uranium 2005: resources, production and...
TRANSCRIPT

Uranium 2005:Resources, Productionand Demand
A Joint Report by the OECD Nuclear Energy Agencyand the International Atomic Energy Agency
N U C L E A R • E N E R G Y • A G E N C Y
Uranium 2005: Resources,Production and Demand
Since 2001 the price of uranium has steadily climbed over five-fold, at a rate and reaching heightsnot seen since the 1970s. As a result, the uranium industry has seen a surge of activity, endinga period of over 20 years of relative stagnation. Worldwide exploration expenditures in 2004increased almost 40% over 2002 figures. Overall, resource totals have increased over the pasttwo years, indicating that increased uranium prices have begun to have an impact. Based onpatterns observed following previous periods of heightened exploration efforts, further additionsto the uranium resource base are anticipated given the recent dramatic increase in explorationexpenditures. In 2004, significant production increases (>30%) were recorded in Australia,Kazakhstan and Namibia, while more modest increases (between 5% and 15%) were recordedfor Brazil, Niger, the Russian Federation and Uzbekistan. Significant expansions are also plannedin future production capacity in Australia, Canada and Kazakhstan. This very dynamic and majorexpansion of production capability could significantly alter the supply and demand relationshipof recent years, provided planned centres are constructed on schedule and successfully reach fullproduction capacity. Clearly, major changes in the uranium industry are under way, driven byrecent uranium price increases.
The "Red Book", jointly prepared by the OECD Nuclear Energy Agency and the InternationalAtomic Energy Agency, is a recognised world reference on uranium. It is based on official infor-mation received from 43 countries. This 21st edition presents the results of a thorough reviewof world uranium supplies and demand as of 1st January 2005 and provides a statistical profile ofthe world uranium industry in the areas of exploration, resource estimates, production andreactor-related requirements. It provides substantial new information from all major uraniumproduction centres in Africa, Australia, Central Asia, Eastern Europe and North America.Projections of nuclear generating capacity and reactor-related uranium requirements through2025 are provided as well as a discussion of long-term uranium supply and demand issues.
(66 2006 03 1 P) € 120.00ISBN 92-64-02425-5
2006
Uranium
2005: Resources,P
roduction and Dem
and
AIEAIAEA AIEA IAEA
-:HSTCQE=UWYWZU:
Red book 2005-Eng 6098 27/04/06 9:57 Page 1


A Joint Report by the OECD Nuclear Energy Agency and the International Atomic Energy Agency
Uranium 2005: Resources, Production
and Demand
© OECD 2005 NEA No. 6098
NUCLEAR ENERGY AGENCY ORGANISATION FOR ECONOMIC CO-OPERATION AND DEVELOPMENT

ORGANISATION FOR ECONOMIC CO-OPERATION AND DEVELOPMENT
The OECD is a unique forum where the governments of 30 democracies work together to address the economic, social and environmental challenges of globalisation. The OECD is also at the forefront of efforts to understand and to help governments respond to new developments and concerns, such as corporate governance, the information economy and the challenges of an ageing population. The Organisation provides a setting where governments can compare policy experiences, seek answers to common problems, identify good practice and work to co-ordinate domestic and international policies.
The OECD member countries are: Australia, Austria, Belgium, Canada, the Czech Republic, Denmark, Finland, France, Germany, Greece, Hungary, Iceland, Ireland, Italy, Japan, Korea, Luxembourg, Mexico, the Netherlands, New Zealand, Norway, Poland, Portugal, the Slovak Republic, Spain, Sweden, Switzerland, Turkey, the United Kingdom and the United States. The Commission of the European Communities takes part in the work of the OECD.
OECD Publishing disseminates widely the results of the Organisation’s statistics gathering and research on economic, social and environmental issues, as well as the conventions, guidelines and standards agreed by its members.
* * *
This work is published on the responsibility of the Secretary-General of the OECD. The opinions expressed and arguments employed herein do not necessarily reflect the official views of the Organisation or of the governments of its member countries.
NUCLEAR ENERGY AGENCY
The OECD Nuclear Energy Agency (NEA) was established on 1st February 1958 under the name of the OEEC European Nuclear Energy Agency. It received its present designation on 20th April 1972, when Japan became its first non-European full member. NEA membership today consists of 28 OECD member countries: Australia, Austria, Belgium, Canada, the Czech Republic, Denmark, Finland, France, Germany, Greece, Hungary, Iceland, Ireland, Italy, Japan, Luxembourg, Mexico, the Netherlands, Norway, Portugal, Republic of Korea, the Slovak Republic, Spain, Sweden, Switzerland, Turkey, the United Kingdom and the United States. The Commission of the European Communities also takes part in the work of the Agency.
The mission of the NEA is:
� to assist its member countries in maintaining and further developing, through international co-operation, the scientific, technological and legal bases required for a safe, environmentally friendly and economical use of nuclear energy for peaceful purposes, as well as
� to provide authoritative assessments and to forge common understandings on key issues, as input to government decisions on nuclear energy policy and to broader OECD policy analyses in areas such as energy and sustainable development.
Specific areas of competence of the NEA include safety and regulation of nuclear activities, radioactive waste management, radiological protection, nuclear science, economic and technical analyses of the nuclear fuel cycle, nuclear law and liability, and public information. The NEA Data Bank provides nuclear data and computer program services for participating countries.
In these and related tasks, the NEA works in close collaboration with the International Atomic Energy Agency in Vienna, with which it has a Co-operation Agreement, as well as with other international organisations in the nuclear field.
Publié en français sous le titre:
URANIUM 2005 : RESSOURCES, PRODUCTION ET DEMANDE
Photo: Torbernite, Bigay Mine, Lachaux, France. Courtesy of CEA/Cogema, France.
© OECD 2006 No reproduction, copy, transmission or translation of this publication may be made without written permission.
Applications should be sent to OECD Publishing: [email protected] or by fax (+33-1) 45 24 13 91. Permission to photocopy a portion of this work should be addressed to the Centre Français d’exploitation du droit de Copie, 20 rue des Grands Augustins, 75006 Paris, France ([email protected]).

3
PREFACE
Since the mid-1960s, with the co-operation of their member countries and states, the OECD Nuclear Energy Agency (NEA) and the International Atomic Energy Agency (IAEA) have jointly prepared periodical updates (currently every two years) on world uranium resources, production and demand. These updates have been published by the OECD/NEA in what is commonly known as the “Red Book”. This 21st edition of the Red Book replaces the 2003 edition and reflects information current as of 1st January 2005.
The Red Book presents a comprehensive assessment of the uranium supply and demand situation at present and periodically up to the year 2025. The basis for the assessment consists of estimates of uranium resources in several categories of existence and economic attractiveness, projections of production capability, installed nuclear capacity and related uranium requirements. Annual statistical data and projections of uranium resources, exploration, production, installed nuclear capacity, annual uranium requirements, uranium stocks and relevant uranium policies are presented. In addition, detailed national reports are provided that include information on environmental activities.
This publication analyses the uranium supply and demand situation throughout the world by evaluating and compiling data on uranium resources, past and present production and plans for future production. The data are then compared with projected future reactor-related uranium requirements. The impact of secondary sources of uranium is evaluated. Longer-term projections of uranium demand, based on expert opinion rather than on information submitted by national authorities, are qualitatively discussed in the report.
This publication has been prepared on the basis of data obtained through questionnaires sent by the NEA to its member countries (18 countries responded) and by the IAEA for those states that are not OECD member countries (25 countries responded). The opinions expressed in Parts I and II do not necessarily reflect the position of the member countries or international organisations concerned. This report is published on the responsibility of the OECD Secretary-General.
Acknowledgement
The OECD Nuclear Energy Agency (NEA), Paris, and the International Atomic Energy Agency (IAEA), Vienna, would like to acknowledge the co-operation of those organisations (see Appendix 2), which replied to the questionnaire.


5
TABLE OF CONTENTS
PREFACE ............................................................................................................................................ 3
EXECUTIVE SUMMARY................................................................................................................. 9
I. URANIUM SUPPLY .................................................................................................................. 13
A. URANIUM RESOURCES .................................................................................................... 13 � Identified Resources (previously “Known Conventional Resources”)..................... 13 � Distribution of Identified Resources by Categories and Cost Ranges ...................... 13 � Distribution of Resources by Production Method..................................................... 14 � Proximity of Resources to Production Centres ......................................................... 20 � Undiscovered Resources........................................................................................... 20 � Other Resources and Materials ................................................................................. 21
B. URANIUM EXPLORATION ............................................................................................... 23 � Current Activities and Recent Developments........................................................... 26
C. URANIUM PRODUCTION.................................................................................................. 28 � Present Status of Uranium Production...................................................................... 32 � Ownership................................................................................................................. 33 � Employment.............................................................................................................. 33 � Production Techniques ............................................................................................. 35 � Projected Production Capabilities............................................................................. 36 � Changes in Production Facilities .............................................................................. 36
II. URANIUM DEMAND................................................................................................................. 41
A. CURRENT COMMERCIAL NUCLEAR GENERATING CAPACITY AND REACTOR-RELATED URANIUM REQUIREMENTS .......................................... 41
B. PROJECTED NUCLEAR POWER CAPACITY AND RELATED URANIUM REQUIREMENTS TO 2025 ................................................................................................. 51 � Factors Affecting Capacity and Uranium Requirements .......................................... 51 � Projections to 2025......................................................................................................... 53
C. URANIUM SUPPLY AND DEMAND RELATIONSHIPS ............................................... 60 � Primary Sources of Uranium Supply............................................................................. 60 � Secondary Sources of Supply ........................................................................................ 60 � Uranium Market Developments .................................................................................... 70 � Supply and Demand to 2025.......................................................................................... 74
D. THE LONG-TERM PERSPECTIVE.................................................................................... 76
6
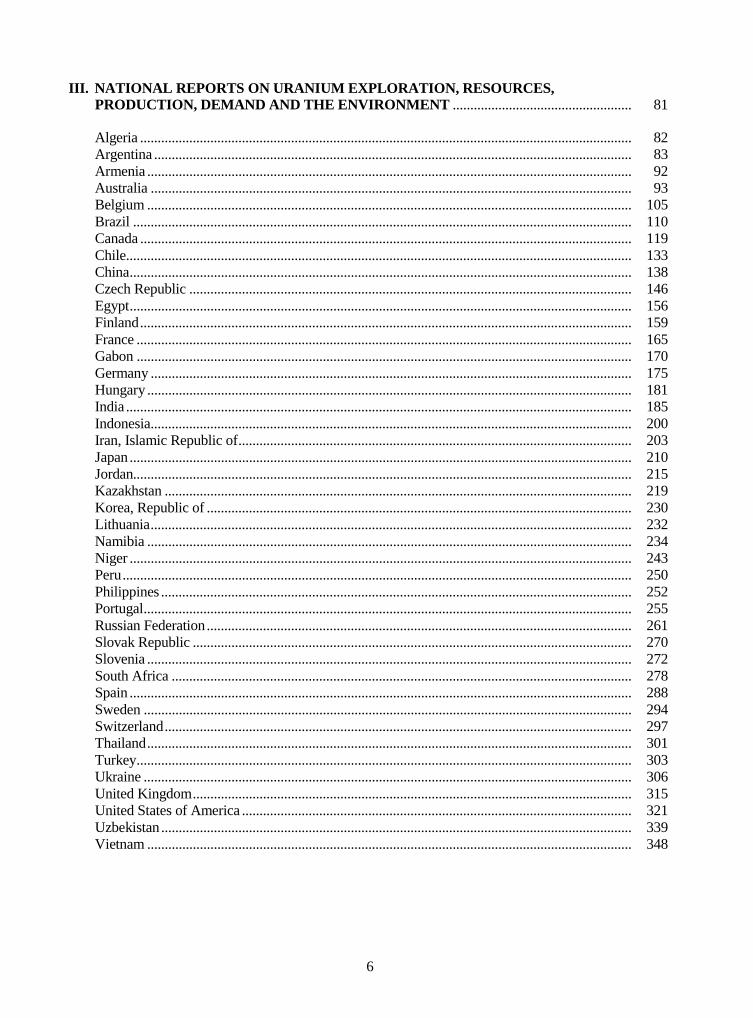
III. NATIONAL REPORTS ON URANIUM EXPLORATION, RESOURCES, PRODUCTION, DEMAND AND THE ENVIRONMENT ................................................... 81
Algeria ............................................................................................................................................ 82 Argentina ........................................................................................................................................ 83 Armenia .......................................................................................................................................... 92 Australia ......................................................................................................................................... 93 Belgium .......................................................................................................................................... 105 Brazil .............................................................................................................................................. 110 Canada ............................................................................................................................................ 119 Chile................................................................................................................................................ 133 China............................................................................................................................................... 138 Czech Republic .............................................................................................................................. 146 Egypt............................................................................................................................................... 156 Finland............................................................................................................................................ 159 France ............................................................................................................................................. 165 Gabon ............................................................................................................................................. 170 Germany ......................................................................................................................................... 175 Hungary .......................................................................................................................................... 181 India ................................................................................................................................................ 185 Indonesia......................................................................................................................................... 200 Iran, Islamic Republic of................................................................................................................ 203 Japan ............................................................................................................................................... 210 Jordan.............................................................................................................................................. 215 Kazakhstan ..................................................................................................................................... 219 Korea, Republic of ......................................................................................................................... 230 Lithuania......................................................................................................................................... 232 Namibia .......................................................................................................................................... 234 Niger ............................................................................................................................................... 243 Peru................................................................................................................................................. 250 Philippines ...................................................................................................................................... 252 Portugal........................................................................................................................................... 255 Russian Federation......................................................................................................................... 261 Slovak Republic ............................................................................................................................. 270 Slovenia .......................................................................................................................................... 272 South Africa ................................................................................................................................... 278 Spain ............................................................................................................................................... 288 Sweden ........................................................................................................................................... 294 Switzerland..................................................................................................................................... 297 Thailand.......................................................................................................................................... 301 Turkey............................................................................................................................................. 303 Ukraine ........................................................................................................................................... 306 United Kingdom............................................................................................................................. 315 United States of America ............................................................................................................... 321 Uzbekistan ...................................................................................................................................... 339 Vietnam .......................................................................................................................................... 348

7
APPENDICES
1. Members of the Joint NEA-IAEA Uranium Group ..................................................................... 353
2. List of Reporting Organisations and Contact Persons .................................................................. 357
3. Glossary of Definitions and Terminology..................................................................................... 361
4. Acronym List.................................................................................................................................. 373
5. Energy Conversion Factors............................................................................................................ 375
6. Index of National Reports in Red Books....................................................................................... 379
7. Currency Exchange Rates .............................................................................................................. 385
8. Grouping of Countries and Areas with Uranium-related Activities............................................. 387

9
EXECUTIVE SUMMARY
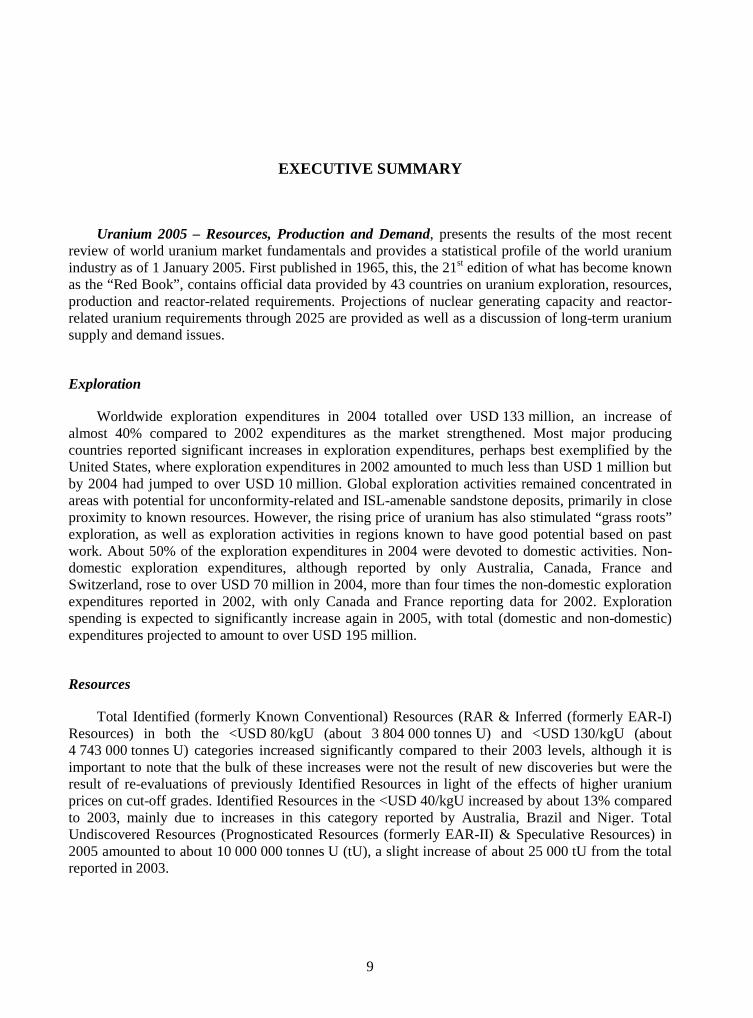
Uranium 2005 – Resources, Production and Demand, presents the results of the most recent review of world uranium market fundamentals and provides a statistical profile of the world uranium industry as of 1 January 2005. First published in 1965, this, the 21st edition of what has become known as the “Red Book”, contains official data provided by 43 countries on uranium exploration, resources, production and reactor-related requirements. Projections of nuclear generating capacity and reactor-related uranium requirements through 2025 are provided as well as a discussion of long-term uranium supply and demand issues.
Exploration
Worldwide exploration expenditures in 2004 totalled over USD 133 million, an increase of almost 40% compared to 2002 expenditures as the market strengthened. Most major producing countries reported significant increases in exploration expenditures, perhaps best exemplified by the United States, where exploration expenditures in 2002 amounted to much less than USD 1 million but by 2004 had jumped to over USD 10 million. Global exploration activities remained concentrated in areas with potential for unconformity-related and ISL-amenable sandstone deposits, primarily in close proximity to known resources. However, the rising price of uranium has also stimulated “grass roots” exploration, as well as exploration activities in regions known to have good potential based on past work. About 50% of the exploration expenditures in 2004 were devoted to domestic activities. Non-domestic exploration expenditures, although reported by only Australia, Canada, France and Switzerland, rose to over USD 70 million in 2004, more than four times the non-domestic exploration expenditures reported in 2002, with only Canada and France reporting data for 2002. Exploration spending is expected to significantly increase again in 2005, with total (domestic and non-domestic) expenditures projected to amount to over USD 195 million.
Resources
Total Identified (formerly Known Conventional) Resources (RAR & Inferred (formerly EAR-I) Resources) in both the <USD 80/kgU (about 3 804 000 tonnes U) and <USD 130/kgU (about 4 743 000 tonnes U) categories increased significantly compared to their 2003 levels, although it is important to note that the bulk of these increases were not the result of new discoveries but were the result of re-evaluations of previously Identified Resources in light of the effects of higher uranium prices on cut-off grades. Identified Resources in the <USD 40/kgU increased by about 13% compared to 2003, mainly due to increases in this category reported by Australia, Brazil and Niger. Total Undiscovered Resources (Prognosticated Resources (formerly EAR-II) & Speculative Resources) in 2005 amounted to about 10 000 000 tonnes U (tU), a slight increase of about 25 000 tU from the total reported in 2003.

10
Resource totals, on balance, increased between 2003 and 2005, indicating that increased uranium prices have already begun to impact resource totals, principally through re-evaluation of existing resources. However, the recent dramatic increase in exploration expenditures can be expected to lead to further additions to the uranium resource base, just as periods of heightened exploration efforts in the past have done.
Production
Uranium production in 2004 totalled 40 263 tU, an increase of almost 12% from the 36 050 tU produced in 2002, and an even greater increase from the 35 492 tU produced in 2003, a year in which output was reduced at key production facilities by unrelated incidents. A total of 19 countries reported output in 2004, compared to 20 in 2002, as Spain ceased production in 2003. Significant production increases (>30%) were recorded between 2002 and 2004 in Australia, Kazakhstan, and Namibia, while more modest increases (between 5 and 15%) were recorded for Brazil, Niger, the Russian Federation and Uzbekistan. Only two countries recorded reduced production (>10%) between 2002 and 2004: the Czech Republic and South Africa. Reductions in the amount of uranium recovered in mine restoration activities were recorded in France, Germany and Hungary from 2002 to 2004. Underground mining accounted for 39% of global production in 2004; open pit mining, 28%; in situ leach mining, 20%; with co-product and by-product recovery from copper and gold operations and other unconventional methods accounting for most of the remaining 13%. Uranium production in 2005 is expected to increase to 41 250 tU, with the largest increases (>10%) anticipated to occur in Kazakhstan and Uzbekistan.
Environmental aspects of uranium production
Although the focus of the Red Book remains uranium resources, production and demand, environmental aspects of the uranium production cycle are again a feature of this volume. A number of National Reports document the long term management of tailings and wastes produced at milling sites, reclamation activities at production centres, monitoring studies of existing operations and waste management areas, as well as information updates on environmental assessment processes. Activities related to the decommissioning and reclamation of inactive sites and dealing with the associated job losses in countries where uranium mining has been terminated, as well as information on the development of water preservation strategies in mining areas, are also outlined. Additional information on the environmental aspects of uranium production may be found in a joint NEA/IAEA Uranium Group publication titled Environmental Remediation of Uranium Production Facilities, Paris, OECD, 2002.
Uranium demand
At the end of 2004, a total of 440 commercial nuclear reactors were operating with a net generating capacity of about 369 GWe requiring about 67 320 tU. By the year 2025, world nuclear capacity is projected to grow to between about 449 GWe net in the low demand case and 533 GWe net in the high demand case. Accordingly, world reactor-related uranium requirements are projected to rise to between about 82 275 tU and 100 760 tU by 2025.

11
Significant regional variation exists within these broad projections. Nuclear energy capacity and resultant uranium requirements are expected to grow significantly the East Asia region (between 90% to over 115% in the low and high cases, respectively) and in the Central, Eastern and South East Europe region (between 34 and 53%). Nuclear capacity and requirements are expected to increase slightly in North America (between 4 and 27%), but decline in Western Europe (between 16 and 26%) as plans to phase out nuclear energy are implemented. However, there are great uncertainties in these projections as there is ongoing debate on the role that nuclear energy will play in meeting future energy requirements. Key factors that will influence future nuclear energy capacity include projected base load electricity demand, public acceptance of nuclear energy and proposed waste management strategies, as well as the economic competitiveness of nuclear power plants and fuel compared to other energy sources. Concerns about longer-term security of supply of fossil fuels and the extent to which nuclear energy is seen beneficial in meeting greenhouse gas reduction targets could contribute to even greater projected growth in uranium demand over the long-term.
Supply and demand relationship
At the end of 2004, world uranium production (40 263 tU) provided about 60% of world reactor requirements (67 450 tU), with the remainder being met by secondary sources including excess commercial inventories, the expected delivery of LEU derived from HEU warheads, re-enrichment of depleted uranium tails and spent fuel reprocessing.
As currently projected, primary uranium production capabilities including existing, committed, planned and prospective production centres supported by Identified Resources (RAR and Inferred) recoverable at a cost of <USD 80/kgU could satisfy projected world uranium requirements by 2010 if all expansions and mine openings proceed as planned and if production is maintained at full capability at all operations. Although it is unlikely that all projects will produce at full capability in the time expected, the uranium production industry has clearly responded to market developments and production capability is expected to increase significantly in the next few years. Secondary sources will, however, continue to be necessary to ensure demand is met given challenges associated with achieving full production capability.
However, secondary sources are expected to decline in importance, particularly after 2015, and reactor requirements will have to be increasingly met by the expansion of existing production capability together with the development of additional production centres or the introduction of alternate fuel cycles, both of which are costly, long-term enterprises. A sustained near-term strong demand for uranium will be needed to stimulate the timely development of needed Identified Resources. Because of the long lead-times required to identify new resources and to bring them into production (typically in the order of 10 years or more), there exists the potential for the development of uranium supply shortfalls and continued upward pressure on uranium prices as secondary sources are exhausted. The long lead times required to bring resources into production continues to underscore the importance of making timely decisions to increase production capability well in advance of any supply shortfall. Improved information on the nature and extent of world uranium inventories and other secondary sources would improve the accuracy of the forecasting required to make these timely production decisions.

12
Conclusions
World electricity use is expected to continue growing over the next several decades to meet the needs of an increasing population and economic growth. Nuclear reactors will continue to play an important role in generating the required electricity, although the magnitude of that role remains uncertain.
Regardless of the magnitude of the role that nuclear energy ultimately plays; the uranium resource base described in this document is adequate to meet projected future requirements. However, a continued strong market and sustained high prices will be necessary for resources to be developed within the timeframe required to meet uranium demand.

13
I. URANIUM SUPPLY
This chapter summarises the current status of worldwide uranium resources, exploration and production. In addition, production capabilities in reporting countries for the period ending in the year 2025 are presented and discussed.
A. URANIUM RESOURCES
Identified Resources (previously “Known Conventional Resources”)
Identified Resources consist of Reasonably Assured Resources (RAR) and Inferred Resources (previously EAR-I), recoverable at a cost of less than USD 130/kgU (<USD 130/kgU).1 Relative changes in different resource and cost categories of Identified Resources between this edition and the 2003 edition of the Red Book are given in Table 1. As shown in Table 1, Identified Resources <USD 130/kgU increased significantly between 2003 and 2005. This increase is mainly the result of reported increases by Australia and Brazil. The overall increase in Identified Resources recoverable at <USD 130/kgU between 2003 and 2005 amounted to about 155 000 tU. The most significant change occurred in the RAR <USD 40/kgU, which saw an increase of about 217 000 tU. Though some of these reported increases are due to new discoveries resulting from increased exploration, it is important to note that the bulk of the increases are due to re-evaluations reflecting the effects of higher uranium prices on cut-off grades. Current estimates of RAR and Inferred Resources, on a country-by-country basis, are presented in Tables 2 and 3 respectively.2
Distribution of Identified Resources by Categories and Cost Ranges
The most significant changes between 2003 and 2005 in Identified Resources occurred in: Australia, Brazil, Kazakhstan, Niger, South Africa and Ukraine, and to a lesser extent China and Namibia. The distribution of RAR and Inferred Resources, among countries with major resources, is shown in Figures 1 and 2, respectively.
1. All Identified Resources are reported as recoverable uranium. In cases where resources were reported by
countries as in situ, resource figures were adjusted to estimate recoverable resources either by using recovery factors provided by the country or applying Secretariat estimates according to expected production method (see Recoverable Resources in Appendix 3).
2. It should be noted that the United States does not report resources in the Inferred Resource category.

14
Table 1. Changes in Identified Resources 2003-2005 (1 000 tU)
Resource category 2003 2005 Changes*
Identified (Total)
<USD 130/kgU 4 588 4 743 + 155
<USD 80/kgU 3 537 3 804 + 267
<USD 40/kgU** > 2 523 > 2 746 + 223
RAR
<USD 130/kgU 3 169 3 297 + 128
<USD 80/kgU 2 458 2 643 + 185
<USD 40/kgU** > 1 730 > 1 947 + 217
Inferred Resources
<USD 130/kgU 1 419 1 446 + 27
<USD 80/kgU 1 079 1 161 + 82
<USD 40/kgU** > 793 > 799 + 6
* Changes might not equal differences between 2005 and 2003 because of independent rounding. ** Resources in the cost categories of <USD 40/kgU are likely higher than reported, because several countries
have indicated that either detailed estimates are not available, or the data are confidential.
RAR recoverable at costs <USD 40/kgU, the most economically attractive category, increased by 217 000 tU since 2003, a significant increase (about 13%). Similarly, RAR at <USD 80/kgU increased by 185 000 tU (about 8%) since 2003. RAR at <USD 130/kgU increased by about 128 000 tU compared to 2003 (about 4%). Most of these changes were due to re-evaluation of known deposits and their transfer to and from other resource categories (Table 4).
Inferred Resources recoverable at <USD 130/kgU increased by about 27 000 tU compared to 2003 (about 2%). Inferred Resource increases were greatest in Australia and Brazil while reductions were greatest in Niger. Since the Russian Federation did not report resources in this cost category, the total amount shown here is underestimated somewhat. Inferred Resources recoverable at costs <USD 80/kgU and <USD 40/kgU both experienced increases of about 82 000 tU and 6 000 tU, respectively. These changes are mainly related to transfers from one cost category into another.
Together, the changes in Identified Resources, i.e., RAR and Inferred Resources, recoverable at costs <USD 40/kgU significantly increased by about 223 000 tU (about 9% from 2003) and the Identified Resources recoverable at costs <USD 80/kgU increased by about 267 000 tU (about 8% from 2003). These changes are mainly the result of increased resources reported in Australia while in Brazil the increases are mainly due to re-evaluation of resources in light of higher uranium prices.
Distribution of Resources by Production Method
In 2005, countries reported Identified Resources by cost categories and by the expected production method, i.e., open-pit or underground mining, in situ leaching, heap leaching or in-place leaching, co-product/by-product or as unspecified.

15
Table 2. Reasonably Assured Resources (RAR) (recoverable resources as of 1 January 2005, tonnes U)
Cost ranges
Algeria (b) (c) NA 19 500 19 500Argentina 4 780 4 880 7 080Australia 701 000 714 000 747 000Brazil 139 900 157 700 157 700Bulgaria (a) (b) (c) 1 665 5 870 5 870Canada 287 200 345 200 345 200Central African Republic (a) (b) (c) NA 6 000 12 000Chile (c) (d) NA NA 561China * (e) 25 795 38 019 38 019Congo, Dem. Rep. of (a) (b) (c) NA 1 350 1 350Czech Republic 0 510 510Denmark (a) (b) (c) 0 0 20 250Finland (b) (c) 0 0 1 125Gabon (b) 0 0 4 830Germany (b) 0 0 3 000Greece (a) (b) 1 000 1 000 1 000India (c) (d) NA NA 42 568Indonesia (b) (c) 0 318 4 622Iran, Islamic Republic of (c) 0 0 378Italy (a) (b) NA 4 800 4 800Japan (b) 0 0 6 600Jordan (b) (c) 30 375 30 375 30 375Kazakhstan 278 840 378 290 513 897Malawi (a) (b) (c) NA 8 775 8 775Mexico (a) (b) (c) 0 0 1 275Mongolia (a) (b) (c) 7 950 46 200 46 200Namibia * (e) 62 186 151 321 182 556Niger 172 866 180 466 180 466Peru (c) 0 1 217 1 217Portugal 0 6 000 7 000Romania (e) 0 0 3 145Russian Federation 57 530 131 750 131 750Slovenia (b) (c) 0 1 210 1 210Somalia (a) (b) (c) 0 0 4 950South Africa (b) (f) 88 548 177 147 255 593Spain 0 2 460 4 925Sweden (b) 0 0 4 000Thailand (a) (c) 0 0 3Turkey (b) (c) 0 7 394 7 394Ukraine (c) 28 005 58 498 66 706United States (b) NA 102 000 342 000Uzbekistan (c) 59 743 59 743 76 936Vietnam (c) NA NA 1 003Zimbabwe (a) (b) (c) NA 1 350 1 350
Total (g) 1 947 383 2 643 343 3 296 689
< USD 80/kgU < USD 130/kgUCOUNTRY
< USD 40/kgU
NA Data not available. * Secretariat estimate. (a) Not reported in 2005 response, data from previous Red Book. (b) Assessment not made within the last 5 years. (c) In situ resources were adjusted by the Secretariat to estimate recoverable resources using recovery factors
provided by countries or estimated by the Secretariat according to the expected production method. (d) Cost data not provided, therefore resources are reported in the <USD 130/kgU category. (e) Data from previous Red Book, depleted by past production. (f) Resource estimates do not account for production. (g) Totals related to the cost range <USD 40/kgU are higher than reported in the Tables because certain
countries do not report resource estimates, mainly for reasons of confidentiality.

16
Table 3. Inferred Resources (recoverable resources as of 1 January 2005, tonnes U)
Cost ranges
Argentina 2 860 2 860 8 560Australia 343 000 360 000 396 000Brazil 0 73 600 121 000Bulgaria (a) (b) (c) 1 650 6 300 6 300Canada 84 600 98 600 98 600Chile (c) (d) NA NA 887China * (c) 5 886 21 704 21 704Congo, Dem. Rep. of (a) (b) (c) NA 1 275 1 275Czech Republic 0 60 60Denmark (a) (b) (c) 0 0 12 000France (b) 0 0 11 740Gabon (b) 0 0 1 000Germany (b) 0 0 4 000Greece (a) (b) NA 6 000 6 000India (c) (d) NA NA 22 272Indonesia (b) (c) 0 0 1 155Iran, Islamic Republic of (c) 0 0 1 122Italy (a) (b) 0 0 1 300Jordan (b) (c) 48 600 48 600 48 600Kazakhstan 129 252 228 368 302 202Mexico (a) (b) (c) 0 0 525Mongolia (a) (b) (c) 8 250 15 750 15 750Namibia (c) 61 192 86 277 99 803Niger 0 44 993 44 993Peru (c) NA 1 265 1 265Portugal 0 1 200 1 200Romania (a) (b) (c) 0 0 3 608Russian Federation 21 572 40 652 40 652Slovenia (b) (c) 0 2 750 5 500Somalia (a) (b) (c) 0 0 2 550South Africa (b) 54 601 71 605 85 003Spain (b) 0 0 6 380Sweden (b) 0 0 6 000Thailand (c) 0 0 5Ukraine (c) 6 513 17 340 23 130Uzbekistan (c) 31 021 31 021 38 590Vietnam (c) NA 818 5 433
Total (e) 798 997 1 161 038 1 446 164
COUNTRY< USD 130/kgU< USD 80/kgU< USD 40/kgU
NA Data not available. * Secretariat estimate.
(a) Not reported in 2005 responses, data from previous Red Book using EAR-I data. (b) Assessment not made within the last 5 years. (c) In situ resources were adjusted to estimate recoverable resources, using recovery factors provided by the
countries or estimated by the Secretariat according to the expected production method. (d) Cost data not provided, therefore resources are reported in the <USD 130/kgU category. (e) Totals related to the cost range <USD 40/kgU are higher than reported in the Tables because certain
countries do not report resource estimates, mainly for reasons of confidentiality.
17
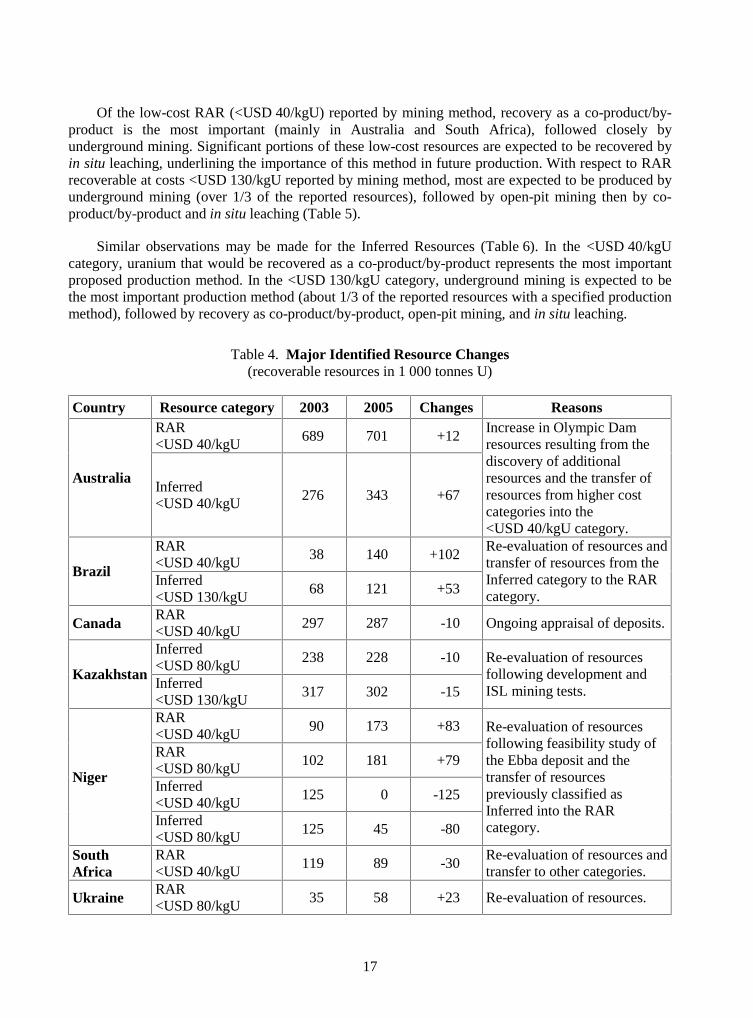
Of the low-cost RAR (<USD 40/kgU) reported by mining method, recovery as a co-product/by-product is the most important (mainly in Australia and South Africa), followed closely by underground mining. Significant portions of these low-cost resources are expected to be recovered by in situ leaching, underlining the importance of this method in future production. With respect to RAR recoverable at costs <USD 130/kgU reported by mining method, most are expected to be produced by underground mining (over 1/3 of the reported resources), followed by open-pit mining then by co-product/by-product and in situ leaching (Table 5).
Similar observations may be made for the Inferred Resources (Table 6). In the <USD 40/kgU category, uranium that would be recovered as a co-product/by-product represents the most important proposed production method. In the <USD 130/kgU category, underground mining is expected to be the most important production method (about 1/3 of the reported resources with a specified production method), followed by recovery as co-product/by-product, open-pit mining, and in situ leaching.
Table 4. Major Identified Resource Changes (recoverable resources in 1 000 tonnes U)
Country Resource category 2003 2005 Changes Reasons RAR <USD 40/kgU
689 701 +12
Australia Inferred <USD 40/kgU
276 343 +67
Increase in Olympic Dam resources resulting from the discovery of additional resources and the transfer of resources from higher cost categories into the <USD 40/kgU category.
RAR <USD 40/kgU
38 140 +102 Brazil
Inferred <USD 130/kgU
68 121 +53
Re-evaluation of resources and transfer of resources from the Inferred category to the RAR category.
Canada RAR <USD 40/kgU
297 287 -10 Ongoing appraisal of deposits.
Inferred <USD 80/kgU
238 228 -10 Kazakhstan
Inferred <USD 130/kgU
317 302 -15
Re-evaluation of resources following development and ISL mining tests.
RAR <USD 40/kgU
90 173 +83
RAR <USD 80/kgU
102 181 +79
Inferred <USD 40/kgU
125 0 -125 Niger
Inferred <USD 80/kgU
125 45 -80
Re-evaluation of resources following feasibility study of the Ebba deposit and the transfer of resources previously classified as Inferred into the RAR category.
South Africa
RAR <USD 40/kgU
119 89 -30 Re-evaluation of resources and transfer to other categories.
Ukraine RAR <USD 80/kgU
35 58 +23 Re-evaluation of resources.

18
Figure 1. Distribution of Reasonably Assured Resources (RAR) Among Countries with Major Resources
0
100
200
300
400
500
600
700
800A
ustr
alia
Kaz
akhs
tan
Can
ada
US
A
Sout
h A
fric
a
Nam
ibia
Nig
er
Bra
zil
Rus
sian
Fed
erat
ion
Uzb
ekis
tan
Ukr
aine
Mon
golia
1 00
0 tU
< USD 40/kgU USD 40-80/kgU USD 80-130/kgU
Table 5. Reasonably Assured Resources (RAR) by Production Method (tonnes U)
<USD 40/kgU <USD 80/kgU <USD 130/kgU
Open-pit mining 275 296 467 535 614 163
Underground mining 553 955 835 003 1 223 409
In situ leaching 360 936 401 936 445 033
Heap leaching 30 668 39 887 50 287
In-place leaching 300 300 300
Co-product/by-product 570 100 587 900 587 900
Unspecified mining method 156 128 310 782 375 597
Total 1 947 383 2 643 343 3 296 689

19
Figure 2. Distribution of Inferred Resources Among Countries with Major Resources
0
50
100
150
200
250
300
350
400
450A
ustr
alia
Kaz
akhs
tan
Bra
zil
Nam
ibia
Can
ada
Sout
hA
fric
a
Jord
an
Nig
er
Rus
sian
Fede
ratio
n
Uzb
ekis
tan
Ukr
aine
Indi
a
1 00
0 tU
USD 80-130/kgU
USD 40-80/kgU
<USD 40/kgU
Table 6. Inferred Resources by Proposed Production Method (tonnes U)
<USD 40/kgU <USD 80/kgU <USD 130/kgU
Open-pit mining 131 626 183 221 237 762
Underground mining 208 342 365 987 488 784
In situ leaching 162 037 172 287 183 256
Heap leaching 12 686 18 439 21 194
In-place leaching 1 500 1 500 1 500
Co-product/by-product 271 000 302 200 353 956
Unspecified mining method 11 806 117 404 159 712
Total 798 997 1 161 038 1 446 164

20
Proximity of Resources to Production Centres
A total of 11 countries provided estimates of the availability of resources for near-term production by reporting the percentage of Identified Resources (RAR and Inferred Resources), recoverable at costs <USD 40/kgU and <USD 80/kgU that are tributary to existing and committed production centres (Table 7). Resources tributary to existing and committed production centres in these 11 countries total more than 2 138 180 tU at <USD 40/kgU, about 15% above 2003, and 2 354 827 tU at <USD 80/kgU, about an 8% increase compared to 2003. These tributary resources represent about 78% of reported total Identified Resources at <USD 40/kgU and about 62% at <USD 80/kgU.
Table 7. Identified Resources Proximate to Existing or Committed Production Centres*
% %
Argentina 7 640 100 7 640 7 740 100 7 740Australia 1 044 000 90 939 600 1 074 000 88 945 120Brazil 139 900 87 121 713 231 300 66 152 658Canada 371 800 100 371 800 443 800 88 390 544China 25 795 NA NA 59 723 100 59 723Kazakhstan 408 092 60 244 855 606 658 41 248 207Namibia 123 378 90 111 040 237 598 90 213 838Niger 172 866 100 172 866 225 459 28 63 129Russian Federation 79 102 100 79 102 172 402 100 172 402Ukraine 34 518 57 19 675 75 838 56 42 469Uzbekistan 90 764 77 69 888 90 764 65 58 997
Total 2 497 855 2 138 180 3 225 282 2 354 827
in Existing or Committed Production CentresCountry
RAR + Inferred recoverable at <USD 40/kgUin Existing or Committed Production Centres
RAR + Inferred recoverable at <USD 80/kgU
Total resources Total resourcesProximate resources Proximate resources
* Identified resources only in countries that reported resources tributary to production centres; not world total.
Undiscovered Resources
Undiscovered Resources include Prognosticated Resources (formerly Estimated Additional Resources – Category II) and Speculative Resources (SR). Prognosticated Resources refers to uranium resources that are expected to occur in well-defined geological trends of known deposits, or mineralised areas with known deposits. SR refers to uranium resources that are thought to exist in geologically favourable, yet unexplored areas. Therefore, Prognosticated Resources are assigned a higher degree of confidence than Speculative Resources. Almost all Prognosticated Resources and Speculative Resources are reported as in situ resources (Table 8).

21
Worldwide, reporting of SR is incomplete, as only 28 countries have historically reported resources in this category. Only 20 countries reported SR for this edition, compared to the 32 that reported RAR. A number of countries, e.g. Australia, did not report Undiscovered Resources for the 2005 Red Book, while others indicated that they do not perform systematic evaluations of this type of resource. Nonetheless, some of these countries, such as Australia, are considered to have significant resource potential in as yet sparsely explored areas.
Prognosticated Resources are estimated to total about 2.5 million tU recoverable at <USD 130/kgU, including about 1.7 million tU at <USD 80/kgU. The estimated total for countries reporting SR recoverable at <USD 130/kgU is about 4.6 million tU, essentially unchanged compared to the 2003 total. About 3.0 million tU of additional SR are reported without an estimate of production cost, almost the same amount as in 2003. Total reported SR are estimated to amount to a little over 7.5 million tU, essentially unchanged compared to 2003.
Other Resources and Materials
No specific compilation of unconventional uranium resources and other potential nuclear fuel materials (e.g., thorium) is provided in this report, since few countries reported relevant information. Most of the unconventional uranium resources reported are associated with uranium in phosphates, but other potential sources exist (e.g., seawater and black shale).
Uranium resources classified as unconventional, in which uranium exists at very low grades or can only be recovered as a minor by-product, include about 22 million tonnes that occur in phosphate deposits, where uranium can be produced as a by-product of phosphoric acid production [1]. The technology to recover the uranium from phosphates is mature; it has been utilised in Belgium and in the United States, but high recovery costs limit the utilisation of these resources. Estimated production costs for a new 100 tU/year project, including capital investment, range from USD 60-100/kgU.
Thorium, abundant and widely dispersed, could also be used as a nuclear fuel resource. Existing estimates of thorium resources total more than 4.5 million tonnes (reserves and additional resources) [2]. These estimates are considered conservative because data from China, Central and Eastern Europe and the Former Soviet Union are not included, and because the historically weak market demand has limited thorium exploration.
So-called secondary sources of uranium, though small compared with the resources described above, play a significant role in supplying current nuclear fuel requirements and are expected to continue to do so through 2025. These resources are discussed in detail in the Uranium Demand section of this book.

22
Table 8. Undiscovered Resources* (in 1 000 tonnes U, as of 1 January 2005)
Cost ranges Cost ranges
Argentina 1.4 1.4 NA NA NABrazil 300.0 300.0 NA 500.0 500.0Bulgaria (a) 2.2 2.2 16.0 0.0 16.0Canada 50.0 150.0 700.0 0.0 700.0Chile NA 4.1 NA 2.4 2.4China 3.6 3.6 4.1 0.0 4.1Colombia (a) NA 11.0 217.0 NA 217.0Czech Republic 0.2 0.2 0.0 179.0 179.0Denmark (a) 0.0 0.0 50.0 10.0 60.0Egypt 0.0 0.0 0.0 0.1 0.1Germany 0.0 0.0 0.0 74.0 74.0Greece (a) 6.0 6.0 0.0 0.0 0.0Hungary 0.0 18.4 NA NA NAIndia NA 12.1 NA 17.0 17.0Indonesia NA NA 0.0 12.5 12.5Iran, Islamic Republic of 0.0 4.1 4.5 6.0 10.5Italy (a) NA NA NA 10.0 10.0Jordan 37.5 37.5 NA NA NAKazakhstan 290.0 310.0 500.0 0.0 500.0Mexico (a) NA 3.0 NA 10.0 10.0Mongolia (a) 0.0 0.0 1 390.0 NA 1 390.0Niger 14.5 24.6 NA NA NAPeru 6.6 6.6 19.7 0.0 19.7Portugal 1.6 2.0 5.0 0.0 5.0Romania (a) NA 3.0 3.0 0.0 3.0Russian Federation 56.3 104.5 545.0 0.0 545.0Slovenia 0.0 1.1 NA NA NASouth Africa 34.9 110.3 NA 1 112.9 1 112.9Ukraine 0.0 15.3 120.0 135.0 255.0United States (b) 839.0 1 273.0 858.0 482.0 1 340.0Uzbekistan 56.3 85.0 0.0 134.7 134.7Venezuela (a) NA NA 0.0 163.0 163.0Vietnam 0.0 7.9 100.0 130.0 230.0Zambia (a) 0.0 22.0 NA NA NAZimbabwe (a) 0.0 0.0 25.0 0.0 25.0
Total (reported by countries)** 1 700.1 2 518.8 4 557.3 2 978.6 7 535.9
COUNTRY
Speculative Resources
< USD 130/kgU< USD 80/kgU < USD 130/kgU TotalCost range unassigned
Prognosticated Resources
* Undiscovered resources are reported as in situ resources. ** Totals may not equal sum of components due to independent rounding. NA Data not available. (a) Not reported in 2005 responses, data from previous Red Book. (b) The United States category of Estimated Additional Resources has been classified as Prognosticated
Resources.

23
B. URANIUM EXPLORATION
Worldwide uranium exploration continues to be unevenly distributed geographically, with the majority of exploration expenditures being concentrated in areas considered to have the best likelihood for the discovery of economically attractive deposits, mainly unconformity-related, sandstone-type and hematite breccia complex deposits.
In 2004, Australia, Canada, France and Switzerland were the only countries to report non-domestic exploration expenditures that totalled USD 70.8 million (Table 9). In 2005, these same four countries are expected to dramatically increase non-domestic expenditures to over USD 146 million, more than seven times the 2003 total. The trends in domestic and non-domestic exploration expenditures are depicted in Figure 3.
Table 9. Non-domestic Uranium Exploration Expenditures (USD thousands in year of expenditure)
Australia NA NA NA NA NA NA NA 1 571 2 324Belgium 4 500 0 0 0 0 0 0 0 0Canada 10 556 3 000 3 000 3 667 2 597 2 549 2 547 9 559 16 393France 691 706 8 777 7 120 7 330 7 690 14 370 16 701 59 701 127 544Germany 403 158 NA NA 0 0 0 0 0 0Japan 393 600 2 280 1 390 NA NA NA NA NA NAKorea, Rep. of 23 604 445 NA NA NA NA NA NA NASpain 20 400 0 0 0 0 0 0 0 0Switzerland 29 657 0 0 0 0 0 0 3 16United Kingdom 61 263 0 0 0 0 0 0 0 0United States 232 242 3 616 NA NA NA NA NA NA NA
TOTAL 1 870 686 18 118 11 510 10 997 10 287 16 919 19 248 70 834 146 277
2005 (expected)
COUNTRY 2000 2001 2002 2003Pre-1998 1998 1999 2004
NA Data not available.
Domestic exploration expenditures generally decreased from 1998 to 2001, then began to slightly increase in 2002 where a total of 18 countries reported domestic exploration expenditures of about USD 95.1 million (Table 10). In 2003, 18 countries reported exploration activities amounting to about USD 92.4 million, though this figure does not include expenditures from the United States, for which data was not available. In 2004, 20 countries reported domestic exploration expenditures totalling about USD 133.3 million, an increase of about 44% compared to 2003. The bulk of 2004 exploration was reported in only seven countries: Australia, Canada, India, Kazakhstan, Russia, United States and Uzbekistan, which accounted for about 80% of reported domestic exploration expenditures. Overall, domestic exploration expenditures are expected to continue to increase to a minimum of about USD 196.0 million in 2005 (United States expenditures for 2005 were not available). Figure 3 portrays these trends, showing the recent, rapid convergence between domestic and non-domestic expenditures.

24
Table 10. Industry and Government Uranium Exploration Expenditures – Domestic (USD thousands in year of expenditure)
Argentina 49 454 0 NA 791 777 265 627 701 946
Australia 480 246 12 030 6 260 4 390 2 470 3 020 4 116 10 813 21 689
Bangladesh 453 NA NA NA NA NA NA NA NA
Belgium 1 685 0 0 0 0 0 0 0 0
Bolivia 9 368 NA NA NA NA NA NA NA NA
Botswana 640 NA NA NA NA NA NA NA NA
Brazil 189 920 0 0 0 NA NA NA 522 1 157
Canada 1 143 668 41 096 33 000 30 667 16 234 22 876 21 687 32 353 40 984
Central African Rep. 20 000 NA NA NA NA NA NA NA NA
Chile 8 831 196 178 214 126 154 115 133 178
China (a) NA NA NA 4 200 6 000 7 200 7 600 8 200 8 600
Colombia 23 935 0 0 NA NA NA NA NA NA
Costa Rica 361 NA NA NA NA NA NA NA NA
Cuba 972 NA NA NA NA NA NA NA NA
Czech Republic 1 693 90 64 44 48 25 0 0 0
Denmark 4 350 0 0 0 0 0 0 0 0
Ecuador 2 055 NA NA NA NA NA NA NA NA
Egypt 60 135 7 976 7 976 10 499 9 404 7 186 5 631 2 589 1 610
Finland 14 777 0 0 0 0 0 0 210 746
France 905 700 1 040 0 0 0 0 0 0 0
Gabon 92 781 0 0 0 0 0 0 0 0
Germany 144 765 0 0 0 0 0 0 0 0
Ghana 90 NA NA NA NA NA NA NA NA
Greece 17 525 NA NA NA NA NA NA NA NA
Guatemala 610 NA NA NA NA NA NA NA NA
Hungary 3 700 0 0 0 0 0 0 0 0
India 236 618 12 812 12 090 14 368 12 060 11 922 14 172 14 333 20 139
Indonesia 15 400 114 217 61 23 30 33 31 112
Iran, Islamic Rep. of NA 857 1 000 1 700 1 004 1 389 3 781 3 710 4 281
Ireland 6 800 0 0 NA NA NA NA NA NA
Italy 75 060 NA NA NA NA NA NA NA NA
Jamaica 30 NA NA NA NA NA NA NA NA
Japan 8 640 0 0 0 0 0 0 0 0
Jordan 722 150 0 0 0 0 0 0 0
Kazakhstan 6 830 0 0 11 035 13 175 11 836 4 372 11 361 37 442
Korea, Republic of 4 670 0 0 0 0 0 0 0 0
Lesotho 21 NA NA NA NA NA NA NA NA
Madagascar 5 243 NA NA NA NA NA NA NA NA
COUNTRY Pre-19982005
(expected)1998 1999 2000 2001 2002 2003 2004

25
Table 10. Industry and Government Uranium Exploration Expenditures – Domestic (contd.) (USD thousands in year of expenditure)
Malaysia 10 044 188 186 66 NA NA NA NA NA
Mali 51 637 NA NA NA NA NA NA NA NA
Mexico 24 910 0 0 0 NA NA NA NA NA
Mongolia 8 153 NA NA NA NA NA NA NA NA
Morocco 2 752 NA NA NA NA NA NA NA NA
Namibia 17 930 0 0 0 0 0 110 1 747 2 384
Niger 205 900 754 471 633 1 088 3 126 4 545 4 222 4 516
Nigeria 6 950 NA NA NA NA NA NA NA NA
Norway 3 180 0 0 0 0 0 0 0 0
Paraguay 25 510 NA NA NA NA NA NA NA NA
Peru 4 183 0 0 0 0 0 0 0 0
Philippines 3 485 13 11 5 4 4 2 NA 5
Portugal 17 518 102 18 19 0 0 0 0 0
Romania 8 420 934 549 157 NA NA NA NA NA
Russian Federation 36 649 8 650 6 870 13 300 11 470 10 420 7 241 10 223 23 772
Slovenia (b) 1 006 NA NA NA NA NA NA NA NA
Somalia 1 000 NA NA NA NA NA NA NA NA
South Africa 108 993 0 0 0 0 0 73 90 1 038
Spain 141 093 10 0 0 0 0 0 0 0
Sri Lanka 33 NA NA NA NA NA NA NA NA
Sweden 46 870 0 0 0 0 0 0 0 0
Switzerland 3 868 0 0 0 0 0 0 0 0
Syria 1 068 NA NA NA NA NA NA NA NA
Thailand 10 921 0 0 NA NA NA NA NA NA
Turkey 20 781 1 200 0 0 NA NA 7 7 23
Ukraine 2 987 1 940 1 606 2 107 1 701 1 898 3 415 4 259 4 278
United Kingdom 2 600 0 0 0 0 0 0 0 0
United States 2 708 618 21 724 8 968 6 694 4 827 352 NA 10 800 NA
Uruguay 231 NA NA NA NA NA NA NA NA
Uzbekistan 50 690 19 652 19 392 14 152 8 516 13 255 13 923 16 995 22 095
Vietnam 2 124 120 120 104 104 132 980 45 NA
Zambia 174 NA NA NA NA NA NA NA NA
Zimbabwe 6 902 0 NA NA NA NA NA NA NA
TOTAL 7 635 008 (c) 131 648 98 976 115 206 89 031 95 090 92 430 133 344 195 995
2000 COUNTRY Pre-1998 19991998 20042005
(expected)2001 2002 2003
NA Data not available. (a) Development expenditures not included. (b) Includes any expenditures spent in other parts of the former Yugoslavia (pre-1996). (c) Includes 312 560 expended in Czechoslovakia (pre-1996) and 247 520 from USSR (pre-1996).

26
Figure 3. Trends in Exploration Expenditures
0
20
40
60
80
100
120
140
160
180
200
1992
1993
1994
1995
1996
1997
1998
1999
2000
2001
2002
2003
2004
2005
(exp
.)
Mill
ion
USD
(
curr
ent)
Domestic
Non-domestic
Year
Current Activities and Recent Developments
North America. In Canada, after a steady decrease of expenditures in domestic exploration from 1998 (USD 41.1 million) to 2001 (USD 16.2 million), spending began to grow again from 2002 (USD 22.9 million) to reach over USD 32.4 million in 2004 and is expected to reach about USD 41 million in 2005.
Uranium exploration and surface development drilling amounted to some 117 800 m in 2004, compared to 74 000 m in 2003. As in recent years, a significant portion of the overall exploration expenditures can be attributed to advanced underground exploration, deposit appraisal activities, and care and maintenance expenditures associated with projects awaiting production approvals. Basic “grass roots” uranium exploration reached USD 25 million (USD 21 million in Saskatchewan alone) in 2004, more than doubling expenditures in 2003 of USD 10.6 million. Over 80% of the combined exploration and surface development drilling in 2003 and 2004 took place in Saskatchewan. A significant discovery at the Millennium deposit in the south-eastern Athabasca Basin is the first tangible result of the heightened exploration. Non-domestic exploration expenditures in 2003 amounted to USD 4 million, with activities mainly carried out in Australia and Kazakhstan. Non-domestic expenditures are expected to significantly increase in 2005, to USD 16.4 million.

27
In 2004, the United States had a significant increase in domestic exploration spending with expenditures that year of about USD 10.8 million, surging from a mere USD 0.352 million in 2002. This step increase ends a period of decline dating to before 1998.
Central and South America. Argentina reported exploration expenditures totalling about USD 0.7 million in 2004, up slightly from about USD 0.6 million in the previous year. Activities included a programme to complete the final feasibility study of the Cerro Solo deposit and evaluation of the surrounding areas. In addition more exploration programmes are planned in the near future. In 2004, Brazil carried out a drilling programme to better define the mineralization at the Lagoa Real deposit at a cost of about USD 0.5 million with increased activity expected in 2005.
Western Europe. Domestic exploration had declined to the point that no exploration expenditures were reported in 2002 and 2003. However, in 2004, two international companies began gathering basic data on the occurrence and geology of uranium in Finland. Exploration licenses have been applied for and exploration is expected in coming years. France reported a sharp increase in non-domestic uranium exploration expenditures to become the world leader in this category with almost USD 60 million in 2004 and over USD 127 million expected in 2005. French exploration and development activities were reported in Australia, Canada, Finland, Kazakhstan, Mongolia, Niger and Russia. Switzerland reported non-domestic exploration activities in Canada in 2004 and 2005, the first Swiss exploration expenditures reported since 1994.
Central, Eastern and South-eastern Europe. No fieldwork was conducted in the Czech Republic and exploration activities were focused on archiving and processing previously obtained data. In the Russian Federation, exploration activities were concentrated on sandstone deposits amenable to in situ leaching (ISL) and unconformity-related deposits in Siberia. Drilling programmes continued in the Transural, Vitim and Irkutsk districts, and in the north-western region of the country, and are planned to continue in 2005. Total expenditures in 2003 amounted to USD 10.2 million and are expected to increase to USD 23.8 million in 2005. Ukraine continued exploration for vein-type and unconformity-related deposits in the Ukrainian shield area. Exploration expenditures totalled about USD 1.9 million in 2002 and rose sharply the following years to USD 3.4 million and USD 4.3 million in 2003 and 2004 respectively. They are expected to remain at approximately to the same level (USD 4.3 million) in 2005.
Africa. In Egypt, activities were concentrated on exploring for conventional uranium resources in the Eastern Desert associated with the younger granites of Pan-African type and evaluation of uranium resources in some uranium occurrences in the Eastern Desert. The Nuclear Material Authority is now preparing for drilling programmes in El Sella and Kab Amiri areas of the Eastern Desert. Total expenditures in Egypt have steadily decreased since the high of 2001 (USD 10.5 million) to USD 2.6 million in 2004 and are expected to decrease to USD 1.6 million in 2005. In Niger, activities focused on resource development in and around the existing mine sites in an effort to expand the resource base in the western Arlit area where several deposits are under development (Artois, Akola and Ebba). Exploration and development expenditures rapidly increased from USD 3.1 million in 2001 to USD 4.2 million in 2004. Annual drilling programmes reached 89.8 km in 2004. For 2005, total expenditures of USD 4.5 million are anticipated, funding 60 km of exploration and development drilling. During 2004, in Namibia, a major drilling programme (166 drill holes, 6 720 metres) was conducted to develop the Langer Heinrich deposit in preparation for mining in 2006.
Middle East, Central and Southern Asia. In India, active programmes are being conducted in several provinces, focusing on Proterozoic basins, Cretaceous sandstones, and other promising geological settings. Annual drilling increased from 40 km in 2002 to 54 km and 46.4 km in 2003 and 2004, respectively, and is expected to increase to 74.7 km in 2005. Exploration expenditures amounted

28
to about USD 14.2 million and USD 14.3 million in 2003 and 2004, respectively, and are expected to increase to USD 20.1 million in 2005. In Iran, activities included exploration and evaluation of uranium resources associated to Precambrian magmatic and metasomatic complexes in the Bafq-Posht-e-Badam province, and exploration of sedimentary basins in central and north-western Iran. Total expenditures amounted about USD 3.8 million and USD 3.7 million in 2003 and 2004, respectively, and are expected to increase to about USD 4.3 million in 2005 with a 10 km drilling programme. In Kazakhstan, exploration was conducted in the Shu-Saryssuiskaia province in 2003 and 2004 where several ISL test sites were completed and mining tests were initiated. Total exploration and development expenditures decreased from USD 11.8 million in 2002 to USD 4.4 million in 2003, then climbed again to USD 11.4 million in 2004 and are expected to rise sharply to USD 37.4 million in 2005. These increases relate to the implementation of a significant drilling programme (148 km), mainly on the Inkai deposit. In Uzbekistan, exploration mainly focused on resource estimation in established ore fields. Total expenditures in 2003 and 2004 amounted to about USD 13.9 million and USD 17 million, respectively, and are expected to increase to USD 22.1 million in 2005.
South-eastern Asia. Exploration activities in Indonesia, the Philippines and Vietnam were maintained at a low level. This work was done to evaluate previously discovered mineralization.
East Asia. China reported increasing exploration expenditures, with USD 7.6 million and USD 8.2 million in 2003 and 2004, respectively. China continues exploration for sandstone-type deposits amenable to in situ leaching in the Yili basin of the Xinjiang region, the Erdos basin in Inner Mongolian Autonomous Region and other areas in northern China. In 2005, exploration expenditures are expected to amount to USD 8.6 million. Exploration continues in Mongolia, although details were not reported.
Pacific. Exploration continued vigorously in several regions of Australia, with annual expenditures of about USD 4.1 million in 2003 and about USD 10.8 million in 2004. Areas explored included the Arnhem Land (Northern Territory) for unconformity-related deposits, the Frome Embayment (South Australia) for sandstone deposits, and the Gawler Craton/Stuart Shelf region (South Australia) for hematite breccia complex deposits. In 2005, exploration expenditures are expected to more than double to about USD 21.7 million. Australia is increasing non-domestic exploration expenditures from USD 1.6 million in 2004 to USD 2.3 million in 2005, principally to fund a major drilling programme to outline additional resources at the Langer Heinrich deposit in Namibia.
C. URANIUM PRODUCTION
In 2004, uranium was produced in 19 different countries; one less than in 2002 (Spain ceased production in 2003), continuing the trend of the concentration of uranium production in fewer and fewer countries. Additionally, three of the 19 countries (France, Germany and Hungary) only produce uranium as a consequence of mine remediation efforts. Just two countries, Canada and Australia, accounted for 51% of world production in 2004 and just seven countries, Canada (29%), Australia (22%), Kazakhstan (9%), Russian Federation (8%), Niger (8%), Namibia (8%) and Uzbekistan (5%), accounted for about 89% of world production in 2004 (Figure 4).
World uranium production increased by almost 11% from 36 050 tU in 2002 to 40 263 tU in 2004, completely recovering from the various production incidents that marred the year 2003. In 2005, it is estimated that uranium production will progress further to reach 41 250 tU.

29
Within OECD countries, production increased slightly to 21 956 tU in 2004, up from 20 114 tU in 2002. Production in 2005 is expected to further increase to 22 022 tU. Table 11 shows the significant changes in production in selected countries between 2002 and 2004. Historical uranium production on a country-by-country basis is provided in Table 12 and Figure 5.3
Figure 4. Uranium Production in 2004: 40 263 tU
29%
22%9%
8%
8%
8%
5%
11% Canada
Australia
Kazakhstan
Russian Federation
Niger
Namibia
Uzbekistan
Others
Table 11. Production in Selected Countries and Reasons for Major Changes
Production Production Change 2002 2004 2002-2004 Country
(tU) (tU) (tU)
Reasons for changes in production
since 2002
Australia 6 854 8 982 2 128
Increased production at Olympic Dam resulting from reconstruction of the solvent extraction plant destroyed by a fire in late 2001.
Kazakhstan 2 826 3 719 893 Increased output through extension of ISL mining.
Namibia 2 333 3 039* 706 Increased output at Rössing.
Niger 3 080 3 245 165 Increased output at Arlit and Akouta production centres.
Russian Federation
2 850 3 280 430 New ISL project at Dalur and development at Priargunsky.
Uzbekistan 1 859 2 087 228 Extension of ISL production.
* Secretariat estimate.
3. Historical production figures have changed since the last edition of the Red Book as a result of new data
made available by member countries.

30
Table 12. Historical Uranium Production (tonnes U)
COUNTRY Pre-2002 2002 2003 2004 Total to 2004 2005
(expected)
Argentina 2 631 0 0 0 2 631 0Australia 98 877 6 854 7 573 8 982 122 286 8 980Belgium 680 0 0 0 680 0Brazil 1 143 272 230 300 1 945 340Bulgaria 16 735 0 0 0 16 735 0Canada 352 486 11 607 10 455 11 597 386 145 11 800China * 26 229 730 730 730 28 419 730Congo, Democratic Republic of 25 600 0 0 0 25 600 0Czech Republic (a) 107 732 465 452 412 109 061 320Finland 30 0 0 0 30 0France 75 938 18 (c) 9 (c) 6 (c) 75 971 3 (c)Gabon 25 403 0 0 0 25 403 0Germany (b) 218 868 221 (c) 150 (c) 77 (c) 219 316 80 (c)Hungary 21 066 10 (c) 4 (c) 4 (c) 21 084 4 *India * 7 503 230 230 230 8 193 230Japan 84 0 0 0 84 0Kazakhstan (d) 18 486 2 826 3 327 3 719 28 358 4 175Madagascar 785 0 0 0 785 0Mexico 49 0 0 0 49 0Mongolia 535 0 0 0 535 0Namibia 74 424 2 333 2 037 * 3 039 * 81 833 3 000Niger 84 949 3 080 3 157 3 245 94 431 3 400Pakistan * 853 38 40 40 971 40Poland 660 0 0 0 660 0Portugal 3 680 0 0 0 3 680 0Romania 17 809 90 90 * 90 * 18 079 * 90 *Russian Federation (d) 26 213 2 850 3 073 3 280 35 416 3 275South Africa 156 027 828 763 747 158 365 848Spain 6 119 37 0 0 6 156 0Sweden 91 0 0 0 91 0Ukraine (d) 8 300 * 800 * 800 * 800 * 10 700 * 800 *United States 354 814 902 769 878 357 363 835 *Uzbekistan (d) 20 220 1 859 1 603 2 087 25 769 2 300Zambia 102 0 0 0 102 0
OECD 1 241 174 20 114 19 412 21 956 1 302 656 22 022
TOTAL 2 133 114 (e) 36 050 35 492 40 263 2 244 919 41 250
* Secretariat estimate. (a) Includes 102 241 tU produced in the former Czechoslovakia and CSFR from 1946 through the end of 1992. (b) Production includes 213 380 tU produced in the former GDR from 1946 through the end of 1989. (c) Production comes from mine rehabilitation efforts only. (d) Production since 1992 only. (e) Includes Secretariat estimate of 377 613 tU produced in the former USSR from 1945 through the end of
1991 and 380 tU in the former Yugoslavia prior to 1991.

31
Figure 5. Recent World Uranium Production
0
5 000
10 000
15 000
20 000
25 000
30 000
35 000
40 000
45 000
1998 1999 2000 2001 2002 2003 2004
Year
tU/y
ear
Others*
South Africa
United States
Uzbekistan
Namibia
Kazakhstan
Russian Fed.
Niger
Australia
Canada
* “Others” includes the remaining producers (Table 12).

32
Present Status of Uranium Production
North America production, which contributed about 31% to the world total in 2004, decreased slightly from 2002 (12 509 tU) to 2004 (12 475 tU). Canada remained the world’s leading producer, as increased McArthur River production exceeded the decline in Rabbit Lake output in 2004 as operations returned to normal at the McArthur River mine following repair of damage caused by water inflow that inundated a portion of the mine in 2003. Production in 2005 is expected to remain strong (11 800 tU), with increased McArthur River, Key Lake and Rabbit Lake production expected to compensate for the closure of the Cluff Lake facility in 2002. Production in the United States declined to 878 tU in 2004, and is expected to further decline to 835 tU in 2005. Almost all production came from three ISL operations, with a small amount coming from ISL restoration and mine water treatment activities.
Brazil was the only producing country in South America in 2003 and 2004. Production increased to 300 tU in 2004, as the Lagoa Real production centre reached full capacity. In Argentina, the Sierra Pintada mine of the San Rafael complex, which was placed on standby in 1999, is expected to restart production in the near future.
Output from Western Europe and Scandinavia remained very low in 2004, representing less than 1% of total world production. In Germany, 77 tU were recovered from mine rehabilitation efforts in 2004 and it is expected that about the same amount will be recovered in 2005. Spain ceased production in 2003.
Production in Central, Eastern and South-eastern Europe increased slightly from 4 215 tU in 2002 to 4 586 tU in 2004, or about 11.4% of world production. In 2005, production is expected to remain stable to 4 399 tU. The Czech Republic produced 412 tU in 2004 and it is expected to produce 320 tU in 2005. Hungary effectively ceased mine production in 2003 with only small amounts continuing to be produced via mine remediation efforts. Production in the Russian Federation increased from 2 850 tU in 2002 to 3 280 tU in 2004. Most of this production came from the Krasnokamensk mine, although 175 tU were produced in 2004 at the Dalur ISL facility at the Dalmatovskoe deposit in the Transural district. Production is expected to remain at about 3 275 tU in 2005. Production in Ukraine is estimated to have been 800 tU in 2003 and 2004.
Three countries in Africa, Namibia, Niger and South Africa, contributed about 17.5% to world production in 2004. Production in Africa progressed from 6 241 tU in 2002 to 7 031 tU in 2004 with production in Namibia increasing from 2 333 tU in 2002 to 3 039 tU in 2004. Niger’s output increased from 3 080 tU in 2002 to 3 245 tU in 2004 and is expected to increase to 3 400 tU in 2005. Production in South Africa decreased from 828 tU in 2002 to 747 tU in 2004, but is expected to reach 848 tU in 2005. Uranium production in South Africa is primarily determined by the gold content of the ore, since uranium is produced as a co-product of gold mining.
Production in the Middle East, Central and Southern Asia increased steadily between 2002 and 2004, totalling 6 076 tU in 2004, or about 15% of the world total, compared to 4 953 tU in 2002. This increase is largely driven by developments in Kazakhstan, where production rose from 2 826 tU in 2002 to 3 719 tU in 2004, and is expected to further increase to 4 175 tU in 2005. During the same period, production in Uzbekistan reached 2 087 tU in 2004 and is expected to increase to 2 300 tU in 2005. India and Pakistan do not report production data and their 2004 output is estimated to have remained steady from 2002 to 2004 at 230 tU and 40 tU, respectively.
China, the only producing country in East Asia, does not report official production figures. Annual production is estimated to have been 730 tU from 2002 through 2004.

33
Australia, the only producing country in the Pacific region, reported a significant increase from 6 854 tU in 2002 to 8 982 tU in 2004, as Olympic Dam recovered from incidents that reduced production in 2003 and Ranger achieved record production in 2004. Beginning in 2000, ISL production at the Beverley mine has steadily increased to 920 tU in 2004, making it the world’s largest single in situ leach uranium mine.
Ownership
Table 13 shows the ownership of uranium production in 2004 in the 19 producing countries. Domestic mining companies controlled about 69.3% of 2004 production, compared to about 64.3% in 2002. Privately-owned domestic mining companies increased their share in 2004; for the first time surpassing government-owned companies. Non-domestic mining companies controlled about 28.6% of 2004 production with approximately 10.2% controlled by government-owned companies and 18.4% by privately-owned companies.
Table 13. Ownership of Uranium Production based on 2004 Output
Domestic mining companies Non-domestic mining companies
COUNTRY Government-owned Privately-owned Government-owned Privately-owned TOTAL
tU/year % tU/year % tU/year % tU/year %
Australia 0 0.0 3 952 44.0 327 3.6 4 703 52.4 8 982Brazil 300 100.0 0 0.0 0 0.0 0 0.0 300Canada 0 0.0 7 655 66.0 3 769 32.5 173 1.5 11 597China* 730 100.0 0 0.0 0 0.0 0 0.0 730Czech Republic 412 100.0 0 0.0 0 0.0 0 0.0 412France 5 87.7 1 16.7 0 0.0 0 0.0 6Germany 77 100.0 0 0.0 0 0.0 0 0.0 77Hungary 4 100.0 0 0.0 0 0.0 0 0.0 4India* 230 100.0 0 0.0 0 0.0 0 0.0 230Kazakhstan 2 716 73.0 647 17.4 0 0.0 356 9.6 3 719Namibia* 106 3.5 2 933 96.5 0 0.0 0 0.0 3 039Niger 1 077 33.2 0 0.0 0 0.0 2 168 66.8 3 245Pakistan* 40 100.0 0 0.0 0 0.0 0 0.0 40Romania* 90 100.0 0 0.0 0 0.0 0 0.0 90Russian Federation 3 280 100.0 0 0.0 0 0.0 0 0.0 3 280South Africa 0 0.0 747 100.0 0 0.0 0 0.0 747Ukraine * 800 100.0 0 0.0 0 0.0 0 0.0 800United States 0 0.0 NA NA 0 0.0 NA NA 878Uzbekistan 2 087 100.0 0 0.0 0 0.0 0 0.0 2 087
TOTAL 11 954 29.7 15 935 39.6 4 096 10.2 7 400 18.4 40 263
* Secretariat estimate. NA Not available.
Employment
Although the data are incomplete, Table 14 shows that employment levels at existing uranium production centres declined slightly from 2002 to 2004, and are expected to continue to do so in 2005. This continues the trend seen from the mid-1990s of a steady reduction in employment levels. Table 15 provides, in selected countries, employment directly related to uranium production (excluding head office, R&D, pre-development activities, etc).
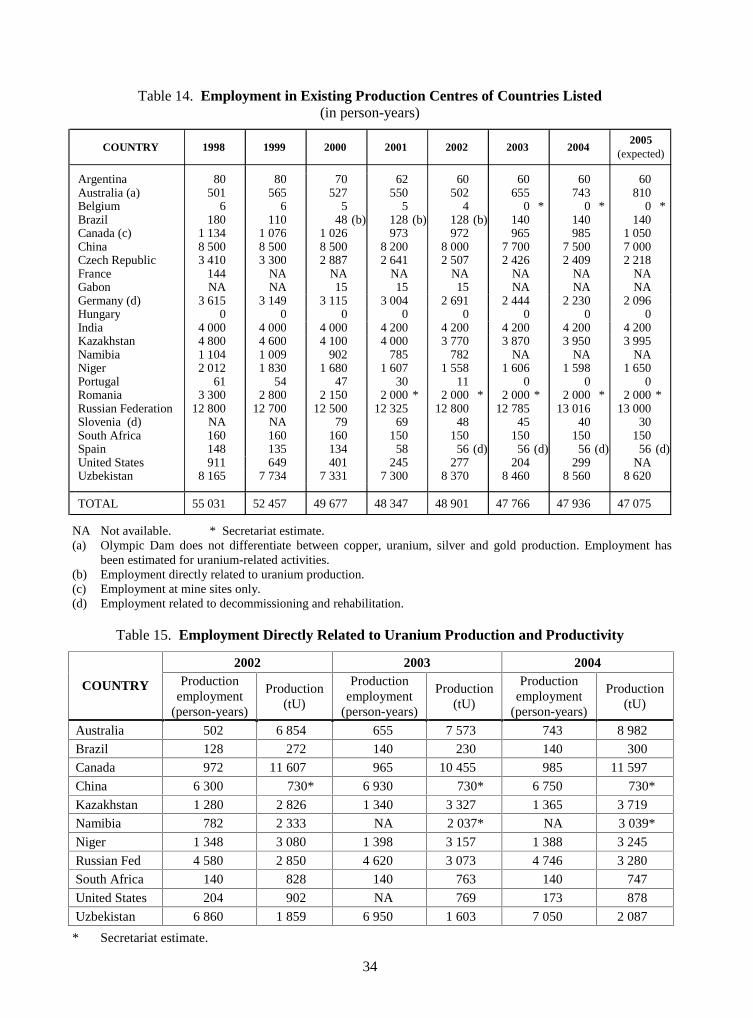
34
Table 14. Employment in Existing Production Centres of Countries Listed (in person-years)
Argentina 80 80 70 62 60 60 60 60Australia (a) 501 565 527 550 502 655 743 810Belgium 6 6 5 5 4 0 * 0 * 0 *Brazil 180 110 48 (b) 128 (b) 128 (b) 140 140 140Canada (c) 1 134 1 076 1 026 973 972 965 985 1 050China 8 500 8 500 8 500 8 200 8 000 7 700 7 500 7 000Czech Republic 3 410 3 300 2 887 2 641 2 507 2 426 2 409 2 218France 144 NA NA NA NA NA NA NAGabon NA NA 15 15 15 NA NA NAGermany (d) 3 615 3 149 3 115 3 004 2 691 2 444 2 230 2 096Hungary 0 0 0 0 0 0 0 0India 4 000 4 000 4 000 4 200 4 200 4 200 4 200 4 200Kazakhstan 4 800 4 600 4 100 4 000 3 770 3 870 3 950 3 995Namibia 1 104 1 009 902 785 782 NA NA NANiger 2 012 1 830 1 680 1 607 1 558 1 606 1 598 1 650Portugal 61 54 47 30 11 0 0 0Romania 3 300 2 800 2 150 2 000 * 2 000 * 2 000 * 2 000 * 2 000 *Russian Federation 12 800 12 700 12 500 12 325 12 800 12 785 13 016 13 000Slovenia (d) NA NA 79 69 48 45 40 30South Africa 160 160 160 150 150 150 150 150Spain 148 135 134 58 56 (d) 56 (d) 56 (d) 56 (d)United States 911 649 401 245 277 204 299 NAUzbekistan 8 165 7 734 7 331 7 300 8 370 8 460 8 560 8 620
TOTAL 55 031 52 457 49 677 48 347 48 901 47 766 47 936 47 075
2005 (expected)
1998 1999 2000 2004COUNTRY 2001 2002 2003
NA Not available. * Secretariat estimate. (a) Olympic Dam does not differentiate between copper, uranium, silver and gold production. Employment has
been estimated for uranium-related activities. (b) Employment directly related to uranium production. (c) Employment at mine sites only. (d) Employment related to decommissioning and rehabilitation.
Table 15. Employment Directly Related to Uranium Production and Productivity
2002 2003 2004
COUNTRY Production employment
(person-years)
Production (tU)
Production employment
(person-years)
Production (tU)
Production employment
(person-years)
Production (tU)
Australia 502 6 854 655 7 573 743 8 982
Brazil 128 272 140 230 140 300
Canada 972 11 607 965 10 455 985 11 597
China 6 300 730* 6 930 730* 6 750 730*
Kazakhstan 1 280 2 826 1 340 3 327 1 365 3 719
Namibia 782 2 333 NA 2 037* NA 3 039*
Niger 1 348 3 080 1 398 3 157 1 388 3 245
Russian Fed 4 580 2 850 4 620 3 073 4 746 3 280
South Africa 140 828 140 763 140 747
United States 204 902 NA 769 173 878
Uzbekistan 6 860 1 859 6 950 1 603 7 050 2 087
* Secretariat estimate.

35
Production Techniques
Uranium is mainly produced using open-pit and underground mining techniques followed by conventional uranium milling. Other mining methods include in situ leaching (ISL); co-product or by-product recovery from copper, gold and phosphate operations; heap leaching and in-place leaching (also called stope or block leaching). Stope/block leaching involves the extraction of uranium from broken ore without removing it from an underground mine, whereas heap leaching involves the use of a leaching facility on the surface once the ore has been mined. Small amounts of uranium are also recovered from water treatment and environmental restoration activities.
Historically, uranium production has principally involved open-pit and underground mining. However, over the past two decades, ISL mining, which uses either acid or alkaline solutions to extract the uranium directly from the deposit, has become increasingly important. The uranium dissolving solutions are injected into, and recovered from, the ore-bearing zone using a system of wells. ISL technology is currently being used to extract uranium from sandstone deposits only.
The distribution of production by type of mining or “material sources” for 1998 through 2003 is shown in Table 16. From 2001 to 2005, “other” includes recovery of uranium through treatment of mine waters as part of reclamation and decommissioning.
As shown in Table 16, open-pit and underground mining with conventional milling continue to be the dominant uranium production technologies, accounting for 70.2% of total production in 2001, 71.4% in 2003 and 66.7% expected in 2005. The increase in ISL since 2002 resulted from increased production in Australia, Kazakhstan and the Russian Federation. The contribution from co-product/by-product recovery, which declined to 9.0% in 2002 resulting from the reduced production in Australia (Olympic Dam) has steadily increased since and represented 11.1% of world production for 2004.
In 2005, open-pit and underground mining are expected to continue to account for a majority of the world’s uranium production, with the underground share expected to increase slightly. Startup of the Cigar Lake mine in Canada, expected in 2007, would contribute to retaining the prominence of underground mining. Production using ISL technology is expected to increase its relative share due to increased production expected in Kazakhstan, the Russian Federation and Uzbekistan. In the near future, ISL could increase its significance further if planned projects in Kazakhstan, the Russian Federation, the United States and Uzbekistan are brought into production. Implementation of a major increase in capacity at Olympic Dam, currently under evaluation, would ensure a continued important role for the co-product/by-product category.
Table 16. Percentage Distribution of World Production by Production Method
Production method 2001 2002 2003 2004 2005
(expected)
Open-pit 26.1 26.8 29.8 27.6 26.6
Underground 44.1 43.1 41.6 39.3 40.1
In situ leaching 15.5 18.3 18.4 19.8 19.2
Heap leaching 1.4 1.9 1.9 2.0 2.2
In place leaching* 0.0 0.0 0.0 0.0 0.1
Co-product/by-product 12.3 9.0 9.7 11.1 11.0
Other methods** 0.5 0.9 0.5 0.2 0.2
* Also known as stope leaching or block leaching. ** Includes mine water treatment and environmental restoration.

36
Projected Production Capabilities
To assist in developing projections of future uranium availability, member countries were asked to provide projections of production capability through 2025. Table 17 shows the projections for existing and committed production centres (A-II columns) and for existing, committed, planned and prospective production centres (B-II columns) in the <USD 80/kgU category through 2025 for all countries that either are currently producing uranium or have the potential to do so in the future. Note that both the A-II and B-II scenarios are supported by local RAR and Inferred Resources in the <USD 80/kgU category.
Several current or potential uranium producing countries, including China, Mongolia, Namibia, Pakistan and Romania, did not report projected production capabilities. Projections of future production capability for Pakistan and Romania in Table 17 are based on reports that these countries intend to meet their future domestic reactor requirements with domestic production. China reports only a capability to meet its short-term requirements unless new resources are discovered.
The reported production capability of existing and committed production centres in 2005 is about 49 720 tU. Expected 2005 production of 41 250 tU thus represents about 83% of the stated production capability. For comparison, 2002 uranium production was 36 050 tU, or about 76% of the 2003 production capability. Total production capability for 2005, including planned and prospective centres, is about 51 565 tU, 3 705 tU more than the 2003 total capability of 47 860 tU. Clearly, an expansion in production capability driven by recent uranium price increases is underway.
According to the information compiled for this volume, the uranium production industry is projected to undergo a significant expansion during the next 10 years as existing production centres are expanded and new production centres are brought online. Later, closure of existing mines due to resource depletion is expected to result in a levelling and downward trend in production capability. As currently projected, production capability of existing and committed production centres would peak in 2010 at 68 605 tU/year before lowering to 64 690 tU/year in 2025. Total potential production capability (including planned and prospective production centres) is currently projected to rapidly climb to 83 370 tU/year in 2010 before increasing gradually to 86 900 tU/year in 2025.
Changes in Production Facilities
Production capability at existing and committed production centres has increased only slightly between 2001 (45 310 tU), when uranium prices began to increase, and 2003 (47 170 tU) and 2005 (49 720 tU). However, significant new production capability is planned for the near-term both through the expansion of existing production centres and the opening of new mines. Some of the significant changes that are expected in the next few years include:
Planned facility closures
2008 Czech Republic (Dolni Rozinka, 200 tU/yr).
Planned mine re-openings or expansion of existing facilities
2006 China (Expansion of Fuzhou to 200 tU).
2007 India (Production at Banduhurang mi-ne in sandstone).
India (Production centre at Bagjata mine in vein).
2010 Australia (Proposed Olympic Dam expansion, to produce 12 720 tU/yr).

37
Table 17. World Uranium Production Capability to 2025 (in tonnes U/year, from RAR and Inferred Resources recoverable at costs up to USD 80/kgU, except as noted)
2005 2010 2015 2020 2025
A-II B-II A-II B-II A-II B-II A-II B-II A-II B-II
Argentina 500 500 500 500 500 500 NA NA NA NAAustralia 9 900 9 900 10 200 19 000 5 500 17 700 5 500 17 700 5 500 17 700Brazil 340 340 1 100 1 100 1 100 1 100 NA NA NA NACanada 14 990 14 990 15 430 17 730 15 430 18 730 15 430 17 430 15 430 17 430China * 540 540 740 740 840 840 840 840 840 840Czech Republic 250 250 50 50 60 60 50 50 40 40India 365 510 510 880 510 1 200 510 1 600 510 * 2 000 *Kazakhstan 4 200 4 200 15 000 15 000 15 000 15 000 15 000 * 15 000 * 15 000 * 15 000 *Mongolia * 0 0 150 500 150 500 150 500 150 500Namibia * 4 000 4 000 4 000 4 000 4 000 4 000 4 000 4 000 4 000 4 000Niger 3 800 3 800 3 800 3 800 3 800 3 800 3 800 3 800 3 800 3 800Pakistan * (a) 65 65 65 110 90 110 235 380 360 530Romania * (a) 100 100 200 200 200 200 300 300 300 300Russian Federation 3 200 3 200 4 300 4 500 5 500 6 300 5 500 7 500 5 500 9 000South Africa (b) 1 270 1 270 4 660 4 660 4 660 4 660 4 660 4 660 4 660 4 660Ukraine 1 000 1 000 1 500 1 500 1 500 2 000 2 000 2 000 2 000 2 000United States 2 900 4 600 3 400 6 100 3 800 6 600 3 700 6 500 3 100 5 600Uzbekistan 2 300 2 300 3 000 3 000 3 000 3 000 3 000 3 000 3 500 3 500
TOTAL 49 720 51 565 68 605 83 370 65 640 86 300 64 675 85 260 64 690 86 900
COUNTRY
A-II Production Capability of Existing and Committed Centres supported by RAR and Inferred Resources recoverable at <USD 80/kgU. B-II Production Capability of Existing, Committed, Planned and Prospective Centres supported by RAR and Inferred Resources recoverable at <USD 80/kgU. NA Data not available or not reported. * Secretariat estimate. (a) Projections are based on reported plans to meet domestic requirements. (b) From resources recoverable at costs of <USD 40/kgU.

38
Recent mine openings
2001 Kazakhstan (JV Betpak Dala, 700 tU/yr) Kazakhstan (JV Inkai, 700 tU/yr) Kazakhstan (JV KATCO – Moinkum deposit, 700 tU/yr) Russia (Dalmatovskoe, 700 tU/yr)
2003 India (Turamdih, 40 tU/yr) Kazakhstan (Zarechnoye, 1 000 tU/yr)
New mines planned
2005 Iran (Bandar Abbas, 21 tU/yr) Russia (Khiagda, 1 000 tU/yr)
2006 India (Banduhuran, 150 tU/yr, Lambapur, 130 tU/yr) Namibia (Langer Heinrich, 1 000 tU/yr) Niger (Ebba, 2 000 tU/yr) Kazakhstan (JV KATCO – Tortkuduk, 1 000 tU/yr)
2007 Brazil (Itataia, 680 tU/yr) Canada (Cigar Lake, 6 900 tU/yr) Iran (Ardakan, 50 tU/yr) Kazakhstan (JV Kendala – Central Mynkuduk, 2 000 tU/yr)
2008 Kazakhstan (LLP Stepnogorskiy Mining and Chemical Complex – Semizbai, 400 tU/yr) Kazakhstan (LLP Kyzylkum – Kharasan-1, 1 000 tU/yr) Kazakhstan (Southern Inkai, 1 000 tU/yr) Kazakhstan (Irkol, 750 tU/yr) Kazakhstan (JV Karatau – Budenovskoye 2)
2010 Canada (Midwest, 2 300 tU/yr)
2010-2030 Kazakhstan (Central Moinkum) Kazakhstan (Kharasan-2) Kazakhstan (Zhalpak) Kazakhstan (Budenovskoye-1)
Date Unknown Australia (Honeymoon, 340 tU)

39
REFERENCES
[1] F. Barthel (2005), Thorium and Unconventional Uranium Resources, presented at IAEA Technical Meeting on “Fissile Materials Management Strategies for Sustainable Nuclear Energy”, Vienna, Austria, 12-15 September 2005.
[2] United Nations Development Program (2000), World Energy Assessment, New York, which was based on data from the German Federal Institute for Geosciences and Natural Resources.

41
II. URANIUM DEMAND
This chapter summarises the current status and projected growth in world nuclear electricity generating capacity and commercial reactor-related uranium requirements. Relationships between uranium supply and demand are analysed and important developments related to the world uranium market are described. The data for 2005 and beyond are estimates and actual figures could differ.
A. CURRENT COMMERCIAL NUCLEAR GENERATING CAPACITY AND REACTOR-RELATED URANIUM REQUIREMENTS
World (369.2 GWe net as of 1 January 2005)
On 1 January 2005, a total of 440 commercial nuclear reactors were operating in 30 countries and 27 reactors were under construction (about 19.3 GWe net).1 During 2003 and 2004, seven reactors were connected to the grid (about 6.4 GWe net) and 11 reactors were permanently shut down (about 2.4 GWe net). Table 18 and Figures 6 and 7 summarise the status of the world’s nuclear power plants as of 1 January 2005. These power plants generated about 2 524 TWh of electricity in 2003 and about 2 638 TWh in 2004 (Table 19).
World annual uranium requirements were about 67 320 tU in 2004 and are estimated to decrease to about 66 840 tU in 2005.
OECD (306.5 GWe net as of 1 January 2005)
As of 1 January 2005, the 349 reactors in operation in 17 OECD countries constituted about 84% of the world’s nuclear electricity generating capacity. A total of four reactors were under construction with a net capacity of about 4.2 GWe. During 2003 and 2004, two reactors were started up (about 2.3 GWe net) and 10 reactors were shut down (about 1.2 GWe net).
Within the OECD there are great differences in nuclear energy policy. Japan and South Korea remain committed to continue strong growth in nuclear energy, whereas several member countries in Western Europe are committed to phasing out nuclear energy, notably Belgium, Germany and Sweden. The Spanish government has also announced its intention to gradually phase out nuclear energy. At the same time, other countries in Western Europe, such as Finland and France, remain strongly committed to the use of nuclear energy. In North America there are indications that construction of new capacity may be announced in the United States before the end of the decade stimulated by new comprehensive energy legislation.
The OECD reactor-related uranium requirements were 55 610 tU for 2004 and are expected to be about 54 955 tU in 2005.
1. Figures include the reactors operating and under construction in Chinese Taipei.

42
Table 18. Nuclear Data Summary
(as of 1 January 2005)
COUNTRY Operating reactors
Generating capacity
(GWe net)
2004 Uranium
requirements (tU)
Reactors under
construction
Reactors started up
during 2003 and 2004
Reactors shut down
during 2003 and 2004
Reactors using MOX
Argentina 2 0.94 120 1 0 0 0 Armenia 1 0.38 90 0 0 0 0 Belgium 7 5.80 1 125 0 0 0 1 Brazil 2 1.90 450 0 0 0 0 Bulgaria 4 2.72 840* 0 0 0 0 Canada 17 12.00 1 700 0 0 (a) 0 0 China (b) 9 6.70 1 260 2 2 0 0 Czech Republic 6 3.51 600 0 0 0 0 Finland 4 2.68 535 0 (c) 0 0 0 France 59 63.30 7 185 0 0 0 20 Germany 18 20.60 3 000 + 0 0 1 9 Hungary 4 1.80 370 0 0 0 0 India 14 2.55 240 9 0 0 3 Iran, Islamic Rep. of 0 0.00 0 1 0 0 0 Japan 54 (d) 43.91 (e) 7 140 (f) 3 1 1 0 Korea, Republic of 19 16.72 3 200 1 1 0 0 Lithuania 1 2.76 315 0 0 1 0 Mexico 2 1.40 180+ 0 0 0 0 Netherlands 1 0.45 65+ 0 0 0 0 Pakistan 2 0.43 65* 0 0 0 0 Romania 1 0.66 100* 1 0 0 0 Russian Federation 31 23.24 4 740 4 1 0 NA Slovak Republic 6 2.46 500 0 0 0 0 Slovenia 1 0.68 160* 0 0 0 0 South Africa 2 1.80 280 0 0 0 0 Spain 9 7.60 2 040 0 0 0 0 Sweden 11 9.40 1 600 0 0 0 0 Switzerland 5 3.22 315 0 0 0 2 Ukraine 15 13.10 2 220 2 2 0 0 United Kingdom 23 11.90 1 910+ 0 0 8 0 United States 104 99.70 24 145 0 0 0 0
OECD 349 306.45 55 610 4 2 10 32
TOTAL 440 369.19 67 320 26 7 11 35
Sources: IAEA Power Reactor Information System (www.iaea.org/programmes/a2/) except for Generating capacity and 2004 Uranium requirements, which use Government-supplied responses to a questionnaire, unless otherwise noted and rounded to the nearest five tonnes.
* Secretariat estimate. + Data from NEA Nuclear Energy Data, Paris, 2005. (a) During 2003 and 2004, two reactors at the Bruce site and one reactor at the Pickering site, shut down in 1997 for safety
concerns, were restarted. (b) The following data for Chinese Taipei are included in the world total but not in the total for China: 6 nuclear power plants
in operation, 4.9 GWe net; 830 tU; 2 reactors under construction; none started up or shut down during 2003 and 2004. (c) Construction of Okiluoto-3 (1.6 GWe net EPR) officially began in December 2005. (d) Including Hamaoka-5 and Monju. (e) Gross capacity converted to net by Secretariat. (f) Higashi-Dori-1, Shika-2 and Tomari-3.

43
Figure 6. 2004 World Installed Nuclear Capacity: 369.2 GWe net
North America
East Asia
Central & Eastern Europe
Middle East,Central & South Asia
Central & South America
Africa
Western Europe
113.1 GWe
125.0 GWe
72.2 GWe
51.3 GWe
1.8 GWe
2.8 GWe
3.0 GWe
Figure 7. 2004 World Uranium Requirements: 67 320 tU
East Asia
W estern Europe17 775 tU
M iddle East, Central & South
Asia Central & South America Africa
Central, Eastern & South East Europe
North America
9 935 tU
12 430 tU
570 tU
305 tU
280 tU
26 025 tU

44
Table 19. Electricity Generated Using Nuclear Power Plants (TWh net)
Argentina 6.56 * 5.40 * 8.40 8.50Armenia 1.99 2.29 1.82 2.21Belgium 44.10 45.10 44.90 44.90 (b)Brazil 14.35 13.84 13.34 11.55Bulgaria 19.60 * 20.20 * 16.09 * 15.60 *Canada 72.00 70.20 70.70 84.20China (c) 16.80 25.00 41.50 47.50Czech Republic 14.75 18.74 24.40 (a) 24.80 (a)Finland 22.30 (a) 21.40 21.70 21.70France 399.60 415.50 419.80 426.80 (a)Germany 162.30 * 162.25 * 156.20 155.70Hungary 14.13 13.95 11.00 + 11.90 +India 19.20 (a) 19.56 (a) 16.64 15.04Japan 319.00 314.00 230.00 282.00Korea (d) 106.60 119.10 (a) 123.50 (a) 123.97 (a)Lithuania 10.30 12.90 15.50 15.10Mexico 8.37 * 9.36 * 10.00 + 8.70 +Netherlands 3.75 * 3.69 * 3.60 + 3.60 +Pakistan 1.98 * 1.80 * 1.81 * 1.93 *Romania 5.05 * 5.20 * 5.10 * 5.10 *Russian Federation 136.30 141.20 (a) 138.40 143.00Slovak Republic 17.10 17.90 16.40 15.70Slovenia 5.31 5.04 4.96 5.21South Africa 10.70 * 11.99 * 12.67 * 14.28 *Spain (e) 63.70 (a) 63.00 59.20 60.90Sweden 69.00 70.00 65.70 + 75.00 +Switzerland 25.29 (a) 25.69 (a) 26.00 (a) 25.30Ukraine 76.18 78.00 81.40 87.40United Kingdom 83.00 81.10 81.90 73.70United States 769.00 (a) 780.00 (a) 764.00 789.00 (a)
OECD 2 193.99 2 230.98 2 129.00 2 227.87
TOTAL 2 518.31 2 573.40 2 524.03 2 638.29
20042001 2003COUNTRY 2002
* Secretariat estimate. + Nuclear Energy Data, OECD Paris, 2005. (a) Generation record. (b) Provisional data. (c) The following data for Chinese Taipei are included in the World Total but not in the total for China:
37.4 TWh in 2003 and 38.0 TWh in 2004. (d) Gross data converted to net by Secretariat. (e) Data for 2001 and 2002 are TWh gross.

45
Western Europe (125.0 GWe net as of 1 January 2005)
As of 1 January 2005, 137 nuclear reactors were operating in Western Europe. No reactors were connected to the grid in 2003 or 2004 but two reactors were committed for future construction, one each in Finland and France. Both will be of the advanced European Pressurised-water Reactor (EPR) design with the plant in Finland expected to be operational in 2009 and the one in France expected by 2012. Eight reactors in the United Kingdom (about 0.4 GWe net combined) and one reactor in Germany (about 0.6 GWe net) were shut down in 2003 and 2004. Nuclear phase out policies are being implemented or have been announced in Belgium, Germany, Spain and Sweden.
In Belgium, the Senate confirmed, in January 2003, the government’s policy to phase out nuclear energy by limiting the operational lives of its reactors to 40 years and permitting no new construction. The first reactor shut down under this policy would occur around 2015 with all reactors to be shut down by 2025. Despite the phase out policy, upgrades to the operating plants are underway or planned to increase installed capacity.
In Finland, Okiluoto was selected as the site for construction of a new nuclear power plant. The EPR (about 1.6 GWe net) was selected after a competitive bid process and construction officially began in December 2005. Plans call for the reactor to be operational by 2009.
France announced that it is planning to construct a new reactor at Flammanville in the Normandy region. Construction of the 1.6 GWe net EPR is expected to begin in 2007 with operation expected in 2012. Power uprates were approved for the four operating N4 reactors that increased capacity by about 50 MWe net per reactor for a new rating of 1.5 GWe net each. France’s nuclear power plants generated a record amount of electricity in 2004.
In Germany, the April 2002 law that codifies the long-term phase-out nuclear energy has resulted in the shutdown of the Stade reactor (about 0.6 GWe net) in November 2003 and the Obrigheim reactor (about 0.34 GWe net) in May 2005. The law grants each plant operating as of 1 January 2000 a residual operating life that has been calculated based on a standard operating life of 32 calendar years from the commencement of commercial operation. This would result in the elimination of nuclear power generation in Germany around 2021. The law also bans the reprocessing of spent fuel after 1 July 2005.
In the Netherlands, the planned shutdown of the Borssele nuclear power plant in 2005 was changed and the plant is now expected to operate at least through 2013. Plans to extend the life of the plant to 2033 were announced in September 2005.
In Spain, the government has announced intentions to phase out nuclear energy though a specific timetable has not been specified. The Jose Cabrera nuclear power plant (about 140 MWe net) has been scheduled for permanent shutdown in April 2006.
Sweden remains committed to the phase out of nuclear energy over the next 30-40 years. Closure of the Barseback-2 reactor (about 0.6 GWe net) as a result of this policy occurred on 31 May 2005. However, power uprates are planned for the remaining reactors that would add about 600 MWe net effectively making up for the loss of generating capacity caused by the shutdown of Barseback-2.

46
In Switzerland, two referenda, initiated in 1999 that would have effectively signalled a public desire to phase out of nuclear energy if they had been passed, were voted down in May 2003. In March 2003, a new nuclear law was approved by the parliament, which, among other things, keeps open the option of deploying new nuclear power plant technologies and avoids placing limits on the operational lifetime of a nuclear power plant, but includes a 10-year moratorium on the export of spent nuclear fuel for reprocessing beginning in 2006. The law and accompanying ordinance were approved by the Federal Council after public consultation and became effective on 1 February 2005. Swiss power plants generated a record amount of electricity in 2003, the third consecutive generation record, though production dipped slightly in 2004.
In the United Kingdom, low electricity prices have placed pressure on operators to shut down older nuclear power plants. As a consequence the four reactors at Calder Hall (about 0.2 GWe net combined) were shut down in March 2003 and the four units at Chapelcross (about 0.2 GWe net combined) were shut down in June 2004. The eight remaining MAGNOX reactors are all scheduled to be shut down by the end of 2010 (about 2.3 GWe net).
The reactor-related uranium requirements for Western Europe in 2004 were about 17 775 tU and are expected to decrease slightly to 16 435 tU in 2005.
North America (113.1 GWe net as of 1 January 2005)
At the beginning of 2005, there were 104 reactors with operating licenses in the United States2, 17 in Canada and two in Mexico. No new reactors were under construction, connected to the grid or shut down in 2003 and 2004, though several reactors in long-term shutdown were restarted or continued the process to restart in Canada and the United States.
In the United States, no new reactors started up and no reactors were shut down during 2003 and 2004. However, the extensions of operating lives and uprates of existing power plants continued to increase installed capacity and projected uranium requirements, even in the absence of new construction. United States regulatory authorities have approved 102 applications for power uprates through 1 January 2005, equivalent to about 4.2 GWe of net capacity. Eleven more applications are pending that, if approved, would add an additional 1.1 GWe of net capacity. During 2003 and 2004, regulatory authorities granted nine 20-year license extensions that covered a total of 20 reactors and they received eight additional applications for similar extensions that covered a total of 16 reactors. Additional capacity is also expected to be added in the nearer term when the Browns Ferry-1 plant (shut down since 1985) is restarted, planned for May 2007. Momentum seems to be building toward construction of a new nuclear plant stimulated, in part, by the enactment of the Energy Policy Act of 2005. The United States government has entered into partnership arrangements with two utility-led consortia and committed funds to test streamlined licensing processes with a goal to submit at least one license application by 2008. As part of this program the consortia are preparing applications for construction and operation licenses for Generation III+ nuclear power plants. Additionally, three companies have applied to the regulatory authority for early site permits that are valid for 20 years and would streamline the permitting process for construction of new plants.
2. The Browns Ferry 1 reactor (1 065 MWe net) is listed as operational in the IAEA Power Reactor
Information System though it has been shut down since June 1985.
47
Record levels of nuclear power generation were achieved in 2004, which made five record-setting years out of the last six. Energy production was down in 2003 due mainly to mandatory reactor pressure vessel head inspections resulting from severe corrosion discovered at the Davis Besse plant in 2002 with several reactors undergoing vessel head replacement as a result.
In Canada, following a performance assessment in 1997, eight reactors were shut down for refurbishment (four at Pickering-A site and four at Bruce-A site). During 2003 three of these reactors (two at Bruce and one at Pickering) were restarted returning about 2.1 GWe net to the grid. A second Pickering reactor was returned to service in September 2005. Plans to restart two of the remaining four reactors are being developed.
Mexico is planning on upgrading the capacity of its two reactors in 2005 adding about 130 MWe to the country’s installed capacity.
Annual requirements for North America were about 26 025 tU in 2004 and are expected to decrease to 24 930 tU in 2005.
East Asia (72.2 GWe net as of 1 January 2005)
As of 1 January 2005, 82 reactors3 were in operation in East Asia. In this region, undergoing the strongest growth in nuclear capacity in the world, three power plants were connected to the grid (about 3.6 GWe net) during 2003 and 2004 while none were shut down. Six reactors were under construction that will add about 6.3 GWe net to the grid.
In Japan, the Hamaoka-5 advanced boiling water reactor (1.38 GWe) was connected to the grid in April 2004 while the Fugen advanced thermal reactor (about 165 MWe) was shut down in March 2003. Construction continues on Higashi Dori-1 boiling water reactor (1.1 GWe) and Shika-2 advanced boiling water reactor (1.358 GWe) with commercial operation expected to begin in 2005 and 2006 respectively, and construction was started on the Tomari-3 pressurised water reactor (0.912 GWe). Government and industry continue development of an indigenous closed fuel cycle and remain committed to the use of MOX fuel in 16-18 reactors by 2010.
In the Republic of Korea, the Ulchin-5 reactor (about 1.0 GWe net) was connected to the grid in 2004 and no reactors were closed during 2003 and 2004. Current plans call for 28 nuclear reactors to be operational by 2015 as compared to the 19 power plants in operation on 1 January 2005. In accordance with these plans the Ulchin-6 reactor (about 1.0 GWe net) was connected to the grid in January 2005 and the government approved construction of two 1.0 GWe net reactors at the Shin-Kori nuclear power plant with operations projected to begin in 2009. Korea’s nuclear power plants generated record amounts of electricity in 2003 and 2004.
3. There were also six nuclear power plants in operation in Chinese Taipei (about 4.9 GWe net) and two plants
under construction (about 2.7 GWe net).

48
In China, there were nine reactors in operation (about 6.7 GWe net) and two under construction (about 2.0 GWe net) as of 1 January 2005. The Qinshan 3-2 reactor (about 0.7 GWe net) was connected to the grid in June 2003 and the Qinshan 2-2 reactor (about 0.6 GWe net) was connected to the grid in March 2004. No reactors were shut down during 2003 and 2004. The government of China has announced plans to increase installed nuclear capacity to about 36 GWe by 2020 that will be accomplished through the construction of 27 reactors of at least 1.0 GWe net each beginning in 2005. China also announced a desalination project in the Shandong province that would use a 200 MW reactor as its power source with operation projected to begin in 2007. Plans were also announced to construct a high-temperature, pebble-bed gas-cooled reactor (about 0.2 GWe) as a commercial demonstration project beginning in 2006 with operation projected to begin in 2010.
The 2004 reactor-related uranium requirements for the East Asia region were 12 430 tU and for 2005 are expected to increase to about 14 465 tU.
Central, Eastern and South-eastern Europe (51.3 GWe net as of 1 January 2005)
As of 1 January 2005, 70 reactors were in operation in 10 countries in this region with seven reactors under construction that will add about 6.4 GWe net when completed. During 2003 and 2004, three plants were connected to the grid (about 2.9 GWe net) and one plant was shut down (about 1.2 GWe net). Entry into the European Union has been a factor driving the planned shutdown of several older model reactors in Bulgaria, Lithuania and the Slovak Republic. These shutdowns may be offset, however, as these governments are considering plans to construct new nuclear power plants to meet energy demand and Kyoto treaty requirements.
In the Russian Federation, 31 reactors (about 23.2 GWe net) were operational as of 1 January 2005. The Kalinin-3 reactor (about 1 GWe net) was connected to the grid in December 2004 while four other reactors remain under construction (about 3.8 GWe net combined). No reactors were shut down during 2003 and 2004. Announced plans are to have at least 32 GWe net of installed capacity in operation by 2020. Additionally, there are announced plans to upgrade existing power plants to increase capacity as well as extend operating lives. For example, the Leningrad-1 plant had its operating life extended from 30 to 45 years in June 2003. Plans were approved by the government of Bashkortostan, an autonomous republic within the Russian Federation, to construct the Bashkir-1 and the Bashkir-2 reactors (about 1 GWe net each) with operation expected to begin in 2012 and 2014, respectively. Russian nuclear power plants generated a record amount of electricity in 2003.
In Ukraine, there were 15 reactors operating on 1 January 2005 with an installed capacity of about 13.1 GWe net. The Khmelnitski-2 and Rovno-4 reactors were started up in 2004 (about 1.9 GWe net combined). No reactors were shut down during 2003 and 2004. Plans have been announced to complete construction of the Khmelnitsky-3 reactor (about 1 GWe net) with operation expected by 2012. Completion of the Khmelnitsky-4 reactor is expected but specific plans have not yet been announced.
The Czech Republic saw the beginning of commercial operation of Temelin-2 in April 2003. As a result there was a 30% increase in nuclear generated electricity from 2002 to 2003, with record levels of electricity generated in 2003 and 2004.

49
In Romania, construction of the Cernavoda-2 plant (about 0.7 GWe net) continues with the plant expected to be operational in 2007. The government is also planning to construct the Cernavoda-3 reactor (about 0.7 GWe net) with operation expected to begin in 2011.
In Bulgaria, two of the four operating reactors at Kozloduy (about 0.4 GWe net each) are planned to be permanently shut down by the end of 2006 as part of Bulgaria’s agreement for entry into the European Union. To compensate for the loss of generating capacity, the government is planning to complete the partially constructed plant at Belene, with construction commencing in 2005 and operations expected to begin in 2010, and is considering construction of a second unit at the same site.
In Hungary, the Paks-2 reactor that was shut down in April 2003, following a fuel cleaning incident, was restarted in September 2004. Generation at the plant was reduced as a result. Despite the incident, plans have been announced to extend the operating life of the Paks nuclear power plant for up to 20 years beyond the originally intended 30 year life-span and to increase the capacity of the plant by about 10% (from 460 MWe to up to 510 MWe).
In Lithuania, the Ignalina-1 reactor (about 1.2 GWe net) was permanently shut down in December 2004 in accordance with agreements made for entry into the European Union. Ignalina-2 is scheduled to be shut down in 2009. The government is considering construction of a new nuclear power plant to be operational in 2010 as a way to replace the capacity lost by these shutdowns.
The Slovak Republic, as part of its European Union ascension agreement, will permanently shut down the Bohunice-1 and Bohunice-2 reactors in 2006 and 2008, respectively (about 0.8 GWe net combined). Plans have been announced to complete the Mohunice-3 and -4 (about 0.4 GWe net each) reactors with operation projected to begin in 2009.
Reactor-related uranium requirements in 2004 for this region were about 9 935 tU and are expected to decrease to 9 715 tU in 2005.
Middle East, Central and Southern Asia (3.0 GWe net as of 1 January 2005)
As of 1 January 2005, 16 reactors were in operation and 10 were under construction (about 5.0 GWe net). During 2003 and 2004, no reactors were connected to the grid and none were shut down.
In India, 14 reactors (about 2.6 GWe net) were operational on 1 January 2005 and nine reactors with a total capacity of about 4.1 GWe net were under construction. Announced plans call for the increase of the country’s nuclear generation capacity to 10 GWe by 2010 and 20 GWe by 2020. Construction of a prototype fast breeder reactor (about 0.5 GWe) began in early 2003. This reactor represents a major step forward for India’s plans to introduce a thorium-based nuclear fuel cycle after its scheduled completion in 2010. Similarly, India announced that it has completed design of an Advanced Heavy Water Reactor that would use thorium and uranium as fuel and generate more uranium than it consumes. A prototype is planned to be built with operation projected by 2011.

50
In Pakistan, a formal agreement has been signed with China to construct a new reactor to be known as Chasnupp-2 (about 0.3 GWe net) with operation expected in 2010; this would be Pakistan’s third operational reactor. Plans for a fourth reactor have been submitted to the government by the Pakistan Atomic Energy Commission. In May 2004, the Pakistani Nuclear Regulatory Authority authorised a life extension of the Kanupp reactor for an additional 15 years beyond its 30-year design life.
In Iran, the Bushehr-1 reactor (about 0.9 GWe net) is expected to startup in 2006. The Iranian government has announced its intention to construct the Bushehr-2 reactor with plans to have 20 GWe net of installed capacity by 2033.
In February 2003, the government of Kazakhstan announced plans to construct a nuclear power plant in the south-eastern part of the country near Lake Balkhash in partnership with the Russian Federation. A tender is planned for 2007; however, the new reactor is not expected to be in operation before 2015.
Reactor-related uranium requirements for the Middle East, Central and Southern Asia region were about 305 tU in 2004 and are expected to increase to 445 tU in 2005.
Central and South America (2.8 GWe net as of 1 January 2005)
At the beginning of 2005, there were four nuclear units operating in two countries in this region – two each in Argentina and Brazil.
Brazil continues to analyze plans for construction of the Angra-3 reactor (about 1.4 GWe net) with a decision expected late in 2005.
In Argentina, the government plans to complete the partially constructed Atucha-2 reactor, which is over 80% complete. Completion is projected for 2009.
The uranium requirements for Central and South America were about 570 tU in 2004 and are expected to remain the same in 2005.
Africa (1.8 GWe net as of 1 January 2005)
Nuclear capacity remained constant in Africa with the region's only two reactors located in South Africa. South Africa continues to actively develop the Pebble Bed Modular Reactor, a high-temperature, helium-cooled reactor (about 0.1 GWe net). A demonstration plant is planned to be built with operation expected to begin in 2010.
51
The government of Nigeria has asked the IAEA for assistance to construct two 1.0 GWe net reactors as it looks to increase base load generating capacity as part of plans to eliminate power shortages.
Annual reactor-related uranium requirements were about 280 tU in 2004 and are expected to remain the same in 2005.
South-eastern Asia (0 GWe net as of 1 January 2005)
This region has no current commercial nuclear capacity. However, Indonesia and Vietnam are planning the construction of nuclear reactors to satisfy their anticipated increased demand for electricity. Indonesia has announced its plans to start construction of a commercial nuclear power plant by 2010 with a plant operational by 2016. Vietnam has established a nuclear power programme and approved a national energy plan that aims to construct at least two nuclear power plants to be operational by 2010.
Pacific (0 GWe net as of 1 January 2005)
This region has no commercial nuclear capacity. Although the government of Australia prohibits the development of commercial nuclear energy, construction of the Open Pool Australian Light-water (OPAL) research reactor is scheduled for completion in 2005. The government of New Zealand also has a policy prohibiting the development of nuclear power.
B. PROJECTED NUCLEAR POWER CAPACITY AND RELATED URANIUM REQUIREMENTS TO 2025
Factors Affecting Capacity and Uranium Requirements
Reactor-related requirements for uranium, over the short-term, are fundamentally determined by installed nuclear capacity, or more specifically by the number of kilowatt-hours of electricity generated in operating nuclear power plants. As noted, the majority of the anticipated near-term capacity is already operating, thus short-term requirements may be predicted with relative certainty.
Uranium demand is also directly influenced by changes in the performance of installed nuclear power plants and fuel cycle facilities, even if the installed base capacity remains the same. Over the past decade there has been a worldwide trend toward higher nuclear plant energy availability and capacity factors. In 2004, the average world nuclear energy availability factor (as defined by the IAEA) was 83.2% compared with 1990 when it was 71.0% [1 ]. Longer operating lifetimes and

52
increased availability tend to increase future uranium requirements. Other factors that affect uranium requirements include plant retirements; fuel-cycle length and discharge burn-up and the ratio between natural uranium and enrichment prices.4
The strong performance and economic competitiveness of existing plants, chiefly because of low operating, maintenance and fuel costs, has made retention and improvement of these plants desirable in many countries. This has resulted in the developing trend to keep existing plants operating as long as can be achieved safely as well as upgrading their generating capacity, when possible. This trend is especially pronounced in the United States but other countries (e.g. France, Hungary, Netherlands, Russian Federation, Sweden and Switzerland) have or are planning to extend the lives of existing power plants and/or upgrade their generating capacities.
Installation of new nuclear capacity will increase uranium requirements when new build capacity outweighs retirements. Many factors that influence decisions on the installation of new nuclear generating capacity must be resolved before there are likely to be any new significant building programmes. These factors include:
� Projected growth of base load electricity demand.
� The cost-competitiveness of new nuclear power plants and fuel compared to other energy sources, particularly with deregulation of electricity markets.
� Concerns about security of fuel supplies.
� Public attitudes and acceptance towards the safety of nuclear energy and proposed waste management strategies.
� Concerns about the connection between the civil nuclear fuel cycle and military uses.
� Environmental considerations, in particular consideration of the role nuclear energy can play in reducing air pollution and greenhouse gas emissions.
Evidence suggests that many nations have decided that the balance of these factors supports construction of new nuclear power plants. Significant building programmes are underway in China, India, Korea, Japan and the Russian Federation. Smaller programs are underway or planned in Finland and France and momentum seems to be building to begin construction in the United States. This building of support for nuclear energy was evident in the international conference on Nuclear Power for the 21st Century in Paris, France (March 2005) that brought together representatives from 74 States and 10 international organisations. The Final Statement declared: “A wide range of views were expressed. In this context, a vast majority of participants affirmed that nuclear power can make a major contribution to meeting energy needs and sustaining the world’s development in the 21st century, for a large number of both developed and developing countries…”5
4. A reduction of the enrichment tails assay from 0.3 to 0.25% 235U would, all other factors being equal,
reduce uranium demand by about 9.5% and increase enrichment demand by about 11%. The tails assay selected by the enricher is dependent on many factors including the ratio between natural uranium and enrichment prices.
5. Final Statement, International Ministerial Conference: “Nuclear Power for the 21st Century”, Paris, France, 22 March 2005.

53
On the other hand nuclear phase-outs have been announced in several European nations that will tend to reduce installed capacity in that region. However, construction programmes along with capacity upgrades and life extensions are projected to outweigh reactor shutdowns so that world installed capacity is expected to continue to increase through 2025, thereby increasing projected uranium requirements over that period.
Projections to 20256
Forecasts of installed capacity and uranium requirements, although uncertain due to the above-mentioned factors, point to future growth. Installed nuclear capacity is projected to grow from about 369 GWe net at the beginning of 2005 to about 449 GWe net (low case) or 533 GWe net (high case) by the year 2025. The low case represents growth of almost 22% from current capacity, while the high case represents a net increase of about 44% (Table 20 and Figure 8).
Nuclear capacity projections vary considerably from region to region. The East Asia region is projected to experience the largest increase that, by the year 2025, could result in the incorporation of between about 65-83 GWe of new capacity, representing 90% to over 115% increases over current capacity, respectively. Nuclear capacity in Central, Eastern and South-eastern Europe is expected to increase, with 17-27 GWe of new capacity projected by 2025 (increases of about 34-53%). Other regions projected to experience growth include the Middle East and Southern Asia; Central and South America; Africa and South-eastern Asia. For North America, the increase of projected nuclear capacity for 2025 varies from only about 4 to over 27%. Only in Western Europe is nuclear capacity expected to decrease significantly as announced plans to phase out nuclear energy in Belgium, Germany and Sweden are implemented despite planned new reactors being built or planned in Finland and France. Here, decreases in capacity of about 16-26% are projected for 2025.
World reactor-related uranium requirements by the year 2025 are projected to increase to between 82 275 tU in the low case and 100 760 tU in the high case, representing about 22% and 50% increases respectively, compared to the 2004 (Table 21 and Figure 9). As in the case of nuclear capacity, uranium requirements are expected to vary considerably from region to region. Uranium requirement increases are projected to be largest in the East Asia region, where expected increases in nuclear capacity would more than double the 2004 uranium needs by the year 2025. In contrast to steadily increasing uranium requirements in the rest of the world, requirements in North America and the Western Europe region are expected to either remain fairly constant or to decline slightly through the year 2025.
6. Projections of nuclear capacity and reactor-related uranium requirements are based on official responses
from member countries to questionnaires circulated by the Secretariat. For countries that did not provide this information, Secretariat projections are based on data from the IAEA Energy, Electricity and Nuclear Power Estimates for the Period up to 2030. Because of the uncertainty in nuclear programmes in the years 2010, 2015, 2020 and 2025, high and low values are given.

54
Table 20. Installed Nuclear Generating Capacity to 2025 (MWe net, as of 1 January 2005)
2010 2015 2020 2025 COUNTRY 2004 2005
Low High Low High Low High Low High
Argentina 940 940 940 1 630 940 1 630 600 1 290 1 290* 1 290*
Armenia 375 375 375 375 0 375 590 1 180 1 180 1 180
Belgium 5 800 5 800 5 800 5 800 5 800 5 800 4 015 5 800 2 000 5 800
Brazil 1 875 1 875 1 875 3 120 1 875 3 120 3 120* 3 120* 3 120* 4 320*
Bulgaria* 2 720 2 720 1 910 1 910 1 910 2 860 2 860 3 810 3 810 3 810
Canada 12 000 12 500 13 600 15 100 13 600 15 100 13 600 15 100 13 600* 15 100*
Chinaa 6 700 8 700 13 000 20 000 25 000 35 000 30 000 40 000 40 000 45 000
Czech Republic 3 510 3 510 3 605 3 605 3 690 3 690 3 690 3 690 3 690 3 690
Finland 2 680 2 680 4 280 4 280 4 280 4 280 4 280 4 280 4 280 4 280
France 63 300 63 300 63 000 63 000 64 500 64 500 64 500 64 500* 67 700* 72 500*
Germany 20 600+ 20 500+ 12 500+ 14 500+ 8 000+ 10 000+ 1 300+ 2 500+ 0+ 0+
Hungary 1 800 1 800 1 800 2 000* 2 000* 2 000* 2 000* 2 000* 2 000* 2 000*
India 2 550 3 040 6 170 6 640 9 465 13 130 13 885 19 385 14 080* 25 130*
Indonesia* 0 0 0 0 0 0 900 900 900 1 800
Iran, Islamic Rep. of 0 0 920 920 5 520 5 520 6 440 6 440 9 200 9 200
Japan 43 910b 45 235b 48 470b 48 470b 49 105* 53 085* 58 605* 66 905* 64 680* 75 130*
Kazakhstan* 0 0 0 0 0 0 0 950 0 950
Korea, Republic of 16 715 17 715 17 715 18 715 24 915 26 315 24 915 26 315 24 915 26 315
Lithuania 2 760 1 380 0 0* 0 0* 0 1 500* 0 1 500*
Mexico 1 400+ 1 400+ 1 400+ 1 400+ 1 400+ 1 400+ 1 400+ 1 400+ 1 400+ 1 400+
Netherlands 450+ 450+ 450+ 450+ 0+ 450* 0+ 450* 0+ 450*

55
Table 20. Installed Nuclear Generating Capacity to 2025 (contd.) (MWe net, as of 1 January 2005)
2010 2015 2020 2025 COUNTRY 2004 2005
Low High Low High Low High Low High
Pakistan* 425 425 725 725 600 725 1 300 2 125 2 000 2 950
Romania* 655 655 1 305 1 305 1 305 1 955 1 955 1 955 1 955 1 955
Russian Federation 23 240 23 000 27 000 29 000 33 000 38 600 37 000 41 400 38 600 44 200
Slovak Republic 2 460 2 460 1 640 1 640 1 640 2 460 1 640 2 460 1 640 2 460
Slovenia 675 675 695 700 695 700 695 700 695 700
South Africa 1 800 1 800 1 800 1 910 1 800 2 830 1 800 3 750 1 800 3 750
Spain 7 600 7 600 7 500 7 500 7 500 7 500 7 500 7 500 7 050* 7 500*
Sweden 9 400 8 800 8 800 9 600 8 800 9 600 8 800 9 600 8 800 9 600
Switzerland 3 220 3 220 3 220 3 220 3 220 3 220 2 250 3 220 1 520 3 220
Turkey* 0 0 0 0 0 0 0 1 000 0 2 000
Ukraine 13 100 13 800 14 800 14 800 15 200 15 600 14 000 15 200 15 000 15 000
United Kingdom 11 900 11 900 8 500 8 500 3 700 3 700 3 700 3 700 1 190 1 190
United States 99 700 99 700 100 600 100 600 102 200 102 200 102 700 108 900 102 700 127 800
Vietnam* 0 0 0 0 0 0 600 600 600 1 200
OECD TOTAL 306 445 308 570 302 880 308 380 304 350 315 300 304 895 329 320 307 165 360 435
WORLD TOTAL 369 145 372 840 381 980 399 000 409 245 444 930 428 225 482 510 448 980 533 255
* Secretariat estimate based on Energy, Electricity and Nuclear Power Estimates for the Period up to 2030, IAEA (Vienna), July 2005.
+ Data from Nuclear Energy Data, NEA (Paris), 2005.
(a) The following data for Chinese Taipei are included in the World Total but not in the totals for China: 4 885 MWe net in 2004 and 2005, 7 585 MWe net for the low and high cases of 2010 and 2015, and 7 585 and 8 885 MWe net for 2020 and 2025 low and high cases, respectively.
(b) MWe gross converted to net by the Secretariat.

56
Table 21. Annual Reactor-related Uranium Requirements to 2025 (tonnes U, rounded to nearest five tonnes)
2010 2015 2020 2025 COUNTRY 2004 2005
Low High Low High Low High Low High
Argentina 120 120 95 250 95 250 60 205 205* 205*
Armenia 90 90 90 90 0 90 90 300 180 180
Belgium 1 125 1 455 1 075 1 075 750 1 075 750 1 075 375 1 075
Brazil 450 450 450 810 450 810 810* 810* 810* 1 120*
Bulgaria* 840 840 380 380 380 570 570 760 760 760
Canada 1 700 1 700 2 000 2 300 2 000 2 300 2 000 2 300 2 000* 2 300*
Chinaa 1 260 1 565 2 340 3 600 4 500 6 300 5 400 7 200 7 200 8 100
Czech Republic 600 700 690 695 690 700 690 700 690 700
Finland 535 520 690 760 690 760 690 760 690 760
France 7 185 7 185 7 350 7 650 7 350 7 780 7 350 7 780* 7 715* 8 745*
Germany 3 000+ 2 900+ 1 800+ 2 000+ 1 100+ 1 500+ 200+ 350+ 0+ 0+
Hungary 370 370 370 410* 410* 410* 410* 410* 410* 410*
India 240 380 880 880 1 380 1 380 1 460* 2 825* 1 480* 3 690*
Indonesia* 0 0 0 0 0 0 160 160 160 325
Iran, Islamic Rep. of 0 0 250 250 1 490 1 490 1 740 1 740 2 480 2 480
Japan 7 140 8 670 11 130 11 130 10 900* 11 785* 13 010* 14 855* 14 360* 16 680*
Kazakhstan* 0 0 0 0 0 0 0 170 0 170
Korea, Republic of 3 200 3 400 3 600 4 300 5 300 6 400 5 300 6 400 5 300 6 400
Lithuania 315 190 0 0* 0 0* 0 270* 0 270*
Mexico 180+ 355+ 175+ 175+ 180+ 180+ 355+ 355+ 175+ 175+
Netherlands 65+ 65+ 65+ 65+ 0+ 65* 0+ 65* 0+ 65*
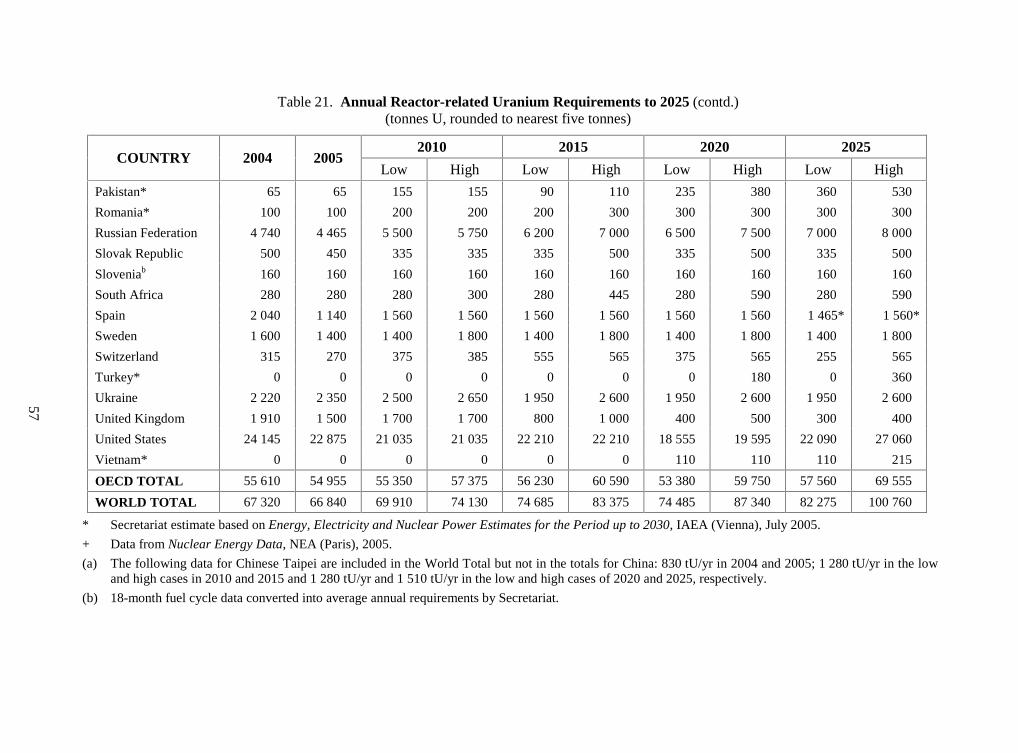
57
Table 21. Annual Reactor-related Uranium Requirements to 2025 (contd.) (tonnes U, rounded to nearest five tonnes)
2010 2015 2020 2025 COUNTRY 2004 2005
Low High Low High Low High Low High
Pakistan* 65 65 155 155 90 110 235 380 360 530
Romania* 100 100 200 200 200 300 300 300 300 300
Russian Federation 4 740 4 465 5 500 5 750 6 200 7 000 6 500 7 500 7 000 8 000
Slovak Republic 500 450 335 335 335 500 335 500 335 500
Sloveniab 160 160 160 160 160 160 160 160 160 160
South Africa 280 280 280 300 280 445 280 590 280 590
Spain 2 040 1 140 1 560 1 560 1 560 1 560 1 560 1 560 1 465* 1 560*
Sweden 1 600 1 400 1 400 1 800 1 400 1 800 1 400 1 800 1 400 1 800
Switzerland 315 270 375 385 555 565 375 565 255 565
Turkey* 0 0 0 0 0 0 0 180 0 360
Ukraine 2 220 2 350 2 500 2 650 1 950 2 600 1 950 2 600 1 950 2 600
United Kingdom 1 910 1 500 1 700 1 700 800 1 000 400 500 300 400
United States 24 145 22 875 21 035 21 035 22 210 22 210 18 555 19 595 22 090 27 060
Vietnam* 0 0 0 0 0 0 110 110 110 215
OECD TOTAL 55 610 54 955 55 350 57 375 56 230 60 590 53 380 59 750 57 560 69 555
WORLD TOTAL 67 320 66 840 69 910 74 130 74 685 83 375 74 485 87 340 82 275 100 760
* Secretariat estimate based on Energy, Electricity and Nuclear Power Estimates for the Period up to 2030, IAEA (Vienna), July 2005.
+ Data from Nuclear Energy Data, NEA (Paris), 2005.
(a) The following data for Chinese Taipei are included in the World Total but not in the totals for China: 830 tU/yr in 2004 and 2005; 1 280 tU/yr in the low and high cases in 2010 and 2015 and 1 280 tU/yr and 1 510 tU/yr in the low and high cases of 2020 and 2025, respectively.
(b) 18-month fuel cycle data converted into average annual requirements by Secretariat.

58
Figure 8. Projected Installed Nuclear Capacity to 2025 (low and high projections)
0
20 000
40 000
60 000
80 000
100 000
120 000
140 000
160 000
180 000
2004 2005 2010 2015 2020 2025
Year
Inst
alle
d C
apac
ity
(MW
e ne
t)
Western Europe
North America
East Asia
Central, Eastern and South East Europe
Others
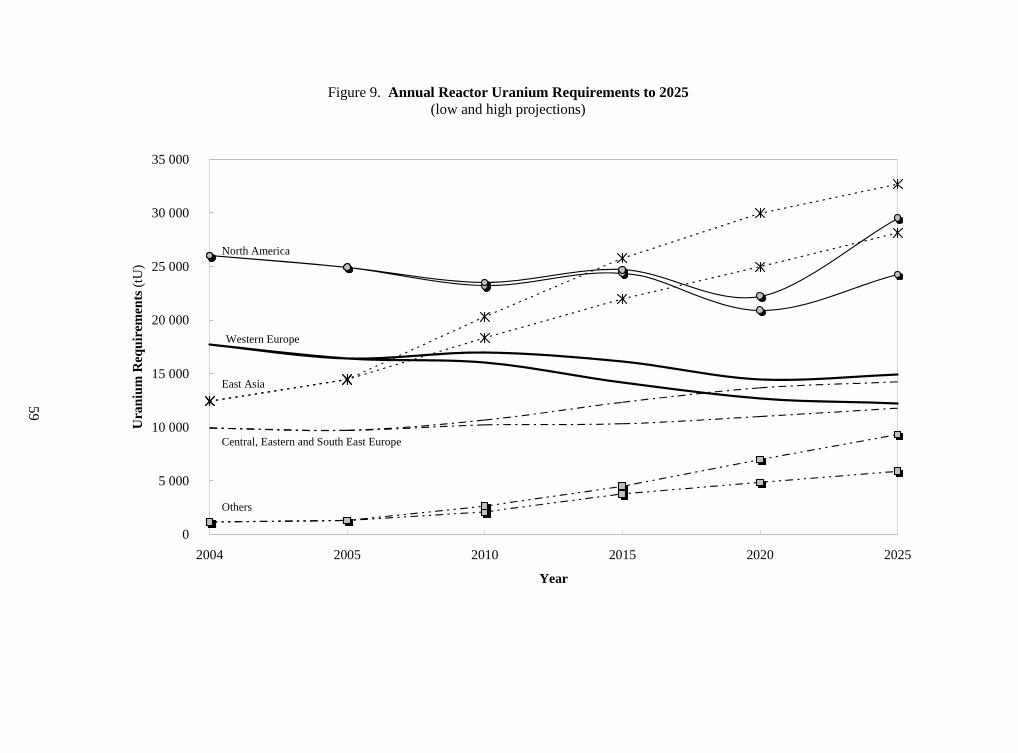
59
Figure 9. Annual Reactor Uranium Requirements to 2025
(low and high projections)
0
5 000
10 000
15 000
20 000
25 000
30 000
35 000
2004 2005 2010 2015 2020 2025
Year
Ura
nium
Req
uire
men
ts (t
U)
North America
Western Europe
East Asia
Central, Eastern and South East Europe
Others

60
C. URANIUM SUPPLY AND DEMAND RELATIONSHIPS
Uranium supply and demand remain in balance and there have been no supply shortages since the last report. There are several different sources of supply of which the largest is the primary production of uranium that, over the last several years, has satisfied some 50-60% of world requirements. The remainder has been provided or derived from secondary sources including stockpiles of natural and enriched uranium, the reprocessing of spent fuel and the re-enrichment of depleted uranium tails.
Primary Sources of Uranium Supply
Uranium was produced in 19 countries in 2004, although less than half produced significant quantities. The seven leading producing countries, in descending order of production, are Canada (29%), Australia (22%), Kazakhstan (9%), the Russian Federation (8%), Niger (8%), Namibia (8%) and Uzbekistan (5%). Together these seven countries provided 89% of the world’s uranium mine output. The two largest producers, Australia and Canada, alone accounted for 51% of the world’s production in 2004.
In comparison, 31 countries currently consume uranium in commercial nuclear power plants creating an uneven distribution between producing and consuming countries (Figure 10). In 2004, only Canada and South Africa produced sufficient uranium to meet domestic requirements. All others must use secondary sources or import uranium and, as a result, the international trade of uranium is a necessary and established aspect of the uranium market.
Primary uranium production alone is insufficient to meet world uranium requirements. In 2004, world uranium production (40 263 tU) provided only about 60% of the world reactor requirements (67 320 tU). In OECD countries, the 2004 production of 21 956 tU provided only about 40% of the demand of 55 610 tU (Figure 11). Remaining requirements were met by imports and secondary sources.
Secondary Sources of Uranium Supply
Uranium is unique among energy fuel resources in that a significant portion of demand is supplied by secondary sources rather than direct mine output. These secondary sources include:
� Stocks and inventories of natural and enriched uranium, both civilian and military in origin.
� Nuclear fuel produced by reprocessing spent reactor fuels and from surplus military plutonium.
� Uranium produced by re-enrichment of depleted uranium tails.

61
Figure 10. Estimated 2005 Uranium Production and Reactor-related Requirements for Major Producing and Consuming Countries
Canada
Australia
Kazakhstan
Niger
Namibia
Uzbekistan
South Africa
Czech Rep.
Spain
Sweden
United Kingdom
China
Ukraine
Germany
Rep. of Korea
Russian Fed.
France
Japan
United States
15 000 10 000 5 000 0 5 000 10 000 15 000 20 000
Production (tU) Requirements (tU)
25 000

62
Figure 11. OECD and World Uranium Production and Requirements* (1988-2005)
0
10 000
20 000
30 000
40 000
50 000
60 000
70 000
80 000
1988
1989
1990
1991
1992
1993
1994
1995
1996
1997
1998
1999
2000
2001
2002
2003
2004
2005
est.
Year
tU/Y
ear
World Production
OECD production
* 2005 values are estimates.
OECD Requirements
World requirements
1. Natural and enriched uranium stocks and inventories
From the beginning of commercial exploitation of nuclear power in the late-1950s through to about 1990, uranium production consistently exceeded commercial requirements (Figure 12). This was mainly the consequence of a lower than expected nuclear electricity generation growth rate and high levels of production for military purposes. This over production has created a stockpile of uranium potentially available for use in commercial power plants.

63
Figure 12. Annual Uranium Production and Requirements
(1945-2004)
10 000
20 000
30 000
40 000
50 000
60 000
70 000
80 000
19451948
19511954
19571960
19631966
19691972
19751978
19811984
19871990
19931996
19992002
tU
World Requirements World Production
Following the political and economic reorganisation in Eastern Europe and the former Soviet Union in the early-1990s, major steps have been taken toward the development of an integrated commercial world uranium market. As a consequence there has been greater availability of uranium supplies from the former Soviet Union, particularly in Kazakhstan, the Russian Federation and Uzbekistan as well as increased availability of information on the production and use of uranium in the former Soviet Union. Despite the increased availability of information regarding the amount of uranium held in inventory by utilities, producers and governments, uncertainty remains regarding the magnitude of these inventories as well as the availability of uranium from other sources. This, combined with uncertainty about the desired levels of inventories, continues to have significant influence on the uranium market.
However, data available from past editions of this publication along with new information provided by member states gives an indication of the possible upper bound of potentially commercially-available inventories. Cumulative production through 2004 is estimated to have amounted to about 2 245 000 tU. Subtracting cumulative reactor requirements through 2004 of about 1 579 000 tU produces an estimated remaining stock of about 666 000 tU which could potentially become available to the commercial sector (Figure 13). This base of already mined uranium has essentially been distributed into two segments; uranium used and/or reserved for the military sector and uranium used or stockpiled by the civilian sector. Since the end of the Cold War, increasing amounts of uranium, previously reserved for military purposes have been released to the commercial sector. However, some portion of this will likely always remain reserved for military uses.

64
Figure 13. Cumulative Uranium Production and Requirements
(1945-2004)
500 000
1 000 000
1 500 000
2 000 000
2 500 000
1945
1948
1951
1954
1957
1960
1963
1966
1969
1972
1975
1978
1981
1984
1987
1990
1993
1996
1999
2002
Year
tU
Cumulative World Requirements Cumulative World production
Civilian inventories include strategic stocks, pipeline inventory and excess stocks available to the market. Utilities are believed to hold the majority of commercial stocks because many utilities have policies that require carrying the equivalent of one to two years of natural uranium requirements. Despite the importance of this secondary source of uranium, relatively little is known about the size of available stocks because few countries are able or willing to provide detailed information on stockpiles held by producers, consumers or governments due to confidentiality concerns (Table 22).
In the United States, 2004 year-end commercial uranium stocks (natural and enriched uranium equivalent) were 36 284 tU. This represents an increase from 2003 level of 32 883 tU. Government stocks of natural uranium in the United States were 19 326 tU at the end of 2004, essentially level over the past several years when compared with the about 20 410 tU in 2000 and 19 755 tU at the end of 2002. The United States government maintains no surplus low-enriched uranium stocks, having transferred its inventory to USEC Inc. as part of the privatisation process.
Available information suggests that no significant excess inventories are held in Eastern Europe and Central Asia, with the exception of the Russian Federation. The inventory of enriched uranium product and natural uranium held by the Russian Federation, though never officially reported, is believed to be substantial. However, published reports indicate that these inventories are declining.
Large stocks of uranium, previously dedicated to military applications in both the United States and the Russian Federation, have become available for commercial applications introducing a significant source of uranium into the market. Highly-enriched uranium (HEU) and natural uranium held in various forms by the military sector could total several years supply of natural uranium equivalent for commercial applications.

65
Highly-enriched Uranium from the Russian Federation
In February 1993, the Agreement between the Government of the United States and the Government of the Russian Federation Concerning the Disposition of Highly Enriched Uranium Extracted from Nuclear Weapons (HEU Purchase Agreement) was signed by the United States and the Russian Federation providing for the blending down of 500 tons of HEU to low-enriched uranium (LEU) over 20 years. USEC Inc., serving as the US Government’s sole executive agent for implementing the HEU Purchase Agreement, receives deliveries of LEU from the Russian Federation for sale to commercial nuclear power plants. As USEC purchases and sells only the enrichment component of this LEU, a separate agreement has been signed for the commercialisation of the natural uranium feed component.
The natural uranium feed component is sold under a commercial agreement between three western corporations (Cameco, COGEMA, and Nukem) and Techsnabexport of the Russian Federation. The quantity of natural uranium feed component of low-enriched uranium derived from the conversion of surplus HEU from the Russian Federation that can enter the US market is restricted to a quota under the USEC Privatization Act. The quota for 2004 is about 5 400 tU, gradually expanding to 7 700 tU in 2009 and subsequent years.
In September 2005, the governments of the United States and Russian Federation issued a joint statement acknowledging that the implementation of the HEU Purchase Agreement had achieved its halfway point with 250 tonnes of HEU having been down-blended to low-enriched uranium out of the total 500 metric tons of HEU covered in the agreement. As of 3 January 2006, 262 tonnes of HEU had been down-blended and 7 670 tonnes of low-enriched uranium fuel has been delivered to the United States for use in commercial reactors. These deliveries represent the dismantlement of 10 467 nuclear warheads.
United States Highly-enriched Uranium
The United States has committed to the disposition of about 174 tonnes of surplus HEU with about 151 tonnes planned to be eventually blended down for use as LEU fuel in research and commercial reactors and 23 tonnes slated for disposal as waste.
Through 2005, 72.9 tonnes of HEU were down-blended yielding 894.7 tonnes of LEU fuel. About 46 tonnes of HEU have been transferred to USEC for down-blending to yield approximately 647 tonnes of low-enriched uranium fuel. Deliveries began in May 1999 and were completed in September 2005. Both sides of the HEU blending point are being monitored by the IAEA at the commercial blending facility.
The DOE and Tennessee Valley Authority (TVA) entered an Interagency Agreement in April 2001, whereby TVA will utilise LEU derived from blending down about 33 tonnes of US surplus HEU. In 2004 this agreement was modified to increase the total to 39 tonnes of HEU. This LEU is considered “off-specification” because it contains U236 in excess of the specifications established for commercial nuclear fuel. Different portions of this material are being down-blended at DOEs Savannah River Site (SRS) and at a TVA contractor. Down-blending began at SRS in 2003 and at the contractor facility in 2004. This down-blending programme will continue through 2007, and use of the resultant Blended Low-enriched Uranium (BLEU) fuel at TVA reactors is expected to continue until 2016.

66
Table 22. Uranium Stocks in Countries that Have Reported Data (tonnes natural U equivalent as of 1 January 2005)
COUNTRY Natural uranium Enriched uranium
Argentina (a) > 110 0 Australia (b) NA 0 Canada (b) NA 0 Chile 0 0 Czech Republic < 200 0 Egypt 0 0 Finland (c) NA NA France (d) NA NA Gabon 0 0 Hungary 0 0 Jordan 0 0 Kazakhstan (b) NA NA Korea, Republic of (e) 2 000 2 500 Lithuania (f) 0 140 Mexico (g) NA NA Niger 0 0 Philippines 0 0 Portugal 168 0 Slovak Republic (h) 0 NA Slovenia 0 0 South Africa (b) NA 0 Spain (i) 0 369 Switzerland 1 609 1 422 Turkey < 2 0 Ukraine 0 0 United States (j) 29 828 11 180 Uzbekistan 0 0 Vietnam 0 0
TOTAL > 33 917 > 15 611
NA Not available or not disclosed. (a) Government data only. Commercial data is not available. (b) Government stocks are zero in all categories. Commercial data is no available. (c) The nuclear power utilities maintain reserves of fuel assemblies sufficient for 7-12 months use. (d) A minimum of three years forward fuel requirements is maintained by EDF. (e) A strategic inventory is maintained along with about one year’s forward consumption in pipeline
inventory. (f) A three month’s stock of fuel (about 140 tU) is generally maintained at the Ignalina NPP. (g) Maintain one to two reloads of natural uranium at an enrichment facility. (h) The government maintains a small stock of enriched uranium in the form of fuel assemblies. (i) Regulations require a strategic inventory of at least 369 tU be maintained jointly by nuclear utilities. (j) Government and utility stocks only, producer stock data not available.

67
About 10 tonnes of surplus HEU will be blended down to make low-enriched research reactor fuel through approximately 2016. In addition, 17.4 tonnes of HEU would be down-blended to low-enriched uranium fuel between 2006 and 2009 as part of the Reliable Fuel Supply initiative announced by Department of Energy in September 2005. Under the Reliable Fuel Supply initiative, the United States will keep a reserve of low-enriched uranium that in the event of a market disruption can be sold to countries that forgo enrichment and reprocessing.
In November 2005, the Department of Energy announced that an additional 200 tonnes of HEU beyond the initially declared 174.3 tonnes of HEU would be permanently removed from further use by the United States in nuclear weapons. Of the additional 200 tonnes HEU, 160 tonnes will be provided for use in naval propulsion, 20 tonnes is to be blended down to low-enriched uranium fuel for use in power or research reactors, and 20 tonnes reserved for space and research reactors that currently use HEU, pending development of fuels that would enable the conversion to low-enriched uranium fuel cores. For power reactors, the low-enriched uranium would become available gradually over a 25-year period.
2. Nuclear fuel produced by reprocessing spent reactor fuels and surplus weapons-related plutonium
The constituents of spent fuel from power plants are a potentially substantial source of fissile material that could displace primary production of uranium. When spent fuel is discharged from a commercial reactor it is potentially recyclable, since about 96% of the original fissionable material remains along with the plutonium created during the fission process. The recycled plutonium can be reused in reactors licensed to use mixed-oxide fuel (MOX). The uranium recovered through reprocessing of spent fuel, known as reprocessed uranium (RepU), is not routinely recycled; rather, it is stored for future reuse.
The use of MOX has not yet significantly altered world uranium demand because only a relatively small number of reactors are using this type of fuel. Additionally, the number of recycles possible using current reprocessing and reactor technology is limited by the build-up of plutonium isotopes that are not fissionable by the thermal neutron spectrum found in light-water reactors and by the build-up of undesirable elements, especially curium.
In January 2005, there were over 35 reactors; about 8% of the world’s operating fleet,7 licensed to use MOX fuel, including in Belgium, France, Germany, India, Sweden and Switzerland (Table 18). Additional reactors could be licensed to use MOX in China and the Russian Federation. The United States has licensed a reactor to use MOX as part of its weapons material disposition program and initial tests of MOX fuel were loaded in 2005. In addition, the United States has proposed a new program, the Global Nuclear Energy Partnership, that will work with international partners to demonstrate the capability to safely recycle used nuclear fuel using more proliferation-resistant processes. Japan is planning to begin use of MOX fuel commercially in 2010. MOX reprocessing and fuel fabrication facilities exist or are under construction in Belgium, China, France, India, Japan, the Russian Federation and the United Kingdom.
7. In December 2002, Sweden authorised the limited use of MOX fuel at the Oskarshamn nuclear power
plant. This decision allows the use of 900 kg of plutonium separated from spent fuel removed from Swedish reactors prior to 1982. Since 1982, Swedish used nuclear fuel has been placed in storage pending final disposal.
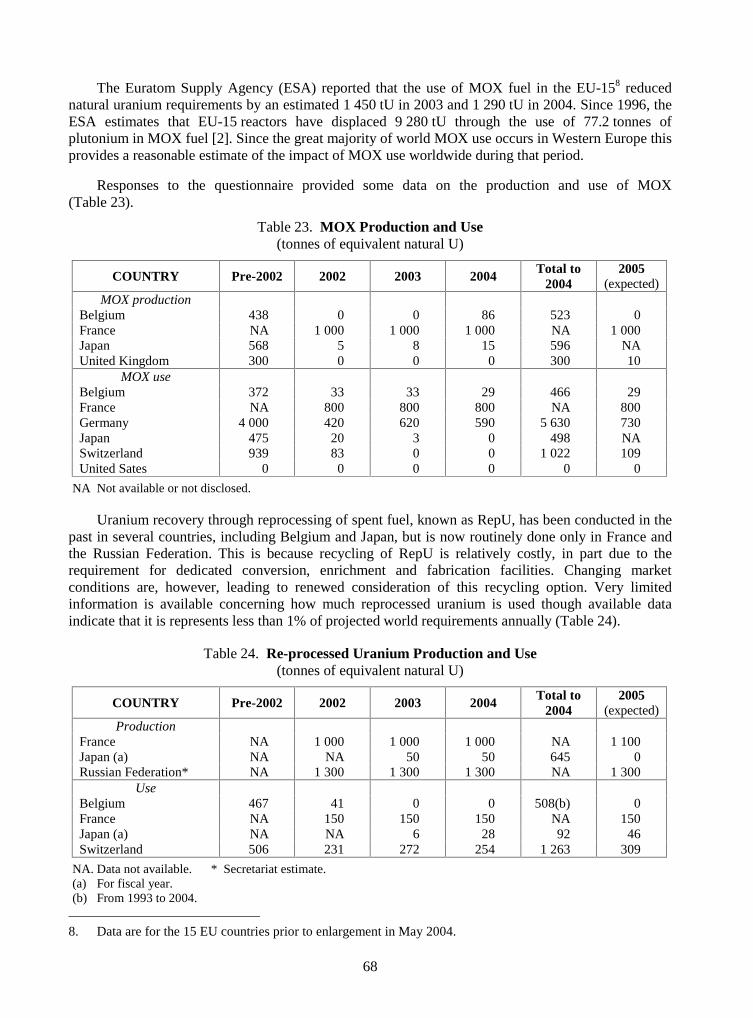
68
The Euratom Supply Agency (ESA) reported that the use of MOX fuel in the EU-158 reduced natural uranium requirements by an estimated 1 450 tU in 2003 and 1 290 tU in 2004. Since 1996, the ESA estimates that EU-15 reactors have displaced 9 280 tU through the use of 77.2 tonnes of plutonium in MOX fuel [2]. Since the great majority of world MOX use occurs in Western Europe this provides a reasonable estimate of the impact of MOX use worldwide during that period.
Responses to the questionnaire provided some data on the production and use of MOX (Table 23).
Table 23. MOX Production and Use (tonnes of equivalent natural U)
COUNTRY Pre-2002 2002 2003 2004 Total to
2004 2005
(expected) MOX production
Belgium 438 0 0 86 523 0 France NA 1 000 1 000 1 000 NA 1 000 Japan 568 5 8 15 596 NA United Kingdom 300 0 0 0 300 10
MOX use Belgium 372 33 33 29 466 29 France NA 800 800 800 NA 800 Germany 4 000 420 620 590 5 630 730 Japan 475 20 3 0 498 NA Switzerland 939 83 0 0 1 022 109 United Sates 0 0 0 0 0 0
NA Not available or not disclosed.
Uranium recovery through reprocessing of spent fuel, known as RepU, has been conducted in the past in several countries, including Belgium and Japan, but is now routinely done only in France and the Russian Federation. This is because recycling of RepU is relatively costly, in part due to the requirement for dedicated conversion, enrichment and fabrication facilities. Changing market conditions are, however, leading to renewed consideration of this recycling option. Very limited information is available concerning how much reprocessed uranium is used though available data indicate that it is represents less than 1% of projected world requirements annually (Table 24).
Table 24. Re-processed Uranium Production and Use (tonnes of equivalent natural U)
COUNTRY Pre-2002 2002 2003 2004 Total to
2004 2005
(expected) Production
France NA 1 000 1 000 1 000 NA 1 100 Japan (a) NA NA 50 50 645 0 Russian Federation* NA 1 300 1 300 1 300 NA 1 300
Use Belgium 467 41 0 0 508(b) 0 France NA 150 150 150 NA 150 Japan (a) NA NA 6 28 92 46 Switzerland 506 231 272 254 1 263 309
NA. Data not available. * Secretariat estimate. (a) For fiscal year. (b) From 1993 to 2004.
8. Data are for the 15 EU countries prior to enlargement in May 2004.
69
Mixed-oxide fuel produced from surplus weapons-related plutonium
In September 2000, the United States and Russia signed an agreement for the disposition of surplus plutonium. Under the agreement, both the United States and Russia will each dispose of 34 tonnes of surplus weapon-grade plutonium at a rate of at least two tonnes per year in each country once facilities are in place. Both countries agreed to dispose of surplus plutonium by fabricating it into MOX fuel for irradiation in nuclear reactors. This approach will convert the surplus plutonium to a form that cannot be readily used to make a nuclear weapon.
In the United States, a planned MOX fuel fabrication facility, to be located at the US Department of Energy’s Savannah River Site near Aiken, South Carolina, is expected to begin producing MOX fuel in 2015 for use in four specially licensed commercial reactors. Lead test assemblies were loaded in 2005 to confirm the performance of the fuel in these reactors.
The 68 tonnes of weapons-grade plutonium would displace about 7 000 to 8 000 tonnes of natural uranium over the life of the programme. This represents about 1% of world annual uranium requirements over the period of the programme.
3. Uranium produced by re-enrichment of depleted uranium tails9
Depleted uranium stocks represent a significant reserve of uranium that could displace primary uranium production. However, the re-enrichment of depleted uranium has been limited as a secondary source of uranium since it is only economic in centrifuge enrichment plants that have spare capacity and low operating costs.
At the beginning of 2005 the inventory of depleted uranium is estimated at about 1 500 000 tU and is estimated to be increasing by about 57 000 tU annually based on uranium requirements of 65 000 tU per annum [3]. This inventory would yield an estimated 565 000 tU of equivalent natural uranium, which would be sufficient for over 8 years of operation of the world's nuclear reactors at the 2004 uranium requirement levels.10
Deliveries of re-enriched tails from the Russian Federation are a significant source of uranium for the EU representing 6-8% of the total natural uranium delivered annually to EU reactors between 1999-2004 (Table 25).
Table 25. Russian Federation Supply of Re-enriched Tails to European Union End Users
Year Re-enriched tail deliveries (tU) Percentage of total natural uranium deliveries 1999 1 100 7.4 2000 1 200 7.6 2001 1 050 7.6 2002 1 100 6.5 2003 1 200 7.3 2004 900 6.2
Sources: Euratom Supply Agency (2005), Annual Report 2004, Luxembourg.
9. Depleted uranium is the by-product of the enrichment process having less U235 than natural uranium.
Normally, depleted uranium tails will contain between 0.25 and 0.35% U235 compared with the 0.711% found in nature.
10. OECD Nuclear Energy Agency, (2001) Management of Depleted Uranium, Paris, France. This total assumes 1.5 million tU at 0.3% assay re-enriched to produce 420 000 tU of equivalent natural uranium, leaving 1 080 000 tU of secondary tails with an assay of 0.14%. These secondary tails could then also be re-enriched providing a further 132 500 tU equivalent leaving 947 500 tU of tertiary tails with an assay of 0.06%.

70
Additional information on the production and use of re-enriched tails is not readily available. The
information provided, however, indicates that its use is relatively limited (See Table 26).
Table 26. Re-enriched Tails Use (tonnes of equivalent natural U)
COUNTRY Pre-2002 2002 2003 2004 Total to 2004
2005 (expected)
Belgium 115 115 115 0 345 0
Finland 100 50 137 140 427 60
France (a) NA 0 0 0 NA 0
NA Data not available. (a) A small amount of tails are re-enriched in Russia Federation and recycled within the Georges Besse
enrichment plant.
Uranium Market Developments
Uranium price developments
Some national and international authorities, i.e., Australia, United States and the Euratom Supply Agency make available price indicators to illustrate uranium price trends. Additionally, spot price indicators for immediate or near-term delivery are regularly provided by industry sources such as the TradeTech, Ux Consulting Company LLC (UxC) and others. Figure 14 shows a comparison of annual average delivered prices reported by various government sources.
The over-production of uranium, which lasted through 1990 (Figure 12), combined with the availability of secondary sources, resulted in uranium prices trending downward from the early-1980s until 1994 when they reached their lowest level in 20 years. Between 1990 and 1994 there were significant reductions in many sectors of the world uranium industry including exploration, production and production capability. This decreasing supply situation combined with growing demand for uranium and the bankruptcy of an important uranium trading company resulted in a modest recovery in uranium prices from October 1994 through mid-1996. This trend, however, reversed as increasingly better information about inventories and supplies maintained downward pressure on uranium prices until 2001.
Beginning in 2001, the price of uranium has rebounded from historic lows to levels not seen since the 1980s. This is best seen using spot price data, which increased five-fold from USD 6.40/lb U3O8 (USD 16.64/kgU) in January 2001 to USD 33.50/lb U3O8 (USD 87.10/kgU) in November 2005 (Figure 15).11 There are no indications that this upswing has ended. Note that Figure 14 reflects mostly long-term contracts and thus the rapid change over the past few years is not as evident as is seen in Figure 15.
11. Spot price data courtesy of TradeTech (www.uranium.info).

71
Figure 14. Development of Uranium Prices
0
20
40
60
80
100
120
19761978
19801982
19841986
19881990
19921994
19961998
20002002
2004
Cur
rent
USD
/kg
U
US Domestic U US Import UCanada Exports Euratom (Multi-Annual Contracts)Australia Euratom (Spot Contracts)Niger
Notes: 1. Euratom prices refer to deliveries during that year under multi-annual contracts. 2. Beginning in 2002, Natural Resources Canada (NRCan) suspended publication of export price for 3-5 years pending a policy review. Sources: Australia, Canada, Euratom Supply Agency, Niger, United States.

72
Figure 15. Recent Uranium Spot Price Trend (USD/lb U3O8)
0
10
20
30
40
50
60
70
80
90
Jan-
01
Apr-0
1Ju
l-01
Oct-01
Jan-
02
Apr-0
2Ju
l-02
Oct-02
Jan-
03
Apr-0
3Ju
l-03
Oct-03
Jan-
04
Apr-0
4Ju
l-04
Oct-04
Jan-
05
Apr-0
5Ju
l-05
Oct-05
USD
/kgU
A variety of reasons have been put forward to account for this rise, including:
� The October 2001 fire that destroyed the solvent extraction facility at the Olympic Dam mine in Australia.
� Flooding in the McArthur River mine in Canada, which stopped production for three months in the summer of 2003.
� Uncertainties concerning continued operation of the Rössing mine in Namibia.
� The temporary shutdown for several months beginning in December 2003 of the Metropolis uranium conversion facility in the United States for corrective measures.
� The weakness of the United States dollar, the currency used in many uranium transactions, which began a significant decline against the major, world currencies beginning in 2002.
These events did not, in themselves, cause the price increase but all combined to create uncertainty about the robustness of the supply chain. Coupled with an increasing sense of the finite nature of inventories, this highlighted the basic imbalance between primary supply and demand, contributing to the steady increase in prices over the past few years. The recent appearance of speculative elements in the market is also impacting uranium prices by introducing demand from sources outside the electricity generation industry in a period when short term availability of additional supply is becoming increasingly scarce. However, speculative demand cannot exert permanent upward pressure on price as this material will at some point return to the market.
73
Other market developments
Restrictions in the United States
Outside of the natural uranium feed component of HEU-derived LEU, imports of uranium from the Russian Federation have been limited by the Agreement Suspending the Antidumping Duty Investigation on Uranium from the Russian Federation (Suspension Agreement) signed between the Department of Commerce (DOC) and the Ministry of Atomic Energy of the Russian Federation in 1992. As a result of the Suspension Agreement, the DOC has suspended antidumping investigations as the Russian Federation agreed to sell uranium to the United States (US) under a quota system whereby Russian imports would have to be matched by an equivalent quantity of newly produced US Uranium. An amendment to the suspension agreement in 1994 contains language specifying an expected termination date of 31 March 2004. However, as of 1 January 2006, Russia has not requested the DOC to undertake a termination review, one of the requirements for termination.
In February 2002, the DOC issued final determinations in antidumping and countervailing duty investigations involving LEU from France, Germany, the Netherlands, and the United Kingdom. As a result, DOC placed an antidumping duty order on LEU imports from France while all four countries were issued countervailing duty orders. The DOC determinations were challenged at the US Court of International Trade (CIT).
In early 2005, the United States Court of Appeals for the Federal Circuit (CAFC) affirmed an earlier ruling by the CIT that contracts for the purchase of separative work (SWU) were contracts for the sale of services, not goods. US antidumping law applies only to the sale or purchase of goods, not to the sale or purchase of services. Further, the CAFC affirmed: that CIT was correct in ruling that the DOC approach to defining the word “producer” was in accordance with law, (this provides USEC the ability to trigger the antidumping and countervailing subsidy investigations). This ruling could impact the imposition of duties on LEU imported from the European Union, as well as the Russian Suspension Agreement on Uranium, which is based on U.S. antidumping law and covers uranium enriched in Russia. Pending a final resolution that may involve further appeals and rehearings, the import duties now imposed will continue to be collected.
Policy measures in the European Union
Since 1992, the Euratom Supply Agency has pursued a policy of diversification of sources of supply in order to avoid over-dependence on any single source, in particular on the Russian Federation, which in recent years has been the largest external supplier to Europe. Enlargement of the EU has added and will continue to add to the number of nuclear power plants in the EU. The Russian Federation has traditionally supplied many of the power plants in the new member states; therefore the supply policy will have to accommodate this new situation.

74
The European Commission received negotiating directives from the European Council in November 2003, to start negotiations with the Russian Federation for a nuclear trade agreement and presented a draft agreement to the Russian Federation in 2004. The agreement will have to take into account the new market conditions in the enlarged EU and the special relations between the new member states and the Russian Federation in this field. The agreement will take into consideration the interests of European consumers and the need to maintain the viability of EU industries at the front end of the fuel cycle.
The Euratom Supply Agency continues to stress the importance for utilities to maintain an adequate level of strategic inventory at all stages of the fuel cycle, consistent with their circumstances. Furthermore, it recommends that utilities cover most of their needs under long-term contracts with diversified primary production sources at equitable prices.
Supply and Demand to 2025
Market conditions are the primary driver of decisions to develop new or expand existing primary production centres. As market prices have increased and expectations of a sustained price increase have developed, significant new production has been planned. Member countries, in particular Australia, Canada and Kazakhstan, have begun to report significant additions to planned future capacity that could be used to meet increasing requirements at the same time that secondary sources are projected to decline in availability (Figure 16).
The picture is dramatically different from even two years ago when a significant potential imbalance between production capability and demand was foreseen, which shows that industry is responding actively to recent price increases. This very dynamic and major expansion of production capability would significantly alter the supply demand relationship of the recent past, if planned centres are constructed on schedule. Nonetheless, a critical examination of projected production capability through 2025 indicates that secondary sources will continue to be needed to meet projected requirements. Planned capability from all reported Existing and Committed production centres based on resources recoverable at a cost of <USD 80/kgU is projected to satisfy about 79% of the low case requirements and only about 64% of the high case requirements in 2025. Adding in Planned and Prospective production centres would allow primary production to adequately satisfy low case requirements in 2025, potentially supplying 105% of requirements, but in the high case primary production would still fall short, supporting only about 86% of high case requirements in 2025. Moreover, although capability at Existing, Planned, Committed and Prospective production centres is projected to exceed both low and high case requirements between 2009 and 2019, it is important to note that world production has never exceeded 89% of reported production capability. Hence, additional primary production and/or additional secondary supply would still be required. Additionally, after 2015, secondary sources of uranium are expected to decline in availability meaning that reactor requirements will have to be increasingly met by primary production [4]. Therefore, despite the significant additions reported here, primary production capability will need to further increase to meet demand either by expanding existing production centres, opening new production centres or through a combination of the two.

75
Figure 16. Annual World Uranium Production Capability Through 2025 Compared with Projected World Reactor Requirements*
0
20 000
40 000
60 000
80 000
100 000
120 000
2004 2006 2008 2010 2012 2014 2016 2018 2020 2022 2024
tU/y
ear
World reactor requirements
High
Low
Existing, Committed, Planned and Prospective production
Existing and Committed production
Year
Sources: Tables 17 and 21. * Includes all Existing, Committed, Planned and Prospective production centres supported by
RAR and Inferred Resources recoverable at a cost of <USD 80/kgU.
A key element influencing market price continues to be the availability of secondary sources of uranium, particularly the level of stocks available and the length of time remaining until those stocks are exhausted. As Table 22 shows, accurate information on secondary sources of uranium, especially uranium inventory levels, is not readily available. Hence, effective decision making on new production capability is hindered. Despite this lack of data, it is clear that recent price increases have spurred increased exploration and influenced decisions on increasing production capability.

76
D. THE LONG-TERM PERSPECTIVE
Uranium demand is fundamentally driven by the number of operating nuclear reactors, which ultimately is driven by the demand for electricity. World demand for electricity is expected to double from 2002 through 2030 to meet the needs of an increasing population and sustained economic growth. International Energy Agency projections indicate that about 4 800 GW of new capacity will be needed by 2030 to meet the projected increase in electricity demand and to replace ageing infrastructure. Growth is expected to be strongest in developing nations seeking to improve their standard of living [5]. The significance of the role that nuclear energy will play in future electrical generation will depend on how effectively a number of factors discussed earlier are addressed (economics, safety, security, waste disposal, environmental considerations, etc.) as well as public acceptance of nuclear energy.
The extent to which nuclear energy is seen as beneficial in meeting greenhouse gas reduction targets could potentially increase the role of nuclear energy in future electrical generation. Recent sustained increases in fossil fuel price have also increased interest in nuclear energy because of the significant role that fuel costs play in fossil energy generation costs compared to nuclear energy, thereby improving the relative economic competitiveness of nuclear energy [6]. However, in countries where public concerns about safety, security, non-proliferation and waste disposal are not convincingly addressed, the contribution of nuclear energy to the future energy mix could be limited. Yet, if only 10% of this projected increase in capacity is met by nuclear energy this would more than double the current installed capacity with a corresponding impact on uranium requirements.
Several alternative uses of nuclear energy have the potential to heighten its role worldwide, such as the production of hydrogen, the desalination of seawater and heat production for industrial or residential purposes. While heat production will likely remain a niche use, the potential exists for desalination and hydrogen production to become significant roles for nuclear energy. The increasing need for fresh water has led to increased planning being announced for the use of nuclear desalination plants, for example in Australia, China, India, Korea, Morocco, Pakistan and the Russian Federation. If these plans come to fruition they could significantly increase uranium requirements.
Energy use for transportation, which is projected to continue to grow rapidly over the coming decades, is a major source of greenhouse gas emissions. Hydrogen is seen as a potential replacement for fossil fuels, as a means to reduce greenhouse gas emissions. Nuclear energy offers a potential means of producing hydrogen that could make this alternate energy carrier available with significantly less greenhouse gas emissions than current methods of hydrogen production. Any electricity-producing reactor can produce hydrogen through the process of electrolysis. As the market for hydrogen continues to develop more commercial reactors may install electrolysis equipment to permit them to produce hydrogen during off-peak hours, thus permitting optimal usage of the baseload generating capability of the reactor and maximising revenue. The overall efficiency of production of hydrogen in this way, however, is relatively low. High-temperature reactors hold the promise to generate hydrogen at much higher efficiencies using high-temperature steam electrolysis or thermo-chemical processes.
77
If these processes can be successfully developed and are deployed to meet growing hydrogen demand, the potential exists for significantly increased uranium demand above that required for electricity generation. This is particularly the case if the current once-through fuel cycle is maintained. For example, replacing motor vehicle fuel with hydrogen in the United States would require on the order of 136 500 000 tonnes of hydrogen a year.12 Assuming 75% efficiency in the electrolyser, production of one tonne of H2 would require 52 000 kWh of electricity. Thus about 7 100 TWh of electricity would be needed to produce the hydrogen required to meet annual United States transportation needs alone.13 In a once-through fuel cycle using current generation light-water reactors, over 145 000 tU would be needed each year to support this level of hydrogen production; over two times 2004 world uranium requirements. However, a shift in technology significantly alters these projections. Production of this quantity of hydrogen would require over 565 dedicated high-temperature gas reactors using high-temperature thermo-chemical production processes. If these advanced reactors could be coupled with full fuel recycling, they would require only on the order of 4 000 tU per year. Considerable development, though, is needed before these reactors and fuel cycles could be available for commercial use.
This example shows how technological advancements could be a major factor in defining the long-term future of nuclear energy and the demand for uranium. Advancements in reactor and fuel cycle technology not only promise to address economic, safety, security, non-proliferation and waste concerns, but also to radically increase the efficiency with which uranium resources are utilised. The introduction and use of advanced reactor designs would also permit the use of other materials as nuclear fuel, such as uranium-238 and thorium, thereby expanding the available resource base. Moreover, breeder reactors could produce more fuel than they consume, since spent fuel could be recovered, reprocessed and reused to produce additional energy.
Many national and several major international programmes are working to develop advanced technologies, for example, the Generation IV International Forum (GIF) and the IAEA International Project on Innovative Nuclear Reactors and Fuel Cycles (INPRO). The objective of INPRO is to help to ensure that nuclear energy is available to contribute, in a sustainable manner, to the energy needs in the 21st century. In July 2003 the IAEA Board of Governors agreed to include INPRO in the regular budget of the Agency. As of July 2005, the following countries or entities have become members of INPRO: Argentina, Armenia, Brazil, Bulgaria, Canada, Chile, China, Czech Republic, France, Germany, India, Indonesia, Republic of Korea, Morocco, Netherlands, Pakistan, the Russian Federation, South Africa, Spain, Switzerland, Turkey, Ukraine and the European Commission.
The members of GIF are: Argentina, Brazil, Canada, France, Japan, the Republic of Korea, the Republic of South Africa, Switzerland, the United Kingdom, the United States and Euratom. In 2002, the GIF selected six nuclear energy system concepts to be the focus of continued collaborative research and development. The reactor concepts are a sodium-cooled fast reactor, a very high-temperature reactor, a supercritical water reactor, a lead-cooled fast reactor, a gas-cooled fast reactor and a molten-salt reactor. All but one of these concepts involve recycling fuel and several may be suitable for hydrogen production.
12. 2004 motor vehicle fuel use on highways in the United States was about 136.5 million gallons according to
the United States Federal Highway Administration, Highway Statistics 2004, Table MF-21. One kilogram of hydrogen has energy equivalent to one gallon of gasoline.
13. At 25 C and 1 atm, the energy released when water is formed is 39 kWh/kg of hydrogen. This value is the energy needed to reverse the reaction and form hydrogen and oxygen from water. The quantities of uranium needed per TWhe for the various fuel cycles are taken from reference [7].
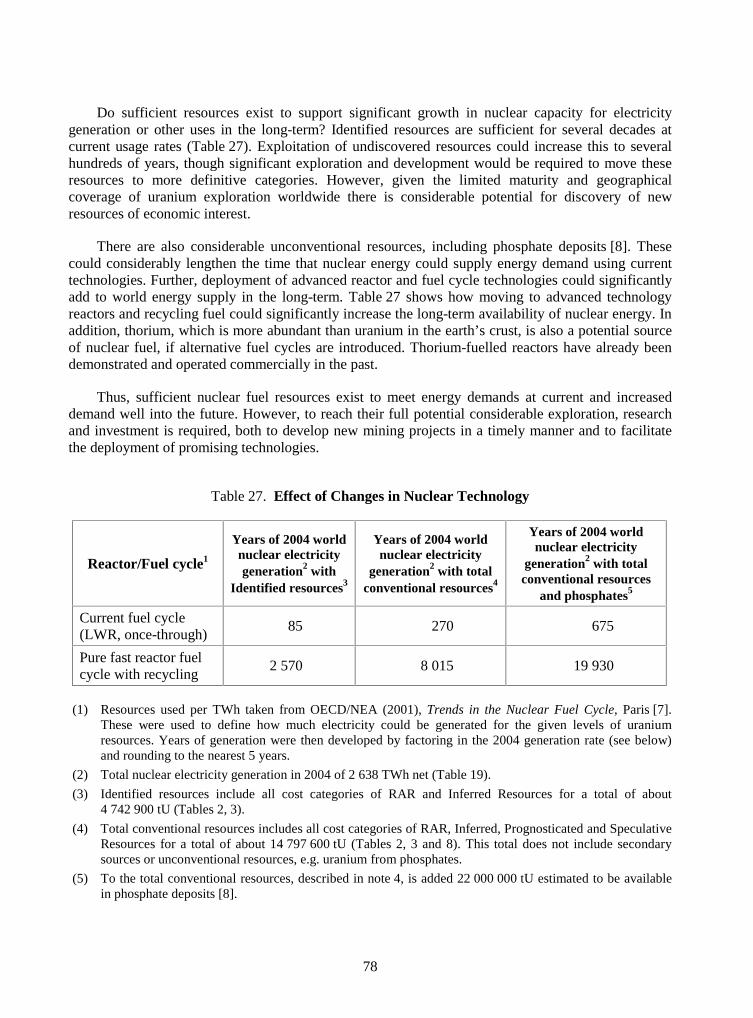
78
Do sufficient resources exist to support significant growth in nuclear capacity for electricity generation or other uses in the long-term? Identified resources are sufficient for several decades at current usage rates (Table 27). Exploitation of undiscovered resources could increase this to several hundreds of years, though significant exploration and development would be required to move these resources to more definitive categories. However, given the limited maturity and geographical coverage of uranium exploration worldwide there is considerable potential for discovery of new resources of economic interest.
There are also considerable unconventional resources, including phosphate deposits [8]. These could considerably lengthen the time that nuclear energy could supply energy demand using current technologies. Further, deployment of advanced reactor and fuel cycle technologies could significantly add to world energy supply in the long-term. Table 27 shows how moving to advanced technology reactors and recycling fuel could significantly increase the long-term availability of nuclear energy. In addition, thorium, which is more abundant than uranium in the earth’s crust, is also a potential source of nuclear fuel, if alternative fuel cycles are introduced. Thorium-fuelled reactors have already been demonstrated and operated commercially in the past.
Thus, sufficient nuclear fuel resources exist to meet energy demands at current and increased demand well into the future. However, to reach their full potential considerable exploration, research and investment is required, both to develop new mining projects in a timely manner and to facilitate the deployment of promising technologies.
Table 27. Effect of Changes in Nuclear Technology
Reactor/Fuel cycle1
Years of 2004 world nuclear electricity generation2 with
Identified resources3
Years of 2004 world nuclear electricity
generation2 with total conventional resources4
Years of 2004 world nuclear electricity
generation2 with total conventional resources
and phosphates5
Current fuel cycle (LWR, once-through)
85 270 675
Pure fast reactor fuel cycle with recycling
2 570 8 015 19 930
(1) Resources used per TWh taken from OECD/NEA (2001), Trends in the Nuclear Fuel Cycle, Paris [7]. These were used to define how much electricity could be generated for the given levels of uranium resources. Years of generation were then developed by factoring in the 2004 generation rate (see below) and rounding to the nearest 5 years.
(2) Total nuclear electricity generation in 2004 of 2 638 TWh net (Table 19).
(3) Identified resources include all cost categories of RAR and Inferred Resources for a total of about 4 742 900 tU (Tables 2, 3).
(4) Total conventional resources includes all cost categories of RAR, Inferred, Prognosticated and Speculative Resources for a total of about 14 797 600 tU (Tables 2, 3 and 8). This total does not include secondary sources or unconventional resources, e.g. uranium from phosphates.
(5) To the total conventional resources, described in note 4, is added 22 000 000 tU estimated to be available in phosphate deposits [8].

79
REFERENCES
[1] IAEA, Power Reactor Information System, World Energy Availability Factors by Year. http://iaea.org/programmes/a2.
[2] Euratom Supply Agency (2005), Annual Report 2004, CEC, Luxembourg.
[3] NEA (2001), Management of Depleted Uranium, OECD, Paris, France.
[4] IAEA (2001), Analysis of Uranium Supply to 2050, IAEA-SM-362/2, Vienna, Austria.
[5] IEA (2004), World Energy Outlook: 2004, OECD, Paris, France.
[6] NEA (2005), Projected Costs of Generating Electricity – 2005 Update, OECD, Paris, France.
[7] NEA (2002), Trends in the Nuclear Fuel Cycle, OECD, Paris, France.
[8] Dr. Fritz Barthel (2005), Thorium and Unconventional Uranium Resources, presented at IAEA Technical Meeting on “Fissile Materials Management Strategies for Sustainable Nuclear Energy”, Vienna, Austria, 12-15 September 2005.

81
III. NATIONAL REPORTS ON URANIUM EXPLORATION, RESOURCES, PRODUCTION, DEMAND AND THE ENVIRONMENT
INTRODUCTION
Part III of the report presents the national submissions on uranium exploration, resources and production. These reports have been provided by official government organisations (Appendix 2) responsible for the control of nuclear raw materials in their respective countries and the details are the responsibility of the individual organisations concerned. In countries where commercial companies are engaged in exploration, mining and production of uranium, the information is first submitted by these companies to the government of the host country and may then be transmitted to the NEA or the IAEA at the discretion of the government concerned. In certain cases, where an official national report was not submitted and where deemed helpful to the reader, the Secretariat has provided additional comments or estimates to complete the Red Book. Where utilised, the Secretariat estimates are clearly indicated.
The Agencies are aware that exploration activities may be currently proceeding in a number of other countries which are not included in this report. They are also aware that in some of these countries uranium resources have been identified. However, it is believed that the total of these resources would not significantly affect the overall conclusions of this report. Nevertheless, both Agencies encourage the governments of these countries to submit an official response to the questionnaire for the next Red Book exercise.
Finally, it should be noted that the national boundaries depicted on the maps that accompany the country reports are for illustrative purposes and do not necessarily represent the official boundaries recognised by the member countries of the OECD or the Member states of the IAEA.
Additional information on the world’s uranium deposits is available in the IAEA publications: “World Distribution of Uranium Deposits” (STI/PUB/997), together with the “Guidebook to accompany the IAEA Map: World Distribution of Uranium Deposits” (STI/PUB/1021). The location of 582 uranium deposits is given on a geologic base map at the scale 1:30 000 000. The guidebook (which is available at no cost with purchase of the map) and map provide information on the deposit: type, tectonic setting, age, total resources, average uranium grade, production status and mining method. They may be ordered from:
INTERNATIONAL ATOMIC ENERGY AGENCY
Sales & Promotion Unit, Division of Publications P.O. Box 100, Wagramerstrasse 5, A-1400 Vienna, Austria
Telephone: (43) 1-2600-22529 Facsimile: (43) 1-26007-29302 Electronic Mail: [email protected]
Forty-three member countries submitted a response to the questionnaire and, as a result, have a national report in the following section. This edition uses a different format than previous in that the data tables are provided at the end of each country’s report. Each data table is clearly titled such that the reader should be able to easily find the table that corresponds to the relevant text in the country report.
Algeria
82
• Algeria •
URANIUM EXPLORATION
Historical review
Uranium exploration began in Algeria in 1969. The Precambrian shield of the Hoggar and its Tassilian sedimentary cover were considered to provide a geological environment favourable for uranium mineralization. Initial exploration, carried out by means of ground radiometric surveys, found several radioactive anomalies (Timgaouine, Abankor and Tinef). In 1971, an aerial radiometric survey was performed over the entire country, an area of 2 380 000 km2. After evaluation of the data from that survey, several prospecting teams were involved in ground follow-up and in verifying anomalies. This led to the discovery of a large number of promising areas for further uranium exploration: Eglab, Ougarta, and southern Tassili (Tin-Seririne basin) where the Tahaggart deposit was discovered. Follow up of the aerial radiometric survey also led to identification of the Tamart-N-Iblis and Timouzeline sectors as areas for future uranium exploration. At the same time, the search for uranium entered a phase (1973-1981), which focused primarily on evaluation of the deposits already discovered. A second phase (1984-1987) was characterised by a marked slowdown in the search effort; however, investigations of the flanks of the known deposits and in neighbouring regions revealed other potential mineralised areas (e.g. Tesnou zone in the northwest and north Timgaouine). In Tin-Seririne basin (Tassili south of the Hoggar), geological mapping has resulted in characterisation of the distribution of uranium mineral deposits in the Paleozoic sedimentary sequences.
Recent and ongoing uranium exploration and mine development activities
From 1998 to 2002 no exploration or prospecting activity was carried out in the field.
URANIUM RESOURCES
Identified resources (RAR & Inferred)
Algeria’s Reasonably Assured Resources are comprised of two geological types: Upper Proterozoic unconformity-related deposits and vein deposits. The first category includes deposits associated with weathering profiles (regolith) and deposits associated with the basal conglomerate and sandstone of the sedimentary cover, which are located primarily in the Tin-Séririne basin in the southern Hoggar. Deposits of the second (vein) type are located in veins in primary fractures associated with faults across granite batholiths. This type of deposit includes the Timgaouine, Abankor, El-Bema and Aït-Oklan deposits in the southwestern Hoggar. Algeria does not report any resources in any category other than RAR.

Algeria/Argentina
83
Undiscovered resources (Prognosticated & SR)
See relevant Table below. Algeria did not report any information on uranium production, uranium requirements, national policies relating to uranium, uranium stocks or uranium prices.
Reasonably Assured Resources* (tonnes U)
Production method <USD 40/kgU <USD 80/kgU <USD 130/kgU Recovery factor (%)
Underground mining 0 0 0 Open-pit mining 0 0 0 In situ leaching 0 0 0 Heap leaching 0 0 0 In-place leaching (stope/block leaching)
0 0 0
Co-product and by-product 0 0 0 Unspecified NA 26 000 26 000 Total NA 26 000 26 000
* In situ resources.
• Argentina •
URANIUM EXPLORATION
Historical review
Uranium exploration activities in Argentina began in 1951-1952. The Huemul sandstone deposit was found in 1954, while exploring for red bed copper mineralization. The Tonco district with the sandstone deposits Don Otto and Los Berthos was discovered by an airborne geophysical survey conducted in 1958. During the late 1950s and the early 1960s, airborne surveys also led to the discovery of the Los Adobes sandstone deposit in Patagonia.
During the 1960s, the Schlagintweit and La Estela vein deposits were found by exploration in granitic terrain. The resources hosted in these deposits were subsequently mined in the production centres of Los Giagantes and La Estela, respectively. In 1968, an airborne survey led to the discovery of the Dr. Baulies deposit, which occurs in volcanoclastic sediments, in Sierra Pintada district in Mendoza province.
During the 1970s, follow-up exploration in the vicinity of the previously discovered uranium occurrences in Patagonia, led to the discovery of two new sandstone deposits: Cerro Condor and Cerro Solo. An airborne survey carried out in 1978 in Patagonia contributed to the discovery of the small Laguna Colorada deposit located in a volcanic environment.

Argentina
84
During the 1980s, an airborne survey conducted over granitic terrain identified a number of strong anomalies. Subsequently in 1986, ground exploration identified the vein Las Termas mineralization. At the end of the 1980s, a nation-wide exploration programme was started to evaluate those geological units that were believed to have uranium potential.
In 1990, exploration was initiated in the vicinity of the Cerro Solo deposit in Patagonia. Since 1998, more than 56 000 metres have been drilled to test the potential of favourable portions of the paleochannel structure. The results included the localisation and partial evaluation of specific mineralised bodies containing resources of several thousand tonnes. These results allowed completion of the pre-feasibility study for this U-Mo deposit.
Recent and ongoing uranium exploration and mine development activities
At the present time, the National Atomic Energy Commission has developed a programme to complete the final feasibility study of the Cerro Solo deposit and the exploration and evaluation of the surrounding areas, in order to increase the resources of this district. To accomplish these tasks with the objective of putting the deposit in operation in the near future, the CNEA is analysing an association with national, provincial and private companies in the framework of the current situation of the mining projects and the uranium international market. In addition, it is planned to carry out a regional exploration programme of the Golfo de San Jorge basin, including extensive areas of the Chubut and Santa Cruz provinces.
Ongoing exploration programmes have continued in the rest of the country, both at regional and local scales. Regional assessment of the country’s overall uranium potential is still in progress, following the steps suggested by the National Uranium Resource Evaluation from the United States. It is setting up the uraniferous favourability based on existing geological data bases and field reconnaissance; estimation of the probability of finding a certain type of uranium deposit; determination of potential resources taking into account the presence of existing uranium deposits in the area or in a similar geological environment and delimitation of geographical sites that can be prospected jointly.
Consequently, areas of interest were selected to develop geological studies at a more detailed scale taking into consideration different metallogenetic models. The specific programmes can be summed up as follows: geological exploration of Las Termas (vein type); assessment of the geological units with potential for exploitation by the in situ leaching technology (sandstone type); exploration of targets defined by airborne surveys in Patagonia (sandstone and volcanoclastic types); favourability studies in granitic environments (vein and episyenite types); metallogenetic studies in the Cerro Solo and Sierra Pintada uranium deposits (sandstone and volcanoclastic types).
It is important to comment that the Geological Survey of Argentina recently carried out new airborne gamma ray spectrometry and magnetometry surveys that have provided very useful geophysical information for the development of uranium exploration projects. This data set is being analysed both to study the geochemical characteristics of the geological units and to locate uranium anomalies. As a result of IAEA Technical Cooperation Project ARG/3/008, a car-borne gamma-ray spectrometric system was put in operation. This has been used to increase the country’s capability for uranium exploration.

Argentina
85
URANIUM RESOURCES
Identified resources (RAR & Inferred)
There are no significant changes with the information in the 2003 Red Book.
Undiscovered resources (Prognosticated & SR)
There are no significant changes with the information in 2003 Red Book.
URANIUM PRODUCTION
Historical review
Argentina has been producing uranium since the mid-1950s. A total of seven commercial scale production centres were in operation at different times through 2000. In addition, a pilot plant operated from 1953-1970.
Between the mid-1950s and 1999, the cumulative production totalled 2 509 tU. Since 1996, all the production has come from the San Rafael centre. Production data are given in the relevant Table.
Los Colorados mine and mill complex, located in La Rioja province started production in 1993, and was shut down at the end of 1995. Los Colorados was owned and operated by Uranco S.A., a private company. Ore was mined from a small sandstone deposit and treated in the attached IX recovery plant that was relocated to Los Colorados from La Estela project. The closure of the Los Colorados operation resulted in a change in the ownership structure of uranium production in Argentina. Since 1996, the uranium mining industry has been wholly owned by the government agency CNEA.
Status of production capability
The production projects
For about 20 years the nuclear power plants were fed with fuel obtained from national sources. At the end of the nineties, it was decided that due to the gaping disparity between costs of the national concentrates and those produced abroad, uranium had to be imported.
At present CNEA proposes to restart local production. There are better conditions to obtain competitive costs and the government has set up a policy to encourage the growth of nuclear electricity.

Argentina
86
Once the decision of completing the Atucha II Plant construction and starting operation was taken, Argentina’s nuclear power plants fuel requirements might increase in the mid-term from 120 tU/year to 220 tU/year.
The San Rafael Mining-Milling Complex Remediation and Reactivation Project
In June 2004 CNEA presented a proposal to reactivate the San Rafael Mining-Milling Complex to the Mendoza Province and national (Nuclear Regulatory Authority) licensing authorities. The main step of the licensing process is the Environmental Impact Assessment, which includes both the engineering for remediation of wastes generated by the former production stage, and the assessment of environmental management of future production activities. The EIA was carried out by the National Technological University, with the collaboration of the DBE TEC consultant company from Germany and some local institutions.
The EIA was elaborated after two years of intensive work. In the first part, it included wide base studies about the environmental components and the activity risks. It also aimed at solving some concerns the community had with regards to the wastes that are under transitory management, and the reactivation project.
The studies carried out concluded that the former operations had neither affected the quality of the underground and surface water of the area, nor any other component of the environment of the region.
The remediation can be prior to or simultaneous with the restart of the production operations, which include substantial improvements, coherent with the new methodologies to put in practice. These methodologies incorporate additional safety measurements, oriented to improve the environment protection with regards to the implemented in the previous operational stage. Starting of production is expected in 2006.
The feasibility of the project is based on re-evaluation studies of the main ore deposit areas, and on the changes of the methodology in mineral treatment, which allow an important reduction of cost production. In the period 2003-2004 new pilot tests were performed for confirm the results of the previous ones, aimed at producing important changes in the methodology.
The Cerro Solo Project
At the pre-feasibility stage, the Cerro Solo Project, in the Province of Chubut, is at the same time under consideration to reinitiate in the short term the feasibility studies and development-production stage.
With the present conditions in the market, the estimated cost of production of the project has become competitive, and the resources could be enough to supply in the long term the needs of nuclear power plants.
Cerro Solo is a sandstone uranium-molybdenum ore deposit type, 0.3% U grade, lying between 50 and 120 m deep. The estimated resources are 5 000 tU (Reasonable Assured Resources and Inferred Resources), and there are high possibilities of increasing these resources in the surrounding area.

Argentina
87
Ownership structure of the uranium industry
At present, all of Argentina’s uranium industry is government owned.
Employment in the uranium industry
Employment in uranium supply in Argentina is 60 persons.
Secondary sources of uranium
Argentina reported no information on mixed oxide fuels and re-enriched tails production and use.
ENVIRONMENTAL ACTIVITIES AND SOCIO-CULTURAL ISSUES
On behalf of the INCO-DC project of the European Union named “Innovative Strategies for the Preservation of Water Quality in Mining Areas of Latin America”, hydro-geochemical studies were performed in order to define baseline previous to any mining work in the Cerro Solo U-Mo deposit area. The tasks included were as follows: water and stream sediment surveys, chemical and isotopic studies, geochemical interpretation, ground radiometric mapping and environmental impact evaluation.
Sierra Pintada’s ongoing project for updating the feasibility study emphasises good environmental practices. Improvement of surface and underground water monitoring and studies of mining waste and mill tailings management are short-term objectives. The World Bank is working in supply a grant to remediate all former uranium mines and production plants exhausted.
URANIUM REQUIREMENTS
Supply and procurement strategy
The National Atomic Energy Commission’s ongoing projects for restarting uranium production in Argentina in the mid-term, described in different sections of this report, reflect a policy aimed at finding equilibrium between market opportunities and reduction of supply and price uncertainties.
NATIONAL POLICIES RELATING TO URANIUM
There are no restrictions that preclude local and foreign private companies from participating in uranium exploration and production. The legal framework issued in the 1994-95 period, regulates these activities to ensure environmental practices that conform to international standards.

Argentina
88
URANIUM STOCKS
As of 1 January 2005, total uranium stocks held by the CNEA amounted to 110 tonnes U.
URANIUM PRICES
There is no uranium market in Argentina.
Uranium Exploration and Development Expenditures and Drilling Effort – Domestic
Expenses in ARS 2002 2003 2004 2005 (expected)
Industry exploration expenditures 0 0 60 000 600 000
Government exploration expenditures 795 000 1 500 000 1 800 000 2 100 000
Industry development expenditures 79 500 300 000 200 000 100 000
Government development expenditures 0 0 0 0
Total expenditures 874 500 1 800 000 2 060 000 2 800 000
Industry exploration drilling (metres) 0 0 0 5 000
Number of industry exploration holes drilled 0 0 0 25
Government exploration drilling (metres) 2 698 0 0 1 500
Number of government exploration holes drilled 136 0 0 5
Industry development drilling (metres) 0 0 0 NA
Number of development exploration holes drilled 0 0 0 NA
Government development drilling (metres) 0 0 0 NA
Number of development exploration holes drilled 0 0 0 NA
Subtotal exploration drilling (metres) 2 698 0 0 NA
Subtotal exploration holes 136 0 0 NA
Subtotal development drilling (metres) 0 0 0 NA
Subtotal development holes 0 NA
Total drilling (metres) 2 698 0 0 NA
Total number of holes 136 0 0 NA

Argentina
89
Reasonably Assured Resources
(tonnes U)
Production method <USD 40/kgU <USD 80/kgU <USD 130/kgU Recovery factor (%)
Underground mining 0 0 2 200 90
Open-pit mining 4 780 4 880 4 880 90
In situ leaching 0 0 0
Heap leaching 0 0 0
In-place leaching (stope/block leaching)
0 0 0
Co-product and by-product 0 0 0
Unspecified 0 0 0
Total 4 780 4 880 7 080
Reasonably Assured Resources by Deposit Type (tonnes U)
Deposit type <USD 40/kgU <USD 80/kgU <USD 130/kgU
Unconformity-related 0 0 0
Sandstone 2 580 2 680 3 080
Hematite breccia complex 0 0 0
Quartz-pebble conglomerate 0 0 0
Vein 0 0 0
Intrusive 0 0 0
Volcanic and caldera-related 2 200 2 200 4 000
Metasomatite 0 0 0
Other 0 0 0
Total 4 780 4 880 7 080
Inferred Resources (tonnes U)
Production method <USD 40/kgU <USD 80/kgU <USD 130/kgU Recovery factor (%)
Underground mining 0 0 5 700 90
Open-pit mining 2 860 2 860 2 860 90
In situ leaching 0 0 0
Heap leaching 0 0 0
In-place leaching (stope/block leaching)
0 0 0
Co-product and by-product 0 0 0
Unspecified 0 0 0
Total 2 860 2 860 8 560

Argentina
90
Inferred Resources by Deposit Type (tonnes U)
Deposit type <USD 40/kgU <USD 80/kgU <USD 130/kgU
Unconformity-related 0 0 0
Sandstone 2 440 2 440 8 140
Hematite breccia complex 0 0 0
Quartz-pebble conglomerate 0 0 0
Vein 0 0 0
Intrusive 0 0 0
Volcanic and caldera-related 420 420 420
Metasomatite 0 0 0
Other 0 0 0
Total 2 860 2 860 8 560
Prognosticated Resources (tonnes U)
Cost ranges
<USD 80/kgU <USD 130/kgU
1 440 1 440
Historical Uranium Production (tonnes U in concentrate)
Production method Total
through end of 2001
2002 2003 2004 Total
through end of 2004
2005 (expected)
Open-pit mining1 1 807 0 0 0 1 807 0
Underground mining1 0 0 0 0 0 0
In situ leaching 0 0 0 0 0 0
Heap leaching 702 0 0 0 702 0
In-place leaching* 0 0 0 0 0 0
Co-product/by-product 0 0 0 0 0 0
U recovered from phosphates
0 0 0 0 0 0
Other methods** 0 0 0 0 0 0
Total 2 509 0 0 0 2 509 0
(1) Pre-2002 totals may include uranium recovered by heap and in-place leaching. * Also known as stope leaching or block leaching. ** Includes mine water treatment and environmental restoration.

Argentina
91
Uranium Industry Employment at Existing Production Centres (person-years)
2002 2003 2004 2005 (expected)
Total employment related to existing production centres
60 60 60 60
Employment directly related to uranium production
60 60 60 60
Short-term Production Capability (tonnes U/year)
2005 2010
A-I B-I A-II B-II A-I B-I A-II B-II
120 120 120 120 120 120 500 500
2015 2020 2025
A-I B-I A-II B-II A-I B-I A-II B-II A-I B-I A-II B-II
500 500 500 500 NA NA NA NA NA NA NA NA
Net Nuclear Electricity Generation
2003 2004
Nuclear electricity generated (TWh net) 8.4 8.5
Installed Nuclear Generating Capacity to 2025 (MWe net)
2010 2015 2020 2025 2004 2005
Low High Low High Low High Low High
940 940 940 1 630 940 1 630 600 1 292 NA NA
Annual Reactor-related Uranium Requirements to 2025 (excluding MOX) (tonnes U)
2010 2015 2020 2025 2004 2005
Low High Low High Low High Low High
120 120 95 250 95 250 60 205 NA NA

Argentina/Armenia
92
Total Uranium Stocks (tonnes natural U-equivalent)
Holder
Natural uranium stocks in
concentrates
Enriched uranium
stocks
Depleted uranium
stocks
Reprocessed uranium
stocks Total
Government 110 0 0 0 110
Producer 0 0 0 0 0
Utility NA 0 0 0 NA
Total NA 0 0 0 NA
• Armenia •
Armenia did not report any information on uranium exploration and mine development, uranium production, environmental activities and socio-cultural issues, national policies relating to uranium or uranium prices. There is no stockpile of natural uranium material in Armenia.
URANIUM REQUIREMENTS
There have been no changes in Armenia’s nuclear energy programme during the past two years. The country’s short-term uranium requirements remained the same and are based on the operation of one VVER-440 unit of the Metsamor nuclear power plant. High-level forecast requirements are given taking into account the designed lifetime for this reactor facility, which has an installed capacity of about 375 MWe net.
The long-term requirements depend on the country's policy in the nuclear energy sector. According to the development plan for the Armenian energy sector, it is envisaged to construct, as a possible option, two new nuclear units with the capacity of about 590 MWe each.
Supply and procurement strategy
The nuclear fuel for the Metsamor reactor is supplied by the Russian Federation.
Armenia’s supply and procurement strategy has remained the same during the past two years, and as there have been no changes in uranium requirements, the country's uranium supply position is based on the same fuel procurement from the Russian Federation.
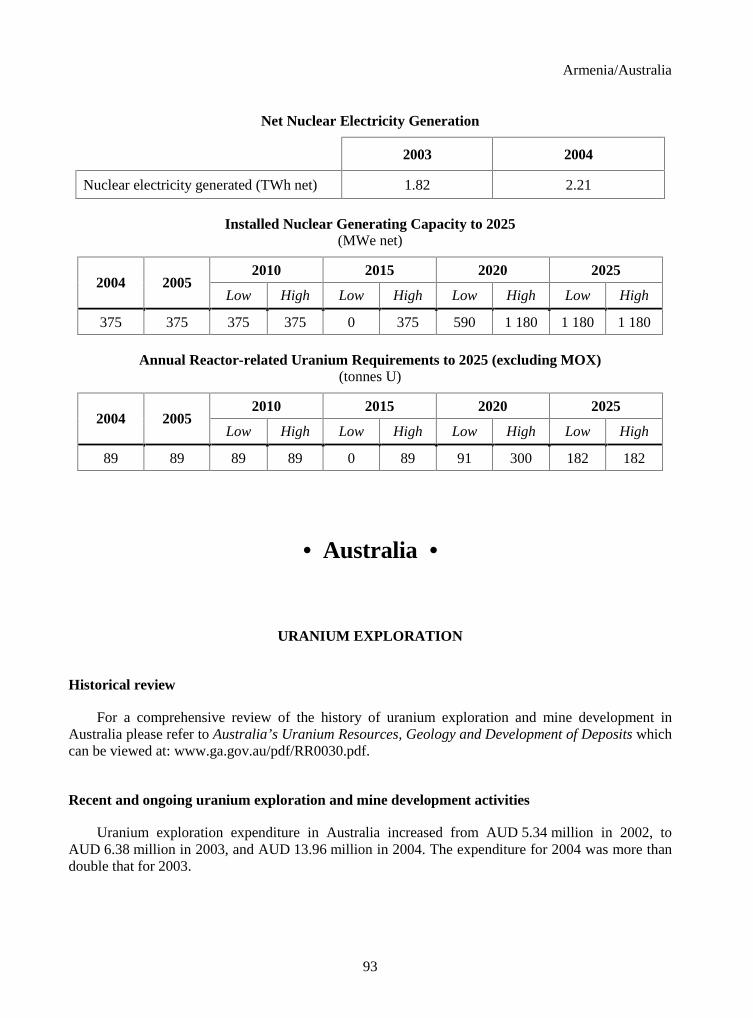
Armenia/Australia
93
Net Nuclear Electricity Generation
2003 2004
Nuclear electricity generated (TWh net) 1.82 2.21
Installed Nuclear Generating Capacity to 2025 (MWe net)
2010 2015 2020 2025 2004 2005
Low High Low High Low High Low High
375 375 375 375 0 375 590 1 180 1 180 1 180
Annual Reactor-related Uranium Requirements to 2025 (excluding MOX) (tonnes U)
2010 2015 2020 2025 2004 2005
Low High Low High Low High Low High
89 89 89 89 0 89 91 300 182 182
• Australia •
URANIUM EXPLORATION
Historical review
For a comprehensive review of the history of uranium exploration and mine development in Australia please refer to Australia’s Uranium Resources, Geology and Development of Deposits which can be viewed at: www.ga.gov.au/pdf/RR0030.pdf.
Recent and ongoing uranium exploration and mine development activities
Uranium exploration expenditure in Australia increased from AUD 5.34 million in 2002, to AUD 6.38 million in 2003, and AUD 13.96 million in 2004. The expenditure for 2004 was more than double that for 2003.

Australia
94
The main areas where uranium exploration was carried out during 2003 and 2004 were:
� Arnhem Land (Northern Territory) – exploration for unconformity-related deposits in Palaeoproterozoic metasediments below a thick cover of Kombolgie Sandstone.
� Frome Embayment (South Australia) – exploration for sandstone uranium deposits.
� Gawler Craton/Stuart Shelf region (South Australia) – exploration for hematite breccia complex deposits.
Exploration activities increased in the Frome Embayment during 2004. Drilling tested target areas, which had been outlined by airborne electromagnetic surveys that defined the extent of buried palaeochannels. Heathgate Resources announced the discovery of a new zone of uranium mineral-isation (referred to as Deep South zone) approximately 3 km south of the Beverley deposit. The Deep South ore zone is in sands similar to those hosting the Beverley deposit.
Southern Cross Resources continued exploration in the region of Honeymoon, East Kalkaroo and Goulds Dam deposits. A new zone of low-medium grade uranium mineralization was discovered in an area of the Yarramba palaeochannel approximately 1.5 km northwest of the Honeymoon deposit. The new zone (known as Brooks Dam prospect) has been tested by drilling over a distance of 1 km along the palaeochannel and the company considers that it may extend as far south as the main Honeymoon deposit. Grades and thickness of mineralised intersections were measured with a down-hole Prompt Fission Neutron probe.
In 2004, WMC Resources reported that exploration drilling in the south eastern portion of the Olympic Dam deposit has outlined significant additional resources. The resources as at December 2004 are almost a 30% increase over the resources to December 2003.
Minotaur Exploration Pty Ltd continued exploration drilling of copper-gold-uranium mineral-isation at the Prominent Hill deposit (SA). Uranium grades are low, averaging approximately 100 ppm U (compared with 300-400 ppm U for Olympic Dam).
Uranium exploration and development expenditures – abroad
During 2004, Paladin Resources Ltd (an Australian exploration company) completed a feasibility study on the Langer Heinrich deposit in Namibia. A major exploration drilling programme outlined areas of additional resources adjacent to the deposit. In May 2005, the company decided to proceed with development of the deposit. Paladin also continued exploration at the Kayelekera deposit in Malawi.
URANIUM RESOURCES
Identified resources (RAR & Inferred)
At 1 January 2005, Australia’s Identified Resources recoverable at costs of less than USD 40/kgU amounted to 1 044 000 tU, compared to 966 000 tU at 1 January 2003 – an 8% increase. This was due to increased resources at Olympic Dam deposit resulting from:
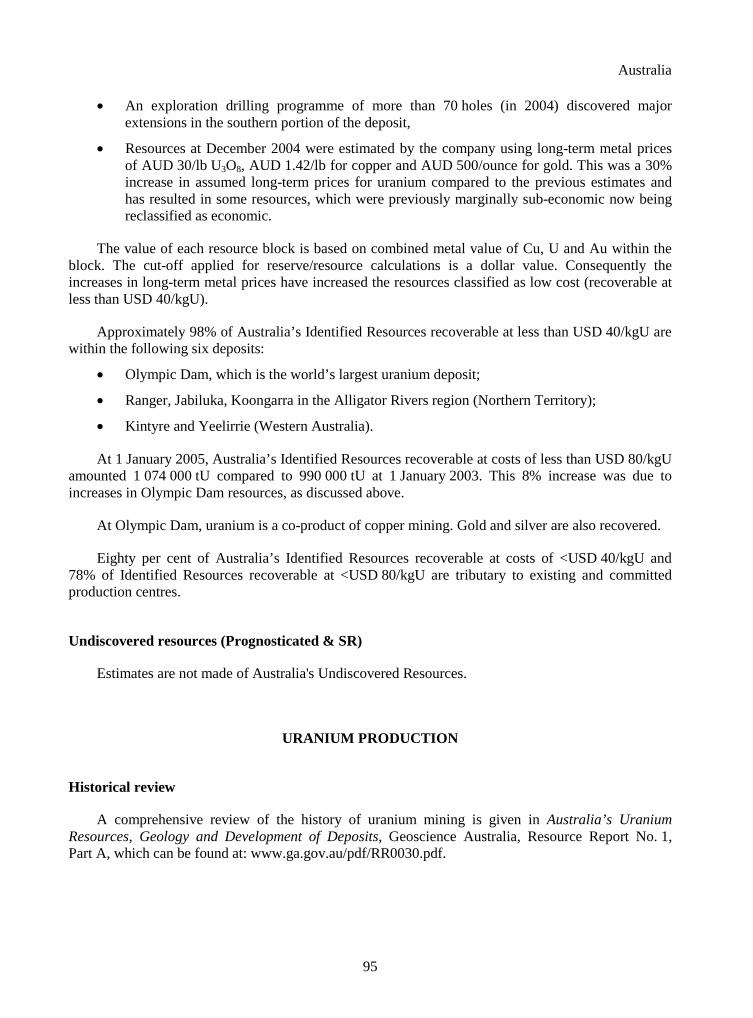
Australia
95
� An exploration drilling programme of more than 70 holes (in 2004) discovered major
extensions in the southern portion of the deposit,
� Resources at December 2004 were estimated by the company using long-term metal prices of AUD 30/lb U3O8, AUD 1.42/lb for copper and AUD 500/ounce for gold. This was a 30% increase in assumed long-term prices for uranium compared to the previous estimates and has resulted in some resources, which were previously marginally sub-economic now being reclassified as economic.
The value of each resource block is based on combined metal value of Cu, U and Au within the block. The cut-off applied for reserve/resource calculations is a dollar value. Consequently the increases in long-term metal prices have increased the resources classified as low cost (recoverable at less than USD 40/kgU).
Approximately 98% of Australia’s Identified Resources recoverable at less than USD 40/kgU are within the following six deposits:
� Olympic Dam, which is the world’s largest uranium deposit;
� Ranger, Jabiluka, Koongarra in the Alligator Rivers region (Northern Territory);
� Kintyre and Yeelirrie (Western Australia).
At 1 January 2005, Australia’s Identified Resources recoverable at costs of less than USD 80/kgU amounted 1 074 000 tU compared to 990 000 tU at 1 January 2003. This 8% increase was due to increases in Olympic Dam resources, as discussed above.
At Olympic Dam, uranium is a co-product of copper mining. Gold and silver are also recovered.
Eighty per cent of Australia’s Identified Resources recoverable at costs of <USD 40/kgU and 78% of Identified Resources recoverable at <USD 80/kgU are tributary to existing and committed production centres.
Undiscovered resources (Prognosticated & SR)
Estimates are not made of Australia's Undiscovered Resources.
URANIUM PRODUCTION
Historical review
A comprehensive review of the history of uranium mining is given in Australia’s Uranium Resources, Geology and Development of Deposits, Geoscience Australia, Resource Report No. 1, Part A, which can be found at: www.ga.gov.au/pdf/RR0030.pdf.

Australia
96
Status of production capability and recent and ongoing activities
Australia has three operating uranium mines: Olympic Dam (underground), Ranger (open pit) and the Beverley (in situ leach). In 2004, Australia’s uranium production reached a record level of 8 982 tU. Production increased at all three mines during the year, with large increases occurring at Olympic Dam.
Olympic Dam
In 2004, 8.9 Mt ore were mined and processed to produce 3 706 tU, 224 731 t copper and 88 633 ounces gold. Uranium production for 2004 was 38% higher than for the previous year. Reconstructions of both the copper and uranium solvent extraction plants (previously destroyed by a fire in late 2001) were completed and the new uranium solvent extraction plant operated at planned production rates from mid 2003 onwards.
In 2004, WMC Resources commenced a study to investigate the feasibility of a major expansion of the operations that would increase annual production to 12 720 tU (15 000 tU3O8), 500 000 t copper and 500 000 ounces gold. The study included:
� A major drilling programme to better define the resources in the southern part of the deposit;
� Assessing the alternative mining, treatment and recovery methods for the southern part of the deposit.
Ongoing drilling has identified significant additional resources in the south-eastern portion of the deposit. The resources as at December 2004 are almost a 30% increase over the resources to December 2003.
Evaluation of the various mining methods and the scale of operations were finalised in March 2005. Two mining options were evaluated: underground (sub-level caving or block caving) and open pit. From the results of the study, the company selected open pit as the preferred method because it provides “clear economic benefits over the alternatives based upon commercially proven technology”. It is proposed to mine 40 Mt ore per year, which would comprise 35-40 Mt/year from the open pit and 5 Mt/year from the existing underground operations.
In August 2005, BHP Billiton acquired all of the issued shares in WMC Resources Ltd. and is now the owner and operator of the Olympic Dam mine. It is continuing investigation of the feasibility of a quadrupling of production capacity of Olympic Dam, based on a large-scale open pit operation to mine the southern part of the deposit.
Ranger
Ranger production in 2004 was a record 4 357 tU. A total of 2 086 Mt ore averaging 0.236% U (0.278% U3O8) were milled during the year. Recent development and exploration drilling has extended the lower limits of the orebody, which together with extending the planned outline of the open pit has added additional reserves of 5 972 t U3O8. Metallurgical test work was undertaken to investigate the feasibility of processing lateritic ore, which has been stockpiled from earlier mining operations.
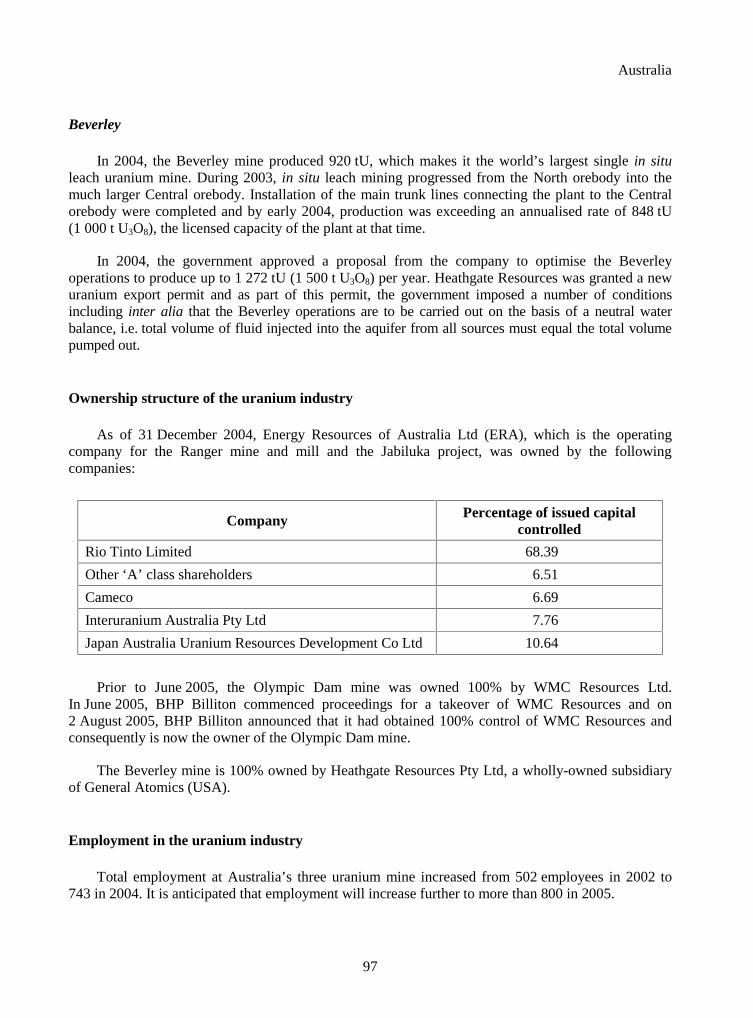
Australia
97
Beverley
In 2004, the Beverley mine produced 920 tU, which makes it the world’s largest single in situ leach uranium mine. During 2003, in situ leach mining progressed from the North orebody into the much larger Central orebody. Installation of the main trunk lines connecting the plant to the Central orebody were completed and by early 2004, production was exceeding an annualised rate of 848 tU (1 000 t U3O8), the licensed capacity of the plant at that time.
In 2004, the government approved a proposal from the company to optimise the Beverley operations to produce up to 1 272 tU (1 500 t U3O8) per year. Heathgate Resources was granted a new uranium export permit and as part of this permit, the government imposed a number of conditions including inter alia that the Beverley operations are to be carried out on the basis of a neutral water balance, i.e. total volume of fluid injected into the aquifer from all sources must equal the total volume pumped out.
Ownership structure of the uranium industry
As of 31 December 2004, Energy Resources of Australia Ltd (ERA), which is the operating company for the Ranger mine and mill and the Jabiluka project, was owned by the following companies:
Company Percentage of issued capital controlled
Rio Tinto Limited 68.39
Other ‘A’ class shareholders 6.51
Cameco 6.69
Interuranium Australia Pty Ltd 7.76
Japan Australia Uranium Resources Development Co Ltd 10.64
Prior to June 2005, the Olympic Dam mine was owned 100% by WMC Resources Ltd. In June 2005, BHP Billiton commenced proceedings for a takeover of WMC Resources and on 2 August 2005, BHP Billiton announced that it had obtained 100% control of WMC Resources and consequently is now the owner of the Olympic Dam mine.
The Beverley mine is 100% owned by Heathgate Resources Pty Ltd, a wholly-owned subsidiary of General Atomics (USA).
Employment in the uranium industry
Total employment at Australia’s three uranium mine increased from 502 employees in 2002 to 743 in 2004. It is anticipated that employment will increase further to more than 800 in 2005.
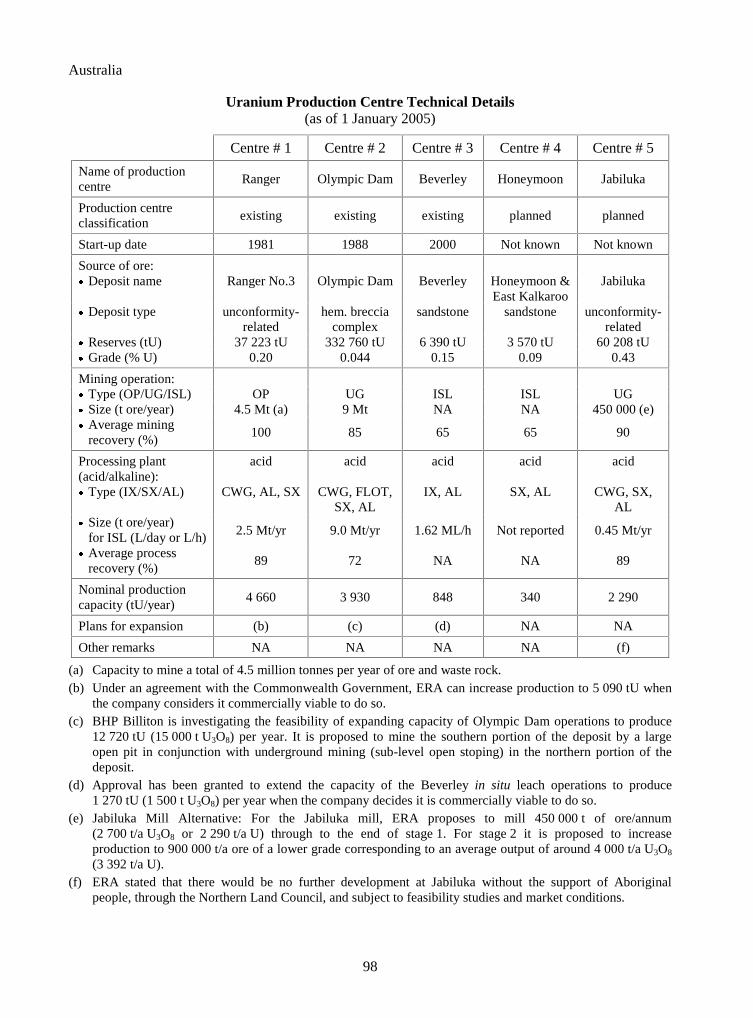
Australia
98
Uranium Production Centre Technical Details
(as of 1 January 2005)
Centre # 1 Centre # 2 Centre # 3 Centre # 4 Centre # 5
Name of production centre
Ranger Olympic Dam Beverley Honeymoon Jabiluka
Production centre classification
existing existing existing planned planned
Start-up date 1981 1988 2000 Not known Not known
Source of ore: � Deposit name Ranger No.3 Olympic Dam Beverley Honeymoon &
East Kalkaroo Jabiluka
� Deposit type unconformity-related
hem. breccia complex
sandstone sandstone unconformity-related
� Reserves (tU) 37 223 tU 332 760 tU 6 390 tU 3 570 tU 60 208 tU � Grade (% U) 0.20 0.044 0.15 0.09 0.43
Mining operation: � Type (OP/UG/ISL) OP UG ISL ISL UG � Size (t ore/year) 4.5 Mt (a) 9 Mt NA NA 450 000 (e) � Average mining
recovery (%) 100 85 65 65 90
Processing plant (acid/alkaline):
acid acid acid acid acid
� Type (IX/SX/AL) CWG, AL, SX CWG, FLOT, SX, AL
IX, AL SX, AL CWG, SX, AL
� Size (t ore/year) for ISL (L/day or L/h) 2.5 Mt/yr 9.0 Mt/yr 1.62 ML/h Not reported 0.45 Mt/yr
� Average process recovery (%)
89 72 NA NA 89
Nominal production capacity (tU/year)
4 660 3 930 848 340 2 290
Plans for expansion (b) (c) (d) NA NA
Other remarks NA NA NA NA (f)
(a) Capacity to mine a total of 4.5 million tonnes per year of ore and waste rock. (b) Under an agreement with the Commonwealth Government, ERA can increase production to 5 090 tU when
the company considers it commercially viable to do so. (c) BHP Billiton is investigating the feasibility of expanding capacity of Olympic Dam operations to produce
12 720 tU (15 000 t U3O8) per year. It is proposed to mine the southern portion of the deposit by a large open pit in conjunction with underground mining (sub-level open stoping) in the northern portion of the deposit.
(d) Approval has been granted to extend the capacity of the Beverley in situ leach operations to produce 1 270 tU (1 500 t U3O8) per year when the company decides it is commercially viable to do so.
(e) Jabiluka Mill Alternative: For the Jabiluka mill, ERA proposes to mill 450 000 t of ore/annum (2 700 t/a U3O8 or 2 290 t/a U) through to the end of stage 1. For stage 2 it is proposed to increase production to 900 000 t/a ore of a lower grade corresponding to an average output of around 4 000 t/a U3O8 (3 392 t/a U).
(f) ERA stated that there would be no further development at Jabiluka without the support of Aboriginal people, through the Northern Land Council, and subject to feasibility studies and market conditions.

Australia
99
Future production centres
Honeymoon
Formal government approval to develop the Honeymoon ISL project (South Australia) was granted in 2001 following an assessment of the environmental impact statement and additional hydrogeological investigations requested by government.
Development of the project is currently on hold following a review of development options for the project, which focused on a 400 t U3O8/year capacity plant with a mine life of 6-8 years.
Jabiluka
Mining was approved by the Commonwealth and Northern Territory governments in 1999 subject to environmental conditions. However, the traditional Aboriginal land-owners have refused to grant their approval for development of the mine. ERA Ltd. has announced that there would be no further development at Jabiluka without the formal support of Aboriginal people, and subject to feasibility studies and market conditions. The project site remains on long-term environmental care.
Secondary sources of uranium
Australia has no production or use of mixed oxide fuels, re-enrichment of tailings or reprocessed uranium.
ENVIRONMENTAL ACTIVITIES AND SOCIO-CULTURAL ISSUES
Comprehensive reviews of environmental activities and socio-cultural issues for Ranger, Jabiluka, Olympic Dam, Beverley and Honeymoon operations were provided in the 2001 and 2003 editions of the Red Book.
Mining of the Jabiluka deposit was approved in 1999 subject to environmental conditions. As with Ranger, Jabiluka is surrounded by, but is not part of, Kakadu National Park. In consideration of World Heritage concerns about the impact of Jabiluka’s development on the park, Energy Resources of Australia (ERA) Ltd. has previously agreed that Jabiluka and the nearby Ranger operation would not be in full operation simultaneously.
The traditional Aboriginal land-owners have refused to grant their approval for development of the mine. In February 2005, the Mirarr Gundjeihmi Aboriginal people, ERA Ltd. and the Northern Land Council signed an agreement on the long-term management of the Jabiluka lease. This agreement obliges ERA Ltd. (and its successors) to secure Mirrar consent prior to any future mining development of uranium deposits at Jabiluka.
URANIUM REQUIREMENTS
Australia has no commercial nuclear power plants and thus has no uranium requirements.

Australia
100
NATIONAL POLICIES RELATING TO URANIUM
The Australian government’s policy is to approve new uranium mines and uranium exports provided they comply with strict environmental, heritage and nuclear safeguards requirements. Where Aboriginal interests are involved, the government is committed to ensuring full consultation with the affected Aboriginal communities.
Exports of Australian uranium are controlled by stringent safeguards agreements. These exports are approved under bilateral safeguards agreements. This means that the importing country must be a signatory to International Atomic Energy Agency safeguards arrangements and must also have signed an agreement with the Australian government to adhere to Australian safeguards obligations for exporting uranium. These safeguards agreements ensure that Australia’s uranium is used only for electricity generation and that it is not diverted to any military purposes. In 2005, Australia made the Additional Protocol a pre-condition for the supply of uranium to non-nuclear weapon states. Australia aims to bring this policy into force as soon as possible and the Government is consulting with both suppliers and customers on timing.
The control over exports reflects both national interest considerations and international obligations. Australia’s uranium policy recognises the needs of customer countries and the nuclear industry for predictability about the way Australia exercises nuclear non-proliferation conditions governing uranium supply.
URANIUM STOCKS
For reasons of confidentiality, information on producer stocks is not available.
URANIUM PRICES
Uranium prices
Average annual export prices for Australian uranium have been:
Average annual export price (AUD/kgU)
1994 53.06 1995 55.74 1996 53.96 1997 48.93 1998 57.28 1999 54.32 2000 57.37 2001 59.07 2002 56.10 2003 48.83 2004 50.25

Australia
101
Uranium Exploration and Development Expenditures and Drilling Effort – Domestic
Expenses in million AUD 2002 2003 2004 2005 (expected)
Industry exploration expenditures 5.34 6.38 13.96 28.00
Government exploration expenditures 0 0 0 0
Industry development expenditures NA NA NA NA
Government development expenditures 0 0 0 0
Total expenditures NA NA NA NA
Industry exploration drilling (metres) 24 057 33 871 109 244 110 000
Number of industry exploration holes drilled NA NA NA NA
Government exploration drilling (metres) 0 0 0 0
Number of government exploration holes drilled 0 0 0 0
Industry development drilling (metres) NA NA NA NA
Number of development exploration holes drilled NA NA NA NA
Government development drilling (metres) 0 0 0 0
Number of development exploration holes drilled 0 0 0 0
Subtotal exploration drilling (metres) 24 057 33 871 109 244 110 000
Subtotal exploration holes NA NA NA NA
Subtotal development drilling (metres) NA NA NA NA
Subtotal development holes NA NA NA NA
Total drilling (metres) 24 057 33 871 109 244 110 000
Total number of holes NA NA NA NA
Uranium Exploration and Development Expenditures – Abroad
Expenses in million AUD 2002 2003 2004 2005 (expected)
Industry exploration expenditures NA NA 2.2 >3
Government exploration expenditures 0 0 0 0
Industry development expenditures NA NA NA NA
Government development expenditures 0 0 0 0
Total expenditures NA NA NA NA

Australia
102
Reasonably Assured Resources
(tonnes U)
Production method <USD 40/kgU <USD 80/kgU <USD 130/kgU Recovery factor (%)
Underground mining 72 000 72 000 85 000 80 Open-pit mining 114 000 128 000 142 000 89 In situ leaching 15 000 15 000 21 000 65 Heap leaching 0 0 0 NA In-place leaching (stope/block leaching)
0 0 0 NA
Co-product and by-product
499 000 499 000 499 000 61 for resources
Unspecified 0 0 0 NA Total 701 000 714 000 747 000
Reasonably Assured Resources by Deposit Type (tonnes U)
Deposit type <USD 40/kgU <USD 80/kgU <USD 130/kgU
Unconformity-related 146 000 147 000 149 000 Sandstone 15 000 24 000 30 000 Hematite breccia complex 499 000 499 000 502 000 Quartz-pebble conglomerate 0 0 0 Vein 0 0 0 Intrusive 0 0 100 Volcanic and caldera-related 0 3 000 6 000 Metasomatite 0 0 13 000 Other 41 000 41 000 47 000 Total 701 000 714 000 747 000
Inferred Resources (tonnes U)
Production method <USD 40/kgU <USD 80/kgU <USD 130/kgU Recovery factor (%)
Underground mining 51 000 57 000 67 000 80 Open-pit mining 16 000 25 000 46 000 89 In situ leaching 5 000 7 000 12 000 65 Heap leaching 0 0 0 NA In-place leaching (stope/block leaching)
0 0 0 NA
Co-product and by-product
271 000 271 000 271 000 61 for resources
Unspecified 0 0 0 NA Total 343 000 360 000 396 000

Australia
103
Inferred Resources by Deposit Type (tonnes U)
Deposit type <USD 40/kgU <USD 80/kgU <USD 130/kgU
Unconformity-related 67 000 71 000 72 000
Sandstone 5 000 11 000 23 000
Hematite breccia complex 271 000 276 000 276 000
Quartz-pebble conglomerate 0 0 0
Vein 0 0 0
Intrusive 0 0 3 000
Volcanic and caldera-related 0 1 000 1 000
Metasomatite 0 0 10 000
Other 200 200 9 000
Total 343 000 360 000 396 000
Historical Uranium Production (tonnes U in concentrate)
Production method Total
through end of 2001
2002 2003 2004 Total
through end of 2004
2005 (expected)
Open-pit mining1 75 208 3 791 4 295 4 357 87 651 4 360
Underground mining1 838 0 0 0 838 0
In situ leaching 463 632 584 920 2 599 920
Heap leaching NA NA NA NA NA NA
In-place leaching* NA NA NA NA NA NA
Co-product/by-product 22 369 2 431 2 694 3 706 31 200 3 700
U recovered from phosphates
NA NA NA NA NA NA
Other methods** NA NA NA NA NA NA
Total 98 878 6 854 7 573 8 982 122 288 8 980
(1) Pre-2002 totals may include uranium recovered by heap and in-place leaching. * Also known as stope leaching or block leaching. ** Includes mine water treatment and environmental restoration.

Australia
104
Ownership of Uranium Production in 2004
Domestic Foreign
Government Private Government Private Totals
[tU] [%] [tU] [%] [tU] [%] [tU] [%] [tU] [%]
0 0 3 952 44.0 327 3.6 4 703 52.4 8 982 100
Uranium Industry Employment at Existing Production Centres (person-years)
2002 2003 2004 2005 (expected)
Total employment related to existing production centres
502 655 743 810
Employment directly related to uranium production
NA NA NA NA
Short-term Production Capability (tonnes U/year)
2005 2010
A-I B-I A-II B-II A-I B-I A-II B-II
9 900 9 900 9 900 9 900 10 200 19 000 10 200 19 000
2015 2020 2025
A-I B-I A-II B-II A-I B-I A-II B-II A-I B-I A-II B-II
5 500 17 700 5 500 17 700 5 500 17 700 5 500 17 700 5 500 17 700 5 500 17 700
Total Uranium Stocks (tonnes natural U-equivalent)
Holder
Natural uranium stocks in
concentrates
Enriched uranium
stocks
Depleted uranium
stocks
Reprocessed uranium
stocks Total
Government 0 0 0 0 0
Producer NA 0 0 0 NA
Utility 0 0 0 0 0
Total NA 0 0 0 NA

Australia/Belgium
105
• Belgium •
URANIUM EXPLORATION
Historical review
Until 1977, only a few uranium occurrences were known in Belgium. These were mainly connected with black shales of the Upper Visean-Namurian, in the Dinant Basin, and of the Revinian, in the Stavelot Mountains, and also with breccia, in the Visean and Frasnian chalk, in the Visé Mountains.

Belgium
106
From 1977 to 1979, there was renewed interest in uranium exploration, leading to a study of the
uranium occurrences in the Visé Mountains and a study on the uranium content of the phosphates in Cretaceous formations, in the Mons Basin.
From 1979 to 1981, the European Communities and the Ministry of Economic Affairs financed a general reconnaissance survey for uranium in the areas of Paleozoic formations in Belgium. The Geological Service co-ordinated three types of exploration, covering an area of approximately 11 000 km2: car-borne radiometric survey, geochemical survey on alluvial deposits and hydrochemical survey. The Belgian universities of Mons, Louvain (UCL), and Brussels (ULB), respectively, were entrusted with the work. The general report was published in 1983.
From 1981 to 1985, this research was conducted chiefly at the Mons Laboratory, with the aim of studying the geological environment of the main anomalies discovered in the course of general exploration (Visean-Namurian and Lower Devonian).
From 1985 to 1988, an exploration programme financed by the Underground Resources Service (Walloon Region) led to the discovery of anomalies and deposits (over 1% uranium equivalent at certain points) in schistose sandstone formations of the Lower Devonian and surface formations in Upper Ardenne.
Strategic and tactical uranium exploration was pursued in the lower Devonian, in the Belgian Ardenne and on the basis of isolated anomalies discovered during the preliminary car-borne prospecting. This project was jointly financed by the EEC and the Geological Service of Belgium, during 1979-1982. Different geochemical and geophysical methods were used (radon in spring water, ground radon survey, gamma spectrometry) for indications discovered during the second phase, as well as trenching and shallow drilling (about 10m). Deeper core sampling and drill hole-logging surveys were conducted on a regional basis by the Geological Service.
Currently, it is estimated that none of the areas investigated are of economic interest. Although the occurrences are numerous and varied, the uranium content of each indication showing more than 100 ppm amounts to less than one tonne.
The uranium content of phosphates in the Mons Basin has also been evaluated, and a new estimate of the P2O5 resources in the basin has put unconventional uranium resources at approximately 40 000 tU. This includes approximately 2 000 tU of resources in areas suitable for phosphate mining although the contents are below 10% P2O5 and 100 ppm uranium equivalent.
Recent and ongoing uranium exploration and mine development activities
No field exploration has been carried out since the 1980s.
URANIUM RESOURCES
Belgium has no known identified resources (RAR and Inferred). No undiscovered resources (Prognosticated and SR) have been identified.

Belgium
107
URANIUM PRODUCTION
Historical review
In 1998, Prayon-Rupel Technologies decided to stop recovering uranium from imported phosphates. Subsequently the facility has been decontaminated and dismantled.
Status of production capability
There is no production centre in Belgium and none is foreseen in the 2005-2025 period.
Secondary sources of uranium
MOX Production in Belgium
Belgonucléaire at the Dessel nuclear site, in the Mol region, manufactures plutonium/uranium mixed oxide (MOX) pellets and fuel rods at the PO plant. It has clients in Belgium, in other European countries and in Japan. The capacity of the Dessel plant is about 40t/year. Belgonucléaire is owned by Tractebel, a Belgian electrical utility and CEN/SCK, a Belgian nuclear research centre. Belgo-nucléaire’s production of MOX started in the early 1960s.
After production, the Mox fuel rods are transported to the nearby Franco-Belge de Fabrication de Combustible (FBFC) International assembly plant, where the fuel rods form fuel assemblies. With a quantity of 4.78 tonnes of separated plutonium, 144 MOX elements can be manufactured.
In 1984, Belgonucléaire and COGEMA formed COMMOX to function as the commercial agent for MOX fuel produced by the two companies.
URANIUM REQUIREMENTS
The installed nuclear generating capacity in Belgium is unchanged at 5 802 MWe net. There was no change in uranium requirements as well as no change in the supply and procurement strategy.
NATIONAL POLICIES RELATING TO URANIUM
None reported. Information on uranium stocks and on uranium prices is not available for reasons of confidentiality.

Belgium
108
Historical Uranium Production (tonnes U in concentrate)
Production method Total
through end of 2001
2002 2003 2004 Total
through end of 2004
2005 (expected)
Open-pit mining1 0 0 0 0 0 0
Underground mining1 0 0 0 0 0 0
In situ leaching 0 0 0 0 0 0
Heap leaching 0 0 0 0 0 0
In-place leaching* 0 0 0 0 0 0
Co-product/by-product 0 0 0 0 0 0
U recovered from phosphates
686 0 0 0 686 0
Other methods** 0 0 0 0 0 0
Total 686 0 0 0 686 0
(1) Pre-2002 totals may include uranium recovered by heap and in-place leaching. * Also known as stope leaching or block leaching. ** Includes mine water treatment and environmental restoration.
Uranium Industry Employment at Existing Production Centres (person-years)
2002 2003 2004 2005 (expected)
Total employment related to existing production centres
4 0 0 0
Employment directly related to uranium production
Mixed Oxide Fuel Production and Use (tonnes of natural U equivalent)
Mixed-oxide (MOX) fuels
Total through end
of 2001 2002 2003 2004
Total through end
of 2004
2005 (expected)
Production 437.5 0 0 85.8 0 0
Usage 372.4 32.5 32.6 28.6 0 28.6
Number of commercial reactors using MOX 1 1 1 1

Belgium
109
Reprocessed Uranium Use (tonnes of natural U equivalent)
Reprocessed uranium
Total through end
of 2001 2002 2003 2004
Total through end
of 2004
2005 (expected)
Production 0 0 0 0 0 0
Usage 467 41 0 0 508* 0
* From 1993 to 2004.
Re-enriched Tails Production and Use (tonnes of natural U equivalent)
Re-enriched tails Total
through end of 2001
2002 2003 2004 Total
through end of 2004
2005 (expected)
Production 0 0 0 0 0 0
Usage* 115 115 115 0 345 0
* Purchased for future re-enrichment.
Net Nuclear Electricity Generation
2003 2004
Nuclear electricity generated (TWh net) 44.9 44.9*
* Provisional data.
Installed Nuclear Generating Capacity to 2025 (MWe net)
2010 2015 2020 2025 2004 2005
Low High Low High Low High Low High
5 802 5 802 5 802 5 802 5 802 5 802 4 014 5 802 2 000 5 802
Annual Reactor-Related Uranium Requirements to 2025 (excluding MOX) (tonnes U)
2010 2015 2020 2025 2004 2005
Low High Low High Low High Low High
1 125 1 455 1 075 1 075 750 1 075 750 1 075 375 1 075

Belgium/Brazil
110
Total Uranium Stocks (tonnes natural U-equivalent)
Holder
Natural uranium stocks in
concentrates
Enriched uranium
stocks
Depleted uranium
stocks
Reprocessed uranium
stocks Total
Government 0 0 0 0 0
Producer 0 0 0 0 0
Utility NA NA NA NA NA
Total NA NA NA NA NA
• Brazil •
URANIUM EXPLORATION
Historical review
Systematic prospecting for radioactive minerals began in 1952 by the Brazilian National Research Council. These efforts led to the discovery of the first uranium occurrences at Pocos de Caldas (State of Minas Gerais) and Jacobina (State of Bahia). In 1955, a technical cooperation agreement was signed with the United States Government to assess the Brazilian uranium potential. After the creation of the National Nuclear Energy Commission (CNEN) a mineral exploration department was organised with the support of the French CEA in 1962.
In the 1970s, CNEN exploration for radioactive minerals increased due to the availability of more financial resources. Additional incentive for exploration was provided in 1974, when the Government opened NUCLEBRAS, an organisation with the exclusive purpose of uranium exploration and production. One of the early achievements of the Government Organisations was the discovery and development of the Osamu Utsumi deposit in the Pocos de Caldas plateau.
In late 1975, Brazil and Germany signed a cooperation agreement for the peaceful use of nuclear energy. It was the beginning of an ambitious nuclear development programme that required an increase of NUCLEBRAS exploration activities. This led to the discovery of eight areas hosting uranium resources including the Pocos de Caldas plateau, Figueira, the Quadrilátero Ferrífero, Amorinopolis, Rio Preto/Campos Belos, Itataia, Lagoa Real and Espinharas (discovered and evaluated by NUCLAM, a Brazilian-German joint-venture).
In 1991, INB uranium exploration activities came to a halt according to the Brazilian nuclear development programme reorganisation of 1988.

Brazil
111
Recent and ongoing uranium exploration and mine development activities
In August 2004, INB carried out a drilling programme in ore bodies located at Lagoa Real Uranium Province, in Bahia State. Because of the distance between old bore holes, the purpose was to better define the thickness and obtain more information about the grade in some mineralised levels at “Cachoeira” and “Engenho” uranium deposits.
The results confirmed the continuity of the mineralised bodies as well as the grades, previously interpreted.
About 8 000 metres of drilling was carried out, and approximately USD 500 000 expended.
URANIUM RESOURCES
Brazil’s conventional known and undiscovered uranium resources are hosted in the following deposits:
� Poços de Caldas (Osamu Utsumi Mine) with the orebodies A, B, E and Agostinho (collapse breccia pipe-type).
� Figueira and Amorinópolis (sandstone).
� Itataia, including the adjoining deposits of Alcantil and Serrotes Baixos (metasomatic).
� Lagoa Real, Espinharas and Campos Belos (metasomatic-albititic).
� Others including the Quadrilátero Ferrífero with the Gandarela and Serra des Gaivotas deposits (quartz pebble conglomerate).
Identified resources (RAR & Inferred)
According to (1) Process Performance achieved during these last four years and taking into account (2) Geological Model, (3) Exploration Methodology and, (4) Estimation Methodology carried out, INB decided to change Lagoa Real Uranium Province cost category. Therefore, all resources estimated since then, will change to Identified Resources (RAR), as <USD 40/kgU cost category.
With the same purpose after optimisation of the mining project and chemical process, the cost category of Itataia Project was also changed according to presented on RAR Table.
Respecting Brazilian regulation, some private companies in Brazil can produce uranium as by-product. The Pitinga Deposit located at Amazonas State, produces tantalite-columbite concentrates. The uranium mineralization is associated, and it is possible to recover uranium as concentrate product. The quantities related to the different stages of the processing plant, were distributed in three categories according to the production cost (<USD 40, <USD 80 and <USD 130/kgU), and were included in Reasonably Assured Resources Table.

Brazil
112
Undiscovered resources (Prognosticated & SR)
Considering the exploration activities developed on the promising area called Rio Cristalino (south of Para State), it is possible to prognosticate approximately 180 000 tU as in situ resources.
URANIUM PRODUCTION
The Poços de Caldas uranium facility was closed in 1997, and a decommissioning programme started in 1998. Poços de Caldas facility is still used for non-nuclear products, mainly for the development of chemical treatment of monazite in order to produce rare earth concentrates.
Lagoa Real production facilities, today called the Caetité Unit, started operation in mid-2000, beginning at a 100 tonnes per annum rate and 340 tU are planned to be producing in 2005.
Feasibility studies for Lagoa Real Unit expansion have been carried out. The expansion will increase annual production capacity to 670 tU, which will double the current production levels. The cost expansion is estimated to be USD 10 million. During this year, INB is doing a major effort on the development of the Itataia deposits, located at Ceará State. Since uranium will be a by-product of phosphate, the feasibility of the project depends mainly on the phosphate market and in the success of obtaining private partnership.
These agreements are in the final phase, and the start of construction is scheduled to begin in 2006. Planned capacity is 680 tU and will be destined to the international market.
At the same time Brazilian government will adapt the legislation concerning to uranium exportation.
After the optimisation of the mining and process, the Itataia uranium resources category will change too, as presented in this questionnaire.
Ownership structure of the uranium industry
The Brazilian uranium industry is 100% government-owned through the state-owned company Indústrias Nucleares do Brasil – INB.
Employment in the uranium industry
See Table – Uranium Industry Employment at Existing Production Centres.
Future production centres
See Table – Short-Term Production Capability.

Brazil
113
Uranium Production Centre Technical Details
(as of 1 January 2005)
Centre #1 Centre #2
Name of production centre Caetité Itataia Production centre classification existing committed Start-up date 1999 2007 Source of ore: � Deposit name Cachoeira Santa Quitéria � Deposit type metasomatite metamorphic/phosphorite � Reserves (tU) 12 700 tU 76 100 tU � Grade (% U) 0.3 0.08 Mining operation: � Type OP OP � Size (t ore/day) 1 000 4 000 � Average mining recovery (%) 90 90 Processing plant (acid/alkaline): � Type (IX/SX/AL) HL/SX AL/SX � Size (t ore/day)
for ISL (L/day or L/h)
� Average process recovery (%) 80 75 Nominal production capacity (tU/year) 340 680 Plans for expansion NA NA Other remarks Start-up OP Engenho
Deposit (2006) Co-product with phosphoric
acid
NA Not available.
Secondary sources of uranium
None reported.
ENVIRONMENTAL ACTIVITIES AND SOCIO-CULTURAL ISSUES
Government policies and regulations
Government policies and regulations are established by Comissão Nacional de Energia Nuclear – CNEN (Brazilian Nuclear Energy Commission), and include a standard Diretrizes Básicas de Radioproteção (Radioprotection Basic Directives) – NE-3.01, and two specific standards on licensing of mines and mills of uranium and thorium ores, named NE-1.13 – Licenciamento de Minas e Usinas de Beneficiamento de Minérios de Uranio ou Tório, and on tailings ponds decommissioning: Segurança de Sistema de Barragem de Rejeito Contendo Radionuclídeos (Safety of Radionuclide Bearing Tailing Pond Systems) – NE-1.10, and a standard for conventional mining and milling industry with U and Th associated (NORM and TENORM), Requisitos de Segurança e Proteção Radiológica para Instalações Mínero-Industriais – NN-4.01. In the absence of specific norm, ICRP and IAEA recommendations are used.

Brazil
114
The closure of Poços de Caldas Unit in 1997 brought to an end the exploitation of a low-grade ore
deposit, which produced vast amounts of waste rock. The closure, remediation and restoration actions are still under development. Several studies are being carried out to characterise geochemical and hydrochemical aspects of the effects that waste rock and tailings dam may have had on the environment and to establish mitigation measures if necessary. The overall decommissioning plan for the installation should mainly consider the acid drainage aspects. A bidding process for the remediation/restoration plan was carried out this year.
URANIUM REQUIREMENTS
Brazil’s present uranium requirements for the Angra I nuclear power plant, a 630 MWe PWR, are about 140 tU/year. The Angra II nuclear power plant, a 1 245 MWe PWR, requires 300 tU/year. In addition, start-up of Angra III (similar to the Angra II nuclear power plant) operation is expected around 2010.
NATIONAL POLICIES RELATING TO URANIUM
INB is planning to increase its uranium production in order to supply internal uranium requirements. After the implementation of the Caetité/Lagoa Real centre, INB focus is turning to the Itataia deposit in Ceará State. Although uranium extraction is considered to be in the low-cost category, project viability is dependent on the production of phosphoric acid. These activities are thus dependent on setting up partnership with a private enterprise interested in this product. These negotiations are expected to be concluded during the year of 2005.
There is a co-operation agreement between INB and a Brazilian mining industry to process concentrates of tantalite/columbite minerals, and to produce uranium concentrate as a by-product. The uranium resources associated with tantalite/columbite concentrate are now included in the resources reported for the Red Book.
Brazil, through INB, is interested in joint venture projects with national or international partners in order to participate in the uranium global market. Some international uranium producers are studying data about the deposits at Rio Cristalino (State of Pará), and other areas, in order to initiate a commercial agreement.
URANIUM STOCKS
None reported.
URANIUM PRICES
None reported.
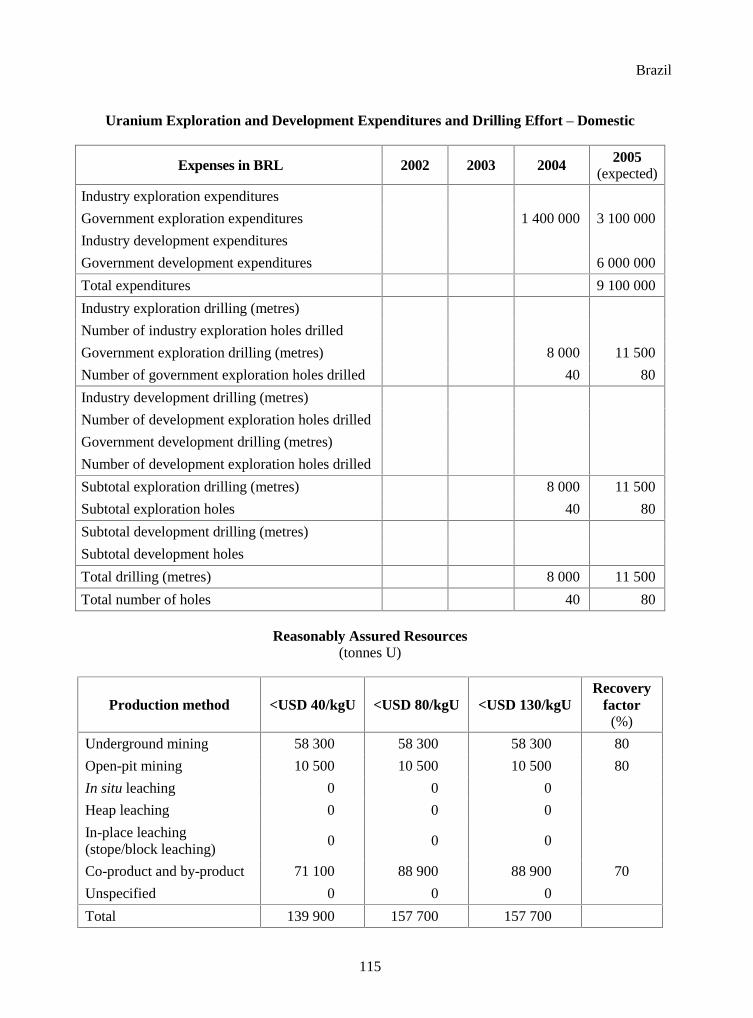
Brazil
115
Uranium Exploration and Development Expenditures and Drilling Effort – Domestic
Expenses in BRL 2002 2003 2004 2005 (expected)
Industry exploration expenditures
Government exploration expenditures 1 400 000 3 100 000
Industry development expenditures
Government development expenditures 6 000 000
Total expenditures 9 100 000
Industry exploration drilling (metres)
Number of industry exploration holes drilled
Government exploration drilling (metres) 8 000 11 500
Number of government exploration holes drilled 40 80
Industry development drilling (metres)
Number of development exploration holes drilled
Government development drilling (metres)
Number of development exploration holes drilled
Subtotal exploration drilling (metres) 8 000 11 500
Subtotal exploration holes 40 80
Subtotal development drilling (metres)
Subtotal development holes
Total drilling (metres) 8 000 11 500
Total number of holes 40 80
Reasonably Assured Resources (tonnes U)
Production method <USD 40/kgU <USD 80/kgU <USD 130/kgU Recovery
factor (%)
Underground mining 58 300 58 300 58 300 80
Open-pit mining 10 500 10 500 10 500 80
In situ leaching 0 0 0
Heap leaching 0 0 0
In-place leaching (stope/block leaching)
0 0 0
Co-product and by-product 71 100 88 900 88 900 70
Unspecified 0 0 0
Total 139 900 157 700 157 700

Brazil
116
Reasonably Assured Resources by Deposit Type
(tonnes U)
Deposit type <USD 40/kgU <USD 80/kgU <USD 130/kgU
Unconformity-related 0 0 0 Sandstone 0 0 0 Hematite breccia complex 0 0 0 Quartz-pebble conglomerate 0 0 0 Vein 0 0 0 Intrusive 0 0 0 Volcanic and caldera-related 0 0 0 Metasomatite 86 300 104 100 104 100 Other 53 600 53 600 53 600
Total 139 900 157 700 157 700
Inferred Resources (tonnes U)
Production method <USD 40/kgU <USD 80/kgU <USD 130/kgU Recovery
factor (%)
Underground mining 0 0 0 Open-pit mining 0 2 400 2 400 70 In situ leaching 0 0 0 Heap leaching 0 0 0 In-place leaching (stope/block leaching)
0 0 0
Co-product and by-product 0 31 200 78 600 70 Unspecified 0 40 000 40 000 70
Total 0 73 600 121 000 70
Inferred Resources by Deposit Type (tonnes U)
Deposit type <USD 40/kgU <USD 80/kgU <USD 130/kgU
Unconformity-related 0 0 0 Sandstone 0 7 600 7 600 Hematite breccia complex 0 0 0 Quartz-pebble conglomerate 0 8 900 8 900 Vein 0 600 600 Intrusive 0 0 0 Volcanic and caldera-related 0 0 0 Metasomatite 0 6 000 53 400 Other 0 50 500 50 500
Total 0 73 600 121 000

Brazil
117
Prognosticated Resources (tonnes U)
Cost ranges
<USD 80/kgU <USD 130/kgU
300 000 300 000
Speculative Resources (tonnes U)
Cost ranges
<USD 130/kgU Unassigned
NA 500 000
Historical Uranium Production (tonnes U in concentrate)
Production method Total
through end of 2001
2002 2003 2004 Total
through end of 2004
2005 (expected)
Open-pit mining1 1 097 0 0 0 1 097 0
Underground mining1 0 0 0 0 0 0
In situ leaching 0 0 0 0 0 0
Heap leaching 0 272 230 300 802 340
In-place leaching* 0 0 0 0 0 0
Co-product/by-product 0 0 0 0 0 0
U recovered from phosphates
0 0 0 0 0 0
Other methods** 0 0 0 0 0 0
Total 1 097 272 230 300 1 899 340
(1) Pre-2002 totals may include uranium recovered by heap and in-place leaching. * Also known as stope leaching or block leaching. ** Includes mine water treatment and environmental restoration.
Ownership of Uranium Production in 2004
Domestic Foreign
Government Private Government Private Totals
[tU] [%] [tU] [%] [tU] [%] [tU] [%] [tU] [%]
300 100 0 0 0 0 0 300 100

Brazil
118
Uranium Industry Employment at Existing Production Centres
(person-years)
2002 2003 2004 2005 (expected)
Total employment related to existing production centres
NA NA NA NA
Employment directly related to uranium production
128 140 140 140
Short-term Production Capability (tonnes U/year)
2005 2010
A-I B-I A-II B-II A-I B-I A-II B-II
340 340 340 340 1 100 1 100 1 100 1 100
2015 2020 2025
A-I B-I A-II B-II A-I B-I A-II B-II A-I B-I A-II B-II
1 100 1 100 1 100 1 100 NA NA NA NA NA NA NA NA
Net Nuclear Electricity Generation
2003 2004
Nuclear electricity generated (TWh net) 13.336 11.552
Installed Nuclear Generating Capacity to 2025 (MWe net)
2010 2015 2020 2025 2004 2005
Low High Low High Low High Low High
1 875 1 875 1 875 3 120 1 875 3 120 NA NA NA NA
Annual Reactor-related Uranium Requirements to 2025 (excluding MOX) (tonnes U)
2010 2015 2020 2025 2004 2005
Low High Low High Low High Low High
450 450 450 810 450 810 NA NA NA NA

Canada
119
• Canada •
URANIUM EXPLORATION
Historical review
Uranium exploration in Canada began in 1942, with the focus of activity traceable through several distinct phases from Great Bear Lake, Northwest Territories, to Beaverlodge and other localities in northern Saskatchewan, to Blind River/Elliot Lake, Ontario, and back to the Athabasca Basin of northern Saskatchewan in the late 1960s. These latter two areas have been Canada’s most prolific, supporting all domestic uranium production until the closure of the Stanleigh mine at the end of June 1996. Following this closure, which brought to an end over 40 years of uranium production in the Elliot Lake area of Ontario, Saskatchewan is Canada’s sole producer of uranium.
Recent and ongoing uranium exploration and mine development activities
As in previous years, uranium exploration remained focused on areas favourable for the occurrence of deposits associated with Proterozoic unconformities in the Athabasca Basin of Saskatchewan, and to a lesser extent, similar geologic settings in the Thelon and Hornby Bay Basins of Nunavut and the Northwest Territories. However, significant uranium spot price increases over the past two years have created a surge in exploration activity in other areas of the country, such as Quebec, Newfoundland and Labrador, Alberta, Yukon, Ontario and Manitoba. Surface drilling, as well as geophysical and geochemical surveys of extensions of mineralised zones and other promising areas in the Athabasca Basin continue to be the principal exploration activities.
In 2004, overall Canadian uranium exploration and development expenditures amounted to CAD 44 million, while uranium exploration and surface development drilling totalled 119 000 m, compared to the 2003 total of 74 000 m. Less than half of the overall exploration and development expenditures in 2004 can be attributed to advanced underground exploration, deposit appraisal activities, and care and maintenance expenditures associated with projects awaiting production approvals. Basic “grass roots” uranium exploration reached CAD 31 million (26 million in Saskatchewan alone) in 2004, more than doubling expenditures in 2003 of CAD 13 million.
Over 80% of the combined exploration and surface development drilling in 2003 and 2004 took place in Saskatchewan. A significant discovery at the Millenium deposit in the southeastern Athabasca Basin is the first tangible result of the heightened exploration. Promising drilling results have also been reported from Shea Creek and Maybelle River, both in the western Atahabasca Basin area, the latter in the province of Alberta. In 2005, total combined uranium drilling is expected to increase to some 150 000 m.
The top three operators, accounting for a significant proportion of the CAD 44 million expended in 2004 were Cameco Corporation, COGEMA Resources Inc. (CRI) and UEX Corporation. Expenditures by AREVA subsidiary CRI include those of Urangesellschaft Canada Limited.

Canada
120
URANIUM RESOURCES
Identified resources (RAR & Inferred)
As of 1 January 2005, Canada’s total identified uranium resources (i.e., recoverable at a cost of <USD 80/kgU) amounted to about 444 000 tU, compared to 432 000 tU as of 1 January 2004. This upward adjustment of some 3% from the 2004 total is the result of recent discoveries and deposit appraisals exceeding mining losses. As of 1 January 2005, uranium resources recoverable at a cost of <USD 40/kgU were estimated to be 371 800 tU, down slightly from the 2004 value of 377 000 tU.
The bulk of Canada’s identified uranium resources occur in Proterozoic unconformity-related deposits of the Athabasca Basin, Saskatchewan, and the Thelon Basin of Nunavut. These deposits host their mineralization near the unconformity boundary in either monometallic or polymetallic mineral assemblages. Pitchblende prevails in the monometallic deposits, whereas uranium-nickel-cobalt assemblages prevail in the polymetallic assemblages. The average grade varies from 1 to over 15% U. None of the uranium resources referred to or quantified herein are a co-product or by-product output of any other mineral of economic importance. Mining loses (~20%) and ore processing losses (~3%) were used to calculate known conventional resources.
Hundred per cent of the Reasonably Assured Resources and Inferred Resources recoverable at <USD 40/kgU are in existing or committed production centres, and 84% of RAR and Inferred resources recoverable at <USD 80/kgU are in existing or committed production centres.
When the Cluff Lake production centre closed at the end of 2002, some 1 500 tU were dropped from the total Canadian resource base, following the long established practice of removing resources from the Canadian total when mining operations close and decommissioning is initiated.
Undiscovered resources (Prognosticated & SR)
Prognosticated and Speculated Resources have not been a part of recent resource assessments; hence there are no changes to report in these categories since 1 January 2001.
URANIUM PRODUCTION
Historical review
Canada’s uranium industry began in the Northern Territories with the 1930 discovery of the Port radium pitchblende deposit. Exploited from 1933 to 1940, the deposit was re-opened in 1942 in response to demand for uranium for British and United States defence programmes. A ban on private exploration and development was lifted in 1947, and by the late 1950s some twenty uranium production centres had started up in five producing districts. Production peaked in 1959 at 12 200 tU. No further defence contracts were signed after 1959 and production began to decline. Despite government stockpiling programmes, output fell rapidly to less than 3 000 tU in 1966, by which time

Canada
121
only four producers remained. While the first commercial sales to electric utilities were signed in 1966, it was not until the mid-1970s that prices and demand had increased sufficiently to promote expansions in exploration and development activity. By the late 1970s, with the industry firmly re-established, several new facilities were under development. Annual output grew steadily throughout the 1980s, as Canada’s focus of uranium production shifted increasingly from east to west. In the early 1990s, poor markets and low prices led to the closure of three of four Ontario production centres. The last remaining Ontario uranium centre closed in mid-1996.
Status of production capability
Overview
Since the last Elliot Lake production facility closed in 1996, all active uranium production centres are located in northern Saskatchewan. Current Canadian uranium production remains below full production capability. In 2004, production reached a total of 11 597 tU, as increased McArthur River production exceeded the decline caused by the closure of Cluff Lake and reduced Rabbit Lake production. In 2005, production can be expected to remain steady.
Saskatchewan
Cameco Corporation is the operator of the McArthur River mine, a Cameco (70%), CRI (30%) joint venture. Production at this, the world’s largest uranium mine, reached 5 751 tU and 7 035 tU in 2003 and 2004, respectively. After raise bore mining of the high-grade ore behind a freeze curtain created to control groundwater inflow, high-grade ore slurry is produced with underground crushing, grinding and mixing circuits. The slurry is then pumped to automated stations on the surface that load specially-designed containers that are trucked 80 km to Key Lake, where all McArthur River ore is milled. The comparatively low production in 2003 is a result of a breach in a development drift that led to a three month closure of the mine.
The Key Lake mill is a Cameco (83%) and CRI (17%) joint venture operated by Cameco. Although mining was completed in 1997, the mill maintained its standing as the world’s largest uranium production centre by producing 5 830 tU and 7 200 tU in 2003 and 2004, respectively. These totals represent a combination of high-grade McArthur River ore slurry and stockpiled, mineralised Key Lake special waste rock that is blended to produce a mill feed grade of about 3.4% U. A proposal to increase production at McArthur River and Key Lake by some 18% annually (from 7 200 tU/yr to 8 500 tU/yr) is currently being reviewed by the federal nuclear regulator, the Canadian Nuclear Safety Commission (CNSC).
The McClean Lake production centre, operated by CRI, is a joint venture between CRI (70%), Denison Mines Ltd. (22.5%), and OURD (Canada) Co. Ltd., a subsidiary of Overseas Uranium Resources Development Corporation of Japan (7.5%). Production in 2003 and 2004 amounted to 2 318 tU and 2 310 tU, respectively. On 19 May 2005, the CNSC renewed the facility’s operating license for four years, with amendments that allow for modifications to be made to the mill to construct facilities to receive and process ore from the Cigar Lake mine. The mill is currently fed by stockpiled Sue C ore, and regulatory approval is being sought to begin open-pit mining of on-site deposits. Mining began in July 2005 at Sue A and could begin in late 2005 at Sue E, subject to the receipt of regulatory approvals. Test mining of small deposits on the McClean Lake property using jet-boring mining techniques from the surface has also been initiated.

Canada
122
Uranium Production Centre Technical Details (as of 1 January 2005)
Centre # 1 Centre # 2 Centre # 3 Centre # 4 Centre # 5
Name of production centre
McArthur/ Key Lake
McClean Lake Rabbit Lake Cigar Lake Midwest
Production centre classification
existing existing existing committed planned
Start-up date 1999/1983 1999 1975 2007 2010
Source of ore: � Deposit name P2N et al. Sue A-C, Jeb,
McClean Eagle Point Cigar Lake Midwest
� Deposit type unconformity unconformity unconformity unconformity unconformity � Reserves (tU) 168 000 tU 12 655 tU 6 925 tU 89 000 tU 13 460 tU � Grade (% U) 21.2 1.4 1.0 17.8 3.7
Mining operation: � Type (OP/UG/ISL) UG OP-UG UG UG OP-UG � Size (t ore/day) NA NA NA NA NA � Average mining
recovery (%) NA NA NA NA NA
Processing plant (acid/alkaline):
� Type (IX/SX/AL) AL/SX AL/SX AL/SX McClean and Rabbit Lake
NA
� Size (t ore/day) for ISL (L/day or L/hour)
750 300 2 300 NA
� Average process recovery (%)
98 97 97 NA
Nominal production capacity (tU/year)
7 200 3 077 4 615 6 924 2 300 (est)
Plans for expansion relates to Cigar
Lake relates to
Cigar Lake
Other remarks
The Rabbit Lake production centre, wholly-owned and operated by Cameco, produced 2 280 tU and 2 087 tU in 2003 and 2004, respectively. The slight decline in 2004 production is the result of difficult mining conditions encountered that reduced mill feed. Surface and underground exploration led to the delineation of 2 300 tU of resources in 2004 that are expected to extend the life of the Rabbit Lake facility to 2007.
Underground and surface drilling at the Eagle Point mine continues in 2005. This underground mine is the only mine at Rabbit Lake that remains in production. Dams built that facilitated the open pit mining of the Collins Bay A, B and D zones are expected to be breached in 2005, connecting these zones once again with Wollaston Lake. Prior to breaching the dams, all waste rock collected during mining will be returned to the pits and covered with clean waste rock and/or till. Finally, native vegetation is to be planted on the re-established shoreline to restore the natural appearance and habitat.

Canada
123
The Cigar Lake mine is a Cameco (50.025%), CRI (37.1%), Idemitsu (7.875%) and TEPCO (5%) joint venture operated by Cameco. High-tech mining methods specifically adapted to the local geology have been developed through on-site test mining programmes. On 7 July 2004, the CNSC issued a license for the construction of specific surface facilities at Cigar Lake. On 20 December 2004, the CNSC issued a license for the construction of the remaining mining and support facilities at the site and on 21 December 2004, the Cigar Lake joint venture partners announced a decision to proceed immediately with construction of the mine. Production is currently anticipated to begin as early as 2007, with a three year period expected to ramp up to full production capacity of some 6 900 tU.
Ownership structure of the uranium industry
On 30 December 2004, ownership of the Midwest project was changed when the joint venture partners acquired the 20.7% share previously held by Redstone Resources. After the acquisition, the share of CRI has increased from 54.84 to 69.16%; the share of Denison Mines from 19.96 to 25.17%; and the share of OURD Canada Co. Ltd from 4.5 to 5.67%. Although firm development plans for Midwest have not been announced, mining of the deposit (13 460 tU with an average grade of 3.7% U) could begin as early as 2010, pending receipt of regulatory approvals.
Employment in the uranium industry
Direct employment in Canada’s uranium industry totalled 965 in 2003 and 985 in 2004 (1 754 in 2004 including head office and contract employees). Employment levels changed little in the last two years as losses resulting from the Cluff Lake closure and the temporary suspension of mining at McClean Lake were balanced by increases brought about by the resumption of operations at Rabbit Lake. Employment should increase in 2005 as mining is expected to resume at McClean Lake.
In 2003, the uranium mining industry in northern Saskatchewan signed the third, five-year Multi-Party Training Plan agreement. This CAD 10.5 million cooperative is a training-to-employment initiative that is cost-shared among the government of Saskatchewan, the government of Canada and Aboriginal agencies, training institutions and the northern mining industry. This initiative has helped lower the academic and skill-related barriers to employment that northerners have historically faced and has enabled them to secure employment in the mining sector.
Future production centres
The remaining uranium mining projects in Saskatchewan that have cleared the environmental review process and are either poised to enter into production or in the final stages of development leading to production will extend the lives of existing production centres. Cigar Lake ore will provide feed for the McClean Lake and Rabbit Lake mills beginning in 2007 and Midwest will provide additional feed for the McClean Lake mill, once development plans have been finalised and regulatory approvals have been obtained. Development at Kiggavik is unlikely to proceed in the foreseeable future owing to regulatory uncertainty in Nunavut.

Canada
124
Secondary sources of uranium
Canada reported that there was no production or use of mixed acid fuels nor any production or use of re-enriched tailings.
ENVIRONMENTAL ACTIVITIES AND SOCIO-CULTURAL ISSUES
Environmental assessments
On 4 June 2004, the Federal Court of Appeal unanimously overturned a September 2002 Federal Court of Canada decision to quash a 1999 McClean Lake operating license on the grounds that an environmental assessment (EA) under the Canadian Environmental Assessment Act (CEAA) had not been conducted prior to issuing a license. An EA of the McClean Lake project was conducted pursuant to the Environmental Assessment and Review Process Guidelines Order, prior to the date that the CEAA was brought into force. On 24 March 2005, the Supreme Court of Canada dismissed with costs an application to appeal the Federal Court of Appeal decision. The end of this legal challenge to the McClean Lake operating license significantly reduces uncertainties surrounding EA requirements at this and other uranium mines and mills in Canada.
Although the McClean Lake mill continues to be fed by stockpiled Sue C ore, a screening level EA pursuant to the CEAA of a proposal to open-pit mine the Sue A and Sue E deposits is nearing completion. Mining began in July 2005 at Sue A and could begin in late 2005 at Sue E, pending receipt of regulatory approvals.
A screening level EA of a proposal to send uranium-rich solution produced from Cigar Lake ore from McClean Lake to Rabbit Lake for further processing was initiated on 8 February 2005. The proposal includes minor modifications to the McClean Lake JEB mill required to load the uranium-rich solution for transport and modifications to the Rabbit Lake mill in order to receive the solution. The proposed project will also require a modification to the Rabbit Lake TMF pit crest, currently at the northern boundary of the facility, to provide sufficient capacity to effectively manage the processing-related waste associated with this proposal. The proposal includes the construction of a dedicated “restricted access” haul road between McClean Lake and Rabbit Lake to transport the solution in specially designed containers.
A proposal to increase production at McArthur River and Key Lake by some 18% annually (from 7 200 tU/yr to 8 500 tU/yr) is the subject of a screening level EA that was initiated on 7 January 2003. Increased production at McArthur River requires changes to manage additional waste rock, mineralised waste and minewater flow. At Key Lake, the means to address the increased rate of tailings and treated effluent resulting from this proposal will be considered in this assessment.
A proposal to construct and operate blending facilities to produce slightly enriched uranium at the Port Hope conversion plant is the subject of an ongoing screening level environmental assessment. The slightly enriched uranium is expected to form the basis of the new type of CANDU fuel under development.

Canada
125
A project description to increase annual production from 18 000 tU to 24 000 tU at the Blind
River refinery was submitted to the CNSC in 2005. A higher production limit will support Cameco’s commitment to supply 5 000 tU as U03 per year to Springfield Fuels Ltd.
On 29 August 2003, a screening environmental assessment of a proposal to dispose of potentially acid generating Cigar Lake waste rock in the Sue C open pit at McClean Lake concluded that the environmental effects of the project are not likely significant. Cigar Lake waste rock is to be deposited in the mined-out Sue C pit during two, two-year long haul campaigns (roughly 20 and 40 years into the Cigar Lake project life).
Regulatory activities
On 18 June 2004, the Saskatchewan Uranium Miner’s Cohort Study Group announced that it had cancelled plans to conduct a study of the health of present and future uranium miners because it would not be scientifically feasible to do so. With radon exposures now between 100 and 1 000 times lower than in past operations (i.e. prior to 1975), the Study Group concluded that any higher-than-normal rates of lung cancer from such low levels of exposure would be virtually impossible to measure.
In 2003 the CNSC and Saskatchewan Environment and Labour signed an administrative agreement for the regulation of health, safety and the environment at Saskatchewan uranium mines and mills. The intent is to harmonise regulatory inspections and reporting requirements to simplify compliance to both federal and provincial regulatory requirements. Since signing the agreement, efforts have focused on the development and implementation of a harmonised inspection programme that will eventually lead to the appointment of several provincial personnel as CNSC inspectors.
In 2004, the CNSC conducted an evaluation of the radiation exposure estimates made during the 2003 water inflow event at McArthur River and concluded that it is unlikely that there will be any negative effects on health of the workers as a result of the doses received during the event. The CNSC also determined that the event did not result in any significant impacts to the treatment facilities or to the environment. The Canadian Nuclear Workers Council also concluded that there were no adverse consequences to miners from radiation exposure during the 2003 flooding event.
Environmental management
The Cluff Lake facility and CRIs uranium exploration programme in Saskatchewan achieved ISO 14001 environmental management system certification in 2004. The McArthur River mine and the Key Lake mill, the McClean Lake mine and mill, as well as the Blind River refinery and Port Hope conversion plant, have already achieved this internationally recognised standard that outlines the key requirements that companies should comply with in order to operate in an environmentally responsible manner. Thus, the front end of the nuclear fuel cycle in Canada meets rigorous international standards.
Decommissioning
On 17 June 2005, the Government of Canada announced that it will cost-share with the Government of Saskatchewan the remediation of certain legacy uranium mining facilities in northern Saskatchewan (principally Gunnar and Lorado). Clean-up costs will be determined as a Memorandum of Agreement is developed between the two governments in the coming months. Although operated by the private sector from the 1950s until the early 1960s, the companies no longer exist. When the sites were closed, there was no regulatory framework in place to appropriately contain and treat the waste, which has led to environmental impacts on local soils and lakes.
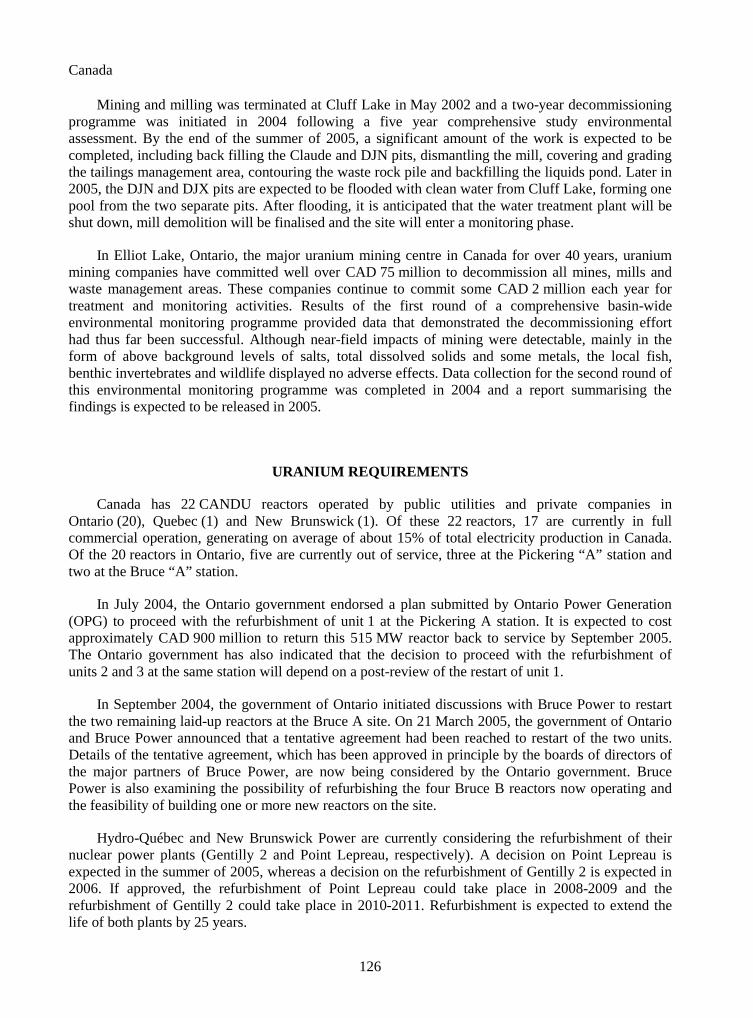
Canada
126
Mining and milling was terminated at Cluff Lake in May 2002 and a two-year decommissioning
programme was initiated in 2004 following a five year comprehensive study environmental assessment. By the end of the summer of 2005, a significant amount of the work is expected to be completed, including back filling the Claude and DJN pits, dismantling the mill, covering and grading the tailings management area, contouring the waste rock pile and backfilling the liquids pond. Later in 2005, the DJN and DJX pits are expected to be flooded with clean water from Cluff Lake, forming one pool from the two separate pits. After flooding, it is anticipated that the water treatment plant will be shut down, mill demolition will be finalised and the site will enter a monitoring phase.
In Elliot Lake, Ontario, the major uranium mining centre in Canada for over 40 years, uranium mining companies have committed well over CAD 75 million to decommission all mines, mills and waste management areas. These companies continue to commit some CAD 2 million each year for treatment and monitoring activities. Results of the first round of a comprehensive basin-wide environmental monitoring programme provided data that demonstrated the decommissioning effort had thus far been successful. Although near-field impacts of mining were detectable, mainly in the form of above background levels of salts, total dissolved solids and some metals, the local fish, benthic invertebrates and wildlife displayed no adverse effects. Data collection for the second round of this environmental monitoring programme was completed in 2004 and a report summarising the findings is expected to be released in 2005.
URANIUM REQUIREMENTS
Canada has 22 CANDU reactors operated by public utilities and private companies in Ontario (20), Quebec (1) and New Brunswick (1). Of these 22 reactors, 17 are currently in full commercial operation, generating on average of about 15% of total electricity production in Canada. Of the 20 reactors in Ontario, five are currently out of service, three at the Pickering “A” station and two at the Bruce “A” station.
In July 2004, the Ontario government endorsed a plan submitted by Ontario Power Generation (OPG) to proceed with the refurbishment of unit 1 at the Pickering A station. It is expected to cost approximately CAD 900 million to return this 515 MW reactor back to service by September 2005. The Ontario government has also indicated that the decision to proceed with the refurbishment of units 2 and 3 at the same station will depend on a post-review of the restart of unit 1.
In September 2004, the government of Ontario initiated discussions with Bruce Power to restart the two remaining laid-up reactors at the Bruce A site. On 21 March 2005, the government of Ontario and Bruce Power announced that a tentative agreement had been reached to restart of the two units. Details of the tentative agreement, which has been approved in principle by the boards of directors of the major partners of Bruce Power, are now being considered by the Ontario government. Bruce Power is also examining the possibility of refurbishing the four Bruce B reactors now operating and the feasibility of building one or more new reactors on the site.
Hydro-Québec and New Brunswick Power are currently considering the refurbishment of their nuclear power plants (Gentilly 2 and Point Lepreau, respectively). A decision on Point Lepreau is expected in the summer of 2005, whereas a decision on the refurbishment of Gentilly 2 is expected in 2006. If approved, the refurbishment of Point Lepreau could take place in 2008-2009 and the refurbishment of Gentilly 2 could take place in 2010-2011. Refurbishment is expected to extend the life of both plants by 25 years.

Canada
127
Supply and procurement strategy
Ontario Power Generation fills its uranium requirements through long-term contracts with a variety of suppliers, as well as periodic spot market purchases. Cameco provides all uranium and uranium conversion services, and contracts all required fuel fabrication services, in managing all of Bruce Power’s fuel procurement needs since becoming a partner in Bruce Power in 2001.
NATIONAL POLICIES RELATING TO URANIUM
An Act Respecting the Long-term Management of Nuclear Fuel Waste (NFW) entered into force on 15 November 2002. The NFW Act requires nuclear utilities to form a Nuclear Waste Management Organization (NWMO) and that, by 15 November 2005, the NWMO submit to the government of Canada a study setting out its proposed approaches for the long-term management of nuclear fuel waste along with its recommendation on which proposed approach should be adopted. The NFW Act requires the NWMO to include in the study approaches based on both storage (on-site or centralised) and disposal. In carrying out this study, the NWMO must consult with the general public on each of the proposed approaches.
The Government of Canada will select one of the proposed approaches for the long-term management of nuclear fuel waste and the NWMO will be required to implement the selected approach. Implementation will be funded through monies deposited in the trust funds set up by the utilities and AECL in accordance with requirements in the NFW.
URANIUM STOCKS
The Canadian government does not maintain any stocks of natural uranium and data for producers and utilities are not available. Since Canada has no enrichment or reprocessing facilities, there are no stocks of enriched or reprocessed material in Canada. Although Canadian reactors use natural uranium fuel, small amounts of enriched uranium are used for experimental purposes and in booster rods in certain CANDU reactors.
URANIUM PRICES
In 2002, Natural Resources Canada suspended the publication of the Average Price of Deliveries under Export Contracts for uranium.

Canada
128
Uranium Exploration and Development Expenditures and Drilling Effort – Domestic
Expenses in million CAD 2002 2003 2004 2005 (expected)
Industry exploration expenditures 15 13 31 76
Government exploration expenditures 0 0 0 0
Industry development expenditures 20 23 13 5
Government development expenditures 0 0 0 0
Total expenditures 35 36 44 81
Industry exploration drilling (metres) 78 000 74 000 117 800 150 000
Number of industry exploration holes drilled NA NA NA NA
Government exploration drilling (metres) 0 0 0 0
Number of government exploration holes drilled 0 0 0 0
Industry development drilling (metres) 0 0 1 200 0
Number of development exploration holes drilled NA NA NA NA
Government development drilling (metres) 0 0 0 0
Number of development exploration holes drilled NA NA NA NA
Subtotal exploration drilling (metres) 78 000 74 000 117 800 150 000
Subtotal exploration holes NA NA NA NA
Subtotal development drilling (metres) 0 0 1 200 0
Subtotal development holes NA NA NA NA
Total drilling (metres) 78 000 74 000 119 000 150 000
Total number of holes NA NA NA NA
Uranium Exploration and Development Expenditures – Abroad
Expenses in million CAD 2002 2003 2004 2005 (expected)
Industry exploration expenditures 3.9 4 13 20
Government exploration expenditures 0 0 0 0
Industry development expenditures 0 0 0 0
Government development expenditures 0 0 0 0
Total expenditures 3.9 4 13 20

Canada
129
Reasonably Assured Resources
(tonnes U)
Production method <USD 40/kgU <USD 80/kgU <USD 130/kgU Recovery factor (%)
Underground mining 259 900 259 900 259 900
Open-pit mining 27 300 42 900 42 900
In situ leaching 0 0 0
Heap leaching 0 0 0
In-place leaching (stope/block leaching)
0 0 0
Co-product and by-product 0 0 0
Unspecified 0 42 400 42 400
Total 287 200 345 200 345 200
Reasonably Assured Resources by Deposit Type (tonnes U)
Deposit type <USD 40/kgU <USD 80/kgU <USD 130/kgU
Unconformity-related 287 200 345 200 345 200
Sandstone 0 0 0
Hematite breccia complex 0 0 0
Quartz-pebble conglomerate 0 0 0
Vein 0 0 0
Intrusive 0 0 0
Volcanic and caldera-related 0 0 0
Metasomatite 0 0 0
Other 0 0 0
Total 287 200 345 200 345 200
Inferred Resources (tonnes U)
Production method <USD 40/kgU <USD 80/kgU <USD 130/kgU Recovery factor (%)
Underground mining 84 600 84 600 84 600
Open-pit mining 0 0 0
In situ leaching 0 0 0
Heap leaching 0 0 0
In-place leaching (stope/block leaching)
0 0 0
Co-product and by-product 0 0 0
Unspecified 0 14 000 14 000
Total 84 600 98 600 98 600

Canada
130
Inferred Resources by Deposit Type
(tonnes U)
Deposit type <USD 40/kgU <USD 80/kgU <USD 130/kgU Unconformity-related 84 600 98 600 98 600 Sandstone 0 0 0 Hematite breccia complex 0 0 0 Quartz-pebble conglomerate 0 0 0 Vein 0 0 0 Intrusive 0 0 0 Volcanic and caldera-related 0 0 0 Metasomatite 0 0 0 Other 0 0 0 Total 84 600 98 600 98 600
Prognosticated Resources (tonnes U)
Cost ranges
<USD 80/kgU <USD 130/kgU 50 000 150 000
Speculative Resources (tonnes U)
Cost ranges
<USD 130/kgU Unassigned 700 000 0
Historical Uranium Production (tonnes U in concentrate)
Production method Total
through end of 2001
2002 2003 2004 Total
through end of 2004
2005 (expected)
Open-pit mining1 103 790 2 459 2 397 2 475 111 121 2 300 Underground mining1 248 255 9 148 8 058 9 122 274 583 9 500 In situ leaching 0 0 0 0 0 0 Heap leaching 0 0 0 0 0 0 In-place leaching* 1 000 0 0 0 1 000 0 Co-product/by-product
0 0 0 0 0 0
U recovered from phosphates
0 0 0 0 0 0
Other methods** 0 0 0 0 0 0 Total 353 045 11 607 10 455 11 597 386 704 11 800
(1) Pre-2002 totals may include uranium recovered by heap and in-place leaching. * Also known as stope leaching or block leaching. ** Includes mine water treatment and environmental restoration.

Canada
131
Ownership of Uranium Production in 2004
Domestic Foreign Totals
Government Private Government Private
[tU] [%] [tU] [%] [tU] [%] [tU] [%] [tU] [%]
0 0 7 655 66 3 769 32.5 173 1.5 11 597 100
Uranium Industry Employment at Existing Production Centres (person-years)
2002 2003 2004 2005 (expected)
Total employment related to existing production centres
1 398 1 265 1 754 2 000
Employment directly related to uranium production
972 965 985 1 000
Short-term Production Capability (tonnes U/year)
2005 2010
A-I B-I A-II B-II A-I B-I A-II B-II
14 990 14 990 14 990 14 990 15 430 17 730 15 430 17 730
2015 2020 2025
A-I B-I A-II B-II A-I B-I A-II B-II A-I B-I A-II B-II
15 430 18 730 15 430 18 730 15 430 17 430 15 430 17 430 15 430 17 430 15 430 17 430
Net Nuclear Electricity Generation
2003 2004
Nuclear electricity generated (TWh net) 70.7 84.2
Installed Nuclear Generating Capacity to 2025 (MWe net)
2010 2015 2020 2025 2004 2005
Low High Low High Low High Low High
12 000 12 500 13 600 15 100 13 600 15 100 13 600 15 100 NA NA

Canada
132
Annual Reactor-Related Uranium Requirements to 2025 (excluding MOX)
(tonnes U)
2010 2015 2020 2025 2004 2005
Low High Low High Low High Low High
1 700 1 700 2 000 2 300 2 000 2 300 2 000 2 300 NA NA
Total Uranium Stocks (tonnes natural U-equivalent)
Holder
Natural uranium stocks in
concentrates
Enriched uranium
stocks
Depleted uranium
stocks
Reprocessed uranium
stocks Total
Government 0 0 0 0 0
Producer NA 0 0 0 NA
Utility NA 0 0 0 NA
Total NA 0 0 0 NA

Chile
133
• Chile •
URANIUM EXPLORATION
Historical review
Uranium exploration activities in Chile started in the early 1950s, carrying out geochemical drainage surveys, aerial radiometry, geology and ground radiometry. This resulted in the detection of 1 800 aerial anomalies, 2 000 geochemical and radiometric anomalies, the designation of 120 sectors of interest, the surveying of 84 areas of interest, the discovery of 80 occurrences of uranium, the study of 12 uranium sites, the preliminary exploration of the sites and the evaluation of uranium resources as a by-product of copper and phosphate mining. The key phases of exploration in Chile are summarised:
� 1950-1960: USAEC (USA)-Chile review of mining districts with Cu, Mo, and Ag mineralization.
� 1970-1974: Nuclear Energy Board (JEN) Spain-Chile: survey of the Tambillos mining district, 4th region.
� 1976-1990: IAEA-UNDP: regional prospecting of 150 000 km.
� 1980-1984: Pudahuel Mining Company-CCHEN Chile carried out exploration using boreholes of the Sagasca Cu-U deposit, Tarapaca, 1st region. Technical and economic evaluation of the Huinquintipa copper deposit, 1st region.
� 1986-1987: Production Promotion Corporation (CORFO) and CCHEN carried out exploration and technical and economic evaluation of the Bahia Inglesa phophorite deposit, Atacama, 3rd region.
� 1990-1996: CCHEN carried out a geological and uranium metallogenic survey, principally in the north of the country.
� 1996-1999: CCHEN and the National Mining Company (ENAMI) carried out a survey of rare earth elements (REE) associated with radioactive minerals in the region of Atacama and Coquimbo. Dozens of primary sources were studied, priority given to the Diego de Almagro anomaly no. 2. Study of these 180 km2 identified disseminated deposits and veins of davidite, ilmenite, magnetite, sphene, rutile and anatase, with 3.5-4 kg/t of rare earth oxides (REO), 0.3-0.4 kgU/t and 20-80 kg/t Ti. The geological resources of the site were estimated at 12 000 000 t.

Chile
134
Recent and ongoing uranium exploration and mine development activities
In 1998, CCHEN established the National Uranium Potential Evaluation project. This project combines metallogenic research with establishment of a geological data base with the objective of establishing a portfolio of research projects whose implementation would improve the assessment of the national uranium potential. In 1999-2000, CCHENs existing information was reviewed as part of the National Uranium Potential Evaluation project.
During 2000-2001, a preliminary geological study of U-REE (rare earth elements) at the Cerro Carmen site, located in Atacama III Region, was carried out under the Specific Co-operation Agreement between CCHEN and ENAMI. Also, detailed regional geological information about radioactive minerals, available from CCHEN, was reassessed to improve knowledge of the national uranium potential.
In 2001, the portfolio of projects was submitted. It updates the metallogeny of Chile and the geological areas likely to contain uranium and also proposes 166 research projects, ranging from regional to detailed scientific activities, to be carried out sequentially in accordance with CCHENs capabilities.
In 2002, geophysical surveys were carried out at the Cerro Carmen site. Magnetometric resistivity and chargeability anomalies were identified, which, in conjunction with the geological and geochemical information, can be used to define a target of metallic sulphurs with uranium and associated rare earths.
The above expenditures include wages and salaries, operational costs incurred by both ENAMI and CCHEN as well as CCHENs costs for administration.
URANIUM RESOURCES
Identified resources (RAR & Inferred)
Chile reports known conventional resources totalling 1 931 tU, including 748 tU RAR and 1 183 tU Inferred (no costs are assigned to either category). The combined RAR plus Inferred total compares with 1 831 tU reported in the 2001 Red Book (RAR: 748 tU; Inferred (EAR-I): 1 083 tU). The 1 January 2003 estimate includes 68 tU mainly in the low grade (0.02% U) surficial type occurrences Salar Grande and Quillagua, 1 763 tU in Upper Cretaceous metasomatic occurrences including mainly the Estacion Romero and Prospecto Cerro Carmen (REE) occurrences whose grades range between 0.02 and 0.17% U, and 100 tU in the Cenozoic volcanogenic deposit of El Laco, which grade ranges between 0.01 and 0.15% U.
Undiscovered resources (Prognosticated & SR)
Undiscovered conventional resources (Prognosticated and SR) are estimated to total 6 502 tU with no assigned cost category. The bulk of this resource (4 060 t) is expected to occur in the Upper Cretaceous metasomatic type occurrences. Within this group the majority of the resource, totalling 2 900 tU, is assigned to the REE occurrence Prospecto Cerro Carmen (Anomaly 2).

Chile
135
Unconventional or by-product resources
Chile reported unconventional or by-product resources totalling 7 256 tU. The majority of these resources are associated with the Chuquicamata copper deposit and with the Bahia Inglesa and Mejillones uraniferous phosphate deposits. Uranium could potentially be recovered as a by-product from both types of deposits. However, because of the very low uranium content (0.005 to 0.02% U), production costs are projected to exceed USD 80/kgU.
URANIUM PRODUCTION
None reported.
ENVIRONMENTAL ACTIVITIES AND SOCIO-CULTURAL ISSUES
None reported.
URANIUM REQUIREMENTS
Chile does not have any nuclear power plants. The National Energy Commission’s (CNE) medium-term projections (10 years) do not envisage adding a nuclear power plant into the national electricity grid during this period.
NATIONAL POLICIES RELATING TO URANIUM
As provided for in Law 16 319 the CCHEN has the mandate to advise the Supreme Government in all matters related to the peaceful use of nuclear energy. It is also responsible for developing, proposing and executing the national plans for research, development, utilisation and control of all aspects of nuclear energy.
The mining law (Law 18 248 of 1983) allows private parties to acquire uranium claims and subsequently produce uranium. However, in view of the strategic importance of uranium and other radioactive materials the law provides for CCHEN the right of first refusal in any uranium sale. As private parties have not shown any interest in uranium activities due to the depressed markets the assessment of the country’s potential and its periodic update remains the mandate of CCHEN within the framework of the National Nuclear Development Plan, as confirmed by Supreme Decree No. 302 of 1994. The objectives of the latter are the performance of geological research into materials of nuclear interest and related elements, periodic updating of the national potential for such resources based on geological assessments, development of applied knowledge and technology transfer.
Chile reported no information on uranium stocks or uranium prices.

Chile
136
Uranium Exploration and Development Expenditures and Drilling Effort – Domestic
Expenses in million CLP 2002 2003 2004 2005 (expected)
Industry exploration expenditures 0 0 0 0
Government exploration expenditures 99.93555 81.3288 83.7788 99.4312
Industry development expenditures 0 0 0 0
Government development expenditures 0 0 0 0
Total expenditures 99.93555 81.3288 83.7788 99.4312
Industry exploration drilling (metres) 0 0 0 0
Number of industry exploration holes drilled 0 0 0 0
Government exploration drilling (metres) NA NA NA NA
Number of government exploration holes drilled NA NA NA NA
Industry development drilling (metres) 0 0 0 0
Number of development exploration holes drilled 0 0 0 0
Government development drilling (metres) NA NA NA NA
Number of development exploration holes drilled NA NA NA NA
Subtotal exploration drilling (metres) NA NA NA NA
Subtotal exploration holes NA NA NA NA
Subtotal development drilling (metres) NA NA NA NA
Subtotal development holes NA NA NA NA
Total drilling (metres) NA NA NA NA
Total number of holes NA NA NA NA
Reasonably Assured Resources* (tonnes U)
Production method <USD 40/kgU <USD 80/kgU <USD 130/kgU Recovery
factor (%)
Underground mining 0 0 0
Open-pit mining 0 0 0
In situ leaching 0 0 0
Heap leaching 0 0 0
In-place leaching (stope/block leaching)
0 0 0
Co-product and by-product 0 0 0
Unspecified NA NA 748
Total NA NA 748
* In situ resources.

Chile
137
Reasonably Assured Resources by Deposit Type*
(tonnes U)
Deposit type <USD 40/kgU <USD 80/kgU <USD 130/kgU Unconformity-related 0 0 0 Sandstone 0 0 0 Hematite breccia complex 0 0 0 Quartz-pebble conglomerate 0 0 0 Vein 0 0 0 Intrusive 0 0 0 Volcanic and caldera-related NA NA 28 Metasomatite NA NA 720 Other 0 0 0 Total NA NA 748
* In situ resources.
Inferred Resources* (tonnes U)
Production method <USD 40/kgU <USD 80/kgU <USD 130/kgU Recovery factor (%)
Underground mining 0 0 0 Open-pit mining 0 0 0 In situ leaching 0 0 0 Heap leaching 0 0 0 In-place leaching (stope/block leaching)
0 0 0
Co-product and by-product 0 0 0 Unspecified NA NA 1 183 Total NA NA 1 183
* In situ resources.
Inferred Resources by Deposit Type* (tonnes U)
Deposit type <USD 40/kgU <USD 80/kgU <USD 130/kgU Unconformity-related 0 0 0 Sandstone 0 0 0 Hematite breccia complex 0 0 0 Quartz-pebble conglomerate 0 0 0 Vein 0 0 0 Intrusive 0 0 0 Volcanic and caldera-related NA NA 140 Metasomatite NA NA 1 043 Other 0 0 0 Total NA NA 1 183
* In situ resources.

Chile/China
138
Prognosticated Resources (tonnes U)
Cost ranges
<USD 80/kgU <USD 130/kgU
NA 4 142
Speculative Resources (tonnes U)
Cost ranges
<USD 130/kgU Unassigned
NA 2 360
• China •
URANIUM EXPLORATION
Historical review
Before the 1990s, China’s uranium resource exploration activities were mainly carried out on hydrothermal related granite type and volcanic type uranium deposits in Jiangxi, Hunan, Guangdong Provinces and Guangxi Autonomous Region in southern China. With decades of exploration, the Bureau of Geology (BOG), China National Nuclear Corporation (CNNC) has been successful in discovering some significant uranium deposits such as the Xiangshan, Xiazhuang ore-fields and Chengxian deposit in the Southern China Fold Belt. These deposits mainly occur in intermediate to acid magmatic rocks such as granitoid and volcanic rocks. As a number of these deposits are of relatively small size, low to middle grade, and their transportation and power supply are not easily accessible, the mining costs turned out to be much higher than those acceptable to the commercial nuclear reactor operators. At the beginning of the 1990s, when China initiated its nuclear energy programme, the demand for uranium from China’s nuclear power plants was not so urgent. Additionally in the mid-1990s China experienced relatively high currency inflation, which resulted in the decrease of uranium exploration activities in China from the mid-1990s to the end of the decade.

China
139
Facing financial difficulties, as well as the challenge to meet the demand for economic uranium resources for the country’s mid-term and long-term nuclear energy development plan, the BOG made the decision to change its prospecting direction from the “hard rock” type to in situ leaching type, in the northern and northwest regions. From the mid-1990s, China began to speed up the construction of nuclear power plants in coastal areas, and accordingly the demand for uranium material started to steadily increase. As the low cost known uranium resources decreased, the BOG initiated some regional geological reconnaissance projects and drilling survey projects in Yili, Turpan-Hami, Junggar, Er’lian and Songliao Basins in northern and northwest China with limited funding from the beginning of the 1990s. During the 1990s, due to an insufficient budget from the government, the average annual drilling distance was maintained at about 40 000 metres. In 1999, the government conducted a significant structure reform in China’s mineral exploration sector, which resulted in a large part of the personnel, who had been involved in geological exploration, being transferred to local governments. After the transfer of most of the geological organisations, the staff of BOG was reduced from more than 45 000 to only about 5 500. At the end of the 1990s, the government gradually became aware of the importance of increasing the economic uranium resources to guarantee the supply of uranium for the domestic nuclear power industry. Investment in uranium exploration steadily increased from 2000, and drilling distance experienced a rebound from 40 000 m to 70 000 m in 2000 gradually increasing to 130 000 m in 2003 and 140 000 m in 2004. All these drillings were focused on prospecting for in situ leaching amenable sandstone type uranium deposits in northern China, the important target areas including Yili, Erdos, Turpan-Hami, Er’lian, Junggar, and Songliao Basins.
Recent and ongoing uranium exploration and mine development activities
Since the mid-1990s, uranium exploration activities have been mainly conducted in Yili, Turpan-Hami, Junggar Basins in Xinjiang Autonomous Region, and Erdos, Er’lian, Hailar Basins in Inner Mongolia Autonomous Region as well as Songliao Basin in Northeast China. Four uranium deposits and a few potential occurrences have been found in Yili, Turpan and Erdos Basins.
In Yili Basin, the BOG found the Zajistan and Wukulqi deposits, the former one completed exploration in 2003 and the latter one is being evaluated and is still under exploration. In Turpan basin, the Shihongtan deposit, which is of medium size, is currently being evaluated. In Erdos basin, the Zaohuohao deposit, which was first discovered in 2001, has been initially delimitated as a medium size deposit with additional expanding potential.
URANIUM RESOURCES
Identified resources (RAR & Inferred)
Uranium resources in China total 85 000 tU, as listed in the relevant Table. The increase of 8 000 tU compared to the figure in the 2003 Red Book is due to the increase in known ISL mining resources in the Yili Xinjiang Autonomous Region and Erdos basin, Inner Mongolia Autonomous Region. The main uranium deposits or ore fields, and known uranium resources in China are listed in the following Table.
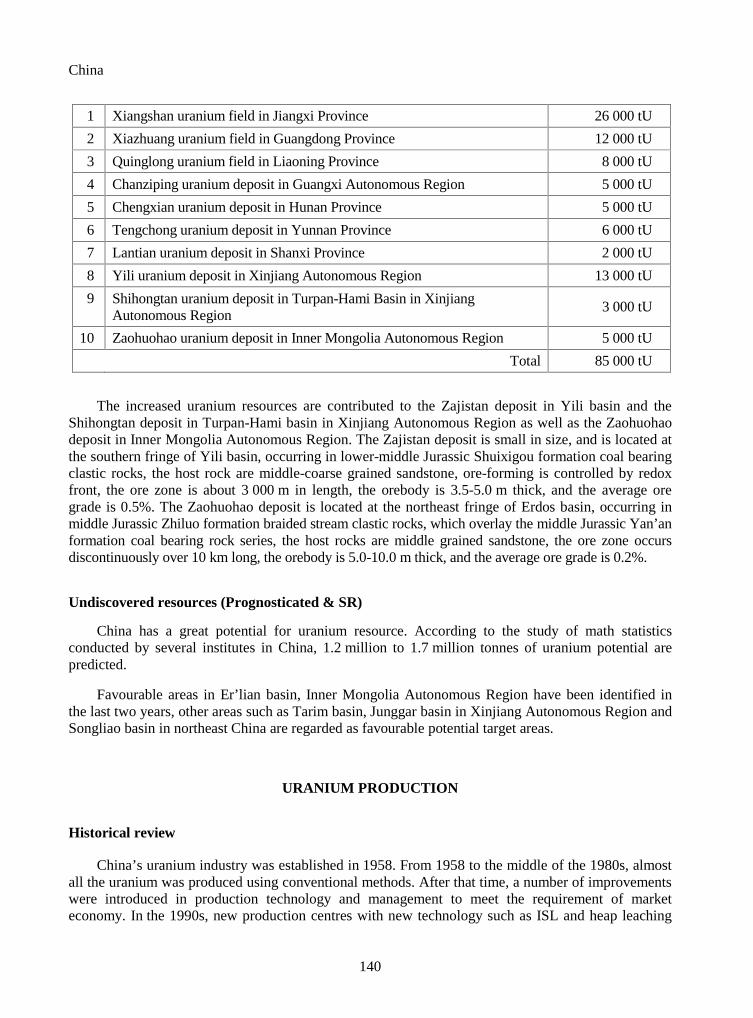
China
140
1 Xiangshan uranium field in Jiangxi Province 26 000 tU
2 Xiazhuang uranium field in Guangdong Province 12 000 tU
3 Quinglong uranium field in Liaoning Province 8 000 tU
4 Chanziping uranium deposit in Guangxi Autonomous Region 5 000 tU
5 Chengxian uranium deposit in Hunan Province 5 000 tU
6 Tengchong uranium deposit in Yunnan Province 6 000 tU
7 Lantian uranium deposit in Shanxi Province 2 000 tU
8 Yili uranium deposit in Xinjiang Autonomous Region 13 000 tU
9 Shihongtan uranium deposit in Turpan-Hami Basin in Xinjiang Autonomous Region
3 000 tU
10 Zaohuohao uranium deposit in Inner Mongolia Autonomous Region 5 000 tU
Total 85 000 tU
The increased uranium resources are contributed to the Zajistan deposit in Yili basin and the Shihongtan deposit in Turpan-Hami basin in Xinjiang Autonomous Region as well as the Zaohuohao deposit in Inner Mongolia Autonomous Region. The Zajistan deposit is small in size, and is located at the southern fringe of Yili basin, occurring in lower-middle Jurassic Shuixigou formation coal bearing clastic rocks, the host rock are middle-coarse grained sandstone, ore-forming is controlled by redox front, the ore zone is about 3 000 m in length, the orebody is 3.5-5.0 m thick, and the average ore grade is 0.5%. The Zaohuohao deposit is located at the northeast fringe of Erdos basin, occurring in middle Jurassic Zhiluo formation braided stream clastic rocks, which overlay the middle Jurassic Yan’an formation coal bearing rock series, the host rocks are middle grained sandstone, the ore zone occurs discontinuously over 10 km long, the orebody is 5.0-10.0 m thick, and the average ore grade is 0.2%.
Undiscovered resources (Prognosticated & SR)
China has a great potential for uranium resource. According to the study of math statistics conducted by several institutes in China, 1.2 million to 1.7 million tonnes of uranium potential are predicted.
Favourable areas in Er’lian basin, Inner Mongolia Autonomous Region have been identified in the last two years, other areas such as Tarim basin, Junggar basin in Xinjiang Autonomous Region and Songliao basin in northeast China are regarded as favourable potential target areas.
URANIUM PRODUCTION
Historical review
China’s uranium industry was established in 1958. From 1958 to the middle of the 1980s, almost all the uranium was produced using conventional methods. After that time, a number of improvements were introduced in production technology and management to meet the requirement of market economy. In the 1990s, new production centres with new technology such as ISL and heap leaching

China
141
were put into operation to further cut down the operation costs. The details were described in the 2001 Red Book. In 2001 and 2002, major efforts were made to improve heap leaching technology and ISL technology, such as adding bacteria in heap leaching to shorten the leaching cycle and raise the recovery rate. Over the last two years major efforts were focused on ISL technology in the Turha and Dongsheng sandstones deposits, which have a low permeability and high TDS. The pilot test is still ongoing. If the test result is favourable, two new production centres will be added. In the southern part a major effort is being made on stope leaching, which has been tested in the Chongyi uranium mine. This method would greatly increase production capacity and lower costs.
Status of production capability
For the last two years (2003 and 2004), the existing production centres in China have remained the same. No production centre was shut down and no new production centre was put into operation. Uranium output increased slightly. The feasibility study of a new production centre in Fuzhou was approved. It is now under preparation for construction. Construction may start in 2005.
Uranium Production Centre Technical Details (as of 1 January 2005)
Centre # 1 Centre # 2 Centre # 3 Centre # 4 Centre # 5
Name of production centre Fuzhou Chongyi Yining Lantian Benxi
Production centre classification
existing existing existing existing existing
Start-up date 1966 1979 1993 1993 1996
Source of ore: � Deposit name Dep 512 Lantian Benxi � Deposit type volcanic granite sandstone granite granite � Reserves (tU) � Grade (% U)
Mining operation: � Type (OP/UG/ISL) UG UG ISL UG UG � Size (t ore/year) 700 350 NA 200 100 � Average mining
recovery (%) 92 90 NA 80 85
Processing plant conventional heap leach heap leach heap leach � Type (IX/SX/AL) IX, AL IX, AL IX, AL IX, AL SX, AL � Size (t ore/day)
for ISL (L/day or L/h) 700 350 NA NA NA
� Average process recovery (%)
90 84 NA 90 90
Nominal production capacity (tU/year)
300 (200 committed)
120 200 100 120
Plans for expansion NA NA to 300 tU/y NA NA
Other remarks

China
142
Ownership structure of the uranium industry
China’s uranium industry is 100% owned by a state company.
Employment in the uranium industry
Employment has decreased in the past two years. Employment is expected to decrease in the future to lower the cost of uranium production.
Future production centres
A new production centre in the Fuzhou uranium mine was constructed in 2003. The new centre will share the same milling plant with the old mine. Production will start in 2 or 3 years. The capacity of this new mine will be 200 tU per year.
In addition, the ISL pilot test on the Shihongtan deposit is still ongoing, and tests on the Dongsheng uranium deposit are planned to start this year. If the test results are favourable, they will be the new potential production centres.
Secondary sources of uranium
China reported no production or use of mixed oxide fuels or re-enriched tailings.
ENVIRONMENTAL ACTIVITIES AND SOCIO-CULTURAL ISSUES
In the past two years, personal dosimeters were installed to measure workers who are directly involved in the production of uranium. So the dosage would be closer to reality, it would be better to guide the protection of workers in this field. Prior to this, personal dosage was calculated through measurements of data working places.
Nearly USD 14.5 million were invested in the rehabilitation of closed uranium mines or mills or complexes over the past two years. The remediation of four entities was completed.
With the end of production of the first area in the Yining ISL mine, more efforts were focused on the restoration of underground water. At present, the method to restore the underground water is being studied and compared. Research will continue in 2005 and further.
URANIUM REQUIREMENTS
As of 1 January 2005, the total capacity of installation of nuclear reactors for nuclear power plants reaches 6 700 MWe net. The annual requirement in 2004 was about 1 260 tU.
Over the last two years, the Chinese government has put forward a big plan. The total capacity of nuclear power plants will reach 40 GWe by the end of 2020, which means over 2 000 MWe nuclear power plants will be constructed each year from 2006 to 2020. The requirement for uranium will grow rapidly.

China
143
Supply and procurement strategy
In order to meet the needs of the new plan for nuclear power plants, domestic production will be essential. So new uranium production centres are being studied in Southern and Northern China. The construction of a new production centre in the Fuzhou uranium mine was started last year. The feasibility study for expansion of the ISL mine in Yining has been approved over the last two years. The feasibility study for expansion of the ISL mine in Turha and Dongsheng is still ongoing. Supplementary to domestic production, foreign production centres were investigated. The first and most promising centre will be in Kazakhstan. Beside this, purchase on the international market is also an alternative over the long-term supply strategy.
NATIONAL POLICIES RELATING TO URANIUM
The annual uranium requirements of reactors will be supplied mainly by domestic production. So China enhances exploration of economic uranium resources. In the mean time, developments such as in-stope leaching and bacteria leaching to produce more competitive uranium are occurring. Chinese uranium facilities are also being reconstructed using improved process flow sheets to increase production. In the short term, China will be able to meet the annual needs of its reactors. With the increase of newly constructed reactors, foreign resources will be co-developed with local partners. China may also purchase uranium in the international market to meet its needs.
Uranium Exploration and Development Expenditures and Drilling Effort – Domestic
Expenses in million USD 2002 2003 2004 2005 (expected)
Industry exploration expenditures 0 0 0 0 Government exploration expenditures 7.2 7.6 8.2 8.6 Industry development expenditures 0 0 0 0 Government development expenditures 0 0 0 0 Total expenditures 7.2 7.6 8.2 8.6 Industry exploration drilling (metres) 0 0 0 0 Number of industry exploration holes drilled 0 0 0 0 Government exploration drilling (metres) 120 000 130 000 140 000 160 000 Number of government exploration holes drilled 412 476 512 510 Industry development drilling (metres) 0 0 0 0 Number of development exploration holes drilled 0 0 0 0 Government development drilling (metres) 0 0 0 0 Number of development exploration holes drilled 0 0 0 0 Subtotal exploration drilling (metres) 120 000 130 000 140 000 160 000 Subtotal exploration holes 412 476 512 510 Subtotal development drilling (metres) 0 0 0 0 Subtotal development holes 0 0 0 0 Total drilling (metres) 120 000 130 000 140 000 160 000 Total number of holes 412 476 512 510

China
144
Historical Uranium Production (tonnes U in concentrate)
Production method Total
through end of 2001
2002 2003 2004 Total
through end of 2004
2005 (expected)
Open-pit mining1 NA 0 0 0 NA 0
Underground mining1 NA NA NA NA NA NA
In situ leaching NA 200 200 200 NA 200
Heap leaching NA NA NA NA NA NA
In-place leaching* NA NA NA NA NA NA
Co-product/by-product NA NA NA NA NA NA
U recovered from phosphates
NA NA NA NA NA NA
Other methods** NA NA NA NA NA NA
Total NA NA NA NA NA NA
(1) Pre-2002 totals may include uranium recovered by heap and in-place leaching. * Also known as stope leaching or block leaching. ** Includes mine water treatment and environmental restoration.
Ownership of Uranium Production in 2004
Domestic Foreign
Government Private Government Private Totals
[tU] [%] [tU] [%] [tU] [%] [tU] [%] [tU] [%]
NA 100 0 0 0 0 0 0 NA 100
Uranium Industry Employment at Existing Production Centres (person-years)
2002 2003 2004 2005 (expected)
Total employment related to existing production centres
8 000 7 700 7 500 7 000
Employment directly related to uranium production
6 300 6 930 6 750 6 300
Net Nuclear Electricity Generation
2003 2004
Nuclear electricity generated (TWh net) 41.5 47.5

China
145
Installed Nuclear Generating Capacity to 2025 (MWe net)
2010 2015 2020 2025 2004 2005
Low High Low High Low High Low High
6 700 8 700 13 000 20 000 25 000 35 000 30 000 40 000 40 000 45 000
Annual Reactor-related Uranium Requirements to 2025 (excluding MOX) (tonnes U)
2010 2015 2020 2025 2004 2005
Low High Low High Low High Low High
1 260 1 566 2 340 3 600 4 500 6 300 5 400 7 200 7 200 8 100

Czech Republic
146
• Czech Republic •
URANIUM EXPLORATION
Historical review
Following its start in 1946, uranium exploration in Czechoslovakia grew rapidly and developed into a large-scale programme in support of the country’s uranium mining industry. A systematic exploration programme including geological, geophysical and geochemical surveys and related research was carried out to assess the uranium potential of the entire country. Areas with identified potential were explored in detail using drilling and underground methods.
Exploration continued in a systematic manner until 1989 with annual exploration expenditures in the range of USD 10-20 million and an annual drilling effort in the range of 70-120 km. Exploration was traditionally centred around vein deposits located in metamorphic complexes of the Bohemian massif and around the sandstone-hosted deposits in northern and north-western Bohemia.
In 1989, the decision was made to reduce all uranium related activities. No field exploration has been carried out since the beginning of 1994.
Recent and ongoing uranium exploration and mine development activities
No field exploration has been carried out since the beginning of 1994. Exploration activities have been focused on the conservation and processing of previously collected exploration data. Processing the exploration data and building the exploration database will continue at a reduced level in 2005.
URANIUM RESOURCES
Historically, most of the known uranium resources of the Czech Republic occurred in 23 deposits, of which 20 have been mined out or closed. Of the three remaining deposits, one is being mined (Rozná), and two, including Osecná-Kotel and Brzkov have resources that are not recoverable in the near future because of high production costs. Undiscovered uranium resources are believed to occur in the Rozná and Brzkov vein deposits in the metamorphic complex of western Moravia, as well as in the sandstone deposits of the Stráz block, Tlustec block and Hermánky region in the Northern Bohemian Cretaceous basin.
Identified resources (RAR & Inferred)
Identified Resources as of 1 January 2004 decreased by 350 tU in comparison with the previous estimate.
Czech Republic
147
In detail, the Reasonably Assured Resources recoverable at cost below USD 80/kgU decreased by 320 tU, and the RAR above USD 80/kgU are no longer registered. The decrease in RAR was the result of the re-evaluation of the Stráz deposit as uneconomic, and the depletion of resources at the Rozná operating production centre.
Inferred Resources at below USD 80/kgU declined by 30 tU as a result of the depletion of resources at the Rozná production centre resource. Inferred Resources above USD 80/kgU are no longer reported. All the Identified Resources recoverable at cost below USD 80/kgU are tributary to the existing Rozná and Stráz Mining losses of 5% have been accounted for in estimating RAR and IR.
Undiscovered Resources (Prognosticated & SR)
No new areas favourable for the discovery of resources have been identified in the last two years.
The Undiscovered Resources (PR and SR) did not change over the last two years (see details in the 2001 Red Book).
URANIUM PRODUCTION
Historical review
The industrial development production in Czechoslovakia began in 1946. Between 1946 and the dissolution of the Soviet Union, all uranium produced in Czechoslovakia was exported to the Soviet Union. The first production came from Jachymov and Horni Slavkov mines, which completed operations in the mid-1960s. Pribram, the main vein deposit, operated in the period 1950-1991. The Hamr and Straz production centres, supported by sandstone deposits, started operation in 1967. The peak production of about 3 000 tU was reached in about 1960 and production remained between 2 500 and 3 000 tU/year from 1960 through 1990, when it began to decline. During the period 1946-2001 a cumulative total of 107 732 tU was produced in the Czech Republic. About 86% of that total was produced by underground and open-pit mining methods while the remainder was recovered using in situ leaching (ISL). A cumulative quantity of 109 061 tU was produced in the Czech Republic during the period 1946-2004.
Status of production capability and recent and ongoing activities
Production capability has not changed in the last two years. Both Dolni Rozinka and Stráz pod Ralskem production centres are in operation but Dolní Rozínka centre will terminate its mining and milling activities in 2008 following a government decision taken in October 2005.
With respect to the good technical and economical conditions at the Rozná deposit, the government decided on closure of the mine in 2008 with annual production of about 277 tU. Uranium from the ISL facility in Stráz pod Ralskem will be produced as part of environmental remediation. Expected production is 40 tU in 2005, then decreasing continuously.

Czech Republic
148
Ownership structure of the uranium industry
In ownership of the uranium producing operations are no changes. All uranium related activities, including exploration and production have been carried out by the government-owned enterprise, DIAMO, s.p., based in Stráz pod Ralskem.
Employment in the uranium industry
With the continuing reduction of uranium related activities, direct employment in the Czech uranium industry has declined to 2 218 workers, as of the end of 2004. This employment is engaged in uranium production, decommissioning and restoration activities in Dolní Rozínka (Rozna mine) and Stráz pod Ralskem (ISL remediation) centres.
Future production centres
No other production centres are committed or planned in the near future.
Secondary sources of uranium
CEZ, a.s., the operator of all six country power reactors does not consider usage of MOX fuels. Alike, it has not been scheduling utilisation of RepU or re-enriched tails in fuels yet.
Uranium Production Centre Technical Details (as of 1 January 2005)
Centre #1 Centre #2
Name of production centre Dolní Rozínka Stráz pod Ralskem Production centre classification existing (mining) existing (remediation) Start-up date 1957 1967 Source of ore: � Deposit name Rozná Stráz � Deposit type vein sandstone � Reserves (tU) 750 1 320 � Grade (% U) 0.379 0.030 Mining operation: � Type (OP/UG/ISL) UG ISL � Size (t ore/day) 620 – � Average mining recovery (%) 95 50 (estimated) Processing plant: � Type (IX/SX/AL) IX/ALKAL/CWG ISL/AL/IX � Size (t ore/day); for ISL (L/day or L/h) 580 20 000 kl/day � Average process recovery (%) 93.5 – Nominal production capacity (tU/year) 400 250 Plans for expansion none none Other remarks Extraction under
remediation process

Czech Republic
149
ENVIRONMENTAL ACTIVITIES AND SOCIAL CULTURAL ISSUES
Both environmental activities and solution of social issues are main parts of contraction programme of the Czech uranium industry, which started in 1989. The environmental remediation activities include planning, administration, environmental impact assessment, decommissioning, waste rock management, rehabilitation of tailings, site rehabilitation, mine water treatment and long-term monitoring. These activities are completely provided at the existing production centres as well as at the sites of former uranium facilities.
The fundamental uranium environmental projects are as follows:
� Remediation of the after-effects of the in situ leaching in Stráz pod Ralskem (652 ha surface area).
� Rehabilitation of the tailing ponds in Mydlovary, Pribram, Straz pod Ralskem (584 ha total area).
� Rehabilitation of the waste rock dumps in Pribram, Rozná-Olsí, Hamr and others (in total 46 million m3).
� Mine water treatment from uranium facilities in Stráz, Olsí, Horní Slavkov, Licomerice and others (in total 9.5 million m3 per year).
The major part of environmental projects (more than 90%) is being funded by the state budget. The projects will continue until approximately 2040 and should cost more than CZK 60 000 million.
The contraction programme of the uranium industry consists in gradual decreasing of the employment related to uranium production and developing of alternative projects for elimination the social issues. The social part of the contraction programme (compensations, damages, rents etc.) is financed by the state budget. The Czech uranium industry presented by state-owned enterprise DIAMO, is transforming itself into an environmental engineering company.
Expenditures Related to Environmental Activities and Social Issues (CZK million)
Total through end of 2002
2003 2004 Total through
end of 2004 2005
(expected)
Uranium environmental remediation
16 793 1 469 1 667 19 929 1 547
Social programme and social security
4 431 430 421 5 282 431
Total 21 224 1 899 2 088 25 211 1 978

Czech Republic
150
URANIUM REQUIREMENTS
After putting both Temelin units (about 1 000 MWe each) into full commercial operation and reaching a total gross generating capacity of 3 760 MWe, the total annual requirements of CEZ, a.s., hover around 700 tU.
Since the beginning of 2004, CEZ, a.s. has been filling its uranium requirements through long-term contracts. Previously, the majority of uranium supplies had come from domestic uranium producer DIAMO, a state-owned enterprise.
Supply and procurement strategy
There was no change in CEZ, a.s. supply and procurement strategy, which is focused on diversification of sources and long term deals.
NATIONAL POLICIES RELATING TO URANIUM
The Czech government decided to implement an extensive contraction programme of uranium industry at the end of the 1980s. However the government has positive policy in the field of the nuclear power industry. Both last uncovered deposits Rozná (underground mine) and Stráz (ISL under remediation process) will be mined out. No other uranium deposits will be opened in the near future. Czech uranium production is designed first of all for domestic nuclear power industry.
The governmental raw material policy has not interfered with CEZ, a.s. uranium procurement policy since the beginning of 2001, when the legislation forcing Czech power company CEZ, a.s. to buy domestic uranium was rescinded.
URANIUM STOCKS
There is no national stockpile policy in the Czech Republic. Generally CEZ, a.s. holds strategic and pipeline uranium inventories in the form of processed uranium (converted and enriched uranium) and/or fresh fuel at the NNP site. Such inventories should cover an equivalent of its annual needs, at least.
URANIUM PRICES
Uranium prices are not available due to confidential business deals.

Czech Republic
151
Uranium Exploration and Development Expenditures and Drilling Effort – Domestic
Expenses in million CZK 2002 2003 2004 2005 (expected)
Industry exploration expenditures 0.8 0.4 0.1 0.1
Government exploration expenditures 0 1.1 0.5 3.3
Industry development expenditures 0 0 0 0
Government development expenditures 0 0 0 0
Total expenditures 0.8 1.5 0.6 3.4
Industry exploration drilling (metres) 0 0 0 0
Number of industry exploration holes drilled 0 0 0 0
Government exploration drilling (metres) 0 0 0 0
Number of government exploration holes drilled 0 0 0 0
Industry development drilling (metres) 0 0 0 0
Number of development exploration holes drilled 0 0 0 0
Government development drilling (metres) 0 0 0 0
Number of development exploration holes drilled 0 0 0 0
Subtotal exploration drilling (metres) 0 0 0 0
Subtotal exploration holes 0 0 0 0
Subtotal development drilling (metres) 0 0 0 0
Subtotal development holes 0 0 0 0
Total drilling (metres) 0 0 0 0
Total number of holes 0 0 0 0
Reasonably Assured Resources (tonnes U)
Production method <USD 40/kgU <USD 80/kgU <USD 130/kgU Recovery
factor (%)
Underground mining 0 510 510 90
Open-pit mining 0 0 0 0
In situ leaching 0 0 0 0
Heap leaching 0 0 0 0
In-place leaching (stope/block leaching)
0 0 0 0
Co-product and by-product 0 0 0 0
Unspecified 0 0 0 0
Total 0 510 510 90
Czech Republic
152
Reasonably Assured Resources by Deposit Type
(tonnes U)
Deposit type <USD 40/kgU <USD 80/kgU <USD 130/kgU
Unconformity-related 0 0 0
Sandstone 0 0 0
Hematite breccia complex 0 0 0
Quartz-pebble conglomerate 0 0 0
Vein 0 510 510
Intrusive 0 0 0
Volcanic and caldera-related 0 0 0
Metasomatite 0 0 0
Other 0 0 0
Total 0 510 510
Inferred Resources (tonnes U)
Production method <USD 40/kgU <USD 80/kgU <USD 130/kgU Recovery factor (%)
Underground mining 0 60 60 90
Open-pit mining 0 0 0 0
In situ leaching 0 0 0 0
Heap leaching 0 0 0 0
In-place leaching (stope/block leaching)
0 0 0 0
Co-product and by-product 0 0 0 0
Unspecified 0 0 0 0
Total 0 60 60 90
Inferred Resources by Deposit Type (tonnes U)
Deposit type <USD 40/kgU <USD 80/kgU <USD 130/kgU
Unconformity-related 0 0 0
Sandstone 0 0 0
Hematite breccia complex 0 0 0
Quartz-pebble conglomerate 0 0 0
Vein 0 60 60
Intrusive 0 0 0
Volcanic and caldera-related 0 0 0
Metasomatite 0 0 0
Other 0 0 0
Total 0 60 60
Czech Republic
153
Prognosticated Resources (tonnes U)
Cost ranges
<USD 80/kgU <USD 130/kgU
180 180
Speculative Resources (tonnes U)
Cost ranges
<USD 130/kgU Unassigned
0 179 000
Historical Uranium Production (tonnes U in concentrate)
Production method Total
through end of 2001
2002 2003 2004 Total
through end of 2004
2005 (expected)
Open-pit mining1 NA 0 0 0 NA 0
Underground mining1 90 120 349 341 339 91 149 277
In situ leaching 16 998 112 108 71 17 289 40
Heap leaching 125 0 0 0 125 0
In-place leaching* 3 0 0 0 3 0
Co-product/by-product 0 0 0 0 0 0
U recovered from phosphates
0 0 0 0 0 0
Other methods** 486 4 3 2 495 3
Total 107 732 465 452 412 109 061 320
(1) Pre-2002 totals may include uranium recovered by heap and in-place leaching. * Also known as stope leaching or block leaching. ** Includes mine water treatment and environmental restoration.
Ownership of Uranium Production in 2004
Domestic Foreign
Government Private Government Private Totals
[tU] [%] [tU] [%] [tU] [%] [tU] [%] [tU] [%]
412 100 0 0 0 0 0 0 412 100

Czech Republic
154
Uranium Industry Employment at Existing Production Centres (person-years)
2002 2003 2004 2005 (expected)
Total employment related to existing production centres
2 507 2 426 2 409 2 218
Employment directly related to uranium production
2 087 2 001 1 994 1 895
Short-term Production Capability (tonnes U/year)
2005 2010
A-I B-I A-II B-II A-I B-I A-II B-II
0 0 250 250 0 0 50 50
2015 2020 2025
A-I B-I A-II B-II A-I B-I A-II B-II A-I B-I A-II B-II
0 0 60 60 0 0 50 50 0 0 40 40
Net Nuclear Electricity Generation
2003 2004
Nuclear electricity generated (TWh net) 24.4 24.8
Installed Nuclear Generating Capacity to 2025 (MWe net)
2010 2015 2020 2025 2004 2005
Low High Low High Low High Low High
3 508 3 508 3 604 3 604 3 692 3 692 3 692 3 692 3 692 3 692
Annual Reactor-related Uranium Requirements to 2025 (excluding MOX) (tonnes U)
2010 2015 2020 2025 2004 2005
Low High Low High Low High Low High
598 700 690 695 690 700 690 700 690 700

Czech Republic
155
Total Uranium Stocks (tonnes natural U-equivalent)
Holder
Natural uranium stocks in
concentrates
Enriched uranium
stocks
Depleted uranium
stocks
Reprocessed uranium
stocks Total
Government 0 0 0 0 0
Producer <200 0 0 0 <200
Utility 0 NA 0 0 NA
Total <200 NA 0 0 NA

Egypt
156
• Egypt •
URANIUM EXPLORATION
Historical review
In the framework of the peaceful uses of nuclear energy, the government of Egypt had plans, beginning in the 1980s, to implement a nuclear power plant for electric power generation. Other R&D plans also considered the use of nuclear energy for water desalination. All of these plans implied the implementation of programmes of uranium exploration. These programmes were undertaken by the Egyptian Nuclear Materials Authority (NMA), which is the government body responsible for nuclear raw materials in the country. In the early phases, the programmes included training NMA teams in exploration and associated relevant tasks. A number of Technical Co-operation (TC) projects and expert missions were mainly executed in collaboration with the IAEA for this purpose. Since then, the NMA activities can be divided into three main phases:
� Before the 1990s, NMA exploration work resulted in the discovery of seven U-potential prospects. The study of these prospects covered only geophysical and geochemical exploration with chemical mapping, supported by a limited amount of exploration drilling and experimental mining. However, the studies did not succeed in evaluation of meaningful reserves and ore grades of any of these prospects. Most of the results of this work were reported in the previous Red Book editions and IAEA TC reports.
� For several reasons, the Egyptian government delayed its NPP plans, including the prevailing world concern about the safety of operating NPPs after the Chernobyl accident, the lack of experience to operate such complicated systems and the difficulties in providing the financial support for such projects. The delay of this programme affected NMA activities, which were significantly decreased during the 1990s. For instance, only one additional potential prospect was added, but the evaluation of the reserves remained in the early phases. However, some bench-scale trials to process samples were undertaken to assess the potential of unconventional resources (e.g. phosphates and black sands). These results were also reported in the Red Book editions and TC reports during this period.
� In the framework of reduction in the governmental expenditure in Egypt at the beginning of 2001, NMA witnessed substantial budget cuts during the period 2001-2005. This led to a reorganisation of all exploration, drilling and training activities in the absence of a nuclear programme. Under such circumstances, a two-fold plan was considered:
– Concerning uranium exploration activities, the plan involved concentration on the exploration and evaluation activities in the most promising prospects only. It also required the implementation of TC programmes with the IAEA to reach conclusions about the potential of the prospects under investigation.

Egypt
157
– The plan also involved (for the first time) the employment of the exploration experience and
facilities gained by past uranium activities in other exploration programmes in the country. These studies have dealt mainly with mineral, oil and groundwater exploration on a contract basis. These contracts have been employed to contribute to the national development plan and also support the NMA budget.
Recent and ongoing uranium exploration and mine development activities
In the absence of a governmental nuclear programme and according to the received budget, the facilities and experience of most NMA activities have been directed towards minerals, groundwater and oil exploration. Such contracted activities now represent most of the NMA activities. The Nuclear Materials Authority is currently concentrating its activities in the following areas:
� Exploration for conventional uranium resources in the Eastern Desert. These activities concentrate on the younger granites of Pan-African type, the associated inter-mountain basins (TC project EGY/03/014).
� Evaluation of uranium resources in some uranium occurrences in the Eastern Desert. NMA is now preparing for drilling programmes in El Sella and Kab Amiri areas of the Eastern Desert. This programme is currently conducted in collaboration with the IAEA (TC project EGY/03/015).
NMA and the IAEA have recently agreed on receiving additional technical assistance through the EGY/03/015 project to evaluate uranium prospects throughout the country and to investigate the promising occurrences. This task will certainly help NMA to make considerable progress in the assessment of uranium resources in the country, if the required budget is available in the future.
� Black sand resources (a potential unconventional uranium resource) are currently considered titanium and zirconium resources. The role of NMA is restricted to the assessment of environmental radiation hazards and mitigation of their environmental impact with a goal to economic mining of these deposits for their Ti and Zr minerals as non-contaminated products. The relevant studies are currently conducted through the TC EGY/9/037 IAEA project.
� Purification of phosphoric acid employing a semi-pilot plant has been completely converted to produce phosphoric acid for agricultural, food grade and other domestic purposes. The previously planned uranium extraction has been completely suspended due to the difficulties discovered during tests of this unit since 1997. The difficulties included the low U-content in phosphoric acid and the serious failures in the extraction cycle in the unit.
URANIUM RESOURCES
Identified resources (RAR & Inferred)
Egypt does not report any known uranium resources according to the standard IAEA/NEA classification system.
Undiscovered resources (Prognosticated & SR)
There is a possible forecasting of about 100 tU as Speculative Resources in some uranium occurrences.

Egypt
158
URANIUM PRODUCTION
Egypt has no uranium production centres, no exploitation mines and no mills. All experimental mining, trenching, drilling tasks and laboratory units are under environmental control and radiation safety regulations according to the international roles considered by the International Atomic Energy Agency.
NMA is responsible for studies to assess and manage the radioactive wastes that are expected to arise during the black sand exploitation and mineral separation. In this respect, this task is currently performed in collaboration with the IAEA (TC project EGY/9/037). In addition, a recent country regulation has involved NMA in monitoring the radiation controls of imported and local raw materials. NMA is currently implementing specialist groups and the relevant facilities to undertake these Governmental responsibilities.
URANIUM REQUIREMENTS
There is no nuclear power plant in Egypt. A programme for nuclear power production was initiated in the mid-1980s and a desalination plant was also considered, but was later put on hold for several reasons. No uranium requirements can be defined. Egypt provided no information on uranium policies, stocks or prices.
Uranium Exploration and Development Expenditures and Drilling Effort – Domestic
Expenses in million EGP 2002 2003 2004 2005
(expected) Industry exploration expenditures 0 0 0 0
Government exploration expenditures 33.2 33 16 10 Industry development expenditures 0 0 0 0
Government development expenditures 0 0 0 0
Total expenditures 33.2 33 16 10
Industry exploration drilling (metres) 0 0 0 0 Number of industry exploration holes drilled 0 0 0 0
Government exploration drilling (metres) 1 300 1 300 NA NA Number of government exploration holes drilled 100 130 NA NA
Industry development drilling (metres) 0 0 0 0
Number of development exploration holes drilled 0 0 0 0 Government development drilling (metres) 0 0 0 0
Number of development exploration holes drilled 0 0 0 0
Subtotal exploration drilling (metres) 1 300 1 300 NA NA
Subtotal exploration holes 100 130 NA NA
Subtotal development drilling (metres) 0 0 0 0
Subtotal development holes 0 0 0 0
Total drilling (metres) 1 300 1 300 NA NA
Total number of holes 100 130 NA NA

Finland
159
• Finland •
URANIUM EXPLORATION
Historical review
Uranium exploration was carried out in Finland from 1955 to 1989, first by several organisations but from the late-1970s mainly by the Geological Survey. Since their beginning in the early-1970s, the regional aero-geophysical and geochemical mapping programmes have played an important role in uranium exploration.
The distribution of uranium provinces and the geological settings of uranium deposits can be summarised as follows; the grades (% U) and tonnages of (in situ) uranium of the deposits are given in brackets:
� The Kolari-Kittilä province in western Lapland, including the Kesänkitunturi sandstone deposit (0.06%; 950 tU) and the Pahtavuoma-U vein deposit (0.19%; 500 tU) in Paleoproterozoic quartzite and greenstone-associated graphitic schists, respectively.
� The Kuusamo province in northeastern Finland, with metasomatite uranium occurrences associated with mineralizations of gold and cobalt (e.g. Juomasuo deposit) in a sequence of Paleoproterozoic quartzites and mafic volcanics.
� The historical Koli province in eastern Finland, with several small sandstone (Ipatti, Martinmonttu and Ruunaniemi: 0.08-0.14%; 250 tU) and epigenetic uranium deposits (the former Paukkajanvaara mine) and occurrences of uranium and thorium-bearing quartz-pebble-conglomerate in Paleoproterozoic quartzites, with an additional prospect of unconformity-related deposits in a Paleoproterozoic regolith.
� The Uusimaa province of intrusive uranium occurrences in Paleoproterozoic granitic migmatites of southern Finland, represented by the Palmottu deposit (0.1%; 1 000 tU) and the Askola area.
The geological settings further include:
� Uraniferous phosphorites associated with sedimentary carbonates of the Paleoproterozoic sequences, e.g., the Vihanti-U (Lampinsaari) deposit (0.03%; 700 tU) and the Nuottijärvi deposit (0.04%; 1 000 tU).
� Uranium mineralization and uraniferous carbonate veins in Paleoproterozoic albitite and albite diabase dykes, mostly in northern Finland.
� Uranium- and thorium-bearing dykes and veins of Paleoproterozoic pegmatite granites.
� Surficial concentrations of young uranium in recent peat.
Finland
160
Finland has previously reported 2 900 tU of reasonably assured resources in the cost range USD 130 or more/kgU, included in several deposits. Because this cost category is no longer used in the Red Book, these resources have to be excluded for the present. In addition, for environmental and technical reasons many of these deposits will not be mineable anymore.
Possible by-product uranium occurs in the low-grade Ni-Cu-Zn deposit of Talvivaara (0.001-0.004% U), hosted by Paleoproterozoic black shales, in central Finland, and in pyrochlore of the Paleozoic Sokli carbonatite (0.01% U) in eastern Lapland.
Recent and ongoing uranium exploration activities
For about 20 years there have been no exploration activities in Finland for uranium. In recent years, however, international companies have been gathering basic data on the occurrence and geology of uranium. In November 2004, two claim reservation areas were registered for COGEMA, one in southern and one in eastern Finland. On both of these areas COGEMA applied for exploration licenses (claims) and registered an additional claim reservation in southern Finland in 2005. Agricola Resources plc acquired claim reservations in eastern and northern Finland in 2005 and carried out first phase trenching and drilling on a discovery site in northern Finland. All these activities were focused on areas of known uranium occurrences in the Uusimaa, Koli and Kuusamo provinces.
URANIUM RESOURCES
Identified resources (RAR & Inferred)
Finland reports 1 500 tU of reasonably assured resources in the cost range USD 80-130/kgU, included in the deposits of Palmottu and Pahtavuoma-U. No Inferred resources are reported.
Undiscovered resources (Prognosticated & SR)
None reported.
Unconventional resources and other materials
As by-product resources, from 3 000 to 9 000 tU could be recovered from the Talvivaara black shales, and another 2 500 tU from the Sokli carbonatite.

Finland
161
URANIUM PRODUCTION
Historical review
Uranium production in Finland has been confined only to the now restored Paukkajanvaara mine, operated as a pilot plant between 1958 and 1961. A total of 40 000 tonnes of ore was hoisted, and the concentrates produced equalled about 30 tU. Currently, Finland has no production capability and has reported no plans to develop any.
Secondary sources of uranium
Finland does not produce or use mixed oxide fuels. Since 2000, Teollisuuden Voima Oy (TVO) has used re-enriched tails for fuel, totalling 427 tU natural by the end of 2004.
ENVIRONMENTAL ACTIVITIES AND SOCIO-CULTURAL ISSUES
The Paukkajanvaara uranium mine area was restored in the 1990s. After the final field measurements in 1999, the Finnish Centre for Radiation and Nuclear Safety gave the certificate of accomplished environmental restoration to the landowner in 2001.
According to legislation in Finland, as of 1996, export of spent nuclear fuel is not permitted. Since the beginning of the 1980s, investigations have been made to solve the problem of final disposal. Posiva Oy was established by Teollisuuden Voima Oy (TVO) and Fortum Power and Heat Oy, the power companies responsible for nuclear waste management, in 1996.
In 1999, Posiva filed an application for a decision-in-principle (DIP) on building of a final disposal facility. In December 2000 the government made a positive DIP and in May 2001 the Finnish Parliament ratified it. The final disposal facility will be built in Olkiluoto, at Eurajoki municipality. The DIP applies to the spent fuel from Finland´s present four nuclear power plant units. In May 2002, in parallel with the DIP ratification of the Olkiluoto 3 nuclear unit, the Parliament also ratified a DIP on the final disposal of the spent nuclear fuel of this unit.
Posiva Oy started the construction of the underground laboratory named Onkalo for final disposal of spent fuel in summer of 2004. Construction of the repository is expected to commence in 2013 and the disposal operations are planned to start in 2020.

Finland
162
URANIUM REQUIREMENTS
At the beginning of 2005, four reactors were in operation: Olkiluoto 1 and Olkiluoto 2 owned by the Finnish private utility TVO (Teollisuuden Voima Oy) and Loviisa 1 and Loviisa 2 owned by Fortum Power and Heat Oy (the former IVO). The installed capacity was about 2.7 Gwe net. Uranium requirements are approximately 520-550 tU/year for the four reactors.
In October 2003 TVO selected Olkiluoto as the location of the new unit and the consortium Framatome ANP – Siemens was selected as the main supplier in. The construction license application for Olkiluoto 3 pressurised water reactor (type EPR, European Pressurised Water Reactor) was submitted to the Council of State in 2004. The reactor’s thermal output is 4 300 MW and electric output about 1 600 MW. The granting of the construction license took place in 17 February 2005. The construction of the plant unit will probably take approximately four years. The new unit is planned to start commercial operation in the first half of 2009. The uranium requirements for this new unit will range from 200 to 300 tU/year.
Supply and procurement strategy
TVO procures natural uranium, enrichment services and fuel fabrication from several countries. Fortum Power and Heat Oy purchases fuel assemblies from Russia and Spain, but until now all the uranium has been from Russia.
NATIONAL POLICIES RELATING TO URANIUM
Licenses for mining, enrichment, possession, fabrication, production, transfer, handling, use and transport of nuclear materials and nuclear wastes may be granted only to natural persons, corporations or authorities under the jurisdiction of a Member State of the European Union. However, under special circumstances, foreign organisations or authorities may be granted a license to transport nuclear material or nuclear waste within Finland. No significant changes to Finnish uranium policy are reported.
URANIUM STOCKS
The nuclear power utilities maintain reserves of fuel assemblies from seven months to one year’s use, although the legislation demands only five months use.
URANIUM PRICES
Due to confidentiality aspects price data are not available.

Finland
163
Uranium Exploration and Development Expenditures and Drilling Effort – Domestic
Expenses in EUR 2002 2003 2004 2005 (expected)
Industry exploration expenditures 0 0 155 000 550 000
Government exploration expenditures 0 0 0 0
Industry development expenditures 0 0 0 0
Government development expenditures 0 0 0 0
Total expenditures 0 0 155 000 550 000
Industry exploration drilling (metres) 0 0 0 250
Number of industry exploration holes drilled 0 0 0 5
Government exploration drilling (metres) 0 0 0 0
Number of government exploration holes drilled 0 0 0 0
Industry development drilling (metres) 0 0 0 0
Number of development exploration holes drilled
0 0 0 0
Government development drilling (metres) 0 0 0 0
Number of development exploration holes drilled
0 0 0 0
Subtotal exploration drilling (metres) 0 0 0 250
Subtotal exploration holes 0 0 0 5
Subtotal development drilling (metres) 0 0 0 0
Subtotal development holes 0 0 0 0
Total drilling (metres) 0 0 0 250
Total number of holes 0 0 0 5
Reasonably Assured Resources* (tonnes U)
Production method <USD 40/kgU <USD 80/kgU <USD 130/kgU Recovery factor (%)
Underground mining 0 0 0
Open-pit mining 0 0 0
In situ leaching 0 0 0
Heap leaching 0 0 0
In-place leaching (stope/block leaching)
0 0 0
Co-product and by-product 0 0 0
Unspecified 0 0 1 500
Total 0 0 1 500
* In situ resources.

Finland
164
Reasonably Assured Resources by Deposit Type*
(tonnes U)
Deposit type <USD 40/kgU <USD 80/kgU <USD 130/kgU
Unconformity-related 0 0 0
Sandstone 0 0 0
Hematite breccia complex 0 0 0
Quartz-pebble conglomerate 0 0 0
Vein 0 0 500
Intrusive 0 0 1 000
Volcanic and caldera-related 0 0 0
Metasomatite 0 0 0
Other 0 0 0
Total 0 0 1 500
* In situ resources.
Historical Uranium Production (tonnes U in concentrate)
Production method Total
through end of 2001
2002 2003 2004 Total
through end of 2004
2005 (expected)
Open-pit mining1 15 0 0 0 15 0
Underground mining1 15 0 0 15 0
In situ leaching 0 0 0 0 0 0
Heap leaching 0 0 0 0 0 0
In-place leaching* 0 0 0 0 0 0
Co-product/by-product 0 0 0 0 0 0
U recovered from phosphates
0 0 0 0 0 0
Other methods** 0 0 0 0 0 0
Total 30 0 0 0 30 0
(1) Pre-2002 totals may include uranium recovered by heap and in-place leaching. * Also known as stope leaching or block leaching. ** Includes mine water treatment and environmental restoration.
Re-enriched Tails Production and Use (tonnes of natural U equivalent)
Re-enriched tails Total
through end of 2001
2002 2003 2004 Total
through end of 2004
2005 (expected)
Production 0 0 0 0 0 0
Usage 100 50 137 140 427 60

Finland/France
165
Net Nuclear Electricity Generation
2003 2004
Nuclear electricity generated (TWh net) 21.7 21.7
Installed Nuclear Generating Capacity to 2025 (MWe net)
2010 2015 2020 2025 2004 2005
Low High Low High Low High Low High
2 680 2 680 4 280 4 280 4 280 4 280 4 280 4 280 4 280 4 280
Annual Reactor-related Uranium Requirements to 2025 (excluding MOX) (tonnes U)
2010 2015 2020 2025 2004 2005
Low High Low High Low High Low High
536 522 690 760 690 760 690 760 690 760
• France •
URANIUM EXPLORATION
Uranium exploration in France began in 1946, focusing on already known uranium ore deposits and the few mineralization occurrences discovered during radium exploration. In 1948, exploration work led to the discovery of the La Crouzille deposit, formerly of major importance. By 1955, deposits had been identified in the granite areas of Limousin, Forez, Vendée and Morvan.
Prospecting activities were subsequently extended to sedimentary formations in small intragranitic basins and terrigeneous formations, arising from eroded granite mountains and mainly located north and south of the Massif Central.
Recent and ongoing uranium exploration and mine development activities
No domestic activities reported. Abroad, COGEMA has been focusing on targets aimed at the discovery of exploitable resources in Australia, Canada, Niger and Central Asia. COGEMA is also directly or indirectly involved in uranium exploration or development activities through subsidiaries. In Canada, Niger and Kazakhstan, it is involved in uranium mining operations and projects. In addition, without being an operator, it holds shares in several mining operations and research projects in different countries. French uranium exploration companies are all private companies in which the French government holds shares through the parent companies.

France
166
URANIUM RESOURCES
Identified resources (RAR & Inferred)
Following the closure of the last uranium mine in 2001 (Jouac), there are no longer Reasonably Assured Resources in France. The amount of Inferred Resources remains unchanged from the last edition of the Red Book (11 740 tU).
Undiscovered resources (Prognosticated & SR)
No systematic appraisal is made of undiscovered resources in France.
URANIUM PRODUCTION
Historical review
As a result of the mine closures French uranium production has declined since 1990. With the closure of the Lodève mining site in 1997 and of Le Bernardan in 2001, there remain no active uranium operations in France.
Ownership structure of the uranium industry
None.
Employment in the uranium industry
In France, the mining industry counts only a small number of working personnel involved in the remediation of former mining sites or to the supervision of exploration activities abroad.
Future production centres
There are no plans to develop new production centres in the near future.
Secondary sources of uranium
Production and use of mixed oxide fuel
The annual production of MOX fuel in France is around 140 t. This corresponds to the total amount of MOX fuel contained in fuel elements produced in France. Production over 100 t is sent abroad.

France
167
The Cadarache MOX fuel factory ceased its commercial production in 2003. The production of a
few fuel elements of a military quality from the United States was produced in 2004-2005 and returned to the Catawba nuclear power plant belonging to Duke Power.
Production and use of re-enriched tails
A fraction of the depleted UF flux generated through the enrichment activities is actually sent to the Russian Federation for re-enrichment. This fraction is limited to materials with mining origin, which allows its transfer (according to international and bilateral agreements dealing with the exchange of nuclear materials). The return flux is exclusively used for the force-feeding of the cascade operated in France (gaseous diffusion used in the Georges Besse plant run by EURODIF).
Production and use of re-processed uranium
Production of reprocessed uranium in France results from the activity of the La Hague reprocessing plant. The annual production was close to 1 000 tU in 2004. In France between 150 t to 400 tU are recycled every year in one or two reactors.
ENVIRONMENTAL ACTIVITIES AND SOCIO-CULTURAL ISSUES
None reported.
URANIUM REQUIREMENTS
The total number of nuclear power reactors should not change much with the addition of one EPR 1 600 MWe to be put into service between 2010 and 2015. After this addition, the total capacity of the nuclear power plants and uranium requirements should not change significantly since no reactor is expected to be shut down in the next 15-20 years.
Supply and procurement strategy
Since France is a net importer of uranium, its policy towards procurement is one of supply diversification. French mining operators participate in uranium exploration and exploitation outside France within the regulatory framework of the host countries. They also purchase uranium, under short or long-term contracts, either from mines in which they have shareholdings or from mines operated by third parties.
NATIONAL POLICIES RELATING TO URANIUM
There have been no significant changes to national policy since the last report. Uranium exploration and production in France are unrestricted within the framework of existing regulations. On the whole, France is mainly a uranium importing country and there are no tariff barriers for imports.

France
168
URANIUM STOCKS
Électricité de France (EDF) possesses strategic uranium inventories, the minimum level of which has been fixed at the equivalent of three years’ forward consumption to offset possible supply interruptions.
URANIUM PRICES
Information on uranium prices is not available.
Uranium Exploration and Development Expenditures – Abroad
Expenses in million EUR 2002 2003 2004 2005 (expected)
Industry exploration expenditures 10.0 10 13 18
Government exploration expenditures 0 0 0 0
Industry development expenditures 5.3 6 31 76
Government development expenditures 0 0 0 0
Total expenditures 15.3 16 44 94
Inferred Resources (tonnes U)
Production method <USD 40/kgU <USD 80/kgU <USD 130/kgU Recovery
factor (%)
Underground mining 0 0 0
Open-pit mining 0 0 11 740
In situ leaching 0 0 0
Heap leaching 0 0 0
In-place leaching (stope/block leaching)
0 0 0
Co-product and by-product 0 0 0
Unspecified 0 0 0
Total 0 0 11 740

France
169
Historical Uranium Production (tonnes U in concentrate)
Production method Total
through end of 2001
2002 2003 2004 Total
through end of 2004
2005 (expected)
Open-pit mining1 0 0 0 0 0 0
Underground mining1 454 0 0 0 0 0
In situ leaching 0 0 0 0 0 0
Heap leaching 0 0 0 0 0 0
In-place leaching* 0 0 0 0 0 0
Co-product/by-product 0 0 0 0 0 0
U recovered from phosphates
0 0 0 0 0 0
Other methods** 26 18 9 6 59 3
Total 73 848 18 9 6 73 881 3
(1) Pre-2002 totals may include uranium recovered by heap and in-place leaching. * Also known as stope leaching or block leaching. ** Includes mine water treatment and environmental restoration.
Uranium Industry Employment at Existing Production Centres (person-years)
2002 2003 2004 2005 (expected)
Total employment related to existing production centres
15 NA NA NA
Employment directly related to uranium production
6 NA NA NA
Mixed Oxide Fuel Production and Use (tonnes of natural U equivalent)
Mixed-oxide (MOX) fuels
Total through end
of 2001 2002 2003 2004
Total through end
of 2004
2005 (expected)
Production NA 1 000 1 000 1 000 NA 1 000
Usage NA 800 800 800 NA 800
Number of commercial reactors using MOX 20 20 20 20

France/Gabon
170
Reprocessed Uranium Use
(tonnes of natural U equivalent)
Reprocessed uranium
Total through end
of 2001 2002 2003 2004
Total through end
of 2004
2005 (expected)
Production NA 1 000 1 000 1 000 NA 1 100
Usage NA 150 150 150 NA 300
Net Nuclear Electricity Generation
2003 2004
Nuclear electricity generated (TWh net) 419.8 426.8
Installed Nuclear Generating Capacity to 2025 (MWe net)
2010 2015 2020 2025 2004 2005
Low High Low High Low High Low High
63 300 63 300 63 000 63 000 64 500 64 500 64 500 NA NA NA
Annual Reactor-related Uranium Requirements to 2025 (excluding MOX) (tonnes U)
2010 2015 2020 2025 2004 2005
Low High Low High Low High Low High
7 184 7 184 7 350 7 650 7 350 7 780 7 350 NA NA NA
• Gabon •
URANIUM EXPLORATION
Historical review
Prompted by the sudden demand for uranium following World War II, the French Commissariat à l'énergie atomique (CEA) initiated uranium exploration in Central Africa. Though based in the then Congo, CEA geologists extended their activities into Gabon. In 1956, surface scintillometry surveys led to a uranium discovery in Precambrian sandstones of the Franceville Basin in the vicinity of the village Mounana.

Gabon
171
Recent and ongoing uranium exploration and mine development activities
None reported.
URANIUM RESOURCES
Identified resources (RAR & Inferred)
See relevant Tables.
After mine and mill dismantling, RAR and Inferred resources were moved from the <USD 40/kgU cost category, to the USD 80-130/kgU cost category.
Undiscovered resources (Prognosticated & SR)
With the closure of uranium production facilities in Gabon, uranium resource estimates are no longer updated.
URANIUM PRODUCTION
Historical review
The uranium production of COMUF experienced significant fluctuations since the company started producing in 1961. Impacting parameters were the ore processing capacity as well as the international uranium market. The main changes were:
� 1961-1969: attainment of a production level of approximately 400 tU/year.
� 1970-1973: gradual production increase to 500 tU/year.
� 1974-1979: rapid production increase to 1 250 tU/year.
� 1980-1989: production decrease to 900 tU/year.
� 1990-1993: further reduction to 550 tU/year.
� 1994-1996: maintenance of a production level of 600 tU/year with the possibility of an adjustment to 550 tU/year.
� 1999: termination of uranium production operations and initiation of mill decommissioning.

Gabon
172
Status of production capability
All mining and milling infrastructures have been dismantled and are being reclaimed. Gabon terminated uranium production in 1999 and is decommissioning its production facilities.
Ownership structure of the uranium industry
COMUF operated under a mutual agreement (Convention d’Établissement) between the government of Gabon and the company.
Employment in the uranium industry
Employment at COMUF was 15 at the end of the year 2002, including six directly associated to reclamation.
ENVIRONMENTAL ACTIVITIES AND SOCIO-CULTURAL ISSUES
The most important environmental concerns are related to the impacts caused by the mining and milling activities. This includes the long-term management of the tailings and other waste produced at the mill site.
With the termination of all uranium production in Gabon, the government started a programme for rehabilitation of the complete Mounana mining and milling operation. There are seven sites covering a total surface of about 60 hectares to be rehabilitated. The work to be done consists of:
� The closure of all impoundments for tailings and other residues.
� The development of a lateritic cover over the tailings.
� Revegetation of the sites.
The objective of this remediation work is to assure a residual radiological impact that is as low as is reasonably achievable (i.e. following the ALARA principle). The work is intended also to ensure the physical stability of the impoundments of the residues, and if possible, provide for the future utilisation of the affected area.
The Mounana mill is completely dismantled and restoration of the site was completed by late 2004. A programme for long-term monitoring and surveillance of the tailings is implemented.
Environmental Costs Associated to Uranium Exploitation
Cost (XOF million)
Tailings reclamation 4 820
Sites reclamation 1 730
Monitoring 500
Total 7 050

Gabon
173
NATIONAL POLICIES RELATING TO URANIUM
Gabon has no uranium requirements and reported no information on national policies relating to uranium, uranium stocks, or uranium prices.
Reasonably Assured Resources (tonnes U)
Production method <USD 40/kgU <USD 80/kgU <USD 130/kgU Recovery
factor (%)
Underground mining 0 0 4 830
Open-pit mining 0 0 0
In situ leaching 0 0 0
Heap leaching 0 0 0
In-place leaching (stope/block leaching)
0 0 0
Co-product and by-product 0 0 0
Unspecified 0 0 0
Total 0 0 4 830
Inferred Resources (tonnes U)
Production method <USD 40/kgU <USD 80/kgU <USD 130/kgU Recovery
factor (%)
Underground mining 0 0 1 000
Open-pit mining 0 0 0
In situ leaching 0 0 0
Heap leaching 0 0 0
In-place leaching (stope/block leaching)
0 0 0
Co-product and by-product 0 0 0
Unspecified 0 0 0
Total 0 0 1 000

Gabon
174
Historical Uranium Production (tonnes U in concentrate)***
Production method Total
through end of 2001
2002 2003 2004 Total
through end of 2004
2005 (expected)
Open-pit mining1 12 147 0 0 0 12 147 0
Underground mining1 15 725 0 0 0 15 725 0
In situ leaching 0 0 0 0 0 0
Heap leaching 0 0 0 0 0 0
In-place leaching* 0 0 0 0 0 0
Co-product/by-product 0 0 0 0 0 0
U recovered from phosphates
0 0 0 0 0 0
Other methods** 0 0 0 0 0 0
Total 27 872 0 0 0 27 872 0
(1) Pre-2002 totals may include uranium recovered by heap and in-place leaching.
* Also known as stope leaching or block leaching.
** Includes mine water treatment and environmental restoration.
*** Uranium contained in the ore. Total production of uranium contained in concentrates was 26 612 tU. Of the total production, 94 tU were found to be depleted in 235U. This uranium was produced from the natural reactor sites of the Oklo deposits.
Uranium Industry Employment at Existing Production Centres (person-years)
2002 2003 2004 2005 (expected)
Total employment related to existing production centres
15 10
Employment directly related to uranium production

Germany
175
• Germany •
URANIUM EXPLORATION
Historical review
Exploration for uranium in Germany occurred in two separate countries prior to reunification on 3 October 1990. A summary of the activities within the two countries is provided.
Former German Democratic Republic before 1990
Uranium exploration and mining was undertaken from 1946 to 1953 by the Soviet stock company, SAG Wismut. These activities were centred around old mining locations of silver, cobalt, nickel and other metals in the Erzgebirge (Ore Mountains) and in Vogtland, Saxony, where uranium had first been discovered in 1789. The mining of uranium first began at the cobalt and bismuth mines near Schneeberg and Oberschlema (a former famous radium spa). During this early period more than 100 000 people were engaged in exploration and mining actitvities. The richer pitchblende ore from the vein deposits was hand-picked and shipped to the USSR for further processing. Lower grade ore was treated locally in small processing plants. In 1950, the central mill at Crossen near Zwickau, Saxony was brought into operation.
In 1954, a new joint Soviet-German stock company was created, Sowjetisch-Deutsche Aktiengesellschaft Wismut (SDAG Wismut). The joint company was held equally by both governments. The entire uranium production either hand-picked concentrate, gravity concentrate, or chemical concentrate was shipped to the USSR for further treatment. The price for the final product was simply agreed to between the two partners. Profits were used for further exploration.
At the end of the 1950s, uranium mining was concentrated in the region of Eastern Thuringia. Uranium exploration had started in 1950 in the vicinity of the radium spa at Ronneburg. From the beginning of the 1970s, the mines in Eastern Thuringia provided about two-thirds of SDAG Wismut’s annual production.
Between the mid-1960s and the mid-1980s, about 45 000 people were employed by SDAG Wismut. In the mid-1980s, Wismut’s employment decreased to about 30 000. In 1990, only 18 000 people worked in uranium mining and milling.
Uranium exploration using a variety of ground-based and aerial techniques occurred in the southern part of the former GDR that covered an extensive area of about 55 000 km2. About 36 000 holes were drilled in an area covering approximately 26 000 km2. Total expenditures for uranium exploration over the life of the GDR programme were on the order of 5.6 billion GDR Marks.

Germany
176
Federal Republic of Germany before 1990
Starting in 1956, exploration was carried out in several areas of geological interest: the Hercynian Massifs of the Blask Forest, Odenwald, Frankenwald, Fichtelgebirge, Oberpfalz, Bayerischer Wald, Harz, the Paleozoic sediments of the Rheinisches Schiefergebirge, the Permian volcanics and continental sediments of the Saar-Nahe region and other areas with favourable sedimentary formations.
The initial phase included hydro-geochemical surveys, carborne surveys, surveys on foot, and, to a lesser extent, airborne prospecting. Follow-up geochemical stream sediment surveys, radon surveys, and detailed radiometric work, followed by drilling and trenching were carried out in promising areas.
During the reconnaissance and detailed exploration phases both the federal and state geological surveys were involved, whereas the actual work was carried out mainly by industrial companies.
Three deposits of economic interest were found: the partly high-grade hydrothermal deposit near Menzenschwand in the southern Black Forest, the sedimentary Müllenbach deposit in the northern Black Forest, and in the Grossschloppen deposit in north-eastern Bavaria. Uranium exploration ceased in western Germany in 1988. Through 1988, about 24 800 holes were drilled, totalling about 354 500 metres. Total expenditures were on the order of USD 111 million.
There have been no exploration activities in Germany since the end of 1990. Several German mining companies did perform exploration abroad mainly in Canada up through 1997.
Recent and ongoing uranium exploration and mine development activities
There are no exploration activities and no plans for future activities.
URANIUM RESOURCES
Identified resources (RAR & Inferred)
Known conventional resources were last assessed in 1993. The known conventional resources occur mainly in the closed mines, which are in the process of being decommissioned. Their future availability remains uncertain.
Undiscovered resources (Prognosticated & SR)
All undiscovered conventional resources are reported as speculative resources in the cost category above USD 130/kgU.

Germany
177
URANIUM PRODUCTION
Historical review
Federal Republic of Germany before 1990
A uranium processing centre at Ellweiler, in the state of Baden-Württemberg was operated by Gewerkschaft Brunhilde beginning in 1960. Serving as a test mill for several types of ore its capacity was only 125 tU per year. It was closed on 31 May 1989 after producing around 700 tU.
Former German Democratic Republic before 1990
Two processing plants were operated by SDAG Wismut in the territories of the former GDR. A plant at Crossen, near Zwickau in Saxony, started processing ore in 1950. The ore was transported by road and rail from numerous mines in the Erzgebirge. The composition of the ore from the hydrothermal deposits required carbonate pressure leaching. The plant had a maximum capacity of 2.5 million tonnes of ore per year. Crossen was permanently closed on 31 December 1989.
The second plant at Seelingstadt, near Gera, Thuringia, started ore processing operations in 1960 using the nearby black shale deposits. The maximum capacity of this plant was 4.6 million tonnes of ore per year. Silicate ore was treated by acid leaching until the end of 1989. Carbonate-rich ores were treated using the carbonate pressure leaching technique. After 1989, Seelingstadt’s operations were limited to the treatment of slurry produced at the Königstein Mine using the carbonate method.
Since 1992, all uranium production in Germany has been derived from the clean-up operations at the Königstein mine.
Status of production capability
There is no commercial production of uranium in Germany. Since 1991 uranium is recovered from clean-up activities in previous mines. Between 1991 and 2001, the recovery from mine water treatment and environmental restoration totalled 1 783 tU.
Ownership structure of the uranium industry
In August 1998, Cameco completed its acquisition of Uranerz Exploration and Mining Ltd. (UEM), Canada, and Uranerz USA Inc. (UUS), from their German parent company Uranerzbergbau GmbH (Preussag and Rheinbraun, 50% each). As a result, no commercial uranium industry remains. The German federal government through Wismut GMBH retains ownership of all uranium recovered in clean up operations.

Germany
178
Employment in the uranium industry
All employment is engaged in decommissioning and rehabilitation of former production facilities.
Future production centres
None reported.
ENVIRONMENTAL ACTIVITIES AND SOCIO-CULTURAL ISSUES
With the reunification of Germany in 1990, commercial uranium production was terminated. The German government took responsibility for the decommissioning and rehabilitation of former production sites and has allocated a total of DEM 13 billion (EUR 6.6 billion) in its federal budget. Up to the end of 2004 about EUR 4.4 billion have been spent. Thanks to the efforts jointly invested in the Wismut project by all participants, significant progress has been achieved leading to a significant abatement of adverse environmental impacts. Expenditures related to environmental activities are tabulated below.
Expenditures for Environmental Activities (EUR million)
1991-2001 2002 2003 2004 Total
Monitoring 110.8 18.9 18.7 16.1 164.5
Rehabilitation of tailings 169.4 31.9 29.1 31.4 261.8
Site rehabilitation1 180.1 17.4 21.9 24.1 243.5
Water treatment 250.1 43.4 46.3 40.0 379.8
Waste rock management2 480.4 71.2 68.0 63.5 683.1
Total 1 190.8 182.8 184.0 175.1 1 732.7
(1) Including demolition. (2) Including planning, licensing, administration.
URANIUM REQUIREMENTS
Historical review
According to the agreement between the federal government of Germany and the utility companies dated 14 June 2000, the future utilisation of nuclear power plants shall be restricted. For each plant the residual operating life remaining after 1 January 2000 shall be calculated on the basis of a standard operating life of 32 calendar years from the commencement of commercial power operation. Accordingly, future uranium requirements will decrease; however, details of the annual requirements for the period to 2025 cannot be given. Germany reported no information on national policies relating to uranium, uranium stocks, or uranium prices.
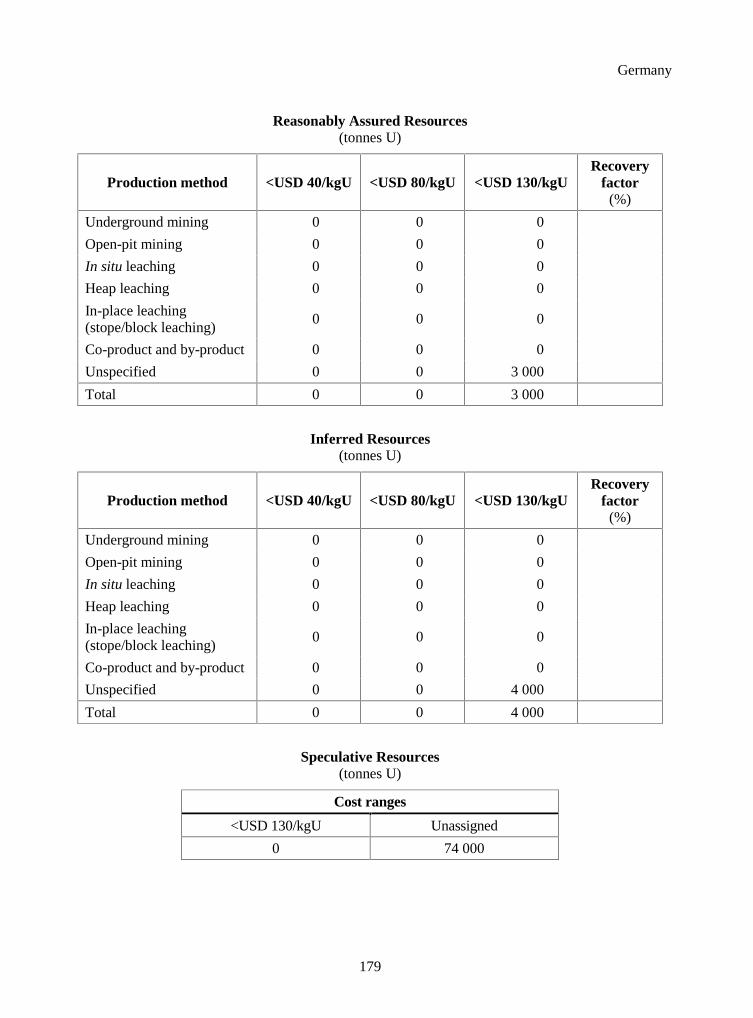
Germany
179
Reasonably Assured Resources (tonnes U)
Production method <USD 40/kgU <USD 80/kgU <USD 130/kgU Recovery
factor (%)
Underground mining 0 0 0
Open-pit mining 0 0 0
In situ leaching 0 0 0
Heap leaching 0 0 0
In-place leaching (stope/block leaching)
0 0 0
Co-product and by-product 0 0 0
Unspecified 0 0 3 000
Total 0 0 3 000
Inferred Resources (tonnes U)
Production method <USD 40/kgU <USD 80/kgU <USD 130/kgU Recovery
factor (%)
Underground mining 0 0 0
Open-pit mining 0 0 0
In situ leaching 0 0 0
Heap leaching 0 0 0
In-place leaching (stope/block leaching)
0 0 0
Co-product and by-product 0 0 0
Unspecified 0 0 4 000
Total 0 0 4 000
Speculative Resources (tonnes U)
Cost ranges
<USD 130/kgU Unassigned
0 74 000

Germany
180
Historical Uranium Production
(tonnes U in concentrate)
Production method Total
through end of 2001
2002 2003 2004 Total
through end of 2004
2005 (expected)
Open-pit mining1 0 0 0 0 0 0
Underground mining1 0 0 0 0 0 0
In situ leaching 0 0 0 0 0 0
Heap leaching 0 0 0 0 0 0
In-place leaching* 0 0 0 0 0 0
Co-product/by-product 0 0 0 0 0 0
U recovered from phosphates
0 0 0 0 0 0
Other methods** 55 221 150 77 503 80
Total 218 869 221 150 77 219 317 80
(1) Pre-2002 totals may include uranium recovered by heap and in-place leaching. * Also known as stope leaching or block leaching. ** Includes mine water treatment and environmental restoration.
Ownership of Uranium Production in 2004
Domestic Foreign
Government Private Government Private Totals
[tU] [%] [tU] [%] [tU] [%] [tU] [%] [tU] [%]
77 100 0 0 0 0 0 77 100
Uranium Industry Employment at Existing Production Centres (person-years)
2002 2003 2004 2005 (expected)
Total employment related to existing production centres
2 691 2 509 NA NA
Employment directly related to uranium production
NA NA NA NA
Mixed Oxide Fuel Production and Use (tonnes of natural U equivalent)
Mixed-oxide (MOX) fuels
Total through end
of 2001 2002 2003 2004
Total through end
of 2004
2005 (expected)
Production 0 0 0 0 0 0
Usage 4 000 420 620 590 5 630 730
Number of commercial reactors using MOX 9 9 9 9
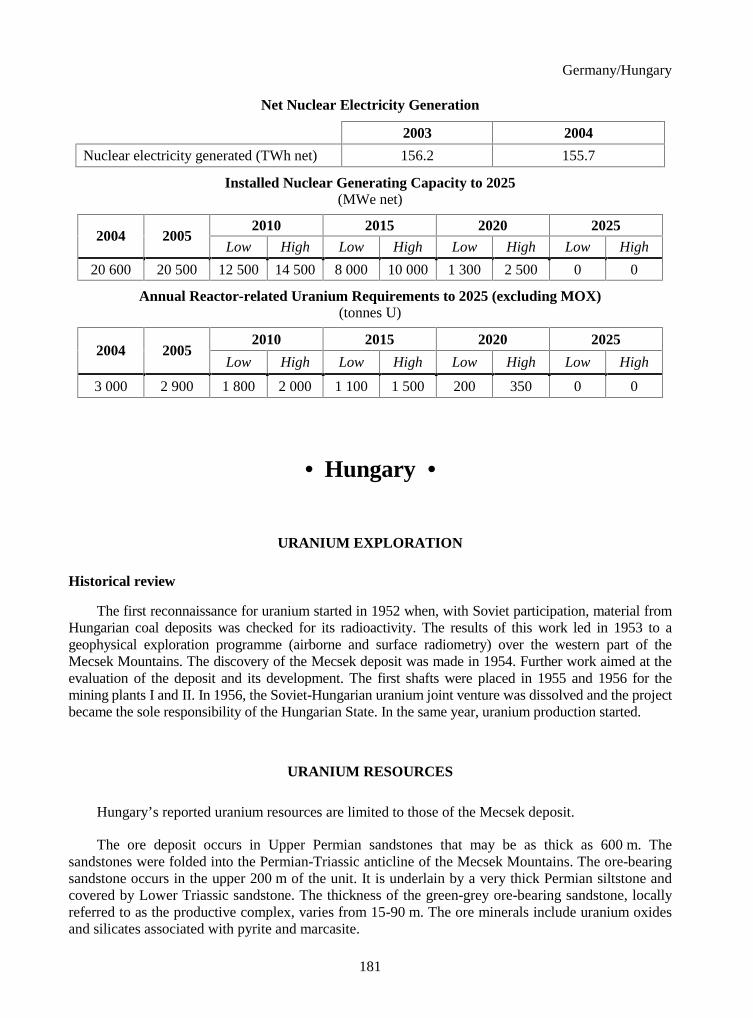
Germany/Hungary
181
Net Nuclear Electricity Generation
2003 2004
Nuclear electricity generated (TWh net) 156.2 155.7
Installed Nuclear Generating Capacity to 2025 (MWe net)
2010 2015 2020 2025 2004 2005
Low High Low High Low High Low High
20 600 20 500 12 500 14 500 8 000 10 000 1 300 2 500 0 0
Annual Reactor-related Uranium Requirements to 2025 (excluding MOX) (tonnes U)
2010 2015 2020 2025 2004 2005
Low High Low High Low High Low High
3 000 2 900 1 800 2 000 1 100 1 500 200 350 0 0
• Hungary •
URANIUM EXPLORATION
Historical review
The first reconnaissance for uranium started in 1952 when, with Soviet participation, material from Hungarian coal deposits was checked for its radioactivity. The results of this work led in 1953 to a geophysical exploration programme (airborne and surface radiometry) over the western part of the Mecsek Mountains. The discovery of the Mecsek deposit was made in 1954. Further work aimed at the evaluation of the deposit and its development. The first shafts were placed in 1955 and 1956 for the mining plants I and II. In 1956, the Soviet-Hungarian uranium joint venture was dissolved and the project became the sole responsibility of the Hungarian State. In the same year, uranium production started.
URANIUM RESOURCES
Hungary’s reported uranium resources are limited to those of the Mecsek deposit.
The ore deposit occurs in Upper Permian sandstones that may be as thick as 600 m. The sandstones were folded into the Permian-Triassic anticline of the Mecsek Mountains. The ore-bearing sandstone occurs in the upper 200 m of the unit. It is underlain by a very thick Permian siltstone and covered by Lower Triassic sandstone. The thickness of the green-grey ore-bearing sandstone, locally referred to as the productive complex, varies from 15-90 m. The ore minerals include uranium oxides and silicates associated with pyrite and marcasite.

Hungary
182
Identified resources (RAR & Inferred)
Hungary reports its RAR & Inferred resources as zero.
Undiscovered resources (Prognosticated & SR)
Speculative resources are not estimated. Known uranium resources classified as prognosticated are recoverable at costs <USD 130/kgU. These resources are tributary to the Mecsek production centre.
URANIUM PRODUCTION
Historical review
The Mecsek mine and the underground facility, was the only uranium producer in Hungary. Prior to 1 April 1992, it was operated as the state-owned Mecsek Ore Mining Company (MÉV). The complex began operation in 1956 and was producing ore from a depth of 100-800 metres until 1997 when it was finally shut down. It has been producing about 500 000-600 000 tonnes/year at an average mining recovery of 50-60%. The ore processing plant has a capacity of 1 300 to 2 000 tonnes ore/day and employs radiometric sorting, agitation acid leach (and alkaline heap leaching) with ion exchange recovery. The nominal production capacity of the plant was about 700t/year.
The Mecsek mine consisted of five sections with the following history:
Section I: operating from 1956 to 1971.
Section II: operating from 1956 to 1988.
Section III: operating from 1961 to 1993.
Section IV: operating from 1971 to 1997.
Section V: operating from 1988 to 1997.
The ore processing plant became operational in 1963. Until that time, raw ore was exported to the USSR. A total of 1.2 million tonnes was shipped to the Sillimae metallurgy plant in Estonia. After 1963, uranium concentrates were shipped to the Soviet Union.
The mining and milling operations were closed down at the end of 1997, because of changes in market conditions. Until this date the total production from the Mecsek site, including the heap leaching, was about 21 000 tU.
Status of production capability
Since 1998 the only uranium production has been about 10 tU/year until 2002 as a by-product of water treatment activities. From 2002 to 2004 this has been 4-5 tU/year.

Hungary
183
ENVIRONMENTAL ACTIVITIES AND SOCIO-CULTURAL ISSUES
In 1998, after the closure of the mines, began the stabilisation and remediation work on the base of the conceptual plan, which was made by the staff and accepted by the competent authorities of Hungary. The government accepted the financial requirement and appointed the time of completion to be the end of 2002. This deadline was modified several times because of financial problems. The new deadline is the end of 2006. The most important activities were the covering of the tailing ponds and the vertical drainage as well as the conditioning and placing of the precipitation-waste for water treatment.
Costs of Environmental Management (HUF thousands)
Pre-1998 1998-1999 2000 2001 2002 2003 2004 Closing of underground spaces
NA 2 107 897 281 992 0 0 0 0
Reclamation of surficial establishments and areas
NA 459 447 589 728 651 766 320 519 67 895 31 610
Reclamation of waste rock piles and their environment
NA 222 943 141 253 286 930 82 543 37 209 0
Reclamation of heap-leaching piles and their environment
NA 900 941 608 231 115 936 18 938 0 0
Reclamation of tailings ponds and their environment
NA 538 203 741 195 1 304 629 1 869 523 941 816 274 807
Water treatment
NA 626 649 383 436 243 941 241 686 0 0
Reconstruction of electric network
NA 0 98 361 20 790 0 0 0
Reconstruction of water and sewage system
NA 1 000 0 0 0 0 0
Other infrastructural service
NA 342 000 93 193 42 651 47 329 0 0
Other activities including monitoring, staff, etc.
NA 581 197 431 678 461 512 367 677 101 227 38 045
SUBTOTAL 5 406 468 5 780 277 3 369 067 3 128 155 2 948 275 1 148 147 344 462 Reserves for the amount of 1998-2000
139 120 0 0 0 0 0
TOTAL 5 406 408 5 919 397 3 369 067 3 128 155 2 948 275 1 148 147 344 462
NA Not available.

Hungary
184
URANIUM REQUIREMENTS
Hungary operates the Paks nuclear plant which consists of four VVER-440-213 type reactor units with a total net nuclear generating capacity of about 1 800 MWe net. At present, there are no firm plans for construction of additional units. Recently Paks was granted an extension of its operating lifetime.
The annual uranium requirements for the Paks NPP are about 370 tU. Until 1997, the requirements could be met by uranium mined domestically. Since that time the uranium requirements are solely satisfied by imports from Russia.
NATIONAL POLICIES RELATING TO URANIUM
Since the shutdown of the Hungarian uranium industry in 1997, there is no uranium related policy. Hungary reported its uranium stocks at zero.
Prognosticated Resources (tonnes U)
Cost ranges
<USD 80/kgU <USD 130/kgU
0 18 399
Historical Uranium Production (tonnes U in concentrate)
Production method Total
through end of 2001
2002 2003 2004 Total
through end of 2004
2005 (expected)
Open-pit mining1 0 0 0 0 0 0
Underground mining1 20 475 0 0 0 20 475 0
In situ leaching 0 0 0 0 0 0
Heap leaching 525 0 0 0 525 0
In-place leaching* 0 0 0 0 0 0
Co-product/by-product 0 0 0 0 0 0
U recovered from phosphates
0 0 0 0 0 0
Other methods** 40 10 4 4 58 4
Total 21 040 10 4 4 21 058 4
(1) Pre-2002 totals may include uranium recovered by heap and in-place leaching. * Also known as stope leaching or block leaching. ** Includes mine water treatment and environmental restoration.
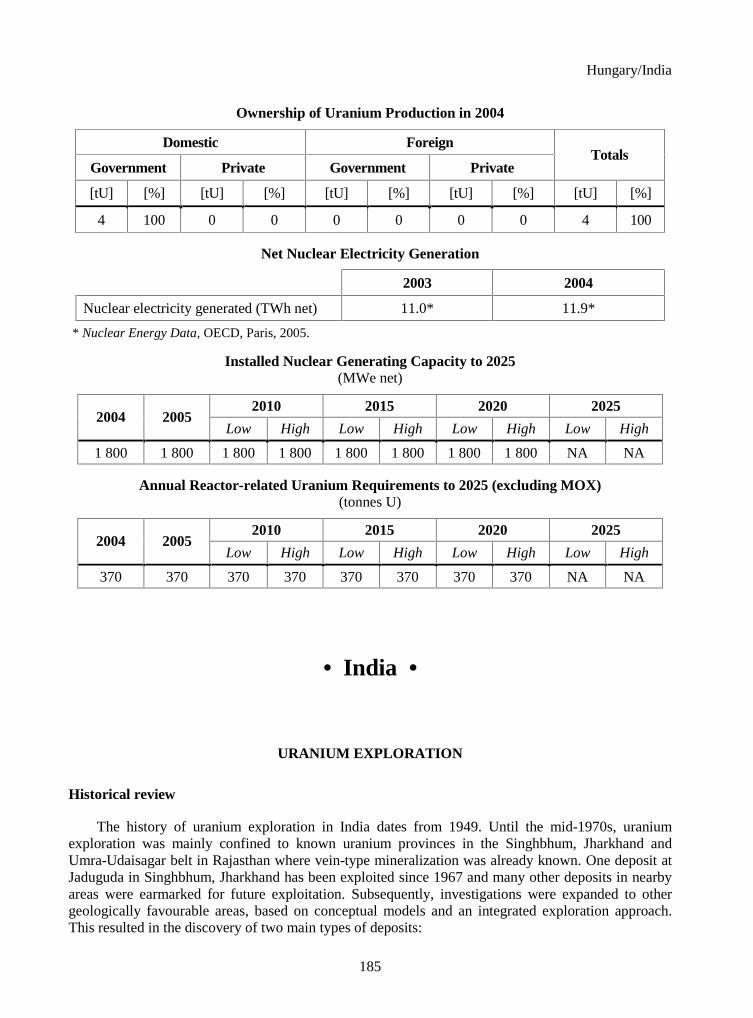
Hungary/India
185
Ownership of Uranium Production in 2004
Domestic Foreign
Government Private Government Private Totals
[tU] [%] [tU] [%] [tU] [%] [tU] [%] [tU] [%]
4 100 0 0 0 0 0 0 4 100
Net Nuclear Electricity Generation
2003 2004
Nuclear electricity generated (TWh net) 11.0* 11.9*
* Nuclear Energy Data, OECD, Paris, 2005.
Installed Nuclear Generating Capacity to 2025 (MWe net)
2010 2015 2020 2025 2004 2005
Low High Low High Low High Low High
1 800 1 800 1 800 1 800 1 800 1 800 1 800 1 800 NA NA
Annual Reactor-related Uranium Requirements to 2025 (excluding MOX) (tonnes U)
2010 2015 2020 2025 2004 2005
Low High Low High Low High Low High
370 370 370 370 370 370 370 370 NA NA
• India •
URANIUM EXPLORATION
Historical review
The history of uranium exploration in India dates from 1949. Until the mid-1970s, uranium exploration was mainly confined to known uranium provinces in the Singhbhum, Jharkhand and Umra-Udaisagar belt in Rajasthan where vein-type mineralization was already known. One deposit at Jaduguda in Singhbhum, Jharkhand has been exploited since 1967 and many other deposits in nearby areas were earmarked for future exploitation. Subsequently, investigations were expanded to other geologically favourable areas, based on conceptual models and an integrated exploration approach. This resulted in the discovery of two main types of deposits:

India
186
� A relatively high-grade, medium-tonnage deposit in the Cretaceous sandstones of Meghalaya
in northern India.
� Low-grade, large tonnage, stratabound deposit in the Middle Proterozoic dolostones of Cuddapah Basin in Andhra Pradesh.
Other small, moderately low-grade deposits discovered during this phase of exploration include:
� Lower Proterozoic amphibolites at Bodal, Chhattisgarh.
� Lower Proterozoic sheared migmatites of Chhotanagpur gneiss complex at Jajawal, Chhattisgarh.
� Basal quartz pebble conglomerates at Walkunji, Western Karnataka and Singhbhum, Jharkhand.
During the early-1990s, a near surface deposit was discovered adjacent to the unconformity contact between basement granites with overlying Proterozoic Srisailam Quartzite at Lambapur in Nalgonda district, Andhra Pradesh. These and others showings were further followed up, and by 1996 the following areas had been identified on the basis of favourable geological criteria and promising exploration results. They were consequently selected for intensive investigations: Cuddapah Basin, Andhra Pradesh; Cretaceous sandstones of Meghalaya; Son Valley, Madhya Pradesh and Uttar Pradesh; Singhbhum Shear Zone, Jharkhand and Orissa; and Aravallis, Rajasthan.
Exploration drilling in the Lambapur Peddagattu area has confirmed the potential of the northwest part of the Cuddapah Basin. Cretaceous sandstones in Meghalaya have been identified as a potential horizon for uranium concentration. Surveys and prospection in the areas around the Domiasiat uranium deposit have revealed further promising areas.
Recent and ongoing uranium exploration and mine development activities
Uranium exploration activities in India have been concentrated in the following areas:
� Proterozoic Aravalli-Delhi basins, Rajasthan.
� Meso-Neoproterozoic Cuddapah basin, Andhra Pradesh.
� Neoproterozoic Bhima basin, Karnataka.
� Cretaceous sedimentary basin, Meghalaya.
Proterozoic Dehli-Aravalli basins, Rajasthan
The zone of albitisation, with varying dimensions over 320 km in length, also referred to as “albitite line”, occurs along the contact of the Mesoproterozoic Dehli Supergroup and Archean Banded Gneissic Complex (BGC), between Raghunathpura in Haryana and Ladera and Tal in Rajasthan. A number of uranium and uranium-thorium anomalies were reported along this zone. The anomaly located at Ghateshwar and Rohil, Sikar district Rajasthan, are being explored in detail.

India
187
At Ghateshwar-Rohil uranium mineralization is associated with albitite within carbonaceous phyllite and mica schist of Delhi Supergroup. At Rohil, a relatively small deposit has been established. Currently the area is under exploration for augmentation of resources.
Meso-Neoproterozoic Cuddapah basin, Andhra Pradesh
The Cuddapah basin is spread over 44 000 km2 encompassing Papaghni, Nallamalai, Srisailam, Kurnool and Palnad sub-basins. The basement Archean gneisses/Dharwar metasedimentaries are thrusted over Cuddapah Supergroup rocks on the eastern margin of the basin. Three types of uranium deposits have been identified in the Cuddapah basin. These include stratabound deposits, unconformity-related deposits and fracture-controlled uranium mineralization.
Unconformity-related deposits
Evaluation and exploratory drilling of the mineralised unconformity contact between the basement granite and the overlying Srisailam Quartzite has further strengthened the resource position of Peddagattu deposit located in the north-eastern part of the basin.
A small size deposit associated with basement granite and overlying quartzite of Banganapalle Formation of Kurnool Group has been established at Koppunuru, Kurnool sub-basin, where further exploration is being continued.
Surveys carried out in the northern part of the Palnad sub-basin, have indicated the presence of uranium anomalies in basement granite, basic dykes and overlying quartzite of Banganapalle Formation over an area of 7 km2 between Rallavagu Tanda and Damarchela, Nalgonda district.
Fracture controlled uranium mineralization
The Gulcheru quartzite exposed in the southern part of the basin is fractured, faulted and intruded by basic dykes. Uranium mineralization is associated with the quartz-chlorite breccia and is intermittently spread over an area of 35 km2 along Madyalabodu-Gandi-Rachakuntapalle-Kannampalle tract and at Idupulapaya in Cuddapah district, Andhra Pradesh. Exploratory drilling is being continued at Madyalabodu, which has indicated that the ore is sub-horizontal, and lensoid in nature and occurs about 3-8 m above the unconformity.
Neoproterozoic Bhima basin, Karnataka
The Bhima basin consists of arenaceous, calcareous and argillaceous sediments of Bhima Group and is affected by a number of E-W and NW-SE trending major faults. The exploration carried out at Gogi has established a small size, medium grade deposit associated with limestone and basement granite. Some drill-holes have intercepted mineralization with grades over 1% U, with appreciable thickness. The Ore (limestone as well as granite) is amenable to conventional leaching by alkaline route.

India
188
Cretaceous sedimentary basin, Meghalaya
Evaluation and exploratory drilling of the mineralised Mahadek sandstone has further strengthened the resource position of Wahkyn deposit located about 10 km SW of Domisiat in West Khasi Hills district.
New areas favourable for sandstone-type uranium mineralization have been identified in Rongcheng Plateau, Garo Hills, in western part of Meghalaya.
Other potential areas
Uranium exploration for locating unconformity related deposits has been taken up in the Mesoproterozoic Gwalior Basin, Madhya Pradesh, and Chhattisgarh basin, Chhattisgarh.
Some of the earlier located uranium occurrences associated with quartz pebble conglomerates (QPC) are now being re-looked at to establish their potential.
India reported expenditures for exploration abroad as zero.
URANIUM RESOURCES
Identified resources (RAR & Inferred)
India’s known conventional uranium resources (RAR and Inferred) are estimated to contain 84 600 tU and are hosted by the following type of deposits:
Vein type 53.7% Sandstone type 16.4% Unconformity type 7.7% Others 22.2%
As of 1 January 2005, the known conventional in situ resources includes 54 800 tU under Reasonably Assured Resources (RAR) and 29 800 tU under Inferred Resources (IR) categories. There is only a marginal increase compared to the 2003 figure in respect of RAR. Substantial increase in the IR is mainly due to additional data accrued for some of the deposits, reported in past years in the EAR-II category (now named Prognosticated Resources), which ultimately firmed up.
Undiscovered resources (Prognosticated & SR)
In part of Rajasthan, Madhya Pradesh, Karnataka, Meghalaya and Andhra Pradesh, uranium resources were firmed up with enhanced degree of confidence and some of the resources, reported in previous editions in the EAR-II category, were reassigned to the IR category. This resulted in a slight decrease of resources in the Prognosticated Resources (PR) category, which was the EAR-II category. There was no change in the resources under the SR category. Many new potential areas were also identified. As of 1 January 2005, the undiscovered resources include 12 100 tU under the PR category and 17 000 tU under the SR category as in situ resources.

India
189
URANIUM PRODUCTION
Historical review
The Uranium Corporation of India Limited (UCIL) was formed in October 1967 under the administrative control of the Department of Atomic Energy, government of India. UCIL is now operating three underground mines at Jaduguda, Narwapahar and Bhatin in the eastern part of the Singhbhum district, Jharkhand State. The ore is treated in the processing plant located at Jaduguda, about 150 km west of Kolkata (formerly Calcutta).
In addition, uranium was recovered as a by-product from the tailings available from the copper concentrator plants of M/S Hindustan Copper Ltd, at the Rakha and Mosaboni mines. The uranium was then further processed in the Jaduguda mill. As the copper mining in the area has been scaled down, uranium recovery from tailing has been temporarily suspended.
Status of production capability
Uranium is produced by the Uranium Corporation of India Limited (UCIL), a Public Sector Undertaking under the Department of Atomic Energy, government of India. UCIL is operating four underground mines at Jaduguda, Narwapahar, Bhatin and Turamdih in the Singhbhum East District, Jharkhand State. The ore is treated in the processing plant located at Jaduguda. The total installed capacity of the Jaduguda mill is about 2 100 t ore/day.
Detailed information on the Jaduguda, Narwapahar and Bhatin mines and the Jaduguda mill was given in the 1997 and 2001 editions of the Red Book. The Turamdih deposit is located about 12 km west of Narwapahar.
The uranium mine at Turamdih was commissioned in 2003. This mine is under development, the first level at a depth of 70 m being accessed by an eight degree decline from the surface. A vertical shaft is being sunk to provide access to deeper levels.
Ownership of the uranium industry
The uranium industry is wholly owned by the department of Atomic Energy, government of India. The Atomic Minerals Directorate for Exploration and Research under the Department of Atomic Energy is responsible for uranium exploration programmes in India. Following the discovery and deposit delineation, the economic viability is worked out. The evaluation stage may also include exploratory mining. Once a deposit of sufficient tonnage and grade in proved, UCIL initiates activities for commercial mining and production of uranium concentrates.
Employment in the uranium industry
About 4 200 people are engaged in uranium mining and milling activities.

India
190
Future production centres
The uranium deposits located at Banduhurang, Bagjata and Mohuldih in Singhbhum east district, Jharkhand, are being proposed for commercial mining. Various pre-project activities have been taken up. The deposit located at Banduhurang in Singhbhum east district, Jharkhand, is being proposed for opencast mining. The orebody at Banduhurang is the western extension of ore lenses at Turamdih. The deposit at Bagjata, about 30 km east of Jaduguda, is being proposed for underground mining. The uranium deposit located at Mohuldih, about 2.5 km west of Banduhurang is being proposed for underground mining. A new ore processing plant at Turamdih is under construction to treat the ore of the Turamdih and Banduhurang mines. This plant will undergo expansion at an appropriate time to treat the ore of Mohuldih mine. The uranium deposits located at Lambapur-Peddagattu in Nalgonda district, Andhra Pradesh are being planned for development. One open-pit mine and three underground mines are proposed at this site. The construction of a uranium ore processing plant is being proposed at Seripally, 50 km away from the mine site. Another uranium deposit at Domiasiat in West Khasi Hills District, Meghalaya State in the north-eastern part of the country, is being planned for open-pit mining with a processing plant near the site.
Uranium Production Centre Technical Details (as of 1 January 2005)
Centre # 1 Centre # 2 Centre # 3 Centre # 4
Name of production centre Jaduguda Bhatin Narwapahar Bagjata
Production centre classification operating operating operating planned
Start-up date 1968 1986 1995 2007
Source of ore: � Deposit name Jaduguda Bhatin Narwapahar Bagjata � Deposit type vein vein vein vein � Reserves (tU) � Grade (% U)
Mining operation:
� Type (OP/UG/ISL) UG UG UG UG
� Size (t ore/day) 600 130 1 000 500 � Average mining recovery (%) 80 75 80 80
Processing plant (acid/alkaline): Jaduguda � Type (IX/SX/AL) IX/AL � Size (t ore/day) 2 100 (dry ore) � Average process recovery (%) 80
Nominal production capacity (tU/year) 175
Plans for expansion None
Other remarks Ore being processed in Jaduguda plant.

India
191
Uranium Production Centre Technical Details (contd.) (as of 1 January 2005)
Centre # 5 Centre # 6 Centre # 7
Name of production centre Turamdih Banduhurang Mohuldih
Production centre classification existing planned planned
Start-up date 2003 2006 2009
Source of ore:
� Deposit name Turamdih Banduhurang Mohuldih
� Deposit type vein vein vein
� Reserves (tU)
� Grade (% U)
Mining operation:
� Type (OP/UG/ISL) UG OP UG/OP
� Size (t ore/day) 550 2 250 1 250
� Average mining recovery (%) 75 65 80
Processing plant (acid/alkaline): Turamdih
� Type (IX/SX/AL) IX/AL
� Size (t ore/day) 3 000
� Average process recovery (%) 80
Nominal production capacity (tU/year) 190
Plans for expansion Turamdih plant may undergo expansion with the commissioning of Mohuldih mine.
Other remarks
Presently, ore being processed in Jaduguda plant. Subsequently, will be treated in Turamdih plant.
Ore to be processed in Turamdih plant.
Ore to be processed after the expansion of Turamdih plant.

India
192
Uranium Production Centre Technical Details (contd.) (as of 1 January 2005)
Centre # 8 Centre # 9
Name of production centre Lambapur-Peddagattu Domiasiat
Production centre classification planned planned
Start-up date 2008 2009
Source of ore:
� Deposit name Lambapur-Peddagattu Domiasiat � Deposit type unconformity sandstone
� Reserves (tU)
� Grade (% U)
Mining operation:
� Type (OP/UG/ISL) UG/OP OP
� Size (t ore/day) 1 250 1 500
� Average mining recovery (%) 75 90
Processing plant (acid/alkaline): Seripally Domiasiat � Type (IX/SX/AL) IX/AL SX/AL
� Size (t ore/day) 1 250 1 370
� Average process recovery (%) 77 87
Nominal production capacity (tU/year) 130 230
Plans for expansion
Other remarks Ore to be processed in the plant at Seripally.
Ore to be processed in the Domiasiat plant.
Secondary sources of uranium
See relevant Table for India’s production and use of mixed-oxide fuels. India reported no information on the production and use of re-enriched tails or reprocessed uranium.
ENVIRONMENTAL ACTIVITIES AND SOCIO-CULTURAL ISSUES
Environmental assessments
A well-equipped Environmental Survey laboratory, set-up at Jaduguda by Bhabha Atomic Research Centre, Department of Atomic Energy, monitors the status of the environment around the operating units. Different environmental matrices are taken into account over an area of 20 km radius. Samples of effluents from mine, mill and tailings pond are regularly collected and analysed. The water

India
193
from different streams and local river system, sediments from river beds are also analysed in different seasons. Samples of soil, grass, vegetables, food and aquatic organisms like algae, fish, etc are collected and analysed. The samples of ground water from wells and hand pumps are periodically collected and analysed for evaluation of radioactive and chemical pollutants. Measurements of gamma radiation, environmental radon concentration, and natural background radiation are carried out using sophisticated instruments and techniques.
These surveillances in the area have not shown any significant rise of any harmful elements in the atmosphere in the entire history of UCILs operations.
Tailings impoundment facility
The tailings impoundment facility created at Jaduguda has high natural hills as barriers on three sides. The embankment has been designed on one side to accommodate the entire tailings for a very long period. The decantation wells in the pond are planned to allow the flow of excess water, preventing any discharge of solid particles. Encroachment into the tailings pond area is prohibited by the laying of permanent fences all around. Security personnel are also posted at the site to guard against any entry. The pond is located at a safe distance from the population to avoid any direct contamination. A large part of the pound is covered with vegetation to prohibit re-suspension of dust into the atmosphere.
Waste rock management
There are minimal waste rocks generated from mining. They are mainly disposed in underground works for filling the void. A quantity is also used within premises for filling low-lying areas.
Effluent management
Mine water is treated for use in ore processing plant after clarification. The decanted effluent from the tailings pond is treated further at the effluent treatment plant, and is brought to normal conditions before being used in the process. Remaining water, if any, is discharged into the environment after strict monitoring.
Site rehabilitation
People displaced by construction of mines and plants are suitably re-housed as per the government rules.
Regulatory activities
There are many independent central and state regulatory bodies, which regulate the operation of each unit. The Atomic Energy Regulatory Board is the apex organisation under DAE to regulate all safety related activities in nuclear units.

India
194
Social and cultural issues
Creation of employment, providing education and health care, undertaking infrastructure development, promoting sports, conducting cultural programme, are some of the areas in which UCIL has contributed towards the society around its operating units.
Surveys are carried out from time to time in and around the operating units of UCIL. The reports have substantially proved that there is no adverse effect of radiation on health of the residents around the area.
URANIUM REQUIREMENTS
India’s uranium requirement is for its nuclear power programme. Present capacity of 2 770 MWe (gross) – 2 550 MWe (net) consists of 2 Boiling Water Reactors (BWRs) and 12 Pressurised Heavy Water Reactors (PHWRs). Construction of 6 PHWRs (TAPP 3&4 – 2×540 MWe, Kaiga 3&4 – 2×220 MWe, and RAPP 5&6 – 2×220 MWe) and two Light Water Reactors (KKNPP 1&2 – 2×1 000 MWe) and one Prototype Fast Breeder Reactor (PFBR) (1x500 MWe) is in progress. With the progressive completion of projects under construction, nuclear power generating capacity would reach about 7 230 MWe (gross) – 6 642 MWe (net) by 2010. By 2020 this capacity is expected to grow to about 19 386 MWe (net). The programme beyond this period is yet to be finalised. Annual uranium requirement for PHWRs up to 2015 is given in the relevant Table.
Supply and procurement strategy
In India, exploration for uranium is carried out by the Atomic Minerals Directorate for Exploration and Research, a wholly owned government organisation. Neither private nor any foreign companies are involved in exploration, production and/or marketing of uranium. The UCIL, a public sector undertaking under the Department of Atomic Energy, is responsible for the production of yellow cake. The rest of the fuel cycle, up to the manufacture of fuel assemblies, is the responsibility of the Nuclear Fuel Complex, a wholly-owned government organisation.
Investment in uranium production in India is directly related to the country's nuclear power programme. For planning purposes the lead-time from uranium exploration and development to production is assumed to be seven years.
India reported no information on national policies relating to uranium, stocks of uranium, or uranium prices.

India
195
Uranium Exploration and Development Expenditures and Drilling Effort – Domestic
Expenses in million INR 2002 2003 2004 2005 (expected)
Industry exploration expenditures 0 0 0 0
Government exploration expenditures 581.2 604.9 645.7 872.0
Industry development expenditures 0 0 0 0
Government development expenditures 0 0 0 0
Total expenditures 581.2 604.9 645.7 872.0
Industry exploration drilling (metres) 0 0 0 0
Number of industry exploration holes drilled 0 0 0 0
Government exploration drilling (metres) 40 025 53 922 46 417 74 700
Number of government exploration holes drilled NA NA NA NA
Industry development drilling (metres) 0 0 0 0
Number of development exploration holes drilled 0 0 0 0
Government development drilling (metres) 0 0 0 0
Number of development exploration holes drilled 0 0 0 0
Subtotal exploration drilling (metres) 40 025 53 922 46 417 74 700
Subtotal exploration holes NA NA NA NA
Subtotal development drilling (metres) 0 0 0 0
Subtotal development holes 0 0 0 0
Total drilling (metres) 40 025 53 922 46 417 74 700
Total number of holes NA NA NA NA
Reasonably Assured Resources* (tonnes U)
Production method <USD 40/kgU <USD 80/kgU <USD 130/kgU Recovery
factor (%)
Underground mining NA NA 45 500
Open-pit mining NA NA 9 300
In situ leaching 0 0 0
Heap leaching 0 0 0
In-place leaching (stope/block leaching)
0 0 0
Co-product and by-product 0 0 0
Unspecified 0 0 0
Total NA NA 54 800
* In situ resources.

India
196
Reasonably Assured Resources by Deposit Type* (tonnes U)
Deposit type <USD 40/kgU <USD 80/kgU <USD 130/kgU
Unconformity-related NA NA 5 500
Sandstone NA NA 12 500
Hematite breccia complex 0 0 0
Quartz-pebble conglomerate 0 0 0
Vein NA NA 34 800
Intrusive 0 0 0
Volcanic and caldera-related 0 0 0
Metasomatite 0 0 0
Other NA NA 2 000
Total NA NA 54 800
* In situ resources.
Inferred Resources* (tonnes U)
Production method <USD 40/kgU <USD 80/kgU <USD 130/kgU Recovery
factor (%)
Underground mining NA NA 21 900
Open-pit mining NA NA 1 300
In situ leaching 0 0 0
Heap leaching 0 0 0
In-place leaching (stope/block leaching)
0 0 0
Co-product and by-product NA NA 6 600
Unspecified 0 0 0
Total NA NA 29 800
* In situ resources.

India
197
Inferred Resources by Deposit Type* (tonnes U)
Deposit type <USD 40/kgU <USD 80/kgU <USD 130/kgU
Unconformity-related NA NA 1 000
Sandstone NA NA 1 400
Hematite breccia complex 0 0 0
Quartz-pebble conglomerate 0 0 0
Vein NA NA 10 600
Intrusive 0 0 0
Volcanic and caldera-related 0 0 0
Metasomatite 0 0 0
Other NA NA 16 800
Total NA NA 29 800
* In situ resources.
Prognosticated Resources (tonnes U)
Cost ranges
<USD 80/kgU <USD 130/kgU
NA 12 100
Speculative Resources (tonnes U)
Cost ranges
<USD 130/kgU Unassigned
NA 17 000
Ownership of Uranium Production in 2004
Domestic Foreign
Government Private Government Private Totals
[tU] [%] [tU] [%] [tU] [%] [tU] [%] [tU] [%]
NA 100 0 0 0 0 0 0 NA 100

India
198
Uranium Industry Employment at Existing Production Centres
(person-years)
2002 2003 2004 2005 (expected)
Total employment related to existing production centres
4 200 4 200 4 200 4 200
Employment directly related to uranium production
NA NA NA NA
Short-term Production Capability (tonnes U/year)
2005 2010
A-I B-I A-II B-II A-I B-I A-II B-II
NA NA 365 510 NA NA 510 880
2015 2020 2025
A-I B-I A-II B-II A-I B-I A-II B-II A-I B-I A-II B-II
NA NA 510 1 560 NA NA 510 2 890
Mixed Oxide Fuel Production and Use (tonnes of natural U equivalent)
Mixed-oxide (MOX) fuels
Total through end
of 2001 2002 2003 2004
Total through end
of 2004
2005 (expected)
Production NA NA NA NA NA NA
Usage NA NA NA NA NA NA
Number of commercial reactors using MOX 2 2 3 1
Net Nuclear Electricity Generation
2003 2004
Nuclear electricity generated (TWh net) 16.64 15.04
Installed Nuclear Generating Capacity to 2025 (MWe net)
2010 2015 2020 2025 2004 2005
Low High Low High Low High Low High
2 550 3 040 6 172 6 642 9 464 13 132 13 884 19 386 NA NA

India
199
Annual Reactor-related Uranium Requirements to 2025 (excluding MOX) (tonnes U)
2010 2015 2020 2025 2004 2005
Low High Low High Low High Low High
242 380 880 880 1 380 1 380 NA NA NA NA

Indonesia
200
• Indonesia •
URANIUM EXPLORATION
Historical review
Uranium exploration by the Centre for Development of Nuclear Ore and Geology, National Nuclear Energy Agency, Indonesia, (BATAN), started in the 1960s. Up to 1996 the reconnaissance survey has covered 79% of a total of 533 000 km2, identified on the basis of favourable geological criteria and promising exploration result. Since that year the exploration activities focused in the Kalan area and its surrounding, Kalimantan, in which the most significant indication of uranium mineralization has been found. During 1998-1999 exploration consisted of systematic geological and radiometric mapping, and radon survey which were carried out at Tanah Merah and Mentawa, Kalimantan in order to delineate the mineralised zone The result of those activities gives additional speculative resources of 4 090 tU to 12 481 tU. From 2000 up to 2002, the exploration drilling was carried out at upper Rirang (178 m) and Rabau (115 m) and Tanah Merah (181 m), West Kalimantan.
Recent and ongoing uranium exploration and mine development activities
In 2003-2004, BATAN, carried out exploration drilling at Jumbang 1 (186 m), Jumbang 2 (227 m) sector, and in 2005 this activity will be continued at Jumbang 3 (expected 300 m) and at Mentawa (expected 300 m) sector. The result of previous exploration drilling activities is still in the process of being reported. Indonesia reported no exploration abroad in 2004 and 2005.
URANIUM RESOURCES
Identified resources (RAR & Inferred)
As of January 2005, RAR total 6 797 tU, recoverable at costs below USD 130/kgU, unchanged from the 2003 Red Book. Of this total, 468 tU is recoverable at costs below USD 80/kgU. Inferred resources at 1 699 tU remain virtually unchanged from the 2003 Red Book. Recovery costs for the Inferred Resources are projected to be below USD 130/kgU.
Undiscovered resources (Prognosticated & SR)
The undiscovered resources, mainly from the Kalan prospect, are allocated to the SR category. The Mentawa sector, located some 50 km southeast of Kalan, has the same high geological favourability as Kalan and could host additional potential. To evaluate this resource potential a delineation drilling programme is needed. Speculative resources amount to 4 090 tU. Recovery costs for the SR have not been assessed.

Indonesia
201
ENVIRONMENTAL ACTIVITIES AND SOCIO-CULTURAL ISSUES
No significant environmental issues relating to uranium exploration and resource development have been identified. Indonesia reported no information on national policies relating to uranium, uranium stocks, or uranium prices.
Uranium Exploration and Development Expenditures and Drilling Effort – Domestic
Expenses in million IDR 2002 2003 2004 2005
(expected)
Industry exploration expenditures 0 0 0 0
Government exploration expenditures 259.172 274.370 275.982 1 033.410
Industry development expenditures 0 0 0 0
Government development expenditures 0 0 0 0
Total expenditures 259.172 274.370 275.982 1 033.410
Industry exploration drilling (metres) 0 0 0 0
Number of industry exploration holes drilled 0 0 0 0
Government exploration drilling (metres) 181 186 227 600
Number of government exploration holes drilled 3 3 5 10
Industry development drilling (metres) 0 0 0 0
Number of development exploration holes drilled 0 0 0 0
Government development drilling (metres) 0 0 0 0
Number of development exploration holes drilled 0 0 0 0
Subtotal exploration drilling (metres) 181 186 227 600
Subtotal exploration holes 3 3 5 10
Subtotal development drilling (metres) 0 0 0 0
Subtotal development holes 0 0 0 0
Total drilling (metres) 181 186 227 600
Total number of holes 3 3 5 10

Indonesia
202
Reasonably Assured Resources* (tonnes U)
Production method <USD 40/kgU <USD 80/kgU <USD 130/kgU Recovery
factor (%)
Underground mining 0 0 0
Open-pit mining 0 0 0
In situ leaching 0 0 0
Heap leaching 0 468 6 797
In-place leaching (stope/block leaching)
0 0 0
Co-product and by-product 0 0 0
Unspecified 0 0 0
Total 0 468 6 797
* In situ resources.
Inferred Resources* (tonnes U)
Production method <USD 40/kgU <USD 80/kgU <USD 130/kgU Recovery
factor (%)
Underground mining 0 0 0
Open-pit mining 0 0 0
In situ leaching 0 0 0
Heap leaching 0 0 1 699
In-place leaching (stope/block leaching)
0 0 0
Co-product and by-product 0 0 0
Unspecified 0 0 0
Total 0 0 0
* In situ resources.
Speculative Resources (tonnes U)
Cost ranges
<USD 130/kgU Unassigned
0 12 481

Iran
203
• Islamic Republic of Iran •
URANIUM EXPLORATION
Historical review
Uranium exploration began in Iran in support of an ambitious nuclear power programme launched in the mid-1970s.
The programme has continued over the last two decades despite sharp fluctuations in the level of activities and suspension of the nuclear power programme for a period of time.
The main activities started with airborne surveys conducted by foreign companies being accompanied by field reconnaissance by geologists and prospectors of the Atomic Energy Organisation of Iran (AEOI). These surveys covered one-third of the area of Iran judged to be most favourable for uranium deposits.
This work was followed up by reconnaissance and detailed ground surveys. Regional and detailed exploration activities were started in the most prospective regions, depending on the available infrastructure and exploration manpower. Follow-up in about one-sixth of the area covered by the airborne surveys led to the definition of a few small prospects.
Recent and ongoing uranium exploration and mine development activities
Uranium exploration activities have mainly focused in identified areas in different phases. The most known deposits are metasomatic and hydrothermal type related to upper Precambrian magmatic and metasomatic complexes.
Data interpretation has also led to define sedimentary basins as favourable areas for sandstone type deposits in central and northwest Iran.
Khoshoumi
Five blocks have been delineated in the anomaly No. VI among 47 discriminated anomalies in this area. The main activities have been concentrated in block I, which is transferring from semi-detailed into detailed phase, and some in blocks II and III. Because of the good potential view of uranium mineralization in the Khoshoumi area, data compilation and modelling will follow on.

Iran
204
Narigan
Pre-cambrian alkaline granite is the most important key for uranium mineralization. Some uranium anomalies have been discriminated adjacent to the granite. After finalising the detailed phase of anomaly I, anomaly II is deemed to be more interesting, while the other anomalies (IV and V) are still under study.
Zarigan
The area consists of north and south anomalies which are thoriferous and uraniferous respectively and some other anomalies (e.g. Mishdovan, Chah-Gaz). The major exploration activities are concentrated in the south anomaly, which is identical to Narigan.
Chah-Juleh
In spite of the good potential view of this albite metasomatite area, the topography condition restricts its priority, but in general that is favourable for the future.
Other exploration activities in central Iran
Evaluation of uranium resources in central Iran includes: Esfordi, Lakeh-siah, Ariz, Chapedoni, Rig-e-Zarin, Natk (Saghand ore field).
Sedimentary potential evaluation
Evaluation of uranium resources of sedimentary basins in Great Kavir, Azarbaijan, Dasht-e-Moghan is ongoing.
Salt plug uranium exploration
Evaluation of uranium in salt plugs in south Iran, emphasis near Bandar Abbas (about 70 salt plugs).
Airborne geophysical data utilisation
Interpretation of airborne geophysical data (650 000 km2) in central Iran, south-east, north-west and ground follow-up for uranium anomalies is ongoing.
Mine development Activities in Saghand
Up to now 75% of the activities related to shaft sinking (two cylindrical shafts, each having 4 m in diameter and 350 m depth) and tunnelling (about 300 m) have been carried out in the frame of five projects and the rest will be implemented during the second half of 2006. Ninety per cent of exploitation is going to be accomplished through room and pillar, cut and fill and sub-level stopping methods.

Iran
205
Mine development activities in Gachin salt plug (Bandar Abbas)
The mining activities are being carried out mainly in three blocks by open-pit method.
URANIUM RESOURCES
Identified resources (RAR & Inferred)
Known resources totalling 1 927 tU have been attributed to the Saghand 1 and Saghand 2 (491 tU RAR, 876 tU Inferred) and Narigan 1 (60 tU Inferred), Khoshoumi 1 (300 tU Inferred), Talmesi (100 tU Inferred as by product) and Bandar Abbass (Gachin salt plug, 100 tU Inferred).
Undiscovered resources (Prognosticated & SR)
A total of 14 550 tU has been estimated for the Prognosticated and Speculative Resources. There has been an increase of 700 tU since 2003 in this category.
Undiscovered Resources are attributed to the following deposits and prospects:
� Saghand Ore field with 2 700 tU PR and 4 800 tU SR associated with Th, RRE, Ti and Mo.
� Narigan Prospect with 800 tU PR hydrothermal vein U-Mo-Co mineralization.
� Dechan Prospect with 1 200 tU SR associated with Cu, alkaline syenite.
� Zarigan Prospect with 250 tU PR and 1 500 tU SR, metasomatic – hydrothermal, associated with U, Th, Ti and RRE mineralization.
� Chah-Juleh Prospect with 1 000 tU SR.
� Khoshoumi Prospect (2, 3, 4, 5 and Ganjeh Donya) with 250 tU PR and 1 000 tU SR.
� Esfordi Prospect with 50 tU PR and 500 tU SR.
� South salt plugs with 500 tU SR.
URANIUM PRODUCTION
Historical review
No uranium has been produced in Iran so far, either by government or by private companies.

Iran
206
Status of production capability
Two production plants, a 50 tU/year in Ardakan from Saghand ore and a 21 tU/year in Bandar Abbas from Gachin ore, are under construction but neither of them is operational yet.
Ownership structure of the uranium industry
The owner of the uranium industry is the government of the Islamic Republic of Iran and authorised by the Atomic Energy Organization of Iran (AEOI).
Employment in the uranium industry
None reported.
Future production centres
As mentioned above, two production centres are planned and both of them are under construction. Their production cost will be above USD 80/kgU.
Uranium Production Centre Technical Details (as of 1 January 2005)
Centre # 1 Centre # 2
Name of production centre Ardakan Bandar Abbas
Production centre classification planned planned
Start-up date 2007 2005
Source of ore: � Deposit name Saghand Gachin � Deposit type metasomatite surficial � Reserves (tU) 900 100 � Grade (% U) 0.0553 0.200
Mining operation: � Type (OP/UG/ISL) 10% OP, 90% UG OP � Size (t ore/day) 500 55 � Average mining recovery (%) 85-90 85-90
Processing plant (acid/alkaline): � Type (IX/SX/AL) AL AL � Size (t ore/day); for ISL (L/day or L/h) 400 48 � Average process recovery (%) >75 >70
Nominal production capacity (tU/year) 50 21
Plans for expansion
Other remarks

Iran
207
URANIUM REQUIREMENTS
In Iran, the Bushehr-1 reactor (about 0.9 GWe net) is expected to startup in 2006. The Iranian Government has announced its intent to construct a second reactor with plans to have 20 GWe net of installed capacity by 2033.
Iran reported no information on national policies relating to uranium, uranium stocks, or uranium prices.
Uranium Exploration and Development Expenditures and Drilling Effort – Domestic
Expenses in million IRR 2002 2003 2004 2005 (expected)
Industry exploration expenditures 0 0 0 0
Government exploration expenditures 11 000 10 800 12 800 16 000
Industry development expenditures 0 0 0 0
Government development expenditures 19 000 20 000 19 000 21 650
Total expenditures 30 000 30 800 31 800 37 650
Industry exploration drilling (metres) 0 0 0 0
Number of industry exploration holes drilled 0 0 0 0
Government exploration drilling (metres) 2 380 4 168 9 030 10 000
Number of government exploration holes drilled 65 41 134 NA
Industry development drilling (metres) 0 0 0 0
Number of development exploration holes drilled 0 0 0 0
Government development drilling (metres) 0 0 0 0
Number of development exploration holes drilled 0 0 0 0
Subtotal exploration drilling (metres) 2 380 4 168 9 030 10 000
Subtotal exploration holes 65 41 134 NA
Subtotal development drilling (metres) 0 0 0 0
Subtotal development holes 0 0 0 0
Total drilling (metres) 2 380 4 168 9 030 10 000
Total number of holes 65 41 134 NA

Iran
208
Reasonably Assured Resources*
(tonnes U)
Production method <USD 40/kgU <USD 80/kgU <USD 130/kgU Recovery factor (%)
Underground mining 0 0 491 Open-pit mining 0 0 0 In situ leaching 0 0 0 Heap leaching 0 0 0 In-place leaching (stope/block leaching)
0 0 0
Co-product and by-product 0 0 0 Unspecified 0 0 0 Total 0 0 491
* In situ resources.
Reasonably Assured Resources by Deposit Type* (tonnes U)
Deposit type <USD 40/kgU <USD 80/kgU <USD 130/kgU Unconformity-related 0 0 0 Sandstone 0 0 0 Hematite breccia complex 0 0 0 Quartz-pebble conglomerate 0 0 0 Vein 0 0 0 Intrusive 0 0 0 Volcanic and caldera-related 0 0 0 Metasomatite 0 0 491 Other 0 0 0 Total 0 0 491
* In situ resources.
Inferred Resources* (tonnes U)
Production method <USD 40/kgU <USD 80/kgU <USD 130/kgU Recovery factor (%)
Underground mining 0 0 1 036 Open-pit mining 0 0 400 In situ leaching 0 0 0 Heap leaching 0 0 0 In-place leaching (stope/block leaching)
0 0 0
Co-product and by-product 0 0 0 Unspecified 0 0 0 Total 0 0 1 436
* In situ resources.

Iran
209
Inferred Resources by Deposit Type*
(tonnes U)
Deposit type <USD 40/kgU <USD 80/kgU <USD 130/kgU
Unconformity-related 0 0 0
Sandstone 0 0 0
Hematite breccia complex 0 0 0
Quartz-pebble conglomerate 0 0 0
Vein 0 0 460
Intrusive 0 0 0
Volcanic and caldera-related 0 0 0
Metasomatite 0 0 876
Other 0 0 100
Total 0 0 1 436
* In situ resources.
Prognosticated Resources (tonnes U)
Cost ranges
<USD 80/kgU <USD 130/kgU
0 4 050
Speculative Resources (tonnes U)
Cost ranges
<USD 130/kgU Unassigned
4 500 6 000
Installed Nuclear Generating Capacity to 2025 (MWe net)
2010 2015 2020 2025 2004 2005
Low High Low High Low High Low High
0 0 920 920 5 520 5 520 6 440 6 440 9 200 9 200
Annual Reactor-related Uranium Requirements to 2025 (excluding MOX) (tonnes U)
2010 2015 2020 2025 2004 2005
Low High Low High Low High Low High
0 0 250 250 1 490 1 490 1 740 1 740 2 480 2 480
Japan
210
• Japan •
URANIUM EXPLORATION
Historical review
Domestic uranium exploration has been carried out by the Power Reactor and Nuclear Fuel Development Corporation (PNC) and its predecessor since 1956. About 6 600 tU of uranium reserves have been detected in Japan. Domestic uranium exploration activities in Japan were terminated in 1988. Overseas uranium exploration began in 1966. Exploration activities were carried out mainly in Canada and Australia, and in other countries such as the United States, Niger, China and Zimbabwe.
In October 1998, PNC was reorganised into the Japan Nuclear Cycle Development Institute (JNC). Based on the decision by the Atomic Energy Commission in February 1998, uranium exploration activities, which were carried out by PNC, were terminated in 2000, and mining interests and technologies which remained in JNC were transferred to the private sector.
Recent and ongoing uranium exploration and mine development activities
Japan-Canada Uranium Co. Ltd., which took over JNC’s mining interests in Canada, is carrying out exploration activities in Canada. Japanese private companies hold shares in developing and mining operations in Canada, Australia and Niger.
URANIUM RESOURCES
Identified resources (RAR and Inferred)
About 6 600 tU of Reasonably Assured Resources have been identified and classified as recoverable at <USD 130/kgU. Japan does not report resources in any other categories.
URANIUM PRODUCTION
Historical review
A test pilot plant with a capacity of 50 tonnes ore per day was established at the Ningyo-toge mine in 1969 by PNC. The operation ceased in 1982 with a total production of 84 tU. In 1978, the vat leaching test of the Ningyo-toge ore began on a small scale with a maximum capacity of 12 000 tonnes ore per year, consisting of three 500-tonne ore vats. The vat leaching test was terminated at the end of 1987.

Japan
211
Production facilities
The plutonium fuel plant of JNC consists of three facilities, the Plutonium Fuel Development Facility (PFDF), the Plutonium Fuel Fabrication Facility (PFFF) and the Plutonium Fuel Production Facility (PFPF).
� The PFDF was constructed for basic research and fabrication of test fuels and started operation in 1966. As of December 2004, approximately two tonnes of MOX fuels have been fabricated in PFDF.
� In the PFFF there are two MOX fuel fabrication lines, one for the experimental Fast Breeder Reactor Joyo (FBR line) with one-tonne MOX/year of fabrication capability and the other for the prototype Advanced Thermal Reactor Fugen (ATR line) with a 10 tonnes MOX/year fabrication capability. The FBR line started its operation in 1973 with Joyo initial load fuel fabrication. The fuel fabrication for the Joyo in the FBR line was finished in 1987, and the role of the fuel fabrication for Joyo was switched to PFPF. The ATR line started its operation in 1972 with MOX fuel fabrication for the Deuterium Critical Assembly (DCA) in O-arai Engineering Center of JNC. The fuel fabrication for ATR Fugen was started in 1975 and was finished in 2001. The total amount of MOX fuel fabricated by both lines was approximately 155 tonnes.
� PFPF FBR line was constructed to supply MOX fuels to the prototype FBR Monju and the experimental FBR Joyo with five tonnes MOX/year of fabrication capability. The PFPF FBR line started its operation in 1988 with Joyo reload fuel fabrication and fuel fabrication for the FBR Monju was started in 1989. As of December 2004, approximately 13 tonnes of MOX fuels had been fabricated in the PFPF.
Use of mixed oxide fuels
� Prototype Fast Breeder Reactor Monju
Monju was first taken critical in April 1994 and generated electricity for the first time in August 1995. Towards the end of the commissioning test, in December 1995, a sodium leak accident occurred from one of the three secondary sodium cooling loops. A thorough investigation of the cause of the accident has been carried out, and the safety of all aspects of the Monju design and operation has been reviewed. Japanese regulators granted the permission to modify the plant to reinforce countermeasures against the sodium leak in December 2002. JNC requested the local officials for understanding of modification based on the Safety Agreements. JNC will start the plant modification work soon after the local government agrees the request.
� Experimental Fast Reactor JOYO
The experimental fast reactor JOYO attained its initial criticality in April 1977 with the MK-I breeder core. As an irradiation test bed, the JOYO MK-II core achieved the maximum design output of 100 MWt in March 1983. Thirty-five duty cycle operations and thirteen special tests with the MK-II core were completed by June 2000. The JOYO net operation time exceeds 60 000 hours and 478 fuel subassemblies were irradiated during the MK-I and MK-II core operations. The MK-III high performance irradiation core, of which maximum design output increases to 140 MWt achieved its initial criticality in July 2003. Two duty-cycle of operation and a special test with MK-III core were completed by November 2004.
Japan
212
� Prototype Advanced Thermal Reactor Fugen
The Advanced Thermal Reactor Fugen, developed independently in Japan, is a heavy-water moderated, light-water cooled reactor. Since power generation started in 1979, the reactor had maintained a high operational reliability, equivalent to that of a commercial station. At the same time it had been used to develop new fuels and improve operation and maintenance techniques. In 1979, Fugen started with 96 MOX fuel assemblies loaded in the initial core and since then 30-70% of the fuel used in the core had been MOX. To March 2003, total of 772 MOX fuel assemblies have been loaded equivalent to nearly 119 tonnes of uranium and plutonium, or nearly 1.9 tonnes of plutonium. Fugen had successfully completed the task for which it was constructed. Fugen ceased its operation in March 2003. Thereafter the reactor entered into the phase in which preparatory work for the decommissioning is being carried out.
� Deuterium Critical Assembly DCA
DCA was constructed in 1969 as a part of experimental facilities for research and development of Advanced Thermal Reactor (ATR). All the missions were finished and decommissioning work was started in March 2002.
ENVIRONMENTAL ACTIVITIES AND SOCIO-CULTURAL ISSUES
None reported.
URANIUM REQUIREMENTS
As of 18 January 2005, Japan had 53 operating commercial nuclear power reactors. Total (gross) electric generating capacity was 47 112 MWe, providing approximately one third of the electricity generated in Japan. Three additional reactors commercial nuclear power reactors (Higashidori-1, Shika-2, Tomari-3) and one prototype fast breeder reactor (MONJU) were under construction.
Supply and procurement strategy
Japan has relatively scarce domestic uranium resources and, therefore, must depend to a great extent on overseas supply of uranium. A stable supply of uranium resources is to be ensured through long-term purchase contracts with overseas uranium suppliers, direct participation in mining development and other ways of diversification of sources of supply.
NATIONAL POLICIES RELATING TO URANIUM
There is no special legislation for uranium exploration and exploitation under the Japanese Mining Laws and Regulations. Uranium exploration and exploitation is open to private companies incorporated in Japan. However, no private company has pursued uranium exploitation in Japan.

Japan
213
URANIUM PRICES
Uranium import prices are contracted by private companies. Government information is not available for these data.
Reasonably Assured Resources (tonnes U)
Production method <USD 40/kgU <USD 80/kgU <USD 130/kgU Recovery
factor (%)
Underground mining 0 0 6 600 85
Open-pit mining 0 0 0
In situ leaching 0 0 0
Heap leaching 0 0 0
In-place leaching (stope/block leaching)
0 0 0
Co-product and by-product 0 0 0
Unspecified 0 0 0
Total 0 0 6 600 85
Reasonably Assured Resources by Deposit Type (tonnes U)
Deposit type <USD 40/kgU <USD 80/kgU <USD 130/kgU
Unconformity-related 0 0 0
Sandstone 0 0 6 600
Hematite breccia complex 0 0 0
Quartz-pebble conglomerate 0 0 0
Vein 0 0 0
Intrusive 0 0 0
Volcanic and caldera-related 0 0 0
Metasomatite 0 0 0
Other 0 0 0
Total 0 0 6 600

Japan
214
Historical Uranium Production (tonnes U in concentrate)
Production method Total
through end of 2001
2002 2003 2004 Total
through end of 2004
2005 (expected)
Open-pit mining1 0 0 0 0 0 0
Underground mining1 45 0 0 0 45 0
In situ leaching 0 0 0 0 0 0
Heap leaching 39 0 0 0 39 0
In-place leaching* 0 0 0 0 0 0
Co-product/by-product 0 0 0 0 0 0
U recovered from phosphates
0 0 0 0 0 0
Other methods** 0 0 0 0 0 0
Total 84 0 0 0 84 0
(1) Pre-2002 totals may include uranium recovered by heap and in-place leaching. * Also known as stope leaching or block leaching. ** Includes mine water treatment and environmental restoration.
Mixed Oxide Fuel Production and Use (tonnes of natural U equivalent)
Mixed-oxide (MOX) fuels
Total through end
of 2001 2002 2003 2004
Total through end
of 2004
2005 (expected)
Production 568 5 8 15 596 NA
Usage* 475 20 3 0 498 NA
Number of commercial reactors using MOX 1 1 0 0
* Includes Fugen, JOYO and MONJU.
Reprocessed Uranium Use (tonnes of natural U equivalent)
Reprocessed uranium
Total through end
of 2001 2002 2003 2004
Total through end
of 2004
2005 (expected)
Production NA NA 50 50 645 0
Usage NA NA 6 28 92 46

Japan/Jordan
215
Net Nuclear Electricity Generation
2003 2004
Nuclear electricity generated (TWh net) 230 282
Installed Nuclear Generating Capacity to 2025 (MWe gross)
2010 2015 2020 2025 2004 2005
Low High Low High Low High Low High
45 742 47 122* 50 492 50 492 NA NA NA NA NA NA
* Includes Hamaoka-5 (1 380 MWe) which commenced operation on 18 January 2005.
Annual Reactor-related Uranium Requirements to 2025 (excluding MOX) (tonnes U)
2010 2015 2020 2025 2004 2005
Low High Low High Low High Low High
7 140 8 670 11 130 11 130 NA NA NA NA NA NA
• Jordan •
URANIUM EXPLORATION
Historical review
In 1980 an airborne spectrometric survey covering the entire country was completed. By 1988 ground based radiometric surveys of anomalies identified in the airborne survey were completed. During the 1988-1990 period, Precambrian basement and Ordovician sandstone target areas were evaluated using geological, geochemical and radiometric mapping and/ or surveys.
During the period 1990-1992 a regional geochemical sampling programme, involving stream sediments and some rock samples, was completed over the basement complex area. Geological and radiometric follow-up was carried out at locations within the basement complex and Precambrian sandstone areas.
A systematic study and evaluation of the uranium concentration in Jordan’s phosphate deposits was conducted to assess the environmental effects of the uranium. This study was completed in September 1997.

Jordan
216
Recent and ongoing exploration and mine development activities
All uranium exploration activities in Jordan are conducted by the Natural Resources Authority (NRA), and projects have been funded by the government. The main findings from exploration activities are described below:
� Radiometric measurements (gamma and radon) and chemical analysis defined several surficial uranium occurrences in central, southern and south-eastern Jordan. In central Jordan, the occurrences are closely related to varicoloured marble. They occupy an area of about 350 km2.
� Uranium occurs as minute mineral grains disseminated within fine calcareous Pleistocene sediments and as yellowish films of carnotite and other uranium minerals coating fractures of fragmented chalk or marl of Mastrichtian-Paleocene age. In the southern and southeastern area uranium occurs only as yellowish stains associated with chalk or marl.
� The Chalk Marl sequence in the investigated area is the major constituent of the uranium bearing rocks. The calcite and clay content are low.
� Preliminary leach tests using the alkaline method indicate leacheability of more than 90%.
� Results of channel sampling in three areas in central Jordan indicate uranium contents ranging from 140 to 2 200 ppm over an average thickness of about 1.4 m. The average thickness of the overburden is about 0.5 m.
URANIUM RESOURCES
Identified resources (RAR & Inferred)
The estimated uranium content in two of the four explored blocks in central Jordan (surficial uranium deposits) is 37 500 tU. However, uranium content in the other blocks has not been estimated because uranium exploration was stopped in 1998 due to NRA policy and projects priority. This project might be refreshed in the coming three or four years.
Undiscovered resources (Prognosticated & SR)
See relevant Table.
Unconventional or by-product resources
A total of approximately 70 000 tU are associated with phosphate deposits and therefore, they belong in the by-product category. The average uranium concentration of the Eshidia deposits, which constitute most of the phosphate resources, ranges between 25 and 50 ppm. The smaller Al-Hassa and Al-Abiad deposits have an average uranium concentration in the range of 60 to 80 ppm.

Jordan
217
URANIUM PRODUCTION
Historical review
Jordan does not currently produce uranium. In 1982, a feasibility study for uranium extraction from phosphoric acid was presented by the engineering company LURGI A.G., Frankfurt, Germany, on behalf of the Jordan Fertiliser Industry Company. This company was later purchased by the Jordan Phosphate Mines Company (JPMC). One of the extraction processes evaluated was originally found to be economically feasible, but as uranium prices fell, the process became uneconomic and extraction plant construction was deferred.
Feasibility studies were resumed in 1989 through the use of a micro pilot plant. These tests, which were terminated in 1990, served as the basis for preparation of a project document for a uranium extraction pilot plant from phosphoric acid.
Status of production capability
Jordan does not currently produce uranium.
ENVIRONMENTAL ACTIVITIES AND SOCIO-CULTURAL ISSUES
None reported.
URANIUM REQUIREMENTS
Jordan reported no information on uranium requirements, national policies relating to uranium, uranium stocks or uranium prices.
NATIONAL POLICIES RELATED TO URANIUM
None reported.

Jordan
218
Reasonably Assured Resources*
(tonnes U)
Production method <USD 40/kgU <USD 80/kgU <USD 130/kgU Recovery factor (%)
Underground mining Open-pit mining 37 500 37 500 37 500 In situ leaching Heap leaching In-place leaching (stope/block leaching)
Co-product and by-product Unspecified Total 37 500 37 500 37 500
* In situ resources.
Reasonably Assured Resources by Deposit Type* (tonnes U)
Deposit type <USD 40/kgU <USD 80/kgU <USD 130/kgU Unconformity-related 0 0 0 Sandstone 0 0 0 Hematite breccia complex 0 0 0 Quartz-pebble conglomerate 0 0 0 Vein 0 0 0 Intrusive 0 0 0 Volcanic and caldera-related 0 0 0 Metasomatite 0 0 0 Other 37 500 37 500 37 500 Total 37 500 37 500 37 500
* In situ resources.
Inferred Resources* (tonnes U)
Production method <USD 40/kgU <USD 80/kgU <USD 130/kgU Recovery factor (%)
Underground mining 0 0 0 0 Open-pit mining 60 000 60 000 60 000 0 In situ leaching 0 0 0 0 Heap leaching 0 0 0 0 In-place leaching (stope/block leaching)
0 0 0 0
Co-product and by-product 0 0 0 0 Unspecified 0 0 0 0 Total 60 000 60 000 60 000 0
* In situ resources.

Jordan/Kazakhstan
219
Inferred Resources by Deposit Type*
(tonnes U)
Deposit type <USD 40/kgU <USD 80/kgU <USD 130/kgU Unconformity-related 0 0 0 Sandstone 0 0 0 Hematite breccia complex 0 0 0 Quartz-pebble conglomerate 0 0 0 Vein 0 0 0 Intrusive 0 0 0 Volcanic and caldera-related 0 0 0 Metasomatite 0 0 0 Other 60 000 60 000 60 000 Total 60 000 60 000 60 000
* In situ resources.
Prognosticated Resources (tonnes U)
Cost ranges
<USD 80/kgU <USD 130/kgU
37 500 NA
• Kazakhstan •
URANIUM EXPLORATION
Historical review
Uranium exploration in Kazakhstan started in 1948 on Kurdai deposit situated south of Kazakhstan, when the now independent Republic was a part of the USSR. Subsequent exploration activities can be divided into distinct stages, based on target areas and exploration concepts applied.
During the first stage, which last through 1957, those portions of the Republic which were not overlain by young unconsolidated sediments, were covered by regional ground and airborne radiometric surveys. Investigations carried out in this period resulted in the discovery of several uranium deposits in what later became the uranium district of Pribalkhash (vein-stockwork deposits in volcanics), Kokchetau (vein-stockwork deposits in folded sedimentary formations) and Pricaspain (phosphoritic fish bone detritus). These districts are respectively, near Lake Balkhash (in southeastern Kazakhstan), in northern Kazakhstan and near the Caspian Sea.

Kazakhstan
220
After 1957, conceptual models developed during regional assessment of Kazakhstan’s sedimentary basins led to the discovery of sandstone deposits in which the uranium is associated with oxidation-reduction interfaces in the Chu-Sarysu basin, located in central Kazakhstan.
In addition, uranium mineralization was discovered in the Koldjat deposit in the Ily basin in eastern Kazakhstan. The uranium, which grades up to 0.1% U, is associated with coal and did not receive further attention due to economic reasons.
During 1970 and 1971, in situ leaching (ISL) mining tests were successfully conducted at the Uvanas deposit in the Chu-Sarysu basin. Since that time, exploration has been concentrated on Mesozoic and Cenozoic sedimentary basins having the potential for ISL amenable deposits. The Stepnoye and Central Mining Companies are currently operating ISL mines in the Chu-Sarysu district. No. 6 Mining Company conducts ISL operations in the Syr-Darya district.
The main results of exploration for the last 30 years are discoveries of large uranium deposits associated with Cretaceous and Paleocene sediments of the Chu-Sarysu and Syr-Darya basins, which have significantly increased the resource base of Kazakhstan. Discovery and development of the ISL amenable resources have placed Kazakhstan in a position to compete with other low-cost uranium producers in the world. Because of the very large resource base, reconnaissance exploration has been suspended.
Prospecting works were done only on the sandstone deposits in the Shu-Saryssuiskaia and Syr-Daryinskaia uranium ore provinces in order to get addition to uranium reserves. They were followed by experimental-industrial works on uranium mining by ISL method that is a part of a geological survey.
Recent and ongoing uranium exploration and mine development activities
In 2003-2004, prospecting work was carried out in the Shu-Saryssuiskaia province on the Inkai and Moinkum deposits. Later on the joint Kazakhstan-French venture KATCO completed uranium exploration at the Tortkuduk site of Moinkum deposit and stopped the experimental-industrial work there. As a result of exploration, the total addition to uranium reserves was increased to 10 200 tU in the RAR category.
In 2005, JV Inkai is planning to continue the experimental-industrial work on uranium mining by ISL method on site No. 2 of the Inkai deposit. NAC Kazatomprom will start exploration drilling on site No. 4 of the Inkai deposit.
There were no new deposits discovered during the report time. Governmental bodies responsible for exploration were not reorganised. A slight change however took place, the Committee of Geology and Conservation of Mineral Resources of the Republic of Kazakhstan was renamed the Committee of Geology and Mineral Resources of the Republic of Kazakhstan. No prospecting and mining works were carried out outside Kazakhstan.

Kazakhstan
221
URANIUM RESOURCES
Identified resources (RAR & Inferred)
As of 1 January 2005, Kazakhstan’s identified resources (recoverable at a cost of <USD 130/kgU) totalled 816 099 tU. When compared to the estimate of 1 January 2003, there is a decrease of 125 701 tU due to the fact that a recovery factor was not taken into account in 2003.
In 2003-2004, a total of 7 046 tU was mined on all deposits with 6 729 tU (95.5%) by the ISL method. Underground mining (Vostok deposit) accounted for 317 tU (348 tU depleted) of the total production. Taking into account mining losses (756 tU or 10.7%) depleted resources increased to 7 804 tU.
A significant increase of RAR category was reported on the Moinkum deposit. As a result of geological exploration by the joint Kazakhstan-French venture KATCO, reasonably assured resources increased by 10 200 tU. Mineralization is located in the sandstones of paleogene age that host already known uranium mineralization of Moinkum deposit. The average grade of U is 0.097%.
Taking into account all the changes, reasonably assured resources at costs of <USD 130/kgU total 513 897 tU. Identified resources which can be recovered at costs of <USD 40/kgU total 408 092 tU, or about 50% of the total. When compared to the estimate of 1 January 2003, Inferred Resources remained essentially unchanged.
Undiscovered resources (Prognosticated & SR)
Estimates of Prognosticated and SR recoverable at costs <USD 130kg/U, remained unchanged. All of them are in situ resources.
URANIUM PRODUCTION
Historical review
Uranium mining in Kazakhstan started in 1957 using the open pit method in the southern part of the country, on the Kurdai deposit. Until 1978 four companies, belonging to the USSR Ministry of Middle Machine Construction, mined uranium by underground and open pit methods: Kyrgyzski Mining Combine, Leninabadski Mining and Chemical Combine in the south, Tselinny Mining and Chemical in the north and Prikaspiiski Mining and Chemical Combine in the west. About 15 deposits, with an approximate cumulative output of 5 000 tU, were mined.
Deposits, being mined out during these years, were mainly vein-stockwork mineralization type. They were located in the Kokshetauskaia and the Pribalkhashskaia uranium provinces. Two syngenetic genesis deposits, where mineralization was connected with phosphatised bone detritus of fossil fish, were also mined. ISL uranium mining of sandstone deposits started in 1978. Mineralization is represented by roll ore bodies of 10 km in length. All deposits of the Shu-Saryssuiskaia and Syr-Daryinskaia uranium provinces belong to sandstone type.
Kazakhstan
222
Production capability
In 2003-2004, uranium was mined on deposits in Uvanas, Mynkuduk, Kanzhugan, Moinkun, Akdala, Northern Karamurun, Southern Karamurun and Vostok. All the deposits except for Vostok are mined by the ISL method. The Vostok deposit is mined by underground method.
Uvanas, Mynkuduk, Kanzhugan, Northern Karamurun, Southern Karamurun, Moinkun (the southern part of site no. 1), and Akdala (until 2004) deposits are mined by NAC Kazatomprom. Since 2004 the Akdala deposit has been mined by Kazakhstan JV Betpak Dala with the participation of NAC Kazatomprom. JV KATCO takes active part in the Moinkun deposit (northern part of site no. 1) exploration. The Vostok deposit is mined by the former JSC KasSubton (since 1 October 2004 – LPP Stepnogorski Mining and Chemical Combine).
In 2003-2004, a total of 7 046 tU was mined on all deposits. Taking into account mining losses, depleted resources made up 7 804 tU. Underground mining (Vostok deposit) accounts for 317 tU (348 tU depleted) of the total production.
Ownership structure of the uranium industry
Some changes have taken place in the ownership structure of the production centres since 2002.
Employment in the uranium industry
See relevant Table.
Future production centres
In the near future, ISL will account for most of Kazakhstan’s uranium production. NAC Kazatomprom is planning to expand significantly.
In 2003, a new production centre for uranium mining by ISL of the Zarechnoye deposit, located in the Syr-Daryinskaia province, was created by a Kazakhastan-Russian joint-venture. Uranium mining on Zarechnoye will start in 2006.
During the period up to 2010, uranium the creation of ISL production centres is planned on Mynkuduk, Irkol, Kharasan, Budenovskoye and Semisbai deposits. The form and type of property of the planned centres are not fully completed.
In Kazakhstan there are standby deposits not involved in the production plans that could allow the creation of new production centres. These are the Kosachinskoie and Kamyshevoie deposits in the Kokchetauskaia province in north Kazakhstan that are reserved by the government.
The Kosachinskoie deposit is a deposit of hydrothermal genesis, with vein-stockwork types ores and has about 100 000 tU of reserves, at an average grade of 0.1% U in the RAR and Inferred Resources categories. Open-pit and underground mining are possible. The deposit is ready for development. The Kamyshevoie deposit of hydrothermal genesis is put on care and maintenance. The rest of the uranium reserves are above 18 t at an average grade of 0.134% U. The method of mining is underground.
In general, Kazakhstan’s known uranium resources could support a relatively rapid increase in production in response to an increase in international demand.

223
Ura
nium
Pro
duct
ion
Cen
tre
Tec
hnic
al D
etai
ls
(as
of 1
Jan
uary
200
5)
C
entr
e #1
C
entr
e #2
C
entr
e #3
C
entr
e #4
C
entr
e #5
C
entr
e #6
C
entr
e #7
Nam
e of
pro
duct
ion
cent
re
Cen
tral
noye
M
inin
g G
roup
St
epno
ye
Min
ing
Gro
up
Min
ing
Gro
up #
6 JV
Bet
pak
Dal
a JV
K
AT
KO
JV
In
kai
LL
P St
epno
gors
ki
Min
ing
& C
hem
ical
co
mbi
ned
Prod
uctio
n ce
ntre
cl
assi
fica
tion
exis
ting
(min
ing)
ex
istin
g (m
inin
g)
exis
ting
(min
ing)
ex
istin
g (m
inin
g)
exis
ting
(min
ing,
ex
plor
atio
n)
exis
ting
(dev
elop
men
t)
exis
ting
(m
inin
g)
Star
t-up
dat
e 19
82
1978
19
85
2001
20
01
2001
19
58
Sour
ce o
f ore
:
• D
epos
it na
me
Kan
zhug
an,
Moi
nkum
-site
1
Myn
kudu
k-V
osto
chny
-si
te, U
vana
s
Nor
th &
So
uth
Kar
amur
un
Akd
ala
Moi
nkum
-site
s 2,
3 In
kai-
site
s 1,
2 V
osto
k
• D
epos
it ty
pe
sand
ston
e sa
ndst
one
sand
ston
e sa
ndst
one
sand
ston
e sa
ndst
one
vein
-sto
ckw
ork
• R
eser
ves
(tU
) 33
500
t 29
960
t 33
860
t 14
250
t 67
360
t 42
500
t 4
150
t •
Gra
de (
% U
) 0.
063
0.04
2 0.
086
0.05
9 0.
064
0.06
3 0.
133
Min
ing
oper
atio
n:
•
Typ
e (O
P/U
G/I
SL)
ISL
IS
L
ISL
IS
L
ISL
IS
L
UG
•
Size
(t o
re/y
ear)
fo
r ISL
(L/d
ay o
r L/h
our)
• A
vera
ge m
inin
g re
cove
ry (
%)
90
90
93
85
85
85
90
• Pr
oces
sing
pla
nt
(aci
d/al
kalin
e):
• T
ype
(IX
/SX
/AL
) ac
id, I
X
acid
, IX
ac
id, I
X
acid
, IX
ac
id, I
X, S
X
acid
, IX
ac
id, S
X,A
L
• Si
ze (
t ore
/yea
r)
for I
SL (L
/day
or L
/hou
r)
• A
vera
ge p
roce
ss
reco
very
(%
) 96
-99
96-9
9 96
-99
96-9
9 93
-96
93-9
6 98
-99
Nom
inal
pro
duct
ion
capa
city
(tU
/yea
r)
1 00
0 1
000
600
700
700
700
1 25
0
Plan
s fo
r ex
pans
ion
no
1500
1
000
1 00
0 1
000
1 00
0 no
O
ther
rem
arks
Kazakhstan

Kazakhstan
224
Secondary sources of uranium
Kazakhstan does not produce or use mixed oxide fuel, re-enriched tails or reprocessed uranium.
ENVIRONMENTAL ACTIVITIES AND SOCIO-CULTURAL ISSUES
Kazakhstan has significant environmental concerns about the wastes associated with its previous and currently operating uranium production facilities. It is also concerned about the environmental aspects of its large volume of sandstone hosted uranium resources that are amenable to in situ leach extraction.
In 2003-2004 about 99% of the uranium was mined by in situ leaching method. It has a much less negative environmental impact in comparison with open and underground mining as it does not result in significant earth surface deformation, waste rocks, non-commercial ores, and tailing pits. Acid leaching is applied for the ISL process.
Monitoring
Monitoring wells are constructed on all developed and operational ISL sites. The number of wells and well patterns are determined by the projects, and confirmed by respective state bodies. Once in a quarter or more often, water sampling is made from wells under-ore and above-ore horizons and from ore bodies. Contents of uranium, thorium, radium, sulphate-ion, nitrate-ion, sulphuric acid, pH, Eh, and solid residual are determined in samples.
On developed sites, well monitoring has been in operation for more than 10 years. The impact of the spreading of industrial solutions is no more than tens of metres from the ore bodies.
Tailings impoundment
When using conventional mining methods to recover uranium at a processing plant, ore is being crushed and milled with tails generation, which are forwarded by hydro-transport to a tailing dump in liquid form. Tailing dumps are equipped with an anti-filtration screen and a two-level drainage system.
Around tailing dumps, monitoring wells have been constructed, where operations are being performed under the above-described scheme.
Waste rock management
Low-level radioactive wastes, generated in small quantities during mining and processing, are disposed at specially equipped points, which have been agreed with regional state sanitary-epidemiological organisations.

Kazakhstan
225
Effluent management
Storm and ice waters within the areas of industrial construction are diverted by means of self-flow for blind areas of buildings and then along a specially designed surface to natural soils.
Site rehabilitation
Rehabilitation is being done at the developed sites according to specially prepared projects, which are co-ordinated with the respective state bodies.
Social and/or cultural issues
All contracts for uranium mining provided by the government to subsoil users contain provisions of participation in local social and cultural sphere. The facility subsoil user deducts funds indicated in contracts to be used social and cultural projects, professional development of staff, training of students and the organisation of different professional seminars.
URANIUM REQUIREMENTS
The government of Kazakhstan has ordered that the fast-breeder reactor BN-350, with a net capacity of 70 MWe, at Aktau on the Mangyshlak Peninsula on the Caspian Sea be shut down.
Therefore, Kazakhstan will not have uranium requirements for the near decade.
Supply and procurement strategy
At the present time all uranium produced in Kazakhstan is exported for sale on the world market. The country does not maintain uranium stockpiles in any form.
NATIONAL POLICIES RELATING TO URANIUM
The main emphasis of the national policy of Kazakhstan relating to uranium is directed toward significantly increasing ISL uranium production for sale on the world market. The second objective supports the manufacture of enriched uranium pellets and other products at the Ulba plant in Kazakhstan. This is to be done in co-operation with the Russian Federation.
In accordance with the government Decree, the National Atomic Company Kazatomprom is designated as the responsible authority for all uranium related export-import issues in Kazakhstan.
No information on uranium stocks or uranium prices was reported.

Kazakhstan
226
Uranium Exploration and Development Expenditures and Drilling Effort – Domestic
Expenses in million KZT 2002 2003 2004 2005 (expected)
Industry exploration expenditures 240 656.6 1 104 1 726
Government exploration expenditures 0 0 0 0
Industry development expenditures 1 564 275.8 435.4 3 104
Government development expenditures 0 0 0 0
Total expenditures 1 804 932.4 1 539.4 4 830
Industry exploration drilling (metres) 49 600 27 660 15 910 100 000
Number of industry exploration holes drilled 171 75 48 200
Government exploration drilling (metres) 0 0 0 0
Number of government exploration holes drilled 0 0 0 0
Industry development drilling (metres) 5 140 15 100 1 210 48 860
Number of development exploration holes drilled 11 16 4 95
Government development drilling (metres) 0 0 0 0
Number of development exploration holes drilled 0 0 0 0
Subtotal exploration drilling (metres) 49 600 27 660 15 910 100 000
Subtotal exploration holes 171 75 48 200
Subtotal development drilling (metres) 5 140 15 100 1 210 48 860
Subtotal development holes 11 16 4 95
Total drilling (metres) 54 740 42 760 17 120 148 860
Total number of holes 182 91 52 295
Reasonably Assured Resources (tonnes U)
Production method <USD 40/kgU <USD 80/kgU <USD 130/kgU Recovery
factor (%)
Underground mining 0 72 000 207 607 Total 83
Open-pit mining 0 27 450 27 450 Total 91
In situ leaching 278 840 278 840 278 840 Total 88.5
Heap leaching 0 0 0
In-place leaching (stope/block leaching)
0 0 0
Co-product and by-product 0 0 0
Unspecified 0 0 0
Total 278 840 378 290 513 897

Kazakhstan
227
Reasonably Assured Resources by Deposit Type
(tonnes U)
Deposit type <USD 40/kgU <USD 80/kgU <USD 130/kgU
Unconformity-related 0 0 0
Sandstone 278 840 278 840 278 840
Hematite breccia complex 0 0 0
Quartz-pebble conglomerate 0 0 0
Vein 0 72 000 207 607
Intrusive 0 0 0
Volcanic and caldera-related 0 0 0
Metasomatite 0 0
Other 0 27 450 27 450
Total 278 840 378 290 513 897
Inferred Resources (tonnes U)
Production method <USD 40/kgU <USD 80/kgU <USD 130/kgU Recovery factor (%)
Underground mining 0 99 116 172 950 Total 83
Open-pit mining 0 0 0
In situ leaching 129 252 129 252 129 252 Total 88.5
Heap leaching 0 0 0
In-place leaching (stope/block leaching)
0 0 0
Co-product and by-product 0 0 0
Unspecified 0 0 0
Total 129 252 228 368 302 202
Inferred Resources by Deposit Type (tonnes U)
Deposit type <USD 40/kgU <USD 80/kgU <USD 130/kgU
Unconformity-related 0 0 0
Sandstone 129 252 129 252 129 252
Hematite breccia complex 0 0 0
Quartz-pebble conglomerate 0 0 0
Vein 0 99 116 172 950
Intrusive 0 0 0
Volcanic and caldera-related 0 0 0
Metasomatite 0 0 0
Other 0 0 0
Total 129 252 228 368 302 202

Kazakhstan
228
Prognosticated Resources (tonnes U)
Cost ranges
<USD 80/kgU <USD 130/kgU
290 000 310 000
Speculative Resources (tonnes U)
Cost ranges
<USD 130/kgU Unassigned
500 000 0
Historical Uranium Production (tonnes U in concentrate)
Production method Total
through end of 2001
2002 2003 2004 Total
through end of 2004
2005 (expected)
Open-pit mining1 21 618 0 0 0 21 618 0
Underground mining1 39 050 0 201 116 39 367 450
In situ leaching 31 588 2 826 3 126 3 603 41 141 3 675
Heap leaching 0 0 0 0 0 50
In-place leaching* 0 0 0 0 0 0
Co-product/by-product 0 0 0 0 0 0
U recovered from phosphates
0 0 0 0 0 0
Other methods** 0 0 0 0 0 0
Total 92 256 2 826 3 327 3 719 102 126 4 175
(1) Pre-2002 totals may include uranium recovered by heap and in-place leaching. * Also known as stope leaching or block leaching. ** Includes mine water treatment and environmental restoration.
Ownership of Uranium Production in 2004
Domestic Foreign
Government Private Government Private Totals
[tU] [%] [tU] [%] [tU] [%] [tU] [%] [tU] [%]
2 716 73 647 17.4 0 0 356 9.6 3 719 100

Kazakhstan
229
Uranium Industry Employment at Existing Production Centres (person-years)
2002 2003 2004 2005 (expected)
Total employment related to existing production centres
3 770 3 870 3 950 3 995
Employment directly related to uranium production
1 280 1 340 1 365 1 380
Short-term Production Capability (tonnes U/year)
2005 2010
A-I B-I A-II B-II A-I B-I A-II B-II
4 200 0 4 200 0 5 000 1 000 1 200 1 800
2015 2020 2025
A-I B-I A-II B-II A-I B-I A-II B-II A-I B-I A-II B-II
7 000 2 000 2 700 1 500 NA NA NA NA NA NA NA NA

Korea
230
• Republic of Korea •
URANIUM EXPLORATION
Recent and ongoing uranium exploration and mine development activities
The Korea Electric Power Corporation (KEPCO), as part of its exploration programme, participated in a number of projects abroad, such as, the Crow Butte project in Nebraska, USA and the Cigar Lake and Dawn Lake projects in Saskatchewan, Canada. KEPCO, however, suspended its participation in these projects and sold its shares in 1999. The Dae Woo Corporation has participated in the Baker Lake project in Canada since 1983.
URANIUM RESOURCES
Korea has no known uranium resources.
URANIUM PRODUCTION
Korea has no domestic uranium production capability.
ENVIRONMENTAL ACTIVITIES AND SOCIO-CULTURAL ISSUES
None reported.
URANIUM REQUIREMENTS
The nuclear capacity of Korea, as of December 2004, was 16 716 MWe at 19 units, representing 30% of Korea’s total installed capacity. Nuclear power generation last year reached 130 TWh, or 40% of the country’s total electricity generation.
Currently, three Korean Standard Nuclear Power Plants (KSNP) are under construction. Ulchin Unit 6 was connected to the grid in June 2005. Shin-Kori Units 1 & 2 are due to be completed in 2011 and 2012, respectively.

Korea
231
And additional two KSNP units (Shin-Wolsong Units 1 & 2) and two Advanced Power Reactors (APR-1400 – Shin-Kori Units 3 & 4) will be constructed at the Shin-Wolsong and Shin-Kori sites.
Shin-Wolsong Units 1 & 2 will start commercial operation in 2012 and 2013, respectively. Shin-Kori Units 3 & 4, which are evolutionary PWR-type reactors of 1 400 MWe, will start commercial operation in 2012 and 2013, respectively.
In addition, Korea has a construction plan for two more APR-1400 units, which are due to be completed in 2015. Together with the increase in nuclear capacity, the requirements for uranium concentrates and fuel cycle services are also continually increasing.
Supply and procurement strategy
In order to secure stable and economical uranium supplies, KHNP maintains a diversification policy and relies on long-term contracts.
NATIONAL POLICIES RELATING TO URANIUM
Korea has pursued a policy to secure a stable and economical uranium supply and Korea maintains an optimal strategic inventory as part of government policy.
URANIUM STOCKS
KEPCO maintains the stock level of around one-year forward reactor-consumption for the operating plants, as a strategic inventory.
Net Nuclear Electricity Generation
2003 2004
Nuclear electricity generated (TWh net) 130 130
Installed Nuclear Generating Capacity to 2025 (MWe net)
2010 2015 2020 2025 2004 2005
Low High Low High Low High Low High
16 716 17 716 17 716 18 716 24 916 26 316 24 916 26 316 24 916 26 316
Korea/Lithuania
232
Annual Reactor-related Uranium Requirements to 2025 (excluding MOX) (tonnes U)
2010 2015 2020 2025 2004 2005
Low High Low High Low High Low High
3 200 3 400 3 600 4 300 5 300 6 400 5 300 6 400 5 300 6 400
Total Uranium Stocks (tonnes natural U-equivalent)
Holder
Natural uranium stocks in
concentrates
Enriched uranium
stocks
Depleted uranium
stocks
Reprocessed uranium
stocks Total
Government 0 0 0 0 0
Producer 0 0 0 0 0
Utility 2 000 2 500 0 0 4 500
Total 2 000 2 500 0 0 4 500
• Lithuania •
URANIUM EXPLORATION, RESOURCES, AND PRODUCTION
Past exploration programmes have been unsuccessful in discovering uranium in Lithuania. Therefore, Lithuania has neither uranium resources nor production and is not currently undertaking any uranium exploration.
Secondary sources of uranium
Lithuania reported mixed oxide and re-enriched tails production and use at zero.
ENVIRONMENTAL ACTIVITIES AND SOCIO-CULTURAL ISSUES
None reported.

Lithuania
233
URANIUM REQUIREMENTS
Unit 1 of Ignalina NPP was closed down on 31 December 2004, thus fulfilling conditions of Lithuania’s membership in the European Union. Unit 2 remains in operation until 2010. Accordingly, uranium requirements have decreased for the country’s nuclear energy programme.
Supply and procurement strategy
As of 1 May 2004 Lithuania has been a member of the European Union. The long-term nuclear fuel supply contract concluded in 1998 by Ignalina NPP and Russian supplier was submitted to the Euratom Supply Agency and approved and remains in force. A complementary agreement to the contract is concluded each year based on planned electricity production.
NATIONAL POLICIES RELATING TO URANIUM
The new government programme for 2004-2008 states that Lithuania should strive to remain a country with the nuclear energy programme. Policies relating uranium are not specifically addressed.
URANIUM STOCKS
There is no stockpile of natural uranium material in Lithuania. A three-month stock of enriched fuel (140 tU equivalent) is generally maintained by the Ignalina nuclear power plant for operating unit. No information concerning uranium prices was reported.
Net Nuclear Electricity Generation
2003 2004
Nuclear electricity generated (TWh net) 15.5 15.1
Installed Nuclear Generating Capacity to 2025 (MWe net)
2010 2015 2020 2025 2004 2005
Low High Low High Low High Low High
2 760 1 380 0 NA 0 NA 0 NA 0 NA
Annual Reactor-related Uranium Requirements to 2025 (excluding MOX) (tonnes U)
2010 2015 2020 2025 2004 2005
Low High Low High Low High Low High
315 187 0 NA 0 NA 0 NA 0 NA

Lithuania/Namibia
234
Total Uranium Stocks (tonnes natural U-equivalent)
Holder
Natural uranium stocks in
concentrates
Enriched uranium
stocks
Depleted uranium
stocks
Reprocessed uranium
stocks Total
Government 0 0 0 0 0
Producer 0 0 0 0 0
Utility 0 140 0 0 140
Total 0 140 0 0 140
• Namibia •
URANIUM EXPLORATION AND MINE DEVELOPMENT
Historical review
In 1928, Captain G. Peter Louw discovered uranium mineralization in the vicinity of the Rossing Mountains in the Namib Desert. Over many years he tried to promote the prospect, but it was not until the late 1950s that Anglo-American Corporation of South Africa prospected the area by drilling and by some underground exploration. Due to erratic uranium values and poor economic prospects for uranium, the Anglo-American Corporation abandoned the search.
As a result of an upswing in the uranium market demand and prices, extensive uranium exploration started in Namibia in the late 1960s. Several airborne radiometric surveys were conducted by the geological survey during this period and numerous uranium anomalies were identified. One of these developed into the Rossing deposit, where Rio Tinto had obtained exploration rights in 1966. This deposit was developed into a large scale open-pit mine, which started production in 1976.
The development of Rossing, combined with a sharp trend in uranium prices, stimulated extensive exploration activity, mainly in the Namib Desert. Two major types of deposits were identified including the intrusive type, associated with Alaskite at Rossing, and the surficial, calcrete type.
Of the intrusive deposits other than Rossing, the Trekkopje deposit has significant resources. The Langer Heinrich deposit is the most promising deposit of the surficial calcrete-type. Feasibility studies were carried out on several of these low-grade deposits but the fall in the market saw the cessation of any further work.

Namibia
235
The combined effect of political uncertainty and the decline of uranium prices caused the rapid curtailment of exploration and development work in the early 1980s. This was indeed unfortunate as the refinement of exploration techniques, which has proved so successful in the Namib Desert were poised to potentially locate a number of new deposits.
Since that time, the continued weakness of the uranium market discouraged further exploration activities, except in the immediate vicinity of the Rossing mine. The recent upturn in demand for uranium made possible the development of the Langer Heinrich deposit.
Recent and ongoing uranium exploration and mine development activities
Uranium mineralization at Langer Heinrich was discovered by the Southern African mining house, General Mining and Finance Corporation Limited (Gencor) in 1973 and the project area was the subject of intensive exploration and trial mining under Gencor’s management in the period from 1974 to 1979. The project then became inactive for a number of years before being acquired by Acclaim Uranium NL (now Aztec Resources Ltd) in 1999. Acclaim completed additional drilling and undertook a Pre-Feasibility Study in 1999.
Following a change of management and corporate direction by Acclaim, the Langer Heinrich Project again became inactive until Paladin purchased the Project from Aztec Resources Ltd in August 2002. Langer Heinrich is now owned 100% by Paladin through its wholly owned Namibian subsidiary, Langer Heinrich Uranium (Pty) Ltd, which holds title to MDRL 2236.
The Langer Heinrich Uranium Project is located in the Namib Naukluft Desert, 180 km west of Windhoek, the capital of Namibia, and 80 km east of the major seaport of Walvis Bay. The property consists of one mineral deposit (retention license – MDRL 2236) covering 44 km2.
Exploration and related activities which have been carried out in relation to the Langer Heinrich Uranium Deposit since the acquisition of Langer Heinrich Uranium (Pty) Ltd by Paladin Resources Ltd include the following:
� Database audit, correction and refinement of digital data.
� Environmental baseline studies (continuing).
� Pre-Feasibility Study (2003).
� Study to determine geochemical variations within the main ore classes.
� Palaeochannel interpretation.
� Reverse circulation drilling (2004 – 166 drill holes, 6 720 metres).
� Classification of uranium ore stockpiles remaining from Gencor’s trial mining carried out in the 1970s.
� Bulk sampling of uranium ore from stockpiles for metallurgical testing.
� Metallurgical testing.
� Uranium ore resource verification.
� Preparation of Bankable Feasibility Study (in progress as of 1 January 2005).
� Preparation of Environmental Assessment and Management Plan (in preparation).
No uranium exploration expenditures are reported abroad.

Namibia
236
URANIUM RESOURCES
The uranium resources of Namibia, including both known and undiscovered categories, occur in a number of geological environments and consequently are hosted in several deposit types. The known resources are mainly associated with intrusive deposits. In addition, about 10% of total known resources are hosted in surficial deposits.
In addition to the known resources in the Rossing and Trekkkopje intrusive deposits, located in the granite associated district of the Precambrian Damara Orogenic Belt, and those associated with surficial calcretes of the Langer Heinrich deposit, there is large undiscovered uranium potential. Although is not quantitatively assessed, the potential is in the following geological environments:
� The granitic terrain of the Damara Belt covers 5 000 km2. This area is largely overlain by surficial deposits and/or wind-blown semi-consolidated sand. Past investigations concentrated on the follow-up of airborne radiometric anomalies. Substantial additional resources, potentially the size of the Rossing deposit, are suspected under the post-mineral cover.
� Tertiary to recent surficial sedimentary terrains exit in semi-arid areas. This environment has further potential for calcrete deposits. Eleven of 38 identified regional airborne anomalies were successfully investigated by extensive drilling, which confirmed a portion of the known resources included in Namibia’s resources totals. In most cases the drilling encountered low-grade mineralization associated with calcrete-filled paleo-river channels. Although the presence of additional resources within the Tertiary sediments is not discounted, the existence of large undiscovered resources is considered unlikely.
� Another potentially favourable geological environment is the sandstone basins that include the Permo-Triassic Karoo sediments which were extensively investigated in neighbouring countries in the early 1970s. These basins were explored to a limited extent in Namibia as well. The Karoo sediments are extensively dissected by river systems in the north-western part of Namibia and consequently airborne radiometric expressions are very pronounced. Ground follow-up including substantial drilling delineated nearly 6 millions tonnes of low-grade uranium mineralization. However, this was excluded from the known resources due to high costs of recovery. It is believed that economically recoverable resources may be present within similar age sedimentary basins in other parts of Namibia.
Identified resources (RAR & Inferred)
As of 1 January 2005, Namibia’s Identified Resources totalled 310 845 tU, recoverable at costs <USD 130/kgU. While the RAR portion totalling to 187 632 tU is expressed as recoverable resources adjusted for mining losses (10-16%) and ore processing losses (14-30%), Inferred Resources are reported as in situ resources (123 213 tU).
Undiscovered resources (Prognosticated & SR)
There is potential for the discovery of further uranium resources in palaeochannels similar to the palaeochannel that hosts the Langer Heinrich uranium mineralization. A number of such palaeo-channels have been identified in the area south and west of Langer Heinrich and Langer Heinrich Uranium (Pty) Ltd has recently applied for four exclusive prospecting licenses in this locality. These areas will be systematically explored for uranium over the next three years once the licenses have been granted.

Namibia
237
Unconventional resources and other materials
None. Namibia does not report any prognosticated or speculative resources.
URANIUM PRODUCTION
Historical review
In August 1966, Rio Tinto Zinc (RTZ) acquired the exploration rights for the Rossing deposit and conducted an extensive exploration programme that lasted until March 1973. Surveying mapping, drilling, bulk sampling and metallurgical testing in a 100 t/day pilot plant indicated the feasibility of establishing a production centre.
Rossing Uranium Limited was formed in 1970 to develop the deposit. TTZ was the leading shareholder with 51.3% of the equity (at the time of the formation of the company).
Mine development commenced in 1974, and commissioning of the processing plant and initial production were in July 1976 with the objective of reaching full design capacity of 5 000 short tons of U3O8/year (3 845 tU/year) during 1977. Due to the highly abrasive nature of the ore, which was not identified during the pilot plant testing stage, the production target was not reached until 1979 after major plant design changes.
Namibia did not report any status of production and recent ongoing activities or on ownership structure of the uranium industry or employment.
Uranium Production Centre Technical Details (as of 1 January 2005)
Centre #1 Centre #2 Name of production centre Rossing Langer Heinrich Production centre classification operating planned Start-up date 1976 September 2006 Source of ore: � Deposit name Rossing Langer Heinrich � Deposit type intrusive sandstone / carnotite � Reserves (tU) NA 17 100 � Grade (% U) 0.03 0.07 Mining operation: � Type (OP/UG/ISL) OP OP � Size (t ore/day) 41 900 4 300 � Average mining recovery (%) 82 90 Processing plant (acid/alkaline): alkaline � Type (IX/SX/AL) AL/IX/SX IX � Size (t ore/day); for ISL (L/day or L/h) 30 000 � Average process recovery (%) 86 90 Nominal production capacity (tU/year) 4 000 1 180 Plans for expansion Under consideration Other remarks

Namibia
238
Future production centres
Langer Heinrich Uranium (Pty) Ltd plans to bring the Langer Heinrich Uranium Project into production reaching design capacity of 1 180 tonnes of U3O8 per annum in January 2007.
ENVIRONMENTAL ACTIVITIES AND SOCIO-CULTURAL ISSUES
Namibian environmental legislation is not specific to the uranium mining industry alone but covers all aspects of mining throughout the country.
Currently, environment activities are governed only by an environmental policy. However, an Environmental Act and an Integrated Pollution Control and Waste management Bill are in a draft form. Furthermore, an Environmental Fund will be established to ensure that financial resources are available for mine rehabilitation.
Langer Heinrich Uranium (Pty) Ltd has commissioned a detailed environmental impact assessment of the proposed Langer Heinrich Uranium Project and Environmental Management Plans for each of the construction and operating phases. These documents have addressed all the topics listed above. The objective throughout the life of the project will be to apply the world’s best practice methods in environmental management to minimise impact on the natural and cultural environment. Tailings, waste rock and effluent management and rehabilitation will be carried out in such a way that the landform can be restored as closely as possible to its existing state.
URANIUM REQUIREMENTS
Namibia has no plan to develop nuclear generating capacity and consequently has no reactor-related requirements.
NATIONAL POLICIES RELATING TO URANIUM
The Namibian government recognises that the country’s uranium deposits represent a major economic resource both for Namibia and the uranium consumers of the world. It is thus committed to develop the deposits in a manner, which is safe for its workers and environmentally sustainable in the long term. This policy has been expressed through legislation in the Minerals (Prospecting and Mining) Act of 1992.
Namibia achieved independence on 21 March 1990 and the Act was promulgated in 1 April 1994. With the introduction of the Act, a number of South African laws that previously related uranium production were repealed or amended. These laws include the Nuclear Installations (Licensing and Security) Act of 1963, the Atomic Energy Act of 1967 and their amendments.

Namibia
239
While the repeal of the South African uranium-related legislation was justified, due to its complexity and references to issues were not relevant to Namibia, the provisions of the Namibian Minerals (Prospecting and Mining) Act of 1992 are not sufficiently detailed to control the safety or the environmental aspects of the uranium industry. The new Act (Atomic Energy Bill-in a final draft), which is due to be promulgated, will address the said problem.
Namibia reported no information on uranium stocks or uranium prices.
Uranium Exploration and Development Expenditures and Drilling Effort – Domestic
Expenses in NAD 2002 2003 2004 2005 (expected)
Industry exploration expenditures 1 200 000 900 000 11 500 000 13 400 000
Government exploration expenditures 0 0 0 0
Industry development expenditures NA NA NA 174 500 000
Government development expenditures 0 0 0 0
Total expenditures 1 200 000 900 000 11 500 000 187 900 000
Industry exploration drilling (metres) NA NA 6 720 9 600
Number of industry exploration holes drilled NA NA 166 240
Government exploration drilling (metres) 0 0 0 0
Number of government exploration holes drilled 0 0 0 0
Industry development drilling (metres) NA NA NA NA
Number of development exploration holes drilled NA NA NA NA
Government development drilling (metres) 0 0 0 0
Number of development exploration holes drilled 0 0 0 0
Subtotal exploration drilling (metres) 0 0 6 720 9 600
Subtotal exploration holes 0 0 166 240
Subtotal development drilling (metres) 0 0 0 0
Subtotal development holes 0 0 0 0
Total drilling (metres) 0 0 6 720 9 600
Total number of holes 0 0 166 240

Namibia
240
Reasonably Assured Resources
(tonnes U)
Production method <USD 40/kgU <USD 80/kgU <USD 130/kgU Recovery factor (%)
Underground mining 0 0 0
Open-pit mining 67 262 156 397 187 632
In situ leaching 0 0 0
Heap leaching 0 0 0
In-place leaching (stope/block leaching)
0 0 0
Co-product and by-product 0 0 0
Unspecified 0 0 0
Total 67 262 156 397 187 632
Reasonably Assured Resources by Deposit Type (tonnes U)
Deposit type <USD 40/kgU <USD 80/kgU <USD 130/kgU
Unconformity-related 0 0 0
Sandstone 10 000 17 100 17 100
Hematite breccia complex 0 0 0
Quartz-pebble conglomerate 0 0 0
Vein 0 0 0
Intrusive 57 262 139 297 170 532
Volcanic and caldera-related 0 0 0
Metasomatite 0 0 0
Other 0 0 0
Total 67 262 156 397 187 632
Inferred Resources* (tonnes U)
Production method <USD 40/kgU <USD 80/kgU <USD 130/kgU Recovery factor (%)
Underground mining 0 0 0
Open-pit mining 75 546 106 515 123 213
In situ leaching 0 0 0
Heap leaching 0 0 0
In-place leaching (stope/block leaching)
0 0 0
Co-product and by-product 0 0 0
Unspecified 0 0 0
Total 75 546 106 515 123 213
* In situ resources.

Namibia
241
Inferred Resources by Deposit Type*
(tonnes U)
Deposit type <USD 40/kgU <USD 80/kgU <USD 130/kgU
Unconformity-related 0 0 0
Sandstone 5 000 15 700 15 700
Hematite breccia complex 0 0 0
Quartz-pebble conglomerate 0 0 0
Vein 0 0 0
Intrusive 70 546 90 815 107 513
Volcanic and caldera-related 0 0 0
Metasomatite 0 0 0
Other 0 0 0
Total 75 546 106 515 123 213
* In situ resources.
Historical Uranium Production (tonnes U in concentrate)
Production method Total
through end of 2001
2002 2003 2004 Total
through end of 2004
2005 (expected)
Open-pit mining1 74 366 2 333 2 500 79 199
Underground mining1 0 0 0
In situ leaching 0 0 0 0
Heap leaching 0 0 0 0
In-place leaching* 0 0 0 0
Co-product/by-product 0 0 0 0
U recovered from phosphates
0 0 0 0
Other methods** 0 0 0 0
Total 74 366 2 333 2 500 79 199
(1) Pre-2002 totals may include uranium recovered by heap and in-place leaching. * Also known as stope leaching or block leaching. ** Includes mine water treatment and environmental restoration.
Ownership of Uranium Production in 2004
Domestic Foreign
Government Private Government Private Totals
[tU] [%] [tU] [%] [tU] [%] [tU] [%] [tU] [%]
NA 3.5 NA 96.5 0 0 0 0 NA 100

Namibia
242
Uranium Industry Employment at Existing Production Centres (person-years)
2002 2003 2004 2005 (expected)
Total employment related to existing production centres
782 780 NA NA
Employment directly related to uranium production
782 780 NA NA
Short-term Production Capability (tonnes U/year)
2005 2010
A-I B-I A-II B-II A-I B-I A-II B-II
0 0 4 000 4 000 0 0 4 000 4 000
2015 2020 2025
A-I B-I A-II B-II A-I B-I A-II B-II A-I B-I A-II B-II
0 0 4 000 4 000 0 0 4 000 4 000

Niger
243
• Niger •
URANIUM EXPLORATION
Historical review
Uranium exploration in the Arlit area of Niger began in 1956 and was conducted by the Commissariat à l’énergie atomique (CEA), later followed by COGEMA. Discovery of mineralised areas eventually led to the mining of the Arlette, Artois and Ariege deposits by the Société des Mines de l’Air (Somaïr), and the Akouta and Akola deposits by the Société des Mines d’Akouta (Cominak). Exploration along the northwest extension of the Arlette flexure fault resulted in the discovery of the Taza deposit. The Société Minière de Tassa N’Taghalgue (STT) was organised to own the deposit but assigned part of its mining rights to Somair in 1986.
In subsequent years, both Somair and Cominak were involved in exploration solely for the purpose of better evaluating known deposits. Somair delineated the Taza Nord deposit, Cominak evaluated a mineralised area located southeast of the Akola deposit.
Since 1993, both Somaïr and Cominak have carried out significant drilling programmes. Part of the drilling results led to reassessment of the resources estimates of the Takriza and Tamou deposits by Somaïr and further evaluation of the South Akouta and Akola deposits by Cominak. The remainder of SMTT’s rights were assigned to Somair in 1996, and SMTT was subsequently dissolved.
Recent and ongoing uranium exploration and mine development activities
COGEMA Niger
On 1 September 2004, the Niger government and COGEMA Niger, an affiliate of COGEMA France, signed a mining agreement to restart exploration. In 2004, a total of 9 656.6 m of drilling were carried out in the COGEMA concession called Arlit.
Somaïr
In 2004, the following tasks were carried out:
� Development of the Artois deposit;
� Feasibility study of the Artois deposit with 7 921 tonnes of mineable uranium at a grade of 0.296%;
� Re-evaluation of Tabelbelle-Takriza area resource with 488 tU at 0.285%.
In 2005, the target is the junction Tabbelle-Takriza and the Tamgak deposit.

Niger
244
Cominak
In 2004, the following tasks were carried out:
� Development drilling on Akola deposit;
� Drilling 20 023.3 m with 83 holes was carried out on Afasto permit;
� Evaluation of resources mineable with 15 737.47 tU at 4.29%;
� Reconfirmed the potential of 21 172 tU on the Ebba deposit.
In 2005, 2 810 m of drilling are budgeted to finalise the feasibility study.
URANIUM RESOURCES
Identified resources (RAR & Inferred)
A part of Reasonably Assured Resources has been moved to Inferred resources. A new area near Akola deposit was discovered. Resources of 1 100 tU were identified.
Undiscovered resources (Prognosticated & SR)
Ebba and Abala are new areas that have been identified in the last two years, which are geologically favourable for the discovery of resources that would be in addition to RAR and Inferred Resources.
URANIUM PRODUCTION
Historical review
In Niger, uranium is produced by two companies, Somaïr and Cominak, which have been operating mines in sandstone deposits since 1970 and 1978 respectively. A third company, the Société Minière de Tassa N’Taghalgue (SMTT) assigned its mining rights to Somaïr in 1996. SMTT was subsequently dissolved.
Status of production capability
According to the two centres the production capability is 3 800 tU/year.
Ownership structure of the uranium industry
The ownership structure of Niger’s two production companies is defined below:
Somaïr Cominak 36.6% Onarem (Niger) 31% Onarem (Niger
37.5% COGEMA (France) 34% COGEMA (France) 25.9% CFMM (France) 25% OURD (Japan)
10% Enusa (Spain

Niger
245
Employment in the uranium industry
With the restart of uranium activities, the number of staff has increased and is expected to reach 1 650 in 2005.
Future production centres
The Cominak production centre has been enlarged to include the northern part of Afasto (North and South Ebba) following the completion of a feasibility study. Cominak has made an application to acquire the license for mining Ebba deposit, expected in 2006. Exploration will continue on the rest of the Afasto permit.
Ownership of the uranium production in 2004
There has been no change in the ownership structure of the production centres since 1 January 2001.
Employment in the uranium industry
See relevant Table.
Uranium Production Centre Technical Details (as of 1 January 2005)
Centre #1 Centre #2
Name of production centre Arlit (SOMAIR) Akouta (COMINAK) Production centre classification existing existing Start-up date 1970 1978 Source of ore: � Deposit name Tamou, Ariege Akouta, Akola � Deposit type sandstone sandstone � Reserves (tU) 24 000 tU � Grade (% U) 0.43% Mining operation: � Type (OP/UG/ISL) OP UG � Size (t ore/day) 11 000 1 800 � Average mining recovery (%) 90% 100% Processing plant (acid/alkaline): � Type (IX/SX/AL) AL/SX AL/SX � Size (t ore/day)
for ISL (L/day or L/h) 2 200 1 900
� Average process recovery (%) 95 96 Nominal production capacity (tU/year) 1 500 2 300 Plans for expansion Other remarks

Niger
246
ENVIRONMENTAL ACTIVITIES AND SOCIO-CULTURAL ISSUES
On 1 January 2004 the mining agreement signed by Somaïr and Cominak came into force, according to which FCFA 500 million must go to site rehabilitation. It will also increase Government income from the sale of uranium.
URANIUM REQUIREMENTS
Niger has no plans to develop nuclear generating capacity and consequently has no reactor-related uranium requirements.
NATIONAL POLICIES RELATING TO URANIUM
One of the main objectives of Niger’s national uranium policy is to achieve a higher degree of international competitiveness in its uranium industry.
URANIUM STOCKS
None reported.
Uranium Exploration and Development Expenditures and Drilling Effort – Domestic
Expenses in million XOF 2002 2003 2004 2005
(expected) Industry exploration expenditures 1 416 1 031 1 168 NA Government exploration expenditures 0 0 0 0 Industry development expenditures 966 1 500 1 556 2 183 Government development expenditures 0 0 0 0 Total expenditures 2 382 2 531 2 724 NA Industry exploration drilling (metres) 35 933 44 351 29 580 10 000 Number of industry exploration holes drilled 148 184 132 40 Government exploration drilling (metres) 0 0 0 0 Number of government exploration holes drilled 0 0 0 0 Industry development drilling (metres) 33 542 33 678 59 317 50 000 Number of development exploration holes drilled 353 337 529 338 Government development drilling (metres) 0 0 0 0 Number of development exploration holes drilled 0 0 0 0 Subtotal exploration drilling (metres) 35 933 44 351 29 580 10 000 Subtotal exploration holes 148 184 132 40 Subtotal development drilling (metres) 33 542 78 029 59 317 50 000 Subtotal development holes 353 521 529 338 Total drilling (metres) 69 475 78 029 88 897 60 000 Total number of holes 501 521 661 378

Niger
247
Reasonably Assured Resources
(tonnes U)
Production method <USD 40/kgU <USD 80/kgU <USD 130/kgU Recovery factor (%)
Underground mining 23 100 30 700 30 700
Open-pit mining 23 512 23 512 23 512
In situ leaching 0 0 0
Heap leaching 0 0 0
In-place leaching (stope/block leaching)
0 0 0
Co-product and by-product 0 0 0
Unspecified 126 254 126 254 126 254
Total 172 866 180 466 180 466
Reasonably Assured Resources by Deposit Type (tonnes U)
Deposit type <USD 40/kgU <USD 80/kgU <USD 130/kgU Unconformity-related 0 0 0
Sandstone 172 866 180 466 180 466
Hematite breccia complex 0 0 0
Quartz-pebble conglomerate 0 0 0
Vein 0 0 0
Intrusive 0 0 0
Volcanic and caldera-related 0 0 0
Metasomatite 0 0 0
Other 0 0 0
Total 172 866 180 466 180 466
Inferred Resources (tonnes U)
Production method <USD 40/kgU <USD 80/kgU <USD 130/kgU Recovery factor (%)
Underground mining 0 7 900 7 900
Open-pit mining 0 9 508 9 508
In situ leaching 0 0 0
Heap leaching 0 0 0
In-place leaching (stope/block leaching)
0 0 0
Co-product and by-product 0 0 0
Unspecified 0 27 585 27 585
Total 0 44 993 44 993
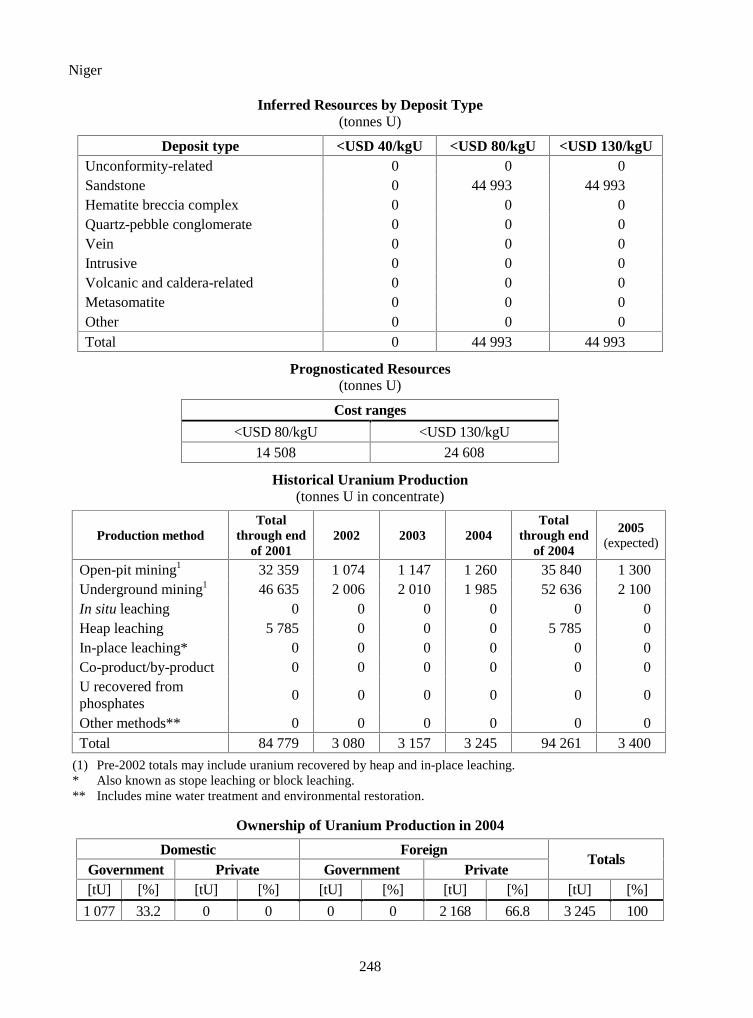
Niger
248
Inferred Resources by Deposit Type
(tonnes U)
Deposit type <USD 40/kgU <USD 80/kgU <USD 130/kgU Unconformity-related 0 0 0 Sandstone 0 44 993 44 993 Hematite breccia complex 0 0 0 Quartz-pebble conglomerate 0 0 0 Vein 0 0 0 Intrusive 0 0 0 Volcanic and caldera-related 0 0 0 Metasomatite 0 0 0 Other 0 0 0 Total 0 44 993 44 993
Prognosticated Resources (tonnes U)
Cost ranges
<USD 80/kgU <USD 130/kgU
14 508 24 608
Historical Uranium Production (tonnes U in concentrate)
Production method Total
through end of 2001
2002 2003 2004 Total
through end of 2004
2005 (expected)
Open-pit mining1 32 359 1 074 1 147 1 260 35 840 1 300 Underground mining1 46 635 2 006 2 010 1 985 52 636 2 100 In situ leaching 0 0 0 0 0 0 Heap leaching 5 785 0 0 0 5 785 0 In-place leaching* 0 0 0 0 0 0 Co-product/by-product 0 0 0 0 0 0 U recovered from phosphates
0 0 0 0 0 0
Other methods** 0 0 0 0 0 0 Total 84 779 3 080 3 157 3 245 94 261 3 400
(1) Pre-2002 totals may include uranium recovered by heap and in-place leaching. * Also known as stope leaching or block leaching. ** Includes mine water treatment and environmental restoration.
Ownership of Uranium Production in 2004
Domestic Foreign Government Private Government Private
Totals
[tU] [%] [tU] [%] [tU] [%] [tU] [%] [tU] [%]
1 077 33.2 0 0 0 0 2 168 66.8 3 245 100

Niger
249
Uranium Industry Employment at Existing Production Centres
(person-years)
2002 2003 2004 2005 (expected) Total employment related to existing production centres
1 558 1 606 1 598 1 650
Employment directly related to uranium production
1 348 1 398 1 388 1 440
Short-term Production Capability (tonnes U/year)
2005 2010
A-I B-I A-II B-II A-I B-I A-II B-II
3 800 0 3 800 0 3 800 0 3 800 0
2015 2020 2025
A-I B-I A-II B-II A-I B-I A-II B-II A-I B-I A-II B-II
3 800 0 3 800 0 3 800 0 3 800 0 3 800 0 3 800 0
Peru
250
• Peru •
URANIUM EXPLORATION
Historical review
The Macusani uraniferous district (Puno Department) is located in the south-east of Peru. The uraniferous mineralization is found in acid volcanic rock from the Mio-Pliocene era, which fills the Macusani tectonic depression and stands on rock from the Palaeozoic era.
Radiometric prospecting revealed over 40 uraniferous areas, the most important being Chapi, Pinocho, Chilcuno-VI, Cerro Concharrumio, Cerro Calvario, etc.
The uranium mineralization consists of: pitchblende, gummite, autunite and meta-autunite, filling sub-vertical to sub-horizontal fractures with impregnation on both sides of the fracture, the host rock being lapilli tuffs.
Of all the areas, Chapi is the most important site, and detailed radiometry, emanometry, trench and gallery work and diamond drilling have been performed here. The mineralization is in sub-vertical fractures distributed in structural lineaments 15-150 m wide and 20-30 m thick. The grades vary between 0.03 and 0.75%, with an average of 0.1% U. Based on the exploration results and both the geological and emanometry information, a minimum potential of 10 000 tU has been assigned to the Chapi site and 30 000 tU to the whole Macusani uraniferous district.
URANIUM RESOURCES
Identified resources (RAR & Inferred)
The identified uranium resources of Peru are primarily located in the Macusani area, Department of Puno. See relevant Table.
Undiscovered resources (Prognosticated & SR)
Undiscovered conventional resources are estimated to be 26 350 tU, 6 610 tU as Prognosticated Resources in the Chapi deposit area, and 19 740 tU as SR, based on the distribution of the volcanic host rock in the rest of the Macusani uraniferous district (1 000 km2).

Peru
251
Undiscovered non-conventional resources
The uranium contained in phosphates (phosphates with an average content of 90 ppm U) or in polymetallic deposits (Cu-Pb-Zn-Ag-W-Ni) is estimated to be 20 540 to 25 600 tU:
Bayovar phosphates 20 000 tU
Other locations (39) 540 – 5 600 tU
Total 20 540 – 25 600 tU
Peru has never produced uranium and reported no plans to do so. Additionally, Peru has no uranium requirements nor reported any plans to develop a nuclear generation capacity.
NATIONAL POLICIES RELATING TO URANIUM
All state-owned mining properties in Peru are in the process of being offered for privatisation within a political and economical framework that ensures long-term stability and guarantees to investors. Currently, the Peruvian government is expecting offers from foreign and national companies interested in the exploration and exploitation of mineral resources including uranium. To facilitate the assessment of the potential of the uranium occurrences, IPEN is prepared to provide the necessary technical information. Peru reported no information on uranium stocks or prices.
Reasonably Assured Resources* (tonnes U)
Production method <USD 40/kgU <USD 80/kgU <USD 130/kgU Recovery
factor (%)
Underground mining 0 0 0
Open-pit mining 0 0 0
In situ leaching 0 0 0
Heap leaching 0 1 790 1 790
In-place leaching (stope/block leaching)
0 0 0
Co-product and by-product 0 0 0
Unspecified 0 0 0
Total 0 1 790 1 790
* In situ resources.

Peru/Philippines
252
Inferred Resources*
(tonnes U)
Production method <USD 40/kgU <USD 80/kgU <USD 130/kgU Recovery factor (%)
Underground mining 0 0 0 Open-pit mining 0 0 0 In situ leaching 0 0 0 Heap leaching 0 1 860 1 860 In-place leaching (stope/block leaching)
0 0 0
Co-product and by-product 0 0 0 Unspecified 0 0 0 Total 0 1 860 1 860
* In situ resources.
Prognosticated Resources (tonnes U)
Cost ranges
<USD 80/kgU <USD 130/kgU
6 610 6 610
Speculative Resources (tonnes U)
Cost ranges
<USD 130/kgU Unassigned
19 740 0
• Philippines •
URANIUM EXPLORATION
Historical review
The search for uranium in the Philippines started in the early-1950s in areas containing radioactive anomalies. Since then, several prospecting and exploration programmes have been conducted throughout the archipelago both by the government and private sector. To date, more than 50% of the country has been covered at the reconnaissance level. Some areas were then followed up by semi-detailed and/or detailed geochemical surveys. Most of the exploration activities involving integrated application of geological, radiometric and geochemical techniques were carried out by the then Philippine Atomic Energy Commission (PAEC) now the Philippine Nuclear Research Institute (PNRI).
Philippines
253
During 1997 and 1998, reconnaissance and semi-detailed uranium geochemical exploration were continued by the Philippine Nuclear Research Institute on Palawan Island. At least two prospective geochemical anomalies were identified in the San Vicente area. Uranium occurrences in this area are related to granitic and metamorphic rocks (phyllite and schist).
From 1998 to 2000, a carborne radiometric survey was carried out on the whole of Marinduque Island. More than 2 000 km of traverse line were covered with the collection of about 20 400 gamma ray measurements. No area was found to have uranium potential. Since 2000, uranium geochemical and radiometric exploration on a detailed scale has been undertaken in the San Vicente area, north of the Palawan province.
URANIUM RESOURCES
Identified resources (RAR & Inferred)
There are no known significant uranium resources in the Philippines. Minor occurrences have been identified in association with pyrometasomatic replacement and hydrothermal metalliferous deposits related to middle Miocene intrusives of acid to intermediate composition.
Undiscovered resources (Prognosticated & SR)
The northern part of Palawan, located southwest of Luzon, was identified in the 1991-1992 period as a geologically favourable area for the discovery of uranium resources. Northern Palawan is considered to be a rifted portion of a continental terrain where the oldest basement formations consist of folded sedimentary and metamorphic rocks. The age of the basement rock is thought to be Lower Proterozoic or older.
The basement rocks were intruded by Tertiary granitic bodies and ultramafics. They are partly covered by Tertiary sedimentary formations. Major thrust faults separate these formations. The granitic intrusive bodies are thought to be prospective and the metamorphic formations near these intrusives are also considered to be geologically favourable for uranium mineralization.
No new areas, which are geologically favourable for the discovery of resources in the country, have been identified in the last two years (2003-2004).
ENVIRONMENTAL ACTIVITIES AND SOCIO-CULTURAL ISSUES
Since the Philippines has no identified uranium resources, there are no significant environmental issues related to the country’s uranium development and exploitation.

Philippines
254
URANIUM REQUIREMENTS
The Philippines began construction in 1976 of a 620 MWe PWR nuclear power plant, designated PNPP-1 that was mothballed en 1986. There were plans to convert this facility to a fossil fuel power plant but this has not materialised up to now. There are, therefore, no uranium requirements for the foreseeable future.
NATIONAL POLICIES RELATING TO URANIUM
By law, uranium exploration and mining is open to private enterprise. These activities are subject to nuclear safety regulations and existing production sharing arrangements including financial or technical assistance agreements as provided in the mining law. The Mines Geosciences Bureau (formerly Bureau of Mines). Monitor all exploration and activities.
The Philippines reported no information on uranium stocks or uranium prices.
Uranium Exploration and Development Expenditures and Drilling Effort – Domestic
Expenses in million PHP 2002 2003 2004 2005 (expected)
Industry exploration expenditures
Government exploration expenditures 0.2 0.1 0.2 0.27
Industry development expenditures
Government development expenditures
Total expenditures 0.2 0.1 0.2 0.27
Industry exploration drilling (metres)
Number of industry exploration holes drilled
Government exploration drilling (metres)
Number of government exploration holes drilled
Industry development drilling (metres)
Number of development exploration holes drilled
Government development drilling (metres)
Number of development exploration holes drilled
Subtotal exploration drilling (metres)
Subtotal exploration holes
Subtotal development drilling (metres)
Subtotal development holes
Total drilling (metres)
Total number of holes

Portugal
255
• Portugal •
URANIUM EXPLORATION
Historical review
The first uranium-radium deposits in Portugal were found in 1907 and the first mining concession (Rosmaneira) was granted in 1909, although it was Urgeiriça the first producing mine in 1913. Radium at Urgeiriça was mined until 1944 (an estimate of 50 g of radium production and 500 t of lost uranium) and uranium started to be mined in 1951. Between 1945 and 1962 a foreign privately owned enterprise, Companhia Portuguesa de Radium (CPR) extracted and processed ores from Urgeiriça and some other several mines in the Beira Alta (Central Portugal) region. CPR also carried out radiometric surveys, detailed geological mapping, trenching and extensive core drilling with gamma ray logging. All the targets were located in the Beiras granitic formations of Hercynian age.
In 1954 the Portuguese government created the Junta de Energia Nuclear (JEN) under the Prime Minister supervision and started (1955) an extensive and systematic exploration programme of the territory based on geological mapping, carborne and ground radiometric surveys, geophysics (resistivity), trenching and core and percussion drilling. This programme achieved a quite significant success and the resource inventory had a very large increase. Metasediments surrounding granitic formations also proved to be a very good target to host uranium mineralization of economic interest. By the end of the exploration programme in 1959 JEN had discovered about 100 deposits of medium and small size in Hercynian granitic and perigranitic formations in Beiras and Alto Alentejo. The Beiras deposits together with Urgeiriça ore mill treatment plant were managed as an integrated uranium production centre. The Alto Alentejo deposits, which include the larger national ore body (Nisa, with roughly 5 000 t U) could support another production centre but remain untouched until the present. The last attempt to start production in this area was abandoned in 1999 after a positive environmental assessment but negative economic appraisal.
From 1976 until the mid-1990s exploration in crystalline regions continued with a relative success with new developed resources roughly replacing depletion by mining extraction. Exploration in sedimentary formations started in 1971 until 1982 based on geological mapping, geochemistry, emanometry and drilling surveys in the western Meso-Cenozoic fringe of the Lusitanian Basin but without proving any economic resource.
Recent and ongoing uranium exploration and mine development activities
During the period of 2003 to 2004, no uranium exploration or exploitation activities were conducted in Portugal or abroad. Several environmental studies were conducted by EXMIN, the concessionaire for the rehabilitation of mine sites, including uranium old mines. Rehabilitation field works are expected to start 2005.

Portugal
256
URANIUM RESOURCES
Identified resources (RAR & Inferred)
Portugal reports revised figures of 6 000 tU of RAR recoverable at costs of <USD 80/kgU. Additionally, 1 200 tU are reported at IR recoverable at costs <USD 80/kgU. Processing losses of ~10% have been accounted for in both resources estimate categories.
Undiscovered resources (Prognosticated & SR)
A new estimate of undiscovered conventional resources include 2 000 tU of prognosticated resource category and a non revised figure of 5 000 tU of speculative resources recoverable at costs <USD 130/kgU.
URANIUM PRODUCTION
Historical review
In 1950-51 a uranium mill facility processing 50 000 t/y has been erected at Urgeiriça. Underground extraction at Urgeiriça mine continued until 1973, followed by in place leaching between 1970 until 1991. The mine reached 500 m depth and 1 600 m extension. In 1951 natural leaching was applied for the first time in Portugal. Five different natural leaching facilities operate in the period 1953-1959 producing 40 tU.
Between 1951 and 1962, the CPR produced a total of 1 123 tU from 22 concessions, of which 1 058 tU were milled at the Urgeiriça plant and 65 tU at other mines by heap leaching. A low grade concentrate was obtained by precipitation using magnesium oxide. During the period 1962 to 1977 the JEN took over the mining and milling activities from CPR, introducing organic solvent extraction in 1967 and expand ore treatment capacity to 100 000 t/y and producing a rich ammonium uranate concentrate. In 1985 (July) a new capacity expansion to 200 000 t/y has been implemented. A total of 825 tU were produced under JEN management from the Urgeiriça plant and the pilot plants at Senhora das Fontes and Forte Velho. Between 1977 and 2001, ENU produced 1 772 tU. Production ceased in March 2001. From the total historical concentrate production 25% came out from Urgeiriça mine.
Urgeiriça mill stopped ore processing in 1999 and was decommissioned in March 2001. In this interim period only exchange ions resins charged in heap and in place leaching plants located in Bica e Quinta do Bispo mines were processed in Urgeiriça plant and yellow cake produced thereafter. Globally, 57 ore bodies have been mined, 29 by underground methods, 24 by open pit and 4 by mixed underground-open pit methods. In 18 of these mines local ore treatment has been used, but only at Urgeiriça uranium concentrates have been produced at industrial scale. Two pilot treatment plants (Forte Velho and Srª das Fontes) produced quite limited amounts of concentrates (sodium uranate).

Portugal
257
Ownership of Urgeiriça mill plant evolved along the time and after CPR concluded the agreement
with the Portuguese government in 1962 JEN took over until 1977 when a publicly-owned enterprise Empresa Nacional de Urânio, SA (ENU) acquired the exclusivity of uranium concentrate production and selling. In 1978 the exploration teams of JEN joined the Direcção-Geral de Geologia e Minas (DGGM). In 1992 ENU was integrated into the Portuguese state mining holding, Empresa de Desenvolvimento Mineiro (EDM). In March 2001 EDM decided to liquidate ENU by the end 2004.
Status of production capabilities
There are no operational processing facilities since 2001. Demolition/reclamation of the Urgeiriça production mill as well as other mine sites are in an advanced project phase. Reclamation of old tailings dam will be done in 2005 after an environmental impact assessment, at an estimated cost of EUR 5 million. Neutralisation of acid mine water coming out from Urgeiriça, Bica, Cunha Baixa and Quinta do Bispo still goes on.
Ownership structure of the uranium industry
ENU, the Portuguese uranium mining and processing company has been extinguished as of 31 December 2004. Presently no company has exploration or mining rights over uranium national resources that make them available for mineral rights granting.
Employment in the uranium industry
Employment has been reduced to zero.
Future production centres
No future production centres are foreseen.
ENVIRONMENTAL ACTIVITIES AND SOCIO-CULTURAL ISSUES
Under the Decree 198-A/2001 the Portuguese state institutionalise the concession for the rehabilitation of all orphan mine sites in the country, which was made extensive to uranium mine sites taken into account the role played by the state in their development. Under the Resolution 93/2001, of the Council of Ministers, the concession was attributed to EXMIN, a company subsidiary of the state holding for the mining sector EDM.
The on-going programme under the Decree 198-A/2001 is aimed to the rehabilitation of mine sites, addressing the public health, potential economic development, cultural and heritage issues. A monitoring programme of old main mines has been approved and is conducted by EXMIN. A rehabilitation project of old tailings dams has been submitted to EIA and got approval to be executed, which will be done during 2005.
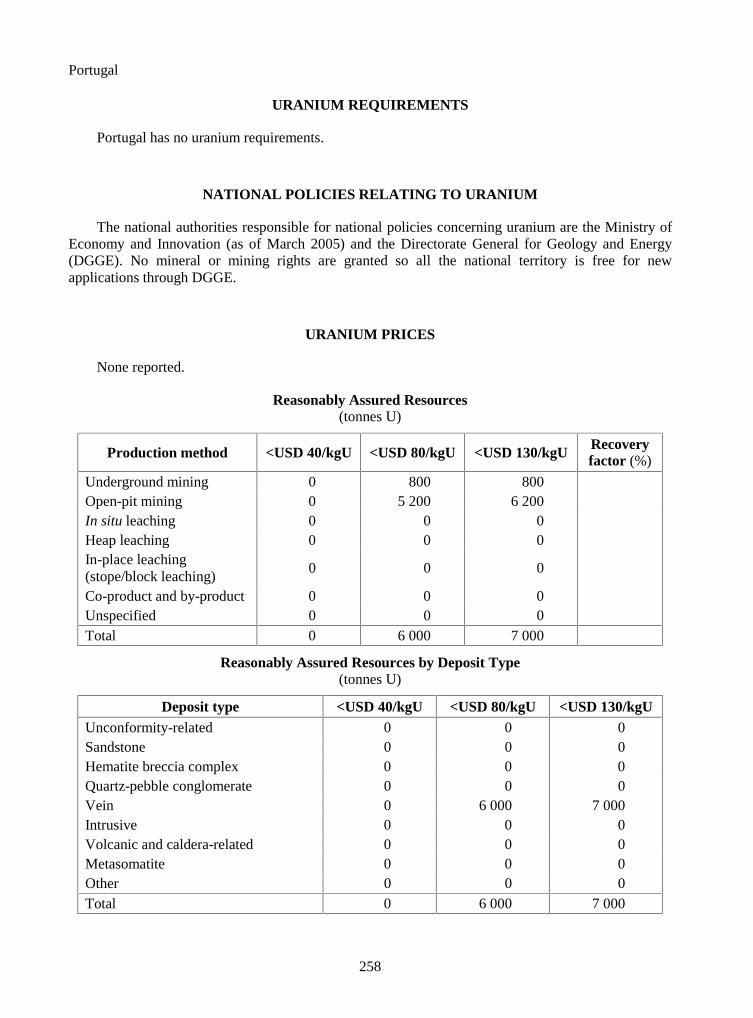
Portugal
258
URANIUM REQUIREMENTS
Portugal has no uranium requirements.
NATIONAL POLICIES RELATING TO URANIUM
The national authorities responsible for national policies concerning uranium are the Ministry of Economy and Innovation (as of March 2005) and the Directorate General for Geology and Energy (DGGE). No mineral or mining rights are granted so all the national territory is free for new applications through DGGE.
URANIUM PRICES
None reported.
Reasonably Assured Resources (tonnes U)
Production method <USD 40/kgU <USD 80/kgU <USD 130/kgU Recovery factor (%)
Underground mining 0 800 800 Open-pit mining 0 5 200 6 200 In situ leaching 0 0 0 Heap leaching 0 0 0 In-place leaching (stope/block leaching)
0 0 0
Co-product and by-product 0 0 0 Unspecified 0 0 0 Total 0 6 000 7 000
Reasonably Assured Resources by Deposit Type (tonnes U)
Deposit type <USD 40/kgU <USD 80/kgU <USD 130/kgU Unconformity-related 0 0 0 Sandstone 0 0 0 Hematite breccia complex 0 0 0 Quartz-pebble conglomerate 0 0 0 Vein 0 6 000 7 000 Intrusive 0 0 0 Volcanic and caldera-related 0 0 0 Metasomatite 0 0 0 Other 0 0 0 Total 0 6 000 7 000
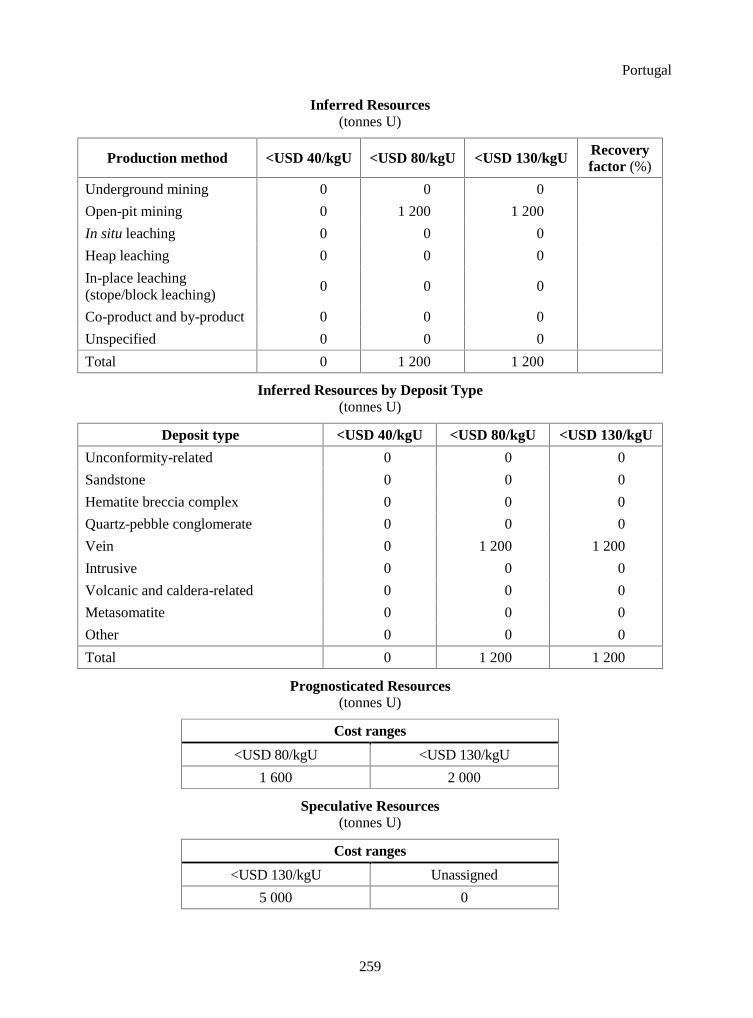
Portugal
259
Inferred Resources
(tonnes U)
Production method <USD 40/kgU <USD 80/kgU <USD 130/kgU Recovery factor (%)
Underground mining 0 0 0
Open-pit mining 0 1 200 1 200
In situ leaching 0 0 0
Heap leaching 0 0 0
In-place leaching (stope/block leaching)
0 0 0
Co-product and by-product 0 0 0
Unspecified 0 0 0
Total 0 1 200 1 200
Inferred Resources by Deposit Type (tonnes U)
Deposit type <USD 40/kgU <USD 80/kgU <USD 130/kgU
Unconformity-related 0 0 0
Sandstone 0 0 0
Hematite breccia complex 0 0 0
Quartz-pebble conglomerate 0 0 0
Vein 0 1 200 1 200
Intrusive 0 0 0
Volcanic and caldera-related 0 0 0
Metasomatite 0 0 0
Other 0 0 0
Total 0 1 200 1 200
Prognosticated Resources (tonnes U)
Cost ranges
<USD 80/kgU <USD 130/kgU
1 600 2 000
Speculative Resources (tonnes U)
Cost ranges
<USD 130/kgU Unassigned
5 000 0

Portugal
260
Historical Uranium Production (tonnes U in concentrate)
Production method Total
through end of 2001
2002 2003 2004 Total
through end of 2004
2005 (expected)
Open-pit mining1 1 810 0 0 0 1 810 0
Underground mining1 1 326 0 0 0 1 326 0
In situ leaching 0 0 0 0 0 0
Heap leaching 321 0 0 0 321 0
In-place leaching* 250 0 0 0 250 0
Co-product/by-product 0 0 0 0 0 0
U recovered from phosphates
0 0 0 0 0 0
Other methods** 13 0 0 0 13 0
Total 3 720 0 0 0 3 720 0
(1) Pre-2002 totals may include uranium recovered by heap and in-place leaching. * Also known as stope leaching or block leaching. ** Includes mine water treatment and environmental restoration.
Uranium Industry Employment at Existing Production Centres (person-years)
2002 2003 2004 2005 (expected)
Total employment related to existing production centres
11 3 0 0
Employment directly related to uranium production
0 0 0 0
Total Uranium Stocks (tonnes natural U-equivalent)
Holder
Natural uranium stocks in
concentrates
Enriched uranium
stocks
Depleted uranium
stocks
Reprocessed uranium
stocks Total
Government 168 0 0 0 168
Producer 0 0 0 0 0
Utility 0 0 0 0 0
Total 168 0 0 0 168

Russian Federation
261
• Russian Federation •
URANIUM EXPLORATION
Historical review
Since the beginning of uranium exploration in 1944, more than 100 uranium deposits have been discovered within fourteen districts in the Russian Federation. These deposits can be classified into three major groups: the Streltsovstk district, which includes 19 volcanic caldera-related deposits where the mining of some deposits is ongoing, the Transural and Vitim districts where sandstone basal-channel type deposits are developed or are planned for uranium production by in situ leaching (ISL) mining and eleven other uranium bearing districts containing numerous deposits of vein, volcanic and metasomatite types higher cost uranium resources. That may have economic potential in the future.
Recent and ongoing uranium exploration and mine development activities
Geological exploration work
Uranium exploration and prospecting work is financed from state budget funds by the Russian Ministry of Natural Resources, and since 2004 by the Federal Subsoil Resources Management Agency. The executing organisation is the Federal State Unitary Enterprise Urangeologorazvedka, known until 2004 as “Central Geological Exploration Division”.
From 2003 to 2004, work continued in two directions:
� Search for sandstone-type deposits in paleovalleys suitable for in situ leaching in Central Russia, the West Siberian and Transural regions and the Buryat Republic (Amalat area).
� Search for rich unconformity-type deposits in Siberia (Yenisey ridge, Eastern Sayan Mountains, Uvat rise, Bulbukhta area) and also in the north-western (Baltic shield) and central (Voronezh massif) regions of the European part of Russia.
As a result of the exploration and prognostication work carried out, a few small uranium deposits and occurrences, as well as a large number of radioactive anomalies, have been found, but no industrial-scale deposits have been discovered. In the East Siberian region a number of new areas that are promising for unconformity or vein-stockwork type deposits have been located.

Russian Federation
262
In 2005, the funding volume increased 2.3-fold. The Federal Subsoil Resources Management Agency plans to step up significantly the geological exploration work in the above-mentioned directions, in both old and new areas. Work will also commence on searching for vein-stockwork type deposits in the Southern Priargun area.
In 2004, the TVEL Corporation invested RUB 51.2 million in exploring deposits located in areas of activity of uranium-producing enterprises.
Development of deposits
Investment in the development of new deposits is made by the TVEL Corporation through its daughter companies.
In Kurgan Region the Dalur company in 2002 started industrial exploitation of the Dalmatovskoe deposit by the method of in situ leaching through boreholes using sulphuric acid. As of 2005 pilot testing and exploration work is starting at the new Khokhlovskoe deposit.
In the Vitim district of the Buryat Republic the Khiagda company has been carrying out pilot industrial work on the Khiagda deposit since 1999. The testing and exploration of the deposit is planned to be completed in 2005. In addition, in 2005 it is planned to finalise the feasibility study prepared in 2004 for the construction of the Khiagda facility.
URANIUM RESOURCES
Identified resources (RAR & Inferred)
The main resources in the RAR category relate to vein-stockwork type deposits in volcanic structures of the Streltsovsk uranium ore district, worked by underground mining by the Priargunsky Company. The status of the resources in this category had changed by 2004, largely because of mining depletion. Since 2004 the resources of sandstone-type deposits for mining by in situ leaching have included not only the Dalmatovskoe deposit taken into account earlier, but also the resources of the Khiagda deposit, amounting to 6 897 tU of RAR and 4 380 tU of Inferred Resources, with a cost of up to USD 40/kgU. In addition, as a result of geological exploration work carried out in 2004, the Inferred Resources at mining companies have grown by 3 208 tU.
Apart from the explored resources given in the Tables, Russia has over 450 000 tonnes of explored non-balance-sheet resources in Inferred Resources whose price category has not been determined to date and which belong to stand-by deposits. These stand-by deposits were discovered, explored and technically and economically evaluated in the 1950s to 1980s. The main reason for including them in this group was the higher production cost of uranium at that time by comparison with other deposits. Today an integrated technical and economic re-evaluation of these deposits is being conducted. The most promising are considered to be the metasomatic type uranium deposits of the Elkon (Aldan) uranium ore district in the Yakut-Sakha Republic, with total resources of over 340 000 tU.

Russian Federation
263
The remaining resources in this category relate mainly to small deposits of the vein-stockwork type in East Siberia (Chita Region) for underground mining (resources about 50 000 tU) and of the sandstone type in the Buryat Republic (resources 37 000 tU) and in the West Siberian region (11 000 tU) for mining by in situ leaching.
Undiscovered resources (Prognosticated & SR)
The overall amount of Prognosticated Resources has not changed with respect to the 2003 Red Book. The major part of the Prognosticated Resources relate to two types of deposits:
� Paleovalley-type deposits within the Transural, West Siberian and Vitim uranium ore districts;
� Unconformity-type deposits within the Baltic shield (Onega-Ladoga district of Karelia) and the south-eastern part of the Aldan shield (Uchur-Maya district, Yakutia), Eastern Sayan and Patom highland (Chara district).
URANIUM PRODUCTION
Historical review
The first organisation responsible for uranium production was the Lermontov Complex, presently Lermontov State Enterprise “Almaz”. Almaz is located 1.5 km from the town of Lermontov, in the Stavropol region or district. This district included the Bestau and Byk vein deposits, which have been mined out. Their original resources totalled 5 300 tU, at an average grade of 0.1% U. These resources were extracted by two underground mines starting in 1950. Mine 1 (Beshtau) was closed in 1975 and Mine 2 (Byk) in 1990. The ore was processed at the local processing plant using sulphuric acid leaching starting in 1954. From 1965 to 1989 stope or block leaching were also used. From the 1980s until 1991 uranium ore transported from Ukraine and Kazakhstan was also processed at Almaz. Production from local deposits totalled 5 685 tU, with 3 930 tU extracted by underground mining and 1 755 tU by a combination of different leaching technologies.
Between 1968 and 1980, 440 tU were produced by ISL from the Sanarskoye deposit in the Transural district. The Malyshevsk Mining Enterprise operated the project.
The joint Stock Company “Priargunsky Mining-Chemical Production Association” (PPGHO) has been the only active uranium production centre in Russia in the last decade. The Priargunsky production centre is located in the Chita region 10-20 km from the town of Krasnokamensk, which has a population of about 60 000 people. The production is based on 19 volcanic deposits of the Streltsovsk uranium district, which has an overall average uranium grade of about 0.2% U. This district has an area of 150 km2. Mining has been conducted since 1968 by two open pits (both are depleted) and three underground mines (mines 1 and 2 are active and mine 4 is closed). Milling and processing has been carried out since 1974 at the local hydrometallurgical plant using sulphuric acid leaching with subsequent recovery by a combination of ion exchange and solvent-extraction. Since the 1990s low-grade ore has been processed by heap and stope/block leaching.

Russian Federation
264
More than 100 000 t U has been produced from the Stresovsk deposits at Priargunsky, making it one of the most productive uranium districts in the world. Cumulative production through 2004 in the Russia Federation totalled 119 963 tU, which makes it the fifth largest uranium producer in the world based on historical production.
Status of production capabilities
Russia’s uranium mining enterprises belong to the state corporation “TVEL”, which produces nuclear fuel for 76 power reactors worldwide, including all the Russian nuclear power plants.
The open joint-stock company Priargunsky Mining and Chemical Production Association remains the principal uranium mining centre in Russia. It is located in Krasnokamensk, Chita Region. The raw material base is constituted by the deposits of the Streltsovsk uranium ore district. Annual uranium production continues to stand at a level of 3 000 tU. Most of this is accounted for by underground mining, but small quantities of uranium are also obtained by heap and block leaching. After technical upgrading of the enterprise, it should be possible, on the basis of the explored resources of the operational mines 1 and 2, to continue the working of rich ores by conventional mining methods while processing the lower grade ores on a broad scale by block and heap leaching. As regards the development of uranium production after 2010, it is planned to put into operation a new mine based on the Argun deposit. To develop the resources for the Priargunsky Company, it is planned to step up the geological exploration work to complete the surveying of the flanks and deep horizons of the Streltsovsk ore field and the search for new deposits in the Southern Priargun region.
A new enterprise for in situ leaching of uranium through boreholes, the closed joint-stock company “Dalur” in Kurgan Region, started industrial operations in 2002. Dalur is engaged in developing the Dalmatovskoe and Khokhlovskoe deposits in the Transural uranium ore district. At present, the first phase of mine construction is under way at Dalmatovskoe. In 2004, 175 tU were extracted. In 2005 it is planned to achieve 250 tU per year. As new sections and deposits are brought into production the centre’s annual output is to increase to 750 tU by 2010.
Employment in the uranium industry
In 2004 there were 12 770 people working for the Priargunsky Mining and Chemical Production Association, about 4 500 of whom were employed directly in uranium mining and reprocessing subdivisions. There were 246 people working at the Dalur facility (under construction) in 2004.
Future production centres
At the Khiagda facility in north-eastern Buryatia, pilot testing work on the Khiagda deposit is being concluded. The data collected confirm the possibility of exploitation using in situ leaching with adequately high technical and economic indicators. There are plans to begin constructing an in situ leaching mine in 2006, which will have an output of 1 000 tU per year by 2012.

Russian Federation
265
Uranium Production Centre Technical Details
(as of 1 January 2005)
Centre # 1 Centre # 2 Centre # 3
Name of production centre
JSC Priargunsky Mining and Chemical Production
Association JSC Dalur JSC Khiagda
Production centre classification
existing existing planned
Start-up date 1968 2002 2006
Source of ore: � Deposit name Antei, Streltsovsk,
Oktyabrskoe, etc. Dalmatovskoe, Khokhlovskoe
Khiagda
� Deposit type volcanic, in caldera sandstone in paleovalleys
sandstone in paleovalleys
� Reserves (tU) 128 200 10 200 11 000 � Grade (% U) 0.2 0.04 0.05
Mining operation: � Type (OP/UG/ISL) UG, HL*, BL* SAL*, ISL SAL, ISL � Size (t ore/day) 6 700 NA NA � Average mining
recovery (%) 95 75 75
Processing plant (acid/alkaline):
� Type (IX/SX/AL) SAL, IX IX IX � Size (t ore/day)
for ISL (L/day or L/h) 4 700 no data no data
� Average process recovery (%)
95 98 98
Nominal production capacity (tU/year)
3 500 800 1 000
Plans for expansion Expansion by heap and block leaching, opening of new mines.
Development of the Khokhlovskoe deposit.
Exploration and development of the Vitim district deposit.
Other remarks
* SAL – sulphuric acid leaching, HL – heap leaching, BL – block leaching.
URANIUM REQUIREMENTS
In 2004, there were 31 nuclear reactors in operation at 10 power plants, with a total installed capacity of 22 242 MWe. These included 15 VVER reactors, 15 channel-type RBMK and EGP reactors and one fast reactor. In 2004, Unit 3 of the Kalinin nuclear power plant was started up and work was completed on extending the lifetime of units at the Leningrad, Kola and Kursk nuclear power plants.

Russian Federation
266
In 2004, Russia’s nuclear power plants generated 143 TWh of electricity (net). The installed capacity factor was 73.2%. Nuclear power plants provided 16% of total electricity production in Russia. The annual uranium requirement for Russia’s nuclear reactors is about 4 700 tU.
NATIONAL POLICIES RELATING TO URANIUM
Russia reported no information on national policies relating to uranium, uranium stocks or uranium prices.
Uranium Exploration and Development Expenditures and Drilling Effort – Domestic
Expenses in million RUB 2002 2003 2004 2005 (expected)
Industry exploration expenditures 0 0 51.2 56.5
Government exploration expenditures 178.15 191.04 200.68 489.60
Industry development expenditures 30 31.4 44.6 115
Government development expenditures 0 0 0 0
Total expenditures 208.15 222.44 296.48 661.1
Industry exploration drilling (metres) 0 0 25 753 44 000
Number of industry exploration holes drilled 0 0 131 85
Government exploration drilling (metres) 75 070 89 092 81 365 102 000
Number of government exploration holes drilled NA NA NA NA
Industry development drilling (metres) 0 0 0 0
Number of development exploration holes drilled 0 0 0 0
Government development drilling (metres) NA NA NA NA
Number of development exploration holes drilled NA NA NA NA
Subtotal exploration drilling (metres) 75 070 89 092 107 118 146 000
Subtotal exploration holes NA NA NA NA
Subtotal development drilling (metres) NA NA NA NA
Subtotal development holes NA NA NA NA
Total drilling (metres) NA NA NA NA
Total number of holes NA NA NA NA

Russian Federation
267
Reasonably Assured Resources
(tonnes U)
Production method <USD 40/kgU <USD 80/kgU <USD 130/kgU Recovery factor (%)
Underground mining 42 900 117 120 NA 95
Open-pit mining 0 0 0
In situ leaching 14 630 14 630 NA 75
Heap leaching 0 0 0
In-place leaching (stope/block leaching)
0 0 0
Co-product and by-product 0 0 0
Unspecified 0 0 0
Total 57 530 131 750 NA
Reasonably Assured Resources by Deposit Type (tonnes U)
Deposit type <USD 40/kgU <USD 80/kgU <USD 130/kgU Unconformity-related 0 0 0
Sandstone 14 630 14 630 NA
Hematite breccia complex 0 0 0
Quartz-pebble conglomerate 0 0 0
Vein 0 0 0
Intrusive 0 0 0
Volcanic and caldera-related 42 900 117 120 NA
Metasomatite 0 0 0
Other 0 0 0
Total 57 530 131 750 NA
Inferred Resources (tonnes U)
Production method <USD 40/kgU <USD 80/kgU <USD 130/kgU Recovery factor (%)
Underground mining 14 790 33 870 NA 95
Open-pit mining 0 0 NA
In situ leaching 6 782 6 782 NA 75
Heap leaching 0 0 NA
In-place leaching (stope/block leaching)
0 0 NA
Co-product and by-product 0 0 NA
Unspecified 0 0 NA
Total 21 572 40 652 NA

Russian Federation
268
Inferred Resources by Deposit Type
(tonnes U)
Deposit type <USD 40/kgU <USD 80/kgU <USD 130/kgU Unconformity-related 0 0 0 Sandstone 6 782 6 782 NA Hematite breccia complex 0 0 0 Quartz-pebble conglomerate 0 0 0 Vein 14 790 33 870 NA Intrusive 0 0 0 Volcanic and caldera-related 0 0 0 Metasomatite 0 0 0 Other 0 0 0 Total 21 572 40 652 NA
Prognosticated Resources (tonnes U)
Cost ranges
<USD 80/kgU <USD 130/kgU
56 300 104 500
Speculative Resources (tonnes U)
Cost ranges
<USD 130/kgU Unassigned
545 000 0
Historical Uranium Production (tonnes U in concentrate)
Production method Total
through end of 2001
2002 2003 2004 Total
through end of 2004
2005 (expected)
Open-pit mining1 38 655 0 0 0 38 655 0 Underground mining1 74 102 2 630 2 772 2 880 82 384 2 800 In situ leaching 3 298 100 140 200 3 738 250 Heap leaching 848 120 155 189 1 312 200 In-place leaching* 210 0 6 11 227 25 Co-product/by-product 0 0 0 0 0 0 U recovered from phosphates
0 0 0 0 0 0
Other methods** 0 0 0 0 0 0 Total 117 113 2 850 3 073 3 280 119 963 3 275
(1) Pre-2002 totals may include uranium recovered by heap and in-place leaching. * Also known as stope leaching or block leaching. ** Includes mine water treatment and environmental restoration.

Russian Federation
269
Ownership of Uranium Production in 2004
Domestic Foreign
Government Private Government Private Totals
[tU] [%] [tU] [%] [tU] [%] [tU] [%] [tU] [%]
3 280 100 0 0 0 0 0 0 3 280 100
Uranium Industry Employment at Existing Production Centres (person-years)
2002 2003 2004 2005 (expected)
Total employment related to existing production centres
12 700 12 785 13 016 13 200
Employment directly related to uranium production
4 580 4 620 4 746 4 850
Short-term Production Capability (tonnes U/year)
2005 2010
A-I B-I A-II B-II A-I B-I A-II B-II
3 200 3 200 3 200 3 200 4 300 4 500 4 300 4 500
2015 2020 2025
A-I B-I A-II B-II A-I B-I A-II B-II A-I B-I A-II B-II
5 500 6 300 5 500 6 300 5 500 7 500 5 500 7 500 5 500 9 000 5 500 9 000
Net Nuclear Electricity Generation
2003 2004
Nuclear electricity generated (TWh net) 138.4 143.0
Installed Nuclear Generating Capacity to 2025 (MWe net)
2010 2015 2020 2025 2004 2005
Low High Low High Low High Low High
23 242 23 000 27 000 29 000 33 000 38 600 37 000 41 400 38 600 44 200
Annual Reactor-related Uranium Requirements to 2025 (excluding MOX) (tonnes U)
2010 2015 2020 2025 2004 2005
Low High Low High Low High Low High
4 742 4 465 5 500 5 750 6 200 7 000 6 500 7 500 7 000 8 000

Russian Federation/Slovak Republic
270
• Slovak Republic •
URANIUM EXPLORATION AND RESOURCES
Uranium exploration was performed within the Slovak Republic since 1950s in different regions. Based on the results of the evaluation it was concluded that the Slovak Republic has no known uranium resources. No uranium exploration has occurred since 1990.
URANIUM PRODUCTION
Historical review
In 1960s and 1970s some small quantities of uranium ore were mined in Eastern Slovakia. Production was stopped due to inefficiency and the low-grade of the ore.

Slovak Republic
271
Status of production capability
The Slovak Republic has no uranium mining industry or production capability and has no plans to create one in the future.
Secondary sources of uranium
The Slovak Republic does not produce or use Mixed Oxide Fuels, Re-enriched Tails and Reprocessed Uranium.
ENVIRONMENTAL ACTIVITIES AND SOCIO-CULTURAL ISSUES
The Slovak Republic has not any developments relating to environmental activities related to uranium mining, because it has not uranium mining industry or production capability.
URANIUM REQUIREMENTS
The Slovak Republic has two nuclear power plants located at Bohunice and Mochovce. The NPP Bohunice has four units of the VVER-440 type in operation, with installed capacity of 4 x 440 MW. The NPP Mochovce has two VVER-440 type units in operation with installed capacity of 2 x 440 MW.
In the end of the year 2003 the Slovak Republic utility signed contract with Russian supplier for supplies of fresh nuclear fuel for NPP Bohunice units 3 and 4 and NPP Mochovce units 1 and 2. The supplied fuel will be of new generation (new mechanical and nuclear design with burnable Gd absorber) and should result in better efficiency.
NATIONAL POLICIES RELATING TO URANIUM
The Slovak Republic utility purchases complete fuel assemblies for all operating units from Russian manufacturers. Therefore, there are no special contracts on uranium, conversion and enrichment services.
URANIUM STOCKS AND PRICES
The Slovak Republic does not maintain an inventory of uranium. The Slovak government keeps small stock of enriched uranium in form of complete fuel assemblies. Based on above-mentioned information, the Slovak Republic utility has not any special uranium contracts; therefore it cannot publish prices for uranium.

Slovak Republic/Slovenia
272
Net Nuclear Electricity Generation
2003 2004
Nuclear electricity generated (TWh net) 16.4 15.7
Installed Nuclear Generating Capacity to 2025 (MWe net)
2010 2015 2020 2025 2004 2005
Low High Low High Low High Low High
2 460 2 460 1 640 1 640 1 640 2 460 1 640 2 460 1 640 2 460
Annual Reactor-related Uranium Requirements to 2025 (excluding MOX) (tonnes U)
2010 2015 2020 2025 2004 2005
Low High Low High Low High Low High
501 448 334 334 334 501 334 501 334 501
Total Uranium Stocks (tonnes natural U-equivalent)
Holder
Natural uranium stocks in
concentrates
Enriched uranium
stocks
Depleted uranium
stocks
Reprocessed uranium
stocks Total
Government 0 NA 0 0 NA
Producer 0 0 0 0 0
Utility 0 0 0 0 0
Total 0 NA 0 0 NA
• Slovenia •
URANIUM EXPLORATION
Historical review
Exploration of the Zirovski Vrh area began in 1961. In 1968, the P-10 tunnel was developed giving access to the ore body. Mining began at Zirovski Vrh in 1982. Uranium concentrate production (as yellow cake) began in 1985.

Slovenia
273
Recent and ongoing uranium exploration and mine development activities
Expenditures for exploration ended in 1990. There are no recent or ongoing uranium exploration activities in Slovenia.
URANIUM RESOURCES
Identified resources (RAR & Inferred)
Resource assessment of the Zirovski deposit was carried out in 1994. RAR are estimated to be 2 200 tU in ore with an average grade of 0.14% U. These resources are in <USD 80/kgU category. Inferred resources of 5 000 tU in the <USD 80/kgU category and 10 000 tU in the <USD 130/kgU category are reported. The average grade of these resources is 0.13% U. The deposit occurs in the grey sandstone of the Permian Groeden formation. The ore bodies occur as linear arrays of elongated lenses within folded sandstone.
Undiscovered resources
See relevant Table.
URANIUM PRODUCTION
Historical review
The Zirovski Vrh uranium mine was the only uranium producer in Slovenia. It is located 20 km southwest of Škofja Loka. Ore production at the Zirovski Vrh mine started in 1982. The ore processing plant located at the mine began operation in 1984 to treat the previously stockpiled ore. The annual production capability of the mill was 102 tU. The ore was mined using a conventional underground operation with a haulage tunnel and ventilation shaft. The ore occurs in numerous small bodies in the mineralised coarse-grained sandstone. It was mined selectively using room and pillar, and cut and fill methods. In 1990, the operation was terminated. Cumulative production from the Zirovski Vrh mine-mill complex totalled 382 tU (620 000 tonnes of ore at an average grade of 0.072% U).
Status of production capability
In 1992, the decision for final closure and subsequent decommissioning of the Zirovski Vrh mine and mill was made. Since 1992, there has been no production from the Zirovski facility. In 1994, the plan for the decommissioning of the centre was accepted by the Slovenian government authorities.

Slovenia
274
Ownership structure of the uranium industry
No changes in ownership have occurred since 1988. The Zirovski Vrh production centre is owned by the Republic of Slovenia.
Employment in the uranium industry
See relevant Table.
ENVIRONMENTAL ACTIVITIES AND SOCIO-CULTURAL ISSUES
Zirovski Vrh Mine Company manages all activities connected with the rehabilitation of the former uranium production site. It provides all required remediation permits, monitors the environmental impact of the mine effluents by air and water pathway, and maintains the area to prevent damage to the environment.
Annual effective dose contribution from all mine objects is between 0.2 and 0.4 mSv/a (during operation it was 0.5 mSv/a), and decreases due to remediation activities. Background annual effective zone is 5 mSv/a in the area surrounding the mine.
Six hundred twenty thousand tonnes of tailings (70 g U/t) and 80 000 tonnes of mine waste are located on the slope of a hill between 530 and 560 m a.s.l., over an area of 4.5 ha. The critical factor is the stability of the site (landslide). The mine waste pile is located in a former ravine, and contains 1 650 000 tonnes of mine waste and mill debris, over an area of 5 ha. The mine effluents are monitored on a regular monthly basis, due to uranium, radium and other chemical contaminants.
Remediation of the Zirovski Vrh mine site is expected to be completed by 2006. There is a plan to turn over the mine’s remediated property to the community to develop an industrial centre.
Environmental impact assessments
Rudnik Zirovski Vrh has three long-term objectives for remediation: underground mine, mine waste pile Jazbec and mill tailings Borst. All others mine liabilities and production areas will be decontaminated and returned to the society for future use. An extensive safety report has been prepared for the mine waste pile Jazbec remediation. A safety report for the mill tailings Borst will be prepared as well.
Monitoring
The mine’s air and water effluents were monitored on regular base since the start of the ore production in 1982. The programme was modified when production stopped in 1990. From that time a modified programme has been going on. Emissions into the surface waters and into air nearby the site are monitored and doses to the critical group of inhabitants have been calculated since 1980. There are plans for long-term monitoring and stewardship of the location.

Slovenia
275
Tailings impoundment
There is one designed long-term tailings site called Borst. The capacity is 700 000 tonnes of waste material, the area is 4.5 ha. The wastes have been stored in dry shape due to filtration of the leached liquor. The place will be covered with engineered multi-layer soil cover 2 m. thick with a clay layer at the bottom to prevent leaching of contaminants.
Waste rock management
All big or small mine waste piles will be relocated to the central mine waste pile Jazbec. All other sites will be decontaminated and made green. There will be 1.8 million tonnes of mine waste and debris, the area is 5 ha. The place will be covered with engineered multi-layer soil cover 2 m. thick.
Effluent management
Treatment of the mine’s effluents is not planned due to low concentrations of the radioactive contaminants.
Site rehabilitation
The mine staff manages the mine site remediation: preparation of technical documentation, required permits, public job procurements, works implementation and supervision. The mine is practically remediated and the areas of the temporary waste piles have been cleaned. The plan is to start with mine waste pile remediation in July 2005 and the remediation of the mill tailings will start in the middle of 2006. All works will be finished in 2009.
Regulatory activities
The company manages acquirements of all required consensuses and permits for the site remediation. The main acts regulating these actions are the Act on Safety against Radioactive Radiation and the Act on Nuclear Safety and Mining Act.
Social and/or cultural issues
The problems were twofold: the loss of jobs and the loss of local economical power when the mine ceased production in 1990. The problems were solved with pensions, compensations, and agreements with companies in the vicinity, etc. The state is helping to develop and support the economic growth of the former mining community.

Slovenia
276
URANIUM REQUIREMENTS
The sole nuclear power plant in Slovenia is based at Krsko and started commercial operation in January 1983. The Krsko reactor was modernised in 2000, increasing its capacity from 632 to 676 Mwe. The power plant is owned 50% each by Slovenia and Croatia.
NATIONAL POLICIES RELATING TO URANIUM
There are no uranium stocks maintained in Slovenia. The company that owns and operates the Krsko plant imports uranium based on requirements contracts on a just-in-time basis. Uranium is purchased at an approximate cost of USD 23 per kg of UF6.
Reasonably Assured Resources* (tonnes U)
Production method <USD 40/kgU <USD 80/kgU <USD 130/kgU Recovery factor (%)
Underground mining 0 2 200 2 200
Open-pit mining 0 0 0
In situ leaching 0 0 0
Heap leaching 0 0 0
In-place leaching (stope/block leaching)
0 0 0
Co-product and by-product 0 0 0
Unspecified 0 0 0
Total 0 2 200 2 200
* In situ resources.
Inferred Resources* (tonnes U)
Production method <USD 40/kgU <USD 80/kgU <USD 130/kgU Recovery factor (%)
Underground mining 0 5 000 10 000
Open-pit mining 0 0 0
In situ leaching 0 0 0
Heap leaching 0 0 0
In-place leaching (stope/block leaching)
0 0 0
Co-product and by-product 0 0 0
Unspecified 0 0 0
Total 0 5 000 10 000
* In situ resources.

Slovenia
277
Prognosticated Resources (tonnes U)
Cost ranges
<USD 80/kgU <USD 130/kgU
0 1 060
Historical Uranium Production (tonnes U in concentrate)
Production method Total
through end of 2001
2002 2003 2004 Total
through end of 2004
2005 (expected)
Open-pit mining1 0 0 0 0 0 0
Underground mining1 382 0 0 0 382 0
In situ leaching 0 0 0 0 0 0
Heap leaching 0 0 0 0 0 0
In-place leaching* 0 0 0 0 0 0
Co-product/by-product 0 0 0 0 0 0
U recovered from phosphates
0 0 0 0 0 0
Other methods** 0 0 0 0 0 0
Total 382 0 0 0 382 0
(1) Pre-2002 totals may include uranium recovered by heap and in-place leaching. * Also known as stope leaching or block leaching. ** Includes mine water treatment and environmental restoration.
Uranium Industry Employment at Existing Production Centres (person-years)
2002 2003 2004 2005 (expected)
Total employment related to existing production centres
48 45 40 30
Employment directly related to uranium production
0 0 0 0
Net Nuclear Electricity Generation
2003 2004
Nuclear electricity generated (TWh net) 4.96 5.21

Slovenia/South Africa
278
Installed Nuclear Generating Capacity to 2025
(MWe net)
2010 2015 2020 2025 2004 2005
Low High Low High Low High Low High
676 676 693 700 693 700 693 700 693 700
Annual Reactor-related Uranium Requirements to 2025 (excluding MOX) (tonnes U)
2010 2015 2020 2025 2004 2005
Low High Low High Low High Low High
247 200 230 210 250
• South Africa •
URANIUM EXPLORATION
Historical review
The worldwide search for uranium resources in the early 1940s resulted in the commencement of uranium exploration in South Africa during 1944. Attention at the time was focused on the occurrence of uranium in the gold bearing Witwatersrand quartz-pebble conglomerates. Exploration for uranium in the Witwatersrand Basin was always in consequence of gold exploration until the oil crisis emerged in 1973. With the price of uranium increasing more than five fold in a short space of time, uranium exploration activities intensified which led to the commissioning of South Africa’s first primary uranium producer, Beisa Mine, in 1981.
However, the crash in the uranium market shortly thereafter not only resulted in the closure of Beisa’s uranium production in 1985, but also had a detrimental effect on the exploration for uranium in general. Incidental discoveries of new uranium resources were, nevertheless, made during the exploration for gold due to the ubiquity of uranium in the quartz-pebble conglomerates. The static gold price in the 1990s furthermore led to a substantial curtailment of gold exploration activities within the Witwatersrand Basin.
The discovery of uranium in the Karoo Basin whilst drilling for oil in the early 1970s, resulted in a diversification of uranium exploration activities in South Africa. Although initially at a modest level, exploration activities increased until the incident at Three Mile Island in 1979, which sent the overheated uranium market plummeting. Exploration activities in the Karoo Basin declined rapidly thereafter and finally ceased in the mid 1980s.

South Africa
279
Exploration for uranium outside of these two geological basins resulted in the discovery of
uranium deposits associated with coal seams, carbonatites, granites, marine phosphates as well as deposits of a surficial nature. Such exploration has always been undertaken on a low-key basis and rendered very limited success in terms of additional uranium resources.
Recent and ongoing uranium exploration and mine development activities
Exploration for uranium as a primary commodity, which was last experienced in 1988 during exploration activities on the Springbok Flats in the Limpopo Province, recommenced during 2003. As a result of the recent increase in the gold price to about USD 400/troy ounce, renewed interest in exploration for the precious metal is currently experienced along the northwestern limbs of the Witwatersrand Basin in the Klerksdorp area, Northwest Province. The recent upsurge in the uranium price encouraged some gold mining groups to revert to the routine of recording the uranium concentrations of the reefs during their ore outlining, development and mining activities. This gold (uranium) exploration activity is however still slightly dampened by the present high ZAR/USD exchange rate.
No exploration for uranium by South African based companies outside of South Africa has been or is presently being undertaken since 2003.
The statutory responsibility for uranium exploration and development has been transferred from the Atomic Energy Corporation of South Africa Limited to South African Nuclear Energy Corporation Limited and National Nuclear Regulator in 1999, whilst the responsibility for updating the Red Book information had since vested with the Council for Geoscience.
URANIUM RESOURCES
Identified resources (RAR & Inferred)
By far the largest portion (about 58%) of South Africa’s identified resources comprises low-grade concentrations within the gold-bearing Witwatersrand quartz-pebble conglomerates. Where uranium is recovered as a by-product of gold operations, it generally accounts for less than 10% of the total revenue from the ore mined.
The low level of exploration for gold experienced in recent years made way for increased exploration activities fuelled by an increase in the gold price to above USD 400/troy ounce since the beginning of 2004 and fast diminishing known ore reserves. At least three operating gold mines have closed down since the previous uranium resource assessment in 2003 resulting in a sterilization of certain resources. As a consequence a small decrease (3.7%) to South Africa’s uranium resource base has been experienced since 2003. Notwithstanding, there has been exploration for uranium mainly as a primary product by one gold mine company since 2003, the additional identified resources discovered were not enough to make up for this loss.
As uranium is presently only produced as a by-product of gold mining, the gold and uranium prices, rand/USD exchange rate, as well as the mining and processing costs have a significant effect on South Africa’s uranium resource figures and cost category allocation.

South Africa
280
The majority (about 63%) of South Africa’s identified in situ uranium resources recoverable at
less than USD 80/kgU is likewise associated with gold resources within the Witwatersrand Supergroup. However, since only one mine, Vaal River Operations has a uranium recovery plant in operation, large amounts of uranium are presently being discarded in tailing dams. Recovery of uranium from this source will depend to a large extent on the degree of dilution by non-uraniferous tailings and the possible use of such tailings as backfill in mined-out areas.
More than 32% of the total South African identified uranium resources recoverable at less than USD 40/kgU are tributary to South Africa’s only uranium recovery facility and 19% of the identified resources recoverable at less than USD 80/kgU.
Undiscovered resources (Prognosticated & SR)
No exploration for uranium deposits outside of the Witwatersrand Basin is presently undertaken. A number of applications for prospecting authorisations for uranium associated with previously discovered deposits within the Karoo Basin have, however, been received during 2005.
Limited efforts to identify Witwatersrand-type basins outside of the currently known limits of the main basin have rendered discouraging results. The lack of funding for speculative type of exploration has further precluded the chances of any meaningful outcome.
Uranium resources in the Prognosticated Resources category which can be produced at a cost of less than USD 80/kgU, as well as the estimate for Speculative Resources with no cost range assigned, remained unchanged from the previous estimate.
URANIUM PRODUCTION
Historical review
Uranium production in South Africa commenced in 1952 with the commissioning of a plant at West Rand Consolidated Mine extracting uranium from quartz-pebble conglomerates of the Witwatersrand Supergroup. During 1953 a further four plants came into production at various centres. Total uranium production peaked in 1959 when 4 957 tU was produced from 17 plants being fed from 26 mines within the Witwatersrand Basin. Production thereafter declined to 2 263 tU in 1965.
The world oil crisis which emerged in 1973 stimulated the demand for uranium as a source of energy. The large tailings stockpiles containing uranium which accumulated over many decades at the time became a readily available source of uranium. These stockpiles were reprocessed at Welkom (Joint Metallurgical Scheme – 1977), on the East Rand (ERGO – 1978) and at Klerksdorp (Chemwes – 1979) which culminated in a record uranium production of 6 028 tU in 1980.
In 1967 there were seven producers (2 585 tU); this number increased to 14 in 1983 (5 880 tU). From 1983 there was a steady decline in the number of producers with only three remaining in 1994 (1 550 tU). Phalabora Mining Company, which commenced uranium production in 1994 outside of the Witwatersrand Basin as a by-product of copper mining, ceased production in 2002 leaving Nuclear Fuels Corporation of South Africa (Pty) Limited (Nufcor) as the sole producer of uranium in South Africa at present.

South Africa
281
Status of production capability
Since the end of 2002 Vaal River Operations near Klerksdorp in the North West Province has been the only uranium producing mine in South Africa. Uranium is being produced as a by-product of gold mining. Two uranium recovery plants are in operation, capable of treating 10 000 t of ore per day with a production capacity of 1 270 tU per annum. No additional production centres are planned.
Ownership structure of the uranium industry
In 1999 Nufcor became a wholly owned subsidiary of AngloGold Ashanti Limited, a public company listed on both the London Stock Exchange and the Johannesburg Securities Exchange.
The South African government is not associated with any uranium production activities.
Employment in the uranium industry
Vaar River Operations employs a total of about 100 persons in the uranium plant. An additional 50 individuals are employed at Nufcor where calcining is being undertaken.
Uranium Production Centre Technical Details (as of 1 January 2005)
Centre #1 Centre #2
Name of production centre Vaal River Operations Aflease Gold & Uranium Production centre classification existing planned Start-up date 1977 2007 Source of ore: � Deposit name Vaal Reef Dominium & Rietkuil � Deposit type quartz-pebble conglomerate quartz-pebble conglomerate � Reserves (tU) 8 380 40 390 � Grade (% U) NA NA Mining operation: � Type (OP/UG/ISL) UG OP/UG � Size (t ore/day) 10 NA � Average mining recovery (%) variable NA Processing plant (acid/alkaline): � Type (IX/SX/AL) AL/SX NA � Size (t ore/day)
for ISL (L/day or L/h) 10 NA
� Average process recovery (%) variable NA Nominal production capacity (tU/year) 1 272 3 390 Plans for expansion under consideration pre-feasibility study
undertaken Other remarks none none

South Africa
282
Future production centres
Since the uranium resources in South Africa occur mainly as a by-product of gold, it is difficult to predict whether prospective production centres could be supported by existing identified resources in the Reasonably Assured and Inferred Resources categories recoverable at a cost of <USD 80/kgU. The cost of producing uranium is to a large degree determined by the gold content of the ore, the gold price, working costs as well as the SA rand/USD exchange rate.
Given favourable conditions in respect of these variables and the current uranium price of around USD 29 per pound U3O8, it is not inconceivable for South Africa to achieve uranium production levels in excess of 6 000 tU per annum, as attained in 1980. South Africa further has significant quantities of uranium contained in mine tailing drams, which could be extracted given stable and predictable long-term contracts. New shafts in areas that contain viable uranium grades are in the process of being developed while indications are that exploration for uranium as a primary commodity undertaken since 2003 has yielded more than promising results.
Secondary sources of uranium
South Africa has never produced or utilised mixed oxide fuels and has no plans to do so in future. South Africa decommissioned and dismantled its uranium enrichment plant at Pelindaba in the period 1997/1998 and does not undertake enrichment activities at present. No reprocessed uranium is produced or utilised in South Africa.
ENVIRONMENTAL ACTIVITIES AND SOCIAL CULTURAL ISSUES
Within South Africa mine related land exists which has been contaminated by radioactivity, particularly where existing and previous uranium plants are or were located. If development takes place on former mine land, the area is radio-metrically surveyed and, where necessary, decontaminated. The National Nuclear Regulator is the body responsible for the implementation of nuclear legislation related to these activities, and the standards conform to international norms. Large areas around gold/uranium mines are covered with slime dams and rock dumps. South Africa has strict environmental legislation, which ensures that such areas are suitably rehabilitated after closure.
Environmental issues relating to gold/uranium mining within Witwatersrand Basin are dust pollution, surface and ground water contamination and residual radioactivity. Scrap materials from decommissioned plants may only be sold after these have been decontaminated to internationally acceptable levels.
The by-product status of uranium production in South Africa makes it impossible to establish what portion of the total expenditure on environmental related activities specifically pertains to uranium. The South African mining industry, however, allocates considerable resources for environmental rehabilitation from the exploration stage, through to mining and finally mill closure.

South Africa
283
URANIUM REQUIREMENTS
South Africa has only one nuclear power plant, Koeberg, which has two reactors. Koeberg I was commissioned in 1984 and Koeberg II in 1985. They have a combined installed capacity of 1 800 MWe and collectively consume about 280 tU per annum. (376 tU over a 16 month cycle).
Nuclear fuel will also be required for the commission of a Pebble Bed Modular Reactor (PBMR) demonstration plant to be constructed at Koeberg. The PBMR is designed to produce 110 MWe. All statutory approvals, save for the issuing of a nuclear license, have already been obtain. It is believed that construction of the demonstration plant could start in 2007. Commercial PBMR reactors planned are to produce about 165 MWe each. To maximise the sharing of support systems, however, the PBMR has been configured into a variety of options, such as 2, 4 and 8 pack layouts. It is believed that between 10 and 50 modules a year could be exported from South Africa once the technology has been demonstrated successfully.
Supply and Procurements Strategy
Whereas fuel for the Koeberg nuclear power plant used to be manufactured at Pelindaba near Pretoria prior to 1997, it is now being imported. Except for normal IAEA safeguard conditions, Eskom, the electricity supply utility operating Koeberg, has no restrictions on where it can procure its uranium. Requests for tenders were in the past issued to all applicable suppliers. Procurement policy is based on commercial considerations. The approach will be maintained in future. Fuel for the demonstration PBMR plant will be manufactured at Pelindaba from radioactive material to be imported. Koeberg has held no stock in the past although the situation may be revised in future.
NATIONAL POLICIES RELATING TO URANIUM
The Nuclear Energy Act No. 131 of 1993, as amended, provided expression to South Africa’s national policies relating to prospecting for and mining of uranium, foreign participation in such activities, the state’s role in this regard, as well as the export of uranium and the disposal of spent nuclear fuel.
This Act has been replaced by the Nuclear Energy Act No. 46 of 1999 and the National Nuclear Regulator Act No. 47 of 1999. The former act provides for the establishment of the South African Nuclear Energy Corporation Limited (NECSA) to replace Atomic Energy Corporation of South Africa Limited, a public company wholly owned by the state to, inter alia, regulate the acquisition and possession of nuclear fuel, the import and export of such fuel and to prescribe measures regarding the discarding of radioactive waste and the storage of irradiated nuclear material. The latter Act provides for the establishment of a National Nuclear Regulator to regulate nuclear activities, to provide for safety standards and regulatory practices for protection of persons, property and the environment against nuclear damage.
URANIUM STOCKS
At present Koeberg maintains no uranium stock for future consumption.
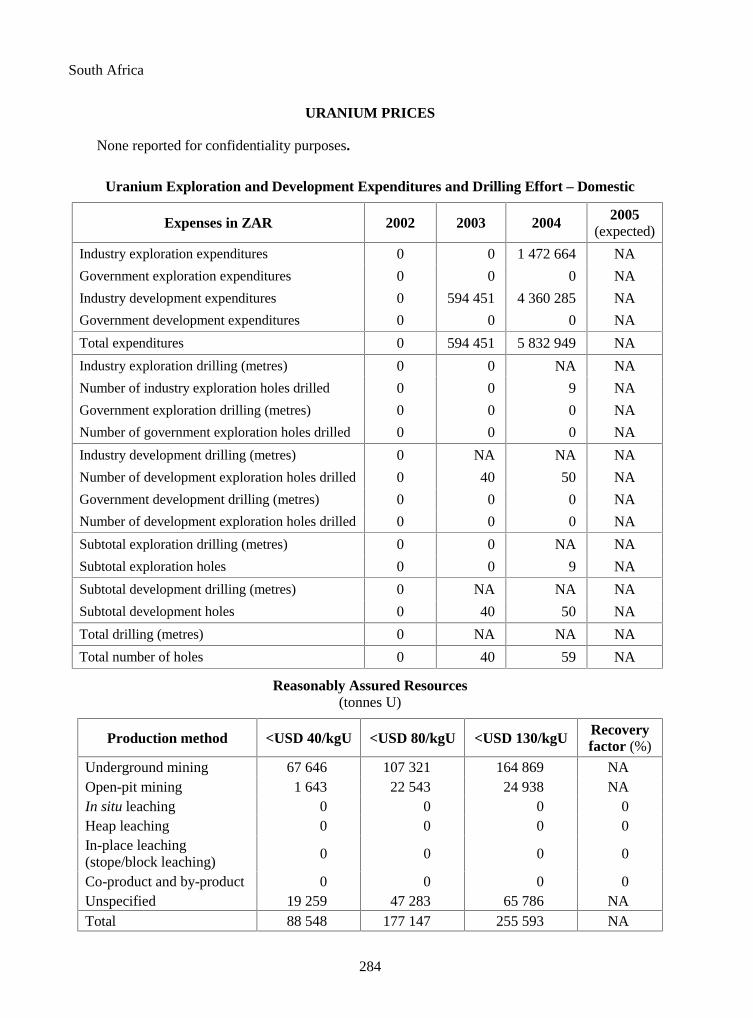
South Africa
284
URANIUM PRICES
None reported for confidentiality purposes.
Uranium Exploration and Development Expenditures and Drilling Effort – Domestic
Expenses in ZAR 2002 2003 2004 2005 (expected)
Industry exploration expenditures 0 0 1 472 664 NA
Government exploration expenditures 0 0 0 NA
Industry development expenditures 0 594 451 4 360 285 NA
Government development expenditures 0 0 0 NA
Total expenditures 0 594 451 5 832 949 NA
Industry exploration drilling (metres) 0 0 NA NA
Number of industry exploration holes drilled 0 0 9 NA
Government exploration drilling (metres) 0 0 0 NA
Number of government exploration holes drilled 0 0 0 NA
Industry development drilling (metres) 0 NA NA NA
Number of development exploration holes drilled 0 40 50 NA
Government development drilling (metres) 0 0 0 NA
Number of development exploration holes drilled 0 0 0 NA
Subtotal exploration drilling (metres) 0 0 NA NA
Subtotal exploration holes 0 0 9 NA
Subtotal development drilling (metres) 0 NA NA NA
Subtotal development holes 0 40 50 NA
Total drilling (metres) 0 NA NA NA
Total number of holes 0 40 59 NA
Reasonably Assured Resources (tonnes U)
Production method <USD 40/kgU <USD 80/kgU <USD 130/kgU Recovery factor (%)
Underground mining 67 646 107 321 164 869 NA Open-pit mining 1 643 22 543 24 938 NA In situ leaching 0 0 0 0 Heap leaching 0 0 0 0 In-place leaching (stope/block leaching)
0 0 0 0
Co-product and by-product 0 0 0 0 Unspecified 19 259 47 283 65 786 NA Total 88 548 177 147 255 593 NA

South Africa
285
Reasonably Assured Resources by Deposit Type
(tonnes U)
Deposit type <USD 40/kgU <USD 80/kgU <USD 130/kgU
Unconformity-related 0 0 0
Sandstone 1 643 22 543 24 938
Hematite breccia complex 0 0 0
Quartz-pebble conglomerate 85 554 153 253 229 304
Vein 0 0 0
Intrusive 1 351 1 351 1 351
Volcanic and caldera-related 0 0 0
Metasomatite 0 0 0
Other 0 0 0
Total 88 548 177 147 255 593
Inferred Resources (tonnes U)
Production method <USD 40/kgU <USD 80/kgU <USD 130/kgU Recovery factor (%)
Underground mining 49 721 58 553 64 615 NA
Open-pit mining 2 974 7 376 7 894 NA
In situ leaching 0 0 0 0
Heap leaching 0 0 0 0
In-place leaching (stope/block leaching)
0 0 0 0
Co-product and by-product 0 0 0 0
Unspecified 1 906 5 676 12 494 NA
Total 54 601 71 605 85 003 NA
Inferred Resources by Deposit Type (tonnes U)
Deposit type <USD 40/kgU <USD 80/kgU <USD 130/kgU
Unconformity-related 0 0 0
Sandstone 2 974 7 376 7 894
Hematite breccia complex 0 0 0
Quartz-pebble conglomerate 50 452 63 054 75 934
Vein 0 0 0
Intrusive 1 175 1 175 1 175
Volcanic and caldera-related 0 0 0
Metasomatite 0 0 0
Other 0 0 0
Total 54 601 71 605 85 003

South Africa
286
Prognosticated Resources (tonnes U)
Cost ranges
<USD 80/kgU <USD 130/kgU
34 865 110 274
Speculative Resources (tonnes U)
Cost ranges
<USD 130/kgU Unassigned
NA 1 112 900
Historical Uranium Production (tonnes U in concentrate)
Production method Total
through end of 2001
2002 2003 2004 Total
through end of 2004
2005 (expected)
Open-pit mining1 0 0 0 0 0 0
Underground mining1 0 0 0 0 0 0
In situ leaching 0 0 0 0 0 0
Heap leaching 0 0 0 0 0 0
In-place leaching* 0 0 0 0 0 0
Co-product/by-product 151 660 828 763 747 153 998 848
U recovered from phosphates
0 0 0 0 0 0
Other methods** 0 0 0 0 0 0
Total 151 660 828 763 747 153 998 848
(1) Pre-2002 totals may include uranium recovered by heap and in-place leaching. * Also known as stope leaching or block leaching. ** Includes mine water treatment and environmental restoration.
Ownership of Uranium Production in 2004
Domestic Foreign
Government Private Government Private Totals
[tU] [%] [tU] [%] [tU] [%] [tU] [%] [tU] [%]
0 0 747 100 0 0 0 0 747 100

South Africa
287
Uranium Industry Employment at Existing Production Centres
(person-years)
2002 2003 2004 2005 (expected)
Total employment related to existing production centres
150 150 150 150
Employment directly related to uranium production
140 140 140 140
Short-term Production Capability (tonnes U/year)
2005 2010
A-I B-I A-II B-II A-I B-I A-II B-II
1 270 1 270 0 0 4 660 4 660 0 0
2015 2020 2025
A-I B-I A-II B-II A-I B-I A-II B-II A-I B-I A-II B-II
4 660 4 660 0 0 4 660 4 660 0 0 4 660 4 660 0 0
Installed Nuclear Generating Capacity to 2025 (MWe net)
2010 2015 2020 2025 2004 2005
Low High Low High Low High Low High
1 800 1 800 1 800 1 910 1 800 2 830 1 800 3 750 1 800 3 750
Annual Reactor-related Uranium Requirements to 2025 (excluding MOX) (tonnes U)
2010 2015 2020 2025 2004 2005
Low High Low High Low High Low High
282 282 282 300 282 443 282 588 282 588
Total Uranium Stocks (tonnes natural U-equivalent)
Holder
Natural uranium stocks in
concentrates
Enriched uranium
stocks
Depleted uranium
stocks
Reprocessed uranium
stocks Total
Government 0 0 0 0 NA
Producer NA 0 0 0 NA
Utility 0 0 NA 0 NA
Total 0 0 NA 0 NA

South Africa/Spain
288
• Spain •
URANIUM EXPLORATION
Historical review
Uranium exploration started in 1951 and was carried out by the Junta de Energía Nuclear (JEN). Initial targets were the Hercynian granites of western Spain. In 1957 and 1958, the first occurrences in Precambrian-Cambrian schists were discovered, including the Fe deposit, located in the province of Salamanca. In 1965, exploration in sedimentary rocks started and the Mazarete deposit in Guadalajara province was discovered. Exploration activities by the Empresa Nacional del Uranio, S.A. (ENUSA) ended in 1992. Joint venture exploration between ENUSA and other companies continued until the end of 1994. During this period, most of the Spanish territory had been surveyed using a variety of exploration methods, adapted to different stages. An ample coverage of airborne and ground radiometrics of the most interesting areas has been achieved.

Spain
289
Recent and ongoing uranium exploration and mine development activities
No exploration and mine development activities were carried out in 2003 and 2004. The last expenditures were in 1998.
URANIUM RESOURCES
Identified resources (RAR & Inferred)
Both of the RAR and Inferred resources remain unchanged from the 2003 Red Book, and are reported as recoverable by open-pit mining.
Undiscovered resources (Prognosticated & SR)
No resources for these categories were reported.
URANIUM PRODUCTION
Historical review
Production started in 1959 at the Andujar plant, Jaen province, and continued until 1981. The Don Benito plant, Badajoz province remained in operation from 1983 to 1990. Production at the Fe Mine (Salamanca Province) started in 1975 with heap leaching (Elefante Plant). A new dynamic leaching plant (Quercus) started in 1993 and was shut down in December 2000. The license for a definitive shutdown of the production was submitted to Regulatory authorities in December 2002 and was approved in July 2003.
Status of production capability
Mining activities were terminated in December 2000. The processing plant finished the production of uranium concentrates in November 2002. A plan for its decommissioning will be presented to the Regulatory Authorities in 2005.
Ownership structure of the uranium industry
The only production facility in Spain belongs to the company ENUSA Industrias Avanzadas, S. A., owned (60%) by Sociedad de Participaciones Industriales (SEPI) and Centro de Investigaciones Energéticas Medioambientales y Tecnológicas (CIEMAT), with 40%.

Spain
290
Employment in the uranium industry
Employment at the Fe Mine was 56 at the end of the year 2004.
Future production centres
No new production centres are being considered.
Secondary sources of uranium
Spain reported mixed oxide fuel and re-enriched tails production and use as zero.
ENVIRONMENTAL ACTIVITIES AND SOCIO-CULTURAL ISSUES
The present conditions of uranium production facilities in Spain are as follows:
� Fabrica de Uranio de Andujar (Jaén Province): Mill and tailings pile are closed and remediated, with a ten-year supervision programme (groundwater quality, erosion control, infiltration and radon control).
� Mine and Plant “LOBO-G” (Badajoz Province): Open pit and mill tailings dump are closed and remediated, with a supervision programme (groundwater quality, erosion control, infiltration and radon control) until 2004. In this year the long term stewardship programme began.
� Old Mines (Andalucía and Extremadura Regions): Underground and open pit mines are restored, with work being completed in 2000.
� Elefante Plant (Salamanca Province): Decommissioning Plan has been approved by Regulatory Authorities (heap leaching plant) in January 2001. The plant was dismantled in 2001. Ore stockpiles (used for heap leaching) have been graded and have been completely covered with a protection layer in 2004.
� Open pit mine in Saelices el Chico (Salamanca Province): In 2004 the remediation plan of the open pit mine in Saelices el Chico (Salamanca Province) has been approved by the Regulatory Authorities. This remediation plan is scheduled to be finished in 2008.
� Quercus Plant (Salamanca Province): Mining activities ended in December 2000. The processing plant finished the production of uranium concentrates in November 2002. A plan for its decommissioning will be submitted to the Regulatory Authorities in 2005.
URANIUM REQUIREMENTS
The net capacity of Spain’s nuclear plants is about 7.6 GWe with nine operating reactors. No new reactors are expected to be built in the near future. On 14 October 2002 the Ministry of Economy awarded the renewal of the Operating Permit to the José Cabrera NPP (150 MWe), allowing the plant to continue operation until 30 April 2006, the date on which the plant is required to undertake definitive shutdown.

Spain
291
Supply and procurement strategy
All uranium procurement activities are carried out by ENUSA representing the companies that own the nine operating nuclear power plants in Spain.
NATIONAL POLICIES RELATING TO URANIUM
Spain’s uranium import policy provides for diversification of supply. The Spanish legislation leaves uranium exploration and production open to national and foreign companies.
URANIUM STOCKS
Present Spanish regulation provides that a strategic uranium inventory of at least 369 tU (435 t U3O8), contained in enriched uranium, should be held jointly by the utilities that own nuclear power plants. Additional inventories could be maintained depending on uranium market conditions. No information on uranium prices was reported.
Reasonably Assured Resources (tonnes U)
Production method <USD 40/kgU <USD 80/kgU <USD 130/kgU Recovery factor (%)
Underground mining 0 0 0 Open-pit mining 0 2 460 4 925 In situ leaching 0 0 0 Heap leaching 0 0 0 In-place leaching (stope/block leaching)
0 0 0
Co-product and by-product 0 0 0 Unspecified 0 0 0 Total 0 2 460 4 925
Reasonably Assured Resources by Deposit Type (tonnes U)
Deposit type <USD 40/kgU <USD 80/kgU <USD 130/kgU Unconformity-related 0 0 0 Sandstone 0 0 0 Hematite breccia complex 0 0 0 Quartz-pebble conglomerate 0 0 0 Vein 0 2 460 4 925 Intrusive 0 0 0 Volcanic and caldera-related 0 0 0 Metasomatite 0 0 0 Other 0 0 0 Total 0 2 460 4 925

Spain
292
Inferred Resources
(tonnes U)
Production method <USD 40/kgU <USD 80/kgU <USD 130/kgU Recovery factor (%)
Underground mining 0 0 0 Open-pit mining 0 0 6 380 In situ leaching 0 0 0 Heap leaching 0 0 0 In-place leaching (stope/block leaching)
0 0 0
Co-product and by-product 0 0 0 Unspecified 0 0 0 Total 0 0 6 380
Inferred Resources by Deposit Type (tonnes U)
Deposit type <USD 40/kgU <USD 80/kgU <USD 130/kgU Unconformity-related 0 0 0 Sandstone 0 0 0 Hematite breccia complex 0 0 0 Quartz-pebble conglomerate 0 0 0 Vein 0 0 6 380 Intrusive 0 0 0 Volcanic and caldera-related 0 0 0 Metasomatite 0 0 0 Other 0 0 0 Total 0 0 6 380
Historical Uranium Production (tonnes U in concentrate)
Production method Total
through end of 2001
2002 2003 2004 Total
through end of 2004
2005 (expected)
Open-pit mining1 4 961 0 0 0 4 961 0 Underground mining1 0 0 0 0 0 0 In situ leaching 0 0 0 0 0 0 Heap leaching 0 0 0 0 0 0 In-place leaching* 0 0 0 0 0 0 Co-product/by-product 0 0 0 0 0 0 U recovered from phosphates
0 0 0 0 0 0
Other methods** 30 37 0 0 67 0 Total 4 991 37 0 0 5 028 0
(1) Pre-2002 totals may include uranium recovered by heap and in-place leaching. * Also known as stope leaching or block leaching. ** Includes mine water treatment and environmental restoration.

Spain
293
Uranium Industry Employment at Existing Production Centres (person-years)
2002 2003 2004 2005 (expected)
Total employment related to existing production centres
56 56 56 56
Employment directly related to uranium production
13 0 0 0
Net Nuclear Electricity Generation
2003 2004
Nuclear electricity generated (TWh net) 59.2 60.9
Installed Nuclear Generating Capacity to 2025 (MWe net)
2010 2015 2020 2025 2004 2005
Low High Low High Low High Low High
7 600 7 600 7 500 7 500 7 500 7 500 7 500 7 500 NA NA
Annual Reactor-related Uranium Requirements to 2025 (excluding MOX) (tonnes U)
2010 2015 2020 2025 2004 2005
Low High Low High Low High Low High
2 040 1 140 1 560 1 560 1 560 1 560 1 560 1 560 NA NA
Total Uranium Stocks (tonnes natural U-equivalent)
Holder
Natural uranium stocks in
concentrates
Enriched uranium
stocks
Depleted uranium
stocks
Reprocessed uranium
stocks Total
Government NA NA NA NA NA
Producer NA NA NA NA NA
Utility NA 369 NA NA NA
Total NA NA NA NA NA

Sweden
294
• Sweden •
URANIUM EXPLORATION
Historical review
Uranium exploration was carried out during the period 1950-1985. However, at the end of 1985, exploration activities were stopped due to availability of uranium at low prices on the world market.
There are four main uranium provinces in Sweden:
The first is in the Upper Cambrian and Lower Ordovician sediments in southern Sweden and along the border of the Caledonian mountain range in central Sweden. The uranium occurrences are stratiform, in black (alumn) shales. Billigen (Vastergotland), where the Ranstad deposits is located, covers an area of more than 500 km2.
The second uranium province Arjeplog-Arvidsjaur-Sorsele, is immediately south of the Arctic Circle. It comprises of one deposit, Pleutajokk, and a group of more than 20 occurrences. The individual occurrences are discordant, of a vein or impregnation-type, associated with sode-metasomatism.
A third province is located north of Ostersund in central Sweden. Several discordant mineralised zones have been discovered in, or adjacent to, a window of Precambrian basement within the metamorphic Caledonites.
A fourth province is located near Asele in northern Sweden.
Recent and ongoing exploration and mine development activities
There are no ongoing uranium exploration or mining activities in Sweden.
URANIUM RESOURCES
Identified resources (RAR & Inferred)
There are small resources in granite rocks (vein deposits) in Sweden.
Undiscovered resources (Prognosticated & SR)
There are no Prognosticated or Speculative resources reported in Sweden.

Sweden
295
Unconventional resources
There are potentially large resources of uranium in alum shale; however, these deposits are very low grade and the cost of recovery is above USD 130/kgU.
URANIUM PRODUCTION
Historical review
In the 1960s, a total of 200 tU were produced from the alum shale deposit in Ranstad and represents all of Sweden’s historical production. This mine is now being restored to protect the environment.
Status of production capability
There is no uranium production in Sweden and there are no plans for production.
Secondary sources of uranium
Sweden reported mixed oxide fuel and re-enriched tails production and use as zero.
ENVIRONMENTAL ACTIVITIES AND SOCIO-CULTURAL ISSUES
The Ranstad mine was rehabilitated in the 1990s. The open-pit was transformed into a lake and the tailings area was covered with a multilayer top to prevent the formation of acid from sulphur in the shale tailings. An environmental monitoring programme is now being carried out.
The total cost of restoration of the Ranstad mine was SEK 150 million. The current monitoring programme represents only minor costs.
URANIUM REQUIREMENTS
In 1999, one of Sweden’s 12 nuclear power reactors, Barsebäck 1, was retired as a result of a political decision. Barsebäck 2 is also subject to closure but a definite date is not yet decided.
Supply and procurement strategy
The utilities are free to negotiate their own purchases.

Sweden
296
NATIONAL POLICIES RELATING TO URANIUM
Sweden has joined the Euratom Treaty and adjusted its policy accordingly.
URANIUM STOCKS
The Swedish parliament decided in 1998 to replace the previous obligation that utilities had to keep a stockpile of enriched uranium corresponding to the production of 35 TWh with a reporting mechanism. Sweden reported no information on uranium stocks.
URANIUM PRICES
As Sweden is now part of the deregulated Nordic electricity market, costs of nuclear fuel are no longer reported.
Reasonably Assured Resources (tonnes U)
Production method <USD 40/kgU <USD 80/kgU <USD 130/kgU Recovery factor (%)
Underground mining 0 0 0 Open-pit mining 0 0 0 In situ leaching 0 0 0 Heap leaching 0 0 0 In-place leaching (stope/block leaching)
0 0 0
Co-product and by-product 0 0 0 Unspecified 0 0 4 000 Total 0 0 4 000
Inferred Resources (tonnes U)
Production method <USD 40/kgU <USD 80/kgU <USD 130/kgU Recovery factor (%)
Underground mining 0 0 0 Open-pit mining 0 0 0 In situ leaching 0 0 0 Heap leaching 0 0 0 In-place leaching (stope/block leaching)
0 0 0
Co-product and by-product 0 0 0 Unspecified 0 0 6 000 Total 0 0 6 000
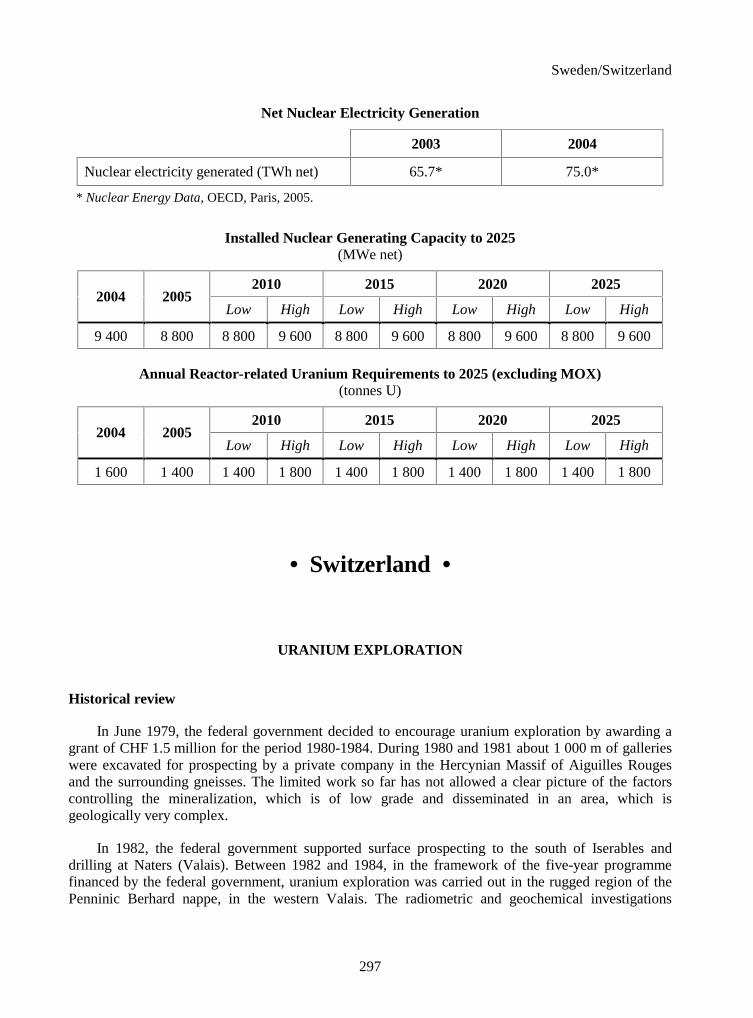
Sweden/Switzerland
297
Net Nuclear Electricity Generation
2003 2004
Nuclear electricity generated (TWh net) 65.7* 75.0*
* Nuclear Energy Data, OECD, Paris, 2005.
Installed Nuclear Generating Capacity to 2025 (MWe net)
2010 2015 2020 2025 2004 2005
Low High Low High Low High Low High
9 400 8 800 8 800 9 600 8 800 9 600 8 800 9 600 8 800 9 600
Annual Reactor-related Uranium Requirements to 2025 (excluding MOX) (tonnes U)
2010 2015 2020 2025 2004 2005
Low High Low High Low High Low High
1 600 1 400 1 400 1 800 1 400 1 800 1 400 1 800 1 400 1 800
• Switzerland •
URANIUM EXPLORATION
Historical review
In June 1979, the federal government decided to encourage uranium exploration by awarding a grant of CHF 1.5 million for the period 1980-1984. During 1980 and 1981 about 1 000 m of galleries were excavated for prospecting by a private company in the Hercynian Massif of Aiguilles Rouges and the surrounding gneisses. The limited work so far has not allowed a clear picture of the factors controlling the mineralization, which is of low grade and disseminated in an area, which is geologically very complex.
In 1982, the federal government supported surface prospecting to the south of Iserables and drilling at Naters (Valais). Between 1982 and 1984, in the framework of the five-year programme financed by the federal government, uranium exploration was carried out in the rugged region of the Penninic Berhard nappe, in the western Valais. The radiometric and geochemical investigations

Switzerland
298
concentrated mainly on the detrital deposits of the Permo-Carboniferous and schists of older age (series of Nendaz and the underlying series of Siviez). Owing to strong alpine tectonism, the uranium is generally irregularly disseminated in the rock. Radioactive anomalies seem to be bound to the carbonatic and chloritic facies of the Nendaz series, but their practical value could not be confirmed.
Private industry was engaged in uranium exploration, mining and milling in the western United States from 1983 to 1995. Since 1985 all domestic exploration activities have been stopped.
Recent and ongoing uranium exploration and mine development activities
Nordostschweizerische Kraftwerke AG has a minor involvement in an exploration Join Venture in northern Saskatchewan, Canada. In 2004 small investments (few thousand CAD) were made.
URANIUM RESOURCES
No uranium resources have been reported for Switzerland.
URANIUM PRODUCTION
Switzerland does not produce uranium and no future production centres in Switzerland are envisaged at this time.
Secondary sources of uranium
Production and/or use of reprocessed uranium
Due to Swiss law there will be a 10-year moratorium on the export of spent fuel assemblies for reprocessing starting on 1 July 2006.
URANIUM REQUIREMENTS
Switzerland has five operating nuclear power stations located at Beznau (Units 1 and 2), Muehleberg, Goesgen and Leibstadt. In 2002, total installed nuclear capacity was about 3 200 MWe net.
Supply and procurement strategy
Uranium is procured from a combination of long-term and spot market contracts.

Switzerland
299
NATIONAL POLICIES RELATING TO URANIUM
Switzerland does not produce uranium and does not export uranium. There is no official import policy as private companies handle their own procurement.
URANIUM STOCKS
It is the policy of nuclear plant operating companies to maintain a stockpile of fresh fuel assemblies at the reactor site. In Switzerland, uranium stocks, if they exist, are held only by the utilities. No detailed information is available on utility uranium stocks.
Uranium stocks are held as U3O8, UF6 (natural) and UF6 (enriched).
URANIUM PRICES
None reported.
Uranium Exploration and Development Expenditures – Abroad
Expenses in CHF 2002 2003 2004 2005 (expected)
Industry exploration expenditures 0 0 4 000 20 000
Government exploration expenditures 0 0 0 0
Industry development expenditures 0 0 0 0
Government development expenditures 0 0 0 0
Total expenditures 0 0 4 000 20 000
Mixed Oxide Fuel Production and Use (tonnes of natural U equivalent)
Mixed-oxide (MOX) fuels
Total through end
of 2001 2002 2003 2004
Total through end
of 2004
2005 (expected)
Production 0 0 0 0 0 0
Usage 938.5 83 0 0 1 021.5 108.5
Number of commercial reactors using MOX 1 0 0 2

Switzerland
300
Reprocessed Uranium Use (tonnes of natural U equivalent)
Reprocessed uranium
Total through end
of 2001 2002 2003 2004
Total through end
of 2004
2005 (expected)
Production 0 0 0 0 0 0
Usage 506 231 272 254 1 263 309
Net Nuclear Electricity Generation
2003 2004
Nuclear electricity generated (TWh net) 26.0 25.3
Installed Nuclear Generating Capacity to 2025 (MWe net)
2010 2015 2020 2025 2004 2005
Low High Low High Low High Low High
3 220 3 220 3 220 3 220 3 220 3 220 2 250 3 220 1 520 3 220
Annual Reactor-related Uranium Requirements to 2025 (excluding MOX) (tonnes U)
2010 2015 2020 2025 2004 2005
Low High Low High Low High Low High
317 268 375 387 555 567 375 567 255 567
Total Uranium Stocks (tonnes natural U-equivalent)
Holder
Natural uranium stocks in
concentrates
Enriched uranium
stocks
Depleted uranium
stocks
Reprocessed uranium
stocks Total
Government 0 0 0 0 0
Producer 0 0 0 0
Utility 1 609 1 422 0 0 3 031
Total 1 609 1 422 0 0 3 031

Thailand
301
• Thailand •
URANIUM EXPLORATION
Historical review
Uranium exploration was carried out in the early 1970s by the Royal Thai Department of Mineral Resources (DMR). Uranium occurrences were found in various geological environments including sandstone and granite host rocks. Sandstone-type mineralization occurs in the Phu Wiang district of the Khon Kaen provinces, north-eastern Thailand. This area had been independently investigated by DMR. The area was investigated in cooperation with foreign organisations. The granite hosted uranium occurrences associated with fluorite were discovered in the Doi Tao district, Chiang Mai province and the Muang district of Tak provinces, northern Thailand. These occurrences have received the most attention.
The most important uranium exploration activity carried out in Thailand is the nation-wide airborne geophysical survey completed between 1985 and 1987. The survey was conducted by Kenting Earth Sciences International Limited of Canada, as contractor to DMR.
Recent and ongoing uranium exploration and mine development activities
Government agencies or companies have not been involved in uranium exploration since 1996.
URANIUM RESOURCES
Identified resources (RAR & Inferred)
A small a uranium occurrence found in Jurassic sandstones in the Phu Wiang district is estimated to contain about 4.5 tU based on a cut-off grade of 0.01% U. This estimate is classified as RAR recoverable at a cost of less than USD 130/kgU.
Granitic area in the Doi Tao district and Om Koi districts of the Chiang Mai province in northern Thailand are considered to have some uranium potential. Uranium minerals have been identified in fluorite veins. Uranium assays yielded values between 0.02 and 0.25% U. The estimate Inferred resources are about 7 tU in the cost category below USD 130/kgU with a cut-off grade of 0.05% U.
Undiscovered resources (Prognosticated & SR)
None reported.

Thailand
302
URANIUM PRODUCTION
Historical review
Thailand does not currently produce uranium.
Status of production capability
Thailand does not currently produce uranium.
Ownership structure of the uranium industry
There is no uranium industry in Thailand.
Future production centres
Not reported.
URANIUM REQUIREMENTS
Thailand reported no information on uranium requirements.
POLICIES RELATED TO URANIUM
Thailand reported no information on national policies relating to uranium, uranium stocks, or uranium prices.
Reasonably Assured Resources* (tonnes U)
Production method <USD 40/kgU <USD 80/kgU <USD 130/kgU Recovery factor (%)
Underground mining 0 0 0 Open-pit mining 0 0 0 In situ leaching 0 0 0 Heap leaching 0 0 0 In-place leaching (stope/block leaching)
0 0 0
Co-product and by-product 0 0 0 Unspecified 0 0 4.5 Total 0 0 4.5
* In situ resources.

Thailand/Turkey
303
Inferred Resources* (tonnes U)
Production method <USD 40/kgU <USD 80/kgU <USD 130/kgU Recovery
factor (%)
Underground mining 0 0 0
Open-pit mining 0 0 0
In situ leaching 0 0 0
Heap leaching 0 0 0
In-place leaching (stope/block leaching)
0 0 0
Co-product and by-product 0 0 0
Unspecified 0 0 7
Total 0 0 7
* In situ resources.
• Turkey •
URANIUM EXPLORATION
Historical review
Uranium exploration in Turkey began in 1956-1957 and was directed towards the discovery of vein type deposits in crystalline terrain, such as acidic igneous rocks and metamorphic. As a result of these activities, some pitchblend mineralizations were found but they did not form economic deposits. Since 1960, studies have been conducted in sedimentary rocks, which surround the crystalline rock and some small ore bodies containing autunite and torbernite mineralization have been found in different parts of the country. In the mid-1970s the first hidden uranium deposit with black ore, below the water table was fo������������ ������� �������� �������� �������� �������������������� ������mineralization has been found in Neogene’s sediments in the Yozgat-Sorgun region of Central Anatolia.
Recent and ongoing uranium exploration and mine development activities
A ground radiometric and geochemical prospection was carried out at the Central Anatolia in 2003-2004. The results indicate that there is no economical uranium ore in this region.

Turkey
304
Granite and acidic intrusive rocks and sedimentary rocks will be explorated for radioactive raw material around Sulakyurt (ANKARA) – ��������� !"�#� $���%�&� �������� ������� �������$�study throughout 3 500 km2 area will be carried out in 2006.
URANIUM RESOURCES
Identified resources (RAR & Inferred)
RAR of 9 129 tU occurring in the <USD 80/kgU category (as in situ resources) were reported from the following deposits:
� Salihli-�� �����'� ( 852 tU in 10 ore bodies and at grades of 0.04-0.05% U3O8 in fluvial Neogene’s sediments;
� &�)���'�*+, tU at 0.05% U3O8 in Neogene lacustrine sediments;
� �-� �����-�)-���� #'�(,. tU at 0.05% U3O8 in Neogene sediments;
� Demirtepe: 1 729 tU at 0.08% U3O8 in fracture zones in gneiss;
� Yozgat-Sorgun: 3 850 tU at 0.1% U3O8 in Eocene deltaic lagoon sediments.
No Inferred Resources were reported.
Undiscovered conventional resources (Prognosticated & SR)
None reported.
URANIUM PRODUCTION
Turkey has no uranium production.
ENVIRONMENTAL ACTIVITIES AND SOCIO-CULTURAL ISSUES
None reported.
URANIUM REQUIREMENTS
Turkey has no operating nuclear power plants.

Turkey
305
URANIUM STOCKS
See relevant Table. No information was reported on Turkey’s national policies relating to uranium or uranium prices.
Uranium Exploration and Development Expenditures and Drilling Effort – Domestic
Expenses in TRL 2002 2003 2004 2005 (expected)
Industry exploration expenditures 0 0 0 0
Government exploration expenditures 0 7 000 7 000 23 000 Industry development expenditures 0 0 0 0
Government development expenditures 0 0 0 0
Total expenditures 0 7 000 7 000 23 000
Industry exploration drilling (metres) 0 0 0 0 Number of industry exploration holes drilled 0 0 0 0
Government exploration drilling (metres) 0 NA NA NA Number of government exploration holes drilled 0 NA NA NA
Industry development drilling (metres) 0 0 0 0 Number of development exploration holes drilled 0 0 0 0 Government development drilling (metres) 0 NA NA NA
Number of development exploration holes drilled 0 NA NA NA
Subtotal exploration drilling (metres) 0 NA NA NA
Subtotal exploration holes 0 NA NA NA
Subtotal development drilling (metres) 0 0 0 0
Subtotal development holes 0 0 0 0
Total drilling (metres) 0 0 NA NA
Total number of holes 0 0 NA NA
Reasonably Assured Resources* (tonnes U)
Production method <USD 40/kgU <USD 80/kgU <USD 130/kgU Recovery factor (%)
Underground mining 0 0 0
Open-pit mining 0 9 129 9 129
In situ leaching 0 0 0
Heap leaching 0 0 0
In-place leaching (stope/block leaching)
0 0 0
Co-product and by-product 0 0 0
Unspecified 0 0 0
Total 0 9 129 9 129
* In situ resources.

Turkey/Ukraine
306
Total Uranium Stocks (tonnes natural U-equivalent)
Holder
Natural uranium stocks in
concentrates
Enriched uranium
stocks
Depleted uranium
stocks
Reprocessed uranium
stocks Total
Government 1.9 0 0 0 1.9
Producer 0 0 0 0 0
Utility 0 0 0 0 0
Total 1.9 0 0 0 1.9
• Ukraine •
URANIUM EXPLORATION
Historical review
Exploration for uranium in Ukraine began in 1944 as a revision of works performed by wells drilled before and mine workings produced in the North Krivoy Rog ore area. Pervomayskoye and Zheltorechenskoye uranium deposits were discovered as a result of these works. These deposits were worked off in 1967 and 1989 respectively.
In the middle 1960s the main geological explorations were concentrated in the Kirovograd ore region with the discovery of uranium deposits of metasomatic type. Michurinskoye, Vatutinskoye and Severinskoye deposits were discovered. Deposits of metasomatic type comprise the basis of raw material resources of Ukraine at the present time; uranium content in ores is 0.1-0.2%. The second kind of commercial deposits are the ores of sandstone type, but they are a small part of total resources.
Recent and ongoing uranium exploration and mine development activities
Using exploration criteria and indications based on international and national practice, specialists of “Kirovgeology” have compiled a new prediction map of Ukraine for uranium at a scale 1:500 000 where ore areas and potential ore regions and nodes have been distinguished with perspectives of finding deposits of unconformity vein-type in “complicated breccias” and of volcanic- type. By ore grades these deposits surpass the deposits of metasomatic type.

Ukraine
307
In 2003-2004 prospecting studies for the discovery of unconformity type deposits within Verbovskaya and Khotynskaya areas of the western slope of the Ukrainian Shield in zones of the Riphean unconformity were conducted. Within zones of vendian unconformity, the works were conducted in the south podolian area of the southwestern slope of the Ukrainian shield. Prognostication works were conducted for the vein-type deposits in the Zelenovskaya and Mikhaylovskaya areas of the West Inguletskaya zone of the Ukrainian shield. Because of limited uranium exploration activity in 2003-2004, no commercially sufficient results were obtained.
In 2004, activity on the estimation of thorium presence within the Ukrainian shield was begun based upon registration map of thorium manifestations at a scale of 1:500 000.
In the context of rising prices for uranium, explorations are being planned for deposits of metasomatic type, first of all within the areas of operating mines. Government and private companies in Ukraine do not conduct any exploration and research activity for uranium in other countries. Neither foreign government nor private companies conduct any search or exploration activity for uranium in Ukraine.
URANIUM RESOURCES
Identified resources (RAR & Inferred)
The State Geological Survey of Ukraine made a decision on 20 February 2003 to transfer the resources of metal and non-metal mineral deposits into taxons of the “Classification of Mineral Resources and Reserves of State Fund of Mineral Resources”.
Analysis of technical-economical indications of mining and processing of uranium ores has revealed the main factors, which affect the cost of producing the concentrate of natural uranium. These factors are:
� Uranium content in ore supplied to hydrometallurgical plant.
� Output of the mine on ore mining and processing.
� Technological properties of ore, namely, specific consumption of acid per tonne of ore and percentage of uranium extraction from ore in pachuka leaching tank and autoclave regimes.
� Distance of ore transportation to hydrometallurgical plant.
On the base of these factors, a method of expert estimation of the cost was elaborated and resources and reserves recalculated. As a result changes of resources took place. The resources of the Severinskoye deposit were transferred into the cost category <USD 80/kgU.
As of 1 January 2005, RAR and Inferred Resources with cost price <USD 80/kgU measured 98 700 tU in contrast to 50 600 tU in 2003, the increase took place as a result of recalculation at the expense of the Severinskoye deposit.

Ukraine
308
As of 1 January 2005, uranium resources extractable at the cost of <USD 40/kgU are estimated at 45 040 tU in contrast to 20 150 tU on 1 January 2003 mainly at the expense of the Severinskoye deposit.
All known uranium resources in Ukraine are localised:
� In the deposits of metasomatic type, concentrated within the Kirovogradsky block of the Ukrainian shield. The deposits are of monometal type. Uranium content in ores is 0.1-0.2%.
� In the deposits of sandstone type, concentrated within the Dnepro-Bugskiy region, in addition to uranium ores contain molybdenum, selenium and rare earth elements of lanthanoide group. Uranium content in ore is 0.01-0.06%. Ores are suitable for mining by well underground leaching (in situ leaching).
Undiscovered resources (Prognosticated & SR)
The total amount of resources of these categories is assessed after recalculation as 270 300 tU. Prognosticated resources are confined to the flanks of the Severinskoye deposit and measure 15 300 tU.
Speculative resources are assessed according to the uranium prognostication map compiled by “Kirovgeology” at a scale 1:500 000 and measure 255 000 tU. They are subdivided according to geological-production types as follows:
� Speculative deposits of metasomatic type (133 500 tU).
� Sandstone-type deposits within sedimentary cover of the Ukrainian Shield (20 000 tU), sandstone-type deposits outside the shield (in bitumen) (16 500 tU).
� Unconformity-related deposits (40 000 tU).
� Vein-type deposits (30 000 tU).
� Intrusive deposits in potassium metasomatites (15 000 tU).
Assessment was conducted during the latest five-year period for the Vatutinskoye, Michurinskoye and Severinskoye deposits but not for deposits of sandstone-type.
URANIUM PRODUCTION
Historical review
A decision was made by the government in 1951 to create Vostochnyi mining-processing combinat (VostGOK) in the city of Zheltye Vody in the North Krivoy Rog area for mining uranium ores from the Pervomayskoye and Zheltorechenskoye deposits, which had been explored by that period. The Pervomayskoye deposit was completely worked off in 1967 and Zheltorechenskoye – in 1989.

Ukraine
309
Currently, VostGok is producing uranium from two deposits of the Kirovograg ore area: Michurinskoye, 21 km of the c. Kirovograd and Vatutinskoye deposit near the town of Smolino.
The Michurinskoye deposit was discovered in 1964 and in 1967 the construction of a mine began. This mine, called Ingul’skaya, began producing ore. The uranium content in ore bodies is about 0.1%. Radiometric sorting of mine-car size lots conducted in the mine allows for the increase of uranium content in resulting ore up to 0.1-0.2%. Two shafts with 7 m diameter have been sunk. Ore is hoisted through the North shaft applying two dump skips with loading capacity 11t. The South shaft is used for descending and lifting the workers, equipment and other technical aims.
A ventilation shaft supplies 480 m3 of fresh air per second. Mining is conducted in blocks 60-70 metres high at the horizons -90, -150, -350 m.
Vatutinskoye deposit was discovered in 1965, and in 1973 construction of the mine was started. The industrial area of Smolinsky mine, operating the Vatutinskoye deposit, is situated within the region of the town of Smolino, 80 km west of Kirovograd. Output of mined rocks on the surface is conducted along two paired shafts “Main” and “Helping” sunk down to the depth of 460 m. The lower part of a deposit down to the depth of 640 m was stripped by two blind stems “Blind-1” and “Blind-2”.
The ore is mined with the use of conventional drill and blast operations with backfill. The mines are operated by 3 shifts with a total number of about 850 workers. Within the block being operated, after blasting operations, the ore is moved to loading pocket and then loaded onto the mine-cars and is transported by electric powered trains to the main shaft, where it is crushed before being hoisted to the surface.
Underground leaching of uranium from the wells has been started practiced in Ukraine since 1961. From 1966 to 1983 two deposits at Devladovskoye and Bratskoye were worked off with the use of sulphuric acid. The depths of ore occurrence were about 100 m. At present monitoring the conditions of worked off deposits is being conducted. Development of two deposits with the application of more unsparing leaching chemicals is planned.
Status of production capability
The hydrometallurgical processing plant of the VostGOK is situated in the c. Zheltye Vody. Project annual capacity of the plant is 1 Mt ore. The number of workers at the plant is 30-35 persons per shift. Ore is hauled to the mill by dedicated trains from two mines-Ingul’skaya (100 km west) and Smolinskaya (150 km west). After grinding and radiometric sorting, ore is leached in autoclaves using sulphuric acid at the temperature 150-200C and under 20 atmospheres pressure with 4-hour permanence time. Acid consumption is 80 kg/t ore. For uranium extraction ion-exchange resin is applied. After elution with a mixture of sulphuric and nitric acids, the uranium-bearing solution is further concentrated and purified applying a technology of extraction with solvents. Ammonia gas is used for precipitation.
Uranium production by the method of underground leaching from the bore holes was conducted in Ukraine from 1966 to 1983 at the Devladovskoye and Bratskoye deposits using acid leach technology. These are sandstone-hosted deposits located within the sedimentary cover of the Ukrainian shield at the depth of less than 100 m. Uranium mining by a method of underground leaching was stopped mainly for environmental considerations.

Ukraine
310
Uranium Production Centre Technical Details (as of 1 January 2005)
Centre # 1
Name of production centre Zheltiye Vody
Production centre classification existing
Start-up date 1959
Source of ore:
� Deposit name Ingil’skii mine/Michurinskoye deposit Vatutinskii mine/Vatutinskoye deposit � Deposit type metasomatite (albitite) � Reserves (tU)
� Grade (% U) 0.1
Mining operation:
� Type (OP/UG/ISL) UG
� Size (t ore/year) NA
� Average mining recovery (%) NA
Processing plant (acid/alkaline): Zheltiye Vody
� Type (IX/SX/AL) AL/IX and SX
� Size (t ore/year) for ISL (L/day or L/h)
NA
� Average process recovery (%) NA
Nominal production capacity (tU/year) 1 000
Plans for expansion doubling the capacity to 2 000 tU/year
Other remarks
Ownership of the uranium industry
All enterprises related to uranium recovery and the nuclear fuel cycle in Ukraine are owned by the state and are a subsidiary of the Department of Nuclear Energy Ministry of Fuel Supply and Energy of Ukraine.
VostGOK is responsible for uranium recovery in Ukraine and is a subsidiary of the Department of Nuclear Energy. In addition to mining and milling activities, VostGOK operates a large sulphuric acid plant as well as producing mining equipment and related spare parts.
The State Geological Enterprise “Kirovgeology” is responsible for the conditions of raw materials for uranium recovery (exploration, assessment and development activities) and is a subsidiary of the State Geological Survey of the Ministry of Environmental Protection of Ukraine.
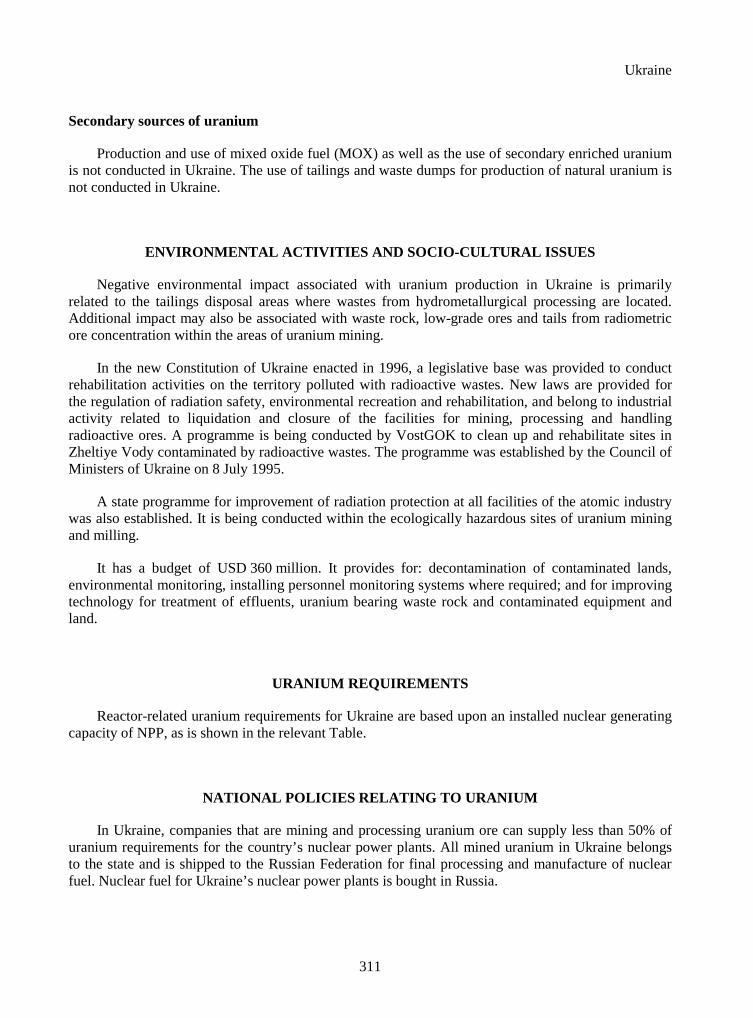
Ukraine
311
Secondary sources of uranium
Production and use of mixed oxide fuel (MOX) as well as the use of secondary enriched uranium is not conducted in Ukraine. The use of tailings and waste dumps for production of natural uranium is not conducted in Ukraine.
ENVIRONMENTAL ACTIVITIES AND SOCIO-CULTURAL ISSUES
Negative environmental impact associated with uranium production in Ukraine is primarily related to the tailings disposal areas where wastes from hydrometallurgical processing are located. Additional impact may also be associated with waste rock, low-grade ores and tails from radiometric ore concentration within the areas of uranium mining.
In the new Constitution of Ukraine enacted in 1996, a legislative base was provided to conduct rehabilitation activities on the territory polluted with radioactive wastes. New laws are provided for the regulation of radiation safety, environmental recreation and rehabilitation, and belong to industrial activity related to liquidation and closure of the facilities for mining, processing and handling radioactive ores. A programme is being conducted by VostGOK to clean up and rehabilitate sites in Zheltiye Vody contaminated by radioactive wastes. The programme was established by the Council of Ministers of Ukraine on 8 July 1995.
A state programme for improvement of radiation protection at all facilities of the atomic industry was also established. It is being conducted within the ecologically hazardous sites of uranium mining and milling.
It has a budget of USD 360 million. It provides for: decontamination of contaminated lands, environmental monitoring, installing personnel monitoring systems where required; and for improving technology for treatment of effluents, uranium bearing waste rock and contaminated equipment and land.
URANIUM REQUIREMENTS
Reactor-related uranium requirements for Ukraine are based upon an installed nuclear generating capacity of NPP, as is shown in the relevant Table.
NATIONAL POLICIES RELATING TO URANIUM
In Ukraine, companies that are mining and processing uranium ore can supply less than 50% of uranium requirements for the country’s nuclear power plants. All mined uranium in Ukraine belongs to the state and is shipped to the Russian Federation for final processing and manufacture of nuclear fuel. Nuclear fuel for Ukraine’s nuclear power plants is bought in Russia.

Ukraine
312
The Ukrainian government recently released the “Strategy of Development of the Nuclear Energy Industry up to 2030”. National policy is now to increase the manufacture of uranium up to the level, which can satisfy the requirements of the nuclear power plants. In addition to this, the Ukrainian government is committed to create a Ukrainian Nuclear Fuel Cycle in 2020.
Foreign companies do not participate in uranium exploration, mining and processing work in Ukraine. Private and state Ukrainian companies do not participate in uranium exploration, mining and processing work abroad.
URANIUM STOCKS
No uranium stockpiles are kept in Ukraine. No information was provided on uranium prices.
Uranium Exploration and Development Expenditures and Drilling Effort – Domestic
Expenses in million UAH 2002 2003 2004 2005 (expected)
Industry exploration expenditures 0 0 0 0
Government exploration expenditures 10.1 18.2 22.7 22.8
Industry development expenditures 0 0 0 0
Government development expenditures 0 0 0 0
Total expenditures 10.1 18.2 22.7 22.8
Industry exploration drilling (metres) 0 0 0 0
Number of industry exploration holes drilled 0 0 0 0
Government exploration drilling (metres) 20 914 31 951 40 938 38 910
Number of government exploration holes drilled 133 203 261 247
Industry development drilling (metres) 0 0 0 0
Number of development exploration holes drilled 0 0 0 0
Government development drilling (metres) 0 0 0 0
Number of development exploration holes drilled 0 0 0 0
Subtotal exploration drilling (metres) 20 914 31 951 40 938 38 910
Subtotal exploration holes 133 203 261 247
Subtotal development drilling (metres) 0 0 0 0
Subtotal development holes 0 0 0 0
Total drilling (metres) 20 914 31 951 40 938 38 910
Total number of holes 133 203 261 247

Ukraine
313
Reasonably Assured Resources* (tonnes U)
Production method <USD 40/kgU <USD 80/kgU <USD 130/kgU Recovery
factor (%)
Underground mining 29 650 69 250 79 910
Open-pit mining 0 0 0
In situ leaching 6 900 6 900 6 900
Heap leaching 0 0 0
In-place leaching (stope/block leaching)
0 0 0
Co-product and by-product 0 0 0
Unspecified 0 0 0
Total 36 550 76 150 86 910
* In situ resources.
Inferred Resources* (tonnes U)
Production method <USD 40/kgU <USD 80/kgU <USD 130/kgU Recovery
factor (%)
Underground mining 7 290 21 350 28 870
Open-pit mining 0 0 0
In situ leaching 1 200 1 200 1 200
Heap leaching 0 0 0
In-place leaching (stope/block leaching)
0 0 0
Co-product and by-product 0 0 0
Unspecified 0 0 0
Total 8 490 22 550 30 070
* In situ resources.
Prognosticated Resources (tonnes U)
Cost ranges
<USD 80/kgU <USD 130/kgU
0 15 300

Ukraine
314
Speculative Resources
(tonnes U)
Cost ranges
<USD 130/kgU Unassigned
120 000 135 000
Ownership of Uranium Production in 2004
Domestic Foreign
Government Private Government Private Totals
[tU] [%] [tU] [%] [tU] [%] [tU] [%] [tU] [%]
1 000 100 0 0 0 0 0 0 1 000 100
Short-term Production Capability (tonnes U/year)
2005 2010
A-I B-I A-II B-II A-I B-I A-II B-II
1 000 1 000 1 500 1 500
2015 2020 2025
A-I B-I A-II B-II A-I B-I A-II B-II A-I B-I A-II B-II
1 500 1 500 2 000 2 000 2 000 2 000
Net Nuclear Electricity Generation
2003 2004
Nuclear electricity generated (TWh net) 81.4 87.4
Installed Nuclear Generating Capacity to 2025 (MWe net)
2010 2015 2020 2025 2004 2005
Low High Low High Low High Low High
13 100 13 800 14 800 14 800 15 200 15 600 14 000 15 200 15 000 15 000
Annual Reactor-related Uranium Requirements to 2025 (excluding MOX) (tonnes U)
2010 2015 2020 2025 2004 2005
Low High Low High Low High Low High
2 220 2 350 2 500 2 650 1 950 2 600 1 950 2 600 1 950 2 600

Ukraine/United Kingdom
315
• United Kingdom •
URANIUM EXPLORATION
Historical review
Some uranium mining occurred in Cornwall, as a sideline to other mineral mining, especially tin, in the late 1800s. Systematic exploration occurred in the periods 1945-1951, 1957-1960, and 1968-1982, but no significant uranium reserves were located.
Recent and ongoing uranium exploration and mine development activities
Exploration in overseas countries is carried out by private companies operating through autonomous subsidiary or affiliate organisations established in the country concerned (e.g., members of the Rio Tinto group of companies).

United Kingdom
316
There were no industry expenditures reported for domestic exploration from 1988 to the end
of 2004, nor were there any government expenditures reported for exploration either domestic or abroad. Since 1983, all domestic exploration activities have been halted.
URANIUM RESOURCES
Identified resources (RAR & Inferred)
The Reasonably Assured Resources (RAR) and Inferred Resources are essentially zero. There has been no geological appraisal of the UK uranium resources since 1980.
Undiscovered resources (Prognosticated & SR)
There are small quantities of in situ Undiscovered Resources as well as Speculative Resources. Two districts are believed to contain uranium resources:
� Metalliferous mining region of southwest England (Cornwall and Devon). Uranium occurs in veins and stockworks, often in association with tin and other metals, emplaced in Devonian metasediments and volcanic and related to the margins of uraniferous Hercynians granites. Mineralization is locally of moderate (0.2-1% U) but of sporadic distribution. Resource tonnages of individual prospects may be up to several hundred tU.
� North Scotland including Orkneys. The Precambrian metamorphic rocks or north Scotland, with intruded Caledonian granites, are overlain by a post-orogenic series of fluviatile and lacustrine Devonian sediments. Uranium occurs in phosphatic and carbonaceous sediments disseminated in arkosic sandstone (Ousdale) and in faults both within the sediments (Stromness) and in underlaying granite (Helmsdale). Resources of a few thousand tonnes of uranium are indicated with an average grade less than 0.1% U.
URANIUM PRODUCTION
Status of production capability
The United Kingdom is not a uranium producer.
Secondary sources of uranium
MOX fuel has been utilised in fast reactor and, on a trial basis, gas-cooled reactor programmes in the United Kingdom in the past. None of the reactors in the UK currently use MOX fuel and this is not expected to change in the near future. In October 2001, the government announced the approval for MOX fuel manufacture in the United Kingdom. In December 2001 BNFL started the first stage of plutonium commissioning of the Sellafield MOX Plant (SMP), following the granting of license consent by the UK Health and Safety Executive’s Nuclear Installations Inspectorate. The plant will manufacture MOX fuel from plutonium oxide separated from the reprocessing of spent fuel and tails of depleted uranium oxide. SMP has a nominal capacity of 120 tHM/yr and is in the early stages of its MOX fuel manufacturing programme.

United Kingdom
317
Over 30 tHM of MOX fuel was produced in the United Kingdom before 2000, principally for use
in fast reactors at Dounreay and for export for use in LWRs. Detailed programmes for the SMP are commercially confidential. Urenco has a long-term contractual agreement to upgrade tails material, but considers this to be commercially confidential.
ENVIRONMENTAL ACTIVITIES AND SOCIO-CULTURAL ISSUES
None reported.
URANIUM REQUIREMENTS
The current economics of nuclear power makes it an unattractive option for new generating capacity but the Government does not rule out the possibility that new nuclear build might become necessary to meet carbon targets. Several measures set out in the White Paper “Our energy future – creating a low carbon economy” in 2003 would make commissioning new nuclear build easier in the future, should it be needed. The White Paper makes it clear that before any decision to proceed with building new nuclear power stations is taken, there would need to be the fullest public consultation and the publication of a White Paper setting out the Government’s proposals.
All existing civil nuclear sites in the UK will close by 2035. The sites have Magnox Reactors, Advanced Gas Cooled Reactors (AGR), or Pressurised Water Reactors (PWR). According to dates provided by the operators, the closure dates will be as follows:
2006: Dungeness A (Magnox) and Sizewell A (Magnox).
2008: Oldbury (Magnox).
2010: Wylfa (Magnox).
2011: Hinkley Point B (AGR) and Hunterston B (AGR).
2014: Hartlepool (AGR) and Heysham 1 (AGR).
2018: Dungeness B (AGR).
2023: Heysham 2 (AGR) and Torness (AGR).
2035: Sizewell B (PWR).
British Energy plc announced on 14 January 2005 that it had successfully completed the financial restructuring it announced in November 2002. The company operates seven Advanced Gas-cooled reactors and one Pressurised Water Reactor in the UK.
Supply and procurement strategy
In the United States anti-dumping (selling at less than fair value) and countervailing (subsidy) action initiated by USEC at the end of 2000 against imports of low enriched uranium from The Netherlands, Germany and the United Kingdom, Urenco was found not to have been dumping but to have been receiving subsidies. This resulted in a small duty rate of 2.23% being levied. Upon review

United Kingdom
318
the subsidy duty rate is now zero as the deemed usage of the subsidies ended in 2002 and no new subsidies have been identified. Various appeals were filed against the original decisions by the United States Department of Commerce and these are currently being progressed through the Court of International Trade and the Court of Appeals for the Federal Circuit.
The technology joint venture between Urenco and Areva in ETC, which was signed in 2003, has received European Commission competition clearance. The closure of the deal is expected in 2005, once governmental clearances have been achieved. This will allow Areva to build a centrifuge enrichment plant to replace its ageing gaseous diffusion facility and give ETC a firm order book for its centrifuges into the next decade.
Urenco is the majority shareholder in the LES Partnership with Westinghouse to design, construct and operate a new uranium enrichment facility, the National Enrichment Facility (NEF), in New Mexico in the United States. The NEF plant would be based on the Urenco centrifuge technology. LES submitted a license application to the US Nuclear Regulatory Commission (NRC) to construct and operate the plant in early 2004. LES hopes to receive the license by mid-2006 and start the construction of NEF by the end of 2006.
The Nuclear Decommissioning Authority (NDA) was established as an executive Non Departmental Public Body (NDPB) under the Energy Act 2004, which received Royal Assent on 26 July 2004. The creation of the NDA implements proposals for the reform of nuclear clean up in the UK civil public sector, which were first published in detail in the July 2002 White Paper, Managing the Nuclear Legacy: A strategy for action. Draft legislation for the establishment of the NDA was published for public consultation on 24 June 2003 as the draft Nuclear Sites and Radioactive Substances Bill. The NDA is sponsored by the Department of Trade and Industry (DTI).
The NDA assumed its full set of powers on 1 April 2005, including responsibility for the nuclear sites, facilities and installations formerly owned and operated by British Nuclear Fuels Limited (BNFL) and the United Kingdom Atomic Energy Authority (UKAEA). The NDA has contracted the management and operation of its sites to BNFL and UKAEA for an initial period. The NDA will seek to secure cost savings in nuclear clean up by subjecting future site management contracts to fair and open tender, in consultation with the nuclear regulators and other key stakeholders. The contractors will carry out the decommissioning work on the sites in accordance with the annual work plans and five-year strategies developed by the NDA. The NDA will pay the contractors for the work done under contract and will act to secure value for money through putting in place appropriate incentives to reward the contractors for achieving set targets and goals on time.
The estimated undiscounted cost of cleaning up the UK civil public sector nuclear liabilities is GBP 48 billion over the next century. As part of the UK government’s 2004 Spending Review Settlement, the DTI secured GBP 928 million resource spending and GBP 250 million capital for the NDA during 2005/06. Alongside this amount, the DTI expects the NDA to achieve a further GBP 1.08 billion in income derived from its commercial operations. A Public Service Agreement (PSA) target was also agreed for the NDA to achieve annual efficiency gains in the cost of nuclear clean up in region of 2% from end 2006, to have completed successful competitions for the management of at least 50% of its nuclear sites by end 2008 and to have reduced the overall civil public sector nuclear liability by 10% by end 2010.

United Kingdom
319
On 3 July 2003, the government announced that a move by BNFL into the private sector via a Private Public Partnership (PPP) was no longer feasible. The decision reflected significant developments in BNFLs key businesses, in the nuclear industry and in the government’s efforts to develop a competitive clean-up market in the UK. Accordingly, the government and BNFL undertook a joint review of the company’s strategy, including the work that BNFL would need to undertake in order to work as a contractor to the NDA. The review concluded in December 2003 that a new holding company would be established (“Newco”) to own BNFLs businesses. Within this new group structure, British Nuclear Fuels plc and Magnox Electric plc will remain as the site licensees of the former BNFL-owned nuclear sites and will be owned and managed by a further new company, British Nuclear Group Ltd (BNG), which in turn will be owned by Newco. BNFL is also setting up two other companies to carry out businesses that were previously undertaken in-house: Nexia Solutions Ltd, which will provide commercial research and technology resource as a supplier to the Site Licensee Companies (SLCs) and to NDA, and Project Services Ltd, which will provide a range of support services to SLCs and other nuclear site operators. The exception is that the Springfields site, which will be re-licensed to a new company, Springfields Fuels Ltd, will be owned by Westinghouse Electric UK Ltd.
NATIONAL POLICIES RELATING TO URANIUM
No changes to uranium policy were reported in the United Kingdom. As regards the current policy on participation of private and foreign companies, the UK Atomic Energy Act 1946 gives the Secretary of State for Trade and Industry wide-ranging powers in relation to uranium resources in the United Kingdom, in particular to obtain information (section 4), to acquire rights to work minerals without compensation (section 7), to acquire uranium mined in the United Kingdom on payment of compensation (section 8), and to introduce a licensing procedure to control or condition the working of uranium (section 12A).
There are no specific policies relating to restrictions on foreign and private participation in uranium exploration, production, marketing and procurement in the United Kingdom, nor exploration activities in foreign countries. There is no national stockpile policy in the UK. Utilities are free to develop their own policy. Exports of uranium are subjects to the Export of Goods (Control) Order 1970 (SI No 1 288), as amended, made under the Import, Export and Customs Powers (Defence) Act 1939.
URANIUM STOCKS
The UK uranium stockpile practices are the responsibility of the individual bodies concerned. Actual stock levels are commercially confidential.
URANIUM PRICES
Uranium prices are commercially confidential in the United Kingdom.
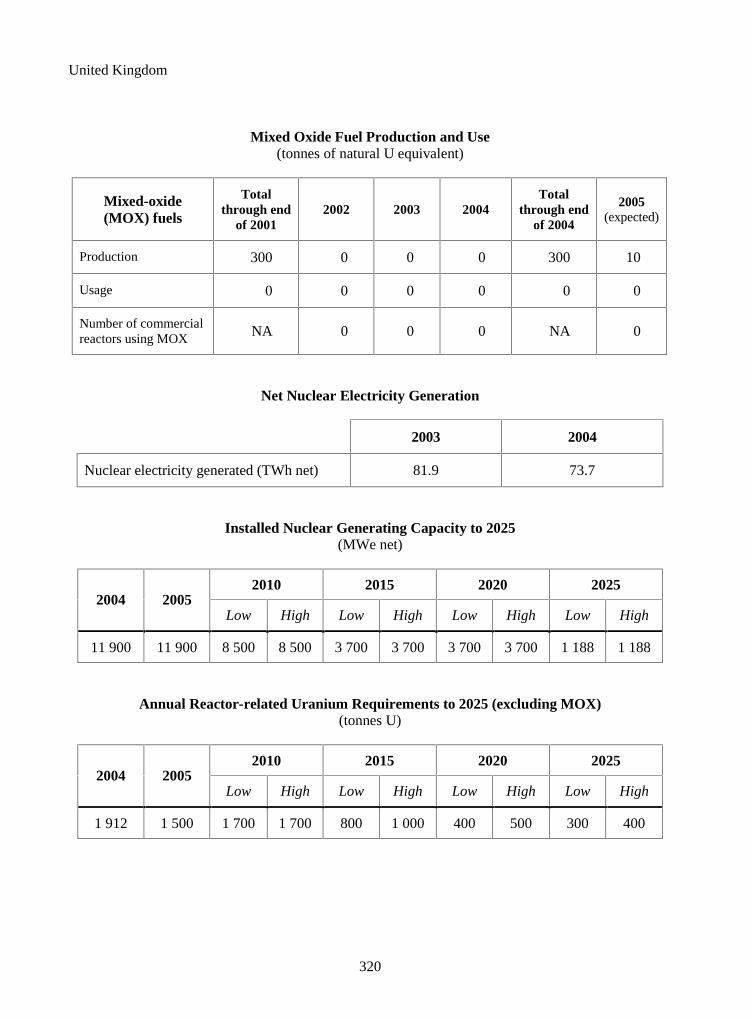
United Kingdom
320
Mixed Oxide Fuel Production and Use (tonnes of natural U equivalent)
Mixed-oxide (MOX) fuels
Total through end
of 2001 2002 2003 2004
Total through end
of 2004
2005 (expected)
Production 300 0 0 0 300 10
Usage 0 0 0 0 0 0
Number of commercial reactors using MOX NA 0 0 0 NA 0
Net Nuclear Electricity Generation
2003 2004
Nuclear electricity generated (TWh net) 81.9 73.7
Installed Nuclear Generating Capacity to 2025 (MWe net)
2010 2015 2020 2025 2004 2005
Low High Low High Low High Low High
11 900 11 900 8 500 8 500 3 700 3 700 3 700 3 700 1 188 1 188
Annual Reactor-related Uranium Requirements to 2025 (excluding MOX) (tonnes U)
2010 2015 2020 2025 2004 2005
Low High Low High Low High Low High
1 912 1 500 1 700 1 700 800 1 000 400 500 300 400

United States of America
321
• United States of America •
URANIUM EXPLORATION
Historical review
From 1947 through 1970, the United States (US) Government fostered a domestic private-sector uranium exploration and production industry to procure uranium for military uses and to promote research and development into peaceful atomic energy applications. By late 1957, the number of new deposits being brought into production by private industry and production capability had increased sufficiently to meet projected requirements, and Federal exploration programmes were ended. The government has continued to monitor private-industry exploration and development activities to meet Federal informational needs.
Exploration by the US uranium industry increased throughout the 1970s in response to rising prices and the projected large demand for uranium to fuel an increasing number of nuclear reactors being built or planned for civilian electric power stations. The peak total in annual surface drilling (exploration and development) was reached in 1978, when 14 700 km of borehole drilling were completed. From 1966 through 1982, US surface drilling totalled 116 400 km in search for new uranium deposits. The US industry completed an additional 12 050 km of surface drilling from 1983 through 1999. Surface drilling is the primary method of delineating uranium deposits in the United States, and the annual total for drilling has proved to be a reliable indicator of overall US exploration activity.
In the United States, exploration has primarily been for sandstone-type uranium deposits in districts such as the Grants Mineral Belt and Uravan Mineral Belt of the Colorado Plateau region and in the Wyoming basins and Texas Gulf Coastal Plain regions. Vein and other structure-controlled deposits were developed in the Front Range of Colorado, near Marysvale in Utah, and in northeastern Washington State. Since 1990, large sandstone-hosted deposits have been mined in northwestern Nebraska. Several relatively high-grade deposits associated with breccia-pipes structures were mined in northern Arizona, but those mines have not been active since the mid-1990s. A large uranium deposit discovered in Virginia in the early 1980s has been pre-empted from exploitation by a state-imposed moratorium on uranium mining in that state.
Recent and ongoing uranium exploration and mine development activities
In the US, the expenditures for uranium surface drilling (exploration and development) during 2004 increased to USD 10.6 million from the USD 2.7 million reported in 2001. For 2002 and 2003, the surface-drilling totals were withheld to avoid disclosure of individually identifiable data. The increase in 2004 was a major turn around for the industry from the steady decline in drilling expenditures since 1997. The number of holes drilled (2 185) and the metres drilled (380 696) were also greater than any year since 1999. Higher uranium prices contributed to this change. The amount of drilling completed for uranium-production control at in situ leach projects and underground and open-pit mining projects is not included in the US uranium surface-drilling total.

United States of America
322
Total reported expenditures for uranium exploration and mine development activities in 2003 and 2004 were USD 31.3 and USD 59.0 million, respectively. These large increases from 2002 total expenditures of USD 0.352 million are primarily due to the inclusion of expenditures for reclamation and restoration work that could not be separated from the total. In 2003 and 2004, there were no exploration expenditures for uranium by the US Government.
The US Government no longer reserves land for uranium production. Under the Atomic Energy Act of 1954, about 100 km2 of public land in the Colorado Plateau in Colorado and Utah were set aside for uranium-vanadium exploration and production. From 1974 to 1994, the withdrawn lands, divided into 43 tracts, were leased to private industry. In 1994, all existing leases were allowed to expire. A programmatic Environmental Assessment study led to a finding in August 1995 of No Significant Impact, and leasing was resumed for a ten-year period for production of uranium and vanadium ores. At year-end 2004, the US Department of Energy (DOE), under its Uranium Lease Management Program, still administered 12 active lease tracts. Leaseholders can conduct ongoing uranium production on these leases. Some of the active leases could expire in 2006 and 2007. Under the current programme, as leases become inactive and are returned to the DOE they are not leased again. The DOE is responsible for assuring that abandoned uranium sites and any undesirable environmental conditions on the lease tracts are resolved. After reclamation, the land associated with the DOE lease tracts is eligible for return to the public domain under the administrative jurisdiction of the Bureau of Land Management of the US Department of the Interior (DOI). However, DOE has begun a review of its lease programme to determine whether 26 inactive lease tracts could be reopened for potential biding due to the current situation with escalating prices for uranium and vanadium.
During 2004, the sharp rise in the prices for uranium (and vanadium concentrates found in some Colorado Plateau ores) also sparked renewed interest in leasing activity for historical uranium reserves properties in several western states. This activity involved the purchasing of existing uranium mineral rights and the forming of new joint ventures for exploration and development of prospective new deposits and covered literally thousands of acres located principally in the known uranium areas of Arizona, California, Colorado, Nevada, New Mexico, Oregon, South Dakota, Utah, Wyoming, and Texas in the western United States.
The US Government did not carry out uranium exploration abroad during 2003 and 2004. Data on industry exploration expenses abroad is not available.
URANIUM RESOURCES
Identified resources (RAR & Inferred)
For the United States, the estimate of RAR for the <USD 80/kgU category at year-end 2003 was 102 000 tU. The estimate for RAR for the <USD 130/kgU category at the end of 2003 was 342 000 tU, a decrease of about 3 000 tU. The 2003 RAR estimates as reported have been adjusted to account for mining dilution and processing losses.
The estimates for RAR for the United States as of the end of 2004 remain the same as for year-end 2003. The RAR estimates will not be updated annually, pending the completion of a study to review the government’s uranium resources assessment programme.
The United States does not report resources for the Inferred category separately.

United States of America
323
Undiscovered resources (Prognosticated & SR)
For the United States, the estimates of resources for the Prognosticated (EAR) and Speculative Resources categories are unchanged from the prior-reported estimates as of 1994. See relevant Table.
URANIUM PRODUCTION
Historical review
Under the Atomic Energy Act of 1946, designed to meet the US Government’s uranium needs, the Atomic Energy Commission (AEC) from 1947 to 1970 fostered a domestic uranium industry, chiefly in the western states, through incentive programmes for exploration, development, and production. To assure that the supply of uranium ore would be sufficient to meet future needs, the AEC, in April 1948, implemented a domestic uranium ore procurement programme designed to stimulate a civilian-based domestic mining industry. The AEC also negotiated uranium concentrate procurements contracts, pursuant to the Atomic Energy Act of 1946 and 1954, with guaranteed prices for source materials delivered within specified times. Contracts were structures to allow milling companies that built and operated mills the opportunity to amortise plant costs during their procurement-contract periods. By 1961, a total of 27 privately owned mills were in operation. Eventually, 32 conventional mills and several pilot plants, concentrators, up graders, heap-leach, and solution-mining facilities were operated at various times. The AEC, as the sole government purchasing agent, provided the only the only US market for uranium. Many of the mills were closed soon after completing deliveries scheduled under their uranium contracts, although several mills continued to produce concentrate for the commercial market after fulfilling their AEC commitments. The Atomic Energy Act of 1954 made lawful the private ownership of nuclear reactors for commercial electricity generation. By late 1957, domestic ore reserves and milling capacity were sufficient to meet the government’s projected requirements. In 1958, the AECs procurement programmes were reduced in scope, and, in order to foster utilisation of atomic energy for peaceful purposes, domestic producers of ore and concentrate were allowed to sell uranium to private domestic foreign buyers. The first US commercial-market contract was finalised in 1966 The AEC announced in 1962 that its procurement programme would enter a “stretch-out” phase, wherein the government would be committed to take domestic uranium industry while it converted to a private marketplace. The government’s uranium procurement programme was ended at year end 1970, and the industry became a private sector, commercial enterprise with no additional government purchases.
Uranium concentrate production in the US has supported the commercial market since 1970. The peak year for US production was 1980 (16 810 tU), subsequently the US industry has experienced generally declining annual production in the period 1981-2003. Production from all sources in 2003 was 769 tU and in 2004 was 878 tU. Since 1991, production from in situ leach mining and other non-conventional production methods has dominated US annual production. In 2004, concentrate production was obtained from facilities in the states of Colorado, Nebraska, Texas, and Wyoming. A breakdown of concentrate production in 2004 by domestic and foreign ownership is not provided to avoid disclosing sensitive data.

United States of America
324
Status of production capability
At year-end 2003, three US uranium mills with a combined capacity of 4 900 tons of ore per day (TPD) were being maintained on standby status; one mill (680 TPD) was in reclamation status; and one mill that was shutdown reported no capacity. Eight in situ leach production facilities with a combined capacity of 3 380 tU were reported, two (1 150 tU) were operating, two (770 tU) were closed indefinitely or on standby, two (690 tU) were in development, and two new non-conventional plants (770 tU) were undergoing permitting and licensing. For three non-conventional plants no capacities were reported: two were undergoing restoration and one was reported as depleted.
At year-end 2004, one mill (360 TPD) was operating, two (4 540 TPD) were maintained in standby, and one mill (680 TPD) was in reclamation. No capacity was reported for the one shutdown mill. Of the eight in situ leach production facilities in 2004 with a capacity of 3 380 tU, three (1 460 tU) were operating, two (770 tU) were closed indefinitely or on standby, one (380 tU) was in development, and two new facilities (770 tU) were undergoing permitting and licensing. Three non-conventional plants reported no capacities: two were undergoing restoration and one was depleted.
Uranium Production Centre Technical Details (as of 1 January 2005)
Centre # 1 Centre # 2 Centre # 3 Centre # 4
Name of production centre Canon City Crow Butte Kingsville Dome
Smith Ranch/
Highland
Production centre classification existing existing existing existing
Start-up date 1979 1991 1988 1988
Source of ore: � Deposit name various Crow
Butte Kingsville
Dome/ Vasquez
Smith Ranch/
Highland
� Deposit type sandstone sandstone sandstone sandstone � Reserves (tU) W W W W � Grade (% U) W W W W
Mining operation: � Type (OP/UG/ISL) UG ISL ISL ISL � Size (t ore/day) NA NA NA NA � Average mining recovery (%) NA NA NA NA
Processing plant (acid/alkaline): acid & alkaline – – – � Type (IX/SX/AL) SX IX IX IX � Size (t ore/day); for ISL (L/day or L/h) 360 TPD NA NA NA � Average process recovery (%) NA NA NA NA Nominal production capacity (tU/year) 210 385 385 770
Plans for expansion unknown unknown unknown unknown
Other remarks operating operating standby operating
W = withheld; NA = not available.

United States of America
325
Uranium Production Centre Technical Details (contd.)
(as of 1 January 2005)
Centre # 5 Centre # 6 Centre # 7
Name of production centre Sweetwater White Mesa Vasquez
Production centre classification existing existing existing
Start-up date 1981 1980 2004
Source of ore:
� Deposit name various Various Vasquez
� Deposit type sandstone sandstone sandstone
� Reserves (tU) W W W
� Grade (% U) W W W
Mining operation:
� Type (OP/UG/ISL) OP UG ISL
� Size (t ore/day) NA NA NA
� Average mining recovery (%) NA NA NA
Processing plant (acid/alkaline): acid Acid –
� Type (IX/SX/AL) SX SX IX
� Size (t ore/day) for ISL (L/day or L/h)
2 720 TPD 1 820 TPD NA
� Average process recovery (%) NA NA NA
Nominal production capacity (tU/year) 350 1 200 310
Plans for expansion unknown unknown unknown
Other remarks standby processes
alternative feed stocks
operating
W = withheld NA = not available
Ownership of uranium production in 2004
Publicly owned firms own the four uranium facilities that produced uranium concentrate in 2004. Foreign firms control three and one is domestically owned. Foreign interests thus controlled the major part of US uranium concentrate production in 2004.
Employment in the uranium industry
Employment in the raw materials sector (exploration, mining, milling, and processing) of the US uranium industry generally declined each year during the period 1998-2003. The employment level at year-end 2004 was reported as 299 person-years expended compared with 204 person-years in 2003. This change represents an increase of about 47% during 2004. The employment level in this sector had declined by about 26 per cent from 2002 to 2003. Changes in the employment levels for the component areas for the raw materials sector cannot be examined more closely due to the company proprietary nature of those data.

United States of America
326
Future production centres
Three new non-conventional facilities were in the process of permitting and licensing during 2004.
Secondary sources of uranium
The US reported mixed oxide fuel and re-enriched tails production and use to be zero.
ENVIRONMENTAL ACTIVITIES AND SOCIO-CULTURAL ISSUES
Overview
Mill tailings, and particularly the contained radionuclides, are a major source of environmental impact to air, soil, surface and groundwater. In the US, a growing appreciation of the extent and severity of damages that had accumulated in the natural environment resulting from ineffective regulatory oversight in governing mine discharges, hazardous waste disposal, and unreclaimed mining sites, led to the passage, beginning in the 1970s, of several US federal and state laws designed to protect air, water, and land resources. Environmental effects traceable to uranium extraction and beneficiation can include the direct disturbances in the natural surface environment, radionuclides present in the waste products from mines and mills, increased surface-water runoff from mined areas, erosion by wind and water, and contamination of nearby groundwater reservoirs.
In the US, uranium ores were processed at mills during the 1940s to produce concentrate for government requirements during World War II and also from 1947 through 1970 under the US AECs uranium procurement programme. The large amounts of mill tailings that accumulated at these mill sites contained hazardous chemicals from the milling operations as well as the ore-processing waste materials. The radioactivity remaining in the waste materials after recovery of the uranium values is about 85% of the radioactivity of the original ore mill feed.
In 1971, the Subcommittee on Raw Materials of the Joint Committee on Atomic Energy heard testimony on the dangers and inherent public health threat from the use of uranium mill tailings materials for construction at civilian sites, which later became known as vicinity properties. As a result of these hearings, the Congress authorised a Federal programme to co-operate with the state of Colorado for removal of tailings from sites and structures in the Grand Junction, Colorado, area. The government paid 75% of the cost and the state paid the remainder.
In 1974, the Congress directed an assessment of problems associated with uranium mill tailings at 22 inactive sites. The Uranium Mill Tailings Radiation Control Act (UMTRCA) was passed in late 1978. The act assigned responsibilities to three Federal agencies: the Environmental Protection Agency (EPA), the Department of Energy (DOE), and Nuclear Regulatory Commission (NRC). The EPA was directed to establish standards for cleanup and disposal of contaminated material from both inactive and active uranium processing sites. After taking into account the economic cost of implementing new standards and considering public health, safety, and the environment, the EPA formulated standards to limit the release of radon gas into the environment and require that any disposal methods be designed to control radiological hazards “for up to [1 000] years, to the extent achievable, and in any case for at least 200 years”.

United States of America
327
The UMTRCA legislation authorised identification of additional mill tailings sites, and two such sites were later designated. Title I of the act covers sites that were already inactive at the time the legislation was enacted, and Title II covers cleanup of sites that were then still active.1 Under the act, the DOE was required to cleanup all Title I sites to EPAs standards: this involved the Title I sites2 and the vicinity properties contaminated by the spread of hazardous radioactive materials by wind, water, and human intervention.3 In some cases, where tailings piles were exposed to weather, groundwater became contaminated due to the effects of rain and snowmelt. The act created a plan of Federal and state cooperation under which the government and the states, wherein Title I sites are located, would cooperate for cleaning up the sites. The cost for cleanup activities at Title I sites was borne mainly by the DOE, and affected states contributed up to 10% of the actual cost for sites located in their borders. The DOE and state, with NRC concurrence, selected the cleanup method and oversaw the cleanup work. The federal government was responsible for the cost of cleanup for sites located on tribal lands.
NRC, working with EPA, was required to establish regulations governing the control and cleanup of the mill tailings and land at Title II sites. These sites are licensed by NRC or by the state in which they are located. NRCs regulations are to conform with and implement and enforce EPAs general standards. UMTRCA requires that the expense for cleaning up the Title II sites are to be borne primarily by the firms that own and operate those sites. Under UMTRCA, the federal government becomes the long-term custodian for all sites cleaned up under Title I. For sites reclaimed under Title II, the host state can elect to become the long-term custodian: otherwise the federal government is to assume that responsibility.4 Before the federal government takes custody to Title II sites, NRC also is responsible for making financial arrangements with the site owners/operators so as to assure that sufficient funds will be available to cover the costs of any necessary long-term monitoring and ongoing routine maintenance for remediated sites. The DOE will ultimately be responsible for costs of long-term surveillance and maintenance of Title I low-level radioactive waste disposal sites, but it will not be financially responsible for those activities at Title II sites once custody is transferred. At year-end 1999, DOE, under the Long-Term Surveillance and Monitoring Program (LTSM), had custody of 25 low-level radioactive waste disposal sites and was responsible for surveillance, monitoring, and maintenance. By 2006, about 50 such low-level radioactivity sites from various reclamation programmes are projected to be included in the LTSM programme.5
1. Title I mills were operated to meet uranium requirements of the Federal Government from 1947-1970. The
objective of the DOE is to clean up “the current waste inventory within the DOE nuclear weapons complex by the year 2019”.
2. Under Title I of the Uranium Mill Tailings Radiation Control Act of 1978 (UMTRCA), the DOE in 1979 set up its Uranium Mill Tailings Remediation Action project (UMTRA) to manage cleanup and disposal of the tailings at 22 inactive sites throughout the United States. Two more mill tailings sites were added later. Through UMTRA, DOE coordinated the cleanup work with affected states, Indian tribes, and local governments. The State of North Dakota later requested that the DOE remove two Title I sites located in that State: the sites were thought to pose very small risk to the public and the environment, and State funding as well as public support for cleaning up the North Dakota sites were limited. The North Dakota sites were removed, without cleanup, from the list of Title I sites by the Secretary of Energy in 1997, after DOE prepared an Environmental Assessment and Finding of No Significant Impact in compliance with the National Environmental Policy Act.
3. Overall, 5 335 vicinity properties were cleaned up under the UMTRA Program.
4. Long-Term Surveillance and Monitoring Program, 1998 Report, US Department of Energy, Grand Junction Office, Grand Junction, Colorado, March 1999, (p. 5).
5. Long-Term Surveillance and Monitoring Program, 1998 Report, US Department of Energy, Grand Junction Office, Grand Junction, Colorado, March 1999, (p. 6).

United States of America
328
Cleanup of surface contamination involves four key steps: (1) identify, or characterise, the type and extent of contamination, (2) obtain a disposal site for contaminated materials, (3) develop a decommissioning plan that prescribes the cleanup method and specifies design requirements, and (4) carry out the cleanup according to specifications and regulations as appropriate.
Based on assessments undertaken to detail the potential risks to public health from tailings, the DOE in 1979 established a cleanup priority for Title I sites, ranking them as high, medium, or low. The rankings determined the order in which cleanup would be performed at the sites, but it did not prevent start up of work on lower priority sites before all higher priority sites were completed. All sites, regardless of risk ranking or cleanup priority, were required to be cleaned up to EPA-established standards.
In 1980, Congress established a different method of setting cleanup priorities. Under the Comprehensive Environmental Response, Compensation, and Liabilities Act (CERCLA), or “Superfund,” potentially hazardous sites are screened to identify those with contamination and risk sufficient to warrant including them on the National Priorities List.6 On the list are sites that present the most serious threats to public health and the environment. Under Superfund, the generators of hazardous wastes and waste transporters, in addition to site owners/operators, are potentially responsible for either cleaning up the site or reimbursing the federal government for the costs of the remedial activities. The DOE, however, was required to reimburse, up to a maximum limit for all Title II sites, the owners/operators for the costs of remediation attributable to mill tailings generated as a result of uranium sales to the US.
CERCLA created a tax on the chemical and petroleum industries and provided broad federal authority to respond directly to releases or threatened releases of hazardous substances that may endanger public health or the environment. Over five years, USD 1.6 billion was collected and the tax went to a fund for cleaning up abandoned or uncontrolled hazardous waste sites. CERCLA established prohibitions and requirements concerning closed and abandoned hazardous waste sites; provided for liability of persons responsible for releases of hazardous waste at these sites; and established a trust fund to provide for clean up when no responsible party could be identified. This law was and currently is being used for clean up of abandoned uranium mines.
Applicable EPA standards under UMTRCA are contained in “Health and Environmental Protection Standards for Uranium and Uranium Mill Tailings,” Code of Federal Regulations, 40 CFR Part 192. The NRC is responsible for issuing operating licenses under “Domestic Licensing of Source Material,” 10 CFR Part 40. It requires that each operating license contain provisions covering the decontamination, decommissioning, and reclamation of the licensed facility. The actions that the licensee must take pertaining to site decommissioning are described in the license document as issued to the facility operator. The operating-license applicant must submit to the NRC or the agreement state,7 a Generic Environmental Impact Statement (GEIS) that covers all aspects for construction and operation of the facility and describes provisions for reclamation of the site and its waste materials.
6. Uranium mill tailings being cleaned up by DOE under Title I of UMTRCA are exempt from Superfund.
7. Three states, Colorado, Texas, and Washington, under agreement with the NRC, elected to operate state-level programmes for regulating uranium production facilities within their borders. All regulations adopted and applied by a State must conform to those of the NRC, which is authorised to review all such regulations.

United States of America
329
Surety for site remediation
On approval of the proposed decommissioning plan by the NRC or state, the licensee must also provide a surety to guarantee that funds required to reclaim the site will be available to complete site restoration work to standards established by federal and state regulations, with the assumption that a third party might be required to do the work if the licensee is unable to complete the task. The NRC or state and the licensee must agree on the estimated cost for decommissioning work. The surety amount must cover a number of activities, such as plant decommissioning, tailings reclamation, groundwater restoration, well-field closure, surface decontamination, revegetation, and long-term monitoring. Contaminated equipment and structures must be crushed and disposed of along with contaminated soil residues in a licensed disposal area. The cost estimate and surety must include a fee set by the NRC or the agreement State for funds necessary for the long-term surveillance and monitoring of the site to protect public health and safety. As of 31 December 1999, the US uranium industry had committed over USD 235 million to surety. For each license, the surety is reassessed annually to accommodate inflation and to take into account decommissioning work completed up to that time.
In addition to the UMTRCA and CERCLA legislation, the statutes and associated regulations established to provide environmental controls over reclamation of uranium recovery facilities include the Clean Water Act (CWA), as amended (33 USC 1251 et seq); the Clean Air Act (CAA), as amended (42 USC 7401 et seq); The Safe Drinking Water Act (SDWA), as amended (42 USC 300 (f) et seq); and the Atomic Energy Act (AEA) (42 USC 2021 et seq), as amended by the UMTRCA (72 USC 7901 et seq). For clean-up of facilities which meet certain ranking criteria due to their potential hazard to the public and the environment, the CERCLA (42 USC 9601 et seq.) is controlling.
The CWA gives EPA the authority to impose effluent limits, via permits, on point-source discharges, including those from active uranium extraction and beneficiation sites, to waters of the United States. It also gives EPA the authority to regulate storm water discharges from both inactive and active mine sites through permits.
The CAA gives EPA authority to regulate emissions of both “conventional” pollutants, like PM10 (particulate matter less than 10 microns) and hazardous pollutants such as radon. Both are air pollutants emitted by uranium extraction and beneficiation activities. The Underground Injection Control (UIC) Program was established under the authority of the SDWA. This programme established a permit system to assure that underground sources of drinking water are protected and that the injection of process fluids and liquid wastes, including those from uranium extraction and beneficiation, into the subsurface via such wells will not contaminate potable water reservoirs.
Authority for state agency regulation of uranium extraction and beneficiation activities comes from federally delegated programmes and state statutory authority. Federal programmes that apply to uranium extraction and beneficiation activities and that can be delegated to states include the UIC programme, the National Pollutant Discharge Elimination System (NPDES) programme, and NRC licensing and radiation protection regulations. In order for a state to administer any or all of these federal programmes, the state must have requirements that are equally as stringent as the respective federal programmes.
United States of America
330
Current regulations: uranium mines
The NRC, like the AEC from which it was created, does not interpret its regulatory authority as encompassing uranium underground or open pit mines. In similar fashion, The Office of Surface Mining (OSM) in the US Department of the Interior excludes itself from the regulation of uranium mines and focuses rather on standards and regulations for cleanup of coal mines. The individual states carry out the enforcement of most regulations that pertain chiefly to mining activities. Under regulations and standards developed for cleanup of active and abandoned coal mines nationwide, a fee is assessed per ton of coal mined to establish a fund for use in reclamation of abandoned coal mines and for the closure of hazardous mine openings left from other mining operations. The funds are derived from coal mining operations, and most of the reclamation effort has been on coal mines and on metal mines other than uranium mines. States that have successfully restored their legacy of abandoned coal mines can use the remaining funds to cleanup other abandoned hard-rock mines, including uranium mines. This approach was used in Wyoming and, under an agreement with the OSM, is now being used by The Navajo Nation government in Arizona. Colorado and Wyoming have active mining programmes that reflect their significant mineral and coal resources and mining industries. For example, state laws in Wyoming have been effective in encouraging phased open pit operations and associated reclamation activities. Colorado also has an abandoned mines law and a fund for reclamation work.
Mines on Federal land also may be subject to requirements established by the Bureau of Land Management (BLM), Department of Interior, or to requirements specified under terms of lease agreements, such as those applicable to mineral leases on Indian lands. The Federal Land Policy and Management Act of 1976 (Public Law 94-579) provide the basis for BLM control of mining lands. Regulations as promulgated in 43 CFR Part 3809, “Surface Management“, are designed to protect Federal lands from degradation. These regulations primarily apply in cases where the surface disturbance covers an area over five acres.
Larger operations require a pre-approved operating plan, but existing mines can continue to operate while plans are being developed and approved. The regulations are general in scope and do not pre-empt state laws regarding mining properties. Where the state and BLM regulations may overlap or result in contravening implementation, the state and BLM must reach agreement by reconciling differing interpretations while still protecting the environment.
For open-pit mines, the principal environmental concerns involve the excavations and associated waste piles. Such mine pits may require backfilling, or their pit walls may have to be reshaped to eliminate steep high slopes. Waste piles may have to be contoured to a more natural shape that will enhance successful re-vegetation. Other than a mandatory requirement to close shafts and mine openings, underground mines generally have few reclamation requirements. For open-pit uranium mines, reclamation costs can be substantial. For example, one uranium mining company reported that a cost of about USD 35 million to backfill and reshape its pits in the Powder River Basin area of Wyoming.
Reclamation of mined areas includes returning the landscape to its original condition. Overburden materials must be returned to mined-out pits and any remaining waste-rock piles contoured to blend with the local terrain. The disturbed site then must be covered with original topsoil (which has been stored separately) for reseeding as necessary to establish vegetation. To enhance its long-term survival, the vegetation selected should be indigenous to the area. After satisfactory completion of site remediation by the licensee, the surety is released, and title to the site (including tailings) passes to the DOE or the appropriate state agency that assumes responsibility for long-term monitoring and care of the site.

United States of America
331
Costs of environmental management after closure
Costs of environmental management after closure consist primarily of reclamation and monitoring costs. For uranium mills, these costs include mill decontamination and demolition, long-term tailings stabilisation, and ground water remediation. For mines, the reclamation costs incurred cover partial backfilling of pits, stabilisation of waste rock piles, recontouring the disturbed land surfaces, and revegetation. Monitoring is a post-closure cost for both mills and mines.
In the US, the total cost for surface cleanup of 22 former uranium ore processing sites designated as Title I sites under UMTRA was reported to be USD 1.476 billion.8,9 Not included in this amount is the cost for groundwater cleanup at the Title I sites, which DOE estimated in 1995 would cost an additional USD 147 million above the surface cleanup cost with completion of the groundwater cleanup work projected for 2014. Surface cleanup of the Title II sites is in progress, and at the end of 1999, the total cost estimated for work already completed at these sites was about USD 600 million. Also in 1999, it was estimated that the costs for surface cleanup completed at 22 major uranium mining sites in the United States was about USD 300 million. The costs incurred to date under the OSM Abandoned Mines Program for surface cleanup of abandoned uranium mine properties that is administered by several states have not been tabulated.
URANIUM REQUIREMENTS
Annual uranium requirements for the US for the period 2004 through 2025 are projected to peak in 2025 at 27 062 tU (high case). Requirements are projected to decline to about 18 555 tU (low case) or 19 595 tU (high case) in 2020 in line with the anticipated closings of some commercial nuclear power plants prior to new growth by 2025.
Supply and procurement strategy
The US does not have a national policy on uranium supply or on procurement. Decisions about uranium production, supply, and sales and purchases are made solely in the private sector by firms involved in the uranium mining and nuclear power industries.
8. The cost stated in the section represents amounts for the years in which the costs were incurred and have
not been adjusted to current dollars.
9. “UMTRA Project, Uranium Mill Tailings Remedial Action Surface Project, 1979-1999, End of Project Report”, DOE/AL/62350-500, Prepared by Jacobs Engineering Group, Inc., Albuquerque, NM, for the US Department of Energy, Environmental Restoration Division, Albuquerque, NM, May 1999 (p. 109).
United States of America
332
NATIONAL POLICIES RELATING TO URANIUM
In February 1993, the Agreement between the Government of the United States and the Government of the Russian Federation Concerning the Disposition of Highly Enriched Uranium Extracted from Nuclear Weapons (HEU Purchase Agreement) was signed by the United States and the Russian Federation providing for the blending down of 500 tons of HEU to low-enriched uranium (LEU) over 20 years. USEC Inc., serving as the US Government’s sole executive agent for implementing the HEU Purchase Agreement, receives deliveries of LEU from the Russian Federation for sale to commercial nuclear power plants. As USEC purchases and sells under existing contracts, the enrichment component only of this LEU, a separate agreement has been agreed for the natural uranium component. An agreement for the maintenance of a domestic uranium enrichment industry that was signed by the DOE and USEC Inc. on 17 June 2002 contains conditions for USEC Inc. to continue as the US Government’s sole executive agent for the HEU Purchase Agreement.
The United States government in 1994 had declared as surplus 174.3 metric tons of HEU. Through 2005, 72.9 tonnes of HEU were blended down to 894.7 tonnes of low-enriched uranium fuel for use in power reactors. In addition, 17.4 tonnes of HEU would be down-blended to low-enriched uranium fuel between 2006 and 2009 as part of the Reliable Fuel Supply initiative announced by the Department of Energy in September 2005. Under the Reliable Fuel Supply initiative, the United States will keep a reserve of low-enriched uranium that in the event of a market disruption can be sold to countries that forgo enrichment and reprocessing.
In November 2005, the Department of Energy announced that an additional 200 tonnes of HEU beyond the initially declared 174.3 tonnes of HEU would be permanently removed from further use by the United States as fissile material in nuclear weapons. Of the additional 200 tonnes HEU, 160 tonnes will be provided for use in naval ship power propulsion, 20 tonnes is to be blended down to low-enriched uranium fuel for use in power or research reactors, and 20 tonnes reserved for space and research reactors that currently use HEU, pending development of fuels that would enable the conversion to low-enriched uranium fuel cores. For power reactors, the low-enriched uranium would become available gradually over a 25-year period.
In February 2006, the United States has proposed a new program, the Global Nuclear Energy Partnership (GNEP), that will work with international partners to demonstrate the capability to safely recycle used nuclear fuel using more proliferation-resistant processes. GNEP will develop and demonstrate the Advanced Breeder Reactor (ABR) that consumes transuranic elements (plutonium and other long-lived radioactive materials) while extracting their energy. The development of ABRs will allow fuel to be recycled and also have the benefit of extending the uranium supply for power generation.
The natural uranium feed component is sold under a commercial agreement between three western corporations (Cameco, Cogema, and Nukem) and Techsnabexport of the Russian Federation. The quantity of natural uranium feed component of low-enriched uranium derived from the conversion of surplus HEU from the Russian Federation that can enter the US market is restricted to a quota under the USEC Privatization Act. The quota for 2004 is about 5 400 tU, gradually expanding to 7 700 tU in 2009 and subsequent years.

United States of America
333
Outside of the natural uranium feed component of HEU-derived LEU, imports of uranium from
the Russian Federation have been limited by the Agreement Suspending the Antidumping Duty Investigation on Uranium from the Russian Federation (Suspension Agreement) signed between the Department of Commerce (DOC) and the Ministry of Atomic Energy of the Russian Federation in 1992. As a result of the Suspension Agreement, DOC has suspended antidumping investigations as the Russian Federation agreed to sell uranium to the US under a quota system whereby Russian imports would have to be matched by an equivalent quantity of newly produced US uranium. An amendment to the suspension agreement in 1994 contains language specifying an expected termination date of 31 March 2004. However, as of 1 January 2006, Russia has not requested the DOC to undertake a termination review, one of the requirements for termination.
In February 2002, the DOC issued final determinations in antidumping and countervailing duty investigations involving LEU from France, Germany, the Netherlands, and the United Kingdom. As a result, DOC placed an antidumping duty order on LEU imports from France while all four countries were issued countervailing duty orders. The DOC determinations were challenged at the US Court of International Trade (CIT).
In early 2005, the United States Court of Appeals for the Federal Circuit (CAFC) affirmed an earlier ruling by the US Court of International Trade (CIT) that contracts for the purchase of separative work (SWU) were contracts for the sale of services, not goods. US antidumping law applies only to the sale or purchase of goods, not to the sale or purchase of services. Further, the CAFC affirmed: that CIT was correct in ruling that the DOCs approach to defining the word “producer” was in accordance with law, (this provides USEC the ability to trigger the antidumping and countervailing subsidy investigations). This ruling could impact the imposition of duties on LEU imported from the European Union, as well as, the Russian Suspension Agreement on Uranium, which is based on US antidumping law and covers uranium enriched in Russia. Pending a final resolution that may involve further appeals and rehearings, the import duties now imposed will continue to be collected.
URANIUM STOCKS
At the end of 2004, total commercial stocks of uranium (natural and enriched uranium equivalent) were 36 284 tU, which represented an increase of 10% above the 32 883 tU level at the end of 2003.
Utility stocks held at year-end 2004, 21 683 tU, were 23% more than the 17 555 tU at year-end 2003. The increase occurred in the inventories of natural and enriched uranium stocks. In 2004, natural uranium stocks increased to 10 502 tU from 8 721 tU, in the prior year, and enriched uranium stocks increased to 11 180 tU from 8 833 tU. These totals include utility-owned stocks reported as inventories at enrichment supplier facilities.
Producer total stocks (that is US supplier inventories) at year-end 2004 were 14 602 tU, a decline of almost 5% from the prior year total of 15 328 tU. The totals reported for producer stocks include amounts owned by USEC, Inc. The details on stocks held as natural versus enriched uranium are withheld to avoid disclosure of confidential data.
Total uranium stocks held by the US Government at the end of 2004 were 483 494 tU, of which 464 178 tU were depleted uranium stocks.

United States of America
334
URANIUM PRICES
Average US Uranium Prices, 1991-2002 (USD per kilogram U equivalent)
Year Domestic utilities from domestic suppliers
Domestic utilities and suppliers from foreign suppliers
2004 30.96 31.85 2003 28.18 27.53 2002 26.91 26.14 2001 27.17 24.74 2000 29.77 25.58 1999 30.90 27.42 1998 31.99 29.08 1997 33.46 30.69 1996 35.91 34.19 1995 28.89 26.52 1994 26.79 23.27 1993 34.17 27.37 1992 34.96 29.48 1991 35.52 40.43
Note: Prices shown are quantity-weighted averages (nominal US dollars) for all primary transactions (domestic and foreign origin uranium) for which prices were reported. The transactions can include US-origin as well as foreign-origin uranium.
Uranium Exploration and Development Expenditures and Drilling Effort – Domestic
Expenses in million USD 2002 2003 2004 2005 (expected)
Industry exploration expenditures W W W NA Government exploration expenditures 0 0 0 NA Industry development expenditures W W W NA Government development expenditures 0 0 0 NA Total expenditures 0.352 W 10.8 NA Industry exploration drilling (metres) W W W NA Number of industry exploration holes drilled W W W NA Government exploration drilling (metres) 0 0 0 NA Number of government exploration holes drilled 0 0 0 NA Industry development drilling (metres) W W W NA Number of development exploration holes drilled W W W NA Government development drilling (metres) 0 0 0 NA Number of development exploration holes drilled 0 0 0 NA Subtotal exploration drilling (metres) W W 0 NA Subtotal exploration holes W W 0 NA Subtotal development drilling (metres) W W 0 NA Subtotal development holes W W 0 NA Total drilling (metres) W W 380 696 NA Total number of holes W W 2 185 NA

United States of America
335
Uranium Exploration and Development Expenditures – Abroad
Expenses in million USD 2002 2003 2004 2005 (expected)
Industry exploration expenditures W NA NA NA
Government exploration expenditures 0 0 0 NA
Industry development expenditures W NA NA NA
Government development expenditures 0 0 0 NA
Total expenditures W NA NA NA
Reasonably Assured Resources (tonnes U)
Production method <USD 40/kgU <USD 80/kgU <USD 130/kgU Recovery
factor (%)
Underground mining NA 53 000 178 000
Open-pit mining NA 11 000 99 000
In situ leaching NA 38 000 64 000
Heap leaching NA 0 0
In-place leaching (stope/block leaching)
NA 0 0
Co-product and by-product NA 0 0
Unspecified NA 1 000
Total NA 102 000 342 000
Reasonably Assured Resources by Deposit Type (tonnes U)
Deposit type <USD 40/kgU <USD 80/kgU <USD 130/kgU
Unconformity-related NA 0 0
Sandstone NA 99 000 327 000
Hematite breccia complex NA 0 0
Quartz-pebble conglomerate NA 0 0
Vein NA 0 0
Intrusive NA 0 W
Volcanic and caldera-related NA W W
Metasomatite NA 0 0
Other* NA W 8 000
Total NA 102 000 342 000
* Includes surficial, collapse-breccia pipe, metamorphic, limestone and uranium coal deposits.

United States of America
336
Prognosticated Resources (tonnes U)
Cost ranges
<USD 80/kgU <USD 130/kgU
839 000 1 273 000
Speculative Resources (tonnes U)
Cost ranges
<USD 130/kgU Unassigned
858 000 482 000
Historical Uranium Production (tonnes U in concentrate)
Production method Total
through end of 2001
2002 2003 2004 Total
through end of 2004
2005 (expected)
Open-pit mining1 NA 0 0 0 NA NA
Underground mining1 NA 0 W W NA NA
In situ leaching NA W W W NA NA
Heap leaching NA W W W NA NA
In-place leaching* NA W W W NA NA
Co-product/by-product NA W W W NA NA
U recovered from phosphates
NA 0 0 0 NA NA
Other methods** NA W W W NA NA
Total 354 814 902 769 878 357 363 NA
(1) Pre-2002 totals may include uranium recovered by heap and in-place leaching. * Also known as stope leaching or block leaching. ** Includes mine water treatment and environmental restoration.
Ownership of Uranium Production in 2004
Domestic Foreign
Government Private Government Private Totals
[tU] [%] [tU] [%] [tU] [%] [tU] [%] [tU] [%]
0 0 W W 0 0 W W 878 100

United States of America
337
Uranium Industry Employment at Existing Production Centres (person-years)
2002 2003 2004 2005 (expected)
Total employment related to existing production centres
277 204 299 NA
Employment directly related to uranium production
204 W 173 NA
Short-term Production Capability (tonnes U/year)
2005 2010
A-I B-I A-II B-II A-I B-I A-II B-II
1 400 1 400 2 900 4 600 1 500 1 800 3 400 6 100
2015 2020 2025
A-I B-I A-II B-II A-I B-I A-II B-II A-I B-I A-II B-II
1 700 2 000 3 800 6 600 1 700 2 000 3 700 6 500 1 300 1 700 3 100 5 600
Mixed Oxide Fuel Production and Use (tonnes of natural U equivalent)
Mixed-oxide (MOX) fuels
Total through end
of 2001 2002 2003 2004
Total through end
of 2004
2005 (actual)
Production 0 0 0 0 NA 0
Usage 0 0 0 0 0 10
Number of commercial reactors using MOX
0 0 0 0 0 1
Net Nuclear Electricity Generation
2003 2004
Nuclear electricity generated (TWh net) 764 789
Installed Nuclear Generating Capacity to 2025 (MWe net)
2010 2015 2020 2025 2004 2005
Low High Low High Low High Low High
99 700 99 700 100 600 100 600 102 200 102 200 102 700 108 900 102 700 127 800

United States of America
338
Annual Reactor-related Uranium Requirements to 2025 (excluding MOX) (tonnes U)
2010 2015 2020 2025 2004 2005
Low High Low High Low High Low High
24 143 22 874 21 034 21 034 22 211 22 211 18 555 19 595 22 092 27 062
Total Uranium Stocks (tonnes natural U-equivalent)
Holder
Natural uranium stocks in
concentrates
Enriched uranium
stocks
Depleted uranium
stocks
Reprocessed uranium
stocks Total
Government 19 326 0 464 168 0 483 494
Producer W W NA NA 14 602
Utility 10 502 11 180 NA NA 21 683
Total W W NA NA 519 779

Uzbekistan
339
• Uzbekistan •
URANIUM EXPLORATION
Historical review
Uranium exploration in Uzbekistan predates the 1945 start-up of uranium mining at the small vein deposits (Shakaptaz, Uiguz Sai, and others) in the Fergana valley of eastern Uzbekistan. Exploration, including airborne geophysical surveys, ground radiometry, underground workings, etc. conducted during the early 1950s over the remote Kyzylkum desert in central Uzbekistan, led to the discovery of uranium in the Uchkuduk area. Drilling confirmed the initial discovery and development of the first open pit mine at Uchkuduk began in 1961.
Following development of a model for uranium deposits hosted by unconsolidated oxidised Mesozoic-Cenozoic sediments, core drilling and a range of geophysical bore hole logging methods became the main exploration tools for exploring the sedimentary environment. Based on the knowledge of the deposit characteristics and using the improved drilling techniques, large areas in the Karakata depression located in the Bukinai area and the southern rim of the Zirabulak-Ziaetdin Mountains, were explored. This led to the discovery of major sandstone uranium deposits including Severny (Northern) Bukinai, Sabyrsai, Yuzhny (Southern) Bukinai, Sugraly, Lavlakan and Ketmenchi. In addition, exploration for uranium deposits in metamorphic schists in the Auminzaatau and Altyntau areas started in 1961. This resulted in the discovery of the Rudnoye and Koscheka U-V-Mo deposits.
Development of the in situ leaching (ISL) mining technique for recovery of uranium from sandstone deposits in the early 1970s led to a re-evaluation of previously ignored deposits including Lavlakan and Ketmenchi, and to an increase in exploration efforts in the sedimentary environments of the Kyzylkum desert.
Exploration was concentrated in the northwestern Nuratau Mountains and the southeastern part of the Zirabulak-Ziaetdin mountains. The discoveries made in these areas include the Alendy, Severny and Yuzhny (South) Kanimekh deposits (Nuratau Mountains) and the Shark and Severny (North) Maizak deposits (Zirabulak-Ziaetdin mountains). Recognition of the polymetallic nature of the sandstone uranium deposits led to the discovery of selenium, molybdenum, rhenium and scandium as by-products, during ISL processing.
Since 1994, the Navoi Mining and Metallurgical Complex (NMMC) has funded all uranium exploration activities in Uzbekistan. Uranium exploration is the responsibility of two organisations. Exploration within and around deposits is the responsibility of the geological divisions of the producing companies. The search for new deposits is carried out by the State Geological Company – Kyzyltepageologia. However, since the early 1990s, exploration drilling has been limited to the delineation of known deposits and the search for extensions of known deposits.

Uzbekistan
340
Recent and ongoing uranium exploration and mine development activities
Now “Kyzyltepageologia” State Geological Enterprise (SGE) makes the most part of prospecting-exploration works in the new areas at the expense of Navoi Mining-Metallurgical Integrated Works (NMMIW). The Integrated Works itself explores flanks of Severniy Bukinay deposit and the northern flank of Ketmenchi deposit.
In 2003-2004 Kyzyltepageologia made exploration and evaluation works in Kendyktyube and Tohumbet deposits, Senoman ingress which is converted into small deposit category, the south-western flanks of Sugraly deposit and the western and eastern flanks of Ketmenchi deposit.
Kyzyltepageologiya SGE explores northern and southern areas of the Central Kyzylkums at the expense of the government. In addition to Senoman deposit the other new deposits have not been found.
The following Table provides statistical data on uranium exploration and development between 2003 and 2004. It includes the activities and expenditures of both the industrial organisation NMMIW and the government exploration branch Kyzyltepageologia.
URANIUM RESOURCES
All of Uzbekistan’s significant resources are located in the central Kyzylkum area, comprising a 125 km-wide belt extending over a distance of about 400 km from Uchkuduk in the northwest, to Nurabad in the southeast. The deposits are located in four districts: Bukantausky or Uchkuduk, Auminza-Beltausky or Zarafshan, West-Nuratinsky or Zafarabad, and Zirabulak-Ziaetdinsky or Nurabad. Uzbekistan’s uranium resources occur in sandstone and black shale (breccia complex) deposits.
The sandstone deposits are located in Mesozoic-Cenozoic depressions filled with up to 1 000 m of clastic sediments of Cretaceous, Paleogene and Neogene age. The uranium is concentrated as roll fronts (bed oxidation zones) in sandstone and gravel units. The mineralization consists of pitchblende and sooty pitchblende with minor coffinite. Average ore grades vary between 0.026 and 0.18% U. Associated elements include selenium, vanadium, molybdenum, rhenium, scandium and lanthanides in potentially commercial concentrations. The depth of the ore bodies is between 50-610 m. Twenty-five uranium deposits belonging to this type are reported, many of which are amenable to ISL extraction techniques.
The black shale (breccia complex) deposits are hosted by metamorphosed and tectonically deformed black carbonaceous and siliceous schists of Precambrian to Lower Paleozoic age. Mineralization includes uranium-vanadium-phosphate ores. The average uranium grade is between 0.06 and 0.132% U, associated with up to 0.024% Mo, 0.1-0.8% V, 68 g Y/tonne and 0.1-0.2 g Au/tonne. The ore bodies occur at depths ranging from 20-450 m. There are seven deposits of this type, most of which could be mined by open-pit and processed by heap leaching.
Identified resources (RAR & Inferred)
As of 1 January 2005, Identified resources (RAR & Inferred) recoverable at costs <USD 130/kgU totalled 164 941 tU, an increase of 577 tU compared to the 2003 Red Book. Of the known resources, 117 917 tU occur in sandstone deposits and 47 024 tU in black shale (breccia complex) deposits.

Uzbekistan
341
Deposit type <USD 40/kgU (tU) USD 40-USD 130/kgU (tU) Sandstone 93 454 117 917 Black shale 36 028 47 024 Total 129 482 164 941
Resources distribution by cost category and uranium district is summarised in the following Tables. Uzbekistan reported its resources in all categories as in situ resources.
Category Uranium ore district Deposit Types RAR+Inferred (tU) Prognosticated+SR (tU)
Bukantausky Sandstone 17 884 21 152 (Uchkuduk) Black shale 33 132 11 234
Total 51 016 32 386 Auminza-Beltausky Sandstone 35 886 47 744
(Zarafshan) Black shale 13 892 42 660 Total 49 778 90 404
West-Nuratinsky Sandstone 51 552 46 773 (Zafarabad) Black shale 0 0
Total 51 552 46 773 Zirabulak- Sandstone 12 595 50 141 Ziaetdinsky Black shale 0 0 (Nurabad) Total 12 595 50 141
Sandstone 117 917 165 810 Total by deposit type Black shale 47 024 53 894
Total 164 941 219 704
Undiscovered resources (Prognosticated & SR)
Undiscovered resources (Prognosticated & SR) as of 1 January 2005 amount to 219 704 tU; 165 800 tU of this number are attributed to the “sandstone-type” and 53 900 tU to the “black shale-type”. In comparison with the data of 2003 the numbers decreased in the result of their recalculation during exploration activities in the Amantay-Kyzylkak area held by SGE “Kyzyltepageologia” in 2004. Depths of the mineralization and the mineral composition are similar to the identified resources.
URANIUM PRODUCTION
Historical review
Uranium production in Uzbekistan began in 1946 at several small volcanic vein deposits in the Fergana valley and Kazamazar uranium district. The mines are no longer in operation and the deposits are depleted. The ore was processed in the Leninabad uranium production centre in Tajiskistan.
Commercial uranium mining began at Uchkuduk in 1958 with the development of both open pit and underground mines. The ore was stockpiled until the completion in 1964 of the hydrometallurgical uranium processing plant in Navoi, located some 300 km southeast of Uchkuduk. The mill and all mines are operated by the NMMC. ISL experiments conducted at the Uchkuduk deposits started as early as 1963, leading to the commercial application of ISL in 1965.

Uzbekistan
342
Conventional underground mining operations started at the Sabysai and Sugraly deposits in 1966 and 1977 respectively. In 1975, ISL extraction began to replace the underground mining of the Sabyrsaj mine, and conventional underground mining at Sabyrsaj was stopped in 1983. The Ketmenchin ISL plant began operation in 1978. In 1994, reduction of uranium demand led to the closure of the open pit at the Uchkuduk mine as well as both underground and ISL Sougraly mines.
As of 1 January 2005, three mining divisions are producing uranium by in situ leaching: the Northern Mining Division (Uchkuduk), Mining Division No. 5 (Zafarabad) and the Southern Mining Division (Nurabad). The Eastern Mining Division was closed for economical reasons. Uranium concentrates are processed in the hydrometallurgical plant in Navoi.
Status of production capability
Uranium, in the Republic of Uzbekistan, is produced by the Navoi Mining and Metallurgical Integrated Works (NMMIW). As of 1 January 2005, the NMMIW is producing uranium only by in situ leaching in the Sabyrsai, Ketmenchi, Severny Bukinai, Yuzhny Bukinai, Beshkak, Kendyktube, Lyavlyakan, Sugraly deposits and as experimental works in Tohumbet deposit. Annual in situ leaching uranium production was 2 087 tU in 2004 and is planned to be 2 300 tU in 2005.
Uranium Production Centre Technical Details (as of 1 January 2005)
Centre # 1 Centre # 2 Centre # 3
Name of production centre Northern Mining Division
Southern Mining Division
Mining Division #5
Production centre classification existing existing existing
Start-up date 1964 1966 1968
Source of ore: � Deposit name Kendyktube Sugraly Sabyrsaj Ketmenchi Severny Bukinai
Yuzhny Bukinai Beshkak, Lyavlyakan,
Tohumbet � Deposit type sandstone sandstone sandstone � Reserves (tU) � Grade (% U)
Mining operation: � Type (OP/UG/ISL) ISL ISL ISL � Size (tU/year) 750 650 900 � Average mining recovery (%) 70 70 70
Processing plant (acid/alkaline): Navoy � Type (IX/SX/AL) � Size (t ore/year)
for ISL (L/day or L/h)
� Average process recovery (%) 99.5
Nominal production capacity (tU/year)
2 300
Plans for expansion
Other remarks

Uzbekistan
343
Ownership structure of the uranium industry
The entire uranium production of the Navoi Mining and Metallurgical Integrated Works (NMMIW) is owned by the government of Uzbekistan.
Employment in the uranium industry
Five towns were constructed to support Uzbekistan’s uranium production activities: Uchkuduk, Zarafshan, Zafarabad, Nurabad and Navoi. Those towns provide the infrastructure, including roads, railway and electricity, required to support a combined population of 500 000 persons. This population is the source of NMMIWs stable and highly skilled work force.
Future production centres
Future uranium production in Uzbekistan will come entirely from ISL operations. There is no information as to the expected lifetime of the operating ISL plants. However, Uzbekistan has reported that the existing production centres will be capable of mining all known deposits. Uzbekistan plans to continue uranium production through 2040 at a rate of up to 3 000-3 100 tU/year. Start of operations at the Severnyi Kanimekh is planned for a near future.
Secondary sources of uranium
Uzbekistan did not and does not deal with the enrichment of depleted uranium.
ENVIRONMENTAL ACTIVITIES AND SOCIO-CULTURAL ISSUES
Environmental protection activity is covered in detail in the last edition of the Red Book.
� Environmental aspects related to uranium resources:
– Ecological conditions in the deposits areas have been adverse before mining operations. Underground waters are characterised by high mineralization content (3-5 mg/l) and high concentrations in sulfate, chlorine, strontium, selenium, iron and manganese. In situ content of radionuclides in water is 5-10 times as much as the concentration limit.
� Environmental aspects related to uranium production:
– Navoi Mining and Metallurgical Integrated Works are changing production method from air-lift to submersible pumps, which reduces atmospheric and soil pollution, equips production holes with devices that prevent solution overflow. In order to reduce underground water contamination in ore-bearing formations, the weak acid leaching method is used where it is possible.
� Environmental aspects related to mine closure:
– Following activities are put into practice at the closure of uranium mining and processing infrastructures:
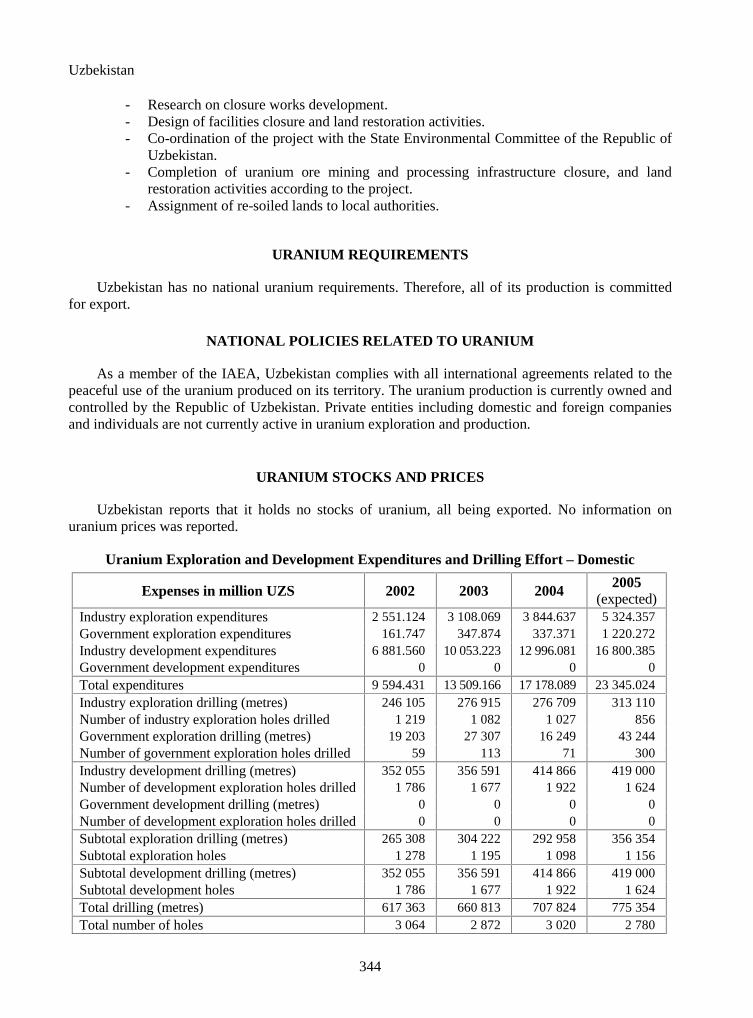
Uzbekistan
344
- Research on closure works development. - Design of facilities closure and land restoration activities. - Co-ordination of the project with the State Environmental Committee of the Republic of
Uzbekistan. - Completion of uranium ore mining and processing infrastructure closure, and land
restoration activities according to the project. - Assignment of re-soiled lands to local authorities.
URANIUM REQUIREMENTS
Uzbekistan has no national uranium requirements. Therefore, all of its production is committed for export.
NATIONAL POLICIES RELATED TO URANIUM
As a member of the IAEA, Uzbekistan complies with all international agreements related to the peaceful use of the uranium produced on its territory. The uranium production is currently owned and controlled by the Republic of Uzbekistan. Private entities including domestic and foreign companies and individuals are not currently active in uranium exploration and production.
URANIUM STOCKS AND PRICES
Uzbekistan reports that it holds no stocks of uranium, all being exported. No information on uranium prices was reported.
Uranium Exploration and Development Expenditures and Drilling Effort – Domestic
Expenses in million UZS 2002 2003 2004 2005 (expected)
Industry exploration expenditures 2 551.124 3 108.069 3 844.637 5 324.357 Government exploration expenditures 161.747 347.874 337.371 1 220.272 Industry development expenditures 6 881.560 10 053.223 12 996.081 16 800.385 Government development expenditures 0 0 0 0 Total expenditures 9 594.431 13 509.166 17 178.089 23 345.024 Industry exploration drilling (metres) 246 105 276 915 276 709 313 110 Number of industry exploration holes drilled 1 219 1 082 1 027 856 Government exploration drilling (metres) 19 203 27 307 16 249 43 244 Number of government exploration holes drilled 59 113 71 300 Industry development drilling (metres) 352 055 356 591 414 866 419 000 Number of development exploration holes drilled 1 786 1 677 1 922 1 624 Government development drilling (metres) 0 0 0 0 Number of development exploration holes drilled 0 0 0 0 Subtotal exploration drilling (metres) 265 308 304 222 292 958 356 354 Subtotal exploration holes 1 278 1 195 1 098 1 156 Subtotal development drilling (metres) 352 055 356 591 414 866 419 000 Subtotal development holes 1 786 1 677 1 922 1 624 Total drilling (metres) 617 363 660 813 707 824 775 354 Total number of holes 3 064 2 872 3 020 2 780

Uzbekistan
345
Reasonably Assured Resources*
(tonnes U)
Production method <USD 40/kgU <USD 80/kgU <USD 130/kgU Recovery factor (%)
Underground mining 0 0 0 Open-pit mining 0 0 0 In situ leaching 64 916 64 916 80 769 70 Heap leaching 20 431 20 431 29 140 70 In-place leaching (stope/block leaching)
0 0 0
Co-product and by-product 0 0 0 Unspecified 0 0 0 Total 85 347 85 347 109 909
* In situ resources.
Reasonably Assured Resources by Deposit Type* (tonnes U)
Deposit type <USD 40/kgU <USD 80/kgU <USD 130/kgU Unconformity-related 0 0 0 Sandstone 64 916 64 916 80 769 Hematite breccia complex 20 431 20 431 29 140 Quartz-pebble conglomerate 0 0 0 Vein 0 0 0 Intrusive 0 0 0 Volcanic and caldera-related 0 0 0 Metasomatite 0 0 0 Other 0 0 0 Total 85 347 85 347 109 909
* In situ resources.
Inferred Resources* (tonnes U)
Production method <USD 40/kgU <USD 80/kgU <USD 130/kgU Recovery factor (%)
Underground mining 0 0 0 Open-pit mining 0 0 0 In situ leaching 28 718 28 718 37 245 70 Heap leaching 15 597 15 597 17 884 70 In-place leaching (stope/block leaching)
0 0 0
Co-product and by-product 0 0 0 Unspecified 0 0 0 Total 44 315 44 315 55 129
* In situ resources.

Uzbekistan
346
Inferred Resources by Deposit Type*
(tonnes U)
Deposit type <USD 40/kgU <USD 80/kgU <USD 130/kgU Unconformity-related 0 0 0 Sandstone 28 718 28 718 37 245 Hematite breccia complex 15 597 15 597 17 884 Quartz-pebble conglomerate 0 0 0 Vein 0 0 0 Intrusive 0 0 0 Volcanic and caldera-related 0 0 0 Metasomatite 0 0 0 Other 0 0 0 Total 44 315 44 315 55 129
* In situ resources.
Prognosticated Resources (tonnes U)
Cost ranges
<USD 80/kgU <USD 130/kgU 56 306 84 969
Speculative Resources (tonnes U)
Cost ranges
<USD 130/kgU Unassigned 0 134 735
Historical Uranium Production (tonnes U in concentrate)
Production method Total
through end of 2001
2002 2003 2004 Total
through end of 2004
2005 (expected)
Open-pit mining1 36 249 0 0 0 36 249 0 Underground mining1 19 719 0 0 0 19 719 0 In situ leaching 41 735 1 859 1 603 2 087 47 284 2 300 Heap leaching 0 0 0 0 0 0 In-place leaching* 0 0 0 0 0 0 Co-product/by-product 0 0 0 0 0 0 U recovered from phosphates
0 0 0 0 0 0
Other methods** 0 0 0 0 0 0 Total 97 703 1 859 1 603 2 087 103 252 2 300
(1) Pre-2002 totals may include uranium recovered by heap and in-place leaching. * Also known as stope leaching or block leaching. ** Includes mine water treatment and environmental restoration.
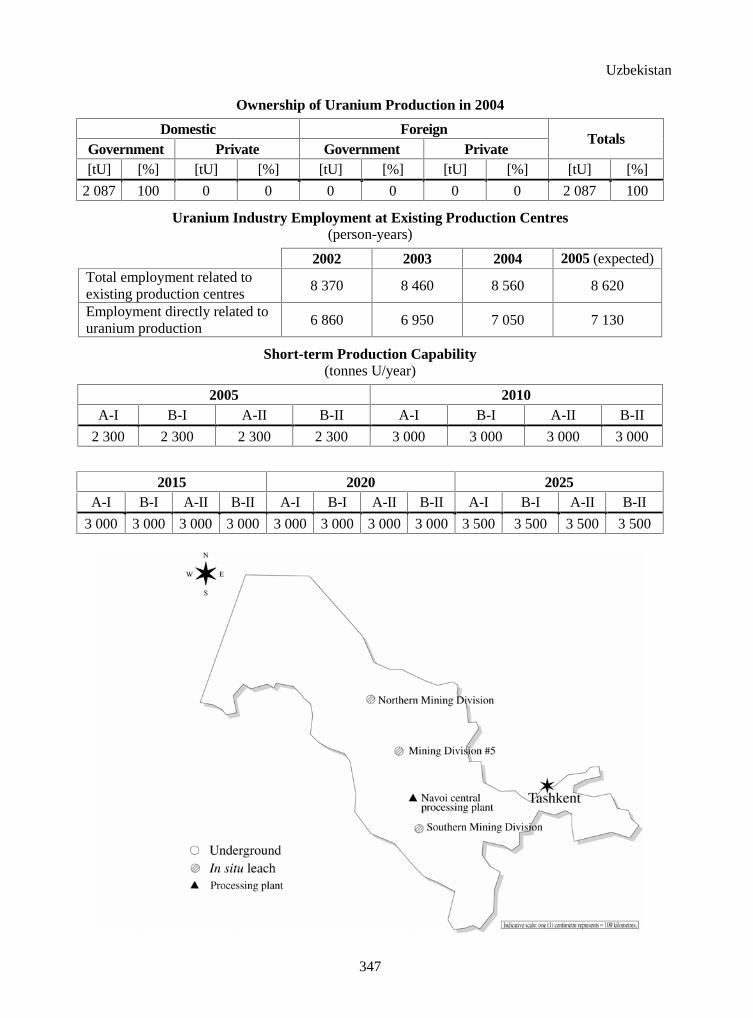
Uzbekistan
347
Ownership of Uranium Production in 2004
Domestic Foreign Government Private Government Private
Totals
[tU] [%] [tU] [%] [tU] [%] [tU] [%] [tU] [%]
2 087 100 0 0 0 0 0 0 2 087 100
Uranium Industry Employment at Existing Production Centres (person-years)
2002 2003 2004 2005 (expected) Total employment related to existing production centres
8 370 8 460 8 560 8 620
Employment directly related to uranium production
6 860 6 950 7 050 7 130
Short-term Production Capability (tonnes U/year)
2005 2010 A-I B-I A-II B-II A-I B-I A-II B-II
2 300 2 300 2 300 2 300 3 000 3 000 3 000 3 000
2015 2020 2025 A-I B-I A-II B-II A-I B-I A-II B-II A-I B-I A-II B-II
3 000 3 000 3 000 3 000 3 000 3 000 3 000 3 000 3 500 3 500 3 500 3 500
Vietnam
348
• Vietnam •
URANIUM EXPLORATION
Historical review
Uranium exploration in selected areas of Vietnam began in 1955. Since 1978, a systematic regional exploration programme has been underway throughout the entire country.
About 330 000 km2, equivalent to almost 100% of the country, have been surveyed at the 1:200 000 scale using surface radiometric methods combined with geological observations. About 103 000 km2 (31% of the country) have been explored at the 1:50 000 scale. Nearly 80 000 km2, or 24% of the country, has been covered by an airborne radiometric/magnetic survey at the 1:25 000 and 1:50 000 scales. Selected occurrences and anomalies have been investigated in more detail by 75 800 m of drilling and by underground exploration workings.
Recent and ongoing uranium exploration and mine development activities
Uranium exploration is conducted by the Geological Division for Radioactive and Rare Elements and the Geophysical Division of the Department of Geology and Minerals of the Ministry of Industry. From 1997 through 2002, exploration was concentrated on evaluation of the uranium potential of the Nong Son basin, Quang Nam province. Exploration activities were concentrated on three projects: (1) evaluation of the An Diem deposit hosted in sandstone; (2) exploration of the Pa Rong area and (3) exploration of the Dong Nam Ben Giang area in the South-East Ben Giang-Nong Son basin.
The relevant Table lists exploration expenditures and drilling statistics.
URANIUM RESOURCES
Identified resources (RAR & Inferred)
Vietnam reports RAR recoverable at <USD 130/kgU of 1 337 tU, as in situ resources. Inferred resources of 6 744 tU are reported in the Khe Hoa-Khe Cao deposit, and of 500 tU at an average grade of 0.034% U in the An Diem deposit, Nong Son basin. A total of 7 244 tU of Inferred resources, recoverable at a cost of <USD 130/kgU, is reported, including 1 091 tU recoverable at a cost of <USD 80/kgU. No mining method is specified. An overall recovery of 75% of the uranium is expected.

Vietnam
349
Undiscovered resources (Prognosticated & SR)
Prognosticated resources have increased by 1 000 tU (An Diem area) in the <USD 130/kgU category compared to the 2001 Red Book. Prognosticated resources recoverable at costs <USD 130/kgU are located mainly in the Tabhing occurrence of the Nong Son basin. Speculative Resources are the same as reported in the 2001 Red Book.
Unconventional and by-product resources
Unconventional resources are reported occurring in coal deposits of the Nong Son basin, rare earth deposits, the sedimentary Binh Duong phosphate deposit and the Tien An graphite deposit.
URANIUM PRODUCTION
Vietnam is not a uranium producing country.
ENVIRONMENTAL ACTIVITIES AND SOCIO-CULTURAL ISSUES
Environmental monitoring is carried out to assess the environmental impacts resulting from exploration activities.
URANIUM REQUIREMENTS
The government is planning to construct a nuclear power plant before 2015.
NATIONAL POLICIES RELATING TO URANIUM
Vietnam is a country with few fossil fuels. Therefore, in its energy policy for the 21st century, the government includes nuclear power as one of the alternatives. However, no long-term plans for developing a domestic uranium supply have been established. Vietnam has no uranium stocks and reported no information on uranium prices.

Vietnam
350
Uranium Exploration and Development Expenditures and Drilling Effort – Domestic
Expenses in million VND 2002 2003 2004 2005 (expected)
Industry exploration expenditures 0 0 NA NA
Government exploration expenditures 2 000 15 000 700 NA
Industry development expenditures 0 0 0 0
Government development expenditures 0 0 0 0
Total expenditures 2 000 15 000 700 NA
Industry exploration drilling (metres) 0 0 0 0
Number of industry exploration holes drilled 0 0 0 0
Government exploration drilling (metres) 900 1 500 600 NA
Number of government exploration holes drilled 11 20 8 NA
Industry development drilling (metres) 0 0 0 0
Number of development exploration holes drilled 0 0 0 0
Government development drilling (metres) 0 0 0 0
Number of development exploration holes drilled 0 0 0 0
Subtotal exploration drilling (metres) 900 1 500 600 NA
Subtotal exploration holes 11 20 8 NA
Subtotal development drilling (metres) 0 0 0 0
Subtotal development holes 0 0 0 0
Total drilling (metres) 900 1 500 600 NA
Total number of holes 11 20 8 NA
Reasonably Assured Resources* (tonnes U)
Production method <USD 40/kgU <USD 80/kgU <USD 130/kgU Recovery
factor (%)
Underground mining 0 0 0
Open-pit mining 0 0 0
In situ leaching 0 0 0
Heap leaching 0 0 0
In-place leaching (stope/block leaching)
0 0 0
Co-product and by-product 0 0 0
Unspecified NA NA 1 337
Total NA NA 1 337
* In situ resources.

Vietnam
351
Inferred Resources* (tonnes U)
Production method <USD 40/kgU <USD 80/kgU <USD 130/kgU Recovery
factor (%)
Underground mining 0 0 0
Open-pit mining 0 0 0
In situ leaching 0 0 0
Heap leaching 0 0 0
In-place leaching (stope/block leaching)
0 0 0
Co-product and by-product 0 0 0
Unspecified NA 1 091 7 244
Total NA 1 091 7 244
* In situ resources.
Prognosticated Resources (tonnes U)
Cost ranges
<USD 80/kgU <USD 130/kgU
0 7 860
Speculative Resources (tonnes U)
Cost ranges
<USD 130/kgU Unassigned
100 000 130 000
353
Appendix 1
MEMBERS OF THE JOINT NEA-IAEA URANIUM GROUP
Argentina Mr. A. CASTILLO Comisión Nacional de Energía Atómica Unidad de Proyectos Especiales de Suministros Nucleares, Buenos Aires
Armenia Mr. A. GEVORGYAN Ministry of Energy, Department of Atomic Energy, Yerevan
Australia Mr. I. LAMBERT (Vice-Chair) Mr. A. McKAY
Geoscience Australia, Canberra
Belgium Ms. F. RENNEBOOG Synatom, Brussels
Brazil Ms. E. PONTEDEIRO Comissão Nacional de Energia Nuclear (CNEN), Rio de Janeiro
Mr. L. F. da SILVA Indústrias Nucleares do Brasil INB-S/A, Rio de Janeiro
Canada Mr. R. VANCE (Chair) Uranium Developments, Energy Resources Branch, Natural Resources Canada, Ottawa
China Mr. S. GAO Bureau of Mining and Metallurgy China National Nuclear Corporation (CNNC), Beijing
Czech Republic Mr. P. VOSTAREK DIAMO s.p. Stráz pod Ralskem
Egypt Mr. A.B. SALMAN Nuclear Materials Authority (NMA) El-Maadi, Cairo
Finland Mr. O. AIKAS Department of Economic Geology Geological Survey of Finland, Espoo
France Mr. P. ARONDEL Commissariat à l’énergie atomique Centre d’études de Saclay
Mr. G. CAPUS (Vice-Chair) COGEMA, Vélizy
Germany Mr. U. SCHWARZ-SCHAMPERA
Bundesanstalt für Geowissenschaften und Rohstoffe, Hannover
Hungary Mr. G. ÉRDI-KRAUSZ Mecsekuran Ltd., Pécs
India Mr. R. M. SINHA Atomic Minerals Directorate for Exploration and Research, Mumbai
Iran, Islamic Republic of
Mr. A. R. ASHTIANI Mr. S.V. KALANTARI
Atomic Energy Organisation of Iran, Tehran

354
Japan Mr. M. GOTO Ministry of Economy, Trade and Industry, Tokyo
Mr. T. KOBAYASHI Office of Strategy Research, Japan Atomic Energy Agency (JAEA), Tokai-mura
Jordan Mr. A. SAYMEH Geophysics Division, Natural Resources Authority, Amman
Kazakhstan Mr. V. PANTELEYEV (Vice-Chair)
National Atomic Company “KAZATOMPROM”, Almaty
Lithuania Mr. K. ZILYS State Nuclear Power Safety Inspectorate, Vilnius
Namibia Mr. A. IILENDE Ministry of Mines and Energy, Windhoek
Netherlands Mrs. M. HOEDEMAKERS Ministry of Economic Affairs, The Hague
Niger Mr. A. OUSMANE Division of Mines, Niamey
Portugal Mr. L. R. COSTA Instituto Geológico e Mineiro, Lisbon
Romania Mr. P.D. GEORGESCU R&D Institute for Rare and Radioactive Metals – ICPMRR S.A., Bucharest
Mr. A.V. BOITSOV (Vice-Chair) JSC TVEL, Moscow Russian Federation
Mr. A.V. TARKHANOV All-Russian Institute of Chemical Technology, Ministry of Atomic Energy, Moscow
Slovak Republic Mr. M. LASCEK Slovenske elecktrarne, a.s., Bratislava
South Africa Mr. P. WIPPLINGER Council for Geoscience, Pretoria
Spain Mr. F. TARIN Enusa Industrias Avanzadas, S.A.
Switzerland Mr. G. KLAIBER Nordostschweizerische (NOK) Kraftwerke AG, Baden
Ukraine Mr. A. BAKARZHIYEV Mr. Y. BAKARZHIYEV
The State Geological Enterprise “Kirovgeology”, Kiev
United Kingdom Mr. K. WELHAM Rio Tinto plc, London
Mr. Craig JONES UK Delegation to the OECD
Ms. S. SITZER
Energy Information Administration US Department of Energy, Washington
United States
Mr. J. OTTON US Geological Survey, Denver
Uzbekistan Mr. H. HALMURZAEV State Geological Enterprise “Kyzyltepageologia”, Tashkent
European Commission
Mr. J. VIHANTA Mr. J. G. CAPDEVILA
Euratom Supply Agency, Brussels
355
IAEA Mr. B. SOYER (Scientific Secretary)
Division of Nuclear Fuel Cycle and Waste Technology, Vienna
OECD/NEA Mr. R. PRICE (Scientific Secretary)
Nuclear Development Division, Paris


357
Appendix 2
LIST OF REPORTING ORGANISATIONS AND CONTACT PERSONS
Algeria Commissariat à l’énergie atomique (COMENA), 02, Boulevard Franz Fanon, BP 399, Alger-Gare, 16000, Alger
Argentina Comisión Nacional de Energía Atómica, Unidad de Proyectos Especiales de Suministros Nucleares, Avenida del Libertador 8250, 1429 Buenos Aires Contact person: Alberto Castillo
Armenia Ministry of Energy, Deptartment of Atomic Energy, Government House, 2 Republic Square, 375010 Yerevan Contact person: Aram Gevorgyan
Australia Department of Industry, Tourism and Resources, Resources Development Branch GPO Box 9839, Canberra, ACT 2601 Contact person: Aden D McKay
Belgium Ministère des Affaires économiques, Administration de l'énergie, Division des applications nucléaires, 16 Boulevard du Roi Albert II, B-1000 Bruxelles Contact person: Françoise Renneboog
Brazil Indústrias Nucleares do Brasil S/A, INB Mineral Resources Director, Rua Mena Barreto, 161, 4 andar-Botafogo, Rio de Janeiro, RJ-Brasil-22271-100 Contact person: Luiz Filipe da Silva
Canada Natural Resources Canada, Uranium and Radioactive Waste Division, Electricity Resources Branch, 580 Booth Street, Ottawa, Ontario K1A OE8 Contact person: Robert Vance
Chile Comisión Chilena de Energía Nuclear, Departamento de Materiales Nucleares, Unidad de Geologia Y Mineria, Centro Nuclear Lo Aguirre, Ruta 68, km 28 Region Metropolitana Contact person: Heriberto Fortín
China China Atomic Energy Authority, Division of Nuclear Affairs and International Organisations, A8, Fuchenglu, Haidian District, Beijing 100037 Contact person: Xiu Binglin
Czech Republic DIAMO s.p., Máchova 201, 471 27 Stráz pod Ralskem. C ��� ������ ���� � ���� ����� ������� ������ �������� ��� !� " ���� � Contact persons: Pavel Vostarek
Denmark GEUS, Danmarks OG Gronlands, Geologiske Undersogelse, Miljomministeriet, Ostervoldgade 10, 1350 Kobenhavn K Contact person: Karsten Secher
Egypt Nuclear Materials Authority, P.O. Box 530, El Maadi, Cairo Contact person: Hamdy S. Sadek
Estonia Estonian Radiation Protection Centre, Kopli 76, 10416 Tallinn Contact person: Iige Maalmann

358
Finland Ministry of Trade and Industry, Energy Department, P.O. Box 32, FIN-00023 Helsinki Contact person: Olli Aikas
France Commissariat à l'énergie atomique, 31-33, rue de la Fédération, F-75752 Paris Cedex 15 Contact person: Patrick Arondel
Gabon Ministère des Mines, de l’Énergie, du Pétrole et des Ressources hydrauliques, B.P. 874, Libreville
Germany Bundesanstalt für Geowissenschaften und Rohstoffe, Stilleweg 2, D-30657 Hannover Contact person: Ulrich Schwarz-Schampera
Hungary Mecsekurc Environmental Co., H-7633 Pécs, Esztergar L.u. 19 Contact person: Gabor Erdi-Krausz
India Atomic Minerals Directorate for Exploration and Research, 1-10-153-156, Begumpet, Hyderabad 500 016, Andhra Pradesh Contact person: Ramendra Mohan Sinha
Indonesia National Nuclear Energy Agency (BATAN), Center for Development of Nuclear Ore and Geology, Jln. Cinere Pasar Jumat, P.O. Box 1375 JKS, Jakarta 12013 Contact person: Achmad Sarwiyana Sastratenaya
Iran, Islamic Rep. of Atomic Energy Organisation of Iran, Nuclear Fuel Production Deputy, Exploration and Mining Affairs, P.O. Box 14155/1339, Tehran Contact person: Abbas Rezaee Ashtiani
Japan Ministry of Economy, Trade and Industry, 3-1 Kasumigaseki, 1-chome, Chiyoda-ku, Tokyo 100 Contact person: Masanobu Goto
Jordan Natural Resources Authority, P.O. Box 7, Amman Contact person: Allam Saymeh
Kazakhstan National Atomic Company “Kazatoprom”, 168 Bogenbai batyr Street, Almaty, 480012 Contact person: Vladimir Panteleyev
Korea, Rep. of Ministry of Science and Technology, Atomic Energy International Co-operation Division, Government Complex, Gwachun, Kyunggi-Do 427-715 Contact person: Soon-Jung Hong
Lithuania State Nuclear Power Safety Inspectorate (VATESI), Nuclear Material Control Department, Sermuksniu 3, LT-2600 Vilnius Contact person: Marius Davainis
Namibia Ministry of Mines and Energy, Directorate of Mines, P/Bag 13297, Windhoek Contact person: Abraham Iilende
Niger Ministère des Mines et de l’Énergie, B.P. 11700, Niamey Contact person: Massalabi Oumarou
Peru Instituto Peruano de Energia Nuclear, Direccion General de Seguridad Radiologica/Direccion de Aplicaciones, Av Canada, 1470, San Borja, Lima Contact person: Jacinto Valencia Herrera

359
Philippines Philippine Nuclear Research Institute, Commonwealth Avenue, Diliman, Quezon City 1101 Contact person: Christine Petrache
Portugal Ministério da Economia, Instituto Geológico e Mineiro, 38 Rua Almirante Barroso, P-1000 Lisbon Contact person: Luis Rodrigues Costa
Russian Federation Joint Stock Company TVEL, Ministry of Atomic Energy of the Russian Federation, Bolshaya Ogdynka 24/26, Moscow, 119017 Contact person: Alexander Boitsov
Slovak Republic Slovenské Electrárne, Department for Operation of NPP, Hranicna 12, 82736 Bratislava Contact person: Milos Lacsek
Slovenia Rudnik Zirovski Vrh, d.o.o., Todraz 1, 4224 Gorenja vas Contact person: Matej Pozun
South Africa Council for Geoscience, 280 Pretoria Street, Silverton, Pretoria Contact person: Ria Putter
Spain ENUSA Industrias Avanzadas, S. A., Santiago Rusiñol, 12, 28040 Madrid Contact person: Francisco Tarin
Sweden Vattenfall Fuel, Jamtlandsgatan 99, SE-162 87 Stockholm Contact person: Ali Etemad
Switzerland Nordostschweizerische Kraftwerke (NOK), Parkstrasse 23, CH-5401 Baden Contact person: Guido Klaiber
Turkey Turkish Atomic Energy Authority, Eskisher Yolu No. 9, 06530 Ankara Contact person: Sema Zararsiz
Ukraine SGE Kirovgeology, 8/9 Kikvidze str., Kiev 01103, Ukraine. Contact person: Yuri A. Bakarzhiyev Department of Nuclear Energy, Ministry of Fuel Supply and Energy of Ukraine, 34 Khreschatyk Street, Kyiv 01601, MCP Contact person: Nikolay A. Shteinberg
United Kingdom Department of Trade and Industry, 1 Victoria Street, London SW1H OET Contact person: John Lownds
United States Energy Information Administration, Coal, Nuclear, Electric and Alternate Fuels (EI- 50), U.S. Department of Energy, 1000 Independence Avenue, SW, Washington, D.C. 20585 Contact person: Scott Sitzer
Uzbekistan The State Committee of the Republic of Uzbekistan on Geology and Mineral Resources, 11 Shevchenko st., 700060 GSP, Tashkent Contact person: N. Khalmurzaev
Vietnam Geological Division for Radioactive and Rare Elements, Department of Geology and Minerals of Vietnam, Ministry of Natural Resources and Environment, Xuan Phuong, Tu Liem, Hanoi Contact person: Nguyen Quang Hung

361
Appendix 3
GLOSSARY OF DEFINITIONS AND TERMINOLOGY
UNITS
Metric units are used in all tabulations and statements. Resources and production quantities are expressed in terms of tonnes (t) contained uranium (U) rather than uranium oxide (U3O8).
1 short ton U3O8 = 0.769 tU
1 percent U3O8 = 0.848 percent U
USD/lb U3O8 = USD 2.6/kg U
1 tonne = 1 metric ton
RESOURCE TERMINOLOGY
Resource estimates are divided into separate categories reflecting different levels of confidence in the quantities reported. The resources are further separated into categories based on the cost of production.
a) Definitions of resource categories
Uranium resources are broadly classified as either conventional or unconventional. Conventional resources are those that have an established history of production where uranium is, either, a primary product, co-product or an important by-product (e.g., from the mining of copper and gold). Very low-grade resources or those from which uranium is only recoverable as a minor by-product are considered unconventional resources.
Conventional resources are further divided, according to different confidence levels of occurrence, into four categories. The correlation between these resource categories and those used in selected national resource classification systems is shown in Figure A.
Reasonably Assured Resources (RAR) refers to uranium that occurs in known mineral deposits of delineated size, grade and configuration such that the quantities which could be recovered within the given production cost ranges with currently proven mining and processing technology, can be specified. Estimates of tonnage and grade are based on specific sample data and measurements of the deposits and on knowledge of deposit characteristics. Reasonably Assured Resources have a high assurance of existence. Unless otherwise noted RAR are expressed in terms of quantities of uranium recoverable from mineable ore (see Recoverable Resources).

362
Inferred Resources refers to uranium, in addition to RAR, that is inferred to occur based on direct geological evidence, in extensions of well-explored deposits, or in deposits in which geological continuity has been established but where specific data, including measurements of the deposits, and knowledge of the deposit’s characteristics are considered to be inadequate to classify the resource as RAR. Estimates of tonnage, grade and cost of further delineation and recovery are based on such sampling as is available and on knowledge of the deposit characteristics as determined in the best known parts of the deposit or in similar deposits. Less reliance can be placed on the estimates in this category than on those for RAR. Unless otherwise noted, Inferred Resources are expressed in terms of quantities of uranium recoverable from mineable ore (see Recoverable Resources).
Figure A. Approximate Correlation of Terms used in Major Resources Classification Systems
IDENTIFIED RESOURCES UNDISCOVERED RESOURCES
NEA/IAEA REASONABLY ASSURED INFERRED PROGNOSTICATED SPECULATIVE
DEMONSTRATED
Australia MEASURED INDICATED
INFERRED UNDISCOVERED
Canada (NRCan) MEASURED INDICATED INFERRED PROGNOSTICATED SPECULATIVE
United States (DOE) REASONABLY ASSURED ESTIMATED ADDITIONAL SPECULATIVE
Russian Federation, Kazakhstan, Ukraine, Uzbekistan
A + B
C 1
C 2
P1
P2
P3
UNFC1 G1 G1 + G2 G3 G4
The terms illustrated are not strictly comparable as the criteria used in the various systems are not identical. “Grey zones” in correlation are therefore unavoidable, particularly as the resources become less assured. Nonetheless, the chart presents a reasonable approximation of the comparability of terms.
1. UNFC correlation with NEA/IAEA and national classification systems is still under consideration.

363
Prognosticated Resources refers to uranium, in addition to Inferred Resources, that is expected to occur in deposits for which the evidence is mainly indirect and which are believed to exist in well-defined geological trends or areas of mineralization with known deposits. Estimates of tonnage, grade and cost of discovery, delineation and recovery are based primarily on knowledge of deposit characteristics in known deposits within the respective trends or areas and on such sampling, geological, geophysical or geochemical evidence as may be available. Less reliance can be placed on the estimates in this category than on those for Inferred Resources. Prognosticated Resources are normally expressed in terms of uranium contained in mineable ore, i.e., in situ quantities.
Speculative Resources (SR) refers to uranium, in addition to Prognosticated Resources, that is thought to exist, mostly on the basis of indirect evidence and geological extrapolations, in deposits discoverable with existing exploration techniques. The location of deposits envisaged in this category could generally be specified only as being somewhere within a given region or geological trend. As the term implies, the existence and size of such resources are speculative. SR are normally expressed in terms of uranium contained in mineable ore, i.e., in situ quantities.
b) Cost categories
The cost categories, in United States dollars (USD), used in this report are defined as: <USD 40/kgU, <USD 80/kgU, and <USD 130/kgU. All resource categories are defined in terms of costs of uranium recovered at the ore processing plant
NOTE: It is not intended that the cost categories should follow fluctuations in market conditions.
Conversion of costs from other currencies into USD is done using an average exchange rate for the month of June in that year except for the projected costs for the year of the report, which uses the exchange rate of 1 January 2003 (Appendix 7).
When estimating the cost of production for assigning resources within these cost categories, account has been taken of the following costs:
� The direct costs of mining, transporting and processing the uranium ore.
� The costs of associated environmental and waste management during and after mining.
� The costs of maintaining non-operating production units where applicable.
� In the case of ongoing projects, those capital costs that remain non-amortised.
� The capital cost of providing new production units where applicable, including the cost of financing.
� Indirect costs such as office overheads, taxes and royalties where applicable.
� Future exploration and development costs wherever required for further ore delineation to the stage where it is ready to be mined.
� Sunk costs were not normally taken into consideration.
c) Relationship between resource categories
Figure B illustrates the inter-relationship between the different resource categories. The horizontal axis expresses the level of assurance about the actual existence of a given tonnage based on varying degrees of geologic knowledge while the vertical axis expresses the economic feasibility of exploitation by the division into cost categories.

364 Fi
gure
B.
NE
A/I
AE
A C
lass
ific
atio
n Sc
hem
e fo
r U
rani
um R
esou
rces
<USD 40/kgU
RE
ASO
NA
BL
Y A
SSU
RE
D
RE
SOU
RC
ES
INFE
RR
ED
RE
SOU
RC
ES
USD 40-80/kgU
INFE
RR
ED
RE
SOU
RC
ES
USD 80-130/kgU
INFE
RR
ED
RE
SOU
RC
ES
PR
OG
NO
STIC
AT
ED
R
ESO
UR
CE
S
D
ecre
asin
g co
nfid
ence
in e
stim
ates
IDE
NT
IFIE
D R
ESO
UR
CE
SU
ND
ISC
OV
ER
ED
RE
SOU
RC
ES
PRO
GN
OST
ICA
TE
D
RE
SOU
RC
ES
Recoverable at costs
RE
ASO
NA
BL
Y
ASS
UR
ED
R
ESO
UR
CE
S
SPE
CU
LA
TIV
E
RE
SOU
RC
ES
Decreasing economic attractiveness
RE
ASO
NA
BL
Y
ASS
UR
ED
R
ESO
UR
CE
S

365
d) Recoverable resources
RAR and Inferred Resource estimates are expressed in terms of recoverable tonnes of uranium, i.e. quantities of uranium recoverable from mineable ore, as opposed to quantities contained in mineable ore, or quantities in situ, i.e., not taking into account mining and milling losses. Therefore both expected mining and ore processing losses have been deducted in most cases. If a country reports its resources as in situ and the country does not provide a recovery factor, the Secretariat assigns a recovery factor to those resources based on geology and projected mining and processing methods to determine recoverable resources. The recovery factors that have been applied are:
Mining and milling method Overall recovery factor (%)
Open-pit mining with conventional milling
Underground mining with conventional milling
ISL (acid)
ISL (alkaline)
Heap leaching
Block and stope leaching
Co-product or by-product
Unspecified method
81
77
75
70
68
75
66
75
SECONDARY SOURCES OF URANIUM TERMINOLOGY
a) Mixed Oxide Fuel (MOX): MOX is the abbreviation for a fuel for nuclear power plants that consists of a mixture of uranium oxide and plutonium oxide. Current practice is to use a mixture of depleted uranium oxide and plutonium oxide.
b) Depleted uranium: Uranium where the 235U assay is below the naturally occurring 0.7110%. (Natural uranium is a mixture of three isotopes, uranium 238 – accounting for 99.2836%, uranium 235 – 0.7110%, and uranium 234 – 0.0054%). Depleted uranium is a by-product of the enrichment process, where enriched uranium is produced from initial natural uranium feed material.
PRODUCTION TERMINOLOGY2
a) Production centres: A production centre, as referred to in this report, is a production unit consisting of one or more ore processing plants, one or more associated mines and the uranium resources that are tributary to them. For the purpose of describing production centres, they have been divided into four classes, as follows:
2. IAEA (1984), Manual on the Projection of Uranium Production Capability, General Guidelines, Technical
Report Series No. 238, Vienna, Austria.

366
i) Existing production centres are those that currently exist in operational condition and include those plants which are closed down but which could be readily brought back into operation.
ii) Committed production centres are those that are either under construction or are firmly committed for construction.
iii) Planned production centres are those for which feasibility studies are either completed or under way, but for which construction commitments have not yet been made. This class also includes those plants that are closed which would require substantial expenditures to bring them back into operation.
iv) Prospective production centres are those that could be supported by tributary RAR and Inferred, i.e., “Identified resources”, but for which construction plans have not yet been made.
b) Production capacity and capability
Production capacity: Denotes the nominal level of output, based on the design of the plant and facilities over an extended period, under normal commercial operating practices.
Production capability: Refers to an estimate of the level of production that could be practically and realistically achieved under favourable circumstances from the plant and facilities at any of the types of production centres described above, given the nature of the resources tributary to them. Projections of production capability are supported only by RAR and/or EAR-I. The projection is presented based on those resources recoverable at costs <USD 80/kgU.
Production: Denotes the amount of uranium, in tonnes U contained in concentrate, output by an ore processing plant or production centre, that is, with milling losses deducted.
c) Mining and milling
In situ leaching (ISL): The extraction of uranium from sandstone using chemical solutions and the recovery of uranium at the surface. ISL extraction is conducted by injecting a suitable uranium-dissolving leach solution (acid or alkaline) into the ore zone below the water table thereby oxidising, complexing, and mobilising the uranium; then recovering the pregnant solutions through production wells, and finally pumping the uranium bearing solution to the surface for further processing.
Heap leaching (HL): Heaps of ore are formed over a collecting system underlain by an impervious membrane. Dilute sulphuric acid solutions are distributed over the top surface of the ore. As the solutions seep down through the heap, they dissolve a significant (50-75%) amount of the uranium in the ore. The uranium is recovered from the heap leach product liquor by ion exchange or solvent extraction.
In place leaching (IPL): involves leaching of broken ore without removing it from an underground mine. This is also sometimes referred to as stope leaching or block leaching.
Co-product: Uranium is a co-product when it is one of two commodities that must be produced to make a mine economic. Both commodities influence output, for example, uranium and copper are co-produced at Olympic Dam in Australia. Co-product uranium is produced using either the open-pit or underground mining methods.

367
By-product: Uranium is considered a by-product when it is a secondary or additional product. By-product uranium can be produced in association with a main product or with co-products, e.g., uranium recovered from the Palabora copper mining operations in South Africa. By-product uranium is produced using either the open-pit or underground mining methods.
Uranium from phosphates: Uranium has been recovered as a by-product of phosphoric acid production. Uranium is separated from phosphoric acid by a solvent extraction process. The most frequently used reagent is a synergetic mixture of Tri-m-Octyl Phosphine Oxide (TOPO) and Di 2-Ethylhexyl Phosphoric Acid (DEPA)
Ion exchange (IX): Reversible exchange of ions contained in a host material for different ions in solution without destruction of the host material or disturbance of electrical neutrality. The process is accomplished by diffusion and occurs typically in crystals possessing – one or two – dimensional channels where ions are weakly bonded. It also occurs in resins consisting of three-dimensional hydrocarbon networks to which are attached many ionisable groups. Ion exchange is used for recovering uranium from leaching solutions.
Solvent extraction (SX): A method of separation in which a generally aqueous solution is mixed with an immiscible solvent to transfer one or more components into the solvent. This method is used to recover uranium from leaching solutions.
DEMAND TERMINOLOGY
a) Reactor-related requirements: Refers to natural uranium acquisitions not necessarily consumption during a calendar year.
ENVIRONMENTAL TERMINOLOGY3
a) Close-out: In the context of uranium mill tailings impoundment, the operational, regulatory and administrative actions required to place a tailings impoundment into long-term conditions such that little or no future surveillance and maintenance are required.
b) Decommissioning: Actions taken at the end of the operating life of a uranium mill or other uranium facility in retiring it from service with adequate regard for the health and safety of workers and members of the public and protection of the environment. The time period to achieve decommissioning may range from a few to several hundred years.
c) Decontamination: The removal or reduction of radioactive or toxic chemical contamination using physical, chemical, or biological processes.
d) Dismantling: The disassembly and removal of any structure, system or component during decommissioning. Dismantling may be performed immediately after permanent retirement of a mine or mill facility or may be deferred.
e) Environmental restoration: Cleanup and restoration, according to predefined criteria, of sites contaminated with radioactive and/or hazardous substances during past uranium production activities.
3. Definitions based on those published in OECD (2002), Environmental Remediation of Uranium Production
Facilities, Paris.

368
f) Environmental impact statement: A set of documents recording the results of an evaluation of the physical, ecological, cultural and socio-economic effects of a planned installation, facility, or technology.
g) Groundwater restoration: The process of returning affected groundwater to acceptable quality and quantity levels for future use.
h) Reclamation: The process of restoring a site to predefined conditions, which allows new uses.
i) Restricted release (or use): A designation, by the regulatory body of a country, that restricts the release or use of equipment, buildings, materials or the site because of its potential radiological or other hazards.
j) Tailings: The remaining portion of a metal-bearing ore consisting of finely ground rock and process liquids after some or all of the metal, such as uranium, has been extracted.
k) Tailings impoundment: A structure in which the tailings are deposited to prevent their release into the environment.
l) Unrestricted release (or use): A designation, by the regulatory body of a country, that enables the release or use of equipment, buildings, materials or the site without any restriction.
GEOLOGICAL TERMINOLOGY
a) Uranium occurrence: A naturally occurring, anomalous concentration of uranium.
b) Uranium deposit: A mass of naturally occurring mineral from which uranium could be exploited at present or in the future.
c) Geologic types of uranium deposits4
Uranium resources can be assigned on the basis of their geological setting to the following categories of uranium ore deposit types (arranged according to their approximate economic significance):
1. Unconformity-related deposits. 2. Sandstone deposits. 3. Hematite breccia complex deposits. 4. Quartz-pebble conglomerate deposits. 5. Vein deposits. 6. Intrusive deposits. 7. Volcanic and caldera-related deposits.
8. Metasomatite deposits. 9. Surficial deposits.
10. Collapse breccia pipe deposits. 11. Phosphorite deposits. 12. Other types of deposits. 13. Rock types with elevated uranium content.
4. This classification of the geological types of uranium deposits was developed by the IAEA in 1988-89 and
updated for this edition of the Red Book.

369
1. Unconformity-related deposits: Unconformity-related deposits are associated with and occur immediately below and above an unconformable contact that separates a crystalline basement intensively altered from overlying clastic sediments of either Proterozoic or Phanerozoic age.
The unconformity-related deposits include the following sub-types:
� Unconformity contact i. Fracture bound deposits occur in metasediments immediately below the unconformity.
Mineralization is monometallic and of medium grade. Examples include Rabbit Lake and Dominique Peter in the Athabasca Basin, Canada.
ii. Clay-bound deposits occur associated with clay at the base of the sedimentary cover directly above the unconformity. Mineralization is commonly polymetallic and of high to very high grade. An example is Cigar Lake in the Athabasca Basin, Canada
� Sub-unconformity-post-metamorphic deposits Deposits are strata-structure bound in metasediments below the unconformity on which clastic sediments rest. These deposits can have large resources, at low to medium grade. Examples are Jabiluka and Ranger in Australia.
2. Sandstone deposits: Sandstone uranium deposits occur in medium to coarse-grained sandstones deposited in a continental fluvial or marginal marine sedimentary environment. Uranium is precipitated under reducing conditions caused by a variety of reducing agents within the sandstone, for example, carbonaceous material, sulphides (pyrite), hydrocarbons and ferro-magnesium minerals (chlorite), etc. Sandstone uranium deposits can be divided into four main sub-types:
� Roll-front deposits: The mineralised zones are convex down the hydrologic gradient. They display diffuse boundaries with reduced sandstone on the down-gradient side and sharp contacts with oxidised sandstone on the up-gradient side. The mineralised zones are elongate and sinuous approximately parallel to the strike, and perpendicular to the direction of deposition and groundwater flow. Resources can range from a few hundred tonnes to several thousands of tonnes of uranium, at grades averaging 0.05-0.25%. Examples are Moynkum, Inkay and Mynkuduk (Kazakhstan); Crow Butte and Smith Ranch (United States) and Bukinay, Sugraly and Uchkuduk (Uzbekistan).
� Tabular deposits consist of uranium matrix impregnations that form irregularly shaped lenticular masses within reduced sediments. The mineralised zones are largely oriented parallel to the depositional trend. Individual deposits can contain several hundreds of tonnes up to 150 000 tonnes of uranium, at average grades ranging from 0.05-0.5%, occasionally up to 1%. Examples of deposits include Westmoreland (Australia), Nuhetting (China), Hamr-Stráz (Czech Republic), Akouta, Arlit, Imouraren (Niger) and Colorado Plateau (United States).
� Basal channel deposits: Paleodrainage systems consist of several hundred metres wide channels filled with thick permeable alluvial-fluvial sediments. Here, the uranium is predominantly associated with detrital plant debris in ore bodies that display, in a plan-view, an elongated lens or ribbon-like configuration and, in a section-view, a lenticular or, more rarely, a roll shape. Individual deposits can range from several hundreds to 20 000 tonnes uranium, at grades ranging from 0.01-3%. Examples are the deposits of Dalmatovskoye (Transural Region), Malinovskoye (West Siberia), Khiagdinskoye (Vitim district) in Russia and Beverley in Australia.

370
� Tectonic/lithologic deposits occur in sandstone related to a permeable zone. Uranium is precipitated in open zones related to tectonic extension. Individual deposits contain a few hundred tonnes up to 5 000 tonnes of uranium at average grades ranging from 0.1-0.5%. Examples include the deposits of Mas Laveyre (France) and Mikouloungou (Gabon).
3. Hematite breccia complex deposits: Deposits of this group occur in hematite-rich breccias and contain uranium in association with copper, gold, silver and rare earths. The main representative of this type of deposit is the Olympic Dam deposit in South Australia. Significant deposits and prospects of this type occur in the same region, including Prominent Hill, Wirrda Well, Acropolis and Oak Dam as well as some younger breccia-hosted deposits in the Mount Painter area.
4. Quartz-pebble conglomerate deposits: Detrital uranium oxide ores are found in quartz-pebble conglomerates deposited as basal units in fluvial to lacustrine braided stream systems older than 2.3-2.4 Ga. The conglomerate matrix is pyritiferous, and gold, as well as other oxide and sulphide detrital minerals are often present in minor amounts. Examples include deposits found in the Witwatersrand Basin where uranium is mined as a by-product of gold. Uranium deposits of this type were mined in the Blind River/Elliot Lake area of Canada.
5. Vein deposits: In vein deposits, the major part of the mineralization fills fractures with highly variable thickness, but generally important extension along strike. The veins consist mainly of gangue material (e.g. carbonates, quartz) and ore material, mainly pitchblende. Typical examples range from the thick and massive pitchblende veins of Pribram (Czech Republic), Schlema-Alberoda (Germany) and Shinkolobwe (Democratic Republic of Congo), to the stockworks and episyenite columns of Bernardan (France) and Gunnar (Canada), to the narrow cracks in granite or metamorphic rocks, also filled with pitchblende of Mina Fe (Spain) and Singhbhum (India).
6. Intrusive deposits: Deposits included in this type are those associated with intrusive or anatectic rocks of different chemical composition (alaskite, granite, monzonite, peralkaline syenite, carbonatite and pegmatite). Examples include the Rossing and Trekkopje deposits (Namibia), the uranium occurrences in the porphyry copper deposits such as Bingham Canyon and Twin Butte (United States), the Ilimaussaq deposit (Greenland), Palabora (South Africa), as well as the deposits in the Bancroft area (Canada).
7. Volcanic and caldera-related deposits: Uranium deposits of this type are located within and nearby volcanic caldera filled by mafic to felsic volcanic complexes and intercalated clastic sediments. Mineralization is largely controlled by structures (minor stratabound), occurs at several stratigraphic levels of the volcanic and sedimentary units and extends into the basement where it is found in fractured granite and in metamorphites. Uranium minerals are commonly associated with molybdenum, other sulphides, violet fluorine and quartz. Most significant commercial deposits are located within Streltsovsk caldera in the Russian Federation. Examples are known in China, Mongolia (Dornot deposit), Canada (Michelin deposit) and Mexico (Nopal deposit).

371
8. Metasomatite deposits: Deposits of this type are confined to the areas of tectono-magmatic
activity of the Precambrian shields and are related to near-fault alkali metasomatites, developed upon different basement rocks: granites, migmatites, gneisses and ferruginous quartzites with production of albitites, aegirinites, alkali-amphibolic and carbonaceous-ferruginous rocks. Ore lenses and stocks are a few metres to tens of metres thick and a few hundred metres long. Vertical extent of ore mineralization can be up to 1.5 km. Ores are uraninite-brannerite by composition and belong to ordinary grade. The reserves are usually medium scale or large. Examples include Michurinskoye, Vatutinskoye, Severinskoye, Zheltorechenskoye and Pervomayskoye deposits (Ukraine), Lagoa Real, Itataia and Espinharas (Brazil), the Valhalla deposit (Australia) and deposits of the Arjeplog region in the north of Sweden.
9. Surficial deposits: Surficial uranium deposits are broadly defined as young (Tertiary to Recent) near–surface uranium concentrations in sediments and soils. The largest of the surficial uranium deposits are in calcrete (calcium and magnesium carbonates), and they have been found in Australia (Yeelirrie deposit), Namibia (Langer Heinrich deposit) and Somalia. These calcrete-hosted deposits are associated with deeply weathered uranium-rich granites. They also can occur in valley-fill sediments along Tertiary drainage channels and in playa lake sediments (e.g., Lake Maitland, Australia). Surficial deposits also can occur in peat bogs and soils.
10. Collapse breccia pipe deposits: Deposits in this group occur in circular, vertical pipes filled with down-dropped fragments. The uranium is concentrated as primary uranium ore, generally uraninite, in the permeable breccia matrix, and in the arcuate, ring-fracture zone surrounding the pipe. Type examples are the deposits in the Arizona Strip north of the Grand Canyon and those immediately south of the Grand Canyon in the United States.
11. Phosphorite deposits: Phosphorite deposits consist of marine phosphorite of continental-shelf origin containing syn-sedimentary stratiform, disseminated uranium in fine-grained apatite. Phosphorite deposits constitute large uranium resources, but at a very low grade. Uranium can be recovered as a by-product of phosphate production. Examples include New Wales Florida (pebble phosphate) and Uncle Sam (United States), Gantour (Morocco) and Al-Abiad (Jordan). Other type of phosphorite deposits consists of organic phosphate, including argillaceous marine sediments enriched in fish remains that are uraniferous (Melovoe deposit, Kazakhstan).
12. Other deposits
Metamorphic deposits: In metamorphic uranium deposits, the uranium concentration directly results from metamorphic processes. The temperature and pressure conditions, and age of the uranium deposition have to be similar to those of the metamorphism of the enclosing rocks. Examples include the Forstau deposit (Austria) and Mary Kathleen (Australia).
Limestone deposits: This includes uranium mineralization in the Jurassic Todilto Limestone in the Grants district (United States). Uraninite occurs in intra-formational folds and fractures as introduced mineralization.
Uranium coal deposits: Elevated uranium contents occur in lignite/coal, and in clay and sandstone immediately adjacent to lignite. Examples are uranium in the Serres Basin (Greece), in North and South Dakota (United States), Koldjat and Nizhne Iliyskoe (Kazakhstan) and Freital (Germany). Uranium grades are very low and average less than 50 ppm U.

372
13. Rock types with elevated uranium contents: Elevated uranium contents have been observed in different rock types such as pegmatite, granites and black shale. In the past no economic deposits have been mined commercially in these types of rocks. Their grades are very low, and it is unlikely that they will be economic in the foreseeable future.
Rare metal pegmatites: These pegmatites contain Sn, Ta, Nb and Li mineralization. They have variable U, Th and rare earth elements contents. Examples include Greenbushes and Wodgina pegmatites (Western Australia). The Greenbushes pegmatites commonly have 6-20 ppm U and 3-25 ppm Th.
Granites: A small proportion of un-mineralised granitic rocks have elevated uranium contents. These “high heat producing” granites are potassium feldspar-rich. Roughly 1% of the total number of granitic rocks analysed in Australia have uranium-contents above 50 ppm.
Black Shale: Black shale-related uranium mineralization consists of marine organic-rich shale or coal-rich pyritic shale, containing syn-sedimentary disseminated uranium adsorbed onto organic material. Examples include the uraniferous alum shale in Sweden and Estonia, the Chatanooga shale (United States), the Chanziping deposit (China), and the Gera-Ronneburg deposit (Germany).

373
Appendix 4
ACRONYM LIST
AGR Advanced gas reactor
AL Acid leaching
ALKAL Alkaline atmospheric leaching
BWR Boiling water reactor
CANDU Canadian deuterium uranium
CEC Commission of the European Communities
CWG Crush-wet grind
DOE Department of Energy (United States)
EIA U.S. Energy Information Administration
EU European Union
EUP Enriched uranium product
FLOT Flotation
Ga Giga-years
GDR German Democratic Republic
GIF Generation IV International Forum
GNSS Global Nuclear Services and Supply
GWe Gigawatt electric
HEU Highly Enriched Uranium
HL Heap leaching
IAEA International Atomic Energy Agency
IEA International Energy Agency
INPRO International project on innovative nuclear reactors and fuel cycles
IPL In place leaching
ISL In situ leaching
IX Ion exchange
kg Kilograms
km Kilometre
LEU Low enriched uranium
LWR Light water reactor
MAGNOX Magnesium oxide
MOX Mixed oxide fuel
MWe Megawatt electric

374
NEA Nuclear Energy Agency
OECD Organisation for Economic Co-operation and Development
OP Open-pit
ppm Part per million
Pu Plutonium
PHWR Pressurised heavy-water reactor
PWR Pressurised water reactor
RAR Reasonably assured resources
RBMK Water-cooled, graphite-moderated reactor (Russian acronym)
SWU Separative work unit
SX Solvent extraction
t Tonnes (metric tons)
Th Thorium
tHM Tonnes heavy metal
TOE Tonnes oil equivalent
tU Tonnes uranium
TVA Tennessee Valley Administration
TWh Terrawatt-hour
U Uranium
UG Underground mining
USSR Union of Soviet Socialist Republics
VVER Water-cooled, water-moderated reactor (Russian acronym)
375
Appendix 5
ENERGY CONVERSION FACTORS
The need to establish a set of factors to convert quantities of uranium into common units of energy appeared during recent years with the increasing frequency of requests for such factors applying to the various reactor types.

376
ENERGY VALUES FOR URANIUM USED IN VARIOUS RECTOR TYPES1
Country Canada France Germany Japan Russian
Federation Sweden United Kingdom United States
Reactor type CANDU N4
PWR BWR PWR BWR PWR
VVER-1000
RBMK-1000
BWR PWR MAGNOX AGR BWR PWR
Burn-up [Mw/day/tU]
a) Natural uranium or natural uranium equivalent
7 770 5 848 5 665 5 230 5 532 4 694 4 855 4 707 6 250 5 780 5 900 NA 4 996 4 888
b) Enriched uranium – 42 500 40 000 42 000 33 000 43 400 42 000 22 000 40 000 42 000 – 24 000 33 000 40 000
Uranium enrichment [%235U]
– 3.60 3.2 3.60 3.00 4.10 4.23 2.40 3.20 3.60 – 2.90 3.02 3.66
Tails assay [%235U] – 0.25 0.30 0.30 0.25 0.30 0.25 0.25 0.25 0.25 – 0.30 0.30 0.30
Efficiency of converting thermal energy into electricity
30% 34.60% 33.50% 34.20% 33% 34% 33.30% 31.20% 34.00% 34.50% 26% 40% 32% 32%
Thermal energy equivalent of 1 t natural uranium [in 1015 joules]2
0.671 0.505 0.490 0.452 0.478 0.406 0.419 0.406 0.540 0.500 0.512 0.360 0.432 0.422
Electrical energy equivalent of 1 t natural uranium [in 1015 joules]2
0.201 0.175 0.164 0.155 0.158 0.140 0.139 0.127 0.184 0.173 0.133 0.144 0.138 0.135
1. Does not include Pu and U recycled. Does not take into account the requirement of an initial core load, which would reduce the equivalence by about 6%, if based on a plant life of about 30 years with a 70% capacity factor.
2. Does not take into account the energy consumed for 235U enrichment in LWR and AGR fuel. The factor to be applied to the energy equivalent under the condition of 3% 235U enrichment and 0.2% tails assay should be multiplied by 0.957.
NA Not available.

377
Conversion Factors and Energy Equivalence for Fossil Fuel for Comparison
1 cal = 4.1868 J
1 J = 0.239 cal
1 tonne of oil equivalent (TOE)(net, LHV) = 42 GJ1 = 1 TOE
1 tonne of coal equivalent (TCE)(standard, LHV) = 29.3 GJ1 = 1 TCE
1 000 m3 of natural gas (standard, LHV) = 36 GJ
1 tonne of crude oil = approx. 7.3 barrels
1 tonne of liquid natural gas (LNG) = 45 GJ
1 000 kWh (primary energy) = 9.36 MJ
1 TOE = 10 034 Mcal
1 TCE = 7 000 Mcal
1 000 m3 natural gas = 8 600 Mcal
1 tonne LNG = 11 000 Mcal
1 000 kWh (primary energy) = 2 236 Mcal2
1 TCE = 0.698 TOE
1 000 m3 natural gas = 0.857 TOE
1 tonne LNG = 1.096 TOE
1 000 kWh (primary energy) = 0.223 TOE
1 tonne of fuelwood = 0.3215 TOE
1 tonne of uranium: light water reactors = 10 000-16 000 TOE open cycle = 14 000-23 000 TCE
1. World Energy Council standard conversion factors (from WEC, 1998 Survey of Energy
Resources, 18th Edition).
2. With 1 000kWh (final consumption) = 860 Mcal as WEC conversion factor.


379
Appendix 6
INDEX OF NATIONAL REPORTS IN RED BOOKS (The following index lists all national reports by the year in which these reports were published in the Red Books.
A listing of all Red Book editions is shown at the end of this Index.)
1965 1967 1969 1970 1973 1975 1977 1979 1982 1983 1986 1988 1990 1992 1994 1996 1998 2000 2002 2004 2006 Algeria 1975 1977 1979 1982 2002 2004 2006
Argentina 1967 1969 1970 1973 1975 1977 1979 1982 1983 1986 1988 1990 1992 1994 1996 1998 2000 2002 2004 2006
Armenia 2000 2002 2004 2006
Australia 1967 1969 1970 1973 1975 1977 1979 1982 1983 1986 1988 1990 1992 1994 1996 1998 2000 2002 2004 2006
Austria 1977
Bangladesh 1986 1988
Belgium 1982 1983 1986 1988 1990 1992 1994 1996 1998 2000 2002 2004 2006
Benin 1990
Bolivia 1977 1979 1982 1983 1986
Botswana 1979 1983 1986 1988
Brazil 1970 1973 1975 1977 1979 1982 1983 1986 1992 1994 1996 1998 2000 2002 2004 2006
Bulgaria 1990 1992 1994 1996 1998
Cameroon 1977 1982 1983
Canada 1965 1967 1969 1970 1973 1975 1977 1979 1982 1983 1986 1988 1990 1992 1994 1996 1998 2000 2002 2004 2006
Central African Republic
1970 1973 1977 1979 1986
Chile 1977 1979 1982 1983 1986 1988 1992 1994 1996 1998 2000 2002 2004 2006
China 1990 1992 1994 1996 1998 2000 2002 2004 2006
Colombia 1977 1979 1982 1983 1986 1988 1990 1996 1998
Costa Rica 1982 1983 1986 1988 1990
Cuba 1988 1992 1996 1998
Czech Republic 1994 1996 1998 2000 2002 2004 2006

380
Czech and Slovak Republic
1990
Denmark (Greenland)
1965 1967 1969 1970 1973 1975 1977 1979 1982 1983 1986 1990 1992 1996 1998 2004
Dominican Republic
1982
Ecuador 1977 1982 1983 1986 1988
Egypt 1977 1979 1986 1988 1990 1992 1994 1996 1998 2000 2004 2006
El Salvador 1983 1986
Estonia 1998 2004
Ethiopia 1979 1983 1986
Finland 1973 1975 1977 1979 1982 1983 1986 1988 1990 1992 1994 1996 1998 2000 2002 2004 2006
France 1965 1967 1969 1970 1973 1975 1977 1979 1982 1983 1986 1988 1990 1992 1994 1996 1998 2000 2002 2004 2006
Gabon 1967 1970 1973 1982 1983 1986 1996 1998 2000 2002 2004 2006
Germany 1970 1975 1977 1979 1982 1983 1986 1988 1990 1992 1994 1996 1998 2000 2002 2006
Ghana 1977 1983
Greece 1977 1979 1982 1983 1986 1988 1990 1992 1994 1996 1998
Guatemala 1986 1988
Guyana 1979 1982 1983 1986
Hungary 1992 1994 1996 1998 2000 2002 2004 2006
India 1965 1967 1970 1973 1975 1977 1979 1982 1983 1986 1990 1992 1994 1996 1998 2000 2002 2004 2006
Indonesia 1977 1986 1988 1990 1992 1994 1996 1998 2000 2002 2004 2006
Iran, Islamic Republic of
1977 1998 2000 2002 2004 2006
Ireland 1979 1982 1983 1986 1992 1998
Italy 1967 1970 1973 1975 1977 1979 1982 1983 1986 1988 1992 1994 1996 1998 2000
Ivory Coast 1982
Jamaica 1982 1983

381
Japan 1965 1967 1970 1973 1975 1977 1979 1982 1983 1986 1988 1990 1992 1994 1996 1998 2000 2002 2004 2006
Jordan 1977 1986 1988 1990 1992 1994 1996 1998 2000 2002 2004 2006
Kazakhstan 1994 1996 1998 2000 2002 2004 2006
Korea, Republic of 1975 1977 1979 1982 1983 1986 1988 1990 1992 1994 1996 1998 2000 2002 2004 2006
Kyrgyzstan 1996 2002
Lesotho 1988
Liberia 1977 1983
Libyan Arab Jamahirya
1983
Lithuania 1994 1996 1998 2000 2002 2004 2006
Madagascar 1975 1977 1979 1982 1983 1986 1988
Malawi 2000
Malaysia 1983 1986 1988 1990 1992 1994 1996 1998 2000 2002
Mali 1986 1988
Mauritania 1990
Mexico 1970 1973 1975 1977 1979 1982 1986 1990 1992 1994 1996 1998 2000
Mongolia 1994 1996 1998
Morocco 1965 1967 1975 1977 1979 1982 1983 1986 1988 1990 1998
Namibia 1979 1982 1983 1986 1988 1990 1996 1998 2000 2002 2004 2006
Netherlands 1982 1983 1986 1990 1992 1994 1996 1998 2000 2002
New Zealand 1967 1977 1979
Niger 1967 1970 1973 1977 1986 1988 1990 1992 1994 1996 1998 2000 2002 2004 2006
Nigeria 1979
Norway 1979 1982 1983 1992 1996 1998
Pakistan 1967 1998 2000 2002
Panama 1983 1988
Paraguay 1983 1986
Peru 1977 1979 1983 1986 1988 1990 1992 1994 1996 1998 2000 2004 2006
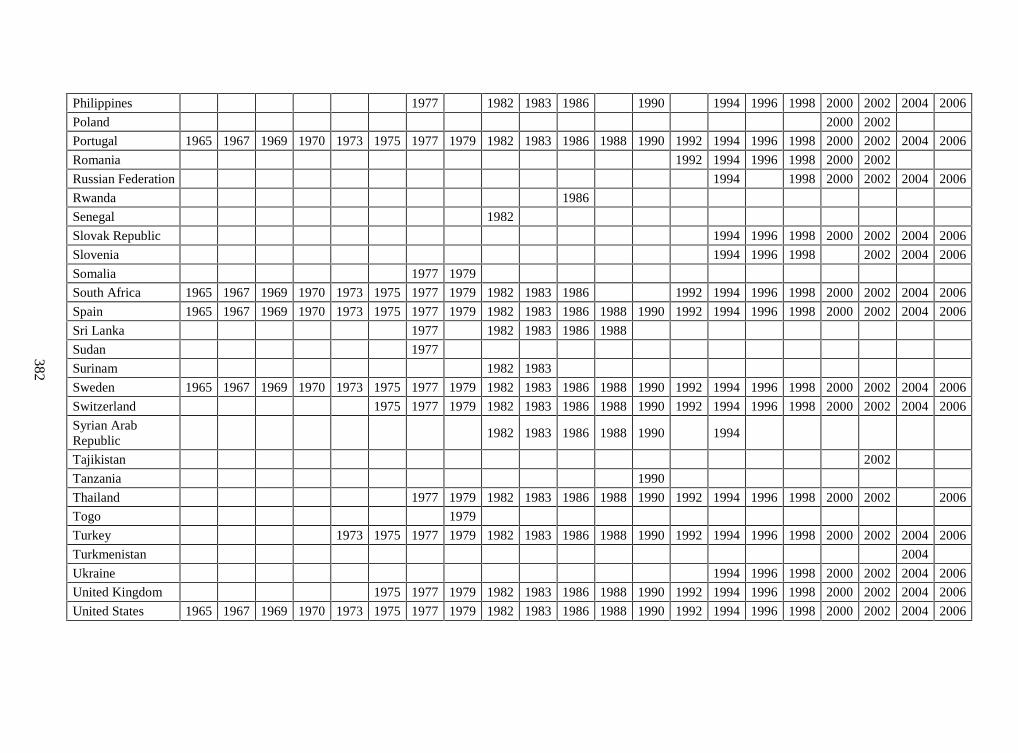
382
Philippines 1977 1982 1983 1986 1990 1994 1996 1998 2000 2002 2004 2006
Poland 2000 2002
Portugal 1965 1967 1969 1970 1973 1975 1977 1979 1982 1983 1986 1988 1990 1992 1994 1996 1998 2000 2002 2004 2006
Romania 1992 1994 1996 1998 2000 2002
Russian Federation 1994 1998 2000 2002 2004 2006
Rwanda 1986
Senegal 1982
Slovak Republic 1994 1996 1998 2000 2002 2004 2006
Slovenia 1994 1996 1998 2002 2004 2006
Somalia 1977 1979
South Africa 1965 1967 1969 1970 1973 1975 1977 1979 1982 1983 1986 1992 1994 1996 1998 2000 2002 2004 2006
Spain 1965 1967 1969 1970 1973 1975 1977 1979 1982 1983 1986 1988 1990 1992 1994 1996 1998 2000 2002 2004 2006
Sri Lanka 1977 1982 1983 1986 1988
Sudan 1977
Surinam 1982 1983
Sweden 1965 1967 1969 1970 1973 1975 1977 1979 1982 1983 1986 1988 1990 1992 1994 1996 1998 2000 2002 2004 2006
Switzerland 1975 1977 1979 1982 1983 1986 1988 1990 1992 1994 1996 1998 2000 2002 2004 2006
Syrian Arab Republic
1982 1983 1986 1988 1990 1994
Tajikistan 2002
Tanzania 1990
Thailand 1977 1979 1982 1983 1986 1988 1990 1992 1994 1996 1998 2000 2002 2006
Togo 1979
Turkey 1973 1975 1977 1979 1982 1983 1986 1988 1990 1992 1994 1996 1998 2000 2002 2004 2006
Turkmenistan 2004
Ukraine 1994 1996 1998 2000 2002 2004 2006
United Kingdom 1975 1977 1979 1982 1983 1986 1988 1990 1992 1994 1996 1998 2000 2002 2004 2006
United States 1965 1967 1969 1970 1973 1975 1977 1979 1982 1983 1986 1988 1990 1992 1994 1996 1998 2000 2002 2004 2006

383
Uruguay 1977 1982 1983 1986 1988 1990
USSR 1992
Uzbekistan 1994 1996 1998 2000 2002 2004 2006
Venezuela 1986 1988
Vietnam 1992 1994 1996 1998 2000 2002 2004 2006
Yugoslavia 1992
Zaire 1967 1973 1977 1988
Zambia 1986 1988 1990 1992 1994 1996 1998
Zimbabwe 1982 1988 1992 1994 1996 1998
1. OECD/ENEA World Uranium and Thorium Resources, Paris, 1965 2. OECD/ENEA Uranium Resources, Revised Estimates, Paris, 1967 3. OECD/ENEA-IAEA Uranium Production and Short-Term Demand, Paris, 1969 4. OECD/ENEA-IAEA Uranium Resources, Production and Demand, Paris, 1970 5. OECD/NEA-IAEA Uranium Resources, Production and Demand, Paris, 1973 6. OECD/NEA-IAEA Uranium Resources, Production and Demand, Paris, 1975 7. OECD/NEA-IAEA Uranium Resources, Production and Demand, Paris, 1977 8. OECD/NEA-IAEA Uranium Resources, Production and Demand, Paris, 1979 9. OECD/NEA-IAEA Uranium Resources, Production and Demand, Paris, 1982
10. OECD/NEA-IAEA Uranium Resources, Production and Demand, Paris, 1983 11. OECD/NEA-IAEA Uranium Resources, Production and Demand, Paris, 1986 12. OECD/NEA-IAEA Uranium Resources, Production and Demand, Paris, 1988 13. OECD/NEA-IAEA Uranium Resources, Production and Demand, Paris, 1990 14. OECD/NEA-IAEA Uranium 1991: Resources, Production and Demand, Paris, 1992 15. OECD/NEA-IAEA Uranium 1993: Resources, Production and Demand, Paris, 1994 16. OECD/NEA-IAEA Uranium 1995: Resources, Production and Demand, Paris, 1996 17. OECD/NEA-IAEA Uranium 1997: Resources, Production and Demand, Paris, 1998 18. OECD/NEA-IAEA Uranium 1999: Resources, Production and Demand, Paris, 2000 19. OECD/NEA-IAEA Uranium 2001: Resources, Production and Demand, Paris, 2002 20. OECD/NEA-IAEA Uranium 2003: Resources, Production and Demand, Paris, 2004 21. OECD/NEA-IAEA Uranium 2005: Resources, Production and Demand, Paris, 2006


385
Appendix 7
CURRENCY EXCHANGE RATES* (in national currency units per USD)
COUNTRY (currency abbreviation)
June 2002 June 2003 June 2004 January 2005
Afghanistan (AFA) ---- ---- ---- 49.680a) Algeria (DZD) 78.920 78.210 70.450 71.440 Argentina (ARS) 3.300 2.870 2.940 2.960 Armenia (AMD) 581.000 588.000 557.000 500.000 Australia (AUD) 1.769 1.550 1.400 1.291 Austria (EURO) 1.065 0.849 0.816 0.737 Belgium (EURO) 1.065 0.849 0.816 0.737 Brazil (BRL) 2.500 2.930 3.120 2.680 Bosnia and Herzegovina (BAM)
2.083 1.660 1.596 1.441
Bulgaria (BGN) 2.105 1.660 1.610 1.455 Canada (CAD) 1.530 1.380 1.360 1.220 Chile (CLP) 650.000 708.000 630.000 558.000 China (CNY) 8.266 8.266 8.266 8.266 Colombia (COP) 2 339.000 2 900.000 2 700.000 2 420.000 Congo, Republic of (XOF)[CFA Franc BEAC]
726.800 556.907 535.261 483.440
Costa Rica (CRC) 355.300 393.000 431.930 456.050 Cuba (CUP) 1.000 1.000 1.000 1.000 Czech Republic (CZK) 32.500 26.700 26.200 22.470 Denmark (DKK) 7.920 6.310 6.070 5.480 Egypt (EGP) 4.620 5.860 6.180 6.210 Finland (EURO) 1.065 0.849 0.816 0.737 France (EURO) 1.065 0.849 0.816 0.737 Gabon (XOF) [CFA Franc BEAC]
726.800 556.907 535.261 483.440
Germany (EURO) 1.065 0.849 0.816 0.737 Greece (EURO) 1.065 0.849 0.816 0.737 Hungary (HUF) 260.000 212.000 205.000 180.600 India (INR) 48.750 46.560 45.050 43.300 Indonesia (IDR) 8 750.000 8 300.000 8 800.000 9 200.000 Italy (EURO) 1.065 0.849 0.816 0.737 Iran, Islamic Rep of (IRR)
7 920.000 8 145.000 8 570.000 8 795.000
Japan (JPY) 123.000 118.000 111.000 104.000 Jordan (JOD) 0.708 0.708 0.708 0.708 Kazakhstan (KZT) 152.500 150.200 135.500 129.000

386
COUNTRY (currency abbreviation)
June 2002 June 2003 June 2004 January 2005
Korea, Republic of (KRW) 1 233.000 1 182.000 1 166.000 1 048.000 Kyrgyzstan (KGS) 47.770 41.800 43.470 40.780 Lithuania (LTL) 3.677 2.931 2.817 2.545 Malawi (MWK) 73.600 92.960 106.060 106.473 Malaysia (MYR) 3.770 3.770 3.770 3.770 Mauritania (MRO) 265.000 267.000 264.230 259.130 Mexico (MXN) 9.440 10.250 11.400 11.200 Mongolia (MNT) 1 101.000 1 127.000 1 159.000 1 212.000 Morocco (MAD) 11.150 9.310 9.120 8.330 Namibia (NAD) 9.850 8.150 6.580 5.620 Netherlands (EURO) 1.065 0.849 0.816 0.737 Niger (XOF) [CFA Franc BCEAO]
726.800 556.907 535.261 483.440
Norway (NOK) 7.920 6.690 6.700 6.080 Peru (PEN) 3.460 3.480 3.480 3.270 Philippines (PHP) 49.270 52.680 55.670 55.980 Poland (PLN) 4.030 3.620 3.800 3.030 Portugal (EURO) 1.065 0.849 0.816 0.737 Romania (RON) 33 592.000 ---- ---- 2.980b) Russian Federation (RUB) 31.300 30.720 29.000 27.810 Serbia & Montenegro (CSD)
---- ---- 59.150 58.920
Slovak Republic (SKK) 47.010 34.750 33.120 28.700 Slovenia (SIT) 244.000 198.000 195.000 176.000 Somalia (SOS) 20 738.000 20 295.000 15 656.000 14 896.000 South Africa (ZAR) 9.850 8.150 6.580 5.620 Spain (EURO) 1.065 0.849 0.816 0.737 Sweden (SEK) 9.700 7.770 7.420 6.610 Switzerland (CHF) 1.560 1.300 1.250 1.130 Syria (SYP) 46.000 51.500 51.720 52.350 Tajikistan (TJS) 2.880 3.160 3.010 3.060 Thailand (THB) 42.730 41.860 40.710 39.100 Turkey (TRY) 1 400 000.000 1 450 000.000 1 500 000.000 1.365 Ukraine (UAH) 5.320 5.330 5.330 5.330 United Kingdom (GBP) 0.680 0.610 0.545 0.522 United States (USD) 1.000 1.000 1.000 1.000 Uruguay (UYU) 17.300 29.300 29.700 26.450 Uzbekistan (UZS) 723.840 970.250 1 010.720 1 056.570 Viet Nam (VND) 15 130.000 15 310.000 15 680.000 15 690.000 Yugoslavia (YUM) 65.420 56.330 56.330 56.330 Zambia (ZMK) 4 215.000 4 755.000 4 700.000 4 575.000 Zimbabwe (ZWD) 55.000 1 975.000 5 350.000 6 400.000
* Source: The Department of Finance of the United Nations Development Programme, New York. a) June 2005 b) July 2005

387
Appendix 8
GROUPING OF COUNTRIES AND AREAS WITH URANIUM-RELATED ACTIVITIES
The countries and geographical areas referenced in this report are listed below. Countries followed by “*” are members of OECD.
1. North America
Canada* Mexico* United States of America*
2. Central and South America
Argentina Bolivia Brazil Chile Colombia Costa Rica Cuba Ecuador El Salvador Guatemala Jamaica Paraguay Peru Uruguay Venezuela
3. Western Europe
Austria* Belgium* Denmark* Finland* France* Germany* Ireland* Italy* Netherlands* Norway* Portugal* Spain* Sweden* Switzerland* United Kingdom*
4. Central, Eastern and South-eastern Europe
Armenia Bulgaria Croatia Czech Republic* Estonia Greece* Hungary* Lithuania Poland* Romania Russian Federation Slovak Republic* Slovenia Turkey* Ukraine
5. Africa
Algeria Botswana Central African Republic Congo, Democratic Republic Egypt Gabon Ghana Lesotho Libya Madagascar Malawi Mali Morocco Namibia Niger Nigeria Somalia South Africa Zambia Zimbabwe
6. Middle East, Central and Southern Asia
Bangladesh India Iran, Islamic Republic of Israel Jordan Kazakhstan Kyrgyzstan Pakistan Sri Lanka Syria Tajikistan Turkmenistan Uzbekistan

388
7. South-eastern Asia
Indonesia Malaysia Philippines Thailand Vietnam
8. Pacific
Australia* New Zealand*
9. East Asia1
China Japan* Mongolia Korea, Republic of* Korea, Democratic People’s Republic of
The countries associated with other groupings of nations used in this report are listed below.
Commonwealth of Independent States (CIS) or Newly Independent States (NIS)
Armenia Kazakhstan Tajikistan Azerbaijan Kyrgyzstan Turkmenistan Belarus Moldavia Ukraine Georgia Russian Federation Uzbekistan
European Union
Austria Estonia Hungary Luxemburg Slovak Republic Belgium Finland Ireland Malta Slovenia Cyprus France Italy Netherlands Spain Czech Republic Germany Latvia Poland Sweden Denmark Greece Lithuania Portugal United Kingdom
1. Includes Chinese Taipei.

OECD PUBLICATIONS, 2, rue André-Pascal, 75775 PARIS CEDEX 16
PRINTED IN FRANCE
(66 2006 03 1 P) ISBN 92-64-02425-5 – No. 55129 2006

Uranium 2005:Resources, Productionand Demand
A Joint Report by the OECD Nuclear Energy Agencyand the International Atomic Energy Agency
N U C L E A R • E N E R G Y • A G E N C Y
Uranium 2005: Resources,Production and Demand
Since 2001 the price of uranium has steadily climbed over five-fold, at a rate and reaching heightsnot seen since the 1970s. As a result, the uranium industry has seen a surge of activity, endinga period of over 20 years of relative stagnation. Worldwide exploration expenditures in 2004increased almost 40% over 2002 figures. Overall, resource totals have increased over the pasttwo years, indicating that increased uranium prices have begun to have an impact. Based onpatterns observed following previous periods of heightened exploration efforts, further additionsto the uranium resource base are anticipated given the recent dramatic increase in explorationexpenditures. In 2004, significant production increases (>30%) were recorded in Australia,Kazakhstan and Namibia, while more modest increases (between 5% and 15%) were recordedfor Brazil, Niger, the Russian Federation and Uzbekistan. Significant expansions are also plannedin future production capacity in Australia, Canada and Kazakhstan. This very dynamic and majorexpansion of production capability could significantly alter the supply and demand relationshipof recent years, provided planned centres are constructed on schedule and successfully reach fullproduction capacity. Clearly, major changes in the uranium industry are under way, driven byrecent uranium price increases.
The "Red Book", jointly prepared by the OECD Nuclear Energy Agency and the InternationalAtomic Energy Agency, is a recognised world reference on uranium. It is based on official infor-mation received from 43 countries. This 21st edition presents the results of a thorough reviewof world uranium supplies and demand as of 1st January 2005 and provides a statistical profile ofthe world uranium industry in the areas of exploration, resource estimates, production andreactor-related requirements. It provides substantial new information from all major uraniumproduction centres in Africa, Australia, Central Asia, Eastern Europe and North America.Projections of nuclear generating capacity and reactor-related uranium requirements through2025 are provided as well as a discussion of long-term uranium supply and demand issues.
(66 2006 03 1 P) € 120.00ISBN 92-64-02425-5
2006
Uranium
2005: Resources,P
roduction and Dem
and
AIEAIAEA AIEA IAEA
-:HSTCQE=UWYWZU:
Red book 2005-Eng 6098 27/04/06 9:57 Page 1