uptake and reaction of hobr on frozen and dry nacl/nabr surfaces
TRANSCRIPT

Atmos. Chem. Phys., 2, 79–91, 2002www.atmos-chem-phys.org/acp/2/79/ Atmospheric
Chemistryand Physics
Uptake and reaction of HOBr on frozen and dry NaCl/NaBrsurfaces between 253 and 233 K
J. W. Adams1,*, N. S. Holmes1, and J. N. Crowley1
1Max-Planck-Institut fur Chemie, Division of Atmospheric Chemistry, Postfach 3060, 55020 Mainz, Germany* Present address: Dept. of Chemistry, University of Cambridge, Lensfield Rd, Cambridge CB2 1EW, UK
Received: 20 December 2001 – Published in Atmos. Chem. Phys. Discuss.: 22 January 2002Revised: 12 April 2002 – Accepted: 12 April 2002 – Published: 19 April 2002
Abstract. The uptake and reaction of HOBr with frozen saltsurfaces of variable NaCl / NaBr composition and temper-ature were investigated with a coated wall flow tube reac-tor coupled to a mass spectrometer for gas-phase analysis.HOBr is efficiently taken up onto the frozen surfaces at tem-peratures between 253 and 233 K where it reacts to form thedi-halogens BrCl and Br2, which are subsequently releasedinto the gas-phase. The uptake coefficient for HOBr reactingwith a frozen, mixed salt surface of similar composition tosea-spray was≈ 10−2. The relative concentration of BrCland Br2 released to the gas-phase was found to be stronglydependent on the ratio of Cl− to Br− in the solution prior tofreezing / drying. For a mixed salt surface of similar com-position to sea-spray the major product at low conversion ofsurface reactants (i.e. Br− and Cl−) was Br2.
Variation of the pH of the NaCl / NaBr solution used toprepare the frozen surfaces was found to have no significantinfluence on the results. The observations are explained interms of initial formation of BrCl in a surface reaction ofHOBr with Cl−, and conversion of BrCl to Br2 via reac-tion of surface Br−. Experiments on the uptake and reac-tion of BrCl with frozen NaCl / NaBr solutions served toconfirm this hypothesis. The kinetics and products of theinteractions of BrCl, Br2 and Cl2 with frozen salt surfaceswere also investigated, and lower limits to the uptake co-efficients of> 0.034, > 0.025 and> 0.028 respectively,were obtained. The uptake and reaction of HOBr on dry saltsurfaces was also investigated and the results closely resem-ble those obtained for frozen surfaces. During the courseof this study the gas diffusion coefficients of HOBr in Heand H2O were also measured as (273± 1) Torr cm2 s−1 and(51 ± 1) Torr cm2 s−1, respectively, at 255 K. The impli-cations of these results for modelling the chemistry of the
Correspondence to:J. N. Crowley([email protected])
Arctic boundary layer in springtime are discussed.
1 Introduction
Field measurements have conclusively shown that theepisodic, catalytic destruction of ozone in the polar tropo-spheric boundary layer is strongly correlated with the pres-ence of reactive bromine compounds (Barrie et al., 1988,1994; Barrie and Platt, 1997). Time resolved measurement ofthe concentrations of alkanes, alkenes and alkynes (Jobson etal., 1994; Ramacher et al., 1997, 1999; Rudolph et al., 1999;Boudries and Bottenheim, 2000), detection of photo-labilebromine compounds such as HOBr, BrCl and Br2 (Impeyet al., 1997, 1999; Foster et al., 2001), the direct measure-ment of the BrO radical in ground-based experiments (Haus-mann and Platt, 1994; Miller et al., 1997; Tuckermann et al.,1997), and by satellite (Chance, 1998), measurement of ac-tive chlorine via chemical amplification (Perner et al., 1999)and isotopic studies of CO (Rockmann et al., 1999) providethe experimental evidence for the presence of reactive, gas-phase bromine and chlorine species and indicate their centralrole in ozone destruction in several arctic locations (Oltmans,1981; Barrie et al., 1988; Oltmans et al., 1989; Anlauf et al.,1994; Solberg et al., 1996; Lorenzen-Schmidt et al., 1998).Measurements in the Antarctic indicate that bromine catal-ysed ozone loss can take place even in this relatively pristineenvironment (Kreher et al., 1997; Wessel et al., 1998).
The chemical mechanism(s) by which high concentrationsof reactive bromine and chlorine compounds are sustainedare not yet completely characterised although an importantrole for heterogeneous reactions of HOBr (Fan and Jacob,1992; McConnell et al., 1992; Mozurkewich, 1995; Tang andMcConnell, 1996) has been identified.
c© European Geophysical Society 2002

80 J. W. Adams et al.: Uptake and reaction of HOBr
Fig. 1. Schematic Diagram of the experimental set-up.QMS = Quadrupole Mass Spectrometer.
In a recent publication (Fickert et al., 1999) we were ableto show that the interaction of HOBr with aqueous NaCl /NaBr solutions of similar composition to sea-spray was anefficient source of Br2 (and BrCl) if the solution pH was lessthan≈ 6. The uptake coefficient (see below) for the interac-tion of HOBr with salt containing deliquescent aerosols hasbeen shown to be large (Abbatt and Waschewsky, 1998). Theinitial step is thought to be an acid catalysed reaction betweenHOBr and Cl−:
HOBr + Cl− + H+ BrCl + H2O (1)
Rapid, aqueous phase equilibria result in the conversion ofBrCl to Br2,
BrCl + Br− + H+ Br2 + HCl (2)
and the relative concentration of Br2 and BrCl released tothe gas-phase is controlled by aqueous phase equilibrium re-actions of Br2Cl− (Wang et al., 1994; Fickert et al., 1999).Only when the [Br−] / [Cl−] ratio was very low comparedto the composition of sea-water, was BrCl released in signif-icant yield.
In the present study we investigate the efficiency of di-halogen release from the interaction of HOBr with frozen saltsurfaces that mimic the arctic snow/ice pack. Supplementaryexperiments that examined the uptake and reaction of HOBron “dry” surfaces and the uptake and reaction of moleculardi-halogens with frozen surfaces were also carried out to gaininsight into the parameters that control the rate and mecha-nism of the chemical interaction. Surprisingly, with few ex-ceptions, the results from this work represent the first mea-surements of the kinetics and mechanisms of the reactionsof halogenated species on mixed Cl− / Br− surfaces madefrom aqueous solutions that were of similar composition toatmospheric sea-spray /sea-water.
2 Experimental
2.1 Flow tube and mass spectrometer
The uptake and reaction of the halogen trace gases onfrozen and dry surfaces was investigated using a coated wallflow tube (Fig. 1) combined with a differentially pumped
quadrupole mass spectrometer (Holmes et al., 2001). Theflow tube set up consists of a horizontally mounted Pyrexglass tube (length 300 mm, internal diameter 27.5 mm) witha thermostatted jacket to regulate the temperature. The sur-faces of interest are coated onto the inner wall of a snug-fitting Pyrex insert (l = 210 mm,id = 25.5 mm), located inthe centre of the flow tube. The experiments were conductedat total (flow tube) pressures of between 0.75 and 3 Torr He(1 Torr = 1.333 hPa), the temperature was varied between233 and 253 K. The bulk flow rate of He through the flowtube was between 400 and 1000, standard cm3 min−1, re-sulting in linear velocities of between 300 and 1500 cm s−1.Reactive trace gases, diluted in He, were introduced into theflow tube via a movable injector, the translation of which en-abled the contact time between trace gas and surface to bevaried. When appropriate, the main gas flow, which enteredthe flow-tube through a sidearm of the reactor, was humidi-fied to prevent evaporation of the frozen surface. Trace gaseswere analysed with a quadrupole mass spectrometer (QMS),equipped with an electron-impact ion source (Fickert et al.,1998). HOBr, BrCl and Br2 were monitored at their parentions (m/z = 96, 116 and 158, respectively).
2.2 Surface preparation, chemicals
In order to prepare reproducible frozen surfaces the follow-ing methodology was adopted. The Pyrex insert was cleanedusing a dilute HF solution before thorough rinsing with dis-tilled water and the aqueous solution from which the frozenor dry surfaces were to be made. Following this, a few ml ofthe same solution was introduced between two Teflon con-straining rings. By slowly turning the insert, a film of es-timated thickness≈ 100µm was evenly distributed on theglass walls. The insert was then placed into the pre-cooledflow tube where a translucent, frozen film was formed withina few seconds. The insert could also be slowly turned dur-ing the freezing process. Once the flow tube was re-sealedthe bulk gas flows, at the correct humidity to maintain theice film in equilibrium with gas-phase, were established.Inspection of the NaCl phase diagram (Koop et al., 2000)shows that at temperatures below 251 K (the temperature ofthe ice/liquid/NaCl·2H2O eutectic), only ice and NaCl di-hydrate co-exist. The presence of bromide ions at concentra-tions of 10−3 M is not expected to modify this significantlyand, for the majority of our experiments, there is not expectedto be an aqueous phase in equilibrium with the bulk materialof the substrate.
When dry films were required, the frozen film was exposedto dry He as the temperature was allowed to increase slowlyto room temperature over a period of≈ 30 min. In this wayan even, unbroken, dry salt surface could be reproducibly ob-tained. In the text we refer to these surfaces as “dry” althoughthe relative humidity was also varied in these experiments.HOBr was prepared by the reaction of AgNO3 with Br2 insolution as described previously (Fickert et al., 1999), and
Atmos. Chem. Phys., 2, 79–91, 2002 www.atmos-chem-phys.org/acp/2/79/

J. W. Adams et al.: Uptake and reaction of HOBr 81
Fig. 2. Plot of inverse uptake coefficient of HOBr vs. pressure of Heor H2O, for dry salt and HCl doped Pyrex surfaces at 253 K. Diffu-sion coefficients and accommodation coefficients may be extractedfrom the gradients and intercepts of these lines. (See Eq. iii in text)
was stored as an aqueous solution at≈ −30◦C. BrCl wasprepared by allowing a Br2 / Cl2 mixture to come to equi-librium in a blacked glass storage bulb, and its mixing ratiodetermined by absorption spectroscopy. The response of themass spectrometer was calibrated against known concentra-tions of Br2, Cl2 and BrCl, and was determined over a rangeof flow-tube pressures, gas-phase water concentrations andinstrument configurations. The mass spectrometer signals ofHOBr were converted to concentrations by assuming 100%yield of Br2 in the reaction of HOBr with aqueous, acidified,bromide containing solutions (Fickert et al., 1999).
The aqueous bromide / chloride solutions were preparedfrom analysis grade NaCl and NaBr and de-ionised wa-ter. For most experiments the solutions were 2 M NaCl and3 × 10−3 M NaBr. The Cl− to Br− ratio (≈ 660) is thusthe same as found in sea-water, and the concentrations simi-lar to those expected to be present in sea-spray (Sander andCrutzen, 1996). The pH of un-buffered solutions was 5.5unless this parameter was deliberately manipulated. In addi-tion, solutions of varied Cl− to Br− ratio, and also pure Cl−
and Br− solutions were used.
2.3 Determination of uptake coefficients
In the present experiments, the pseudo first-order rate coeffi-cient for loss to the reactive surfacekw was calculated fromthe variation of signal with injector position according to:
[C]z2 = [C]z1 · exp
(− kw ·
1z
ν
)(i)
where [C]z1,2 is the trace gas concentrations at injector posi-tions z1 andz2, 1z represents the distance between the po-sitionsz1 andz2 andν is the gas flow velocity in the tube.The ratio1z/ν thus defines the gas-surface contact time.The measured value ofkw has to be corrected (to givekcor)to take into account radial concentration gradients causedby efficient interaction of the trace gas at the wall (Brown,1978). This required knowledge of the diffusion coefficientsof HOBr in both He and H2O, which were determined sepa-rately (see results). The uptake coefficient,γ , was then ob-tained directly fromkcor (Howard, 1979):
γ =2 · r · kcor
ω(ii)
wherer is the internal radius of the coated glass insert, andω is the mean molecular velocity of the trace gas, derivedfrom the Boltzmann equation. Note that using this method,we make the assumption that the geometric surface area ofthe ice substrate is appropriate for calculating the uptake co-efficient, though there is still some controversy regarding this(Hanson and Ravishankara, 1993; Keyser et al., 1993). Cor-rections based on pore diffusion calculations have only beenproperly tested for ice surfaces that were formed by conden-sation from the gas-phase, which are considerably rougherthan those formed from the relatively slow freezing of a liq-uid as practised here. We expect that our ice surfaces, whichappear smooth and translucent to the eye, are significantlyless porous that those grown by vapour deposition.
3 Results and discussion
3.1 Diffusion coefficients of HOBr in He and H2O
Experiments to determine the diffusion coefficient of HOBrin water vapour,DHOBr
H2O , were carried out using a salt sur-face doped with HCl at 255 K. For this measurement, the Hegas flow was accurately humidified, and the uptake of HOBr,limited by its diffusion through both He and H2O, was mon-itored. The diffusion coefficient of HOBr in He,DHOBr
He , wasalso determined using the reaction with HCl on the surface ofthe glass insert. In these experiments, HCl was added to thebulk gas flow, and was present at a concentration in excess ofHOBr by more than a factor of 10.
For diffusion-limited uptake onto the surface of a reactorwith cylindrical geometry, the equation approximating thedependence of the uptake coefficient on the bath gas pres-sure is given by: (Hanson et al., 1992)
1
γ=
1
α+
ω · r · PH2O
7.32 · DH2O+
ω · r
7.32 · DHe· PHe (iii)
This assumes that reaction at the surface is rapid and not ratelimiting. Doping the ice / glass surface with excess HCl en-sures that this is the case (Abbatt, 1994).
Figure 2 (open circles) shows plots of 1/γ vs. He bath gaspressure for uptake onto a sea-salt substrate in the presence
www.atmos-chem-phys.org/acp/2/79/ Atmos. Chem. Phys., 2, 79–91, 2002

82 J. W. Adams et al.: Uptake and reaction of HOBr
Fig. 3. Uptake of HOBr and subsequent product formation, ona frozen mixed salt surface at 233 K.(a) [HOBr]init = 4 ×
109 molecules cm−3, exposure of the surface to HOBr begins at400 s when the injector is retracted.(b) [HOBr]init = 8.5 ×
1010 molecules cm−3, exposure of the surface to HOBr begins at550 s. In both cases, the Br2 trace has been offset for clarity ofpresentation.
of excess HCl at 255 K. Two experiments were performedat each pressure, though the excellent reproducibility makessome data points difficult to see. During these experimentsthe water vapour pressure was held constant at ca. 0.8 Torr.The linear dependence of the inverse uptake coefficient onthe pressure of the He bath gas enabled the diffusion coef-ficient to be extracted from the gradient (see Eq. iii above).The diffusion coefficient at 255 K was found to beDHOBr
He =
(273± 1) Torr cm2 s−1, where the errors are precision only
(2σ ). This result can be compared to the only previous exper-imental determination ofDHOBr
He = (319± 48) Torr cm2 s−1
at 274 K. Assuming aT 1.75 dependence on temperature, thisindicates a value of (281±42) Torr cm2 s−1 at 255 K, in goodagreement with the present result. These values are in accordwith diffusion coefficient calculations based on average col-lision diameters and Lennard-Jones potentials (Wachsmuthet al., 2002)
A separate set of experiments (filled circles) was per-formed in which the diffusion limited uptake of HOBr ontofrozen sea-salt surfaces and excess HCl in the presence ofvarious pressures of added water vapour was studied. Dur-ing these experiments the He pressure was held constant at2 Torr. Each data point represents the average of at least threeuptake experiments. The slope of this data set yields a dif-fusion coefficient ofDHOBr
H2O = (51± 1) Torr cm2 s−1 wherethe errors are precision only (2σ ). This is the first direct de-termination of this quantity. The data taken with the partiallyhumidified sea-salt surface (open circles) was analysed to ob-tain they-axis intercept of the data. Once the contributionfrom the diffusion of HOBr in water (see Eq. iii) was sub-tracted, an estimate of the mass accommodation coefficientfor uptake of HOBr onto frozen, HCl doped, sea-salt surfacescan be calculated. A value ofα ≈ 0.15 was obtained, whichis comparable to the literature value ofγ = 0.25, obtainedfor the uptake of HOBr onto ice doped with HCl (Abbatt,1994).
3.2 HOBr uptake onto frozen salt surfaces: product forma-tion
The uptake and reaction of HOBr on frozen salt substrateswas examined at a variety of temperatures between 233 and253 K, at various NaBr / NaCl concentration ratios and withvariation of the initial HOBr concentration and total pressure.For each experiment a fresh substrate was used.
Figure 3a displays raw data obtained at 233 K with aninitial (aqueous) composition of the salt of 2 M NaCl and3 × 10−3 M NaBr. After a steady flow of HOBr at a con-centration of≈ 4× 109 cm−3 has been established (t = 0 tot = 400 s, constant mass spectrometer signal atm/z = 96)the injector is withdrawn and the HOBr is exposed to a welldefined area of frozen substrate. At this point, the HOBr sig-nal drops precipitously, indicating uptake onto the substrate,and the molecular ion of Br2 is, within the time resolution ofthe measurement, instantaneously observed. The uptake ofHOBr and the release of Br2 proceeds at approximately thesame rate untilt = 3400 s, during which the HOBr is seento be converted stoichiometrically to Br2. When the injec-tor is re-inserted att ≈ 3400 s, and contact between HOBrand the substrate is stopped the HOBr signal returns to itsinitial value, and Br2 production ceases. We note that al-though the result shown is representative of several data sets,the exact shape of the HOBr uptake profile was somewhatvariable from one experiment to the next, though the size of
Atmos. Chem. Phys., 2, 79–91, 2002 www.atmos-chem-phys.org/acp/2/79/
J. W. Adams et al.: Uptake and reaction of HOBr 83
the initial uptake coefficient (directly after the injector waswithdrawn) was reasonably constant. Despite efforts made togenerate surfaces in a reproducible manner, this effect prob-ably reflects differences in surface characteristics such as thenumber of defect sites and porosity, which will influence theavailability of reactive sites on the surface. As shown, thereis no evidence for significant production of BrCl in this ex-periment. In a second experiment, at the same temperature(Fig. 3b), a fresh substrate was exposed to a significantlyhigher concentration of HOBr (8.5 × 1010 cm−3). At thisconcentration of HOBr the time dependence of its uptakeis markedly different. Following an initially large uptakedirectly after the injector has been withdrawn (t = 550 s)the concentration of HOBr increases rapidly until it almostreaches its original level. At the same time Br2 is initiallyformed at high yield, but decreases in concentration as theuptake of HOBr slows down. In this experiment BrCl is alsoclearly formed, though there is a delay of≈ 50 s before itsmaximum concentration is reached. An examination of theHOBr, Br2 and BrCl profiles at 600< t < 850 s shows thatHOBr is being converted to Br2 and BrCl in roughly equalamounts.
The change in the HOBr uptake profile as the HOBr con-centration is varied indicates that, at higher concentrations,there is sufficient HOBr to modify the reactivity of the sur-face on the time scales of these experiments, i.e. reactivesites on the surface are depleted as the reaction progresses,and both the uptake of HOBr and the formation of productsdecrease with time. An important aspect of these results isthe switch in products from only Br2 at low HOBr to Br2 andBrCl as the concentration of HOBr is increased.
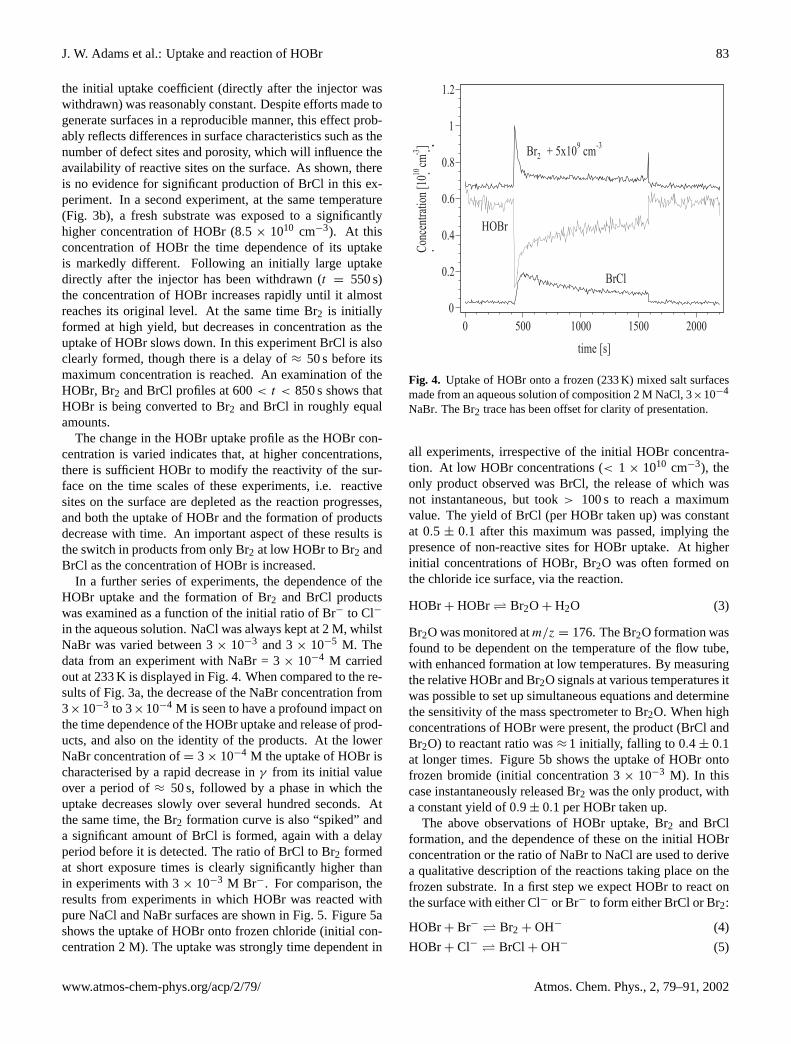
In a further series of experiments, the dependence of theHOBr uptake and the formation of Br2 and BrCl productswas examined as a function of the initial ratio of Br− to Cl−
in the aqueous solution. NaCl was always kept at 2 M, whilstNaBr was varied between 3× 10⁻³ and 3× 10⁻⁵ M. Thedata from an experiment with NaBr = 3× 10⁻⁴ M carriedout at 233 K is displayed in Fig. 4. When compared to the re-sults of Fig. 3a, the decrease of the NaBr concentration from3×10−3 to 3×10⁻⁴ M is seen to have a profound impact onthe time dependence of the HOBr uptake and release of prod-ucts, and also on the identity of the products. At the lowerNaBr concentration of= 3 × 10⁻⁴ M the uptake of HOBr ischaracterised by a rapid decrease inγ from its initial valueover a period of≈ 50 s, followed by a phase in which theuptake decreases slowly over several hundred seconds. Atthe same time, the Br2 formation curve is also “spiked” anda significant amount of BrCl is formed, again with a delayperiod before it is detected. The ratio of BrCl to Br2 formedat short exposure times is clearly significantly higher thanin experiments with 3× 10⁻³ M Br−. For comparison, theresults from experiments in which HOBr was reacted withpure NaCl and NaBr surfaces are shown in Fig. 5. Figure 5ashows the uptake of HOBr onto frozen chloride (initial con-centration 2 M). The uptake was strongly time dependent in
Fig. 4. Uptake of HOBr onto a frozen (233 K) mixed salt surfacesmade from an aqueous solution of composition 2 M NaCl, 3×10⁻⁴
NaBr. The Br2 trace has been offset for clarity of presentation.
all experiments, irrespective of the initial HOBr concentra-tion. At low HOBr concentrations (< 1 × 1010 cm−3), theonly product observed was BrCl, the release of which wasnot instantaneous, but took> 100 s to reach a maximumvalue. The yield of BrCl (per HOBr taken up) was constantat 0.5 ± 0.1 after this maximum was passed, implying thepresence of non-reactive sites for HOBr uptake. At higherinitial concentrations of HOBr, Br2O was often formed onthe chloride ice surface, via the reaction.
HOBr + HOBr Br2O + H2O (3)
Br2O was monitored atm/z = 176. The Br2O formation wasfound to be dependent on the temperature of the flow tube,with enhanced formation at low temperatures. By measuringthe relative HOBr and Br2O signals at various temperatures itwas possible to set up simultaneous equations and determinethe sensitivity of the mass spectrometer to Br2O. When highconcentrations of HOBr were present, the product (BrCl andBr2O) to reactant ratio was≈ 1 initially, falling to 0.4 ± 0.1at longer times. Figure 5b shows the uptake of HOBr ontofrozen bromide (initial concentration 3× 10⁻³ M). In thiscase instantaneously released Br2 was the only product, witha constant yield of 0.9 ± 0.1 per HOBr taken up.
The above observations of HOBr uptake, Br2 and BrClformation, and the dependence of these on the initial HOBrconcentration or the ratio of NaBr to NaCl are used to derivea qualitative description of the reactions taking place on thefrozen substrate. In a first step we expect HOBr to react onthe surface with either Cl− or Br− to form either BrCl or Br2:
HOBr + Br− Br2 + OH− (4)
HOBr + Cl− BrCl + OH− (5)
www.atmos-chem-phys.org/acp/2/79/ Atmos. Chem. Phys., 2, 79–91, 2002

84 J. W. Adams et al.: Uptake and reaction of HOBr
Fig. 5. Uptake of HOBr onto frozen salt surfaces.(a) 2 M NaCl,T = 233 K, (b) 3 × 10⁻³ M NaBr, 243 K. The Br2 trace has beenoffset for clarity of presentation.
Due to its greater polarity, we expect BrCl to have a relativelylong residence time on the surface compared to Br2, thus,when sufficient Br− is available on the surface for reaction,BrCl will be converted to Br2 before it can leave the surfaceto be detected as a gas-phase species.
BrCl + Br− Br2 + Cl− (6)
When the Br− concentration is lowered, the rate of des-orption of BrCl from the surface becomes comparable withthe rate of its surface reaction with Br− and some will bedetected, with a delay period due to retention on the sur-face. When Br− is low, BrCl may thus build up on thesurface so that the increased flux through the back Reac-tion (5) results in the net decrease in HOBr uptake between
500 < t < 1500 s seen in Fig. 4. This effect may be furtherenhanced by occupation of reactive sites by BrCl. The samemechanism also explains the formation of both BrCl and Br2when high initial HOBr concentrations are employed. In thiscase, the surface Br− is rapidly depleted by the BrCl + Br−
reaction (Fig. 3b, 550< t < 600 s), and further uptake ofHOBr can result in BrCl formation and release. Independentevidence for an efficient conversion of BrCl to Br− on frozenNaCl / NaBr substrates was gained in a separate set of exper-iments that directly examined the uptake of BrCl (see below).
Until now the formation of Br2 following reaction ofHOBr with mixed salt surfaces has been discussed largelyin terms of an indirect mechanism in via formation of BrClreaction. This is due to the greater concentration of Cl−
compared to Br− in the aqueous solutions used to generatethe frozen surfaces, which favours Reaction (5) over Reac-tion (4). The rate of each reaction will however depend onits rate coefficient and the surface concentration of the halideions. In the aqueous phase the reaction of HOBr with Br−
is a factor of≈ 3 larger than that for HOBr with Cl− whichalone cannot compensate the factor 660 in the relative con-centration of Cl− and Br− in the bulk solutions. However,during the freezing process, which presumably starts at thesurface of the cold glass insert and proceeds outwards to-wards the gas-liquid interface, some separation of Br− andCl− will be caused by the higher solubility of Br− comparedto Cl−. This will result in a frozen film that has a highersurface Br− / Cl− ratio compared to bulk. Observations ofenhanced Br− / Cl− concentration ratios at the surface havebeen made on NaBr / NaCl crystals grown from aqueous so-lutions (Zangmeister et al., 2001), and from a melt (Ghosalet al., 2000). In the present experiments, although a surfaceenhancement of the Br− ion concentration probably occurs,we have no means to determine its extent, but note that evena surface enhancement of a factor of 10 in the Br− / Cl−
ratio would increase the contribution of Reaction (5) to just≈ 5% if the relative aqueous phase rate coefficients for thesereactions are applicable.
The observations presented here appear to be completelyconsistent with the known aqueous-phase equilibrium chem-istry involved in the uptake and reaction of HOBr on del-iquescent sea-salt aerosols or solutions (Wang et al., 1994;Fickert et al., 1999) and despite contrary indications from thephase-diagram, it is tempting to suggest that the reactions aretaking place in aqueous medium. However, an important as-pect of the aqueous phase transformation of HOBr into Br2 orBrCl is the requirement of low pH (Abbatt and Waschewsky,1998; Fickert et al., 1999) as the reactions are acid catalysed(Wang et al., 1994). We have shown (Fickert et al., 1999) thatthe release of molecular halogens from aqueous solutions issuppressed at a pH of greater that≈ 7, and have therefore car-ried out a series of experiments in which the NaBr / NaCl so-lutions were adjusted in pH between 4 and 10 prior to freez-ing. It was found that the variation of pH had no influenceon identity of the products or their yields per HOBr taken
Atmos. Chem. Phys., 2, 79–91, 2002 www.atmos-chem-phys.org/acp/2/79/

J. W. Adams et al.: Uptake and reaction of HOBr 85
up to the surface. As the amount of liquid-phase available atthe surface of a frozen sample will depend on the tempera-ture, we also carried out experiments at various temperaturesbetween 233 and 253 K. Again, no significant change in theuptake coefficient, time dependence or product distribution(i.e. the Br2 to BrCl ratio) was observed over this tempera-ture range. Even in those experiments where the temperaturewas above the eutectic for NaCl (i.e. at 253 K) there was noobvious change in either the kinetics of the uptake process orthe product distribution.
3.3 Uptake of HOBr to frozen surfaces: surface capacity
Even at high HOBr our experiments did not reveal com-plete deactivation (i.e. titration of reactive sites). Despitethis, some indication of the capacity of the surface to removeHOBr can be derived from the data in, e.g. Figs. 3 and 4.In Fig. 4, (NaCl = 2M, NaBr = 3× 10⁻⁴ M), during the ex-posure phase (t ∼ 450− 1500 s) approximately 1× 10¹⁶
HOBr have been lost from the gas-phase due to contact with∼ 80 cm2 of the frozen surface, yielding a lower limit to thecapacity of the frozen surface to remove HOBr of 1×10¹⁴ percm2. In contrast, in Fig. 3a (NaCl = 2M, NaBr = 3× 10⁻³
M) ∼ 5 × 10¹⁴ HOBr are taken up per cm2 (and convertedto Br2) with no significant change in the rate of reaction overthe exposure period. Again, this is different to the result inFig. 3b in which much higher fluxes of HOBr to the samesurface result in a deactivation of the surface after just 50 sin which ∼ 1.5 × 10¹⁴ HOBr were taken up. This indicatesthat the capacity of the surface to support reaction can de-pend on the rate of reactivation, perhaps due to surface re-organisation. Note that reactivation of the surfaces, whichare quite dynamic at these temperatures, has previously beendocumented by Holmes et al. (2001) in studies of HOI andIONO2 uptake.
Those experiments in which the pH of the aqueous solu-tion used to generate the frozen substrate was varied showthat the capacity of the surface of convert HOBr to BrCl orBr2 was not influenced by this parameter. Indeed, at a pH of10, the amount of HOBr taken up to the frozen surface andconverted to di-halogen can exceed the number of H+ ini-tially present in the entire sample by orders of magnitude. Incontrast to the aqueous phase, the surface reaction is clearlynot driven by the presence of protons.
3.4 HOBr uptake onto frozen salt surfaces: uptake coeffi-cients
As shown in, e.g. Fig. 3b, the uptake of HOBr onto a frozen,mixed salt surface is sometimes time dependent, with an ini-tially large uptake coefficient that decreases with exposuretime due to the deactivation of reactive surface sites. At lowconcentrations of HOBr and sufficiently high halide ion con-centrations the uptake was independent of exposure time onthe time scales of a typical experiment (e.g. Fig. 3a). In order
Table 1. Summary of kinetic and product data obtained for HOBruptake onto frozen salt surfaces
[Cl−] / M [Br −] / M T Major Products∗ γinit n
K
2 3× 10⁻³ 248 Br2 0.026± 0.006 10
2 3× 10⁻³ 233 Br2 0.032± 0.009 16
2 3× 10⁻³ 253 Br2 0.012± 0.005 2
2 3× 10⁻³ 243 Br2 0.017± 0.09 6
2 0 233 BrCl 0.043± 0.008 3
2 0 248 BrCl 0.016± 0.007 2
0 0.1 248 Br2 > 0.01 1
0 3× 10⁻³ 248 Br2 0.036 1
∗Product formed at short exposure times. The evolution of theproduct distribution as a function of reaction time is described inthe text.n = number of experiments.
to make meaningful comparison of uptake coefficients fromdifferent data sets, the uptake coefficient shortly after expo-sure,γinit , is reported. The initial uptake coefficients listedhave been corrected for radial concentrations gradients as de-scribed in the experimental section. Only those data wherethe criterionkcor ≤ 4kobs is fulfilled are reported/displayed asabsolute values, otherwise a lower limit toγinit is presented.One set of experiments was carried out to examine the effectof temperature on the initial uptake coefficient of HOBr toa mixed salt surface, whereby uptake coefficients were ob-tained at temperatures of 233, 243, 248 and 253 K, with the2 M Cl− / 3 × 10⁻³ M Br− surfaces. The results are pre-sented in Table 1, and plotted in Fig. 6 (solid circles). Thedata points are averages from several experiments. Althoughthe data are associated with some scatter (the errors bars rep-resent reproducibility) there is a trend of increasing uptakecoefficient with decreasing temperature. Also plotted withthis data are results obtained using the same initial Cl− con-centration, but without bromide present (open circles). Theinitial uptake coefficients are, within error limits, indistin-guishable from those with 3× 10⁻³ M bromide, and clearly,at these concentrations, the presence of bromide on the sur-face has little influence on the magnitude of the HOBr uptakecoefficient. This substantiates the arguments presented abovethat the initial step is the reaction of surface adsorbed HOBrwith the dominant halide ion, Cl−, rather than reaction withBr−. Uptake coefficients were also obtained for the reactionof HOBr with a surface prepared from freezing NaBr solu-tions of either 3× 10⁻³ or 0.1 M concentration.
www.atmos-chem-phys.org/acp/2/79/ Atmos. Chem. Phys., 2, 79–91, 2002

86 J. W. Adams et al.: Uptake and reaction of HOBr
Fig. 6. Temperature dependence of the initial uptake coefficient ofHOBr onto frozen surfaces made from solutions containing 2 MNaCl with and without added NaBr. The error bars define the re-producibility of the result.
3.5 BrCl, Br2 and Cl2 uptake onto frozen salt surfaces
The uptake of HOBr and release of Br2 is described abovein terms of formation of BrCl in a primary step, followedby reaction of BrCl on the surface with Br−. This conceptwas tested in separate experiments by measuring the uptakeof BrCl, Br2 and also Cl2 onto frozen salt surfaces of vary-ing composition. Representative data from an experiment toexamine the uptake of BrCl (plus Br2 and Cl2 impurity) ona mixed Br− / Cl− surface are shown in Fig. 7, which showsthat BrCl is taken up efficiently and that the increase in gas-phase Br2 is approximately equal to the summed loss of BrCland Cl2 from the gas-phase. If the initial Cl− to Br− ratio isclose to 660 as found in sea-water, BrCl will react on the sur-face to form Br2. A lower limit to the uptake coefficient of0.034 was obtained at 233 K.
In a further set of experiments the uptake of Br2 ontomixed salt surfaces was examined. Br2 was found to reactstrongly with these surfaces in halogen inter-conversion re-actions. Although BrCl is expected to be the primary prod-uct, it reacts with the surface bromide to form Br2. The up-take coefficient was determined to be> 0.025 at 233 K. Onpure bromide at 243 K, Br2 is both taken up to react withthe surface (γ > 0.01) and released to form a different Br2molecule. In this case, the use of isotopically labelled NaBrwas used to discriminate between the reactant and productBr2.
The uptake of Cl2 was examined on mixed salt surfaces at233 K, and resulted in the stoichiometric formation of Br2,presumably via the intermediacy of BrCl. A lower limit to
Fig. 7. Uptake of BrCl and Cl2 onto a mixed, frozen salt surfaceand formation of Br2. T = 233 K, 2 M NaCl, 3× 10⁻³ M NaBr.The Br2 and Cl2 traces have been offset for clarity of presentation.
the uptake coefficients of> 0.028 was obtained. These re-sults are summarised in Table 2.
3.6 HOBr uptake onto dry salt surfaces
Experiments to examine the uptake of HOBr onto dry sur-faces were performed on both mixed Br− / Cl− surfaces andpure Cl− surfaces, and at various relative humidities. For themixed salt at 243 K (see Fig. 8a),γ was found to be 2×10⁻²
and time independent. Uptake onto the pure Cl− surface(see Fig. 8b) behaved differently and was clearly time de-pendent, with an initial uptake coefficient of 6× 10⁻² thatdecreased to a steady value of≈ 3 × 10⁻³ after ≈ 500 s.BrCl was formed at high yield (≈ 70%), but not stoichio-metrically. Upon re-inserting the injector (t ≈ 2050 s) someHOBr was released from the surface to the gas-phase, indi-cating the presence of unreactive, physi-adsorption sites onthe chemically aged surface, and explaining the observationthat the yield of BrCl per HOBr lost from the gas-phase wasnot 100%. Similar to the uptake of HOBr onto frozen sur-faces, the uptake onto dried and humidified surfaces resultedin the release of both Br2 and trace amounts of BrCl, with Br2the major initial product released to the gas-phase, followedby BrCl release as the surface bromide was depleted. Therewas no change in the product distribution as the relative hu-midity was varied between 0 and 100%. Note that the deli-quescence relative humidities of NaCl at 298 K is 75.6% andshows a weak temperature dependence, increasing to∼ 76%at 273 K (Tang and Munkelwitz, 1993), that of NaBr is about58% at 298 K (Malvestuto and Ascoli, 2001). These resultsare summarised in Table 2.
Atmos. Chem. Phys., 2, 79–91, 2002 www.atmos-chem-phys.org/acp/2/79/

J. W. Adams et al.: Uptake and reaction of HOBr 87
3.7 Comparison with literature
3.7.1 HOBr uptake to frozen and dry surfaces
The present results pertaining to the uptake and reaction ofHOBr on frozen salt surfaces can be directly compared to thesimilar but less extensive studies of Kirchner et al. (1997).Also using a flow-tube / mass spectrometer set-up, those au-thors found that the reaction of HOBr on a frozen, mixedNaCl / NaBr surface at 233 K resulted in the release to thegas-phase of both BrCl and Br2 in roughly equal amounts.They determined an uptake coefficient for the process of≈ 1− 3× 10⁻³. As detailed in Sect. 2, the present work hasclearly shown that the use of HOBr concentrations in excessof 1011 cm−3 in studies of the HOBr uptake to salt surfacescan strongly influence both the kinetic behaviour and the ra-tio of the Br2 and BrCl products, and can also lead to theformation of Br2O on the surface. The factor of 10 differ-ence in the uptake coefficient and the vastly different productdistribution seen by these authors can therefore be explainedby their use of≈ 1013 cm−3 HOBr, i.e. a factor of 1000greater than routinely used in the present study. As we havealready shown, the use of high concentrations of HOBr leadsto rapid depletion of surface bromide, and increases the ratioof BrCl to Br2 observed in the gas-phase. At the same time,at such high HOBr concentrations, we expect a very rapidsurface saturation that leads to a much lower uptake coeffi-cient after an initially high value. Even at concentrations of≈ 1011 cm−3 this effect is apparent, and at 1013 cm−3 theinitial high uptake coefficient, would not be observable. Fol-lowing the initial large uptake, the subsequent low uptake isalso expected to show some time dependence, and results incurvature in plots of HOBr signal versus injector position. In-deed, a close examination of the raw data presented by Kirch-ner et al. (1997) reveals pronounced curvature in several ofthe uptake profiles. The low uptake coefficient measured bythese authors probably corresponds to uptake onto a surfacethat is severely depleted in available reactive sites.
There have been several studies of the uptake of HOBronto pure ice surfaces, which reveal a number of commonfeatures (Abbatt, 1994; Allanic et al., 1997; Chu and Chu,1999; Chaix et al., 2000) including a strong negative temper-ature dependence of the uptake coefficient between 175 and239 K, and the formation of Br2 and BrCl products when thesurface is doped with HBr or HCl respectively. The uptakecoefficients measured in these studies vary fromγ ≈ 0.5at 175 K toγ ≈ 10−3 at ≈ 230 K on pure ice. The uptakecoefficients on pure ice at 230 K are thus lower that thosemeasured on the frozen salt substrates of the present study,which wereγ ≈ 10−2 at 230 K. On the other hand, the pres-ence of HCl on the surface increases the uptake coefficientup toγ ≈ 0.2 at temperature close to 230 K, depending onthe amount of HCl available on the surface for reaction (Ab-batt, 1994; Chu and Chu, 1999). The observed formation ofBrCl and Br2 when Cl− and Br− are available at the surface
Fig. 8. Uptake of HOBr onto dried salt surface at 233 K(a) 2 MNaCl, 3× 10⁻³ M NaBr, (b) 2 M NaCl, 0 M NaBr.
is compatible with the present results, as is the observationof a fast reaction of BrCl with surface adsorbed HBr on icesurfaces at 180− 210 K to form Br2 (Allanic et al., 2000).
The interaction of HOBr with dry NaCl and KBr surfaceshas been examined at room temperature (Mochida et al.,1998). In that study no data were obtained for mixed saltsurfaces. For reaction with NaCl, the products observed wereBrCl and Br2, whereby the Br2 was believed to arise from aself-reaction of HOBr on the surface, and decomposition ofthe subsequently formed Br2O. The BrCl evolution into thegas-phase displayed an induction period as observed in thepresent work. Br2 was observed as the sole gas-phase prod-uct of the HOBr + KBr interaction. Mochida et al. (1998)reported initial uptake coefficients ofγ = (6.5±2.5)×10−3
for NaCl andγ = (0.18± 0.04) for KBr.
www.atmos-chem-phys.org/acp/2/79/ Atmos. Chem. Phys., 2, 79–91, 2002

88 J. W. Adams et al.: Uptake and reaction of HOBr
3.7.2 BrCl, Cl2 and Br2 uptake to frozen and dry surfaces
There have been a number of studies of the interactionsof the di-halogens BrCl, Cl2 and Br2 with both dry andfrozen salt surfaces. Berko et al. (1991) examined quali-tative aspects of the uptake and reaction of Cl2 and BrClwith dry NaBr crystals. They found that whilst BrCl re-acted with NaBr to form Br2 directly, the uptake of Cl2 re-sulted in initial formation and release of Br2, followed byBrCl. This is consistent with the present results and mech-anism for reaction of Cl2 with mixed salt surfaces. BrClis formed in the first step of the reaction in which Cl2 re-acts with NaBr, but is converted to Br2 before it can leavethe bromide-rich surface. Only after the surface has beensufficiently depleted in Br− can BrCl escape to the gas-phase. Kinetic data on the reaction of Cl2 with dry syntheticsea-salt have also been obtained, and an uptake coefficient ofγ ≈ 2 × 10⁻² reported (Mochida et al., 1998). As in thepresent study, Br2 (rather than BrCl) was observed as thedominant product. The reaction of Cl2 with frozen, mixedsalt surfaces of similar composition to those reported herewas examined by Huff and Abbatt (2000). They found anefficient interaction at 248 K, but no evidence for reaction at233 K (γ < 0.002), which the authors reported as surprising.This observation contrasts the present result in which the up-take coefficient was found to be greater than 0.028 at 233 K,and where Br2 product was observed at high yield. The re-sult of Huff and Abbatt (2000) at 248 K, whereby an uptakecoefficient ofγ = 0.048 was obtained is more in line withthe present observations, as is the observation that Br2 is thedominant product (98–99%). These authors also carried outa detailed study of the reaction of Cl2 with surfaces preparedfrom solutions containing various amounts of Br− (in the ab-sence of Cl−) and found a strong dependence of the uptakecoefficient on this parameter at 233 K.
The same authors have also examined the reaction of BrClwith frozen, Br− containing salt surfaces and also find anefficient conversion of BrCl to Br2 and an uptake coeffi-cient that depended on the Br− concentration, with valuesof γ = 0.018 for [Br−] = 0.01 M, andγ = 0.042 for [Br−]= 0.1 M. Importantly, for reaction of both Cl2 and BrCl, theyalso observed no dependence of the uptake coefficient on thepH of the solution used to prepare the surface, which is con-sistent with the present observations for HOBr.
4 Conclusions and implications for the chemistry of thepolar boundary layer
In the present study it has been shown that HOBr reacts effi-ciently with surfaces prepared by freezing synthetic salt so-lutions of similar Br− / Cl− ratio and ionic strength to seawater. Use of very low HOBr concentrations has enabled usto show that previous results (Kirchner et al., 1997) on boththe uptake coefficient and product yields were erroneous due
to use of very high HOBr concentrations in the gas-phase,that modified the relative surface abundance of Br− and Cl−
on the time scale of the measurements. Various aspects of ourobservations are discussed below in the context of their im-plications for helping us understand the cause of low ozoneevents (LOEs) in both the Arctic and Antarctic boundary lay-ers. In doing this we note that whereas our laboratory-madesurfaces, prepared from pure chloride / bromide solutions arenot perfect replicas of sea-ice, or sea-spray that has been de-posited on the ice pack, they allow the variation of parame-ters (i.e. the Cl− to Br− ratio and the pH) that enable us togain some insight into the chemical mechanisms of halogenactivation and release.
Firstly we note that the uptake of HOBr to a fresh, frozensea-salt surface does not initially lead to the release of BrCl,which is consistent with our measurements in the aqueousphase (Fickert et al., 1999). A significant depletion of sur-face Br− is necessary before the slow rate of desorption ofBrCl from the surface allows it to compete with its transfor-mation to Br2. If halogen activation is initiated by gas-phasebromine chemistry that leads to HOBr formation, we wouldpredict first bromine activation and later the release of chlo-rine. At first glance, this appears to disagree with the resultsof Ramacher et al. (1999) who, by making measurements ofhydrocarbon depletion rates, were able to show that duringeach ozone depletion event the time integrated chlorine atomconcentration increases earlier than the bromine. However,as discussed by these authors, the presence of high concen-trations of Br atoms (available to react with hydrocarbons)is precluded by ozone mixing ratios in excess of≈ 10 ppb,whereas Cl atom / hydrocarbon reactions are relatively unaf-fected by the presence of these ozone concentrations.
We also observe that, in stark contrast to reaction in theaqueous phase, the uptake of HOBr to Br− / Cl− contain-ing ice surfaces leads to release of molecular di-halogens athigh yield even at low H+ concentrations. In the marineboundary layer at mid-latitudes the deposition of HOBr tothe surface of the sea does not lead to release of di-halogens,but requires the acidification of aerosol sea-spray by uptakeof gases such as SO2, HNO3 (Sander and Crutzen, 1996)or methane sulphonic acid (Ayers et al., 1999) (MSA), andgives halogen activation a strong dependence on the concen-tration of airborne particles, and thus wind strength. In veryclean environments, and in the absence of a significant sourceof CH3SCH3 (precursor of MSA), di-halogen activation byHOBr uptake is therefore inoperative. Our observation thatthe uptake of HOBr and the formation of Br2 or BrCl is effi-cient on dry and frozen salt surfaces made from non-acidifiedsolutions may help explain why low ozone events still occurin the clean air of the Antarctic even though mechanisms toacidify particles may not be available. A complicating is-sue here is caused by the presence of a liquid-phase whichis believed to be associated with these frozen surfaces, andin which high concentrations of Cl− and Br− are expectedto be present (Koop et al., 2000). The reaction of HOBr
Atmos. Chem. Phys., 2, 79–91, 2002 www.atmos-chem-phys.org/acp/2/79/

J. W. Adams et al.: Uptake and reaction of HOBr 89
Table 2. Summary of kinetic and product data obtained for uptake of BrCl, Cl2 and Br2 onto frozen salt surfaces, and HOBr onto dry (andhumidified)1 salt surfaces
Trace gas Surface2 T Major Products3 γinitK
BrCl Br− / Cl− (Frozen) 233 Br2 > 0.034
Br2 Br− / Cl− (Frozen) 233 Br2 > 0.025
Br2 Br− (Frozen) 243 Br2 > 0.01
Cl2 Br− / Cl− (Frozen) 233 Br2 > 0.028
HOBr Br− / Cl− (Dry) 243 Br2 0.02
HOBr Cl− (Dry) 233 BrCl 0.06
1Relative humidity varied from 0 to 100%.2Br−/Cl− surfaces were made from 2 M Cl− / 3 × 10⁻³ M Br− solutions. The Cl− surfaces were prepared from 2 M Cl− solutions, theBr− surfaces were prepared from 3× 10⁻³ M solutions.3Product formed at short exposure times. The evolution of the product distribution as a function of reaction time is described in the text.
with Cl− and or Br− in liquid environments should requirea pH which is lower than that of sea-water to result in halo-gen activation as long as sufficient liquid is present to causedissolution and ionisation of HOBr. Our measurements ofthe uptake coefficient of HOBr on frozen sea-salt surfaces ofγ = 2 × 10⁻² enables comparison between, and linking ofthe heterogeneous and homogeneous gas-phase processes oc-curring in the boundary layer at the poles during a LOE to bemade. If most of the heterogeneous chemistry involving saltsurfaces is taking place at the snow pack rather than in sus-pended sea-salt aerosols (Tang and McConnell, 1996; Sanderet al., 1997), values ofγ of this magnitude imply that the rateof reaction of HOBr at the surface of the snow pack will belimited by its deposition velocity, which, following Huff andAbbatt (2000), and assuming a mixed layer of 100 m height,is ≈ 0.6 cm s−1. Although there may be a weak source ofBr atoms due to the photolysis of bromoform (Barrie et al.,1988), which may be sufficient to initiate bromine chemistryat polar sunrise, most photochemical activity will take placeclose to the snow pack, where Br2 is released and photolysed(to form two Br atoms, Reaction 8) on time scales that maybe short relative to times required for vertical mixing. TheBr atoms can react with O3 to form BrO.
Br2 + hν → 2 Br (7)
2 Br + 2 O3 → 2 BrO+ 2 O2 (8)
BrO + HO2 → HOBr + O2 (9)
HOBr + Cl−/Br− → BrCl/Br2 + OH− (10)
At normal levels of O3 (≈ 40 ppb, Hausmann and Platt, 1994;Hopper et al., 1998), most Br atoms will react with O3, andthe loss of one HOBr in a heterogeneous process and theformation of 2 HOBr via Reaction sequence (8 and 9) im-plies that the photochemical / heterogeneous chemistry tak-ing place at the snow pack is of a chain branching nature,
and will result in efficient release of reactive halogen speciesas long as sufficient Br− is present in the surface snow-packand sufficient O3 is present in the gas-phase so that formationof BrO is efficient compared to reaction with aldehydes. Ifthe reservoir of Br− is significantly depleted before all gas-phase O3 has been consumed, then chlorine activation can beexpected, as BrCl is released in preference to Br2. Fast sur-face reactions and the short lifetimes of the reactive brominespecies with respect to photo-dissociation imply that mixingof O3 rich air masses distant from the snow pack with O3poor air masses very close to the surface will be importantin determining the occurrence and duration of LOEs. Theseconsiderations preclude a simple description of the hetero-geneous and gas-phase reactions that initiate and maintainhigh concentrations of reactive halogens in the polar bound-ary layer, which can only be done with the use of models thatcontain both gas-phase and heterogeneous halogen chemistry(the objectives of this paper) and appropriate parameterisa-tion of mixing and transport of air masses over the snowpack. The reader is referred to the recent modelling studyby Michalowski et al. (2000) which shows that O3 depletionis very sensitive to the concentration of HOBr, and the rateof its uptake to Br− and Cl− containing surfaces.
Acknowledgements.We extend our thanks to Thomas Koop for sev-eral helpful discussions regarding the freezing of halide solutions,and for making his data available prior to publication. We thankRolf Sander for critically reading the manuscript. We acknowl-edge the European Union for financial support (ENV4-CT97-0394,HAMLET).
References
Abbatt, J. P. D.: Heterogeneous reaction of HOBr with HBr andHCl on ice surfaces at 228 K, Geophys. Res. Lett., 21, 665–668,
www.atmos-chem-phys.org/acp/2/79/ Atmos. Chem. Phys., 2, 79–91, 2002

90 J. W. Adams et al.: Uptake and reaction of HOBr
1994.Abbatt, J. P. D. and Waschewsky, G. C. G.: Heterogeneous inter-
actions of HOBr, HNO3, O3 and NO2 with deliquescent NaClaerosols at room temperature, J. Phys. Chem., 102, 3719–3725,1998.
Allanic, A., Oppliger, R., and Rossi, M. J.: Real-time kinetics ofthe uptake of HOBr and BrONO2 on ice and in the presence ofHCl in the temperature range 190–200 K, J. Geophys. Res., 102,23 529–23 541, 1997.
Allanic, A., Oppliger, R., van den Bergh, H., and Rossi, M. J.: Theheterogeneous kinetics of the reactions ClONO2 + HX/ice (X =Br, I), BrONO2 + HI/ice and the reactivity of the interhalogensBrCl, ICl and IBr with HX/ice in the temperature range 180 to210 K, Z. Phys. Chem., 214, 1479–1500, 2000.
Anlauf, K. G., Mickle, R. E., and Trivett, N. B. A.: Measurement ofozone during polar sunrise experiment 1992, J. Geophys. Res.,99, 24 345–24 353, 1994.
Ayers, G. P., Gillett, R. W., Cainey, J. M., and Dick, A. L.: Chlorideand bromide loss from sea-salt particles in Southern Ocean air, J.Atmos. Chem., 33, 299–319, 1999.
Barrie, L. and Platt, U.: Arctic tropospheric chemistry: Anoverview, Tellus, 49B, 450–454, 1997.
Barrie, L. A., Bottenheim, J. W., and Hart, W. R.: Polar sunriseexperiment 1992 (PSE 1992): Preface, J. Geophys. Res., 99,25 313–25 314, 1994.
Barrie, L. A., Bottenheim, J. W., Schnell, R. C., Crutzen, P. J., andRasmussen, R. A.: Ozone destruction and photochemical reac-tions at polar sunrise in the lower Arctic atmosphere, Nature,334, 138–141, 1988.
Berko, H. N., McCaslin, P. C., and Finlayson-Pitts, B. J.: Formationof gas-phase bromine compounds by reaction of solid NaBr withgaseous ClONO2, Cl2, and BrCl at 298 K, J. Phys. Chem., 95,6951–6958, 1991.
Boudries, H. and Bottenheim, J. W.: Cl and Br atom concentrationsduring a surface boundary layer ozone depletion event in theCanadian high Arctic, Geophys. Res. Lett., 27, 517–520, 2000.
Brown, R. L.: Tubular flow reactors with first-order kinetics, J. Res.Nat. Bur. Standards, 83, 1–8, 1978.
Chaix, L., Allanic, A., and Rossi, M. J.: Heterogeneous chemistryof HOBr on different types of ice and on ice doped with HCl,HBr and HNO3 at 175< T/K < 215, J. Phys. Chem. A, 104,7268–7277, 2000.
Chance, K.: Analysis of BrO measurements from the global ozonemonitoring experiment, Geophys. Res. Lett., 25, 3335–3338,1998.
Chu, L. and Chu, L. T.: Heterogeneous interaction and reaction ofHOBr on ice films, J. Phys. Chem. A, 103, 8640–8649, 1999.
Fan, S.-M. and Jacob, D. J.: Surface ozone depletion in Arcticspring sustained by bromine reactions on aerosols, Nature, 359,522-524, 1992.
Fickert, S., Adams, J. W., and Crowley, J. N.: Activation of Br2 andBrCl via uptake of HOBr onto aqueous salt solutions, J. Geophys.Res., 104, 23 719–23 727, 1999.
Fickert, S., Helleis, F., Adams, J. W., Moortgat, G. K., and Crowley,J. N.: Reactive uptake of ClNO2 on aqueous bromide solutions,J. Phys. Chem., 102, 10 689–10 696, 1998.
Foster, K. L., Plastridge, R. A., Bottenheim, J. W., Shepson, P. B.,Finlayson-Pitts, B. J., and Spicer, C. W.: The role of Br2 andBrCl in surface ozone destruction at polar sunrise, Science, 291,
471–474, 2001.Ghosal, S., Shbeeb, A., and Hemminger, J. C.: Surface segregation
of bromine in bromide doped NaCl: Implications for the seasonalvariations in Arctic ozone, Geophys. Res. Lett., 27, 1879–1882,2000.
Hanson, D. R. and Ravishankara, A. R.: The reaction probabilitiesof ClONO2 and N2O5 on polar stratospheric cloud material, J.Geophys. Res., 96, 5081–5090, 1991.
Hanson, D. R., Burkholder, J. B., Howard, C. J., and Ravishankara,A. R.: Measurement of OH and HO2 radical uptake coefficientson water and sulfuric acid surfaces, J. Phys. Chem., 96, 4979–4985, 1992.
Hanson, D. R. and Ravishankara, A. R.: Response to “Commenton porosities of ice films used to simulate stratospheric cloudsurfaces”, J. Phys. Chem., 97, 2802–2803, 1993.
Hausmann, M. and Platt, U.: Spectroscopic measurements ofbromine oxide and ozone in the high Arctic during polar sunriseexperiment 1992, J. Geophys. Res., 99, 25 399–2 5414, 1994.
Holmes, N. S., Adams, J. W., and Crowley, J. N.: Uptake and reac-tion of HOI and IONO2 on frozen and dry NaCl / NaBr surfacesand H2SO4, Phys. Chem. Chem. Phys., 3, 1679–1687, 2001.
Hopper, J. F., Barrie, L. A., Silis, A., Hart, W., Gallant, A. J., andDryfhout, H.: Ozone and meteorology during the 1994 polar sun-rise experiment, J. Geophys. Res., 103, 1481–1492, 1998.
Howard, C. J.: Kinetic measurements using flow tubes, J. Phys.Chem., 83, 3–9, 1979.
Huff, A. K. and Abbatt, J. P. D.: Gas-Phase Br2 production in het-erogeneous reactions of Cl2, HOCl and BrCl with halide-ice sur-faces, J. Phys. Chem., 104, 7284–7293, 2000.
Impey, G. A., Mihele, C. M., Anlauf, K. G., Barrie, L. A., Hastie,D. R., and Shepson, P. B.: Measurements of photolyzable halo-gen compounds and bromine radicals during the polar sunriseexperiments 1997, J. Atmos. Chem., 34, 21–37, 1999.
Impey, G. A., Shepson, P. B., Hastie, D. R., Barrie, L.A ., and An-lauf, K. G.: Measurement of photolyzable chlorine and bromineduring the polar sunrise experiment 1995, J. Geophys. Res., 102,16 005–16 010, 1997.
Ingham, T., Bauer, D., Landgraf, J., and Crowley, J. N.: Ultraviolet-visible absorption cross sections of gaseous HOBr, J. Phys.Chem., 102, 3293–3298, 1998.
Jobson, B. T., Niki, H., Yokouchi, Y., Bottenheim, Y., Hopper, F.,and Leaitch, R.: Measurements of C2-C6 hydrocarbons duringpolar sunrise experiment 1992, J. Geophys. Res., 99, 25 355–25 368, 1994.
Keyser, L. F., Leu, M.-T., and Moore, S. B.: Comment on porositiesof ice films used to simulate stratospheric cloud surfaces, J. Phys.Chem., 97, 2800–2801, 1993.
Kirchner, U., Benter, T., and Schindler, R. N.: Experimental veri-fication of gas phase bromine enrichment in reactions of HOBrwith sea salt doped ice surfaces, Ber. Bunsen Ges. Phys. Chem.,101, 975–977, 1997.
Koop, T., Kapilashrami, A., Molina, L. T., and Molina, M. J.: Phasetransitions of sea-salt/water mixtures at low temperatures: Impli-cations for ozone chemistry in the polar marine boundary layer,J. Geophys. Res., 105, 26 393–26 402, 2000.
Kreher, K., Johnson, P. V., Wood, S. W., Nardi, B., and Platt, U.:Ground-based measurements of tropospheric and stratosphericBrO at Arrival Heights, Antarctica, Geophys. Res. Lett., 24,3021–3024, 1997.
Atmos. Chem. Phys., 2, 79–91, 2002 www.atmos-chem-phys.org/acp/2/79/

J. W. Adams et al.: Uptake and reaction of HOBr 91
Lorenzen-Schmidt, H., Wessel, S., Unold, W., Solberg, S., Ger-nandt, H., Stordal, F., and Platt, U.: Ozone measurements in theEuropean Arctic during the ARCTOC 1995 campaign, Tellus,50B, 416–429, 1998.
Malvestuto, V. and Ascoli, S.: A deliquescence model for alkalihalide nuclei, Meteorol. Z., 10, 37–43, 2001.
McConnell, J. C., Henderson, G. S., Barrie, L., Bottenheim, J., Niki,H., Langford, C. H., and Tempelton, E. M. J.: Photochemicalbromine production in Arctic boundary-layer ozone depletion,Nature, 355, 150–152, 1992.
Michalowski, B. A., Francisco, J. S., Li, S. M., Barrie, L. A., Bot-tenheim, J. W., and Shepson, P. B.: A computer model study ofmultiphase chemistry in the Arctic boundary layer during polarsunrise, J. Geophys. Res., 105, 15 131–15 145, 2000.
Miller, H. L., Weaver, A., Sanders, R. W., and Arpag, K.:Measurements of arctic sunrise surface ozone depletion eventsat Kangerlussuaq, Greenland (67◦ N, 51◦ W), Tellus, 49B, 496–509, 1997.
Mochida, M., Akimoto, H., van den Bergh, H., and Rossi, M. J.:The heterogeneous kinetics of the uptake of HOBr on solid al-kali halides at ambient temperatures, J. Phys. Chem., 102, 4819–4828, 1998.
Mochida, M., Hirokawa, J., Kajii, Y., and Akimoto, H.: Hetero-geneous reactions of Cl2 with sea salts at ambient temperature:Implications for halogen exchange in the atmosphere, Geophys.Res. Lett., 25, 3927–3930, 1998.
Mozurkewich, M.: Mechanisms for the release of halogens fromsea-salt particles by free radical reactions, J. Geophys. Res., 100,14 199–14 207, 1995.
Oltmans, S. J.: Surface Ozone Measurements in Clean-Air, J. Geo-phys. Res., 86, 1174–1180, 1981.
Oltmans, S. J., Schnell, R. C., Sheridan, P. J., Peterson, R. E., Li,S.-M., Winchester, J. W., Tans, P. P., Sturges, W. T., and Kahl, J.D.: Seasonal surface ozone and filterable bromine relationship inthe high Arctic, Atmos. Environ., 23, 2431–2441, 1989.
Perner, D., Arnold, T., Crowley, J., Klupfel, T., Martinez, M., andSeuwen, R.: The measurement of active chlorine in the atmo-sphere by chemical amplification, J. Atmos. Chem., 34, 9–20,1999.
Ramacher, B., Rudolph, J., and Koppmann, R.: Hydrocarbon mea-surements in the spring arctic troposphere during the ARCTOC95 campaign, Tellus, 49B, 466–485, 1997.
Ramacher, B., Rudolph, J., and Koppmann, R.: Hydrocarbon mea-surements during tropospheric ozone depletion events: Evidencefor halogen atom chemistry, J. Geophys. Res., 104, 3633–3653,1999.
Rockmann, T., Brenninkmeijer, C. A. M., Crutzen, P. J., and Platt,U.: Short-term variations in the C13/C12 ratio of CO as a mea-sure of Cl activation during tropospheric ozone depletion eventsin the Arctic, J. Geophys. Res., 104, 1691–1697, 1999.
Rudolph, J., Fu, B. R., Thompson, A., Anlauf, K., and Bottenheim,J.: Halogen atom concentrations in the Arctic troposphere de-rived from hydrocarbon measurements: Impact on the budget offormaldehyde, Geophys. Res. Lett., 26, 2941–2944, 1999.
Sander, R. and Crutzen, P. J.: Model study indicating halogen ac-tivation and ozone destruction in polluted air masses transportedto the sea, J. Geophys. Res., 101, 9121–9138, 1996.
Sander, R., Vogt, R., Harris, G. W., and Crutzen, P. J.: Modelingthe chemistry of ozone, halogen compounds, and hydrocarbonsin the arctic troposphere during spring, Tellus, 49B, 522–532,1997.
Solberg, S., Schmidbauer, N., Semb, A., and Stordal, F.: Boundary-layer ozone depletion as seen in the Norwegian Arctic in spring,J. Atmos. Chem., 23, 301–332, 1996.
Tang, I. N. and Munkelwitz, H. R.: Composition and tempera-ture dependence of the deliquescence properties of hygroscopicaerosols, Atmos. Environ., 27A, 467–473, 1993.
Tang, T. and McConnell, J. C.: Autocatalytic release of brominefrom Arctic snow pack during polar sunrise, Geophys. Res. Lett.,23, 2633–2636, 1996.
Tuckermann, M., Ackermann, R., Golz, C., Lorenzen-Schmidt,H., Senne, T., Stutz, J., Trost, B., Unold, W., and Platt, U.:DOAS observations of halogen radical-catalyzed arctic boundarylayer ozone destruction during the ARCTOC-campaigns 1995and 1996 in Ny-Alesund, Spitsbergen, Tellus, 49B, 533–555,1997.
Wachsmuth, M., Gaeggeler, H. W., von Glasow, R., and Am-mann, M.: Accommodation coefficient of HOBr on deliquescentsodium bromide aerosol particles, Atmos. Chem. Phys. Disc., 2,1–28, 2002.
Wang, T. X., Kelley, M. D., Cooper, J. N., Beckwith, C., andMargerum, D. W.: Equilibrium, kinetic and UV-spectral char-acteristics of aqueous bromine chloride, bromine and chlorinespecies, Inorg. Chem., 33, 5872–5878, 1994.
Wessel, S., Aoki, S., Winkler, P., Weller, R., Herber, A., Gernandt,H., and Schrems, O.: Tropospheric ozone depletion in polar re-gions. A comparison of observations in the Arctic and Antarctic,Tellus, 50B, 34–50, 1998.
Zangmeister, C. D., Turner, J. A., and Pemberton, J. E.: Segregationof NaBr in NaBr / NaCl crystals grown from aqueous solutions:Implications for sea salt surface chemistry, Geophys. Res. Lett.,28, 995–998, 2001.
www.atmos-chem-phys.org/acp/2/79/ Atmos. Chem. Phys., 2, 79–91, 2002