upscaling water productivity in irrigated agriculture using remote-sensing and gis technologies 2003
DESCRIPTION
Upscaling Water Productivity in Irrigated Agriculture Using Remote-sensing and GIS TechnologiesTRANSCRIPT

18 Upscaling Water Productivity in IrrigatedAgriculture Using Remote-sensing and GIS
Technologies
Wim Bastiaanssen,1 Mobin-ud-Din Ahmad2 and Zubair Tahir31International Institute for Aerospace Survey and Earth Sciences, Enschede, TheNetherlands; 2International Water Management Institute, Colombo, Sri Lanka;
3International Water Management Institute, Lahore, Pakistan
© CAB International 2003. Water Productivity in Agriculture: Limits and Opportunities for Improvement (eds J.W. Kijne, R. Barker and D. Molden) 289
Abstract
Reliable information on water depletion for agricultural production is much needed when freshwaterresources are getting scarcer. This is the case in the irrigated Indus basin. Despite their importance, datarequired to monitor the productivity of the land and water resources over vast areas are usually not avail-able or accessible. Satellite measurements from the National Oceanic and Atmospheric Adminstration(NOAA) weather satellite are combined in this study with ancillary in situ data into a geographic informa-tion system (GIS). Remote-sensing measurements are converted to crop yield, to actual evapotranspirationand, indirectly, to net groundwater use. The GIS data consist of canal-water deliveries and rainfall records.For each of the canal commands, the productivity of water is calculated. Large variability in the data isfound from the different canal commands in the Indus basin. It is concluded that water productivity iscontrolled more by crop yields than by the water input. The spatial variability of productivity per unitwater diverted is greater than per unit depleted. This can be ascribed to wide variations in the relationshipbetween canal-water supply and actual evapotranspiration. This is an issue covered by classical irrigationefficiencies. Upscaling of water productivity for the Indus basin was achieved by aggregating the variouscanal command areas from the upstream end of the system downwards. The results show that the produc-tivity of water tends to a constant value at a spatial scale of 6 million ha and higher. At that scale, waterdiversion and water depletion are equal, which implies that groundwater systems, to a large extent, regu-late losses and reuse of water resources. The Indus basin is an example of substantial groundwater recy-cling and this needs to be taken into account in analytical frameworks of water productivity.
Introduction
When freshwater resources are gettingscarcer, such as in the irrigated Indus basin,it is necessary to have an accurate descrip-tion of the depletion of the water resource asa result of agricultural production.Frameworks for the formulation and assess-
ment of water productivity have been devel-oped by Molden et al. (1998) and Seckler et al.(Chapter 3, this volume), and have beenused in water-management studies (e.g.Droogers and Kite, 1999).
Water-management techniques often focuson ‘saving’ water at field level, but, in water-scarce conditions, water is diverted at one
Water Prod - Chap 18 15/7/03 10:17 am Page 289

place and used at another. It is, therefore, ofextreme importance to gain an insight into theefficiencies and productivities at larger scales.Traditional field surveys and field-scale water-balance measurements cannot give a compre-hensive description of the water flows at theregional scale. Processes, such as recharge,capillary rise and groundwater extractions, aredifficult to measure or estimate for subsys-tems. These water terms are mentioned in par-ticular, as they are reflected in the processes ofwater recycling. However, information oncrop acreage, yields and canal-water deliveriesis also difficult to obtain, as actual canal opera-tion may differ substantially from the plan-ning and design discharges.
Lack of data required for monitoring theproductivity of the land and water resources,especially over vast irrigation schemes andriver basins, can often hamper the applica-tion and understanding of the water-produc-tivity framework. The aim of this chapter isto demonstrate how remote-sensing and geo-graphic information system (GIS) tools canhelp in assessing water productivity andhow productivity varies with spatial scale.
Hydrological Approach
The soil-water balance and crop-productionvalues form the basis for the water-produc-tivity analysis. The soil-water balance relatestotal supply to total consumption and has astorage term for cases when inflow and out-flow are not balanced (see also Fig. 18.1).
∆S = (P + Icw + Itw + q↑) � (ETa + q↓) (mm) (18.1)
where ∆S is the storage change, P is precipita-tion, Icw is canal-water supply, Itw is ground-water supply through tube wells, q↑ iscapillary rise, ETa is the actual evapotranspira-tion and q↓ is the recharge. Since several termsof Equation 18.1 are difficult to quantify, thethree groundwater terms are taken together:
NGW = Itw + q↑ � q↓ (mm) (18.2)
where NGW is the net groundwater use, i.e.the extractions of groundwater minus the netrecharge. NGW represents the net with-drawal of groundwater, which is important
for the sustainability analysis. The rechargeq↓ comprises the return flow from tube-wellirrigation, Itw, but can also arise from precipi-tation, P, and canal-water irrigation, Icw.After combining Equations 18.1 and 18.2, thesimplified water-balance equation is:
∆S = P + Icw + NGW � ETa (mm) (18.3)
For the current case study in the Indusbasin, P is taken from rain gauges, Icw fromflow records and ETa from remote sensing.The two unknowns are then ∆S and NGW. If,in addition, the storage changes are ignored,which is not correct in all canal commandareas, NGW remains as the residual term ofthe water balance. The storage changesdepend on groundwater-table fluctuations,which in some cases can be as much as100 mm year�1 (see Ahmad andBastiaanssen, 2003). A sufficient number ofpiezometric readings was not available toestimate ∆S in a systematic manner across theentire Indus basin. Because of this limitation,∆S was disregarded, as is usually done inhydrological studies for longer time periods.
290 W. Bastiaanssen et al.
Icw Pu ETa Itw
Unsaturated zone
q(hm = 0) q(hm = 0)
qbot
Deep groundwater
Saturated zone
Fig. 18.1. Schematic presentation of the soil-waterbalance.
Water Prod - Chap 18 15/7/03 10:17 am Page 290
Hydrological Results
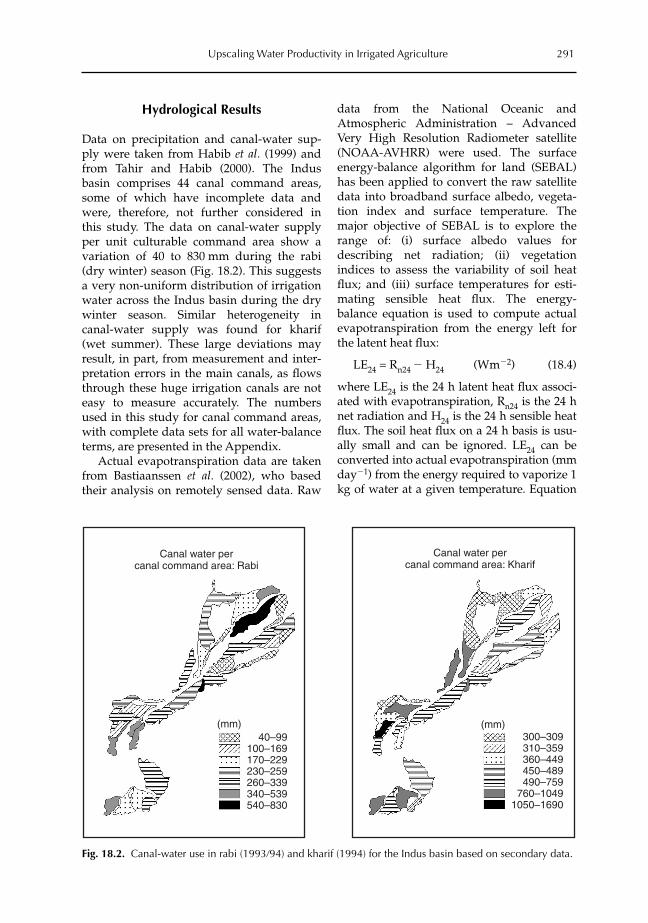
Data on precipitation and canal-water sup-ply were taken from Habib et al. (1999) andfrom Tahir and Habib (2000). The Indusbasin comprises 44 canal command areas,some of which have incomplete data andwere, therefore, not further considered inthis study. The data on canal-water supplyper unit culturable command area show avariation of 40 to 830 mm during the rabi(dry winter) season (Fig. 18.2). This suggestsa very non-uniform distribution of irrigationwater across the Indus basin during the drywinter season. Similar heterogeneity incanal-water supply was found for kharif(wet summer). These large deviations mayresult, in part, from measurement and inter-pretation errors in the main canals, as flowsthrough these huge irrigation canals are noteasy to measure accurately. The numbersused in this study for canal command areas,with complete data sets for all water-balanceterms, are presented in the Appendix.
Actual evapotranspiration data are takenfrom Bastiaanssen et al. (2002), who basedtheir analysis on remotely sensed data. Raw
data from the National Oceanic andAtmospheric Administration – AdvancedVery High Resolution Radiometer satellite(NOAA-AVHRR) were used. The surfaceenergy-balance algorithm for land (SEBAL)has been applied to convert the raw satellitedata into broadband surface albedo, vegeta-tion index and surface temperature. Themajor objective of SEBAL is to explore therange of: (i) surface albedo values fordescribing net radiation; (ii) vegetationindices to assess the variability of soil heatflux; and (iii) surface temperatures for esti-mating sensible heat flux. The energy-balance equation is used to compute actualevapotranspiration from the energy left forthe latent heat flux:
LE24 = Rn24 � H24 (Wm�2) (18.4)
where LE24 is the 24 h latent heat flux associ-ated with evapotranspiration, Rn24 is the 24 hnet radiation and H24 is the 24 h sensible heatflux. The soil heat flux on a 24 h basis is usu-ally small and can be ignored. LE24 can beconverted into actual evapotranspiration (mmday�1) from the energy required to vaporize 1kg of water at a given temperature. Equation
Upscaling Water Productivity in Irrigated Agriculture 291
Canal water percanal command area: Rabi
Canal water percanal command area: Kharif
40–99100–169170–229230–259260–339340–539540–830
(mm) 300–309310–359360–449450–489490–759
760–10491050–1690
(mm)
Fig. 18.2. Canal-water use in rabi (1993�94) and kharif (1994) for the Indus basin based on secondary data.
Water Prod - Chap 18 15/7/03 10:17 am Page 291
18.4 was used to compute the actual evapo-transpiration for cloud-free NOAA imagesacquired during 20 different days throughoutan annual cycle. Individual day results weretemporally integrated by preserving the evap-orative fraction between two successive satel-lite acquisition days. The evaporative fractionon a daily time basis is equal to LE24/Rn24.This energy partitioning was fixed until thenext available AVHRR image. Since net radia-tion changes considerably due to cloud coverthat may arise during satellite flyover days,day-to-day variations of Rn24 have been takeninto account to compute LE24 from the tempo-rally preserved LE24/Rn24 fraction. The Indus
basin was divided for this purpose into fiveclimatic zones, and daily global radiation(short-wave radiation reaching the land sur-face) was computed for every climatic zone.
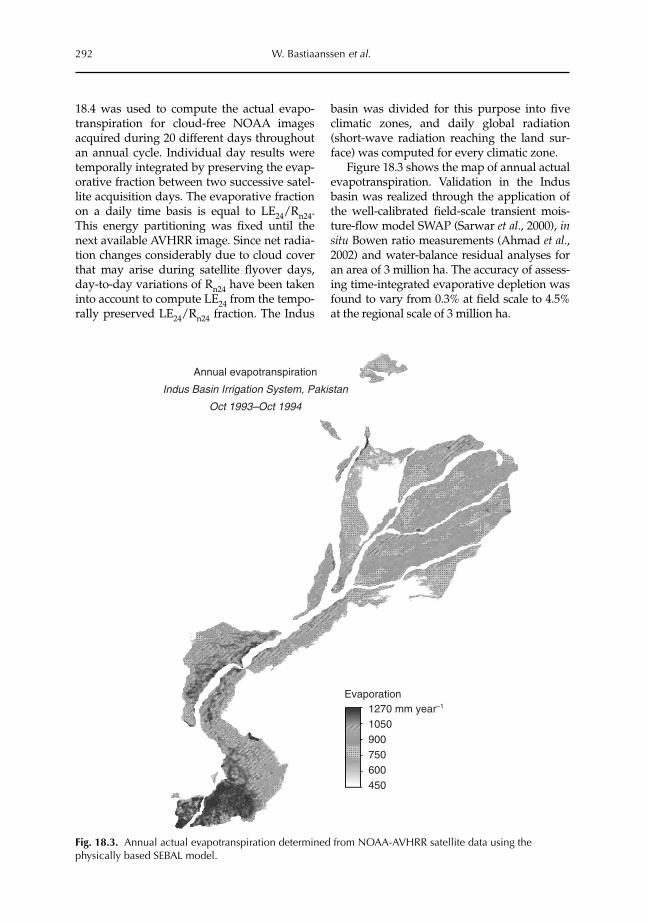
Figure 18.3 shows the map of annual actualevapotranspiration. Validation in the Indusbasin was realized through the application ofthe well-calibrated field-scale transient mois-ture-flow model SWAP (Sarwar et al., 2000), insitu Bowen ratio measurements (Ahmad et al.,2002) and water-balance residual analyses foran area of 3 million ha. The accuracy of assess-ing time-integrated evaporative depletion wasfound to vary from 0.3% at field scale to 4.5%at the regional scale of 3 million ha.
292 W. Bastiaanssen et al.
1270 mm year–1
1050900750600450
Evaporation
Annual evapotranspiration
Indus Basin Irrigation System, Pakistan
Oct 1993–Oct 1994
Fig. 18.3. Annual actual evapotranspiration determined from NOAA-AVHRR satellite data using thephysically based SEBAL model.
Water Prod - Chap 18 15/7/03 10:17 am Page 292

Actual evapotranspiration during the rabiwas, on average, 350 mm, while kharif had atotal consumption of 620 mm. The spatialvariation is again – as for canal-water supply– very high, with annual evapotranspirationvalues ranging from 450 to 1270 mm year�1!
Water supply to the cropped area cancome from three difference sources, i.e. canalirrigation, Icw, groundwater irrigation, Itw,and net precipitation, Pn (gross precipitationP minus interception losses Pi and surfacerunoff). For the sustainability of irrigationsystems, it is important to estimate the extentto which irrigated agriculture depends ongroundwater resources. The groundwater–resource ratio, ξ , is defined as the ratio ofgroundwater irrigation, Itw, to the totalinflow from all sources:
ξ = Itw/(Icw + Itw + Pn) (�) (18.5)
A map of the groundwater–resource ratio ξis shown in Fig. 18.4. It demonstrates thatthere is little contribution of groundwater dur-ing kharif and a relatively significant amountof groundwater use during the dry rabi season(the rainfall in many areas varies from 25 to50 mm). During rabi, some areas rely for 80%of their water resources on groundwater.
Crop Yield
Crop yield is a major input in water-produc-tivity frameworks. Crop-yield information isclassically collected through field surveys.This is a laborious activity, especially whenone has to deal with vast areas. To aid theground sampling and to swiftly obtain anoverall picture of the crop development, aremote-sensing model for crop-yield predic-tion was developed and applied (Bastiaanssenand Ali, 2003). This model is based onMonteith’s equation for biomass production,which reads in its simplest form as:
Bio = APAR ε (kg m�2 day�1) (18.6)
where Bio (kg m�2 day�1) is the biomass pro-duction, APAR (MJ m�2) is the absorbedphotosynthetic active radiation and ε (kgMJ�1) is the light-use efficiency. Incomingsolar radiation and light interception byleaves control APAR. Solar radiation wascomputed from the actual hours of sun-shine, and the leaf presence from the nor-malized difference vegetation index (NDVI),being derived from the NOAA-AVHRR sen-sor. The light-use efficiency ε depends notonly on the type of crop (C3 or C4), but also
Upscaling Water Productivity in Irrigated Agriculture 293
Groundwater–resource ratio: Rabi
0.0–0.10.1–0.20.2–0.30.3–0.40.4–0.60.6–0.80.8–0.9
(–) 0.0–0.020.02–0.060.06–0.080.08–0.140.14–0.200.20–0.260.26–0.30
(–)
Groundwater–resource ratio: Kharif
Fig. 18.4. Groundwater–resource ratio (fraction net groundwater use/total water resources available) forcanal command areas in rabi (1993�94) and kharif (1994).
Water Prod - Chap 18 15/7/03 10:17 am Page 293

on the soil-moisture availability, whichaffects leaf water potential. Moisture stressreduces the light-use efficiency, and thisfeedback was taken into account by incorpo-rating the evaporative fraction (LE24/Rn24)into the light-use efficiency. The biomassproduction rates for single NOAA acquisi-tion days were further integrated in time byconsidering day-to-day variation of cloudcover, which affects APAR because cloudsreflect and scatter solar radiation. The light-use efficiency ε was made quasi-variable byadjusting the value between consecutiveNOAA images.
Remote-sensing estimates of crop yieldhave been validated against secondary datacollected by the Agriculture Department ofPakistan. The validation revealed a rootmean square error of 525, 616, 551 and 13,484kg ha�1 for wheat, rice, cotton and sugarcaneyield, respectively. The deviation betweensecondary data and remote-sensing datashows that the yield of wheat, rice and sug-arcane can be mapped for approximately80% of the cases within the 95% confidencelevels of the secondary field data. On aver-age, crop yields in Pakistan are on the lower
side. The yields are 2276, 1756, 1293 and47,929 kg ha�1 for wheat, rice, cotton andsugarcane, respectively. A comparison withthe study of Hussain et al. (2000), who col-lected crop-cutting experimental data inSindh, confirmed the wheat yields to be lowin Sindh. In Fig. 18.5, yields of wheat, cottonand rice are presented for 26 out of the 44canal commands. The canal command areasare numbered from the upstream to thedownstream end. It is evident that, exceptfor wheat, location in the basin does not sig-nificantly affect yields.
Water Productivity
One of the first issues in water-productivitydata is to identify which ‘crop’ and which‘drop’ are referred to. To differentiatebetween water productivity per unitdepleted and per unit canal-water supplymakes sense, as the former describes howproductively water that leaves the basin isused, whereas the latter illustrates the returnfrom canal-management efforts and irriga-tion-sector investments.
294 W. Bastiaanssen et al.
Wheat
Cotton
Rice
3,500
3,000
2,500
2,000
1,500
1,000
500
01 4 9 11 17 20 23 25 32 34 36 39 42
Canal command area
Yie
ld (
kg h
a–1)
Fig. 18.5. Canal command area yield data for wheat, cotton and rice. The yield data have been computedfrom NOAA-AVHRR data.
Water Prod - Chap 18 15/7/03 10:17 am Page 294

Molden et al. (1998) suggested definingwater productivity per unit diverted irriga-tion supply, the latter meaning ‘surface irriga-tion water diverted to the command area plus netremovals from groundwater’ (writers’ italics).There are reasons why we believe that theuse of ‘unit canal-water supply’ in thedenominator may have some advantages forthe Indus basin:
● The irrigation manager is responsible forcanal-water supply and prefers to under-stand the impact of the expensive irrigationinfrastructure. Groundwater managementis usually delegated to institutions otherthan the irrigation departments.
● Adding together water flows originatingfrom different sources (P, Icw, Itw) preventsthe study of the impact of separatesources. In particular, the important roleof groundwater in respect of water pro-ductivity gets hidden if it is included inthe diverted water.
We propose using the following set ofdefinitions:
WPETa = Ya/ETa (kg m�3) (18.7)
WPIcw = Ya/Icw (kg m�3) (18.8)
WP$ = GVP/Icw (US$ m�3) (18.9)
where Ya (kg ha�1) is the actual crop yieldand GVP (US$ kg�1) is the gross value ofproduction. GVP is computed from the cropproduction of every crop, its market priceand its acreage. The indicator WP$ is espe-cially suitable as it comprises the total pro-duction of different crops. Also, it can beused in the comparison with water-produc-tivity values of other users, such as fish pro-duction, ecosystems, etc.
Ya and ETa raster data from satellites canbe easily combined to make crop-specificevaluations of WPETa; this is not straightfor-ward for Ya/Icw, as crop-specific Icw data areseldom available. Hence, WPETa has theadvantage that it can be used to make crop-specific evaluations. Table 18.1 contains anoverview of the basin-wide crop-specificproductivity values. It shows that sugarcaneand cotton have higher water consumptionthan rice because of their longer growingperiod. Cotton has the lowest WPETa valuesand sugarcane the highest. However, the useof world market prices of agricultural prod-ucts for 1994 shows that cotton is more eco-nomically productive than rice and wheat.This, by itself, shows that evaluating agricul-tural production and water-resources deple-tion is not straightforward.
With data on crop yield, actual evapo-transpiration and canal-water flow availablein the GIS database, it became feasible tocompute WPETa and WPIcw. The case ofwheat is given as an example (Fig. 18.6).WPETa varies from 0.2 to 0.8 kg m�3, which isreally a low value. A literature search onWPETa for wheat showed an average value ofapproximately 1.0 kg m�3; hence, Pakistan isperforming poorly in terms of WPETa, as thewhole range is less than the worldwideaverage. The WPETa trend in Fig. 18.6 showsthat the response of wheat yield to evapora-tion is not constant; the value for WPETaincreases with higher yields (R2 = 0.83). Theobvious conclusion, then, is that wheat witha higher yield is more efficient in terms ofwater depletion. This is worth exploring fur-ther in future studies.
Upscaling Water Productivity in Irrigated Agriculture 295
Table 18.1. Average output in terms of physical and economical production per unitwater depleted in the Indus basin during rabi 1993/94 and kharif 1994.
Productivity GVP per per unit unit
Evapotranspiration Crop yield consumed consumedCrop (mm) (kg ha�1) (kg m�3) (US$ m�3)
Cotton 579 1,293 0.22 0.43Rice 414 1,756 0.42 0.13Wheat 357 2,276 0.64 0.10Sugarcane 965 47,929 4.97 –
Water Prod - Chap 18 15/7/03 10:17 am Page 295

WPIcw is higher than WPETa because ETaexceeds Icw during the dry winter season.The spatial variability of WPIcw is more thanfor WPETa, because ETa and Icw have a weakrelationship due to unequal canal-water dis-tribution throughout the basin (see Fig. 18.2).This brings us to the relationship betweenETa and Icw, which is addressed in the classi-cal irrigation-efficiency concept (e.g.Israelsen, 1950; Keller et al., 1996; Seckler etal., Chapter 3, this volume) as:
Ec = (ETa � Pnet)/Icw � 100 (18.10)
where the numerator represents the net irri-gation requirements and the denominatorthe canal-water supply. When the efficiency,Ec, is lower than 100%, water that is not evap-orated from moist soil or transpired by cropsis considered as lost in the classical efficiencyconcept. This may be true if water that isdrained from irrigation schemes flows out ofthe basin or is no longer available for furtheruse by any other means. In most cases, how-ever, drainage water rejoins the river down-stream of an irrigation system.
In the absence of a surface-water drainagesystem, this ‘lost’ water stays in the system
as groundwater. Irrigation systems such as inthe Indus basin are underlain by a produc-tive aquifer with high permeability, and heregroundwater is transferred laterally andpumped up by shallow and deep tube wells.If this water is reused in an irrigation system,classical efficiency is not a suitable indicatorof water productivity. Thus, canal water‘lost’ from one irrigation command area maybe reused in another.
Classical irrigation efficiencies were calcu-lated for a set of canal commands for bothrabi and kharif seasons to demonstrate how:(i) groundwater use has surprising effects onthe irrigation efficiency; and (ii) ETa relates toIcw . Figure 18.7 shows that, in the wet sum-mer kharif season, Ec ranges between 50 and200%. The map shows that canal commandareas with Ec > 100% can be found next tocommand areas with Ec < 100%. This suggeststhat there is a net groundwater movement inthe direction of the command area with thehighest efficiency. Unfortunately, appropriatepiezometric data were not available to verifythese flow directions. But, if ETa >> (P + Icw),it is obvious that groundwater is an impor-tant source of irrigation.
296 W. Bastiaanssen et al.
2.00
1.50
1.00
0.50
0.000 500 1000 1500 2000 2500 3000 3500
Wat
er p
rodu
ctiv
ity (
kg m
–3)
Wheat yield (kg ha–1)
Per unit depleted (ETa)
Per unit diverted (lcw)
Per unit diverted (lcw + lgw)
Fig. 18.6. Relationship between water and land productivity for a wheat crop across the Indus basin. Everypoint represents one canal command area.
Water Prod - Chap 18 15/7/03 10:17 am Page 296

By comparing the situation in the twoseasons, it appears that command areas hav-ing a low Ec in kharif – because precipitationP and canal water Icw far exceed the actualcrop evapotranspiration ETa – respond withEc > 100% during the rabi season. This is fea-sible if kharif water is carried over to the rabiseason through soil moisture and groundwa-ter storage mechanisms. Hence, Fig. 18.7shows that recycling of water is a veryimportant issue in the Indus basin, not onlybetween adjoining command areas, but alsobetween successive growing seasons. Thus,groundwater acts as a storage mechanismand a mediator for making canal operationsmore effective.
Spatial-scale Issues
How do the water productivity and effi-ciency change with scale? Our GIS databaseallowed us to aggregate various canal com-mand areas. This has been done in theupstream to downstream direction, whichallowed us to study the productivity at dif-ferent spatial scales. The hydrological datawere combined first and weighted according
to the area, i.e. mixing-cell approach.Thereafter, the productivity was recalculatedassuming that one is dealing with a unifiedand larger canal command area, instead of amosaic of separated canal command areas.The smallest scale is 43,000 ha and thelargest scale for a total of 32 combined canalcommand areas became 11.6 million ha. Thetotal size of all canal command areas in theIndus basin is larger, but not all of themcould be included, due to missing data. Thewheat crop in the rabi season was chosenbecause it is the dominant winter crop andmost canal water is used for the irrigation ofwheat. Figure 18.8, which is a plot of theupscaled water productivity of wheat pro-duction during rabi 1993�94, shows two veryimportant phenomena:
● WPIcw has greater spatial scale variabilitythan WPETa.
● WPIcw and WPETa tend to have the samevalue at increasing scales.
The highest water productivity in theIndus basin occurs in smaller canal com-mand areas, especially where the ground-water-resource ratio is high. But, as can beseen in Fig. 18.8, low water-productivity
Upscaling Water Productivity in Irrigated Agriculture 297
Classical irrigationefficiency: Rabi
0.00–0.330.33–1.251.25–1.731.73–2.672.67–3.823.82–5.955.95–11.18
(–)0.40–0.550.55–0.850.85–0.970.97–1.181.18–1.311.31–1.531.53–2.09
(–)
Classical irrigationefficiency: Kharif
Fig. 18.7. Classical irrigation efficiencies for canal command areas in rabi (1993�94) and kharif (1994). Thevalues are given as a fraction.
Water Prod - Chap 18 15/7/03 10:17 am Page 297

values are also found at this smaller scale.Figure 18.8 shows that PWIcw decreasesfrom 2.0 kg m�3 at a scale of 2.0 million hato 1.0 kg m�3 at the 6 million ha scale.These results arise from merging the morefertile soils with a high yield in Punjab inthe upstream part of the basin, with thedownstream areas receiving less canalwater during rabi and being prone to salin-ity in Sindh.
Water-management interventions andwater-saving techniques should thereforefocus more on reducing the wide range inWPIcw values at scales between, say, 10,000to 1 million ha, and not aim to promotechanges in one (small) area within thebasin. An important conclusion from thiswork is that increasing WPIcw in a poorlyperforming canal command area comes atthe cost of highly productive systems else-where in the region. But it will result in lessfluctuation of WPIcw at a lower scale andreduces the scale below which variabilitybecomes insignificant. One of the targets inwater-resources management is to obtainthe averages of WPETa = 0.55 and WPIcw =0.66 kg m�3 at the smallest possible scale,i.e. the scale above which no furtherchanges in the values are likely to occur(correlation length in geostatistics).
Conclusions
Water productivity can be expressed per unitwater diverted and per unit water depleted.Since actual crop yield and actual evapotran-spiration both depend on plant physiologicalprocesses – stomata need to open for carboninhalation and vapour exhalation – the pro-ductivity per unit depleted shows less vari-ability than the productivity per unitdiverted. The relationship between diversionand depletion is complex and not clearbeforehand. It is demonstrated in this chap-ter that the ratio of crop yield to evapotran-spiration is not conservative and there issome scope for improving productivity perunit depleted, by enhancing physical yieldper unit land area.
The biggest challenge, though, is toincrease the productivity per unit of waterdiverted. The results reveal that a significantvariability exists due to variations in the clas-sical irrigation efficiency. The variationsaverage out if one moves to a larger scale.This can only be explained hydrologically ifgroundwater recycling occurs as a predomi-nant process. Water budgets demonstratethat net groundwater use is a key componentof the water balance. Productivity of waterper unit consumed and per unit diverted
298 W. Bastiaanssen et al.
6.0
5.0
4.0
3.0
2.0
1.0
0.0
Wat
er p
rodu
ctiv
ity (
kg m
–3)
Cumulative canal command area (million ha)
0 2 4 6 8 10 12
Wheat (rabi 1993/94) Per unit consumed
Per unit diverted
Fig. 18.8. Upscaling of water productivity over the canal command areas in the Indus basin system for thedry winter season, when wheat is predominantly cultivated.
Water Prod - Chap 18 15/7/03 10:17 am Page 298

become equal at a scale of 6 million ha,which proves that water in the Indus basin isnot lost but is used by evaporative depletionelsewhere in the system. A significant trans-fer of water was detected from the wet sum-mer season to the dry winter season. Butgroundwater may also flow to adjoiningcanal command areas. Piezometric informa-tion is required to verify this hypothesis.
The impact of small-scale interventions,such as alternate wet–dry phases in rice pro-duction, zero tillage, micro-water harvesting,etc., can help improve the local water pro-ductivity. There is, however, a possibilitythat they adversely affect water productivityelsewhere and may further enhance spatialdifferences in water productivity. Therefore,we recommend narrowing the amplitude ofwater productivity. That will ultimately leadto a smaller scale above which the averagewater productivity in the basin stabilizes.Interventions should start in the areas withthe lowest water productivity.
Significant progress has been made in thedevelopment of frameworks for irrigationefficiency, performance ratios, etc. It is feltthat carry-over groundwater from neigh-bouring irrigation schemes and from the pre-ceding season needs to be more explicitlyaddressed in these analytical water-produc-tivity frameworks.
This work has demonstrated how afford-able images, such as NOAA-AVHRR or fromalternative sensors, can help in providing a quick scan of parameters necessary for water-productivity assessment. Moreresearch needs to be done on the assessmentof soil water-storage changes. Satellite datahave been used to determine crop occur-rence, actual evapotranspiration by crops,crop yield and, indirectly, net groundwateruse. This helps in environments where dataare not present or are difficult to access.Coarse images, such as NOAA, are suitablefor getting an overall impression at schemelevel. Smaller areas or specific crop typeswould require finer-resolution images, suchas those available from Landsat and theAdvanced Spaceborne Thermal Emissionand Reflection Radiometer.
Acknowledgements
The authors wish to express their gratitudeto the Punjab Irrigation and DrainageAuthority (PIDA), Pakistan MeteorologicalDepartment (PMD), Water and PowerDevelopment Authority (WAPDA) and theDirectorate of Economic and Marketing ofthe Provincial Agriculture Department formaking available the required information.
Upscaling Water Productivity in Irrigated Agriculture 299
References
Ahmad, M.D. and Bastiaanssen, W.G.M. (2003) Retrieving soil moisture storage in the unsaturated zonefrom satellite imagery and bi-annual groundwater table fluctuations. Irrigation and Drainage Systems(in press).
Ahmad, M.D., Bastiaanssen, W.G.M. and Feddes, R.A. (2002) Sustainable use of groundwater for irriga-tion: a numerical analysis of the subsoil water fluxes. ICID Journal for Irrigation and Drainage 51(3),227–241.
Bastiaanssen, W.G.M. and Ali, S. (2003) A new crop yield forecasting model based on satellite measure-ments applied across the Indus basin, Pakistan. Journal of Agriculture, Ecosystems and Environment94(3), 321–340.
Bastiaanssen, W.G.M., Ahmad, M.-ud-D. and Chemin, Y. (2002) Satellite surveillance of evaporativedepletion across the Indus basin. Water Resources Research 38(12), 1273–1282.
Droogers, P. and Kite, G.F. (1999) Water productivity from integrated basin modeling. Irrigation andDrainage Systems 13, 275–290.
Habib, Z., Tahir, Z. and Khan, A.R. (1999) Across-the-basin-analysis of water and land utilization usingspatio-temporal information techniques emphasize the need for integrated resources management.In: Musi, Fritsch and Pereira (eds) Proceedings of the 2nd Inter-Regional ICID Conference on Water andEnvironment, Lausanne, September 1999.
Hussain, I., Marikar, F. and Jehangir, W. (2000) Productivity and Performance of Irrigated Wheat Farms Across
Water Prod - Chap 18 15/7/03 10:17 am Page 299

Canal Commands in the Lower Indus Basin. IWMI Research Report 44, International WaterManagement Institute, Colombo, Sri Lanka.
Israelsen, O.W. (1950) Irrigation Principles and Practices, 2nd edn. John Wiley & Sons, New York. Keller, A., Keller, J. and Seckler, D. (1996) Integrated Water Resource Systems: Theory and Policy Implications.
Research Report 3. International Water Management Institute, Colombo, Sri Lanka, 15 pp.Molden, D.J., Sakthivadivel, R., Perry, C.J., de Fraiture, C. and Kloezen, W.H. (1998) Indicators for
Comparing Performance of Irrigated Agricultural Systems. Research Report 20, International WaterManagement Institute, Colombo, Sri Lanka, 26 pp.
Sarwar, A., Bastiaanssen, W.G.M., Boers, Th.M. and van Dam, J.C. (2000) Evaluating drainage designparameters for the Fourth Drainage Project, Pakistan by using SWAP model: Part 1: calibration.Irrigation and Drainage Systems 14, 257–280.
Tahir, Z. and Habib, Z. (2000) Land and Water Productivity Trends Across Punjab Canal Commands.International Water Management Institute, Working Paper 14. Pakistan Country Series No. 3,International Water Management Institute, Lahore, 35 pp.
300 W. Bastiaanssen et al.
Appendix 1: canal command wise water balances for rabi and kharif
A negative net groundwater use reveals recharge, a positive value relates to groundwater depletion. Alldata are expressed in gross canal command area.
Rabi Kharif
Canal Net Net command Canal groundwater Canal groundwater area Rain water ETa use Rain water ETa use
1 26 55 346 +265 410 281 633 �583 36 212 336 +87 295 279 588 +154 25 59 320 +236 254 290 583 +395 25 64 347 +258 250 466 575 �1419 25 256 367 +86 480 356 675 �161
10 25 140 359 +195 305 222 570 +4311 44 165 300 +91 310 233 453 �9013 25 234 350 +91 250 380 595 �3517 25 30 302 +246 250 360 549 �6119 25 612 222 �415 145 558 421 �28220 25 225 277 +28 150 480 480 �15022 25 146 363 +192 65 466 594 +6423 25 217 344 +102 138 677 622 �19324 25 138 335 +172 206 628 597 �23725 25 29 347 +293 237 212 634 +18431 25 97 391 +269 50 820 707 �16332 25 203 372 +144 50 514 599 +35.333 25 254 404 +125 50 396 635 +18934 25 120 422 +279 50 1425 720 �75535 25 308 405 +71 50 583 597 �3636 25 373 422 +24 50 577 697 +7037 25 266 304 +13 50 322 500 +12939 25 245 358 +88 127 367 619 +12641 25 286 392 +80 150 415 756 +19142 25 156 411 +230 120 820 790 �14943 25 147 412 +240 58 563 776 +155
Water Prod - Chap 18 15/7/03 10:17 am Page 300