upsc engineering service 50% discount on ies - adapala academy · adapala academy when adapala...
TRANSCRIPT

50% Discount on IES GS 2020
Online Coaching Institute for Engineering Service & GATE exams
www.adapala-academy.com www.iesgeneralstudies.com
Theory Booklet
ESE 2020 UPSC Engineering Service
Prelims Paper -1
GENERAL STUDIES & ENGINEERING APTITUDE
‣ Environment ‣ Energy ‣ Engineering Ethics ‣ Project Management
ESE General Studies Video Lecture Theory Booklet
www.iesgeneralstudies.com www.adapala-academy.com 3
Chandra Sekhar Adapala (IISc, IES)
These books are divided into two volumes, together covering seven out of ten topics of the ESE prelims (Environment and Energy, Information and Communication Technologies, Engineering Ethics, Project Management, Quality Practice, Design, Drawing and Safety, Engineering Drawing). Separate Practice question booklet (consisting of 5000+ questions) by Adapala Academy will give enough practice for the theory covered in these materials. Subjects covered in this (Booklet-1) are
1. Environment and Energy 2. Information and Communication Technologies 3. Engineering Ethics 4. Project Management
For the current affairs, download the monthly and yearly Hyperloops from www.iesgeneralstudies.com and follow the Academy for the video lectures on the same. The efforts of Anueeja S and other faculty members, to make this book possible, are appreciated.
“Success is no accident. It is hard work, perseverance, learning, studying, sacrifice and most of all, love of what you are doing or learning to do”. – Pele
Wishing you Happy Learning, Chandra Sekhar Adapala
Adapala Academy
When Adapala Academy (IES GS) started video lectures for the ESE General Studies and Engineering Aptitude, we realised the necessity of the theory booklets in consonance with the lectures. These booklets contain the topics, that are covered in the video lectures in detailed and lucid manner, with appropriate examples. We believe in quality, rather than the quantity of the materials that are flooding the market irrespective of the exam requirement. Topics covered in these books are apt and are oriented for the exam preparation.

ESE General Studies Video Lecture Theory Booklet
www.iesgeneralstudies.com www.adapala-academy.com 4

ESE General Studies Video Lecture Theory Booklet
www.iesgeneralstudies.com www.adapala-academy.com 5
Table of Contents
ENVIRONMENT ................................................. 8
1. Environment, Ecology and Ecosystems ............. 9 1. Introduction ............................................................. 9 2. Energy Flow ............................................................. 9 3. Ecological Pyramids ............................................... 10 4. Food Chain and Food Webs ................................... 10 5. Productivity ............................................................ 11 6. Nutrient Cycles or Biogeochemical Cycles ............. 12 7. Levels of Organisation ........................................... 13 8. Biotic Interactions .................................................. 14 9. Habitat and Niche .................................................. 15 10. Biomes ................................................................. 15 11. Different Ecosystems ........................................... 18 12. Ecosystems in India .............................................. 21 13. Ecosystem Services .............................................. 22 14. Ecological Footprint ............................................. 23 15. Biodiversity .......................................................... 23
2. The Atmosphere ............................................ 26 1. Atmospheric Layers and Composition ................... 26 2. Elements of Weather and Climate ......................... 27 3. Winds, Storms and Cyclones .................................. 29 4. Gas Equations ........................................................ 30
3. Pollution and Degradation ............................. 32 1. Introduction ........................................................... 32 2. Air Pollution ........................................................... 32 3. Calculations on Air Pollution .................................. 36 4. Prevention and Control of Air Pollution ................ 37 5. Radioactive Pollution ............................................. 39 6. Surface Water Pollution ......................................... 40 7. Groundwater Pollution .......................................... 43 8. Marine Pollution and Degradation ........................ 44 9. Water Management .............................................. 45 10. Land Pollution and Degradation .......................... 47 11. Solid Waste Management ................................... 48 12. Degradation of Ecosystems ................................. 50 13. Noise Pollution ..................................................... 51 14. Comprehensive Environment Pollution Index (CEPI) ......................................................................... 51
4. Ozone ............................................................ 53 1. Ozone Layer ........................................................... 53 2. Ozone Depletion .................................................... 53 3. Protection of the Ozone Layer ............................... 54
5. Climate Change .............................................. 56 1. Climate Change and Global Warming .................... 56 2. How Global Warming Causes Climate Change? ..... 57 3. Mitigation and Adaptation .................................... 59 4. Global Efforts ......................................................... 61 5. National Efforts ...................................................... 64
6. Conservation .................................................. 66 1. Environmental Conversation ................................. 66 2. Global Efforts ......................................................... 67 3. National Efforts ...................................................... 71 4. Environmental Impact Assessment ....................... 74
ENERGY ........................................................... 78
1. Energy Resources and Power Production ....... 79 1. Classification of Energy Sources ............................ 79 2. Biofuels ................................................................. 80 3. Thermal Power Plants ........................................... 83 4. Nuclear Energy ...................................................... 83 5. Solar Energy .......................................................... 84 6. Wind Energy .......................................................... 85 7. Ocean Energy ........................................................ 86 8. Geo - Thermal Energy ............................................ 86 9. Hydrogen Energy ................................................... 86 10. Shale Gas ............................................................. 87 11. Coal Bed Methane (CBM) .................................... 87 12. Hydroelectric Power ........................................... 88 13. Power Transmission and Distribution ................. 88 14. Challenges in Energy ........................................... 89 15. Energy Production and Distribution in India ....... 90
2. Energy Conservation ...................................... 92 1. How Can We Conserve Energy? ............................ 92 2. Renewable Energy in India .................................... 95 3. Mechanisms for Energy Conservation in India ...... 96 4. Institutions ............................................................ 97
ENGINEERING ETHICS ...................................... 99
1. Introduction to Ethics .................................... 100 1. Study of Ethics ..................................................... 100 2. Ethical Judgements ............................................. 100 3. Ethical Scrutiny .................................................... 101 4. Ethical Principles ................................................. 101 5. Ethical Rights ....................................................... 102 6. Theories of Ethics (V-C-R) .................................... 102 7. Human Values ..................................................... 104 8. Concept of Justice ............................................... 105 9. Ethical Skills ......................................................... 105 10. Environmental Ethics ........................................ 105
2. Emotional Intelligence (EI) ............................ 106 1. Introduction ........................................................ 106 2. Importance of Emotions and EI ........................... 106 3. Sympathy, Empathy and Compassion ................. 106
3. Attitude ........................................................ 107 1. What is Attitude? ................................................ 107 2. CAB Model: ......................................................... 107 3. Attitude Functions ............................................... 107
4. Persuasion and Influence .............................. 108 1. Persuasion - Technique and Strategies ............... 108 2. Influence and Power ........................................... 108
5. Organisational and Professional Ethics .......... 110 1. Ethical Competencies and Duties ........................ 110 2. Corporate Ethics .................................................. 110 3. Internal and External Responsibilities of an Employee ................................................................ 111 4. Whistle Blowing .................................................. 112 5. Conflicts of Interest ............................................. 113 6. Sexual Harassment and Discrimination in Work Places ...................................................................... 114
6. Engineering Ethics ......................................... 115 1. Engineering Ethics ............................................... 115
ESE General Studies Video Lecture Theory Booklet
www.iesgeneralstudies.com www.adapala-academy.com 6
2. Macro and Micro - Ethics ..................................... 115 3. Professional Roles and Responsibility .................. 116 4. Intellectual Property Rights (IPR) ......................... 116 5. Code of Ethics ...................................................... 117 6. Fundamental Values - Safety, Health and Public Welfare .................................................................... 117 7. Ethical Issues ........................................................ 119 8. Professional Rights ............................................... 120
7. Sample Code of Ethics .................................. 121 1. Preamble .............................................................. 121 I. Fundamental Canons ............................................ 121 II. Rules of Practice .................................................. 121 III. Professional Obligations ..................................... 122
8. Ethics Lexicon ............................................... 124 1. Aptitude ............................................................... 124 2. Ability ................................................................... 124 3. Probity in Profession ............................................ 124 4. Honesty and Integrity .......................................... 124 5. Neutrality ............................................................. 125 6. Plurality ................................................................ 126
INFORMATION AND COMMUNICATION TECHNOLOGY ................................................ 127
1. Computing ................................................... 128 1. Introduction ......................................................... 128 2. Computer Software ............................................. 128 3. Different Types of Computing ............................. 131 4. Cloud Computing - Models and Application ........ 132 5. Input Devices ....................................................... 133 6. Output Devices .................................................... 134 7. Computer Ports ................................................... 136 8. Data Storage ........................................................ 137 9. Multimedia .......................................................... 138
2. Networking .................................................. 140 1. Networking Introduction ..................................... 140 2. Network Devices .................................................. 142 3. Network Architectures and Models ..................... 143 4. Internet Operations ............................................. 145 5. World Wide Web ................................................. 147 6. Web Services and Applications ............................ 149 7. Mediums of Connection – Wired and Wireless ... 150
3. Communication ............................................ 154 1. Basis of Communication ...................................... 154 2. Propagation of Waves .......................................... 156 3. Satellite Communication ..................................... 156 4. Mobile Communication ....................................... 159 5. Telephone Communication ................................. 162 6. Radio Communication ......................................... 162 7. Radar, Sonar, Lidar ............................................... 163
4. Applications ................................................. 165 1. Services on Internet ............................................. 165 2. Online Transactions/ Online Business ................. 167 3. Biometrics ............................................................ 168 4. M2M and IOT ....................................................... 169 5. Database Management Systems ......................... 170 6. Big Data ................................................................ 170 7. Artificial Intelligence and Machine Learning ....... 170
5. E-Education ................................................... 172 1. ICT in Education .................................................. 172 2. Tools and Technologies ....................................... 172 3. Networking in Education ..................................... 174 4. Digital Libraries and Digital Contents .................. 174 5. Government Initiatives in E - Education .............. 175
6. E - Governance .............................................. 177 1. Governance ......................................................... 177 2. E governance ....................................................... 177 3. Digital India ......................................................... 178 4. Electronic Financial Transactions ........................ 180 5. Services by ISRO .................................................. 181 6. Internet Governance ........................................... 182
7. Cyber Security ............................................... 183 1. Cyber Threats ...................................................... 183 2. Cyber Crimes ....................................................... 183 3. Cyber Security ..................................................... 184 4. Network Security Measures ................................ 185 5. Cryptography ...................................................... 186 6. Intrusion Prevention and Detection systems ...... 187 7. Other security Measures ..................................... 188 8. Best Practices ...................................................... 189 9.Government Initiatives ........................................ 189
8. Basics of Programming Language .................. 191 1. Programming Languages ..................................... 191 2. Data Structures ................................................... 192 3. Programming Paradigms ..................................... 193 4. C Language .......................................................... 194 5. C++ Language ...................................................... 194 6. JAVA .................................................................... 195 7. Web Development Languages ............................ 195
PROJECT MANAGEMENT ............................... 197
1. Introduction .................................................. 198 1. What is a Project? ............................................... 198 2. Project Management .......................................... 198 3. Project Organization ........................................... 200 4. Project Manager - Role and Responsibilities ....... 201
2. Project Initiation ........................................... 203 1. Project Identification: ......................................... 203 2. Project Pre - Feasibility and Feasibility Study ...... 203 3. Market Feasibility Qualitative Methods .............. 204 4. Market Feasibility Quantitative Methods ........... 204 5. Financial Feasibility ............................................. 207 6. Detailed Project Report ....................................... 209 7. Project Charter .................................................... 210
3. Project Planning and Scheduling ................... 211 1. Introduction to Planning ..................................... 211 2. Work Breakdown Structure (WBS) ...................... 211 3. Project Scheduling ............................................... 212 4. Scheduling Using Charts ...................................... 212 5. Introduction to Network Diagram ....................... 214 6. Introduction to Critical Path Method .................. 216 7. Introduction To PERT (Program Evaluation & Review Techniques) ............................................................. 218 8. Resources Allocation Technique - Levelling and Smoothing ............................................................... 220
ESE General Studies Video Lecture Theory Booklet
www.iesgeneralstudies.com www.adapala-academy.com 7
4. Project Monitoring and Control .................... 222 1. Earned Value Analysis .......................................... 222 2. Graph of Cumulative Project Cost PV (BCWS) ..... 223 3. Line of Balance Techniques ................................. 224 4. Project Crashing ................................................... 225 5. Cost Estimating: ................................................... 226 6. Types of Estimates ............................................... 227 7. Approximate Estimates: ...................................... 227
5. Project Evaluation and Closure ..................... 229 1. What is Project Closure? ...................................... 229 2. Evaluation and Auditing ....................................... 229
6. Compound Interest Factors [Engg Economics] ........................................................................ 231
1. Basic Terms and Mathematics ............................. 231 2. Different Interest Rates ....................................... 232 3. Equivalence and Cash Flow Diagrams .................. 232 4. Single Payment Compound Amount Factor ......... 233 5. Single - Payment Present Worth Method: ........... 233 6. Uniform Series Present Worth Factor .................. 233 7. Sinking Fund Factor ............................................. 234 8. Uniform Series Compound Amount Factor ......... 234 9. Sinking fund factor ............................................... 234 10. Non - Annual Compounding .............................. 235 11. Arithmetic Gradient: .......................................... 237 12. Geometric Gradient Series ................................ 237 13. Comparison of Alternatives ............................... 237
7. Depreciation of Equipment [Engg. Economics] ........................................................................ 239
1. What is Depreciation? ......................................... 239 2. Straight Line(SL) Depreciation Method ................ 239 3. Declining Balance (DB) Depreciation Method ..... 239 4. Sum of Years Digits (SOYD) Method .................... 240 5. Sinking Fund (SF) Depreciation Method .............. 240 6. Comparison of Different Methods ....................... 241 7. Equipment Costs: ................................................. 242
8. Break - Even Analysis ................................... 244 1. Basic Terminology ................................................ 244 2. BEP for Two or More Alternatives of Same Product: ................................................................................. 246 3. BEP for Product Mix: ............................................ 247
9. Miscellaneous Topics ................................... 249 1. COCOMO (Constructive Cost Model) ................... 249 2. Project Contract ................................................... 249 3. Tendering ............................................................. 251 4. Tendering Documents ......................................... 251 5. Types of vendors .................................................. 251 6. Linear Programming( ........................................... 252 7. Special Cases in Linear Programming .................. 253 8. Sensitivity Analysis ............................................... 255

ESE General Studies Video Lecture Theory Booklet
www.iesgeneralstudies.com www.adapala-academy.com 8
ENVIRONMENT
Chapters 1. Environment, Ecology and Ecosystems 2. The Atmosphere 3. Pollution and Degradation 4. Ozone 5. Climate Change 6. Conservation
Reference Books and Materials
1. NCERT XI and XII text books 2. NIOS Environment 3. Ministry of Environment site
Practice Questions: Adapala’ s Practice Questions Booklet Current Affairs: Hyperloop (www://iesgeneralstudies.com/downloads/)

ESE General Studies Video Lecture Theory Booklet
www.iesgeneralstudies.com www.adapala-academy.com 9
1. Environment, Ecology and Ecosystems1. Introduction What is Environment? • The word ‘environment’ means what that
surrounds. It includes • The biotic elements like living organisms • Abiotic components like air, water etc. • Human made components like buildings, roads etc. • It includes cultural environment like religion,
political system etc. • The cultural environment influences our
interactions with the environment
What is Ecology? • Greek ‘Oikos’ means house, home, natural home
etc • Ecology is the science of study of environment and
ecosystem Eco system What is system? • System is a regularly interacting & interdependent
group of items forming a unified whole. E.g.: Car - has different elements like engine, driver, seats etc. It interacts with outside environment for fuel, passengers and releases exhaust • Open, Closed & Isolated systems depending on the
interaction with outside environment. Open - exchanges both energy and matter; closed - no exchange of matter. Isolated - no exchange of matter or energy.
Ecosystem as a system - example is a pond. Characteristics of ecosystem 1. It can be subdivided into different subsystems.
Individual fish →population of fish →pond community including fish and other living things →Pond as part of larger ecosystem say forest.
2. Energy flow: This character makes the system behave like a single unit. All elements form part of this unidirectional flow from sun →green plants→animals
3. Nutrient cycling ensures the sustainability. The resources are limited, so the elements are recycled for the entire system. Example carbon cycle.
4. Interactions makes the system live. The exchange of matter and energy happens through the interactions. Example food chain, water cycle.
5. Productivity - The entire ecosystem depends on the productivity - how efficiently the energy is fixed in the organic compounds. It decides the population, biodiversity etc.
6. Self - regulation. A system should have feedbacks to ensure the stability. The ecosystem has several feedback mechanisms. For example, if food production declines, mass death occurs.
7. Evolving. Changes happen to help the system to adapt to the changes. Example adaptations, ecological successions Unitary characteristics is exhibited in energy flow, nutrient cycling and productivity
Thus what is an ecosystem? • Something ‘More than the sum of the elements’ in
the environment 2. Energy Flow • Energy is required for all metabolic activities • In an ecosystem energy flows from producers to
consumers, and not reverse, so it is unidirectional • Energy follows the Laws of thermodynamics I & II • 1st law - energy can neither be created nor
destroyed, but it can change the forms • 2nd law - every time an energy transfer happens,
some amount of useful energy will be lost as useless energy. Constant input of energy is required to maintain the balance in a system. Otherwise entropy (irreversibility) of the system increases.

ESE General Studies Video Lecture Theory Booklet
www.iesgeneralstudies.com www.adapala-academy.com 10
Trophic levels Shows the hierarchical arrangement of members of an ecosystem based on feeding habits of nutritional needs. E.g.: Corn→Chicken→Human
Limitations to the trophic levels • These are usually only 4 or 5 levels, seldom more
than 6 because very little energy is left to support organism.
• There is a law called ‘ten percent law’ or Lindeman’s law which says that only 10% of energy is transferred from one trophic level to next
• For example, corn plant takes 10 J from sunlight fixes only 1 J in the corn, when chicken eats it only 0.1 J is fixed in chicken. When a human eats it, he/she gets only 0.01J.
Where does the remaining energy go? • For Metabolism(sum of all chemical reactions in a
living thing including digestion) • Lost as a heat during activities • Lost due to incomplete digestion This means that only few higher trophic level organisms can be managed by a large population of 10 producers If we diagrammatically represent the populations across different trophic levels, it will be like a pyramid 3. Ecological Pyramids 1. Pyramid of Numbers 2. Pyramid of Biomass 3. Pyramid of Energy Pyramids of Numbers • Number of all organisms in the same trophic level
at a particular bar • Normally these pyramids are upright
• Pyramids of numbers can be inverted. Because, a large living being can provide food to many small organisms. Example, parasites like lice.
• This pyramid can be distorted also. • This is the drawback of the representation by a
pyramid of numbers - they do not take into account the variation in size of animals, so it is not a complete representation of the trophic structure.
Pyramids of Biomass • Instead of counting the number of individuals, the
weight(biomass) is calculated • Dry weight / unit area/ at a particular time
(g/m2/year) or g/km2/year is taken • Dry weight is taken to exclude the water content. • Most of these Pyramids are up right • But in aquatic eco system the 10 producers biomass
is less than that of 10 consumers, so the pyramid is inverted
• This is because the photo plantations grow & reproduce rapidly so their total weight at a particular time is less compared to fish or zooplankton, which has longer life span.
Pyramid of Energy • Always upright, because energy production will not
happen in between. • These pyramids are steep because the difference
in two energy levels is large. The usable energy decreases up the pyramid.
• This pyramid represents the functional roles in the trophic levels better.
4. Food Chain and Food Webs They show the Relationship through the feeding mechanism Two types are : 1. Grazing FC - starts from photosynthetic organisms E.g.: Aquatic food chains phytoplankton‘s (diatoms, micro algae)→zooplanktons (crustaceans, jellyfish) →arthropods (crabs) →small fish →bigger fish E.g.: Carrot→rabbit →fox →tiger

ESE General Studies Video Lecture Theory Booklet
www.iesgeneralstudies.com www.adapala-academy.com 11
2. Detritus FC - starts from dead organic matter. The scavengers and decomposers feed on these dead matter to release the energy.
E.g.: Litter→earthworms →chicken→human
The detritus food chains will have more links, because the energy level at the base is higher. This chain helps in nutrient cycling • Scavengers and decomposers are two types of
organisms in recycling. • Scavengers are called as detritivores. They
consumes dead plants and animals to break down the organic materials into small particles - birds, vultures, worms etc
• Decomposers are called as saprophytes. They consumes the small particles produced by the scavengers. They help to recycle organic material by breaking it down into in simpler compounds that can be taken up by other organisms.
E.g.: Fungi, earthworm, bacteria Steps involved in the process Fragmentation, leaching (nutrients carried down to soil sub layers), humiliation (process of humus formation), catabolism (breaking down of complex molecules to simpler molecules), mineralisation (nutrients are released into the environment) But the ecological pyramids not represent the decomposers. Food web • Represents the complex feeding relations • In real world, simple food chains are rare, rather
they occur as complex web • Food webs are not represented in the ecological
pyramids, because it is difficult to represent same organisms in different trophic levels.
Drawback of pyramids 1. Detritivores are not represented 2. Food webs do not represent
o Diversity in food base o Seasonal shifts in food habits
3. Does not take into account that animals can occur on different trophic levels
Biomagnification and Bioaccumulation The pyramids can explain the phenomenon of bio magnification. Persistent Organic Pollutants (POPs) tend to bio accumulate. They are • Non - degradable pollutants • Has long life in the environment • They are mobile • Soluble in fats, so gets accumulated in body tissues • They are insoluble in H2O, so that will not be
excreted via excretory system. • If it is bioactive it will cause health issues E.g.: Halogenated hydrocarbons like in DDT; heavy metals like mercury, cadmium • When the chemicals accumulate in the living
tissues, their concentration increases in the higher levels of the food chain.
• This phenomenon is called biomagnification. • Thus the top trophic level living beings like human
at the risk of chemical poisoning. Minamata disaster - Mercury poisoning due to consumption of fish in Minamata bay, Japan. Fish tissues had bioaccumulation of methylmercury from industrial discharge. 5. Productivity Productivity is the rate of production of biomass (mass/unit area/unit time) usually denoted by gm-2 day-1 or gm-2 year -1 • Primary Production is by the green plants • Gross Primary Productivity is the rate at which
photosynthesis occurs. • Net Primary Production - green plants needs some
of the energy fixed for their own activities and growth.
So NPP = GPP -- respiration loss. • Net primary production is available for organisms
at next trophic level. • Secondary Production - it happens in tissues of non
- photosynthetic organisms. It is the rate conversion of food matter into different tissues.
• Secondary productivity is the measure of rate at which food is converted to biomass.
Environmental factors which affect productivity: • Solar radiation - important for photosynthesis • Temperature - affects the rate of the process • Moisture availability • Nutrients availability • Edaphic(Soil) - fertility, moisture, depth etc

ESE General Studies Video Lecture Theory Booklet
www.iesgeneralstudies.com www.adapala-academy.com 12
• Impacts of activities like overgrazing, soil erosion, diseases, deforestation etc
• Efficiency of the primary producers E.g.: C3 & C4 plants
C3 cycle(Calvin cycle) C4 cycle(Hatch & Slack)
Photorespiration reduces the efficiency
Photorespiration is prevented
E.g.: Wheat, rice, cotton
E.g.: Maize, sugarcane, sorghum
6. Nutrient Cycles or Biogeochemical Cycles • Nutrients are important in maintaining the life. • They constitute the living tissues, forms enzymes
and are essential for body functions. • Plants fix the nutrients in the food and will be
circulated in the living world. • Plants gets the nutrients mainly from the soil. • Standing state denote the amount of nutrients
such as carbons, nitrogen, phosphorous, calcium etc. present in soil at any given time.
Importance of nutrient cycles • Helps in maintaining the ecosystem balance. For
example imbalance in carbon cycle has caused global warming.
What is a nutrient cycle? • In simple terms, it is the exchange of nutrients from
natural reservoirs to the living beings and vice versa.
• It is called as biogeochemical cycle because it involves geological elements like rock, air, water, biological elements and chemical changes.
Depending on the type of reservoir, there are two types of cycles. 1. Gaseous - Atmosphere is the main reservoir.
Replacement is fast, so is a perfect cycle. E.g.: Carbon and nitrogen cycles 2. Sedimentary - Main reservoir is earth crust (rocks).
Some nutrients gets stored in reservoirs and are not immediately recycled. So it is an imperfect cycle.
E.g.: Sulphur, phosphorus cycles Carbon cycle Carbon constitute about 49% of dry weight of organisms. Reservoirs of carbon are • Atmosphere (1%) • Oceans (71%) • Fossil fuels • Biomass • Soil and rocks The carbon will be stored for a longer time in reservoirs like oceans, fossil fuels, rocks. They are called carbon sinks.
Atmospheric carbon It is important, because it affects the climate systems. The following processes add or remove carbon from the atmosphere • Removed by - Photosynthesis, Sedimentation
(formation of carbonate rock minerals) • Added by - Respiration, Decomposition,
Combustion of wood, fossil fuels etc, volcanic activity (degassing during magma formation)
Carbon cycle consists of both short term (red arrows) and long term (black arrows) cycles Short - term cycle→involves photosynthesis, respiration and decomposition. It happens on day-to-day basis. Long term cycle →involves undecomposed organic matter, formation of fossils, rock formation, erosion, combustion of fossil fuels. It represents the imbalanced cycle. Human interference in the long term cycle has ecological implications. Oceanic Carbon Carbon cycle in oceans consists of both long and short term cycles. In long term cycle, carbon is converted to shells and then to carbonate rocks Influence of human activities The following activities add CO2 to the atmosphere from the sinks. Their percentage contribution in the human made emissions are shown in brackets. • Deforestation and land use changes (9%) • Fossil fuels burning (87%) • Industrial process (4%) To reduce the effect of imbalance caused, we have to remove excess carbon dioxide from the atmosphere. Carbon sequestration is the method of removal of CO2
from atmosphere and storing in sinks. Methods are 1. Afforestation 2. Carbon capture and storage through chemical
process
ESE General Studies Video Lecture Theory Booklet
www.iesgeneralstudies.com www.adapala-academy.com 13
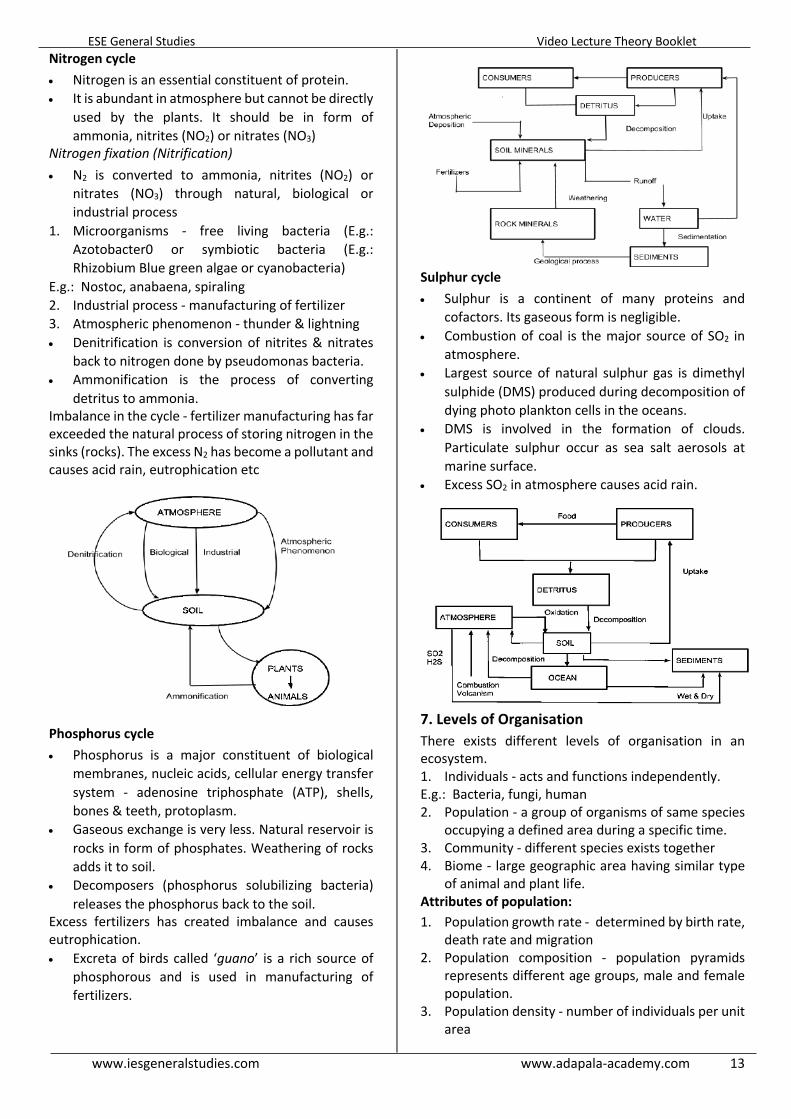
Nitrogen cycle • Nitrogen is an essential constituent of protein. • It is abundant in atmosphere but cannot be directly
used by the plants. It should be in form of ammonia, nitrites (NO2) or nitrates (NO3)
Nitrogen fixation (Nitrification) • N2 is converted to ammonia, nitrites (NO2) or
nitrates (NO3) through natural, biological or industrial process
1. Microorganisms - free living bacteria (E.g.: Azotobacter0 or symbiotic bacteria (E.g.: Rhizobium Blue green algae or cyanobacteria)
E.g.: Nostoc, anabaena, spiraling 2. Industrial process - manufacturing of fertilizer 3. Atmospheric phenomenon - thunder & lightning • Denitrification is conversion of nitrites & nitrates
back to nitrogen done by pseudomonas bacteria. • Ammonification is the process of converting
detritus to ammonia. Imbalance in the cycle - fertilizer manufacturing has far exceeded the natural process of storing nitrogen in the sinks (rocks). The excess N2 has become a pollutant and causes acid rain, eutrophication etc
Phosphorus cycle • Phosphorus is a major constituent of biological
membranes, nucleic acids, cellular energy transfer system - adenosine triphosphate (ATP), shells, bones & teeth, protoplasm.
• Gaseous exchange is very less. Natural reservoir is rocks in form of phosphates. Weathering of rocks adds it to soil.
• Decomposers (phosphorus solubilizing bacteria) releases the phosphorus back to the soil.
Excess fertilizers has created imbalance and causes eutrophication. • Excreta of birds called ‘guano’ is a rich source of
phosphorous and is used in manufacturing of fertilizers.
Sulphur cycle • Sulphur is a continent of many proteins and
cofactors. Its gaseous form is negligible. • Combustion of coal is the major source of SO2 in
atmosphere. • Largest source of natural sulphur gas is dimethyl
sulphide (DMS) produced during decomposition of dying photo plankton cells in the oceans.
• DMS is involved in the formation of clouds. Particulate sulphur occur as sea salt aerosols at marine surface.
• Excess SO2 in atmosphere causes acid rain.
7. Levels of Organisation There exists different levels of organisation in an ecosystem. 1. Individuals - acts and functions independently. E.g.: Bacteria, fungi, human 2. Population - a group of organisms of same species
occupying a defined area during a specific time. 3. Community - different species exists together 4. Biome - large geographic area having similar type
of animal and plant life. Attributes of population: 1. Population growth rate - determined by birth rate,
death rate and migration 2. Population composition - population pyramids
represents different age groups, male and female population.
3. Population density - number of individuals per unit area

ESE General Studies Video Lecture Theory Booklet
www.iesgeneralstudies.com www.adapala-academy.com 14
Types of population pyramids are 1. Expanding - have large younger population 2. Stationary - fertility rate is at replacement level 3. Contracting - younger composition is less, so
the population declines
Biotic Potential: • Ability of a population to increase their number
under ideal environmental conditions. • Usually the potential is restricted by environmental
resistance such as food scarcity, diseases and predation.
Community Community structure is determined by the number of species and the relative role played by various populations in the community. E.g.: Forest community has large number and variety of tree species. Based on relative dependence, communities can be 1. Major community:
Large well - organized independent units. E.g.: Rainforest community 2. Minor community:
Occurs within a major community. They are dependent on surroundings communities.
E.g.1: Rhizobium nodules on roots of nitrogen fixing legumes. • Rhizobium is bacteria in symbiotic relation with
plants. • Rhizobium fixes nitrogen for the plants • Rhizobium gets shelter and food from plants • Important in agriculture E.g.2: Lichen • Symbiotic association of algae and fungus • Can colonize in barren soil • Are pioneer species • Can survive in harsh environmental conditions • Present in wide range of topographies • Are indicator species • Is used as a source of industrial chemicals E.g.:3: Mycorrhizae • Symbiotic association of fungus in roots of higher
plants • Fungus gives higher absorptive capacity for water,
soil, nutrients • Gives pest resistance and disease resistance
• Acidic tolerance • Protects from toxic chemicals • Fungus get carbohydrates from plants • Important in regeneration of degraded community
(secondary succession) • They are pioneer species 8. Biotic Interactions There are different ways in which the different populations interact, otherwise called as interspecific interactions. They are summarised in the table below.
Name Species A
Species B
Examples
Mutualism + + Pollination, lichens(fungi & algae)
Competition - - Birds & fish compete for zooplankton
Predation + - Herbivory - carnivory
Parasitism + - Malarial parasite Plasmodium (but mosquito is not a parasite)
Commensalism
+ 0 Orchid on a tree
Amensalism - 0 Allelopathy - Release of chemical toxins by plants, fungi, bacteria etc.
Importance of Predation: • Transfers energy in food chain. • Predators keep prey populations under control. • They help in maintaining diverse predator
population. The prey population evolves different adaptation features to escape and it enhances the biodiversity.
E.g.: Different colors for visual deception, secreting chemicals like poisons, defence mechanisms like thorns in plants. • The top predators form a key species in a
community. E.g.: Tiger in forest/grassland. • The invasive species spreads fast if they do not
have natural predators in the new ecosystem. • If predator over exploits the prey population, co-
excitation occurs.
Expanding
Stationary
Contracting
65
Age
15

ESE General Studies Video Lecture Theory Booklet
www.iesgeneralstudies.com www.adapala-academy.com 15
Parasitism: Parasites hosts usually co- evolve, Life cycle of a parasite may involve one or more hosts E.g.: Malarial parasite. Mosquitoes are vectors, not considered as parasites Symbiosis: Is a long term association mainly mutualism, commensalism or parasitism. The species are closely associated so that they cannot live independently. E.g.: Corals, lichens. Competition: Causes extinction of less efficient species. Adaptations: Adaptations occur at the species level for coping with extremes in their environment 1. Physiological (biological activities) E.g.: Increased red blood cell production in higher altitude 2. Morphological (body structure) E.g.: Desert plants leaves are reduced to spines, small limbs and ears for animals in colder climate 3. Behavioral (nature of activities). E.g.: Migration, aestivation, burrowing Adaptations can happen at ecosystem or community level also. They are called as the ecological successions. Ecological Succession • It is the community response to environment
changes over time. • Community’s composition and structure changes
over time. • These occurs in different gradual and predictable
stages known as seres. E.g.: Lichens →grasslands →forests • The individual transition communities are called
seral stages or seral communities. • The final community which is near equilibrium with
environment is called a climax community. • The climax community remains stable as long as
environment remains unchanged. E.g.: Tree community in a forest. There are two types of successions - primary and secondary. Primary and Secondary Succession: • Primary succession occur on a new place - the bare
rock, newly cooled lava, newly created pond etc. • It is generally slow since soil formation takes time. E.g.: lichens on rocks. • Lichens secrete acids to dissolve rock and helps in
soil formation. • Such species that evolves in a bare area is
called pioneer species. • Pioneer species will be having special features like
long roots, long living, nutrients cycling capability, photosynthetic, ability to tolerate extreme environmental conditions etc.
• Secondary succession occurs in areas destroyed or abandoned where a community had existed before.
• It is relatively faster than primary succession. E.g.: Abandoned farmlands, flooded lands, degraded forests etc • Autogenic succession - happens by internal factors • Allogeneic succession - caused by outside factors 9. Habitat and Niche Habitat is the place where an organism lives. It is a subsystem of a biome. For example, in a forest biome a tree can be a habitat. Niche is different from a habitat. Niche denotes the • Unique functions role /place of the organism in the
ecosystem. E.g.: The earthworm has an unique role of making soil fertile. • It includes the activities & responses for survival
and reproduction. • No two species can have same niche in the same
area. • Different niches are formed based on the
o Survival (food) needs o Shelter (habitat) requirements o Reproductive needs o Factors required to stay healthy (temperature,
land topography, humidity etc.) Biosphere • Region on earth where all the biotic interactions
occur. It is a narrow zone between the atmosphere, lithosphere (soil) and hydrosphere (water).
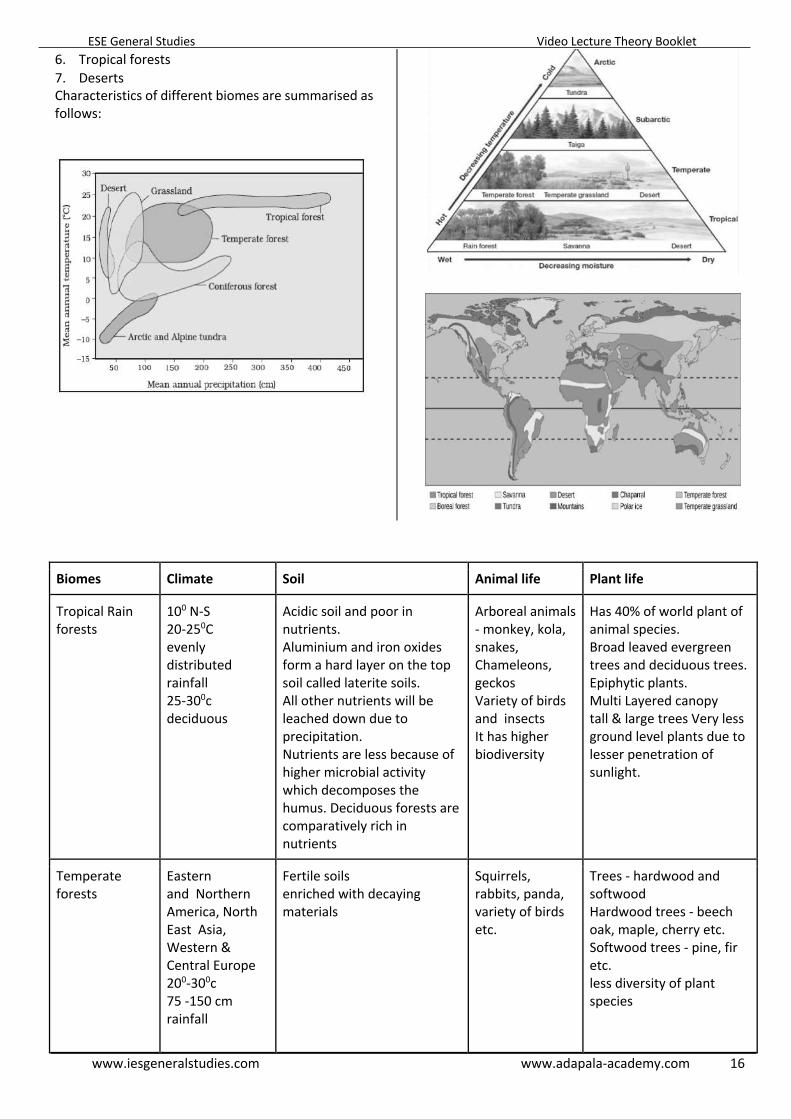
10. Biomes • The biotic life varies from hot humid tropics to cold
dry polar Regions. • This variation give rise to assemblage of plants &
animal life in various geographical settings called biomes
• The large geographical regions characterised by climate, vegetation, animal life and general soil type
• The key geographical elements determining the plant and animal life are temperature, water availability, sunlight, soil
By using the two main determining factors - mean annual temperature and mean annual precipitation(rainfall), the different biomes available on earth are 1. Tundra or Alpine 2. Boreal Forests 3. Temperate forests 4. Temperate grasslands 5. Tropical grasslands
ESE General Studies Video Lecture Theory Booklet
www.iesgeneralstudies.com www.adapala-academy.com 16
6. Tropical forests 7. Deserts Characteristics of different biomes are summarised as follows:
Biomes Climate Soil Animal life Plant life
Tropical Rain forests
100 N-S 20-250C evenly distributed rainfall 25-300c deciduous
Acidic soil and poor in nutrients. Aluminium and iron oxides form a hard layer on the top soil called laterite soils. All other nutrients will be leached down due to precipitation. Nutrients are less because of higher microbial activity which decomposes the humus. Deciduous forests are comparatively rich in nutrients
Arboreal animals - monkey, kola, snakes, Chameleons, geckos Variety of birds and insects It has higher biodiversity
Has 40% of world plant of animal species. Broad leaved evergreen trees and deciduous trees. Epiphytic plants. Multi Layered canopy tall & large trees Very less ground level plants due to lesser penetration of sunlight.
Temperate forests
Eastern and Northern America, North East Asia, Western & Central Europe 200-300c 75 -150 cm rainfall
Fertile soils enriched with decaying materials
Squirrels, rabbits, panda, variety of birds etc.
Trees - hardwood and softwood Hardwood trees - beech oak, maple, cherry etc. Softwood trees - pine, fir etc. less diversity of plant species

ESE General Studies Video Lecture Theory Booklet
www.iesgeneralstudies.com www.adapala-academy.com 17
Taiga forests(Boreal Forest)
Eurasia and North America characterised by long cold and dry winters 40-100 cm rainfall
Podolsk - consists of oxides of silicon Acidic soil Poor in nutrients Has thin soil cover
Birds like hawks, woodpecker Carnivores with fur Bears, Siberian tiger, wolf etc. deer, hares, bats
Coniferous evergreen (boreal) forest E.g.: Pine, spruce
Temperate grasslands: Prairie - North America Steppe - Europe and Asia Veld - South Africa Downs - Australia
Hot summers cold winters 50-90 cm rainfall
Brown earth /chernozem soil rich in bases (Ca, Mg, Na, K) due to capillary action. Known as bread basket of the world Suitable for commercial agriculture and cattle ranching
Large herbivores Bison, cattle antelopes, gazelles, horses, prairie dog, wolves, lions ground nesting birds snakes
Dominated by grasses Trees and large shrubs are occasional Fire limit the tree growth oaks, willows
Tropical grasslands (Savannah)
Warm & hot 50-125 cm rainfall
Porous soil thin layer of humus Old soil
Herbivores (great diversity) Antelopes, buffalos, zebra, elephants, rhinoceros lion, cheetah, hyena snakes, mongoose
Grasses, scattered trees, thorny shrubs (fire resistant) large trees are absent Fire and drought prone region.
Tundra Means “barren land” Two types - 1)Artic 2)Alpine (mountain)
Icebound Very low temperature -120C to -60C Strong winds scanty rainfall
Gelisols or Cryosols Permafrost - layer of frozen soil and dead plants below the top layer Top soil under goes cycles of freezing and thawing
Animals with fur, short limbs, ears and fatty body Lemmings reindeer arctic fox polar bear Insects - short life cycle migratory birds abundant in microorganisms - bacteria & fungi
Devoid of trees Has stunted shrubs The growing period is very less( two months only) - perennials lichens mosses sedges herbs wildflowers in summer
Desert 1. Subtropical
desert - under high pressure belts.
E.g.: Sahara 2. Coastal
desert - due to cold
Hot 200C - 450C Semiarid 210C - 380C Coastal 150C-350C Cold 20C - 250C Rainfall less than 50mm
Rich in nutrients No organic matter
Reptiles, birds mammals - antelope, rabbits, rats, kangaroo rat, camel Adaptations: Nocturnal (active during night)
Drought resistant vegetation cactus, sagebrush, euphorbias Adaptations: Plants produce seeds Succulent green stems for photosynthesis Residual leaves - spines, cuticles, sunken stomata, epidermal hairs to prevent water loss
ESE General Studies Video Lecture Theory Booklet
www.iesgeneralstudies.com www.adapala-academy.com 18
11. Different Ecosystems Following are specific ecosystems, which do not form a biomes, but are significant in ecological perspective Chaparral Ecosystem Looks similar to desert ecosystem due to its plant life, but is a temperate ecosystem. • Dry summer and wet winter • Fire and drought resistant plants • Sclerophyllous plants (with thick leaves) • Mainly found in Mediterranean sea • Famous for orchards - grapes, olive, oranges Aquatic Ecosystems
Three types of water bodies are 1. Saline - dissolved salts more than 35 ppt (parts per
thousand) E.g.: Oceans, mangroves, seagrass, corals 2. Brackish - dissolved salts 5 ppt to 35 ppt E.g.: Estuary, wetlands 3. Fresh water - dissolved salts less than 5 ppt E.g.: River, freshwater lakes The Limiting Factors in an aquatic ecosystem: • Main limiting factors are availability of sunlight and
dissolved oxygen in water. • The penetration of sunlight depends on depth and
transparency of water which in turn depends on turbidity and sediment content.
• The dissolved oxygen decreases with depth. • Other factors are nutrient availability and
temperature. Nutrients are supplied by sediments from land run off, upwelling from the bottom or recycled in the ecosystem.
• The temperature declines with depth. The region where sharp decline in temperature happens is called thermocline layer. Usually the thermocline layer coincides with the boundary of photic and aphotic zone.
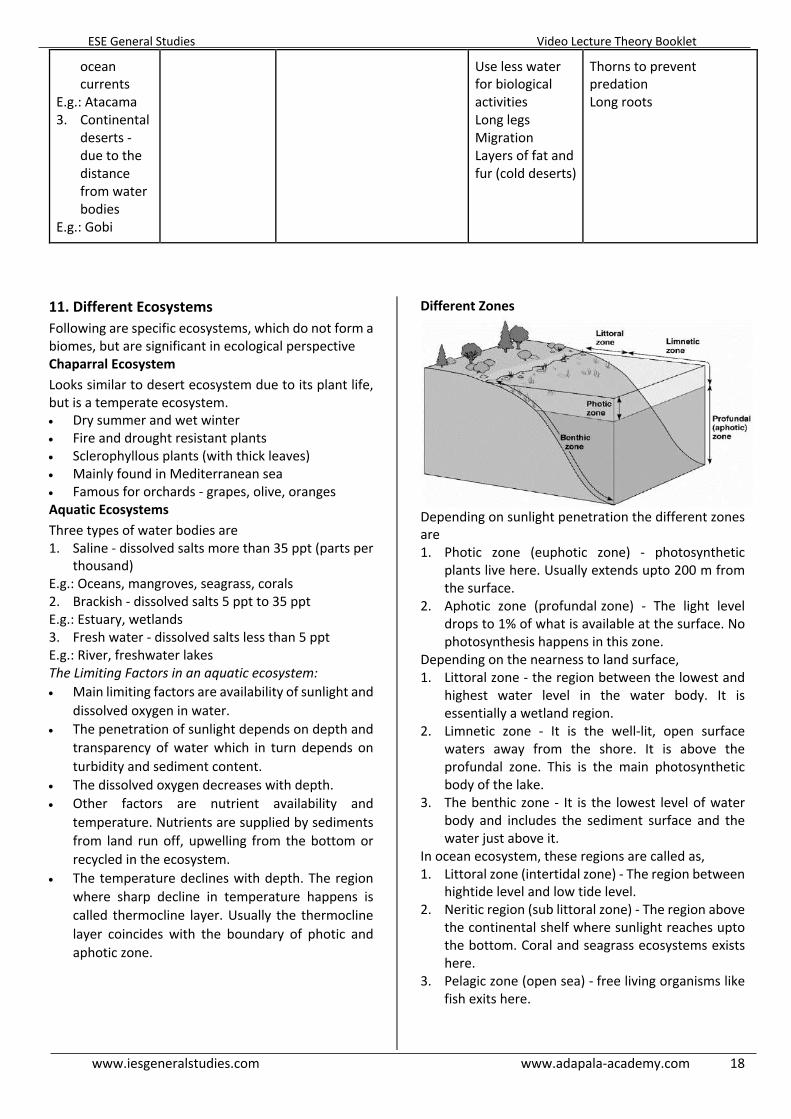
Different Zones
Depending on sunlight penetration the different zones are 1. Photic zone (euphotic zone) - photosynthetic
plants live here. Usually extends upto 200 m from the surface.
2. Aphotic zone (profundal zone) - The light level drops to 1% of what is available at the surface. No photosynthesis happens in this zone.
Depending on the nearness to land surface, 1. Littoral zone - the region between the lowest and
highest water level in the water body. It is essentially a wetland region.
2. Limnetic zone - It is the well-lit, open surface waters away from the shore. It is above the profundal zone. This is the main photosynthetic body of the lake.
3. The benthic zone - It is the lowest level of water body and includes the sediment surface and the water just above it.
In ocean ecosystem, these regions are called as, 1. Littoral zone (intertidal zone) - The region between
hightide level and low tide level. 2. Neritic region (sub littoral zone) - The region above
the continental shelf where sunlight reaches upto the bottom. Coral and seagrass ecosystems exists here.
3. Pelagic zone (open sea) - free living organisms like fish exits here.
ocean currents
E.g.: Atacama 3. Continental
deserts - due to the distance from water bodies
E.g.: Gobi
Use less water for biological activities Long legs Migration Layers of fat and fur (cold deserts)
Thorns to prevent predation Long roots

ESE General Studies Video Lecture Theory Booklet
www.iesgeneralstudies.com www.adapala-academy.com 19
Dissolved Oxygen Normal level of dissolved oxygen in fresh water is 10 ppm (parts per million). If it goes below 3 or 5 ppm, the living organisms compete for oxygen. In winter, lake surface gets covered with ice which prevents dissolution of oxygen and fishes die inside water. This is termed as ‘winter kill’. When algal bloom happens, dissolved oxygen gets consumed and fishes dies. Lake Ecosystem The depth will be more than 3 meters and has greater than 10 hectares water spread. Not nutrient rich like a wetland. As per the nutrient contents, the lake types are 1. Oligotrophic. - Very low nutrient content 2. Mesotrophic -Moderate nutrient content 3. Eutrophic - High nutrients content Eutrophication • The phenomenon of enriching waterbodies with
excess nutrients mainly nitrates and phosphates (from sewage and fertilizers)
• It causes Algal bloom - excess growth of algae and cyanobacteria (blue green algae).
Algal bloom o Prevents sunlight penetration to down layers o Consumes dissolved O2 for decomposition of
dead algae o Some algae produces toxins and can be
harmful to other organisms Types of lakes 1. Natural or Manmade 2. Saltwater (E.g.: Sambhar lake), fresh water (E.g.: Wular lake) or brackish (E.g.: Chilika lake) Estuary Ecosystem • Exists where river meet the sea • Fresh water mixes with saltwater, thus it is a
brackish ecosystem. Features • Semi enclosed waterbody • Nutrient rich as river brings sediments which
makes it the most productive water body • Shows edge effect(transition between land and
water ecosystems) • Home to both terrestrial and aquatic plants and
animals
• Supports ecosystems like mangroves, salt marshes, seagrass, mudgrass etc
• Has very little wave actions • Also called as bays, lagoons, inlets, harbours etc. Biodiversity includes • Terrestrial organisms like wood stocks, pelicans,
butterflies etc. • Sea animals like sea turtle, sea lion, sea catfish etc • Sea plants like salt worts, eelgrass, seagrass(found
in South East coast of Tamil Nadu and Andaman & Nicobar islands)
• Predators like tigers • Special animal like Dugong(sea cow) which graze
on seagrass Functions • Groundwater recharge • Habitat and breeding grounds for various animals • Helps in sedimentation • Regulates the tide actions • Supports economic activities like fishing,
harbouring, ports etc. Coral Ecosystems Corals are symbiotic association of coral polyps & microscopic algae (zooxanthellae) Algae gets • Support, shelter and carbon dioxide Polyps get • Nutrients for living, Carbon, Calcium etc for reef
building • Gets its beautiful colours from the algae • When Coral polyps die they leave their limestone
skeleton behind which forms the coral reefs. When algae dies, the corals will lose their colour (coral bleaching) and they also eventually die.
Types of corals • Subtropical/tropical corals - seen near the water
surface. • Deep water corals Subtropical/tropical corals • Grows in clean, clear & warm water at 0-60 m
depth in tropical regions (30 degree N to 30 degree S latitudes)
• Temperature range - 20 to 21 degree Celsius • Salinity should be 20-30%o Types of reefs 1. Fringing reef 2. Barrier reef 3. Atolls

ESE General Studies Video Lecture Theory Booklet
www.iesgeneralstudies.com www.adapala-academy.com 20
Features • Has high productivity • Has high nutrient cycling capacity. So they can
survive in nutrient poor water Significance • It is one of the most diverse ecosystem on the
earth. • Home to about 25% of marine species • Productivity is equal to or more than that rain
forests • Acts as carbon sinks • Forms protective barriers around the coasts • Provides substrate for mangroves and other
ecosystems Wetland Ecosystem It is an intermediate ecosystem between a water ecosystem and a terrestrial ecosystem. It can be • Natural/manmade, • Permanently /Temporarily filled with water, • Fresh/brackish/saline water, • Flowing(lentic)/stagnant(lotic) water body • And water depth should not exceed 6 metres. As per Ramsar convention on wetlands, an aquatic ecosystem is called a wetland if 1. It is nutrient rich 2. Supports high biodiversity 3. Has high productivity 4. Has high density of macrophytes(plants living near
the surface of water) Types of wetlands 1. Littorals • Marginal areas between highest and lowest water
levels in an aquatic system. 2. Flood plains • Areas that get periodically flooded during the
overflow of river. 3. Marshes • Dominated by grasses. 4. Swamps • Forested (woody plants) wetlands. 5. Bogs • Accumulated peat (undecomposed organic
matter). • Fed by surface water or groundwater. • Found mainly in taiga/tundra regions. 6. Fens • Fed by mineral rich surface water or ground water
source. Found mainly in taiga/tundra regions. 7. Mangroves • Dominated by mangrove plants. Functions: • Acts as buffer storage of water
o It helps in ground water recharge o Helps in flood mitigation
• Filtration of surface water
o Removes excess nutrients. Almost 95% of nitrogen from sewage can be removed by the wetlands.
o Removes heavy metals and pollutants through sedimentation.
• Helps in nutrient recycling • Provides habitat especially to the numerous
species of birds including migratory species. Has edge effect, supports high density and diversity of species.
• Stabilizing and protecting the shore lines • Has high productivity Mangrove Ecosystems Mangroves are littoral evergreen plants found in the tropical and subtropical sheltered coastlines. Its special features are, • Has remarkable salt water tolerance. • It likes to grow in regions of high slit. • Can survive in soils with low oxygen. • Has pneumatophores (blind roots) for respiration.
• Seeds germinates in tree itself before falling on the
soil (viviparity). • Has stilt roots for anchoring in the muddy soil. • Can absorb fresh water from saline/brackish water. • The excess salts are excreted through leaves. Functions • The stilt roots impedes water flow and enhance
deposits of sediments. Thus it stabilise coast lines and shores
• Provide breeding ground for fishes • Acts as wave breakers and protects coastal lands
from tides, floods, surges and tsunamis.
Ecotones An ecotone is a junction between two or more diverse ecosystems E.g.: Wetlands, grasslands, estuary • It may contain organisms entirely different from
that of adjoining communities.

ESE General Studies Video Lecture Theory Booklet
www.iesgeneralstudies.com www.adapala-academy.com 21
• It can have more population density or more number of species than the nearby ecosystems. This is known as ‘positive edge effect’
• The abundant species in such ecosystems is called ‘edge species’
E.g.: Grass (in grasslands), birds (wetlands) Comparison of productivity of different ecosystems Combined terrestrial biomes have more productivity than ocean ecosystems. Almost 54% of total productivity is from terrestrial Biomes. 1. Coral reef - 2500 g/ sqm /year 2. Estuaries, marshes, tropical forests, swamps
around 2200 g/ sqm /year 3. Temperate forests 4. Taiga forests 5. Savannah 6. Agricultural land 7. Wood land & shrub land 8. Temperate grassland 9. Lakes, streams 10. Continental shelf 11. Tundra 12. Open ocean 13. Desert shrub 14. Extreme desert
12. Ecosystems in India Forests in Indie 1. Tropical They are again five kinds 1. Wet evergreen - found only in few places like
Western Ghats north east India and Andaman and Nicobar Islands where rainfall is greater than 200 cm.
2. Semi - evergreen - In the regions with rainfall ranges from 70 - 200 cm.
3. Moist deciduous - 30% of total forest cover of India.
4. Littoral /swamps 2. Subtropical They are again 6 kinds 1. Dry deciduous - 38% of total forest cover of India 2. Thorn 3. Dry evergreen - found in Tamilnadu coastal region
which gets winter rainfall.
4. Broad leaved Hill forest 5. Pine forests 6. Dry evergreen in Himalayas 3. Montane 1. Wet temperate 2. Moist temperature (Himalayan) 3. Dry temperature (Himalayan) 4. Alpine 1. Subalpine forest 2. Moist alpine scrub 3. Dry alpine scrub Forest Cover • Forest covers 21.34% of total geographical area • Forest and tree cover(include plantations also) is
24.16% of total geographical area • The deciduous forests (moist and dry) form the
major forest type. They are also known as monsoon forests.
• Littoral forests include mangroves and other wetland forests
• Ganga-Brahmaputra delta houses the largest single block of tidal forest in the world called ‘Sundarbans’
• The montane forests found in Nigiris are known as ‘shola forests’.
Mangroves of India • Mangroves are found in delta regions of Ganga-
Brahmaputra, Mahanadi, Godavari-Krishna, Kaveri in Eastern coast
• Western coast - Goa, Maharashtra and Gujarat • Andaman and Nicobar islands Corals in India All the three major reef types occur in India (atoll, fringing and barrier). Corals are found in • The Gulf of Kachchh in the northwest • Palk Bay and Gulf of Mannar in the southeast • There are patches of reef growth on the West
Coast • The Andaman and Nicobar Islands and
Lakshadweep have fringing reefs, barrier reef and atolls
Wetlands in India • India has 27000+ wetlands. • 115 wetlands are recognised by National Wetland
Conservation Programme (NWCP). • 26 wetlands are recognised as Ramsar sites of
international importance. Types of wetlands in India 1. High attitude Himalayan lakes 2. Flood plains 3. Saline wetlands of arid & semi-arid regions 4. Coastal wetlands 5. India has all types of wetlands except bogs & fens Ramsar Sites 1. Wular - freshwater lake
ESE General Studies Video Lecture Theory Booklet
www.iesgeneralstudies.com www.adapala-academy.com 22
2. Hokera - freshwater marsh 3. Surinsar Manesar - freshwater lake 4. Tsomoriri - brackish water lake 5. Chandertal - freshwater lake 6. Pong dam - man made reservoir 7. Kanjli - man made 8. Harika - man made reservoir 9. Ropar - fresh water lake 10. Renuka - fresh water lake 11. Sambhar - salt water lake 12. Keoladeo - man made swamp 13. Upper Ganga - flood plains 14. Nalsarovar - freshwater lake 15. Bhoj - man made reservoir 16. Deepor beel - freshwater lake 17. Loktak - lake with floating land masses called
‘phumdis’ 18. Rudrasagar - freshwater lake 19. East Kolkata - fish pond fed by sewage 20. Bhitarkanika - mangrove swamp 21. Chilika - lagoon 22. Kolleru - brackish water lake 23. Vembanad kol - combination of estuary and flood
plains 24. Ashtamudi - estuary 25. Sasthamkota - freshwater lake 26. Point Calimere(Kodiakkarai) - mangrove forest Montreux record sites The degrading Ramsar sites are included in this list. The Loktak lake and Keoladeo Ghana national park are included in this list.
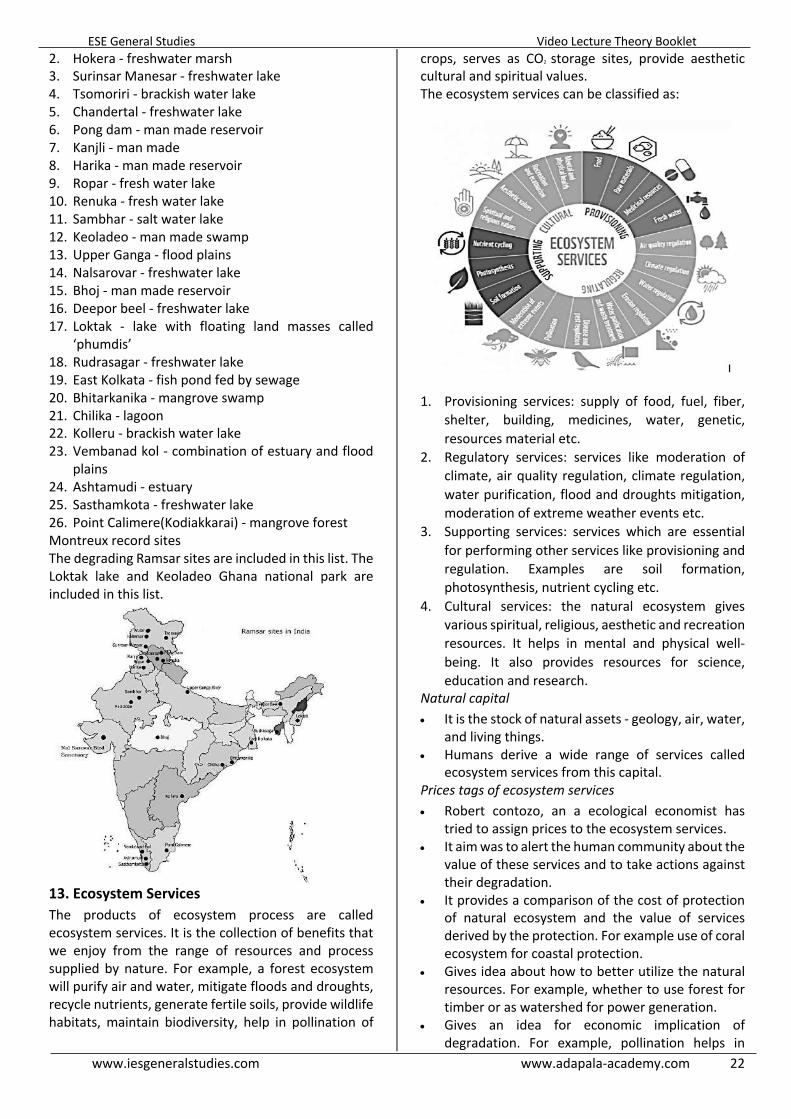
13. Ecosystem Services The products of ecosystem process are called ecosystem services. It is the collection of benefits that we enjoy from the range of resources and process supplied by nature. For example, a forest ecosystem will purify air and water, mitigate floods and droughts, recycle nutrients, generate fertile soils, provide wildlife habitats, maintain biodiversity, help in pollination of
crops, serves as CO2 storage sites, provide aesthetic cultural and spiritual values. The ecosystem services can be classified as:
1. Provisioning services: supply of food, fuel, fiber, shelter, building, medicines, water, genetic, resources material etc.
2. Regulatory services: services like moderation of climate, air quality regulation, climate regulation, water purification, flood and droughts mitigation, moderation of extreme weather events etc.
3. Supporting services: services which are essential for performing other services like provisioning and regulation. Examples are soil formation, photosynthesis, nutrient cycling etc.
4. Cultural services: the natural ecosystem gives various spiritual, religious, aesthetic and recreation resources. It helps in mental and physical well-being. It also provides resources for science, education and research.
Natural capital • It is the stock of natural assets - geology, air, water,
and living things. • Humans derive a wide range of services called
ecosystem services from this capital. Prices tags of ecosystem services • Robert contozo, an a ecological economist has
tried to assign prices to the ecosystem services. • It aim was to alert the human community about the
value of these services and to take actions against their degradation.
• It provides a comparison of the cost of protection of natural ecosystem and the value of services derived by the protection. For example use of coral ecosystem for coastal protection.
• Gives idea about how to better utilize the natural resources. For example, whether to use forest for timber or as watershed for power generation.
• Gives an idea for economic implication of degradation. For example, pollination helps in

ESE General Studies Video Lecture Theory Booklet
www.iesgeneralstudies.com www.adapala-academy.com 23
cross breeding and food production. Intensive agriculture destroys the pollinators and subsequently food production will be reduced.
14. Ecological Footprint Ecological footprint implies the impact of an entity on the global resources. The global resources are specified in terms of the land area required to supply those resources and to accumulate the waste generated from its utilisation. It is the land area needed to completely sustain the entity - an individual, a group of people or an activity throughout its lifetime. It is measured in terms of global hectare per capita.
Biocapacity Biocapacity denotes the ability of the natural system to support the requirements and assimilate the waste generated. It is the measurement of the capacity of a given biologically productive area to generate an ongoing supply of resources. If the ecological footprint of a process or activity is greater than biocapacity, that process or activity is unsustainable. Presently human footprint is 1.5 times the world’s biocapacity. It means that we are living on natural capital that is essential for the sustaining future generations. Earth overshoot day It is the day in an year when the humanity has consumed more resources than the planet can generate in that year. Usually it comes in the month of August. Thus the remaining months of the year we are living in an ‘ecological debt’. Carrying capacity Carrying capacity denotes the maximum population that can be accommodated in a given area given the resources availability waste accumulation capacity of environment
Once the population overshoots the carrying capacity population decline happens, since nature cannot support the excess population. The carrying capacity of nature can reduce with degradation. This concept is called ‘Limits to growth’. 15. Biodiversity Biodiversity is defined as the variability among living organisms from all sources and also the variability in the ecological complexes of which they are part. Types of Biodiversity Genetic diversity • This is the basic level in biodiversity • A gene is the basic physical and functional unit of
heredity. There exists different variety of genes within a biological species. Genetic diversity serves as a way for populations to adapt to changing environments.
• The genetic variations creates the diversity within a species such as the thousands of breeds of different dogs or the numerous variety of roses.
Species Diversity • Species is group of organisms which have a similar
genetic base and can interbreed. • Diversity between the species constitute the
species diversity. For example - domesticated cat and wild cat form two different species.
• There exists millions of different species of plants and animals on earth
Ecosystem diversity • Measure of overall diversity of different
ecosystems within a region Measurements of Biodiversity Biodiversity is a function of species abundance, species richness and species evenness. • Species abundance - Relative numbers among
different species • Species Richness - Number of biological species in
a region Species evenness - Distribution of species a (alpha) diversity: Diversity within a particular area, community or ecosystems. It is the measure of number of species within that area (species richness).

ESE General Studies Video Lecture Theory Booklet
www.iesgeneralstudies.com www.adapala-academy.com 24
b (beta) diversity: Comparison between two ecosystems g (gamma) diversity: The overall diversity in different ecosystems within a region. Gamma diversity is determined by the mean species diversity in the region's ecosystems (alpha diversity) and the differentiation among those ecosystems (beta diversity). Significance of biodiversity • Diversity ensures the survival of population.
Genetic diversity allows species to adapt to changing environment.
• Diversity is important to maintain the food web. It is essential to maintain the ecological balance. For example, if food chain is broken by extinction of a particular species, many others species will also move more closer to extinction.
• Biodiversity provides different ecosystem services like provisioning and regulating services. Examples, o Pollination o Varieties of food materials o Provides medicines o Helps in agriculture - genes for hybrid varieties,
genetic engineering etc o Ecosystem diversity provides cultural services
• Commercialisation of resources. Example - use of bio - active compounds for medicines, guar gum for shale gas production. Bioprospecting is the process of discovery and commercialization of new products based on biological resources. Biopiracy is the commercialisation of biotic resources or traditional knowledge without consent or paying fair compensation to the community from which it originates.
The threats to biodiversity There are both manmade and natural threats to biodiversity. The effects of man made threats are severe. Four main human induced causes of biodiversity loss, known as ‘evil quartet’ are, 1. Habitat degradation and fragmentation -
deforestation, expansion for agriculture, pollution, mining, urbanisation etc destroys habitats.
2. Over exploitation - poaching, overfishing etc 3. Alien species invasions - invasive species will not be
having local predators. They explode in population and consume the resources of native species, thus pushing them to extinction.
E.g.: lantana is Western Ghats, African snail, African catfish etc 4. Co extinction - when one species extinct, other
species depending on them will also get extinct. E.g.: Coral bleaching. Different terms associated Flagship Species
• The species chosen to represent an environmental cause
E.g.: Giant Panda, Bengal tiger • Also called as charismatic megafauna Keystone Species • Their role is very important for the survival of
ecosystem itself • Occur in lesser numbers in the ecosystem, but their
significance is more than their numbers E.g.: Pollinators, Predators like tiger, sea otters etc Umbrella Species • The ecological requirements of this species
includes that of many other species. Thus conserving this species will ensure the conservation of many other species.
E.g.: Elephant, tiger. Indicator species • They are very sensitive to change in
habitats/environment. Thus they can indicate the health of the environment.
E.g.: Colour change in lichens due to pollution, deformation of limbs of frogs due to toxins. Foundation species • Supports the entire ecosystem. They are found in
larger numbers. E.g.: Grass, Corals, Kelps Exotic Species • They are introduced from outside to the
ecosystem. Endemic species • They exists in only one geographic region. They will
not be found anywhere else on the earth. E.g.: Asiatic Lion in Gir Forests Indigenous species • The species present in a region naturally. They can
be found in other geographical locations also. E.g.: Tiger in India Invasive species • Exotic or alien species E.g.: Lantana plant in Western Ghats Megadiverse countries • Identified by Conservation International, an NGO • These countries contain more than 70% of earth’s
biodiversity • There are 17 megadiverse countries • These region exhibit high degree of endemism Biodiversity hotspots • These regions are identified by Conservation
International, an NGO • Concept is given by Norman Myers • The criteria are
o High degree of endemicity. o At Least 1500 species of vascular plants are
endemic.

ESE General Studies Video Lecture Theory Booklet
www.iesgeneralstudies.com www.adapala-academy.com 25
o 70% of primary vegetation is lost • There are a total of 35 hotspots Indian Biodiversity
India is/has • 2.5% of landmass but home to 8% of world’s
biodiversity • One of the megadiverse country. • Rich in species and endemicity • India forms part of 4 biodiversity hotspots
- Sunland, Himalayas, Western Ghats and Indo-Burma
• India is in the zone of transition of two biogeographic realms - Palearctic(covers Europe and Asia) and Indo - Malayan realms
There are 5 biomes in India 1. Tropical forests 2. Temperate forests 3. Alpine 4. Deserts 5. Grasslands Wild life • Asiatic lion • Asian elephant • One horned rhinoceros • Gangetic river dolphin • Snow leopard • Kashmir stag • Dugong • Migratory birds • Nilgiri tahr • Black buck • Lion tailed malgue The Himalayas • Species endemism →40% • Has 12 endemic mammals and 4 endemic birds
o Gold langur o Himalayan tahr o Pygmy hog
The Western Ghats • Has different vegetations - tropical wet evergreen,
montane, most deciduous, shola grasslands • Very high biodiversity of 12 endemic mammals and
16 endemic birds • UNESCO World Heritage Site • 1600 Km long and covers 6 states • Ecology expert panels - Madhav Gadgil and
Kasturirangan panels have prepared reports on the conservation of the western ghat ecosystem. Kasturirangan report is accepted by the government for implementation.
Threatened Species
The term threatened species is made popular by the work of an NGO, IUCN (International Union for
conservation and natural Resources). IUCN has been publishing red data book since 1966 Red data book • Pink pages - lists critically endangered species • Green pages- lists formerly endangered species but
now recovered and no longer threatened • The various categories in the book are,
VU EN CR EW EX
Vulnerable - high risk of extinction in wild
Endangered - very high risk of extinction in wild
Critically Endangered - extremely high risk of extinction in wild
Extinct in wild
extinct - the last individual has died
NE DD LC NT
Not evaluated
Data deficit
Least concern - Widespread and abundant
Near threatened
Endangered species or Threatened Species The species listed under the categories vulnerable, endangered and critically endangered are the threatened species. The criteria for classification are:
Endangered Species in India • 665 animal 387 plants are endangered • 57 animals are critically endangered • Endangered animals includes mammals, reptiles,
amphibians, fish, spider and corals
VU EN CR
Reduction in population 50% in in last 10 years Number of matured individuals <10,000 Probability of excitation is 10% in 100 years
Reduction in population 70% in last 10 years Number of matured individuals <250 Probability of excitation is 20% in 20 years
Reduction in population 90% in last 10 years Number of matured individuals <50 Probability of excitation is 50% in 10 years
ESE General Studies Video Lecture Theory Booklet
www.iesgeneralstudies.com www.adapala-academy.com 26
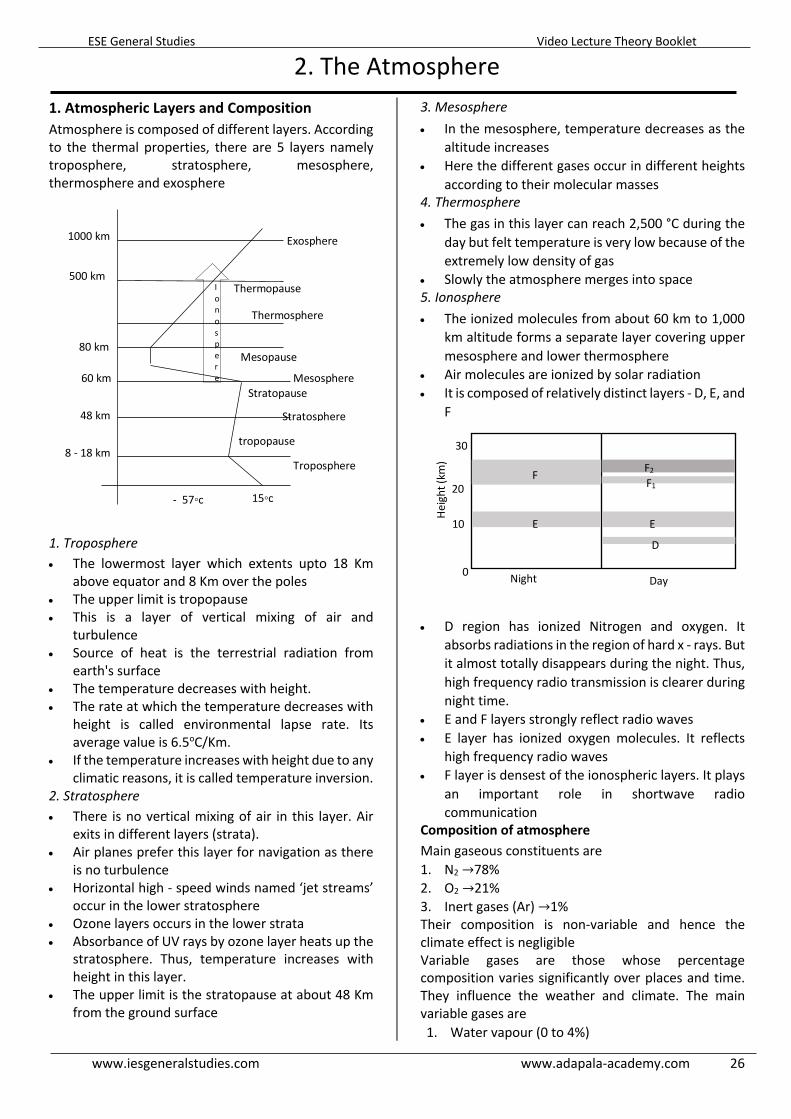
2. The Atmosphere1. Atmospheric Layers and Composition Atmosphere is composed of different layers. According to the thermal properties, there are 5 layers namely troposphere, stratosphere, mesosphere, thermosphere and exosphere
1. Troposphere • The lowermost layer which extents upto 18 Km
above equator and 8 Km over the poles • The upper limit is tropopause • This is a layer of vertical mixing of air and
turbulence • Source of heat is the terrestrial radiation from
earth's surface • The temperature decreases with height. • The rate at which the temperature decreases with
height is called environmental lapse rate. Its average value is 6.5oC/Km.
• If the temperature increases with height due to any climatic reasons, it is called temperature inversion.
2. Stratosphere • There is no vertical mixing of air in this layer. Air
exits in different layers (strata). • Air planes prefer this layer for navigation as there
is no turbulence • Horizontal high - speed winds named ‘jet streams’
occur in the lower stratosphere • Ozone layers occurs in the lower strata • Absorbance of UV rays by ozone layer heats up the
stratosphere. Thus, temperature increases with height in this layer.
• The upper limit is the stratopause at about 48 Km from the ground surface
3. Mesosphere • In the mesosphere, temperature decreases as the
altitude increases • Here the different gases occur in different heights
according to their molecular masses 4. Thermosphere • The gas in this layer can reach 2,500 °C during the
day but felt temperature is very low because of the extremely low density of gas
• Slowly the atmosphere merges into space 5. Ionosphere • The ionized molecules from about 60 km to 1,000
km altitude forms a separate layer covering upper mesosphere and lower thermosphere
• Air molecules are ionized by solar radiation • It is composed of relatively distinct layers - D, E, and
F
• D region has ionized Nitrogen and oxygen. It
absorbs radiations in the region of hard x - rays. But it almost totally disappears during the night. Thus, high frequency radio transmission is clearer during night time.
• E and F layers strongly reflect radio waves • E layer has ionized oxygen molecules. It reflects
high frequency radio waves • F layer is densest of the ionospheric layers. It plays
an important role in shortwave radio communication
Composition of atmosphere
Main gaseous constituents are 1. N2 →78% 2. O2 →21% 3. Inert gases (Ar) →1% Their composition is non-variable and hence the climate effect is negligible Variable gases are those whose percentage composition varies significantly over places and time. They influence the weather and climate. The main variable gases are 1. Water vapour (0 to 4%)
48 km
60 km
80 km
500 km
1000 km Exosphere
Thermosphere
Mesosphere
Stratosphere
Troposphere
- 57◦c 15◦c
tropopause
Stratopause
8 - 18 km
Mesopause
Thermopause
Ionospere
300
200
100
0
Night
Day
Heig
ht (k
m)
F
F2
F1
E D
E
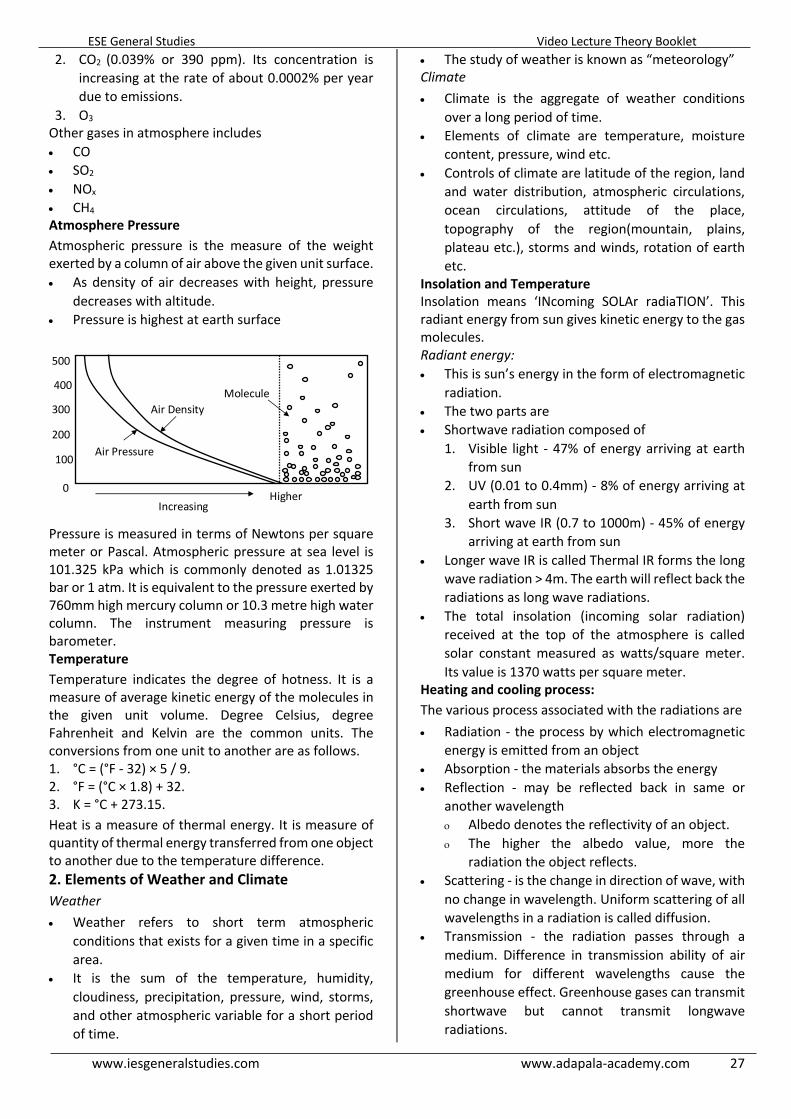
ESE General Studies Video Lecture Theory Booklet
www.iesgeneralstudies.com www.adapala-academy.com 27
2. CO2 (0.039% or 390 ppm). Its concentration is increasing at the rate of about 0.0002% per year due to emissions.
3. O3 Other gases in atmosphere includes • CO • SO2 • NOx • CH4 Atmosphere Pressure
Atmospheric pressure is the measure of the weight exerted by a column of air above the given unit surface. • As density of air decreases with height, pressure
decreases with altitude. • Pressure is highest at earth surface
Pressure is measured in terms of Newtons per square meter or Pascal. Atmospheric pressure at sea level is 101.325 kPa which is commonly denoted as 1.01325 bar or 1 atm. It is equivalent to the pressure exerted by 760mm high mercury column or 10.3 metre high water column. The instrument measuring pressure is barometer. Temperature
Temperature indicates the degree of hotness. It is a measure of average kinetic energy of the molecules in the given unit volume. Degree Celsius, degree Fahrenheit and Kelvin are the common units. The conversions from one unit to another are as follows. 1. °C = (°F - 32) × 5 / 9. 2. °F = (°C × 1.8) + 32. 3. K = °C + 273.15. Heat is a measure of thermal energy. It is measure of quantity of thermal energy transferred from one object to another due to the temperature difference. 2. Elements of Weather and Climate Weather • Weather refers to short term atmospheric
conditions that exists for a given time in a specific area.
• It is the sum of the temperature, humidity, cloudiness, precipitation, pressure, wind, storms, and other atmospheric variable for a short period of time.
• The study of weather is known as “meteorology” Climate • Climate is the aggregate of weather conditions
over a long period of time. • Elements of climate are temperature, moisture
content, pressure, wind etc. • Controls of climate are latitude of the region, land
and water distribution, atmospheric circulations, ocean circulations, attitude of the place, topography of the region(mountain, plains, plateau etc.), storms and winds, rotation of earth etc.
Insolation and Temperature Insolation means ‘INcoming SOLAr radiaTION’. This radiant energy from sun gives kinetic energy to the gas molecules. Radiant energy: • This is sun’s energy in the form of electromagnetic
radiation. • The two parts are • Shortwave radiation composed of
1. Visible light - 47% of energy arriving at earth from sun
2. UV (0.01 to 0.4mm) - 8% of energy arriving at earth from sun
3. Short wave IR (0.7 to 1000m) - 45% of energy arriving at earth from sun
• Longer wave IR is called Thermal IR forms the long wave radiation > 4m. The earth will reflect back the radiations as long wave radiations.
• The total insolation (incoming solar radiation) received at the top of the atmosphere is called solar constant measured as watts/square meter. Its value is 1370 watts per square meter.
Heating and cooling process: The various process associated with the radiations are
• Radiation - the process by which electromagnetic energy is emitted from an object
• Absorption - the materials absorbs the energy • Reflection - may be reflected back in same or
another wavelength o Albedo denotes the reflectivity of an object. o The higher the albedo value, more the
radiation the object reflects. • Scattering - is the change in direction of wave, with
no change in wavelength. Uniform scattering of all wavelengths in a radiation is called diffusion.
• Transmission - the radiation passes through a medium. Difference in transmission ability of air medium for different wavelengths cause the greenhouse effect. Greenhouse gases can transmit shortwave but cannot transmit longwave radiations.
500 400
300 200 100
0
Air Density
Air Pressure
Molecules
Increasing
Higher

ESE General Studies Video Lecture Theory Booklet
www.iesgeneralstudies.com www.adapala-academy.com 28
• Refraction - the phase of wave changes when it travels from one medium to another of different densities
Greenhouse Effect • Greenhouse gases (GHG) readily transmit the
incoming shortwave radiation but do not easily transmit the outing long wave terrestrial radiation. This will heat up the lower atmosphere.
• The increase in GHGs and accompanied rise in average global temperature is referred to as global warming
• The most important GHG are water vapour, CO2 other trace gases (CH4).
Air movements • Convection - is the movement of the heated
molecules form one place to another, predominantly in vertical circulation.
• Advection - is the horizontal movement of air mass for heat transfer
• Adiabatic cooling and heating • In atmosphere, when an air parcel ascends or
descends, its temperature changes. This change is called adiabatic cooling or heating. Adiabatic means change in temperature without gain or loss of heat of the air parcel.
• When altitude changes, due to change in pressure, air either expands or compresses. As per gas law, the temperature changes when pressure and volume changes. This causes cooling of air when it expands and heating of air when it contracts.
• Adiabatic cooling is the important process involved in the cloud development and precipitation
Temperature inversion In normal case, • The temperature in troposphere decreases with
increasing altitude at an average rate of about 6.50c/1000 meters.
• Temperature inversion is a situation in which temperature in troposphere increase with altitude
• This phenomenon is common during winter, in high latitudes, cool air regions and valley slopes.
• The existence of cool air mass near the ground surface is called subsidence and leads to high pressure conditions in the region. High pressure conditions do not favour vertical movements of air.
• This condition influences weather and climate by o Diminishing the possibility of precipitation o Increasing air pollution, as pollutants do not
disperse Humidity Humidity is the measure of the amount of water vapour content in the air. Various measurements are,
Absolute humidity: Measures the mass of water vapour in a given volume of air (g/m3). The value changes with expansion/compression of air. Specific Humidity: Measures the mass of water vapour in a given mass of air (g/kg). The value is not affected by volume variations. Relative Humidity (RH): • This measurement describes how close the given
parcel of air is to saturation. Saturation means the maximum quantity of water vapour that air can hold at the given temperature.
• It is expressed as percentage ratio of actual amount of water vapour to the water vapour capacity holding capacity of the air.
• The water vapour holding capacity is determined by the temperature. As temperature increases, water vapour holding capacity increases, thus RH decreases. Similarly, when the air is cooled, it moves closer towards saturation.
Vapour pressure: This measurement denotes the contribution of water vapour to the total pressure of atmosphere. Dew point temperature Cooling can bring an unsaturated parcel air to the saturation point, even without addition of more moisture. The temperature at which saturation is reached is called the dew point. The dew point varies as per moisture content in air. Water vapour in the air condenses at the dew point. Sensible temperature: Refers to the temperature as it is felt. It is Influenced by temperature, relative humidity and wind. Condensation and Precipitation • Condensation is the reverse process of
evaporation. The water vapour in air condenses to form water droplets or ice crystals. It occurs when the air reaches saturation point (100% relative humidity)
• Water Vapour needs a surface for condensation. If no surface is available, no condensation occurs and air remains super saturated (RH>100%)
• Particulate matter or hygroscopic particles can serve as surface for condensation. They are known as condensation nuclei.
• Such particles are concentrated over cities, seacoasts, volcanoes etc, thus rainfall is relatively higher over these regions.
• Cloud is formed as a result of condensation in air. Fog and mist are nothing but a cloud formed on ground.
• Condensed water from cloud falls on earth as ‘precipitation’

ESE General Studies Video Lecture Theory Booklet
www.iesgeneralstudies.com www.adapala-academy.com 29
Forms of Precipitation
Rain Snow Sleet Hail
Drops of liquid water
Solid ice crystals, flakes etc
Frozen rain drops
Concentric layers of ice and snow
3. Winds, Storms and Cyclones Global wind circulations
Heat transfer from equator to poles happens through wind circulations. There exists a permanent pattern of circulation in the globe creating the global wind belts.
The Coriolis effect • Due to rotation of earth, the winds cannot follow
the theoretical circulation path from the equator to poles. Winds get deflected to right in northern hemisphere and to left in the southern hemisphere.
• This apparent effect on the moving bodies is called Coriolis effect.
• This effect influences both oceanic and atmospheric circulations.
• As a results three circulatory cells are formed in the atmosphere.
Vertical Movements of air
• Air gets heat from the earth surface and rises up. Such regions are low pressure regions. Cloud formation and precipitation is frequent in such regions.
E.g.: Equatorial regions • In high pressure regions subsidence happens, so
there will be no cloud formation. The sky will be clear devoid of clouds (no overcasting). Such regions will be dry.
E.g.: subtropical hot deserts. El-Nino and La - Nina
• Apart from the permanent wind and ocean circulations, there exists various circulations in the atmosphere-ocean system. The El Niño-Southern Oscillation (ENSO) is one such system.
• El Niño and La Niña are opposite phases of the ENSO cycle. The cycle repeats once in 2-3 years.
• This happens due to the fluctuations in sea surface temperature in the eastern equatorial Pacific Ocean.
• The ENSO phenomenon influences the Indian monsoon. Usually El Niño causes drought in India and La Niña causes excess rainfall.
El Niño
• Normally cold currents flow through the eastern equatorial Pacific Ocean (Peruvian cold current). Sometimes this cold current will be replaced by hot current.
• This appearance of unusually warm water in the central and eastern equatorial Pacific Ocean is called El Niño phenomenon.
• It affects the winds patterns. The east to west winds (trade winds) weakens.
• This brings less rain in northern Australia and southeast Asia. But Pacific coastal South America gets more rain than normal.
La Niña • La Niña is opposite phase of El Niño. The Peruvian
current gets colder than normal. • The trade winds strengthen. • Northern Australia and southeast Asia get more
rain and Pacific coastal South America gets less rain.

ESE General Studies Video Lecture Theory Booklet
www.iesgeneralstudies.com www.adapala-academy.com 30
Cyclones and anticyclones: • They are distinct and predictable wind patterns
that develop around intense high-pressure or low- pressure centers. Cyclone has low pressure center; anticyclone has high pressure center.
• Because of the Coriolis Effect, the winds circulate around the center.
• The cyclone winds rotate in anti-clockwise or counter-clockwise in the northern hemisphere and clockwise in southern hemisphere
• The anticyclone winds rotate in clockwise in the northern hemisphere and anti-clockwise in southern hemisphere
• The two major types of cyclones are tropical
cyclones and temperate cyclones (hurricanes). Tropical Cyclones Tropical cyclones are formed in the equatorial oceans. Tropical Cyclone formation needs a high sea surface temperature for formation. Effects of cyclone • High winds and torrential rain • Storm surges in coastal regions • The eastern coast of India is affected by cyclone
landfalls. Thunderstorm • It is a violent convective storm accompanied by
thunder and lighting • They are usually localized and short-lived
phenomenon
The relation of air pollution and atmospheric conditions • If there is considerable air movement, the
pollutants will be quickly and widely dispersed. • Thus, air pollution is particularly noticeable when
high pressure (anticyclonic) conditions and temperature inversions prevail.
• For example, persistently smoggiest cities in the world are Mexico city, Los Angeles, Delhi (during winter).
4. Gas Equations Basic Equations Density = mass/volume Specific gravity = density of the substance/density of water Density of water = 1 g/cm3 Consider a mixture of gases A, B and C Weight fraction of A in the mixture
= (Weight of A) /(Total Weight) Mole fraction of A in the mixture
= (Moles of A) / (Total moles) Number of moles of A
= (Mass of A) / (Molecular mass of A) Average molecular weight of the mixture
= (molecular weight of A x mole fraction of A) + (molecular weight of B x mole fraction of B) + (molecular weight of C x mole fraction of C).
Example 1: Find the total number of moles and average molecular mass in given volume of air which contains 20 g of O2, 30 g of NO2 and 10 g of SO2 Answer: Moles of O2 = 20 g / 32g = 284.1 = 0.625 moles Moles of NO2 = 30 g / 46g = 0.652 moles. Moles of SO2 = 10 g / 64g = 0.156 moles. Total moles = 0.625+ 0.652 + 0.156 = 1.43 moles Mole fraction of O2 in the mixture = (Moles of O2) / (Total moles) = 0.625/1.43 = 0.437 Mole fraction of NO2 in the mixture = (Moles of NO2) / (Total moles) = 0.652/1.43 = 0.456 Mole fraction of SO2 in the mixture = (Moles of SO2) / (Total moles) = 0.156/1.43 = 0.109 Average molecular mass of the mixture
= (mol. mass of O2 x mole fraction of O2) + (mol. mass of NO2 x mole fraction of NO2) + (mol. mass of SO2 x mole fraction of SO2)
= 32 x 0.437 + 46 x 0.456 + 64 x 0.109 = 41.936 g Gas Law P V = n R T Where, • P is the Absolute Pressure • V is the Volume occupied by gas
ESE General Studies Video Lecture Theory Booklet
www.iesgeneralstudies.com www.adapala-academy.com 31
• T is Absolute temperature in Kelvin • N is Number of moles • R is the Gas law constant
= 1.986 calories / gmole - K = 0.08205 liter· atm/mol·K = 8.205 × 10⁻⁵m3⋅atm⋅K−1⋅mol−1
Rewriting ideal gas law in terms of density, Density = mass/volume = n x molecular weight of gas / Volume. Where, n = (P x V) / (R x T). Therefore Density = P x molecular weight of gas / (R x T) Combined gas law Combining Boyle's law (PV = constant), Charles' law (V/T = constant) and Gay-Lussac's law (P/T = constant), we get P1V1 / T1 = P2V2 / T2 The volume can be replaced by the volumetric flow rate q (rate of fluid flow or volume velocity, the volume of fluid which passes per unit time), q1 x P1 / T1 = q2 x P2/ T2 Henry’s Law The law states that at a constant temperature, the amount of dissolved gas in a volume of a specified liquid is directly proportional to the partial pressure of the gas in equilibrium with the liquid. In other words, the amount of dissolved gas is directly proportional to the partial pressure of its gas phase. Pg = H × Xg Pg - Partial pressure of gas H - Henry constant Xg - Mole fraction of gas in solution For ideal gas, Pg = mole fraction x Total pressure Reynolds Number Reynolds Number is the ratio of the inertial forces to viscous forces acting on a fluid. It provides information about the flow behaviour of the fluid, i.e. whether the flow is laminar or transitional. %& = ( × ) × r × µ D = Diameter of duct V = Average velocity of fluid µ = Viscosity of fluid r = Density of fluid In general, laminar flow Re < 2000 Transition region 2000 < Re < 4000 Turbulent flow Re > 4000 Heat Transfer The amount of heat required for a temperature change is Q = M CP ∂T Where, M = Mass of fluid
CP = Heat capacity of fluid ∂T = Change in temperature The rate of heat transfer, Q = M CP ∂T/t Where, t = time
Example 2: Determine the stack discharge velocity at 320 R (temperature in Rankine) in ft/min, if the standard conditions for the exhaust are 2000 standard cubic feet per minute (scfm), 270 R and 1 atm. The diameter of the stack is found to be 1.2 ft. Answer:
Given qstd = 2000 scfm(standard cubic feet per minute) From equation, q1 x P1 / T1 = q 2 x P2/ T2 qactual = qstd x {Tactual x Tstd} at constant pressure. qact = 2000 x 320/270 = 2370.37 cfm (actual cubic feet per minute) The cross sectional area of the stack. A = π x D2/4. = π x 1.22/4. = 1.130 ft2 Discharge velocity = qact / A = 2370.37 / 1.13 = 2097.67 ft / min. Example 3: SO2 is dissolved in a solution to exert a partial pressure of 0.01 atm at 80°F. If the mole fraction of SO2 is 0.1, find the pressure exerted by the solution. Answer: For ideal gas Pg = mole fraction x Total pressure Total pressure = Pg /mole fraction = 0.01/0.1 = 0.1 atm
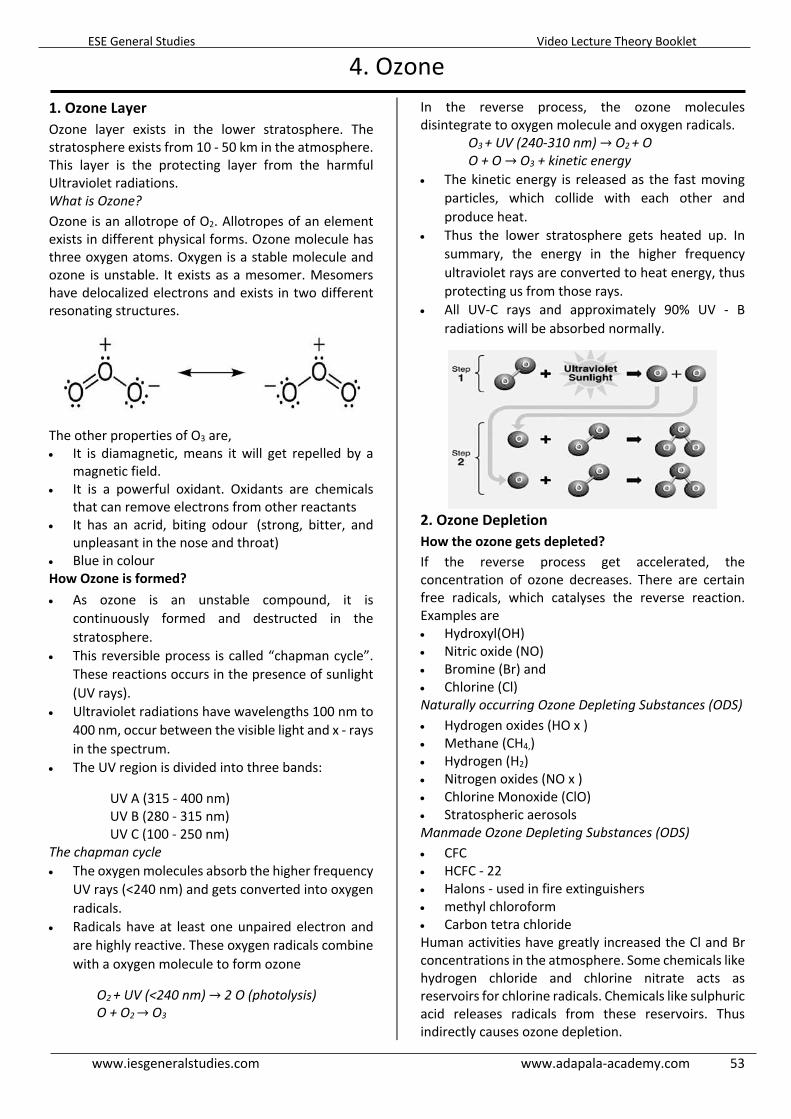
ESE General Studies Video Lecture Theory Booklet
www.iesgeneralstudies.com www.adapala-academy.com 53
4. Ozone 1. Ozone Layer Ozone layer exists in the lower stratosphere. The stratosphere exists from 10 - 50 km in the atmosphere. This layer is the protecting layer from the harmful Ultraviolet radiations. What is Ozone? Ozone is an allotrope of O2. Allotropes of an element exists in different physical forms. Ozone molecule has three oxygen atoms. Oxygen is a stable molecule and ozone is unstable. It exists as a mesomer. Mesomers have delocalized electrons and exists in two different resonating structures.
The other properties of O3 are, • It is diamagnetic, means it will get repelled by a
magnetic field. • It is a powerful oxidant. Oxidants are chemicals
that can remove electrons from other reactants • It has an acrid, biting odour (strong, bitter, and
unpleasant in the nose and throat) • Blue in colour How Ozone is formed? • As ozone is an unstable compound, it is
continuously formed and destructed in the stratosphere.
• This reversible process is called “chapman cycle”. These reactions occurs in the presence of sunlight (UV rays).
• Ultraviolet radiations have wavelengths 100 nm to 400 nm, occur between the visible light and x - rays in the spectrum.
• The UV region is divided into three bands:
UV A (315 - 400 nm) UV B (280 - 315 nm) UV C (100 - 250 nm)
The chapman cycle • The oxygen molecules absorb the higher frequency
UV rays (<240 nm) and gets converted into oxygen radicals.
• Radicals have at least one unpaired electron and are highly reactive. These oxygen radicals combine with a oxygen molecule to form ozone
O2 + UV (<240 nm) →2 O (photolysis) O + O2 →O3
In the reverse process, the ozone molecules disintegrate to oxygen molecule and oxygen radicals.
O3 + UV (240-310 nm) →O2 + O O + O →O3 + kinetic energy
• The kinetic energy is released as the fast moving particles, which collide with each other and produce heat.
• Thus the lower stratosphere gets heated up. In summary, the energy in the higher frequency ultraviolet rays are converted to heat energy, thus protecting us from those rays.
• All UV-C rays and approximately 90% UV - B radiations will be absorbed normally.
2. Ozone Depletion How the ozone gets depleted? If the reverse process get accelerated, the concentration of ozone decreases. There are certain free radicals, which catalyses the reverse reaction. Examples are • Hydroxyl(OH) • Nitric oxide (NO) • Bromine (Br) and • Chlorine (Cl) Naturally occurring Ozone Depleting Substances (ODS) • Hydrogen oxides (HO x ) • Methane (CH4,) • Hydrogen (H2) • Nitrogen oxides (NO x ) • Chlorine Monoxide (ClO) • Stratospheric aerosols Manmade Ozone Depleting Substances (ODS) • CFC • HCFC - 22 • Halons - used in fire extinguishers • methyl chloroform • Carbon tetra chloride Human activities have greatly increased the Cl and Br concentrations in the atmosphere. Some chemicals like hydrogen chloride and chlorine nitrate acts as reservoirs for chlorine radicals. Chemicals like sulphuric acid releases radicals from these reservoirs. Thus indirectly causes ozone depletion.

ESE General Studies Video Lecture Theory Booklet
www.iesgeneralstudies.com www.adapala-academy.com 54
CFC The single most major ozone depleting substance is CFC (chlorofluorocarbons) • Odourless, non - flammable, noncorrosive and
generally non - reactive chemical • Remains in atmosphere for a longer time • Used for industrial applications such as
refrigerators, propellants, foaming agents, fire extinguishing agents, solvents, aerosol sprays etc.
• In the stratosphere they are exposed to UV radiation. Photolysis occurs and chlorine radicals will be released
CFC + UV →Cl Cl + O3 →ClO ClO + O →Cl + O2
How Ozone concentration is measured? • Dobson unit is the measurement of the amount of
ozone in the atmosphere above an unit area of earth’s surface.
• 1 Dobson = 2.68 x 10²⁰ molecules and is equivalent to a pure layer of ozone 0.01 mm thick at standard temperature and pressure per square meter.
• Normal thickness is 300DU. If thickness is less than 220 DU, ozone hole is said to be formed.
• The DU is measured using Dobson Ozone spectrophotometer. Ozone can be monitored by a satellite instrument called TOTAL Ozone Mapping spectrometer.
What is ozone hole and where it is formed? • The ozone hole is defined as the area where the
ozone quantity is less than 220 Dobson units. • The phenomenon of ozone hole is generally
observed above Antarctica and sometimes over the Arctic during spring season.
• The cyclonic winds called ‘polar vortex’ are formed around the poles during winter.
• This circulation isolate the cold polar air from mixing with warmer air outside.
When the temperatures drop below -780c, thin clouds of ice, nitric acid and other mixtures are formed. These are the polar stratospheric clouds (PSCs). • These ice crystals provide surface for the chemical
reactions that releases chlorine (Cl2) from the natural reservoirs such as hydrogen chloride and chlorine nitrates.
• After winter season in spring, in presence of sunlight, these chlorine molecules break down to Cl radicals, and depletes O3 faster.
• The depletion continues till summer, when the temperatures become high enough to disperse the polar stratospheric clouds
Effects of Ozone depletion UV rays reaches the earth surface, which causes • Direct damage of DNA in the living cells • Affects the immune system • Causes skin cancer, eye diseases etc • Inhibits plant growth and causes change in species
composition in ecosystem • Kills phytoplankton in aquatic ecosystem • Affects reproduction of marine organisms Other effects are • Increases photo dissociation of key trace gases in
the atmosphere • Increases concentration of oxidants like hydroxyl
radicals • Changes the life time of gases like methane and
CFCs, which in turn add to global warming and ozone depletion.
• Affects the particulate matter concentrations which affects the weather conditions
• Causes photodissociation of polymers like plastics and rubber
Ground Level Ozone • Ozone in troposphere is a pollutant. • Causes damage to vegetation. • It is harmful to the respiratory system and eyes. • Causes cracking of polymers like rubber, plastics
etc. • It can corrode materials • Is a greenhouse gas • Is a component of the photochemical smog 3. Protection of the Ozone Layer Protection of ozone layer is relatively easy, as the chemicals causing it are known and can be controlled. The simple method is substitution of ODS with non-ODS for industrial uses. What are the substitutes for CFCs? The substitutes should have the following properties • Nil ODP(Ozone depleting potential) • Nil GWP(Global warming potential) • Operational efficiency • Operating pressure • Non - hazardous The available substitutes are: 1. HCFCs (Hydro chloro fluoro carbons)
They form a temporary substitute to CFCs.
ESE General Studies Video Lecture Theory Booklet
www.iesgeneralstudies.com www.adapala-academy.com 55
They contain less chlorine than CFCs. But they have higher global warming potential. Some countries have banned the use of HCFCs.
E.g.: R22, R123, R124. R - 22 is most popular refrigerant at present 2. HFCs ((Hydro fluoro carbons)
They are not harmful to ozone layer, but they have high global warming potential.
E.g.: R - 32 Methane series, R - 125 Ethane series, R - 134a Ethane series 3. Fluoro carbons They are not ozone depleting, but has high GWP. E.g.: R218 4. Hydrocarbons
Harmless to ozone, not a GHG, but are highly flammable
5. Ammonia - NH3(R717) ODP, GWP are zero. But self - altering properties and is hazardous
6. HFO (Hydro Fluoro Olefin) Can be used in same operating conditions like that of HFC - 134a
International Conventions Internationally, there is a treaty to protect ozone layer. The agreement is called Vienna convention for protection of the ozone layer, agreed upon at the Vienna conference of 1985. It is first global convection to get universal ratification and came to force in 1988. It is the most successful treaty so far. The legally finding targets to reduce the ODS was laid out in the accompanying protocol called Montreal Protocol. It was agreed in 1987 and is in force since 1989. It aims to phase out all ODS according to the schedule agreed upon the parties. The protocol was amended in 2016, known as Kigali Amendment to include the HFCs also. HFCs even though not ozone depleting are potential greenhouse gases. India and Montreal Protocol India become party to both conventional protocol in 1991 and 1992 respectively. India has phased out production and consumption of CFCs, carbon tetrachloride (used in steel industries) and halons. The present targets are • To phase out HCFCs by 2030 (as part of Montreal
protocol). • As per Kigali agreement India will freeze HFC use by
2028 and reduce to about 15% of 2025 levels by 2047.
• India has voluntarily agreed to eliminate use of HFC - 23(fluoroform). HFC - 23 is a by - product during manufacturing HCFC - 22.

ESE General Studies Video Lecture Theory Booklet
www.iesgeneralstudies.com www.adapala-academy.com 115
6. Engineering Ethics1. Engineering Ethics Engineering Ethics is the study of the moral issues and decisions related to individuals and organizations engaged in engineering profession. What is the need of Engineering Ethics? • To responsibly confront moral issues raised by
technological activity. • To recognize and resolve moral dilemma of
professionals. Basic goals of Engineering Ethics • To identify and enlist the types of ethical issues of
an engineer in his/her work life. • To clarify the key concepts, related theories and
standards involved. • To help engineers be prepared for resolving ethical
dilemmas. • To have a responsible discussion on these issues. • engineering ethics aims at knowing moral values
related to engineering, finding accurate solutions to the moral problems in engineering and justifying moral judgments of engineers
2. Macro and Micro - Ethics • Engineering ethics can be considered in three
frames of reference - individual, professional, and social.
• These be further divided into “microethics” and “macroethics”.
Micro ethics • Concerned with individuals and the internal
relations of the engineering profession • Deals about some typical and everyday problems Macro ethics • Concerned with the collective, social responsibility
of the engineering profession • Concerned with societal decisions about
technology • Deals with all the societal problems which are
unknown and suddenly burst out • Macroethics looks at bigger picture issues such as
sustainability, poverty, social justice, bioethics etc. • Consider the ethical implications of public policy
issues o Example:- risk and product liability, sustainable
development, health care, and information and communication technology
Macro level analysis of technology as a whole. • Example:- Ethical issues generated by new
developments such as nanoscience and nanotechnology, Ethical issues associated with robotics and autonomous systems
• Macroethics is generally not captured by professional codes of conduct
Personal Ethics
Some of the desires personal values are; Responsibility • Means liabilities and accountability for actions
• Ethical responsibility involves more than leading a decent, honest, truthful life
• Moral obligations include the crucial choices in technology
• And how intelligently to confront the the issues Integrity and honesty
ESE General Studies Video Lecture Theory Booklet
www.iesgeneralstudies.com www.adapala-academy.com 127
INFORMATION AND COMMUNICATION TECHNOLOGY
Chapters
1. Computing 2. Networking 3. Communication 4. Applications 5. E-Education 6. Governance 7. Cyber Security 8. Basis of Programming Languages
Reference Books and Materials
1. Wireless Communication and Networking – William Stallings 2. Cryptography and Network Security - William Stallings 3. Computer Networks – A. Tanenbaum 4. NCERT XI and XII text books 5. NPTEL Lectures 6. digitalindia.gov.in
Practice Questions: Adapala’ s Practice Questions Booklet Current Affairs: Hyperloop (www:iesgeneralstudies.com/downloads/)

ESE General Studies Video Lecture Theory Booklet
www.iesgeneralstudies.com www.adapala-academy.com 128
1. Computing1. Introduction Information technology (IT) is the use of any computers, storage, networking and other physical devices, infrastructure and processes to create, process, store, secure and exchange all forms of electronic data. When information is entered into and stored in a computer, it is generally referred to as data. After processing becomes information. When information is used for understanding or doing something, it is called as knowledge.
Difference between information and data • The useful data are called as information. • A data can become information only if it is
presented in a recognizable form. Data can be • Structured, E.g.: Data in an excel sheet • Semi Structured, E.g.: Email • Unstructured, E.g.: Human speech Computing Computing is any activity that uses computers. It includes developing hardware and software, using computers to manage and process information and applications like communication, entertainment etc. A computer means a system of components (i) To input data and display output i.e. input and
output devices; (ii) Processing unit called the Central Processing
Unit (CPU) and (iii) The Memory spaces (iv) Computer software
Processor • A processor is the logic circuitry that responds to
and processes the basic instructions that drive a computer.
A computer software which consists of 1. Algorithms - a specific set of ordered operations 2. Data - that is stored for the operations of the
system 2. Computer Software Software is a collection of data or computer instructions that tell the computer how to work. Depending on the function of software, it can be 1. A System software 2. A Middleware 3. An Application software System Software System software are designed to control the operation and networking of computers. It can further be divided into three types: Operating System, Language Processor and Utilities.
Operating System • An operating system manages overall performance
and functioning of the computer system by controlling the resources such as CPU, memory, I/O devices
E.g.: Linux, Mac OS, Windows 95/98/ VISTA etc. • The operating system acts as an interface between
the user and the computer hardware. Functions of an operating system are: 1. Processor Management: The operating system
takes care of the allotment of CPU time to different processes. This is called scheduling. Two types of scheduling techniques are : a. Priority Scheduling: Each task is given CPU time
according to the priority assigned to that task. b. Round Robin Scheduling: Each program or task
is given a fixed amount of time. If the task is not completed in the allotted time, it is put at
Application software
Software
System software
Operating system
Language processor
Utility General
purpose application
Specialized application
ESE General Studies Video Lecture Theory Booklet
www.iesgeneralstudies.com www.adapala-academy.com 129
the end of the queue. This technique improves the response time and provides an interactive environment.
2. Device Management: The Operating System communicates with hardware and the attached devices and maintains a balance between them and the CPU. The operating system employs two techniques - Buffering and Spooling. a. Buffering: The temporary storage of input and
output data is done in Input Buffer and Output Buffer of the devices.
b. Simultaneous Peripheral Operation on Line: For processing of different tasks on the same input/output device.
3. Memory management: In a computer, both the CPU and the I/O devices interact with the memory. When a program needs to be executed it is loaded onto the main memory till the execution is complete. Thereafter that memory space is freed and is available for other programs. The common memory management techniques are Partitioning and Virtual Memory. a. Partitioning: The total memory is divided into
various partitions of same size or different sizes.
b. Virtual Memory: The user can load the programs which are larger than the main memory of the computer. The operating system divides the main memory into equal sizes called pages. A part of the program resides in the main memory and is called the active set. The rest is in the secondary storage device. With the help of Page Map Tables (PMT), the operating system keeps track which page of main memory is storing which block of secondary memory. This allows more programs and even larger programs to be executed in the main memory.
4. File Management: The operating System manages the files, folders and directory systems on a computer. File Allocation Table (FAT) stores general information about files.
E.g.: Windows explorer Types of OS
1. Single User and Single Task OS: It is used on a standalone single computer for performing a single task.
E.g.: MS - DOS. 2. Multiuser OS: is used in mini computers or
mainframes that allow same data and applications to be accessed by multiple users at the same time. The users can also communicate with each other.
E.g.: Linux, UNIX. 3. Multiprocessing OS: have two or more processors
for a single running process. Each processor works
on different parts of the same task, or, on two or more different tasks. E.g.: Linux, UNIX, Windows 7.
4. Time sharing Operating System: It allows execution of more than one tasks or processes concurrently. For this, the processor time is divided amongst different tasks. Virtual Memory techniques are used in this type of operating system. For example, the user can listen to music on the computer while writing an article using a word processing software.
E.g.: Windows 95 and all later versions of Windows. 5. Real Time Operating System: It is a multitasking
operating system designed for real time applications like robotics.
6. Distributed Operating System: On a network, data is stored and processed on multiple locations. It allows shared data/files to be accessed from any machine on the network.
7. Interactive Operating System: Interactive computer systems are programs that allow users to enter data or commands. It could be a command line style of interface or it could be a graphical interface. Through Graphic User Interface (GUI) the user can easily navigate and interact.
8. Mobile Operating Systems (Mobile OS) • It is the operating system that operates on
digital mobile devices like smart phones and tablets.
• It extends the features of a normal operating system so as to include touch screen, Bluetooth, Wi - Fi, GPS mobile navigation, camera, music player and many more.
• The most commonly used mobile operating systems are - Android and Symbian
Android OS It is a Linux derived Mobile OS. It is Google’s open and free software that includes an operating system, middleware and some key applications. The Android releases have dessert inspired codenames like Cupcake, Honeycomb, Ice Cream, Jelly Bean etc. Middleware a. Manage the runtime systems b. Provide platform for app development Application Layers has the user applications - both inbuilt and downloaded. Whereas ‘Feature phones’ have only inbuilt apps Language Processors
For program execution, instructions must be converted into the machine language. Language processors are used to convert assembly language and high-level language programs into machine level language. E.g.: Assemblers, translators and compilers. • A program written in any high-level programming
language or in assembly language is called the Source Program or Source Code.
ESE General Studies Video Lecture Theory Booklet
www.iesgeneralstudies.com www.adapala-academy.com 130
• The program translated into machine code is known as Object Program or Object code.
• The Assembler is used to translate the program written in Assembly language into machine code.
• Compiler translates the source program as a whole in one go into machine code. Some of the examples are C and C++ compilers.
• Interpreter translates a single statement of source program into machine code and executes it immediately before moving on to the next. If there is an error in the statement, the interpreter terminates its translating process at that statement and displays an error message.
Utilities These are designed to aid, manage and tune the computer hardware, operating system or application software. These are also known as service programs, service routines, tools, or utility routines. Examples: disk defragmenter, disk compression, disk clean-up, disk check-up, antivirus, backup, compression etc. Middleware Middleware is a software layer situated between applications and operating systems. A typical operating system provides an application programming interface (API) for programs to utilize underlying hardware features. Middleware also provides an API for utilizing underlying operating system features. Examples • Database access services • The Android operating system provides a
middleware layer including libraries that provide services such as data storage, screen display, multimedia, and web browsing etc.
• Webservices form the middleware between server software and user software (browser) in www.
Application programming interface (API) A set of subroutine definitions, communication protocols, and tools for building software. • Provides interoperability between different
systems • Complex software can be made by integrating
different APIs • Example - messaging API, telephony API, payment
gateway, social media API etc used in internet and www
• Dotnet is an API by Microsoft which provides a platform for software development
Application Software There are enormous number of application software catering to our needs. We can categorise them according to their use as: • Educational and communication software. E.g.: LMS (Learning management system) • Design, media and simulation software.
E.g.: CAD, Adobe photoshop • Office automation and process management
software. E.g.: MS office, tally, SAP • Control and analysis software. E.g.: GIS Commercial - Off - The - Self (COTS) packages can be used to develop customised applications. E.g.: Packages such as GIS, Simulators, CAD/CAM, SAP etc. They are available in the market and applications are being developed using these COTS packages. Software categorisation based on their ownership and licenses 1. Proprietary 2. Shareware 3. Freeware 4. Open source 5. Free Software 1. Proprietary software
a. Developer holds the copyright b. Users get them for a fee c. Users cannot modify or distribute
2. Shareware a. Developer distributes, but holds the copyright b. The cost of development will be shared among
the users c. Users who want to continue using the program
after the trial period are encouraged to purchase the.
d. Shareware is generally less expensive 3. Freeware a. They are given away free of charge and often made
available on the Internet. b. The programmer offers programs as freeware
either for personal satisfaction or to assess its reception among interested users.
c. Program developers often retain all rights to their freeware and users are not free to copy or distribute or sell it further.
4. Open source Software • Code is open, means public has access • People can modify, distribute • Examples are Linux, Netscape communication,
android platform, Hadoop, GIS, wordpress.org, Moodle, Python, Tux Paint etc
Advantages • Better for Coders - People start coding from the
point of already existing level of code. • Better for Users - The user does not have to spend
more for applications. The user can get his applications customised without getting into huge investments.
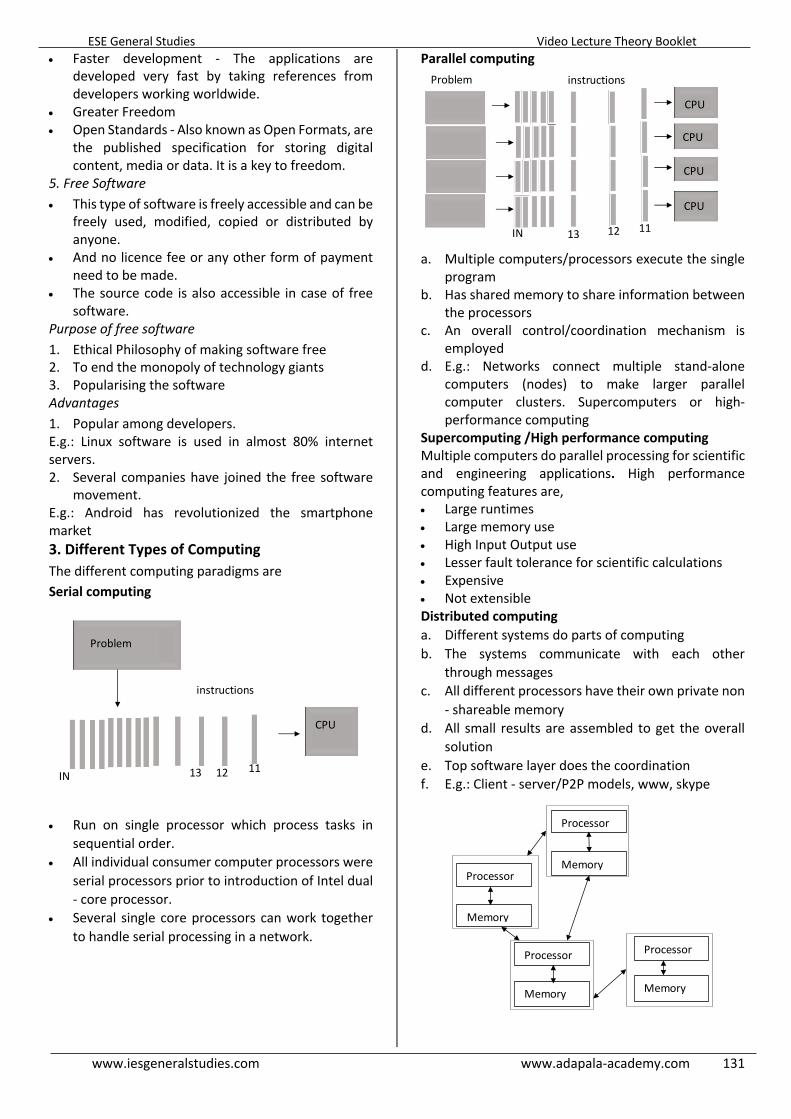
ESE General Studies Video Lecture Theory Booklet
www.iesgeneralstudies.com www.adapala-academy.com 131
• Faster development - The applications are developed very fast by taking references from developers working worldwide.
• Greater Freedom • Open Standards - Also known as Open Formats, are
the published specification for storing digital content, media or data. It is a key to freedom.
5. Free Software • This type of software is freely accessible and can be
freely used, modified, copied or distributed by anyone.
• And no licence fee or any other form of payment need to be made.
• The source code is also accessible in case of free software.
Purpose of free software 1. Ethical Philosophy of making software free 2. To end the monopoly of technology giants 3. Popularising the software Advantages 1. Popular among developers. E.g.: Linux software is used in almost 80% internet servers. 2. Several companies have joined the free software
movement. E.g.: Android has revolutionized the smartphone market 3. Different Types of Computing The different computing paradigms are Serial computing
• Run on single processor which process tasks in
sequential order. • All individual consumer computer processors were
serial processors prior to introduction of Intel dual - core processor.
• Several single core processors can work together to handle serial processing in a network.
Parallel computing
a. Multiple computers/processors execute the single
program b. Has shared memory to share information between
the processors c. An overall control/coordination mechanism is
employed d. E.g.: Networks connect multiple stand-alone
computers (nodes) to make larger parallel computer clusters. Supercomputers or high-performance computing
Supercomputing /High performance computing Multiple computers do parallel processing for scientific and engineering applications. High performance computing features are, • Large runtimes • Large memory use • High Input Output use • Lesser fault tolerance for scientific calculations • Expensive • Not extensible Distributed computing a. Different systems do parts of computing b. The systems communicate with each other
through messages c. All different processors have their own private non
- shareable memory d. All small results are assembled to get the overall
solution e. Top software layer does the coordination f. E.g.: Client - server/P2P models, www, skype
Problem
instructions
IN 13
12 11
CPU
CPU
CPU
CPU
CPU
Problem instructions
11 12 13 IN
Processor
Memory Processor
Memory
Processor
Memory
Processor
Memory

ESE General Studies Video Lecture Theory Booklet
www.iesgeneralstudies.com www.adapala-academy.com 132
Utility computing • Can arrange for more computing resources as per
need. E.g.: Internet hosting systems Quantum computing a. Uses quantum phenomena - superposition,
entanglement and interference to manipulate information
b. Superposition - qubits can take on the value 0, or 1, or both simultaneously
c. Entanglement is correlation between the different qubits. For n qubits there are 2n correlations.
d. Quantum interference can be understood similarly to wave interference - when two waves are in phase, their amplitudes add, and when they are out of phase, their amplitudes cancel.
Cluster computing, Grid computing and Cloud computing • These are models of distributed computing • They provide cost effective solutions over the high
performance computing Cluster computing • Interconnected, independent systems • Usually in a single location • Comprised of similar systems • Software layer coordinates the systems E.g.: Google Search Engine Grid computing • Interconnected, independent systems • Spread over large geographic area • Distance problem overcome by larger bandwidth
and high speed connections • Offers data storage and computation services like
an utility, i.e. available over the grid • Resources can be turned on/off as per requirement E.g.: Internet Cloud computing • Improved version over the grid computing • Cloud means actual computation is done
somewhere far from the end devices • Uses on - demand provisioning, ie the resources
are used as much as required instead of switching on and off
• Internet based - uses network of remote servers. • Offers storage, data management and processing
as services E.g.: Web based email, google docs Mobile computing, edge computing, fog computing Mobile computing • Has computing capability and can transmit/ receive
data while in motion. • Applications are run in devices like mobiles,
laptops etc but data processing and storage happens in the cloud
Edge Computing • Means computing done away from centralized
nodes • Computing is one at the logical extremes of a
network, for example in IOT devices like sensors Fog computing • Computing is done away from centralized nodes to
the local area network (LAN) level of network architecture
• E.g.: Processing data in a fog node or IoT gateway. 4. Cloud Computing - Models and Application
Cloud computing uses the internet and central remote servers to maintain data and applications. It is delivered to the end user as a service over the network. For example, the web based e - mail service providers like Yahoo, Gmail, Outlook etc. takes care of storing all the hardware and software necessary to support our personal e mail account. Office software (word processors, spreadsheets, etc.), graphics software etc. are also now available in cloud. Cloud service models Cloud providers offer services that can be grouped into three major services. They are Software as a service (SaaS), platform as a service (PaaS), and infrastructure as a service (IaaS).
1. Service as a Software • Here a complete application is offered to the
customer. Consumers purchase the ability to access and use an application or service that is hosted in the cloud.
• Example - Google Docs - a single instance of the service runs on the cloud and multiple end users are serviced.
• SaaS makes it unnecessary to have a copy of software to be installed on user devices like desktop.
• SaaS also makes it easier to have the same version of the software to all of personal devices like desktop and mobile phone at once by accessing it on the cloud.
• Customers have least control over the cloud. • For customer, there is no need for high investment
in servers or software licenses

ESE General Studies Video Lecture Theory Booklet
www.iesgeneralstudies.com www.adapala-academy.com 173
• Includes LMS, online admission system, e- portfolio, project management, general accounting system, payroll generation, purchase & inventory management, library automation, online election management, web hosting, management system
School Management Systems • E - governance • Automated school administration
o Planning o Library o Resources o E - office o Records maintenance o Student tracking o Guidance & counselling o Support services
Design, Media and Simulation Software
CAD • Computer Aided Design (CAD) software are used to
create two and three-dimensional design. • Use of CAD
o Saves time in making and editing the drawings o Enables the designers to lay out and develop
work on the screen o Provides print out of the designs o Reduces the design cycle and overall product
development costs o Stores the designs for future purposes in digital
form thus occupying practically no space. o Help in quality assurance and control
AUTOCAD • A proprietary CAD software for 2D,3D design and
drafting • Create blueprints of buildings, computer chips etc. • Graphic simulations, prototyping • Analysis on variety of environments and stresses ORCAD • Electronic hardware and PCB design software • For electronic design automation MATLAB Technical computing, visualization and programming software used for • algorithm development • modelling, simulation, prototyping • statistics, data analysis, exploration, visualization • graphics - scientific and engineering (2D & 3D) • Application development • Math functions - sine, cosine, matrix inverse,
eigenvalues, FFT etc. Scilab • For signal processing, statistical analysis, image
enhancement, fluid dynamic simulations
numerical optimization, modelling, symbolic manipulations etc.
GNU Octave • Free and opensource software • Emphasis is on syntactic compatibility with
MATLAB Oscad/E - Sim • For circuit design, simulations, analysis and PCB
design Open foam • Field operation and manipulation • C++ tool box for customized numerical solvers for
continuum mechanics problems • Computational fluid dynamics Fluent • To model fluid flow, aerodynamics, combustion,
hydro dynamics, particle dispersions, heat transfer etc.
COiN - OR • Open source operations research software. • Linear programming • Development and deployment of models,
algorithms, computation research etc. Arduino • Electronic prototyping platform Netduino • Open source hardware based on .NET micro
framework. • At higher level of abstraction than Arduino MS office/office 365 • Real time coauthoring • Chat, email incorporated • Presentations • Offline working • Planner etc. LaTex • Document preparation system • Typesetting system for technical and scientific
documentation Open Office • Word processor, spreadsheet, presentation,
application, drawing application, formula editor • Default file format is ODF (open document format) AI in education
• Automation of some tasks • Student assessment, adaptation to student’s
needs, helping students in learning • Alternate learning models • Prediction of patterns- failures, dropouts etc. • Helping the children with special needs Ex: Human
computers interface for sign languages avoids need of interpreter for hearing impaired people
ESE General Studies Video Lecture Theory Booklet
www.iesgeneralstudies.com www.adapala-academy.com 174
3. Networking in Education Schools/colleges’ network for • Information sharing and storing • Connections (administrators, students and
teachers) • Services (registration, courses schedules, access
research etc.) • Computing resources. E.g.: High quality printers, collaborative software • Flexible working and Access. E.g.: For assignment & projects • Management and networking of the institutions Use of Satellite Network SITE (Satellite Instructional Television Experiment)
• Designed jointly by NASA and the Indian Space Research Organization (ISRO)
• Uses of satellite in support of development & educational programs
• Villages are covered for education, agriculture, health, family planning & national integration
• Direct reception television (DRS) sets were deployed
Gyan Darshan
• Satellite based TV channel • soft skill training • Gyan Darshan -11(Edusat or Gsat - 3) is an exclusive
educational satellite • uses DVB-RCS technology • Distance education through virtual classroom
mode • Interactive and non - interactive classes • Access to digital repository of IGNOU • Connectivity to institutions • Developmental communication • Edusat Multimedia Research Centres established
to leverage EDUSAT VSAT
• E - learning for remote locations • Enables real time applications • Can accommodate multiple locations in a single
network School GIS
• Web based data management system • Digital map of school locations • Map services • School report cards Web Technologies Web 2.0 • Has redefined the internet’s user interface • knowledge transfer has become a two-way process
o Sharing sites o Blogs - wordpress, Life Type, Roller (open
source)
o Rss feeds o Podcasts →Audacity, Juice o Wiki →Xwiki, Swik, Trac etc o Discussion forums
E.g.: EDTECH List HNet (an international consortium of scholars and teachers) Cloud hosting o Create, edit and store online o Ideal for publishing within an institution,
maintaining blogs or composing work Digitalisation of Education 1. Virtual universities 2. Virtual classroom
o Teleconferencing o Use of www o Accessible to large number of students
3. Virtual labs o Graphical front end o Simulation engine at backend o Works on actual measurement data (remote
access to labs) or remotely triggered experiment
4. Distance Learning o Users both traditional contents and e -
contents. E.g.: NIOS, IGNOU MOOC (Massive Open Online Courses)
• Open source model • No specific restrictions on access • Many global universities have released moocs • Licensee can be open or commercial Examples: • Coursera • Edx - for promotion of moocs • Khan academy • SWAYAM • Code academy OCW (open course ware)
• Consists of teaching materials supplemented by video lectures
• Courseware means study materials for both online and offline purposes
• Designed for both teachers and learners E.g.: MIT open course ware 4. Digital Libraries and Digital Contents Advantages • Easy text, images, video and audio collection • Improved and wider access • Preservation of resources • Efficient search and retrieval • Improved sharing E - Granthalaya
• Library management software developed by NIC

ESE General Studies Video Lecture Theory Booklet
www.iesgeneralstudies.com www.adapala-academy.com 175
• Uses postgreSQL, an open source DBMS • Is available in ‘Meghraj’ for government libraries Digital Libraries in India
• Shodhganga - National repository of theses and dissertations
• E - shodh sindhu →Peer - reviewed journals and other publications
TKDL • Collaboration of CSIR, Ministry of S&T, Ministry of
AYUSH • Documentation of knowledge available in public
domain • Supports five international languages (English,
French, German, Spanish, Japanese) Sugamya Pustakalaya • India’s first and largest collection of accessible
books • For inclusive education E - Basta • School books in digital form • Bring various publishers and schools one platform
(both free and commercial) • The school can browse the contents, organize and
create their own e-basta E- Pathshala • Educational resources for teachers, students,
parents, researchers and educators • The resources are available in English, Hindi and
Urdu languages. • The students can get access of all educational
material, including textbooks, audio, video, periodicals and a variety of other print and non-print materials
DLI (Digital Library of India) • Collection of rare books and significant books • Free access over internet EGyanKosh • A National Digital Repository to store, index,
preserve, distribute and share the digital learning resources developed by the open and distance Learning Institutions in the country.
5. Government Initiatives in E - Education ICT in schools • Computer labs • ICT skills • Computer aided education • Smart school • Capacity enhancement of teachers • Development of e-contents • Shala Darpan and Shala siddhi Shiksha
• For teacher training
• For applications of ICT • Uses ICT for training SWAYAM • Indigenously developed IT platform for online
courses • All class room courses covered from 9th till PG • Anyone, anywhere, anytime can access free of cost • Interactive • Offers certificates for registered students after
successful completion of course on payment of fee for certification.
PMGDISHA • To train 6 crore persons in rural areas • Make 40% of rural households digitally literate
covering one member from every eligible household by march 2019
The NMEICT (National Mission on Education Through Information & communication Technology) • Centrally sponsored scheme, 2009 • For enhancing gross enrolment ratio in higher
Education • Connectivity to all colleges and universities • Low cost access-cum-computing devices to
students and teachers. E.g.: Akash tablet • High quality e - content to all learners • To bridge the digital divide • Appropriate pedagogy for e -learning • Experiments through virtual laboratories • Online tests and certifications • Guides and mentors online • Utilization of Edusat & DTH platforms • Training and empowerment of teachers • All services available through the portal sakshat • A - VIEW →for teacher training • Spoken tutorial • DTH programme →50 DTH education channels for
UG courses • E - yantra • NDL (National Digital Library) - content of any
language and interface support for leading vernacular languages
NPTEL
• National Program on Technology Enhanced Learning
• Curriculum based video lectures and web courses • By MHRD for Engineering, science, Technology,
management and humanities Free & open source software for Education (FOSSE)
• Under NMEICT • Aimed to provide free support for FOSS (free and
open source software) • Self - workshops documentation for FOSS • Lab migration activity - to help to migrate from
proprietary software based labs to FOSS
ESE General Studies Video Lecture Theory Booklet
www.iesgeneralstudies.com www.adapala-academy.com 176
E.g.: Scilab to replace matlab o Oscad to replace ORCAD o Openfoam to replace FLUENT o COIN-OR for optimisation o Python for programming o Open office for documentation o MySQL
• For websites encourage use of, o Apache Tomcat o PHP o Javascript o PERL
• Develop softwares if required INFLIBNET
Objectives • Information & Library Network - create a virtual
network of people and resources in academic institutions
• Development of e - learning resources, virtual labs, open source applications etc
• Build and strengthen ICT infrastructure in educational institutions
National Knowledge Network
• Connects all universities, research institutions, libraries, labs, health care and agricultural institutions
ESE General Studies Video Lecture Theory Booklet
www.iesgeneralstudies.com www.adapala-academy.com 177
6. E - Governance1. Governance Governance is the process of decision making and the process by which decisions are implemented (or not implemented) Good Governance
Good Governance has 8 major characteristics 1. Participatory 2. Consensus oriented - views of everybody are taken
into account 3. Accountable - less corruption/decision and action
taken as per rule of law 4. Transparent - follows rules and regulations,
information is freely available and accessible 5. Responsive - to present and future needs of society
within a reasonable time frame 6. Effective & efficient - best use of resources,
sustainable use 7. Equitable & Inclusive - voice of most vulnerable is
heard 8. Follows rule of law - fair legal framework and
impartial enforcement ICT in Good governance ICT helps in • Managing large volumes of data and work • Workflow between government operations,
department, agencies • Automation of complicated and repetitive tasks • Reducing personal interface • Information available to citizens • Improved and affordable connectivity • Improving reach • Reduce cycle times • Public participation • Impartiality • Transparency 2. E governance What is e - governance? • Utilization of internet to serve people • Use of ICT to support administration or
management of government Features • Active, transparent, efficient, responsive, reliable • 24 X 7 online services • Faster information distribution E - Governance involves, • Business process re-engineering • Automation • E - databases
o Management Information System (MIS) - to manage and support managerial decisions
o Decision Support System (DSS) - for development , planning and responsive administration in governments
Advantages • Simplification • Online tracking • Online repositories. E.g.: For certificates, identity
documents, etc. • Integration of services and platforms • Automation of certain jobs • Participatory governance - provides platform for
citizens to give feedbacks, raise complaints, give inputs, access data and monitor the government processes
• Bridging the Digital Divide • Social and Financial Inclusion • Reaching - the - Unreached • Communication
o One way →websites →regulations, policies, Programmes, applications, e - voting, tax filing, financial transaction etc
o 2 way →input from citizens also E - Governance Models The four basic models are 1. Government - to - citizen(customer) 2. Government - to - employees 3. Government - to - government and 4. Government - to - business G2C
• To offer a variety of ICT services to citizens in an efficient and economical manner
E.g.: E - passport G2E
• Help employees maintain communication with the government and vice versa.
E.g.: E - payroll, e - training etc G2G (E - government) Aimed at efficient file routing, quick search and retrieval of files and office orders, digital signatures for authentication, forms and reporting components etc. • Inter organisational relationship • Policy coordination • Implementation E.g.: E - office project of central government G2B The Main Goal of Government to Business is • Lowering cost of doing business • Cutting red tape • Transparency E.g.: MCA 21 - by the Ministry of Corporate Affairs
ESE General Studies Video Lecture Theory Booklet
www.iesgeneralstudies.com www.adapala-academy.com 178
Disadvantages of e - governance There exists • Digital divide • Illiteracy • Infrastructure deficiencies before achieving full
benefits out of e - governance 3. Digital India Vision Areas of Digital India
These are three vision areas of areas of digital India 1. Digital infrastructure as a utility for citizens 2. Governance of services on demand 3. Digital empowerment of citizens a. Digital Infrastructure A. Broadband and high speed internet • A nationwide broadband network • Mandatory communication infrastructure in new
urban settlements and buildings • National Rural Internet Mission - coverage through
Common Services Centres (CSCs) and Post offices as multi-service centres
B. Infrastructure for digital identity and financial inclusion • Aadhaar the 12 - digit individual identification
number • JAM for financial inclusion C. Common service Centres • Internet connectivity is available through the CSC. • Public can avail G2C services, B2C services, banking
services etc. • learn computer skills at the CSC D. Digital lockers • Shareable private spaces on a public cloud to every
citizen E. Make cyberspace safe and secure b. Governance and Services A. Integrated services • Providing single-window access to services • Use of open APIs to promote software
interoperability for all e-governance applications and systems
• Common platforms like MeghRaj Cloud Platform, Mobile Seva, PayGov and Sangam
B. Real time services • Information services and grievance - handling
mechanism online on a real time basis. C. Use of cloud technologies • GI Cloud is named as ‘MeghRaj’ • To accelerate delivery of e - services • Optimizing ICT spending of the Government. D. Government services for businesses • For improving Ease of Doing Business. • Examples
o The e - Biz project provides integrated services
o The MCA21 for statutory requirements and other business related services.
o The e -Trade facilitates foreign trade. E. Digital Financial Transactions • Electronic payments and fund transfers for
targeted and direct delivery to the intended beneficiaries without the involvement of middlemen
F. Use of GIS technology • National Geospatial Information System (NGIS) is
being implemented to integrate geo-spatial data available with a number of organizations such as Survey of India, National Informatics Centre (NIC), NRSA
• Develop a GIS platform for e- Governance applications.
• For monitoring the physical progress of projects, disaster management and specialized needs of public safety agencies.
c. Digital Empowerment
A. Digital literacy • Digitization and connectivity of the local
institutions, such as panchayat office, schools, health centres, libraries, etc
• National Digital Literacy Mission to empower at least one person per household with crucial digital literacy skills by 2020
B. Digital resources, and collaborative digital platforms • Digital resources/services in Indian languages • Digitalisation of government documents or
certificates • E - Bhasha
o Digital content in local languages o The disabled friendly content and systems
• National Data Sharing and Accessibility Policy (NDSAP) o Requires government organizations to
proactively release their datasets in an open format.
o Data.gov.in provides a single point access to all the open - format datasets
• India Development Gateway (InDG) o InDG facilitates rural empowerment
• Digitize India Platform (DIP) o To lead organizations towards a paperless
office o Accessibility - Providing access to digital
resources for citizens with special needs, such as those with visual or hearing impairments, learning or cognitive disabilities, physical disabilities
o Collaborative and participative governance Nine pillars of Digital India
a. Broadband Highways b. Universal Access to Mobile Connectivity

ESE General Studies Video Lecture Theory Booklet
www.iesgeneralstudies.com www.adapala-academy.com 179
c. Public Internet Access Programme d. E - Governance: Reforming Government
through Technology e. E - Kranti - Electronic Delivery of Services f. Information for All g. Electronics Manufacturing h. IT for Jobs i. Early Harvest Programmes
a. Broadband Highways • For All Rural, Broadband for All Urban and National
Information Infrastructure. • NOFN and Bharatnet projects • National Information Infrastructure • For integration of all core ICT infrastructure built
under National e -Governance Plan (NeGP) • Integrate the network and cloud infrastructure in
the country • Networks such as State Wide Area Network
(SWAN), National Knowledge Network (NKN) and the MeghRaj Cloud.
• National Knowledge Network (NKN): to connect all the knowledge institutions like AIIMS, IIT, IISC, DRPs, CSIR etc in India
b. Universal Access to Mobile Connectivity
• Focus on network penetration and fill the gaps in connectivity.
c. Public Internet Access Programme • Giving internet access to the public. • National Rural Internet Mission - The two
subcomponents are Common Service Centres and Post Offices as multi - service centres.
• Urban public Wi-Fi is provided to increase the internet services coverage like rail - Wi-Fi, college - Wi-Fi etc.
d. E - Governance: Reforming Government through Technology • Form simplification and field reduction – Simple
and user friendly and only minimum and necessary information should be collected.
• Online applications, tracking of their status and interface between departments.
• Use of online repositories
E.g.: School certificates, voter ID cards, etc. should be mandated so that citizens are not required to submit these documents in physical form. • Integration of services and platforms, E.g.: UIDAI, Payment Gateway, Mobile Platform, Electronic Data Interchange (EDI) etc. should be mandated to facilitate integrated and interoperable service delivery to citizens and businesses. • Workflow Automation Inside Government - The
workflow inside government departments and agencies should be automated.
• Public Grievance Redressal - IT should be used to automate, respond and analyse data to identify and resolve persistent problems.
e. E - Kranti - Electronic Delivery of Services • Vision of “Transforming e - Governance for
Transforming Governance”. • There are 44 Mission Mode Projects under e -
Kranti programme. • A mission mode project (MMP) is an individual
project within the National e - Governance Plan (NeGP) that focuses on one aspect of electronic governance, such as banking, land records or commercial taxes etc.
• The projects have clearly defined objectives, scopes, and implementation timelines and milestones, as well as measurable outcomes and service levels.
• These mission mode projects are grouped into Central, State and Integrated projects.
• Integrated MMP:- Where both state and central government will be working together like E - trade, E - commerce etc
The key principles of e - Kranti are as follows • Transformation and not Translation • Integrated Services and not Individual Services. • Government Process Reengineering (GPR) to be
mandatory in every MMP. • ICT Infrastructure on Demand. • Cloud by Default • Mobile First. • Fast Tracking Approvals. • Mandating Standards and Protocols.

ESE General Studies Video Lecture Theory Booklet
www.iesgeneralstudies.com www.adapala-academy.com 180
• Language Localization. • National GIS (Geo - Spatial Information System). • Security and Electronic Data Preservation The focus areas are Technology for Education - e - Education • All Schools will be connected with broadband. • Free wifi will be provided in all secondary and
higher secondary schools. • A programme on digital literacy at the national
level. • MOOCs - Massive Online Open Courses for e-
Education. Technology for Health - e - Healthcare • E-Healthcare would cover online medical
consultation, online medical records, online medicine supply, pan - India exchange for patient information.
Technology for Farmers • This would facilitate farmers to get real time price
information, online ordering of inputs and online cash, loan and relief payment with mobile banking.
Technology for Security • Mobile based emergency services and disaster
related services would be provided to citizens on real time basis so as to take precautionary measures well in time and minimize loss of lives and properties.
Technology for Financial Inclusion • Financial Inclusion shall be strengthened using
Mobile Banking, Micro - ATM program and CSCs/ Post Offices.
Technology for Justice • Interoperable Criminal Justice System shall be
strengthened by leveraging e - Courts, e - Police, e - Jails and e - Prosecution.
Technology for Planning • National GIS Mission Mode Project would be
implemented to facilitate GIS based decision making for project planning, conceptualization, design and development.
Technology for Cyber Security • National Cyber Security Coordination Centre would
be set up to ensure safe and secure cyberspace within the country.
f. Information for All • Open Data platform and online hosting of
information & documents • Government shall pro-actively engage through
social media and web based platforms to inform citizens.
• Online messaging to citizens on special occasions/programs would be facilitated through emails and SMSes.
• The above would largely utilise existing infrastructure and would need limited additional resources.
g. Electronics Manufacturing
Target NET ZERO Imports. • Taxation, incentives • Economies of scale, eliminate cost disadvantages • Focus areas - Big Ticket Items FABS, Fabless design,
Set top boxes, VSATs, Mobiles, Consumer & Medical Electronics, Smart Energy meters, Smart cards, micro - ATMs
• Incubators, clusters • Skill development • Government procurement h. IT for Jobs
• 1 Cr students from smaller towns & villages will be trained for IT sector jobs over 5 years.
• BPOs would be set up in every north - eastern state to facilitate ICT enabled growth in these states.
• Service delivery agents would be trained as part of skill development to run viable businesses delivering IT services.
• Rural workforce would be trained by the Telecom Service Providers (TSPs) to cater to their own needs.
i. Early Harvest Programs • These certain areas, identified which are important
for the development and need not any special infrastructure
• Email are made primary mode of communication. This require certain standardization
• Using of messaging platform for target messaging • Wi-Fi in universities : All the universities should
have Wi-Fi that are connected with “ National Knowledge Network”
• Public Wi-Fi hotspots: Wi-Fi in public utilities like railways, parks etc so that it helps to build up the digital cities
• E- books: All the school books should be available as e-book
• SMS based information services and elements: • National Portal for Lost and Found children - real
time information gathering and sharing on the lost and found children.
4. Electronic Financial Transactions The Unified Payments Interface (UPI) The Unified Payments Interface (UPI) is a new system developed by the NPCI and the RBI to aid instant transfer of money using a cashless system. • Through this platform, the person can transfer
money from his account to other person’s account directly, provided both are connected to the UPI.
• One just requires a smartphone and a banking app to send and receive money instantly or to pay a merchant for retail purchase.
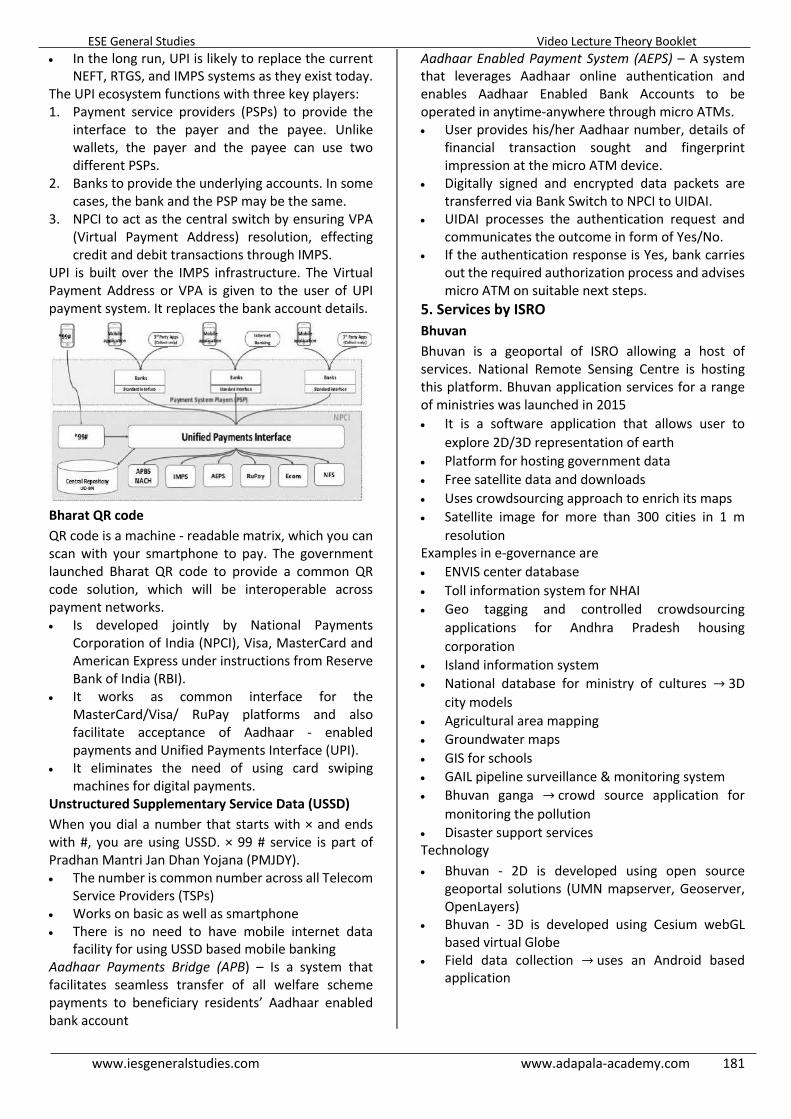
ESE General Studies Video Lecture Theory Booklet
www.iesgeneralstudies.com www.adapala-academy.com 181
• In the long run, UPI is likely to replace the current NEFT, RTGS, and IMPS systems as they exist today.
The UPI ecosystem functions with three key players: 1. Payment service providers (PSPs) to provide the
interface to the payer and the payee. Unlike wallets, the payer and the payee can use two different PSPs.
2. Banks to provide the underlying accounts. In some cases, the bank and the PSP may be the same.
3. NPCI to act as the central switch by ensuring VPA (Virtual Payment Address) resolution, effecting credit and debit transactions through IMPS.
UPI is built over the IMPS infrastructure. The Virtual Payment Address or VPA is given to the user of UPI payment system. It replaces the bank account details.
Bharat QR code QR code is a machine - readable matrix, which you can scan with your smartphone to pay. The government launched Bharat QR code to provide a common QR code solution, which will be interoperable across payment networks. • Is developed jointly by National Payments
Corporation of India (NPCI), Visa, MasterCard and American Express under instructions from Reserve Bank of India (RBI).
• It works as common interface for the MasterCard/Visa/ RuPay platforms and also facilitate acceptance of Aadhaar - enabled payments and Unified Payments Interface (UPI).
• It eliminates the need of using card swiping machines for digital payments.
Unstructured Supplementary Service Data (USSD) When you dial a number that starts with × and ends with #, you are using USSD. × 99 # service is part of Pradhan Mantri Jan Dhan Yojana (PMJDY). • The number is common number across all Telecom
Service Providers (TSPs) • Works on basic as well as smartphone • There is no need to have mobile internet data
facility for using USSD based mobile banking Aadhaar Payments Bridge (APB) – Is a system that facilitates seamless transfer of all welfare scheme payments to beneficiary residents’ Aadhaar enabled bank account
Aadhaar Enabled Payment System (AEPS) – A system that leverages Aadhaar online authentication and enables Aadhaar Enabled Bank Accounts to be operated in anytime-anywhere through micro ATMs. • User provides his/her Aadhaar number, details of
financial transaction sought and fingerprint impression at the micro ATM device.
• Digitally signed and encrypted data packets are transferred via Bank Switch to NPCI to UIDAI.
• UIDAI processes the authentication request and communicates the outcome in form of Yes/No.
• If the authentication response is Yes, bank carries out the required authorization process and advises micro ATM on suitable next steps.
5. Services by ISRO Bhuvan Bhuvan is a geoportal of ISRO allowing a host of services. National Remote Sensing Centre is hosting this platform. Bhuvan application services for a range of ministries was launched in 2015 • It is a software application that allows user to
explore 2D/3D representation of earth • Platform for hosting government data • Free satellite data and downloads • Uses crowdsourcing approach to enrich its maps • Satellite image for more than 300 cities in 1 m
resolution Examples in e-governance are • ENVIS center database • Toll information system for NHAI • Geo tagging and controlled crowdsourcing
applications for Andhra Pradesh housing corporation
• Island information system • National database for ministry of cultures →3D
city models • Agricultural area mapping • Groundwater maps • GIS for schools • GAIL pipeline surveillance & monitoring system • Bhuvan ganga →crowd source application for
monitoring the pollution • Disaster support services Technology • Bhuvan - 2D is developed using open source
geoportal solutions (UMN mapserver, Geoserver, OpenLayers)
• Bhuvan - 3D is developed using Cesium webGL based virtual Globe
• Field data collection →uses an Android based application

ESE General Studies Video Lecture Theory Booklet
www.iesgeneralstudies.com www.adapala-academy.com 182
6. Internet Governance • How the internet is managed • Internet is an open platform for innovation and
sharing of ideas Internet society’s Internet Governance Forum (IGF) • Annual event where stakeholders - Governments,
business leaders and common users participate National IT Policy
The National Policy on IT focuses on application of technology - enabled approaches to overcome monumental developmental challenges in education, health, skill development, financial inclusion, employment generation, governance etc. The twin goals are • Bringing the full power of ICT within the reach of
the whole of India • harnessing the capability and human resources of
the whole of India to enable India to emerge as the Global Hub and Destination for IT and ITES Services by 2020
Objectives include • To promote innovation and R&D in cutting edge
technologies • The development of applications and solutions in
areas like localization, location based services, mobile value added services, Cloud Computing, Social Media and Utility models.
• To create a pool of 10 million additional skilled manpower in ICT
• To enable access of content and ICT applications by differently - abled people to foster inclusive development.
• Ensuring a Secure and legally compliant Cyberspace ecosystem.
• To adopt Open standards and promote open source and open technologies
Information Technology Act, 2000 • The Information Technology Act, 2000 provides
legal recognition to the transaction done via an electronic exchange of data and other electronic means of communication or electronic commerce transactions.
• Use of alternatives to a paper-based method of communication and information storage to facilitate the electronic filing of documents with the Government agencies.
• Give legal recognition to digital signatures for the authentication of any information or matters requiring legal authentication
• Provision for the appointment of the Controller of Certifying Authorities (CCA) to license and regulate the working of Certifying Authorities. The Controller to act as a repository of all digital signatures.
• Chapter - IX of the said Act talks about penalties and adjudication for various offences.
• Provision for establishing a Cyber Regulatory Appellant Tribunal
• Act talks about various offences and the said offences shall be investigated only by a Police Officer not below the rank of the Deputy Superintendent of Police. These offences include tampering with computer source documents, publishing of information, which is obscene in electronic form, and hacking.
Associated terms Net Neutrality • Internet service providers, governments should
treat all data that flow across internet equally • Prevent “any form of discrimination or
interference” with data, including blocking, degrading, slowing down, or granting preferential speeds or treatment to any content.
Digital Divide • The difference between those who have ready
access to computers and the Internet, and those who do not.
• It is an economic and social inequality • It covers the aspects of - access to, use of, or impact
of information and communication technologies (ICT).
Network Readiness Index
By World Economic Forum • How economy is using ICT to boost
competitiveness & well being • How the country is reaping the benefits of 4th
industrial revolution ICT Development Index • By UN - ITU • 11 indicators which indicates the access, use and
skills of the people for using ICT based services. Access Use skills ICT readiness, access and Infrastructure % households with computers % households with internet access % telephone subscriptions % mobile subscriptions Internet bandwidth (bits) per user
IICT intensity -% individuals using internet -% broadband subscriptions
ICT Capability adult literacy rate - gross enrolment ratio at secondary level

ESE General Studies Video Lecture Theory Booklet
www.iesgeneralstudies.com www.adapala-academy.com 199
• On time • Within budget • With defined scope • To the required specification/Quality
Project Management Terminologies: Client /Project Sponsor: They provide business case to be solved and funds to execute the project Stakeholders: Are different persons involved in different teams who will be involved in decision making Project charter: It is the basic document that outlines the project objectives and guides how to execute the project Project manager: He/She will be responsible for execution delivery and all other parts of project .He/She is the single point of contact for project delivery Project schedule: It is the detailed timing of each activities related to project to finish on time Budget: Funds/resources requirement to reach the end goal Resources / Team: Lists all manpower, material etc available to execute the projects Quality: The output of project should meet the specification of quality requirements. It is checked by quality control plan. Risk: It is uncertainty in the execution of project Project Management process Project management processes fall into five groups: 1. Initiating 2. Planning 3. Executing 4. Monitoring and Controlling 5. Closing
Initiation
Initiation phase is very important because it
• Sets overall direction, • Define project objective, • Assign project manager • The concept is well defined and the requirement
collection, analysis and data gathering are performed
• Does feasibility study and alternatives are identified and approved
Planning The project planning phase is the next step after project initiation. In this phase, • Develop Project Charter - This document translates
the project sponsor’s business case into project objectives
• Detailed plan and final scope • Does planning about the resources, staffing,
infrastructure, stakeholder’s accountability and how the plans to be executed.
• Communication plan - Setting up, maintaining, and carrying out communications among stakeholders.
• Identify possible risks and actions to mitigate them • Gets project approvals Execution The third step is to execute the project with the help of plans, processes and the entire project management schedule. • Each milestone set during the project
management plan is executed. • KPIs - Development of key deliverables • Status - Monitor/control the pace • Quality, time and risk management Closure The final step is project closing in which the entire activities and plans have been executed the project is now handed over to the client. • Support and service to the product is provided to
do the operational tasks. • Handover final documents • Reporting • Training operations • Reviews • Contract closeout Project life cycle and Level of Effort Level of Effort • The level of effort is commonly expressed as man -
hours or expenses/cost. • This is different over the different stages of the
project. • The project lifecycle is often presented with its
associated level of effort. • The accumulated effort is the sum of the effort to
date. The activities involved in the each stages are

ESE General Studies Video Lecture Theory Booklet
www.iesgeneralstudies.com www.adapala-academy.com 200
Level of Influence Vs Cost of Changes
3. Project Organization There are different types of Project organization. They are 1. Functional organization 2. Projectized organization 3. Matrix organization Functional Organization
• This type of organization is grouped by different
areas of specialization within different functional
areas such as accounting, marketing, purchase, etc.
• Projects in these type of organizations are usually taken up in a single department and the team members may be loaned to these projects from time to time.
• Each department in a functional organization will do its project work independently of other departments
• The functional or departmental manager is in charge of the project
• The project budget is usually managed by the functional manager.
• The project manager has low influence or power or he could even be a part time employee.
Advantages:- • Well defined career path for the team members in
their areas of specialization • Deeper expertise in their function • Reporting to single manager • Similar resources are centralized as the company is
grouped by specialties • Better accountability of work Disadvantages are:- • The project manager has very little or no authority. • No single person responsible for entire project • Preference to department works. People place
more emphasis on their functional specialty to the detriment of their project
• Communication efficiency is not good Projectized Organization
• In a projectized organization, the entire company
is structured according to projects instead of functional departments
• Most of the company’s resources are allocated to project work
• The project manager is highly empowered and have control our budget allocation of resources
• Employees report to project manager • Once the projects are over, the team members are
assigned to another project • E.g.: Consulting companies Advantages:- • More efficient than functional organization • The project manager has complete authority • Ease of communication between team members
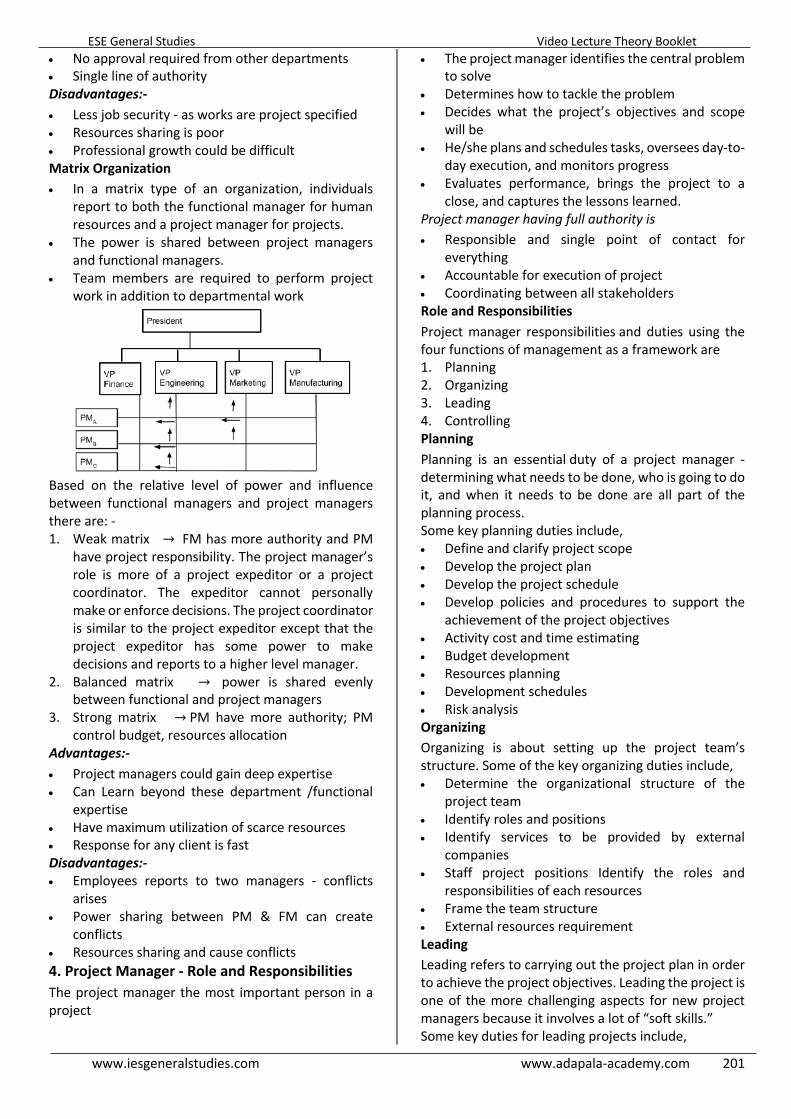
ESE General Studies Video Lecture Theory Booklet
www.iesgeneralstudies.com www.adapala-academy.com 201
• No approval required from other departments • Single line of authority Disadvantages:- • Less job security - as works are project specified • Resources sharing is poor • Professional growth could be difficult Matrix Organization • In a matrix type of an organization, individuals
report to both the functional manager for human resources and a project manager for projects.
• The power is shared between project managers and functional managers.
• Team members are required to perform project work in addition to departmental work
Based on the relative level of power and influence between functional managers and project managers there are: - 1. Weak matrix → FM has more authority and PM
have project responsibility. The project manager’s role is more of a project expeditor or a project coordinator. The expeditor cannot personally make or enforce decisions. The project coordinator is similar to the project expeditor except that the project expeditor has some power to make decisions and reports to a higher level manager.
2. Balanced matrix → power is shared evenly between functional and project managers
3. Strong matrix →PM have more authority; PM control budget, resources allocation
Advantages:- • Project managers could gain deep expertise • Can Learn beyond these department /functional
expertise • Have maximum utilization of scarce resources • Response for any client is fast Disadvantages:- • Employees reports to two managers - conflicts
arises • Power sharing between PM & FM can create
conflicts • Resources sharing and cause conflicts 4. Project Manager - Role and Responsibilities The project manager the most important person in a project
• The project manager identifies the central problem to solve
• Determines how to tackle the problem • Decides what the project’s objectives and scope
will be • He/she plans and schedules tasks, oversees day-to-
day execution, and monitors progress • Evaluates performance, brings the project to a
close, and captures the lessons learned. Project manager having full authority is • Responsible and single point of contact for
everything • Accountable for execution of project • Coordinating between all stakeholders Role and Responsibilities
Project manager responsibilities and duties using the four functions of management as a framework are 1. Planning 2. Organizing 3. Leading 4. Controlling Planning
Planning is an essential duty of a project manager - determining what needs to be done, who is going to do it, and when it needs to be done are all part of the planning process. Some key planning duties include, • Define and clarify project scope • Develop the project plan • Develop the project schedule • Develop policies and procedures to support the
achievement of the project objectives • Activity cost and time estimating • Budget development • Resources planning • Development schedules • Risk analysis Organizing Organizing is about setting up the project team’s structure. Some of the key organizing duties include, • Determine the organizational structure of the
project team • Identify roles and positions • Identify services to be provided by external
companies • Staff project positions Identify the roles and
responsibilities of each resources • Frame the team structure • External resources requirement Leading Leading refers to carrying out the project plan in order to achieve the project objectives. Leading the project is one of the more challenging aspects for new project managers because it involves a lot of “soft skills.” Some key duties for leading projects include,

ESE General Studies Video Lecture Theory Booklet
www.iesgeneralstudies.com www.adapala-academy.com 202
• Setting team direction • Coordinating activities across different
organizational functions • Motivating team members • Assigning work • Clear communication • Keep the team motivated • Conflicts between team members resolving skill • Soft skills Controlling Controlling is all about keeping the project on track. Project control can be performed using a three - step process. 1. Measuring: Checking project progress toward
meeting its objectives 2. Evaluating: Determining the cause of deviations
from the plan 3. Correcting: Taking corrective actions to address
deviations Some key controlling duties include, • Defining project baselines • Tracking project progress • Project status reporting • Determining and taking corrective actions • Communication to each party Qualities of a Project Manager 1. Organisational Ability - Discipline of good
documentation and records. 2. Strong communication skills - Clear
communication to project leadership teams, steering committees, stakeholders, clients and project team or boss on the outcomes and progress of the project.
3. Ability to facilitate discussions - A project manager should be able to organise collaboration between the project team and clients, and other technical resources to improve the project outputs.
4. Financial understanding - It is critical to have an understanding of the budget build up and financial status of the project.
5. Contractual skills 6. Multi-tasking - typically you will need to be able to
manage multiple project tasks or even multiple projects.
7. Good timing - Being timely as a project manager not only sets an example for your team, but will also assist in making your project come in on time.
8. Thinking on your feet - Sometimes despite all your preparation a good project manager will have to come up with solutions with a project on the spot.
9. Strong focus on safety - Keeping people safe is the number one priority for any project.
10. Inspiration - Building on strong communication and effective facilitation of meetings is the
requirement for a project manager to inspire teams to complete tasks.
ESE General Studies Video Lecture Theory Booklet
www.iesgeneralstudies.com www.adapala-academy.com 203
2. Project Initiation The project initiation phase is the first phase within the project management life cycle. Within the initiation phase, the business problem or opportunity is identified, a solution is defined, a project is formed, and a project team is appointed. The different steps are, 1. Project Identification 2. Pre - feasibility Study 3. Feasibility Study 4. Project Appraisal 5. DPR (Detailed Project Report) 6. Project Selection 7. Project Charter 1. Project Identification: This step create ideas or proposals that can be undertaken as a project. A business case can be developed as a project. The business case includes: • A detailed description of the problem or
opportunity with headings such as Introduction, Business Objectives, Problem/Opportunity Statement, Assumptions, and Constraints
• A list of the alternative solutions available • An analysis of the business benefits, costs, risks,
and issues • A description of the preferred solution • Main project requirements • A summarized plan for implementation that
includes a schedule and financial analysis Project identification aims: • Increase of profitability • Increase of market share • Reducing the operating costs • Expand the plant capacity • Introduction of new product Organisations can do SWOT Analysis to identify the projects SWOT Analysis S - Strength →Brand image, financial position of the organisation W - Weakness → Weak financial position, Lack of workforce etc O - Operation → Introduce new product, new market entry opportunity, new technology T - Threats →Technology, Price competition The success of the project depends on the clarity and accuracy of the business case and whether people believe they can achieve it. The best way to make an objective clear to all the teams involved is to state it in such a way that it can be verified. It is important to provide quantifiable definitions to qualitative terms.
2. Project Pre - Feasibility and Feasibility Study Pre - feasibility study For this we have two Questions 1. Should we do the project? 2. Can we do the project? Following aspects are done to answer the above two questions • Study of existing industries • Price difference check • Government policies • Finance condition Feasibility or formulation study Major aspects as part of feasibility study are:- 1. Market feasibility 2. Technical feasibility 3. Financial feasibility 4. Economic feasibility 5. Environment feasibility Market Feasibility Both the supply and demand analysis is required to meet planning and decision making for the projects undertaken. This is conducted to know about the market in relation with the project. It involves the following activities:
I. Situation analysis and specification of objectives
II. Collection of Information III. Conducting Market Survey IV. Demand Forecasting
Demand forecasting It refers to estimation of future demand for a product or service. Forecasting methods may be broadly divided into three categories i.e. Qualitative and Quantitative methods There are “Quantitative /Qualitative Techniques” for the demand forecasting. Qualitative information required for forecast are:- 1. Expertise 2. Technical knowledge 3. Experience 4. Intuition Qualitative Techniques examples are 1. Delphi Methods 2. Executive opinion 3. Sales force opinion 4. Consumer /market survey Quantitative Techniques examples are 1. Simple Moving Average method 2. Weighted Moving Average method 3. Exponential smoothing 4. Trend projection 5. Linear regression
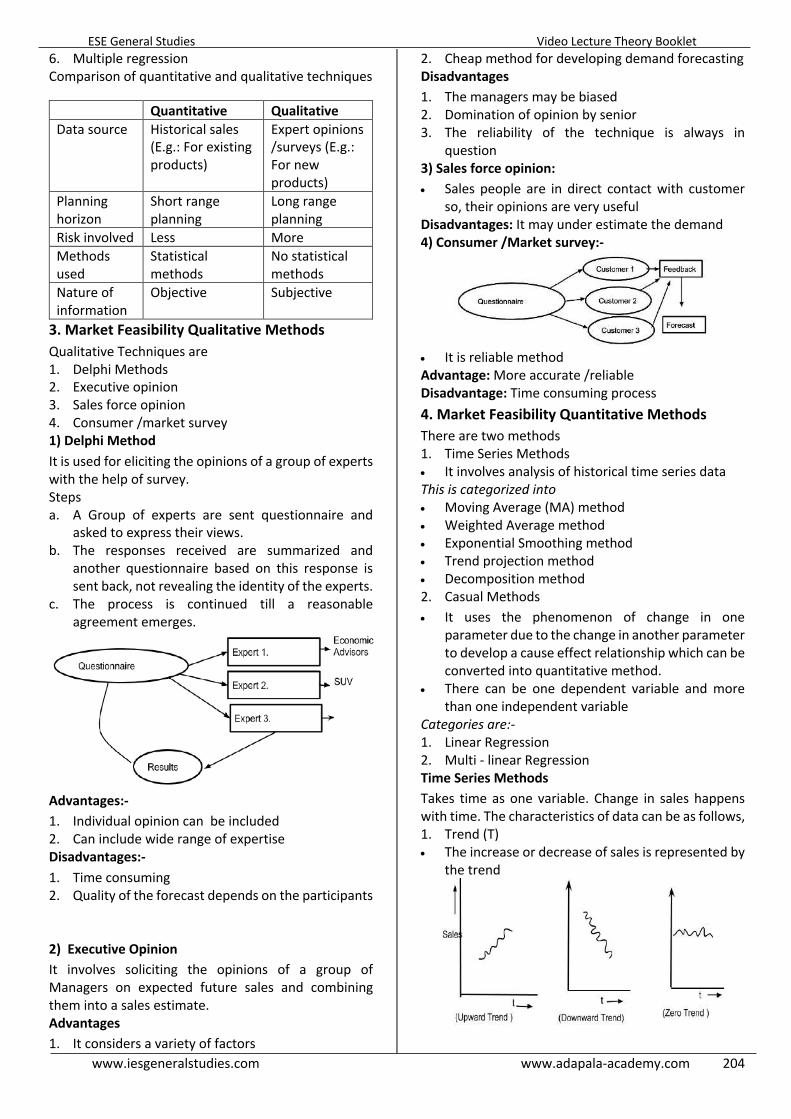
ESE General Studies Video Lecture Theory Booklet
www.iesgeneralstudies.com www.adapala-academy.com 204
6. Multiple regression Comparison of quantitative and qualitative techniques
Quantitative Qualitative Data source Historical sales
(E.g.: For existing products)
Expert opinions /surveys (E.g.: For new products)
Planning horizon
Short range planning
Long range planning
Risk involved Less More Methods used
Statistical methods
No statistical methods
Nature of information
Objective Subjective
3. Market Feasibility Qualitative Methods Qualitative Techniques are 1. Delphi Methods 2. Executive opinion 3. Sales force opinion 4. Consumer /market survey 1) Delphi Method
It is used for eliciting the opinions of a group of experts with the help of survey. Steps a. A Group of experts are sent questionnaire and
asked to express their views. b. The responses received are summarized and
another questionnaire based on this response is sent back, not revealing the identity of the experts.
c. The process is continued till a reasonable agreement emerges.
Advantages:- 1. Individual opinion can be included 2. Can include wide range of expertise Disadvantages:-
1. Time consuming 2. Quality of the forecast depends on the participants 2) Executive Opinion It involves soliciting the opinions of a group of Managers on expected future sales and combining them into a sales estimate. Advantages 1. It considers a variety of factors
2. Cheap method for developing demand forecasting Disadvantages 1. The managers may be biased 2. Domination of opinion by senior 3. The reliability of the technique is always in
question 3) Sales force opinion: • Sales people are in direct contact with customer
so, their opinions are very useful Disadvantages: It may under estimate the demand 4) Consumer /Market survey:-
• It is reliable method Advantage: More accurate /reliable Disadvantage: Time consuming process 4. Market Feasibility Quantitative Methods There are two methods 1. Time Series Methods • It involves analysis of historical time series data This is categorized into • Moving Average (MA) method • Weighted Average method • Exponential Smoothing method • Trend projection method • Decomposition method 2. Casual Methods • It uses the phenomenon of change in one
parameter due to the change in another parameter to develop a cause effect relationship which can be converted into quantitative method.
• There can be one dependent variable and more than one independent variable
Categories are:- 1. Linear Regression 2. Multi - linear Regression Time Series Methods Takes time as one variable. Change in sales happens with time. The characteristics of data can be as follows, 1. Trend (T) • The increase or decrease of sales is represented by
the trend
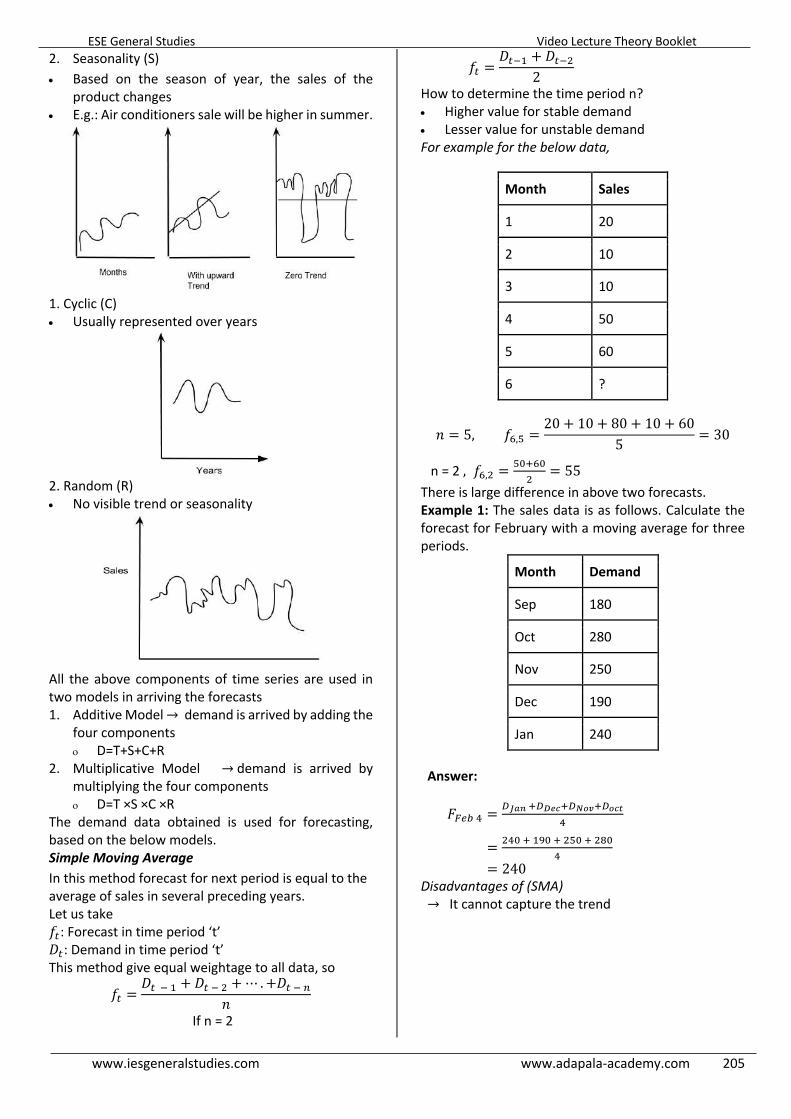
ESE General Studies Video Lecture Theory Booklet
www.iesgeneralstudies.com www.adapala-academy.com 205
2. Seasonality (S) • Based on the season of year, the sales of the
product changes • E.g.: Air conditioners sale will be higher in summer.
1. Cyclic (C) • Usually represented over years
2. Random (R) • No visible trend or seasonality
All the above components of time series are used in two models in arriving the forecasts 1. Additive Model → demand is arrived by adding the
four components o D=T+S+C+R
2. Multiplicative Model →demand is arrived by multiplying the four components o D=T ×S ×C ×R
The demand data obtained is used for forecasting, based on the below models. Simple Moving Average In this method forecast for next period is equal to the average of sales in several preceding years. Let us take ?5: Forecast in time period ‘t’ (5: Demand in time period ‘t’ This method give equal weightage to all data, so
?5 =(5{j + (5{k + ⋯ .+(5{3
A
If n = 2
?5 =(5{j + (5{k
2
How to determine the time period n? • Higher value for stable demand • Lesser value for unstable demand For example for the below data,
Month Sales
1 20
2 10
3 10
4 50
5 60
6 ?
A = 5, ?9,è =20 + 10 + 80 + 10 + 60
5 = 30
n = 2 , ?9,k =èêy9ê
k= 55
There is large difference in above two forecasts. Example 1: The sales data is as follows. Calculate the forecast for February with a moving average for three periods.
Month Demand
Sep 180
Oct 280
Nov 250
Dec 190
Jan 240
Answer:
ëí4ìî =ïñóòyïôöõyïúùûyïùõü
î
= kîêyjwêykèêyk†êî
= 240 Disadvantages of (SMA) → It cannot capture the trend

ESE General Studies Video Lecture Theory Booklet
www.iesgeneralstudies.com www.adapala-academy.com 206
Example 1: For the below data,
Week Sales
1 1
2 2
3 3
4 4
5 5
6 ?
Answer:
Mathematically
d9,è =5 + 4 + 3 + 2 + 1
5 = 3
d9,î =5 + 4 + 3 + 2
4 = 14/4 = 3.5
d9,o =5 + 4 + 3
3 = 4
d9,k = èyîk
= 4.5; d9,j =èj= 5
Here, we observe that, it is not crossing the maximum value of data which is 5, but trend shows that it will be about ‘6’. Thus it is not about capturing trend Weighted Moving Average Method In WMA, we give more weightage to recent data ?5
=dj × (5{j +fk × (5{k +fo × (5{o + d3 × (5{3
dj + dk + do − − −−−−+d3
For example, form the below data, find the forecast for January.
Month Demand
Sep 180
Oct 280
Nov 190
Dec 240
Jan ?
fj = 3;fk = 2;fo = 1
ë¢-3 =£§×ï•öõy¶ß×ïòùûy£®×ïùõü
¶§y¶ßy£®
= o×kîêyk×jwêyj×k†êoykyj
= skêyo†êyk†ê9
= 230
Simple exponential smoothing • In this method forecasts are modified in the light of
observed errors using relationship ë5yj = ë5 + ((5 − ë5) × ©
Where © is the smoothing constant • This method is suitable for data which having no
trends, or seasonal data components in their characteristics
Difference from other methods: This method considers the error in the forecast previously calculated
ë5{j = ë5 + ((5 − ë5) × ©
The value of alpha lies between 0 and 1(0 ≤ © ≤ 1)
&E:−¨?© = 1 ⇒ ë5yj = ë5 + ((5 − ë5) = (5
© = 0; ë5yj = ?5
© = 0.5 ⇒ ë5yj = 0.5ë5 + 0.5(5
Example 2:(¢-3 = 500, ë¢-3 = 400, (í4ì = 60, © =
0.75. Find forecast for March.
Answer: ëÆ-É1Ø = ë04ì + ((04ì − ë04ì)©
ë04ì = ë¢-3 + ∞(¢-3 − ë¢-3±©
= 400 + (500 − 400) = 475
Thus, ëÆ-É1Ø = 475 + (600 − 475) × 0.75
= 568.75
Other way of expressing SES expression:- ë5yj = ë5 + ((5 − ë5)©
= ë5 + (5 × © − ë5 × ©
ë5yj = ©(5 + (1 − ©)ë5 ------------ (1)
ë5 = ©(5{j + (1 − ©)ë5{j ------------ (2)
ë5{j = ©(5{k + (1 − ©)ë5{k ------------ (3)
Now, substituting (3) in (2) & (2) in (1) ë5yj = ©(5 + ©(1 − ©)(5{j + (1 − ©)kë5{j
ë5yj = ©(B + ©(1 − ©)(5{j+. . . . ©(1 − ©)3yjë5{3
It means the weightage decreases exponentially for previous data as 0 ≤ © ≤ 1 Note:- • Recent demand will be given more weightage • Considers all demand with varying weightages • Smoothing constant is data dependent
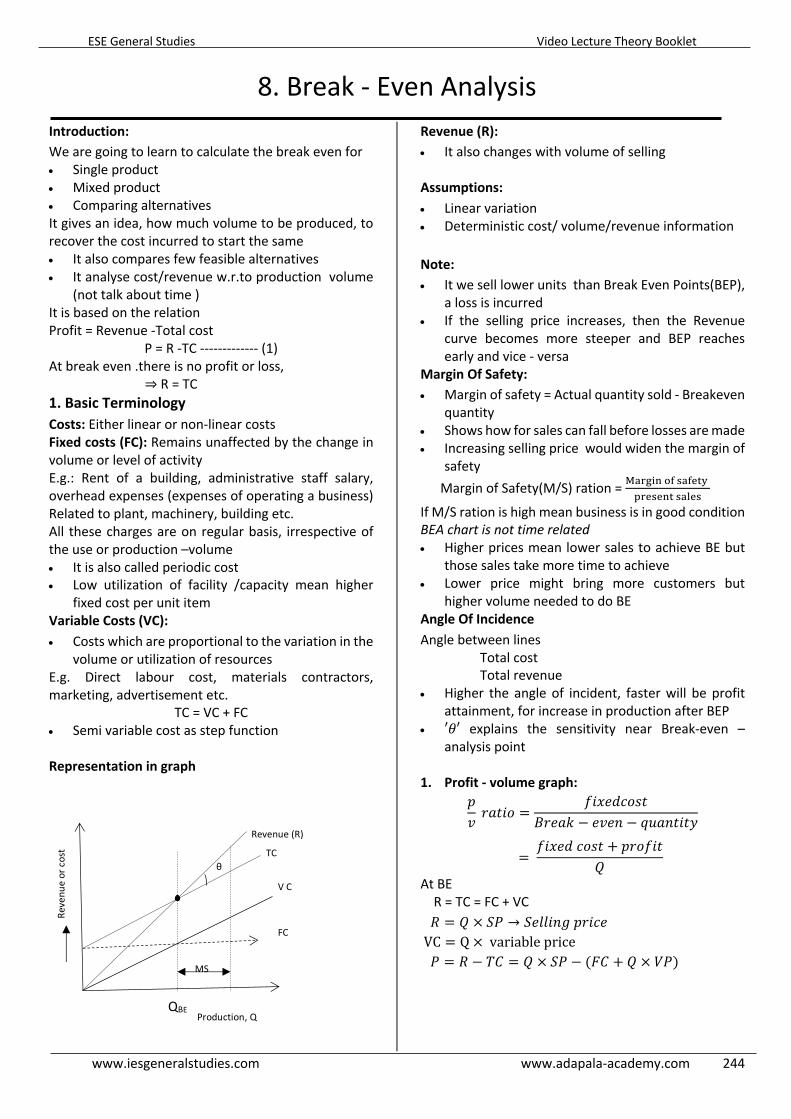
ESE General Studies Video Lecture Theory Booklet
www.iesgeneralstudies.com www.adapala-academy.com 244
8. Break - Even Analysis Introduction: We are going to learn to calculate the break even for • Single product • Mixed product • Comparing alternatives It gives an idea, how much volume to be produced, to recover the cost incurred to start the same • It also compares few feasible alternatives • It analyse cost/revenue w.r.to production volume
(not talk about time ) It is based on the relation Profit = Revenue -Total cost
P = R -TC ------------- (1) At break even .there is no profit or loss,
⇒ R = TC 1. Basic Terminology Costs: Either linear or non-linear costs Fixed costs (FC): Remains unaffected by the change in volume or level of activity E.g.: Rent of a building, administrative staff salary, overhead expenses (expenses of operating a business) Related to plant, machinery, building etc. All these charges are on regular basis, irrespective of the use or production –volume • It is also called periodic cost • Low utilization of facility /capacity mean higher
fixed cost per unit item Variable Costs (VC):
• Costs which are proportional to the variation in the volume or utilization of resources
E.g. Direct labour cost, materials contractors, marketing, advertisement etc.
TC = VC + FC • Semi variable cost as step function Representation in graph
Revenue (R): • It also changes with volume of selling Assumptions:
• Linear variation • Deterministic cost/ volume/revenue information Note: • It we sell lower units than Break Even Points(BEP),
a loss is incurred • If the selling price increases, then the Revenue
curve becomes more steeper and BEP reaches early and vice - versa
Margin Of Safety: • Margin of safety = Actual quantity sold - Breakeven
quantity • Shows how for sales can fall before losses are made • Increasing selling price would widen the margin of
safety Margin of Safety(M/S) ration = ÈÍÎÏÌÓÔÒÍÚÛÙ
ıÎÚÒÚÓÛÒ͈ÚÒ
If M/S ration is high mean business is in good condition BEA chart is not time related • Higher prices mean lower sales to achieve BE but
those sales take more time to achieve • Lower price might bring more customers but
higher volume needed to do BE Angle Of Incidence
Angle between lines Total cost Total revenue • Higher the angle of incident, faster will be profit
attainment, for increase in production after BEP • ′¯′ explains the sensitivity near Break-even –
analysis point 1. Profit - volume graph:
*Q F<BC> =
?C|&J@>=BÕF&<R − &Q&A − IH<ABCBc
= ?C|&J@>=B + *F>?CB
Ä
At BE R = TC = FC + VC % = Ä × h: → h&DDCAE*FC@& VC = Q × variableprice : = % − aP = Ä × h: − (ëP + Ä × ):)
QBE
V C
TC
Reve
nue
or c
ost
FC
MS
Production, Q
θ
Revenue (R)
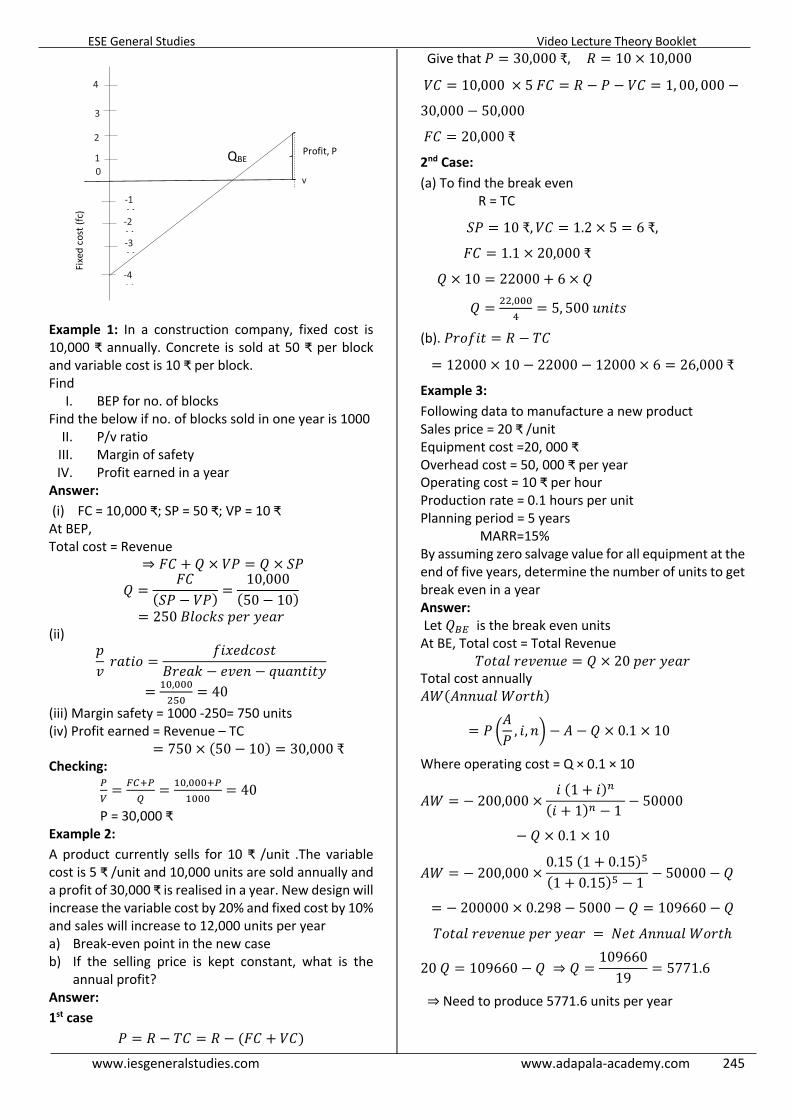
ESE General Studies Video Lecture Theory Booklet
www.iesgeneralstudies.com www.adapala-academy.com 245
Example 1: In a construction company, fixed cost is 10,000 ₹ annually. Concrete is sold at 50 ₹ per block and variable cost is 10 ₹ per block. Find
I. BEP for no. of blocks Find the below if no. of blocks sold in one year is 1000
II. P/v ratio III. Margin of safety IV. Profit earned in a year
Answer: (i) FC = 10,000 ₹; SP = 50 ₹; VP = 10 ₹ At BEP, Total cost = Revenue
⇒ ëP + Ä × ): = Ä × h:
Ä =ëP
(h: − ):) =10,000
(50 − 10)
= 250ÕD>@R=*&Fc&<F (ii)
*Q F<BC> =
?C|&J@>=BÕF&<R − &Q&A − IH<ABCBc
= jê,êêêkèê
= 40 (iii) Margin safety = 1000 -250= 750 units (iv) Profit earned = Revenue – TC = 750 × (50 − 10) = 30,000₹ Checking:
q‚= í yq
˛= jê,êêêyq
jêêê= 40
P = 30,000 ₹ Example 2: A product currently sells for 10 ₹ /unit .The variable cost is 5 ₹ /unit and 10,000 units are sold annually and a profit of 30,000 ₹ is realised in a year. New design will increase the variable cost by 20% and fixed cost by 10% and sales will increase to 12,000 units per year a) Break-even point in the new case b) If the selling price is kept constant, what is the
annual profit? Answer: 1st case
: = % − aP = % − (ëP + )P)
Give that : = 30,000₹,% = 10 × 10,000
)P = 10,000 × 5ëP = % − : − )P = 1, 00, 000 −
30,000 − 50,000
ëP = 20,000₹
2nd Case:
(a) To find the break even R = TC
h: = 10₹, )P = 1.2 × 5 = 6₹,
ëP = 1.1 × 20,000₹
Ä × 10 = 22000 + 6 × Ä
Ä = kk,êêêî
= 5, 500HACB=
(b). :F>?CB = % − aP
= 12000 × 10 − 22000 − 12000 × 6 = 26,000₹
Example 3:
Following data to manufacture a new product Sales price = 20 ₹ /unit Equipment cost =20, 000 ₹ Overhead cost = 50, 000 ₹ per year Operating cost = 10 ₹ per hour Production rate = 0.1 hours per unit Planning period = 5 years MARR=15% By assuming zero salvage value for all equipment at the end of five years, determine the number of units to get break even in a year Answer: Let Ä…p is the break even units At BE, Total cost = Total Revenue
a>B<DF&Q&AH& = Ä × 20*&Fc&<F Total cost annually Sf(SAAH<Df>FBℎ)
= : äS: , C, Aã − S − Ä × 0.1 × 10
Where operating cost = Q × 0.1 × 10
Sf = −200,000 ×C(1 + C)3
(C + 1)3 − 1 − 50000
− Ä × 0.1 × 10
Sf = −200,000 ×0.15(1 + 0.15)è(1 + 0.15)è − 1 − 50000 − Ä
= −200000 × 0.298 − 5000 − Ä = 109660 − Ä
a>B<DF&Q&AH&*&Fc&<F = ^&BSAAH<Df>FBℎ
20Ä = 109660 − Ä ⇒ Ä =10966019 = 5771.6
⇒Need to produce 5771.6 units per year
Fixe
d co
st (f
c)
Profit, P QBE
v
0
1
2
3
4
-1 44-2 44-3 44
-4 44
50% Discount on IES GS 2020
Why to choose e-classes? Access:
‣ Youcanwatchthevideosonlineandthereisnorestric2ononnumberofplayswithinyourvalidperiod.
‣ YoucanwatchthevideosAny2me,AnywhereandAnynumberof2mesforoneyear
Doubts:
‣ Weclarifyalldoubtswithin24hoursthroughoutyourjourneywithus,unlikeinofflineclassroomcoaching,wheredoubtsclarifica2onisnotpossible
Economical:
‣ Costofthecourseisonlyaround25%ofcoursesofferedofflinewithhigherquality
‣ Noneedtotraveltolongdistancesandwas2ng2metoadjustinnewplaces
VideoCourseFeatures
‣ Eachvideolecturefollowedbyaquiz
‣ Theorybookletsasperthevideocourse
‣ Freetestseries
‣ Doubtsclarifica2onwithin24hours
‣ RegularGuidance
Adapala Academy www.adapala-academy.com
Rs. 400
Prac8ceBooklet
MechanicalCourses
TestSeries