uplift capacity of belled and multi-belled piles in …
TRANSCRIPT

483
i) Associate Chief Researcher, Research and Development Institute, Takenaka Corporation, Chiba, Japan (honda.tsuyoshi@takenaka.co.jp).ii) Senior Chief Researcher, ditto.iii) Deputy General Manager, Soil Remediation Engineering Department, Takenaka Corporation.
The manuscript for this paper was received for review on April 30, 2010; approved on April 12, 2011.Written discussions on this paper should be submitted before January 1, 2012 to the Japanese Geotechnical Society, 4-38-2, Sengoku,Bunkyo-ku, Tokyo 112-0011, Japan. Upon request the closing date may be extended one month.
483
SOILS AND FOUNDATIONS Vol. 51, No. 3, 483–496, June 2011Japanese Geotechnical Society
UPLIFT CAPACITY OF BELLED AND MULTI-BELLED PILES IN DENSE SAND
TSUYOSHI HONDAi), YOSHIO HIRAIii) and EIJI SATOiii)
ABSTRACT
This paper evaluates the uplift capacity of belled and multi-belled piles in dense sand. A two-dimensional distinctelement (DE) analysis was applied in pullout tests on single piles to investigate the uplift resistance of the piles, the soilbehavior around the piles, and the interaction between the soil and the pile surface. It was observed from the DE analy-sis that the soil mass adjacent to the projections of the belled and multi-belled piles moved vertically, and that the soilmovements leaned slightly with the occurrence of relative displacement between the soil and the pile surface. A theoret-ical solution for predicting the uplift capacity of belled and multi-belled piles was derived from an upper bound limitanalysis based on the soil movements in the DE analysis. The solution was able to reproduce the ultimate upliftresistance in the DE analysis using the friction angles in the aggregates and on the pile surface that were evaluated froma simulation of direct and simple shear tests. In addition, a continuity equation that satisˆed the relationship betweenthe displacement vector of the soil mass adjacent to the projections and the change in volume around the soil mass wasproposed for predicting the uplift capacity of actual piles under axisymmetric conditions. The theoretical solution ob-tained with the continuity equation was in good agreement with the pullout resistance of the belled and multi-belledpiles in centrifuge model tests and full-scale tests conducted in situ.
Key words: (belled pile), dense sand, distinct element method, (multi-belled pile), pulling test, (uplift capacity), (IGC:E4/E13)
INTRODUCTION
During an earthquake, the uplift force acts on the pilesunder high-rise buildings. Belled and multi-belled pileshave been used to increase the uplift and the bearingcapacity of foundations. They are cast-in-place concretepiles with one or a plural number of enlarged projectionsthat are built in the bearing stratum and the middle hardlayer ( see Fig. 1). Figure 2 shows photographs of the spe-cial buckets used to build the projections, namely, themiddle and the bottom projections, of a multi-belled pileconstructed to execute control tests. However, a designmethod for the uplift resistance of belled and multi-belledpiles has not yet been established, because it is unclearhow the uplift resistance of soil is induced. Therefore,several axial tensile load tests have been conducted inmany studies to ascertain the design method. From theseload tests, several methods to practically predict the up-lift capacity of belled piles have been proposed by Tsutsuiet al. (1995) and Chatani et al. (2008). Most of them sug-gest a design to estimate the lowest value of skin frictionin the belled piles that was measured in the axial tensileload tests. However, the methods frequently underesti-mate the uplift capacity of belled piles. In addition, littleis known about whether or not the methods can be ap-
plied to the uplift capacity of multi-belled piles. In con-trast, the uplift resistance of anchor plates has been theo-retically studied by many researchers (Balla 1961;Meyerhof and Adams, 1968, among others). Rowe andDavis (1982) investigated the eŠects of anchor embed-ment, the friction angle, dilatancy, initial stress state K0,and anchor roughness for anchor plates using an elasto-plastic ˆnite element analysis, and proposed the factorsaccounting for these eŠects. Murray and Geddes (1987)showed that the theoretical solutions obtained from an e-quilibrium analysis, a lower bound limit analysis, and anupper bound limit analysis could produce good agree-ments with the experimental results of pullout tests on an-chor plates in dense sand. Kumar (2003) proposed a theo-retical solution for the uplift capacity of anchor plates intwo-layered sand by an upper bound limit analysis.Meriˆeld and Sloan (2006) conducted a numerical limitanalysis on the pullout capacity of horizontal and verticalanchor plates, and compared them with numerous theo-retical solutions. Dickin and Leung (1990) attempted toapply the theoretical solution for anchor plates to the up-lift capacity of belled piers in a centrifuge model. Theyshowed that the uplift capacity of belled piers was lowerthan that of anchor plates. Dickin and Leung (1992) con-ducted many pullout tests on belled piers using centrifuge

484
Fig. 1. Schematic diagrams of a belled pile and a multi-belled pile
Fig. 2. Photographs of the special bucket to construct the parts ofmiddle and bottom projections
Fig. 3. Shapes of the circular and the cluster disks used in the DEanalysis
Fig. 4. The grain size distribution curve of the aggregates comprisingthe circular or the cluster disks
484 HONDA ET AL.
models, and proposed an empirical design methodwherein appropriate factors that account for the founda-tion geometry of belled piers are applied to an anchor for-mula. Thus, the theoretical solution for anchor platescannot be directly applied to the uplift capacity of belledand multi-belled piles, because anchor plates are horizon-tal and are used in shallow foundations, whereas belledand multi-belled piles under high-rise buildings have slop-ing surfaces and are used in deep foundations. This studyevaluates the uplift capacity of belled and multi-belledpiles embedded in dense sand as a deep foundation.Belled and multi-belled piles in loose sand are not exam-ined because belled piles are rarely constructed in loosesand.
The distinct element method (Cundall, 1971) is apowerful tool for simulating large and discontinuous soildeformations. A two-dimensional distinct element (DE)analysis can directly reproduce the interaction betweenthe soil and the pile surface, which is often di‹cult to dowith ˆnite element methods. In this study, a DE analysis
of pullout tests on single piles was conducted to inves-tigate the uplift resistance of piles, the soil behavioraround the piles, and the interaction between the soil andthe pile surface.
In the DE analysis, two types of disks were used, name-ly, circular disks and cluster disks, formed from two cir-cular particles. Before starting the simulation of the pull-out tests, the mechanical properties of the aggregatescomprising the circular or the cluster disks were evaluatedfrom simulations of direct and simple shear tests to iden-tify the friction and the dilatancy angles in the aggregatesand on the pile surface. Four kinds of piles were tested inthe pullout tests on single piles, a straight pile, a belledpile, and two multi-belled piles. In addition, a theoreticalsolution to predict the uplift capacity was obtained froman upper bound limit analysis based on soil movements inthe DE analysis. The theoretical solution was comparedwith the results of the DE analysis, centrifuge modeltests, and full-scale tests conducted in situ.
MECHANICAL PROPERTIES OF AGGREGATES
Two types of disks were used in the DE analysis to in-vestigate the in‰uence of the mechanical properties of soilon the uplift capacity of single piles. Figure 3 illustratesthe shapes of the circular and the cluster disks used in theDE analysis. The cluster disks were formed from two cir-cular particles with diameter ``b'' and size ``a'' in thelong axis. The ratio in length of the short axis to the longaxis was 0.7 for all disks. The circular and the clusterdisks have the same grain size distribution curve, which isplotted in Fig. 4. Table 1 shows the numericalparameters used in the DE analysis.
Before starting the simulation of the pullout tests on

485
Table 1. Numerical parameters used in the DE analysis
Average of diameter 2 mmDensity of particles 1.8E+03 kg/m3
Normal stiŠness (kn) 1.5E+08 N/mShear stiŠness (ks) 3.8E+07 N/mNormal damping (hn) 3.8E+01 Ns/mShear damping (hs) 9.6E+00 Ns/mCohesion (c?) 0.0 NFriction angle (q?) 40.09
Fig. 5. Schematic diagrams of the models in direct and simple sheartests to evaluate mechanical properties of the aggregates
Fig. 6. Results in the simulation of direct shear tests using the circulardisks
Fig. 7 Results in the simulation of simple shear tests using the circulardisks
485UPLIFT CAPACITY OF PILES
the single piles, direct and simple shear tests under con-stant pressures were reproduced to evaluate the mechani-cal properties of the aggregates comprising the circular orthe cluster disks, as shown in Fig. 3. The direct shear testsdirectly give the friction and the dilatancy angles of theaggregates on failure lines. The mechanical properties ob-tained from the simple shear tests are useful for evaluat-ing the interaction between the soil and the pile surfacefor the upper bound limit analysis described in a subse-quent chapter. Schematic diagrams of the models in thedirect and simple shear tests are presented in Fig. 5. Themodels were 100 mm in both width and height. The topand bottom boundaries of the models had a friction angleof 409. The side walls in the direct shear tests had no fric-tion. Repeated boundaries were used for the right and leftboundaries of the simple shear tests. In the packing of thedisks, the friction angle for the disk-to-disk was tem-porally decreased from 409to 109to achieve a dense con-dition. The disks were randomly arranged and com-pressed at vertical pressures of 100, 200, 300, and 400kPa. The models were sheared after the friction angle wasreset to 409.
Figures 6 and 7 show the mobilized friction angles,qmob=tan-1 (t/sn), and the vertical displacements againstthe shear displacements in the direct and simple sheartests using the circular disks. The diŠerence in verticalpressure hardly aŠected the mobilized friction angle orthe vertical displacement. In the direct shear tests, strainsoftening was remarkably observed after the mobilizedfriction angle reached about 289at the peak strength, andthen it decreased to about 229. The vertical displacementdue to dilatancy gradually increased until the strengthdropped to the residual strength. Once the strengthreached the residual strength, the vertical displacement
did not change, because the soil attained the critical state.From the initial gradient of the vertical displacementsagainst the shear displacement, a dilatancy angle of about279was obtained. In the simple shear tests, the mobilizedfriction angles and the vertical displacements wereremarkably smaller than those in the direct shear tests,and the shear displacement at the peak strength was larg-er than that in the direct shear tests. The friction angles atthe peak strength in the simple shear tests were about 199,

486
Fig. 8. Results in the simulation of direct shear tests using the clusterdisks
Fig. 9. Results in the simulation of simple shear tests using the clusterdisks
Fig. 10. Deformations in the direct and simple shear tests using thecircular disks
Fig. 11. Deformations in the direct and simple shear tests using thecluster disks
Table 2. Mechanical properties of the aggregates comprising the circu-lar or the cluster disks
Unit weight of the aggregates 15.5 kN/m3
(a) Circular disksSoil in shear zone
Friction angle 289Dilatancy angle 279
Interaction between soil and the pile surfaceFriction angle 199Dilatancy angle 8.49
(b) Cluster disksSoil in shear zone
Friction angle 379Dilatancy angle 339
Interaction between soil and the pile surfaceFriction angle 279Dilatancy angle 129
486 HONDA ET AL.
and a dilatancy angle of about 8.49was obtained. Thismust be because the disks easily slipped along the top andbottom boundaries in the simple shear tests.
Figures 8 and 9 show the results of the direct and sim-ple shear tests using the cluster disks. The curves of themobilized friction angles and the vertical displacementsagainst the shear displacements in both tests were verysimilar to those using the circular disks. However, theirvalues were larger than those in the cases using the circu-
lar disks. In the direct shear tests, the friction and thedilatancy angles at the peak strength were 379and 339,respectively. In the simple shear tests, the friction and thedilatancy angles were 279and about 129, respectively.
The ˆnal deformations in the direct and simple sheartests under the vertical stress of 400 kPa are illustrated inFigs. 10 and 11. The shear deformation in the direct sheartests was concentrated in the gap between the top andbottom boxes. The shear deformation in the simple sheartests was predominant around the top and bottomboundaries, since the disks easily slipped. Accordingly,this is why the friction and the dilatancy angles in the sim-ple shear tests were smaller than those in the direct sheartests. In the simulation of the pullout tests on single piles,the pile surface was also reproduced by the same bound-

487
Fig. 12. Schematic diagrams of the piles used in the DE analysis (thesizes of piles are expressed in prototype scale)
Fig. 13. Numerical model of the multi-belled pile in Case 4
487UPLIFT CAPACITY OF PILES
aries as the top and bottom boundaries in the simpleshear tests. Therefore, it might be assumed that the diskson the pile surface also slip easily, and that the mechani-cal properties of the disks on the pile surface are similarto those in the simple shear tests.
To sum up the results of the direct and simple shearsimulation, the mechanical properties of the aggregateswith the circular or the cluster disks were almost the samein quality, although they were quantitatively diŠerent.The friction and the dilatancy angles on the boundaries,such as the pile surface, are assumed to be signiˆcantlylower than those in the soil. Table 2 summarizes themechanical properties obtained from the simulation ofthe direct and simple shear tests.
PULLOUT TESTS ON SINGLE PILES
Two series of pullout tests on single piles were conduct-ed in the DE analysis. One case used the circular disks,while the other used the cluster disks, as shown in Fig. 3.Four kinds of single piles were tested in both series.Figure 12 presents the schematic diagrams of the singlepiles in prototype scale. Case 1 was a straight pile with adiameter of 1.4 m; Case 2 was a belled pile with diametersof 1.4 m in the shaft and 2.5 m at the base; Cases 3 and 4were multi-belled piles with diameters of 1.4 m in theshaft and 2.5 m in the projections-they were diŠerent interms of the distance between the upper and lower projec-tions. The total length of the piles was 23.5 m. The incli-nations at the upper and lower surfaces in the projectionswere 129and 459, respectively. The pile surface had thesame friction angle of 409as the top and bottom bounda-ries used in the simulation of the simple shear tests. As anexample, the numerical model that has half a cross sec-tion in Case 4 is shown in Fig. 13. The piles were repro-duced as a rigid body with a self-weight of about 425kN/m in unit depth. The DE analysis of the pullout testson the single piles was conducted in a 50-times gravityˆeld (50 G) using miniature models with a scale of 1/50.The reasons for this are to use the same circular andcluster disks as those used in the simulation of the directand simple shear tests and to reduce the number of disksfor minimizing the calculation time. The similarity rule inthe DE analysis is the same as that in centrifuge modeltests. The simulation was conducted in the followingmanner:
(i) All the disks with a disk-to-disk friction angle of109were randomly arranged in the analyzed area.
(ii) An acceleration of 50 G was applied to all thedisks, and then the model ground was compressedby the self-weight of the disks to yield a dense con-dition.
(iii) After the friction angle in all the disks was reset to409, the disks that overlapped with the area of asingle pile were removed; then the single pile withself-weight was inserted.
(iv) The pile was pulled out at a constant rate of 5mm/sec up to the uplift displacement of 500 mmin the prototype scale.
The uplift resistance of the piles was calculated by in-tegrating the increment of downward forces induced bythe contact forces between the disks and the pile surface.Figures 14 and 15 show the uplift resistances against theuplift displacements of the piles in the series using the cir-cular or the cluster disks. In these ˆgures, a sudden reduc-tion in uplift resistance repeatedly occurred. The reasonfor this is that the skeleton of the disks' structure col-lapsed locally and the uplift resistance suddenlydecreased. This is a particular phenomenon in two-dimensional DE analyses. The straight pile in both seriesshowed yielding at the lowest value of uplift resistance.The uplift resistance of the straight pile did not increasejust after yielding, but maintained the resistance of about1200 kN/m. In contrast, the belled and multi-belled pilesshowed a gradual increase in uplift resistance after theyielding occurred at the uplift resistance of about 1200kN/m. The stiŠness of the belled and multi-belled piles inthe initial gradient of the uplift resistance was slightlylarger than that in the straight piles. It can be said from

488
Fig. 14. Uplift resistance of the single piles against uplift displace-ments in the simulation using the circular disks
Fig. 15. Uplift resistance of the single piles against uplift displace-ments in the simulation using the cluster disks
Fig. 16. Final ground deformations in the simulation using the clusterdisks
Fig. 17. Loci of soil movements until the uplift displacement of 250 mm in the simulation using the circular disks
488 HONDA ET AL.
this that the uplift resistance is ˆrstly induced by the skinfriction, and that the eŠects of the projections in thebelled and multi-belled piles then develop after a certain
uplift displacement. The multi-belled piles showed thehighest stiŠness and uplift resistance. The multi-belledpiles of Case 4, with the longer distance between twoprojections, had the highest uplift resistance of all thecases. Comparing the series using the circular and thecluster disks, the uplift resistance of the straight piles wasalmost the same for both series. The uplift resistance ofthe belled pile in the cluster disks was larger than that inthe circular disks. Thus, it was found that the eŠects ofthe projections in belled and multi-belled piles largely de-pend on the mechanical properties of the soil.
Figures 16(a), (b), (c), and (d) show the ˆnal grounddeformation at the vertical displacement of 500 mm inthe series using the cluster disks. It is found from theseˆgures that the ground deformation was very small in all

489
Fig. 18. Loci of soil movements until the uplift displacement of 250 mm in the simulation using the cluster disks
Fig. 19. Distributions of horizontal stress at the uplift displacement of250 mm in the simulation using the cluster disks
Fig. 20. Distributions of vertical stress at the uplift displacement of250 mm in the simulation using the cluster disks
489UPLIFT CAPACITY OF PILES
cases, and that no remarkable failure line was observed.In the cases of belled and multi-belled piles, the grounddeformation was slightly induced in the limited area adja-cent to the projections. The ground deformation in theseries using the circular disks was also small and similarto that in the series using the cluster disks. The 10-timesdisplacement vectors of the soil movements at the upliftdisplacement of 250 mm are illustrated in Figs. 17 and18. The circles in Figs. 17 and 18 indicate the initial posi-tions of some disks, while the curves show the displace-ment vectors of the soil movements. It was found that thesoil movements in the straight pile were very small andwere limited in the closed area around the pile. The soilmovements in the cases of the belled and multi-belledpiles were larger than that in the case of the straight pile,and the areas where large movements were induced werewider. In addition, the soil movements in the series usingthe cluster disks with the large friction angle became larg-er than that in the other series. With respect to the behav-ior of the soil movements in the cases of the belled andmulti-belled piles, it was observed that the soil move-ments around the projections were larger than thosearound the shaft in all the cases. The soil adjacent to theprojections ˆrstly moved in an upward direction, andthen gradually inclined in a horizontal direction with theincrease in uplift displacement. It was also observed thatthe soil mass with the shape of a reverse triangle moved asa body in the area adjacent to the projections, and thatthe soil movements in that area were not fully transmittedto the upper layer.
Figures 19 and 20 show the distributions of verticaland horizontal stress at the vertical displacement of 250mm in the series using the cluster disks. The concentra-tion of vertical and horizontal stress, due to the load-
bearing eŠect, was seen in the limited area adjacent to theprojections. In addition, compressive and shear deforma-tion, due to the load-bearing eŠect, was intensively in-duced in the area where vertical and horizontal stress was

490
Fig. 21. A mechanism of plastic collapse of the soil adjacent to theprojections in belled and multi-belled piles
490 HONDA ET AL.
concentrated. No remarkable failure line was detected inthe distribution of the maximum shear strain.
UPLIFT CAPACITY OF BELLED ANDMULTI-BELLED PILES UNDERTWO-DIMENSIONAL CONDITIONS
In this chapter, the ultimate uplift resistance of belledand multi-belled piles under two-dimensional conditionsis evaluated by the upper bound limit analysis based onthe soil movements in the DE analysis. The uplift capaci-ty in actual piles under axisymmetric conditions will bediscussed in the next chapter. Figure 21 shows themechanism of the plastic collapse around the projectionsof the belled and multi-belled piles. The plastic collapsecan reproduce the phenomenon whereby soil adjacent tothe projections moves vertically as a body and then leansslightly, and that the soil movements are not fully trans-mitted to the upper layer in Figs. 17 and 18. In Fig. 21, Pis the ultimate uplift resistance, pa and pb are the overbur-den pressures on lines AD and DC, D1 and D2 are the di-ameters of the shaft and the projection, H and u are theheight and the inclination of the upper slope in theprojection, a is the direction of the soil movements inblocks ABD and BCD, c and q are the cohesion and thefriction angle of the soil, c is the dilatancy angle of thesoil that is assumed to equal friction angle q, d is the fric-tion angle on the slope in the projection, which dependson the roughness of the pile surface and loosening duringthe excavation, dv0, dwa, and dwb are the displacementvectors of the pile, block ABD, and block BCD, and dwa0
is the relative displacement vector on line AB.The displacement vectors in Fig. 21(b) must satisfy the
following equations:
dv0=dwa sin a+dwa cos a/tan (u+d) (1a)dwb=dwa (1b)dwba=0 (1c)dwa0=dwa cos a/sin (u+d) (1d)
where dwba is the relative displacement on line BD, whichwas observed in the tests on an anchor plate after failure
line BC developed (Kanatani et al., 1973). However, itwas derived from a comparison of several failuremechanisms that the uplift capacity became the lowestvalue at the relative displacement of dwba=0.
The external loads in Fig. 21(a) represent the gravityacting on blocks ABD and BCD and the overburden pres-sure on lines AD and DC. They are calculated by Eqs. (2)and (3).
Wa=12
gH2 tan u, Wb=12
gH2/tan (a-q) (2)
PA=paH tan u, PB=pbH/tan (a-q) (3)
where g is the unit weight of the soil, Wa and Wb are theweight in blocks ABD and BCD, and Pa and Pb are theoverburden forces that are calculated by integrating theoverburden pressure on lines AD and DC. The incrementof work done by the external loads is expressed as Eq.(4).
DW=P・dv0-(Pa+Wa)・dwa sin a-(Pb+Wb)・dwb sin a(4)
The work done by the internal stress is calculated onlines AB and BC. Now, the dilatancy angle is assumed toequal the friction angle. The increment in work done bythe internal stress is due to cohesion, and it is expressed asfollows:
DE=c・H/cos u・dwa0 cos d+c・H/sin (a-q)・dwb cos q(5)
From the theory of the upper bound method, the incre-ment in work done by the external load and the internalstress are equal.
DW=DE (6)
The ultimate uplift resistance is calculated by substitutingEqs. (1a)–(1d) into Eq. (6). It is expressed as Eq. (7a),namely,
P=1
sin a+cos a/tan (u+d)s(Pa+Wa)・sin a
+(Pb+Wb)・sin a+c・H/cos u・cos a/sin (u+d)・cos d+c・H/sin (a-q)・cos qt (7a)
The uplift capacity is obtained by searching for the an-gle of a to minimize the uplift resistance. Using the fric-tion angle of 289in the aggregates for the circular disks,the friction angle of 8.49between the disks and the pilesurface and the unit weight of 15.5 kN/m3 in Table 2, theuplift capacity of a belled pile is about 1508 kN/m ( seeFig. 14), which includes the piles' self-weight of about425 kN/m. For the cluster disks, the uplift capacity of1931 kN/m was obtained from the friction angle of 379inthe aggregates, the friction angle of 129on the pile sur-face, and the unit weight of 15.5 kN/m3. The angles of a,applied to minimize the uplift resistance in the models us-ing the circular and the cluster disks, are 80.49and 84.19,respectively.
The uplift capacity of the belled piles is actually com-posed of the skin friction on the shaft and the bearing

491
Fig. 22. Three mechanisms of plastic collapse in the multi-belled pilesconstructed in two-layer grounds
Fig. 23. Relationship between the uplift resistance and the roughnesson the pile surface
Fig. 24. Relationship between the direction of soil movements and theroughness on the pile surface
491UPLIFT CAPACITY OF PILES
force on the slope at the bell. It is di‹cult to exactly esti-mate the skin friction. The skin friction causes a reduc-tion in the overburden forces on lines AD and DC in Fig.21. Therefore, evaluating the share of uplift resistance inthe shaft and the bell is a complicated problem. However,the total uplift resistance of belled piles can be calculatedsimply from Eq. (7a) and the overburden forces that areobtained by computing the self-weight of the soil directly,since the skin friction on the shaft is in balance with thereduction in uplift resistance due to the decrease in over-burden forces. Similarly, Dickin and Leung (1992) meas-ured the uplift resistance in the shaft and the bellseparately, and showed that the total uplift resistancecorrelated with the theoretical solutions for the anchorplates.
The uplift capacity of the multi-belled piles is obtainedas the sum of the uplift resistance in each projection. As-suming that soil does not possess any cohesion and thatthe friction angle on the pile surface is adequately rough,for example, it is equivalent to that of soil, the directionof the soil movements, a in Fig. 21, is always 909. Conse-quently, Eq. (7a) is also expressed in the following:
P=Pa+Wa+Pb+Wb (7b)
The uplift capacity of each projection is determined byonly the weight of the soil mass, which is similar to thatof a horizontal anchor plate proposed by Kumar (2003).Equation (7b) also suggests that the soil masses used toinduce the uplift resistance are clearly separated in the up-per and lower projections, as seen in Fig. 22, because thesoil mass above the upper projection is in balance withthe uplift force in the upper projection and does not aŠectthe ultimate uplift resistance in the lower projection.Figure 22 shows three failure mechanisms of the multi-belled piles in a two-layer ground. The hatched areas inFig. 22 indicate the soil mass resisting the uplift force.The shape of the soil mass in the hatched areas dependson the geometry of the piles and the friction angles in thesoil and on the pile surface. When multi-belled piles withthe same dimensions in the upper and lower projectionsare constructed in a homogeneous layer, as seen in Fig.22(a), the uplift capacity almost equals that of a belledpile without the upper projection. In other words, multi-belled piles do not always increase the ultimate upliftresistance in comparison to belled piles. However, multi-belled piles can make the stiŠness in uplift resistance larg-er than belled piles, for the uplift capacity in each projec-tion is reduced by the share in the upper and lower projec-tions, and the uplift displacement to reach the ultimateuplift resistance is also decreased, as seen in Figs. 14 and15. Now, when the model ground in the DE analysis is re-garded as a homogeneous one, the uplift capacities of thebelled and the multi-belled piles are equal, as shown inFigs. 14 and 15. It can be seen that the proposed methodby Eq. (7a) is in good agreement with the results of theDE analysis. However, the belled pile of Case 2 and themulti-belled piles with the longer distance between twoprojections in Case 4 exceeded the upper limit value ofEq. (7a) in the large uplift displacement. The reason is
that the soil movements in Figs. 17 and 18 were inducedin the outer area of block ABC in Fig. 21 with the largeuplift displacement.
Equation (7a) implies that the uplift capacity of belledand multi-belled piles is considerably in‰uenced by thefriction angle on the pile surface. Figures 23 and 24 showthe in‰uence of the friction angle on the pile surface inthe uplift capacity and the direction of soil movements.With a decrease in the friction angle on the pile surface,the uplift capacity is decreased and the direction of thesoil movements is inclined.
UPLIFT CAPACITY OF BELLED ANDMULTI-BELLED PILES UNDER AXISYMMETRICCONDITIONS
The theoretical solution for the uplift capacity in actualpiles under axisymmetric conditions is derived by in-

492
Fig. 25. Comparison between the theoretical solution and pullout tests of a belled pile in centrifuge model tests conducted by Hirai et al. (2009)
492 HONDA ET AL.
tegrating Eq. (7a) around the center axis of the piles inthe following manner:
P=1
sin a+cos a/tan (u+d)s(Pa+Wa)・sin a
+(Pb+Wb)・sin a+c・SAB・cos a/sin (u+d)・cos d+c・SBC・cos qt (8)
The weight of soil masses Wa and Wb are calculated byEqs. (9) and (10).
Wa=p4
g {(D22-D2
1)H-D1H 2 tan u-H 3 tan2 u
3 } (9)
Wb=p4
g {D2H 2
tan (a-q)+
H 3
3 tan2 (a-q)} (10)
Overburden forces Pa and Pb are obtained by Eqs. (11)and (12).
Pa=pa・p4
(D22-D2
1) (11)
Pb=pb・p4
[sD2+H/tan (a-q)t2-D22] (12)
SAB and SBC are the surface areas formed by rotating linesAB and BC around the center axis of the piles in Fig. 21.They are expressed as follows:
SAB=p(D1H+H 2 tan u) (13)SBC=psD2H+H 2/tan (a-q)t (14)
Note that the direction of soil movements, a, tominimize Eq. (8) does not always satisfy the continuitycondition: The vertical displacement on surface AC (Fig.21) is determined by the change in volume due to dilatan-cy on failure surfaces SAB and SBC. Therefore, a new con-tinuity equation was added to the theoretical solution forresolving the direction of the soil movements as Eq. (15),namely,
Dn=SAC・dwa・sin a-SAB・dwa0・sin d-SBC・dwb・sin q=0(15)
where SAC is the surface area formed by rotating line ACaround the center axis of the pile. It was calculated fromthe following equation:
SAC=p4
[sD2+H/tan (a-q)t2-D21] (16)
Equation (15) is also expressed as Eq. (17) by using Eqs.(1a)–(1d).
Dn=SAC sin a-SAB cos a/sin (u+d)・sin d-SBC sin q=0(17)
CASE STUDIES ON MODEL TESTS ANDFULL-SCALE TESTS IN SITU
Case studies on the uplift capacity of belled and multi-belled piles were conducted using centrifuge model testsand in situ axial tensile load tests. This chapter discussesthe validity of the theoretical solution with the continuityequation that consists of Eqs. (8) and (17).
Case 1: Centrifuge model tests on a belled pileHirai et al. (2009) conducted centrifuge model tests on
pullout tests of a belled pile. The model pile was made ofaluminum and had a length of 290 mm and diameters of12.5 mm and 17.5 mm for the shaft and the base. The up-per slope of the bell had an inclination of 129. The sur-face of the pile was smooth rather than rough, and itsboundaries were similar to those used in the DE analysis.Toyoura sand with a relative density of 90z and a dryunit weight of 15.8 kN/m3 was used for the modelground. Pullout tests were conducted in the centrifugeˆeld of 80 G. The pile in prototype scale was 23.2 m in
493
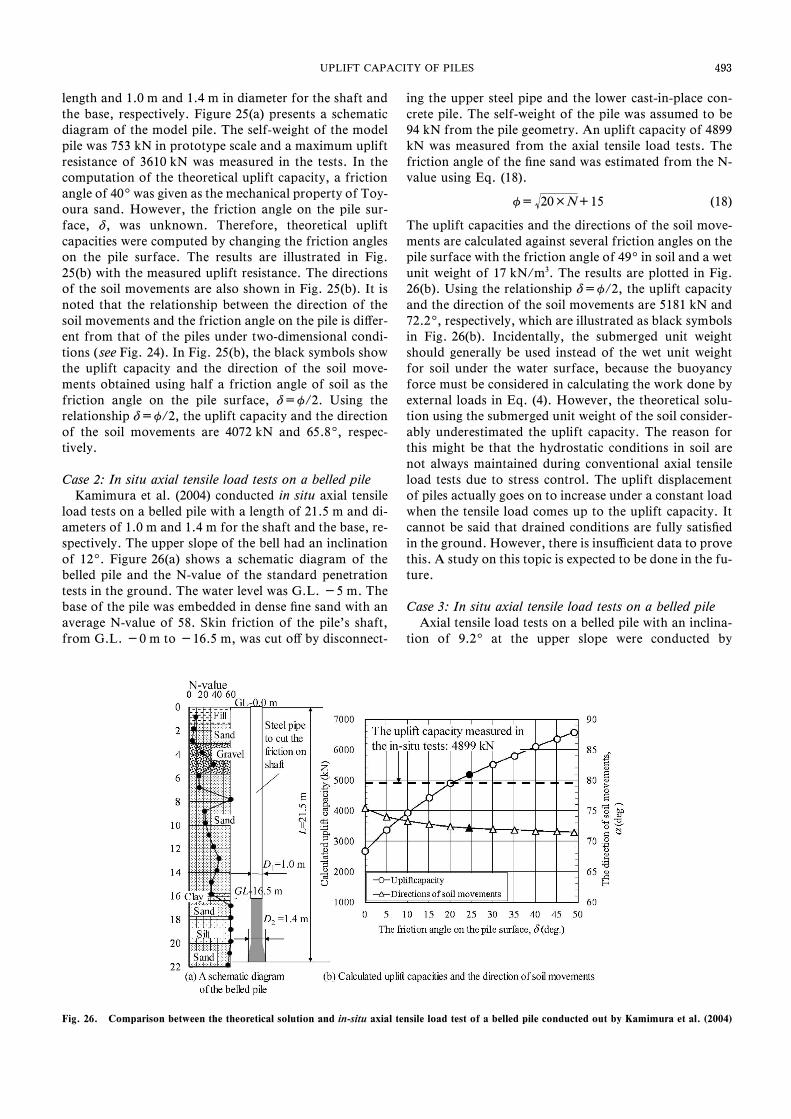
Fig. 26. Comparison between the theoretical solution and in-situ axial tensile load test of a belled pile conducted out by Kamimura et al. (2004)
493UPLIFT CAPACITY OF PILES
length and 1.0 m and 1.4 m in diameter for the shaft andthe base, respectively. Figure 25(a) presents a schematicdiagram of the model pile. The self-weight of the modelpile was 753 kN in prototype scale and a maximum upliftresistance of 3610 kN was measured in the tests. In thecomputation of the theoretical uplift capacity, a frictionangle of 409was given as the mechanical property of Toy-oura sand. However, the friction angle on the pile sur-face, d, was unknown. Therefore, theoretical upliftcapacities were computed by changing the friction angleson the pile surface. The results are illustrated in Fig.25(b) with the measured uplift resistance. The directionsof the soil movements are also shown in Fig. 25(b). It isnoted that the relationship between the direction of thesoil movements and the friction angle on the pile is diŠer-ent from that of the piles under two-dimensional condi-tions ( see Fig. 24). In Fig. 25(b), the black symbols showthe uplift capacity and the direction of the soil move-ments obtained using half a friction angle of soil as thefriction angle on the pile surface, d=q/2. Using therelationship d=q/2, the uplift capacity and the directionof the soil movements are 4072 kN and 65.89, respec-tively.
Case 2: In situ axial tensile load tests on a belled pileKamimura et al. (2004) conducted in situ axial tensile
load tests on a belled pile with a length of 21.5 m and di-ameters of 1.0 m and 1.4 m for the shaft and the base, re-spectively. The upper slope of the bell had an inclinationof 129. Figure 26(a) shows a schematic diagram of thebelled pile and the N-value of the standard penetrationtests in the ground. The water level was G.L. -5 m. Thebase of the pile was embedded in dense ˆne sand with anaverage N-value of 58. Skin friction of the pile's shaft,from G.L. -0 m to -16.5 m, was cut oŠ by disconnect-
ing the upper steel pipe and the lower cast-in-place con-crete pile. The self-weight of the pile was assumed to be94 kN from the pile geometry. An uplift capacity of 4899kN was measured from the axial tensile load tests. Thefriction angle of the ˆne sand was estimated from the N-value using Eq. (18).
q= 20×N+15 (18)
The uplift capacities and the directions of the soil move-ments are calculated against several friction angles on thepile surface with the friction angle of 499in soil and a wetunit weight of 17 kN/m3. The results are plotted in Fig.26(b). Using the relationship d=q/2, the uplift capacityand the direction of the soil movements are 5181 kN and72.29, respectively, which are illustrated as black symbolsin Fig. 26(b). Incidentally, the submerged unit weightshould generally be used instead of the wet unit weightfor soil under the water surface, because the buoyancyforce must be considered in calculating the work done byexternal loads in Eq. (4). However, the theoretical solu-tion using the submerged unit weight of the soil consider-ably underestimated the uplift capacity. The reason forthis might be that the hydrostatic conditions in soil arenot always maintained during conventional axial tensileload tests due to stress control. The uplift displacementof piles actually goes on to increase under a constant loadwhen the tensile load comes up to the uplift capacity. Itcannot be said that drained conditions are fully satisˆedin the ground. However, there is insu‹cient data to provethis. A study on this topic is expected to be done in the fu-ture.
Case 3: In situ axial tensile load tests on a belled pileAxial tensile load tests on a belled pile with an inclina-
tion of 9.29at the upper slope were conducted by

494
Fig. 27. Comparison between the theoretical solution and in-situ axial tensile load test of a belled pile conducted by Takagaki et al. (1995)
Fig. 28. Comparison between the theoretical solution and in-situ axial tensile load test of a multi-belled pile conducted by Hirai et al. (2008)
494 HONDA ET AL.
Takagaki et al. (1995). The pile had a length of 18.8 mand diameters of 1.0 m and 1.5 m in the shaft and at thebase. Figure 27(a) shows the schematic diagram of thebelled pile and the N-value in the ground. There was noinformation about the water level. The base of the pilewas embedded in dense ˆne sand with an average N-valueof 31. The self-weight of the pile was estimated to be 354kN from the pile geometry. An uplift capacity of 8300 kNwas measured from the axial tensile load tests. A wet unitweight of 17.5 kN/m3 and a friction angle of 409in the
ˆne sand were used to calculate the uplift capacities andthe directions of the soil movements. Figure 27(b) showsthe calculated uplift capacities and the directions of thesoil movements against several friction angles on the pilesurface. The uplift capacity and the direction of the soilmovements using the relationship d=q/2 were 7387 kNand 62.59, respectively, which are illustrated as blacksymbols in Fig. 27(b).

495
Fig. 29. Summarized results in the comparison between the theoreticalsolution and the test results conducted in a centrifuge model andsitu
495UPLIFT CAPACITY OF PILES
Case 4: In situ axial tensile load tests on a multi-belledpile
Hirai et al. (2008) conducted axial tensile load tests ona multi-belled pile with an inclination of 129at the upperslope in the two projections. The pile had a length of 23.2m and diameters of 1.0 m in the shaft and 1.7 m in theprojections. Figure 28(a) shows the schematic diagram ofthe multi-belled pile and the N-value in the ground. Thewater level was about G.L. -4 m. The upper and lowerprojections were constructed in ˆne sand with average N-values of 30 and 55, respectively. Skin friction of thepile's shaft, from G.L. -0 m to -15.8 m, was cut oŠ bydisconnecting the upper steel pipe and the lower cast-in-place concrete pile. The self-weight of the pile was esti-mated to be about 150 kN from the pile geometry. A totaluplift capacity of 12,500 kN was measured from the axialtensile load tests. The shared uplift resistance in the upperand lower projections was 7700 kN and 4800 kN, respec-tively. The theoretical uplift capacity of the multi-belledpile is calculated using the concept shown in Fig. 22(b). Awet unit weight of 17.5 kN/m3 in the soil was used. Thefriction angles of the soil around the upper and lowerprojections were estimated to be 409and 489, respec-tively, from Eq. (18). The area of the soil mass to resistuplift force in the lower projection was wider than that inthe upper projection, because the ground where the lowerprojection was embedded had a higher N-value than thataround the upper projection. The total uplift capacity ofthe multi-belled pile could be calculated by ignoring theupper projection. The calculated uplift capacities anddirections of the soil movements are illustrated in Fig.28(b). The uplift capacity and the direction of the soilmovements using the relationship d=q/2 are 12,643 kNand 70.19, respectively, which are plotted as black sym-bols in Fig. 28(b). The theoretical uplift capacity in theupper projection was obtained as 7753 kN by using fric-tion angles of 409in the soil and 209on the pile surface.As a result, the uplift resistance of 4890 kN was shared at
the lower projection.Finally, the theoretical uplift capacities are compared
with those in the centrifuge model tests and the full-scaletests conducted in situ in Fig. 29, where the friction an-gles in the soil and on the pile surface were calculatedfrom Eq. (18) and the relationship d=q/2. It is obviousfrom Fig. 29 that the theoretical solution with the con-tinuity equation can reproduce the uplift capacity of boththe belled and the multi-belled piles.
CONCLUSIONS
Two-dimensional distinct element (DE) analyses ondirect shear tests, simple shear tests, and pullout tests onsingle piles were conducted to investigate the uplift capac-ity of belled and multi-belled piles in dense sand. In addi-tion, a theoretical solution to predict the uplift capacityof belled and multi-belled piles was derived from an up-per bound limit analysis based on the soil movements inthe DE analysis. The continuity equation was proposedfor application to actual piles under axisymmetric condi-tions. The theoretical solution with the continuity equa-tion was compared with the results of centrifuge modeltests and full-scale tests conducted in situ. The conclu-sions obtained from this study are summarized as fol-lows:1. It was found from the DE analysis on direct and sim-
ple shear tests that the friction and the dilatancy an-gles on the pile surface were signiˆcantly smaller thanthose in soil.
2. The DE analysis of the pullout tests on single pilesdemonstrated that the uplift resistance and the stiŠ-ness in the early stage of uplift displacement were larg-er in the order of straight piles, belled piles, and multi-belled piles in the series using the cluster disks.However, there was no remarkable diŠerence in theuplift capacities of the belled and multi-belled piles.
3. Ground deformation induced by the uplift displace-ment of the piles was limited to the area adjacent tothe projections of the piles. The soil movementsaround the projections were slightly inclined from thevertical direction to the horizontal direction.
4. A failure mechanism for the soil adjacent to theprojection was proposed, and a theoretical solutionwas derived for estimating the uplift capacity of belledpiles using the soil conditions and the shape of thepiles. A method for predicting the uplift capacity ofmulti-belled piles and the shared resistances at theprojections were also shown.
5. The fact that the uplift capacities calculated from thetheoretical solution corresponded well with the resultsin the DE analysis suggests that the mechanical prop-erties of the aggregates were properly evaluated by thesimulation of direct and simple shear tests.
6. A continuity equation was adopted for predicting theuplift capacity of actual piles. The theoretical solutionobtained with the continuity equation was comparedwith the results from centrifuge model tests and full-scale tests conducted in situ, and it was in good agree-

496496 HONDA ET AL.
ment with them.7. It was quantitatively revealed from the theoretical so-
lution that the uplift capacity of belled and multi-belled piles was intensively in‰uenced by the frictionangle on the slope of the projections. The uplift capac-ities in the in situ axial tensile load tests are appropri-ately estimated using half the frictional angle of soil asthe friction angle on the pile surface.The authors showed the validity of the theoretical solu-
tion by comparing it with the uplift capacity of belled andmulti-belled piles in several axial tensile load tests.However, the authors caution that the use of the solutionfor a design must be done with care, because the frictionangle on the pile surface is intensively in‰uenced by theconstruction process, namely, the type of buckets, thedrilling slurry, and the looseness in the ground during theexcavation, which all sensitively aŠect the uplift capacityof belled and multi-belled piles. Therefore, it is recom-mended that the friction angle on the pile surface be care-fully evaluated from axial tensile load tests of the pilesthat are constructed by exact execution controls.
ACKNOWLEDGMENTS
The authors are grateful to Mr. Tamai, Mr. Wakai,and Dr. Koumura (Research and Development Institute,Takenaka Corporation) for their valuable suggestions re-garding the mechanism of uplift resistance and soil be-havior around belled and multi-belled piles.
REFERENCES
1) Balla, A. (1961): The resistance of breaking-out of mushroomfoundations for pylons, Proceedings of the 5th International Con-ference on Soil Mechanics and Foundation Engineering, 1,569–576.
2) Chatani, F., Suzuki, N., Nishimura K. and Wada Y. (2008): Staticaxial reciprocal and tensile load tests of single cast-in-place concretenodular piles, –Part 5–, Annual Meeting of Architectural Instituteof Japan, 575–576 (in Japanese).
3) Cundall, P. A. (1971): A computer model for simulating progres-sive large scale movements in blocky rock system, Proc. of Sympo-sium, ISRM, Nancy, France, 2, 129–136.
4) Dickin, E. A. and Leung, C. F. (1990): Performance of piles withenlarged bases subject to uplift forces, Canadian GeotechnicalJournal, 27, 546–556.
5) Dickin, E. A. and Leung, C. F. (1992): The in‰uence of foundationgeometry on the uplift behavior of piles with enlarged bases, Cana-dian Geotechnical Journal, 29, 498–505.
6) Hirai, Y., Wakai, S. and Aoki, M. (2008): In-situ pull-out test formulti-belled cast-in-place concrete pile: –Part 3– In the Case ofDiluvial Sand Ground, Annual Meeting of Architectural Instituteof Japan, 577–578 (in Japanese).
7) Hirai, Y., Wakai, S. and Aoki, M. (2009): Centrifuge model testson uplift resistance of belled pile in sand, Journal of Structural andConstruction Engineering, Transactions of Architectural Instituteof Japan, 74(643), 1613–1619 (in Japanese).
8) Kamimura, K., Hirai, Y., Aoki, M. and Maruoka, M. (2004): In-situ pull-out test for cast-in-place belled pile: –Part 3– Short PileEmbedded in Diluvial Laminated Ground, Annual Meeting of Ar-chitectural Institute of Japan, 553–554 (in Japanese).
9) Kanatani, Y., Sato, H. and Akino, Y. (1973): Experimental studyon pullout tests of model foundations, Proceedings of the 8th An-nual Meeting of Japanese Geotechnical Society, 439–442 (inJapanese).
10) Kumar, J. (2003): Uplift resistance of strip and circular anchors in atwo layered sand, Soils and Foundations, 43(1), 101–107.
11) Meriˆeld, R. S. and Sloan, S. W. (2006): The ultimate pulloutcapacity of anchors in frictional soils, Canadian Geotechnical Jour-nal, 43, 852–868.
12) Meyerhof, G. C. and Adams, J. L. (1968): The ultimate upliftcapacity of foundations, Canadian Geotechnical Journal, 5(4),225–245.
13) Murray, E. J. and Geddes, J. D. (1987): Uplift of anchor plates insand, Journal of Geotechnical Engineering, ASCE, 113(3),202–215.
14) Rowe, R. K. and Davis, E. H. (1982): The behaviour of anchorplates in sand, Geotechnique, 32(1), 25–41.
15) Takagagi, T., Tsutsui, M., Katoh, K. and Shimatani, Y. (1995): Ex-perimental study on pulling resistance of cast-in-place belled pile,–Part 1–, Annual Meeting of Architectural Institute of Japan,931–932 (in Japanese).
16) Tsutsui, M., Takagagi, T., Katoh, K. and Shimatani, Y. (1995): Ex-perimental study on pulling resistance of cast-in-place belled pile,–Part 2–, Annual Meeting of Architectural Institute of Japan,933–934 (in Japanese).