upgrading your business - · pdf fileupgrading your business technology & innovation...
TRANSCRIPT

Interim Financial Report | for the nine months ended 30 September 2017
Upgrading your Business
TECHNOLOGY & INNOVATION
future through

Corporate Information
Director’s Review
Director’s Review
Condensed Interim Financial Statements
Condensed Interim Balance Sheet
Condensed Interim Profit and Loss Account
Condensed Interim Statement of Comprehensive Income
Condensed Interim Cash Flow Statement
Condensed Interim Statement of Changes in Equity
Selected Notes to the Condensed Interim Financial Information
Condensed Interim Consolidated Financial Statements
Condensed Interim Consolidated Balance Sheet
Condensed Interim Consolidated Profit and Loss Account
Condensed Interim Consolidated Statement of Comprehensive Income
Condensed Interim Consolidated Cash Flow Statement
Condensed Interim Consolidated Statement of Changes in Equity
Selected Notes to the Condensed Interim Consolidated Financial Information
Contents02
03
05
08
10
11
12
13
14
30
32
33
34
35
36

DIRECTOR’S REVIEWCORPORATE INFORMATION
Revenue
Gross Profit
Operating Profit
Profit After Taxation
Basic Earnings Per share (Rs)
Diluted Earnings Per Share (Rs)
Nine months ended
30 September 2017
Nine months ended
30 September 2016
Change
%
Unconsolidated
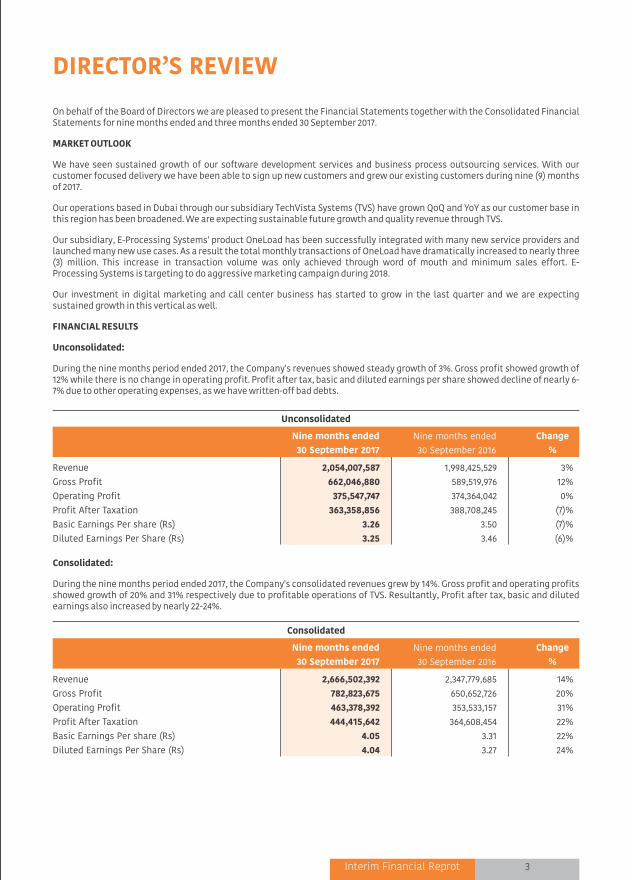
Consolidated:
During the nine months period ended 2017, the Company's consolidated revenues grew by 14%. Gross profit and operating profits showed growth of 20% and 31% respectively due to profitable operations of TVS. Resultantly, Profit after tax, basic and diluted earnings also increased by nearly 22-24%.
AUDIT COMMITTEE
Mr. Ayaz DawoodChairman
Mr. Omer SaeedMember
Mr. Tahir MasaudMember
HUMAN RESOURCE & COMPENSATION COMMITTEE
Mr. Omar SaeedChairman
Mr. Asif JoomaMember
Mr. Tahir MasaudMember
COMPANY SECRETARY & CHIEF FINANCIAL OFFICER
Mr. Muhammad Khurram Iqbal
Mr. Aezaz Hussain Non-executiveChairman
Mr. Asif Peer ExecutiveCEO and Managing Director
Mr. Arshad Masood Non-executiveDirector
Mr. Omar Saeed IndependentDirector
Mr. Ayaz Dawood IndependentDirector
Mr. Asif Jooma IndependentDirector
Mr. Tahir Masaud IndependentDirector
BOARD OF DIRECTORS
EXTERNAL AUDITORS
Chartered Accountants
Lahore
EY Ford Rhodes
Interim Financial Reprot 32 Systems Limited
3%
12%
0%
(7)%
(7)%
(6)%
SHARES REGISTRAR
THK Associates (Private) Limited.1st Floor, 40-C, Block-6P.E.C.H.S, Karachi.
T: +92 21 111-000-322F: +92 21 34168271
Systems Campus
Software Technology Park
E-1, Sehjpal Near DHA Phase-VIII,
(Ex-Air Avenue), Lahore Cantt.
UAN: +92 42 111-797-836
T: +92 42 37319401
REGISTERED & HEAD OFFICE
KARACHI OFFICE
E-5, Central Commercial Area,Shaheed-e-Millat Road,Karachi, PakistanT: +92 21 34549385-87F: +92 21 34549389
WEB PRESENCE
www.systemsltd.com
DUBAI OFFICE
TechVista Systems FZ-LLC
O�ce 1905, Regal Tower
Business Bay,
Dubai, UAE
Tel: + 9714 369 3525
Fax: + 9714 456 3761
On behalf of the Board of Directors we are pleased to present the Financial Statements together with the Consolidated Financial Statements for nine months ended and three months ended 30 September 2017.
MARKET OUTLOOK
We have seen sustained growth of our software development services and business process outsourcing services. With our customer focused delivery we have been able to sign up new customers and grew our existing customers during nine (9) months of 2017.
Our operations based in Dubai through our subsidiary TechVista Systems (TVS) have grown QoQ and YoY as our customer base in this region has been broadened. We are expecting sustainable future growth and quality revenue through TVS.
Our subsidiary, E-Processing Systems' product OneLoad has been successfully integrated with many new service providers and launched many new use cases. As a result the total monthly transactions of OneLoad have dramatically increased to nearly three (3) million. This increase in transaction volume was only achieved through word of mouth and minimum sales effort. E-Processing Systems is targeting to do aggressive marketing campaign during 2018.
Our investment in digital marketing and call center business has started to grow in the last quarter and we are expecting sustained growth in this vertical as well.
FINANCIAL RESULTS
Unconsolidated:
During the nine months period ended 2017, the Company's revenues showed steady growth of 3%. Gross profit showed growth of 12% while there is no change in operating profit. Profit after tax, basic and diluted earnings per share showed decline of nearly 6-7% due to other operating expenses, as we have written-off bad debts.
Revenue
Gross Profit
Operating Profit
Profit After Taxation
Basic Earnings Per share (Rs)
Diluted Earnings Per Share (Rs)
Nine months ended
30 September 2017
Nine months ended
30 September 2016
Change
%
Consolidated
14%
20%
31%
22%
22%
24%
LEGAL ADVISOR
Hassan & Hassan Advocates
Habib Metropolitan Bank Limited
BANKERS
United Bank Limited
Standard Chartered Bank (Pakistan) Limited
Albaraka Bank Limited
Bank Alfalah Limited
Bank Islami Limited
Meezan Bank Limited
Dubai Islamic Bank
Faysal Bank Limited
Deutsche Bank AGHabib Bank LimitedMCB Bank Limited
INTERNAL AUDITORS
Uzair Hammad Faisal & Co.
2,054,007,587
662,046,880
375,547,747
363,358,856
3.26
3.25
1,998,425,529
589,519,976
374,364,042
388,708,245
3.50
3.46
2,666,502,392
782,823,675
463,378,392
444,415,642
4.05
4.04
2,347,779,685
650,652,726
353,533,157
364,608,454
3.31
3.27
DIRECTOR’S REVIEWCORPORATE INFORMATION
Revenue
Gross Profit
Operating Profit
Profit After Taxation
Basic Earnings Per share (Rs)
Diluted Earnings Per Share (Rs)
Nine months ended
30 September 2017
Nine months ended
30 September 2016
Change
%
Unconsolidated
Consolidated:
During the nine months period ended 2017, the Company's consolidated revenues grew by 14%. Gross profit and operating profits showed growth of 20% and 31% respectively due to profitable operations of TVS. Resultantly, Profit after tax, basic and diluted earnings also increased by nearly 22-24%.
AUDIT COMMITTEE
Mr. Ayaz DawoodChairman
Mr. Omer SaeedMember
Mr. Tahir MasaudMember
HUMAN RESOURCE & COMPENSATION COMMITTEE
Mr. Omar SaeedChairman
Mr. Asif JoomaMember
Mr. Tahir MasaudMember
COMPANY SECRETARY & CHIEF FINANCIAL OFFICER
Mr. Muhammad Khurram Iqbal
Mr. Aezaz Hussain Non-executiveChairman
Mr. Asif Peer ExecutiveCEO and Managing Director
Mr. Arshad Masood Non-executiveDirector
Mr. Omar Saeed IndependentDirector
Mr. Ayaz Dawood IndependentDirector
Mr. Asif Jooma IndependentDirector
Mr. Tahir Masaud IndependentDirector
BOARD OF DIRECTORS
EXTERNAL AUDITORS
Chartered Accountants
Lahore
EY Ford Rhodes
Interim Financial Reprot 32 Systems Limited
3%
12%
0%
(7)%
(7)%
(6)%
SHARES REGISTRAR
THK Associates (Private) Limited.1st Floor, 40-C, Block-6P.E.C.H.S, Karachi.
T: +92 21 111-000-322F: +92 21 34168271
Systems Campus
Software Technology Park
E-1, Sehjpal Near DHA Phase-VIII,
(Ex-Air Avenue), Lahore Cantt.
UAN: +92 42 111-797-836
T: +92 42 37319401
REGISTERED & HEAD OFFICE
KARACHI OFFICE
E-5, Central Commercial Area,Shaheed-e-Millat Road,Karachi, PakistanT: +92 21 34549385-87F: +92 21 34549389
WEB PRESENCE
www.systemsltd.com
DUBAI OFFICE
TechVista Systems FZ-LLC
O�ce 1905, Regal Tower
Business Bay,
Dubai, UAE
Tel: + 9714 369 3525
Fax: + 9714 456 3761
On behalf of the Board of Directors we are pleased to present the Financial Statements together with the Consolidated Financial Statements for nine months ended and three months ended 30 September 2017.
MARKET OUTLOOK
We have seen sustained growth of our software development services and business process outsourcing services. With our customer focused delivery we have been able to sign up new customers and grew our existing customers during nine (9) months of 2017.
Our operations based in Dubai through our subsidiary TechVista Systems (TVS) have grown QoQ and YoY as our customer base in this region has been broadened. We are expecting sustainable future growth and quality revenue through TVS.
Our subsidiary, E-Processing Systems' product OneLoad has been successfully integrated with many new service providers and launched many new use cases. As a result the total monthly transactions of OneLoad have dramatically increased to nearly three (3) million. This increase in transaction volume was only achieved through word of mouth and minimum sales effort. E-Processing Systems is targeting to do aggressive marketing campaign during 2018.
Our investment in digital marketing and call center business has started to grow in the last quarter and we are expecting sustained growth in this vertical as well.
FINANCIAL RESULTS
Unconsolidated:
During the nine months period ended 2017, the Company's revenues showed steady growth of 3%. Gross profit showed growth of 12% while there is no change in operating profit. Profit after tax, basic and diluted earnings per share showed decline of nearly 6-7% due to other operating expenses, as we have written-off bad debts.
Revenue
Gross Profit
Operating Profit
Profit After Taxation
Basic Earnings Per share (Rs)
Diluted Earnings Per Share (Rs)
Nine months ended
30 September 2017
Nine months ended
30 September 2016
Change
%
Consolidated
14%
20%
31%
22%
22%
24%
LEGAL ADVISOR
Hassan & Hassan Advocates
Habib Metropolitan Bank Limited
BANKERS
United Bank Limited
Standard Chartered Bank (Pakistan) Limited
Albaraka Bank Limited
Bank Alfalah Limited
Bank Islami Limited
Meezan Bank Limited
Dubai Islamic Bank
Faysal Bank Limited
Deutsche Bank AGHabib Bank LimitedMCB Bank Limited
INTERNAL AUDITORS
Uzair Hammad Faisal & Co.
2,054,007,587
662,046,880
375,547,747
363,358,856
3.26
3.25
1,998,425,529
589,519,976
374,364,042
388,708,245
3.50
3.46
2,666,502,392
782,823,675
463,378,392
444,415,642
4.05
4.04
2,347,779,685
650,652,726
353,533,157
364,608,454
3.31
3.27

Interim Financial Reprot 54 Systems Limited
24 October 2017
Lahore
Asif Peer
Chief Executive
On behalf of the Board
DIRECTOR’S REVIEW
30 Septmebr 201730 September 2016
(Basic)
(Diluted)
FUTURE OUTLOOK
Our future growth is going to be attributed to following factors:
• Strong and consistent pipeline and recurring business from North America.
• We are investing heavily in the new tools and technologies which includes Artificial Intelligence, Machine Learning, Block Chain and Robotics Process Automation. This will pay off results in the future as international markets are moving in this direction.
• We are expecting further growth from our MEA business since we have signed up projects for many large public sector organizations, and we are also seeing strong evidence that these organizations are investing heavily in Information technology and very interested in adopting new technology areas. Our focus is to expand this business further.
• In domestic and regional markets we are strongly aligned with two major Principals - Microsoft and IBM and expect business from their partnerships.
• We are expecting slowdown in Public Sector spending due to political uncertainty and elections next year; but we are not seeing any adverse effect on our business as most of our existing customers have recurring maintenance contracts with us.
• We are also actively pursuing and looking for acquisition opportunities in the market, which can provide us inorganic growth.
• We are targeting to complete the Pakistan Civil Aviation Authority project by Q4 of 2017 and kick-off three (3) years support immediately after new Islamabad Airport is operational.
• We have also started focus in building business solutions, which we can pitch to our customers globally.
• We are expecting growth in our export revenue. Any Dollar depreciation will provide additional profitability.
ACKNOWLEDGEMENT
The Board takes this opportunity to thank the Company's valued customers, bankers and other stakeholders for their corporation and support. The Board greatly appreciates hard work and dedication of all employees of the Company.
1,998,425,529
589,519,976
374,364,042
388,708,245
3.50
3.46
2,054,007,587
662,046,880
375,547,747
363,358,856
3.26
3.25
3%
%12
%0
%(7)
%(7)
( )%6
(Basic)
(Diluted)
30 Septmebr 201730 September 2016
14%
20%
31%
22%
22%
24%
2,666,502,392
782,823,675
463,378,392
444,415,642
4.05
4.04
2,347,779,685
650,652,726
353,533,157
364,608,454
3.31
3.27

Condensed Interim
Financial Information
6 Systems Limited
24-10-2017

Condensed Interim
Financial Information
6 Systems Limited
24-10-2017

ASIF PEER
Chief Executive
CONDENSED INTERIM BALANCE SHEET
AEZAZ HUSSAIN
Chairman
as at 30 September 2017
8 Systems Limited Interim Financial Reprot 9
MUHAMMAD KHURRAM IQABL
Chief Financial Officer
ASSETS
Non-current assets
Property and equipment 6
Intangibles 7
Long term investments 8
Long term deposits
Deferred taxation
Total non-current assets
Current assets
Unbilled revenue
Trade debts 9
Advances 10
Trade deposits and short term prepayments 11
Interest accrued
Other receivables 12
Short term investments 13
Tax refunds due from the Government
Cash and bank balances 14
Total current assets
826,178,822
557,598,452
57,701,100
51,467,435
51,077,980
51,077,980
6,130,852
6,130,852
25,276,863
25,276,863
966,365,617
691,551,582
525,170,875
320,894,130
1,105,531,902
1,290,766,880
57,106,053
31,158,750
63,375,844
59,561,630
16,320,426
11,863,416
292,979,993
226,917,525
130,000,000
253,000,000
141,104,241
105,551,702
84,386,247 183,200,188
2,415,975,581 2,482,914,221
Note
Un-audited Audited
30 Sepember 31 December
2017 2016
Rupees Rupees
TOTAL ASSETS
3,382,341,198 3,174,465,803
EQUITY AND LIABILITIES
Share capital and reserves
Authorized share capital
200,000,000 (2016: 150,000,000) ordinary shares of Rs. 10 each
Issued, subscribed and paid up share capital 15
Capital reserves
Unappropriated profit
Total shareholders' equity
Non-current liabilities
Liabilities against asset subject to finance lease
Long term advances 16
Current liabilities
Trade and other payables 17
Short term borrowings 18
Unearned revenue
Current portion of liabilities against asset subject to finance lease
Current portion of long term advances
Total current liabilities
TOTAL EQUITY AND LIABILITIES
1,500,000,000
1,110,784,920
461,091,227
1,344,492,456
2,916,368,603
-
10,910,791
10,910,791
226,689,126
-
14,387,586
-
6,109,697
247,186,409
3,174,465,803
2,000,000,000
1,118,276,520
483,838,326
1,499,851,879
3,101,966,725
9,270,379
10,978,526
20,248,905
92,024,900
150,000,000
12,155,585
3,721,121
2,223,962
260,125,568
3,382,341,198
Contingencies and commitments 20
Note
Un-audited Audited
30 Sepember 31 December
2017 2016
Rupees Rupees
The annexed notes from 1 to 28 form an integral part of this condensed interim financial information.
Total Long term advances

CONDENSED INTERIM PROFIT AND LOSS ACCOUNTfor the nine and three months ended 30 September 2017
10 Systems Limited
AEZAZ HUSSAIN
Chairman
ASIF PEER
Chief Executive
MUHAMMAD KHURRAM IQABL
Chief Financial Officer
CONDENSED INTERIM STATEMENT OF COMPREHENSIVE INCOME
Interim Financial Reprot 11
for the nine months ended 30 September 2017
AEZAZ HUSSAIN
Chairman
ASIF PEER
Chief Executive
MUHAMMAD KHURRAM IQABL
Chief Financial Officer
30 Sepember 30 Sepember 30 Sepember
Note 2017 2016 2016
Rupees Rupees
30 Sepember
2017
Rupees Rupees
21
22
22
Revenue - net
Cost of sales
Gross profit
Distribution expenses
Administrative expenses
Research and development expenses
Operating profit
Other income
Other operating expenses
Finance costs
Profit before taxation
Taxation
Profit for the period
Earnings per share:
Basic earnings per share
Diluted earnings per share
The annexed notes from 1 to 28 form an integral part of this condensed interim financial information.
NINE Months Ended Three Months Ended
2,054,007,587
1,391,960,707
662,046,880
80,782,775
205,716,358
-
286,499,133
375,547,747
47,049,402
422,597,149
46,232,319
5,115,685
371,249,145
7,890,289
363,358,856
3.26
3.25
1,998,425,529
1,408,905,553
589,519,976
28,798,321
184,576,023
1,781,590
215,155,934
374,364,042
23,589,770
397,953,812
-
2,345,567
395,608,245
6,900,000
388,708,245
3.50
3.46
660,072,342
461,103,626
198,968,716
8,429,366
55,824,631
-
64,253,997
134,714,719
7,949,093
142,663,812
-
1,571,512
141,092,300
4,927,587
136,164,713
1.23
1.21
689,148,644
462,269,930
226,878,714
33,988,486
69,438,151
-
103,426,637
123,452,077
14,163,733
137,615,810
9,157,762
3,536,179
124,921,869
2,641,520
122,280,349
1.09
1.09
Profit for the period
Other comprehensive income
Total comprehensive income for the period
The annexed notes from 1 to 28 form an integral part of this condensed interim financial information.
30 Sepember 30 Sepember
2017 2016
Rupees Rupees
363,358,856
388,708,245
-
-
363,358,856 388,708,245
Nine Months Ended
CONDENSED INTERIM CASH FLOW STATEMENT
12 Systems Limited
AEZAZ HUSSAIN
Chairman
ASIF PEER
Chief Executive
MUHAMMAD KHURRAM IQABL
Chief Financial Officer CO
ND
EN
SE
D I
NTE
RIM
STA
TE
ME
NT O
F C
HA
NG
ES
IN
EQ
UIT
Y
Interim Financial Reprot 113
AE
ZA
Z H
US
SA
IN
Chair
man
AS
IF P
EE
R
Chie
f Exe
cuti
ve
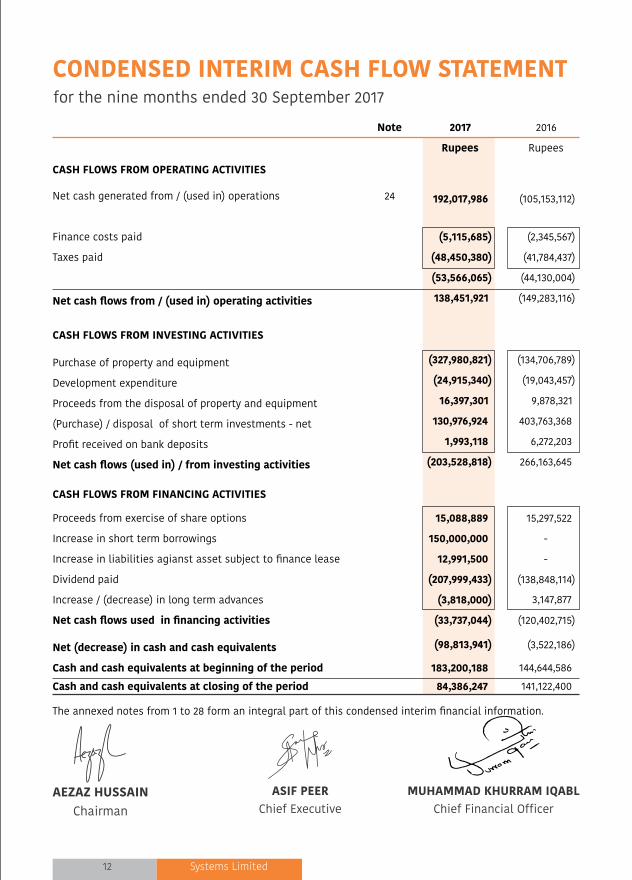
CASH FLOWS FROM OPERATING ACTIVITIES
Net cash generated from / (used in) operations
Finance costs paid
Taxes paid
Net cash flows from / (used in) operating activities
CASH FLOWS FROM INVESTING ACTIVITIES
Purchase of property and equipment
Development expenditure
Proceeds from the disposal of property and equipment
(Purchase) / disposal of short term investments - net
Profit received on bank deposits
Net cash flows (used in) / from investing activities
CASH FLOWS FROM FINANCING ACTIVITIES
Proceeds from exercise of share options
Increase in short term borrowings
Increase in liabilities agianst asset subject to finance lease
Dividend paid
Increase / (decrease) in long term advances
Net cash flows used in financing activities
Net (decrease) in cash and cash equivalents
Cash and cash equivalents at beginning of the period
Cash and cash equivalents at closing of the period
The annexed notes from 1 to 28 form an integral part of this condensed interim financial information.
(105,153,112)
(2,345,567)
(41,784,437)
(44,130,004)
(149,283,116)
(134,706,789)
(19,043,457)
9,878,321
403,763,368
6,272,203
266,163,645
15,297,522 - -
(138,848,114)
3,147,877
(120,402,715)
(3,522,186)
144,644,586
141,122,400
2016
Rupees
MU
HA
MM
AD
KH
UR
RA
M I
QA
BL
Chie
f Fi
nanci
al O
ffic
er
for the nine months ended 30 September 2017
for
the n
ine m
onth
s ended 3
0 S
epte
mber
2017
192,017,986
(5,115,685)
(48,450,380)
(53,566,065)
138,451,921
(327,980,821)
(24,915,340)
16,397,301
130,976,924
1,993,118
(203,528,818)
15,088,889
150,000,000
12,991,500
(207,999,433)
(3,818,000)
(33,737,044)
(98,813,941)
183,200,188
84,386,247
24
Note 2017
Rupees
Bala
nce
as
at
31 D
ece
mber
2015
- (
Audit
ed)
Share
iss
ued a
gain
st E
mplo
yees'
Share
Opti
on S
chem
e
Share
base
d p
aym
ents
Final
div
idend @
Rs.
1.25
per
share
for
the y
ear
ended 3
1st
Dece
mber
2015
Tota
l co
mpre
hensi
ve i
nco
me f
or
the p
eri
od
Bala
nce
as
at
30 S
epte
mber
2016
- (
Unaudit
ed)
Bala
nce
as
at
31 D
ece
mber
2016
- (
Audit
ed)
Transf
er
from
com
pensa
tion r
ese
rve t
o s
hare
pre
miu
m r
ese
rve
Share
iss
ued a
gain
st E
mplo
yees'
Share
Opti
on S
chem
e
Share
base
d p
aym
ents
Final
div
idend @
Rs.
1.8
6 p
er
share
for
the y
ear
ended 3
1 D
ece
mber
2016
Tota
l co
mpre
hensi
ve i
nco
me f
or
the p
eri
od
Bala
nce
as
at
30
Se
pte
mb
er
20
17 -
(U
nau
dit
ed
)
The a
nnexe
d n
ote
s fr
om
1 t
o 2
8 f
orm
an i
nte
gra
l part
of
this
condense
d i
nte
rim
financi
al
info
rmati
on.
Re
ve
nu
e r
ese
rve
1,10
6,8
08,7
60
411,
302,
586
9,25
5,4
67
968,2
60,6
24
2,49
5,6
27,4
37
3,97
6,1
60
11,3
21,3
62
-
15,2
97,5
22
-
-
7,37
7,627
-
7,37
7,627
-
-
-
(138
,848
,114
)
(138
,848
,114
)
-
-
-
388,7
08,2
45
388,7
08,2
45
1,11
0,7
84,
920
422,
623
,948
16,6
33,0
94
1,21
8,1
20,7
55
2,76
8,1
62,
717
1,11
0,7
84,
920
422,
623
,948
38,4
67,
279
1,34
4,49
2,45
6
2,9
16,3
68
,60
3
43,0
68,4
02
(43,
068,4
02)
-
7,49
1,600
7,597
,289
-
-
15,0
88
,88
9
-
-
15,1
49,8
10
-
15,1
49,8
10
-
-
-
(207,
999,
433)
(20
7,999,4
33)
--
-36
3,35
8,8
56
363,3
58
,856
1,11
8,2
76,5
20
473
,28
9,6
39
10,5
48
,68
71,
499,8
51,
879
3,1
01,
966,7
25
Cap
ital
rese
rve
s
Ru
pe
es
Sh
are
cap
ital
pre
miu
m
Em
plo
ye
e
com
pe
nsa
tio
n
rese
rve
Un
ap
pro
pri
ate
d
pro
fit
Issu
ed
,
sub
scri
be
d
an
d p
aid
up
share
cap
ital
Tota
l
Ru
pe
es
Ru
pe
es
Ru
pe
es
Ru
pe
es

CONDENSED INTERIM CASH FLOW STATEMENT
12 Systems Limited
AEZAZ HUSSAIN
Chairman
ASIF PEER
Chief Executive
MUHAMMAD KHURRAM IQABL
Chief Financial Officer CO
ND
EN
SE
D I
NTE
RIM
STA
TE
ME
NT O
F C
HA
NG
ES
IN
EQ
UIT
Y
Interim Financial Reprot 113
AE
ZA
Z H
US
SA
IN
Chair
man
AS
IF P
EE
R
Chie
f Exe
cuti
ve
CASH FLOWS FROM OPERATING ACTIVITIES
Net cash generated from / (used in) operations
Finance costs paid
Taxes paid
Net cash flows from / (used in) operating activities
CASH FLOWS FROM INVESTING ACTIVITIES
Purchase of property and equipment
Development expenditure
Proceeds from the disposal of property and equipment
(Purchase) / disposal of short term investments - net
Profit received on bank deposits
Net cash flows (used in) / from investing activities
CASH FLOWS FROM FINANCING ACTIVITIES
Proceeds from exercise of share options
Increase in short term borrowings
Increase in liabilities agianst asset subject to finance lease
Dividend paid
Increase / (decrease) in long term advances
Net cash flows used in financing activities
Net (decrease) in cash and cash equivalents
Cash and cash equivalents at beginning of the period
Cash and cash equivalents at closing of the period
The annexed notes from 1 to 28 form an integral part of this condensed interim financial information.
(105,153,112)
(2,345,567)
(41,784,437)
(44,130,004)
(149,283,116)
(134,706,789)
(19,043,457)
9,878,321
403,763,368
6,272,203
266,163,645
15,297,522 - -
(138,848,114)
3,147,877
(120,402,715)
(3,522,186)
144,644,586
141,122,400
2016
Rupees
MU
HA
MM
AD
KH
UR
RA
M I
QA
BL
Chie
f Fi
nanci
al O
ffic
er
for the nine months ended 30 September 2017fo
r th
e n
ine m
onth
s ended 3
0 S
epte
mber
2017
192,017,986
(5,115,685)
(48,450,380)
(53,566,065)
138,451,921
(327,980,821)
(24,915,340)
16,397,301
130,976,924
1,993,118
(203,528,818)
15,088,889
150,000,000
12,991,500
(207,999,433)
(3,818,000)
(33,737,044)
(98,813,941)
183,200,188
84,386,247
24
Note 2017
Rupees
Bala
nce
as
at
31 D
ece
mber
2015
- (
Audit
ed)
Share
iss
ued a
gain
st E
mplo
yees'
Share
Opti
on S
chem
e
Share
base
d p
aym
ents
Final
div
idend @
Rs.
1.25
per
share
for
the y
ear
ended 3
1st
Dece
mber
2015
Tota
l co
mpre
hensi
ve i
nco
me f
or
the p
eri
od
Bala
nce
as
at
30 S
epte
mber
2016
- (
Unaudit
ed)
Bala
nce
as
at
31 D
ece
mber
2016
- (
Audit
ed)
Transf
er
from
com
pensa
tion r
ese
rve t
o s
hare
pre
miu
m r
ese
rve
Share
iss
ued a
gain
st E
mplo
yees'
Share
Opti
on S
chem
e
Share
base
d p
aym
ents
Final
div
idend @
Rs.
1.8
6 p
er
share
for
the y
ear
ended 3
1 D
ece
mber
2016
Tota
l co
mpre
hensi
ve i
nco
me f
or
the p
eri
od
Bala
nce
as
at
30
Se
pte
mb
er
20
17 -
(U
nau
dit
ed
)
The a
nnexe
d n
ote
s fr
om
1 t
o 2
8 f
orm
an i
nte
gra
l part
of
this
condense
d i
nte
rim
financi
al
info
rmati
on.
Re
ve
nu
e r
ese
rve
1,10
6,8
08,7
60
411,
302,
586
9,25
5,4
67
968,2
60,6
24
2,49
5,6
27,4
37
3,97
6,1
60
11,3
21,3
62
-
15,2
97,5
22
-
-
7,37
7,627
-
7,37
7,627
-
-
-
(138
,848
,114
)
(138
,848
,114
)
-
-
-
388,7
08,2
45
388,7
08,2
45
1,11
0,7
84,
920
422,
623
,948
16,6
33,0
94
1,21
8,1
20,7
55
2,76
8,1
62,
717
1,11
0,7
84,
920
422,
623
,948
38,4
67,
279
1,34
4,49
2,45
6
2,9
16,3
68
,60
3
43,0
68,4
02
(43,
068,4
02)
-
7,49
1,600
7,597
,289
-
-
15,0
88
,88
9
-
-
15,1
49,8
10
-
15,1
49,8
10
-
-
-
(207,
999,
433)
(20
7,999,4
33)
--
-36
3,35
8,8
56
363,3
58
,856
1,11
8,2
76,5
20
473
,28
9,6
39
10,5
48
,68
71,
499,8
51,
879
3,1
01,
966,7
25
Cap
ital
rese
rve
s
Ru
pe
es
Sh
are
cap
ital
pre
miu
m
Em
plo
ye
e
com
pe
nsa
tio
n
rese
rve
Un
ap
pro
pri
ate
d
pro
fit
Issu
ed
,
sub
scri
be
d
an
d p
aid
up
share
cap
ital
Tota
l
Ru
pe
es
Ru
pe
es
Ru
pe
es
Ru
pe
es

1. THE COMPANY AND ITS OPERATIONS
1.1 The Company is a public limited Company incorporated in Pakistan under the repealed Companies
Ordinance 1984, and is listed on the Pakistan Stock Exchange (formerly Karachi, Islamabad and Lahore
Stock Exchanges). The Company is principally engaged in the business of software development, trading
of software and business process outsourcing services. The head office of the Company is situated at E-1,
Sehjpal Road, Near DHA Phase VIII (Ex-Air Avenue), Lahore Cantt.
1.2 This financial information is the separate financial information of the company in which investment in
subsidiary is stated at cost less impairment losses, if any. The condensed interim consolidated financial
statements are prepared separately.
2. STATEMENT OF COMPLIANCE
2.1 During the year, the Companies Act, 2017 (the Act) has been promulgated with effect from 30 May 2017.
However, Securities and Exchange Commission of Pakistan vide its circulars no.17 and 23 of 2017 dated July
20, 2017 and October 04, 2017 respectively communicated that the companies whose financial year closes
on or before December 31, 2017 shall prepare their financial statements in accordance with the provisions
of the repealed Companies Ordinance, 1984.
2.2 Accordingly, these unconsolidated condensed interim financial information of the Company for the nine
months period ended 30 September 2017 has been prepared in accordance with the requirements of the
International Accounting Standard 34 - Interim Financial Reporting as are notified under the repealed
Companies Ordinance, 1984, provisions of and directives issued under the repealed Companies
Ordinance,1984. In case requirements differ, the provisions or directives of the repealed Companies
Ordinance, 1984 shall prevail.
2.3 This is condensed interim financial information is un-audited and is being submitted to shareholders, as
required by section 245 of the Companies ordinance, 1984.
3 BASIS OF PREPARATION
3.1 These unconsolidated condensed interim financial information of the Company for the nine months period
ended 30 September 2017 has been prepared in accordance with the requirements of the International
Accounting Standard 34 - Interim Financial Reporting as are notified under the repealed Companies
Ordinance, 1984, provisions of and directives issued under the repealed Companies Ordinance,1984.
3.2 This condensed interim financial information does not include all the information and disclosures required
in annual financial statements, and should be read in conjunction with the Company's annual financial
statements as at 31 December 2016.
3.3 This condensed interim financial statements have been prepared under the historical cost convention.
4 ACCOUNTING POLICIES
The accounting policies adopted for the preparation of this condensed interim financial information are
the same as those applied in the preparation of the preceding annual published financial statements of
the Company for the year ended 31 December 2016 except as follows:
The Company has adopted the following standards and amendment to IFRSs which became effective for
the current period:
IFRS 7-Financial Instruments: Disclosures - Disclosure Initiative - (Amendment)
IAS 12 -Income Taxes – Recognition of Deferred Tax Assets for Unrealized losses (Amendments)
SELECTED NOTES TO THE CONDENSED INTERIM FINANCIAL INFORMATION
14 Systems Limited
The adoption of the above amendment to accounting standards did not have any material effect on the
condensed interim financial information.
5 ACCOUNTING ESTIMATES AND JUDGMENTS
The preparation of condensed interim financial information requires management to make judgments,
estimates and assumptions that affect the application of accounting policies and reported amount of
assets and liabilities, incomes and expenses. Actual results may differ from these estimates. The
significant judgments made by management in applying the Company's accounting policies and the key
sources of estimation are the same as those that applied to the financial statements for the year ended 31
December 2016.
Interim Financial Reprot 15
for the nine months ended 30 September 2017
Un-audited Audited
30 September 31 December
Note 2017 2016
6. PRPOERTY AND EQUIPMENT
Opening balance - net book value 557,598,452 359,204,912
Additions during the period / year - cost 6.1 327,980,821 281,640,741
885,579,273 640,845,653
Less:
Disposals during the period / year 6.2 8,798,064 10,606,471
Depreciation during the period / year 50,602,387 72,640,730
Book value at the end of the period / year 826,178,822 557,598,452
6.1 Additions during the period/year-cost
Computers 17,855,407
21,208,723
Computer equipment and installations 7,011,032 4,407,210
Other equipment and installations 772,645 1,170,889
Furniture and fittings 562,500 1,280,747
O�ce equipment 2,171,578 5,172,978
Vehicles 15,025,500 31,139,108
Project assets - 1,353,000
Mobile sets - 991,774
Leased assets 12,616,500 -
Capital work in progress 271,965,659 214,916,312
327,980,821 281,640,741
Rupees Rupees

16 Systems Limited
9. TRADE DEBTS
Considered good - unsecured
Export 9.1 896,942,277 1,054,908,632
Local 215,465,107 251,404,144
1,112,407,384 1,306,312,776
Considered doubtful - unsecured
Local 10,442,367 11,179,257
Less: Provision for doubtful debts (10,442,367) (11,179,257)
- -
Less: Written o� (6,875,482)
(15,545,896)
1,105,531,902 1,290,766,880
Interim Financial Reprot 17
6.2 Disposals during the period / year
Computers
Vehicles
31 December 2016
Computers
Computer equipment and installations
Other equipment and installations
Generator
Furniture and fittings
Vehicles
O�ce equipment
Project assets
Mobile sets
23,161,593
4,252,261
1,213,226
226,267
2,171,557
10,910,334
510,000
40,543
106,157
42,591,938
Accumulated
Depreciation
672,577
14,167
106,667
133,233
-
9,646,494
-
-
33,333
10,606,471
Written Down
Value
23,834,170
4,266,428
1,319,893
359,500
2,171,557
20,556,828
510,000
40,543
139,490
53,198,409
Cost
Rupees Rupees Rupees
564,099
8,233,965
8,798,064
30 September 2017
2,247,909
11,254,943
13,502,852
2,812,008
19,488,908
22,300,916
7. INTANGIBLES
Opening balance - net book value 51,467,435 42,247,518
Additions during the period / year - cost 24,915,340 29,003,609
76,382,775 71,251,127
Less:
Amortization during the period / year 18,681,675 19,783,692
Book value at the end of the period / year 57,701,100 51,467,435
Un-audited Audited
30 September 31 December
2017 2016
Rupees Rupees
8.
8.1 49,700,030 49,700,030
8.2 1,377,950 1,377,950
51,077,980 51,077,980
LONG TERM INVESTMENTS
Investment in Subsidiaries - at cost - unquoted
140,004 (2016: 140,004) fully paid
ordinary shares of Rs. 10/- each
50 (2016: 50) fully paid ordinary shares of AED 1,000/- each
Tech Vista Systems FZ-LLC
E - Processing Systems (Private) Limited
Un-audited Audited
30 September 31 December
Note 2017 2016
Rupees Rupees
8.1 This represents 63% share in Company's subsidiary E-Processing Systems (Private) Limited, a company
engaged in the business of purchase and sale of airtime and related services in Pakistan.
8.2 This represents 100% share in Company's subsidiary, TechVista Systems FZ- LLC, a company set up in Dubai
Technology and Media Free Zone Authority engaged in providing a host of services including enterprise
application integration and software development and has been registered as a limited liability company
on 03 April 2013.
Un-audited Audited
30 September 31 December
Note 2017 2016
Rupees Rupees

18 Systems Limited
14. CASH AND BANK BALANCES
Cash in hand
Cash at bank:
Local currency:
Current accounts
Deposit accounts 14.1
Foreign currency - current accounts
457,226
11,196,701
71,119,591
82,316,292
1,612,729
83,929,021
84,386,247
47,660
38,931,750
142,712,134
181,643,884
1,508,644
183,152,528
183,200,188
14.1 These carry interest rate of 3.19% to 4% (2016: 3.29% to 4.04%) per annum.
Interim Financial Reprot 19
9.1 This includes receivables from related parties i.e. Visionet Systems Incorporation and Tech Vista Systems
FZ-LLC amounting to Rs. 538.40 million (2016: Rs 646.40 million) and Rs. 318.30 million (2016: Rs 366.9 million)
respectively.
13. SHORT TERM INVESTMENTS
Term deposit receipts 13.1 130,000,000
13.1 These carry interest at the rate of 5.75% (2016: 5.85% per annum).
10. ADVANCES
Advances- considered good
against salary 2,110,443
against expenses 20,428,659
22,539,102
To suppliers-against goods 34,566,951
57,106,053
11. TRADE DEPOSITS AND SHORT TERM PREPAYMENTS
Security deposits 32,489,298
Prepayments 30,886,546
63,375,844
12. OTHER RECEIVABLES
These represent receivables from the following related parties:
Considered good - unsecured
Visionet Systems Incorporation - USA 7,907,624
E-processing Systems (Private) Limited 119,584,572
Tech Vista Systems FZ LLC - UAE 165,487,797
292,979,993
253,000,000
2,160,096
20,605,249
22,765,345
8,393,405
31,158,750
32,693,991
26,867,639
59,561,630
2,593,326
76,552,155
147,772,044
226,917,525
Un-audited Audited
30 September 31 December
Note 2017 2016
Rupees Rupees
Un-audited Audited
30 September 31 December
Note 2017 2016
Rupees Rupees
15. ISSUED, SUBSCRIBED AND PAID UP SHARE CAPITAL
15.1 Reconciliation of issued, subscribed and paid-up share capital:
22,226,927
22,226,927
222,269,270 222,269,270
89,600,725
88,851,565
896,007,250 888,515,650
111,827,652
111,078,492
1,118,276,520 1,110,784,920
Ordinary shares of Rs. 10/- each
fully paid up as bonus shares
Ordinary shares of Rs. 10/- each fully
paid in cash
30 September
2017
31 December
2016
30 September
2017
31 December
2016
No of Shares RupeesRupeesNo of Shares
Balance as at 1st January
Stock options exercised
111,078,492
110,680,876
1,110,784,920
1,106,808,760
749,160 397,616 7,491,600
111,827,652 111,078,492 1,118,276,520
30 September
2017
31 December
2016
30 September
2017
31 December
2016
No of Shares RupeesRupeesNo of Shares
3,976,160
1,110,784,920
20 Systems Limited Interim Financial Reprot 21
2017 2016
Unallocated income and expenses:
Rupees Rupees
Other operating expenses (46,232,319) -
Other income 47,049,402 23,589,770
Finance cost (5,115,685) (2,345,567)
(4,298,602) 21,244,203
Profit before taxation 371,249,145 395,608,245
Taxation (7,890,289) (6,900,000)
Profit for the year 363,358,856 388,708,245
Un-audited Audited
30 September 31 December
2017 2016
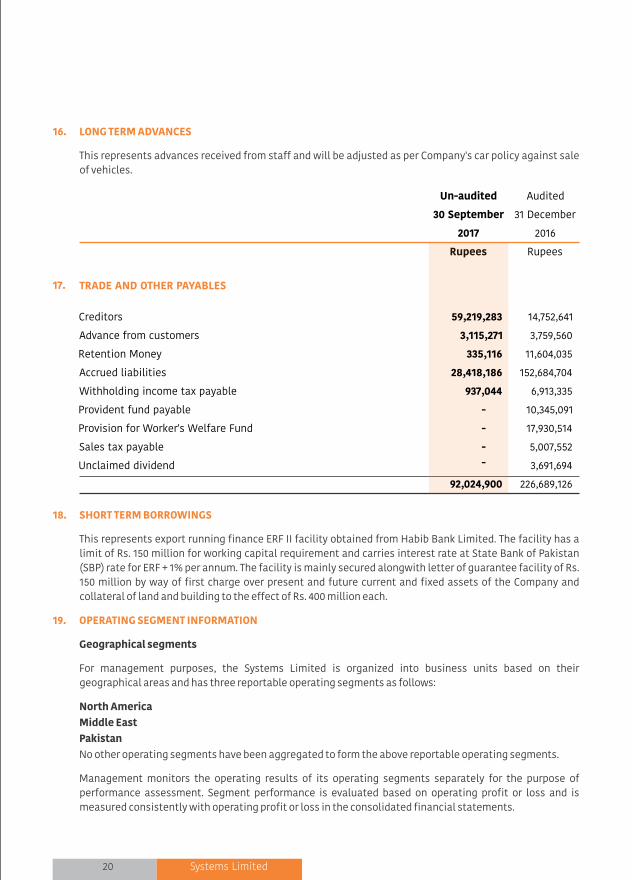
17. TRADE AND OTHER PAYABLES
Creditors
14,752,641
Advance from customers
3,759,560
Retention Money
11,604,035
Accrued liabilities
152,684,704
Withholding income tax payable
6,913,335
Provident fund payable
10,345,091
Provision for Worker's Welfare Fund
17,930,514
Sales tax payable 5,007,552
Unclaimed dividend 3,691,694
226,689,126
Rupees
Rupees
16. LONG TERM ADVANCES
This represents advances received from staff and will be adjusted as per Company's car policy against sale
of vehicles.
18. SHORT TERM BORROWINGS
This represents export running finance ERF II facility obtained from Habib Bank Limited. The facility has a
limit of Rs. 150 million for working capital requirement and carries interest rate at State Bank of Pakistan
(SBP) rate for ERF + 1% per annum. The facility is mainly secured alongwith letter of guarantee facility of Rs.
150 million by way of first charge over present and future current and fixed assets of the Company and
collateral of land and building to the effect of Rs. 400 million each.
19. OPERATING SEGMENT INFORMATION
Geographical segments
For management purposes, the Systems Limited is organized into business units based on their
geographical areas and has three reportable operating segments as follows:
North America
Middle East
Pakistan
No other operating segments have been aggregated to form the above reportable operating segments.
Management monitors the operating results of its operating segments separately for the purpose of
performance assessment. Segment performance is evaluated based on operating profit or loss and is
measured consistently with operating profit or loss in the consolidated financial statements.
Transfer prices between operating segments are on arm's length basis in a manner similar to transactions
with third parties.
2017 2016
Sales 1,398,792,914 1,255,721,259
260,699,637
224,867,081
394,515,036 517,837,189 2,054,007,587 1,998,425,529
Cost of sales (807,306,373) (721,652,844)
(251,105,061) (205,936,414)
(333,549,273) (481,316,295) (1,391,960,707) (1,408,905,553)
Gross profit 591,486,541
534,068,415
9,594,576
18,930,667
60,965,763 36,520,894 662,046,880 589,519,976
Distribution expenses (2,747,310)
(1,751,818)
(56,201,874) (1,758,123)
(21,833,591) (25,288,380) (80,782,775) (28,798,321)
Research and development expenses -
(457,171)
-
(624,831)
- (699,588) - (1,781,590)
Administrative expenses (149,679,354)
(129,002,169) (27,671,700)
(23,026,001)
(28,365,304) (32,547,853) (205,716,358) (184,576,023)
(152,426,664) (131,211,158) (83,873,574) (25,408,955)
(50,198,895) (58,535,821) (286,499,133) (215,155,934)
Profit / (loss) before taxation and
Unallocated income and expenses 439,059,877
402,857,257
(74,278,998)
(6,478,288)
10,766,868 (22,014,927) 375,547,747 374,364,042
Un-audited
Nine Months Ended
30 September
Nine Months Ended
30 September
Un-audited
Nine Months Ended
30 September
Rupees
North America Middle East Pakistan Total
Un-audited
Nine Months Ended
30 September
Un-audited
Rupees
2017 2016
RupeesRupees
2017 2016
RupeesRupees
2017 2016
RupeesRupees
59,219,283
3,115,271
335,116
28,418,186
937,044
-
-
-
-
92,024,900
20. CONTINGENCIES AND COMMITMENTS
20.1 Contingencies
There is no significant change in the contigencies since the date of preceding pusblished annual financail
statements.
20.2 Commitments:
Guarantees issued by the financial institutions on behalf of the Company amount to Rs. 154.62 (2016: Rs.
199.9) million.
Commitments include capital commitments for construction of building of the Company amounting to Rs.
29.03 (2016: 427.60) million.

20 Systems Limited Interim Financial Reprot 21
2017 2016
Unallocated income and expenses:
Rupees Rupees
Other operating expenses (46,232,319) -
Other income 47,049,402 23,589,770
Finance cost (5,115,685) (2,345,567)
(4,298,602) 21,244,203
Profit before taxation 371,249,145 395,608,245
Taxation (7,890,289) (6,900,000)
Profit for the year 363,358,856 388,708,245
Un-audited Audited
30 September 31 December
2017 2016
17. TRADE AND OTHER PAYABLES
Creditors
14,752,641
Advance from customers
3,759,560
Retention Money
11,604,035
Accrued liabilities
152,684,704
Withholding income tax payable
6,913,335
Provident fund payable
10,345,091
Provision for Worker's Welfare Fund
17,930,514
Sales tax payable 5,007,552
Unclaimed dividend 3,691,694
226,689,126
Rupees
Rupees
16. LONG TERM ADVANCES
This represents advances received from staff and will be adjusted as per Company's car policy against sale
of vehicles.
18. SHORT TERM BORROWINGS
This represents export running finance ERF II facility obtained from Habib Bank Limited. The facility has a
limit of Rs. 150 million for working capital requirement and carries interest rate at State Bank of Pakistan
(SBP) rate for ERF + 1% per annum. The facility is mainly secured alongwith letter of guarantee facility of Rs.
150 million by way of first charge over present and future current and fixed assets of the Company and
collateral of land and building to the effect of Rs. 400 million each.
19. OPERATING SEGMENT INFORMATION
Geographical segments
For management purposes, the Systems Limited is organized into business units based on their
geographical areas and has three reportable operating segments as follows:
North America
Middle East
Pakistan
No other operating segments have been aggregated to form the above reportable operating segments.
Management monitors the operating results of its operating segments separately for the purpose of
performance assessment. Segment performance is evaluated based on operating profit or loss and is
measured consistently with operating profit or loss in the consolidated financial statements.
Transfer prices between operating segments are on arm's length basis in a manner similar to transactions
with third parties.
2017 2016
Sales 1,398,792,914 1,255,721,259
260,699,637
224,867,081
394,515,036 517,837,189 2,054,007,587 1,998,425,529
Cost of sales (807,306,373) (721,652,844)
(251,105,061) (205,936,414)
(333,549,273) (481,316,295) (1,391,960,707) (1,408,905,553)
Gross profit 591,486,541
534,068,415
9,594,576
18,930,667
60,965,763 36,520,894 662,046,880 589,519,976
Distribution expenses (2,747,310)
(1,751,818)
(56,201,874) (1,758,123)
(21,833,591) (25,288,380) (80,782,775) (28,798,321)
Research and development expenses -
(457,171)
-
(624,831)
- (699,588) - (1,781,590)
Administrative expenses (149,679,354)
(129,002,169) (27,671,700)
(23,026,001)
(28,365,304) (32,547,853) (205,716,358) (184,576,023)
(152,426,664) (131,211,158) (83,873,574) (25,408,955)
(50,198,895) (58,535,821) (286,499,133) (215,155,934)
Profit / (loss) before taxation and
Unallocated income and expenses 439,059,877
402,857,257
(74,278,998)
(6,478,288)
10,766,868 (22,014,927) 375,547,747 374,364,042
Un-audited
Nine Months Ended
30 September
Nine Months Ended
30 September
Un-audited
Nine Months Ended
30 September
Rupees
North America Middle East Pakistan Total
Un-audited
Nine Months Ended
30 September
Un-audited
Rupees
2017 2016
RupeesRupees
2017 2016
RupeesRupees
2017 2016
RupeesRupees
59,219,283
3,115,271
335,116
28,418,186
937,044
-
-
-
-
92,024,900
20. CONTINGENCIES AND COMMITMENTS
20.1 Contingencies
There is no significant change in the contigencies since the date of preceding pusblished annual financail
statements.
20.2 Commitments:
Guarantees issued by the financial institutions on behalf of the Company amount to Rs. 154.62 (2016: Rs.
199.9) million.
Commitments include capital commitments for construction of building of the Company amounting to Rs.
29.03 (2016: 427.60) million.

22 Systems Limited Interim Financial Reprot 23
OTHER OPERATING EXPENSES
Provison for doubtful debts
Unbilled and bad debt written-o�
EARNINGS PER SHARE
Basic earnings per share
Profit for the period
Weighted-average number of ordinary shares
outstanding during the period
Basic - in Rupees
Diluted earnings per share
Profit for the period
Weighted-average number of rdinary
shares (basic)
E�ect of share options
Diluted - in Rupees
Un-audited Un-audited
30 September 30 September
2017 2016
21.
-
-
840,484
45,391,835
46,232,319
-
22.
Rupees
136,164,713
111,040,049
1.23
136,164,713
111,040,049
1,217,883
112,257,932
1.21
30 September
2017
30 September
122,280,349
111,827,652
1.09
122,280,349
111,827,652
257,775
112,085,427
1.09
2016
363,358,856
111,553,234
3.26
363,358,856
111,553,234
225,916
111,779,150
3.25
388,708,245
111,040,049
3.50
388,708,245
111,040,049
1,217,883
112,257,932
3.46
Three Month EndedNine Month Ended
30 September
2017
30 September
2016
Rupees
Related party Relationship
2017 2016
Subsidiary 43,032,417
28,200,000
Interest income 2,502,619 1,994,204
45,535,036 30,194,204
Sales 232,146,404
153,554,148
Payment for
expenses17,715,753
3,902,155
249,862,157 157,456,303
Sales 1,367,396,987
1,229,725,655
Payment for
expenses - Net5,314,298
19,858,009
1,372,711,285 1,249,583,664
Provident fund Employee benefit plan Contributions 56,029,306 54,276,071
Tech Vista Systems FZ - LLC
Visionet Systems Incorporation
E Processing Systems (Pvt.) Ltd.
Common directorship
30 SeptemberNature of
transactions
Un-audited
Rupees
Nine Months Ended
Payment for expenses
Subsidiary
Rupees
23. TRANSACTIONS WITH RELATED PARTIES
Related parties comprises of associated companies, staff retirement fund, directors and key management
personnel. Transactions with related parties other than remuneration and benefits to key management
personnel under the terms of their employment, are as follows:

24 Systems Limited Interim Financial Reprot 25
24. CASH FLOWS FROM OPERATING ACTIVITIES
Profit before taxation 395,608,245
Adjustments for:
Depreciation on property and equipment 53,716,134
Amortization of intangibles 14,066,091
Provision for bad debts (2,029,520)
Bad debts - written o� -
Share based payment expense 7,377,627
Finance costs 2,345,567
Profit on bank deposits (6,272,203)
Gain on short term investments (10,047,661)
Gain on disposal of property and equipment (3,941,641)
55,214,394
Profit before working capital changes 450,822,639
E�ect on cash flow due to working capital changes
(Increase) / decrease in current assets:
Unbilled revenue - net (33,515,422)
Trade debts (80,320,340)
Advances (40,202,342)
Trade deposits and short term prepayments (45,665,114)
Interest accrued -
Other receivables (104,940,940)
(304,644,158)
(Decrease) / increase in current liabilities:
Trade and other payables (141,520,523)
Unearned revenue (109,811,070)
(251,331,593)
Net cash generated from / (used in) operations (105,153,112)
371,249,145
50,602,387
18,681,675
840,484
45,391,835
15,149,810
5,115,685
(1,993,118)
(7,976,924)
(7,599,237)
118,212,597
489,461,742
(242,793,098)
177,519,012
(25,947,303)
(3,814,214)
(4,457,010)
(66,062,468)
(165,555,081)
(129,656,674)
(2,232,001)
(297,443,756)
192,017,986
2017 2016
30 September
Un-audited
Nine Months Ended
Rupees Rupees
25. FINANCIAL RISK MANAGEMENT
25.1 Financial risk factors
There is no change in the company's objectives, policies, procedures for measuring and managing the
financial risks including capital management risk, since the preceding annual financial year ended 31
December 2016.
25.2 Fair values of financial assets and liabilities
The carrying values of all financial assets and liabilities reflected in financial statements approximate to
their fair values. Fair value is determined on the basis of objective evidence at each reporting date.
Accordingly, detailed disclosure with reference to fair value has not been given in this condensed interim
financial information.
Fair value hierarchy
The Company uses the following hierarchy for determining and disclosing the fair value of financial
instruments by valuation technique:
Level 1: quoted (unadjusted) prices in active markets for identical assets or liabilities
Level 2: other techniques for which all inputs which have a significant effect on the recorded fair value are
observable either, directly or indirectly
Level 3: techniques which use inputs that have a significant effect on the recorded fair value that are not
based on observable market data
- There were no financial assets and liabilities measured at fair value as at 30 September 2017.
- During the nine month period ended 30 September 2017, there were no transfers between Level 1 and Level
2 fair value measurements.
- There were no financial assets and liabilities measured at fair value as at 31 December 2016.
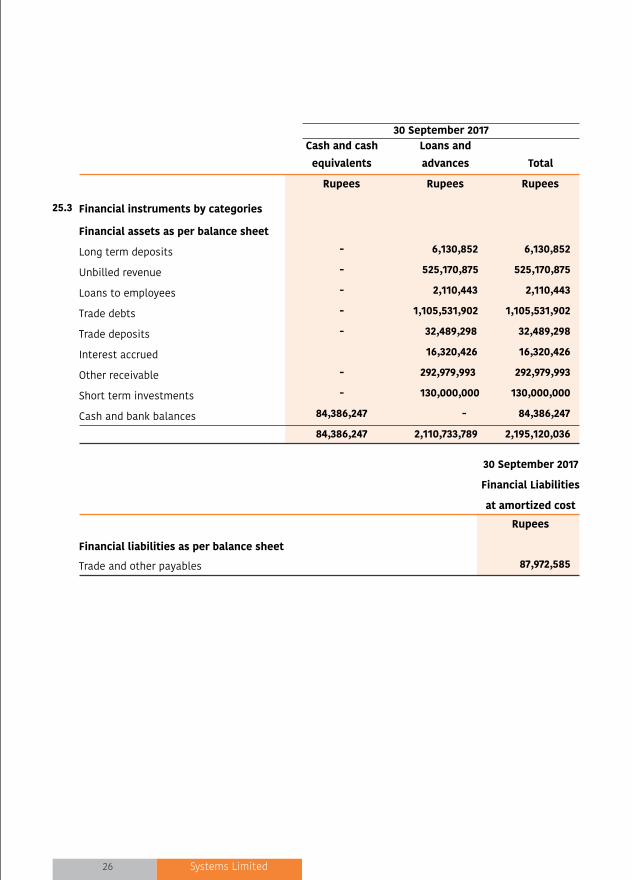
26 Systems Limited
31 December 2016
Rupees
31 December 2016
Financial Liabilities
at amortized cost
Long term deposits
Unbilled revenue
Loans to employees
Trade debts
Trade deposits
Interest accrued
Other receivables
Short term investments
Cash and bank balances
Financial liabilities as per balance sheet
Trade and other payables 182,733,074
Financial assets as per balance sheet
Cash and cash
equivalents
Loans and
advances Total
- 6,130,852 6,130,852
- 320,894,130 320,894,130
- 2,160,096 2,160,096
- 1,290,766,880 1,290,766,880
- 32,693,991 32,693,991
- 11,863,416 11,863,416
- 226,917,525 226,917,525
- 253,000,000 253,000,000
183,200,188 - 183,200,188
183,200,188 2,144,426,890 2,327,627,078
RupeesRupeesRupees
25.3 Financial instruments by categories
Financial assets as per balance sheet
Long term deposits
Unbilled revenue
Loans to employees
Trade debts
Trade deposits
Interest accrued
Other receivable
Short term investments
Cash and bank balances
Financial liabilities as per balance sheet
Trade and other payables
Interim Financial Reprot 27
Cash and cash
equivalents
Loans and
advances Total
-
6,130,852
6,130,852
-
525,170,875
525,170,875
-
2,110,443
2,110,443
-
1,105,531,902
1,105,531,902
-
32,489,298
32,489,298
16,320,426
16,320,426
-
292,979,993
292,979,993
-
130,000,000
130,000,000
84,386,247
-
84,386,247
84,386,247
2,110,733,789
2,195,120,036
Rupees
30 September 2017
Financial Liabilities
at amortized cost
87,972,585
30 September 2017
Rupees Rupees Rupees
26. DATE OF AUTHORIZATION FOR ISSUE
This condensed interim financial information was authorized for issue on 24 October 2017 by the Board of
Directors of the Company.
27. CORRESPONDING FIGURES
Corresponding figures have been re-arranged or re-classified where necessary for the purpose of
comparison, however no significant re-classification or re-arrangements have been made in this
condensed interim financial information.
28. GENERAL
28.1 Figures have been rounded off to the nearest rupees, unless otherwise stated.

Condensed Interim
Consolidated Financial Information
AEZAZ HUSSAIN
Chairman
ASIF PEER
Chief Executive
MUHAMMAD KHURRAM IQABL
Chief Financial Officer
31 December
2016
Reclassification from component Reclassification to component
Rupees
Trade Debtor Tax refunds due from the Government 6,593,361
28.2 Corresponding figures have been rearranged or reclassified, wherever necessary, for the purpose of
comparison. However, no significant reclassification has been made in these financial statements except
for the following in order to comply with requirements of International Financial Reporting Standards:
28 Systems Limited

CONDENSED INTERIM CONSOLIDATED BALANCE SHEET
30 Systems Limited
as at 30 September 2017
AEZAZ HUSSAIN
Chairman
ASIF PEER
Chief Executive
Interim Financial Reprot 31
EQUITY AND LIABILITIES
Share capital and reserves
Authorized share capital
200,000,000 (2016: 150,000,000) ordinary shares of Rs. 10 each 1,500,000,000
Issued, subscribed and paid up share capital 14 1,110,784,920
Capital and reserve 460,774,513
Unappropriated profit 1,244,108,681
Total shareholders' equity 2,815,668,114
Non-controlling interest (15,568,020)
2,800,100,094
Non-current liabilities
Convertible loan -
Liabilities against asset subject to finance lease -
Long term advances 15 10,910,791
Provision for gratuity 4,009,766
14,920,557
Current liabilities
Trade and other payables 16 271,567,025
Short term borrowings 17 -
Unearned revenue 14,387,586
Current portion of liabilities against asset subject to finance lease -
Current portion of long term advances 6,109,697
Total current liabilities 292,064,308
TOTAL EQUITY & LIABILITIES 3,107,084,959
Contingencies and commitments 19 -
The annexed notes from 1 to 27 form an integral part of this condensed interim financial information.
6 837,897,755
571,175,127 7 139,612,103
118,945,145
9,136,852
9,136,852
25,276,863
25,276,863
1,011,923,573
724,533,987
354,263,368
393,659,781
8 1,186,039,428
1,108,405,149
9 57,106,053
33,871,434
10 120,981,552
67,903,663
4,228,733
2,274,342
11 148,553,864 150,344,859 12 130,000,000 253,000,000
141,104,241 98,958,341
13 277,385,916 274,133,403
2,419,663,155 2,382,550,972
ASSETS
Non-current assets
Property and equipment
Intangible assets
Long term deposits
Deferred taxation
Total non-current assets
Current assets
Unbilled revenue
Trade debts
Advances
Trade deposits and short term prepayments
Interest accrued
Other receivables
Short term investments
Tax refunds due from the Government
Cash and bank balances
Total current assets
MUHAMMAD KHURRAM IQABL
Chief Financial Officer
Audited
Note Rupees
31 December
2016
TOTAL ASSETS 3,431,586,728 3,107,084,959
Un-audited Audited
Note Rupees Rupees
30 September
2017
31 December
2016
2,000,000,000
1,118,276,520
483,782,367
1,491,516,282
3,093,575,169
(26,337,192)
3,067,237,977
10,423,914
9,270,379
10,978,526
7,074,823
37,747,642
158,500,441
150,000,000
12,155,585
3,721,121
2,223,962
326,601,109
3,431,586,728
-
Un-audited
Rupees
30 September
2017

CONDENSED INTERIM CONSOLIDATED PROFIT AND LOSS ACCOUNT
32 Systems Limited
AEZAZ HUSSAIN
Chairman
ASIF PEER
Chief Executive
MUHAMMAD KHURRAM IQABL
Chief Financial Officer
CONDENSED INTERIM CONSOLIDATED STATEMENT OF COMPREHENSIVE INCOME
Interim Financial Reprot 33
Revenue - net
Cost of sales
Gross profit
Distribution cost
Administrative expenses
Research & development expenses
Operating profit
Other income
Other operating expenses
Finance cost
Profit before taxation
Taxation
Profit after taxation
Attributable to:
Equity holders of the parent
Non-controlling interest
Earnings per share:
Basic earnings per share
Diluted earnings per share
The annexed notes from 1 to 27 form an integral part of this condensed interim financial information.
AEZAZ HUSSAIN
Chairman
ASIF PEER
Chief Executive
MUHAMMAD KHURRAM IQABL
Chief Financial Officer
for the nine and three months ended 30 September 2017 for the nine months ended 30 September 2017
30 September
2017
30 September
2016
30 September
2017
30 September
2016
Un-audited Un-audited Un-audited Un-audited
Rupees Rupees Rupees Rupees
2,666,502,392 2,347,779,685 984,102,543 785,102,440
1,883,678,717 1,697,126,959 698,406,751 561,978,393
782,823,675 650,652,726 285,695,792 223,124,047
62,846,211 81,498,248 20,164,711 21,085,712
256,599,072 213,839,730 95,367,860 67,201,847
- 1,781,591 - -
319,445,283 297,119,569 115,532,571 88,287,559
463,378,392 353,533,157 170,163,221 134,836,488
43,440,116 21,733,501 13,419,047 7,163,386
506,818,508 375,266,658 183,582,268 141,999,874
46,232,319 - 9,157,762 -
7,383,565 3,758,204 4,548,544 1,981,232
453,202,624 371,508,454 169,875,962 140,018,642
8,786,982 6,900,000 3,064,684 4,927,587
444,415,642 364,608,454 166,811,278 135,091,055
451,634,493 367,262,716 169,372,315 135,713,048
(7,218,851) (2,654,262) (2,561,037) (621,993)
444,415,642 364,608,454 166,811,278 135,091,055
4.05 3.31 1.51 1.22
4.04 3.27 1.51 1.21
Note
20
21
21
Three Months EndedNine Month Ended
30 September
2017
30 September
2016
Un-audited Un-audited
Rupees Rupees
Profit for the period 444,415,642
364,608,454
Other comprehensive income
Exchange di�erence on transaltion of foreign operations 260,755
144,261
Total comprehensive income for the period 444,676,397
364,752,715
Attributable to:
Equity holders of the parent 451,895,248
367,406,977
Non-controlling interest (7,218,851)
(2,654,262)
444,676,397 364,752,715
The annexed notes from 1 to 27 form an integral part of this condensed interim financial information.
Nine Month Ended

CONDENSED INTERIM CONSOLIDATED CASH FLOW STATEMENT
34 Systems Limited
AEZAZ HUSSAIN
Chairman
ASIF PEER
Chief Executive
MUHAMMAD KHURRAM IQABL
Chief Financial Officer CO
ND
EN
SE
D I
NTE
RIM
CO
NS
OLI
DA
TED
STA
TEM
EN
T O
F C
HA
NG
ES
IN
EQ
UIT
Y
Interim Financial Reprot 35
AE
ZA
Z H
US
SA
IN
Chair
man
AS
IF P
EE
R
Chie
f Exe
cuti
ve
MU
HA
MM
AD
KH
UR
RA
M I
QA
BL
Chie
f Fi
nanci
al O
ffic
er
for the nine months ended 30 September 2017
for
the n
ine m
onth
s ended 3
0 S
epte
mber
2017
CASH FLOWS FROM OPERATING ACTIVITIES
Net cash flows from/(used in) operations
Finance costs paid
Gratuity paid
Taxes paid
Net cash flows from/(used in) operating activities
CASH FLOWS FROM INVESTING ACTIVITIES
Purchase of property and equipment
Development expenditure
Proceeds from the disposal of property and equipment
Increase in long term deposits
Purchase / (disposal) of short term investments - net
Profit received on short term investment
Profit received on bank deposits
Net cash flows used in/from investing activities
CASH FLOWS FROM FINANCING ACTIVITIES
Proceeds from exercise of share options
Proceeds from issue of shares
Increase in short term borrowings
Increase in liabilities agianst asset subject to finance lease
Proceeds from convertible loan
Dividend paid
Increase / (decrease) in long term advances
Net cash flows used in financing activities
Net (decrease) in cash and cash equivalents
E�ect of exchange translation reserve
Cash and cash equivalents at 1st January
Cash and cash equivalents at 30 September
The annexed notes from 1 to 27 form an integral part of this condensed interim financial information.
Note
23
30 September
2017
30 September
2016
Un-audited Un-audited
Rupees Rupees
301,913,735
(24,617,575)
(5,115,685)
(3,758,204)
(473,110)
(920,585)
(48,450,380)
(41,785,137)
(54,039,175)
(46,463,926)
247,874,560
(71,081,501)
(329,628,562) (138,572,722)
(41,911,078)
(39,975,309)
16,397,301
9,878,321
- (3,358,053)
130,976,924
396,236,000
- -
1,993,118
6,279,414
(222,172,297) 230,487,651
15,088,889
15,297,522
222,220
-
150,000,000
-
-
-
12,991,500
10,423,914
(207,999,433) (138,848,114)
(3,818,000) 3,147,877
(23,090,910) (120,402,715)
2,611,353 39,003,435
641,160 144,261
274,133,403 193,593,856
277,385,916 232,741,552
Re
ve
nu
e r
ese
rve
Bala
nce
as
at
31 D
ece
mber
2015
(A
udit
ed)
1,10
6,8
08,7
60
411,
302,
586
9,25
5,4
67
33,0
82
895
,921
,042
2,42
3,32
0,9
37
(9,7
46,7
36)
2,41
3,574
,201
Share
s is
sued u
nder
em
plo
yees
share
opti
on s
chem
e3,
976,1
60
11,3
21,3
62
-
15,2
97,5
22
-15
,297
,522
Adju
stm
ent
ot
em
plo
yee c
om
pensa
tion r
ese
rve
-
-
7,37
7,627
-
7,37
7,627
-7,
377,
627
Cash
div
idend
-
-
-
(138
,848
,114
)
(138
,848
,114
)
-(1
38,8
48,1
14)
Tota
l co
mpre
hensi
ve i
nco
me f
or
the p
eri
od
-
-
-
144,
261
367,
262,
716
367,
406,9
77
(2,6
54,
262)
364,
752,
715
Bala
nce
as
at
30 S
epte
mber
2016
(U
n-a
udit
ed)
1,11
0,7
84,
920
422,
623
,948
16,6
33,0
94
177,
343
1,12
4,33
5,6
44
2,674
,554,
949
(12,
400,9
98)
2,662,
153,
951
Bala
nce
as
at
31 D
ece
mber
2016
(A
udit
ed)
1,11
0,7
84,
920
422,
623
,948
38,4
67,
279
(316
,714
)
1,24
4,10
8,6
81
2,815
,668,1
14
(15,5
68,0
20)
2,800,1
00,0
94
Transf
er
from
com
pensa
tion r
ese
rve t
o s
hare
pre
miu
m r
ese
rve
-
43,0
68,4
02
(43,
068,4
02)
-
-
-
--
Share
iss
ued a
gain
st E
mplo
yees'
Share
Opti
on S
chem
e7,
491,
600
7,597
,289
-
-
-
15,0
88,8
89
-15
,088,8
89
Share
base
d p
aym
ents
-
-
15,1
49,8
10
-
-
15,1
49,8
10
-15
,149
,810
Share
iss
ued t
o N
CI again
st c
ash
-
-
-
-
-
-
222,
220
222,
220
Adju
stm
en o
n a
ccount
of
issu
e o
f sh
are
s to
NCI
-
-
-
3,77
2,541
3,77
2,541
(3,7
72,5
41)
-
Final div
idend @
Rs.
1.8
6 p
er
share
for
the y
ear
ended 3
1 D
ece
mber
2016
-
-
-
-
(207,
999,
433)
(207,
999,
433)
-(2
07,
999,
433)
Tota
l co
mpre
hensi
ve i
nco
me f
or
the p
eri
od
-
-
-
-
451,
634
,493
451,
634
,493
(7,2
18,8
51)
444,
415,6
42
Oth
er
com
pre
hensi
ve i
nco
me f
or
the p
eri
od
-
-
-
260,7
55
-
260,7
55
-26
0,7
55
Bala
nce
as
at
30
Se
pte
mb
er
20
17 -
(U
n-a
ud
ite
d)
1,11
8,2
76,5
20
473
,28
9,6
39
10,5
48
,68
7
(55,9
59)
1,491,
516
,282
3,0
93,5
75,1
69
(26,3
37,
192)
3,0
67,
237,
977
The a
nnexe
d n
ote
s fr
om
1 t
o 2
7 fo
rm a
n i
nte
gra
l part
of
this
condense
d i
nte
rim
financi
al in
form
ati
on.
Ru
pe
es
Issu
ed
,
sub
scri
be
d
an
d p
aid
up
share
cap
ital
Cap
ital
rese
rve
To
tal
eq
uit
y a
ttri
bu
tab
le
to s
hare
ho
lde
rs o
f p
are
nt
com
pan
y
No
n-c
on
tro
llin
g
inte
rest
T
ota
l
Sh
are
cap
ital
pre
miu
m
Em
plo
ye
e
com
pe
nsa
tio
n
rese
rve
Fo
reig
n c
urr
en
cy
tran
salt
ion
re
serv
e
Un
ap
pro
pri
ate
d
pro
fit
Ru
pe
es
Ru
pe
es
Ru
pe
es
Ru
pe
es
Ru
pe
es
Ru
pe
es
Ru
pe
es

CONDENSED INTERIM CONSOLIDATED CASH FLOW STATEMENT
34 Systems Limited
AEZAZ HUSSAIN
Chairman
ASIF PEER
Chief Executive
MUHAMMAD KHURRAM IQABL
Chief Financial Officer CO
ND
EN
SE
D I
NTE
RIM
CO
NS
OLI
DA
TED
STA
TEM
EN
T O
F C
HA
NG
ES
IN
EQ
UIT
Y
Interim Financial Reprot 35
AE
ZA
Z H
US
SA
IN
Chair
man
AS
IF P
EE
R
Chie
f Exe
cuti
ve
MU
HA
MM
AD
KH
UR
RA
M I
QA
BL
Chie
f Fi
nanci
al O
ffic
er
for the nine months ended 30 September 2017fo
r th
e n
ine m
onth
s ended 3
0 S
epte
mber
2017
CASH FLOWS FROM OPERATING ACTIVITIES
Net cash flows from/(used in) operations
Finance costs paid
Gratuity paid
Taxes paid
Net cash flows from/(used in) operating activities
CASH FLOWS FROM INVESTING ACTIVITIES
Purchase of property and equipment
Development expenditure
Proceeds from the disposal of property and equipment
Increase in long term deposits
Purchase / (disposal) of short term investments - net
Profit received on short term investment
Profit received on bank deposits
Net cash flows used in/from investing activities
CASH FLOWS FROM FINANCING ACTIVITIES
Proceeds from exercise of share options
Proceeds from issue of shares
Increase in short term borrowings
Increase in liabilities agianst asset subject to finance lease
Proceeds from convertible loan
Dividend paid
Increase / (decrease) in long term advances
Net cash flows used in financing activities
Net (decrease) in cash and cash equivalents
E�ect of exchange translation reserve
Cash and cash equivalents at 1st January
Cash and cash equivalents at 30 September
The annexed notes from 1 to 27 form an integral part of this condensed interim financial information.
Note
23
30 September
2017
30 September
2016
Un-audited Un-audited
Rupees Rupees
301,913,735
(24,617,575)
(5,115,685)
(3,758,204)
(473,110)
(920,585)
(48,450,380)
(41,785,137)
(54,039,175)
(46,463,926)
247,874,560
(71,081,501)
(329,628,562) (138,572,722)
(41,911,078)
(39,975,309)
16,397,301
9,878,321
- (3,358,053)
130,976,924
396,236,000
- -
1,993,118
6,279,414
(222,172,297) 230,487,651
15,088,889
15,297,522
222,220
-
150,000,000
-
-
-
12,991,500
10,423,914
(207,999,433) (138,848,114)
(3,818,000) 3,147,877
(23,090,910) (120,402,715)
2,611,353 39,003,435
641,160 144,261
274,133,403 193,593,856
277,385,916 232,741,552
Re
ve
nu
e r
ese
rve
Bala
nce
as
at
31 D
ece
mber
2015
(A
udit
ed)
1,10
6,8
08,7
60
411,
302,
586
9,25
5,4
67
33,0
82
895
,921
,042
2,42
3,32
0,9
37
(9,7
46,7
36)
2,41
3,574
,201
Share
s is
sued u
nder
em
plo
yees
share
opti
on s
chem
e3,
976,1
60
11,3
21,3
62
-
15,2
97,5
22
-15
,297
,522
Adju
stm
ent
ot
em
plo
yee c
om
pensa
tion r
ese
rve
-
-
7,37
7,627
-
7,37
7,627
-7,
377,
627
Cash
div
idend
-
-
-
(138
,848
,114
)
(138
,848
,114
)
-(1
38,8
48,1
14)
Tota
l co
mpre
hensi
ve i
nco
me f
or
the p
eri
od
-
-
-
144,
261
367,
262,
716
367,
406,9
77
(2,6
54,
262)
364,
752,
715
Bala
nce
as
at
30 S
epte
mber
2016
(U
n-a
udit
ed)
1,11
0,7
84,
920
422,
623
,948
16,6
33,0
94
177,
343
1,12
4,33
5,6
44
2,674
,554,
949
(12,
400,9
98)
2,662,
153,
951
Bala
nce
as
at
31 D
ece
mber
2016
(A
udit
ed)
1,11
0,7
84,
920
422,
623
,948
38,4
67,
279
(316
,714
)
1,24
4,10
8,6
81
2,815
,668,1
14
(15,5
68,0
20)
2,800,1
00,0
94
Transf
er
from
com
pensa
tion r
ese
rve t
o s
hare
pre
miu
m r
ese
rve
-
43,0
68,4
02
(43,
068,4
02)
-
-
-
--
Share
iss
ued a
gain
st E
mplo
yees'
Share
Opti
on S
chem
e7,
491,
600
7,597
,289
-
-
-
15,0
88,8
89
-15
,088,8
89
Share
base
d p
aym
ents
-
-
15,1
49,8
10
-
-
15,1
49,8
10
-15
,149
,810
Share
iss
ued t
o N
CI again
st c
ash
-
-
-
-
-
-
222,
220
222,
220
Adju
stm
en o
n a
ccount
of
issu
e o
f sh
are
s to
NCI
-
-
-
3,77
2,541
3,77
2,541
(3,7
72,5
41)
-
Final div
idend @
Rs.
1.8
6 p
er
share
for
the y
ear
ended 3
1 D
ece
mber
2016
-
-
-
-
(207,
999,
433)
(207,
999,
433)
-(2
07,
999,
433)
Tota
l co
mpre
hensi
ve i
nco
me f
or
the p
eri
od
-
-
-
-
451,
634
,493
451,
634
,493
(7,2
18,8
51)
444,
415,6
42
Oth
er
com
pre
hensi
ve i
nco
me f
or
the p
eri
od
-
-
-
260,7
55
-
260,7
55
-26
0,7
55
Bala
nce
as
at
30
Se
pte
mb
er
20
17 -
(U
n-a
ud
ite
d)
1,11
8,2
76,5
20
473
,28
9,6
39
10,5
48
,68
7
(55,9
59)
1,491,
516
,282
3,0
93,5
75,1
69
(26,3
37,
192)
3,0
67,
237,
977
The a
nnexe
d n
ote
s fr
om
1 t
o 2
7 fo
rm a
n i
nte
gra
l part
of
this
condense
d i
nte
rim
financi
al in
form
ati
on.
Ru
pe
es
Issu
ed
,
sub
scri
be
d
an
d p
aid
up
share
cap
ital
Cap
ital
rese
rve
To
tal
eq
uit
y a
ttri
bu
tab
le
to s
hare
ho
lde
rs o
f p
are
nt
com
pan
y
No
n-c
on
tro
llin
g
inte
rest
T
ota
l
Sh
are
cap
ital
pre
miu
m
Em
plo
ye
e
com
pe
nsa
tio
n
rese
rve
Fo
reig
n c
urr
en
cy
tran
salt
ion
re
serv
e
Un
ap
pro
pri
ate
d
pro
fit
Ru
pe
es
Ru
pe
es
Ru
pe
es
Ru
pe
es
Ru
pe
es
Ru
pe
es
Ru
pe
es

SELECTED NOTES TO THE CONDENSED INTERIM CONSOLIDATED FINANCIAL INFORMATION
36 Systems Limited
1. THE GROUP AND ITS OPERATIONS
Holding company
Systems Limited (the Company) is a public limited company incorporated in Pakistan under the Companies
Ordinance 1984, and is listed on the Pakistan Stock Exchange (formerly Karachi, Islamabad and Lahore
Stock Exchanges). The Company is principally engaged in the business of software development, trading of
software and business process outsourcing services. The head office of the Company is situated at E-1,
Sehjpal Road, Near DHA Phase VIII (Ex-Air Avenue), Lahore Cantt.
Subsidiary company
TechVista Systems FZ - LLC, a limited liability company incorporated in Dubai Technology and Media Free
Zone Authority, is a 100% owned subsidiary of Systems Limited. The Company is engaged in the business of
developing software and providing ancillary services.
E-Processing Systems (Private) Limited, a private limited company registered under Companies Ordinance,
1984 incorporated on 06 February 2013, is a 63% owned subsidiary of Systems Limited. The Company is
principally engaged in the business of purchase and sale of airtime and related services.
2. STATEMENT OF COMPLIANCE
2.1 During the year, the Companies Act, 2017 (the Act) has been promulgated with effect from 30 May 2017.
However, Securities and Exchange Commission of Pakistan vide its circulars no.17 and 23 of 2017 dated July
20, 2017 and October 04, 2017 respectively communicated that the companies whose financial year closes
on or before December 31, 2017 shall prepare their financial statements in accordance with the provisions
of the repealed Companies Ordinance, 1984.
2.2 Accordingly, these consolidated condensed interim financial information of the Group for the nine months
period ended 30 September 2017 has been prepared in accordance with the requirements of the
International Accounting Standard 34 - Interim Financial Reporting as are notified under the repealed
Companies Ordinance, 1984, provisions of and directives issued under the repealed Companies
Ordinance,1984. In case requirements differ, the provisions or directives of the repealed Companies
Ordinance, 1984 shall prevail.
2.3 This consolidated condensed interim financial information is un-audited and is being submitted to
shareholders, as required by section 245 of the Companies ordinance, 1984.
3 BASIS OF PREPARATION
This condensed interim consolidated financial information is not audited and has been prepared in
condensed form and does not include all the information as is required to be provided in full set of annual
financial statements. This condensed interim consolidated financial information should be read in
conjunction with the audited financial statements of the Group for the year ended 31 December 2016.
3.2 Consolidated financial satements
This condensed interim consolidated financial information comprises the financial information of Systems
Limited and its subsidiaries, here-in-after referred to as "the Group".
3.2 Basis of measurement
This condensed interim consolidated financial information has been prepared under the historical cost
convention.
Interim Financial Reprot 37
Opening balance - net book value
Additions during the period/ year - cost 6.1
Less:
Disposals - net book value 6.2
Depreciation during the period / year
Closing balance - net book value
571,233,100
329,629,994
900,863,094
8,798,064
54,167,275
837,897,755
362,703,298
294,443,247
657,146,545
10,606,471
75,364,947
571,175,127
4 ACCOUNTING POLICIES
The accounting policies adopted for the preparation of this condensed interim consoidated financial
information are the same as those applied in the preparation of the preceding annual published financial
statements of the Group for the year ended 31 December 2016 except as follows:
The Group has adopted the following standards and amendment to IFRSs which became effective for the
current period:
IFRS 7-Financial Instruments: Disclosures - Disclosure Initiative - (Amendment)
IAS 12 -Income Taxes – Recognition of Deferred Tax Assets for Unrealized losses (Amendments)
The adoption of the above amendment to accounting standards did not have any material effect on the
condensed interim financial information.
5 ACCOUNTING ESTIMATES AND JUDGMENTS
The preparation of condensed interim financial information requires management to make judgments,
estimates and assumptions that affect the application of accounting policies and reported amount of
assets and liabilities, incomes and expenses. Actual results may differ from these estimates. The
significant judgments made by management in applying the Group's accounting policies and the key
sources of estimation are the same as those that applied to the financial statements for the year ended 31
December 2016.
for the nine months ended 30 September 2017
6. PRPOERTY AND EQUIPMENT
Un-audited Audited
30 September 31 December
Note 2017 2016
Rupees Rupees

38 Systems Limited
Interim Financial Reprot 39
9.
2,110,443 4,872,781
20,428,659 20,605,250
22,539,102 25,478,031
ADVANCES
Advances- considered good
against salary
against expenses
To suppliers-against goods 34,566,951 8,393,403
57,106,053 33,871,434
8.
8.1 578,642,929
614,271,981
1,192,914,910
10,442,367
(10,442,367) -
TRADE DEBTS
Considered good - unsecured
Export
Local
Considered doubtful - unsecured
Local
Less: Provision for doubtful debts
Less: Written o� (6,875,482)
1,186,039,428
83,233,400
56,349,585
139,582,985
20,637,840
118,945,145
Opening Balance - net book value
Additions during the period / year
Less:
Amortization during the period / year
Closing Balance - net book value
118,945,145
41,911,078
160,856,223
21,244,120
139,612,103
Computers 19,504,580 22,133,397
Computer equipment and installations 7,011,032 4,407,210
Other equipment and installations 772,645 1,170,889
Furniture and fittings 562,500 2,611,883
O�ce equipment 2,171,578 5,569,666
Vehicles 15,025,500 41,289,116
Project assets - 1,353,000
Mobile sets - 991,774
Leased assets 12,616,500 -
Capital work in progress 271,965,659 214,916,312
329,629,994 294,443,247
6.1 Additions during the period/year-cost
Un-audited Audited
30 September 31 December
2017 2016
Rupees Rupees
6.2 Disposals during
Computers
Vehicles
31 December 2016
Computers
Computer equipment and installations
Other equipment and installations
Generator
Furniture and fittings
Vehicles
O�ce equipment
Project assets
Mobile sets
23,161,593
4,252,261
1,213,226
226,267
2,171,557
10,910,334
510,000
40,543
106,157
42,591,938
Accumulated
Depreciation
672,577
14,167
106,667
133,233
-
9,646,494
-
-
33,333
10,606,471
Written Down
Value
23,834,170
4,266,428
1,319,893
359,500
2,171,557
20,556,828
510,000
40,543
139,490
53,198,409
Cost
Rupees Rupees Rupees
564,099
8,233,965
8,798,064
30 September 2017
2,247,909
11,254,943
13,502,852
2,812,008
19,488,908
22,300,916
INTANGIBLES ASSETS 7.
Un-audited Audited
30 September 31 December
2017 2016
Rupees Rupees
Note
855,144,096
268,806,949
1,123,951,045
20,114,301
(20,114,301)
(15,545,896)
1,108,405,149
8.1 This includes receivable from related parties i.e. Visionet Systems Incorporation amounting to Rs. 538.40
million (2016: Rs 664.40 million).
Un-audited Audited
30 September 31 December
2017 2016
Rupees Rupees

40 Systems Limited
Interim Financial Reprot 41
14.1 Reconciliation of issued, subscribed and paid-up share capital:
22,226,927
22,226,927
222,269,270 222,269,270
89,600,725
88,851,565
896,007,250 888,515,650
111,827,652
111,078,492
1,118,276,520 1,110,784,920
Ordinary shares of Rs. 10/- each
fully paid up as bonus shares
Ordinary shares of Rs. 10/- each fully
paid in cash
30 September
2017
31 December
2016
30 September
2017
31 December
2016
No of Shares RupeesRupeesNo of Shares
Balance as at 1st January
Stock options exercised
111,078,492
110,680,876
1,110,784,920
1,106,808,760
749,160 397,616 7,491,600
111,827,652 111,078,492 1,118,276,520
30 September
2017
31 December
2016
30 September
2017
31 December
2016
No of Shares RupeesRupeesNo of Shares
3,976,160
1,110,784,920
10. TRADE DEPOSITS AND SHORT TERM PREPAYMENTS
Security deposits
Prepayments
11. OTHER RECEIVABLES
Visionet Systems Incorporation - USA
TechVista Information Technology - Qatar
TechVista Information Technology - Australia
TechVista Systems LLC
12. SHORT TERM INVESTMENTS
Term deposit receipts 12.1
These carry interest at the rate of 5.75% (2016: 5.85% per annum).
44,924,998
76,056,554
120,981,552
214,855
115,474,768
30,697,293
2,166,948
148,553,864
130,000,000
35,670,879
32,232,784
67,903,663
2,593,326
129,120,377
18,277,609
353,547
150,344,859
253,000,000
Un-audited Audited
30 September 31 December
2017 2016
Rupees Rupees
Note
13. CASH AND BANK BALANCES
Cash in hand
Cash at bank:
Local currency:
Current accounts
Deposit accounts 13.1
Foreign currency - current accounts
469,567
202,715,966
72,587,654
275,303,620
1,612,729
276,916,349
277,385,916
49,000
48,880,189
223,695,570
272,575,759
1,508,644
274,084,403
274,133,403
13.1 These carry interest rate of 3.19% to 4% (2016: 3.29% to 4.04%) per annum.
Un-audited Audited
30 September 31 December
2017 2016
Rupees Rupees
Note15. LONG TERM ADVANCES
This represents advances received from staff and will be adjusted as per Company's car policy against sale
of vehicles.
14. ISSUED, SUBSCRIBED AND PAID UP SHARE CAPITAL
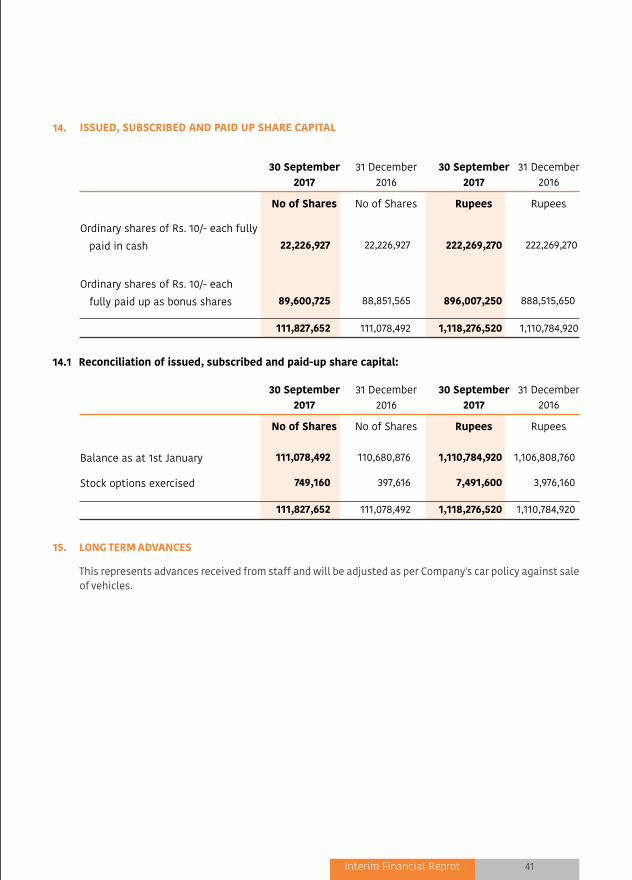

42 Systems Limited Interim Financial Reprot 43
17. SHORT TERM BORROWINGS
This represents export running finance ERF II facility obtained from Habib Bank Limited. The facility has a
limit of Rs. 150 million for working capital requirement and carries interest rate at State Bank of Pakistan
(SBP) rate for ERF + 1% per annum. The facility is mainly secured alongwith letter of guarantee facility of Rs.
150 million by way of first charge over present and future current and fixed assets of the Company and
collateral of land and building to the effect of Rs. 400 million each.
18. OPERATING SEGMENT INFORMATION
Geographical segments
For management purposes, the Group is organized into business units based on their geographical areas
and has three reportable operating segments as follows:
North America
Middle East
Pakistan
No other operating segments have been aggregated to form the above reportable operating segments.
Management monitors the operating results of its operating segments separately for the purpose of
performance assessment. Segment performance is evaluated based on operating profit or loss and is
measured consistently with operating profit or loss in the consolidated financial statements.
Transfer prices between operating segments are on arm’s length basis in a manner similar to transactions
with third parties.
Transfer pricing between operating segments are at arm's length basis in a manner similar to ransactions
with third parties.
OTHER OPERATING EXPENSES
Provison for doubtful debts
Unbilled and bad debt written-o�
Un-audited Un-audited
30 September 30 September
2017 2016
20.
-
-
840,484
45,391,835
46,232,319
-
Rupees Rupees
2017 2016
Sales 1,398,792,914
1,255,721,259
1,115,454,783
769,536,781
439,349,699
518,875,785 (287,095,004) (196,354,140) 2,666,502,392 2,347,779,685
Cost of sales (807,306,373)
(721,652,844)
(935,128,502)
(685,048,879)
(373,390,246)
(486,779,376) 232,146,404 196,354,140 (1,883,678,717) (1,697,126,959)
Gross profit 591,486,541
534,068,415
180,326,281
84,487,902
65,959,453
32,096,409 782,823,675 650,652,726
Distribution cost (2,747,310)
(1,751,818)
(84,970,092)
(51,717,788)
(30,077,409) (28,028,642) 54,948,600 -
-
--
-
--
--
--
(62,846,211) (81,498,248)
R & D -
(457,171) - (624,832)
- (699,588) - (1,781,591)
Administrative expenses (149,679,354)
(129,002,169) (65,698,664) (50,625,867)
(41,221,054) (34,211,694) (256,599,072) (213,839,730)
(152,426,664)
(131,211,158) (150,668,756) (102,968,487)
(71,298,463)
(62,939,924) (319,445,283) (297,119,569)
Profit / (loss) before taxation and
Unallocated income and expenses 439,059,877
402,857,257 29,657,525 (18,480,585)
(5,339,010)
(30,843,515) 463,378,392 353,533,157
Unallocated income and expenses:
Other operating expenses
Other income
Finance cost
Profit before taxation
Taxation
Profit for the year
Rupees
Inter Segment Elimination
Un-audited Un-audited Un-audited Un-audited Un-audited
Nine months ended Nine months ended Nine months ended Nine months ended Nine months ended
North America Middle East Pakistan Total
Rupees
2017 2016
Rupees Rupees
2017 2016
Rupees Rupees
2017 2016
Rupees Rupees
2017 2016
Rupees Rupees
16. TRADE AND OTHER PAYABLES
Creditors
Advance from customers
Retention Money
Accrued liabilities
Withholding income tax payable
Provident fund payable
Provision for WWF
Sales tax payable
Unclaimed dividend
56,045,456
3,115,271
335,116
97,808,501
1,196,097
-
-
-
-
158,500,441
16,868,179
4,270,423
11,604,035
194,071,875
7,117,368
10,345,091
17,930,514
5,007,552
4,351,988
271,567,025
Un-audited Audited
30 September 31 December
2017 2016
Rupees Rupees
2017 2016
Rupees Rupees
(46,232,319) -
43,440,116 21,733,501
(7,383,565) (3,758,204)
(10,175,768) 17,975,297
453,202,624 371,508,454
(8,786,982) (6,900,000)
444,415,642 364,608,454
19. CONTINGENCIES AND COMMITMENTS
19.1 Contingencies
There is no significant change in the contigencies since the date of preceding pusblished annual financail
statements.
19.2 Commitments:
Guarantees issued by the financial institutions on behalf of the Group amounts to Rs. 309.26 (2016: Rs.
279.47) million.
Commitments include capital commitments for construction of building of the Company amounting to Rs.
29.03 (2016: 427.6) million.

44 Systems Limited Interim Financial Reprot 45
23. CASH FLOWS FROM OPERATING ACTIVITIES
Profit before taxation
Adjustments of recincile profit before tax to meet cash flows:
Depreciation on property and equipment
Amortization of intangible assets
Provision for bad debts - net
Bad debts - written o�
Share based payment expense
Gratuity expense
Finance cost
Profit on bank deposits
Gain on short term investments
Gain on disposal of property and equipment
Profit before working capital changes
E�ect on cash flow due to working capital changes
(Increase) / decrease in current assets:
Trade debts
Unbilled revenue - net
Other receivables
Trade deposits and short term prepayments
Advances
Interest accrued
(Decrease) / increase in current liabilities:
Trade and other payables
Unearned revenue
Net cash flows from operations
EARNINGS PER SHARE21.
Basic earnings per share
Profit for the period attributable to equity holder of parent
Weighted average number of ordinary shares in issue during the
period
Basic - in Rupees
Diluted earnings per share
Profit for the period attributable to equity holder of parent
Weighted-average number of ordinary sahres (basic)
E�ect of share options
Diluted - in Rupees
Three Month EndedNine Month Ended
2017
30 September
451,634,493
111,553,234
4.05
451,634,493
111,553,234
225,916
111,779,150
4.04
30 September
2016
367,262,716
111,040,049
3.31
367,262,716
111,040,049
1,217,883
112,257,932
3.27
2017
30 September
169,372,315
111,827,652
1.51
169,372,315
111,827,652
257,775
112,085,427
1.51
30 September
2016
135,713,048
111,040,049
1.22
135,713,048
111,040,049
1,217,883
112,257,932
1.21
22. TRANSACTIONS WITH RELATED PARTIES
Related parties comprises of associated companies, staff retirement fund, directors and key management
personnel. Transactions with related parties other than remuneration and benefits to key management
personnel under the terms of their employment, are as follows:
Related party Relationship
Un-audited Un-audited
2017 2016
Associate Sales 1,429,734,189
1,229,725,655
Payment for expenses -
Net (2,378,471)
19,858,009
1,427,355,718
1,249,583,664
Provident fundEmployee
benefit plan Contributions 56,029,306
54,276,071
Nature of
transactionsNine months ended 30 September
Rupees
Visionet Systems Incorporation
Rupees
453,202,624 371,508,454
54,167,275 55,832,615
21,244,120 14,066,091
840,484 (2,029,520)
45,391,835 -
15,149,810 7,377,627
3,514,233 113,669
7,618,304 3,758,204
(1,993,118) (6,279,414)
(7,976,924) (10,047,661)
(7,599,237) (3,941,641)
130,356,782 58,849,970
583,559,406 430,358,424
(92,738,504) (99,634,546)
1,752,815
(168,958,475)
2,470,320
(8,321,699)
(50,012,075) 15,650,288
(25,947,303)
(39,675,173)
(4,457,010)
-
(168,931,757) (300,939,605)
(137,953,236) (44,225,324)
25,239,322
(109,811,070)
(281,645,671) (154,036,394)
301,913,735
(24,617,575)
Un-audited Un-audited
2017 2016
Nine months ended
30 September
RupeesRupees

46 Systems Limited Interim Financial Reprot 47
24. FINANCIAL RISK MANAGEMENT
24.1 Financial risk factors
There is no change in the company's objectives, policies, procedures for measuring and managing the
financial risks including capital management risk, since the preceding annual financial year ended 31
December 2016.
24.2 Fair values of financial assets and liabilities
The carrying values of all financial assets and liabilities reflected in financial statements approximate to
their fair values. Fair value is determined on the basis of objective evidence at each reporting date.
Accordingly, detailed disclosure with reference to fair value has not been given in this condensed interim
financial information.
Fair value hierarchy
The Company uses the following hierarchy for determining and disclosing the fair value of financial
instruments by valuation technique:
Level 1: quoted (unadjusted) prices in active markets for identical assets or liabilities
Level 2: other techniques for which all inputs which have a significant effect on the recorded fair value are
observable either, directly or indirectly
Level 3: techniques which use inputs that have a significant effect on the recorded fair value that are not
based on observable market data
- There were no financial assets and liabilities measured at fair value as at 30 September 2017.
- During the nine months period ended 30 September 2017, there were no transfers between Level 1 and
Level 2 fair value measurements.
- There were no financial assets and liabilities measured at fair value as at 31 December 2016.
Rupees
30 September 2017
Financial Liabilities
at amortized cost
24.3 Financial instruments by categories
Financial assets as per balance sheet
Long term deposits
Unbilled revenue
Loans to employees
Trade debts
Trade deposits
Interest accrued
Other receivable
Short term investments
Cash and bank balances
Financial liabilities as per balance sheet
Trade and other payables 154,189,073
Financial instruments by categories
Financial assets as per balance sheet
Long term deposits 9,136,852
9,136,852
Unbilled revenue 393,659,781
393,659,781
Loans to employees 4,872,781
4,872,781
Trade debts 1,108,405,149
1,108,405,149
Trade deposits 35,670,879
35,670,879
Interest accrued 2,274,342
2,274,342
Other receivable 150,344,859
150,344,859
Short term investments 253,000,000
253,000,000
Cash and bank balances 274,133,403
274,133,403
274,133,403
1,957,364,643
2,231,498,046
Cash and cash Loans and
equivalents advances
9,136,852
9,136,852
354,263,368
354,263,368
2,110,443
2,110,443
1,186,039,428
1,186,039,428
44,924,998
44,924,998
4,228,733
4,228,733
148,553,864
148,553,864
130,000,000
130,000,000
277,385,916
-
277,385,916
277,385,916
1,879,257,686
2,156,643,602
30 September 17
Rupees
Total
Rupees
-
-
-
-
-
-
-
-
Rupees
Cash and cash Loans and
equivalents advances
30 September 16
Rupees
Total
RupeesRupees
-
-
-
-
-
-
-
-
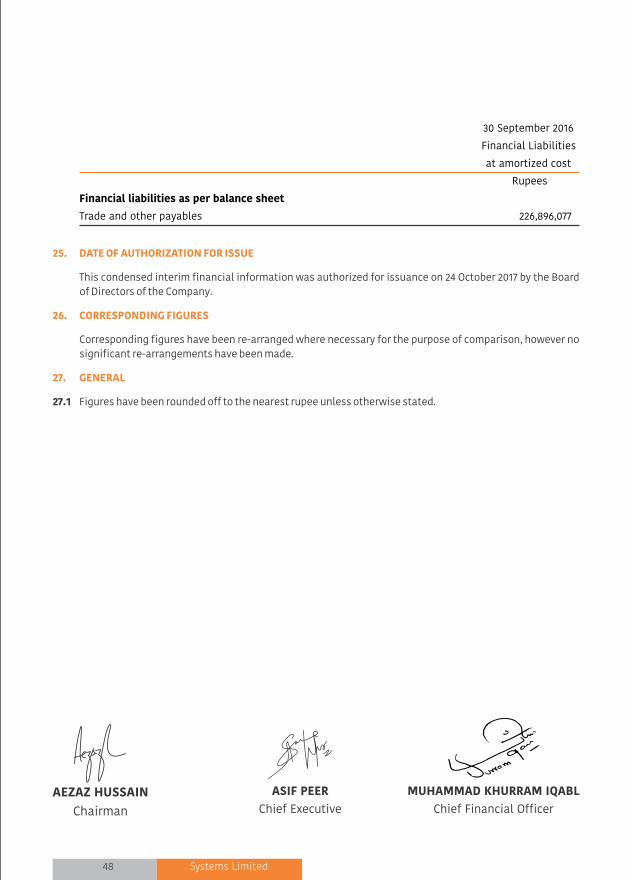
48 Systems Limited
Rupees
Financial liabilities as per balance sheet
Trade and other payables 226,896,077
Financial Liabilities
30 September 2016
at amortized cost
AEZAZ HUSSAIN
Chairman
ASIF PEER
Chief Executive
MUHAMMAD KHURRAM IQABL
Chief Financial Officer
25. DATE OF AUTHORIZATION FOR ISSUE
This condensed interim financial information was authorized for issuance on 24 October 2017 by the Board
of Directors of the Company.
26. CORRESPONDING FIGURES
Corresponding figures have been re-arranged where necessary for the purpose of comparison, however no
significant re-arrangements have been made.
27. GENERAL
27.1 Figures have been rounded off to the nearest rupee unless otherwise stated.
KarachiE-5, Central Commercial Area,Shaheed-e-Millat Road,Karachi, PakistanT: +92 21 34549385-87F: +92 21 34549389
DubaiTechVista Systems FZ-LLCO�ce 1905, Regal TowerBusiness Bay,Dubai, UAETel: + 9714 369 3525Fax: + 9714 456 3761
Registered & Head O�ceSystems Campus Software Technology ParkE-1, Sehjpal Near DHA Phase-VIII,(Ex-Air Avenue), Lahore Cantt.UAN: +92 42 111-797-836T: +92 42 37319401