updates on renal cell cancer sandy srinivas.m.d stanford university & david minor.m.d cpmc
TRANSCRIPT
Updates on Renal Cell CancerUpdates on Renal Cell Cancer
Sandy Srinivas.M.DSandy Srinivas.M.DStanford UniversityStanford University
&&David Minor.M.DDavid Minor.M.D
CPMCCPMC

Educational ObjectivesEducational Objectives
Describe the intracellular signaling cascades associated with VEGFR, Describe the intracellular signaling cascades associated with VEGFR, PDGFR, and Ras/Raf kinases in tumor cells and tumor vasculaturePDGFR, and Ras/Raf kinases in tumor cells and tumor vasculature
Discuss Clinical trials and data on SorafenibDiscuss Clinical trials and data on Sorafenib
Discuss the national clinical trial on adjuvant and metastatic disease Discuss the national clinical trial on adjuvant and metastatic disease
Discuss Clinical trials and data on SutentDiscuss Clinical trials and data on Sutent
Role of High dose IL-2Role of High dose IL-2
Describe mTor InhibitorsDescribe mTor Inhibitors
FR=platelet-derived growth factor; RCC=renal cell carcinoma; VEGFR=vascular endothelial growth factor
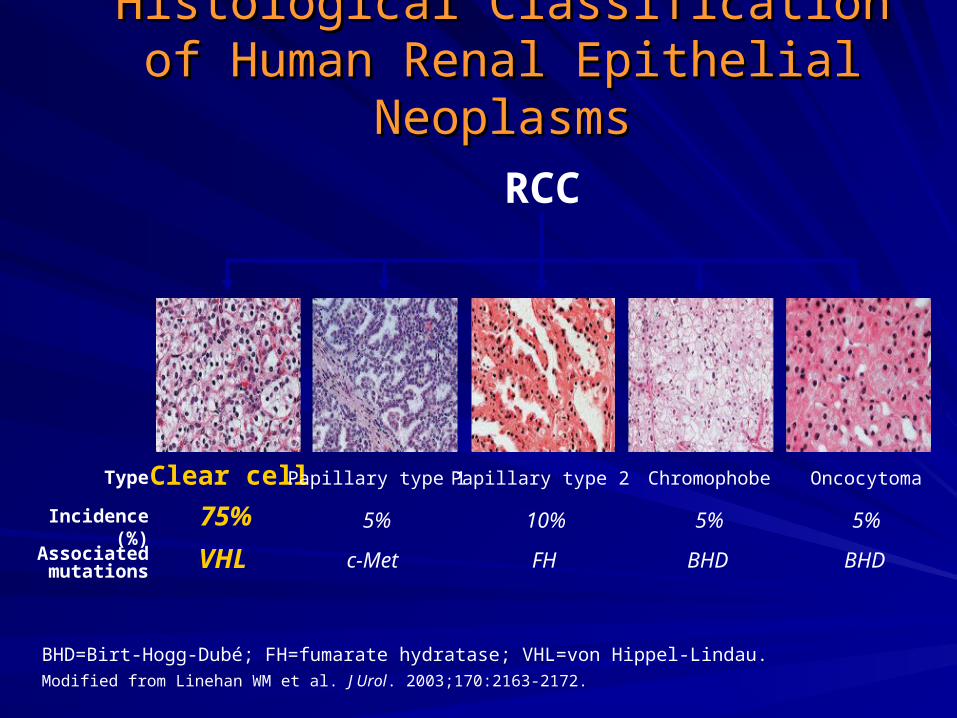
BHD=Birt-Hogg-Dubé; FH=fumarate hydratase; VHL=von Hippel-Lindau.Modified from Linehan WM et al. J Urol. 2003;170:2163-2172.
Histological ClassificationHistological Classificationof Human Renal Epithelial Neoplasmsof Human Renal Epithelial Neoplasms
RCC
Clear cell
75%
Type
Incidence (%)
Associated mutations VHL
Papillary type 1
5%
c-Met
Papillary type 2
10%
FH
Chromophobe
5%
BHD
Oncocytoma
5%
BHD

American Joint Committee on Cancer (AJCC) American Joint Committee on Cancer (AJCC)
2002 Clinical Staging System2002 Clinical Staging System
Cohen HT, McGovern FJ. N Engl J Med. 2005;353:2477-2490.
Stage Description5-Year Survival
(%)
Stage I T1, N0, M0 95
Stage II T2, N0, M0 88
Stage III T1-2, N1 or T3, N0-1 59
Stage IVT4 (any N or M) orN2 (any T or M) or M1
20

Motzer RJ et al. J Clin Oncol. 2002;20:289-296.
MSKCC Risk Factor Model in MSKCC Risk Factor Model in mRCCmRCC
0 risk factors (n=80 patients)
1 or 2 risk factors (n=269 patients)
3, 4, or 5 risk factors (n=88 patients)
Risk factors associated with worse prognosis
• KPS <80
• Low serum hemoglobin (13 g/dL/11.5 g/dL: M/F)
• High corrected calcium (10 mg/dL)
• High LDH (300 U/L)
• Time from Dx to IFN- <1 yr
Time From Start of IFN- (years)
Pro
po
rtio
n S
urv
ivin
g
0
0.1
0.2
0.3
0.4
0.5
0.6
0.7
0.8
0.9
1.0
0 2 1614131195436 151210876
MS:20 mo10 mo4 mo

1. Krown SE. Cancer. 1987;59:647-651.2. Muss HB. Semin Oncol. 1988;15:30-34.3. Rosenberg SA et al. JAMA. 1994;271:907-913.
Historical Management Strategies Historical Management Strategies for RCC: Summaryfor RCC: Summary
ChemotherapyChemotherapy
– RCC is highly resistant, <10% ORRRCC is highly resistant, <10% ORR11
IFN-IFN-
– 15% ORR, but responses rarely complete or durable15% ORR, but responses rarely complete or durable22
HD IL-2HD IL-2
– 15% ORR in stage IV patients, only 15% ORR in stage IV patients, only 55% were CR% were CR33
Urgent need for additional options in late-stage RCCUrgent need for additional options in late-stage RCC

Role of VHL in RCC ProgressionRole of VHL in RCC Progression
EGF
PDGF
VEGF
Pericyte
Endothelial cell
Tumor cell
EGF
PDGFVEGF
EGF PDGF
VEGF
HIF-1
VHL
HIF-1
HIF-1HIF-1
RAS
RAF
MEK
ERK
RAS
RAF
MEK
ERK
RAS
RAF
MEK
ERK
ParacrineFunction
ParacrineFunction
AutocrineFunction
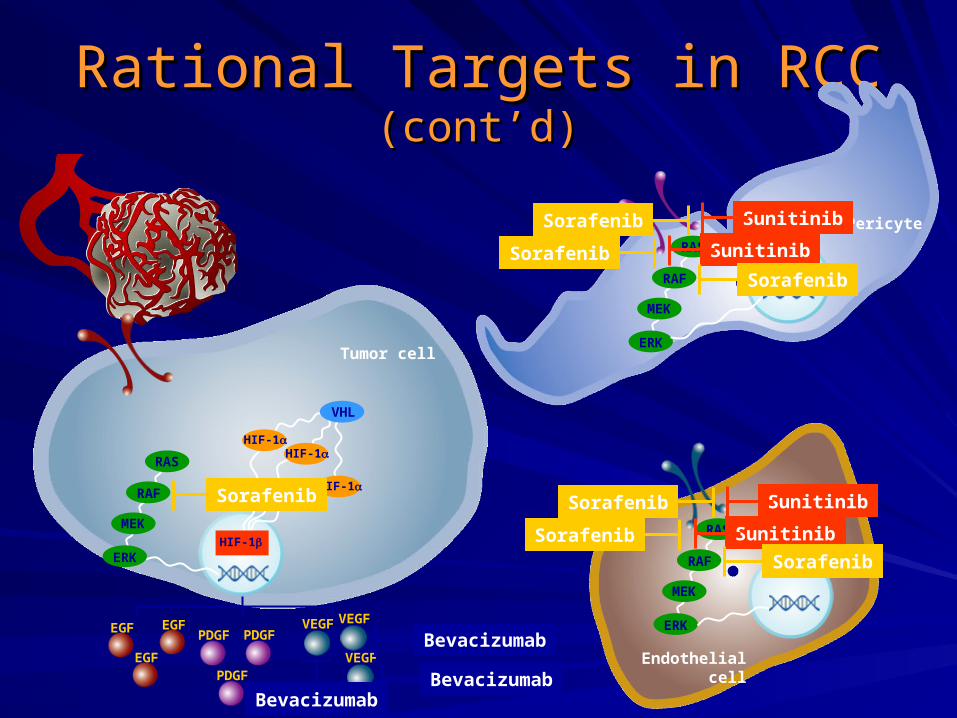
Rational Targets in RCC Rational Targets in RCC (cont’d)(cont’d)
EGF
PDGF
VEGF
Pericyte
Endothelial cell
Tumor cell
EGF
PDGFVEGF
EGF PDGF
VEGF
HIF-1
VHL
HIF-1
HIF-1HIF-1
RAS
RAF
MEK
ERK
RAS
RAF
MEK
ERK
RAS
RAF
MEK
ERK
Bevacizumab
Bevacizumab
Bevacizumab
Sunitinib
Sunitinib
Sunitinib
Sunitinib
Sorafenib Sorafenib
Sorafenib
Sorafenib
Sorafenib
Sorafenib
Sorafenib
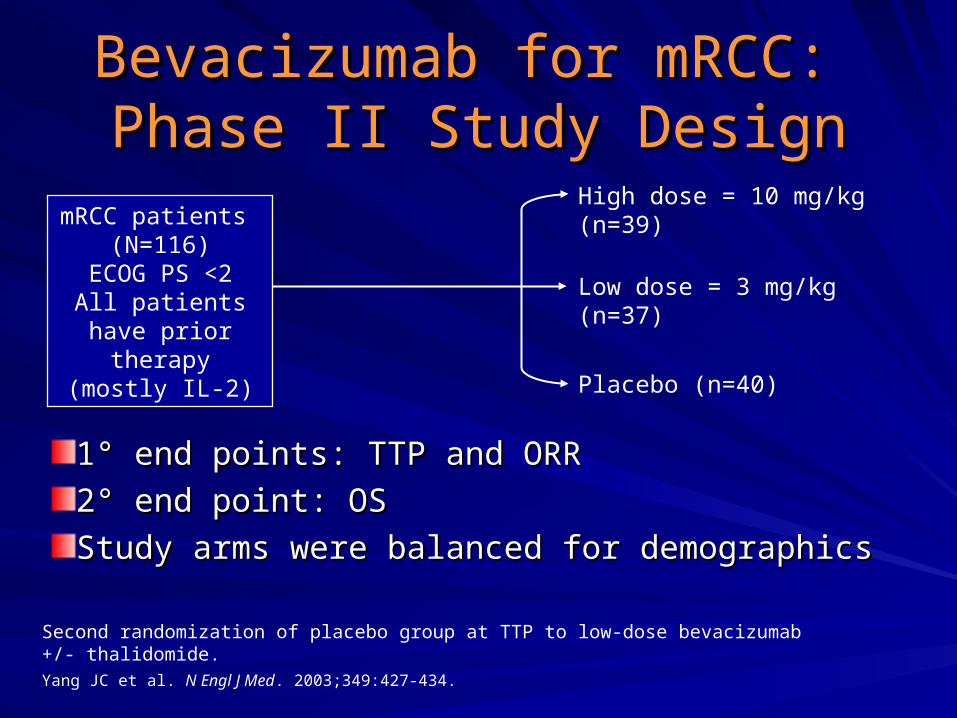
Bevacizumab for mRCC: Bevacizumab for mRCC: Phase II Study DesignPhase II Study Design
High dose = 10 mg/kg (n=39)
Low dose = 3 mg/kg (n=37)
Placebo (n=40)
Second randomization of placebo group at TTP to low-dose bevacizumab +/- thalidomide.Yang JC et al. N Engl J Med. 2003;349:427-434.
11°° end points: TTP and ORR end points: TTP and ORR
22°° end point: OS end point: OS
Study arms were balanced for demographicsStudy arms were balanced for demographics
mRCC patients (N=116)
ECOG PS <2All patients have
prior therapy (mostly IL-2)

Bevacizumab for mRCC:Bevacizumab for mRCC:Progression-Free SurvivalProgression-Free Survival
100
90
80
70
60
50
40
30
20
10
00 6 12 18 24 30 36
Time (months)
Pat
ien
ts F
ree
of
Tu
mo
r P
rog
ress
ion
(%
)
Adapted from Yang JC et al. N Engl J Med. 2003;349:427-434.
Median PFS (months)
High dose, 10 mg/kg(n=39) 4.8 (P<.001)
Low dose, 3 mg/kg (n=37) 3.0 (P<.041)
Placebo (n=40) 2.5
Partial Response-10%
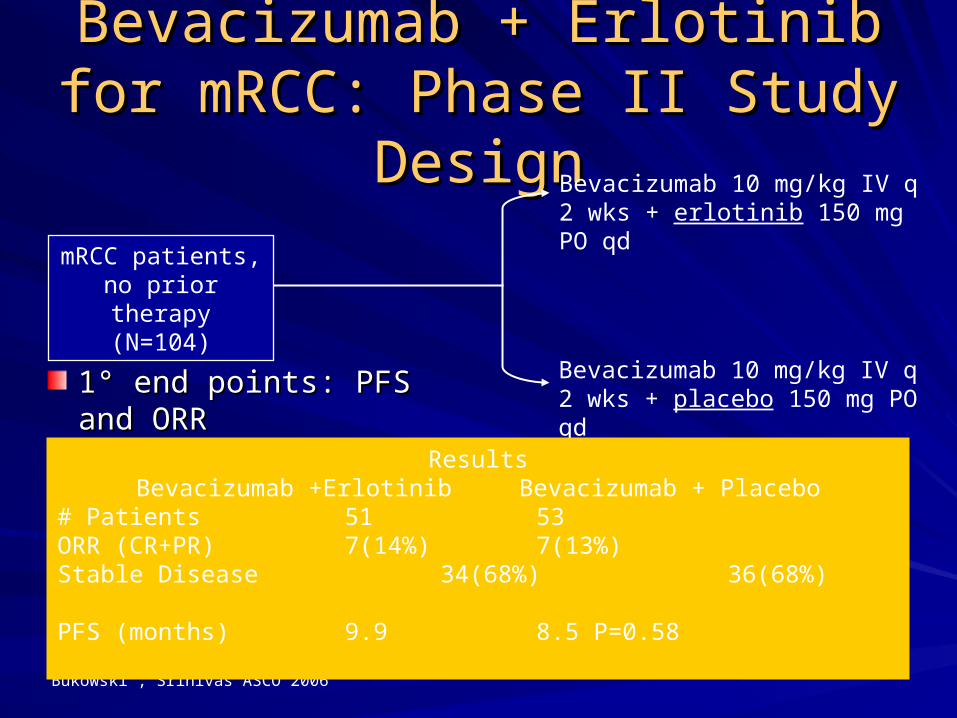
Bevacizumab + Erlotinib for Bevacizumab + Erlotinib for mRCC: Phase II Study DesignmRCC: Phase II Study Design
Bevacizumab 10 mg/kg IV q 2 wks + erlotinib 150 mg PO qd
Bukowski , Srinivas ASCO 2006
11°° end points: PFS and ORR end points: PFS and ORR
mRCC patients,no prior therapy
(N=104)
Bevacizumab 10 mg/kg IV q 2 wks + placebo 150 mg PO qd
ResultsBevacizumab +Erlotinib Bevacizumab + Placebo
# Patients 51 53ORR (CR+PR) 7(14%) 7(13%)Stable Disease 34(68%) 36(68%)PFS (months) 9.9 8.5 P=0.58
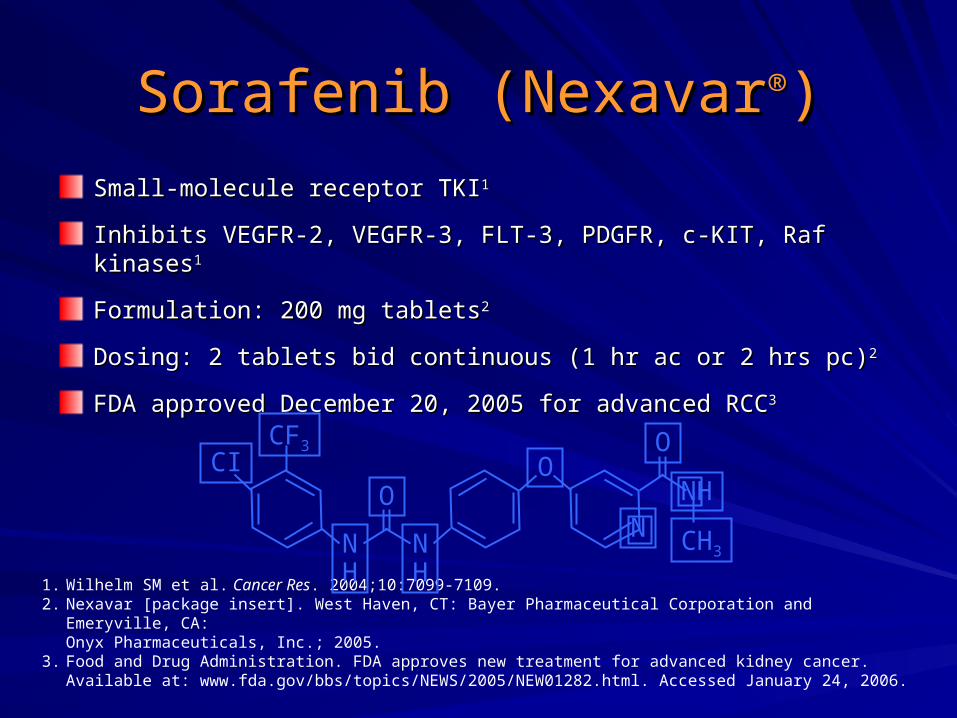
Sorafenib (NexavarSorafenib (Nexavar®®))
Small-molecule receptor TKISmall-molecule receptor TKI11
Inhibits VEGFR-2, VEGFR-3, FLT-3, PDGFR, c-KIT, Raf kinasesInhibits VEGFR-2, VEGFR-3, FLT-3, PDGFR, c-KIT, Raf kinases11
Formulation: 200 mg tabletsFormulation: 200 mg tablets22
Dosing: 2 tablets bid continuous (1 hr ac or 2 hrs pc)Dosing: 2 tablets bid continuous (1 hr ac or 2 hrs pc)22
FDA approved December 20, 2005 for advanced RCCFDA approved December 20, 2005 for advanced RCC33
1. Wilhelm SM et al. Cancer Res. 2004;10:7099-7109.2. Nexavar [package insert]. West Haven, CT: Bayer Pharmaceutical Corporation and Emeryville, CA:
Onyx Pharmaceuticals, Inc.; 2005.3. Food and Drug Administration. FDA approves new treatment for advanced kidney cancer.
Available at: www.fda.gov/bbs/topics/NEWS/2005/NEW01282.html. Accessed January 24, 2006.
NH
NH
OO
O
N
CICF3
NH
CH3

Sorafenib for mRCC: Sorafenib for mRCC: Phase II (RDT) Study DesignPhase II (RDT) Study Design
RDT=randomized discontinuation trial.*May cross over to sorafenib. Ratain MJ et al. Presented at: ASCO; May 13-17, 2005; Orlando FL.
≥25% tumor shrinkage continue sorafenib
Stable patients(-25% to +25%)randomized
>25% tumor growth off-study
11°° end points end points– PFS from day 1PFS from day 1– PFS 12 weeks post-randomization,PFS 12 weeks post-randomization,
tumor response rate, safetytumor response rate, safety
Solid tumors (N=502) mRCC
patients (n=202)
Sorafenib
Placebo*

Median PFS from randomization
Sorafenib=24 weeksPlacebo=6 weeks
P=.0087
Sorafenib for mRCC: Phase II Sorafenib for mRCC: Phase II (RDT) Progression-Free Survival(RDT) Progression-Free Survival
Time From Randomization (days)
Pro
po
rtio
n o
f P
atie
nts
P
rog
ress
ion
-Fre
e1.00
0.75
0.50
0.25
0
12-week period
84 0 100 200 300 400 500
Ratain MJ et al. Presented at: ASCO; May 13-17, 2005; Orlando FL.
Sorafenib (n=33)Placebo (n=32)Censored

Sorafenib for mRCC: Phase II (RDT) Sorafenib for mRCC: Phase II (RDT)
Drug-Related Adverse EventsDrug-Related Adverse Events Any grade
%Grade 3/4
%
Any event 98 48
Cardiovascular 38 25
Hypertension 35 24
Dermatology 90 15
Rash/desquamation 62 2
Hand-foot skin reaction 60 13
Alopecia 50 –
Other 38 –
Dry skin 21 –
Flushing 13 –
Constitutional symptoms 68 6
Fatigue 55 4
Weight loss 24 –Ratain MJ et al. Presented at: ASCO; May 13-17, 2005; Orlando FL.

Sorafenib for mRCC:Sorafenib for mRCC:Phase III Study Design (TARGET)Phase III Study Design (TARGET)
Sorafenib, 400 mg bid (n=451)
11°° end point: OS end point: OS
22°° end points: ORR, PFS, safety, HR-QoL end points: ORR, PFS, safety, HR-QoL
DemographicsDemographics– MSKCC good or intermediate risk patientsMSKCC good or intermediate risk patients– Clear-cell carcinomaClear-cell carcinoma
Unresectable and/or mRCC,
1 prior systemic Tx in last 8 months, ECOG PS 0/1
(N=903*) Placebo (n=452)
*Out of 905 patients randomized by February 15, 2005.Escudier B et al. Presented at: ECCO; October 30-November 3, 2005; Paris, France.

Sorafenib for mRCC:Sorafenib for mRCC:Response Rate* (TARGET)Response Rate* (TARGET)
Best Response by RECIST
Sorafenib (n=451)n (%)
Placebo (n=452)
n (%)
Complete response 1 (<1) —
Partial response 43 (10) 8 (2)
Stable disease 333 (74) 239 (53)
Progressive disease 56 (12) 167 (37)
Missing 18 (4) 38 (8)
* Investigator assessment. Patients randomized at least 6 weeks before data cut-offof May 31, 2005.
Escudier B et al. Presented at: ECCO; October 30-November 3, 2005; Paris, France.

Sorafenib for mRCC: Sorafenib for mRCC: Tumor Reduction* (TARGET)Tumor Reduction* (TARGET)
* Investigator assessment. Patients randomized at least 6 weeks before data cut-off of May 31, 2005.Escudier B et al. Presented at: ECCO; October 30-November 3, 2005; Paris, France.
Sorafenib (n=451)Placebo (n=452)
Tumor Reduction Tumor Reduction
PR (30% or reduction, RECIST).
Ch
an
ge
Fro
m B
as
eli
ne
(%
)*
25% 76%
Ch
an
ge
Fro
m B
as
eli
ne
(%
)*
0
50
100
150
-50
-100
0
50
100
150
-50
-100
PD (20% increase, RECIST);
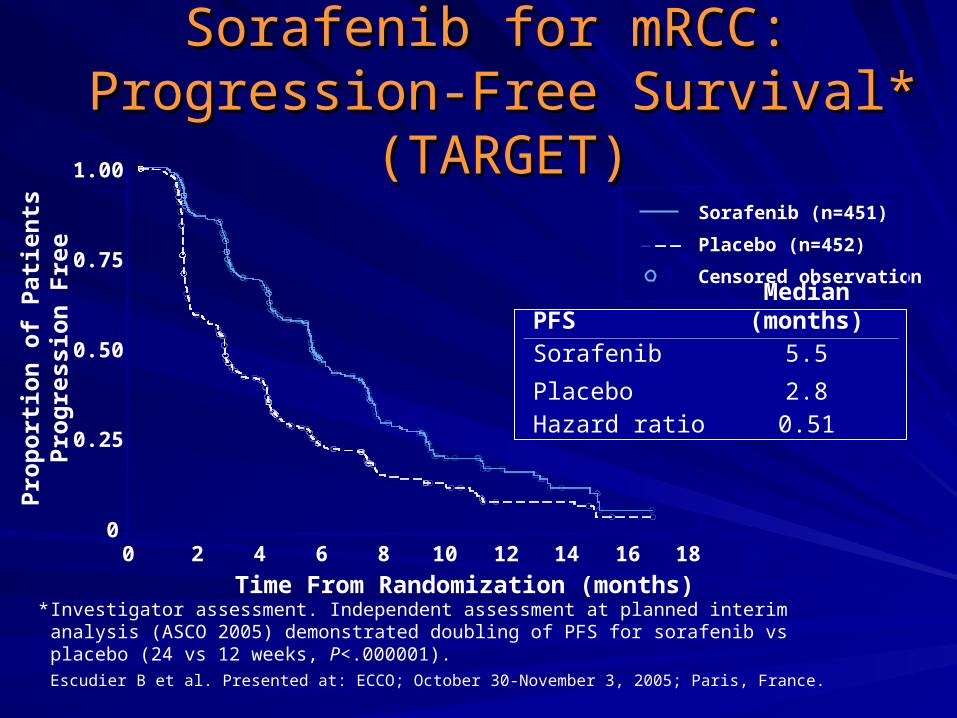
PFSMedian
(months)Sorafenib
Placebo
5.5
2.8Hazard ratio 0.51
Time From Randomization (months)
Pro
po
rtio
n o
f P
atie
nts
Pro
gre
ssio
n F
ree
0
0.25
0.50
0.75
1.00
0 4 10 202 6 8 12 14 16 18
Sorafenib for mRCC: Sorafenib for mRCC: Progression-Free Survival* (TARGET)Progression-Free Survival* (TARGET)
* Investigator assessment. Independent assessment at planned interim analysis (ASCO 2005) demonstrated doubling of PFS for sorafenib vs placebo (24 vs 12 weeks, P<.000001).Escudier B et al. Presented at: ECCO; October 30-November 3, 2005; Paris, France.
Censored observation
Placebo (n=452)
Sorafenib (n=451)
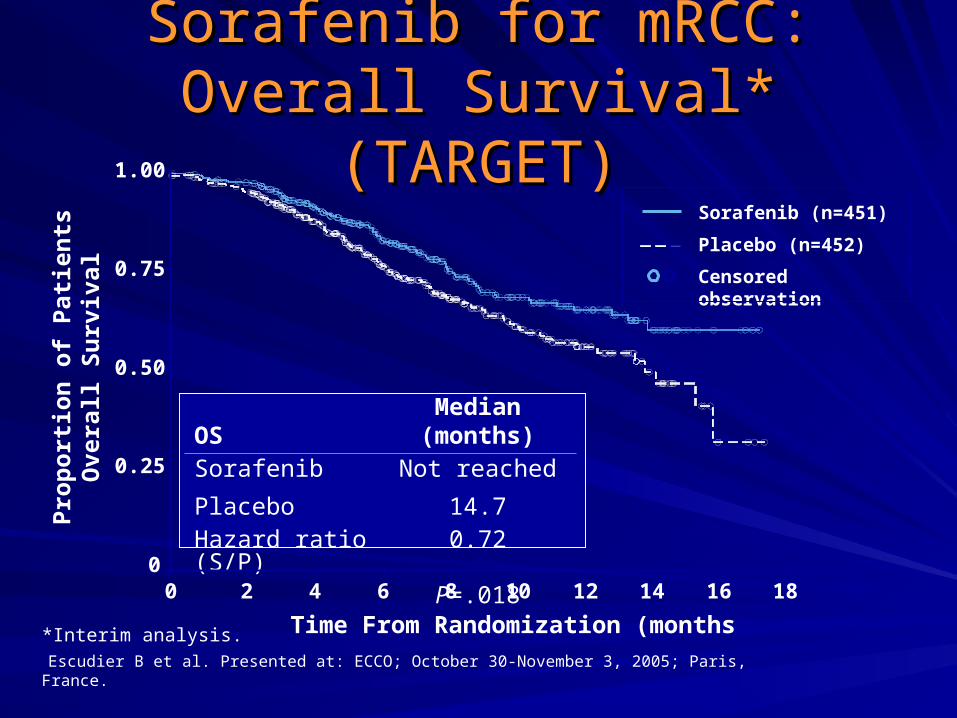
Sorafenib for mRCC:Sorafenib for mRCC:Overall Survival* (TARGET)Overall Survival* (TARGET)
OSMedian
(months)Sorafenib
Placebo
Not reached
14.7Hazard ratio (S/P)
0.72
P=.018
Censored observation
Placebo (n=452)
Sorafenib (n=451)
Time From Randomization (months)
Pro
po
rtio
n o
f P
atie
nts
Ove
rall
Su
rviv
al
0
0.25
0.50
0.75
1.00
0 4 10 202 6 8 12 14 16 18
*Interim analysis.Escudier B et al. Presented at: ECCO; October 30-November 3, 2005; Paris, France.
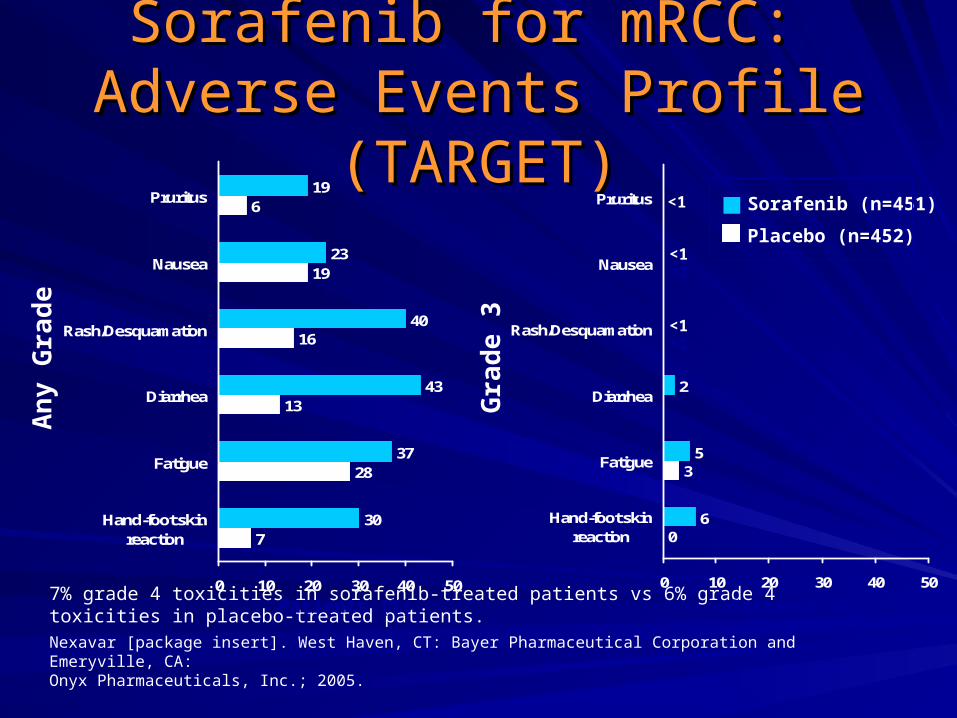
7
28
13
16
19
6
30
37
43
40
23
19
0 10 20 30 40 50
Hand-foot skinreaction
Fatigue
Diarrhea
Rash/Desquamation
Nausea
Pruritus
Sorafenib for mRCC: Sorafenib for mRCC: Adverse Events Profile (TARGET)Adverse Events Profile (TARGET)
7% grade 4 toxicities in sorafenib-treated patients vs 6% grade 4 toxicities in placebo-treated patients.Nexavar [package insert]. West Haven, CT: Bayer Pharmaceutical Corporation and Emeryville, CA:Onyx Pharmaceuticals, Inc.; 2005.
0
3
6
5
2
0 10 20 30 40 50
Hand-foot skinreaction
Fatigue
Diarrhea
Rash/Desquamation
Nausea
Pruritus
<1<1
<1<1
<1
An
y G
rad
e
Gra
de
3
Placebo (n=452)
Sorafenib (n=451)
Patients (%) Patients (%)

Sorafenib for mRCC: Sorafenib for mRCC: Laboratory Toxicities (TARGET)Laboratory Toxicities (TARGET)
11
13
30
10
49
23
5
45
23
41
18
44
30
12
0 10 20 30 40 50
Hypophosphatemia
Lymphopenia
Elevated lipase
Neutropenia
Anemia
Elevated amylase
Thrombocytopenia
3
7
7
2
4
3
0
13
13
12
5
2
1
1
0 10 20 30 40 50
Hypophosphatemia
Lymphopenia
Elevated lipase
Neutropenia
Anemia
Elevate amylase
Thrombocytopenia
Nexavar [package insert]. West Haven, CT: Bayer Pharmaceutical Corporation and Emeryville, CA: Onyx Pharmaceuticals, Inc.; 2005.
An
y G
rad
e
Gra
de
3
Patients (%) Patients (%)
Placebo (n=452)
Sorafenib (n=451)

TARGETsTARGETsHand–Foot Skin ReactionHand–Foot Skin Reaction

Sorafenib for mRCC: Sorafenib for mRCC: ConclusionConclusion
First MKI approved for treatment of advanced RCCFirst MKI approved for treatment of advanced RCC
– December 20, 2005December 20, 2005
More than doubles PFS compared to placebo More than doubles PFS compared to placebo
Therapeutic response Therapeutic response
– Radiographic response vs disease stabilizationRadiographic response vs disease stabilization
OS survival trend at planned interim analysis (OS survival trend at planned interim analysis (PP<.018)<.018)
Mild to moderate toxicity profileMild to moderate toxicity profile
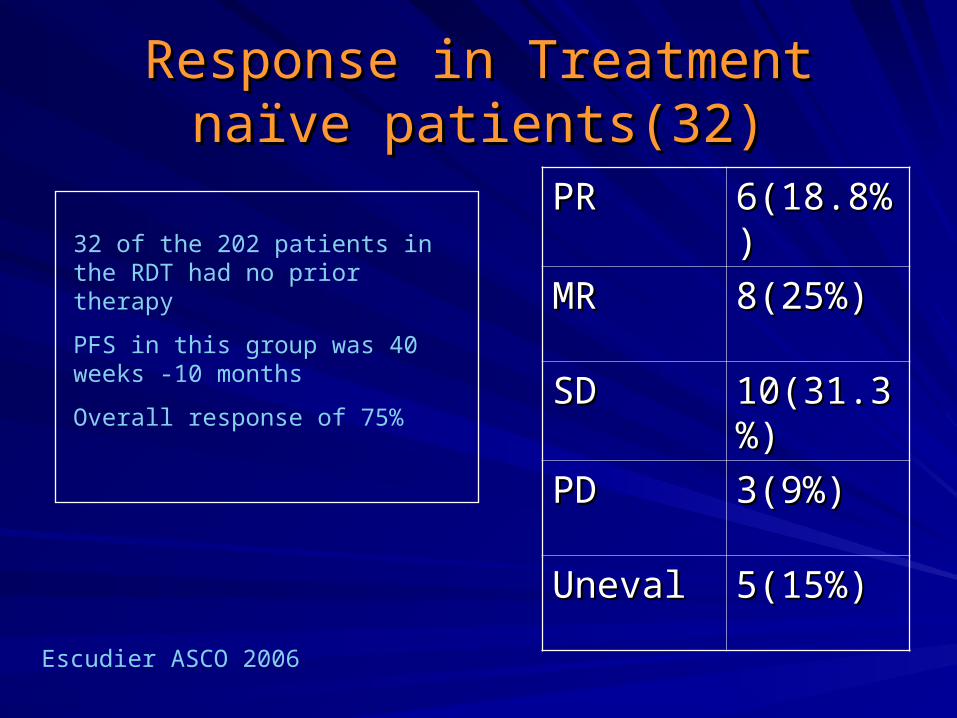
Response in Treatment naïve Response in Treatment naïve patients(32)patients(32)
PRPR 6(18.8%)6(18.8%)
MRMR 8(25%)8(25%)
SDSD 10(31.3%)10(31.3%)
PDPD 3(9%)3(9%)
UnevalUneval 5(15%)5(15%)
32 of the 202 patients in the RDT had no prior therapy
PFS in this group was 40 weeks -10 months
Overall response of 75%
Escudier ASCO 2006
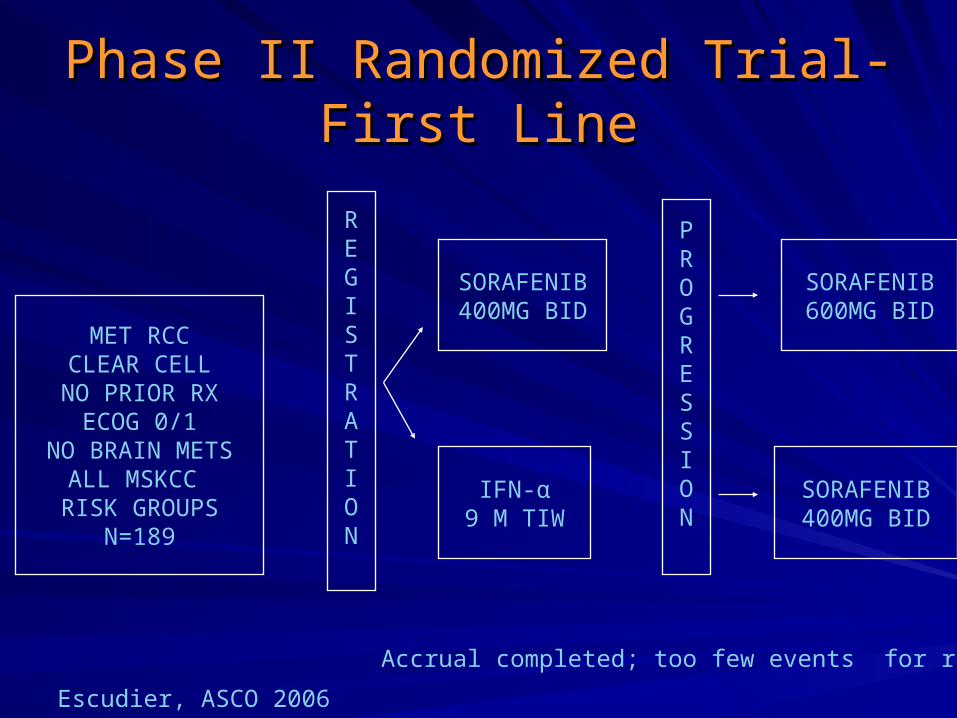
Phase II Randomized Trial- First LinePhase II Randomized Trial- First Line
Escudier, ASCO 2006
MET RCCCLEAR CELLNO PRIOR RXECOG 0/1
NO BRAIN METSALL MSKCC RISK GROUPS
N=189
REGISTRATION
SORAFENIB400MG BID
IFN-α9 M TIW
SORAFENIB600MG BID
SORAFENIB400MG BID
PROGRESSION
Accrual completed; too few events for results

Randomized phase III trial of Sorafenib: Randomized phase III trial of Sorafenib: Impact of Crossover o survivalImpact of Crossover o survival
OS @ CrossOS @ Cross
overover
OS@6 months OS@6 months Cross overCross over
OS@ 6 mosOS@ 6 mos
Crossover with Crossover with placebo censoredplacebo censored
PlaceboPlacebo 14.714.7 15.915.9 14.314.3
SorafenibSorafenib NRNR 19.319.3 19.319.3
Hazard RatioHazard Ratio 0.720.72 0.770.77 0.740.74
P-valueP-value 0.0180.018 0.0150.015 0.010.01
O-Brien-O-Brien-Flemming SRFlemming SR
0.00050.0005 0.00940.0094 0.00940.0094
Eisen, ASCO 2006

Summary-PFS (months)Summary-PFS (months)
First LineFirst Line Second LineSecond Line
BevazizumabBevazizumab 8.58.5 4.84.8
SorafenibSorafenib 99 5.55.5
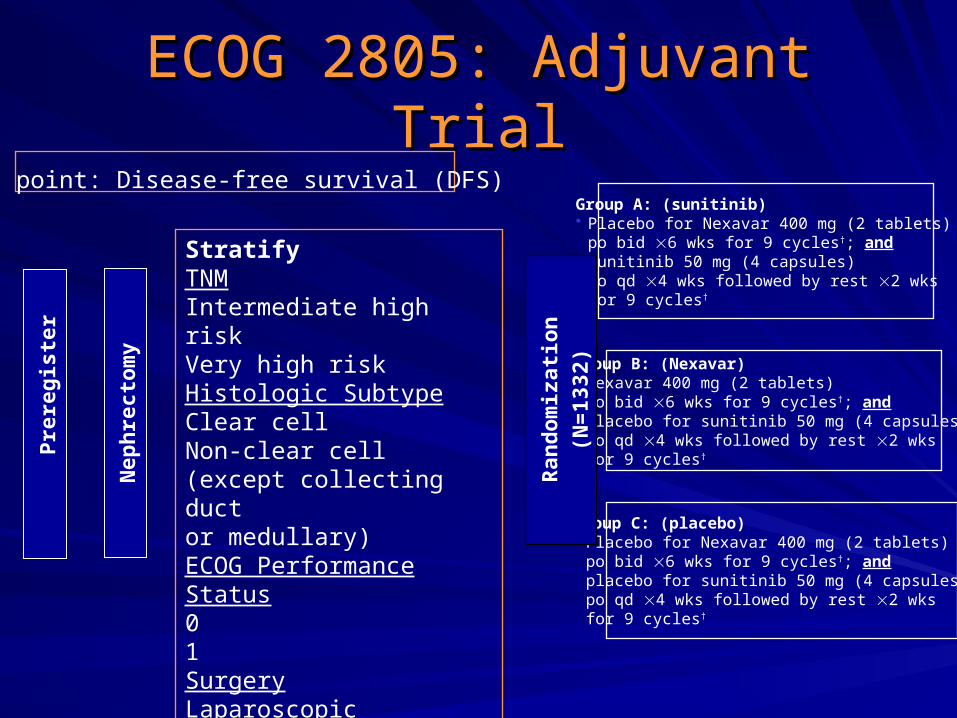
ECOG 2805: Adjuvant TrialECOG 2805: Adjuvant Trial
StratifyTNMIntermediate high riskVery high riskHistologic SubtypeClear cellNon-clear cell (except collecting ductor medullary)ECOG Performance Status01SurgeryLaparoscopicOpen
Nephrectomy
Preregister
Group A: (sunitinib) Placebo for Nexavar 400 mg (2 tablets) po bid 6 wks for 9 cycles†; andsunitinib 50 mg (4 capsules)po qd 4 wks followed by rest 2 wks for 9 cycles†
Group B: (Nexavar) Nexavar 400 mg (2 tablets) po bid 6 wks for 9 cycles†; andplacebo for sunitinib 50 mg (4 capsules)po qd 4 wks followed by rest 2 wks for 9 cycles†
Group C: (placebo) Placebo for Nexavar 400 mg (2 tablets) po bid 6 wks for 9 cycles†; andplacebo for sunitinib 50 mg (4 capsules)po qd 4 wks followed by rest 2 wks for 9 cycles†
Randomization
(N=1332)
1° end point: Disease-free survival (DFS)
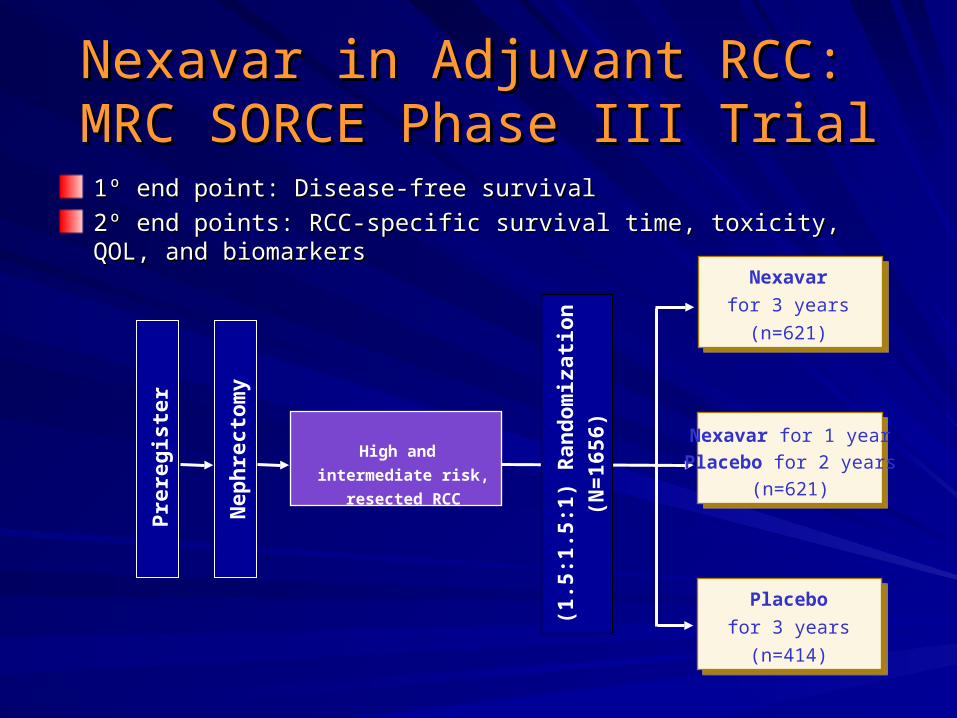
Nexavar in Adjuvant RCC: Nexavar in Adjuvant RCC: MRC SORCE Phase III TrialMRC SORCE Phase III Trial
11ºº end point: Disease-free survival end point: Disease-free survival
22ºº end points: end points: RCC-specific survival time, toxicity, QOL, and biomarkersRCC-specific survival time, toxicity, QOL, and biomarkers
(1.5:1.5:1) Randomization
(N=1656)
High and
intermediate risk,
resected RCC
Nephrectomy
Preregister
Placebo
for 3 years
(n=414)
Nexavar for 1 yearPlacebo for 2 years
(n=621)
Nexavar
for 3 years
(n=621)