updated review of potential test p fmvss no 208
TRANSCRIPT

UPDATED REVIEW OF POTENTIAL TEST PROCEDURES FOR
FMVSS NO. 208
Prepared By The
OFFICE OF VEHICLE SAFETY RESEARCH
WILLIAM T. HOLLOWELL
HAMPTON C. GABLER
SHELDON L. STUCKI
STEPHEN SUMMERS
JAMES R. HACKNEY, NPS
OCTOBER 1999

TABLE OF CONTENTS
Executive Summary . . . . . . . . . . . . . . . . . . . . . . . . . . . . . . . . . . . . . . . . . . . . . . . . . . . . ES-1
Chapter 1 Introduction . . . . . . . . . . . . . . . . . . . . . . . . . . . . . . . . . . . . . . . . . . . . . 1-1
Chapter 2 Candidate Test Procedures . . . . . . . . . . . . . . . . . . . . . . . . . . . . . . 2-12.1 APPROACH . . . . . . . . . . . . . . . . . . . . . . . . . . . . . . . . . . . . . . . . . . . . . . . . . . . . . . . 2-12.2 OVERVIEW OF EXPERIENCE . . . . . . . . . . . . . . . . . . . . . . . . . . . . . . . . . . . . . . . 2-12.3 OVERVIEW OF POTENTIAL CANDIDATE TEST PROCEDURES . . . . . . . . . . . 2-62.4 SUMMARY . . . . . . . . . . . . . . . . . . . . . . . . . . . . . . . . . . . . . . . . . . . . . . . . . . . . . . 2-182.5 REFERENCES . . . . . . . . . . . . . . . . . . . . . . . . . . . . . . . . . . . . . . . . . . . . . . . . . . . . 2-19
Chapter 3 NASS Analysis of Frontal Impacts . . . . . . . . . . . . . . . . . . 3-13.1 INTRODUCTION . . . . . . . . . . . . . . . . . . . . . . . . . . . . . . . . . . . . . . . . . . . . . . . . . . 3-13.2 GENERAL FINDINGS ON FRONTAL CRASH MODES . . . . . . . . . . . . . . . . . . . 3-23.3 ANALYSIS OF NASS CRASH DATA BY CRASH MODE, PULSE TYPE AND
INTRUSION . . . . . . . . . . . . . . . . . . . . . . . . . . . . . . . . . . . . . . . . . . . . . . . . . . . . . . 3-53.4 SUMMARY . . . . . . . . . . . . . . . . . . . . . . . . . . . . . . . . . . . . . . . . . . . . . . . . . . . . . . 3-153.5 REFERENCES . . . . . . . . . . . . . . . . . . . . . . . . . . . . . . . . . . . . . . . . . . . . . . . . . . . . 3-16
Chapter 4 Crash Compatibility . . . . . . . . . . . . . . . . . . . . . . . . . . . . . . 4-14.1 INTRODUCTION . . . . . . . . . . . . . . . . . . . . . . . . . . . . . . . . . . . . . . . . . . . . . . . . . . 4-14.2 CRASH COMPATIBILITY OF VEHICLES DESIGNED TO FMVSS NO. 208 RIGID
BARRIER TEST . . . . . . . . . . . . . . . . . . . . . . . . . . . . . . . . . . . . . . . . . . . . . . . . . . . . 4-24.3 POTENTIAL CONSEQUENCES OF TEST PROCEDURE OPTIONS . . . . . . . . . 4-64.4 SUMMARY . . . . . . . . . . . . . . . . . . . . . . . . . . . . . . . . . . . . . . . . . . . . . . . . . . . . . . . 4-94.5 REFERENCES . . . . . . . . . . . . . . . . . . . . . . . . . . . . . . . . . . . . . . . . . . . . . . . . . . . . . 4-9
Chapter 5 Evaluation of Test Configurations . . . . . . . . . . . . . . . . . . 5-15.1 CRASH RESPONSES . . . . . . . . . . . . . . . . . . . . . . . . . . . . . . . . . . . . . . . . . . . . . . . 5-35.2 OCCUPANT INJURY . . . . . . . . . . . . . . . . . . . . . . . . . . . . . . . . . . . . . . . . . . . . . . 5-125.3 OCCUPANT COMPARTMENT INTRUSION . . . . . . . . . . . . . . . . . . . . . . . . . . . 5-145.4 EVALUATION OF ENERGY ABSORPTION . . . . . . . . . . . . . . . . . . . . . . . . . . . 5-165.5 SUMMARY AND DISCUSSION . . . . . . . . . . . . . . . . . . . . . . . . . . . . . . . . . . . . . 5-175.6 REFERENCES . . . . . . . . . . . . . . . . . . . . . . . . . . . . . . . . . . . . . . . . . . . . . . . . . . . . 5-19

Chapter 6 Summary and Recommendations . . . . . . . . . . . . . . . . . . . 6-16.1 SUMMARY OF FINDINGS . . . . . . . . . . . . . . . . . . . . . . . . . . . . . . . . . . . . . . . . . . 6-16.2 OPTIONS FOR CONSIDERATION . . . . . . . . . . . . . . . . . . . . . . . . . . . . . . . . . . . . 6-66.3 RECOMMENDATIONS . . . . . . . . . . . . . . . . . . . . . . . . . . . . . . . . . . . . . . . . . . . . . 6-76.4 REFERENCES . . . . . . . . . . . . . . . . . . . . . . . . . . . . . . . . . . . . . . . . . . . . . . . . . . . . . 6-7
Appendix A FMVSS 208 Unbelted Rigid Barrier Test Results: MY 1998Bags vs Pre-MY 1998 Bags, Compliance Margins . . . . . A-1
Appendix B Validation of Simulated Crash Conditions . . . . . . . . . . . . B-1
Appendix C Maximum Crush Displacement vs Linear Stiffness . . . . . C-1
ES-1
Executive Summary
Background
The objective of a crash test for Federal Motor Vehicle Safety Standard (FMVSS) No. 208 is tomeasure how well a passenger vehicle would protect its occupants in the event of a serious real worldfrontal crash. This is sometimes referred to as the crashworthiness of a vehicle. This report reviewspotential test procedures for evaluating frontal crashworthiness.
Structural design for crashworthiness seeks to mitigate two adverse effects of a crash – (1) rapiddeceleration of the occupant compartment, and (2) crush of the occupant compartment survival space. In a severe crash, the speed of a vehicle often decreases from its travel speed to zero in a hundredthousandths of a second. One important way to minimize the injury consequences of this abrupt changein velocity is to extend the amount of time necessary to slow the vehicle down – the less abrupt thechange in velocity, the lower the crash forces on the occupant. The front end of vehicles are designedto crumple in a controlled manner in a collision to give their occupants the necessary additional time tosafely decelerate in a crash.
Note that the controlled crush or crumple of the front-end, a safety positive feature, is totally differentfrom the crush or collapse of the actual occupant compartment – which is to be avoided. At aminimum, partial collapse of the structural cage which surrounds the occupant allows vehicle parts (e.g.,the engine or steering mechanism) to “intrude” into the occupant space and strike the occupant causinginjury. In extremely severe collisions, the occupant compartment may suffer a catastrophic collapse,and allow the occupant to be crushed.
The degradation of the occupant compartment survival space is measured by intrusion. The occupantcompartment deceleration severity is measured by the amplitude and time duration of the decelerationtime history. The deceleration time history is sometimes called the crash pulse. Both effects have thepotential for causing injury.
Objectives
The ideal frontal crash test procedure will be able to evaluate occupant protection while ensuring thatthe vehicle will not jeopardize its crash “friendliness” with its collision partners. The test conditions(e.g., impact speed, impact angle, and test device) must be representative of the frontal crashenvironment to which passenger vehicles are exposed on the highway. Finally, to provide assurance ofprotection in potentially serious injury crashes, the test procedures must be severe enough to representa crash in which occupants could be seriously injured or killed.
ES-2
This report examines several potential frontal crash test procedures, and evaluates how well eachcandidate frontal test procedure meets these objectives. Specifically, this report evaluates (1) the fullfrontal fixed barrier test, (2) the oblique frontal fixed barrier test, (3) the generic sled test, (4) the frontalfixed offset deformable barrier test, (5) the perpendicular moving deformable barrier (MDB) test, (6)the oblique moving deformable barrier test and (7) the full frontal fixed deformable barrier (FFFDB)test. Each procedure is compared with the 48 kph fixed rigid barrier test and the generic sled testcurrently prescribed in FMVSS No. 208.
Approach and Findings
Based on actual crash tests and computer simulations of real world crashes, each test procedure hasbeen categorized with respect to its crash pulse and expected intrusion level. The crash responses ofthe vehicles that were similar to the rigid barrier test responses were categorized as stiff, whereas thecrash responses that were similar to the generic sled pulse were categorized as soft. In examining thedeceleration levels from the crash tests and simulations, the “soft” responses are generally characterizedby longer duration pulses and lower acceleration levels. The “stiff” pulses are characterized by shorterduration pulses and higher acceleration levels. In examining the resulting velocity profiles from thesepulses during the first 50 to 60 milliseconds (the time at which occupants begin to interact with the airbag), it is observed that the “soft” pulses result in a velocity change of the occupant that is roughly halfthat experienced by occupants inside vehicles subjected to a stiff pulse. In examining both the crashtest and the simulation results, the occupants of vehicles subjected to the soft pulses experienced lowerinjury levels than would have occupants of vehicles subjected to stiff pulses.
In addition to characterizing the crash pulse response, the expected intrusion outcome was determinedfrom crash test measurements and simulations. The intrusion outcome was divided into two categories- (1) intrusion level of 0 to 15 cm, and (2) intrusion greater than 15 cm. The results from these effortsare shown in the table below. Analysis of U.S. crash statistics has shown that in crashes where theintrusion exceeds 15 cm, the probability of injury is substantially higher than in crashes with loweramounts of intrusion.

ES-3
Table ES-1: Test Procedure: Expected Outcomes
Test Procedure Impact Direction Crash Pulse Intrusion (est.)
Rigid Wall/Full frontal
Perpendicular Stiff 0 - 15 cm
Rigid Wall/Full frontal
Oblique Soft > 15 cm
FFFDB/Full frontal
Perpendicular Soft 0 - 15 cm
Offset-Barrier (EU Test)
Perpendicular Soft > 15 cm
Vehicle-MDB/Full-Frontal
Perpendicular Stiff 0 - 15 cm
Vehicle-MDB/Overlap # 55%
Perpendicular Soft > 15 cm
Vehicle-MDB/Overlap > 55%
Perpendicular Stiff > 15 cm
Vehicle-MDB/Overlap # 33%
Oblique Soft > 15 cm
Vehicle-MDB/Overlap > 33%
Oblique Stiff > 15 cm
Sled Test Perpendicular Soft Not Applicable
Passenger vehicles will be exposed to a wide spectrum of real world crash types when introduced intothe vehicle fleet. The strategy in selecting a test procedure is to identify tests that have the potential toimprove the crash protection provided across a broad range of real-world impact conditions. The crashtest conditions for each procedure, e.g., impact speed, impact angle, test devices and configurations,must be carefully selected to be representative of the frontal crash environment to which passengervehicles are generally exposed on the highway.
The National Automotive Sampling System (NASS) files for 1988-97 were analyzed in order tocharacterize the frontal crash environment. The study investigated approximately 3,770 vehicles, or

ES-4
drivers, with airbags which were involved in frontal crashes, of which 847 had injuries classified asmoderate or greater, 408 serious or greater injuries, and 89 fatal injuries. These were “weighted” inNASS to represent 97,585, 32,143 and 4,437 moderate, serious and fatal injuries, respectively. Bygrouping drivers into specific test conditions based on the crash severity, assumed to be defined bycrash pulse and intrusion, an estimate of the target crash populations for each test configuration can bepredicted. The target populations based on exposure and based on serious-to-fatal injuries for driverswith air bags were computed. The major finding was that a MDB-to-vehicle test, both left and rightoffset, would address the largest target population of drivers exposed to frontal crashes –approximately 64 percent of drivers and about 59 percent of those receiving serious to fatal injuries. The full, fixed rigid barrier test at 0 to 30 degrees impact angle would address a lower targetpopulation -- about 44 percent of the drivers and about 40 percent of those receiving serious to fatalinjuries. All other potential tests would address substantially lower target populations.
Although the emphasis of the rigid barrier test is clearly on occupant protection, an important constrainton the test procedure is that it should not lead to designs which jeopardize the vehicles crash“friendliness” in collisions against other vehicles. One concern that has been raised by many safetyresearchers in industry, government, and academia is that some tests currently not in use – most notablythe frontal offset-barrier test – may drive vehicle designs away from being crash “friendly” and it mustbe ensured that any tests that are required do not drive vehicle designs in that direction.
Mitigation of intrusion and crash pulse require competing design modifications. To reduce intrusion, thecommon remedy is to strengthen or ‘stiffen’ the vehicle structure both surrounding and including theoccupant compartment. To lessen deceleration severity, the conventional approach is to soften thevehicle structure forward of the occupant compartment. The ideal test procedure would be one whichleads designers to (1) soften the front structure for control of deceleration severity and (2) strengthenthe structure surrounding the occupant compartment to control intrusion. Currently, the rigid barrier testacts as a constraint on over-stiffening of the front vehicle structure. The frontal-oblique MDB test, or acombination of the rigid full frontal barrier test and a frontal-offset test forces designers to produce avehicle which limits intrusion while simultaneously limiting deceleration severity. However, less rigoroustests which produce neither intrusion nor high deceleration, e.g, the FFFDB or the sled test, provideessentially no constraint on front structure stiffness, and would permit the manufacture of a newgeneration of stiffer, more aggressive passenger vehicles.
Options for Consideration
Analysis of each of the candidate test procedures with respect to their lead time, target populations,body regions addressed, and effect on compatibility leads to the following four options available forconsideration for the evaluation of a vehicle’s frontal crash protection. The generic sled test is not oneof the options. Unlike a full scale vehicle crash test, a sled test does not, and cannot, measure theactual protection an occupant will receive in a crash. The sled test does not replicate the actual timing
ES-5
of air bag deployment, does not replicate the actual crash pulse of a vehicle, does not measure theinjury or protection from intruding parts of the vehicle, and does not measure how a vehicle performs inactual angled crashes. Finally, the generic sled test has a substantially smaller target population whencompared to the options discussed below.
Option 1 - Combination of Perpendicular and Oblique Rigid Barrier Tests: The first option is theunbelted rigid barrier test of impact speed 0 to 48 kmph and impact angle 0 to 30o. This option has atarget population which is substantially larger than the generic sled test, and is immediately available forimplementation. The perpendicular rigid barrier test primarily evaluates crash pulse severity while theoblique rigid barrier test primarily evaluates intrusion. Likewise, the perpendicular rigid barrier test isexpected to evaluate head, chest, neck and upper leg injury potential, but generally indicates no lowerleg injury unless coupled with the oblique barrier test. With regard to compatibility, the perpendicularrigid barrier test acts as a constraint on over-stiffening the front structure.
Option 2: Combination of the Perpendicular Rigid Barrier Test and an Offset-Barrier Test:The second option is a combination of the rigid barrier test with an offset-barrier test similar to theprocedure used in Europe. This option combines the crash pulse control provided by the perpendicularrigid barrier test with the intrusion control provided by the offset-barrier test. The target population forthe combined procedure equals the target population for the combination of the perpendicular andoblique rigid barrier tests. In addition to evaluating the protection of the head, chest, and neck of theoccupant, the combined procedure also evaluates leg protection against intrusion. With regard tocompatibility, the combined procedure, like the rigid barrier test alone, acts as a constraint on over-stiffening the front structure, but would allow strengthening of the occupant compartment to avoidintrusion.
Option 3 - Moving Deformable Barrier (MDB)-to-Vehicle Test: The third option is the frontal-MDBtest. Of all candidate test procedures, this option has one of the largest target populations, but also hasthe need for a longer lead time (2-3 years) to complete research and development. The frontal-MDBtest combines, in a single test, the crash pulse control provided by the perpendicular rigid barrier testwith the intrusion control provided by the offset-barrier test. For lighter vehicles, this procedureprovides the incentive to produce designs which are more crash compatible with heavier collisionpartners. The procedure provides no incentive to either stiffen or soften larger vehicles, therebyallowing the automakers the design flexibility to build compatibility into heavier vehicles. Designmodifications made to take advantage of this could lead to poorer performance in single vehiclecrashes.
Option 4 - Combination of Perpendicular Rigid Barrier and Moving Deformable Barrier (MDB)-to-Vehicle Test: The fourth option is the combination of the frontal rigid barrier and the MDB test. Of allcandidate test procedures, this option has the largest target population. These tests combine the crashpulse control provided by the perpendicular rigid barrier test with the intrusion control provided by theoffset-barrier test. For lighter vehicles, this procedure provides the incentive to produce designs which

ES-6
are more crash compatible with heavier collision partners. The combined procedures prevent largervehicles from becoming too stiff, thereby pointing the automakers toward designs that buildcompatibility into heavier vehicles. The research and development related to this procedure will requirea lead time of 2-3 years to complete.
Recommendations
On March 19, 1997, NHTSA published a final rule that adopted an unbelted sled test protocol as atemporary alternative to the fixed barrier test for unbelted occupants. The agency took this action toprovide an immediate, interim solution to the problem of the fatalities and injuries that current air bagsystems are causing in relatively low speed crashes to a small, but growing number of children andoccasionally to adults. It was the understanding at that time, and it is reiterated in this study, that thesled test does not meet the need for effectively evaluating vehicle protection systems. The advanced airbag rulemaking actions that are being proposed provide adequate lead time to assure proper designsfor occupant protection that must be evaluated under appropriate test conditions. Therefore, it isrecommended for this rulemaking to eliminate the sled test procedure and to consider theaforementioned options that are available within the rulemaking time frame. Additionally, it isrecommended that research be continued in developing and evaluating the moving deformable barriertest for future agency consideration for upgrading FMVSS No. 208.

1 The agency has revised both the benefits and disbenefits of the redesigned air bag systems as a result ofthe review of significant data obtained regarding redesigned air bag systems. The large potential increase in chestacceleration as seen in the agency’s testing of prototype depowered systems for unbelted passengers in 30 and 35mph testing has not materialized in Model Year (MY) 1998 vehicles, with the exception of one vehicle. The agencydoes not know the reason why. It could be that vehicles were not depowered as much as the prototype systems andthus did not have as large of an effect. It could be that manufacturers changed their systems from the prototypes tolessen the effect to the extent possible; or some combination of the two. Based on minimal data, the MY9 1998redesigned air bags along with increases in belt use and moving kids to the rear seat together appear to havereduced the low speed out-of-position fatalities by about 70 percent or up to 83 mostly unbelted passenger fatalities. However, between 8 and 49 lives might not be saved in high speed crashes by MY 1998 air bags compared to pre-NY 1998 air bags. [1]
1-1
CHAPTER 1. INTRODUCTION
The National Highway Traffic Safety Administration (NHTSA) strives to establish test procedures inregulatory requirements that lead to improvements in real world safety, often in connection withperformance standards. In Federal Motor Vehicle Safety Standard (FMVSS) No. 208, “OccupantCrash Protection,” a rigid barrier crash test was applied. Historically, this test has applied to bothbelted and unbelted 50th percentile male anthropomorphic dummies for impact conditions from 0 to 48kmph and impact angles from 0 to 30 degrees.
As a result of problems of injuries and fatalities associated with air bags and out-of-position childpassengers, out-of-position adult drivers (usually unbelted), and infants in rear-facing child safety seats,NHTSA published a final rule on March 19, 1997, that temporarily amended FMVSS No. 208 tofacilitate the rapid redesign of air bags so that they inflate less aggressively. More specifically, theagency adopted an unbelted sled test protocol as a temporary alternative to the full scale unbeltedbarrier crash test requirement. The agency took this temporary action to provide an immediate, yetpartial, solution to the problem of the fatalities and injuries that current air bag systems are causing inrelatively low speed crashes to a small, but growing number of children and occasionally to adults. Inthe final regulatory evaluation published in conjunction with the issuance of the final rule, the agencyestimated that if manufacturers depowered their air bag systems on average by 20 to 35 percent, 47children’s lives could be saved from the estimated 140 children who otherwise would be killed over thelifetime of one model year’s fleet. Furthermore, based on limited test results, projections were maderegarding the disbenefits to adult occupants that would occur in high severity crashes as a result ofdepowering the air bag systems. The estimated disbenefit was that 45 to 409 driver and passengeradult fatalities would result from depowering the air bag systems by 20 to 35 percent.1
While the agency adopted the sled test alternative to facilitate the quick redesign of air bags, the agencyrecognized that the sled test does not evaluate full vehicle system performance, particularly crashsensing. Therefore, the agency included a sunset provision for this alternative. The sunset provisionwould eliminate the sled test at the time that the agency believed advanced air bag technology would be

2 In preparing for the advanced air bag regulation, several potential crash test procedures have beenexplored by the agency. These include the offset deformable barrier test as specified by the European Union inDirective 96/79/EC, the moving deformable barrier crash test that is being evaluated in NHTSA’s advanced frontal research programs, and a 48 kmph full frontal fixed deformable barrier (FFFDB) crash test. The supporting rationaleprovided for any one of these tests may include the belief that the crash pulse is similar to that experienced in realworld vehicle crashes, the use of the crash test will result in improvements in vehicle structures to prevent intrusionand/or improved restraint system designs to reduce loads on the occupants, and the use of the test will improvevehicle compatibility between passenger cars and light trucks and vans. Conversely, it may be argued that any oneof these tests may not represent vehicle crash pulses, will lead to improper air bag/restraint system designs, and willlead to structural designs that increase incompatibility between vehicle types and weights.
1-2
available. The recently enacted “National Highway Traffic Safety Administration Reauthorization Actof 1998" requires that a final rule for advanced air bag systems be made effective in phases as rapidlyas possible, beginning not earlier than September 1, 2002, and provides that the sled test option shallremain in effect unless or until changed by this rule. Nevertheless, comments received by the agencyregarding the March 19, 1997 rule, and the sunset provision included extensive discussions of therelevance of the full barrier test requirements and sled test protocol.
This report has been written to provide an assessment of potential frontal impact test procedures.2 Toachieve this goal, a multifaceted approach was undertaken. In Chapter 2, a review of the types oftesting that have been utilized in the past for evaluating vehicle safety performance is presented. Candidate test procedures are identified, and a general description and an assessment of the state ofdevelopment for each test procedure is presented. In Chapter 3, the frontal crash environment ischaracterized using the National Automotive Sampling System (NASS) file. Target populations forcrashes and for serious injury-producing crashes are presented for the crash modes represented by thecandidate test procedures. Furthermore, the predominant body regions for which injury potential isevaluated by each of the candidate test procedures are identified. In Chapter 4, a study is presentedthat addresses whether potential test procedures would necessarily and unavoidably result in vehicledesigns that on balance would have a negative impact on motor vehicle safety. In Chapter 5, a study ispresented that identifies the candidate test procedures as being rigid barrier-like (or “stiff”) or sled-like(or “soft”). The procedures also are characterized according to their anticipated level of intrusion in thevehicles tested. These outcomes were used for characterizing the crash environment in Chapter 3. Thefinal section, Chapter 6, summarizes the major findings from the individual studies, and then providesrecommendations resulting from these findings. Appendices A-C provide technical background forthese chapters.
REFERENCES
1. ____, “Preliminary Economic Assessment, SNPRM, FMVSS No. 208, Advanced Air Bags,”National Highway Traffic Safety Administration, September 1999.
2-1
CHAPTER 2. CANDIDATE TEST PROCEDURES
This section examines candidate test procedures for evaluation of frontal crash protection. Thediscussion describes each test procedure, provides the status of each procedure, the agency’sexperience with each procedure, the experience of the crash safety community with each procedure,and the lead time necessary to complete research for each procedure.
2.1 Approach
The objective of a crash test for Federal Motor Vehicle Safety Standard (FMVSS) No. 208 is tomeasure the crashworthiness of a passenger vehicle. The standard specifies performance requirementsfor the protection of vehicle occupants in crashes. Historically, this has encouraged improvements tothe vehicle structure and restraint systems to enhance occupant crash protection. Structural design forcrashworthiness seeks to mitigate two adverse effects of a crash – (1) degradation of the occupantcompartment survival space and (2) the occupant compartment deceleration severity. Both effects havethe potential to cause injuries – first, because of the increase in probability of occupant contact withintruding vehicle components, and, second, because of the potential for internal injuries to occupants. The degradation of the occupant compartment survival space is measured by intrusion, while occupantcompartment deceleration severity is measured by the amplitude and time duration of the crash pulse.
The ideal frontal crash test procedure will evaluate the potential for occupant injury from bothdeceleration severity and from intrusion. Furthermore, in addition to occupant protection, the ideal testprocedure will not lead to designs which jeopardize the vehicles’ crash compatibility with its collisionpartners. Finally, the test conditions (i.e., impact speed, impact angle, and impact partner) mustencompass and be representative of the frontal crash environment to which passenger vehicles areexposed on the highway.
This report examines several frontal crash test procedures, and evaluates how well each proceduremeets these objectives. Specifically, this report evaluates (1) the full frontal fixed rigid barrier test, (2)the oblique frontal fixed rigid barrier test, (3) the generic sled test, (4) the offset frontal fixed deformablebarrier test, (5) the perpendicular moving deformable barrier (MDB) test, (6) the oblique movingdeformable barrier test and (7) the full frontal fixed deformable barrier (FFFDB) test. Each procedureis compared with the 48 kph rigid barrier test and the generic sled test.
2.2 Overview of Experience
A number of test types have been used in the past to evaluate vehicle performance in frontal crashes.

2-2
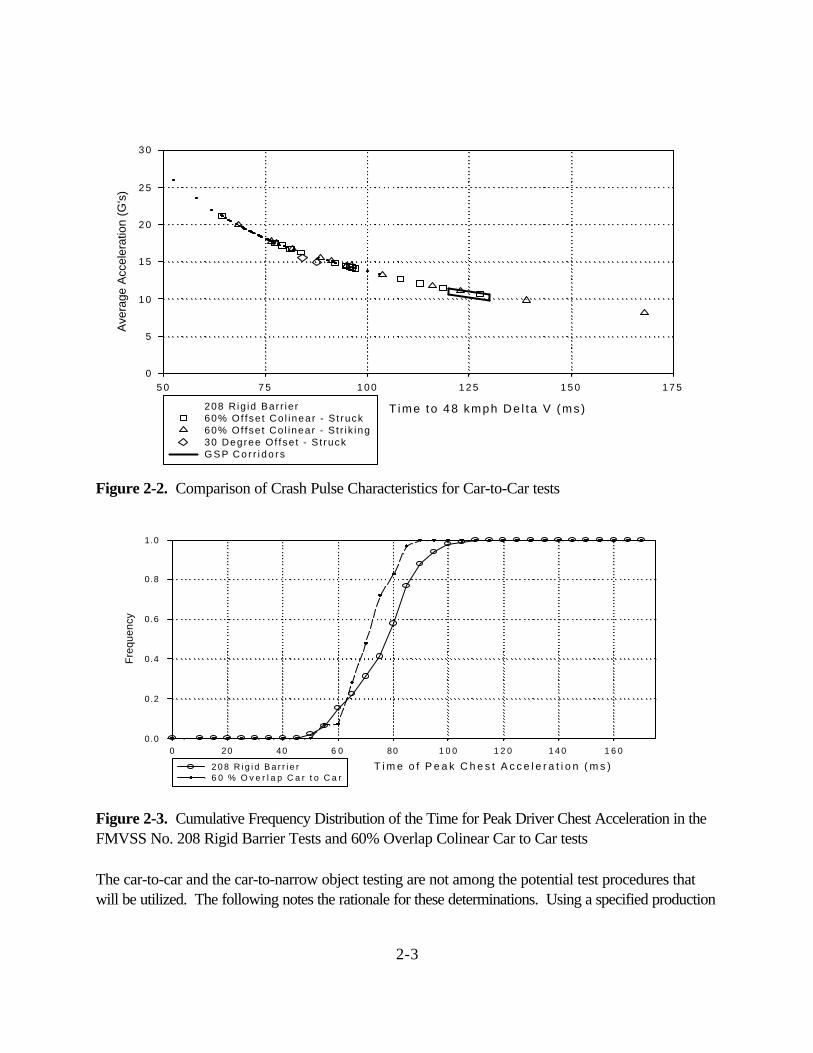
Over the years, the agency has conducted car-to-car, car-to-fixed barrier, moving barrier-to-car, andcar-to-narrow object crash tests. Additionally, the agency has routinely conducted sled tests toevaluate restraint system performance. Figure 2-1 shows an example of an oblique offset car-to-cartest. These car-to-car crashes generate a wide range of crash responses. In Figure 2-2, two crashresponse characteristics are cross-plotted (average acceleration vs. time to velocity change) for car-to-car tests and for the two test procedures specified in FMVSS No. 208--the rigid barrier test and thegeneric sled test. In car-to-car tests, the vehicles differ in their change in velocity, with the lightervehicle experiencing a greater velocity change than the heavier vehicle. In rigid barrier tests, there is alesser vehicle-to-vehicle variation in the velocity change. In order to compare the crash pulses of car-to-car tests with those in other tests, it is necessary to isolate the velocity change in the car-to-car testthat corresponds to the velocity change in the test being evaluated, and then compare the timenecessary taken to make the change. In the tests evaluated for this report, a 48 kmph velocity changewas selected as a measure of comparison. Clearly in terms of the crash pulse, the generic sled tests arenot representative of car-to-car tests.
The 48 kmph velocity was used since it is the upper bound for the velocity change in the generic sledpulse. The time for the 48 kmph velocity change in the car-to-car tests ranges from 64 to 168 msec,with the vast majority being in the 75 to 125 msec range. Figure 2-3 compares the time of the peakchest acceleration for the driver dummy in FMVSS No. 208 rigid barrier tests conducted for modelyear 1990 - 1998 vehicles and 18 vehicles crashed in the 60 percent overlap collinear car-to-car tests. Out of the 215 rigid barrier tests analyzed, 97.6 percent of the driver dummies measured peak chestacceleration prior to 100 msec. The time duration over which these peak chest accelerations occurcompares well with the time duration over which most of the vehicles tested against the rigid barrierreached the 48 kmph velocity change. Also, it is seen that this compares well with the time durationover which the peak chest accelerations occur in the car-to-car tests. Returning to Figure 2-2, it isseen that the generic sled pulse (GSP) falls both at the lower end of the average acceleration and at thelonger end of the time duration. Furthermore, it is seen that most of the car-to-car tests fall within thetime range for the rigid barrier tests, (with the few outliers at the longer time duration representingvehicles substantially heavier than their crash partner in the test).
ì
Figure 2-1. Car-to-Car Crash Test
2-3
T ime to 48 kmph De l ta V (ms )
5 0 7 5 1 0 0 1 2 5 1 5 0 1 7 5
Ave
rage
Acc
eler
atio
n (G
's)
0
5
1 0
1 5
2 0
2 5
3 0
208 R ig id Bar r ie r60% Of fse t Co l inear - S t ruck60% Of fse t Co l inear - S t r i k ing30 Degree Of fse t - S t ruckG S P C o r r i d o r s
Figure 2-2. Comparison of Crash Pulse Characteristics for Car-to-Car tests
T i m e o f P e a k C h e s t A c c e l e r a t i o n ( m s )
0 20 40 6 0 80 1 0 0 1 2 0 1 4 0 1 6 0
Fre
quen
cy
0.0
0.2
0.4
0.6
0.8
1.0
2 0 8 R i g i d B a r r i e r6 0 % O v e r l a p C a r t o C a r
Figure 2-3. Cumulative Frequency Distribution of the Time for Peak Driver Chest Acceleration in theFMVSS No. 208 Rigid Barrier Tests and 60% Overlap Colinear Car to Car tests
The car-to-car and the car-to-narrow object testing are not among the potential test procedures thatwill be utilized. The following notes the rationale for these determinations. Using a specified production

2-4
vehicle as an impactor, or bullet vehicle, has never been considered as a compliance test procedure bythe agency. However, such an approach has been implemented in test procedures specified for theevaluation of highway safety features [2]. The agency has not included this as part of the testprocedures that would be proposed in this rulemaking out of concern regarding the future availability ofa current vehicle specified for use as an impactor precluded this approach from consideration as acandidate test procedure. Also, the large variety of equipment configurations (e.g., engine,transmission, air conditioning) available for a production vehicle would introduce unwieldy complexity inthe test procedure. Finally, conducting a car-to-car crash test could raise repeatability issues.
A second type of test is vehicle-to-narrow objects, e.g., trees and poles. Collisions between vehiclesand fixed narrow objects result in a significant number of fatalities. Car collisions with trees and polesaccount for approximately one-third of all fatalities in fixed object collisions. Offset barrier testing,addressed below, is a reasonable surrogate for car-to-narrow object tests. Car-to-narrow objectcrash testing has shown crash pulses which are quite similar to the European Union (EU) and theInsurance Institute for Highway Safety (IIHS) fixed deformable offset barrier tests.
Finally, the car-to-fixed barrier and the moving barrier-to-car crash tests are two test types that havebeen used extensively for compliance testing as well as for testing in the agency’s research programs. Furthermore, the agency has experience in using these test types in which the front of the tested vehicleis fully engaged (i.e., full frontal test) or only a portion of the front of the tested vehicle is engaged (i.e.,frontal offset test). Also, the agency has conducted these types of tests under conditions in which theline of travel of the tested vehicle is perpendicular to the fixed barrier or is in line, i.e., parallel, with theline of travel of the moving barrier (i.e., head-on). Additionally, the agency has conducted tests underconditions in which the tested vehicle’s line of travel is at an angle to the perpendicular with the fixedbarrier or to the line of travel of the moving barrier (i.e., oblique). Table 2-1 provides a summary of thetype of testing the agency has conducted to represent these crash types. As can be seen from anexamination of the relevant frontal crash test found in this table, the agency has experience in all testconfigurations with the exception of a moving rigid barrier in the frontal crash mode.

2-5
Table 2-1. Agency Experience with Vehicle Crash Test Types
BARRIER
TYPE Fixed Moving
Direction Frontal Frontal Side Rear
Stiffness Rigid Flexible Rigid Flexible Rigid Flexible Rigid Flexible
In-line FMVSS208
barrier
Simula-tionsOnly
FrontalResearchProgram
SideResearchProgram
EU,FMVSS
214
FMVSS301
FuelSystem
ResearchProgram
Oblique FMVSS208
barrier
SideResearchProgram
Offset In-line
FrontalResearchProgram
EU, IIHS,Frontal
ResearchProgram
FrontalResearchProgram
FuelSystem
ResearchProgram
OffsetOblique
FrontalResearchProgram
2-6
2.3 Overview of Potential Candidate Test Procedures
The following section examines each of the viable candidate test procedures for evaluation of frontalcrash protection. Following a brief summary, a review is presented of the status of each procedure, theagency’s experience with each procedure, the experience of external organizations with eachprocedure, and the expected lead time that would be necessary to complete the research andimplement each procedure.
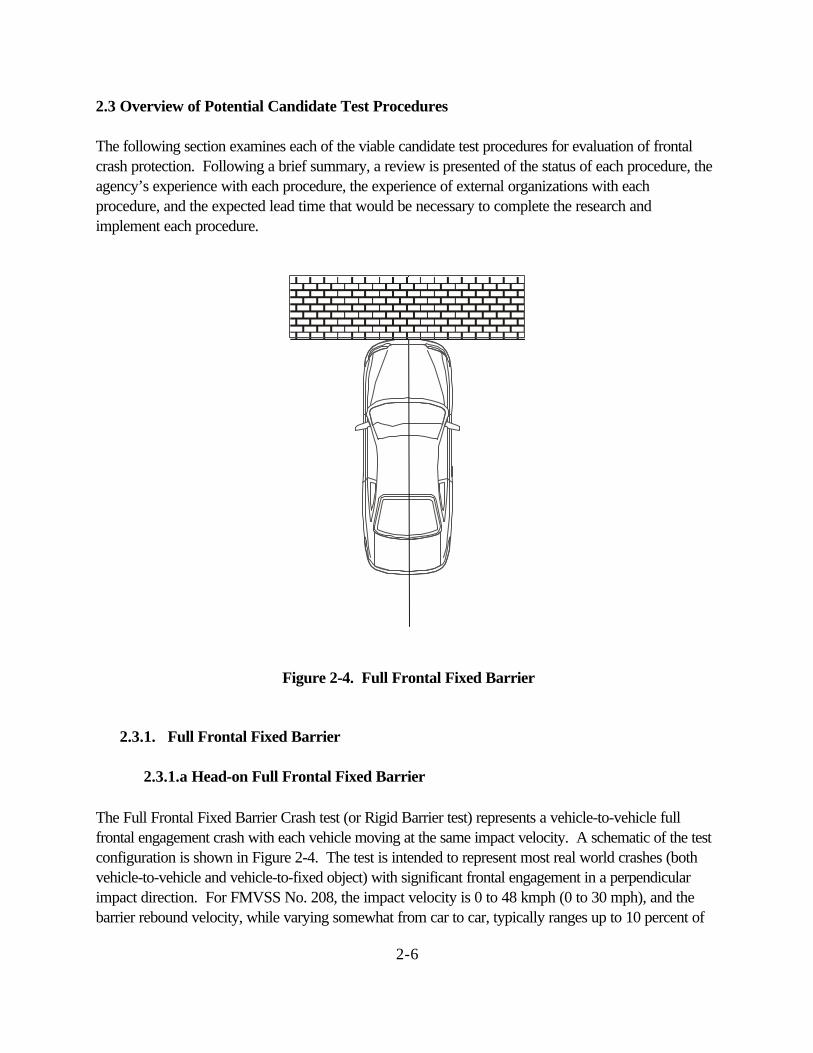
Figure 2-4. Full Frontal Fixed Barrier
2.3.1. Full Frontal Fixed Barrier
2.3.1.a Head-on Full Frontal Fixed Barrier
The Full Frontal Fixed Barrier Crash test (or Rigid Barrier test) represents a vehicle-to-vehicle fullfrontal engagement crash with each vehicle moving at the same impact velocity. A schematic of the testconfiguration is shown in Figure 2-4. The test is intended to represent most real world crashes (bothvehicle-to-vehicle and vehicle-to-fixed object) with significant frontal engagement in a perpendicularimpact direction. For FMVSS No. 208, the impact velocity is 0 to 48 kmph (0 to 30 mph), and thebarrier rebound velocity, while varying somewhat from car to car, typically ranges up to 10 percent of

2-7
the impact velocity for a change in velocity of up to 53 kmph. Note that although the rebound velocityvaries somewhat from vehicle to vehicle, it is small compared to the impact speed, and the rigid barriertest therefore exposes the belted or unbelted occupant to approximately the same change in velocity(48 kmph plus the rebound velocity) for any vehicle. It is a full systems test which evaluates theprotection provided by both the energy-absorbing vehicle structure and the occupant restraint system. Together with performance requirements, it ensures that the vehicle provides the same minimum level ofprotection in single vehicle crashes also regardless of the vehicles mass or size.
In the rigid barrier test, the vehicle changes velocity very quickly upon hitting the barrier. The crashproduces a high deceleration crash pulse of short time duration – frequently referred to as a “stiff”pulse. Figure 2-5 shows a plot of the pulse duration against the average deceleration for rigid barriertests of model years 1990 through 1998. (The average acceleration was determined by dividing thechange in velocity of the vehicle during the test by the duration of the crash pulse.) The data are plottedfor both the FMVSS No. 208 rigid barrier tests conducted at 48 kmph and for the New CarAssessment Program (NCAP) tests conducted at 56 kmph.. A reference curve based on theory isincluded, assuming a change velocity of the impact speed plus a 10 percent rebound velocity for eachof the two data sets. Figure 2-5 also shows the required corridors for the generic sled test. Acomparison of car-to-car tests in Figure 2-2 with the rigid barrier tests in Figure 2-5 demonstrate thatrigid barrier tests produce crash pulses which are representative of car-to-car tests. Once again, wenote that the generic sled pulse is representative of neither car-to-car tests nor rigid barrier tests. Theagency has used the rigid barrier test for many years, and estimates that 4,758 lives have been saved byOctober 1, 1999, by air bag equipped vehicles designed to meet the FMVSS No. 208 [3]. Should thegeneric sled test become the sole requirement for frontal crash protection evaluation, the benefits willbecome significantly reduced.
In the rigid barrier tests conducted by NHTSA, only minimal intrusion has been measured in the testingvehicles of the U.S. fleet. Prior to the mandatory requirements of FMVSS No. 208 and of NCAP, inthe late 1970s and early 1980s, extensive intrusion, particularly of the steering columns in light trucks,was a common occurrence. The kinetic energy of the crash (½ MV2) is dissipated by crush of vehicleand rebound velocity. To minimize the delta-V, structural designs attempt to minimize the residualrebound velocity away from the wall. As noted above, the rebound velocity varies somewhat fromvehicle to vehicle, and therefore the variation is small compared to the impact speed. Hence,approximately the same amount of kinetic energy per kilogram of vehicle mass will be dissipated foreach tested vehicle when tested at the same speed.
The rigid barrier test is used in crashworthiness standards in the U.S., Canada, Japan, and Australia. The test is widely accepted as repeatable and reproducible [4]. In the U.S., until the recent adoption ofthe alternative sled test, the test (including the oblique test) was the only basis for the occupantprotection standard FMVSS No. 208 (S.5.1) for unbelted and belted occupants. In Canada, Japan,and Australia, the test is used with belted occupants only. In addition, several other U.S. standards arealso based upon the results of this test including FMVSS No. 204, Steering Control Rearward

2-8
Displacement (48 kmph only), FMVSS No. 212, Windshield Mounting (0 to 48 kmph), FMVSS No.219, Windshield Zone Intrusion (0 to 48 kmph), and FMVSS No. 301, Fuel System Integrity (0 to 48kpmh).
Pu lse Dura t i on (ms)
0 2 5 5 0 7 5 1 0 0 1 2 5 150 1 7 5 2 0 0
Ave
rage
Acc
eler
atio
n (G
's)
0
5
1 0
1 5
2 0
2 5
3 0
208 Test DataT h e o r y ( 4 8 k m p h + 1 0 % )NCAP Tes t Da taT h e o r y ( 5 6 k m p h + 1 0 % )GSP Cor r ido rs
NCAP
2 0 8
G S P
Figure 2-5. FMVSS 208 and NCAP rigid barrier test data for model years 1990-1998
The rigid barrier test is used in the New Car Assessment Programs (NCAP) of the U.S., Japan, andAustralia. Unlike the FMVSS No. 208 rigid barrier test, the NCAP test is applied to belted occupantsonly at a speed of 56 kmph. Along with FMVSS No. 208 rigid barrier test, NCAP testing has led todesigns with reduced intrusion and softer crash pulses for both cars and light trucks and vans (LTVs)[5]. Comparison of NCAP results with real world crash statistics, prior to the introduction of air bags,show that rigid barrier tests have resulted in improved occupant protection [6]. A report to Congresson the effectiveness of air bags confirmed that vehicle systems developed according to this test areeffective in reducing injuries and fatalities in the U.S. crash environment [7].
Performance of New Model Vehicles with Redesigned Air Bag Systems in Rigid Barrier Tests: In1997, the generic sled test was introduced as a temporary alternative to the rigid barrier test to allowautomakers to rapidly install less aggressive air bags. To check the performance of these redesigned airbags in the new vehicle models, NHTSA has completed a series of FMVSS No. 208 rigid barrier testsin thirteen production vehicles with unbelted 50th percentile male dummies in the driver and right front

2-9
passenger seating positions. Additionally, three of the vehicle models were tested with unbelted 5th
percentile female dummies in the driver and right front seating positions. The results of these tests areprovided in Appendix A, Tables A-1 through A-4.
The test results for the 50th percentile male driver dummy are summarized in Table A-1. As reflected inthis table, the driver dummy in the 1999 Honda Acura RL exceeded the maximum femur loadrequirement. This was the only injury assessment reference value (IARV) exceeded for the driverdummy in these tests. It should be noted that the injury measures for the chest displacement, headinjury criterion, and neck injury criterion were below 90 percent of the IARVs for each of the thirteentested vehicles, with most below the 80 percent level. However, in examining the results for the chestGs, it is seen that two vehicles (i.e., the 1999 Dodge Intrepid and Honda Acura RL) were within the90 to 100 percent IARV range.
The test results for the 50th percentile male passenger dummy are summarized in Table A-2. Asreflected in this table, the passenger dummy in the 1998 Dodge Neon exceeded the IARV for the chestG. This was the only injury assessment reference value (IARV) exceeded for the passenger dummy inthese tests. It should be noted that the injury measures for the chest displacement, head injury criterion, neck injury criterion, and femur load requirement were below 90 percent of the IARVs for each of thethirteen tested vehicles, again with most below the 80 percent level. However, in examining the resultsfor the chest Gs, it is seen that one vehicles (i.e., the 1999 Dodge Intrepid) was within the 90 to100 percent IARV range
The test results for the 5th percentile female driver dummy are summarized in Table A-3. As reflectedin this table, three vehicles were tested--the 1999 Saturn SL, Dodge Intrepid, and Toyota Tacoma. The driver dummy injury measures in the Saturn were all below the 80 percent level of the IARVs. Whereas, the driver dummy in the Intrepid exceeded the IARVs for the chest displacement and theneck injury criteria. Furthermore, the chest G measurement was within the 90 to 100 percent IARVrange. For the Tacoma, the chest displacement and the femur load measurements were in the 90 to100 percent IARV range, while the chest G measurement was in the 80 to 90 percent IARV range. Note that each of the vehicles had head injury criterion measurements that were below the 80 percentlevel of the IARVs.
The test results for the 5th percentile female passenger dummy are summarized in Table A-4. As wasthe case with the driver dummy, the Saturn passenger dummy injury measures also were all below the80 percent level of the IARVs. The passenger dummy in the Intrepid exceeded the IARVs for chestGs. For the Tacoma, the passenger dummy exceeded the IARVs for the neck injury criterion. Notethat each of the vehicles had chest displacement and head injury criterion measurements that werebelow the 80 percent level of the IARVs.
Status: NHTSA and the auto industry have extensive experience with this test procedure using the 50th
percentile male dummy. The challenge will be in meeting the requirements for the 5th percentile female
2-10
dummy. From the agency’s limited test results, meeting these requirements is achievable in the timeframe of this rulemaking. Lead time: No lead time required to resume implementation of thisprocedure.
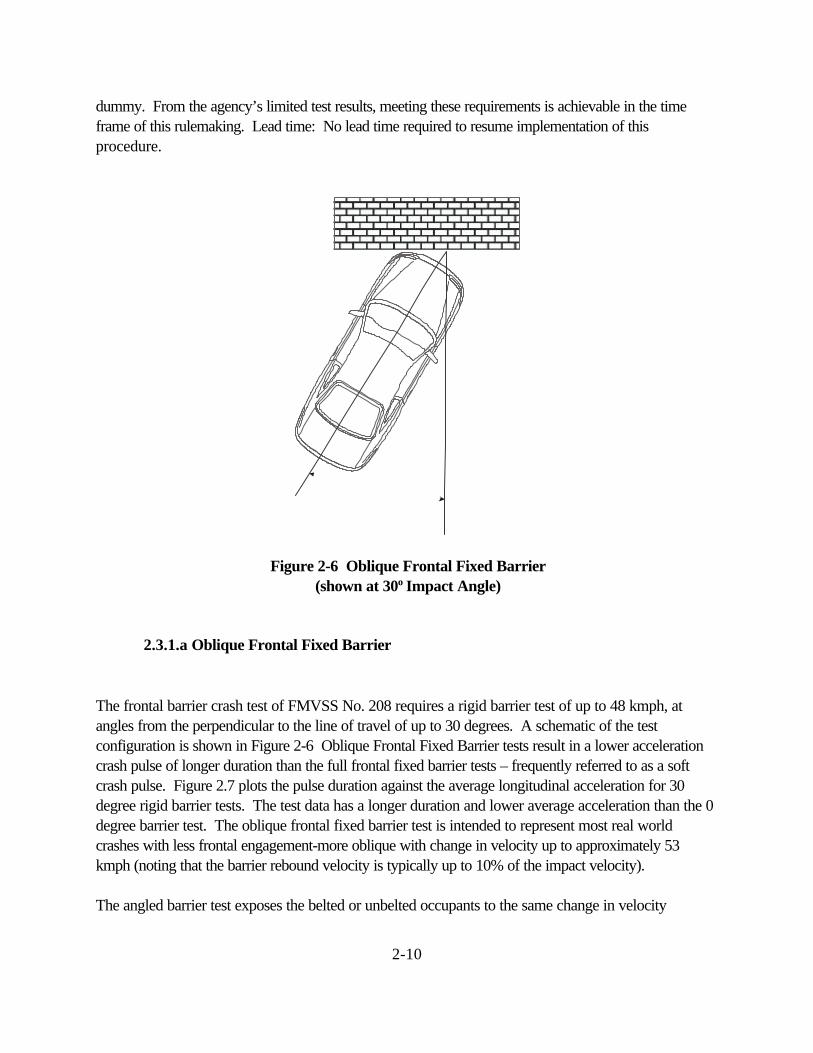
ìFigure 2-6 Oblique Frontal Fixed Barrier
(shown at 30o Impact Angle)
2.3.1.a Oblique Frontal Fixed Barrier
The frontal barrier crash test of FMVSS No. 208 requires a rigid barrier test of up to 48 kmph, atangles from the perpendicular to the line of travel of up to 30 degrees. A schematic of the testconfiguration is shown in Figure 2-6 Oblique Frontal Fixed Barrier tests result in a lower accelerationcrash pulse of longer duration than the full frontal fixed barrier tests – frequently referred to as a softcrash pulse. Figure 2.7 plots the pulse duration against the average longitudinal acceleration for 30degree rigid barrier tests. The test data has a longer duration and lower average acceleration than the 0degree barrier test. The oblique frontal fixed barrier test is intended to represent most real worldcrashes with less frontal engagement-more oblique with change in velocity up to approximately 53kmph (noting that the barrier rebound velocity is typically up to 10% of the impact velocity).
The angled barrier test exposes the belted or unbelted occupants to the same change in velocity

2-11
(approximately 0 to 53 kmph) for any vehicle. Like the perpendicular barrier test, it is a full systemstest which evaluates the protection provided by both the energy-absorbing vehicle structure and theoccupant restraint system. It ensures that the restraint system provide the same level of protection insingle vehicle crashes regardless of vehicle mass/size. Figure 2-7 demonstrates that the generic sledpulse roughly approximates the oblique frontal fixed barrier test at 30 degrees – a very benign test ofvehicle restraint systems.
In contrast to the perpendicular rigid barrier test, the angled barrier test evaluates air bags/passiverestraints to ensure occupant protection in other than longitudinal motions of the occupant. It alsoevaluates the protection offered by the air bag designs in preventing serious head contact with A-pillars,roof headers, and other components of the upper interior structure of the occupant compartment. Unlike the perpendicular test, the angled test provides some measure of the resistance of the occupantcompartment to intrusion. The angled barrier test provides some ability to evaluate the degree of lowerlimb protection afforded by the compartment to localized intrusion.
P u l s e D u r a t i o n ( m s )
0 2 0 4 0 6 0 80 1 0 0 1 2 0 1 4 0 1 6 0 1 8 0 2 0 0
Ave
rage
Acc
eler
atio
n (G
's)
0
5
10
15
20
25
30
3 0 D e g r e e B a r r i e r T e s t D a t aG S P C o r r i d o r s
Figure 2-7 30 Degree Rigid Barrier Test Data
The kinetic energy of the crash (½ MV2) is dissipated by crush of vehicle, residual final velocity, andvehicle rotation. To minimize the delta-V, structural designs attempt to minimize the residual reboundvelocity away from the wall. Although the rebound velocity frequently varies somewhat from vehicle tovehicle, it is small compared to the impact speed. Hence, approximately the same amount of kineticenergy per kilogram of vehicle mass will be dissipated in the vehicle structure.
The angled barrier test is a component of crashworthiness standards in the U.S., Canada, Japan, andAustralia. In the U.S., the test is a part of the occupant protection standard FMVSS No. 208 (Section
2-12
5.1) for unbelted and belted occupants. In Canada, Japan, and Australia, the test is used with beltedoccupants only. In addition, one other U.S. standard is based upon the results of this test--FMVSSNo. 301, Fuel System Integrity.
Status: The auto industry has extensive experience with this test procedure. This procedure is availablefor use without additional research. However, only minimum testing with the angled barrier has beenconducted at NHTSA (one test in recent years, a few early NCAP tests) – primarily because the softpulse of the angled barrier test makes it a less severe test of the occupant restraint system. No leadtime required to resume implementation of this procedure.
2.3.2. Sled Test for Unbelted Occupants
The generic sled test was intended as a temporary measure to allow rapid introduction of redesigned airbags. Unlike a full scale vehicle crash test, a sled test does not, and cannot, measure the actualprotection an occupant will receive in a crash. The current sled test measures limited performanceattributes of the air bag, but not the performance provided by the vehicle occupant crash protectionsystem or even the full air bag system. Several inherent flaws prevent the generic sled test from beingan adequate measure of frontal crash protection.
First, the sled test does not replicate the actual timing of air bag deployment. Deployment timing is acritical component of the safety afforded by an air bag. If the air bag deploys too late, the occupantmay already have struck the interior of the vehicle before deployment begins. Air bag deploymenttiming is determined by parts of the air bag system which are not tested during a sled test, i.e., the crashsensors and computer algorithm. While this performance is tested in a barrier test, there is no crashinvolved in a sled test to trigger air bag deployment based on the performance of the crash sensors andcomputer algorithm. Instead, the air bag is simply deployed at a predetermined time during a sled test. The time is artificial – it may have nothing to do with the time when the air bag would deploy during anactual real world crash of the same vehicle
Second, the current generic sled pulse does not replicate the actual crash pulse of a vehicle. The actualcrash pulse of a vehicle is a critical factor in occupant protection. The pulse takes into account thespecific manner in which the front of the vehicle deforms during a crash, thereby absorbing energy. However, the current sled test uses an identical crash pulse to test all vehicles, which is somewhattypical of the crash pulse of a large passenger car. Light trucks and smaller cars typically have much"stiffer" crash pulses than that of the sled test. This means that deceleration occurs more quickly than isindicated by the sled test. Thus, the sled test result may falsely portray the occupant protectioncharacteristics of a vehicle. Third, a sled test does not measure protection and harm from actual vehicle systems, e.g., steeringwheel intrusion into the driver, or pillar or toe-board intrusion and related injuries to the driver or apassenger that may result. Since a sled test does not involve any kind of crash, it does not test for such
2-13
intrusions in crashes. Thus, the sled test may falsely indicate that a vehicle provides good protectionbased on dummy injury criteria when, in actuality as a result of steering wheel or other intrusion, thevehicle provides poor protection.
Fourth, the sled test does not measure how a vehicle performs in oblique crashes. It only tests aperpendicular impact. Real world frontal crashes occur at varying angles, resulting in occupants movingtoward the steering wheel and instrument panel in a variety of trajectories. The angle test component ofthe barrier test requirement ensures that a vehicle is tested under these real world conditions.
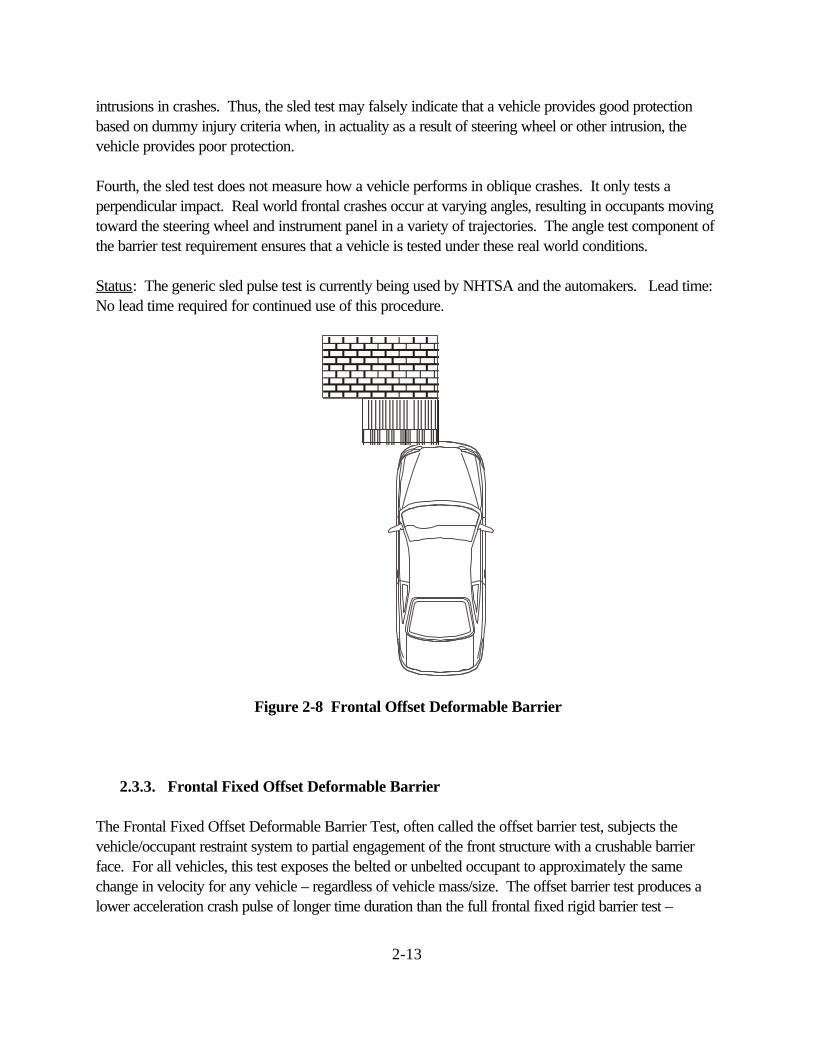
Status: The generic sled pulse test is currently being used by NHTSA and the automakers. Lead time: No lead time required for continued use of this procedure.
Figure 2-8 Frontal Offset Deformable Barrier
2.3.3. Frontal Fixed Offset Deformable Barrier
The Frontal Fixed Offset Deformable Barrier Test, often called the offset barrier test, subjects thevehicle/occupant restraint system to partial engagement of the front structure with a crushable barrierface. For all vehicles, this test exposes the belted or unbelted occupant to approximately the samechange in velocity for any vehicle – regardless of vehicle mass/size. The offset barrier test produces alower acceleration crash pulse of longer time duration than the full frontal fixed rigid barrier test –

2-14
frequently characterized as a “soft” pulse. It is a full systems test which evaluates the response of theenergy-absorbing vehicle structure and the occupant restraint system to a low severity crash pulse. Figure 2-9 plots the pulse duration and average acceleration for 40 and 60 kmph offset deformablebarrier tests. The average acceleration levels for the 40 kmph cases are lower than the 60 kmph cases,and roughly approximate the generic sled pulse in average amplitude. To obtain the same level ofprotection as the full frontal rigid barrier test, the offset barrier test must either be run at a higher speed,or coupled with the full frontal rigid barrier test.
The offset barrier test is intended to represent most real world crashes with less frontal engagement-inperpendicular impacts with change in velocity up to approximately 56-60 kmph based upon an impactspeed of 56 kmph. This test frequently results in significant occupant compartment intrusion in currentproduction vehicles. The test is intended to evaluate air bags/passive restraints to assure occupantprotection in more than just the longitudinal direction. It requires that vehicle designs prevent serioushead contact with A-pillars, roof headers, and other components of the upper interior structure of theoccupant compartment. The test provides the capability to evaluate upper and lower leg protection dueto localized intrusion. In Europe, it is the only proposed test for evaluating frontal occupant protection.
P u l s e D u r a t i o n ( m s )
0 2 5 5 0 7 5 1 0 0 1 2 5 1 5 0 1 7 5 2 0 0
Ave
rage
Acc
eler
atio
n (G
's)
0
5
1 0
1 5
2 0
2 5
3 0
40 kmph O f f se t Ba r r i e r60 kmph O f f se t Ba r r i e rG S P C o r r i d o r s
Figure 2-9. Frontal 40 % offset deformable barrier test data
The kinetic energy of the crash is dissipated by crush of vehicle, crush of the deformable barrier, anyresidual rebound velocity, and vehicle rotation. The kinetic energy of a crash is equal to ½MV2 whereM is the mass of the vehicle and V is the impact velocity of the vehicle. To minimize the delta-V,

2-15
structural designs attempt to minimize the residual rebound velocity away from the wall. Because thedeformable barrier bottoms-out in all tests which NHTSA has analyzed, the barrier face absorbs afixed quantity of the crash energy. Hence, the relative kinetic energy (KE) dissipated by a given vehiclewill vary significantly.
Percent KE Absorbed by the Vehicle = (½ MV2 - KE absorbed by the Barrier) / (½ MV2) x 100
The offset barrier test has been proposed for European Union Directive for belted occupants at a speedof 56 kmph. This test has potential as an alternative to the FMVSS No. 208 full barrier test forunbelted occupants. Adoption of this test for FMVSS No. 208 would establish harmonization with theEU, and would provide the ability to evaluate lower limb injuries more effectively than with the rigidperpendicular or rigid oblique barrier test. As part of a research program on air bag crash protection,Transport Canada has conducted a large series of 40 kmph (25 mph) 40 percent offset deformablebarrier tests. The tests have used belted 5th percentile female and 50th percentile male dummies.
In September 1996, the U.S. Congress directed NHTSA to conduct a feasibility study towardestablishing a FMVSS for frontal offset crash testing. Congress stated that these activities shouldreflect ongoing efforts to enhance international harmonization of safety standards. In response to thisCongressional directive, NHTSA has recently completed a series of five (5) offset barrier crash tests. In these tests, the vehicle was impacted at 60 kmph into a fixed deformable barrier that overlaps 40percent of the front of the vehicle. The tests used belted 5th percentile female dummies and 50th
percentile male dummies [8].
The offset barrier test is used in NCAP in Europe, Australia, and US (IIHS). These NCAP offsetbarrier tests use a higher speed - 64 kmph and are restricted to belted occupants only. The IIHS testshave demonstrated excessive intrusion in many current production vehicles. IIHS has shown that betterperforming vehicles, i.e., those with less intrusion, can and often do have softer crash pulses asmeasured in full barrier test indicating that such tests do not necessarily need to lead to more aggressivefrontal structure designs [9]. Real world Australian study correlates results to improved occupantprotection [10].
Status: At the time of the first publication of this study (i.e., September 1998), the use and assessmentto date had been focused on belted occupants. Since that time, the agency has conducted research toevaluate the possible extension of this test procedure to unbelted occupants and an array of dummysizes. While this research has provided limited test data, the results indicate the feasibility of meeting theperformance requirements associated with such a test. The major challenge that would be faced by theautomakers would be in the development of improved crash sensing that provide timely deployment ofthe air bag. However, the improved sensing for this crash condition has the potential of increaseddeployments in lower severity crash events. Lead time: It is now assumed that no additional lead timeis required for implementation of this test procedure.
2-16
ì
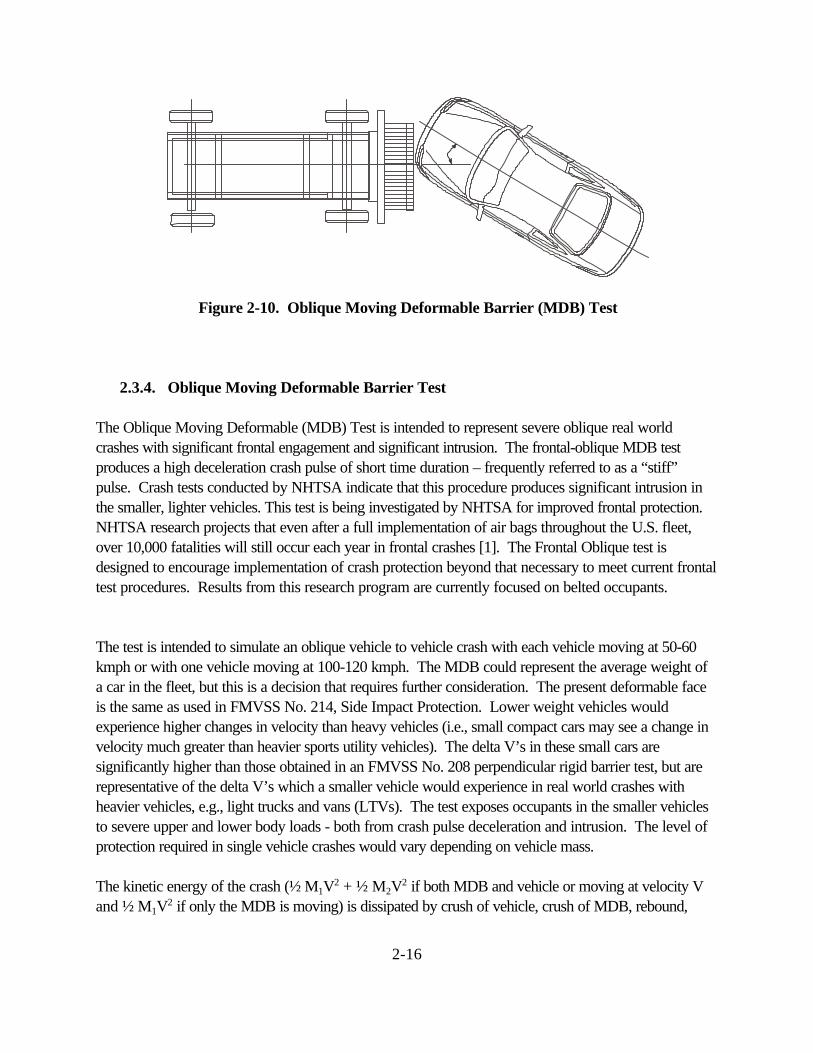
Figure 2-10. Oblique Moving Deformable Barrier (MDB) Test
2.3.4. Oblique Moving Deformable Barrier Test
The Oblique Moving Deformable (MDB) Test is intended to represent severe oblique real worldcrashes with significant frontal engagement and significant intrusion. The frontal-oblique MDB testproduces a high deceleration crash pulse of short time duration – frequently referred to as a “stiff”pulse. Crash tests conducted by NHTSA indicate that this procedure produces significant intrusion inthe smaller, lighter vehicles. This test is being investigated by NHTSA for improved frontal protection. NHTSA research projects that even after a full implementation of air bags throughout the U.S. fleet,over 10,000 fatalities will still occur each year in frontal crashes [1]. The Frontal Oblique test isdesigned to encourage implementation of crash protection beyond that necessary to meet current frontaltest procedures. Results from this research program are currently focused on belted occupants.
The test is intended to simulate an oblique vehicle to vehicle crash with each vehicle moving at 50-60kmph or with one vehicle moving at 100-120 kmph. The MDB could represent the average weight ofa car in the fleet, but this is a decision that requires further consideration. The present deformable faceis the same as used in FMVSS No. 214, Side Impact Protection. Lower weight vehicles wouldexperience higher changes in velocity than heavy vehicles (i.e., small compact cars may see a change invelocity much greater than heavier sports utility vehicles). The delta V’s in these small cars aresignificantly higher than those obtained in an FMVSS No. 208 perpendicular rigid barrier test, but arerepresentative of the delta V’s which a smaller vehicle would experience in real world crashes withheavier vehicles, e.g., light trucks and vans (LTVs). The test exposes occupants in the smaller vehiclesto severe upper and lower body loads - both from crash pulse deceleration and intrusion. The level ofprotection required in single vehicle crashes would vary depending on vehicle mass.
The kinetic energy of the crash (½ M1V2 + ½ M2V2 if both MDB and vehicle or moving at velocity Vand ½ M1V2 if only the MDB is moving) is dissipated by crush of vehicle, crush of MDB, rebound,

2-17
vehicle(s) rotation, and vehicle(s) residual velocity. Because the deformable barrier absorbs anessentially fixed share of the crash energy, the relative kinetic energy dissipated by a given vehicle willvary significantly.
Percent KE Absorbed by the Vehicle = (½ MV2 - KE absorbed by the MDB) / (½ MV2) x 100
Status: Experience with this test is limited. The repeatability and reproducibility of this procedure arebeing addressed in RD programs. The assessment to date has been focused on belted occupants. Anyextension to unbelted occupants and to an array of dummy sizes will require additional study. Leadtime: Completion of research using this test is estimated to require 2-3 years.
Figure 2-11. Full Frontal Fixed Deformable-face Barrier (FFFDB)
2.3.5. Full Frontal Fixed Deformable-face Barrier (FFFDB)
The Full Frontal Fixed Deformable-face Barrier (FFFDB) test extends the concept of the deformableoffset barrier test to full engagement of the vehicle structure. In this test, a vehicle is crashed into a rigidbarrier equipped with a deformable face. The front structure of the vehicle is fully engaged. This testexposes the belted or unbelted occupant to approximately the same change in velocity of 0 to 53 kmph(noting that the rebound velocity varies from vehicle to vehicle, but is typically 10% of the impact

2-18
velocity). It is a full systems test which evaluates the protection provided by both the energy-absorbingvehicle structure and the occupant restraint system. Depending on the design of the deformable face,the test can be designed to require approximately the same level of protection in single vehicle crashesregardless of vehicle mass/size.
The FFFDB test produces a lower deceleration crash pulse of longer time duration – commonlyreferred to as a “soft” pulse. As the more severe rigid barrier test at 48 kmph produces no intrusion,likewise, the less severe FFFDB test could be expected to also produce no intrusion in vehicles of thecurrent U.S. fleet.
The kinetic energy of the crash (½ MV2) is dissipated by crush of vehicle, crush of the deformablebarrier, and any residual rebound velocity. The relative kinetic energy dissipated by a given vehicle isdetermined as shown below:
Percent KE Absorbed by the Vehicle = (½ MV2 - KE absorbed by the Barrier) / (½ MV2) x 100
Status: This test procedure has not been run by the agency. No data are available to assessrepeatability or reproducibility. The agency’s experience with the offset deformable barrier wouldapply here. However, the exact characteristics of the full deformable barrier would need further study. Furthermore, an oblique version of this test would require development and evolution. Lead time: 1-2years to complete research using this test procedure.
2.4. Summary
This section provides an examination of the candidate test procedures available for evaluation of frontalcrash protection through crash testing. The discussion has provided the status of each procedure withrespect to regulatory testing, NCAP testing, and research testing. Included have been both theagency’s and external organizations’ experience with each procedure, and the expected lead timenecessary to complete research for each procedure in a revised FMVSS No. 208. From this review, ithas been determined that the rigid barrier, the oblique rigid barrier, the frontal offset deformable barrier,and sled test procedures are available immediately. The full frontal fixed deformable-face barrier maytake 1-2 years to complete research and the moving deformable barrier test may take 2-3 years.

2-19
0.0
5.0
10.0
15.0
20.0
25.0
30.0
0.05 0.075 0.1 0.125 0.15 0.175 0.2
Pulse Duration
Av
era
ge
De
ce
lera
tio
n Approximate Region of Car-to-Car Tests at ∆Vs from 48-60 kmph
Stiff
Soft
Offset Tests40 kmph
Sled PulseRigid Barrier,30 Degrees
NCAP
Rigid Barrier,48 kmph
Offset Tests60 kmph
Figure 2.12 Comparison of Test Methods
As part of the analysis undertaken for this section, the vehicle crash response characteristics of the car-to-car tests were compared to those of the candidate test procedures. Figure 2.12 above provides acomposite plot showing the characteristics from each of these test procedures along with theapproximated region represented by car-to-car crash tests. Here it is seen that, while some of the car-to-car tests result in “soft” crash pulses, a majority of these tests are characterized by a “stiff” pulse. The circled area in Figure 2-12 shows the approximate region of the car-to-car crash tests with deltaVs between 48 and 60 kmph. In these delta-velocity ranges, the test procedure which is mostrepresentative of car-to-car tests is the full frontal rigid barrier test. The generic sled pulse is clearly notrepresentative of these car-to-car crashes.
2.5. References
1. ____, “Preliminary Economic Assessment, FMVSS No. 208, Advanced Air Bags,” NationalHighway Traffic Safety Administration, September 1998.
2. Ross, H. E., Sicking, D. L., Zimmer, R. A., and Michie, J. D., “Recommended Procedures forthe Safety Performance Evaluation of Highway Features,” NCHRP Report 350, TransportationResearch Board, Washington, D.C., 1993.
3. ____, “Fourth Report to Congress: Effectiveness of Occupant Protection Systems and Their Use(Draft)” National Highway Traffic Safety Administration, June 1998.
4. Mackey, John M. and Gauthier, Charles L., “Results, Analysis, and Conclusions of NHTSA’s35 MPH Frontal Crash Test Repeatability Program,” SAE Paper No. 840201, 1984.
2-20
5. Hackney, James R. and Kahane, Charles J., “The New Car Assessment Program: Five StarRating System and Vehicle Safety Performance Characteristics,” SAE Paper No. 950888, SAEInternational Congress and Exposition, Detroit, MI, 1995.
6. Kahane, Charles J., Hackney, James R., and Berkowitz, Alan M., “Correlation of VehiclePerformance in the New Car Assessment Program with Fatality Risk in Actual Head-onCollisions,” 14th International Technical Conference on the Enhanced Safety of Vehicles,Munich, Germany, May 1994.
7. ____, “Third Report to Congress: Effectiveness of Occupant Protection Systems and TheirUse,” National Highway Traffic Safety Administration, Report No. DOT HS 537, December1996.
8. Park, B., Morgan, R. M., Hackney, J. R., Lee, J., Stucki, S. L., and Lowrie, J.C., “FrontalOffset Crash Test Study Using 50th Percentile Male and 5th Percentile Female Dummies”,16th International Technical Conference on the Enhanced Safety of Vehicles, Windsor, Canada,June 1998.
9. Meyerson, S., Zuby, D., and Lund, Adrian, “Repeatability of Frontal Offset Crash Tests,”15th International Technical Conference on the Enhanced Safety of Vehicles, Melbourne,Australia, May 1996.
10. Fildes, Brian, Deery, Hamish, Lenard, Jim, Kenny, David, Edwards-Coghill, Kate, andJacobsen, Simon, “Effectiveness of Air Bags in Australia,” 16thInternational Technical Conferenceon the Enhanced Safety of Vehicles, Windsor, Canada, June 1998.
3-1
CHAPTER 3. NASS ANALYSIS OF FRONTALIMPACTS
3.1. Introduction
To assess the relationship between the various test procedures and real world crashes, a methodologyfor estimating the target population for each test type was developed. The procedure estimates thenumber of drivers exposed to crashes as well as the number exposed to MAIS$3 injuries, by variousfrontal test procedures, in a future fleet where all the vehicles are equipped with frontal air bags. Theanalysis was limited to drivers since NASS data on passengers with air bags is still quite limited. Hence, this analysis provides a means of ranking different tests based solely on the “target” crashpopulations addressed by the test.
Data from the 1988 through 1997 NASS-CDS files are used in these analyses [1]. For NASS years1988 to 1997 there are about 3,770 air bag equipped vehicles involved in frontal crashes, of which 847of the drivers had moderate and greater injuries (MAIS$2), 408 drivers had serious and greaterinjuries (MAIS$3), and 89 drivers had fatal injuries. Frontal impacts were defined as follows: non-rollover and principal direction of force (DOF1) = 11, 12, or 1 o’clock positions or DOF1 = 10 or 2o’clock positions with the crash damage forward of the A-pillar.
NASS cases are assigned a weighting factor which is used to formulate a national estimate from thesampled data. These factors produce “weighted” estimates of 97,585 drivers in frontal crashes with moderate and greater injuries, 32,143 drivers in frontal crashes with serious and greater injuries, and4,437 drivers in frontal crashes with fatal injuries. All calculations used in these analyses are based onthe NASS-CDS weighted national estimates. The details of this methodology and resulting estimatedannual target populations for each test are presented in Section 3.3.
Section 3.2 provides some background information on several analyses related to frontal crashes. Included in these analyses are 1) crash descriptions considering crash modes based solely on crashpulse and a combination of crash pulse and intrusion and 2) an analysis of deltaV for several intrusionlevels and injury level. This section distinguishes frontal crashes by general impact type: full barrier andleft and right offset without specifically identifying what the test will be to address these type of impacts.
See Section 5, of the report, for a discussion of the frontal crash pulse stiffness (soft and stiff) definitionsused in this section.

3-2
3.2. General Findings on Frontal Crash Modes
This section provides background analyses, which presents to the reader data to put the later analysis incontext. Type of crash mode analysis, i.e., crash pulse only or crash pulse combined with intrusion, ananalysis of the size of the frontal crash exposure, and an analysis of deltaV’s is presented.
3.2.1 Crash Description - Effect of Crash Pulse With and Without Intrusion In a paper presented at the 16th International Technical Conference on the Enhanced Safety ofVehicles, Stucki, et. al., presented a method of grouping impact conditions [2]. Drivers in frontalcrashes with air bags are grouped into different crash modes based on impact direction (collinear oroblique), degree of overlap, and object struck (other vehicle or fixed object). As noted in Section 2,two adverse results of a crash are occupant compartment deceleration severity and survival spacedegradation. For analytical purposes, assuming that the driver injury is a result of crash severity andthat the crash pulse and impact intrusion define the severity, the impact conditions which may berepresented by a full barrier, and left or right offset, or other impact modes are shown in Table 3-1. Table 3-1 presents the distribution of frontal crashes, serious injury crashes, and fatal crashes.
Table 3-1. Crash Description and Driver Exposure, Serious Injury and Fatality for FrontalCrash Modes Considering Crash Pulse and Intrusion (1988-1997 NASS-CDS)
Crash Mode Crash Description(Pulse/Intrusion)
Percentage of
Frontals MAIS $3$Serious Injury
Fatalities
Full Barrier 1. All distributed damage, collinearimpacts2. Distributed damage, oblique, fixedobject
22 34 14
Left Offset 1. All left offset2. Distributed damage, oblique,vehicle-to-vehicle
34 36 53
Right Offset 1. All right offset2. Distributed damage, oblique,vehicle-to-vehicle
35 23 18
Other Other 9 7 15
Total Total 100 100 100
Assuming that crash pulse alone is a sufficient indicator of crash severity; the resulting driver exposure,serious injury, and fatal injury distributions are shown in Table 3-2. If it is assumed that intrusion is notimportant then many of the offset impact crash pulses may be similar to the full barrier pulse. The roleof intrusion and crash pulse will be evaluated later in the section.

3-3
Table 3-2. Crash Description and Driver Exposure, Serious Injury and Fatality for FrontalCrash Modes Considering Crash Pulse Only (1988-1997 NASS-CDS)
Crash Mode Crash Description(Pulse Only)
Percentage of
Frontals MAIS $ 3$Serious Injury
Fatalities
Full Barrier 1. Collinear,. Overlap> 55%2. Oblique, Overlap>33%
57 67 45
Left Offset 1. Left collinear, Overlap #55%2. Oblique, Overlap #33%
12 17 27
Right Offset 1. Right collinear, Overlap #55%2. Oblique, Overlap #33%
14 9 13
Other Other 17 7 15
Total Total 100 100 100
3.2.2 Injuries by Crash Mode
As described in reference 1, the annual number of injuries and fatalities to drivers in frontal impactmodes can be estimated based on data from the Agency’s Preliminary Economic Assessment onAdvanced Air Bags [3]. These estimates for two different levels of injuries and fatalities are presentedin Table 3-3.
Table 3-3, Estimated Annual Injuries and Fatalities by Crash Mode, Drivers in FrontalCrashes (1988-1997 NASS-CDS)
Crash Mode MAIS >= 2 MAIS >= 3 Fatalities
Full Barrier 31,200 11,900 1,190
Left Offset 43,200 12,600 4,505
Right Offset 37,200 8,050 1,530
Other 8,400 2,450 1,275
Total 120,000 35,000 8,500
3.2.3 DeltaV Analysis of Frontal Crashes
Historically, FMVSS No. 208 test requirements included and are proposed to include impact speedsup to 48 kmph (30 mph), including crash modes which will address full barrier or offset impacts. Thepercentage of driver injuries and fatalities in frontal crashes up to and including a velocity change(deltaV) of 48 kmph and over 48 kmph for full barrier and left offset crash modes are shown in Table3-4 for the crashes involving air bag equipped vehicles.
3-4
0%
20%
40%
60%
80%
100%
0 16 32 48 64 >64
Delta V (kmph)
Cu
mu
lati
ve %
None 2.5-15 cm >15 cm All
Figure 3-1. Cumulative Percent of All Drivers in Frontal Crashes by Delta V for DifferentIntrusion Amounts
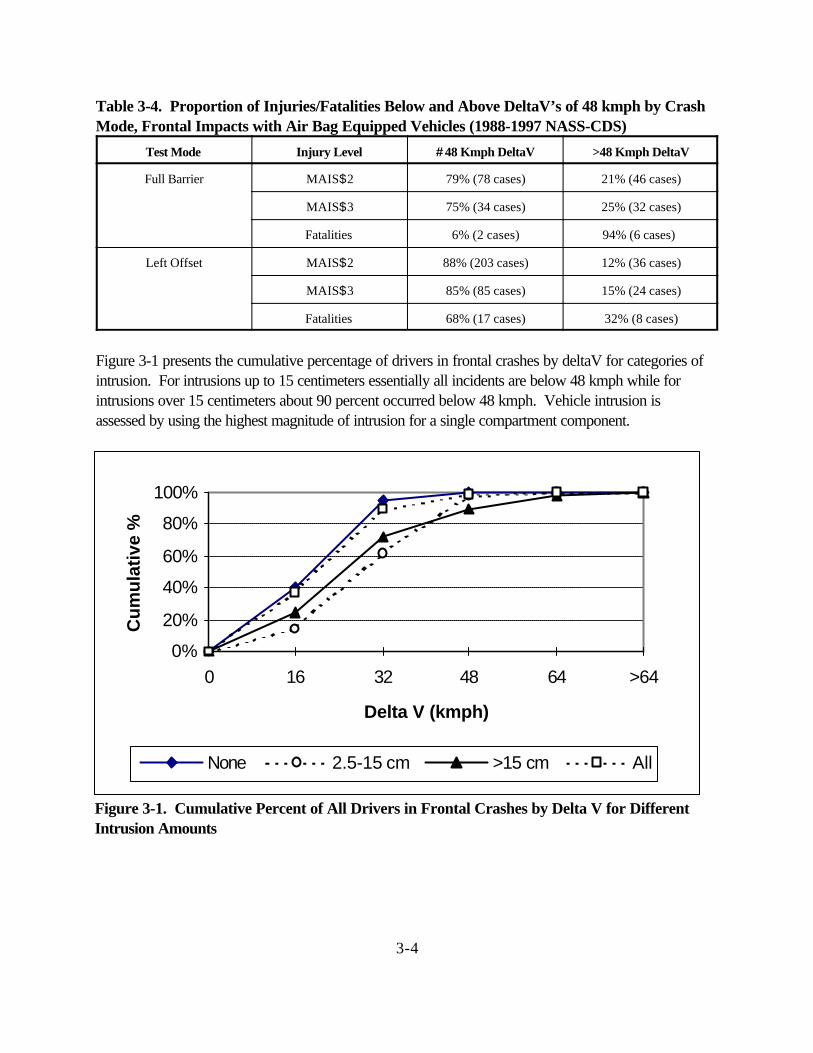
Table 3-4. Proportion of Injuries/Fatalities Below and Above DeltaV’s of 48 kmph by CrashMode, Frontal Impacts with Air Bag Equipped Vehicles (1988-1997 NASS-CDS)
Test Mode Injury Level #48 Kmph DeltaV >48 Kmph DeltaV
Full Barrier MAIS$2 79% (78 cases) 21% (46 cases)
MAIS$3 75% (34 cases) 25% (32 cases)
Fatalities 6% (2 cases) 94% (6 cases)
Left Offset MAIS$2 88% (203 cases) 12% (36 cases)
MAIS$3 85% (85 cases) 15% (24 cases)
Fatalities 68% (17 cases) 32% (8 cases)
Figure 3-1 presents the cumulative percentage of drivers in frontal crashes by deltaV for categories ofintrusion. For intrusions up to 15 centimeters essentially all incidents are below 48 kmph while forintrusions over 15 centimeters about 90 percent occurred below 48 kmph. Vehicle intrusion isassessed by using the highest magnitude of intrusion for a single compartment component.

3-5
For the limited number of crashes with air bag equipped vehicles available in the NASS CDS 1988-1997, almost 100 percent of drivers are involved in frontal crashes that have deltaV’s below 48 kmph. About 80 percent of the drivers with serious injuries are in impacts with deltaV’s below 48 kmph, seeFigure 3-2.
0%10%20%30%40%50%60%70%80%90%
100%
0 16 32 48 64 >64
Delta V (kmph)
Cu
mu
lati
ve P
erce
nt
All Air Bag MAIS>=3
Figure 3-2. Cumulative Percent of Drivers with Air Bags in Frontal Crashes by Delta V forall Exposures and MAIS$3 Injury
3.3. Analysis of NASS Crash Data by Crash Mode, Pulse Type, and Intrusion to PredictTarget Populations for Potential Tests
This section documents a procedure to estimate the number of drivers exposed to crashes as well asthe number exposed to MAIS$3 injuries, by various frontal test procedures, in a future fleet where allthe vehicles are equipped with frontal air bags. Further, it uses this procedure to predict the number ofcrashes related to each test procedure.
Frontal crashes with a deltaV of 48 kmph and less are segregated by impact mode (full barrier and leftand right offset), by crash pulse (stiff or soft, as defined in Section 2), and by three levels of intrusion(none, up to 15 centimeters, and over 15 centimeters) into appropriate groups based on the testparameters of each potential test. Vehicle intrusion is assessed by using the highest magnitude ofintrusion for a single compartment component.
The annual distribution of vehicle (or driver) involvement (exposure) by the crash parameters, describedabove, is assumed to be the same for a future air bag fleet as for the current fleet for all vehicles. Theannual exposure for each specified impact type (barrier, left or right offset), intrusion amount and stiff orsoft crash pulse is computed. The likelihood of drivers in vehicles with air bags receiving serious or
3-6
greater injury (MAIS$3) in frontal collisions is also computed for these crash variables. The MAIS$3injury likelihood for drivers with air bags for each specified combination of the crash variables is thenapplied to the corresponding exposure to estimate the number of seriously injured drivers for eachspecific crash condition. These injured drivers are then apportioned into the tabular cells of crashmode, pulse type, and intrusion amount. The candidate tests are defined by their crash mode, pulsetype, and intrusion amount; and the appropriate cells in the exposure and MAIS$3 injury tables areapportioned to the specific test accordingly.
The analysis is separated by drivers with belts “as used”, i.e., with no discrimination of belt use, and bydrivers without belts, since the proposed test procedures are for unbelted occupants. However, asshown in the following Tables 3-5 and 3-6 the unweighted numbers of drivers with air bags andMAIS$3 injuries are infrequent. Although the driver MAIS$3 incidences within the table cells areprobably not sufficient for valid conclusions, the proportions for each test procedure appear to besimilar as for the “as used’ observations. Because of the limited incidences in certain table cells for theunbelted driver population the remaining discussions and analysis will address the population of driverswith belts “as used.”
Table 3-5 shows the intrusion distributions of all vehicles in frontal impacts for deltaV’s of 48 kmph orless by type of impact and crash pulse (soft or stiff), from NASS-CDS years 1988 to 1997. By designof NASS, these data should approximately represent national estimates of vehicles, or drivers, incrashes with deltaV’s of 48 kmph or less over a period of ten years (1988 through 1997.) However,since deltaV is unknown in about 50 percent of cases, overall, the data must also be adjusted for thesemissing values. The annual estimate of drivers in frontals with deltaV equal or less than 48 kmph shownin Table 3-5 is then the total estimate divided by the ten years of NASS and multiplied by a factor oftwo to adjust for cases of unknown deltaV. This analysis produces an annual estimate of 1,456,619drivers (or vehicles) in frontal crashes with a deltaV of 48 kmph or less.
The number of drivers with serious or greater injuries (MAIS$3) in frontal crashes with deltaV’s lessthan or equal to 48 kmph, and the number in each cell as a percent of all drivers for that cell (labeled“Risk%”), is shown in Table 3-6 by crash pulse type and intrusion amount.
Except for crash pulses with intrusions of 2.5 to 15 centimeters, drivers in crashes with “stiff “ crashpulses have a slightly higher likelihood of MAIS$3 injuries than those with “soft” pulses. See Figure 3-3. The likelihood of a driver with an air bag receiving a MAIS$3 injury to the

3-7
0%
5%
10%
15%
20%
25%
30%
35%
None 2.5-15 cm >15 cm Total
Intrusion Amount
MA
IS>=
3 R
isk
Full Barrier L.Off./Stiff L.Off./Soft
Figure 3-3. MAIS$3 Likelihood by Intrusion and Crash Pulse Type, Delta V#48 Kmph,Drivers with Air Bags in Frontal Crashes, 1988-1997 NASS
0.00%
0.50%
1.00%
1.50%
2.00%
2.50%
3.00%
Head/Chest Legs Arms
Body Region
Inju
ry R
isk
%
Full Barrier L.Off./Stiff L.Off./Soft All Stiff All Soft
Figure 3-4. AIS$3 Likelihood by Crash Pulse Type, Body Region AIS=MAIS, Delta V#48 Kmph, Drivers with Air Bags in Frontal Crashes, 1988-1997 NASS
3-8
head/chest, leg and body regions is shown in Figure 3-4, for crash mode and crash pulse type (stiff orsoft). The highest likelihood of MAIS$3 head or chest injuries, occur in full barrier impacts with stiffcrash pulses. Serious leg injuries, not life-threatening, occur at a higher rate in offset crashes. Thus, thegeneral finding is that stiff pulses produce more head and chest injuries while soft crashes produce moreleg injuries.
The annual counts of all drivers and for drivers with MAIS$3 injuries are computed for the differentcrash pulses and intrusion magnitude. For exposure, the annual count is simply the percent of allfrontals (% of Front) in each cell of Table 3-5 multiplied by the estimated annual number of drivers withair bags in frontal impacts (1,456,619) in the same table. The results are shown in Table 3-7. Forexample, for the full barrier with no intrusion and belts “as used”, the estimate is: 1,456,619 * 16.42%=239,154 drivers.
For annual estimates of drivers with serious to fatal injuries, the annual numbers of MAIS$3 injuries isestimated by taking the risk in each cell of Table 3-6 and applying it to the estimated annual number ofexposed drivers in each cell of Table 3-5. The drivers with MAIS$3 injury in each cell is “Risk%" forthe cell multiplied by the annual count for the corresponding cell. Again, these results are shown inTable 3-7.
The number of drivers in frontal crashes, both exposed and with MAIS$3 injuries, addressed by eachof the test types can be estimated by selecting the appropriate cells in Table 3-7 which represent thecrash pulse and intrusion. Designs which comply with the specific test and provide adequate protectionat the conditions specified would also provide protection at lower severities, i.e., lower deltaV and lessintrusion, but not at higher severities. For example, vehicles designed to meet the EU test, which is asoft crash pulse with intrusions over 15 centimeters, would also provide adequate protection for lessthan 15 centimeters intrusion but not for stiffer crash pulses. For each test type, the associated crashpulse type, intrusion amount, cells addressed in Table 3-7, and cells addressed if the offset test alsoincludes right overlap, are shown in Table 3-8. The number of drivers in the cells specified for each ofthe tests are summed to give the estimate of the annual number of drivers, either exposed or MAIS$3injuries, with air bags in frontal impacts. The results are shown below in Table 3-9.
Note that the annual counts include only left offset impacts (where appropriate) while the expandedcount includes both right and left offset impacts as a percentage of all driver exposures and MAIS$3injuries in frontal crashes. It also should be noted that the test procedures overlap, i.e., the full barrieroblique impact has a soft crash pulse similar to an offset pulse with over 15 centimeters intrusion, whichis also included in the vehicle-to-MDB offset test. This procedure of defining the crash populationwhich applies to each test based on the crash pulse type and the intrusion of the test creates the overlapof crash data.
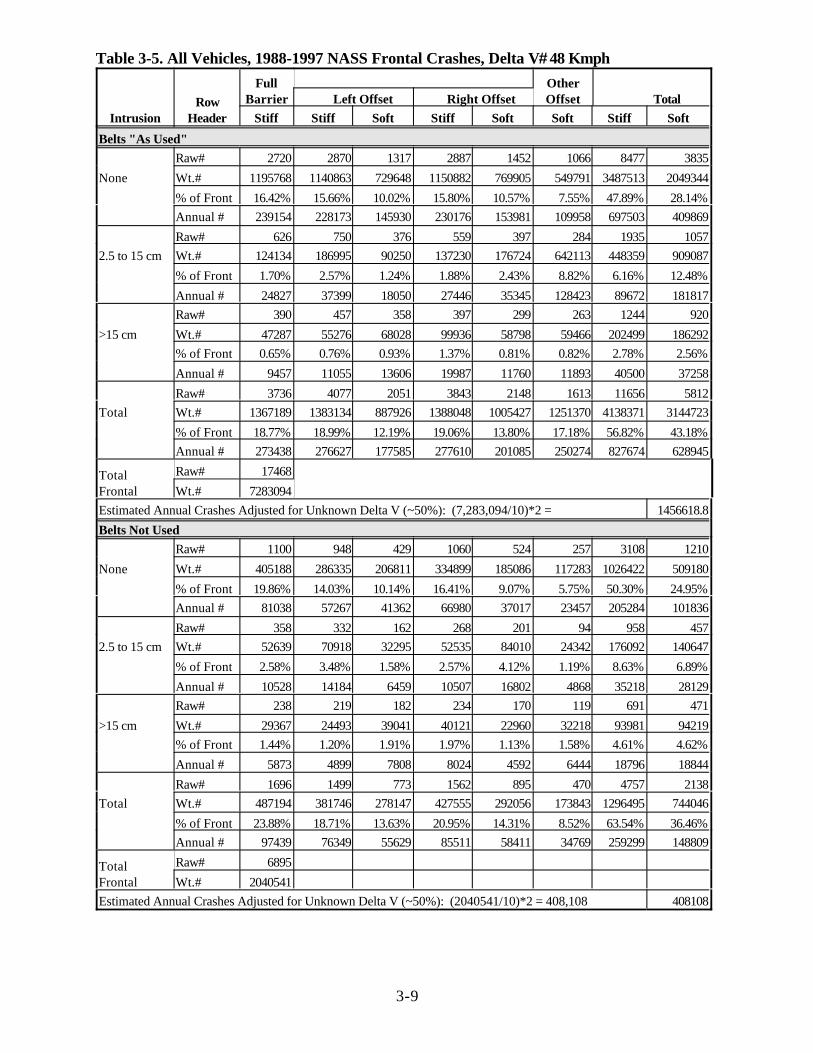
3-9
Table 3-5. All Vehicles, 1988-1997 NASS Frontal Crashes, Delta V#48 Kmph
IntrusionRow
Header
FullBarrier
OtherOffset Total Left Offset Right Offset
Stiff Stiff Soft Stiff Soft Soft Stiff Soft
Belts "As Used"Raw# 2720 2870 1317 2887 1452 1066 8477 3835
None Wt.# 1195768 1140863 729648 1150882 769905 549791 3487513 2049344
% of Front 16.42% 15.66% 10.02% 15.80% 10.57% 7.55% 47.89% 28.14%Annual # 239154 228173 145930 230176 153981 109958 697503 409869
Raw# 626 750 376 559 397 284 1935 10572.5 to 15 cm Wt.# 124134 186995 90250 137230 176724 642113 448359 909087
% of Front 1.70% 2.57% 1.24% 1.88% 2.43% 8.82% 6.16% 12.48%
Annual # 24827 37399 18050 27446 35345 128423 89672 181817Raw# 390 457 358 397 299 263 1244 920
>15 cm Wt.# 47287 55276 68028 99936 58798 59466 202499 186292% of Front 0.65% 0.76% 0.93% 1.37% 0.81% 0.82% 2.78% 2.56%
Annual # 9457 11055 13606 19987 11760 11893 40500 37258
Raw# 3736 4077 2051 3843 2148 1613 11656 5812Total Wt.# 1367189 1383134 887926 1388048 1005427 1251370 4138371 3144723
% of Front 18.77% 18.99% 12.19% 19.06% 13.80% 17.18% 56.82% 43.18%Annual # 273438 276627 177585 277610 201085 250274 827674 628945
TotalFrontal
Raw# 17468
Wt.# 7283094Estimated Annual Crashes Adjusted for Unknown Delta V (~50%): (7,283,094/10)*2 = 1456618.8
Belts Not UsedRaw# 1100 948 429 1060 524 257 3108 1210
None Wt.# 405188 286335 206811 334899 185086 117283 1026422 509180
% of Front 19.86% 14.03% 10.14% 16.41% 9.07% 5.75% 50.30% 24.95%Annual # 81038 57267 41362 66980 37017 23457 205284 101836
Raw# 358 332 162 268 201 94 958 4572.5 to 15 cm Wt.# 52639 70918 32295 52535 84010 24342 176092 140647
% of Front 2.58% 3.48% 1.58% 2.57% 4.12% 1.19% 8.63% 6.89%
Annual # 10528 14184 6459 10507 16802 4868 35218 28129Raw# 238 219 182 234 170 119 691 471
>15 cm Wt.# 29367 24493 39041 40121 22960 32218 93981 94219% of Front 1.44% 1.20% 1.91% 1.97% 1.13% 1.58% 4.61% 4.62%
Annual # 5873 4899 7808 8024 4592 6444 18796 18844
Raw# 1696 1499 773 1562 895 470 4757 2138Total Wt.# 487194 381746 278147 427555 292056 173843 1296495 744046
% of Front 23.88% 18.71% 13.63% 20.95% 14.31% 8.52% 63.54% 36.46%Annual # 97439 76349 55629 85511 58411 34769 259299 148809
TotalFrontal
Raw# 6895
Wt.# 2040541Estimated Annual Crashes Adjusted for Unknown Delta V (~50%): (2040541/10)*2 = 408,108 408108

3-10
Table 3-6. Drivers with Air Bags, MAIS$3, 1988-1997 NASS Frontal Crashes, Delta V# 48 Kmph
IntrusionRow
Header
FullBarrier
OtherOffset Total Left Offset Right Offset
Stiff Stiff Soft Stiff Soft Soft Stiff Soft
Belts "As Used"MAIS>=3 Raw# 10 12 7 21 8 6 43 21
None MAIS>=3 Wt.# 2475 1436 507 1683 547 313 5594 1367
Drivers Raw# 287 381 169 405 224 167 1073 560Drivers Wt.# 151228 154999 100331 155781 127837 72456 462008 300624
Risk% 1.64% 0.93% 0.51% 1.08% 0.43% 0.43% 1.21% 0.45%MAIS>=3 Raw# 12 14 10 9 3 3 35 16
2.5 to 15 cm MAIS>=3 Wt.# 989 818 850 674 83 478 2481 1411
Drivers Raw# 61 103 50 64 48 39 228 137Drivers Wt.# 21535 14473 9384 19049 21162 11020 55057 41566
Risk% 4.59% 5.65% 9.06% 3.54% 0.39% 4.34% 4.51% 3.39%MAIS>=3 Raw# 12 25 17 8 10 13 45 40
>15 cm MAIS>=3 Wt.# 749 1400 1096 390 746 704 2539 2546
Drivers Raw# 29 67 43 41 26 43 137 112Drivers Wt.# 3092 4568 5252 22420 3061 8396 30080 16709
Risk% 24.22% 30.65% 20.87% 1.74% 24.37% 8.38% 8.44% 15.24%MAIS>=3 Raw# 34 51 34 38 21 22 123 77
Total MAIS>=3 Wt.# 4213 3654 2453 2747 1376 1495 10614 5324
Drivers Raw# 377 551 262 510 298 249 1438 809Drivers Wt.# 175855 174040 114967 197250 152060 91872 547145 358899
Risk% 2.40% 2.10% 2.13% 1.39% 0.90% 1.63% 1.94% 1.48%Total MAIS>=3: 10614+5324 15938
Total Number of Drivers: 547145+358899 906044

3-11
Table 3-6 (Continued)
IntrusionRow
Header
FullBarrier
OtherOffset Total Left Offset Right Offset
Stiff Stiff Soft Stiff Soft Soft Stiff SoftBelts Not Used
MAIS>=3 Raw# 5 1 1 8 6 0 14 7
MAIS>=3 Wt.# 166 38 48 1192 258 0 1396 306None Drivers Raw# 57 53 26 70 57 18 180 101
Drivers Wt.# 18617 19359 14001 19187 16945 3759 57163 34705Risk% 0.89% 0.20% 0.34% 6.21% 1.52% 0.00% 2.44% 0.88%
MAIS>=3 Raw# 3 6 4 4 3 2 13 9
MAIS>=3 Wt.# 575 107 189 216 83 471 898 7432.5 to 15 cm Drivers Raw# 20 24 14 26 15 10 70 39
Drivers Wt.# 2968 2774 1123 3674 3872 2882 9416 7877Risk% 19.37% 3.86% 16.83% 5.88% 2.14% 16.34% 9.54% 9.43%
MAIS>=3 Raw# 5 8 6 7 6 1 20 13
MAIS>=3 Wt.# 509 538 547 371 634 350 1418 1531>15 cm Drivers Raw# 11 25 13 16 11 8 52 32
Drivers Wt.# 1210 1585 1275 2373 1133 4259 5168 6667Risk% 42.07% 33.94% 42.90% 15.63% 55.96% 8.22% 27.44% 22.96%
MAIS>=3 Raw# 13 15 11 19 15 3 47 29
MAIS>=3 Wt.# 1250 683 784 1779 975 821 3712 2580Total Drivers Raw# 88 102 53 112 83 36 302 172
Drivers Wt.# 22795 23718 16399 25234 21950 10900 71747 49249Risk% 5.48% 2.88% 4.78% 7.05% 4.44% 7.53% 5.17% 5.24%
Total MAIS>=3: 3,712+2,580 6292
Total Number of Drivers : 71,747+49,249 120996

3-12
Table 3-7. Annual Estimates, Drivers with Air Bags, Exposed and MAIS$3, 1988 through1997 NASS-CDS Frontal Crashes, Delta V<= 48 kmph
Intrusion
FullBarrier
OtherOffset Total Left Offset Right Offset
Stiff Stiff Soft Stiff Soft Soft Stiff Soft
Belts “As Used”EXPOSED
None 239154 228173 145930 230176 153981 109958 697503 409869
2.5 to 15 cm 24827 37399 18050 27446 35345 128423 89672 181817>15 cm 9457 11055 13606 19987 11760 11893 40500 37258
Total 273438 276627 177585 277610 201085 250274 827674 628945MAIS>=3
None 3914 2114 737 2487 659 475 8515 1871
2.5 to 15 cm 1140 2114 1635 971 139 5570 4225 7344>15 cm 2291 3388 2839 348 2866 997 6027 6702
Total 7345 7616 5212 3806 3663 7043 18767 15918

3-13
Table 3-8. Crash Conditions Simulated by Test Type
Test CrashPulse
Intrusion Cell Location in Table 3-7 Expanded Test Cell Location in Table 3-7
Rigid Wall/Full Frontal
Stiff 0 to 15 cm Column - “Full Barrier”Rows - “None” & “2.5-15"
Same as Previous Column
Rigid Wall/Full FrontalOblique
Soft > 15 cm Column - “Left and Right Offset -Soft”Rows - “Total”1
Same as Previous Column
FFFDB/Full Frontal
Soft 0 to 15cm Column -“Left and Right Offset-Soft”Rows - “None” & “2.5-15"1
Same as Previous Column
Offset-BarrierEU Test
Soft >15 cm" Column - “Left Offset - Soft”Rows - “Total”
Column - “Left and Right Offset -Soft”Rows - “Total”
Vehicle-MDBFull Frontal
Stiff 0 to 15 cm Column - “Full Barrier”Rows - “None” & “2.5-15"
Same as Previous Column
Vehicle-MDBInline, Overlap >55%
Stiff >15 cm Column - “Left Offset - Stiff” & “Left Offset - Soft”Rows - “Total”
Column - “Left and Right Offset -Stiff & Soft”Rows - “Total”
Vehicle-MDBInline, Overlap #55%
Soft >15 cm Column - “Left Offset - Soft”Rows - “Total”
Column - “Left and Right Offset -Soft”Rows - “Total”
Vehicle-MDBOblique, Overlap> 33%
Stiff >15 cm Column - “Left Offset - Stiff” & “LeftOffset - Soft” Rows - “Total”
Column - “Left and Right Offset -Stiff & Soft”Rows - “Total”
Vehicle-MDBOblique, Overlap#33%
Soft >15 cm Column - “Left Offset - Soft”Rows - “Total”
Column - “Left and Right Offset -Soft”Rows - “Total”
Sled Test Soft NA Column - “Left and Rt Offset - Soft”Rows - “None”1
Same as Previous Column
1 These tests do not “fit” the cells from NASS specifically but represents the nearest fit.
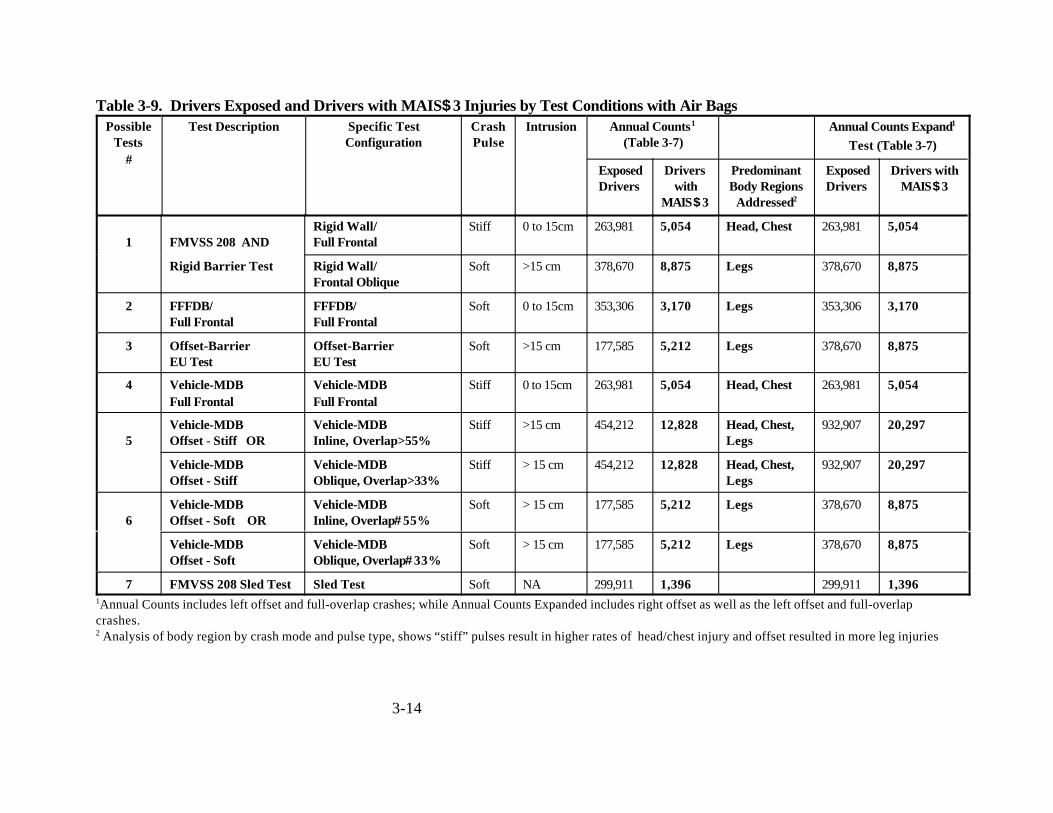
3-14
Table 3-9. Drivers Exposed and Drivers with MAIS$3 Injuries by Test Conditions with Air Bags
PossibleTests
#
Test Description Specific TestConfiguration
CrashPulse
Intrusion Annual Counts1
(Table 3-7)Annual Counts Expand1
Test (Table 3-7)
ExposedDrivers
Driverswith
MAIS$3
PredominantBody Regions
Addressed2
ExposedDrivers
Drivers withMAIS$3
1 FMVSS 208 ANDRigid Wall/Full Frontal
Stiff 0 to 15cm 263,981 5,054 Head, Chest 263,981 5,054
Rigid Barrier Test Rigid Wall/Frontal Oblique
Soft >15 cm 378,670 8,875 Legs 378,670 8,875
2 FFFDB/Full Frontal
FFFDB/Full Frontal
Soft 0 to 15cm 353,306 3,170 Legs 353,306 3,170
3 Offset-BarrierEU Test
Offset-BarrierEU Test
Soft >15 cm 177,585 5,212 Legs 378,670 8,875
4 Vehicle-MDBFull Frontal
Vehicle-MDBFull Frontal
Stiff 0 to 15cm 263,981 5,054 Head, Chest 263,981 5,054
5Vehicle-MDBOffset - Stiff OR
Vehicle-MDBInline, Overlap>55%
Stiff >15 cm 454,212 12,828 Head, Chest,Legs
932,907 20,297
Vehicle-MDBOffset - Stiff
Vehicle-MDBOblique, Overlap>33%
Stiff > 15 cm 454,212 12,828 Head, Chest,Legs
932,907 20,297
6Vehicle-MDBOffset - Soft OR
Vehicle-MDBInline, Overlap#55%
Soft > 15 cm 177,585 5,212 Legs 378,670 8,875
Vehicle-MDBOffset - Soft
Vehicle-MDBOblique, Overlap#33%
Soft > 15 cm 177,585 5,212 Legs 378,670 8,875
7 FMVSS 208 Sled Test Sled Test Soft NA 299,911 1,396 299,911 1,3961Annual Counts includes left offset and full-overlap crashes; while Annual Counts Expanded includes right offset as well as the left offset and full-overlapcrashes.2 Analysis of body region by crash mode and pulse type, shows “stiff” pulses result in higher rates of head/chest injury and offset resulted in more leg injuries

3-15
0%
10%
20%
30%
40%
50%
60%
70%
208Barrier FFFDB EU MDB Full MDB Off. 208 Sled
Test
Per
cen
t of A
ll
Exposure MAIS>=3
Figure 3-5. Estimated Driver Exposure and MAIS$3 Injuries for SelectedTest Types as Percentage of all Frontal Occurrences
3.4. Summary
Some general conclusions are that drivers of vehicles equipped with air bags in stiff pulse frontal crasheshave a higher frequency and risk of serious to fatal injuries than those in crashes with soft pulses. Stiffcrash pulses produce more AIS$3, life-threatening, head/chest injuries; while offset crashes, with stiffand soft pulses, produce more leg injuries.
By grouping drivers into specific test conditions based on the crash severity, defined by the crash pulseand intrusion, an estimate of the target crash populations for each test can be predicted.
Figure 3-5 presents the exposure and serious-to-fatal injuries for drivers of vehicles with air bags forthe various test types. A MDB-to-vehicle test, both left and right offset, would address the largesttarget population for both exposure and MAIS$3 injured drivers (about 64 percent of drivers in frontalcrashes and about 58 percent of those with MAIS$3 injuries.) The full, fixed barrier test wouldaddress a lower target population (about 45 percent of drivers in frontal crashes and about 40 percentof those with MAIS$3 injuries). All other potential tests would address significantly lower targetpopulations.
The MDB-to-vehicle test addresses head, chest, and leg injuries while the full barrier test addresseshead and chest injuries, predominantly. Of the remaining tests, those which produce stiff pulses andlow intrusion address mainly head and chest injuries, while those with soft pulses and substantialintrusion address mainly leg injuries.

3-16
3.5. References
1. National Automotive Sampling System - Crashworthiness Data System, 1988-1997), NationalCenter for Statistics and Analysis, National Highway Traffic Safety Administration.
2. Stucki, Sheldon L., Hollowell, William T., and Fessahaie, Osvaldo, “Determination of FrontalOffset Test Conditions Based on Crash Data,” Sixteenth International Technical Conference onEnhanced Safety of Vehicles, Windsor, Canada, June, 1998.
3. “Preliminary Economic Assessment, FMVSS No. 208, Advanced Air Bags,” National HighwayTraffic Safety Administration, September, 1998.

4-1
CHAPTER 4. CRASH COMPATIBILITY
4.1 Introduction
This report has addressed tests that assess the crashworthiness of a vehicle – the capability of a vehicleto protect its occupants in a collision. This is one aspect of crash compatibility. The other aspect ofcrash compatibility is aggressivity – the tendency of a vehicle to injure the occupants of the other vehiclein a vehicle-to-vehicle collision. This chapter examines the impact of each of the candidate testprocedures on crash compatibility – particularly in frontal crashes. The specific objective is todetermine whether the candidate test procedures would invariably result in a significant negative impacton safety that cannot be mitigated in a reasonable manner.
In general, lack of crash compatibility arises from three factors:
• Mass Incompatibility• Stiffness Incompatibility• Geometric Incompatibility
The first factor is an incompatibility in mass. The conservation of momentum in a collision placessmaller vehicles at a fundamental disadvantage when the collision partner is a heavier vehicle. For aninelastic head-on collision, a vehicle which is half the mass of its collision partner will experience achange in velocity double that of its collision partner. Joksch has estimated that a vehicle of half themass of its collision partner will experience a fatality risk 10 times greater than its heavier collisionpartner [1].
The second factor is an incompatibility in stiffness. In a frontal collision between two vehicles of thesame mass but with a mismatch in stiffness, the bulk of the crash energy would be absorbed by the lessstiff vehicle resulting in greater deformation of the less stiff vehicle. If the deformation of the less stiffvehicle is sufficiently large, occupant compartment intrusion may occur with an increase in injurypotential to the vehicle’s occupants. From a compatibility perspective, the preferred scenario would befor both vehicles to share the crash energy rather than forcing one of the collision partners to absorb thebulk of the energy in the crash.
The third factor is geometric incompatibility such as might arise when a sports utility vehicle strikes acar. In a frontal impact, geometric incompatibility, e.g, a ride height mismatch, can lead to themisalignment of the structural load paths, and may prevent effective interaction of the two vehiclestructures in a collision so that crash energy is absorbed by vehicle structures designed to absorb it. Ina side impact, a mismatch in ride height can allow the vehicle with greater ground clearance to overridethe door sill of the lower vehicle, and contribute to the intrusion of a side-impacted vehicle.
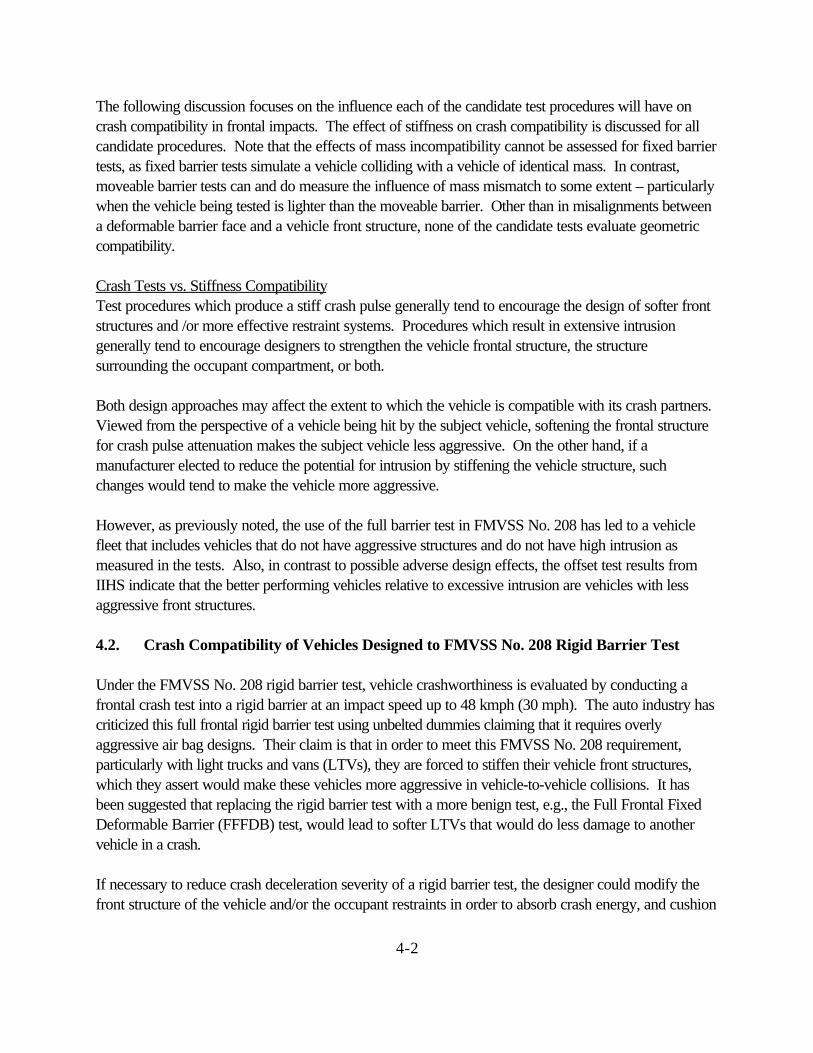
4-2
The following discussion focuses on the influence each of the candidate test procedures will have oncrash compatibility in frontal impacts. The effect of stiffness on crash compatibility is discussed for allcandidate procedures. Note that the effects of mass incompatibility cannot be assessed for fixed barriertests, as fixed barrier tests simulate a vehicle colliding with a vehicle of identical mass. In contrast,moveable barrier tests can and do measure the influence of mass mismatch to some extent – particularlywhen the vehicle being tested is lighter than the moveable barrier. Other than in misalignments betweena deformable barrier face and a vehicle front structure, none of the candidate tests evaluate geometriccompatibility.
Crash Tests vs. Stiffness CompatibilityTest procedures which produce a stiff crash pulse generally tend to encourage the design of softer frontstructures and /or more effective restraint systems. Procedures which result in extensive intrusiongenerally tend to encourage designers to strengthen the vehicle frontal structure, the structuresurrounding the occupant compartment, or both.
Both design approaches may affect the extent to which the vehicle is compatible with its crash partners. Viewed from the perspective of a vehicle being hit by the subject vehicle, softening the frontal structurefor crash pulse attenuation makes the subject vehicle less aggressive. On the other hand, if amanufacturer elected to reduce the potential for intrusion by stiffening the vehicle structure, suchchanges would tend to make the vehicle more aggressive.
However, as previously noted, the use of the full barrier test in FMVSS No. 208 has led to a vehiclefleet that includes vehicles that do not have aggressive structures and do not have high intrusion asmeasured in the tests. Also, in contrast to possible adverse design effects, the offset test results fromIIHS indicate that the better performing vehicles relative to excessive intrusion are vehicles with lessaggressive front structures.
4.2. Crash Compatibility of Vehicles Designed to FMVSS No. 208 Rigid Barrier Test
Under the FMVSS No. 208 rigid barrier test, vehicle crashworthiness is evaluated by conducting afrontal crash test into a rigid barrier at an impact speed up to 48 kmph (30 mph). The auto industry hascriticized this full frontal rigid barrier test using unbelted dummies claiming that it requires overlyaggressive air bag designs. Their claim is that in order to meet this FMVSS No. 208 requirement,particularly with light trucks and vans (LTVs), they are forced to stiffen their vehicle front structures,which they assert would make these vehicles more aggressive in vehicle-to-vehicle collisions. It hasbeen suggested that replacing the rigid barrier test with a more benign test, e.g., the Full Frontal FixedDeformable Barrier (FFFDB) test, would lead to softer LTVs that would do less damage to anothervehicle in a crash.
If necessary to reduce crash deceleration severity of a rigid barrier test, the designer could modify thefront structure of the vehicle and/or the occupant restraints in order to absorb crash energy, and cushion

4-3
the load on the occupants. As shown in Figure 4-1 and tabulated in Table C-1, overall the automakershave exercised great design latitude in how the rigid barrier requirement is met. Drawing on NHTSANew Car Assessment Program crash test results, the linear stiffness of a selection of LTVs and carswas estimated using the following relationship:
k = (mv2) / x2
where m is the mass of the vehicle, v is the initial velocity of the vehicle, and x is the maximum dynamiccrush of the vehicle. Because NCAP impact speeds are 5 mph higher than the FMVSS No. 208barrier test, the NCAP tests encompass and provide an excellent estimate of the vehicle structuralresponse which would be measured in the lower speed 208 test. Note that all of the vehicles on thischart have passed FMVSS No. 208 requirements. In general stiffness increases with weight, but forany given weight there is a wide range of average frontal stiffness values. For today’s vehicles,excessive compartment intrusion is rarely observed by the agency in the full frontal rigid barriercompliance test. Therefore, FMVSS No. 208 rigid barrier test provides absolutely no incentive tostiffen the vehicle structure.
As shown in Figure 4-2 and tabulated in Table C-1, for a given vehicle weight, vehicles display asubstantial variation in the amount of crush, or front-end crumple, designed into the front structure. Ingeneral, LTVs crumple much less than a passenger car of the same weight. The result is that LTVs aresubstantially stiffer, and less forgiving in a crash, than are passenger cars of the same weight.
0
500
1000
1500
2000
2500
3000
750 1000 1250 1500 1750 2000 2250 2500 2750 3000
Vehicle Mass (kg)
Lin
ear
Sti
ffn
ess
(kN
/ m
)
Subcompact CarsCompact CarsMidsize CarsLarge CarsSUVPickup TrucksMinivansFull-Size Van
Figure 4-1. Relationship between Frontal Stiffness and Vehicle Mass
as determined from NCAP Rigid Barrier Crash Tests.
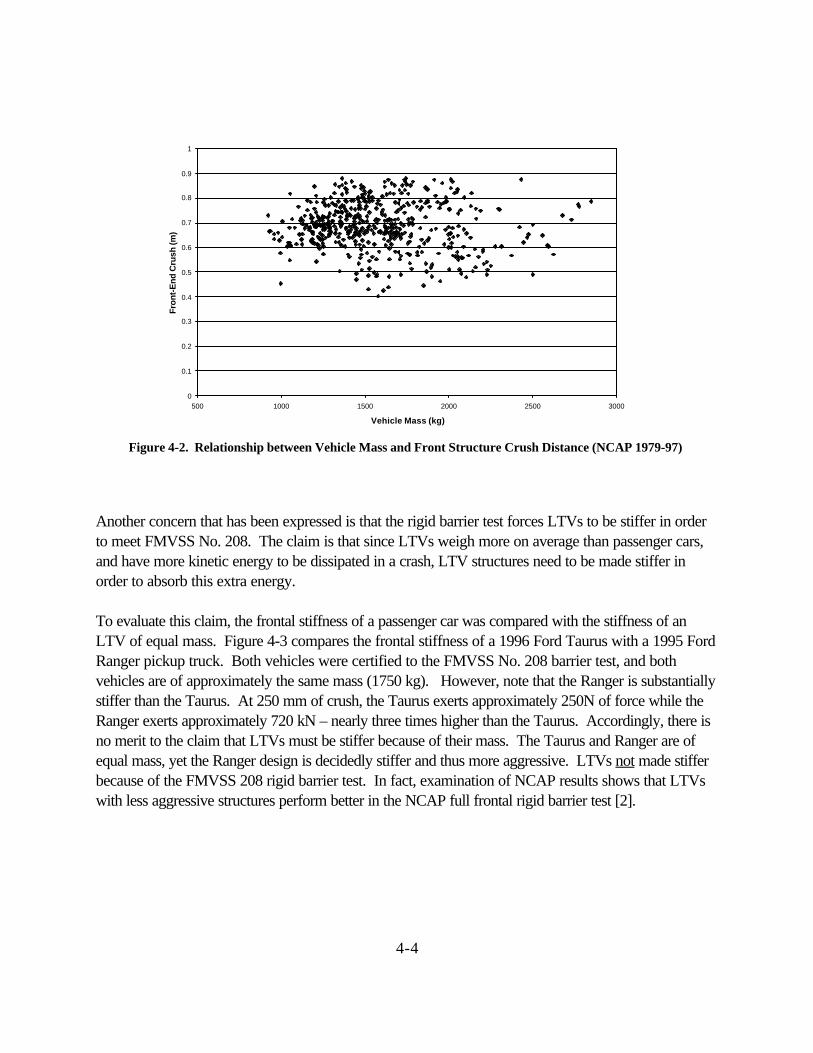
4-4
0
0.1
0.2
0.3
0.4
0.5
0.6
0.7
0.8
0.9
1
500 1000 1500 2000 2500 3000
Vehicle Mass (kg)
Fron
t-E
nd C
rush
(m)
Figure 4-2. Relationship between Vehicle Mass and Front Structure Crush Distance (NCAP 1979-97)
Another concern that has been expressed is that the rigid barrier test forces LTVs to be stiffer in orderto meet FMVSS No. 208. The claim is that since LTVs weigh more on average than passenger cars,and have more kinetic energy to be dissipated in a crash, LTV structures need to be made stiffer inorder to absorb this extra energy.
To evaluate this claim, the frontal stiffness of a passenger car was compared with the stiffness of anLTV of equal mass. Figure 4-3 compares the frontal stiffness of a 1996 Ford Taurus with a 1995 FordRanger pickup truck. Both vehicles were certified to the FMVSS No. 208 barrier test, and bothvehicles are of approximately the same mass (1750 kg). However, note that the Ranger is substantiallystiffer than the Taurus. At 250 mm of crush, the Taurus exerts approximately 250N of force while theRanger exerts approximately 720 kN – nearly three times higher than the Taurus. Accordingly, there isno merit to the claim that LTVs must be stiffer because of their mass. The Taurus and Ranger are ofequal mass, yet the Ranger design is decidedly stiffer and thus more aggressive. LTVs not made stifferbecause of the FMVSS 208 rigid barrier test. In fact, examination of NCAP results shows that LTVswith less aggressive structures perform better in the NCAP full frontal rigid barrier test [2].
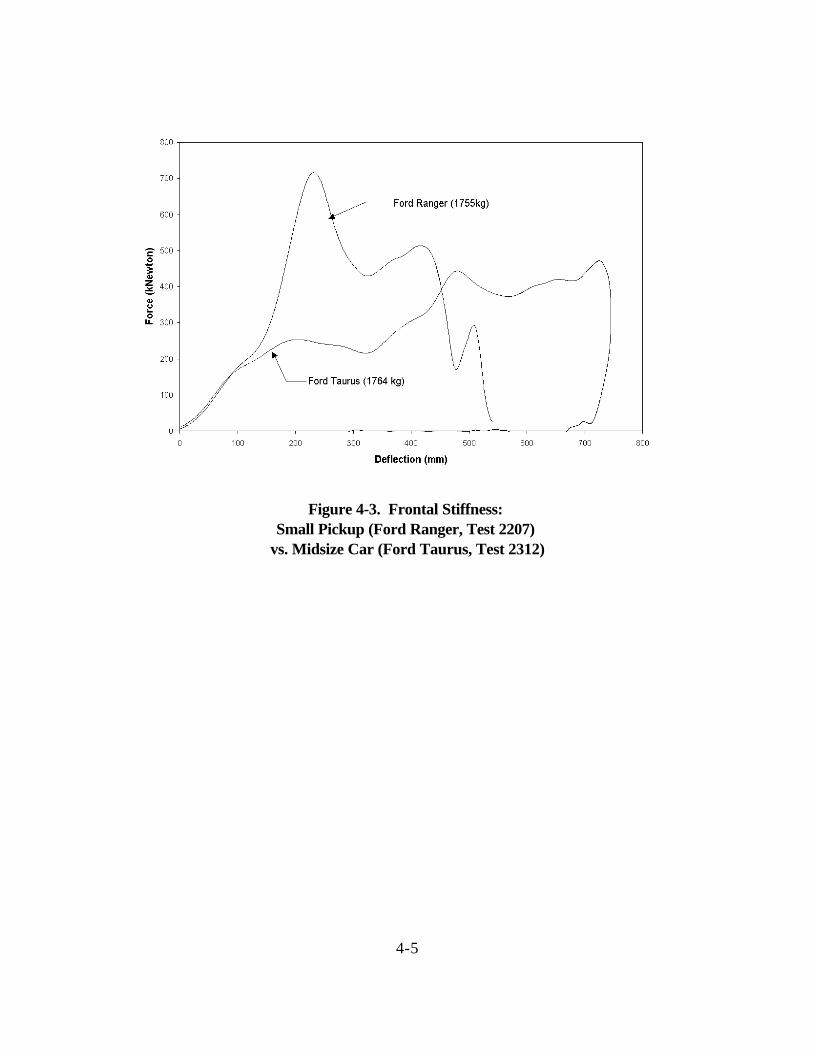
4-5
Figure 4-3. Frontal Stiffness: Small Pickup (Ford Ranger, Test 2207)
vs. Midsize Car (Ford Taurus, Test 2312)
4-6
4.3. Potential Consequences of Test Procedure Options
This section examines the potential consequences, in terms of stiffening/softening of the front end, of thetest procedure options discussed below and earlier in this report.
4.3.1 Effect of the Generic Sled Test on Compatibility
As discussed earlier, the perpendicular rigid wall test produces a stiff pulse without excessive intrusion. This test would encourage designs which soften the front structure or enhance restraints for high severityevents. The sled test is based upon a soft pulse, and by its nature produces no intrusion. Vehicleswhich currently pass the rigid-barrier test can readily pass the generic sled test, and this test requires nodesign modifications.
4.3.2 Effect of the Frontal-Offset Test and Oblique Frontal Fixed Barrier onCompatibility
Unlike the full frontal barrier crash test, the Frontal-Offset test may produce large amounts of occupantcompartment intrusion depending on a large number of factors, e.g., impact velocity. Although thesetests generally indicate little risk to the occupant from head and chest injuries, the tests do suggest thepotential for lower limb injury. To perform well in some of these offset tests, vehicle designers maychoose to limit intrusion by stiffening the front structure of a vehicle. The concern is that in making theirvehicle less prone to leg injuries, the automakers may be make their vehicles stiffer and moreaggressive.
However, as previously noted, the use of the full barrier test in FMVSS No. 208 including oblique testshas not led to a vehicle fleet that is, in general, aggressive or that suffers substantial intrusion asmeasured in the tests. Also, in contrast to possible adverse design effects, the offset test results fromIIHS indicate that the better performing vehicles relative to excessive intrusion are vehicles with lessaggressive front structures.
4.3.3 Effect of the FFFDB test on Crash Compatibility
In the Full Frontal Fixed Deformable Barrier (FFFDB) test, the deformable barrier acts as a crashenergy absorber. As there is a fixed total amount of crash energy, energy which is absorbed by thehoneycomb barrier is energy that does not have to be absorbed by the vehicle. If the deformablebarrier face stiffness is less than the stiffness of the tested vehicle, the result is that with a FFFDB-typetest the vehicle structure does not need to be designed to absorb the entire energy load.
Because the deformable barrier absorbs crash energy and effectively ‘softens’ and extends the durationof the impact, the FFFDB test produces little incentive to soften the car or LTV structure. If theFFFDB test were chosen, vehicle designers could actually choose to stiffen the structure of a vehicle
4-7
that passed the rigid barrier test of FMVSS No. 208, and be able to pass the FMVSS No. 208dummy requirements in the FFFDB test.
4.3.4 Effect of the MDB test on Crash Compatibility
Unlike the barrier tests, the two MDB test options provide a test of mass compatibility as well asstiffness compatibility. In a collision between a heavier and lighter vehicle, the lighter vehicle undergoesthe greater change of velocity and hence is subjected to a more severe crash event. Hence, in an MDBtest, vehicles which are lighter than the MDB would need to be designed to protect the occupant in thismore severe crash environment.
As the crushable front of the current MDB typically crushes fully or “bottoms out”, the MDB absorbs afixed amount of crash energy. Vehicles near the mass of the MDB would therefore absorb more crashenergy than they would absorb in a perpendicular rigid barrier test. Like the offset barrier test, whichalso exhibits the same bottoming-out effect, vehicle designers may choose to limit excessive intrusion bystiffening the front structure of a vehicle. However, in the case of the MDB test, any increase instiffness to limit intrusion will be constrained by the requirement to limit crash pulse severity. Note alsothat although the current MDB face bottoms out in a crash, the MDB face could be made thicker toavoid bottoming out.
As LTVs are typically heavier than cars (and heavier than the current MDB mass of 3000 pounds), thistest would have the effect of requiring smaller cars to have restraint systems and frontal structurescapable of improved protection for the occupant in LTV-to-car collisions. Light trucks, on the otherhand, would be subjected to a less severe event. However, as increasing vehicle weight, in an MDBtest, decreases crash severity, both LTV and car designers would have an incentive to increase vehiclemass in order to improve test results.
The frontal-oblique MDB test produces both a severe crash pulse as well as significant intrusion. Mitigation of these two threats to the occupant would tend to lead to both softer frontal structures toreduce deceleration severity and strengthening of the structure surrounding the occupant compartmentto reduce intrusion. Designing to meet both of these objectives will produce vehicles which produceenhanced crashworthiness and improved compatibility.
Table 4-1 summarizes the potential consequences, in terms of stiffening/softening of the front end, of thetest procedure options discussed above and earlier in this report.

4-8
Table 4-1. Test Procedure: Potential Consequences for Frontal Crash Protection and Effect on Stiffness Compatibility
Test Procedure Impact Direction Potential Consequences on Design
Rigid Wall/Full frontal
Perpendicular Soften Front and/orImprove Restraints
Rigid Wall/Full frontal
Oblique Stiffen front structure or structuresurrounding occupant compartment
Full Frontal Fixed DeformableBarrier (FFFDB)
Perpendicular None
Offset-Barrier: IIHS / EU Test
Perpendicular Stiffen front structure or structuresurrounding occupant compartment
Vehicle-MDB/Full frontal
Perpendicular 1) Stiffen lighter vehicles2) Neutral for heavy veh.
Vehicle-MDB/Overlap # 55%
Perpendicular Stiffen front structure
Vehicle-MDB/Overlap > 55%
Perpendicular 1) Soften front structure.2) Lighter cars must also strengthen
compartment
Vehicle-MDB/Overlap # 33%
Oblique Stiffen front structure.
Vehicle-MDB/Overlap > 33%
Oblique 1) Soften front structure.2) Lighter cars must also strengthen
compartment.
Generic Sled Test Perpendicular None
4-9
4.4. Summary
Currently, the FMVSS No. 208 perpendicular rigid barrier test acts as a constraint on over-stiffening ofthe front vehicle structure. The frontal-oblique MDB test, or a combination of the rigid full frontalbarrier test and a frontal-offset test would lead to vehicles which limit intrusion while simultaneouslylimiting deceleration severity. However, less rigorous tests, e.g, the FFFDB or the sled test, wouldeffectively waive or weaken the limit associated with the rigid barrier deceleration severity, and wouldfacilitate the manufacture of a new generation of stiffer, more aggressive passenger vehicles.
4.5. References
1. Joksch, H., Massie, D., and Pichler, R., “Vehicle Aggressivity: Fleet Characterization UsingTraffic Collision Data”, DOT HS 808 679, February 1998.
2. Hackney, James R. and Kahane, Charles J. “The New Car Assessment Program: Five StarRating System and Vehicle Safety Performance Characteristics”, SAE Paper No. 950888,SAE International Congress and Exposition, Detroit, MI, 1995.

5-15-1
CHAPTER 5. EVALUATION OF TEST CONFIGURATIONS
A variety of test configurations have been investigated for evaluating a vehicle’s crashworthiness. Thissection examines these test configurations and compares them in terms of deceleration and intrusionresponses. The tests are categorized according to how well the test configurations resemble car-to-caror car-to-fixed object crashes. Vehicle test data are augmented with computer simulated tests toprovide a complete analysis of the proposed test configurations. The test configurations arecharacterized according to the deceleration and intrusion responses in vehicle crash tests.
The deceleration responses were categorized as either “rigid barrier like” (“stiff”) or “sled like” (“soft”). Crash pulses were identified that were similar to the rigid barrier deceleration/velocity crash responses. Additionally, the remaining crash pulses were characterized as similar to the deceleration/velocity pulseused for the generic sled pulse, GSP. The rigid barrier like pulses were labeled as stiff due to the highvelocity an unrestrained occupant would experience relative to the interior of the vehicle. Anunrestrained occupant in a barrier like test would experience high impact speeds with the interiorsurfaces and corresponding higher injury measures. The sled like pulses were labeled as soft due to thelower velocity an unrestrained occupant would experience relative to the interior of the vehicle and thecorresponding lower injury measures. Figures 5-1 through 5-3 are provided to demonstrate this effect. In Figure 5-1, the vehicle deceleration responses are plotted for the generic sled pulse as well as for arigid barrier test of a Dodge Neon. Here, it is seen that the sled pulse is longer in duration and lower inmagnitude than that for the rigid barrier test. Figure 5-2 provides a plot of the vehicle velocityresponses resulting from the crash pulses. Here, it is seen that the change in velocity in the rigid barriertest occurs much more rapidly than in the sled test. Finally, Figure 5-3 provides a plot of the velocity ofthe occupant relative to the interior of the vehicle. As seen in this plot, at 60 milliseconds (the time atwhich occupants generally engage a deploying air bag) the velocity of the occupant in the rigid barriertest is almost twice that of the sled test.

5-25-2
T ime (seconds)
0.00 0 .02 0 .04 0.06 0 .08 0.10 0 .12 0 .14
Acc
eler
atio
n (G
's)
-30
-25
-20
-15
-10
-5
0
5
G S P - S o f tRigid Barr ier - St i f f
Figure 5-1: Typical Occupant Compartment Acceleration Profiles
T i m e ( s e c o n d s )
0 . 0 0 0 . 0 2 0.04 0.06 0 .08 0 . 1 0 0 . 1 2 0 . 1 4
Vel
ocity
(km
ph)
- 1 0
0
1 0
2 0
3 0
4 0
5 0
6 0
G S P - S o f tR ig id Bar r ie r - S t i f f
Figure 5-2: Typical Occupant Compartment Velocity Profiles
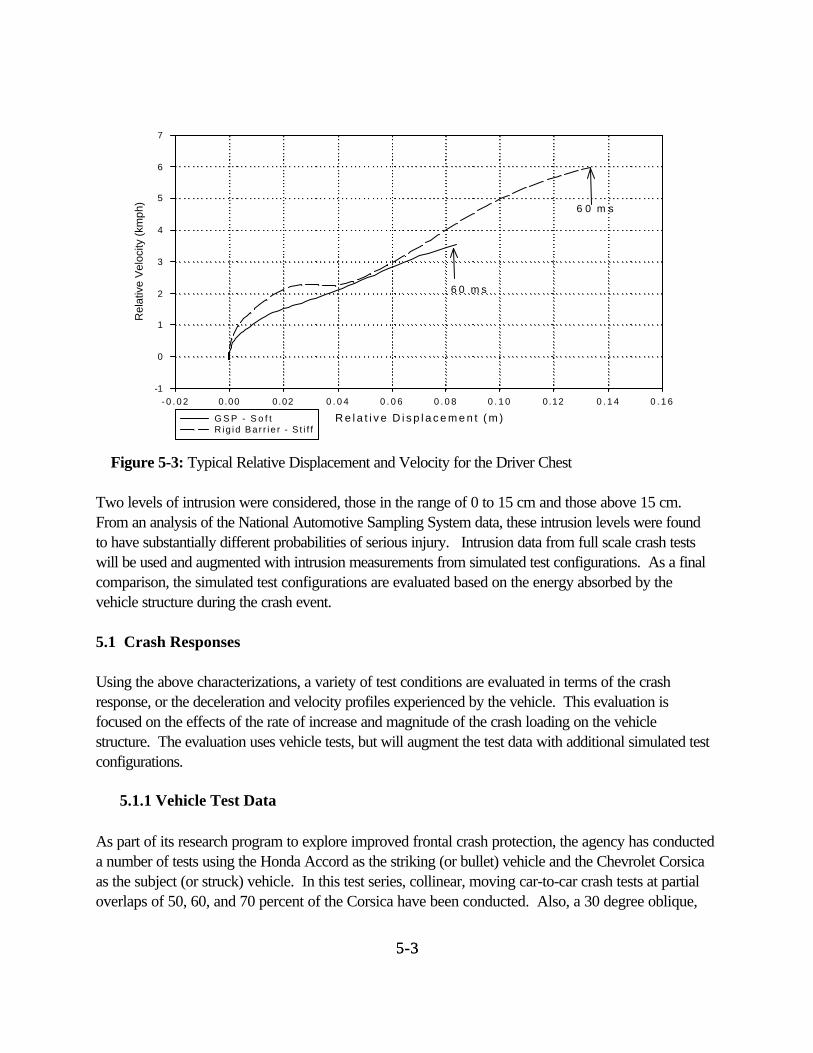
5-35-3
R e l a t i v e D i s p l a c e m e n t ( m )
- 0 . 0 2 0.00 0.02 0 . 0 4 0 . 0 6 0 . 0 8 0 . 1 0 0.12 0 . 1 4 0 . 1 6
Rel
ativ
e V
eloc
ity (
kmph
)
-1
0
1
2
3
4
5
6
7
G S P - S o f tR ig id Ba r r i e r - S t i f f
6 0 m s
6 0 m s
Figure 5-3: Typical Relative Displacement and Velocity for the Driver Chest
Two levels of intrusion were considered, those in the range of 0 to 15 cm and those above 15 cm. From an analysis of the National Automotive Sampling System data, these intrusion levels were foundto have substantially different probabilities of serious injury. Intrusion data from full scale crash testswill be used and augmented with intrusion measurements from simulated test configurations. As a finalcomparison, the simulated test configurations are evaluated based on the energy absorbed by thevehicle structure during the crash event.
5.1 Crash Responses
Using the above characterizations, a variety of test conditions are evaluated in terms of the crashresponse, or the deceleration and velocity profiles experienced by the vehicle. This evaluation isfocused on the effects of the rate of increase and magnitude of the crash loading on the vehiclestructure. The evaluation uses vehicle tests, but will augment the test data with additional simulated testconfigurations.
5.1.1 Vehicle Test Data
As part of its research program to explore improved frontal crash protection, the agency has conducteda number of tests using the Honda Accord as the striking (or bullet) vehicle and the Chevrolet Corsicaas the subject (or struck) vehicle. In this test series, collinear, moving car-to-car crash tests at partialoverlaps of 50, 60, and 70 percent of the Corsica have been conducted. Also, a 30 degree oblique,
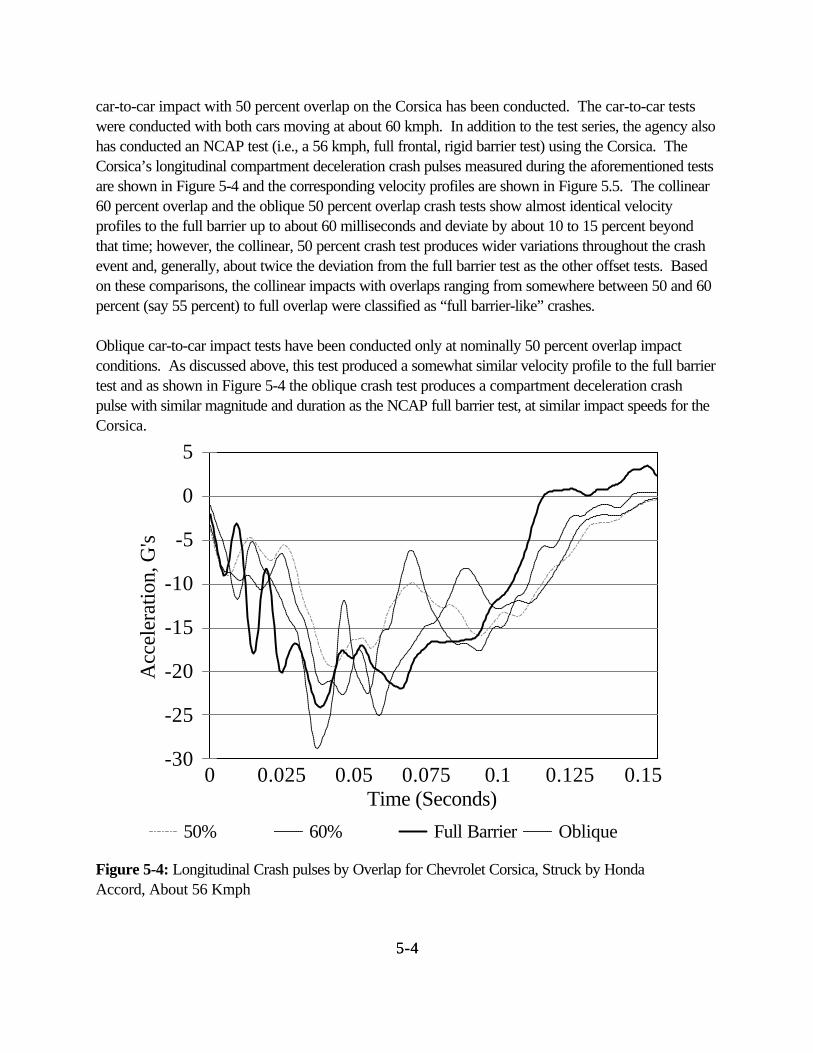
5-45-4
car-to-car impact with 50 percent overlap on the Corsica has been conducted. The car-to-car testswere conducted with both cars moving at about 60 kmph. In addition to the test series, the agency alsohas conducted an NCAP test (i.e., a 56 kmph, full frontal, rigid barrier test) using the Corsica. TheCorsica’s longitudinal compartment deceleration crash pulses measured during the aforementioned testsare shown in Figure 5-4 and the corresponding velocity profiles are shown in Figure 5.5. The collinear60 percent overlap and the oblique 50 percent overlap crash tests show almost identical velocityprofiles to the full barrier up to about 60 milliseconds and deviate by about 10 to 15 percent beyondthat time; however, the collinear, 50 percent crash test produces wider variations throughout the crashevent and, generally, about twice the deviation from the full barrier test as the other offset tests. Basedon these comparisons, the collinear impacts with overlaps ranging from somewhere between 50 and 60percent (say 55 percent) to full overlap were classified as “full barrier-like” crashes.
Oblique car-to-car impact tests have been conducted only at nominally 50 percent overlap impactconditions. As discussed above, this test produced a somewhat similar velocity profile to the full barriertest and as shown in Figure 5-4 the oblique crash test produces a compartment deceleration crashpulse with similar magnitude and duration as the NCAP full barrier test, at similar impact speeds for theCorsica.
-30
-25
-20
-15
-10
-5
0
5
Acc
eler
atio
n, G
's
0 0.025 0.05 0.075 0.1 0.125 0.15Time (Seconds)
50% 60% Full Barrier Oblique
Figure 5-4: Longitudinal Crash pulses by Overlap for Chevrolet Corsica, Struck by HondaAccord, About 56 Kmph

5-55-5
-10
0
10
20
30
40
50
60 V
eloc
ity (K
mph
)
0 0.025 0.05 0.075 0.1 0.125 0.15Time (Seconds)
50% 60% Full Barrier Oblique
Figure 5-5: Velocity Profiles by Overlap for Chevrolet Corsica, Struck by Honda Accord, About 56Kmph
In addition to the test series with the Corsica, another test series was conducted using the Ford Taurus. This test series included a Taurus-to-Taurus test and a Moving Deformable Barrier (MDB)-to-Taurus. Both of these tests were conducted at a 30 degree oblique impact with a nominal 50 percent overlap ofthe subject Taurus vehicle. For these tests, each vehicle had an initial speed around 56 kmph. Also,the agency has conducted an NCAP test of the Taurus. A comparison of the crash pulses from thesetests is shown in Figures 5-6 and 5-7. Both of the oblique crash pulses are observed to be moresevere than the NCAP crash pulse, based on peak deceleration. Comparison of the velocity profiles inFigure 5-7 shows corresponding velocity profiles up until about 80 msec and deviations from 15 to 20percent afterwards.
From a review of the test results from the Taurus test series along with those from the Corsica testseries, it has been determined that the oblique impact is more severe due in part to higher peakdeceleration. The oblique test engages more of the vehicle structure simultaneously, wheel, frame rail,and engine. Thus, in the absence of additional tests with varying proportions of overlap, it is assumedthat oblique frontal offset crash pulses at overlaps of one-third (a) and greater are similar to those inthe full barrier tests. Although all of the partial overlap crash tests produce longer duration crash pulses
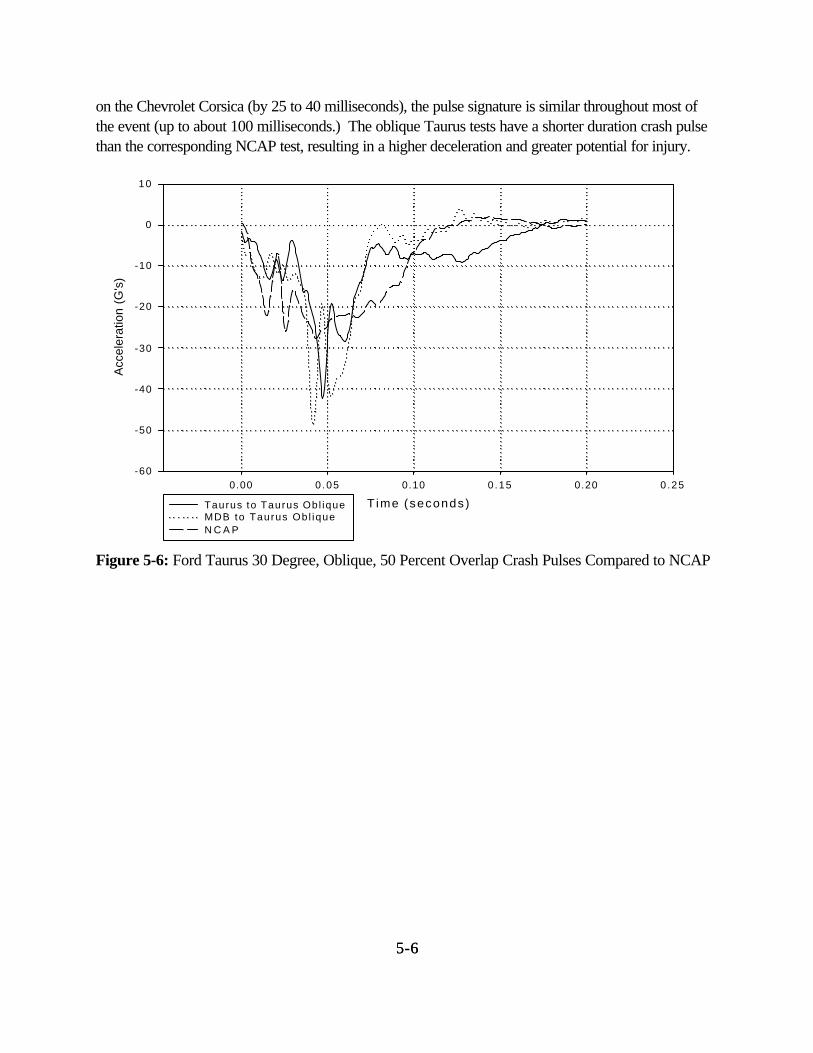
5-65-6
on the Chevrolet Corsica (by 25 to 40 milliseconds), the pulse signature is similar throughout most ofthe event (up to about 100 milliseconds.) The oblique Taurus tests have a shorter duration crash pulsethan the corresponding NCAP test, resulting in a higher deceleration and greater potential for injury.
Time (seconds)
0.00 0 .05 0.10 0 .15 0.20 0 .25
Acc
eler
atio
n (G
's)
-60
-50
-40
-30
-20
-10
0
10
Taurus to Taurus Obl iqueMDB to Taurus Obl iqueN C A P
Figure 5-6: Ford Taurus 30 Degree, Oblique, 50 Percent Overlap Crash Pulses Compared to NCAP
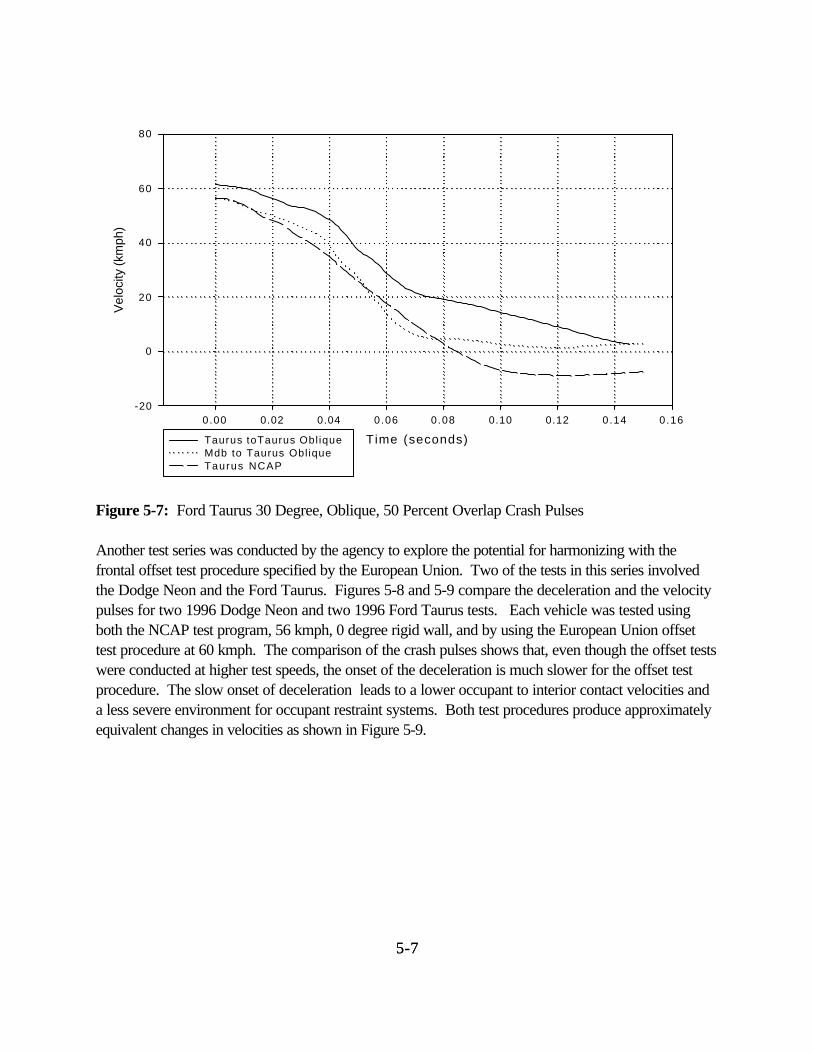
5-75-7
Time (seconds)
0.00 0.02 0.04 0.06 0.08 0.10 0.12 0.14 0.16
Vel
ocity
(km
ph)
-20
0
20
40
60
80
Taurus toTaurus Obl ique Mdb to Taurus Obl ique Taurus NCAP
Figure 5-7: Ford Taurus 30 Degree, Oblique, 50 Percent Overlap Crash Pulses
Another test series was conducted by the agency to explore the potential for harmonizing with thefrontal offset test procedure specified by the European Union. Two of the tests in this series involvedthe Dodge Neon and the Ford Taurus. Figures 5-8 and 5-9 compare the deceleration and the velocitypulses for two 1996 Dodge Neon and two 1996 Ford Taurus tests. Each vehicle was tested usingboth the NCAP test program, 56 kmph, 0 degree rigid wall, and by using the European Union offsettest procedure at 60 kmph. The comparison of the crash pulses shows that, even though the offset testswere conducted at higher test speeds, the onset of the deceleration is much slower for the offset testprocedure. The slow onset of deceleration leads to a lower occupant to interior contact velocities anda less severe environment for occupant restraint systems. Both test procedures produce approximatelyequivalent changes in velocities as shown in Figure 5-9.
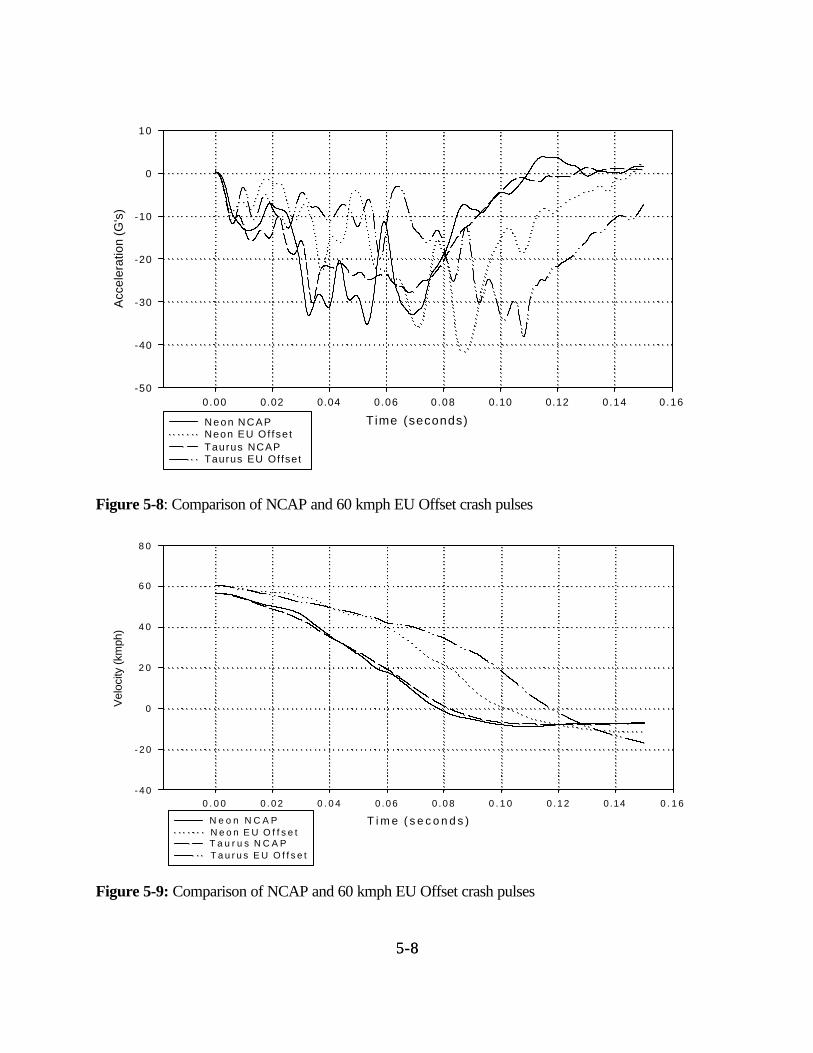
5-85-8
Time (seconds)
0.00 0.02 0.04 0.06 0.08 0.10 0.12 0.14 0.16
Acc
eler
atio
n (G
's)
-50
-40
-30
-20
-10
0
10
N e o n N C A PNeon EU Of fse tTaurus NCAPTaurus EU Of fset
Figure 5-8: Comparison of NCAP and 60 kmph EU Offset crash pulses
T i m e ( s e c o n d s )
0 . 0 0 0 . 0 2 0 . 0 4 0 . 0 6 0 . 0 8 0 . 1 0 0 . 1 2 0.14 0 . 1 6
Vel
ocity
(km
ph)
- 4 0
- 2 0
0
2 0
4 0
6 0
8 0
N e o n N C A PN e o n E U O f f s e tT a u r u s N C A PT a u r u s E U O f f s e t
Figure 5-9: Comparison of NCAP and 60 kmph EU Offset crash pulses

5-95-9
5.1.2 Simulated Crash Responses
In order to provide additional crash response data, a series of finite element simulations using anavailable Dodge Neon model as the baseline vehicle was conducted. These simulations were run for amatrix of test methods and crash configurations so that a comparative analysis can be undertaken. Allof the simulations were conducted using LS-DYNA version 9.40. These included simulating 48 kmph(30 mph) full frontal rigid wall tests at angles of 0, 15, and 30 degrees. Also included were simulationsof a fixed full frontal deformable barrier. Finally, vehicle-to-vehicle collisions were simulated. Theseincluded both full frontal and oblique, frontal offset crash simulations of the Neon into a Chevrolet CK2500 pickup truck. The matrix for the finite element simulation study is shown in Table 5-1. Thevalidation and detailed results for these simulations are discussed in Appendix B.
Table 5-1: Matrix for Finite Element Simulations
Vehicle Speed Configuration
Neon 48 kmph 0 Degree Rigid Wall
Neon 48 kmph 15 Degree Rigid Wall
Neon 48 kmph 30 Degree Rigid Wall
Neon 48 kmph Fixed Full Frontal Deformable Barrier (FFFDB)
Neon-CK 48 kmph Full Frontal engagement
Neon-Neon 48 kmph Full Frontal engagement
Neon-CK 48 kmph 30 Degree Oblique 50% Offset
Figures 5-10 and 5-11 show the deceleration profiles for all of the Neon simulations. The 208 rigidbarrier deceleration and the generic sled pulse are used as references for comparison. Figure 5-10plots the deceleration profiles that are classified as “soft” or “sled-like”. Figure 5-11 plots the profilesthat are considered “stiff” or “Barrier-like.” Notice that the rigid barrier deceleration very closelyresembles the Neon to Neon simulation. This correlation is dependent upon the symmetry of the Neonstructure. The generic sled pulse does not resemble the deceleration profile for any of the testconfigurations. The GSP has a longer pulse width and lower peak deceleration than the 208 barrier. The FFFDB and the 30 degree barrier similarly had longer deceleration pulse widths and lower peaksthan the 208 barrier. The fixed full frontal deformable barrier, FFFDB, has generally low decelerationprofile from 40 to 60 milliseconds. The peak deceleration for the FFFDB occurs significantly later, (78ms), than any of the other test configurations, except the 30 degree angled barrier impact. Note thelongitudinal deceleration of the Neon was plotted for all of the deceleration profiles. The offset obliqueNeon - CK simulation produced a longer deceleration profile with a significantly lower peak

5-105-10
deceleration than was produced by the inline Neon - CK simulation. The Neon-CK oblique offsetsimulation did not produce the high deceleration levels, relative to the 208 rigid barrier test procedure,that were observed in the Taurus test series.
T i m e ( s e c o n d s )
0 . 0 0 0 . 0 2 0 . 0 4 0 . 0 6 0 . 0 8 0 . 1 0 0 . 1 2 0 . 1 4 0 . 1 6
Acc
eler
atio
n (G
's)
- 4 0
- 3 0
- 2 0
- 1 0
0
1 0
R i g i d B a r r i e rG S P F F F D B 3 0 D e g r e e B a r r i e rN e o n - C K O f f s e t O b l i q u e
Figure 5-10: Comparison of “Soft” Acceleration Profiles for Neon Simulations
T i m e ( s e c o n d s )
0 . 0 0 0 . 0 2 0 . 0 4 0 . 0 6 0 . 0 8 0 . 1 0 0 . 1 2 0 . 1 4 0 . 1 6
Acc
eler
atio
n (G
's)
- 5 0
- 4 0
- 3 0
- 2 0
- 1 0
0
1 0
2 0
R i g i d B a r r i e rG S P N e o n - N e o nN e o n - C K1 5 D e g r e e B a r r i e r
Figure 5-11: Comparison of “Stiff” Acceleration Profiles for Neon Simulations

5-115-11
Figures 5-12 and 5-13 shows the velocity profiles for the “soft” and “stiff” simulated test configurationsrespectively. Between 20 ms and 70 ms the velocity profiles can be lumped into two general groups. The stiff velocity profiles have a sharp slope and follow the behavior of the rigid barrier test. The softvelocity profiles have a much lower slope. Again the rigid barrier velocity profile very closelyresembles the Neon-Neon simulation. The Neon - CK simulation initially resembles the rigid barrier profile, but has a much higher change in velocity after 70 ms.
T i m e ( s e c o n d s )
0 . 0 0 0 . 0 2 0 . 0 4 0 . 0 6 0 . 0 8 0 . 1 0 0 . 1 2 0 . 1 4 0 . 1 6
Vel
ocity
(km
ph)
- 2 0
- 1 0
0
1 0
2 0
3 0
4 0
5 0
6 0
R i g i d B a r r i e rG S PF F F D B3 0 D e g r e e B a r r i e rN e o n - C K O f f s e t O b l i q u e
Figure 5-12: Comparison of Velocity Profiles for “Soft” Neon Simulations
T i m e ( s e c o n d s )
0 . 0 0 0 . 0 2 0 . 0 4 0 . 0 6 0 . 0 8 0 . 1 0 0 . 1 2 0 . 1 4 0 . 1 6
Vel
ocity
(km
ph)
- 4 0
- 2 0
0
2 0
4 0
6 0
R i g i d B a r r i e rG S PN e o n - N e o nN e o n - C K1 5 D e g r e e B a r r i e r
Figure 5-13: Comparison of Velocity Profiles for “Stiff” Neon Simulations
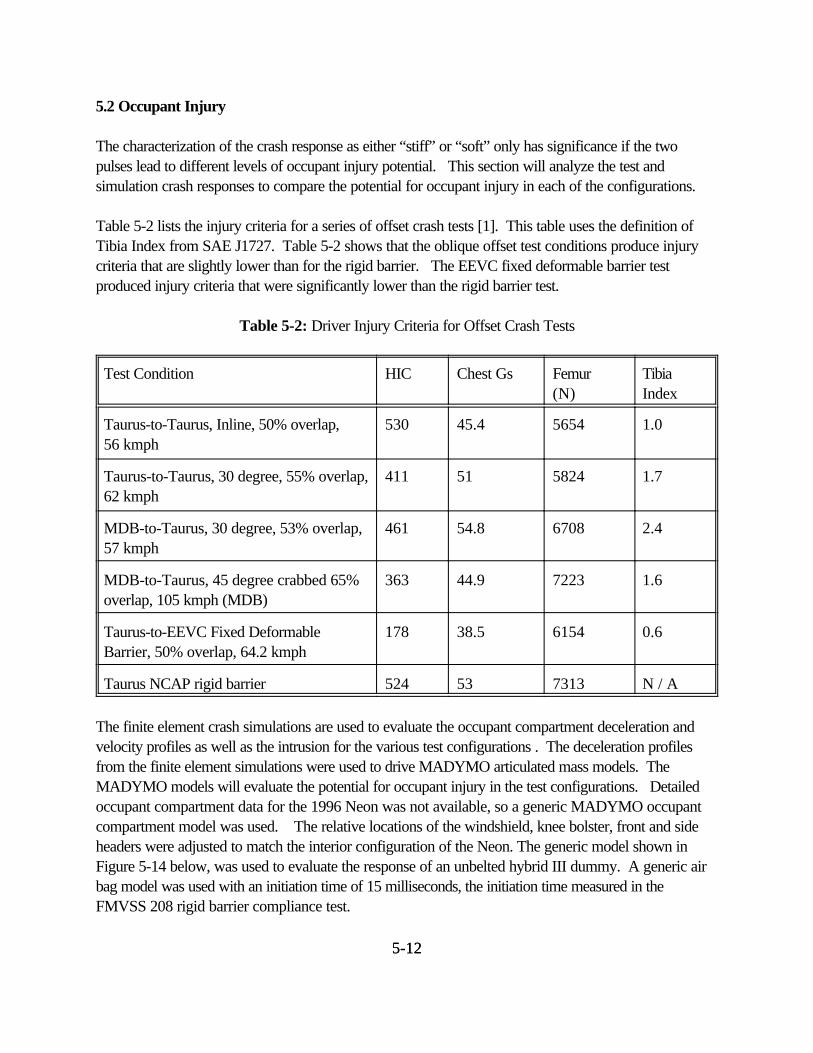
5-125-12
5.2 Occupant Injury
The characterization of the crash response as either “stiff” or “soft” only has significance if the twopulses lead to different levels of occupant injury potential. This section will analyze the test andsimulation crash responses to compare the potential for occupant injury in each of the configurations.
Table 5-2 lists the injury criteria for a series of offset crash tests [1]. This table uses the definition ofTibia Index from SAE J1727. Table 5-2 shows that the oblique offset test conditions produce injurycriteria that are slightly lower than for the rigid barrier. The EEVC fixed deformable barrier testproduced injury criteria that were significantly lower than the rigid barrier test.
Table 5-2: Driver Injury Criteria for Offset Crash Tests
Test Condition HIC Chest Gs Femur(N)
TibiaIndex
Taurus-to-Taurus, Inline, 50% overlap,56 kmph
530 45.4 5654 1.0
Taurus-to-Taurus, 30 degree, 55% overlap,62 kmph
411 51 5824 1.7
MDB-to-Taurus, 30 degree, 53% overlap,57 kmph
461 54.8 6708 2.4
MDB-to-Taurus, 45 degree crabbed 65%overlap, 105 kmph (MDB)
363 44.9 7223 1.6
Taurus-to-EEVC Fixed DeformableBarrier, 50% overlap, 64.2 kmph
178 38.5 6154 0.6
Taurus NCAP rigid barrier 524 53 7313 N / A
The finite element crash simulations are used to evaluate the occupant compartment deceleration andvelocity profiles as well as the intrusion for the various test configurations . The deceleration profilesfrom the finite element simulations were used to drive MADYMO articulated mass models. TheMADYMO models will evaluate the potential for occupant injury in the test configurations. Detailedoccupant compartment data for the 1996 Neon was not available, so a generic MADYMO occupantcompartment model was used. The relative locations of the windshield, knee bolster, front and sideheaders were adjusted to match the interior configuration of the Neon. The generic model shown inFigure 5-14 below, was used to evaluate the response of an unbelted hybrid III dummy. A generic airbag model was used with an initiation time of 15 milliseconds, the initiation time measured in theFMVSS 208 rigid barrier compliance test.

5-135-13
Figure 5-14: MADYMO model for the generic occupant compartment
Since the occupant compartment model is generic and developed specifically for the Neon, thecomputed injury criteria have been normalized relative to the baseline 48 kmph zero degree rigid barriertest data. The injury criteria for all of the test configurations are shown in Table 5-3.
Table 5-3: Injury Criteria from MADYMO Driver simulations
Test HIC Chest G’s Chest Defl.
FMVSS 208 Rigid Barrier 100% 100% 100%
Generic Sled Pulse (GSP) 48% 65% 76%
FFFDB 80% 92% 103%
Neon-Neon 90% 119% 99%
Neon-CK Inline 207% 142% 155%
15 Degree Barrier 78% 90% 111%
30 Degree Barrier 67% 64% 72%
Neon-CK30 Degree50% Offset
80% 64% 79%

5-145-14
Table 5-3 indicates the test configurations that were identified as “soft”, the GSP, FFFDB, 30 degreebarrier, and Neon - CK oblique all have HIC’s that are 80% or below of the rigid barrier testconfiguration. The chest acceleration shows a somewhat narrower differentiation between the testconfigurations with the FFFDB having an acceleration 92% of the FMVSS 208 test configuration. The chest displacement measurements do show the same grouping of test procedures. The FFFDBhas approximately the same chest deflection as the FMVSS 208 test configuration, while the other“soft” configurations have chest deflections below 80% of the FMVSS 208 test configuration.
5.3 Occupant Compartment Intrusion
Studies of the NASS data have shown that crashes with greater than 15 cm of intrusion have a higherprobability of serious injury. This section will evaluate the test configurations in terms of the measuredintrusion.
The intrusion measurements for the full vehicle tests of the Ford Taurus and Chevrolet Corsica areshown in Tables 5-4 and 5-5. For the tables, only the maximum intrusion into the occupantcompartment is considered. For the various test configurations, intrusion measurements were made forthe toepan, instrument panel, and steering column. The intrusion measurements were broken down intotwo groups, less than and greater than 15 cm of intrusion. For the Taurus series all of the angledimpacts generated intrusions greater than 15 cm, while all the tests with full engagement of the frontstructure produced less than 15 cm of intrusion. The Corsica test series consisted of a series ofoblique and collinear offset tests, in which all tests that recorded intrusion measured greater than 15 cmof intrusion. The oblique tests all produced intrusion greater than 15 cm.
Table 5-4: Intrusion measurements for Taurus Test Series
TAURUS INTRUSION BY TEST TYPE
TEST TYPE SPEED,kmph
OVERLAP, % 0-15 cm > 15 cm
#1 Car-to-car collinear 56 50 x
#2 Car-to-car collinear 59 50 x
Car-to-car oblique 62 50 x
MDB-to-car oblique 59 50 x
EU Directive 64 50 x
EU Directive 64 40 x

5-155-15
EU Directive 60 40 x
#1 NCAP Rigid Barrier 56 100 x
#2 NCAP Rigid Barrier 59 100 x
#1 FMVSS 208 Rigid Barrier 48 100 x
#2 FMVSS 208 Rigid Barrier 48 100 x
Table 5-5: Intrusion measurements for Corsica Test Series
CORSICA INTRUSION BY TEST TYPE
TEST TYPE SPEED,kmph
OVERLAP, % 0-15 cm > 15 cm
#1 Car-to-car oblique 66 80 x
#2 Car-to-car oblique 62 50 x
MDB-to-car oblique 66 50 x
Car-to-car oblique 53 50 x
#1 Car-to-car collinear 59 50 x
#2 Car-to-car collinear 58 60 x
#3 Car-to-car collinear 59 70 x
DOT# 1585 NCAP Rigid Barrier 56 100 N/A N/A
DOT #2124 208 Rigid Barrier 48 100 N/A N/ANote: Data not available for NCAP and 208 Corsica tests
Similarly the measurements for the simulations are shown in Table 5-6. Only the simulations for the208, Neon-Neon, and FFFDB test configurations had maximum intrusions of less than 15 cm. All ofthe angled simulations produced maximum intrusions of greater than 15 cm..
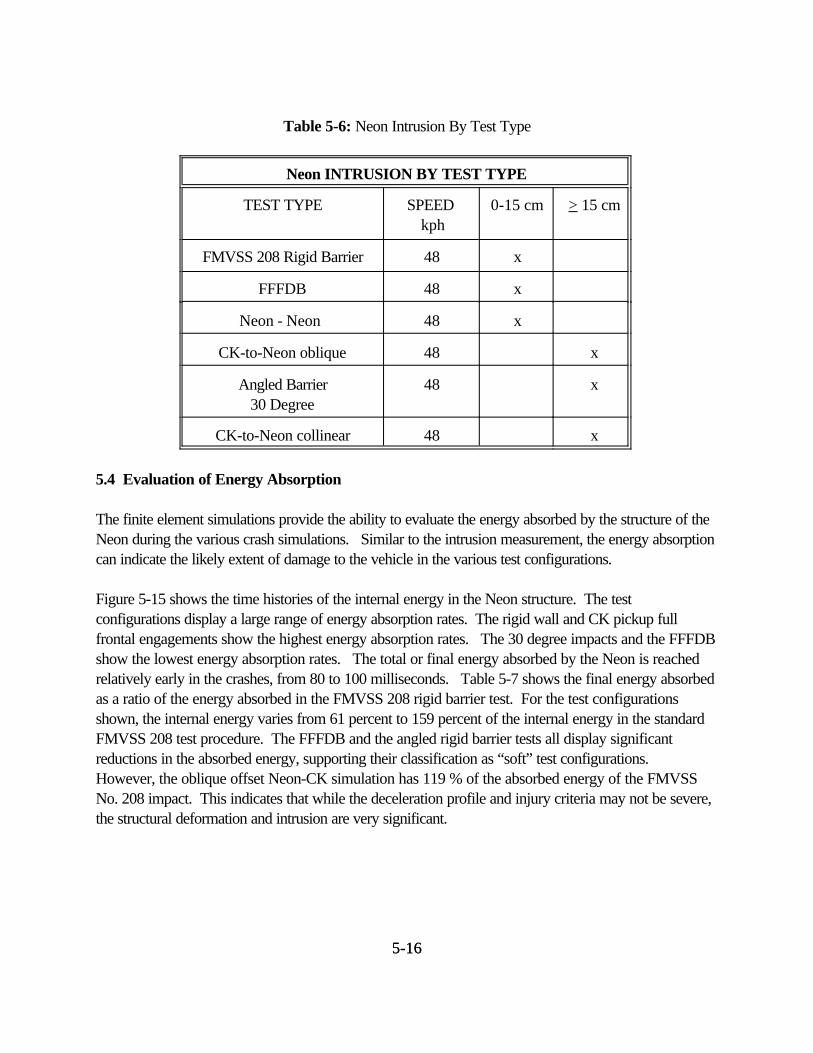
5-165-16
Table 5-6: Neon Intrusion By Test Type
Neon INTRUSION BY TEST TYPE
TEST TYPE SPEED kph
0-15 cm > 15 cm
FMVSS 208 Rigid Barrier 48 x
FFFDB 48 x
Neon - Neon 48 x
CK-to-Neon oblique 48 x
Angled Barrier30 Degree
48 x
CK-to-Neon collinear 48 x
5.4 Evaluation of Energy Absorption
The finite element simulations provide the ability to evaluate the energy absorbed by the structure of theNeon during the various crash simulations. Similar to the intrusion measurement, the energy absorptioncan indicate the likely extent of damage to the vehicle in the various test configurations.
Figure 5-15 shows the time histories of the internal energy in the Neon structure. The testconfigurations display a large range of energy absorption rates. The rigid wall and CK pickup fullfrontal engagements show the highest energy absorption rates. The 30 degree impacts and the FFFDBshow the lowest energy absorption rates. The total or final energy absorbed by the Neon is reachedrelatively early in the crashes, from 80 to 100 milliseconds. Table 5-7 shows the final energy absorbedas a ratio of the energy absorbed in the FMVSS 208 rigid barrier test. For the test configurationsshown, the internal energy varies from 61 percent to 159 percent of the internal energy in the standardFMVSS 208 test procedure. The FFFDB and the angled rigid barrier tests all display significantreductions in the absorbed energy, supporting their classification as “soft” test configurations. However, the oblique offset Neon-CK simulation has 119 % of the absorbed energy of the FMVSSNo. 208 impact. This indicates that while the deceleration profile and injury criteria may not be severe,the structural deformation and intrusion are very significant.
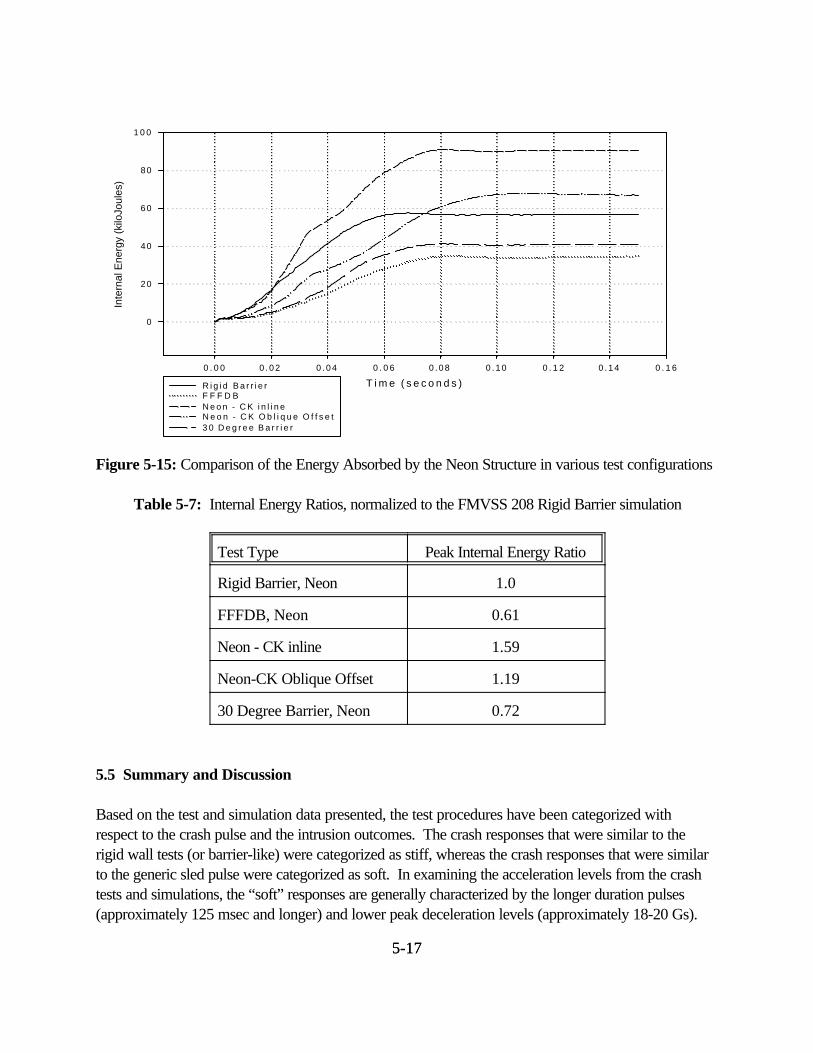
5-175-17
T i m e ( s e c o n d s )
0 . 0 0 0 . 0 2 0 . 0 4 0 . 0 6 0 . 0 8 0 . 1 0 0 . 1 2 0 . 1 4 0 . 1 6
Inte
rnal
Ene
rgy
(kilo
Joul
es)
0
20
40
60
80
1 0 0
R i g i d B a r r i e rF F F D BN e o n - C K i n l i n eN e o n - C K O b l i q u e O f f s e t3 0 D e g r e e B a r r i e r
Figure 5-15: Comparison of the Energy Absorbed by the Neon Structure in various test configurations
Table 5-7: Internal Energy Ratios, normalized to the FMVSS 208 Rigid Barrier simulation
Test Type Peak Internal Energy Ratio
Rigid Barrier, Neon 1.0
FFFDB, Neon 0.61
Neon - CK inline 1.59
Neon-CK Oblique Offset 1.19
30 Degree Barrier, Neon 0.72
5.5 Summary and Discussion
Based on the test and simulation data presented, the test procedures have been categorized withrespect to the crash pulse and the intrusion outcomes. The crash responses that were similar to therigid wall tests (or barrier-like) were categorized as stiff, whereas the crash responses that were similarto the generic sled pulse were categorized as soft. In examining the acceleration levels from the crashtests and simulations, the “soft” responses are generally characterized by the longer duration pulses(approximately 125 msec and longer) and lower peak deceleration levels (approximately 18-20 Gs).

5-185-18
The “stiff” pulses are characterized by the shorter duration pulses (below 110 millisecond) and higherpeak deceleration levels (approximately 25 Gs). In examining the resulting velocity profiles from thesepulses during the first 50 to 60 milliseconds (the time at which occupants begin to interact with the airbag), it is observed that the “soft” pulses result in velocity changes that are roughly half of thoseexperienced by vehicles subjected to a stiff pulse. In examining both the crash test and the simulationresults, it is seen that the vehicles subjected to the soft pulses experienced lower injury levels ascompared to the vehicles subjected to stiff pulses. Furthermore, in examining the energy absorbed bythe Neon’s frontal structure as calculated through finite element analyses, it was observed that the stiffpulses resulted in substantially greater energy absorption. The energy absorption resulting from a softpulse was 70 percent (and lower) of that absorbed by a stiff pulse.
In addition to characterizing the crash response, the expected intrusion outcome was determined. Theexpected intrusion outcome was divided into two categories as well. The first was an expectedintrusion level of 0 to 15 cm. The second was for intrusion that is expected to exceed 15 cm. Theseintrusion levels were chosen based on the probability of injury as observed in the NASS files (SeeChapter 3.). The results from these efforts are shown in Table 5-8.
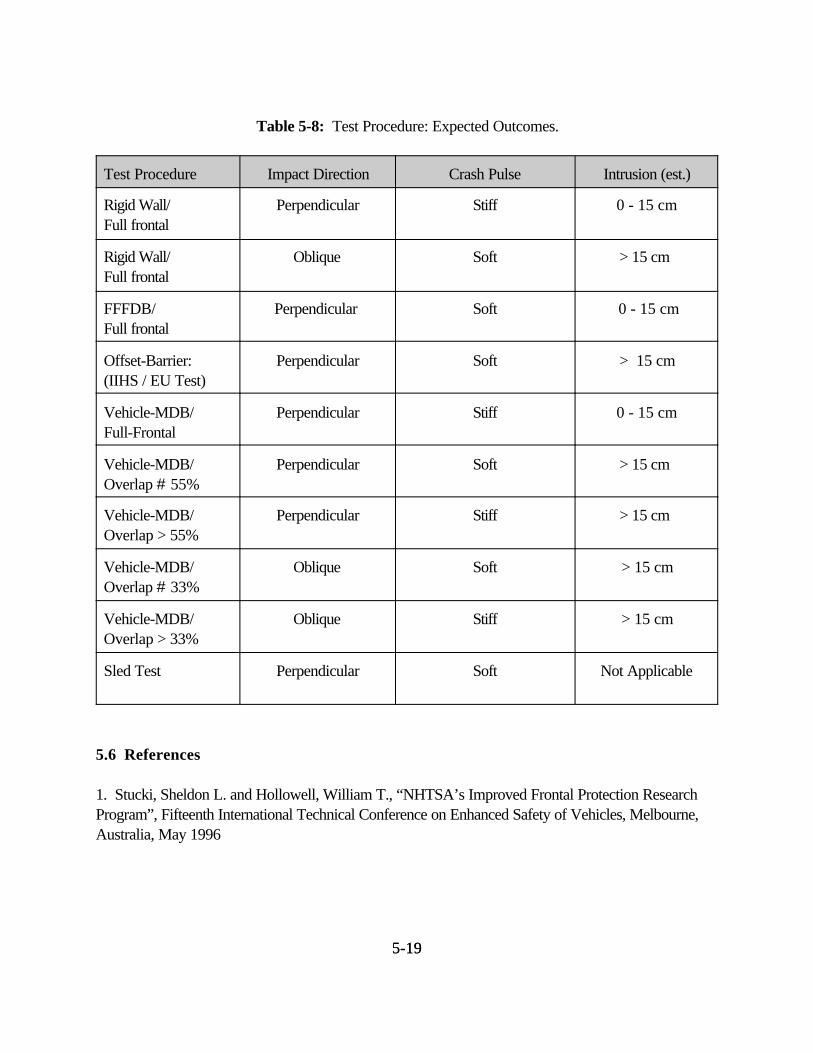
5-195-19
Table 5-8: Test Procedure: Expected Outcomes.
Test Procedure Impact Direction Crash Pulse Intrusion (est.)
Rigid Wall/Full frontal
Perpendicular Stiff 0 - 15 cm
Rigid Wall/Full frontal
Oblique Soft > 15 cm
FFFDB/Full frontal
Perpendicular Soft 0 - 15 cm
Offset-Barrier: (IIHS / EU Test)
Perpendicular Soft > 15 cm
Vehicle-MDB/Full-Frontal
Perpendicular Stiff 0 - 15 cm
Vehicle-MDB/Overlap # 55%
Perpendicular Soft > 15 cm
Vehicle-MDB/Overlap > 55%
Perpendicular Stiff > 15 cm
Vehicle-MDB/Overlap # 33%
Oblique Soft > 15 cm
Vehicle-MDB/Overlap > 33%
Oblique Stiff > 15 cm
Sled Test Perpendicular Soft Not Applicable
5.6 References
1. Stucki, Sheldon L. and Hollowell, William T., “NHTSA’s Improved Frontal Protection ResearchProgram”, Fifteenth International Technical Conference on Enhanced Safety of Vehicles, Melbourne,Australia, May 1996

6-1
CHAPTER 6. SUMMARY AND RECOMMENDATIONS
The National Highway Traffic Safety Administration has undertaken a priority effort to minimize thefatalities and reduce the severity of the injuries to out-of-position occupants resulting from aggressive airbag deployment in low speed crashes, and also, simultaneously, to preserve the benefits for normallyseated restrained and unbelted adults in high severity crashes. As part of this effort, the agency hasundertaken a study to evaluate a number of test procedures that could be used to evaluate the safetyperformance of vehicles in frontal crashes. For this special study, a multifaceted approach wasundertaken. In Chapter 2, a review of the candidate test procedures is presented, and a generaldescription and an assessment of the state of development for each test procedure are discussed. InChapter 3, the frontal crash environment is characterized using the National Automotive SamplingSystem (NASS) file. Target populations for crashes and for serious injury-producing crashes arepresented for the candidate test procedures. Furthermore, the predominant body regions which areaddressed by the candidate test procedures are identified. In Chapter 4, a study is presented regardingthe design directions that would result from each of the candidate test procedures. An evaluation ismade regarding the effects of the test procedures toward compatibility in vehicle-to-vehicle crashes. InChapter 5, a study is presented that identifies the candidate test procedures as being rigid barrier-like(“stiff) or sled-like (“soft”), the test procedures that are currently part of FMVSS No. 208. Comparisons of the crash responses are made with responses from vehicle-to-vehicle crashes (usingtest or simulation data) in order to ascertain whether the candidate test procedures are representative ofreal world crashes. Furthermore, the procedures are characterized based on their anticipated level ofintrusion. This final section summarizes the major findings from the individual studies, and then providesrecommendations resulting from these findings.
6.1 Summary of Findings
This section provides highlights of the findings from each of the analyses undertaken for this study. Forthe convenience of the reader, Table 6.1 summarizes these findings.
As mentioned, Chapter 2 provides a review of the types of testing that have been utilized in the pastand that could be used in the future by the agency for evaluating vehicle safety performance. During thisreview, car-to-car and car-to-narrow object testing were eliminated as candidate test procedures. Included as candidate test procedures were the rigid barrier test (both full frontal and full frontaloblique), a full frontal fixed deformable barrier test, a moving deformable barrier-to-vehicle test, and asled test. A general description and an assessment of the state of development for each test procedureis presented. Additionally, the status of each procedure with respect to regulatory testing, NCAPtesting, and research testing was discussed. Included within the discussion are the agency’s andexternal organizations’ experience with each procedure as well as the expected lead time necessary to

6-2
complete the research related to each procedure. From this review, it has been determined that therigid barrier, the oblique rigid barrier, the frontal offset deformable barrier, and the sled test proceduresare available for use without additional research. The moving deformable barrier test may require 2-3years to complete the research.
In Chapter 3, the frontal crash environment is characterized using the National Automotive SamplingSystem (NASS) file. Target populations for all frontal crashes and for serious injury-producing crashesare presented for the candidate test procedures. Furthermore, the predominant body regions which areaddressed by the candidate test procedures are identified. Some general conclusions are that driverswith air bags involved in frontal crashes subjected to a stiff crash pulse have a higher frequency and riskof serious-to-fatal injuries than drivers in crashes subjected to a soft crash pulse. Crashes characterizedby a stiff crash pulses produce more AIS$3, life-threatening, head and chest injuries. Offset crashes,with either a stiff and soft crash pulses, produce more leg injuries.
By grouping drivers into specific test conditions based on the crash severity, assumed to becharacterized by the crash pulse and level of intrusion, an estimate of the target crash populations isprojected. An MDB-to-vehicle test, using both left and right offset test procedures, would address thelargest target population for both the exposure and for seriously injured drivers (i.e., drivers withinjuries of severity MAIS$3). The results from the study indicated the target population is about 80percent of the drivers in frontal crashes and about 70 percent of those with serious-to-fatal injuries. The full frontal fixed barrier test would address a lower target population, about 55 percent of drivers infrontal crashes and about 45 percent of those with MAIS$3 injuries. All other potential tests wouldaddress substantially lower target populations. The MDB-to-vehicle test addresses head, chest, andleg injuries; while the full frontal fixed barrier test addresses head and chest injuries, predominantly. Theremaining tests which produce stiff pulses and low intrusion address mainly head and chest injuries,while those tests with soft pulses and substantial intrusion mainly address leg injuries. The body regionsaddressed by the sled test with a soft pulse and no intrusion is not apparent from the method used toevaluate the crashes contained in the NASS file.
In Chapter 4, a study is presented regarding the design directions that would result from each of thecandidate test procedures. An evaluation is made regarding the effects of the test procedures towardcompatibility in vehicle-to-vehicle crashes. Test procedures which produce a stiff crash pulse tend toencourage the design of softer front structures and /or more effective restraint systems. Procedureswhich replicate the intrusion seen in real world crashes, tend to encourage designers to strengthen thevehicle structure. Both design modifications affect the extent to which the vehicle is compatible with itscrash partners. Stiffening the frontal structure of a vehicle for intrusion protection makes the vehiclemore aggressive while softening the frontal structure for crash pulse protection makes the vehicle lessaggressive. The ideal design balances the need for crash and intrusion control while limitingaggressivity.

6-3
Currently, the rigid barrier test acts as a constraint on over-stiffening of the front vehicle structure. Thefrontal-oblique MDB test, or a combination of the rigid full frontal barrier test and a frontal-offset testforces designers to produce a vehicle which limits intrusion while simultaneously limiting decelerationseverity. However, less rigorous tests, e.g, the FFFDB or the sled test, would effectively waive orweaken this limit on deceleration severity, and possibly could permit the manufacture of a newgeneration of stiffer and, therefore, more aggressive passenger vehicles.
In Chapter 5, a study is presented that identifies the candidate test procedures as being barrier-like(“stiff) or sled-like (“soft”). Comparisons of the crash responses are made with responses fromvehicle-to-vehicle crashes (using test or simulation data) in order to ascertain whether the candidate testprocedures are representative of real world crashes. Furthermore, the procedures are characterizedregarding their anticipated level of intrusion. Based on the test and simulation data presented, the testprocedures have been categorized with respect to the crash pulse and the intrusion outcomes. Thecrash responses that were similar to the rigid wall tests (or barrier-like) were categorized as stiff,whereas the crash responses that were similar to the generic sled pulse were categorized as soft. Inexamining the acceleration levels from the crash tests and simulations, the “soft” responses are generallycharacterized by the longer duration pulses and lower peak acceleration levels). The “stiff” pulses arecharacterized by the shorter duration pulses and higher acceleration levels. In examining the resultingvelocity profiles from these pulses during the first 50 to 60 milliseconds (the time at which occupantsbegins to interact with the air bag), it is observed that the “soft” pulses result in velocity changes that areroughly half of those experienced by vehicles subjected to a “stiff” pulse. In examining both the crashtest and the simulation results, it is seen that the occupants of vehicles subjected to soft pulsesexperienced lower injury levels than the occupants of vehicles subjected to stiff pulses. Furthermore, inexamining the energy absorbed by the frontal structure as calculated through finite element analyses, itwas observed that the test procedures resulted in substantially different energy absorption. Forexample, the energy absorption resulting from the FFFDB test procedure was less than or equal to 70percent of that absorbed by the vehicle in the rigid barrier test.
In addition to characterizing the crash response, the maximum occupant compartment intrusion wasdetermined at the toeboard, dashpanel, and steering column. The expected intrusion outcome wasdivided into two categories as well. The first was an expected intrusion level of 0 to 15 cm. Thesecond was for intrusion that is expected to exceed 15 cm. These intrusion levels were chosen basedon the probability of injury as observed in the NASS files.

6-4
Table 6.1. Test Procedure Expected Outcomes
Test#
Test DescriptionSpecific TestConfiguration
CrashPulse
IntrusionAnnual Counts Annual Counts
Expanded Test DesignDirections
LeadTimeExposed
DriversDrivers
withMAIS$3
PredominantBody Regions
Addressed1
ExposedDrivers
Driverswith
MAIS$3
1FMVSS 208Rigid Barrier Test(Past andPlanned)
Rigid Wall/Full Frontal (0-15o)
Stiff 0 to 15cm 263,981 5,054 Head, Chest NA NA Soften front and/orimprove restraints
Now
Rigid Wall / FrontalOblique (15-30o)
Soft >15 cm 378,670 8,875 Legs 378,670 8,875 Stiffen frontstructure
Now
2 FFFDB/Full Frontal
FFFDB/Full Frontal
Soft 0 to 15cm 353,306 3,170 Legs NA NA 1-2 yrs
3 Offset-BarrierEU Test
Offset-BarrierEU Test
Soft >15 cm 177,585 5,212 Legs 378,670 8,875 Stiffen frontstructure
Now
4 Vehicle-MDBFull Frontal
Vehicle-MDBFull Frontal
Stiff 0 to 15cm 263,981 5,054 Head, Chest NA NA Stiffen lightervehicles; neutralfor heavy vehicles
2-3 yrs
5 Vehicle-MDBOffset - Stiff (Option 1)
Vehicle-MDBInline Overlap>55%
Stiff >15 cm 454,212 12,828 Head, Chest,Legs
932,907 20,297 Soften frontstructure; Lightervehicles also muststrengthencompartment
2-3 yrs
Vehicle-MDBOffset - Stiff (Option 2)
Vehicle-MDBOblique Overlap>33%
Stiff > 15 cm 454,212 12,828 Head, Chest,Legs
932,907 20,297 Soften frontstructure; Lightervehicles also muststrengthencompartment
2-3 yrs

6-5
6 Vehicle-MDBOffset - Soft (Option 1)
Vehicle-MDBInline Overlap#55%
Soft > 15 cm 177,585 5,212 Legs 378,670 8,875 Stiffen frontstructure
2-3 yrs
Vehicle-MDBOffset - Soft (Option 2)
Vehicle-MDBObliqueOverlap#33%
Soft > 15 cm 177,585 5,212 Legs 378,670 8,875 Stiffen frontstructure
2-3 yrs
7 FMVSS 208 SledTest
Sled Test Soft NA 299,911 1,396 NA NA - Now
1 Analysis of body region by crash mode and pulse type, shows “stiff” pulses result in higher rates of head/chest injury and offset resulted in more leg injuries

6-6
6.2 Options for Consideration
Analysis of each of the candidate test procedures with respect to their lead time, target populations,body regions addressed, and effect on compatibility leads to the following four options available forconsideration for the evaluation of a vehicle’s frontal crash protection. The generic sled test is not one ofthe options. Unlike a full scale vehicle crash test, a sled test does not, and cannot, measure the actualprotection an occupant will receive in a crash. The sled test does not replicate the actual timing of airbag deployment, does not replicate the actual crash pulse of a vehicle, does not measure the injury orprotection from intruding parts of the vehicle, and does not measure how a vehicle performs in actualangled crashes. Finally, the generic sled test has a substantially smaller target population whencompared to the options discussed below.
Option 1 - Combination of Perpendicular and Oblique Rigid Barrier Tests: The first option is theunbelted rigid barrier test of impact speed 0 to 48 kmph and impact angle 0 to 30o. This option has atarget population which is substantially larger than the generic sled test, and is immediately available forimplementation. The perpendicular rigid barrier test primarily evaluates crash pulse severity while theoblique rigid barrier test primarily evaluates intrusion. Likewise, the perpendicular rigid barrier test isexpected to evaluate head, chest, neck and upper leg injury potential, but provides no evaluation oflower leg injury unless coupled with the oblique barrier test. With regard to compatibility, theperpendicular rigid barrier test acts as a constraint on over-stiffening the front structure. However, invehicle-to-vehicle collisions, it is equivalent to a frontal-to-frontal collision with a vehicle like itself. Hence, this procedure does not lead to compatibility with either lighter or heavier collision partners.
Option 2: Combination of the Perpendicular Rigid Barrier Test and an Offset Deformable Barrier Test: The second option is a combination of the rigid barrier test with an offset deformable barrier test similarto the procedure used in Europe. This option combines the crash pulse control provided by theperpendicular rigid barrier test with the intrusion control provided by the offset-barrier test. The targetpopulation for the combined procedure equals the target population for the combination of theperpendicular and oblique rigid barrier tests. In addition to evaluating the protection of the head, chest,and neck of the occupant, the combined procedure also evaluates leg protection against intrusion. Withregard to compatibility, the combined procedure, like the rigid barrier test alone, acts as a constraint onover-stiffening the front structure, but would allow strengthening of the occupant compartment to avoidintrusion. However, like Option 1, it is equivalent to a frontal collision with a vehicle like itself. Hence,this procedure does not lead to compatibility with either lighter or heavier collision partners.
Option 3 - Moving Deformable Barrier (MDB)-to-Vehicle Test: The third option is the frontal-MDBtest. Of all candidate test procedures, this option has one of the largest target populations, but also hasthe need for a longer lead time (2-3 years) to complete research and development. The frontal-MDBtest combines, in a single test, the crash pulse control provided by the perpendicular rigid barrier testwith the intrusion control provided by the offset-barrier test. For lighter vehicles, this procedureprovides the incentive to produce designs which are more crash compatible with heavier collision
6-7
partners. The procedure provides no incentive to either stiffen or soften larger vehicles, thereby allowingthe automakers the design flexibility to build compatibility into heavier vehicles. This option leads tocrash compatible designs. On the negative side, if a barrier weight is selected that represents the medianweight of the fleet, the vehicles that weigh more than the selected MDB would experience a softer crashpulse than that experienced in a rigid barrier test. Design modifications made to take advantage of thiscould lead to poorer performance in single vehicle crashes.
Option 4 - Combination of Perpendicular Rigid Barrier and Moving Deformable Barrier (MDB)-to-Vehicle Test: The fourth option is the combination of the frontal rigid barrier and the MDB test. Of allcandidate test procedures, this option has the largest target population. These tests combine the crashpulse control provided by the perpendicular rigid barrier test with the intrusion control provided by theoffset-barrier test. For lighter vehicles, this procedure provides the incentive to produce designs whichare more crash compatible with heavier collision partners. The combined procedures prevent largervehicles from becoming too stiff, thereby pointing the automakers toward designs that build compatibilityinto heavier vehicles. Of all the candidate test procedures, this option leads to most crash-compatibledesigns. This combination eliminates the negative side of an MDB test alone; that is, it would not allowdesign modifications that could lead to poorer performance in single vehicle crashes. The research anddevelopment related to this procedure will require a lead time of 2-3 years to complete.
6.3 Recommendations
On March 19, 1997, NHTSA published a final rule that adopted an unbelted sled test protocol as atemporary alternative to the fixed barrier test for unbelted occupants. The agency took this action toprovide an immediate, interim solution to the problem of the fatalities and injuries that current air bagsystems are causing in relatively low speed crashes to a small, but growing number of children andoccasionally to adults. It was the understanding at that time, and it is reiterated in this study, that thesled test does not meet the need for effectively evaluating vehicle protection systems. The advanced airbag rulemaking actions that are being proposed provide adequate lead time to assure proper designs foroccupant protection that must be evaluated under appropriate test conditions. Therefore, it isrecommended for this rulemaking to eliminate the sled test procedure and to consider theaforementioned options that are available within the rulemaking time frame. Additionally, it isrecommended that research be continued in developing and evaluating the moving deformable barriertest for future agency consideration for upgrading FMVSS No. 208.
6.4 References
1. Kahane, Charles J., Hackney, James R., and Berkowitz, Alan M., “Correlation of VehiclePerformance in the New Car Assessment Program with Fatality Risk in Actual Head-on Collisions,”14th International Technical Conference on the Enhanced Safety of Vehicles, Munich, Germany,May 1994.
6-8
2. ____, “Third Report to Congress: Effectiveness of Occupant Protection Systems and Their Use,”National Highway Traffic Safety Administration, Report No. DOT HS 537, December 1996.
3. Hackney, James R. and Kahane, Charles J., “The New Car Assessment Program: Five Star RatingSystem and Vehicle Safety Performance Characteristics,” SAE Paper No. 950888, SAEInternational Congress and Exposition, Detroit, MI, 1995.
APPENDIX A

LEGEND for TABLES A-1 through A-4
0 to 80 Percent of Injury Assessment Reference Value
80 to 90 Percent of Injury Assessment Reference Value
90 to 100 Percent of Injury Assessment Reference Value
Exceeds Injury Assessment Reference Value
TABLE A-1. UNBELTED DRIVER 50th PERCENTILE MALE
TABLE A-2. UNBELTED PASSENGER 50th PERCENTILE MALE
TABLE A-3. UNBELTED DRIVER 5th PERCENTILE FEMALE
TABLE A-4. UNBELTED PASSENGER 5th PERCENTILE FEMALE

A-1
TABLE A-1. UNBELTED DRIVER 50th PERCENTILE MALE
Test # Chest GIARV = 60.0
Chest disp.IARV = 63.0 mm
HIC15IARV = 700
Nij ver. 9 IARV = 1.0
Maximum Femur (N)IARV = 10,008 N
30 mphRigid Barrier
MY99 Intrepid V3126 54.4 44.8 403 0.52 7,786 (R)
MY99 Tacoma V3128 43.7 48.4 176 0.33 8,839 (L)
MY99 Acura RL V3125 56.9 31.8 154 0.29 13,349 (L)
MY99 Saturn SC1 V3127 36.8 46.8 128 0.41 5,288 (R)
MY99 Econoline V3123 52.1 37.1 87 0.32 6,198 (L)
MY99 Expedition V3124 46.7 28.1 178 0.41 6,612 (R)
MY98 Taurus V2832 47.2 21.9 181 0.38 5,556 (L)
MY98 Neon V2838 43.5 24.9 166 0.47 7,336 (R)
MY98 Camry V2837 51.8 38.1 231 0.45 6,115 (L)
MY98 Accord V2836 36.7 45.8 51 0.27 7,623 (R)
MY98 Explorer 4L V2839 44.4 32.3 272 0.30 6,033 (R)
MY98 Voyager V2773 48.0 54.7 350 0.47 7,309 (L)
MY98 Cherokee V2830 46.1 41.6 189 0.53 7,366 (L)
25 mphRigid Barrier
MY99 Intrepid V3147 40.1 33.0 194 0.41 7,824 (R)
MY99 Tacoma V3146 42.9 46.1 97 0.34 7,280 (L)
MY99 Acura RL V3145 35.0 35.7 63 0.24 5,912 (L)
35 mph 40% Offset Deformable Barrier
MY99 Intrepid V3143 57.8 42.3 350 1.39 5,558 (R)
MY99 Tacoma V3148 38.0 46.2 150 0.42 4,844 (L)
30 mph 30ERightBarrier
MY99 Intrepid V3144 34.4 23.5 53 0.35 5,623 (R)
30 mph 30E Left Barrier MY99 Intrepid V3117 43.0 32.0 210 0.37 5,666 (L)

A-2
TABLE A-2. UNBELTED PASSENGER 50th PERCENTILE MALE
Test # Chest GIARV = 60.0
Chest disp. (mm)IARV = 63.0 mm
HIC15IARV = 700
Nij ver. 9IARV 1.0
Maximum Femur (N)IARV = 10,008 N
30 mphRigid Barrier
MY99 Intrepid V3126 54.1 25.7 223 0.40 7,890 (R)
MY99 Tacoma V3128 35.6 23.5 173 0.69 6,372 (R)
MY99 Acura RL V3125 49.8 11.6 367 0.44 7,676 (R)
MY99 Saturn SC1 V3127 40.2 9.2 200 0.50 6,374 (L)
MY99 Econoline V3123 45.8 7.3 226 0.35 8,039 (R)
MY99 Expedition V3124 51.0 19.6 132 0.34 6,975 (R)
MY98 Taurus V2832 48.5 8.8 191 0.43 5,697 (L)
MY98 Neon V2838 61.4 16.0 297 0.59 6,606 (L)
MY98 Camry V2837 35.1 16.7 236 0.26 5,273 (R)
MY98 Accord V2836 45.0 13.1 160 0.39 4,677 (L)
MY98 Explorer4L V2839 48.2 10.3 186 0.31 6,341 (R)
MY98 Voyager V2773 53.4 20.3 249 0.48 8,025 (R)
MY98 Cherokee V2830 49.2 12.2 84 0.49 7,921 (R)
25 mph Rigid BarrierMY99 Intrepid V3147 48.1 18.3 83 0.39 9,016 (L)
MY99 Tacoma V3146 23.5 15.6 82 1.15 5,236 (R)
MY99 Acura RL V3145 32.8 17.3 119 0.44 6,215 (R)
35 mph 40% OffsetDeformable Barrier
MY99 Intrepid V3143 53.2 19.5 197 0.57 7,592 (L)
MY99 Tacoma V3148 39.4 23.4 208 0.57 4,591 (L)
30 mph 30E RightBarrier
MY99 Intrepid V3144 34.7 6.0 234 0.43 5,179 (L)
30 mph 30E LeftBarrier
MY99 Intrepid V3117 45.5 18.9 288 0.44 6,267 (L)
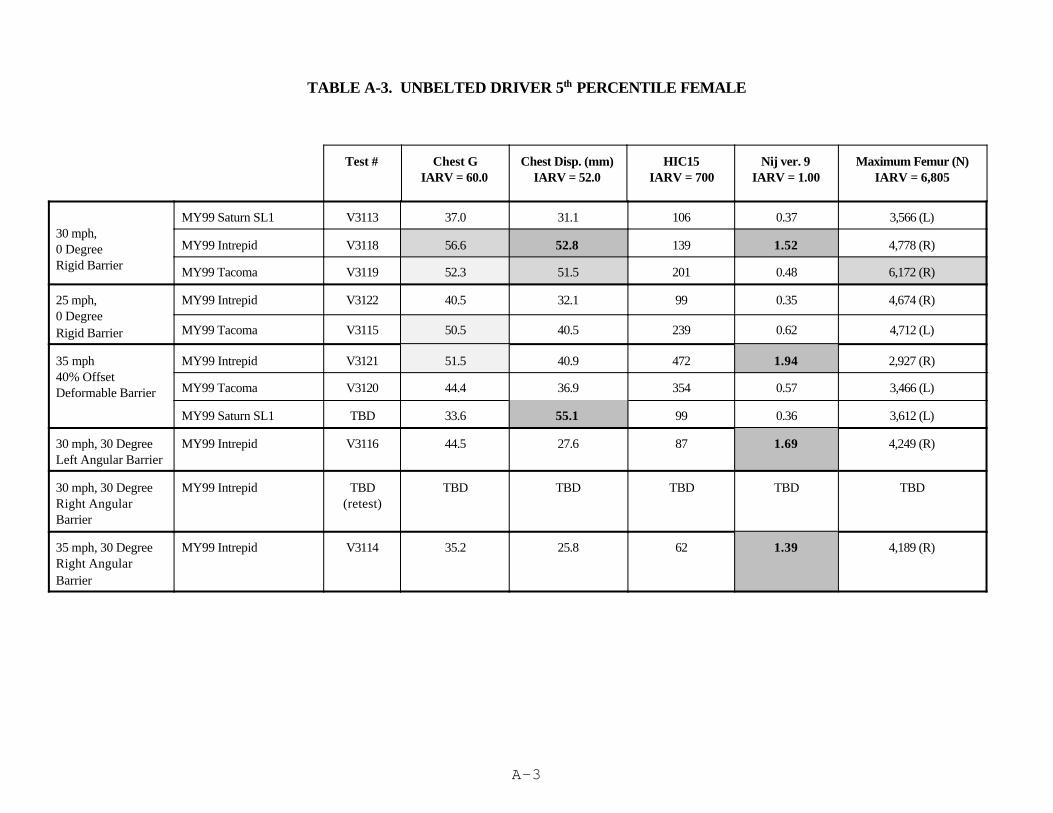
A-3
TABLE A-3. UNBELTED DRIVER 5th PERCENTILE FEMALE
Test # Chest GIARV = 60.0
Chest Disp. (mm)IARV = 52.0
HIC15IARV = 700
Nij ver. 9IARV = 1.00
Maximum Femur (N)IARV = 6,805
30 mph, 0 DegreeRigid Barrier
MY99 Saturn SL1 V3113 37.0 31.1 106 0.37 3,566 (L)
MY99 Intrepid V3118 56.6 52.8 139 1.52 4,778 (R)
MY99 Tacoma V3119 52.3 51.5 201 0.48 6,172 (R)
25 mph, 0 DegreeRigid Barrier
MY99 Intrepid V3122 40.5 32.1 99 0.35 4,674 (R)
MY99 Tacoma V3115 50.5 40.5 239 0.62 4,712 (L)
35 mph 40% OffsetDeformable Barrier
MY99 Intrepid V3121 51.5 40.9 472 1.94 2,927 (R)
MY99 Tacoma V3120 44.4 36.9 354 0.57 3,466 (L)
MY99 Saturn SL1 TBD 33.6 55.1 99 0.36 3,612 (L)
30 mph, 30 DegreeLeft Angular Barrier
MY99 Intrepid V3116 44.5 27.6 87 1.69 4,249 (R)
30 mph, 30 Degree Right AngularBarrier
MY99 Intrepid TBD(retest)
TBD TBD TBD TBD TBD
35 mph, 30 Degree Right AngularBarrier
MY99 Intrepid V3114 35.2 25.8 62 1.39 4,189 (R)

A-4
TABLE A-4. UNBELTED PASSENGER 5th PERCENTILE FEMALE
Test # Chest GIARV = 60.0
Chest Disp. (mm)IARV = 52.0
HIC15IARV = 700
Nij ver. 9IARV = 1.00
Maximum Femur (N)IARV = 6,805
30 mph,0 DegreeRigid Barrier
MY99 Saturn SL1 V3113 44.9 15.2 277 0.73 3,259 (R)
MY99 Intrepid V3118 62.1 13.1 303 0.62 5,078 (L)
MY99 Tacoma V3119 42.3 4.2 380 2.65 5,974 (L)
25 mph, 0 Degree Rigid Barrier
MY99 Intrepid V3122 35.2 4.6 121 0.52 4,324 (R)
MY99 Tacoma V3115 35.0 3.7 143 2.06 5,419 (L)
35 mph40% OffsetDeformable Barrier
MY99 Intrepid V3121 77.7 12.3 368 1.70 4,450 (L)
MY99 Tacoma V3120 41.7 1.1 164 0.61 3,373 (L)
MY99 Saturn SL1 TBD 24.0 5.7 45 0.31 3,701 (L)
30 mph, 30 Degree LeftAngular Barrier
MY99 Intrepid V3116 51.0 5.8 1 124 2 0.48 5,396 (L)
30 mph, 30 DegreeRight Angular Barrier
MY99 Intrepid TBD(retest)
TBD TBD TBD TBD TBD
35 mph, 30 DegreeRight Angular Barrier
MY99 Intrepid V3114 58.0 11.3 295 0.64 6,158 (L)
1 = VRTC noted that passenger chest displacement is suspicious.2 = VRTC noted that z head acceleration was noisy and HIC computations did not include it.

A-5
Compliance Margins:
To date, NHTSA has tested thirteen vehicles with redesigned air bags in unbelted 48 km/h rigid barrier tests. All butone driver Hybrid III dummy and all but one passenger Hybrid III dummy met the requirements of FMVSS No. 208'scurrent injury criteria. The one driver failure was a femur load (13,349 N) and the passenger failure was the chest Gs(61.3) The vehicles tested represent a range of passenger car sizes, a minivan, a full size van and two sports utilityvehicles. In general, chest Gs are the injury measures which will most be affected by redesigned air bags. Chest Gs fordriver and passenger Hybrid III’s in these tests are shown in Table A-5 and Figures A-1 and A-2. (Of these thirteenvehicles, NHTSA has tested twelve of the pre-redesigned models.) A comparison of the test results of redesigned airbags to FMVSS No. 208 compliance tests of 1996 and 1997 model year vehicles and manufacturers certification of1997 vehicles with pre-redesigned air bags is presented in Figure A-3 for drivers and passengers. This figure showschest Gs in terms of margin of compliance with the 60 G requirement, i.e., 48 Gs would be 20 percent. From thisfigure (and the complete listing in Tables A-6 and A-7), it can be seen that the scatter for redesigned air bags is similarto that for pre-redesigned air bags.
TABLE A-5: Resultant Chest Gs in 208 Barrier Tests, Unbelted 50th% HIII Dummy
Pre-'98 Driver '98 Driver '99 Driver Pre-'98Pass
'98 Pass '99 Pass
Taurus 50.4 47.2 NA 45.6 48.5 NA
Explorer 53.2 44.4 NA 44.6 48.2 NA
Neon 47.3 43.5 NA 46.1 61.4 NA
Camry 49 51.8 NA 47.3 35.1 NA
Caravan 47.5 48.0 NA 39 53 NA
Accord 40.2 36.7 NA 40.2 45 NA
Intrepid 40.6 NA 54.4 52.4 NA 54.1
Saturn 33 NA 36.8 41.6 NA 40.2
Acura RL 45 NA 56.9 45.9 NA 49.8
Econoline 47.3 NA 52.1 44.6 NA 45.7
Expedition 42.2 NA 46.7 43.7 NA 51
Tacoma 46.4 NA 43.7 46 NA 35.6
Average 46.1 45.3 48.4 44.8 48.5 46.1

A-6
208 Crash Test Results
0
10
20
30
40
50
60
Res
pons
e
Tau
rus
Exp
lore
r
Neo
n
Cam
ry
Acc
ord
Car
avan
Intr
epid
Satu
rn
cono
line
Acu
ra R
L
Exp
edit
ion
Tac
oma
Ave
rage
50th Male Unbelted Driver Chest g's
Pre-'98 Driver '98 Driver '99 Driver
Figure A-1. Driver Resultant Chest Gs , Unbelted 50th Percentile HIII Dummies in FMVSS No. 208, 48 Kmph Barrier Test
0
10
20
30
40
50
60
Res
po
nse
Tau
rus
Exp
lore
r
Neo
n
Cam
ry
Car
avan
Acc
ord
Intr
epid
Satu
rn
Eco
nolin
e
Acu
ra R
L
Exp
edit
ion
Tac
oma
Ave
rage
50th Male Unbelted Passenger Chest g's
Pre-'98 Pass '98 Pass '99 Pass
Figure A-2. Passenger Resultant Chest Gs , Unbelted 50th Percentile HIII Dummies in FMVSS No. 208, 48 Kmph Barrier Test
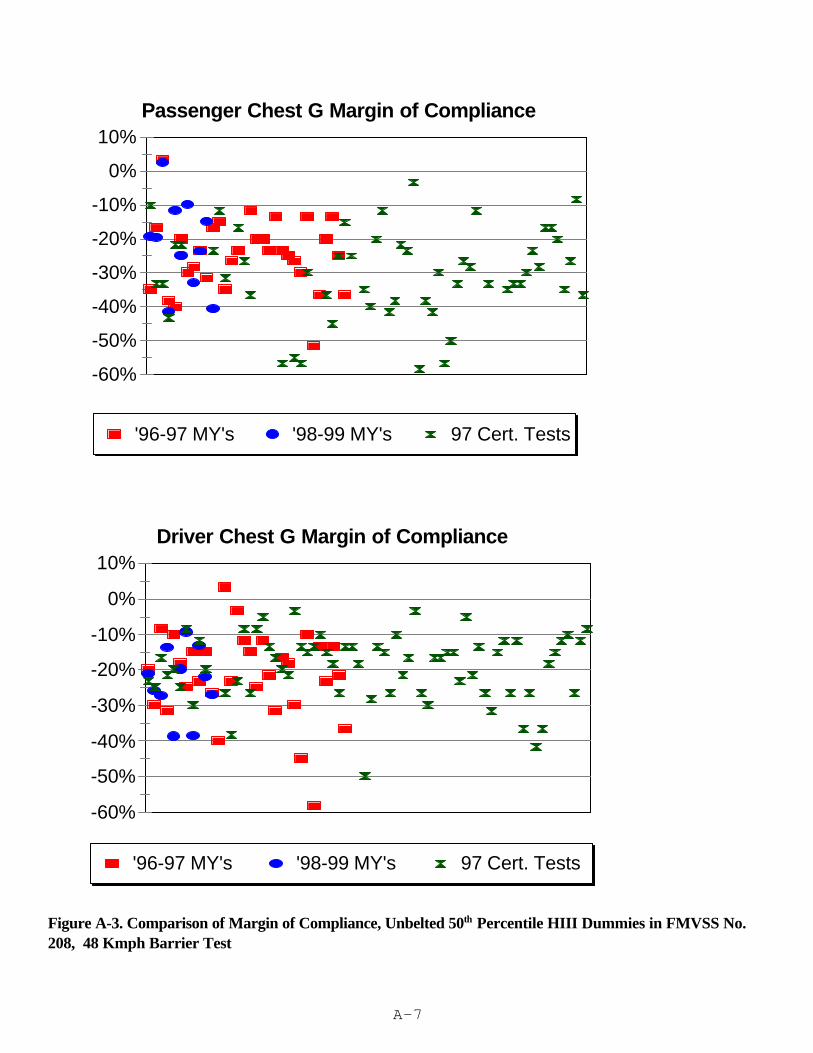
A-7
-60%
-50%
-40%
-30%
-20%
-10%
0%
10%
'96-97 MY's '98-99 MY's 97 Cert. Tests
Passenger Chest G Margin of Compliance
-60%
-50%
-40%
-30%
-20%
-10%
0%
10%
'96-97 MY's '98-99 MY's 97 Cert. Tests
Driver Chest G Margin of Compliance
Figure A-3. Comparison of Margin of Compliance, Unbelted 50th Percentile HIII Dummies in FMVSS No.208, 48 Kmph Barrier Test

A-8
Manufacturers stated that to be comfortable with their vehicle certification they have established a 20 percent margin ofcompliance and that anything less would indicate a problem with certification. Drivers with redesigned air bags (98 and99 model year’s) had a margin less than 20 percent of the 60 G criteria (above 48 Gs) in 33 percent (4 of 12) NHTSAtests, while drivers with pre-redesigned air bags (96 and 97 model years) had less than 20 percent margins in47 percent (15 of 32) of the compliance tests and 56 percent (38 of 68) in the certification tests. For passengers, thepercentage having less than a 20 percent margin was 58 percent (7 of 12) with redesigned air bags and 26 percent (8of 31) with pre-redesigned air bags in compliance tests and 19 percent (10 of 54) in the certification tests. These resultsindicate that with regard to compliance margins for chest Gs redesigned air bags provide similar performance, albeithigher percentages with less than 20 percent margin of compliance for passengers but lower percentages for drivers.
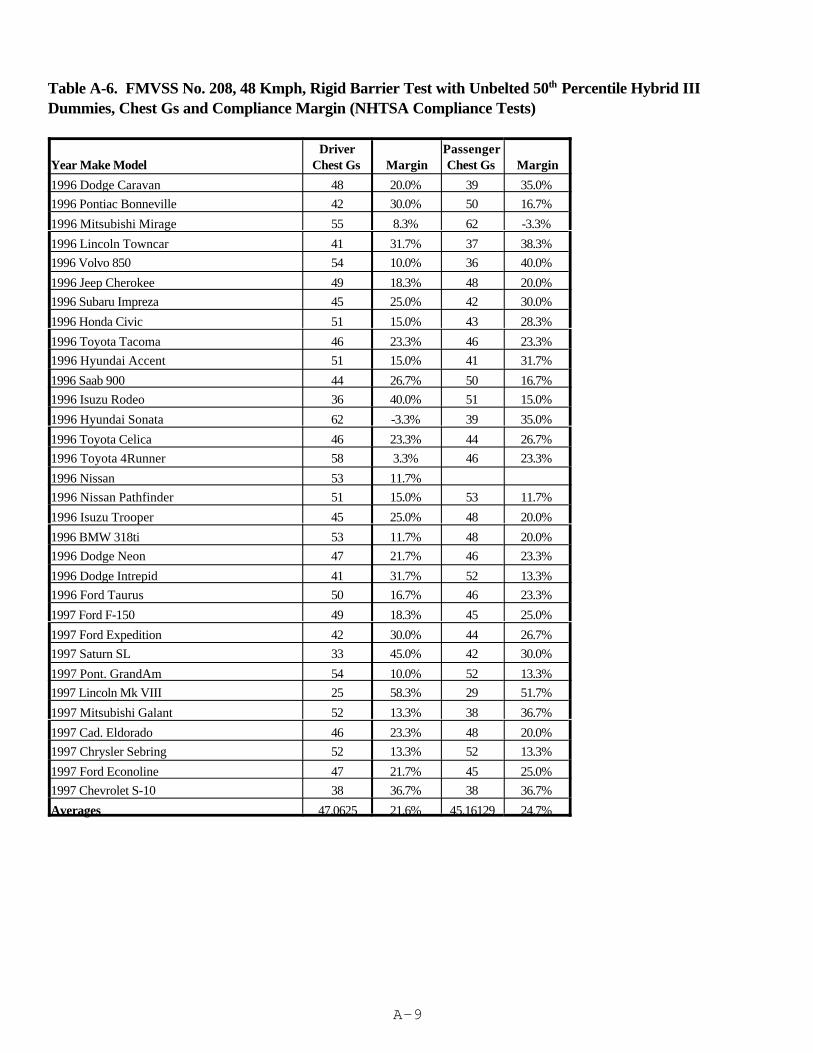
A-9
Table A-6. FMVSS No. 208, 48 Kmph, Rigid Barrier Test with Unbelted 50th Percentile Hybrid IIIDummies, Chest Gs and Compliance Margin (NHTSA Compliance Tests)
Year Make ModelDriver
Chest Gs MarginPassenger Chest Gs Margin
1996 Dodge Caravan 48 20.0% 39 35.0%1996 Pontiac Bonneville 42 30.0% 50 16.7%
1996 Mitsubishi Mirage 55 8.3% 62 -3.3%
1996 Lincoln Towncar 41 31.7% 37 38.3%1996 Volvo 850 54 10.0% 36 40.0%
1996 Jeep Cherokee 49 18.3% 48 20.0%1996 Subaru Impreza 45 25.0% 42 30.0%
1996 Honda Civic 51 15.0% 43 28.3%
1996 Toyota Tacoma 46 23.3% 46 23.3%1996 Hyundai Accent 51 15.0% 41 31.7%
1996 Saab 900 44 26.7% 50 16.7%1996 Isuzu Rodeo 36 40.0% 51 15.0%
1996 Hyundai Sonata 62 -3.3% 39 35.0%
1996 Toyota Celica 46 23.3% 44 26.7%1996 Toyota 4Runner 58 3.3% 46 23.3%
1996 Nissan 53 11.7%1996 Nissan Pathfinder 51 15.0% 53 11.7%
1996 Isuzu Trooper 45 25.0% 48 20.0%
1996 BMW 318ti 53 11.7% 48 20.0%1996 Dodge Neon 47 21.7% 46 23.3%
1996 Dodge Intrepid 41 31.7% 52 13.3%1996 Ford Taurus 50 16.7% 46 23.3%
1997 Ford F-150 49 18.3% 45 25.0%
1997 Ford Expedition 42 30.0% 44 26.7%1997 Saturn SL 33 45.0% 42 30.0%
1997 Pont. GrandAm 54 10.0% 52 13.3%1997 Lincoln Mk VIII 25 58.3% 29 51.7%
1997 Mitsubishi Galant 52 13.3% 38 36.7%
1997 Cad. Eldorado 46 23.3% 48 20.0%1997 Chrysler Sebring 52 13.3% 52 13.3%
1997 Ford Econoline 47 21.7% 45 25.0%1997 Chevrolet S-10 38 36.7% 38 36.7%
Averages 47.0625 21.6% 45.16129 24.7%
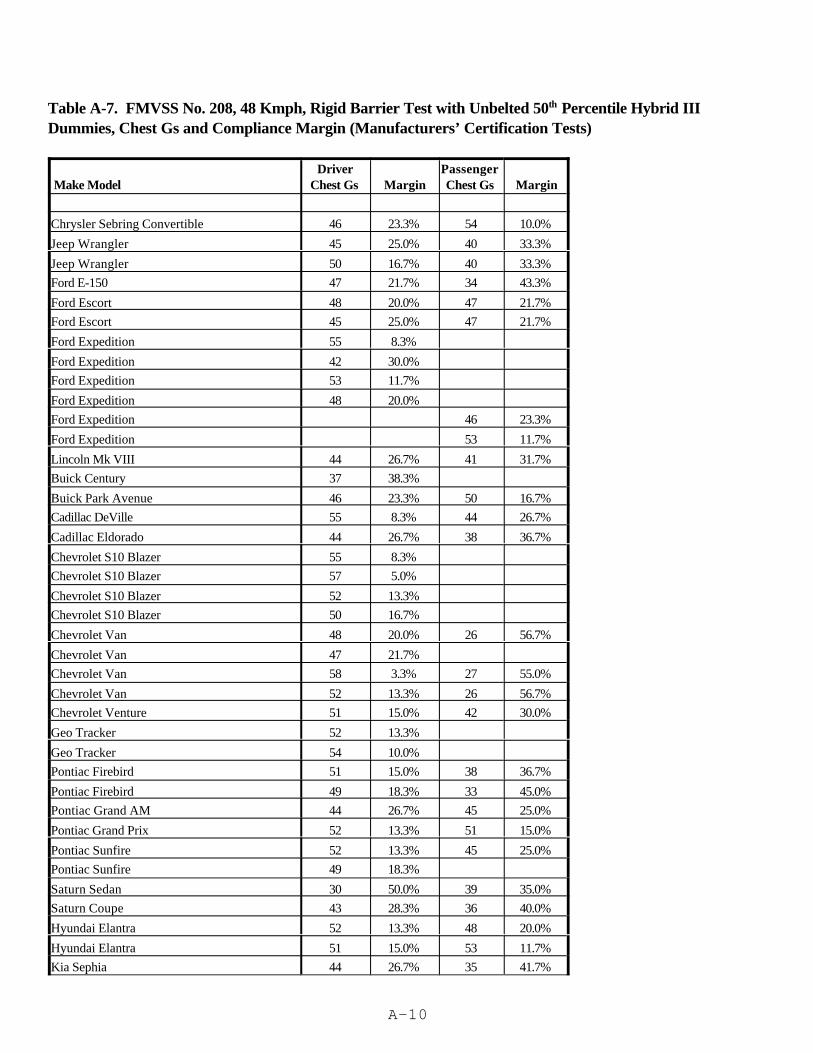
A-10
Table A-7. FMVSS No. 208, 48 Kmph, Rigid Barrier Test with Unbelted 50th Percentile Hybrid IIIDummies, Chest Gs and Compliance Margin (Manufacturers’ Certification Tests)
Make ModelDriver
Chest Gs MarginPassenger Chest Gs Margin
Chrysler Sebring Convertible 46 23.3% 54 10.0%
Jeep Wrangler 45 25.0% 40 33.3%
Jeep Wrangler 50 16.7% 40 33.3%Ford E-150 47 21.7% 34 43.3%
Ford Escort 48 20.0% 47 21.7%Ford Escort 45 25.0% 47 21.7%
Ford Expedition 55 8.3%
Ford Expedition 42 30.0%Ford Expedition 53 11.7%
Ford Expedition 48 20.0%Ford Expedition 46 23.3%
Ford Expedition 53 11.7%
Lincoln Mk VIII 44 26.7% 41 31.7%Buick Century 37 38.3%
Buick Park Avenue 46 23.3% 50 16.7%Cadillac DeVille 55 8.3% 44 26.7%
Cadillac Eldorado 44 26.7% 38 36.7%
Chevrolet S10 Blazer 55 8.3%Chevrolet S10 Blazer 57 5.0%
Chevrolet S10 Blazer 52 13.3%Chevrolet S10 Blazer 50 16.7%
Chevrolet Van 48 20.0% 26 56.7%
Chevrolet Van 47 21.7%Chevrolet Van 58 3.3% 27 55.0%
Chevrolet Van 52 13.3% 26 56.7%Chevrolet Venture 51 15.0% 42 30.0%
Geo Tracker 52 13.3%
Geo Tracker 54 10.0%Pontiac Firebird 51 15.0% 38 36.7%
Pontiac Firebird 49 18.3% 33 45.0%Pontiac Grand AM 44 26.7% 45 25.0%
Pontiac Grand Prix 52 13.3% 51 15.0%
Pontiac Sunfire 52 13.3% 45 25.0%Pontiac Sunfire 49 18.3%
Saturn Sedan 30 50.0% 39 35.0%Saturn Coupe 43 28.3% 36 40.0%
Hyundai Elantra 52 13.3% 48 20.0%
Hyundai Elantra 51 15.0% 53 11.7%Kia Sephia 44 26.7% 35 41.7%

A-11
Land Rover Discovery 54 10.0% 37 38.3%
Mercedes C Class 47 21.7% 47 21.7%Mercedes C Class 50 16.7% 46 23.3%
Mercedes E Class 58 3.3% 58 3.3%Mitsubishi Galant 44 26.7% 25 58.3%
Mitsubishi Mirage 42 30.0% 37 38.3%
Mitsubishi Mirage 50 16.7% 35 41.7%Mitsubishi Mirage 50 16.7% 42 30.0%
Mitsubishi Mirage 51 15.0% 26 56.7%Mitsubishi Mirage 51 15.0% 30 50.0%
Mitsubishi Montero 46 23.3% 40 33.3%
Nissan Infiniti Q45 57 5.0% 44 26.7%Nissan Altima 47 21.7% 43 28.3%
Nissan Quest 52 13.3% 53 11.7%Saab 9000 44 26.7%
Saab 9000 41 31.7% 40 33.3%
Suzuki Sidekick 51 15.0%Suzuki X-90 53 11.7%
Toyota Lexus ES300 44 26.7% 39 35.0%Toyota Lexus LS400 53 11.7% 40 33.3%
Toyota Lexus SC300 38 36.7% 40 33.3%
Toyota Camry 44 26.7% 42 30.0%Toyota Camry 35 41.7% 46 23.3%
Toyota Land Cruiser 38 36.7% 43 28.3%Toyota RAV4 49 18.3% 50 16.7%
Toyota RAV4 51 15.0% 50 16.7%
Toyota RAV4 53 11.7% 48 20.0%Toyota RAV4 54 10.0% 39 35.0%
Toyota RAV4 44 26.7% 44 26.7%Toyota RAV4 53 11.7% 55 8.3%
Volkswagen Passat 55 8.3% 38 36.7%
Averages 48.5 19.2% 41.8 30.4%
APPENDIX B
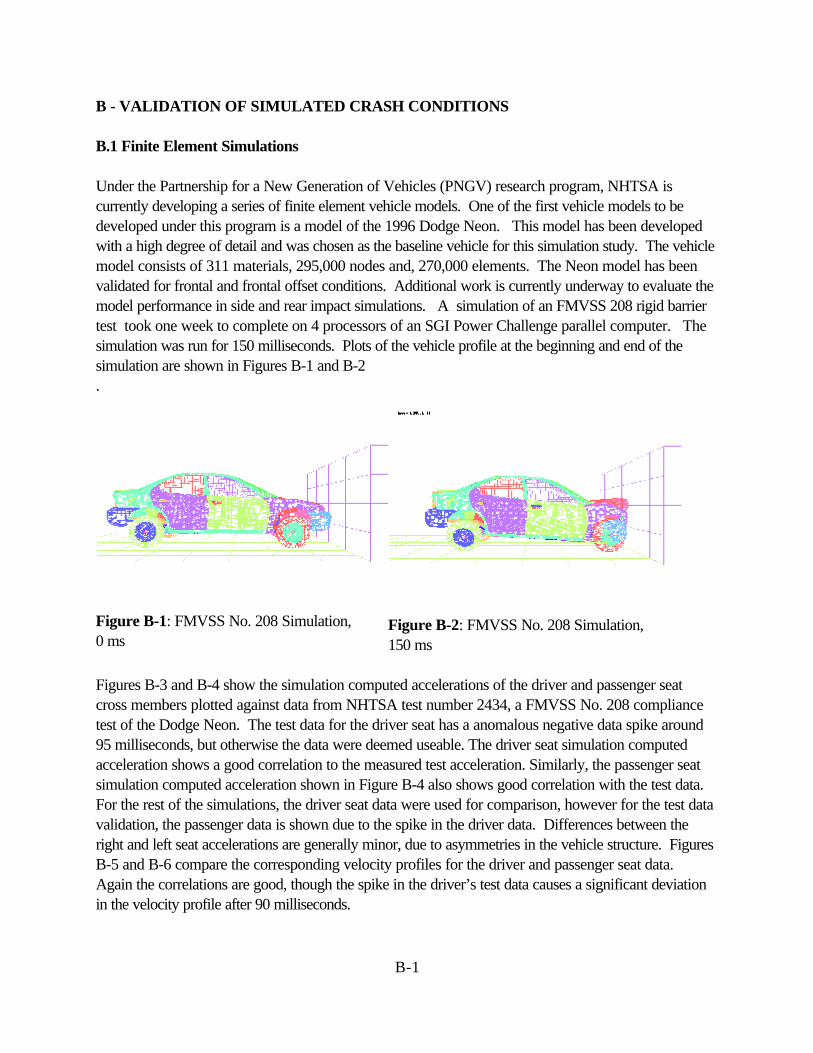
B-1
B - VALIDATION OF SIMULATED CRASH CONDITIONS
B.1 Finite Element Simulations
Under the Partnership for a New Generation of Vehicles (PNGV) research program, NHTSA iscurrently developing a series of finite element vehicle models. One of the first vehicle models to bedeveloped under this program is a model of the 1996 Dodge Neon. This model has been developedwith a high degree of detail and was chosen as the baseline vehicle for this simulation study. The vehiclemodel consists of 311 materials, 295,000 nodes and, 270,000 elements. The Neon model has beenvalidated for frontal and frontal offset conditions. Additional work is currently underway to evaluate themodel performance in side and rear impact simulations. A simulation of an FMVSS 208 rigid barriertest took one week to complete on 4 processors of an SGI Power Challenge parallel computer. Thesimulation was run for 150 milliseconds. Plots of the vehicle profile at the beginning and end of thesimulation are shown in Figures B-1 and B-2.
Figure B-1: FMVSS No. 208 Simulation, 0 ms
Figure B-2: FMVSS No. 208 Simulation, 150 ms
Figures B-3 and B-4 show the simulation computed accelerations of the driver and passenger seatcross members plotted against data from NHTSA test number 2434, a FMVSS No. 208 compliancetest of the Dodge Neon. The test data for the driver seat has a anomalous negative data spike around95 milliseconds, but otherwise the data were deemed useable. The driver seat simulation computedacceleration shows a good correlation to the measured test acceleration. Similarly, the passenger seatsimulation computed acceleration shown in Figure B-4 also shows good correlation with the test data. For the rest of the simulations, the driver seat data were used for comparison, however for the test datavalidation, the passenger data is shown due to the spike in the driver data. Differences between theright and left seat accelerations are generally minor, due to asymmetries in the vehicle structure. FiguresB-5 and B-6 compare the corresponding velocity profiles for the driver and passenger seat data. Again the correlations are good, though the spike in the driver’s test data causes a significant deviationin the velocity profile after 90 milliseconds.
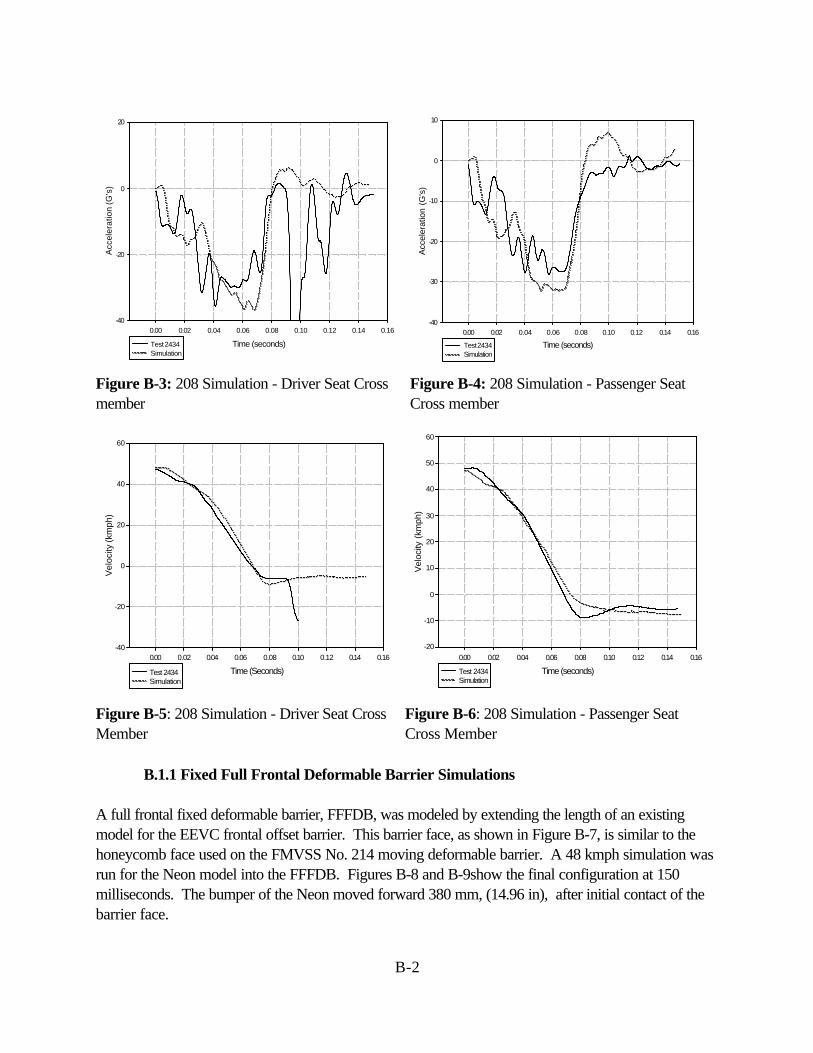
B-2
Time (seconds)
0.00 0.02 0.04 0.06 0.08 0.10 0.12 0.14 0.16
Acc
eler
atio
n (G
's)
-40
-20
0
20
Test 2434Simulation
Figure B-3: 208 Simulation - Driver Seat Crossmember
Time (seconds)
0.00 0.02 0.04 0.06 0.08 0.10 0.12 0.14 0.16
Acc
eler
atio
n (G
's)
-40
-30
-20
-10
0
10
Test 2434Simulation
Figure B-4: 208 Simulation - Passenger SeatCross member
Time (Seconds)
0.00 0.02 0.04 0.06 0.08 0.10 0.12 0.14 0.16
Vel
ocity
(km
ph)
-40
-20
0
20
40
60
Test 2434Simulation
Figure B-5: 208 Simulation - Driver Seat CrossMember
Time (seconds)
0.00 0.02 0.04 0.06 0.08 0.10 0.12 0.14 0.16
Vel
ocity
(km
ph)
-20
-10
0
10
20
30
40
50
60
Test 2434Simulation
Figure B-6: 208 Simulation - Passenger SeatCross Member
B.1.1 Fixed Full Frontal Deformable Barrier Simulations
A full frontal fixed deformable barrier, FFFDB, was modeled by extending the length of an existingmodel for the EEVC frontal offset barrier. This barrier face, as shown in Figure B-7, is similar to thehoneycomb face used on the FMVSS No. 214 moving deformable barrier. A 48 kmph simulation wasrun for the Neon model into the FFFDB. Figures B-8 and B-9show the final configuration at 150milliseconds. The bumper of the Neon moved forward 380 mm, (14.96 in), after initial contact of thebarrier face.
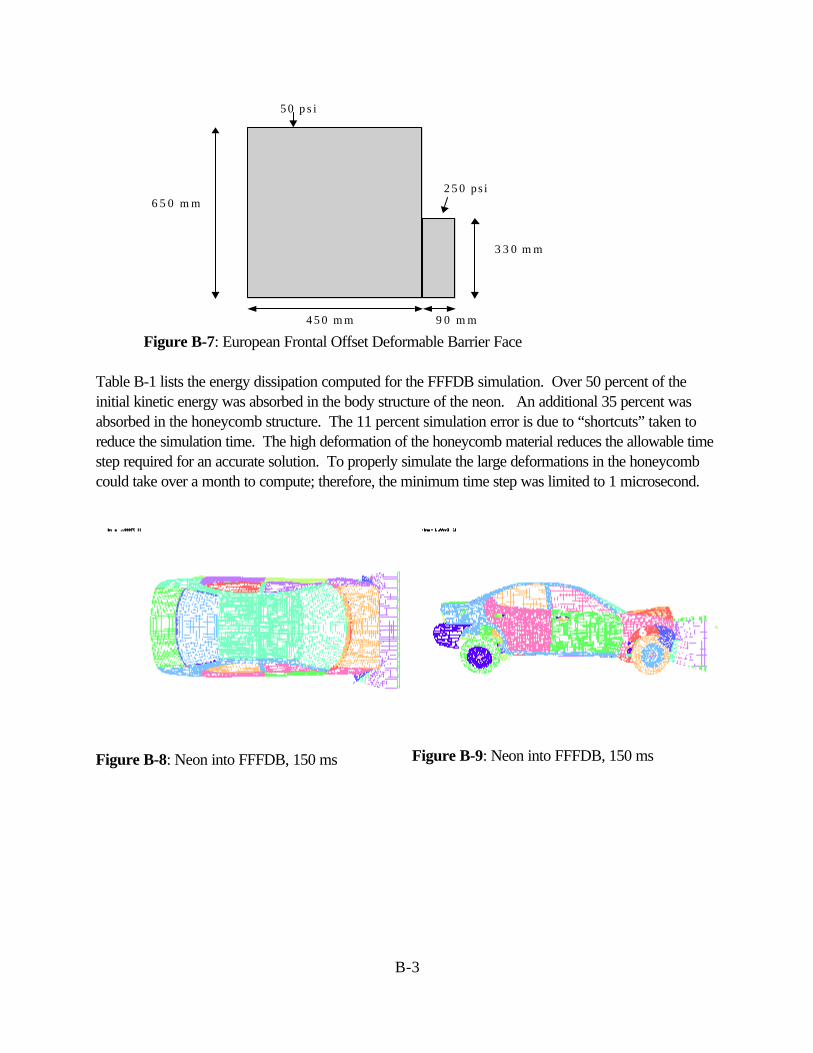
B-3
6 5 0 m m
5 0 p s i
3 3 0 m m
2 5 0 ps i
9 0 m m4 5 0 m m
Figure B-7: European Frontal Offset Deformable Barrier Face
Table B-1 lists the energy dissipation computed for the FFFDB simulation. Over 50 percent of theinitial kinetic energy was absorbed in the body structure of the neon. An additional 35 percent wasabsorbed in the honeycomb structure. The 11 percent simulation error is due to “shortcuts” taken toreduce the simulation time. The high deformation of the honeycomb material reduces the allowable timestep required for an accurate solution. To properly simulate the large deformations in the honeycombcould take over a month to compute; therefore, the minimum time step was limited to 1 microsecond.
Figure B-8: Neon into FFFDB, 150 ms Figure B-9: Neon into FFFDB, 150 ms
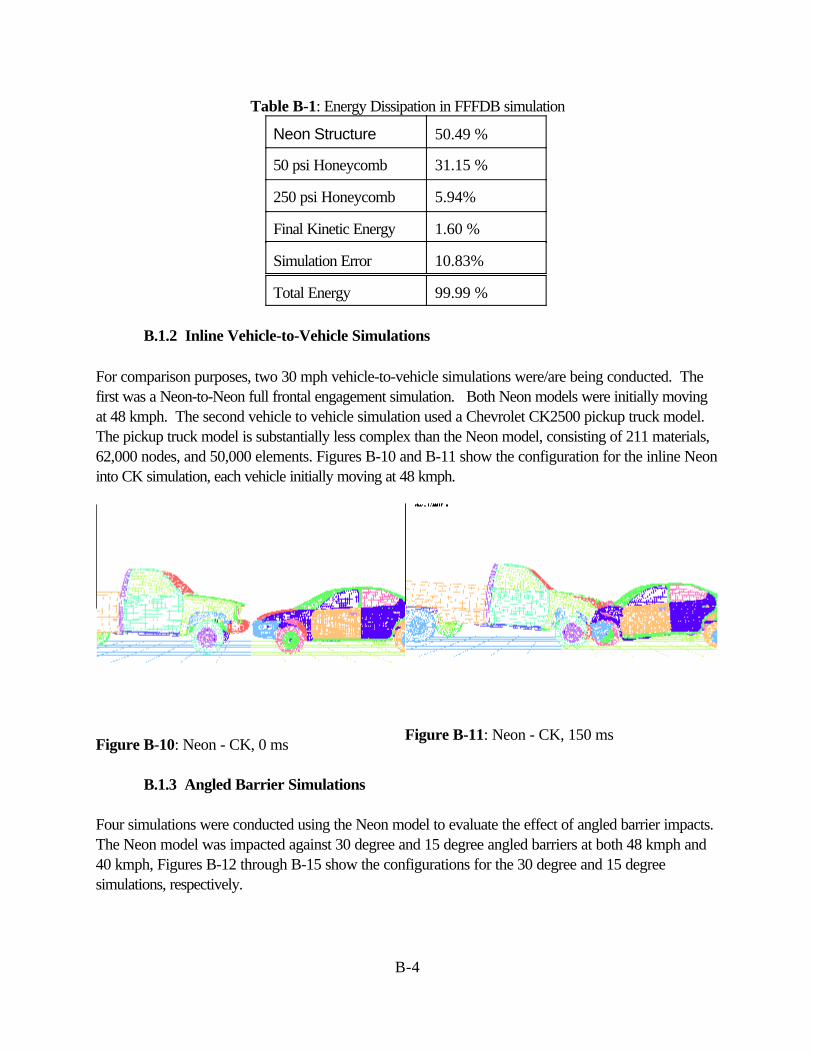
B-4
Table B-1: Energy Dissipation in FFFDB simulation
Neon Structure 50.49 %
50 psi Honeycomb 31.15 %
250 psi Honeycomb 5.94%
Final Kinetic Energy 1.60 %
Simulation Error 10.83%
Total Energy 99.99 %
B.1.2 Inline Vehicle-to-Vehicle Simulations
For comparison purposes, two 30 mph vehicle-to-vehicle simulations were/are being conducted. Thefirst was a Neon-to-Neon full frontal engagement simulation. Both Neon models were initially movingat 48 kmph. The second vehicle to vehicle simulation used a Chevrolet CK2500 pickup truck model. The pickup truck model is substantially less complex than the Neon model, consisting of 211 materials,62,000 nodes, and 50,000 elements. Figures B-10 and B-11 show the configuration for the inline Neoninto CK simulation, each vehicle initially moving at 48 kmph.
Figure B-10: Neon - CK, 0 msFigure B-11: Neon - CK, 150 ms
B.1.3 Angled Barrier Simulations
Four simulations were conducted using the Neon model to evaluate the effect of angled barrier impacts. The Neon model was impacted against 30 degree and 15 degree angled barriers at both 48 kmph and40 kmph, Figures B-12 through B-15 show the configurations for the 30 degree and 15 degreesimulations, respectively.
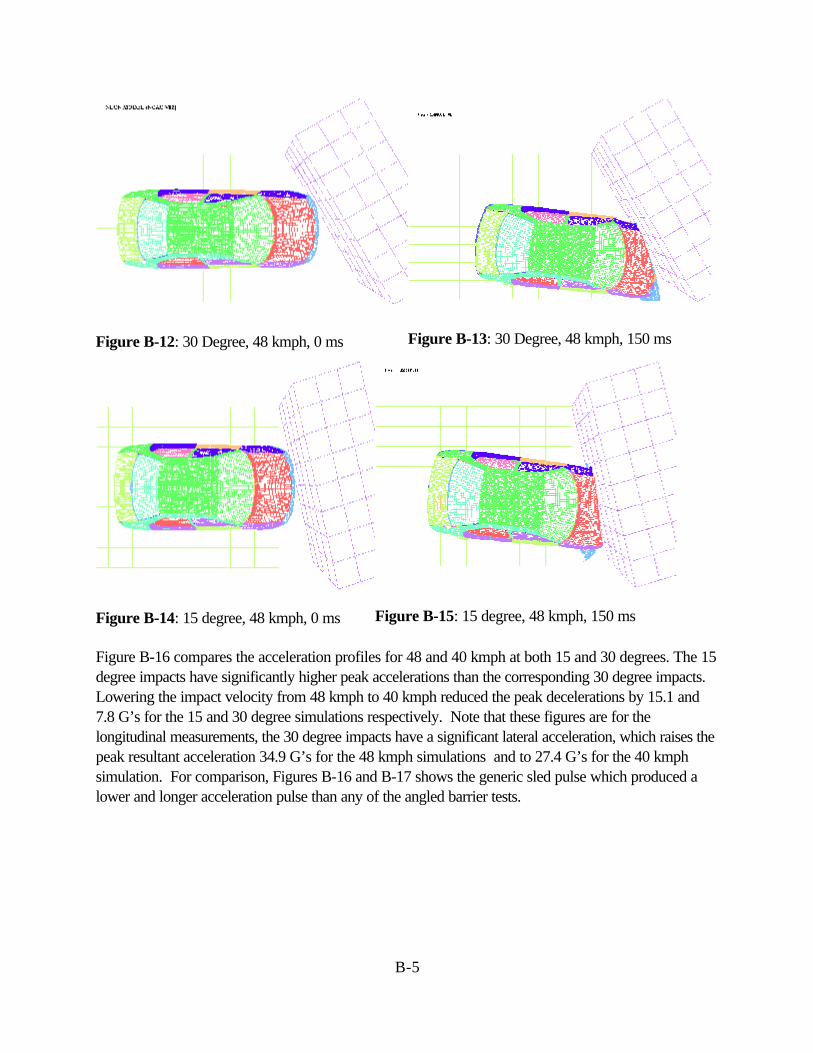
B-5
Figure B-12: 30 Degree, 48 kmph, 0 ms Figure B-13: 30 Degree, 48 kmph, 150 ms
Figure B-14: 15 degree, 48 kmph, 0 ms Figure B-15: 15 degree, 48 kmph, 150 ms
Figure B-16 compares the acceleration profiles for 48 and 40 kmph at both 15 and 30 degrees. The 15degree impacts have significantly higher peak accelerations than the corresponding 30 degree impacts. Lowering the impact velocity from 48 kmph to 40 kmph reduced the peak decelerations by 15.1 and7.8 G’s for the 15 and 30 degree simulations respectively. Note that these figures are for thelongitudinal measurements, the 30 degree impacts have a significant lateral acceleration, which raises thepeak resultant acceleration 34.9 G’s for the 48 kmph simulations and to 27.4 G’s for the 40 kmphsimulation. For comparison, Figures B-16 and B-17 shows the generic sled pulse which produced alower and longer acceleration pulse than any of the angled barrier tests.

B-6
Time (Seconds)
0.00 0.02 0.04 0.06 0.08 0.10 0.12 0.14 0.16
Acc
eler
atio
n (G
's)
-50
-40
-30
-20
-10
0
10
15 Degree 40 kmph15 Degree 48 kmph30 Degree 40 kmph30 Degree 48 kmphGSP
Figure B-16: Longitudinal Accelerations for Angled Barrier Simulations and the Generic Sled Pulse
A c c e l e r a t i o n ( s e c o n d s )
0 . 0 0 0 .02 0 . 0 4 0 .06 0 . 0 8 0 .10 0 . 1 2 0 .14 0 . 1 6
Vel
ocity
(km
ph)
- 10
0
1 0
2 0
3 0
4 0
5 0
6 0
1 5 D e g r e e 4 0 l m p h1 5 D e g r e e 4 8 k m p h3 0 D e g r e e 4 0 k m p h3 0 D e g r e e 4 8 k m p hG S P
Figure B-17: Longitudinal Velocities for Angled Barrier Simulations and the Generic Sled Pulse

B-7
B.1.4 Oblique Offset Impact Simulations
An Oblique offset simulation for the CK pickup into the Neon has been conducted. For this simulationeach vehicle had an initial velocity of 48 kmph, with an angle of 30 degrees between the line of travel ofthe two vehicles. Figures B-18 and B-19 show the initial and final profiles for this configuration. TheNeon experienced severe deformation and occupant compartment intrusion.
Figure B-18: Neon - CK 30 Degree 50% Offset,0 ms
Figure B-19: Neon - CK 30 Degree 50%Offset, 150 ms
B.2 Intrusion Measurements
Eight of the simulations were selected for analyzing the occupant compartment intrusion. Thesesimulations included the 48 kmph full frontal rigid wall tests at 0, 15, 30 degrees, the 48 kmph fullfrontal fixed deformable barrier, and the vehicle-to-vehicle collisions. The intrusion estimates werebased on the motions of the A-pillar, the left lower instrument panel and the toe board/floorboard. Forthe toe board/floorboard intrusion, six points in two horizontal rows were defined. The toeboardlongitudinal, rearward intrusion was estimated at both upper row and lower row levels as shown inFigure B-20.

B-8
Figure B-20: 208 Simulation, Toeboard/Floorboard Configuration
For each of the points selected as the toe board intrusion measurement locations, displacementmeasurements were taken for both the X and Y axes. In order to separate the vehicle motion from theintrusion, a node corresponding to the center of the rear bumper was selected as a reference point. Themaximum difference between the displacement of the reference node and the six selected nodesrespectively determined the toe board intrusion. Figure B-21 shows the toeboard / floorboard finalconfiguration for the FMVSS No. 208 at 150 milliseconds.
Figure B-21: 208 Simulation, Toeboard/Floorboard Configuration, 150 ms

B-9
Figure B-22 shows the final configuration of the toeboard/floorboard of the Neon for the 30 degree, 49kmph rigid barrier impact simulation.
Figure B-22: 30 Degree, 48 kmph Floorboard/Toeboard Configuration, 150 ms
Figure B-23 shows the final toe board/floorboard configuration for the inline vehicle-to-vehiclesimulation of the Neon into a Chevrolet CK 2500 pickup truck
Figure B-23: Neon - CK, Toeboard/Floorboard Configuration, 150 ms
Figure B-24 shows the final toe board/floorboard configurations for the oblique offset impact simulation ofthe CK pickup truck into the Neon with an angle of 30 degrees between the line of travel of the twovehicles.

B-10
Figure B-24: Neon - CK 30 Degree 50% Offset, Toeboard/Floorboard Configuration, 150ms
The same methodology was developed for the intrusion evaluation of the other two selected interiorcomponents, respectively the A-pillar and the lower instrument panel. For each of the latter cases,seven points were selected and the displacements were computed relative to the same referenceposition on the rear bumper. The intrusion of selected interior components are summarized in Table B-2.
Table B-2: Intrusion of Selected Interior Components
Vehicle Intruding Component (mm)
A B C
Neon 208 Barrier 25 145 25
Neon Full FrontalDeformable Barrier
25 50 25
CK into Neon 30 Degree Oblique
250 380 250
Neon 30 mph 30 DegreeRigid Barrier
320 370 370
Neon 25 ph 30 DegreeRigid Barrier
225 350 275
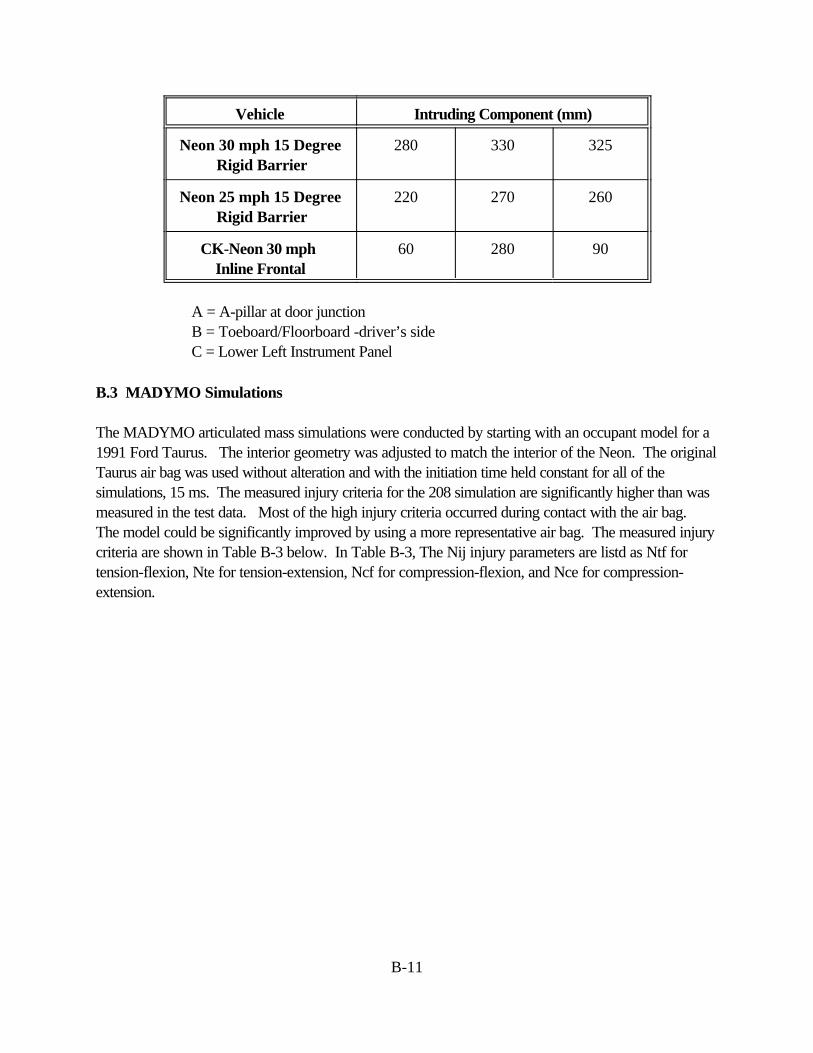
Vehicle Intruding Component (mm)
B-11
Neon 30 mph 15 DegreeRigid Barrier
280 330 325
Neon 25 mph 15 DegreeRigid Barrier
220 270 260
CK-Neon 30 mph Inline Frontal
60 280 90
A = A-pillar at door junctionB = Toeboard/Floorboard -driver’s sideC = Lower Left Instrument Panel
B.3 MADYMO Simulations
The MADYMO articulated mass simulations were conducted by starting with an occupant model for a1991 Ford Taurus. The interior geometry was adjusted to match the interior of the Neon. The originalTaurus air bag was used without alteration and with the initiation time held constant for all of thesimulations, 15 ms. The measured injury criteria for the 208 simulation are significantly higher than wasmeasured in the test data. Most of the high injury criteria occurred during contact with the air bag. The model could be significantly improved by using a more representative air bag. The measured injurycriteria are shown in Table B-3 below. In Table B-3, The Nij injury parameters are listd as Ntf fortension-flexion, Nte for tension-extension, Ncf for compression-flexion, and Nce for compression-extension.
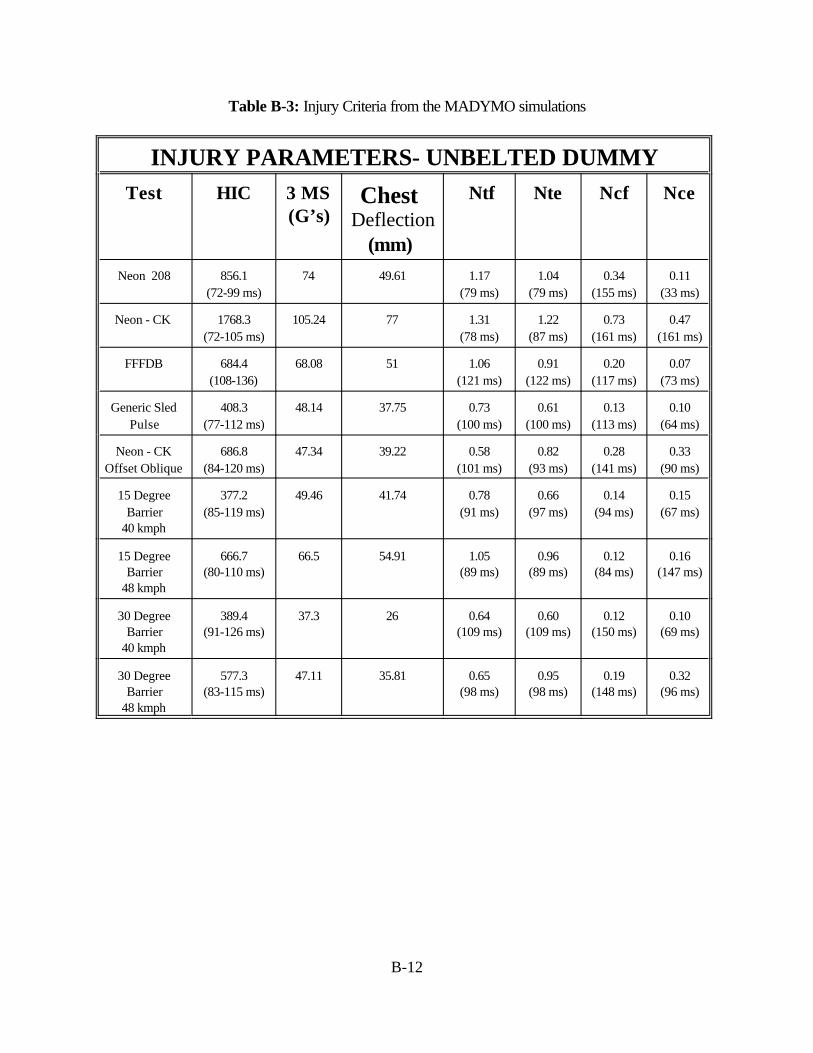
B-12
Table B-3: Injury Criteria from the MADYMO simulations
INJURY PARAMETERS- UNBELTED DUMMYTest HIC 3 MS
(G’s)Chest
Deflection(mm)
Ntf Nte Ncf Nce
Neon 208 856.1(72-99 ms)
74 49.61 1.17(79 ms)
1.04(79 ms)
0.34(155 ms)
0.11(33 ms)
Neon - CK 1768.3(72-105 ms)
105.24 77 1.31(78 ms)
1.22(87 ms)
0.73(161 ms)
0.47(161 ms)
FFFDB 684.4(108-136)
68.08 51 1.06(121 ms)
0.91(122 ms)
0.20(117 ms)
0.07(73 ms)
Generic SledPulse
408.3(77-112 ms)
48.14 37.75 0.73(100 ms)
0.61(100 ms)
0.13(113 ms)
0.10(64 ms)
Neon - CKOffset Oblique
686.8(84-120 ms)
47.34 39.22 0.58(101 ms)
0.82(93 ms)
0.28(141 ms)
0.33(90 ms)
15 DegreeBarrier
40 kmph
377.2(85-119 ms)
49.46 41.74 0.78(91 ms)
0.66(97 ms)
0.14(94 ms)
0.15(67 ms)
15 DegreeBarrier
48 kmph
666.7(80-110 ms)
66.5 54.91 1.05(89 ms)
0.96(89 ms)
0.12(84 ms)
0.16(147 ms)
30 DegreeBarrier
40 kmph
389.4(91-126 ms)
37.3 26 0.64(109 ms)
0.60(109 ms)
0.12(150 ms)
0.10(69 ms)
30 DegreeBarrier
48 kmph
577.3(83-115 ms)
47.11 35.81 0.65(98 ms)
0.95(98 ms)
0.19(148 ms)
0.32(96 ms)

APPENDIX C
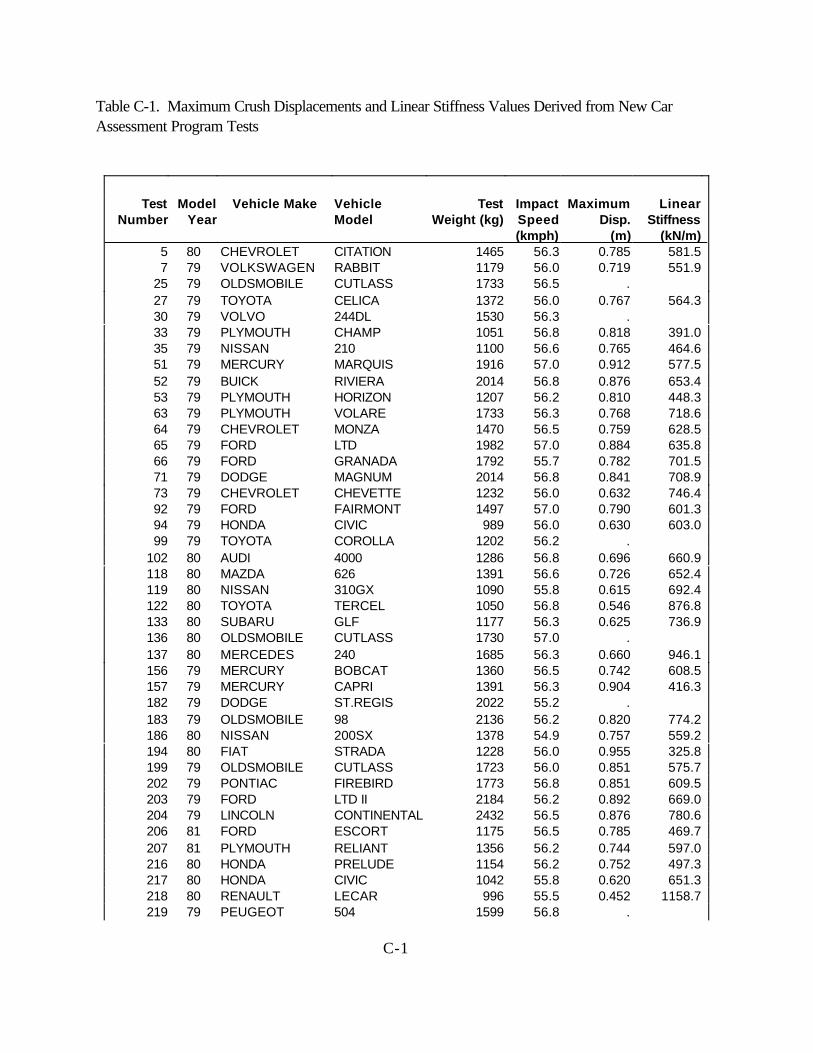
C-1
Table C-1. Maximum Crush Displacements and Linear Stiffness Values Derived from New CarAssessment Program Tests
TestNumber
ModelYear
Vehicle Make Vehicle Model
TestWeight (kg)
ImpactSpeed(kmph)
MaximumDisp.
(m)
LinearStiffness
(kN/m)5 80 CHEVROLET CITATION 1465 56.3 0.785 581.57 79 VOLKSWAGEN RABBIT 1179 56.0 0.719 551.9
25 79 OLDSMOBILE CUTLASS 1733 56.5 .27 79 TOYOTA CELICA 1372 56.0 0.767 564.330 79 VOLVO 244DL 1530 56.3 .33 79 PLYMOUTH CHAMP 1051 56.8 0.818 391.035 79 NISSAN 210 1100 56.6 0.765 464.651 79 MERCURY MARQUIS 1916 57.0 0.912 577.552 79 BUICK RIVIERA 2014 56.8 0.876 653.453 79 PLYMOUTH HORIZON 1207 56.2 0.810 448.363 79 PLYMOUTH VOLARE 1733 56.3 0.768 718.664 79 CHEVROLET MONZA 1470 56.5 0.759 628.565 79 FORD LTD 1982 57.0 0.884 635.866 79 FORD GRANADA 1792 55.7 0.782 701.571 79 DODGE MAGNUM 2014 56.8 0.841 708.973 79 CHEVROLET CHEVETTE 1232 56.0 0.632 746.492 79 FORD FAIRMONT 1497 57.0 0.790 601.394 79 HONDA CIVIC 989 56.0 0.630 603.099 79 TOYOTA COROLLA 1202 56.2 .
102 80 AUDI 4000 1286 56.8 0.696 660.9118 80 MAZDA 626 1391 56.6 0.726 652.4119 80 NISSAN 310GX 1090 55.8 0.615 692.4122 80 TOYOTA TERCEL 1050 56.8 0.546 876.8133 80 SUBARU GLF 1177 56.3 0.625 736.9136 80 OLDSMOBILE CUTLASS 1730 57.0 .137 80 MERCEDES 240 1685 56.3 0.660 946.1156 79 MERCURY BOBCAT 1360 56.5 0.742 608.5157 79 MERCURY CAPRI 1391 56.3 0.904 416.3182 79 DODGE ST.REGIS 2022 55.2 .183 79 OLDSMOBILE 98 2136 56.2 0.820 774.2186 80 NISSAN 200SX 1378 54.9 0.757 559.2194 80 FIAT STRADA 1228 56.0 0.955 325.8199 79 OLDSMOBILE CUTLASS 1723 56.0 0.851 575.7202 79 PONTIAC FIREBIRD 1773 56.8 0.851 609.5203 79 FORD LTD II 2184 56.2 0.892 669.0204 79 LINCOLN CONTINENTAL 2432 56.5 0.876 780.6206 81 FORD ESCORT 1175 56.5 0.785 469.7207 81 PLYMOUTH RELIANT 1356 56.2 0.744 597.0216 80 HONDA PRELUDE 1154 56.2 0.752 497.3217 80 HONDA CIVIC 1042 55.8 0.620 651.3218 80 RENAULT LECAR 996 55.5 0.452 1158.7219 79 PEUGEOT 504 1599 56.8 .

C-2
220 80 DODGE MIRADA 1876 57.1 0.790 756.2263 79 FORD FIESTA 991 56.2 .271 80 FORD THUNDERBIRD 1716 56.8 0.564 1342.9272 80 AMERICAN CONCORD 1678 55.8 0.584 1182.0273 81 HONDA CIVIC 1114 56.3 0.709 542.0333 81 TOYOTA STARLET 1004 56.5 0.643 598.1334 81 TOYOTA CRESSIDA 1550 56.5 0.658 881.8335 81 CHRYSLER IMPERIAL 2069 56.3 1.008 498.0356 81 HONDA CIVIC 980 56.5 0.660 554.2357 81 AUDI 5000 1525 55.8 0.787 591.5360 81 FORD EXP 1154 56.3 0.792 450.0363 81 RENAULT 18i 1247 56.6 0.726 584.8364 81 AMERICAN SPIRIT 1442 56.3 0.612 941.6365 81 VOLKSWAGEN JETTA 1202 56.2 0.683 628.0376 79 CHRYSLER LEBARON 1887 56.3 0.765 788.6386 81 AMERICAN CONCORD 1783 55.5 0.699 867.3418 82 VOLVO DL 1521 56.2 0.798 582.1423 79 CHEVROLET IMPALA 1896 56.6 0.671 1040.9425 80 CADILLAC SEVILLE 2093 55.8 0.803 779.8426 80 CHEVROLET CHEVETTE 1198 56.6 0.757 516.8427 80 CHRYSLER LEBARON 1760 56.5 0.818 647.9428 80 VOLKSWAGEN RABBIT 1255 56.2 0.724 583.5444 82 DODGE OMNI 1211 56.6 0.785 485.8445 82 VOLKSWAGEN SCIROCCO 1216 56.5 0.726 568.3446 82 SAAB 900 1461 56.8 0.759 631.3450 82 CHEVROLET CAMARO 1555 57.0 .451 82 CHEVROLET CELEBRITY 1485 56.3 0.919 430.0452 82 FORD ESCORT 1172 55.5 .453 82 DODGE 400 1381 56.3 .454 82 TOYOTA CELICA 1388 55.8 0.747 597.6455 82 HONDA ACCORD 1195 56.0 0.848 402.1462 82 NISSAN STANZA 1218 55.7 .463 82 RENAULT FUEGO 1316 56.3 0.732 600.7464 82 NISSAN SENTRA 1114 56.6 .465 82 VOLKSWAGEN QUANTUM 1340 55.7 0.787 517.9466 82 CHEVROLET IMPALA 1864 56.8 0.843 653.0468 82 FORD LTD 1873 57.0 0.836 671.9470 82 MAZDA 626 1315 56.6 0.688 686.7471 82 FORD GRANADA 1556 55.7 .496 82 TOYOTA CORONA 1379 56.0 0.790 534.7514 83 DODGE 600 1411 56.6 0.912 419.3515 83 CHEVROLET CAPRICE 1869 56.8 0.838 662.5523 82 CHEVROLET CAVALIER 1284 56.3 0.686 667.3525 82 CHEVROLET CHEVETTE 1282 56.2 0.726 592.8526 82 DODGE COLT 1129 56.2 .528 82 LINCOLN CONTINENTAL 1886 55.8 0.879 586.5550 82 CHRYSLER LEBARON 1361 56.8 0.815 510.1563 83 TOYOTA COROLLA 1252 56.6 0.678 673.2569 83 FORD EXP 1175 56.6 0.732 542.1573 83 VOLVO 760GLE 1615 56.6 0.660 916.5574 83 PONTIAC FIREBIRD 1510 56.6 0.965 400.8

C-3
575 83 FORD THUNDERBIRD 1624 56.8 0.912 486.1579 83 MITSUBISHI PICKUP 1403 56.6 0.559 1109.8580 83 FORD BRONCO II 1744 57.0 .583 83 MITSUBISHI MONTERO 1757 56.2 0.617 1124.8588 83 PEUGEOT 505 1641 56.5 .590 83 TOYOTA TERCEL 1282 56.6 0.706 635.8593 83 PLYMOUTH RELIANT 1320 56.5 0.856 443.7594 83 TOYOTA CAMRY 1352 56.2 0.696 680.2598 83 NISSAN PULSAR 1116 56.8 0.719 537.4599 83 MAZDA 626 1315 56.8 0.820 486.8600 83 FORD LTD 1616 56.6 .612 84 MERCURY COUGAR 1615 56.2 0.866 524.8613 84 CHEVROLET CORVETTE 1669 55.8 0.922 471.7624 84 OLDSMOBILE CUTLASS 1678 56.0 0.909 491.4625 84 PONTIAC PARISENNE 1878 56.2 0.785 742.7632 84 RENAULT ENCORE 1179 56.2 0.630 723.9633 84 JEEP CJ 1442 56.5 .644 84 FORD LTD 1669 55.7 0.818 597.1661 84 CHEVROLET CAVALIER 1411 56.3 0.729 649.4665 84 PLYMOUTH COLT VISTA 1352 57.0 0.724 646.6667 84 PONTIAC FIERO 1361 56.5 0.770 565.4668 84 PLYMOUTH CONQUEST 1438 56.8 0.754 629.7669 84 HONDA CIVIC CRX 1048 56.5 0.681 556.6674 84 DODGE DAYTONA 1361 57.0 0.879 441.6681 84 FORD TEMPO 1397 56.3 0.655 796.4682 84 TOYOTA COROLLA 1216 56.3 0.645 714.9685 84 TOYOTA COROLLA 1184 56.2 0.635 715.6686 84 NISSAN 300ZX 1529 56.3 0.828 545.5688 84 CHEVROLET CELEBRITY 1628 56.3 0.914 476.6689 84 PONTIAC T1000 1246 56.8 0.617 814.8693 84 NISSAN STANZA 1276 56.6 0.696 651.1694 84 HONDA CIVIC 1139 56.2 0.729 522.3696 84 CHEVROLET C10 2191 56.6 0.749 965.4697 84 FORD F150 1849 56.6 .703 84 DODGE CARAVAN 1720 56.5 0.653 993.6705 84 HONDA CIVIC 1048 57.0 0.620 683.5706 84 MERCURY MARQUIS 1956 57.0 0.980 510.6707 84 JEEP CHEROKEE 1653 56.8 0.665 930.5711 84 RENAULT SPORTWAGO
N1407 56.5 0.688 732.2
720 84 TOYOTA VAN 1640 57.0 0.480 1784.5721 84 MERCEDES 300SD 1946 55.8 .722 84 NISSAN 200SX 1306 55.8 0.709 624.2738 85 BUICK ELECTRA 1746 56.2 0.879 550.7739 84 FORD MUSTANG 1615 56.0 0.846 546.0743 84 ISUZU IMPULSE 1465 55.7 0.699 717.8745 84 HONDA PRELUDE 1261 55.8 0.770 511.0746 84 MITSUBISHI TREDIA 1243 55.8 0.721 574.5747 84 TOYOTA TERCEL 1107 56.3 0.653 634.9756 84 RENAULT ALLIANCE 1116 56.0 0.632 676.1788 85 BUICK SOMERSET 1456 55.5 0.803 536.7

C-4
789 85 SUBARU DL 1224 56.5 0.719 583.2790 85 MAZDA RX-7 1303 56.8 0.780 533.2791 85 DODGE COLT 1186 56.0 0.721 552.1792 85 DODGE LANCER 1474 55.8 0.838 504.3793 85 PLYMOUTH CARAVELLE 1438 56.5 0.894 443.2794 85 PLYMOUTH RELIANT 1388 56.3 0.787 548.1797 85 VOLKSWAGEN JETTA 1290 56.0 0.676 683.1798 85 MITSUBISHI GALANT 1524 56.3 0.688 787.4799 85 RENAULT ALLIANCE 1275 56.2 .800 85 CHEVROLET ASTRO 1855 56.0 0.617 1179.1801 85 CHEVROLET BLAZER 1769 56.3 0.572 1322.4802 85 CHEVROLET SPECTRUM 1064 56.0 0.716 502.2807 85 VOLVO DL 1628 55.7 0.815 586.7808 85 VOLVO DL 1542 55.8 0.805 571.7809 85 NISSAN MAXIMA 1706 56.2 0.676 909.8813 85 AUDI 5000 1541 56.3 0.892 473.7814 85 TOYOTA CRESSIDA 1674 55.7 0.660 920.0817 85 VOLKSWAGEN VANAGON 1715 56.2 0.488 1755.1818 85 FORD TEMPO 1356 56.0 0.610 881.8821 85 FORD MERKUR 1566 56.2 0.759 662.5823 85 TOYOTA MR2 1324 56.8 .826 85 TOYOTA 4RUNNER 1768 57.1 0.569 1373.8827 86 MAZDA B2000 1397 56.3 0.572 1044.3828 85 ISUZU I-MARK 1293 56.0 0.660 718.3839 85 BMW 318 1335 56.3 0.744 589.9840 85 ISUZU TROOPER II 1636 56.5 0.437 2110.2841 85 CHEVROLET SPRINT 926 56.5 0.665 515.8842 85 FORD TEMPO 1359 56.5 0.693 697.0843 85 FORD CLUBWAGON 2375 56.2 0.566 1806.8889 86 BUICK CENTURY 1524 56.5 0.823 554.2890 86 BUICK CENTURY 1474 56.6 0.851 503.1894 86 MAZDA 323 1139 56.6 0.678 612.5896 86 YUGO GV 1052 56.5 0.610 696.4897 86 HONDA ACCORD 1389 56.3 0.823 501.6901 86 PLYMOUTH COLT VISTA 1352 55.8 0.706 651.7902 86 ISUZU I-MARK 1080 56.2 0.681 567.5904 86 JEEP COMANCHE 1613 56.6 .905 86 BUICK LESABRE 1656 57.1 0.917 495.4906 86 OLDSMOBILE DELTA 88 1683 57.0 0.937 480.6921 86 VOLKSWAGEN SCIROCCO 1538 56.3 .936 86 SAAB 9000 1538 56.2 0.671 832.5937 86 CHEVROLET NOVA 1170 56.6 0.683 620.0938 86 TOYOTA CELICA 1338 56.2 0.744 589.1942 86 BUICK SKYLARK 1429 55.7 0.792 545.4943 86 OLDSMOBILE TORONADO 1674 56.8 0.892 523.7944 86 FORD TAURUS 1569 56.3 0.699 785.4945 86 VOLKSWAGEN GOLF 1188 56.2 0.655 674.8946 86 SUZUKI SAMURAI 1209 56.5 0.541 1017.5947 86 DODGE SPORTSMAN 2057 56.3 0.549 1669.2948 86 MITSUBISHI CORDIA 1282 56.3 0.770 528.8949 86 MERCURY SABLE 1619 56.5 0.683 854.9
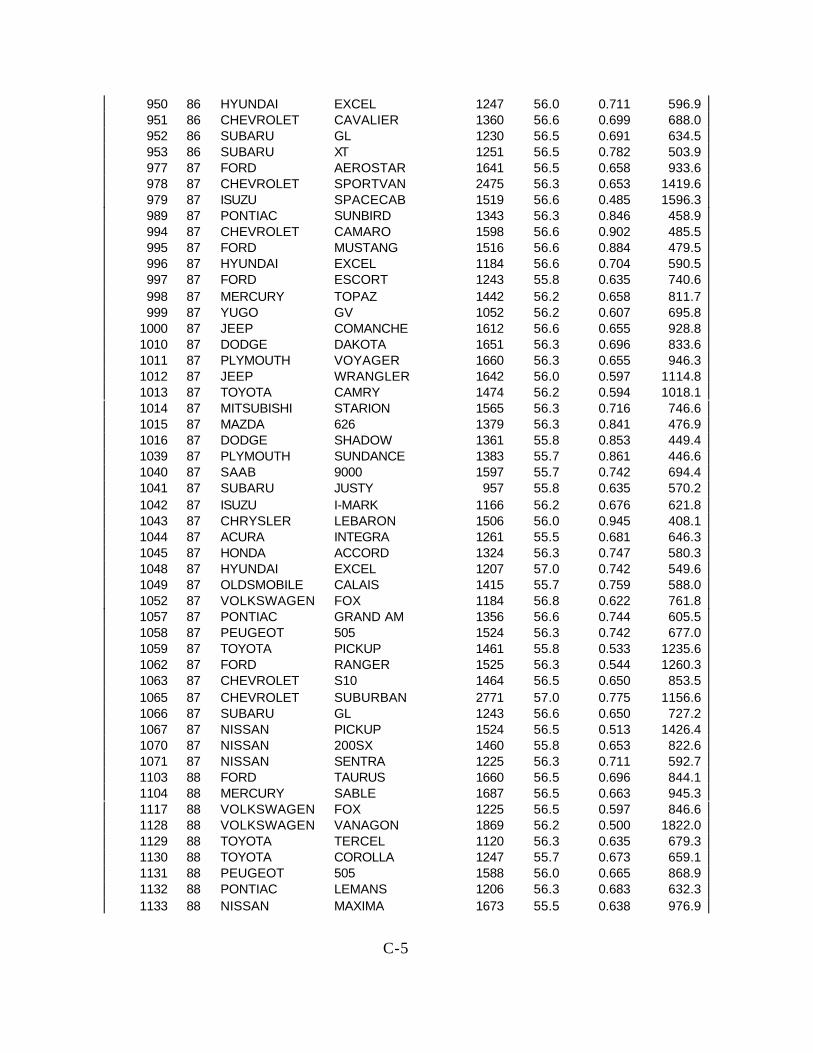
C-5
950 86 HYUNDAI EXCEL 1247 56.0 0.711 596.9951 86 CHEVROLET CAVALIER 1360 56.6 0.699 688.0952 86 SUBARU GL 1230 56.5 0.691 634.5953 86 SUBARU XT 1251 56.5 0.782 503.9977 87 FORD AEROSTAR 1641 56.5 0.658 933.6978 87 CHEVROLET SPORTVAN 2475 56.3 0.653 1419.6979 87 ISUZU SPACECAB 1519 56.6 0.485 1596.3989 87 PONTIAC SUNBIRD 1343 56.3 0.846 458.9994 87 CHEVROLET CAMARO 1598 56.6 0.902 485.5995 87 FORD MUSTANG 1516 56.6 0.884 479.5996 87 HYUNDAI EXCEL 1184 56.6 0.704 590.5997 87 FORD ESCORT 1243 55.8 0.635 740.6998 87 MERCURY TOPAZ 1442 56.2 0.658 811.7999 87 YUGO GV 1052 56.2 0.607 695.8
1000 87 JEEP COMANCHE 1612 56.6 0.655 928.81010 87 DODGE DAKOTA 1651 56.3 0.696 833.61011 87 PLYMOUTH VOYAGER 1660 56.3 0.655 946.31012 87 JEEP WRANGLER 1642 56.0 0.597 1114.81013 87 TOYOTA CAMRY 1474 56.2 0.594 1018.11014 87 MITSUBISHI STARION 1565 56.3 0.716 746.61015 87 MAZDA 626 1379 56.3 0.841 476.91016 87 DODGE SHADOW 1361 55.8 0.853 449.41039 87 PLYMOUTH SUNDANCE 1383 55.7 0.861 446.61040 87 SAAB 9000 1597 55.7 0.742 694.41041 87 SUBARU JUSTY 957 55.8 0.635 570.21042 87 ISUZU I-MARK 1166 56.2 0.676 621.81043 87 CHRYSLER LEBARON 1506 56.0 0.945 408.11044 87 ACURA INTEGRA 1261 55.5 0.681 646.31045 87 HONDA ACCORD 1324 56.3 0.747 580.31048 87 HYUNDAI EXCEL 1207 57.0 0.742 549.61049 87 OLDSMOBILE CALAIS 1415 55.7 0.759 588.01052 87 VOLKSWAGEN FOX 1184 56.8 0.622 761.81057 87 PONTIAC GRAND AM 1356 56.6 0.744 605.51058 87 PEUGEOT 505 1524 56.3 0.742 677.01059 87 TOYOTA PICKUP 1461 55.8 0.533 1235.61062 87 FORD RANGER 1525 56.3 0.544 1260.31063 87 CHEVROLET S10 1464 56.5 0.650 853.51065 87 CHEVROLET SUBURBAN 2771 57.0 0.775 1156.61066 87 SUBARU GL 1243 56.6 0.650 727.21067 87 NISSAN PICKUP 1524 56.5 0.513 1426.41070 87 NISSAN 200SX 1460 55.8 0.653 822.61071 87 NISSAN SENTRA 1225 56.3 0.711 592.71103 88 FORD TAURUS 1660 56.5 0.696 844.11104 88 MERCURY SABLE 1687 56.5 0.663 945.31117 88 VOLKSWAGEN FOX 1225 56.5 0.597 846.61128 88 VOLKSWAGEN VANAGON 1869 56.2 0.500 1822.01129 88 TOYOTA TERCEL 1120 56.3 0.635 679.31130 88 TOYOTA COROLLA 1247 55.7 0.673 659.11131 88 PEUGEOT 505 1588 56.0 0.665 868.91132 88 PONTIAC LEMANS 1206 56.3 0.683 632.31133 88 NISSAN MAXIMA 1673 55.5 0.638 976.9

C-6
1142 88 CHEVROLET SPORTVAN 2210 57.0 0.531 1964.91143 88 CHEVROLET ASTRO 2003 56.8 0.635 1236.61144 88 CHEVROLET C1500 1954 56.8 0.775 809.91147 88 FORD F150 1989 57.0 0.787 805.11148 88 NISSAN PULSAR 1288 55.8 0.739 566.61149 88 NISSAN VAN 1901 56.2 0.480 2010.81150 88 DODGE D150 1895 56.6 0.907 569.41151 88 DODGE COLT 1294 56.6 0.803 496.11152 88 HONDA CIVIC 1153 56.3 0.688 595.81153 88 NISSAN PICKUP 1478 56.5 0.508 1410.71154 88 MITSUBISHI MONTERO 1781 56.3 0.511 1668.21157 88 NISSAN SENTRA 1213 56.6 0.693 624.31159 88 ACURA LEGEND 1683 56.3 0.681 887.61160 88 DAIHATSU CHARADE 1006 56.6 0.706 498.91166 88 VOLVO 740GLE 1610 56.0 0.635 966.21167 88 CHEVROLET CORSICA 1465 56.6 0.770 610.81173 88 CHEVROLET BERETTA 1520 55.7 0.808 557.41174 88 OLDSMOBILE DELTA 88 1792 56.3 0.904 536.31175 88 MAZDA RX-7 1506 56.0 0.785 591.41176 88 MAZDA 929 1778 57.1 0.653 1049.01178 88 SAAB 900S 1515 56.8 0.681 813.21179 88 ISUZU SPACECAB 1700 56.6 0.655 979.51186 88 FORD TEMPO 1397 56.0 0.668 757.61187 88 FORD FESTIVA 993 56.0 0.579 716.71188 88 BUICK REGAL 1683 56.5 0.744 748.91189 88 CHRYSLER NEW YORKER 1656 56.0 0.859 543.11190 88 RENAULT MEDALLION 1406 56.6 0.734 645.11191 88 BUICK ELECTRA 1749 56.2 0.856 581.71214 89 EAGLE MEDALLION 1433 56.3 0.719 678.01223 89 MITSUBISHI MIRAGE 1302 56.3 0.706 638.91234 89 MITSUBISHI GALANT 1479 57.0 0.709 737.61273 89 DODGE DAYTONA 1506 55.8 0.904 442.71282 89 FORD THUNDERBIRD 1864 55.8 0.780 736.11287 89 DODGE SPIRIT 1492 56.5 0.800 574.21288 89 HONDA CIVIC CRX 1045 55.7 .1290 89 CHEVROLET CAPRICE 1914 56.6 0.874 619.41294 89 EAGLE PREMIER 1615 55.8 0.709 771.91295 89 CHRYSLER FIFTH AVE 1969 55.8 0.780 777.51296 89 MERCURY TRACER 1220 56.5 0.693 625.71297 89 CHEVROLET BLAZER 1858 56.6 .1298 89 CHEVROLET ASTRO 2145 56.3 .1299 89 PLYMOUTH ACCLAIM 1483 55.8 0.803 552.61308 89 FORD PROBE 1388 55.5 0.714 647.11309 89 LINCOLN CONTINENTAL 1923 56.0 0.810 709.21311 89 FORD BRONCO II 1818 56.6 .1312 89 TOYOTA COROLLA 1275 56.3 0.721 599.91313 89 TOYOTA CRESSIDA 1787 55.8 0.693 894.01314 89 TOYOTA VAN 1726 56.0 .1315 89 TOYOTA PICKUP 1438 56.8 .1316 89 HYUNDAI SONATA 1510 55.8 0.706 727.81318 89 MITSUBISHI VAN 1844 56.3 .
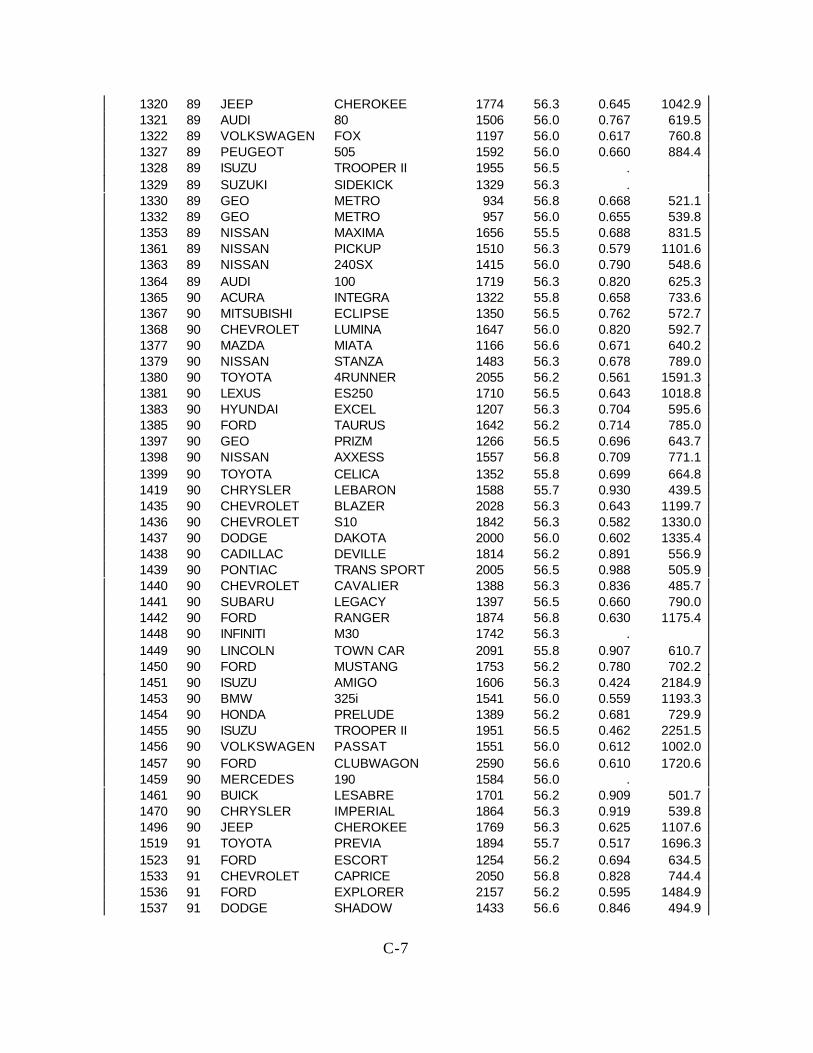
C-7
1320 89 JEEP CHEROKEE 1774 56.3 0.645 1042.91321 89 AUDI 80 1506 56.0 0.767 619.51322 89 VOLKSWAGEN FOX 1197 56.0 0.617 760.81327 89 PEUGEOT 505 1592 56.0 0.660 884.41328 89 ISUZU TROOPER II 1955 56.5 .1329 89 SUZUKI SIDEKICK 1329 56.3 .1330 89 GEO METRO 934 56.8 0.668 521.11332 89 GEO METRO 957 56.0 0.655 539.81353 89 NISSAN MAXIMA 1656 55.5 0.688 831.51361 89 NISSAN PICKUP 1510 56.3 0.579 1101.61363 89 NISSAN 240SX 1415 56.0 0.790 548.61364 89 AUDI 100 1719 56.3 0.820 625.31365 90 ACURA INTEGRA 1322 55.8 0.658 733.61367 90 MITSUBISHI ECLIPSE 1350 56.5 0.762 572.71368 90 CHEVROLET LUMINA 1647 56.0 0.820 592.71377 90 MAZDA MIATA 1166 56.6 0.671 640.21379 90 NISSAN STANZA 1483 56.3 0.678 789.01380 90 TOYOTA 4RUNNER 2055 56.2 0.561 1591.31381 90 LEXUS ES250 1710 56.5 0.643 1018.81383 90 HYUNDAI EXCEL 1207 56.3 0.704 595.61385 90 FORD TAURUS 1642 56.2 0.714 785.01397 90 GEO PRIZM 1266 56.5 0.696 643.71398 90 NISSAN AXXESS 1557 56.8 0.709 771.11399 90 TOYOTA CELICA 1352 55.8 0.699 664.81419 90 CHRYSLER LEBARON 1588 55.7 0.930 439.51435 90 CHEVROLET BLAZER 2028 56.3 0.643 1199.71436 90 CHEVROLET S10 1842 56.3 0.582 1330.01437 90 DODGE DAKOTA 2000 56.0 0.602 1335.41438 90 CADILLAC DEVILLE 1814 56.2 0.891 556.91439 90 PONTIAC TRANS SPORT 2005 56.5 0.988 505.91440 90 CHEVROLET CAVALIER 1388 56.3 0.836 485.71441 90 SUBARU LEGACY 1397 56.5 0.660 790.01442 90 FORD RANGER 1874 56.8 0.630 1175.41448 90 INFINITI M30 1742 56.3 .1449 90 LINCOLN TOWN CAR 2091 55.8 0.907 610.71450 90 FORD MUSTANG 1753 56.2 0.780 702.21451 90 ISUZU AMIGO 1606 56.3 0.424 2184.91453 90 BMW 325i 1541 56.0 0.559 1193.31454 90 HONDA PRELUDE 1389 56.2 0.681 729.91455 90 ISUZU TROOPER II 1951 56.5 0.462 2251.51456 90 VOLKSWAGEN PASSAT 1551 56.0 0.612 1002.01457 90 FORD CLUBWAGON 2590 56.6 0.610 1720.61459 90 MERCEDES 190 1584 56.0 .1461 90 BUICK LESABRE 1701 56.2 0.909 501.71470 90 CHRYSLER IMPERIAL 1864 56.3 0.919 539.81496 90 JEEP CHEROKEE 1769 56.3 0.625 1107.61519 91 TOYOTA PREVIA 1894 55.7 0.517 1696.31523 91 FORD ESCORT 1254 56.2 0.694 634.51533 91 CHEVROLET CAPRICE 2050 56.8 0.828 744.41536 91 FORD EXPLORER 2157 56.2 0.595 1484.91537 91 DODGE SHADOW 1433 56.6 0.846 494.9

C-8
1538 91 NISSAN SENTRA 1284 56.6 0.668 711.31539 91 CHEVROLET BLAZER 2018 56.3 0.619 1288.11541 91 HONDA ACCORD 1483 55.7 0.630 894.51543 91 CHEVROLET BERETTA 1419 56.3 0.867 461.71545 91 BUICK CENTURY 1576 56.5 0.789 623.61548 91 MITSUBISHI GALANT 1468 56.3 0.728 677.51558 91 CHEVROLET CAMARO 1638 56.3 0.874 524.51559 91 TOYOTA COROLLA 1284 56.3 0.679 681.11560 91 MAZDA PROTEGE 1286 57.1 0.653 758.71561 91 HONDA CIVIC 1244 56.3 0.632 761.71565 91 TOYOTA PICKUP 1771 56.3 0.534 1519.01568 91 ISUZU STYLUS 1249 56.3 0.573 930.41569 91 SATURN SL2 1316 56.3 0.773 538.71570 91 FORD PROBE 1456 56.3 0.735 659.21585 91 CHEVROLET CORSICA 1497 56.0 0.756 633.81586 91 ISUZU RODEO 1851 56.3 0.444 2296.41589 91 SUZUKI SIDEKICK 1477 56.3 0.571 1108.01590 91 CHRYSLER NEW YORKER 1742 56.3 0.868 565.51591 91 NISSAN 300ZX 1693 56.3 0.716 807.71592 91 NISSAN STANZA 1456 56.5 0.724 684.21593 91 TOYOTA TERCEL 1120 56.8 0.634 693.61595 91 GEO STORM 1197 56.3 0.692 611.41597 91 HONDA ACCORD 1669 56.3 0.679 885.41600 91 FORD TAURUS 1774 56.3 0.699 888.01604 91 MAZDA MPV 1973 56.0 0.613 1270.51606 91 HYUNDAI SCOUPE 1192 56.8 0.692 619.71607 91 PLYMOUTH ACCLAIM 1497 56.3 0.818 547.21628 92 OLDSMOBILE 88 ROYALE 1723 56.6 0.938 484.11629 92 TOYOTA PASEO 1133 56.6 0.696 578.21631 92 MITSUBISHI DIAMANTE 1741 56.7 0.661 988.51656 92 ACURA VIGOR 1628 56.8 0.664 919.21659 92 BMW 325i 1623 56.7 0.676 881.01667 92 CHEVROLET S10 1653 56.3 0.613 1075.91669 92 DODGE CARAVAN 1841 56.3 0.763 773.41670 92 FORD F150 2091 56.0 0.674 1113.81671 92 CHEVROLET SPORTVAN 2468 55.8 0.642 1438.61673 92 GEO METRO 920 56.3 0.730 422.21675 92 DODGE DAKOTA 1615 56.3 0.689 832.01677 92 CHEVROLET ASTRO 2084 56.3 0.556 1648.81679 92 ISUZU PICKUP 1569 56.3 0.489 1604.81684 92 NISSAN MAXIMA 1656 56.7 0.680 888.41689 92 VOLVO 240 1590 56.7 0.774 658.41690 92 TOYOTA CAMRY 1632 56.0 0.710 783.41691 92 HONDA ACCORD 1437 56.2 0.682 752.91695 92 FORD CLUBWAGON 2624 56.7 0.572 1989.51697 92 FORD AEROSTAR 1941 56.2 0.576 1425.81700 92 MITSUBISHI MIGHTY MAX 1518 56.7 0.429 2046.11701 92 DODGE RAM WAGON 2501 56.3 0.489 2558.01705 92 CADILLAC SEVILLE 1870 56.7 0.935 530.61706 92 OLDSMOBILE ACHIEVA 1493 56.7 0.829 538.91708 92 SATURN SL2 1325 56.3 0.770 546.6
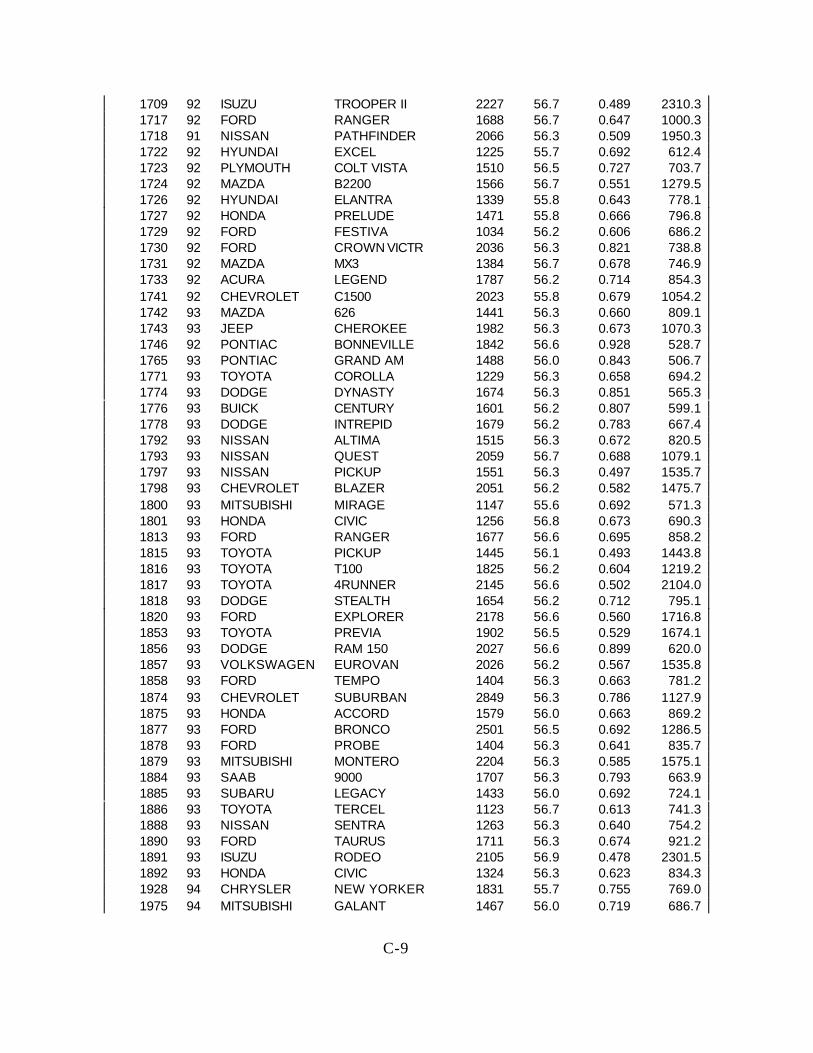
C-9
1709 92 ISUZU TROOPER II 2227 56.7 0.489 2310.31717 92 FORD RANGER 1688 56.7 0.647 1000.31718 91 NISSAN PATHFINDER 2066 56.3 0.509 1950.31722 92 HYUNDAI EXCEL 1225 55.7 0.692 612.41723 92 PLYMOUTH COLT VISTA 1510 56.5 0.727 703.71724 92 MAZDA B2200 1566 56.7 0.551 1279.51726 92 HYUNDAI ELANTRA 1339 55.8 0.643 778.11727 92 HONDA PRELUDE 1471 55.8 0.666 796.81729 92 FORD FESTIVA 1034 56.2 0.606 686.21730 92 FORD CROWN VICTR 2036 56.3 0.821 738.81731 92 MAZDA MX3 1384 56.7 0.678 746.91733 92 ACURA LEGEND 1787 56.2 0.714 854.31741 92 CHEVROLET C1500 2023 55.8 0.679 1054.21742 93 MAZDA 626 1441 56.3 0.660 809.11743 93 JEEP CHEROKEE 1982 56.3 0.673 1070.31746 92 PONTIAC BONNEVILLE 1842 56.6 0.928 528.71765 93 PONTIAC GRAND AM 1488 56.0 0.843 506.71771 93 TOYOTA COROLLA 1229 56.3 0.658 694.21774 93 DODGE DYNASTY 1674 56.3 0.851 565.31776 93 BUICK CENTURY 1601 56.2 0.807 599.11778 93 DODGE INTREPID 1679 56.2 0.783 667.41792 93 NISSAN ALTIMA 1515 56.3 0.672 820.51793 93 NISSAN QUEST 2059 56.7 0.688 1079.11797 93 NISSAN PICKUP 1551 56.3 0.497 1535.71798 93 CHEVROLET BLAZER 2051 56.2 0.582 1475.71800 93 MITSUBISHI MIRAGE 1147 55.6 0.692 571.31801 93 HONDA CIVIC 1256 56.8 0.673 690.31813 93 FORD RANGER 1677 56.6 0.695 858.21815 93 TOYOTA PICKUP 1445 56.1 0.493 1443.81816 93 TOYOTA T100 1825 56.2 0.604 1219.21817 93 TOYOTA 4RUNNER 2145 56.6 0.502 2104.01818 93 DODGE STEALTH 1654 56.2 0.712 795.11820 93 FORD EXPLORER 2178 56.6 0.560 1716.81853 93 TOYOTA PREVIA 1902 56.5 0.529 1674.11856 93 DODGE RAM 150 2027 56.6 0.899 620.01857 93 VOLKSWAGEN EUROVAN 2026 56.2 0.567 1535.81858 93 FORD TEMPO 1404 56.3 0.663 781.21874 93 CHEVROLET SUBURBAN 2849 56.3 0.786 1127.91875 93 HONDA ACCORD 1579 56.0 0.663 869.21877 93 FORD BRONCO 2501 56.5 0.692 1286.51878 93 FORD PROBE 1404 56.3 0.641 835.71879 93 MITSUBISHI MONTERO 2204 56.3 0.585 1575.11884 93 SAAB 9000 1707 56.3 0.793 663.91885 93 SUBARU LEGACY 1433 56.0 0.692 724.11886 93 TOYOTA TERCEL 1123 56.7 0.613 741.31888 93 NISSAN SENTRA 1263 56.3 0.640 754.21890 93 FORD TAURUS 1711 56.3 0.674 921.21891 93 ISUZU RODEO 2105 56.9 0.478 2301.51892 93 HONDA CIVIC 1324 56.3 0.623 834.31928 94 CHRYSLER NEW YORKER 1831 55.7 0.755 769.01975 94 MITSUBISHI GALANT 1467 56.0 0.719 686.7

C-10
1977 93 CHEVROLET CAMARO 1738 57.0 0.874 570.41979 93 CHEVROLET ASTRO 2132 56.2 0.640 1268.51983 94 DODGE CARAVAN 1739 56.5 0.741 780.11990 94 PONTIAC TRANS SPORT 1962 56.5 0.861 651.91993 94 DODGE SPIRIT 1494 56.3 0.788 588.51996 93 LEXUS GS300 1925 56.3 0.677 1027.21998 94 MAZDA 626 1447 56.7 0.667 806.82002 93 INFINITI J30 1864 56.3 0.724 869.72004 94 FORD BRONCO 2447 56.2 0.622 1541.42017 94 TOYOTA T100 1815 56.0 0.566 1370.92021 94 DODGE RAM 1500 2305 56.5 0.753 1001.32024 94 CADILLAC DEVILLE 1937 56.2 0.915 563.82030 94 CHEVROLET CORSICA 1456 56.3 0.795 563.42033 94 PONTIAC GRAND PRIX 1677 56.2 0.713 803.92034 94 TOYOTA COROLLA 1344 56.2 0.621 849.32035 94 OLDSMOBILE ACHIEVA 1483 56.3 0.814 547.42038 94 TOYOTA CAMRY 1639 56.3 0.681 864.42044 94 FORD THUNDERBIRD 1780 56.3 0.720 839.82048 94 HONDA ACCORD 1509 56.6 0.663 848.62049 94 BUICK REGAL 1694 56.5 0.751 739.82052 94 MERCEDES C220 1650 56.5 0.645 976.92053 94 VOLVO 850 1700 56.3 0.581 1231.72054 94 CHEVROLET S10 1811 56.4 0.765 759.52055 94 FORD F150 2296 55.9 0.757 966.12056 94 DODGE DAKOTA 2057 56.2 0.738 920.42057 94 JEEP WRANGLER 1553 56.8 0.615 1022.22058 94 TOYOTA PREVIA 1865 56.8 0.533 1634.22059 94 NISSAN ALTIMA 1495 56.3 0.656 849.72061 94 CHEVROLET SPORTVAN 2559 56.4 0.650 1486.62062 94 FORD ESCORT 1369 56.3 0.632 838.32063 94 FORD MUSTANG 1605 56.3 0.753 692.32064 94 FORD PROBE 1441 56.0 0.626 889.82066 94 HONDA CIVIC 1249 56.5 0.605 840.52067 94 NISSAN QUEST 1999 56.3 0.684 1045.02068 94 HYUNDAI ELANTRA 1379 56.3 0.605 921.42072 94 CHEVROLET CAPRICE 2133 56.5 0.768 890.82126 95 NISSAN MAXIMA 1561 56.6 0.679 836.92127 95 PLYMOUTH NEON 1288 56.3 0.683 675.32129 95 FORD ASPIRE 1124 56.8 0.655 652.22130 95 FORD WINDSTAR 2005 56.1 0.755 854.22131 95 MAZDA MILLENIA 1620 56.3 0.610 1064.82139 94 VOLKSWAGEN JETTA 1467 56.2 0.612 954.52140 95 NISSAN 240SX 1440 56.5 0.726 673.02142 95 DODGE RAM WAGON 2162 56.6 0.518 1991.72149 95 FORD CROWN VICTR 1985 56.3 0.804 751.02154 95 FORD CONTOUR 1581 56.2 0.584 1129.72157 95 HYUNDAI SONATA 1449 56.2 0.678 768.22158 95 SUBARU LEGACY 1394 56.6 0.731 644.92159 95 CHEVROLET M O N T E
CARLO1705 56.2 0.833 598.8
2160 95 SATURN SL2 1256 56.3 0.797 483.6

C-11
2161 95 MAZDA PROTEGE 1282 56.6 0.647 757.02193 95 OLDSMOBILE AURORA 2041 55.8 0.562 1552.52195 95 CHEVROLET BLAZER 2165 56.2 0.717 1026.32197 95 TOYOTA TERCEL 1183 56.3 0.664 656.22198 95 SAAB 900 1601 56.5 0.733 734.02200 95 JEEP CHEROKEE 1637 56.3 0.627 1018.42203 95 MAZDA MPV 2003 56.3 0.509 1890.92207 95 FORD RANGER 1755 56.0 0.575 1284.42208 95 VOLKSWAGEN PASSAT 1650 56.3 0.636 997.72209 95 AUDI A6 1833 56.4 0.788 724.52211 95 FORD EXPLORER 2206 56.2 0.592 1534.02212 95 ACURA INTEGRA 1420 56.6 0.688 741.62221 95 DODGE AVENGER 1516 56.2 0.622 955.02222 95 CHEVROLET LUMINA 1741 56.2 0.833 611.52223 95 CHEVROLET S10 1687 56.8 0.664 952.52231 95 MITSUBISHI MONTERO 2252 56.5 0.523 2028.02232 95 MITSUBISHI ECLIPSE 1490 56.5 0.607 996.12239 95 GEO METRO 1125 56.6 0.711 550.12240 95 CHEVROLET C1500 2072 57.0 0.752 918.52250 95 BMW 325i 1717 56.5 0.638 1039.02252 95 DODGE STRATUS 1626 57.0 0.663 927.32253 95 CHEVROLET CAVALIER 1433 56.5 0.705 710.22254 95 SUZUKI SIDEKICK 1471 56.3 0.556 1163.82257 95 KIA SEPHIA 1290 56.5 0.682 683.12262 95 ISUZU TROOPER II 2232 56.3 0.508 2115.32263 95 HONDA ODYSSEY 1830 56.2 0.680 964.52264 95 FORD ESCORT 1325 56.4 0.674 715.92280 95 TOYOTA CAMRY 1576 56.6 0.713 766.32282 95 TOYOTA AVALON 1714 56.5 0.698 866.62296 95 TOYOTA TACOMA 1447 56.6 0.468 1633.12297 95 NISSAN ALTIMA 1549 56.4 0.689 800.92298 95 NISSAN SENTRA 1293 56.3 0.666 713.02299 95 HYUNDAI ACCENT 1213 56.0 0.614 778.62311 95 CHEVROLET TAHOE 2678 56.6 0.730 1242.22312 96 FORD TAURUS 1764 56.5 0.700 886.72313 95 ISUZU RODEO 2075 56.4 0.493 2095.52319 96 AUDI A4 1763 56.5 0.693 904.22320 96 DODGE NEON 1354 56.5 0.686 708.72335 96 DODGE CARAVAN 2003 56.2 0.757 851.82336 96 DODGE RAM 2119 55.7 0.567 1577.92341 96 PONTIAC GRAND AM 1560 57.0 .2342 96 LEXUS ES300 1759 56.5 0.715 847.52343 96 LANDROVER DISCOVERY 2315 56.3 0.605 1546.92359 96 CADILLAC DEVILLE 2024 56.5 0.866 664.82360 96 FORD MUSTANG 1700 56.3 0.779 685.22367 96 MERCURY VILLAGER 2009 56.0 0.659 1119.42368 96 FORD CROWN VICTR 1985 56.2 0.786 783.02370 96 MAZDA MIATA 1227 56.5 0.638 742.52371 96 HONDA CIVIC 1250 56.3 0.686 649.62372 96 MITSUBISHI MIRAGE 1185 56.5 0.660 670.12373 96 SUBARU IMPREZA 1435 56.3 0.650 830.7
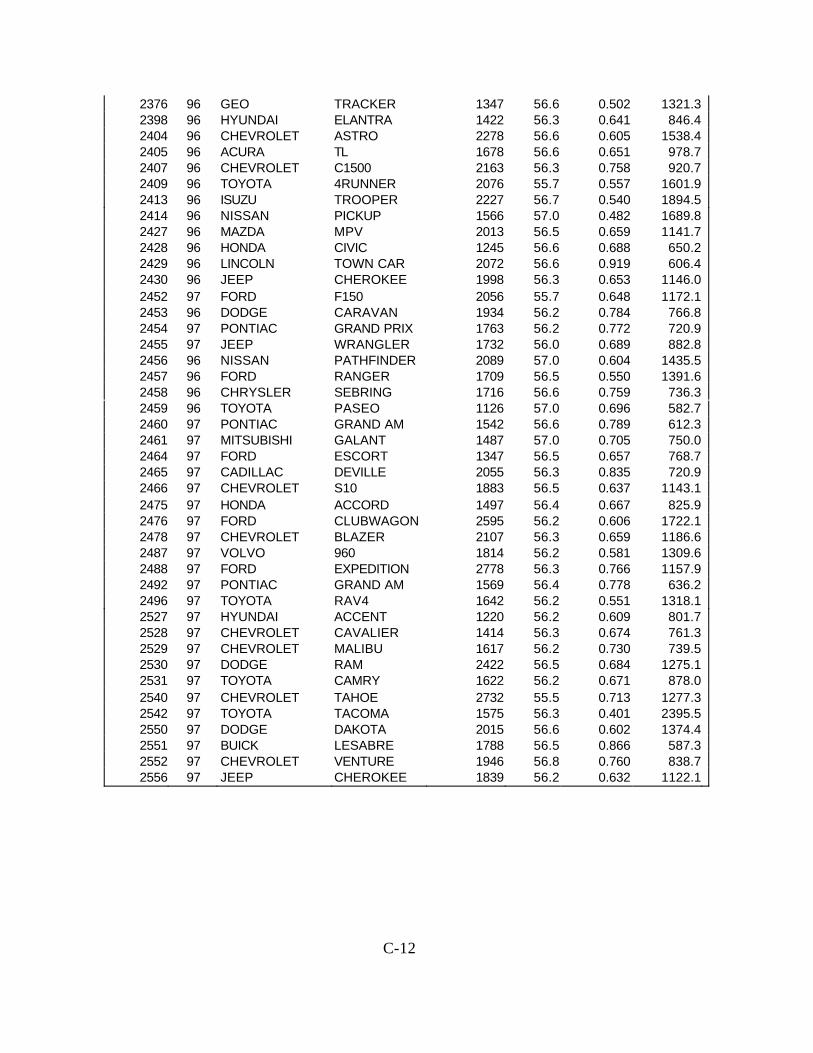
C-12
2376 96 GEO TRACKER 1347 56.6 0.502 1321.32398 96 HYUNDAI ELANTRA 1422 56.3 0.641 846.42404 96 CHEVROLET ASTRO 2278 56.6 0.605 1538.42405 96 ACURA TL 1678 56.6 0.651 978.72407 96 CHEVROLET C1500 2163 56.3 0.758 920.72409 96 TOYOTA 4RUNNER 2076 55.7 0.557 1601.92413 96 ISUZU TROOPER 2227 56.7 0.540 1894.52414 96 NISSAN PICKUP 1566 57.0 0.482 1689.82427 96 MAZDA MPV 2013 56.5 0.659 1141.72428 96 HONDA CIVIC 1245 56.6 0.688 650.22429 96 LINCOLN TOWN CAR 2072 56.6 0.919 606.42430 96 JEEP CHEROKEE 1998 56.3 0.653 1146.02452 97 FORD F150 2056 55.7 0.648 1172.12453 96 DODGE CARAVAN 1934 56.2 0.784 766.82454 97 PONTIAC GRAND PRIX 1763 56.2 0.772 720.92455 97 JEEP WRANGLER 1732 56.0 0.689 882.82456 96 NISSAN PATHFINDER 2089 57.0 0.604 1435.52457 96 FORD RANGER 1709 56.5 0.550 1391.62458 96 CHRYSLER SEBRING 1716 56.6 0.759 736.32459 96 TOYOTA PASEO 1126 57.0 0.696 582.72460 97 PONTIAC GRAND AM 1542 56.6 0.789 612.32461 97 MITSUBISHI GALANT 1487 57.0 0.705 750.02464 97 FORD ESCORT 1347 56.5 0.657 768.72465 97 CADILLAC DEVILLE 2055 56.3 0.835 720.92466 97 CHEVROLET S10 1883 56.5 0.637 1143.12475 97 HONDA ACCORD 1497 56.4 0.667 825.92476 97 FORD CLUBWAGON 2595 56.2 0.606 1722.12478 97 CHEVROLET BLAZER 2107 56.3 0.659 1186.62487 97 VOLVO 960 1814 56.2 0.581 1309.62488 97 FORD EXPEDITION 2778 56.3 0.766 1157.92492 97 PONTIAC GRAND AM 1569 56.4 0.778 636.22496 97 TOYOTA RAV4 1642 56.2 0.551 1318.12527 97 HYUNDAI ACCENT 1220 56.2 0.609 801.72528 97 CHEVROLET CAVALIER 1414 56.3 0.674 761.32529 97 CHEVROLET MALIBU 1617 56.2 0.730 739.52530 97 DODGE RAM 2422 56.5 0.684 1275.12531 97 TOYOTA CAMRY 1622 56.2 0.671 878.02540 97 CHEVROLET TAHOE 2732 55.5 0.713 1277.32542 97 TOYOTA TACOMA 1575 56.3 0.401 2395.52550 97 DODGE DAKOTA 2015 56.6 0.602 1374.42551 97 BUICK LESABRE 1788 56.5 0.866 587.32552 97 CHEVROLET VENTURE 1946 56.8 0.760 838.72556 97 JEEP CHEROKEE 1839 56.2 0.632 1122.1