updated responses to the us nuclear regulatory commission ... · phase 1 of the decommissioning....
TRANSCRIPT

UPDATED RESPONSES TO THE
U.S. NUCLEAR REGULATORY COMMISSION
REQUEST FOR ADDITIONAL INFORMATION
ON THE WEST VALLEY DEMONSTRATION PROJECT
PHASE 1 DECOMMISSIONING PLAN
RAIs 5C6, 5C7, 5C9, 5C10, 5C12, 5C15, and 5C21
November 6, 2009
Prepared by Washington Safety Management Solutions andScience Applications International Corporation
for the
U.S. Department of Energy
West Valley, New York
As is the Decommissioning Plan itself, these responses are based on the assumption that the preferred
alternative in the Revised Draft Environmental Impact Statement for Decommissioning and/or Long-Term
Stewardship at the West Valley Demonstration Project and Western New York Nuclear Service Center (the
Decommissioning EIS) will be selected in the Record of Decision. If changes to the Decommissioning EIS
occur during the course of the National Environmental Policy Act process that affect the Decommissioning
Plan, such as changes to the preferred alternative, or if a different approach is selected in the Record of
Decision, the Decommissioning Plan and these responses would need to be revised or replaced in their
entirety to reflect the changes.
11/6/09 1
•
•
•
UPDATED RESPONSES TO THE
U.S. NUCLEAR REGULATORY COMMISSION
REQUEST FOR ADDITIONAL INFORMATION
ON THE WEST VALLEY DEMONSTRATION PROJECT
PHASE 1 DECOMMISSIONING PLAN
RAls 5C6, 5C7, 5C9, 5C1 0, 5C12, 5C15, and 5C21
November 6, 2009
Prepared by Washington Safety Management Solutions and Science Applications International Corporation
for the
u.S. Department of Energy
West Valley, New York
As is the Decommissioning Plan itself, these responses are based on the assumption that the preferred
alternative in the Revised Draft Environmental Impact Statement for Decommissioning and/or Long-Term
Stewardship at the West Valley Demonstration Project and Western New York Nuclear Service Center (the
Decommissioning EIS) will be selected in the Record of Decision. If changes to the Decommissioning EIS
occur during the course of the National Environmental Policy Act process that affect the Decommissioning Plan, such as changes to the preferred alternative, or if a different approach is selected in the Record of
Decision, the Decommissioning Plan and these responses would need to be revised or replaced in their
entirety to reflect the changes.
11/6/09

This page is intentionally blank.
11/6/09 2
• This page is intentionally blank.
•
• 11/6/09 2

DOE RESPONSES TO WVDP PHASE 1 DECOMMISSIONING PLAN RAIS
CONTENTS
Acronym s, A bbreviations, and U nits ....................................................................................... 4
Intro d u ctio n .................................................................................................................................. 5
UPDATED RAI RESPONSES IN THIS SUBMITTAL
Ref. No. Subject
11 5C6 Show cistern scenario bounding ..................................................................... 7
12 5C7 Subsurface DCGL approach not limiting ................................................ .......... 12
14. 5C9 Consideration of subsurface contamination .................................................. 15
15 5C10 Subsurface model contaminated area ........................................................... 54
17 5C12 Streambed model inhalation pathway ......................................................... 58
20 5C15 Conservatism in model input parameters ........................................................ 103
26 5C21 1-129 sensitivity to conductivity changes ......................................................... 163
CALCULATION PACKAGES IN THIS SUBMITTAL (provided on compact disk only)
No. Subject RAI
1 Code Development Verification Package, Rectangular Monolith Finite 5C9Difference Solution Groundwater Release Model
2 Calculation Package, Estimates of Human Health Impacts Due to a Subsurface 5C9
Source in the Vicinity of the Excavation of the Main Plan Process Building
3 Calculation Package, RESRAD Dose-to-Source Ratios 5C9
11/6/09 3
•
•
•
DOE RESPONSES TO WVDP PHASE 1 DECOMMISSIONING PLAN RAls
CONTENTS
Acronyms, Abbreviations, and Units ............................................................................................ 4
Introduction .................................................................................................................................. 5
UPDATED RAI RESPONSES IN THIS SUBMITTAL
Ref. No. Subject
11 5C6 Show cistern scenario bounding .......................................................................... 7
12 5C7 Subsurface DCGL approach not limiting ................................................ , .......... 12
14 5C9 Consideration of subsurface contamination ...................................................... 15
15 5C 1 0 Subsurface model contaminated area ................................................................ 54
17 5C12 Streambed model inhalation pathway ............................................................... 58
20 5C15 Conservatism in model input parameters ........................................................ 103
26 5C21 1-129 sensitivity to conductivity changes ......................................................... 163
CALCULATION PACKAGES IN THIS SUBMITTAL (provided on compact disk only)
No. Subject RAI
11/6/09
Code Development Verification Package, Rectangular Monolith Finite 5C9 Difference Solution Groundwater Release Model
2 Calculation Package, Estimates of Human Health Impacts Due to a Subsurface 5C9 Source in the Vicinity of the Excavation of the Main Plan Process Building
3 Calculation Package, RESRAD Dose-to-Source Ratios 5C9
3

UPDATED DOE RESPONSES TO WVDP PHASE 1 DECOMMISSIONING PLAN RAIs
Acronyms and Abbreviations
CFR Code of Federal Regulations
DCGL derived concentration guideline level
DCGLEMC derived concentration guideline level, elevated measurement concentration
DCGLw derived concentration guideline level, wide
DOE U.S. Department of Energy
DP decommissioning plan
EIS environmental impact statement
EPA U.S. Environmental Protection Agency
Kd distribution coefficient
LTR License Termination Rule
NRC Nuclear Regulatory Commission
RAI request for additional information
RESRAD Residual radioactivity [computer code]
WMA waste management area
WVDP West Valley Demonstration Project
Units
cm centimeter
cm 3 centimeter cubed
g gram [mass]
kg kilogram
L liter
m meter
millirem 0.001 Roentgen equivalent man
mL milliliter
mrem millirem
pCi 10.12 curie
y year
11/6/09 411/6/09
UPDATED DOE RESPONSES TO WVDP PHASE 1 DECOMMISSIONING PLAN RAls
Acronyms and Abbreviations
CFR Code of Federal Regulations
DCGL
DCGLEMC
DCGLw
DOE
DP
EIS
EPA
Kd
LTR
NRC
RAI
RESRAD
WMA
WVDP
Units
cm
cm3
g
kg
L
m
millirem
mL
mrem
pCi
y
derived concentration guideline level
derived concentration guideline level, elevated measurement concentration
derived concentration guideline level, wide
U.S. Department of Energy
decommissioning plan
environmental impact statement
U.S. Environmental Protection Agency
distribution coefficient
License Termination Rule
Nuclear Regulatory Commission
request for additional information
Residual radioactivity [computer code]
waste management area
West Valley Demonstration Project
centimeter
centimeter cubed
gram [mass]
kilogram
liter
meter
0.001 Roentgen equivalent man
milliliter
millirem
10.12 curie
year
4
•
•
•

UPDATED DOE RESPONSES TO WVDP PHASE I DECOMMISSIONING PLAN RAtS
INTRODUCTION
The U.S. Department of Energy (DOE) submitted Revision 0 of the West Valley DemonstrationProject (WVDP) Phase 1 Decommissioning Plan to the U.S. Nuclear Regulatory Commission(NRC) for review on December 3, 2008. DOE subsequently submitted Revision 1 of this plan toNRC for review on March 16, 2009. Revision I provided additional subsurface soil andgroundwater characterization data and the results of additional groundwater modeling, along with
several other minor changes.
NRC submitted the Request for Additional Information (RAI) on May 15, 2009 in a letter to Bryan
Bower, the Director of the WVDP. This request consisted of 44 separate RAls on various aspects
of the Decommissioning Plan, including dose modeling.
NRC review of the Decommissioning Plan is being performed consistent with the provisions ofPublic Law 96-368, the WVDP Act of 1980, which provides authority for NRC to consult with DOEinformally on matters related to the project. Consistent with the Act, and with a 1981
Memorandum of Understanding between DOE and NRC pertaining to the project, DOE has
considered the NRC RAIs and is providing written responses to NRC.
DOE responded to these RAIs in two parts. Responses to the first group of 38 RAIs wereprovided on August 14, 2009. Responses to the remaining six RAIs were provided on September
16, 2009.
As discussed at the DOE-NRC meeting held on September 2, 2009 and stated in the DOEforwarding letter for the September 16, 2009 submittal, changes to the subsurface soil cleanupgoals were necessary to account for diffusion of residual radioactivity from the bottom of the deep
excavations. These changes required revisions to the responses to RAI 5C9 and RAI 5C15. Theresponses to the following additional RAIs were also updated, primarily for the sake of clarity:
5C6, 5C7, 5C10, 5C12, and 5C21.
Like the initial responses, the updated RAI responses are provided in the following format:
NRC RAI number: The NRC RAI number is specified
Subject: DOE added a brief statement of the RAI subject, for clarity.
RAI: A complete copy of the NRC RAI is provided.
Basis: A complete copy of the NRC basis for the RAI is provided.
NRC path forward: A complete copy of the NRC path forward is provided.
DOE response: The DOE response provides requested information and answers NRC
questions.
Changes to the plan: Changes to be made are specifically identified with red text and
change bars. (The two completely new appendices are not so marked.)
References: References are included where appropriate.
The following calculation packages and the associated electronic files are being provided with thissubmittal to enable NRC staff to replicate the modeling described in the updated response to RAI
5C9:
11/6/09 5
•
•
•
UPDATED DOE RESPONSES TO WVDP PHASE 1 DECOMMISSIONING PLAN RAts
INTRODUCTION
The U.S. Department of Energy (DOE) submitted Revision 0 of the West Valley Demonstration Project (WVDP) Phase 1 Decommissioning Plan to the U.S. Nuclear Regulatory Commission (NRC) for review on December 3, 2008. DOE subsequently submitted Revision 1 of this plan to NRC for review on March 16, 2009. Revision 1 provided additional subsurface soil and groundwater characterization data and the results of additional groundwater modeling, along with several other minor changes.
NRC submitted the Request for Additional Information (RAI) on May 15, 2009 in a letter to Bryan Bower, the Director of the WVDP. This request consisted of 44 separate RAls on various aspects of the Decommissioning Plan, including dose modeling.
NRC review of the Decommissioning Plan is being performed consistent with the provisions of Public Law 96-368, the WVDP Act of 1980, which provides authority for NRC to consult with DOE informally on matters related to the project. Consistent with the Act, and with a 1981 Memorandum of Understanding between DOE and NRC pertaining to the project, DOE has considered the NRC RAls and is providing written responses to NRC.
DOE responded to these RAls in two parts. Responses to the first group of 38 RAls were provided on August 14, 2009. Responses to the remaining six RAls were provided on September 16,2009.
As discussed at the DOE-NRC meeting held on September 2, 2009 and stated in the DOE forwarding letter for the September 16, 2009 submittal, changes to the subsurface soil cleanup goals were necessary to account for diffusion of residual radioactivity from the bottom of the deep excavations. These changes required revisions to the responses to RAI 5C9 and RAI 5C15. The responses to the following additional RAls were also updated, primarily for the sake of clarity: 5C6, 5C7, 5C10, 5C12, and 5C21.
Like the initial responses, the updated RAI responses are provided in the following format:
NRC RAt number: The NRC RAI number is specified
Subject: DOE added a brief statement of the RAI subject, for clarity.
RAt: A complete copy of the NRC RAI is provided.
Basis: A complete copy of the NRC basis for the RAI is provided.
NRC path forward: A complete copy of the NRC path forward is provided.
DOE response: The DOE response provides requested information and answers NRC questions.
Changes to the ptan: Changes to be made are specifically identified with red text and change bars. (The two completely new appendices are not so marked.)
References: References are included where appropriate.
The following calculation packages and the associated electronic files are being provided with this submittal to enable NRC staff to replicate the modeling described in the updated response to RAI 5C9:
11/6/09 5

UPDATED DOE RESPONSES TO WVDP PHASE 1 DECOMMISSIONING PLAN RAIs
* Code Development Verification Package, Rectangular Monolith Finite Difference Solution
Groundwater Release Model;
• Calculation Package, Estimates of Human Health Impacts Due to a Subsurface Source in
the Vicinity of the Excavation of the Main Plan Process Building; and
" Calculation Package, RESRAD Dose-to-Source Ratios.
As indicated on the cover sheet, if changes to the Decommissioning EIS occur during the course
of the National Environmental Policy Act process that affect the Decommissioning Plan, such as
changes to the preferred alternative, or if a different approach is selected in the Record of
Decision, the Decommissioning Plan and these responses would need to be revised or replaced
in their entirety to reflect the changes.
11/6/09 6
UPDATED DOE RESPONSES TO WVDP PHASE 1 DECOMMISSIONING PLAN RAls
• Code Development Verification Package, Rectangular Monolith Finite Difference Solution
Groundwater Release Model;
• Calculation Package, Estimates of Human Health Impacts Due to a Subsurface Source in the Vicinity of the Excavation of the Main Plan Process Building; and
• Calculation Package, RESRAD Dose-to-Source Ratios.
As indicated on the cover sheet, if changes to the Decommissioning EIS occur during the course of the National Environmental Policy Act process that affect the Decommissioning Plan, such as changes to the preferred alternative, or if a different approach is selected in the Record of Decision, the Decommissioning Plan and these responses would need to be revised or replaced in their entirety to reflect the changes.
11/6/09 6
•
•
•

UPDATED DOE RESPONSES TO WVDP PHASE 1 DECOMMISSIONING PLAN RAIS
RAI 5C6 (11)
Subject: Show that the cistern scenario is bounding
RAI: DOE did not provide enough information to show that the subsurface DCGL calculations
considering a cistern drilling scenario are bounding. (Section 5.1.4, Page 5-14)
Basis: Subsurface DCGLs are calculated assuming a cistern is drilled throughout the thickness
of the sand and gravel unit to the top of the Lavery Till.
DOE acknowledges that gully erosion could intrude upon the lagoon areas (see page 5-14).
However, DOE did not provide quantitative support for its assumption that erosion from gully
formation/advancement, or stream widening could intercept the WMA 2 source areas and
produce greater exposures to an offsite or onsite receptor.
Path Forward: DOE should provide the results of a quantitative analysis that supports its
assumption that the subsurface DCGLs calculated assuming a cistern driller scenario bound the
potential impacts from erosion.
DOE Response: DOE has performed a quantitative analysis of potential doses to an onsite
receptor located in the portion of WMA 2 most susceptible to the impacts of unmitigated erosion
based on the erosion modeling performed for the Decommissioning EIS. The results show that
the cistern scenario is more limiting than the alternate onsite receptor scenario that was analyzed.
DOE has also performed a quantitative analysis of the potential impacts of unmitigated erosion in
the area of the backfilled WMA 2 excavation on a representative offsite receptor. Here too, the
results show that the cistern scenario is more limiting than the alternate offsite receptor scenario
that was analyzed.
These analyses are described below.
However, additional groundwater modeling using the STOMP code has shown that diffusion of
radioactivity from the bottom of the deep excavations must be taken into account in establishing
the subsurface soil DCGLs and cleanup goals.
The updated response to RAI 5C9 describes the additional modeling and the reduced DCGLs
and cleanup goals that take the results of this analysis into account. This updated response
includes a new DP subsection 5.2.6 that describes the modified conceptual model used. the
mathematical models used, and the results of the analysis.
The updated response to RAI 5C15 includes revised tables for section 5 of the DP such as Table
5-14 that specifies the cleanup goals to be used in soil and sediment remediation associated with
Phase 1 of the decommissioning.
Predicted Erosion
Information in Section 5.1.4 of the DP is drawn from erosion analyses performed for the
Decommissioning EIS. As indicated in Section 5.1.4, the studies described in Appendix F to the
Decommissioning EIS suggest that the central portion of the north plateau where WMA 1 is
located will be generally stable for the next 1000 years, but that the portion of WMA 2 near the
Erdman Brook stream valley is much more susceptible to erosion, particularly that associated
with development of gullies.
11/6/09 7
•
•
•
UPDATED DOE RESPONSES TO WVDP PHASE 1 DECOMMISSIONING PLAN RAls
RAlse6 (11)
Subject: Show that the cistern scenario is bounding
RAI: DOE did not provide enough information to show that the subsurface DCGL calculations considering a cistern drilling scenario are bounding. (Section 5.1.4, Page 5-14)
Basis: Subsurface DCGLs are calculated assuming a cistern is drilled throughout the thickness of the sand and gravel unit to the top of the Lavery Till.
DOE acknowledges that gully erosion could intrude upon the lagoon areas (see page 5-14). However, DOE did not provide quantitative support for its assumption that erosion from gully formation/advancement, or stream widening could intercept the WMA 2 source areas and produce greater exposures to an offsite or onsite receptor.
Path Forward: DOE should provide the results of a quantitative analysis that supports its
assumption that the subsurface DCGLs calculated assuming a cistern driller scenario bound the potential impacts from erosion.
*******************
DOE Response: DOE has performed a quantitative analysis of potential doses to an onsite receptor located in the portion of WMA 2 most susceptible to the impacts of unmitigated erosion based on the erosion modeling performed for the Decommissioning EIS. The results show that the cistern scenario is more limiting than the alternate onsite receptor scenario that was analyzed.
DOE has also performed a quantitative analysis of the potential impacts of unmitigated erosion in the area of the backfilled WMA 2 excavation on a representative offsite receptor. Here too, the results show that the cistern scenario is more limiting than the alternate offsite receptor scenario that was analyzed.
These analyses are described below.
However, additional groundwater modeling using the STOMP code has shown that diffusion of radioactivity from the bottom of the deep excavations must be taken into account in establishing the subsurface soil DCGLs and cleanup goals.
The updated response to RAI 5C9 describes the additional modeling and the reduced DCGLs and cleanup goals that take the results of this analysis into account. This updated response includes a new DP subsection 5.2.6 that describes the modified conceptual model used, the mathematical models used, and the results of the analysis.
The updated response to RAI 5C15 includes revised tables for section 5 of the DP such as Table 5-14 that specifies the cleanup goals to be used in soil and sediment remediation associated with Phase 1 of the decommissioning.
Predicted Erosion
Information in Section 5.1.4 of the DP is drawn from erosion analyses performed for the Decommissioning EIS. As indicated in Section 5.1.4, the studies described in Appendix F to the
Decommissioning EIS suggest that the central portion of the north plateau where WMA 1 is located will be generally stable for the next 1000 years, but that the portion of WMA 2 near the Erdman Brook stream valley is much more susceptible to erosion , particularly that associated with development of gullies.
11/6/09 7

UPDATED DOE RESPONSES TO WVDP PHASE 1 DECOMMISSIONING PLAN RAIs
Potential Doses to an Onsite Receptor
The predicted gully erosion would produce narrow, deep steep-sided gullies, conditions where
building a home and growing crops would not be practical. Consequently, the resident farmer
scenario used in development of the subsurface soil DCGLs would no longer be plausible for this
part of WMA 2 under these conditions.
A plausible scenario for these conditions would involve a recreationist spending time hiking in the
area, which is assumed to be rent by deep gullies that extend to the bottom of the WMA 2
excavation. Figure 5C6-1 illustrates the basic conceptual model. This scenario was analyzed
using RESRAD in the deterministic mode with the following key conceptual model input
parameters:
* Unmitigated erosion would produce conditions where the recreationist could be exposed
to contamination at the bottom of the WMA 2 excavation in the area of Lagoons 1 and 2
in 200 years;
* One or more gullies are assumed to extend through the contamination zone, which is
made up of unweathered Lavery till material one-meter thick at the bottom of the WMA 2
excavation;
* The exposed contamination zone area in the gully walls is assumed to be two meters
wide and 100 meters long, a reasonable size to represent the likely geometry of the
exposed contamination in the gully (modeling a single source area rather than the twoillustrated in Figure 5C6-1 was more practical);
" The recreationist is assumed to be walking at a pace of 0.8 kilometers (0.5 mile) per hour
on a path where exposed contamination is present, such as going to the stream to hunt
or fish and returning home;
" The recreationist would be exposed to the contamination for a total of 28 hours per year
(an outdoor time fraction of 0.0032), based on 112 trips per year to and from the stream.
Approximate RationistFeet Above Exposed contaminationMean Sea Level
-1370
- 1365
- 1360
1-m thick contamination
1355 zone at excavation bottom(modeled as a singlesource area)
Figure 5C6-1 Recreationist Conceptual Model Cross Section
11/6/09 8
UPDATED DOE RESPONSES TO WVDP PHASE 1 DECOMMISSIONING PLAN RAls
Potential Doses to an Onsite Receptor
The predicted gully erosion would produce narrow, deep steep-sided gullies, conditions where building a home and growing crops would not be practical. Consequently, the resident farmer scenario used in development of the subsurface soil DCGLs would no longer be plausible for this part of WMA 2 under these conditions.
A plausible scenario for these conditions would involve a recreationist spending time hiking in the area, which is assumed to be rent by deep gullies that extend to the bottom of the WMA 2 excavation. Figure 5C6-1 illustrates the basic conceptual model. This scenario was analyzed using RESRAD in the deterministic mode with the following key conceptual model input parameters:
• Unmitigated erosion would produce conditions where the recreationist could be exposed to contamination at the bottom of the WMA 2 excavation in the area of Lagoons 1 and 2 in 200 years;
• One or more gullies are assumed to extend through the contamination zone, which is made up of unweathered Lavery till material one-meter thick at the bottom of the WMA 2
excavation;
• The exposed contamination zone area in the gully walls is assumed to be two meters wide and 100 meters long, a reasonable size to represent the likely geometry of the exposed contamination in the gully (modeling a single source area rather than the two illustrated in Figure 5C6-1 was more practical);
• The recreationist is assumed to be walking at a pace of 0.8 kilometers (0.5 mile) per hour on a path where exposed contamination is present, such as going to the stream to hunt or fish and returning home;
• The recreationist would be exposed to the contamination for a total of 28 hours per year (an outdoor time fraction of 0.0032), based on 112 trips per year to and from the stream .
Approximate Feet Above Mean Sea Level
1370
1365
1360
1355 1-m thick contamination zone at excavation bottom (modeled as a single source area)
Figure 5C6-1 Recreationist Conceptual Model Cross Section
11/6/09 8
•
•
•

UPDATED DOE RESPONSES TO WVDP PHASE 1 DECOMMISSIONING PLAN RAIs
The modeling of this recreationist scenario produced DCGLs for 25 mrem per year that weremore than one order of magnitude greater than the DCGLs produced with the cistern scenario for
all 18 radionuclides of interest. These results demonstrate that the cistern scenario is morelimiting for an onsite receptor.
Sensitivity analyses of the time to beginning exposure (development of gullies as assumed in the
conceptual model) were performed for 100 years and 500 years. These analyses showed thateven with an impossibly short period of 100 years to produce the eroded conditions that were
analyzed, the DCGLs for the recreationist scenario would still be more than one order ofmagnitude greater than those for the cistern scenario for all radionuclides. This difference would
be even greater using the 500 year time period, as would be expected.
The calculation package describing this analysis and the associated electronic files are being
provided to NRC with the RAI responses.
Potential Doses to an Offsite Receptor
The response to RAI 5C4 describes an analysis to determine the values of surface soil DCGLsthat would produce 25 mrem per year to an offsite receptor from radioactivity associated with
erosion of surface soil. A similar analysis has been performed for residual radioactivity at thebottom of the deep excavation in WMA 2.
The type of erosion described previously in relation to potential doses to an onsite receptor could
result in residual radioactivity from the bottom of the backfilled deep excavation in WMA 2
entering Erdman Brook and impacting downstream offsite receptors. To quantitatively estimate
such potential impacts, an analysis was performed using methodology used in the
Decommissioning EIS for estimating offsite impacts of erosion.
The assumption of erosion by gully intrusion into residual subsurface contamination in WMA 2 is
supported by landscape evolution modeling that indicates that the WMA 2 area will be affected by
gully erosion over a 10,000-year period as described in the Decommissioning EIS.
In order to evaluate these potential impacts, the largest gully produced in simulations of the
landscape evolution model is assumed to intrude into Lagoon 1 (area of 400 m2 ) and Lagoon 3
(area of 1,800 M 2). Peak rates of erosion were estimated as 0.012 and 0.0035 m/y for the areas
of Lagoons 1 and 3, respectively, based on the erosion modeling done for the DecommissioningEIS. (These peak erosion rates are considered conservative; the next highest erosion rates
predicted by this modeling are much less than these values, being on the order of 0.0035 m/y for
Lagoon 1 and 0.0012 m/y Lagoon 3.)
Radioactivity in eroded soil is assumed to be transported to surface water used by an offsitereceptor. The receptor located on Cattaraugus Creek near the confluence with Buttermilk Creek
ingests both the water and fish harvested from the water and uses the water to irrigate a garden.
Drinking water and fish ingestion rates used in the analysis correspond to the 9 5 th percentile of
national use and crop and animal product intake values are those recommended in NUREG/CR-
5512, Volume 3 (Beyeler, et al. 1999). Doses for the combined pathways due to onsite
contamination at a level of one picocurie per gram and the related DCGLs are summarized forkey radionuclides in the following tables.
11/6/09 9
•
•
•
UPDATED DOE RESPONSES TO WVDP PHASE 1 DECOMMISSIONING PLAN RAls
The modeling of this recreationist scenario produced DCGLs for 25 mrem per year that were more than one order of magnitude greater than the DCGLs produced with the cistern scenario for all 18 radionuciides of interest. These results demonstrate that the cistern scenario is more limiting for an onsite receptor.
Sensitivity analyses of the time to beginning exposure (development of gullies as assumed in the conceptual model) were performed for 100 years and 500 years. These analyses showed that even with an impossibly short period of 100 years to produce the eroded conditions that were analyzed, the DCGLs for the recreationist scenario would still be more than one order of magnitude greater than those for the cistern scenario for all radionuclides. This difference would be even greater using the 500 year time period, as would be expected.
The calculation package describing this analysis and the associated electronic files are being
provided to NRC with the RAI responses.
Potential Doses to an Offsite Receptor
The response to RAI 5C4 describes an analysis to determine the values of surface soil DCGLs that would produce 25 mrem per year to an offsite receptor from radioactivity associated with erosion of surface soil. A similar analysis has been performed for residual radioactivity at the bottom of the deep excavation in WMA 2.
The type of erosion described previously in relation to potential doses to an onsite receptor could result in residual radioactivity from the bottom of the backfilled deep excavation in WMA 2 entering Erdman Brook and impacting downstream offsite receptors. To quantitatively estimate such potential impacts, an analysis was performed using methodology used in the Decommissioning EIS for estimating offsite impacts of erosion.
The assumption of erosion by gully intrusion into residual subsurface contamination in WMA 2 is supported by landscape evolution modeling that indicates that the WMA 2 area will be affected by gully erosion over a 10,000-year period as described in the Decommissioning EIS.
In order to evaluate these potential impacts, the largest gully produced in simulations of the landscape evolution model is assumed to intrude into Lagoon 1 (area of 400 m2
) and Lagoon 3 (area of 1,800 m2
). Peak rates of erosion were estimated as 0.012 and 0.0035 m/y for the areas of Lagoons 1 and 3, respectively, based on the erosion modeling done for the Decommissioning EIS. (These peak erosion rates are considered conservative; the next highest erosion rates predicted by this modeling are much less than these values, being on the order of 0.0035 m/y for Lagoon 1 and 0.0012 m/y Lagoon 3.)
Radioactivity in eroded soil is assumed to be transported to surface water used by an offsite receptor. The receptor located on Cattaraugus Creek near the confluence with Buttermilk Creek
ingests both the water and fish harvested from the water and uses the water to irrigate a garden.
Drinking water and fish ingestion rates used· in the analysis correspond to the 95th percentile of national use and crop and animal product intake values are those recommended in NUREG/CR-5512, Volume 3 (Beyeler, et al. 1999). Doses for the combined pathways due to onsite contamination at a level of one picocurie per gram and the related DCGLs are summarized for key radionuciides in the following tables.
11/6/09 9
UPDATED DOE RESPONSES TO WVDP PHASE 1 DECOMMISSIONING PLAN RAIs
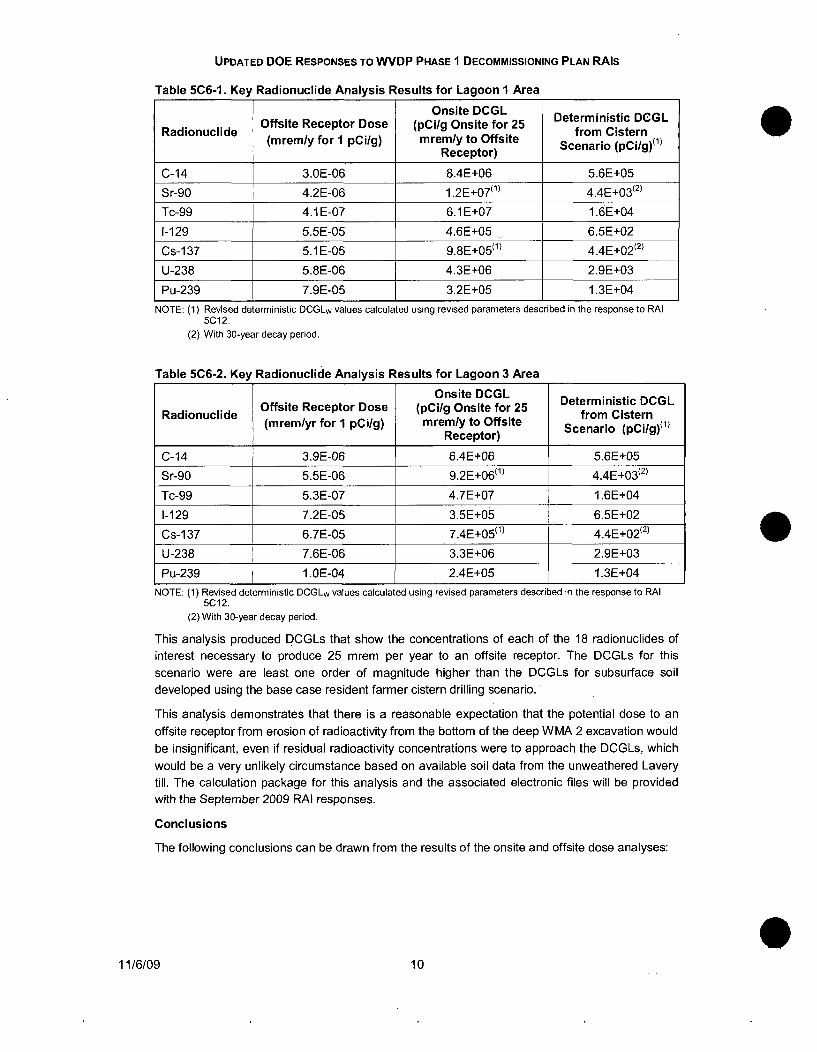
Table 5C6-1. Key Radionuclide Analysis Results for Lagoon I Area
Onsite DCGL Deterministic DCGL
Radionuclide Offsite Receptor Dose (pCi/g Onsite for 25 from Cistern(mrem/y for I pCi/g) mrem/y to Offsite Scenario (pCi/g)(1)
Receptor)
C-14 3.OE-06 8.4E+06 5.6E+05
Sr-90 4.2E-06 1.2E+07(1 ) 4.4E+03(2)
Tc-99 4.1E-07 6.1E+07 1.6E+04
1-129 5.5E-05 4.6E+05 6.5E+02
Cs-137 5.1 E-05 9.8E+0511 ) 4.4E+02(2)
U-238 5.8E-06 4.3E+06 2.9E+03
Pu-239 7.9E-05 3.2E+05 1.3E+04
NOTE: (1) Revised deterministic DCGLw values calculated using revised parameters described in the response to RAI5C12.
(2) With 30-year decay period.
Table 5C6-2. Key Radionuclide Analysis Results for Lagoon 3 Area
Onsite DCGL Deterministic DCGL
Radionuclide Offsite Receptor Dose (pCi/g Onsite for 25 from Cistern(mrem/yr for 1 pCi/g) mrem/y to Offsite Scenario (pCi/g)( 1 )
Receptor)
C-14 3.9E-06 6.4E+06 5.6E+05
Sr-90 5.5E-06 9.2E+06(11 4.4E+03(2)
Tc-99 5.3E-07 4.7E+07 1.6E+04
1-129 7.2E-05 3.5E+05 6.5E+02
Cs-1 37 6.7E-05 7.4E+05") 4.4E+0212)
U-238 7.6E-06 3.3E+06 2.9E+03
Pu-239 1.0E-04 2.4E+05 1.3E+04
NOTE: (1) Revised deterministic DCGLw values calculated using revised parameters described in the response to RAI5C12.
(2) With 30-year decay period.
This analysis produced DCGLs that show the concentrations of each of the 18 radionuclides ofinterest necessary to produce 25 mrem per year to an offsite receptor. The DCGLs for this
scenario were are least one order of magnitude higher than the DCGLs for subsurface soil
developed using the base case resident farmer cistern drilling scenario.'
This analysis demonstrates that there is a reasonable expectation that the potential dose to an
offsite receptor from erosion of radioactivity from the bottom of the deep WMA 2 excavation would
be insignificant, even if residual radioactivity concentrations were to approach the DCGLs, which
would be a very unlikely circumstance based on available soil data from the unweathered Laverytill. The calculation package for this analysis and the associated electronic files will be providedwith the September 2009 RAI responses.
Conclusions
The following conclusions can be drawn from the results of the onsite and offsite dose analyses:
11/6/09 10
UPDATED DOE RESPONSES TO WVDP PHASE 1 DECOMMISSIONING PLAN RAls
Table 5C6-1. Key Radionuclide Analysis Results for Lagoon 1 Area
Onsite DCGL Deterministic DCGL
Radionuclide Offsite Receptor Dose (pCi/g Onsite for 25
from Cistern (mrem/y for 1 pCi/g) mrem/y to Offsite Scenario (pCi/g)(1)
Receptor)
C-14 3.0E-06 8.4E+06 5.6E+05
Sr-90 4.2E-06 1.2E+07(1) 4.4E+03(2)
Tc-99 4.1 E-07 6.1E+07 1.6E+04
1-129 5.5E-05 4.6E+05 6.5E+02
Cs-137 5.1 E-05 9.8E+05(1) 4.4E+02(2)
U-238 5.8E-06 4.3E+06 2.9E+03
Pu-239 7.9E-05 3.2E+05 1.3E+04
NOTE: (1) Revised deterministic DCGLw values calculated using revised parameters described In, the response to RAI 5C12.
(2) With 3D-year decay period.
Table 5C6-2. Key Radionuclide Analysis Results for Lagoon 3 Area
Onsite DCGL Deterministic DCGL
Radionuclide Offsite Receptor Dose (pCi/g Onsite for 25
from Cistern (mrem/yr for 1 pCi/g) mrem/y to Offsite Scenario (pCi/g)(1)
Receptor)
C-14 3.9E-06 6.4E+06 5.6E+05
Sr-90 5.5E-06 9.2E+06(1) 4.4E+03(2)
Tc-99 5.3E-07 4.7E+07 1.6E+04
1-129 7.2E-05 3.5E+05 6.5E+02
Cs-137 6.7E-05 7.4E+05(1) 4.4E+02(2)
U-238 7.6E-06 3.3E+06 2.9E+03
Pu-239 1.0E-04 2.4E+05 1.3E+04
NOTE: (1) Revised deterministic DCGLw values calculated using revised parameters described in the response to RAI 5C12.
(2) With 3D-year decay period.
This analysis produced DCGLs that show the concentrations of each of the 18 radionuclides of interest necessary to produce 25 mrem per year to an offsite receptor. The DCGLs for this scenario were are least one order of magnitude higher than the DCGLs for subsurface soil developed using the base case resident farmer cistern drilling scenario ..
This analysis demonstrates that there is a reasonable expectation that the potential dose to an
offsite receptor from erosion of radioactivity from the bottom of the deep WMA 2 excavation would
be insignificant, even if residual radioactivity concentrations were to approach the DCGLs, which
would be a very unlikely circumstance based on available soil data from the unweathered Lavery till. The calculation package for this analysis and the associated electronic files will be provided with the September 2009 RAI responses.
Conclusions
The following conclusions can be drawn from the results of the onsite and offsite dose analyses:
11/6/09 10
•
•
•

UPDATED DOE RESPONSES TO WVDP PHASE 1 DECOMMISSIONING PLAN RAIS
" The subsurface soil DCGLs are protective for onsite receptors, that is, the cistern
scenario used to develop the DCGLs is more limiting that the alternate recreationist-hiker
scenario analyzed; and
" The subsurface soil DCGLs are also protective for offsite receptors, that is, the cistern
scenario used to develop the DCGLs is more limiting that the alternate scenario for an
offsite Cattaraugus Creek receptor that was analyzed.
Based on these conclusions, DOE considers that there is a reasonable expectation that
remediation of the WMA 2 excavation as planned will ensure that doses to both onsite and offsite
receptors will be well below the 25 mrem per year dose limit.
Changes to the Plan:
Change note (2) to Table 5-5 to read as follows:
This assumption is conservative because it results in no depletion of the source through erosion. The conservativenature of the assumption can be demonstrated by assuming that erosion takes place and evaluating potentialdoses to a receptor located in a gully where radioactivity has been exposed by erosion. As explained in thediscussion of alternate conceptual models below, the receptor in the area of the gully would receive less dose onan annual basis than would the resident farmer due to factors such as spending less time in the contaminatedarea and receiving exposure through fewer pathways. Consideration of potential doses to an offsite receptor fromradioactivity displaced to the stream through erosion indicates that there is a reasonable expectation that offsitedoses would not be significant either
Add the following information to the subsection on page 5-28 labeled Other Possible Conceptual
Models for Subsurface Soil DCGL Development, coordinating this change with the changes to
this subsection identified in the responses to RAI 5C5 and RAI 5C8.
Another alternative scenario was evaluated to determine the potential impact of long-
term erosion in WMA 2. This analysis estimated the potential doses to an offsite receptorfrom radioactivity that could be released from the bottom of the remediated WMA 2
excavation due to formation of a gully that eventually cut through the bottom of the
backfilled excavation.
In this analysis, radioactivity in eroded soil from the bottom of the WMA 2 backfilled
excavation was assumed to be transported in surface water to a receptor located on
Cattaraugus Creek near the confluence with Buttermilk Creek who ingested both the water
and fish harvested from the water and used the water to irrigate a garden. Both the area of
Lagoon 1 and the area of Lagoon 3 were considered using conservative erosion rates. The
results showed that doses to this receptor would be insignificant compared to the onsite
receptor doses estimated in the base case model.
Reference:
Beyeler, et al. 1999, Residual Radioactivity from Decommissioning, Parameter Analysis,
NUREG/CR-5512, Vol 3, Draft Report for Comment. Beyeler, W. E., W. A.
Hareland, F. A. Duran, T. J. Brown, E. Kalinina, D. P. Gallegos, and P. A. Davis,
Sandia National Laboratories, Albuquerque, New Mexico, October 1999.
11/6/09 11
•
•
•
UPDATED DOE RESPONSES TO WVDP PHASE 1 DECOMMISSIONING PLAN RAls
• The subsurface soil DCGLs are protective for onsite receptors, that is, the cistern
scenario used to develop the DCGLs is more limiting that the alternate recreationist-hiker
scenario analyzed; and
• The subsurface soil DCGLs are also protective for offsite receptors, that is, the cistern
scenario used to develop the DCGLs is more limiting that the alternate scenario for an
offsite Cattaraugus Creek receptor that was analyzed .
Based on these conclusions, DOE considers that there is a reasonable expectation that
remediation of the WMA 2 excavation as planned will ensure that doses to both onsite and offsite
receptors will be well below the 25 mrem per year dose limit.
Changes to the Plan:
Change note (2) to Table 5-5 to read as follows:
This assumption is conservative because it results in no depletion of the source through erosion . The conservative nature of the assumption can be demonstrated by assuming that erOSion takes place and evaluating potential doses to a receptor located 10 a gully where radioactivity has been exposed by erosion . As explained in the diSCUSSion of alternate conceptual models below, the receptor in the area of the gully would receive less dose on an annual basis than would the resident farmer due to factors such as spending less time in the contaminated area and receiving exposure through fewer pathways. Consideration of potential doses to an offsite receptor from radioactivity displaced to the stream through erosion indicates that there is a reasonable expectation that offsite doses would not be significant either.
Add the following information to the subsection on page 5-28 labeled Other Possible Conceptual
Models for Subsurface Soil DCGL Development, coordinating this change with the changes to
this subsection identified in the responses to RAI 5C5 and RAI 5C8.
Another alternative scenario was evaluated to determine the potential impact of long
term erosion in WMA 2. This analysis estimated the potential doses to an offsite receptor from radioactivity that could be released from the bottom of the remediated WMA 2
excavation due to formation of a gully that eventually cut through the bottom of the
backfilled excavation.
In this analysis, radioactivity in eroded soil from the bottom of the WMA 2 backfilled
excavation was assumed to be transported in surface water to a receptor located on
Cattaraugus Creek near the confluence with Buttermilk Creek who ingested both the water
and fish harvested from the water and used the water to irrigate a garden. Both the area of
Lagoon 1 and the area of Lagoon 3 were considered using conservative erosion rates. The
results showed that doses to this receptor would be insignificant compared to the onsite
receptor doses estimated in the base case model.
Reference:
11/6/09
Beyeler, et al. 1999, Residual Radioactivity from Decommissioning, Parameter Analysis, NUREG/CR-5512, Vol 3, Draft Report for Comment. Beyeler, W. E., W. A. Hareland, F. A. Duran, T. J. Brown, E. Kalinina, D. P. Gallegos, and P. A. Davis,
Sandia National Laboratories, Albuquerque, New Mexico, October 1999.
11
UPDATED DOE RESPONSES TO WVDP PHASE I DECOMMISSIONING PLAN RAIs
RAI 5C7 (12)
Subject: Show cistern scenario bounding
RAI: The approach to developing subsurface DCGLs may not be limiting for all types ofcontamination sources found and scenarios expected at the WVDP. Two aspects should be more
fully assessed: 1) the potential for groundwater contamination by buried sources; and 2) erosion
of cover material thereby converting a subsurface source into a surface source and making anexcavation scenario applicable. (Section 5.2.1, Page 5-26):
Basis: The approach of using a scenario where a cistern well is installed and a resident is
exposed to the contaminated cuttings may be limiting for some types and distributions ofcontamination, but may not be limiting for certain sources. For example, the old sewage plant
drainage was significantly contaminated and covered with three feet of soil. While the old sewageplant drainage is not considered part of the scope of Phase 1 (see Figure 1-5), if contamination is
located in a thin lens but in a hydrologically active or previously hydrologically active area to be
remediated as part of Phase 1, the dilution and partitioning with soil afforded in the cisterndisruption scenario may be larger and result in higher DCGLs than would be developed from
exposure to contaminated groundwater or an excavation scenario that would become applicable
if the cover was eroded.
Path Forward: Provide the technical basis that the approach to developing subsurface DCGLs is
limiting when groundwater transport and erosion processes are considered. Part of the technical
basis could be assurance that the subsurface DCGLs will exclusively be used to guideremediation of excavated areas in WMA 1 and 2, adequate characterization will be conducted to
ensure any unremediated areas are not impacted, and that erosion is not expected to uncover
residual WMA 1 and 2 contamination following remediation over the 1000 year compliance
period. If erosion could lead to applicability of an excavation scenario within the 1000 yearcompliance period (i.e., if erosion could lead to depletion of the cover materials to a thickness of 3
m or less), then an excavation scenario should also be evaluated. Erosion processes may belimited to those that result in landform evolution consistent with the expected future land use
scenario.
DOE Response: Additional evaluation has confirmed that the approach used to develop
subsurface soil DCGLs is limiting insofar as erosion processes are concerned. However,additional groundwater modeling using the STOMP code has shown that diffusion of radioactivityfrom the bottom of the deep excavations must be taken into account in establishing the
subsurface soil DCGLs and cleanup goals.
The updated response to RAI 5C9 describes the additional modeling and the reduced DCGLs
and cleanup goals that take the results of this analysis into account. This updated responseincluded a new DP subsection 5.2.6 that describes the modified conceptual model used, the
mathematical models used, and the results of the analysis.
The updated response to RAI 5C15 includes revised tables for section 5 of the DP such as Table
5-14 that specifies the cleanup goals to be used in soil and sediment remediation associated with
Phase 1 of the decommissioning.
11/6/09 12
UPDATED DOE RESPONSES TO WVDP PHASE 1 DECOMMISSIONING PLAN RAls
RAIse7
Subject: Show cistern scenario bounding
RAI: The approach to developing subsurface DCGLs may not be limiting for all types of contamination sources found and scenarios expected at the WVDP. Two aspects should be more
fully assessed: 1) the potential for groundwater contamination by buried sources; and 2) erosion of cover material thereby converting a subsurface source into a surface source and making an excavation scenario applicable. (Section 5.2.1, Page 5-26):
Basis: The approach of using a scenario where a cistern well is installed and a resident is exposed to the contaminated cuttings may be limiting for some types and distributions of contamination, but may not be limiting for certain sources. For example, the old sewage plant drainage was significantly contaminated and covered with three feet of soil. While the old sewage plant drainage is not considered part of the scope of Phase 1 (see Figure 1-5), if contamination is located in a thin lens but in a hydrologically active or previously hydrologically active area to be remediated as part of Phase 1, the dilution and partitioning with soil afforded in the cistern disruption scenario may be larger and result in higher DCGLs than would be developed from exposure to contaminated groundwater or an excavation scenario that would become applicable if the cover was eroded.
Path Forward: Provide the technical basis that the approach to developing subsurface DCGLs is limiting when groundwater transport and erosion processes are considered. Part of the technical basis could be assurance that the subsurface DCGLs will exclusively be used to guide remediation of excavated areas in WMA 1 and 2, adequate characterization will be conducted to ensure any unremediated areas are not impacted, and that erosion is not expected to uncover residual WMA 1 and 2 contamination following remediation over the 1000 year compliance period. If erosion could lead to applicability of an excavation scenario within the 1000 year compliance period (i.e., if erosion could lead to depletion of the cover materials to a thickness of 3
m or less), then an excavation scenario should also be evaluated. Erosion processes may be limited to those that result in landform evolution consistent with the expected future land use scenario.
*******************
DOE Response: Additional evaluation has confirmed that the approach used to develop subsurface soil DCGLs is limiting insofar as erosion processes are concerned . However, additional groundwater modeling using the STOMP code has shown that diffusion of radioactivity from the bottom of the deep excavations must be taken into account in establishing the subsurface soil DCGLs and cleanup goals.
The updated response to RAI 5C9 describes the additional modeling and the reduced DCGLs and cleanup goals that take the results of this analysis into account. This updated response included a new DP subsection 5.2.6 that describes the modified conceptual model used, the mathematical models used, and the results of the analysis.
The updated response to RAI 5C15 includes revised tables for section 5 of the DP such as Table
5-14 that specifies the cleanup goals to be used in soil and sediment remediation associated with Phase 1 of the decommissioning.
11/6/09 12
•
•
•

UPDATED DOE RESPONSES TO WVDP PHASE 1 DECOMMISSIONING PLAN RAIS
Limitations on Applicability of Subsurface Soil DCGLs
The subsurface soil DCGLs (that is, the cleanup goals of Table 5-14) apply only to the bottoms
and lower sides of the two large excavations to be dug to remove facilities in WMA 1 and WMA 2,as indicated on page 5-4 and in other places in the DP. They will not be used in connection with
remediation of any other areas. Changes will be made to the DP to reinforce this point for the
sake of clarity.
Potential for Groundwater Contamination by Upgradient Sources
The radiological status of groundwater on the project premises is discussed in Section 4.2.8 ofthe DP. Figure 4-12 shows routinely monitored groundwater monitoring locations and indicatesthat the three locations just west of WMA 1 show no radiological constituents in excess of
background. These results indicate a low potential for contamination of the remediated WMA 1
excavation from upgradient sources.
The response to RAI 7C1 explains that the conceptual schedule in Figure 7-15 is being changed
to provide for installation of the WMA 1 hydraulic barrier before starting the WMA 2 excavation.
This sequence will reduce groundwater infiltration in the WMA 2 excavation and prevent
contamination from WMA 1 being transported by groundwater into the WMA 2 excavation.
Consideration has also been given to the potential for buried contamination in the old sewage
treatment plant drainage impacting either the WMA 1 or WMA 2 excavated areas. The amount of
buried contamination in this area is expected to be small based on information provided in
Section 2.3.2 of the DP, and since this area is not hydraulically upgradient of WMA 1 or WMA 2,
the potential for any impact on those areas by groundwater transport is low.
In summary, available data suggest that there is no significant potential for groundwater
contamination from upgradient sources impacting either WMA 1 or WMA 2.
Characterization
The characterization program to be defined in the Characterization Sample and Analysis Plan,
coupled with the Phase 1 final status surveys, will verify that unremediated areas are notimpacted. The response to RAI 7C1 describes mitigative measures to be taken to minimize
potential impacts of contaminated excavated soil on areas that will not undergo remediation
during the Phase 1 decommissioning activities.
As explained in the response to RAI 9C1, DOE will solicit NRC input on the CharacterizationSample and Analysis Plan objectives and provide the final draft plan to NRC for review.
Potential Erosion Impacts and Excavation Scenario
As explained in the response to RAI 5C4, the predicted sheet and rill erosion rate for the central
portion of the north plateau where WMA 1 is located is small, so the excavation scenario
associated with constructing a basement for a home in that area would not be applicable.However, unchecked long-term erosion could lead to deep gullies in the area of Lagoons 1, 2,
and 3 that could possibly reach the bottom of the backfilled deep excavation. Growing crops orbuilding a home in an area with such gullies would not be plausible. Consequently, the excavation
scenario associated with constructing a basement for a home in that area would not be realistic.
The recreationist-hiker exposure scenario discussed in connection with RAI 5C4 would be much
more plausible. The response to RAI 5C6 provides the results of an analysis of this scenario.
11/6/09 13
•
•
•
UPDATED DOE RESPONSES TO WVDP PHASE 1 DECOMMISSIONING PLAN RAls
Limitations on Applicability of Subsurface Soil DCGLs
The subsurface soil DCGLs (that is, the cleanup goals of Table 5-14) apply only to the bottoms and lower sides of the two large excavations to be dug to remove facilities in WMA 1 and WMA 2, as indicated on page 5-4 and in other places in the DP. They will not be used in connection with remediation of any other areas. Changes will be made to the DP to reinforce this point for the sake of clarity.
Potential for Groundwater Contamination by Upgradient Sources
The radiological status of groundwater on the project premises is discussed in Section 4.2.8 of the DP. Figure 4-12 shows routinely monitored groundwater monitoring locations and indicates that the three locations just west of WMA 1 show no radiological constituents in excess of background. These results indicate a low potential for contamination of the remediated WMA 1 excavation from upgradient sources.
The response to RAI 7C1 explains that the conceptual schedule in Figure 7-15 is being changed to provide for installation of the WMA 1 hydraulic barrier before starting the WMA 2 excavation. This sequence will reduce groundwater infiltration in the WMA 2 excavation and prevent contamination from WMA 1 being transported by groundwater into the WMA 2 excavation.
Consideration has also been given to the potential for buried contamination in the old sewage treatment plant drainage impacting either the WMA 1 or WMA 2 excavated areas. The amount of buried contamination in this area is expected to be small based on information provided in Section 2.3.2 of the DP, and since this area is not hydraulically upgradient of WMA 1 or WMA 2, the potential for any impact on those areas by groundwater transport is low.
In summary, available data suggest that there is no significant potential for groundwater contamination from upgradient sources impacting either WMA 1 or WMA 2.
Characterization
The characterization program to be defined in the Characterization Sample and Analysis Plan,
coupled with the Phase 1 final status surveys, will verify that unremediated areas are not impacted. The response to RAI 7C1 describes mitigative measures to be taken to minimize potential impacts of contaminated excavated soil on areas that will not undergo remediation during the Phase 1 decommissioning activities.
As explained in the response to RAI 9C1, DOE will solicit NRC input on the Characterization Sample and Analysis Plan objectives and provide the final draft plan to NRC for review.
Potential Erosion Impacts and Excavation Scenario
As explained in the response to RAI 5C4, the predicted sheet and rill erosion rate for the central portion of the north plateau where WMA 1 is located is small, so the excavation scenario associated with constructing a basement for a home in that area would not be applicable. However, unchecked long-term erosion could lead to deep gullies in the area of Lagoons 1, 2, and 3 that could possibly reach the bottom of the backfilled deep excavation. Growing crops or building a home in an area with such gullies would not be plausible. Consequently, the excavation scenario associated with constructing a basement for a home in that area would not be realistic. The recreationist-hiker exposure scenario discussed in connection with RAI 5C4 would be much more plausible. The response to RAI 5C6 provides the results of an analysis of this scenario.
11/6/09 13

UPDATED DOE RESPONSES TO WVDP PHASE 1 DECOMMISSIONING PLAN RAIs
Changes to the Plan:
More information about the limitations of the subsurface soil DCGLs is being added to the plan as
follows:
On page ES-18, add the following footnote to Table ES-2, with the footnote tagged to the
Subsurface Soil heading:
(3) The subsurface soil cleanup goals apply only to the bottom of the large WMA 1 and WMA 2 excavations and tothe sides of these excavation three feet or more below the surface.
On page 5-49, add the same footnote to Table 5-14. In this case, the footnote will be number (5).
Make the following additional change on page 5-49:
Basis for Cleanup Goals for Subsurface Soil
DOE has established the subsurface soil cleanup goals at 50 percent of subsurface soilDCGLs calculated in the limited site-wide dose assessments for 22.5 mrem per year (Table
5-12). The cleanup goals for subsurface soil would therefore equate to 11.25 mrem per
year. DOE is taking this approach to provide additional assurance that remediation of theWMA 1 and WMA 2 excavated areas would support all potential options for Phase 2 of the
proposed decommissioning. As indicated previously, these cleanup goals apply only to the
bottom of the large WMA 1 and WMA 2 excavations and to the sides of these excavations
three feet or more below the surface.
11/6/09 14
UPDATED DOE RESPONSES TO WVDP PHASE 1 DECOMMISSIONING PLAN RAls
Changes to the Plan:
More information about the limitations of the subsurface soil DCGLs is being added to the plan as follows:
On page ES-18, add the following footnote to Table ES-2, with the footnote tagged to the Subsurface Soil heading:
(3) The subsurface soli cleanup goals apply only to the bottom of the large WMA 1 and WMA 2 excavations and to the sides of these excavation three feet or more below the surface.
On page 5-49, add the same footnote to Table 5-14 . In th is case, the footnote will be number (5).
Make the following additional change on page 5-49:
11/6/09
Basis for Cleanup Goals for Subsurface Soil
DOE has established the subsurface soil cleanup goals at 50 percent of subsurface soil DCGLs calculated in the limited site-wide dose assessments for 22 .5 mrem per year (Table 5-12). The cleanup goals for subsurface soil would therefore equate to 11.25 mrem per year. DOE is taking this approach to provide additional assurance that remediation of the WMA 1 and WMA 2 excavated areas would support all potential options for Phase 2 of the proposed decommissioning. As ind icated previously, these cleanup goals apply only to the bottom of the large WMA 1 and WMA 2 excavations and to the sides of these excavations three feet or more below the surface.
14
•
•
•

UPDATED DOE RESPONSES TO WVDP PHASE I DECOMMISSIONING PLAN RAIS
RAI 5C9 (14)
Subject: Consideration of subsurface contamination
RAI: DOE has not provided sufficient information to justify lack of consideration of subsurfacecontamination at the bottom of WMA 1 and 2 excavations when deriving subsurface soilDCGLs. Additional data collected on the extent of Lavery Till contamination as remediation
proceeds may show greater extent of contamination than originally assumed, additionaltransport pathways not considered in the subsurface DCGL calculations (e.g., contamination of
Lavery Till Sand or along H-piles in the Lavery Till), or greater accessibility of contamination at
depth than what is expected. (Section 5.2.1, Page 5-23)
Basis: DOE presented several qualitative arguments (page 5-41) to justify lack of consideration
of subsurface contamination at depth after contaminated subsurface soils are excavated from
WMA 1 and 2. While some of the qualitative arguments regarding the relative inaccessibility ofcontamination in the Lavery Till to a potential receptor are compelling, additional data and
calculations are needed to fully support the arguments presented. Because only one scenario is
evaluated in deriving subsurface DCGLs (i.e., construction of a cistern), this scenario must be
demonstrably conservative when considering other scenarios that may be just as, or more, likely.The amount of contamination assumed to be brought to the surface from construction of a cistern
is relatively small and dilute' and may not be limiting for those radionuclides where water-
dependent pathways may dominate the dose (e.g., existing contamination present in thesaturated zone may be drawn from a well leading to water-dependent exposure pathways).
Additional information may be needed to support the hydrogeological conceptual model for
contamination assumed to be present underneath WMA 1 and 2 used to derive subsurfaceDCGLs. Previous geologic interpretations showed contamination of a significant portion of the
Lavery Till and Lavery Till Sand underneath the Main Plant Process building that could lead topathways of exposure not considered in the current analysis. DOE should indicate how it plans
to manage the risk associated with significantly greater contamination levels at depth along H-
piles or within the Lavery Till then were assumed in the DCGL calculations.
Additional calculations or modeling should be performed to sup~port the assumption regarding the
expected lower relative risk of residual contamination at depth versus the risk associated withcontamination assumed to be brought to the surface due to a cistern drilling scenario. This wouldinclude a quantitative evaluation of the potential for Lavery Till contamination to be transported to
the Kent Recessional Sequence (KRS). DOE should present information on the relative risk of the
cistern versus a ground/surface water transport scenario. DOE should also quantitatively evaluatethe impact of pumping and the presence of hydraulic barriers on the potential migration of
contamination from the top of the Lavery Till to a well located in the sand and gravel unit andpresent the relative risks associated with a cistern versus groundwater well scenario.
DOE should clarify how the residual risk from contaminated soil located just below 1 m (e.g., on
the sides of the excavations) is appropriately accounted for when comparing residual
concentrations to subsurface DCGLs which assume the contamination is mixed with clean soil ata ratio of one to ten (i.e., dilution factor of ten). DOE indicates in a footnote on page 5-4 that
contamination on the sides of the excavation up- and cross-gradient from the source area is not
1 Only one tenth of the soil column is assumed to be contaminated resulting from assumptions regarding the
thickness of contamination in the Lavery Till at the bottom of the excavation and the amount of clean soilused to back-fill the excavation.
11/6/09 15
•
•
•
UPDATED DOE RESPONSES TO WVDP PHASE 1 DECOMMISSIONING PLAN RAls
RAI5C9 (14)
Subject: Consideration of subsurface contamination
RAI: DOE has not provided sufficient information to justify lack of consideration of subsurface contamination at the bottom of WMA 1 and 2 excavations when deriving subsurface soil DCGLs. Additional data collected on the extent of Lavery Till contamination as remediation proceeds may show greater extent of contamination than originally assumed, additional transport pathways not considered in the subsurface DCGL calculations (e.g., contamination of
Lavery Till Sand or along H-piles in the Lavery Till), or greater accessibility of contamination at depth than what is expected. (Section 5.2.1, Page 5-23)
Basis: DOE presented several qualitative arguments (page 5-41) to justify lack of consideration of subsurface contamination at depth after contaminated subsurface soils are excavated from WMA 1 and 2. While some of the qualitative arguments regarding the relative inaccessibility of contamination in the Lavery Till to a potential receptor are compelling, additional data and calculations are needed to fully support the arguments presented. Because only one scenario is evaluated in deriving subsurface DCGLs (i.e., construction of a cistern), this scenario must be demonstrably conservative when considering other scenarios that may be just as, or more, likely. The amount of contamination assumed to be brought to the surface from construction of a cistern is relatively small and dilute 1 and may not be limiting for those radionuclides where waterdependent pathways may dominate the dose (e.g., existing contamination present in the saturated zone may be drawn from a well leading to water-dependent exposure pathways).
Additional information may be needed to support the hydrogeological conceptual model for contamination assumed to be present underneath WMA 1 and 2 used to derive subsurface DCGLs. Previous geologic interpretations showed contamination of a significant portion of the Lavery Till and Lavery Till Sand underneath the Main Plant Process building that could lead to pathways of exposure not considered in the current analysis. DOE should indicate how it plans to manage the risk associated with significantly greater contamination levels at depth along Hpiles or within the Lavery Till then were assumed in the DCGL calculations.
Additional calculations or modeling should be performed to support the assumption regarding the expected lower relative risk of residual contamination at depth versus the risk associated with contamination assumed to be brought to the surface due to a cistern drilling scenario. This would include a quantitative evaluation of the potential for Lavery Till contamination to be transported to
the Kent Recessional Sequence (KRS). DOE should present information on the relative risk of the cistern versus a ground/surface water transport scenario. DOE should also quantitatively evaluate the impact of pumping and the presence of hydraulic barriers on the potential migration of contamination from the top of the Lavery Till to a well located in the sand and gravel unit and present the relative risks associated with a cistern versus groundwater well scenario.
DOE should clarify how the residual risk from contaminated soil located just below 1 m (e.g., on the sides of the excavations) is appropriately accounted for when comparing residual
concentrations to subsurface DCGLs which assume the contamination is mixed with clean soil at a ratio of one to ten (i.e., dilution factor of ten). DOE indicates in a footnote on page 5-4 that contamination on the sides of the excavation up- and cross-gradient from the source area is not
1 Only one tenth of the soil column is assumed to be contaminated resulting from assumptions regarding the thickness of contamination in the Lavery Till at the bottom of the excavation and the amount of clean soil used to back-fill the excavation.
11/6/09 15

UPDATED DOE RESPONSES TO WVDP PHASE 1 DECOMMISSIONING PLAN RAIs
expected to be contaminated. This expectation should be confirmed in the field or enough data
collected to evaluate the impact of contamination at intermediate depths on the dose calculations.
Path Forward: DOE could provide additional information such as borehole logs for those
locations where the top of the Lavery Till was significantly lowered and the Lavery Till Sand
eliminated underneath the process building in the vicinity of the source of the North Plateau
groundwater plume. Additional cross-sections overlaying recent concentration data over
reinterpreted geology underneath the process building would also provide additional confidencein the revised hydrogeological conceptual model.
DOE should provide additional details on how in-process or final status survey data will be
collected at the bottom of excavations. A procedure should be in place to provide adequate
assurance that the thickness of contamination at depth is less than assumed in the DCGLcalculations and is present within the impermeable Lavery Till as assumed in the DCGL
calculations. If the thickness of contamination is significantly greater than assumed and/or ispresent in more permeable sediments (e.g., Lavery Till Sand), then sufficient data should be
collected to perform additional dose modeling to adequately assess risk. If DOE amends the DP
to allow use of surrogate DCGLs to demonstrate compliance with LTR criteria at the bottom of the
WMA 1 and 2 excavations, DOE should provide supporting information such as radioisotopic
ratios within the Lavery Till used to derive the surrogate DCGLs. DOE should also indicate how it
intends to update surrogate DCGLs based on collection of additional data obtained during in-
process or final status surveys, if necessary.
As discussed in a preceding comment, it is recommended that DOE provide results of
calculations or perform additional modeling (e.g., multi-dimensional groundwater modeling using
STOMP) to show the impacts of (i) a pumping well, and (ii) hydraulic barriers on the flow field inthe immediate vicinity of WMA 1 and 2 excavations and potential transport of contaminants from
the Lavery Till to a the drinking water well located in the sand and gravel. DOE should also
evaluate the potential risk associated with transport of contamination from the Lavery Till to the
KRS or to surface water. This information could be used to provide additional support that the
potential contributions from subsurface contamination to the overall risk from the site from other
pathways of exposure (i.e., drilling scenario) are insignificant.
DOE should explain how contamination present on excavation sides will be remediated to
ensure that unrestricted use criteria will be met.
DOE Response: DOE has given additional consideration to subsurface contamination at the
bottom of the WMA 1 and WMA 2 excavations from the standpoint of additional groundwatermodeling, available data on residual radioactivity in the area of these excavations, the potential
for transport of residual contamination to the KRS, the potential for transport of this contamination
to groundwater which is then used for drinking water and irrigation, and the potential for drawing
this contamination into the hypothetical well postulated in the base-case conceptual model for
development of subsurface soil DCGLs. These matters and related matters identified as issues of
interest in the NRC path forward are discussed below. Note that most of the subsurface soil
cleanup goals were reduced after taking into account the impacts of continuing releases of
residual radioactivity from the bottom of the deep excavations by diffusion.
11/6/09 16
UPDATED DOE RESPONSES TO WVDP PHASE 1 DECOMMISSIONING PLAN RAls
expected to be contaminated. This expectation should be confirmed in the field or enough data
collected to evaluate the impact of contamination at intermediate depths on the dose calculations.
Path Forward: DOE could provide additional information such as borehole logs for those locations where the top of the Lavery Till was significantly lowered and the Lavery Till Sand eliminated underneath the process building in the vicinity of the source of the North Plateau groundwater plume. Additional cross-sections overlaying recent concentration data over reinterpreted geology underneath the process building would also provide additional confidence in the revised hydrogeological conceptual model.
DOE should provide additional details on how in-process or final status survey data will be collected at the bottom of excavations. A procedure should be in place to provide adequate assurance that the thickness of contamination at depth is less than assumed in the DCGL calculations and is present within the impermeable Lavery Till as assumed in the DCGL calculations. If the thickness of contamination is significantly greater than assumed and/or is present in more permeable sediments (e.g., Lavery Till Sand), then sufficient data should be collected to perform additional dose modeling to adequately assess risk. If DOE amends the DP to allow use of surrogate DCGLs to demonstrate compliance with L TR criteria at the bottom of the WMA 1 and 2 excavations, DOE should provide supporting information such as radioisotopic ratios within the Lavery Till used to derive the surrogate DCGLs. DOE should also indicate how it intends to update surrogate DCGLs based on collection of additional data obtained during inprocess or final status surveys, if necessary.
As discussed in a preceding comment, it is recommended that DOE provide results of calculations or perform additional modeling (e.g., mUlti-dimensional groundwater modeling using STOMP) to show the impacts of (i) a pumping well, and (ii) hydraulic barriers on the flow field in the immediate vicinity of WMA 1 and 2 excavations and potential transport of contaminants from the Lavery Till to a the drinking water well located in the sand and gravel. DOE should also evaluate the potential risk associated with transport of contamination from the Lavery Till to the KRS or to surface water. This information could be used to provide additional support that the potential contributions from subsurface contamination to the overall risk from the site from other pathways of exposure (i.e., drilling scenario) are insignificant.
DOE should explain how contamination present on excavation sides will be remediated to
ensure that unrestricted use criteria will be met.
*******************
DOE Response: DOE has given additional consideration to subsurface contamination at the bottom of the WMA 1 and WMA 2 excavations from the standpoint of additional groundwater modeling, available data on residual radioactivity in the area of these excavations, the potential for transport of residual contamination to the KRS, the potential for transport of this contamination to groundwater which is then used for drinking water and irrigation, and the potential for drawing this contamination into the hypothetical well postulated in the base-case conceptual model for development of subsurface soil DCGLs. These matters and related matters identified as issues of interest in the NRC path forward are discussed below. Note that most of the subsurface soil
cleanup goals were reduced after taking into account the impacts of continuing releases of residual radioactivity from the bottom of the deep excavations by diffusion.
11/6/09 16
•
•
•

UPDATED DOE RESPONSES TO WVDP PHASE 1 DECOMMISSIONING PLAN RAIs
Process Building Area Geology
The Lavery till sand is not located beneath the Process Building nor within the north plateau
groundwater plume and previous interpretations of the extent of this unit have not suggested itslocation beneath the Process Building. Re-examination of borehole logs from the north plateau in
2007 resulted in a re-evaluation of the areal extent of the Lavery till sand. Copies of the borehole
logs that were used to revise the extent of the Lavery till sand are attached. Table 5C9-1 (which
appears at the end of the text) summarizes the revisions to the geologic interpretation of the
boring logs used to delineate the extent of the Lavery till sand as described in Figure 3-64 of the
DP.
From 1991 to 2007 the Lavery till sand was inferred to be present to the west, south, andsoutheast of the Process Building in a location that was hydraulically upgradient and cross-
gradient to the north plateau groundwater plume (Figure 5C9-1). Earlier interpretations of the
borehole logs considered a prominent clay-rich geologic horizon up to several feet in thickness aspart of the unweathered Lavery till and the underlying sandy unit as the Lavery till sand.
Following the completion of the 1993 soil boring program to support the RCRA Facility
Investigation, evaluation of the 1993 borehole data indicated that the sand and gravel unit wascomposed of two distinct subunits, the thick-bedded unit and the underlying slack water sequence
which are separated by the prominent clay-rich geologic horizon mentioned earlier.
In 2007 it was noted that the elevation of the original Lavery till sand west and southwest of the
Process Building was much shallower in elevation that the Lavery till sand to the southeast of the
Process Building. It was determined that this western and southwestern portion was more
consistent with the elevation of the slack water sequence of the sand and gravel unit and it wasreclassified as part of the slack water sequence. As a result the areal extent of the Lavery till sand
was substantially reduced and it is now located southeast of the Process Building away from thenorth plateau groundwater plume as shown in Figure 3-64 of the DP, which is reproduced here as
Figure 5C9-2.
Soil samples have not been collected from the Lavery till sand. However, groundwater monitoringof Lavery till sand wells WNW0202, WNW0204, WNW0206, and WNW0208 does not suggest the
presence of radioactive contamination in this unit.
Radioactivity in Subsurface Soil in the Areas of the Deep Excavations
To place the information that follows into context, it is useful to review available characterization
data on radioactivity in subsurface soil in the areas of the deep excavations and planned
additional characterization of those areas.
Limited soil sampling data currently exists for the Lavery till at the bottom of the WMA 1 and WMA2 excavations as discussed in Section 4.2. Geoprobe® investigations in 1994, 1998, and 2008
collected soil samples from the upper several feet of the Lavery till at seven locations beneath theMain Plant Process Building and the results are summarized in Table C-4 of Appendix C. Low
levels of radioactivity were detected in these samples with a maximum Sr-90 concentration of 59
pCi/g. Deeper soil samples were not collected from the Lavery till during these investigations as
sampling was terminated shortly after reaching the Lavery till in accordance with the sampling
and analysis plan for this project.
It is not known whether the radioactivity in the shallow Lavery till soil samples is an artifact of the
Geoprobe® sampling method or the result of migration from contaminated groundwater from the
11/6/09 17
•
•
•
UPDATED DOE RESPONSES TO WVDP PHASE 1 DECOMMISSIONING PLAN RAls
Process Building Area Geology
The Lavery till sand is not located beneath the Process Building nor within the north plateau groundwater plume and previous interpretations of the extent of this unit have not suggested its location beneath the Process Building. Re-examination of borehole logs from the north plateau in
2007 resulted in a re-evaluation of the areal extent of the Lavery till sand. Copies of the borehole logs that were used to revise the extent of the Lavery till sand are attached. Table 5C9-1 (which appears at the end of the text) summarizes the revisions to the geologic interpretation of the boring logs used to delineate the extent of the Lavery till sand as described in Figure 3-64 of the DP.
From 1991 to 2007 the Lavery till sand was inferred to be present to the west, south, and southeast of the Process Building in a location that was hydraulically upgradient and crossgradient to the north plateau groundwater plume (Figure 5C9-1). Earlier interpretations of the borehole logs considered a prominent clay-rich geologic horizon up to several feet in thickness as part of the unweathered Lavery till and the underlying sandy unit as the Lavery till sand.
Following the completion of the 1993 soil boring program to support the RCRA Facility Investigation, evaluation of the 1993 borehole data indicated that the sand and gravel unit was composed of two distinct subunits, the thick-bedded unit and the underlying slack water sequence which are separated by the prominent clay-rich geologic horizon mentioned earlier.
In 2007 it was noted that the elevation of the original Lavery till sand west and southwest of the Process Building was much shallower in elevation that the Lavery till sand to the southeast of the Process Building. It was determined that this western and southwestern portion was more consistent with the elevation of the slack water sequence ofthe sand and gravel unit and it was reclassified as part of the slack water sequence. As a result the areal extent of the Lavery till sand was substantially reduced and it is now located southeast of the Process Building away from the north plateau groundwater plume as shown in Figure 3-64 of the DP, which is reproduced here as Figure 5C9-2.
Soil samples have not been collected from the Lavery till sand. However, groundwater monitoring of Lavery till sand wells WNW0202, WNW0204, WNW0206, and WNW0208 does not suggest the presence of radioactive contamination in this unit.
Radioactivity in S .. ubsurface Soil in the Areas of the Deep Excavations
To place the information that follows into context, it is useful to review available characterization data on radioactivity in subsurface soil in the areas of the deep excavations and planned additional characterization of those areas.
Limited soil sampling data currently exists for the Lavery till at the bottom of the WMA 1 and WMA 2 excavations as discussed in Section 4.2. Geoprobe® investigations in 1994, 1998, and 2008 collected soil samples from the upper several feet of the Lavery till at seven locations beneath the Main Plant Process Building and the results are summarized in Table C-4 of Appendix C. Low levels of radioactivity were detected in these samples with a maximum Sr-90 concentration of 59 pCi/g. Deeper soil samples were not collected from the Lavery till during these investigations as sampling was terminated shortly after reaching the Lavery till in accordance with the sampling and analysis plan for this project.
It is not known whether the radioactivity in the shallow Lavery till soil samples is an artifact of the Geoprobe® sampling method or the result of migration from contaminated groundwater from the
11/6/09 17

UPDATED DOE RESPONSES TO WVDP PHASE 1 DECOMMISSIONING PLAN RAIs
source area of the north plateau groundwater plume (Hemann and Steiner 1999). Less data are
available from WMA 2 as the only Lavery till sample was collected from borehole BH-5 in the
vicinity of WMA 1. A representative cross-section showing the geology and recent Sr-90
concentration data beneath the Process Building is presented in Figure 4-8 of the DP.
Additional subsurface soil data will be collected from the Lavery till in WMA 1 and WMA 2 during
the Phase 1 soil and sediment characterization program that will be defined in the
Characterization Sample and Analysis Plan. This characterization program will provide additional
information on the nature and extent of contamination within the project premises and guide the
final design of the large excavations in WMA 1 and WMA 2. If this characterization data indicates
that contamination at depth is greater than assumed in the subsurface soil DCGL calculations,
this factor will be taken into account in the preliminary dose assessments and in plans for
remediation of soil in the deep excavations.
In-Process and Phase 1 Final Status Surveys
Samples of Lavery till will also be collected from the bottom of the WMA 1 and WMA 2
excavations during the in-process surveys and final status surveys as described in the responses
to RAIs 9C3 and 9C4. In-process surveys will be performed when the WMA 1 and WMA 2
excavations reach a depth of approximately one foot (30 cm) into the Lavery till and will include
gamma scans and the collection of biased soil samples six inches (15 cm) in depth in the Lavery
till to evaluate whether the subsurface soil cleanup criteria have been met at the bottom of the
WMA 1 and WMA 2 excavations. Systematic composite samples from the Lavery till will also be
collected from the upper one meter of soil at the bottom of the WMA 1 and WMA 2 excavations
during the final status surveys to document that the subsurface soil cleanup criteria have been
achieved.
Risk Associated With Transport of Lavery Till Contamination to the KRS
The extent of contamination along the foundation pilings beneath the Main Plant Process Building
is currently unknown. As discussed in the response to RAI 4C2, as part of the in-process and final
status surveys subsurface soil samples will be collected around representative Process Building
foundation pilings located within the area impacted by the north plateau groundwater plume once
the Process Building and the sand and gravel overlying the Lavery till have been removed. These
samples will be taken in close proximity to the pilings several feet below the surface of the
unweathered Lavery till as specified in the Characterization Sample and Analysis Plan and the
Phase 1 Final Status Survey Plan to evaluate whether contamination has migrated downward
around the pilings towards the KRS. If contamination exceeding the subsurface soil cleanup
criteria is detected along the foundation pilings, additional soil will be removed until the soil
cleanup criteria is achieved.
Risk Associated With Transport of Residual Lavery Till Contamination to Surface Waters
The risk associated with transport of residual contamination from the Lavery till to surface waters
and to groundwater in the backfilled WMA 1 and WMA 2 excavations has been evaluated.
Erosion modeling indicates that erosion will not impact the residual contamination in the Lavery till
beneath WMA 1. The transport of residual contamination in the Lavery till from WMA 2 as a result
of unmitigated gully erosion via surface waters to a downstream receptor on Cattaraugus Creek
was evaluated and found to be less limiting than the resident farmer scenario as described in the
response to RAI 5C6.
11/6/09 18
UPDATED DOE RESPONSES TO WVDP PHASE 1 DECOMMISSIONING PLAN RAls
source area of the north plateau groundwater plume (Hemann and Steiner 1999). Less data are
available from WMA 2 as the only Lavery till sample was collected from borehole BH-5 in the vicinity of WMA 1. A representative cross-section showing the geology and recent Sr-90 concentration data beneath the Process Building is presented in Figure 4-8 of the DP.
Additional subsurface soil data will be collected from the Lavery till in WMA 1 and WMA 2 during the Phase 1 soil and sediment characterization program that will be defined in the
Characterization Sample and Analysis Plan. This characterization program will provide additional information on the nature and extent of contamination within the project premises and guide the
final design of the large excavations in WMA 1 and WMA 2. If this characterization data indicates that contamination at depth is greater than assumed in the subsurface soil DCGL calculations, this factor will be taken into account in the preliminary dose assessments and in plans for
remediation of soil in the deep excavations.
In-Process and Phase 1 Final Status Surveys
Samples of Lavery till will also be collected from the bottom of the WMA 1 and WMA 2 excavations during the in-process surveys and final status surveys as described in the responses
to RAls 9C3 and 9C4. In-process surveys will be performed when the WMA 1 and WMA 2 excavations reach a depth of approximately one foot (30 cm) into the Lavery till and will include
gamma scans and the collection of biased soil samples six inches (15 cm) in depth in the Lavery till to evaluate whether the subsurface soil cleanup criteria have been met at the bottom of the WMA 1 and WMA 2 excavations. Systematic composite samples from the Lavery till will also be
collected from the upper one meter of soil at the bottom of the WMA 1 and WMA 2 excavations during the final status surveys to document that the subsurface soil cleanup criteria have been achieved.
Risk Associated With Transport of Lavery Till Contamination to the KRS
The extent of contamination along the foundation pilings beneath the Main Plant Process Building is currently unknown. As discussed in the response to RAI 4C2, as part of the in-process and final
status surveys subsurface soil samples will be collected around representative Process Building foundation pilings located within the area impacted by the north plateau groundwater plume once
the Process Building and the sand and gravel overlying the Lavery till have been removed. These samples will be taken in close proximity to the pilings several feet below the surface of the
unweathered Lavery till as specified in the Characterization Sample and Analysis Plan and the Phase 1 Final Status Survey Plan to evaluate whether contamination has migrated downward around the pilings towards the KRS. If contamination exceeding the subsurface soil cleanup
criteria is detected along the foundation pilings, additional soil will be removed until the soil cleanup criteria is achieved.
Risk Associated With Transport of Residual Lavery Till Contamination to Surface Waters
The risk associated with transport of residual contamination from the Lavery till to surface waters and to groundwater in the backfilled WMA 1 and WMA 2 excavations has been evaluated. Erosion modeling indicates that erosion will not impact the residual contamination in the Lavery till
beneath WMA 1. The transport of residual contamination in the Lavery till from WMA 2 as a result of unmitigated gully erosion via surface waters to a downstream receptor on Cattaraugus Creek was evaluated and found to be less limiting than the resident farmer scenario as described in the response to RAI 5C6.
11/6/09 18
•
•
•

UPDATED DOE RESPONSES TO WVDP PHASE 1 DECOMMISSIONING PLAN RAIs
Radionuclide Ratios and the Use of Surrogate Radionuclides
Soil data collected during the soil characterization program will be used to identify radionuclide
ratios within the Lavery till from the WMA 1 and WMA 2 excavations that may be used to develop
surrogate DCGLs to demonstrate compliance with the subsurface soil cleanup goals. Based on
available data, it is doubtful that these ratios will be consistent enough to permit use of an easy-
to-measure surrogate radionuclide to identify the concentrations of Sr-90, which available data
suggest will be the dominant radionuclide at the bottom of the deep excavations.
Impacts of Residual Radioactivity at the Bottoms of the Deep Excavations
The response to RAI 5C3 describes the results of additional groundwater modeling using the
STOMP code and other models used in the EIS to evaluate the potential impacts of changes in
flow fields associated with installation of the hydraulic barriers on the DCGLs. As explained in the
response to that RAI, this impact is expected to be negligible.
The potential impact of movement of residual contamination from the upper layer of the Lavery till
into groundwater of the backfilled excavations has been evaluated using a combination of flow
modeling performed using the three-dimensional near field STOMP model of the north plateau
and transport and dose modeling using the FEIS finite difference rectangular source model. The
STOMP modeling determined the influence of pumping of a well on the direction and magnitude
of groundwater flow at the backfill soil-Lavery till interface and established the magnitude and
direction of flow of groundwater towards and around the well in the volume above the
contaminated till.
The base-case conceptual model that had been used for development of the subsurface soil
DCGLs using RESRAD was modified to provide for a multi-source approach. Two potential
sources were considered. First, a plug of Lavery till with residual contamination from the
excavation bottom is brought to the surface during installation of the cistern and spread over the
entire surface of the hypothetical garden. In addition, the remaining contaminated Lavery till is
considered a subsurface source that produces a continuing release of contamination from the
Lavery till at the excavation bottom into the clean backfill, where residual radioactivity moves
upward by diffusion and contaminates the aquifer resulting in additional doses. Both the
residential gardener scenario and the resident farmer scenario were evaluated.
A more detailed description of this modeling, including an illustration of the modified conceptual
model, is provided below in the form of a new Section 5.2.6 that is to be added to Section 5 of the
DP in Revision 2.
Table 5C9-2 compares the subsurface soil DCGLs that take into account continuing releases
from the bottoms of the remediated deep excavations with subsurface soil DCGLs calculated
using the other conceptual models. This table also shows the changes necessary to the
subsurface soil cleanup goals to take these releases into account.
11/6/09 19
•
•
•
UPDATED DOE RESPONSES TO WVDP PHASE 1 DECOMMISSIONING PLAN RAls
Radionuclide Ratios and the Use of Surrogate Radionuclides
Soil data collected during the soil characterization program will be used to identify radionuclide ratios within the Lavery till from the WMA 1 and WMA 2 excavations that may be used to develop surrogate DCGLs to demonstrate compliance with the subsurface soil cleanup goals. Based on available data, it is doubtful that these ratios will be consistent enough to permit use of an easyto-measure surrogate radionuclide to identify the concentrations of Sr-90, which available data suggest will be the dominant radionuclide at the bottom of the deep excavations.
Impacts of Residual Radioactivity at the Bottoms of the Deep Excavations
The response to RAI 5C3 describes the results of additional groundwater modeling using the STOMP code and other models used in the EIS to evaluate the potential impacts of changes in flow fields associated with installation of the hydraulic barriers on the DCGLs. As explained in the response to that RAI, this impact is expected to be negligible.
The potential impact of movement of residual contamination from the upper layer of the Lavery till
into groundwater of the backfilled excavations has been evaluated using a combination of flow modeling performed using the three-dimensional near field STOMP model of the north plateau and transport and dose modeling using the FE IS finite difference rectangular source model. The STOMP modeling determined the influence of pumping of a well on the direction and magnitude of groundwater flow at the backfill soil-Lavery till interface and established the magnitude and direction of flow of groundwater towards and around the well in the volume above the contaminated till.
The base-case conceptual model that had been used for development of the subsurface soil DCGLs using RESRAD was modified to provide for a multi-source approach. Two potential sources were considered. First, a plug of Lavery till with residual contamination from the excavation bottom is brought to the surface during installation of the cistern and spread over the entire surface of the hypothetical garden. In addition, the remaining contaminated Lavery till is considered a subsurface source that produces a continuing release of contamination from the Lavery till at the excavation bottom into the clean backfill, where residual radioactivity moves upward by diffusion and contaminates the aquifer resulting in additional doses. Both the residential gardener scenario and the resident farmer scenario were evaluated.
A more detailed description of this modeling, including an illustration of the modified conceptual model , is provided below in the form of a new Section 5.2 .6 that is to be added to Section 5 of the DP in Revision 2.
Table 5C9-2 compares the subsurface soil DCGLs that take into account continuing re leases
from the bottoms of the remediated deep excavations with subsurface soil DCGLs calculated using the other conceptual models. This table also shows the changes necessary to the subsurface soil cleanup goals to take these releases into account.
11/6/09 19

UPDATED DOE RESPONSES TO WVDP PHASE 1 DECOMMISSIONING PLAN RAIS
Table 5C9-2. Subsurface Soil DCGL Comparison and Revised Subsurface Soil Cleanup Goals (pCi/g)i')
Multi-Source Cistern Recreationist Lagoon 3 Natural Gas DCGL for Basic Probabilistic Revised OldNuclide Analysis Well Driller Hiker Erosion Well Driller Deterministic Peak-of-the- Cleanup Cleanup
DCGL DCGL DCGL DCGL DCGL Models(2 ) Mean DCGL Goal(31 Goal(41
Am-241 6.3E+03 1.7E+04 2.7E+05 2.9E+05 1.4E+05 7.1E+03 6.8E+03 2.8E+03 2.9E+03
C-14 9.9E+02 2.3E+09 3.3E+08 6.4E+06 4.9E+09 3.7E+05 7.2E+05 4.5E+02 1.9E+05
Cm-243 3.6E+03 1.1E+04 5.OE+04 1.8E+05 1.2E+05 1,2E+03 1.IE+03 5.OE+02 5.1E+02
Cm-244 3.4E+04 3.3E+04 1.OE+09 3.9E+05 2.6E+05 2.3E+04 2.2E+04 9.9E+03 8.8E+03
Cs-137(5 2.8E+03 6.7E+03 9.8E+05 7.4E+05 9.2E+04 4.4E+02 3.OE+02 1.4E+02 2.OE+02
1-129 7.5E+00 8.OE+05 1.9E+06 3.5E+05 9.2E+06 5.2E+01 6.7E+02 3.4E+00 1.9E+02
Np-237 1.0E+00 6.6E+03 2.7E+04 5.9E+05 6.6E+04 4.3E+00 9.3E+01 4,5E-01 1.7E+01
Pu-238 1.3E+04 2.OE+04 1.5E+06 2.7E+05 1,6E+05 1.5E+04 1.4E+04 5.9E+03 5.5E+03
Pu-239 3.1E+03 1.9E+04 2.8E+05 2.4E+05 1.5E+05 1.3E+04 1.2E+04 1.4E+03 5.OE+03
Pu-240 3.4E+03 1.9E+04 2.8E+05 2.4E+05 1.5E+05 1.3E+04 1.2E+04 1.5E+03 5.OE+03
Pu-241 5.5E+05 5.5E+05 1.7E+07 1.2E+07 4.5E+06 2.4E+05 2.5E+05 1.1E+05 9.8E+04
Sr-90' 5' 2.8E+02 8.7E+05 1.6E+08 9.2E+06 1.1E+07 3.2E+03 3.4E+03 1.3E+02 1.4E+03
Tc-99 5.9E+02 7.9E+07 2.2E+08 4.7E+07 9.4E+08 1.1E+04 1.4E+04 2.7E+02 5.OE+03
U-232 8.8E+01 1.6E+03 2.8E+04 4.5E+05 1.6E+04 1.OE+02 7.4E+01 3.3E+01 5.3E+01
U-233 2.7E+02 6.2E+04 1.3E+06 2.9E+06 4.9E+05 1.9E+02 9.9E+03 8.6E+01 7.5E+02
U-234 2.8E+02 6.4E+04 1.4E+06 3.1E+06 5.OE+05 2.OE+02 1.3E+04 9.OE+01 7.7E+02
U-235 2.9E+02 1.2E+04 4.2E+04 3.2E+06 1.4E+05 2.1E+02 9.3E+02 9.5E+01 4.3E+02
U-238 3.OE+02 3.7E+04 1.9E+05 3.3E+06 3.6E+05 2.1E+02 4.6E+03 9.5E+01 8.2E+02
NOTES: (1) Values show in boldface are the lowest of the DCGL sets.
(2) The lower value of the deterministic resident farmer and residential gardener DCGLs.
(3) The cleanup goals are generated by the process described in Section 5.4.1 of the DR, and are based on adjusting DCGLs to an acceptable dose of 22.5 mrem/y, witha further reduction of 50 percent to account for uncertainty in the DCGLs.
(4) From Table 5-14 of the DP, Revision 1.
(5) These values take into account 30 years decay.
11/6/09 20
UPDATED DOE RESPONSES TO WVDP PHASE 1 DECOMMISSIONING PLAN RAIS
Table SC9-2. Subsurface Soil DCGL Comparison and Revised Subsurface Soil Cleanup Goals (pCi/g)(l)
Multi-5ource Cistern Recreationist Lagoon 3 Natural Gas DCGL for Basic Probabilistic Revised Old Nuclide Analysis Well Driller Hiker Erosion Well Driller Deterministic Peak-of-the- Cleanup Cleanup
DCGL DCGL DCGL DCGL DCGL Models(2) Mean DCGL Goal(3 Goal(4
Am-241 6.3E+03 1.7E+04 2.7E+05 2.9E+05 1.4E+05 7.1E+03 6.BE+03 2.BE+03 2.9E+03
C-14 9.9E+02 2.3E+09 3.3E+OB 6.4E+06 4.9E+09 3.7E+05 7.2E+05 4.5E+02 1.9E+05
Cm-243 3.6E+03 1.1E+04 5.0E+04 1.BE+05 1.2E+05 1.2E+03 1.1E+03 5.0E+02 5.1E+02
Cm-244 3.4E+04 3.3E+04 1.0E+09 3.9E+05 2.6E+05 2.3E+04 2.2E+04 9.9E+03 B.BE+03
CS-13i5) 2.BE+03 6.7E+03 9.BE+05 7.4E+05 9.2E+04 4.4E+02 3.0E+02 1.4E+02 2.0E+02
1-129 7.SE+OO B.OE+05 1.9E+06 3.5E+05 9.2E+06 5.2E+01 6.7E+02 3.4E+OO 1.9E+02
Np-237 1.0E+OO 6.6E+03 2.7E+04 5.9E+05 6.6E+04 4.3E+OO 9.3E+01 4.5E-01 1.7E+01
Pu-238 1.3E+04 2.0E+04 1.5E+06 2.7E+05 1.6E+05 1.5E+04 1.4E+04 5.9E+03 5.5E+03
Pu-239 3.1E+03 1.9E+04 2.BE+05 2.4E+05 1.5E+05 1.3E+04 1.2E+04 1.4E+03 5.0E+03
Pu-240 3.4E+03 1.9E+04 2.8E+05 2.4E+05 1.5E+05 1.3E+04 1.2E+04 1.5E+03 5.0E+03
Pu-241 5.5E+05 5.5E+05 1.7E+07 1.2E+07 4.5E+06 2.4E+OS 2.5E+05 1.1E+05 9.BE+04
Sr-90(5) 2.8E+02 B.7E+05 1.6E+OB 9.2E+06 1.1E+07 3.2E+03 3.4E+03 1.3E+02 1.4E+03
Tc-99 S.9E+02 7.9E+07 2.2E+OB 4.7E+07 9.4E+OB 1.1 E+04 1.4E+04 2.7E+02 5.0E+03
U-232 8.BE+01 1.6E+03 2.8E+04 4.5E+05 1.6E+04 1.0E+02 7.4E+01 3.3E+01 5.3E+01
U-233 2.7E+02 6.2E+04 1.3E+06 2.9E+06 4.9E+05 1.9E+02 9.9E+03 B.6E+01 7.5E+02
U-234 2.BE+02 6.4E+04 1.4E+06 3.1E+06 5.0E+05 2.0E+02 1.3E+04 9.0E+01 7.7E+02
U-235 2.9E+02 1.2E+04 4.2E+04 3.2E+06 1.4E+05 2.1E+02 9.3E+02 9.5E+01 4.3E+02
U-23B 3.0E+02 3.7E+04 1.9E+05 3.3E+06 3.6E+05 2.1E+02 4.6E+03 9.5E+01 B.2E+02
NOTES: (1) Values show In boldface are the lowest of the DCGL sets. (2) The lower value of the deterministic resident farmer and residential gardener DCGLs (3) The cleanup goals are generated by the process described in Section 5.4.1 of the DP. and are based on adjusting DCGLs to an acceptable dose of 22.5 mrem/y, with
a further reduction of 50 percent to account for uncertainty in the DCGLs. (4) From Table 5-14 of the DP, Revision 1. (5) These values take Into account 30 years decay.
11/6/09 20
• • •

UPDATED DOE RESPONSES TO WVDP PHASE 1 DECOMMISSIONING PLAN RAIs
Table 5C9-2 shows that in nine cases, the DCGLs developed using other conceptual models are
lower than the DCGLs developed by the multi-source model that accounts for continuing releases
from the bottom of the deep excavations:
" The peak-of-the-mean probabilistic DCGLs, which did not take into account continuing
releases from the bottoms of the excavation, are lower for Cm-243, Cm-244, Cs-137 and
U-232; and
" The limiting DCGLs from the deterministic resident farmer and residential gardener
conceptual models, which did not take into account continuing releases from the bottom
of the excavations, were lower for Pu-241, U-233, U-234, U-235, and U-238.
This situation can be attributed to conceptual model differences such as different contamination
zone geometry. As discussed in this response and the responses to RAI 5C6 and RAI 5C15, a
number of different scenarios were evaluated in developing the subsurface DCGLs; for all of the
radionuclides, the lowest DCGLs are being used as the basis for the subsurface soil cleanup
goals. This matter is addressed in the changes being made to Section 5 as described below.
Table 5C9-2 also shows that the revised cleanup goals are lower than the old cleanup goals in
Revision 0 and Revision 1 of the DP in all but three cases: Cm-244, Pu-238. and Pu-241.
Remediation of Excavation Sides
Contamination present on the sides of the deep excavation will be remediated to ensure thatunrestricted release criteria are met as specified in Section 7 of the DP.
Section 7 states on page 7-25 that remedial action surveys would be performed during the course
of the work and soil on the bottom and sides of the excavation with radioactivity concentrations
exceeding the cleanup goals would be removed and disposed of offsite as radioactive waste. The
related footnote states that it is unlikely that the sides of the excavation that are not hydraulically
downgradient will be contaminated. This footnote also states that in any case, the extent of soil
remediation on the sides of the excavation would be limited by the excavation boundaries.
The Final Status Survey Conceptual Framework included in the response to RAI 9C4 describes
how Phase 1 final status surveys will be performed on the sides of the deep excavations to
document that the cleanup criteria are achieved.
11/6/09 21
•
•
•
UPDATED DOE RESPONSES TO WVDP PHASE 1 DECOMMISSIONING PLAN RAls
Table 5C9-2 shows that in nine cases, the DCGLs developed using other conceptual models are lower than the DCGLs d,eveloped by the multi-source model that accounts for continuing releases from the bottom of the deep excavations:
• The peak-of-the-mean probabilistic DCGLs, which did not take into account continuing releases from the bottoms of the excavation, are lower for Cm-243, Cm-244, Cs-137 and U-232; and
• The limiting DCGLs from the deterministic resident farmer and residential gardener conceptual models, which did not take into account continuing releases from the bottom of the excavations, were lower for Pu-241 , U-233, U-234, U-235, and U-238.
This situation can be attributed to conceptual model differences such as different contamination zone geometry. As discussed in this response and the responses to RAI 5C6 and RAI 5C15, a number of different scenarios were evaluated in developing the subsurface DCGLs; for all of the radionuclides, the lowest DCGLs are being used as the basis for the subsurface soil cleanup goals. This matter is addressed in the changes being made to Section 5 as described below.
Table 5C9-2 also shows that the revised cleanup goals are lower than the old cleanup goals in Revision 0 and Revision 1 of the DP in all but three cases: Cm-244, Pu-238, and Pu-241.
Remediation of Excavation Sides
Contamination present on the sides of the deep excavation will be remediated to ensure that unrestricted release criteria are met as specified in Section 7 of the DP.
Section 7 states on page 7-25 that remedial action surveys would be performed during the course of the work and soil on the bottom and sides of the excavation with radioactivity concentrations exceeding the cleanup goals would be removed and disposed of offsite as radioactive waste. The
related footnote states that it is unlikely that the sides of the excavation that are not hydraulically downgradient will be contaminated . This footnote also states that in any case, the extent of soil remediation on the sides of the excavation would be limited by the excavation boundaries.
The Final Status Survey Conceptual Framework included in the response to RAI 9C4 describes how Phase 1 final status surveys will be performed on the sides of the deep excavations to document that the cleanup criteria are achieved.
11/6/09 21

UPDATED DOE RESPONSES TO WVDP PHASE 1 DECOMMISSIONING PLAN RAIs
Table 5C9-1. Borehole Log Geologic Picks Used to Re-Evaluate the Extent of the LaveryTill Sand in the North Plateau
Original Original Original Revised Revisedorigin Top Bottom Revised Top Bottom
Borehole Geologic Elevation Elevation Geologic Elevation ElevationUnit ()(i)Unit(i)()(ft) (ft) (ft) (ft)S&G 0 16 S&G-TBU 0 17
WLT 16 17 S&G-- _17 23302 ULLT 17 23 CLAY
LTS 23 28 S&G-SWS 23 28
ULT 28 >32 ULT 28 >32
S&G 0 14.5 S&G-TBU 0 15
WLT 14.5 15 S&G-
402 ULLT 15 24 CLAY
LTS 24 28.75 S&G-SWS 24 28.75
ULT 28.75 >36 ULT 28.75 >36
S&G 0 14.75 S&G-TBU 0 14.7
WLT 14.75 15.25 S&G-
404 ULLT 15.25 24 C LAY
LTS 24 32 S&G-SWS 24 32
ULT 32 >36.5 ULT 32 >36.5
S&G 0 14.75 S&G-TBU 0 14.7
WLT 14.75 15.25 S&G-
ULT 15.25 24 CLAY
410 LTS 24 25 S&G-SWS 24 32
ULT 25 62 ULT 32 62
KRS 62 82 KRS 62 82
BR 82 >82 BR 82 >82
S&G 0 14.5 S&G-TBU 0 15
WLT 14.5 15 S&G-
ULT 15 24 CLAY
11B LTS 24 28.75 S&G-SWS 24 28.75
ULT 28.75 46 ULT 28.75 46
KRS 46 66 KRS 46 66
KT 66 >66 KT 66 >66F 0 3
S&G 0 26
S&G-TBU 3 26S&G-
62DMB-16 ULT 26 27 CLAY 26 27CLAY
LTS 27 40 S&G-SWS 27 40
ULT 40 >40 ULLT 40 >40F 0 3
S&G 0 17
S&G-TBU 3 1762DMB-17 S&G-
U LT 17 25 CLY17 25CLAY
LTS 25 31 S&G-SWS 25 31
11/6/09 22
UPDATED DOE RESPONSES TO WVDP PHASE 1 DECOMMISSIONING PLAN RAls
Table 5C9-1. Borehole Log Geologic Picks Used to Re-Evaluate the Extent of the Lavery Till Sand in the North Plateau
Original Original Original
Revised Revised Revised
Borehole Geologic Top Bottom Geologic Top Bottom Elevation Elevation Elevation Elevation
Unit (ft) (ft)
Unit (ft) (ft)
S&G 0 16 S&G-TBU 0 17 WLT 16 17 S&G-
CLAY 17 23 302 ULT 17 23
LTS 23 28 S&G-SWS 23 28 ULT 28 >32 ULT 28 >32 S&G 0 14.5 S&G-TBU 0 15 WLT 14.5 15 S&G- 15 CLAY 24
402 ULT 15 24 LTS 24 28.75 S&G-SWS 24 28.75 ULT 28.75 >36 ULT 28.75 >36 S&G 0 14.75 S&G-TBU 0 14.7 WLT 14.75 15.25 S&G-
CLAY 14.7 24 404 ULT 15.25 24
LTS 24 32 S&G-SWS 24 32 ULT 32 >36.5 ULT 32 >36.5 S&G 0 14.75 S&G-TBU 0 14.7 WLT 14.75 15.25 S&G-
15.25 CLAY 14.7 24 ULT 24
410 LTS 24 25 S&G-SWS 24 32 ULT 25 62 ULT 32 62 KRS 62 82 KRS 62 82 BR 82 >82 BR 82 >82
S&G 0 14.5 S&G-TBU 0 15 WLT 14.5 15 S&G- 24 CLAY 15 ULT 15 24
11 B LTS 24 28.75 S&G-SWS 24 28.75 ULT 28.75 46 ULT 28.75 46 KRS 46 66 KRS 46 66 KT 66 >66 KT 66 >66
S&G 26 F 0 3
0 S&G-TBU 3 26
62DMB-16 ULT 26 27 S&G- 26 27 CLAY LTS 27 40 S&G-SWS 27 40 ULT 40 >40 ULT 40 >40
F 0 3 S&G 0 17
S&G-TBU 3 17 62DMB-17
17 S&G- 17 25 ULT 25 CLAY LTS 25 31 S&G-SWS 25 31
11/6/09 22
•
•
•

UPDATED DOE RESPONSES TO WVDP PHASE 1 DECOMMISSIONING PLAN RAIs
Table 5C9-1. Borehole Log Geologic Picks Used to Re-Evaluate the Extent of the LaveryTill Sand in the North Plateau
Original Original Original Revised Revised Revisedregin Top Bottom Gevic Top Bottom
Borehole Geologic Elevation Elevation Geologic Elevation Elevation(ft) (ft) (ft) (ft)
ULT 31 >42 ULT 31 >42
S&G 0 17 S&G-TBU 0 17S&G-
IULT 17 23 CLAY 17 2362PAH-71 CLAY
LTS 23 28 S&G-SWS 23 28
ULT 28 >36.5 ULT 28 >36.5
S&G 0 12 S&G-TBU 0 12S&G-
IULT 12 20.5 CLAY 12 20.563DMB-24 CLAY
LTS 20.5 25 S&G-SWS 20.5 25
ULT 25 >42 ULT 25 >42S&G 0 18 S&G-TBU 0 17.5
S&G-ULT 18 20 17.5 20CLAY
63DMB-25 LTS 20 23 S&G-SWS 20 23
ULT 23 52 ULT 23 52
KRS 52 77 KRS 52 77
BR 77 >77 BR 77 >77
S&G 0 20 S&G-TBU 0 20S&G-
ULLT 20 24 S&G- 20 24CLAY70DMB-26 LTS 24 32 S&G-SWS 24 32
ULT 32 58 ULT 32 58
KRS 58 >77 KRS 58 >77
S&G 0 20 S&G-TBU 0 20S&G-
ULT 20 24 CLM' 20 24CLAY70DMB-27 LTS 24 28 S&G-SWS 24 28
ULT 28 50 ULT 28 50
KRS 50 >76 KRS 50 >76
S&G 0 15 S&G-TBU 0 15
74DMB-33 ULT 15 68
LTS 43 68
BR 68 >68 BR 68 >68
S&G 0 15 S&G-TBU 0 15S&G-
ULT 15 20 ctG- 15 20CLAY74DMB-39 LTS 20 29 S&G-SWS 20 29
ULT 29 53 ULT 29 53
KRS 53 70 KRS 53 70
11/6/09 23
•
•
•
UPDATED DOE RESPONSES TO WVDP PHASE 1 DECOMMISSIONING PLAN RAls
Table 5C9-1. Borehole Log Geologic Picks Used to Re-Evaluate the Extent of the Lavery Till Sand in the North Plateau
Original Original Original
Revised Revised Revised
Top Bottom Top Bottom Borehole Geologic Elevation Elevation
Geologic Elevation Elevation
Unit (tt) (tt) Unit (tt) (tt)
ULT 31 >42 ULT 31 >42 S&G 0 17 S&G-TBU 0 17
ULT 17 23 S&G- 17 23 62PAH-71 CLAY
LTS 23 28 S&G-SWS 23 28 ULT 28 >36.5 ULT 28 >36.5 S&G 0 12 S&G-TBU 0 12
ULT 12 20.5 S&G- 12 20.5 63DMB-24 CLAY
LTS 20.5 25 S&G-SWS 20.5 25 ULT 25 >42 ULT 25 >42 S&G 0 18 S&G-TBU 0 17.5
ULT 18 20 S&G- 17.5 20 CLAY 63DMB-25 LTS 20 23 S&G-SWS 20 23
ULT 23 52 ULT 23 52 KRS 52 77 KRS 52 77 BR 77 >77 BR 77 >77
S&G 0 20 S&G-TBU 0 20
ULT 20 24 S&G- 20 24 CLAY 70DMB-26 LTS 24 32 S&G-SWS 24 32
ULT 32 58 ULT 32 58 KRS 58 >77 KRS 58 >77 S&G 0 20 S&G-TBU 0 20
ULT 20 24 S&G- 20 24 CLAY 70DMB-27 LTS 24 28 S&G-SWS 24 28
ULT 28 50 ULT 28 50 KRS 50 >76 KRS 50 >76 S&G 0 15 S&G-TBU 0 15
74DMB-33 ULT 15 43
ULT LTS 43 68
15 68
BR 68 >68 BR 68 >68 S&G 0 15 S&G-TBU 0 15
ULT 15 20 S&G- 15 20 CLAY 74DMB-39
LTS 20 29 S&G-SWS 20 29 ULT 29 53 ULT 29 53 KRS 53 70 KRS 53 70
11/6/09 23

UPDATED DOE RESPONSES TO WVDP PHASE 1 DECOMMISSIONING PLAN RAIs
Table 5C9-1. Borehole Log Geologic Picks Used to Re-Evaluate the Extent of the LaveryTill Sand in the North Plateau
Original Original Original Revised Revisedorigin Top Bottom Revised Top Bottom
Borehole Geologic Elevation Elevation Geologic Elevation ElevationUnit ()(i) Unit(i)()(ft) (ft) (ft) (ft)BR 70 >70 BR 70 >70
F 0 3S&G 0 25 F__0_3
S&G-TBU 3 25S&G-
ULT 25 31 25 30.5CLAY
LTS 31 34 S&G-SWS 30.5 3474DMB-40 ULT 34 63 ULT 34 63
KRS 63 94 KRS 63 94
KT 94 113 KT 94 113
ORS 113 128 ORS 113 128
BR 128 >128 BR 128 >128
F 0 5 F 0 5
S&G 5 23.5 S&G-TBU 5 23.5
UR-1 ULT 23.5 27 S&G- 23.5 27CLAY
LTS 27 35.5 S&G-SWS 27 35.5
ULT 35.5 >42 ULT 35.5 >42
F 0 5 F 0 5
S&G 5 23.5 S&G-TBU 5 23.5S&G-
UR-2 ULT 23.5 28 23.5 28CLAY
LTS 28 35.8 S&G-SWS 28 35.8
ULT 35.8 >37 ULT 35.8 >37
F 0 5 F 0 5
S&G 5 20 S&G-TBU 5 20
UR-3 ULT 20 30.3 S&G- 20 30.3CLAY
LTS 30.3 36 S&G-SWS 30.3 36
ULT 36 >39 ULT 36 >39
LEGEND: BR - BedrockClay - Clay UnitF- FillKRS - Kent Recessional SequenceKT Kent till
LTS - Lavery till sandORS - Olean Recessional SequenceS&G - Sand and Gravel Unit; subdivided into:SWS -Slack Water SequenceTBU - Thick-bedded UnitULT - Unweathered Lavery tillWLT - Weathered Lavery till
11/6/09 24
UPDATED DOE RESPONSES TO WVDP PHASE 1 DECOMMISSIONING PLAN RAls
Table 5C9-1. Borehole log Geologic Picks Used to Re-Evaluate the Extent of the lavery Till Sand in the North Plateau
Original Borehole Geologic
Unit
BR
S&G
ULT
LTS 74DMB-40
ULT
KRS
KT
ORS
BR
F
S&G
UR-1 ULT
LTS ULT
F
S&G
UR-2 ULT
LTS
ULT
F
S&G
UR-3 ULT
LTS
ULT
LEGEND: BR - Bedrock Clay - Clay Unit
F- Fill
Original Top
Elevation (tt)
70
0
25
31
34
63
94
113
128
0
5
23.5
27
35.5
0
5
23.5
28
35.8
0
5
20
30.3
36
KRS - Kent Recessional Sequence
KT - Kent till LTS - Lavery till sand
ORS - Olean Recessional Sequence
Original Bottom
Elevation (tt)
>70
25
31
34
63
94
113
128
>128
5
23.5
27
35.5
>42
5
23.5
28
35.8
>37
5
20
30.3
36
>39
S&G - Sand and Gravel Unit; subdivided into:
11/6/09
SWS - Slack Water Sequence
TBU - Thick-bedded Unit
UL T - Unweathered Lavery till WL T - Weathered Lavery till
24
Revised Revised Revised
Geologic Top Bottom
Elevation Elevation Unit (tt) (tt)
BR 70 >70
F 0 3
S&G-TBU 3 25
S&G-25 30.5
CLAY
S&G-SWS 30.5 34
ULT 34 63
KRS 63 94
KT 94 113
ORS 113 128
BR 128 >128
F 0 5
S&G-TBU 5 23.5
S&G- 23.5 27 CLAY
S&G-SWS 27 35.5
ULT 35.5 >42
F 0 5
S&G-TBU 5 23.5
S&G- 23.5 28 CLAY
S&G-SWS 28 35.8
ULT 35.8 >37
F 0 5
S&G-TBU 5 20
S&G- 20 30.3 CLAY
S&G-SWS 30.3 36
ULT 36 >39
•
•
•

UPDATED DOE RESPONSES TO WVDP PHASE 1 DECOMMISSIONING PLAN RAIs
i/
7"
./ .. .......
A .\
N.
• /
/
.... ,
.4;:
.4' /
4... ....
V!,4
......
1200
'j 2
1 '\•:
//.," /I
/t •
".I
/'-'N
-J
.44-J
7
/
'-N.N
Figure 5C9-1. Pre-2007 Inferred Areal Extent of the Lavery Till Sand in the North Plateau
11/6/09 25
•
•
•
/ . ...- ..
UPDATED DOE RESPONSES TO WVDP PHASE 1 DECOMMISSIONING PLAN RAls
/
.~:"\
\\> ........ . \;.:
\
\~'" "
\.'\ .-:::.:::~ .,~'" ( i ::::;'.>:.i\ , .... ,' \ ';.
_st.~:::.\.. . ....... ·jL:\:~:;1.i"1 \ · .. :f::·\·;.i .... ·\>.. 'i i \
~ \
'. '\ /1 \ " \
/\\)i\~EkJ t-=: )\'
, f
\"
...... \\
I j
/
/,. / \
/
\ j
/
/ ./ \
) i \ \ /
Figure 5C9-1. Pre-2007 Inferred Areal Extent of the Lavery Till Sand in the North Plateau
11/6/09 25

UPDATED DOE RESPONSES TO WVDP PHASE I DECOMMISSIONING PLAN RAIs
0
Legend
* Monitoring Location-Elevation Contour Line
1435.53 Groundvater ElevationL=. Approximate Extert of Lavery TO-Sand Unit
Contour Interval: 2 feetMap Based on 1996 Fy-Over SurveyWater Levels Were Measured on November 28, 2007Water ElevatIons in Feet Above Mean Sea Level (M.SL)
1st-Quarter 2008Groundwater Elevation Contours
in the Lavery Till-SandWest Valley Demonstration Project
West Valley, New York
Figure 5C9-2 - Current Inferred Areal Extent of the Lavery Till Sand in the North Plateau
11/6/09 26
UPDATED DOE RESPONSES TO WVDP PHASE 1 DECOMMISSIONING PLAN RAls
'" , ... Legend
• Monitoring location Elevation Contour Line
1435_53 Groundwater Elevation L-=.i Approximate Extert of Lavery ToII-Sand Unit
Contour Inte.val: 2 !eel Map eased on 1996 Fly-Oller Survey Water Levels Were Meas..-ed on November 28. 2fXJ7 Water Elevations In Feet Above Mean Sea Level (M_S.L)
N
A
1st-Quarter 2008 Grouncmater Elevation Contours
In the Lavery lill-Sand West Valley Demorl$tration Project
West Valley, New York
Figure 5C9-2 - Current Inferred Areal Extent of the Lavery Till Sand in the North Plateau
11/6/09 26
•
•
•

UPDATED DOE RESPONSES TO WVDP PHASE I DECOMMISSIONING PLAN RAIs
References:
Hemann and Steiner 1999, 1998 Geoprobe Investigation of the Core Area of the NorthPlateau Groundwater Plume, WVDP-346, Revision 0. Hemann, M.R. and R.E.Steiner, II, West Valley Nuclear Services Company, June 11, 1999.
Changes to the Plan:
Section 3.5.2, Lavery Till-Sand Unit on page 3-48 will be modified as follows:
The Lavery till-sand unit is a lenticular shaped, silty, sand layer that is locally presentwithin the Lavery till in the north plateau of the Center, immediately southeast of theProcess Building. It is thought to be either a pro-glacial sand deposit or a reworked kamedeposit.
The till-sand is limited in areal extent, occurring on the north plateau in an east-westband approximately 750 feet wide. It lies within the upper 20 feet of the Lavery till (Figure 3-6) and is up to seven feet in thickness.
Re-examination of borehole logs from the north plateau in 2007 resulted in a re-evaluation of the areal extent of the Lavery till sand. From 1991 to 2007 the Lavery till sandwas inferred to be present to the west, south, and southeast of the Process Building in alocation that was hydraulically upgradient and cross-gradient to the north plateaugroundwater plume. Earlier interpretations of the borehole logs considered a prominentclay-rich geologic horizon up to several feet in thickness as part of the unweathered Laverytill and the underlying sandy unit as the Lavery till sand.
Following the completion of the 1993 soil boring program to support the RCRA FacilityInvestigation, the 1993 borehole data indicated that the sand and gravel unit wascomposed of two distinct subunits, the thick-bedded unit and the underlying slack watersequence which are separated by the prominent clay-rich geologic horizon mentionedearlier. In 2007 it was noted that the elevation of the original Lavery till sand west andsouthwest of the Process Building was much shallower in elevation that the Lavery till sandto the southeast of the Process Building. It was determined that this western andsouthwestern portion was more consistent with the elevation of the slack water sequence ofthe sand and gravel unit and it was reclassified as part of the slack water sequence. As aresult the areal extent of the Lavery till sand was substantially reduced and it is now locatedsoutheast of the Process Building away from the north plateau groundwater plume asshown in Figure 3-64.
Changes to Section 5 are as follows:
New introductory information will be added following the unnumbered subsection heading"Subsurface Soil Conceptual Model" on page 5-23, as follows:
11/6/09 27
•
•
•
UPDATED DOE RESPONSES TO WVDP PHASE 1 DECOMMISSIONING PLAN RAls
References:
Hemann and Steiner 1999, 1998 Geoprobe Investigation of the Core Area of the North Plateau Groundwater Plume, WVDP-346, Revision O. Hemann, M.R. and R.E. Steiner, II, West Valley Nuclear Services Company, June 11 , 1999.
Changes to the Plan:
Section 3.5.2, Lavery Till-Sand Unit on page 3-48 will be modified as follows:
The Lavery till-sand unit is a lenticular shaped, silty, sand layer that is locally present within the Lavery till in the north plateau of the Center, immediately southeast of the Process Building. It is thought to be either a pro-glacial sand deposit or a reworked kame deposit.
The till-sand is limited in areal extent, occurring on the north plateau in an east-west band approximately 750 feet wide. It lies within the upper 20 feet of the Lavery till (Figure 3-6) and is up to seven feet in thickness.
Re-examination of borehole logs from the north plateau in 2007 resulted in a reevaluation of the areal extent of the Lavery till sand. From 1991 to 2007 the Lavery till sand was inferred to be present to the west, south, and southeast of the Process Building in a location that was hydraulically upgradient and cross-gradient to the north plateau groundwater plume. Earlier interpretations of the borehole logs considered a prominent clay-rich geologic horizon up to several feet in thickness as part of the unweathered Lavery till and the underlying sandy unit as the Lavery till sand.
Following the completion of the 1993 soil boring program to support the RCRA Facility Investigation, the 1993 borehole data indicated that the sand and gravel unit was composed of two distinct subunits, the thick-bedded unit and the underlying slack water sequence which are separated by the prominent clay-rich geologic horizon mentioned earlier. In 2007 it was noted that the elevation of the original Lavery till sand west and southwest of the Process Building was much shallower in elevation that the Lavery till sand to the southeast of the Process Building. It was determined that this western and southwestern portion was more consistent with the elevation of the slack water sequence of the sand and gravel unit and it was reclassified as part of the slack water sequence. As a result the areal extent of the Lavery till sand was substantially reduced and it is now located southeast of the Process Building away from the north plateau groundwater plume as shown in Figure 3-64.
Changes to Section 5 are as follows:
New introductory information will be added following the unnumbered subsection heading "Subsurface Soil Conceptual Model" on page 5-23, as follows:
11/6/09 27

UPDATED DOE RESPONSES TO WVDP PHASE 1 DECOMMISSIONING PLAN RAIS
Evaluation of Various Subsurface Soil Conceptual Models
The analyses described in Revision 0 and Revision I to this plan made use of the base-caseconceptual model for subsurface soil DCGL development described below and illustrated inFigure 5-8. Minor changes were made to this conceptual model in Revision 2 that producedDCGLs that were slightly higher for most radionuclides.
Addition analyses were also performed to determine whether this conceptual model, whichmakes use of the resident farmer scenario, represented the bounding case for potentialfuture doses from the remediated deep excavations. These additional analyses, which aredescribed below, involved:
* Evaluating the potential acute dose to the hypothetical individual drilling the well (thetwo meter diameter cistem) used in the original base case model,
* Evaluating potential acute dose to a hypothetical individual who might drill a naturalgas well in the area of one of the deep excavations,
* Evaluating potential doses to a recreational hiker in the area of the lagoons in WMA2 assuming that unchecked erosion would eventually produce deep gullies in thisarea,
* Evaluating potential doses to an offsite receptor from residual radioactivity at thebottom of the deep excavation in WMA 2 that might be released to Erdman Brook ifdeep gullies were to eventually cut into this area, and
* Evaluating a residential gardener scenario.
Of these five alternate conceptual models, one, the residential gardener model, was found tobe more limiting for some radionuclides that the original base-case resident farmer scenario.
To help determine whether the input parameters used in the original base-case model weresufficiently conservative, a comprehensive probabilistic uncertainty analysis was performed(similar analyses were also performed for surface soil and streambed sediment DCGLdevelopment). Section 5.2.5 describes this analysis. The resulting peak-of-the-mean DCGLswere somewhat lower for most radionuclides than the DCGLs produced by the deterministicresident farmer and residential gardener scenarios.
Another analysis was performed to evaluate whether continuing release of residualradioactivity from the bottom of the deep excavations would influence potential future dosesfrom the remediated deep excavations. Section 5.2.6 describes this analysis. The originalbase-case conceptual model was modified to add a secondary source of radioactivity fromresidual contamination at the bottom of the deep excavation that moves upward by diffusionand is drawn into the hypothetical well, resulting in additional dose to the resident primarilyfrom the drinking water pathway.
This multi-source model was analyzed using the resident farmer scenario and also theresidential gardener scenario, the latter with three different upper contamination zonegeometries to evaluate the sensitivity of the model to the contamination zone area andthickness. The results showed that this model was more limiting for nine of the 18radionuclides of interest than the other conceptual models that were evaluated.
Consideration of the results of all of this subsurface soil dose modeling led to the decision touse the lowest DCGLs among all of the modeling results as the basis for the subsurface soilcleanup goals in the interest of conservatism.
11/6/09 2811/6/09
UPDATED DOE RESPONSES TO WVDP PHASE 1 DECOMMISSIONING PLAN RAls
Evaluation of Various Subsorface Soil Conceptual Models
The analyses described in Revision 0 and Revision 1 to this plan made use of the base-case conceptuai model for subsurface soil DCGL ~evelopment described below and illustrated in Figure 5-8. Minor changes were made to this conceptual model in Revision 2 that produced DCGLs that were slightly higher for most radionuclides.
Addition analyses were also performed to determine whether this conceptual model, which makes use of the resident farmer scenario, represented the bounding case for potential future doses from the remediated deep excavations. These additional analyses, which are described be'low, involved:
• Evaluating the potential acute dose to the hypothetical individual drilling the well (the two meter diameter cistern) used in the original base case model,
• Evaluating potential acute dose to a hypothetical individual who might drill a natural gas well in the area of one of the deep excavations,
• Evaluating potential doses to a recreational hiker in the area of the lagoons in WMA 2 assuming that unchecked erosion would eventually produce deep gullies in this area,
• Evaluating potential doses to an offsite receptor fro~ residual radioactivity at the bottom of the deep exc~vation in WMA 2 that might b,e released to Erdman Brook if deep gullies were to eventually cut into this area, and
• Evaluating a residential gardener scenario.
Of these five alternate conceptual models, one, the residential gardener model, was found to be more limiting for some radionuclides that the original base-case resident farmer scenario.
To help determine whether the input parameters used in the original base-case model were sufficie!1t1y conservative, a comprehensive probabilistic uncertainty analysis was performed (similar ' analyses were also p~rformed for surface soil and streambed 'sediment DCGL development). Section 5.2.5 describes this analysis. The resulting peak-of-the-mean DCGLs Were somewhat lower for most radionuclides than the DCGLs produced by the deterministic resident farmer and residential gardener scenarios.
Another analysis was performed to evaluate whether continuing release of residual radioactivity from the bottom of the deep excavations would influence potential future doses from the remediated deep excavations. Section 5.2.6 describes this analysis. The original base-case conceptual model was modified to add a secondary source of radioactivity from residual contamination at the bottom of the deep excavation that moves upward by diffusion and is drawn into the hypothetical well, resulting in additional dose to the resident primarily from the drinking water pathway.
This multi-source model was analyzed using the resident farmer scenario and also the residential gardener scenario, the latter with three different upper contamination zone geometries to evaluate the sensitivity of the model to the contamination zone area and thickness. The results showed that this model was more limiting for nine of the 18 radionuclides of interest than the other conceptual models that were evaluated.
Consideration of the results of all of this subsurface soil dose modeling ted to the decision to use the lowest DCGLs among all of the modeling results as the basis for the subsurface soil cleanup goals in the interest of conservatism.
28
•
•
•

UPDATED DOE RESPONSES TO WVDP PHASE 1 DECOMMISSIONING PLAN RAIS
A new Section 5.2.6 will be added as follows:
5.2.6 Subsurface Soil DCGL Multi-Source Analysis
As noted in Section 5.2.1, the original base-case conceptual model used in developingthe subsurface soil DCGLs recognizes one source of contamination - the Lavery till fromthe bottom of one of the deep excavations that is brought to the surface during constructionof the hypothetical cistern. This model does not consider potential impacts to groundwaterin the backfilled excavation from continuing release of remaining residual radioactivity atthe bottom of the deep excavations.
To address this limitation, analyses were performed that take into account the impactsof releases of this other residual radioactivity on both a hypothetical residential gardenerand a resident farmer with a modified model that accounts for a surface and a subsurfacesource of radiation. Figure 5-10 illustrates the modified conceptual model used in theseanalyses.
Four surface contamination zonegeometry/dilution factor (DF) combinationsevaluated based on removal of a 3 m3 plug ofunweathered Lavery till to the surface:(1) 2000 M2, 0.15 m thick, with a soil DF of 100(2) 2000 M2, 0.0015 m thick, with a soil DF of 1
(3) 2000 M2, 1 m thick, with a soil DF of 667(4) 10,000 M2, 1 m thick, with a soil DF of 3333
A residential gardener is the averagemember of the critical group for the2000 M
2 area scenarios. A residentfarmer is the average member of thecritical group for the 10,000 m2
scenario.
Vý.... z . .. ..I
Backfill, unsaturated zone (2 m thick)
Contamination on bottom of excavation in area where cisternis installed is brought to surface and remaining subsurface
source contributes to groundwater contamination
Backfill, saturated zone
Well (cistern) intake depth 5 m below water table
Assumed 10,000 mi, 1 m thick, Contamination
located 10 m below surface usesin yback
Reida Raiatvity at Bottom of Exaao (Unetrd Lavr Till) /Unweathered L~avery TilI (Silty Clay) / Hypothetical cistern
,• ~(2 m diameter well,
Shale Berock Advection carries contain- 10 m deep)ination downward over time
Figure 5-10. Modified Conceptual Model for Subsurface Soil DCGL Development
With this model, the subsurface soil DCGLs are based on exposure to residual
radioactivity associated with the bottom of the deep excavation in the unweathered Lavery
till, with (1) soil from this area assumed to be relocated to the surface during installation of
11/6/09 29
•
•
•
UPDATED DOE RESPONSES TO WVDP PHASE 1 DECOMMISSIONING PLAN RAls
A new Section 5.2.6 will be added as follows:
11/6/09
5.2.6 Subsurface Soil DCGL Multi-Source Analysis
As noted in Section 5.2.1 , the original base-case conceptual model used in developing the subsurface soil DCGLs recognizes one source of contamination - the Lavery till from the bottom of one of the deep excavations that is brought to the surface during construction of the hypothetical cistern. This model does not consider potential impacts to groundwater in the backfilled excavation from continuing release of remaining residual radioactivity at the bottom of the deep excavations.
To address this limitation, analyses were performed that take into account the impacts of releases of this other residual radioactivity on both a hypothetical residential gardener and a resident farmer with a modified model that accounts for a surface and a subsurface source of radiation. Figure 5-10 illustrates the modified conceptual model used in these analyses.
Four surface contamination zone geometry/dilution factor (OF) combinations evaluated based on removal of a 3 m3 plug of unweathered Lavery till to the surface:
(1) 2000 m2, 0.15 m thick, with a soil OF of 100
(2) 2000 m2, 0.0015 m thick, with a soil OF of 1
(3) 2000 m2, 1 m thick, with a soil OF of 667
(4) 10,000 m2, 1 m thick, with a soil OF of 3333
Backfill, unsaturated zone (2 m thick)
Contamination on bottom of excavation in area where cistern is installed is brought to surface and remaining subsurface
source contributes to groundwater contamination
Backfill, saturated zone
r A residential gardener is the average member of the critical group for the 2000 m2 area scenarios. A resident farmer is the average member of the critical group for the 10,000 m2
scenario.
Well (cistern) intake depth 5 m below water table I --_~ Assumed 10,000 m' , 1 m thick,
located 10 m below surface
Shale Bedrock Advection carries contamination downward over time
Contamination diffuses into backfill
Figure 5-10. Modified Conceptual Model for Subsurface Soil DCGL Development
With this model, the subsurface soil DCGLs are based on exposure to residual radioactivity associated with the bottom of the deep excavation in the unweathered Lavery till, with (1) soil from this area assumed to be relocated to the surface during installation of
29

UPDATED DOE RESPONSES TO WVDP PHASE I DECOMMISSIONING PLAN RAIs
a cistern and (2) with the remaining contaminated Lavery till in the excavation bottomserving as a continuing source of contaminants to groundwater. These sources and theexposure pathways considered are described below.
Excavation Bottom Treated as Two Sources of Contamination
The excavation bottom is treated as two distinct sources: (1) a plug of contaminatedsoil from the excavation bottom that is brought to the surface during installation of thecistern and spread over the entire surface of the hypothetical garden, and (2) the remainingcontaminated Lavery till at the excavation bottom from which residual radioactivity movesupward by diffusion and enters groundwater being drawn into the well. Both the residentialgardener scenario and the resident farmer scenario were considered as indicated in Figure5-10.
The surface source that results from the contribution of contamination in soil beingremoved from the bottom of the excavation and brought to the surface and the contributionof contamination in irrigation water has the following characteristics:
* It is assumed that the contaminated material is evenly spread across the entirehypothetical garden and mixed in the soil to varying depths (the surfacecontamination zone),
* Exposure occurs from direct exposure and soil pathways associated withcontaminated soil brought to the ground surface, and
• Exposure occurs from groundwater pathways as contaminated water is drawn intothe well and used as irrigation water resulting in plant contamination and animalcontamination where these plants are used as feed. As a result, the resident isexposed to radioactivity from the plants being consumed and, in the case of theresident farmer scenario, from meat and milk produced from cattle that have beenraised on the contaminated feedstock.
The subsurface source remaining at the bottom of the excavation is assumed to havethe following characteristics:
" The diffusive movement of contamination from the excavation bottom (thesubsurface contamination zone) begins immediately after the excavation isbackfilled and results in contaminating the aquifer,
* Contaminated groundwater entering the well is a source to soil in the surfacecontamination zone because well water is used to irrigate the garden, and
* Drinking water exposure occurs from contaminated well water being used as asource of drinking water.
Table 5-1 lb shows the exposure pathways evaluated.
Table 5-11 b. Exposure Pathways for Modified Subsurface Soil DCGL Model
Exposure Pathways Resdntial Rsident_____GardenerjFarmer
External gamma radiation from contaminated soil Yes Yes
Inhalation of airborne radioactivity from re-suspended Yes Yescontaminated soil
11/6/09 3011/6/09
UPDATED DOE RESPONSES TO WVDP PHASE 1 DECOMMISSIONING PLAN RAls
a cistern and (2) with the remaining contaminated Lavery till in the excavation bottom
serving as a continuing source of contaminants to groundwater. These sources and the exposure pathways considered are described below.
Excavation Bottom Treated as Two Sources of Contamination
The excavation bottom is treated as two distinct sources: (1) a plug of contaminated soil from the excavation bottom that is brought to the surface during installation of the cistern and spread over the entire surface of the hypothetical garden. and (2) the remaining
contaminated Lavery till at the excavation bottom from which residual radioactivity moves upward by diffusion and enters groundwater being drawn into the well. Both the residential gardener scenario and the resident farmer scenario were considered as indicated in Figure 5-10.
The surface source that results from the contribution of contamination in soil being removed from the bottom of the excavation and brought to the surface and the contribution of contamination in irrigation water has the following characteristics:
• It is assumed that the contaminated material is evenly spread across the entire hypothetical garden and mixed in the soil to varying depths (the surface contamination zone).
• Exposure occurs from direct exposure and soil pathways associated with contaminated soil brought to the ground surface. and
• Exposure occurs from groundwater pathways as contaminated water is drawn into the well and used as irrigation water resulting in plant contamination and animal contamination where these plants are used as feed . As a result, the resident is exposed to radioactivity from the plants being consumed and. in the case of the resident farmer scenario. from meat and milk produced from cattle that have been raised on the contaminated feedstock.
The subsurface source remaining at the bottom of the excavation is assumed to have the following characteristics:
• The diffusive movement of contamination from the excavation bottom (the subsurface contamination zone) begins immediately after the excavation is backfilled and results in contaminating the aquifer.
• Contaminated groundwater entering the well is a source to soil in the surface contamination zone because well water is used to irrigate the garden. and
• Drinking water exposure occurs from contaminated well water being used as a source of drinking water.
Table 5-11b shows the exposure pathways evaluated.
Table 5·11 b. Exposure Pathways for Modified Subsurface Soil DCGL Model
Exposure Pathways
External gamma radiation from contaminated soil
Inhalation of airborne radioactivity from re-suspended contaminated soil
30
Residential Gardener
Yes
Yes
Resident Farmer
Yes
Yes
•
•
•

UPDATED DOE RESPONSES TO WVDP PHASE 1 DECOMMISSIONING PLAN RAIs
Table 5-11b. Exposure Pathways for Modified Subsurface Soil DCGL Model
Exposure Pathways Residential ResidentGardener Farmer
Plant ingestion (produce impacted by contaminated soil Yes Yesand groundwater contaminated by primary and secondarysources)
Meat ingestion (beef impacted by contaminated soil and No Yesgroundwater contaminated by primary and secondarysources)
Milk ingestion (impacted by contaminated soil and No Yesgroundwater contaminated by primary and secondarysources)
Aquatic food ingestion No No
Ingestion of drinking water (from groundwater Yes Yescontaminated by primary and secondary sources)
Soil ingestion Yes Yes
Radon inhalation No No
Details of the modeling including values of input parameters such
coefficients appear in the calculation package (Price 2009).
as distribution
Mathematical Models
Calculation of the combined dose utilized information from the three-dimensional nearfield STOMP finite difference model of the north plateau for groundwater transport, a modelthat estimated the drinking water dose associated with contamination from the subsurfacesource diffusing into the aquifer, and RESRAD dose to source ratios associated with unitsoil concentrations to determine the total dose from all pathways. The calculations wereimplemented with a FORTRAN language computer program that estimates time dependenthuman health impacts.2
The model performs mass balance calculations and develops concentrations over timefor three distinct areas (1) the remaining subsurface source, (2) the backfilled saturatedzone, and (3) the surface which has been contaminated with material excavated from thesubsurface source and radionuclides in irrigation water.
In order to identify controlling scenarios, the area of the contaminated zone at thesurface and the degree of mixing into the soil of the garden were varied.
The STOMP model was executed with parameter values for the contaminated area andwell pumping rates that corresponded with assumptions used in the RESRAD model for theexposure scenarios under consideration. A contaminated area of 10,000 m2 and pumpingrate of 5720 m3/y were used to evaluate the resident farmer, and a contaminated area of2,000 m2 and well pumping rate of 1140 m3/y were used to evaluate the residentialgardener scenario. The residential gardener scenario assumed several source
2 These analyses were deterministic analyses. Consideration was given to performing probabilistic analysesinstead. However, the complexity of the muflti-source model made a probabilistic analysis impractical.
11/6/09 31
•
•
•
UPDATED DOE RESPONSES TO WVDP PHASE 1 DECOMMISSIONING PLAN RAls
Table 5-11 b. Exposure Pathways for Modified Subsurface Soil DCGL Model
Exposure Pathways Residential Resident Gardener Farmer
Plant ingestion (produce impacted by contaminated soil Yes Yes and groundwater contaminated by primary and secondary sources)
Meat ingestion (beef impacted by contaminated soil and No Yes groundwater contaminated by primary and secondary sources)
Milk ingestion (impacted by contaminated soil and No Yes groundwater contaminated by primary and secondary sources)
Aquatic food ingestion No No
Ingestion of drinking water (from groundwater Yes Yes contaminated by primary and secondary sources)
Soil ingestion Yes Yes
Radon inhalation No No
Details of the modeling including values of input parameters such as distribution coefficients appear in the calculation package (Price 2009).
Mathematical Models
Calculation of the combined dose utilized information from the three-dimensional near field STOMP finite difference model of the north plateau for groundwater transport, a model
that estimated the drinking water dose associated with contamination from the subsurface source diffusing into the aquifer, and RESRAD dose to source ratios associated with unit soil concentrations to determine the total dose from aU pathways. The calculations were implemented with a FORTRAN language computer program that estimates time dependent human health impacts.2
The model performs mass balance calculations and develops concentrations over time for three distinct areas (1) the remaining subsurface source, (2) the backfilled saturated zone, and (3) the surface which has been contaminated with material excavated from the subsurface source and radionuclides in irrigation water.
In order to identify controlling scenarios, the area of the contaminated zone at the surface and the degree of mixing into the soil of the garden were varied.
The STOMP model was executed with parameter values for the contaminated area and well pumping rates that corresponded with assumptions used in the RESRAD model for the exposure scenarios under consideration. A contaminated area of 10,000 m2 and pumping rate of 5720 m3/y were used to evaluate the resident farmer, and a contaminated area of 2,000 m2 and well pumping rate of 1140 m3/y were used to evaluate the residential gardener scenario. The residential gardener scenario assumed several source
2 These analyses were deterministic analyses. Consideration was given to performing probabilistic analyses instead. However, the complexity of the multi-source model made a probabilistic analysis impractical.
11/6/09 31

UPDATED DOE RESPONSES TO WVDP PHASE 1 DECOMMISSIONING PLAN RAIS
configurations within the contaminated area for the three m3 of contaminated Lavery tillassumed to be excavated to the surface:
* Contamination is spread over the surface in a thin layer (1.5 mm thick) of undilutedtill,
" Contamination is spread over the surface and then tilled into the soil to a depth of15 cm, and
• Contamination is spread over the surface and then tilled into the soil to a depth of 1m.
The source configuration determined to be most limiting for each radionuclide was used asthe basis for the development of the subsurface DCGLs.
Results
Table 5-11 c shows the results of the analyses compared to DGCLs developed usingother conceptual models.
Table 5-11c. Subsurface Soil DCGL Comparison (pCl~g)
Cistern Well Rcreat Lagoon 3 Natural GasNuld Mut-Suc Dri~llr Hiker Erosion Well Driller Deefinsl Pea ofte
___ __ _ _ __ Models(') Mean
Am-241 6.3E+03 1.7E+04 2.7E+05 2.9E+05 1.4E+05 7.1E+03 6.8E+03
C-14 9.9E+02 2.3E+09 3.3E+08 6.4E+06 4.9E+09 3.7E+05 7.2E+05
Cm-243 3.6E+03 1.1E+04 5.OE+04 1.8E+05 1.2E+05 1.2E+03 1.1E+03
Cm-244 3.4E+04 3.3E+04 11.0E+09 3.9E+05 2.6E+05 2.3E+04 2.2E+04
Cs-137(2) 2.8E+03 6.7E+03 9.8E+05 7A4E+05 9.2E+04 4.4E+02 3.OE+02
1-129 7.5E+00 8.OE+05 1.9E+06 3.5E+05 9.2E+06 5.2E+01 6.7E+02
Np-237 1.OE+00 6.6E+03 2.7E+04 5.9E+05 6.6E+04 4.3E+00 9.3E+01
Pu-238 1.3E+04 2.0E+04 1.5E+06 2.7E+05 1.6E+05 1.5E+04 1.4E+04
Pu-239 3.1E+03 1.9E+04 2.8E+05 2.4E+05 1.5E+05 1.3E+04 1.2E+04
Pu-240 3.4E+03 1.9E+04 2.8E+05 2,4E+05 1.5E+05 1.3E+04 1.2E+04
Pu-241 5.5E+05 5.5E+05 1.7E+07 1.2E+07 4.5E+06 2.4E+05 2.5E+05
Sr-90(2) 2.8E+02 8.7E+05 1.6E+08 9.2E+06 1.1E+07 3.2E+03 3.4E+03
Tc-99 5.9E+02 7.9E+07 2.2E+08 4.7E+07 9.4E+08 1.1 E+04 1.4E+04
U-232 8.8E+01 1.6E+03 2.8E+04 4.5E+05 1.6E+04 1.OE+02 7.4E+01
U-233 2.7E+02 6.2E+04 1.3E+06 2.9E+06 4.9E+05 1.9E+02 9.9E+03
U-234 2.8E+02 6.4E+04 1.4E+06 3,1E+06 5.OE+05 2.OE+02 1.3E+04
U-235 2.9E+02 1.2E+04 42E+04 3.2E+06 1.4E+05 2.1 E+02 9.3E+02
U-238 3.OE+02 3.7E+04 1.9E+05 3.3E+06 3.6E+05 2.1E+02 4.6E+03
NOTES: (1) The lower value of the deterministic resident fanner and residential gardener DCGLs.(2) These values take into account 30 years decay.
011/6/09 32
UPDATED DOE RESPONSES TO WVDP PHASE 1 DECOMMISSIONING PLAN RAls
configurations within the contaminated area for the three m3 of contaminated Lavery till assumed to be excavated to the surface:
• Contamination is spread over the surface in a thin layer (1 .5 mm thick) of undiluted till,
• Contamination is spread over the surface and then tilled into the soil to a depth of 15 em, and
• Contamination is spread over the surface and then tilled into the soil to a depth of 1 m.
The source configuration determined to be most limiting for each radionuclide was used as the basis for the development of the subsurface DCGLs.
Results
Table 5-11 c shows the results of the analyses compared to DGCLs developed using other conceptual models.
Table 5·11 c. Subsurface Soil DCGL Comparison (pCi/g)
Nuclide
~ .1:,
M If S Cistern Well I' Recreat. I H Lagoon 3 u I- ource Driller I;,. Hiker I· , Erosion
I ~ , f' ;~' "h i i'l'i!~ "c.
,0 J:t; Basic Natural Gas .. Well Driller Determmlstlc
I'."U ' ?" ~odels(1)
Am-241 6.3E+03 1.7E+04 2.7E+05 2.9E+05 1.4E+05 7.1E+03
C-14 9.9E+02 2.3E+09 3.3E+08 6.4E+06 4.9E+09 3.7E+05
Cm-243 3.6E+03 1.1E+04 5.0E+04 1.8E+05 1.2E+05 1.2E+03
Cm-244 3.4E+04 3.3E+04 1.0E+09 3.9E+05 2.6E+05 2.3E+04
Cs-137(2) 2.8E+03 6.7E+03 9.8E+05 7.4E+05 9.2E+04 4,4E+02
1-129 7.5E+OO 8.0E+05 1.9E+06 3.5E+05 9.2E+06 5.2E+01
Np-237 1.0E+OO 6.6E+03 2.7E+04 5.9E+05 6.6E+04 4.3E+OO
Pu-238 1.3E+04 2.0E+04 1.5E+06 2.7E+05 1.6E+05 1.5E+04
Pu-239 3.1E+03 1.9E+04 2.8E+05 2.4E+05 1.5E+05 1.3E+04
Pu-240 3.4E+03 1.9E+04 2.8E+05 2.4E+05 1.5E+05 1.3E+04
Pu-241 5.5E+05 5.5E+05 1.7E+07 1.2E+07 4.5E+06 2.4E+05
Sr-9()(2) 2.8E+02 8.7E+05 1.6E+08 9.2E+06 1.1E+07 3.2E+03
Tc-99 5.9E+02 7.9E+07 2.2E+08 4.7E+07 9.4E+08 1.1E+04
U-232 8.8E+01 1.6E+03 2.8E+04 4.5E+05 1.6E+04 1.0E+02
U-233 2.7E+02 6.2E+04 1.3E+06 2.9E+06 4.9E+05 1.9E+02
U-234 2.8E+02 6.4E+04 1.4E+06 3.1E+06 5.0E+05 2.0E+02
U-235 2.9E+02 1.2E+04 4.2E+04 3,2E+06 1,4E+05 2.1E+02
U-238 3.0E+02 3.7E+04 1.9E+05 3.3E+06 3.6E+05 2. 1 E+02
NOTES: (1) The lower value of the deterministic resident farmer and residential gardener DCGLs. (2) These values lake into account 30 years decay.
11/6/09 32
ptobabilistlc Peak of the·
M~an
6.8E+03
7.2E+05
1.1E+03
2.2E+04
3.0E+02
6.7E+02
9.3E+01
1.4E+04
1.2E+04
1.2E+04
2.5E+05
3.4E+03
1.4E+04
7.4E+01
9.9E+03
1.3E+04
9.3E+02
4.6E+03
•
•
•

UPDATED DOE RESPONSES TO WVDP PHASE 1 DECOMMISSIONING PLAN RAIS
In nine cases, the DCGLs developed using other conceptual models are lower than theDCGLs developed by the multi-source model that accounts for continuing releases from thebottom of the deep excavations:
" The peak-of-the-mean probabilistic DCGLs, which did not take into accountcontinuing releases from the bottom of the deep excavations, are lower for Cm-243, Cm-244, Cs-137, and U-232; and
* The limiting deterministic DCGL from the deterministic resident farmer andresidential gardener conceptual models, which did not take into account continuingreleases from the bottom of the excavations, was lower for Pu-241, U-233, U-234,U-235, and U-238.
This situation can be attributed to conceptual model differences such as differentcontamination zone geometry.
Change the preliminary dose estimates in Section 5.4.4 as follows:
5.4.4 Preliminary Dose Assessment
Preliminary dose assessments have been performed for the remediated WMA 1 andWMA 2 excavations. These assessments made use of the maximum measuredradioactivity concentration in the Lavery till for each radionuclide as summarized in Table 5-1, and the results of modeling to develop DCGLs for 25 mrem per year and the multi-source analysis results as shown in Table 5-1 1c. The results were as follow:
WMA 1, a maximum of approximately 8 mrem a year
WMA 2, a maximum of approximately 0.2 mrem a year
Given the limited data available, these results must be viewed as order-of-magnitudeestimates. However, they do suggest that actual potential doses from the two remediatedareas are likely to be substantially below 25 mrem per year. Note that the primary dosedriver for these estimates is Sr-90, which accounts for approximately 67 percent of theestimated dose for the WMA 1 excavation and approximately 58 percent of the estimate forthe WMA 2 excavation.
Note that changes to incorporate the revised subsurface soil cleanup goals into Table 5-14 aredescribed in the updated response to RAI 5C15.
Add the following reference to Section 5.5:
Price 2009, West Valley EIS/DPlan Calculation Package, Estimates of Human HealthImpacts Due to a Sub-surface Source in the Vicinity of the Excavation of the MainPlant Process Building, Calculation DPlan-SAIC-JDP-003. Price, J., ScienceApplications International Corporation, Germantown, Maryland, October 2009.
.Attachment
(1) Recent WMA 1 Boring Logs
11/6/09 33
•
•
•
UPDATED DOE RESPONSES TO WVDP PHASE 1 DECOMMISSIONING PLAN RAls
In nine cases, the DCGLs developed using other conceptual models are lower than the DCGLs developed by the multi-source model that accounts for continuing releases from the bottom of the deep excavations:
• The peak-of-the-mean probabilistic DCGLs, which did not take into account continuing releases from the bottom of the deep excavations, are lower for Cm-243, Cm-244, Cs-137, and U-232; and
• The limiting deterministic DCGL from the deterministic resident farmer and residential gardener conceptual models, which did not take into account continuing releases from the bottom of the excavations, was lower for Pu-241 , U-233, U-234, U-235, and U-238.
This situation can be attributed to conceptual model differences such as different contamination zone geometry.
Change the preliminary dose estimates in Section 5.4.4 as follows:
5.4.4 Preliminary Dose Assessment
Preliminary dose assessments have been performed for the remediated WMA 1 and
WMA 2 excavations. These assessments made use of the maximum measured
radioactivity concentration in the Lavery till for each radionuclide as summarized in Table 5-
1, and the results of modeling to develop DCGLs for 25 mrem per year and the multisource analysis results as shown in Table 5-11c. The results were as follow:
WMA 1, a maximum of approximately 8 mrem a year
WMA 2, a maximum of approximately 0.2 mrem a year
Given the limited data available, these results must be viewed as order-of-magnitude
estimates. However, they do suggest that actual potentia l doses from the two remediated
areas are likely to be substantially below 25 mrem per year. Note that the primary dose
driver for these estimates is Sr-90, which accounts for approximately 67 percent of the estimated dose for the WMA 1 excavation and approximately 58 percent of the estimate for
the WMA 2 excavation.
Note that changes to incorporate the revised subsurface soil cleanup goals into Table 5-14 are described in the updated response to RAI 5C15.
Add the following reference to Section 5.5:
Price 2009, West Valley EISIDPlan Calculation Package, Estimates of Human Health Impacts Due to a Sub-surface Source in the Vicinity of the Excavation of the Main Plant Process Building, Calculation DPlan-SAIC-JDP-003. Price, J., Science Applications International Corporation, Germantown, Maryland, October 2009 .
. Attachment
(1) Recent WMA 1 Boring Logs
11/6/09 33

1 I
SHEET IDATE STARTI
'ATE FINISHWILLER:
OF: I HOLE/WELL NO.:SURFACE ELEVATION:
03021,416.22EO: 12/1/89
lEO: 12/12/89Empire Soils Inv.
Hamburg, New YorkJTB
BORING LOG
DAMES & MOORE NORTHINGEASTING
892,564.84480,547.64INSPECTOR:
PROJECT: WVOP OOEIRCRA wells LOCATION: SW OF CSS
JOB NUMBER: 10805-410-023 SSWMU Locale: 3
INCHES BLOWS ONDEPTH IN SAMPLE SAMPLER DESCRIPTION / NOTES
IN FEET TYPE-NO. D P NRECOVERED 0 1 8 e/12,
12 / 18 18 / 24 -J
-5
10
-15
- 20
- 25
- 30
35
24/10 SS-Ia 2412 24 S
62 16
24/19 SS-2 18 12
19 1524119 SS-3 10 13 ,
9 1324/15 SS-4 I 8 ,
24/10 SS-5 8 1it 15
24/12 SS-6 8 2 •
6 8.24/11 SS-7 12 20
S.,.. A
.4,
Moist, brown. SILT, some fine to medium suDangular gravel.little sand, trace clay, orange and green mottling. (GM)
Moist, light to dark, brown, silty SAND and fine tocoarse GRAVEL, trace clay. (GM)
Saturated, brown. (GM)
7
-H
Some silt. (GM/ML)
Saturated, brown, silty SAND and fine to coarseGRAVEL, little subangular shale fragments. (GP/ML)
Saturated. light brown with red and orange mottling. (GP/ML)24/16 as-8
29 2021 22
S
6lI 9 Saturated, brown. SILT, little fine sand, trace clay and24/15 SS-9 I 19 fine subangular gravel. Weathered till. (ML)
24/22 SS-10 4 6 8 / Wet, gray SILT, some clay, trace fine sand and fine to8 tO medium subangular gravel. Unweathered. (CL)
24/24 I 5 Some to little sand. (CL)
/S 6 Wet, gray, SILT, little clay, little fine to medium
4 6 sand and gravel, brown-red mottling. (CL)25 18 Saturated, brown-orange, fine to coarse SAND and fine
24/17 SS-13 3 8 ." to coarse subangular GRAVEL, trace clay. (SP)__ __ __ _ __ __ _ It 11 "
-4 8 Little silt and clay. (SP/SM)24122 SS-14 l I j.l•
3 6 V Saturated, brown-gray. sandy SILT, little clay, trace24/I1 SS-15 t0 12 fine to medium gravel. Unweathered. (ML/CL)
24/21 SS-16 3 a Saturated, dark gray, SILT, some clay. trace fine sand,24/2 -1 8 i /13 trace fine to medium subangular gravel. (CL)
Augered to 30.0 ft.Sampled to 32.0 ft.The water level was measured at 17.1 ft. b.g.s.-While the bottom of the augers were 30.0 ft. b.g.s..No radiation detected above background by R/S.
H& .~.
CLASSIFICATION: VISUAL (Modified Burmister),USCS METHOD OF SAMPLING: ASTM D1586-84
11/6/09 34
SHEET 1 OF: 1 HOLE/WELL NO.: 0302
DATE ST ARTED: 12/11/89 BORING LOG SURFACE ELEVATION: 1,416.22
TE FINISHED: 12/12/89 ILLER: Empire Soils Inv. • Hamburg, New York DAMES & MOORE NORTHING 892,564.84
INSPECTOR: JTB EASTING 480,547.64
PROJECT: WVOP OOE/RCRA wells COCATION: SW OF CSS
JOB NUMBER: 10805-410-023 SSWMU Locale: 3
>-INCHES BLOWS ON C)
0 DEPTH
DRIVEN / SAIo4PlE SAIo4PLER ...J DESCRIPTION / NOTES
lIN FEET TYPE-NO. ~ RECOVERED 0/8 e / 12 ~
112 / 18 118 I 24 -'
I- 24/10 55-1 6 B ~ 1\ Moist. brown. SILT. some fine to medium subangular gravel. -
f-12 24 ~~:' little sand. trace clay, orange and green mottling. (GM) -
f- 24/19 5S-2 12 14 r..~:~ -
"-19 15 ~.'/ -9 13 r../ Moist. Ught to dark. brown. silty SAND and line to
f- 5 24/19 55-3 coarse GRAVEL. trace clay. (GM) -I-
10 16 r../ I 9 13 Saturated. brown. (GM) I- 24/15 5S-4 r..~:~ II 18
1.'/ I
f-8 11 j
f- 24/10 5S-5 II 15 1../ i
f- 1O . '.- Some slit. (GM/ML) 6 16 I .• ·.~.:.
~ f- 24/12 5S-6 18 12 f- a 8
I. •.. ~:. Saturated. brown. silty SAND and fine to coarse
• 24111 S5-7 12 20 l".~:. GRAVEL. little subangular shale fragments. (GP/Ml) 1_.-_.:.
29 20 I.·.·:~ Saturated, light brown with red and orange mottling. (GP/ML) - IS 24/16 5S-8 21 22 '~:' -- a 9 111111
-- 24/15 55-9 Saturated. brown. SILT. little fine sand, trace clay and -17 19
~ fine sub angular gravel. Weathered till. (ML) - 4 e -
- 24/22 SS-IO ~ Wet, gray SILT, some clay, trace fine sand and fine to -
"- 20 8 1O medium subangular gravel. Unweathered. (CL) -5 II Some to little sand. (CU - 24124 55-II ~ -
I-_6 6 Wet, gray, SIL T, little clay, little fine to medium -
"- 24/22 S5-12 4 B sand and gravel, brown-red mottling. (Cl) -
I-25 18
r~~ Saturated, brown-orange. fine to coarse SAND and fine -I- 25 24/17 S5-13
3 8 to coarse subangular GRAVEL, trace clay. (SP) -\I 11
.<:
I-4 8 ~~< LIttle slit and clay. (SP/SM) -
I- 24/22 S5-14 1 II .~: -I- -I- 24/17 5S-15
3 6 ~ Saturated. brown-gray, sandy SIl T. little clay. trace -10 12 fine to medium gravel. Unweathered. (Ml/CL) I- 30 3 6 ~ -I- 24/21 55-16 Saturated, dark gray, SILT, some clay, trace fine sand, -
8 13 trace fine to medium sub angular gravel. (CLl I- -
•
-Augered to 30.0 ft. -Sampled to 32.0 ft.
I- 35 The water level was measured at 11.1 ft. b.g.s.- -I- While the bottom of the augers were 30.0 It. b.g., .. -I- No radiation detected above background by RIS.
l-
,,) l ..
CLASSIFICA nON: VISUAL (Modified Burmlsted,USCS METHOD OF SAMPLING: ASTM 01586-84 •
11/6/09 34

SHEET I OF: I HOLE/WELL NO.: 0402
DATE STARTED: 11/989 O R0 T I NG LO 0 G SURFACE ELEVATION: 1.416.96
STE FINISHED: 11/10/89W ILLER: Empire Soils Inv.
Hamburg, New York DAMES & MOORE NORTHING 892,668.86INSPECTOR: FJC EASTING 480,504.59PROJECT: WVOP OOE/RCRA wells LOCATION: EAST OF TRAILER J
JOB NUMBER: 10805-410-023 SSWMU Locale: 4
INCHES BLOWS ON 0DEPTH DRIVEN SAMPLE SAMPLER _j DESCRIPTION / NOTESIN FEET TYPE-NO. ~o81RECOVERED 0
__.._ . ... ...12.1..
5
10
MALL
"\.Medlum brown, silty GRAVEL and SAND, (GP)
Medium brown, SAND and GRAVEL, some silt. (SM)
115
20
25
30
35
j_-1-\Medium brown. clayey SILT, trace gravel and sand. (ML)
Moist, medium brown to dark gray. SILT, some clay,
trace gravel, trace fine sand. (ML)
Dark gray. SILT, some clay, trace gravel. (ML)151824/24 SS-I 5 8
Il 424/22 SS-2 1 4
24/23 SS-32 71 23
24/20 SS-4 4 4 Dark gray. fine SAND. trace slit. (SP)T 14 Dark gray. GRAVEL and SAND, trace slit. (GP)
24/9 SS-5 t0 27 Dark gray, fine SAND, some silt, little gravel. (SP)24/9__ SS-5_ 20 20 .:
24/18 SS-8 32 31 Dark gray. SILT and CLAY, trace gravel. (ML/CL)2 67 Dark gray. SAND, little slit. (SM)24/23 SS-7 12 18 Dark gray, SILT and CLAY. trace gravel. (ML/CL)
24124 SS-8 2 B •
20
Augered to 34 ft. / Sampled from I8 to 38 ft..The water level was measured at 28.25 ft. b.g.s.-While the bottom of the augers were 30.0 ft. b.g.s..No radiation detected above background by R/S.
.LASSIFICATION: VISUAL (Modified Burmister),USCS
11/6/09
METHOD OF SAMPLING: ASTM 01586-84See 0401 for sampling 0-18 feet
35
HOLE/WELL NO.:
OA TE ST ARTED: 11/9/89 ~HEET 1 OF: I
BORING LOG SURFACE ELEVATION: 0402
1.416.96 TE FINISHED: 11/10/89 ILLER: Empire Soils Inv.
Hamburg, New York DAMES [; MOORE NORTHING EASTING
892,668.86 480,504.59 INSPECTOR: F JC
PROJECT WVOP DOE/RCRA wells JOB NUMBER: 10805-410-023
INCHES DEPTH DRIVEN I SAj.jPLE
IN FEET RECOVERED TYPE-NO.
-- 5 .. r
-~
~ 10 ~
r
l
t-
15
t- 35 I-
) I-
24/18 SS-6
~
BLOWS ON g SAMPLER ....
o / 8 8 / 12 ~ 12 I 18118 / 24 :;
LOCATIO-N: SSWMU Locale:
DESCRIPTION I NOTES
Augered to 34 fl. / Sampled trom 18 to 38 tt..
EAST OF TRAILER J 4
The water level was measured at 28.25 ft. b.g.s.While the bottom of the augers were 30.0 ft. b.g.s .. No radlallon detected above background by R/S •
• LASSIFICA TION: VISUAL (Modified 8urmist r),USCS
11/6/09 35
METHOD OF SAMPLING: ASTM 01586-84 See 0401 for sampling 0-18 feet

SHEET I OF: 3 HOLE/WELL NO.: 0410
DATE STARTED: 11/10/89 B O RI N 3 L 0 G SURFACE ELEVATION: 1,417.15
'ATE FINISHED: 11/29/89,-. ILLER: Empire Soils Inv.
Hamburg, New York DAMES & MOORE NORTHING 892,834.68
INSPECTOR: JTB EASTING 480.428.42PROJECT: WVOP DOE/RCRA wells LOCATION: SOUTHWEST OF CTSJOB NUMBER: 10805-410-023 SSWMU Locale: 4
INCHES BLOWS ONDEPTH DRIVEN SAMPLE SAMPLER - DESCRIPTION / NOTES
IN FEET RECOVERED O 0 8 18 12-
12 /1818 24 Aprii =
5
10
15
20
25
30
- 35
I
a
a
Damp, brown to red, SILT, trace fine sand and clay,trace angular gravel, some orange mottling. (ML)
Wet to saturated, brown. SILT and fine to coarse GRAVEL.trace fine to medium sand, orange mottling. (GM)
Wet, brown. SILT and fine to medium angular GRAVEL.trace fine to medium sand, trace clay, mottled. (GM)
4a;&
r Damp, brown, SILT. trace sand, oxidized. (ML)
"7" 14 ,24/21 SS- 17 21
8 12 •24/24 SS-2 15 20
24/23 SS-3 a 8a :/______ _ ___ __ 10 14
24/23 SS-4 4 57 106 6
24/24 SS-5 13 1813 18
24/23 SS- 18 25 !;
24/15 SS-7 11 1213 18
24/3 SS-8 26 21
24/1g SS-9 II 13
Damp, gray. SILT. little fine to medium angularto subangular gravel, trace clay. unweathered. (ML)
Wet, gray, SILT and CLAY, trace angular to subangulargravel. (ML)
Saturated, gray. silty CLAY. trace fine sandand gravel. (CL)
Wet. gray, fine SAND, some silt, trace clay. (SM)
Saturated, gray, CLAY, little silt, little very fine sand,trace gravel. (CL)
Wet, gray. fine SAND and SILT, little clay at 2e.0 ft. b.g.s.
Saturated. gray, fine SAND and SILT, trace graveland clay. (SM)
Wet, gray, SILT, little fine sand. trace clay, trace fineto medium subangular gravel. (ML)
Wet. gray, SILT, little clay, trace fine sand,trace fine gravel. (CL)
-J
24/14 SS-10 12 109 14
CLASSIFICATION: VISUAL (Modified Burmister),USCS
11/6/09
METHOD OF SAMPLING: ASTM D1586-84SEE 0403 FOR ADDITIONAL SAMPLING
36
SHEET I OF: 3 HOLE/WELL NO.: 0.410
OA TE STARTED: 11/10/89 BORING LOG SURFACE ELEVATION: 1.417.15
""'ATE FINISHED: 11/29/89 . ~;ILLER: Empire Soils Inv.
Hamburg. New York DAMES & MOORE NORTHING 892.834.68
INSPECTOR: JTB EASTING 480.426.42 PROJECT: wvOP OOE/RCRA wells LOCA TION: SOUTHWEST OF CTS
JOB NUMBER: 10805- 410-023 SSWMU Locale: 4
>-INCHES BLOWS ON C)
0 DEPTH DRivEN I SAMPLE SAMPLER -' DESCRIPTION I NOTES
IN FEET TYPE~NO. ~ RECOVERED ole e I 12 ~
12 I f8 18 I 24 -' I
I-~ i\ Damp. brown to red. SIL T. trace fine sand and clay. .J · ~ .. ' trace angular gravel. some orange mottling. (ML)
f.- .' e' -Ii> ~ .. -I- .... -~ ~ .. ' l- ..•.
Wet to saturated. brown. SILT and fine to coarse GRAVEL. -~ ~.-f- 5 ..•. trace fine to medium sand. orange mottling. (GM) -~ ~.:
f- .... -f-
~ ..... -.... f-
.. -....... f-
.. -.... l- to · ~ .. i -..•. l- · ~ ".i ..•. -I- ~ .. - Wet. brown. SIl T and fine to medium angular GRAVEL • .-
• ' e' · ~ ... trace fine to medium sand. trace clay. mottled. (GM) -. ...J ..•.
::,:.' -I- t5
~ r\ Damp. brown. SILT. trace sana. olCldlzed. (ML) -
I- -I-
~ Camp. gray, SIL T, little tIne to medium angular -to sub angular gravel, trace clay. unweathered. (ML)
f- -I-
~ Wet. gray, SIl T and CLAY. trace angular to subangular -
f- 20 gravel. (Ml) -7 14
24/21 55-1 17 21 ~ Saturated, gray, silty CLAY, trace fine sand -8 12
and gravel. eCL) -24/24 55-2 15 20 ~ -
I-6 8 :y'.'~ Wet, gray, fine SAND, some slit, treee clay. (5104) -
f- 25 24/23 55-3 10 14
~ Saturated, gray, CLAY, little slit, little very fine sand, -
I-4 5 trace grevel. eeL) -
I- 24/23 55-4 7 10 ~ -
wet, gray, fine SAND an~ SILT, little clay at 26.0 ft. b.g.s. -f- a 6 I- 24/24 55-5
13 18 ~ -I- 30 13 16 Y.'() Saturated, grey, fine SAND and SIL T, trace gravel -I- 24/23 55-6
18 25 li?~ and clay. (SM) -I-
16 10
~ . Wet, gray, SIL T, little fine sand. tri!lce clay, trace tine -
I- 24/15 55-7 11 12 to medium subangular gravel. (ML) -- 13 16 ~ -
- 35 24/3 55-8 -26 21
~ - 7 7 -- 24/19 55-9 -It 13 ~ -, 12 10 Wet, gray, SIL T, little clay, trace fine sand, - 24/14 5S-10 ~ trace line gravel. (eU -9 14
CLASSIFICA TION: VISUAL (Modified Burmlsterl,USCS METHOD OF SAMPLING: ASTM 01586-84
SEE 0403 FOR ADDITIONAL SAMPLING
11/6/09 36
•
•
•

SHEET 2 OF: 3 HOLE/WELL NO.: 0410
DATE STARTED: 11/10/89 B O R I N G L 0 G SURFACE ELEVATION: 1,417.15
TE FINISHED: 11/29/89
ýILLER: Empire Soils Inv.
Hamburg. New York DAMES & MOORE NORTHING 892,834.68
INSPECTOR: JTB EASTING 480,426.42
PROJECT: WVDP DOE/RCRA wells' - LOCATION: SOUTHWEST OF CTS
JOB NUMBER: 10805-410-023 SSWMU Locale: 4
INCHES BLOWS ON 0
DEPTH DRINCI SAMPLE SAMPLER • DESCRIPTION / NOTESIN FEET RVE TYPE-NO. 2RECOVERED O / 8 " / 12 t
12 / 18 18 / 24 4
45
50
5
600
65
70
75
• i)
24/14 SS-tlWOR WOR
15 19" 7 It
24/18 SS-12 20 3024/12 SS-13 30 23
_______36 39
24/11 SS-14 12 21______44 50
2WOR3 2424/23 SS-15 26 30
8 IS1
8 I7
24/23 SS-17 20 21
12 1824/0 SS-18 22 31
24/24 SS-19 17 2211 17
24/24 SS-20 20 22
Saturated. gray, silty CLAY. trace fine gravel. (CL)
Moist to wet, gray, SILT. little fine to medium gravel.trace fine sand. trace clay. (ML)
Moist, brown, SILT, little fine to coarse gravel andclay . trace fine sand. (ML)
Moist, brownish-gray, SILT, some fine to coarse gravel,
trace clay. (ML/CL)
Moist, gray, SILT, little fine to medium subangular gravel. (ML)
24/24 SS-21WOR WOR
11 17
Saturated. gray, silty CLAY, trace fine to medium gravel. (CL)
24/18 SS-22 25 28!50Q 42
0o.
Damp. green, fine SAND, trace angular gravel (shale),little slit. (SP)
.4/1,9 SS-23 to 5036 19
14 1324/20 SS-24 1 8 3
24/21 SS-25 8 1518 21 •-
24/13 SS-26 WORI 7
24/24 SS-2T 8 T11 _ 15
Wet, medium brown, SILT, some clay. trace fine tomedium gravel. (ML)
Moist to wet, gray. SILT. little clay, trace gravel,trace sand. (ML)
Moist to wet.brownish-gray, SILT. little clay, trace sand,blueish-gray mottling. (ML)24/24 SS-28
a 1 9 -012 1 18
24/11/ SS-2914 2249 107
Moist. brown to green, silty SAND. (SM)Moist. gray, SILT and fine to coarse subangular GRAVEL.
little fine to medium sand. (ML/GM)I A
241t1 SS-3025 3334 30 -1
I, 1 *
LASSIFICATION: VISUAL
11/6/09
(Modified Burmister).USCS METHOD OF SAMPLING: ASTM 01586-84SEE 0403 FOR ADDITIONAL SAMPLING
37
HOLE/WELL NO.: 0410 iEET 2 OF: 3
OA TE STARTED: 11/10/89 BORING LOG SURF ACE ELEVA T ION: 1,417.15
TE FINISHED: 11/29/89 ILLER: Empire Solis Irw.
Hamburg, New York DAMES &, MOORE NORTHING 892,834.68
INSPECTOR: JTB EASTING 480,426.42
PROJECT WVOP DOE/RCRA wells C5CAfI0N: SOUTHWEST OF CTS
JOB NUMBER: 10805-410-023 SSWMU Locale: 4
>-INCHES BLOWS ON (!)
0 OEPTH
ORIVEN J SA~PLE SA~PLER ..J DESCRIPTION J NOTES
!N FEET RECOVERED
TYPE-NO. D / e e / 12
~ ~
112 I 18 118 / 24 -'
i- 24/14 55-II WOR WOR
~ Saturated, gray, silty CLAY. trace line gravel. (CL) -i-
15 19
~ -f- 24/18 S5-12
7 1\ -f-
20 30
~ Moist to wet, gray, SilT. little fine to medium gravel, -10 23
i- 45 24/12 SS-13 36 39
trace fine sand, trace clay. ~ML) -i-
12 21 ~ Moist, brown, SILT, little fine to coarse gravel and -
f- 24111 S5-14 44 50 clay, trace fine sand. (ML) -i- WOR3 24 ~ Moist, brownish-gray, SILT, some fine to coarse gravel, -i- 24/23 S5-15 26 30 trace clay. (ML/CL) -t- 50 8 15 ~ MOist, gray, SIl T, little fine to medium subangular gravel. (ML) -t- 24/24 S5-le 23 30
-,...
8 17 ~ -
-, 24/23 55-17 20 21 12 18 ~
--5 24/0 55-18 22 31 -
10 '13 ~ -r- 24/24 S5-19 17 22 -- II 17 ~ -- 24/24 55-20 20 22 -- 60 WOR WOR ~ Saturated, gray, silty CLAY, trace fine to medium gravel. (Cl) -- 24/24 55-21 11 17 -- -25 28 ~o:c 24/18 55-22 Damp, green, fine SAND, trace angular gravel (shale), -50 42 lo,o little slit. (SP)
10 50 p,-~'j -65 24119 SS-23 36 19 ~
-f- 14 13 E
Wet. medium brown, SILT. some clay. trace fine to -24/20 55-24 medium gr avel. (ML) -69 27 ~ -6 15 § Moist to wet. gray. SIL T, little clay. trace gravel.
f- 24/21 S5-25 18 21 E trace sand. (Mll -
70 WORS 7 ~ -I- 24/13 S5-26 11 18 ~
-.. -6 7 E - 24/24 S5-27 11 15 ~
-- 8 9 § Moist to wet,brownlsh-gray, SIL T, little clay, trace sand, -- 75 24/24 55-28 12 16 E blueish-gray mottling. (ML) -- -14 22 ~" . 24/17 55-29 ~ !'! Moist. brown to green, silty SAND. (SM)
) 49 107 Moist. gray. SIL T and fine to coarse sub angular GRAVEL.
25 33 ~.{'! lit tie fine to medium ,and. (ML/GM)
l 24/17 55-30 34 30 r.:, ., C
.LASSIFICATION: VISUAL (Modified 8urmlster),USCS
11/6/09 37
METHOD OF SAMPLING: ASTM 01586-84 SEE 0403 FOR ADDITIONAL SAMPLING

SHEET 3 OF: 3 HOLE/WELL NO.: 0410
DATE STARTED: 11/10/89 B O R I NG0 L G O SURFACE ELEVATION: 1,417.15
-" TE FINISHED: 11/29/894 ILLER: Empire Soils Inv.
Hamburg, New York DAMES &MOORE NORTHING 892,834.68
INSPECTOR: JTB EASTING 480,426.42
PROJECT: WVOP DOE/RCRA wells LOCATION: SOUTHWEST OF CTS
JOB NUMBER: 10805-410-023 SSWMU Locale: 4
INCHES BLOWS ON )-
DEPTH DRIVEN SAMPLE SAMPLER D DESCRIPTION / NOTESIN FEET RECOVERED TYPE-NO. 0 8 8 / 12-
12 _1811 / 24 _
24/14 SS-31 8 1 22__;L 28 7
Moist to wet, gray, SHALE and GRAVEL. tracesilt. trace sand. (GM)
24/7
24/0
SS-032
SS-3385
90
95
10C
105
L- 110
- 115
)
200/.3
1001.2
Moist to wet, gray, SHALE and SILT, little fine sand,- thin-bedded, fissile. Shale bedrock.
Augered to 83.5 ft..Sampled to 82.5 ft..The water level was measured at 7 ft. b.g.s-while the bottom of the augers were 32 ft. b.g.s..No radiation detected above background by R/S.
0
5
*/~CLASSIFICATION: VISUAL (Modified Burmister),USCS METHOD OF SAMPLING: ASTM 01586-84
SEE 0403 FOR ADDITIONAL SAMPLING
11/6/09 38
SHEET 3 OF: 3 HOLE/WELL NO.: 0410 DATE ST ARTED: 11/10/89 BORING LOG SURFACE ELEVATION: 1,417.15 -, HE FINISHED: 11/29/89
~ILLER: Empire Soils Inv. Hamburg, New York DAMES &. MOORE NORTHING 892,834.68
INSPECTOR: JTB EASTING 480,426.42 PROJECT: WVDP DOE/RCRA wells LOCA nON: SOUTHWEST OF CTS
JOB NUMBER: 10805-410-023 SSWMU Locale: 4
>-INCHES BLOWS ON !!l
0 DEPTH SAI4PLE ORIVEN I SAI4PLER -' DESCRIPTION I NOTES
IN FEET TYPE-NO. ~ RECOVERED 016 6 I 12 ...
12 I 18 16 I 24 :J
9 22 . ·0
I- 24/14 55-31 '. <:>. C Moist to wet, gray, SHALE and GRAVEL, trace -28 78 10· ·0 slit. trace sand . (GM) l- ...... -I-
24/7 SS-32 200/.3 Moist to wet, gray, SHALE and SIL T, little fine sand, F -
r- :"'\ thin-bedded, fissile. Shale bedrock. -- 85
24/0 55-33 100/.2 -- Augered to 83.5 ft .. -Sampled to 82.5 ft .. - -The water level was measured at 7 ft. b.g.s-r- while the bottom of the augers were 32 ft. b.g.s .. -r- No radiation detected above background by RIS. -r- 90 -r- -r- -
-.J -
95 ----
- -100 -
---
I- -I- 105 -I- -I- -[ -
-- 110 -- -- -- -- -- 115 -- -- -) -
- -CLASSIFICATION: VISUAL (MOdified Burmlster),USCS METHOD OF SAMPLING: ASTM 01586-84
SEE 0403 FOR ADDITIONAL SAMPLING
11/6/09 38
•
•

SHEET I OF: 2 HOLE/WELL NO.: 0411b
ATE STARTED: 3/27/90 BO • 0 r"- N L o G SURFACE ELEVATION: 1,416.76
TE FINISHED: 3/29/90ILLER: Empire Soils Inv.
Hamburg, New York DAMES & MOORE NORTHING 892,657.72
INSPECTOR: JTB L___ _ __ _ I EASTING 480,509.12
PROJECT: WVDP DOE/RCRA wellsJOB NUMBER: 10805-410-023
LOCAT ION:SSWMU Locale:
WEST OF- TRAILER J4
DESCRIPTION / NOTES
Medium brown, silty GRAVEL and SAND. (OL/GP)
5
10
Medium brown. SAND and GRAVEL. some silt. (SM)
20
L 25
Medium brown. clayey SILT, trace gravel, trace sand. (ML)
Dark gray. SILT, some clay, trace gravel. (ML)
Dark gray. SILT. some clay, trace gravel. (ML)
Dark gray, fine SAND, trace silt. (SP)Dark gray. GRAVEL and SAND. trace slit. (GP/GM)Dark gray, fine SAND, some slit, little gravel. (SM)
35 24/18 SS-i
Dark gray, SILT and CLAY. trace gravel. (ML/CL)Dark gray, SAND. little slit. (SM)Dark gray, SILT and CLAY, trace gravel. (ML/CL)
Saturated, gray, SILT. some clay, little fine tomedium sand, trace fine to medium subangular to angulargravel, slightly plastic, medium plastic. (ML/CL)
Saturated, gray. SILT and CLAY, trace fine to mediumsubangular to angular gravel, medium stiff. (ML/CL)
7
24/18__SS-2T---j 24/8 SS-3
718 24 r/A
I
* ASSIFICATION: VISUAL (Modified Burmister),USCS
METHOD OF SAMPLING: ASTM 01586-84SEE 0401 & 0402 FOR ADD'L SAMPLING
11/6/09 39
~EET I OF: 2 HOLE/WELL NO.: 0411b
ATE 5T ARTEO: 3/27/90 BORING LOG SURF ACE ELEVA TION: 1,416.76
TE FINISHED: 3/29/90 ILLER: Empire Soils Inv.
Hamburg, New York DAMES & MOORE NORTHING 892,657.72
INSPECTOR: JTB EASTING 480,509.12 PROJECT WVDP OOE/RCRA wells LOCATION: WEST OF TRAILER J
JOB NUMBER: 10805- 410- 023 SSWMU Locale: 4
>-INCHES BLOWS ON ~
0 DEPTH DRIVEN I
SAMPLE SAMPlER ~ DESCRIPTlON I NOTES 0 IN FEET RECOVERED
TYPE -NO. a I e 6 I 12 :I: 0-
112 I 16 118 I 24 ::;
r- ~ 1\ 4edlum brown, silty GR IEL m. (OL/GP) -I.. '~:~ r- '.' -
r- .. :. -r- I"'~:~ -r- 5 r.'.~:~ -r- t.·.::" Medium brown. SAND and GRAVEL. some slit. 15M) -
r. .. / -... r. .. / -~ r., ~:~ -I- 10 I,"~:' -I- I .... ~:· -I- ,-,.' -
I''',~.:i -1: .. :.:- -5 U111 \ Medium brown. clayey SIL T, trace gravel, trace sand. (ML) -
~ -
~ Dark gray. SIL T. some clay, trace gravel. (ML) --
~ -,.. 20 -,.. ~ -- ~ -
Dark gray. SILT. some clay, trace gravel. (MU --~~~~ 25
Dark gray, fine SAND, trace silt. (SP)
",:~ Dark gray, GRAVEL and SAND, trace slit. (GP/GM) -Dark gray. tine SAND. some silt, little gravel. (SM) -
L.. l~~; -- -'n -
~ -
- 30 Oark gray. SILT and CLAY. trace gravel. (MLleu -- ~
Dark gray, SAND. little slit. (SM) -- Dark gray. SILT and CLAY, trace gravel. (MLleL) -.
~ -
. 4 5 Saturated, gray, SILT, some clay, little tine to -
35 24/18 55-\ 7 B ~ medium sand, trace fine to medium subangular to angular -
3 8 gravel, slightly plastic, medium plastic. (MLICU -
24/18 55-2 II 19 ~ -
) 7 ! Saturated, gray, SILT and CLAY. trace fine to medium -24/8 55-3 16 24 ~ sub angular to angular gravel, medium stiff. (MLleu -
.ASSIFICA TION: VISUAL (Modified 8urmister),USCS METHOD OF SAMPLING: ASTM 01586-84 SEE 0401 Iii 040 F R A
, SAMPLING 2 0 DO L
11/6/09 39

J
SHEET 2 OF:- 2 HOLE/WELL NO.: 0411b
DATE STARTED: 3/12/90 B 0 R I N G L O G SURFACE ELEVATION: 1,416.76
A1TE FINISHED: 3/29/90
* ILLER: Empire Soils Inv.Hamburg, New York DAMES & MOORE NORTHING 892,657.72
INSPECTOR: JTB EASTING 480,509.12
PROJECT: WVOP DOE/RCRA wells LOCATION: WEST OF TRAILER J
JOB NUMBER: 10805-410-023 SSWMU Locale: 4
BLOWS ONDEPTH INCHES SAMPLE SAMPLER - DESCRIPTION / NOTESN ET DRIVEN / TP-O
IN FEET RECOVERED 0 / 8 8 / 12 -
12 /1818 /24
45
50
- 055
65
70
75
24/15 SS-417 I123 30
24124 SS-5 32 30 /Wet, dark gray. SILT, some clay, trace fine to coarsesubangular to subrounded gravel, trace fine sand.slightly plastic, dense. (ML/CL)
24/24 SS-831 3034 385 53 100 & Saturated. greenish-gray, mostly fine to coarse GRAVEL
24/18 SS-7 100/.2 and fine to medium SAND, trace silt, trace clay. (GM)0.0./ 'S Saturated, gray, medium to coarse GRAVEL, trace slit,
24/3 SS-8 '0. trace clay, trace fine sand. (GM)
68 52 0 Wet, gray, black, greenish, medium SAND. (SM)24/18 ss-g 84 59/.4 _" _';
80 100/.3 Moist, greenish, fine to coarse GRAVEL, little silt, trace sand.Dry, medium to coarse GRAVEL, trace fine sand, trace silt,
39 59 dense, undisturbed till. (GM)24/12 SS-_ 48 38 Wet, greenish-gray, silty SAND and fine to medium subangular
9 21 to subrounded GRAVEL, trace clay. (GM)24/18 SS-12 27 23
15 15 Saturated, greenish-gray, fine to medium GRAVEL and fine24/12 SS-13 14 II to medium SAND, little silt, trace clay. (GM)
12 le24/8 SS-14 20 21
28 1524/10 SS-15 21 23
30 31 Saturated, greenish-gray, silty SAND and fine to medium24/8 SS-16 30 38 GRAVEL, trace clay, loose. (GM)
5 9 Moist to wet, gray. SILT and CLAY, trace fine to medium24/12 SS-17 14 17 subangular to subrounded gravel, medium stiff. (ML/CL)
5 724/18 SS-18 6 116 15 /9
0
Augered to 88.0 ft..Sampled to 70.0 ft..The water level was measured at 44.8 ft. b.g.s. -while the bottom of the augers were at 88.0 ft. b.g.s..No radiation was detected above background by R/S.
A .1.
METHOD OF SAMPLING: ASTM 01586-84SEE 0401 & 0402 FOR AOO'L SAMPLING
CLASSIFICATION: VISUAL (Modified Burmister),USCS
11/6/09 40
SHEET 2 OF:' 2 HOLE/WELL NO.: 0411b
DATE 5T ARTED: 3/27/90 BORING [lATE FINISHED: 3/29/90
LOG SURFACE ELEVA TION: 1,416.76
.e\ILLER: Empire Soils Inv. Hamburg, New York DAMES &. MOORE NORTHING 892,657.72
INSPECTOR: JT8 EASTING 480,509.12
PROJECT: WVOP DOE/RCRA wells LOCA TION: WEST OF TRAILER J
JOB NUMBER: 10805-410-023 SSWMU Locale: 4
>-INCHES BLOWS ON (!)
DEPTH SAMPLE 0
DRIVEN I SAMPLER ~ DESCRIPTION I NOTES IN FEET TYPE-NO. ~
RECOVERED 0/8 8 I 12 I-
12 I 18 18 I 24 ::;
24/15 SS-4 17 17
~ I-23 30
-f-
20 30 ~ Wet. dl!lrk gray. SIL T. some clI!lY. trace fine to COl!lrse -I- 24/24 SS-5
35 31 subangular to subrounded gravel. trace fine sand. -
I- ~ slightly plastic. dense. (ML/CU -
45 24/24 S5-6 31 30 - 34 38
-- -
53 100 · '0
24/18 55-7 '.0.0 Saturated. greenish-gray. mostly fine to coarse GRAVEL - 100/.2 0. :.; and fine to medium SAND. trace slit. trl!lce clay. (GM) -- '.0.( -0..' . Saturated. gray. medium to coarse GRAVEL. trl!lce slit. - 24/3 SS-8 • '0 -"- 50
·o.~ trace clay. trace tine sand. (GM) -68 52
• '0
24/18 5S-9 ·.o.~ Wet, grl!lY. black. greenish. medium SAND. (SM) - 84 59/.4 · '0 -"0-
I-80 100/.3 0 -
24/10 SS-IO Moist. greenish. fine to coarse GRAVEL, little slit. trace sl!lnd. - ~ Dry. medium to cOl!lrse GRAVEL. trace tine sand. trace silt.
39 59 ~ dense, undisturbed till. (GM) -
I- 55 24112 S5-11 48 38 Wet. greenish-gray. silty SAND and tine to medium sub angular -
I- 9 21 0 to subrounded GRAVEL. trace clay. (GM) -I- 24/18 SS-12
17 23 ~ -I-
15 15 ~ Sl!Iturated. greenish-gray. tine to medium GRAVEL and fine -
"- 24/12 SS-13 14 II
to medium SAND. little slit, trace clay. (GM) -I- 60 12 16 ~
-I- 24/8 SS-I4
20 21 -I-
28 15 ~ -
I- 24/10 55-15 21 23 -
I-30 31 ~ Saturated. greenish-gray. silty SAND and fine to medIum -
I- 65 24/6 5S-16 30 38
GRAVEL. trace clay. loose. (GM) -.j l-
S 9 ~
-24/12 55-17 Moist to wet. gray. SILT and CLAY. trace fine to medium I-
14 17 sub angular to subrounded grevel. medIum stiff. (ML/CL) -r- 5 7 ~ -I- 24/18 55-18
16 15 -70 -
-Augered to 88.0 ft .. f- Sampled to 70.0 ft .. -
The water level was mel!lsured at 44.8 ft. D.g.s. - -I- while the bottom of the augers were at ee.o ft. b.g.s .• -f- 75 No radiation was detected above background by RIS. -f- --
) , _l -..
CLASSIFICATION: VISUAL (Modlfred Burmlsterl,USCS METHOD OF SAMPLING: ASTM 01586-84
SEE 0401 & 0402 FOR ADD'L SAMPLING
11/6/09 40
•
•
•

r V
HOLE/wELL NO.:
DATE STARTED:
OATE F:-NISHEO:
DRILLER:
UP-I0/27/19
S/ 30 / 0
EMPIPE SOILS
HAMBURG, NY
F. J. COHEN
SHEET I OF:
BORIN3 LOG
Dames & Moore
SURFACE ELEVATION:
GROUNOWATE DEPTH:
MEASUREMENT DATE:
NORTHING:
EASTING:
2
1408. 1
9/30/91
892694.05
480857.12INSPECTOR:
PROJECT: UP EXPt.NSION LCCATIDN: WV[)P
JOB NUMB8ER: 10B05-509 SWM'U Localie: 3
INHE BLCWS ON_
DRTN IVNC)E DESCRIPTraN / WO2!3IN FErET 0E0 ~ 05 51
______ _____12/18118/2T
Gravelly fill at surface-augered to 5 ft.
-5
20
I-
-25
-30
24/15 S IS-1.4 t-' 12
24/10 SS-2 12 13
!9 18
24/14 SS-3 10 1315 15
24/17 SS-4 i8 1010 if
C
in
Dry to oamp medium to light Drown SILT, some gray andwhite medium angular Gravel, some medium to coarseSand, little clay. C-umOly. Some rust mottling. (GM)
Dry, light brown fine SAND, some mediumto coarse subangular gray Gravel. (SP)
Moist light brown to greenish brown fine to coarse,subangular to subrounded GRAVEL, sume Sand and Silt.Loose when disturbed. Trace rust mottling. (GM)
4 4 -~
24/17 23 1215 18
-J-J
/ /
/7Moist light brown CLAY, li~tle silt, trace fine tcmedium sand. Grades to dark ;ray, some Silt, finesilty sandy layering at 1/8' intervals. (CL)t ii it | [J , .
24/24 ss-6 0U 14
14 14
24/12 S5-7 3
3 4
IC
<=0
CD;
D CQ;
ý- C
Wet gray fine to medium SANO. (SP)Grades to moist gray CLAY with! siltyGrades to wet light brown fine SAND,to coarse sand and fine gravel. (SP)brown, medium to coarse SAND. (SP)
I
laminations. (CL)little mediumGraaes to dark
Moist light brown CLAY, little silt, littlemedium to coarse gravel. (CL)Grades to saturated light brown fine to medium SAND. (SW)Grades to medium to coarse SAND and fi'e to mediumGRAVEL. (SW)
241115 7
7 5
rr• T
I24/:2 SS- 9 12
14 _13
-J-J
7 Camp brown CLAY, little silt. Graces to lark ;ray,Laminated. 4ith fine silty sandy partir.gs. (-L)
I
CLASSIFICATION: VISUAL (MODIFIED BURMISTER) , USCS
11/6/09 41
METHOD OF SAHPLIN3: ASTH D1586-B,
,~ ~:;"", ';~~~ ~~!ih. ' ~"JLE/"ELL NO.' U~-l SHEET 1 OF: 2
OATE STA~TED: ';/27/91 aORIN3 LOG SURFt.C:: ELEVATION: 140B.1('
OHE F:rIISHED: C;/30/9~ GHQUNDIoIA;::~ :!EPTH: 1
ORILLE~: E~PlnE SOILS I-1EASU~EIo1ENT DATE: 9/30/91
HA~BU~G. NY Dames & Moore NORTHING: 892694.05
!I"SPECTO~: F . J. COHEN EASTING: 480857.12
PROJECT: UR ':::XPl.NSION LC:A TION: ioIVDP
J:a NUIo18ER: 10905-509 SPI).1U Loca~e: 3
BlOlfS OH >-INCf'£S '"-! '2 g
D€PTH ~ - -J DRIVEN / ~I ~ ~ D£5CRIPT:~ / NO!_3
IN FEET PECOVE~
.... ~ 0/6 6 I 12 >-<J') >- ..... >-18 I 24 ....... 12 I IB -...
GravellY /1 ! 1 surface-auliereo 5 ft. ...•. at to f-
•... ..•.. . ,., f- ...•. •...
-.•. f-
•... ...•. -.. -f- "." •... ...•.
5 f- ., '·0· ~ .. 16 Dry to Oal!Op medium to 1 ignt Drown SILT. some gray and f- 24/15 55-1 · .', ti white meaium angular Grave 1. medium to 19 12 ->.-:' sOl'lle coarse f- · .. Sand. littIe clay. C~umOly. SOllie rust mot tl ing. (GM)
" f- .:-.-:-f-
.. .. .:-.:-
I- 10 ':'.
f- 24/10 12 t3 .' '.'. Dr'y. liQht brawn fine 5I.NO. some medium 55-2 ... · iii' ti to coarse SUbangular gray Gravel. (SP) 19 18 f- e .:- .:-
~ .; .;
.~ <:> ->.", ..... en · e'· ..
15 .:-.:- fine ' '. Moist 1 !ght bro .. n to greeniSh orown to coat-se. 10 t3 · -f- 24/14 55-3 .:- .. :- subangular to subrounCled GRAVEL. sume 5anCl and 5i It. '5 S5 , · .; Loose wl'len disturbed. Trace rust mottling. (GIo4) f- •.... ,
f- ,; . f- .....
" .... f- 20
18 10 · ... I- 24/H SS-4 '.'. 10 11 ..::' '.'" l- · e" .. l- . : .. : . ,....
~~ f- 25 ...J
...J 0 Moist 1igM brown CLAY. IHUe 5 i 1 t. trace fine to f- 24/,7 5S-:J 23 12 >- medium Grades to dar 10:. Si It. line ~ sana. .Fay. some r-
15 18 ~ slit y sanjy Layering at 1IS· intervals. (CLl "0,
~ 24/24 55-6 10 14 9.'~ Wet gray fine to mediu. SAND. (5P) ';0 '
.... 14 ,.. p,~ GraCles to '''0 i s t g~ay CLAY __ it~ si Ity laminations. (ell ';0- Graces to wet 1 ignt brown fine SAND. little medi um ... p: ~
- 30 c: ':0' to coarse sana and fine gravel. (SP) Grades to darle. 24/12 S5-7
7 3 ~ p~ Oro loin. medium to coarse SANO. (SP) - :-0-3 .. ., P'_<=: .. "0- MOist lignt brown CLAY, little s i 1 t. little <-co b.~": medium to coarse gravel. (ell - 0 .. 0
u b·_c GraOes to saturated light bro.m fine to meOium SAND, (SW) f- ':p
Po~ Grades to medilJm to coarse SI.NO and f i . e to medium f- ...,- GRI.VEL, ISIot) ..::::J c' c 5 7 f- 2ol/11 S5-9
~ Camp Orown CLAY. lit t: e silt . Grad~s to '1ar~ ;.~ay ,
f-7 6 l3minated. ... itn f 11'1 e s 11 t y sanoy partinQs. (eLI ...J 9 12 ...J
f- 24/:2 S5-9 -~ f- 14 13 f • CL4SSIFrCHrmt VISUAL (~OOIFIEO 8L.:~~rSTERJ. uscs Io1E:THOD OF SAMPLIN3: ASTM 01586-8.
11/6/09 41

i HOLE/WELL NO.:
DATE STARTED:
J DATE FINiSHEO:
DRILLER:
UP-1
9/27/911/30/91
EMPIRE SOILS
HAMBURG, NY
F. J. COHEN
BORING LOG
Dames & Moore
SHEET 2 OF:
SURFACE ELEVATION:
GROUNOWATER DEPTH:
MEASUREMENT DATE:
NORTHING:
EASTING:
2
1408. 0
13
9/30/91
892894.05
480857.12
pINSPECTOR:
PROJECT: UR EXPANSION LOCAT ION: WVOP
JOB NUMBER: 10805-509 SNvU Locale: 3
D TH INC ItS 8 LCWS ON
DEPTHEEOT IVEN SAMPLER DESCRIPTIO.' / WTESt2 VEA/ Q B 1 / 24 -_
-45
-50
-55
560
-65
-70
-75
2/A/6 SS-1O14 10 Va 124'
odmR wU Fujzo g. ay-gl'e" I iTI1 TU meuiumGRAVEL. some Clay and Silt. (GW/GC)
Graces tO camp dark gray CLAY and SILT. grades tofine sandy silty CLAY. (CL/HL)
t i I L J f
Augered to 40 ft.Sampled to 42 ft.water encountered at 5.5 ft.Boring grouted to surface,
METHOD OF SAMPLING: ASTM Di586-E 0CLASSIFICATION: VISUAL (MODIFIED BUAMISTER). USCS
11/6/09 42
!i':1f'lh[7 '~f'(;."
g~l----~---r-------' .. HOLE/W~LL NO.: UA-1 SHEET OF: 2
• DATE S I AMTED: 9/27/91 BOR I NG LOG ~ DATE FINISHE~ :/30/91
DRILLE~ E~PIRE SOILS
INSPEC TOri:
PROJECT:
JOB Nt.;~8ER:
L)(PTH iHCfJ£S IN FEET OAI V~ /
RECDVEA£Q
HA~BURG. NY F. J. COHEN
UR EXPANSION 10805-509
Dames & M.Jore
2 SURFACE ELEVA TIOt~:
GROUNO .... ATER DEPTH:
I-IEASUAEMENT DATE:
NORTHING:
EASUNG:
LOCAT IC~l:
S ....... U '-Deale:
DESCRIPTIO' / ~TES
55-W t- 214/26
t-
14 10 lV/ uamp to m01St Qray-green flne to-lnel:nurfi 8 12 ~ GRAVEL. sOllie C~ay an" Sllt. (G~/GC)
140B.10
13
9/30/91
892694.05
480857,12
WVOp , , 3
I Graaes to aamp aarx gray Cl~Y and SILT. grades tD fine sanoy silty CLAY. (CL/HLl _
... f-
45
50
f- 55 l-
I-
l-
t-
f- 60 t-
f-
65 t-
t-t-t-
t- 70 t-t-l-
f-
7S
l-
t-
t-
Augered to 40 ft. Sampled to 42 ft. Water encountered at 5.5 ft, Boring grouted to surfett.
----------------
CLASS rFICA TION: VISUAL ().100IFIEO BUH~rSTER). uscs ).1ETHOO OF SAMPLING: ASn! 01586-E
11/6/09 42 •

HOLE/WELL NO.:
ATE ST4ATEO:
c,-rE FINISHED:
P.ILLER:
UR-2
10/02/91
EMPIRE SOILS
HAMBURG, NY
.T.B. G F.J.C.
BORING LOG
Dames & Moore
SHEET i OF:
SURFACE ELEVAT:ON:
GROUNDWATER OE,7)TH:
MEASUREMENT CATE:
NORTHINCI '
EASTIIG:
±
iO7.99
±3.2
±0/02/g9
892674.56
460826.50Jý,'SPECTOP:
P POJECT: TU EXPANSION LOCATION: NVOP
J0B NUMBER: 10805-509 SWMU Locale: 3
INCRES 6 BOSODRIVEN SELETR DESCRIPTION / NOTES
RECOVERED n 0 /6 /1212 19• 18 24 _j
I
Gravelly fill at surface-augered to 5'.
4 F
24/36 55-113 13
15 16
10 20 ID24/12 SS-2
11 9
24/15 SS-3 15 329 B
24/0 SS-4
3 7
D
Met grayish-brown very fine SAND and fine to mediumsubangular GRAVEL, little silt. loose. (SP)Grades to camp light brown-yellow very fine sandy SILTand fine to medium subangular GRAVEL, trace clay,firm to friable, oxidized, mot:led, non-plastic.(Rock in end of spoon) (GM)
Grades to moist. (GM)
Moist coarse angular GRAVEL, some brown Silt andClay, little coarse sand. (GM)
Grades to wet, some medium to coarse black, brown.gray Sand, little clay. (GW)
20
25
30
35
SS-5WOR
l.,-~. t
24/19 SS-6 7
1 _ 10
-J-j
7
/
Moist gray CLAY, little silt and fine to medium sand,trace gravel.Grades to brown, layering at ./8' intervals, somesilty partings. (CL)
-, .~ 14* ~ 4.
I24/Wi SS-7 7 7
6 5UUL
S4.
p6
0~ C* 0-~. C
0
0C
5' Net fine to coarse subangular SAND and medium tocoarse black, pink. gray GRAVEL, some clay, littlesilt. (SM)
Wet brown-Gray SILT. some medium argular Gravel. (S'4)Grades to wet gray-green fine to mediLm SAND, somemedium to coarse subangular Gravel, little clay. (SW)24/14 SS-8 20 1 17
10 97
Grades to moist gray CLAY, little silt, littlemedium gravel and sand. (CLi
Augered to 37 ft.- Grouted to surface.I
tJI
WCLASS[FICATION:11/6/09
VISUAL (MODIFIED BURMISTER), USCS43
METHOD OF SAMPLING: ASTM 015B6-84
,,,c·.-'~JrY' :;--- -. ; ,_,.,t-",:,
:~ ~.~'.
1~~·.~ .... :'111 ' .. .. ..
E/"ELL NO.: UR-2 SHEET 1 OF: 1
ATE S T Ar:1TEO: 10/01/91 BORING LOG SURFACE ELEVU ~ON: 1J07.99
C,\TE FINISHED: 10/02/91 GROUSQWATEA OEo"'rH: 13.2
CRILLER: E~PIRE SOILS ~E A SURE~E ~n DATE: 10/02/91
HA.~BURG, NY Dames ~ Maara NORTHHJG' 892674.56
:~;SPEC TCR: J.T.B. b F.J.C. ·EA.SiI~JG: 480826.50
PDJECT: Uri EXPANSION LOCA. TION: wvop J83 NU~BER: !O805-509 SWI-IU Lec a] e: 3
a'CHES BlOIjS ON >-w 0 '-"
:f?nl ....J ::c SA~L£R I~ 0
DRIVEN / esc..!... -' DESCRIPTION f NOTES ! H Ft'...£T
RECOVERED ~ Q.. o I 6 6 I 12
§ IJl >-- 12 / 19 liB / 24
::; ,- . Gravelly f iII at surface-au\jered to 50.
t- 1-" -1 ~~.:
t- I~" -t- I·~:.:. -fo-
1-::.. -I,~::. f- 5 n 13 ~" ..•. wet grayisn-orown very fine SAND and fine to medium t- 24/16 55-1
~ 16 r-:::/ suDangular G~AVEL. little si It. loose. (SP) -t-
/io Grades to damp light orown-yellow .ery fine sanoy 5ILT -
- l- and fine to medium suoangular GRAVEL. trace clay. -- ' ." firm to friaOle, oxiCliZed. mot tled. non-plastiC. -p .• (Aock in end of spoon) (GM) ... 10
20 10 Grades to lIoist. (GH) -... 24/12 55-2
11 9 ~: -
f- ~ I,··, ~-.
~ [// -",. f- 15
15 12 r~/. loIoist coarse angular GJ:lAVEL. some brown 5i It and -t- 24/15 55-3
9_ a ~:> Clay. li':tle coarse sand. (GI4) -t- ' ',' -t- r·:: '.' -f0- r/ -t- 20 ',' -6 5 t\:~:· t- 24/0 55-4
3 7 -
t- :.:-~: -WO~ r.:-/ Grades to wet. some medium to coarse black. brown.
t- 24/3 55-5 gray Sand. little clay. (GW) -t- -
~ -
t- 25 5 7_ ~
loIoist gray CLA'{ • little silt and fine to medium sand. -t- 24/19 SS-6
9 10 ~ trace gravel. -
t- Grades to bro.,.n. layering at liS' intervals, some -I-
si lty partings. (CL)
I-~,::\ -
~!!i 30
!5 7 5' Wet fine to coarse suOangular SANO and medium to -24/11 55-7 coarse Dlack, pink. gray GRAVEL. some clay. little -
5 5
!~ si It. (Sw) -f- -I- -
;~~ ~et ~rown-cray SILT. some medium ar,gular Gravel. (:;\.1)
- 35 20 17 Grades to "et gray-green fine to medlt.:m SAND. some -- 24/14 55-8 // medium to coarse subangular Gr3vel. litt!e clay. (5~) -
10 9 Grades to moist gray CLAY. little silt. little I medium crave I and sand. (eU
Augered to 37 ft.- Grouted to surface, _.
'!' CLASSIFICAT ~ON. VISUAL (1-10DIFIED BURIoHSTER). USCS ~ETHOO OF SA~PLING. ASTI-I 01586-e4 11/6/09 43

4-'77 7
HOLE/WELL N3.:
DATE STARTED:
DATE FINISHED:
DRILLER:
UP-3
t1/02/g9
iC/04/91
EMPIRE SOILS
HAMBURG, NY
F.J.C.
BORING LOG
Dames & Moore
SHEET i OF:
SURFACE ELEVATION:
GROUNDWATER DEPTH:
MEASUREMENT DATE:
NORTHING:
EAST:NG:
2
1407 77
20
10/02/91
892684.95
4800807.97INSPECTOR:
PRO JEC T: UR EXPANSION LOCATION: WVD?
JOB NUMBEIR: 10805-509 SWHU Locale: 3
BLOWS ON -IN FEET DRIVEN IPLER - - DESCPIPTION / NOTES
RECOVERED - 01:/ 6 /12__- I___2 / 1 8 1,8 / 24 __
5
10
15
-20
-25
30
35
Gravelly fill at surface-augered to 5'.
24/18 SS- 15 gg 7
12 724/10 SS-2
7 8
24/12 SS-3 6
7 5
z,0-m=
Dry brown fine to coarse subangular GRAVEL, gray,brown, light Drown fine to medium SAND, littleDrown clay. (GW)
Grades to wet. (GW)
24/9 55-41g 12
12 12
I___ I_ ____
_ 13 j 324/15 SS-5 12 a13 j ,13
-J
7
/
7
Moist light brown CLAY, some Silt, some medium tocoarse sand and fine subangular gravel. (CL)
Grades to dark gray. (CL)
24/14 ES-59 74 5
5aJ
ýD. C
Net brown, gray, black sLoangular to subrounded GRAVELand medium to coarse SAND, some Clay. little silt. (GC)
wet Drown fine to medium SAND, some fine Gravel. (SW)Graces to gray-green. some Clay. (SC/GC)+ 4-
I25 2024/:5 SS-7 .. .. 25 to
14
SS-88 1222 23
A
-J-J
V wet gray CLAY, some Silt. (CL) Grades to damp, littlefine to medium gravel, trace sand. (CL)
I I Auaered to 39 ft.-Groputed to surface.
METHOD OF SAMPLING: ASTH 01525-84CLASSIFICIT[ON: VISUAL (MODIFIED BURMISTER). USCS11/6/09 44
~""-,~;: ~;\; .. "",' "!I.~'~ fJ:_ ,.~ :'jI ~~(;!(~ rII HOLE/WELL N.). : UP'-3 SHEEr 1 OF: 2
DATE SHRTE:): 10/02/91 BORING LOG SURFACE ELEVATION: 1407.77
~ DATE FINISHED: 10/04/91 GRDUN::lWATER ~EPTH: 20 • DRILLER: E~PIRE SOILS HEASU~01ENT DATE: 10/02/91
HA~BURG. ~N Dames & ~are NORTHING: 892684.93
INsoECTOR: F.J.C. EAST:NG: 480.807.97
PRC -'=:C T: UR EXPANSION LOCATION: WVO? JOB Nt.:~6ER: 10805-509 SWIo1U Locale: 3
INCrES BlOI/S ON >-
DEPTH ~2 s.uPill ...... 8 DRIVEN I ~' ~
...J DESCRIpTiON / NOTES IN FEET -c~ ..
RECOVER£!) 0/6 6 / 12 .:: "';:: -12 / 18 18 I 24 ...J
...... Gravelly fill at surtace-augered 5' . ....... to
f- , .. -.. .,. .. -... f- ,::.:,~.: -t- ... ". -.. , .... _.,. - ...... --...
5 .......
6 9 . -.. '", . Dry DroOoln fine to coarse subangular GRAVEL, gray.
~ '24/18 55-1 '.'. brown, lignt orown fine to meaium SAND. little -9 7 10:':': ~
..... - Drown clay. (GWI -f- .' -.', -t- 0· .. •. '. -t- 10
.... .:-.. :-~ 'e', -12 7 ~ ia'::~:, ~ 24/10 55-2 -
7 8 o ..... f- ;;; ~:-~: -f-
.... -f-
.::.-:: .. .. -- 15 .: '.:. -
4 6 .... Grades to wet. (GW) - 24/12 55-3 .:' .• :' -7 6 r- ':'. -•
r-.: :.-:. . ,; -.. '
f- .:-.. :- -~ 20 '.'. r 24/9 5S-4
19 12
~ )o4oist ligl'lt brown CLAY. sOllie Si It. some medium to coarse sand and fine suoangular Q~i'lvel. (ell -
12 12 ~
~ -
I- -f-
~~ -
f- 25 -12 a Grades to dark gray. (eLI
I- 24/15 5S-5 -f-
13 13 '~ -f-
~ -
f- -30 -
9 7 ,0, Wet black sl..:nangular to subrounded G~AVEL f- 24/14 =5-6 b·( brown. gray. -
t- 4 5 ;: ~<?~ ana me a i UIII to coarse SANO. some Clay. little s i It. (GCl 30 -
f- p.'.: -• ··0·
f- ~ F.{'-<: -co -0 Wet Drown fine to medium SAND. some fine Gra vel. (Sw) f- 35 o p'. ( GrllOes to grey-green. some Clay. {SC/GCI
~ 80. -
f- 24/l5 5S-7 25 10 14 '", " ~
Wet gray CUI'. sOllie 5i It. leu GraOes to aamp. little f- ..J
...J fine to .ellium gravel. trace sand. (eU -e 12 -f- 24/15 55-8 .... V; -
f-22 23 ~
Auoered to 39 ft.-Grouted to surface.
CLASSIFICf. HON: VISUAL (1010DIFIED 8UAIo1ISTERl. uses Io1ETHOD OF SAIo1PLING: ASTM 015:5-8~ • 11/6/09 44

14-(4..0 Vt~
tO I i
I I rta.
I Z,. I,
24
221
t0'l.tIIG
30'
:is
S........0
Ui
IS_
8ORING 16M11LL - :,-•1 L
f+fTylQ f~tll A WAY•l I40II1 JaL.A.1L
It 11
0 A
I i| SILT CLAY
JcwCL.AW. SILT.7
I 3JA.1io ill'
1.11,1
CL 8p0w-(sh.4AAV SILTY44cz F 9*Qcmrs
Jcj7
ir* iapi ;..(•vtL
,.11'u 0 I(10 -LAII
r114 -7is. L 6IN r5s
313 .4SAM*ll,• ,IVEL mllt'UIf
r
CLAY aIT% IJAAVCL k
ltl
LOG OF BORINGS
LOG OF SORING 16 j
11/6/09 45
o II)
• BORING 16 lIHLLa ".t .. ,tS,.U
/'/o'l.l, 'l(V."O .. t ... ,oe II'
I I :,~., ~ "" Me" ::t.Art.,. ~ [\, r _I rilt tCIII, ~"''''lL.
<fOOlS _ 'lOCo"" ... lTei 'OCUli' r. rQ~ '"1,..,.", . .t
~ .... TTU~ rn _ :.&. -II",," ~, ;\.Ior.
s u.r .. "-0 -. r .. ...c,.. ,~&.u ••
o
I •• ... ~u. leo. " ....... '.rs ... ,,,
'0 us-.u ..
., 11~1J1 •
to
~I" I-
1'~ln ~ mr~ C\.lo' 131.1 ~ ~
'lie -1~"'" cu.'. SH.r, suo. ~&W, ... ",UfU. -< 1 J3J~.~
1"~I:' • 1
IS
30
-.. :
I I US-I~'. •
i.~ '-- '/6 Ut.,. ~ I 1l""1-l'O CI. ~.U".~'" !'u.rY cu. .... ",. '''.\ilU.
I. _oa , 'IQltprs
! l' ~
• -0
I I,.s-I~ '. <.
'0
I I .... .,. •
I I ,'''.'01 •
.~ I I
I "~IU . , , 13'17. J..
I
I I , /t,.l1 1,,\1'.
I I
I '-r' • I ~-:
I, '....;,\ J :""" . , c. , , \,~ f i .-
sa
'0
." t5
ro
LOG OF BORINGS
• LOG OF BORING 1 6 ~'I
11/6/09 45

I7-(~2~
I.3"~t %r04fl low 2100( qua '
.o
m
11
I
.0
14
so
25
do
13'-1,.'B u - I - I
-i . - - - lr-
SI e-t
t " 1.0
....-..-. - -I... - . - - ,
SCRING 17
))1? 7 tC ~IICL 2"IICMe RAT( MrL
'-Q' MIW IMMI Of C0A ?
~'/3 16,7C INGWISN-45*1 SILTy
;.A&vgL
r CLAV 'ItI LATCOl 31
AV, Mt.? SAM0 6
*CLAY '.Ith LATIJIS Of~
11.I 61 43 *IL r
LAI, Sit *0
C
6~) ,-J * 4 ~ Jl
6~~
I,'.
L r~
LOG OF BORINGS
I LOG OF 80RING 17I
011/6/09 46
• 8eRING 17 :WIU.(::' I,.IT.-t.a
.- - QOG
I
I I I :~ ~~
.~ 'L ... U \tl..' _If .... c.".( ',.I'.(\,.
I \ .,,,.
'000" , 'I'>OU ~U."'IC .... flU "(SUo' i. 'J"U "J 1-1»),1
i .awe .. UfU •• 'J' CUf. ill..', 'i •• O.
'"" ;U,(1. .. lOa ,O£,"",.rl
10 I I ltoolll I-
U
to
1.
I 11lI-1" •• I
, , 17 J)J' 7 1~1~US.llI '.
I 101
'I. '_UM,,"", SlLr. '!.Ar w'OI !.Aft., " _·n '''''01 ,.',;!
:i I> ... i 1 I
7 'lI-llI I- '.- "IUll'~~' 'rr. SlLr, s ...... :.IA'n .
30
.. .. -.! !
lS . !I
-"
..
.. 1'h~ , .. - ~ - ~
I' I 1 .... 1l 5/ IJ1',7\J->\"~.,. ~",,~
I" 'lO .. nM,~' '1I.r, C'-', ~If" '-'II'S ", .....U.
I ,
~..,.-" ./ 1" Go' 7'1.11 I 1
I , ...... 0'1
\~'o~ J . • '0
sa
...
~
10
., ,"~' 1 ~~;~ -!,
.. ~ . , '. / .'.\ ,,\,;1'°, , .. j
I t ' ,.,1 i _~, 4 ~" ... " \ !j • t" ;,->1.,. d " --I ,:,t J I
I " j , I,;.:;' ...
.,:.-\ ,~
(~ :~\ J
,'I ~ I "
j
I I I ,/\ I "'\ "".' - .,
" , , ( :\) i. <, , ~,
'I I I .~
.
LOG OF BORINGS
LOG OF 80RING 17 • 11/6/09 46

Table 3.--Logs of welZl
62-PAM63 Amgred January 1, 1962. tAt 4V26'2?7.Land'RT 7-54% AAltitude 1.402.34 ft. Loi fromrecords of lw York Ster Dept. ft Public Works,Bureau of Soil Imcb~ateca.
(.- ft ham ailt. trace to soem and aud stone
7-40 Slit, same clay
bi-PAkA Mgered January 3, tvo. Let 41o26'27,.
Loot 7'54%. Altitude 1.407.13 ft. Log from
recorda of No Tort State Dept. st Public retra,
Bureaeu of Soil @chsaatcs.
0-4 ft Me S~les takes; botroa of hole 6 ft
(See loa of PAM61)
62-PAN5 Aureqad JaInuary 1. l b2. Ltc 62126-40,.Lroq 7S37'43°. Altitude 1,433.10 ft. Log fromrecords of Mew York Stcae Dept. of Public Works,bureau ot Soil Macbsoics.
0-5 ft)-16
1'-a121
grow* slit, trace ot clay sud stone
Cray silt. soms clay ($oft and plastic)
Cray milt sand suigular shal trunces
Possible shatle bedrock
and Test 6or'71g3 (continued)62-PAN7O 6orod JMauArV 9. 1146. tlc 4Z"271*33-Loa- 758 39'3U'. Alticudse 1.36.01 ft. Log fromrecords at Wew Yoro Stara Dept. of Public Warta,Bureou of atl Mecbanice.
0-10 mo almple take*; boctom at bole 10 ft(See log of PP.LA59)
62-P•ayt Amgered Jauary 10-Il, 1962, LatI-0 LoAl 7B'31220 altitude 1,422.52 ft.
Lag trom records of Nev York State Dept. ofPublic Warko, Sure*" of Soll febchsalcm.
0-1/ ft Brow silt, eome scose sd ood (bord)il-23 Cray sit, trees of clay sad eta
(madium sad plastic)23-2v Gray sand aod silt28-36.5 Gry slit, trace to sam clay, trace of
etoat and very fine sand (emdtum sodplastic)
62-PFIA2 aU4srd January l1,,1942. Let 42027101'.Long---- I '22". AAltitude 1,422.80 ft. Log irearecords of iew York State Dept. of Public wdoek,bureau of SalL mechanics.
0-10 ft *a temples takes; botts* of bole 10 ft(See Los of PAR71)
62-PANT) Ausiorad January [1. 19i2. Let 42*27*01',L-o-- 1•739-22. Atcitude 1,422.O0 it. Log fromrecords of New York State Dept. oa Public Works,Bureau of Sail aechomics.
0-2.1 ft No samples takes; bottom of hole 25 ft(See log of PAKi)
62-PAJ74 augered January 12, 192a. Let 4Zo'2*3St°Lag 7--3'22'. Altitude 1,446.59 ft. Lag fromrecords of New York Staco Dept. of Public VrkoftBureau of Soil Mechamics.
0-8 fc Yellow brows silt trace of sand andsNC (hard)
8-17 Gray brows Out, trace to scam waacktredshmalo (very hard)
17-21 Brows sLIt, Croea to seas weathered shaleand clay (very bard)
below 21 Probable shale bedrock
bi-PAMbO Aaagarsd January 4. 1962. Let 42"26'50".
LoNg- l63e'1'. Altltude 1,358.74 ft. Log tr a
records of Mew York Scoct Dept. of Public Worts,
Buc.ou of Soil Me.rhaoica.
0-5 cc
10-30
30-40
hoist brmw silt. trace at clay
0ct gray slit sad very flEe seandWOt gcry silt. trace of very fine Bsad
sad clayWet gray silt, sme clay (soft andplastic)
62-AN61 •Augred Jaeuary 4, 1962. LAt 42*26'50,.Long 75"33'16". Altitude 1,368.67 ft. Log tromrecords of Pew York State Dept. of public oarks,Bureau of Sail mechanics.
0-) f€ &tro eilt5-7 Silt san very time &aid7-9 Sand
62-PAMA Augored January 5. M9I2. LCt 42'26'41'Long 74A'Ab Altitude I1.95.4U ft. Log froerecords of New York State Dept. of Public Warts,Ibreau of Soil Mechanics.
0-10 ft Hoist Ira" aIlt. trace of clay10-05 NOlet gray milt, agm Clay, roace of
scane (mdl,.. snd ptsettc)
2-PAh69 Algered Janeury 5-9, i*6Z. Let 42"26'29",Loe" 74*39'11?. Altitude 1,472.23 ft. Log fromerecords of .ýw York Stats Dept. at Public Worka,urgem of S.1i Mechanics.
0-10 Poisc brown silt, trace of ClAyf- I? Dry brown silt, trace to sf m•atchorad
shalebelow 17 Probable *halo bedrock
62-PAN75 auoared January It, 1962.LoqG 76*31)0"U. Altitude 1,424.95record. ci Sew York State Dept. of
ures,. of. Soil Mechanics.
Let 42"2*134',ft. Log fromPublic Warta,
0-12 ft Ie samples takes; bottom of hole J2 ft(Sea 10o of PA89S)
A2-PAN746 A€aerd Januory 10, 1062.Loag 76 ]V'Se. AlCItudo 1",123.00records of New Yort stats Dept. oasurseu of Soil Nschmeice.
Let 42"20,1I),ft. Lag fromPublic Works,
U-5 it Brows elit. trace of clay and scone,-9 Gray brow silt, trota of shale f orapatse
(angular) and cispbelow 9 Probable *hale bedrock
25
4711/6/09
-.....
'I'a.b~e J. --Logs of iJelZs and Test: dor-ing:; (continued)
U-'~l .... n." J ..... ry J. "U. yt 41'2,'21·. I.-c 111·l1·~." ... .1tu ..... 1.402 •• te. tol troe r.c:oU. ot ... 'Con Sc.c. o.pc. of /'\I,Ue Wer1 ... ...... _ 0' SoU .. eMale...
u-7 It. 7...0
.... _ IUC, true co _ HD4 ..... aCoM SHe ..... cu.,
'1-'~ AMI.r .. J.DW.r, 1. 1,.1. Llc 42"2t'27". Loac 7"l1·"·, Alclc~. 1.401.1) fC. Lot froe nc.orU 0' ... Ton SUC. Dlpe. 0' "'bHc IoIon., ... t .... of SoU "'CUelca.
~ tc ... .,1 •• t .. _. Met ... o( hoi •• tt (Se. lac of ,.-)
fIt-, .... ~ .... er •• J .... u., •• 19ft2. YC 'Z·U'40·, Lrac 1,;)1'4)". Alele ..... 1.4)).10 ft. Lo. froe r.cor •• of ... 'Cork Sc.c. o.pc. of I'\Ibltc Work •• ... r .... 0' Soli Naeb •• le ••
0-5 fe )-16
1&-21 2l
• rowe '11t. crac. 0' cia, &ad acone Cuy 1I1c, ._ cia, (.oft IIftd pluctc) Cr., ollt .ad .neul.r ,hal. tr .... fte. 'o,albl. a~l. be4rock
&%-, ..... ~ •• r •• J.D~r' '. I'bl. y, .1·l.·~O·. IAq 7,il,',,·. Alcic ..... 1,1N.H. te. Lol fr_ r.cord. of ... lork Sc.,. o.pt. of I'\Ib11C Work., ... ra .. of SoU ",-c.h.olC ••
NDl.t browa .11t. cr.c. of cl., IMt au, aUt &ad "ry U ........ ~t ,f., .llc, cr.c. of w.ry tine aaDd ..... cloy ~t ,r.y .llc. ~ c1., (.ofc ... pl""e)
62-'AH67 4wC.r~ J ..... ry 4, 19t2. Lac 42"2t'50". Loo, 1s·le'a·, .utie ..... I.lll8," tc. Lo, fro. r.cord. of "v fork Sc.,. Dep:. of 'ublle Won., lure ... 01 SoU Nad .... le ••
0-) " 't0V8 Illl )-1 Sill ..... y.t)' tiM .. 1M 1-9 lOa ..
tIl-'UIlo • ..... ar •• J._ry ). 1.'1. Lolli Ii' ... • •• •• Altic .... I.Jn.4u raeor4. of .ew lork Se.c. DoDe. of .... r .... of SoU Naell •• le..,
Lou U"Z6'41", te. Lol hoe /'\IbUc Won.,
0-10 tc 10-4)
.. laC ,.".,. 8Ue. trac. of ca., Mol., ,r., 8111 ..... cl.y, crae. of ec_ (_1_ .... ,luelc)
U·,-u.t "",or .. J ..... t)' S-t, J~Z. LaC 'loa'a·. LotIC 1")"11·, Altlc ..... 1.412.n ft. Lol tr_ rocor". 01 ~ fork Suu Dept. 01 /'\I."e IoIor"a, "u .. of s..U .. chaalc ••
0-10 11r17
"Ol., ~,_ .Uc. trac. 0' c", 0'r1 ...... 1lC. craea to _ "'''''.r.d • "al. !'To .... I •• " .... boo'~<K"
25
11/6/09 47
62-,.-.10 .... ud J ..... ry t, 19112. Lac 41'21'''-, Loac lS'lt')U-. Alcle ..... l.l",O~ ft. Lol tt_ r.cord. 01 _ ron St.n De,t. of /'\I'llc ... n •• ... ..... at Soli ",-cb.ftlel •
0-10 110 .... u.. tall •• : bott_ of bal. 10 fC (Se. lac 01 ','.ItS,)
U-'AII11 "'Cor"" JaalUt)' 10-11, '96Z. Lac '2'21'01". Lo .. 7.·1"Z2". Alt'c~. 1.4Z2.52 tc. IAI h_ rocor ... , .... York 'hU Dlpc. of PubLic Wa~o, "'f._ of !oll NadllAlca •
0-11 Ic IT-U
Irova .11C, ..... co ....... DeDI (b.~) Cr., aile. crae. 0' cl., ~ .t ... (_41_ ..... pla.,1c) Cr., .oa" .~ .llt Or., allc, tr.e. co .... cia,. tr.ce 01 ec_ .1Id wary UIIoI .... <Mdl_ ... pla.tic)
IIZ-PAII7! ........ d J ..... ry 10, ."U • LoDll.J lf·n". Altltlld. 1,412.80 raeord. 0' -.. York S,.,e Do,t. 01 "'Uh of SoU ltau.Dic ••
LaC 42·11'01", fc. Lot ft_ PIa~lI c Wadl"
0--10 tc ...... 1 •• talla •• Meto. of bal. 10 'C ($e. lOS of ,AK11)
~1·'~7) Au,.r.d J.~.r, II, 1"2. La, '2"27'0'·, IAq 1,·'t'U·. .uu, ..... 1.4U,'0 h. Lo. tr_ record. of __ fork SC." Dopt. of .... bUe len., ..., .... of SoU IIoc.ll ... le...
o-u It Il1O • .,1 .. cu.a; bon_ of bole 2' Ie (Se. 101 of 'WI)
'Z-'AH74 AMI.r .. J .... '1 12. ".2. Lac .2'2.",·, LaQi 7."19'22-. A1CIE~' I ••••• " Ie. Lot ft_ r.cord. 0' ... lotk St.,. De,t. 0' 'ublle Work, .ur .... 01 Sojl ",ch.alca.
0-. It 'ellow brova ellc cr.e. 01 •• nd ... ., .... (bord) .
1-17 1;,., It,_ .Uc. croc. co • __ .CI'.,.... .bal. (ury bord)
17-21 .rova .11c. ttac. co 10" ~.t"r.d ahel. ..... e1., (y.ry bord)
below 21 ,.. .... bl. ,bola Melroc:lI
'Z-PAH1' Auc.r.d J.ft~r1 I •• 1'.1. La.., 1,",.,110-. AlUCud. 1.4Z'.9S r.cord. cf ... tork Sur. Dopc. 01 lure ... 01. So11 Naeha"lc ••
Lac '1·1'-'4'. h. Lot fro. ""ltHc Work.,
0-12 If .......... , ..... : bou_ of hole U Ie (Se. 10, of ,AMI"
&2-,AH7. AYI.r .. J ..... r' 10, "'1, ~c '1·1.'11·. 1..0 .. 1.')11",·. &.I.c'e~. f,Ul.OO te. Lol tr_ ucor •• of ... " Yon lur. De,t. of /'\IbUc Warh, lut ... 0( 1011 ",c!\a,lu.
U-' It .rowe .11e. cr.e. 01 cl.y and ,co~ ,., ~r., "owe .11C. tr.c. 01 1 .. 1. Ir ..... ' • ('neul.,) .nd cl.,
b.Low, 'rob.bl •• hal. badrocll

0 'ý5
SCRING 24)N 6 . 1-#43
(L L"A t 12 op I 10 .2 V
I0
23
I I~t.I21I3I-'~2
- I 181.114
1~.I0Z
____________________ _________ I IJ1~IZ8
iT ~
~l?~.12S
ID____________
___________ f-i___
___
aI
Ul
a
II
ii
~. I s.o~. .t*t~uc *:, ~I3, ~:'~ '~.o,% I ~U4LI. ~3A~(L a ~8I1 ~SaQ.(1.t5
:iii
Mb~I 1,60 1.(TM TOACC 2f SJ'AIL ISAa(L
40CA FUGMICS I
ý.Z UyfAL 3av
%• ! ec
G*6-
SILrT cIAY wir5 sqN SQ. AvIL
"A
ZIs
'a'
-I
IZ~~? $
01W.6 KUSrývt
011.6 091 sA5.
,0
so
is
LOG OF BORINGS
I ~LOG _.F 8CRING 24emV
11/6/09 48
---------------- .---....
., Of
BeRING 2.4 »ILI,O l.'·"J •
•
."
LOG OF BORINGS
LOG :F 8eRING 24 • 11/6/09 48

BORING 25-OILLL0 Z-3--
CtLUI'A f" ON t -t Z .$5 '
UI
z
12%-Il 1
15~~~~.2 Q'-
- - - 0-1
"AA0E ;. 0x- '4(iF
9
,,:.xADI0M A491 1 11vAtL b 90C, FNrAQ(t0t$S
(;*AVCL 4100584 OUT!
$*afI!MS*-lV;AA SILTY CLAY tr%~ rSAC( If
14OWN CLAYEY FIN( SAhO0
8POW16 Spq.Q460 SILTY CLAY VINM S01SIKLL aXA VO(L
CL.
,GRADING SAROT A. -O-1VCL.
Wit $&(]-a $ SI LO s.? '10 ý.tiac Or Z~of.000, J(9 ~ a
La*# h :p. I ý9
(;,AO9IPG LASS SANG A ;0AV0L)
if7pa0lft on3( ;24ycf.)
Aft AV c'*0 hA L *c , .aCT r
J(St040"mlLOG OF BORINGS
1 49LOG OF 80RING 25
• BORING 25 :.I1l'O l.) •• J
!I.(',"rroli t.tl.,),'
! I
I )c. i5 I- ~ iQi~;~;:~". ~!ll ~ ':~'\.:o\ _tr .. \,.. ·,.ilc,;,,, i. "~-::~. ,:
~ UC".~ ~~_,~ ':." Il'. ;'00, i .... H.OOca
fl .... 1 " [.
..~.g, .. ~ ....0., ~lAv'L • '00' 'Ua-UlrS
,.".110 I-
\ , 'z-..." ..
(~'''(L -a.OI .... OUf 1
~ tlO_U"·'." lillY CLAY _I II< ruu J, '(JII' ';'.V(L
, !IS.IO. se IItOwoo CLAY(Y 'tN( $£00 20
l' II.J ~ - : I ., "L\ •
~ eL allOW_UM.GUY IILfT CLAY -,It ... 50 ... (
2JC.'OV I- S,,"lL · ..... (l
!GUOIIICG SA_OT ~ /OC'! :.u"!L: JO
2=""00 •
,':;"OtNG .£15 IhO • "'VH I
' ••• 11' I_
• .~.~. I--0
0-
I
I \~".Ill I-
i ';,0'01"" ""I(;.'YH I 0 ,
I 'll--
~ ~~!!~~ s~;~~:~ ~. ~~:(, <~:~~~i :i 1\. r , i I
S
"'., 25 :-! I i I
\ ! I I ;
0
r !
I ,
s I- ~i I I
I ~" .. l 2!
I ~ i ; I I ~i I : ]
~I ... ", -- ~'I , .
LOG OF BORINGS
• lOG OF BORING 2S 11~~------------------- 49

2(1-70
O•P77f '• 8
•E N#.7•7f R.2X4TRS7U I
CRING 26
W ..AC , --IW-70V
r 1_ _ 1-- "oI U- +
IV127tz U
_ _ _ I
- . p ___ ,_ _ ,_ ...... _
0--;5 a
C3a
/0 r
20 rl
40
30
34 a
60 -r-v
;65/4' a
*0 ".-r
VA
'4
i
ICL.
2cL
2, 3 A.N.. 1, 1 .%A'A. : CT
3;x 13113
~* is ." '11"'C '1 . ,• "l -SA2A:. 18 J.i, n * IPAEL
Sm.347/
#7,-h' -10 10( * 3
ut *.ZuaC3 .. .p *>i.4Ja ;A$f..Pi".C* 21JCr'!*'i' '.ifl~ ~*r..4 ut 1.541 4 4 0 Ra a044. IA-tA. ~*A5''.050 jAs.,¶',0C
,.'. CS. a O* ¶r.'S,$ AN ant '-br '.%.n0 * 'O',t..e -. 6 '4
t. '.0 ..~ &t~"C ''541 a 'COAN ~A~S ~ *j K22
1. ~ :~' Z. - i'.aC'-i
:5 '4-
'1 '!.A0~ )AthJ~.
fl-A' 'raIns,;. "A
LOG CF 3CRING 25
11/6/09 50
SN£A1i'1N6 ST'REN6TH OR vz acvuroR S17rESS IN I.8$./SQ. FT.
3000 2!JOO 200fJ 1.500 lOCO ~oo 0
I I
I I I I
I I
I I I I I I· I I I,.. """"'" I
, , I , - ,. I I. i I I
, I I I '2·IS·'27 I
- '0, ... -;.:) .. I I I
I , I
I I , I
I I I I· I I
I I , ! I
... ;) f , ,:
10
2Q
30
40
60 -=-...-11 .. 11111
TO . ..,..... ....... IIMII
80--
'wt I',::u"" ... :"'\0, ··,,""v .......... "r .. fa '."t •• ::. -'v"'" .... ~!. ":) ~~ '"''', .... III ... ; ••
'(~"' •• fCII ''3 ,e'",e "\<It '''''''C' I( ""0 •• 1011., ,.~t •. :; •. ,''''-.0--0 1'\,.1 · ... ,~~O .. , ... ..-"C .... .,.,r ...... " )' -J'" F'lOr '.f'..,g • ~')'J- • .,t..'-a _ ................... ,.-.1. ",-0.,." •
• ..., ~"'-cl , ...0".' t ........ C. ,t ;1" 'J.,:'t ...... 0 ...... ",tUlljl',,.. ~.i" : J. ~ 'f •• C ... ·" '''"jr-,-.,O'' ''''''-'.'. " ~·'I) .. ,. ,,-0 ,.~ .. 1.J.
'-f' .. ~ •• ! .. ":"" ... '~ ' •• ~.l. 'u,.'·· 't.' ..... '''C'I ... :,~ ...... ' ""." S.a....",j ~~t Jet..... IIwCC' fI .. \Jr~"-'! JtII' •• 'O ... \.I .. ~.' ~""''''''tII'. ,"-01:1 : ••.. "4.
11/6/09 50
2(' -70
80RIN<3 2e
;" dIJ 1_"'1' ,I",,, C\"".," ."101 1ft, ' •• ct J' ..... ,
, ........... ')C'CA1:I~" -:.''\If\,. (S,.'II)
, ........ ,f .. t_ I.~ 'Q ..... Gf\lW ... 1IIIO .. r .. SQIIiC :::".1. ,_-.a allllG 'l_Aw4' ... ·.~"CI"",
~1\,1o. ':"C." u-.sri.
lIS
LOG at: 90~ING 26
•
•
•

Z7- -7
S.QIARIAff SMEWS7v OW lol OdVZAOR S7W(S INIV 4.&/5.o FreE
BORING 27$SPA~r CBfSr?* ~-14
2-4M /000 /SW /00 500 0 xVio?=L7 YMOL
A
.4- 7
'A :
10-
20 --
40-
, 23 2
i CL
CL
4RA 114 -t (o..s..t) l~
jMAV :LAPt !s-c SIo OQ.csaO l-o .'
'at.,
30N9 -0::19A' 00
Ism
500-0 CCS~~g'tO ~
so -
LOG OF BORING
!
1 LOG OF EOIRING 27 II
11/6/09 51
2r-""1O
• BORING '27 o~prH ~
SH£ARINfI srR£'MITH 0II1/Z O£YUTOlf STRESS IN , IN /.JJS./SQ. n: FeET ~
I I I '.~S-I "II
I 12. lJ-1I7 ,
ILDW (J O~,..t7'WOU
~ .~~--~~~~~~~~~~~~
;:, . 26 •
1 I I
I I I 1 I
I I' .• I-I:"l
f-- 10 -<00 -
I I 1 I
I '1.8:11-1 zq
• I l I ; I
I I I I I I
1 I .,.-
I
I I I
I , I !
I i I I I I
I I 1 I
I I, ··'·-1 .---I , I
I I !
$0
In ~
60
12'1 :I
7'0
I~ S
!1M
" ___ d'~ so- .... :-"""1"(0 ". 3-!-""O
80--
LOG OF BORING
• LOG 01= BORING 27
11/6/09 51
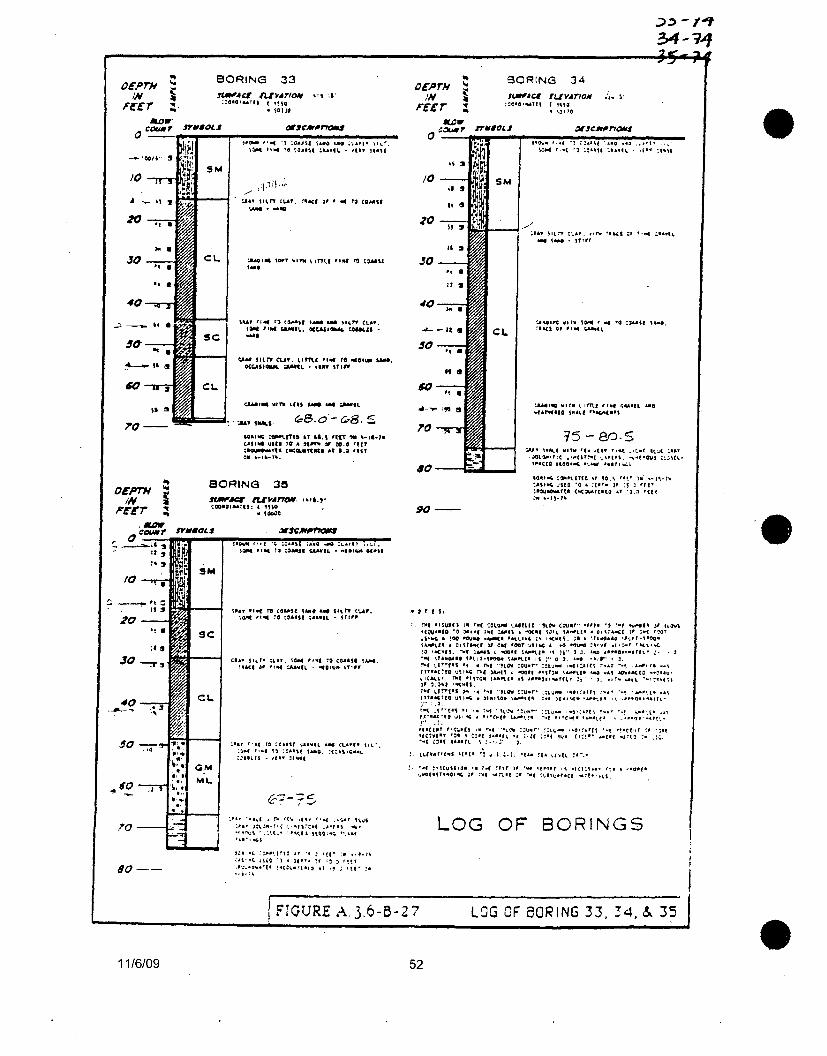
3:,- 10w?
34-71I-4 d-dL r
.' rU
OEPT'NIN
BORING 33Ytw~cf tAtYlrfag I.s .5
$0110
INLrar 1 700
aw4c-irr -w ITMEOS
CR(NG 34
-fActr Ax~vA7.lom -'~ ; 3-
cv',"?ISmaPGLj 42MArPMOW
'/ - .~. ~ -
A - i
20 ,
30
40
50a, S,
50
$m
sCL
L-4 .4 .0 M-114 ",it .1 't5? 7511%
'Aol 1,4t 1 CLAW. AC.4 I? If 4 t0 (am%#0
$I)F` 05 "mT ui"I ls 11- M CM014S-0
0."I fr1 13 1454) IlI Flob Ilk1? (,AI
aft 4 F 005CAME. 41CCA4101WA 0418401
(AMSIt? CLAV. LIME5. F7154 74 15451 SA50,OC4.0500554 UL&M4 - 142V STIOS
3' 'k:, iWitoi"DTfg$ 1-'Aý4
7Aj.415 0545 7o A 0101% OF5.0 'It?-55 CMA 1 C114545 .1 5.* lilt
/0-
50
•7II S
20-
90-
rJ
-74 1 -0 '7744 - Sl. *~i1
CL'1O 1141 W.5 s"114 rO3 CIFISS 1.50,!Sul5 of 11" 40.5451
MAOISOIS lr4E1 lfl~f CSSW14 40041*
4 1545 1(04 AS, I- 5Y5 -
t55(0*. 514 Pl.54 5*I...
:A$15 C45l15 AEO I0. (I, 47
053.ft( 1112- -(i55v07 BORING 35
ftwi~' n£25057704 .4-0.9,c55l51155 4 1500
50500z
/0- m S
-A0,
;II
-fO
20-
11MadALS 4eCcAv#Ifyc 01050 51. 7C - -00 -004 - .(1- 1 41-
SM
W! I
/S
7/olo
'-Nor SOW1S 305004l 5050 A"0 if~tW ttAV.S014 '1-4 70 704551 C ...IL - 11100
'opt ll.1 !LI C054 '5 700414 1450.
Tf;( 0? .'754 .gL0 - 451v- 51155
CL
IM605 it 145 (1"4
G.MMWL
ic 5c:-tr
*(u55'0 2.11f N54 40514 I 1445(C 50411 5050435 I 011 K t )fL :-f5
:-k1* 7 .41c 055( Is ( ca '1..s5 15 -.547 ?tr* :." .t*0 ", '40.4
0t ... (5 ~o f %tK 51 4 It. I 055 I 74f lt f). 07415 ~'7 .... . 70711C *54055- 557TQI5 14 I- 5'U '0-1 :' 7.'1 3. -IT 0. L
f7 S 7 .75 -K 74 j.%C
-T5f1 "CUM 5 5 5 15CU5 7,5 .'C~S. . 471 a5175411 0114 s lusý-rs.760115 55..7 .55 571
'-5 *5715 '9. 0 0 lN 33
-:7.-.5-.17f7 7 507 4
51t75 1- 0 745 ! 0.l77 IF 7
7 7'5 7 14'*r 1,
7'N. -7.
LOG OF BORINGS
so--
i!
IFIGURE A.3-6-3-27 LOG OF 80RING 33, 34, & 35
11/6/09 52
OEP'f"H IN
Ff"Er
JO
40
.. ... ~ ~,
SORING 33 ~ACI nrYATI~ .. , ,I'
:::O_OI_lIS I ,"0 • ~0110
,,~ "" " ::0"'10« "'_0 .... 0 ~~,,,I' ~11 • .r, \~ -' ... ~o ~4.u" ~"'''I\, . ",u =t:"U
\.AlII .. - ..
:AMI" lon' 'IItnt \,.Int.' , .... 'I"C tlLU1& , ....
;u. .. II ... r') ,o.uu ,Me u.e \1," (1,..& •• i" , ' ... r..LMI\.. ~t.l.l''''''' '0""£1 ..... UM ,n,n- (Uf. ~,rn.' , ... 1"0 "'ltWl """'.
OCUli ..... ~'" .. ftl'. ITt"

-39- 144p- 7-4
"IVi
Now-owr JVN~dLJ
ORING 40Awd al~vjr~c -*A
someaoo ''
"r
ciAt OW~ L0oa - rreft
ORING 39Wp3~r (LEVA17w aS.I.
2*I io I 7
atscwv,1a
:2 3
20 -
50
60
fro
'ICL
sMo
', T It St :_I mf..Ctt. -4 :-"v~ $'%r.IIrTts flit TO C00*3 tA" 4i 4*
004? SILr? 55.4?. Lt~rIU fl og TO8000 SAN.
fI - %50 1 Ot Am. Sam4 %OAMUOST
OMt IIW Ct :&A.111.
'."VS~l CLA1. I" P.ý TO 500*0 U.S. TUKA
; If To0 50" Q000008*05 - so"? To -%DIM SIPP~
A001.84 016? %TIM
0-
/0
20-
It'
so
Ai
Jill
J m
CL
sc
CL
CL
GC
*0?.Z lto cun U0* " ~. SO" wtiqv Vtj..I flu 0*065 - 066? Hall
-i'p04 TO 00*110 04AVFA. A@1tr CLA TPOL,
- aR3 Sm - ..A*
10l ""'. 119 ;ui I"j CLAYt 0 - Il~y'lilt lug toS ~ WII 00 '(6
-ooo tom a~Toi t.0Slt
. .4.1.S42-
70 -7F 4:Ii
ISM
/90
/50
/40- ~
It' 14 10 :30.59 - "* ct (Sl 5l.4tomE 114 to :oa~*4 0, .
A&I II~r? CLAV. '%t1 Of f1W TO :3"116SAM0 -04 ;PA-tL -ST1FF
S7.11 .a0 0 COMIN AAW81*05 -
08AA 111.1" CLAf. -'ALI ON 1-- to :3"140
AAMING .Eolm SITTF
08*0 F4 14 50 (0*004 :uvcLmm CLOFIY SILtI~ 11. TO 55*MSE1-0T . XCASIa 040
0561.12 - It"7 04"0
;AA SITY 'LAI. 11145 3' 1-11UI 4R
. A III r IFF
U.D.G 1f -0.1 U1.t .2%,I
*. .0 Lt1-.qQt 511-mi.8 W -- ;F Sk~150:5016 q-
:A 1( 0?~ .A IalA-r Of04 !%. .5;? ¶.
N.
I'--.
LOG OF BORINGS
IFIGURPE A. 3.6-3-429 LOG OF 8CRING 39,& 40
11/6/09 53
•
•
•
OEPTH 1/1
FEET
/0
M
~
40
~O -+--
6(J
BORING 39
~ rtlYAnf1II ""." ~.:IO.'IUr", , tlM .. -
~ .... , u,," t~.". \.11'1\1: ,' .. 1'0 t.OAAH ,,... :1VIC' 01 ., .. :a.wn.. • ,ft"
.... 'tIC ~ <:rSM:II \Me. SGN. Q.A1TI' '11..'. 1GIII It .. r, eAM$I ;&A_IL
:aM'" •• '" AIr&.I _ ;&.III'Q.
~u, 11"'" Cu.y. 1~ '1'" TO (QAAU u... JUl.. ;. It. iO CAMSI ""wn, - lCWJ ':'0 .. D ...... Sn, ..
;.hy " ... .", CaM" \.iN. '0fIC :U'" U&.T. "1'\1 ;,u, .. IL • IllY 'Inl
..... , " .. r~ CQMJI ;u_n ..... lit." nAY. ","",I , • .,. ~ (:1M3' 1 ....... .,.
~ ... " .... 1'0 ':lUll ;,u.'VR A.e CLA'" U", . .. m.&. ,.,.. 1"0 C(LUU tMI. WI", .untO"
/0
.. .. i ~ ..
.,0 .....",..-rllil~li1
TO -!II..~l/iiIiii:I=;;;!~~ :~ 1~1:c!=:CI
80--
'lA ... tfNl'\.tTU ,a, :0.1 'In a "-11-" ' . .a"111 vII, !'O j er"", ,,. :01.' ',IT ACIJ..,...nl ~n ... ,,' I.i 'ur 21 .,.-,.
LOG OF
/40--
BORINGS
BORING 40 ttM'-4a ttlYAn_
:.::0 .. ' .... ''': t ~~'" ·so*
"'0.(1'
39-1~ 4o-7~
~, .. ,," CLA' ... tAU .11' , ... ro :::1&111 ,.&oWl ... :,MwlL. • HI'"
~., " .. rE, C~SI ",... ..... 11Lf"I' CU'. ',Intt 'I .... fO (OM" ~L ...... .
:,up " .. " CU'. !'tAd J6 " .. ro :3 ... '" ! ........ (.AA.,.~ . ,,,,,,
~, 'U( ro C~M1I ::',LA'lfR ..... ~L."''' ULr. \0/lIl fl., ra c, .... U' ~Me. XU.Ia-.... .::allUI - ",n ,."'" ;,uG1'" 10/1", 1M'" 'IIAQIC."
aA" 1I\rr ,:U'_ I"UC, ~~ ~ oUIO , .... .,u. • ,UY HI"
;.,.., '1"1 ~ c~ ... " ':NIe _D "'~ :Ul' . ... L me , ... ,:.u .. u •• ~, •• :, .. ,
: ..... cu,e" ~llT '-"~ f3 't~ .. u, ..... '11(\ ..... , .... .:ct.& .. ~ '"""-, {I.tC,IIt1l1n
. or'" :rllit .;u" !"'lLt ....... r' .... r'c LUG, If '.j';..r ,,",'.11
:~.., :CL!liIIlfIC ","OT:.I:. '('oj "CQl'~ 't." tllI(r';IU
.0.'" ;:,..",ffD.r .".' :(IT JIt ,.,.,,, :.'1-' .. tto -Q • :,I'TIf ", ~~,' '((r ;Jou.OIMru ("'~l1'n .r -.,: 'Ur ;11 ·-11";-.
FIGURE A. 3.6-8-2 9 lOG OF BORING 39·3,. 40
11/6/09 53
UPDATED DOE RESPONSES TO WVDP PHASE 1 DECOMMISSIONING PLAN RAIS
RAI 5C10 (15)
Subject: subsurface DCGL model contaminated area
RAI: For certain pathways and radionuclides, the assumption that contamination is distributed
over a larger area (e.g., 1000 M2 ) rather than 100 m2 would lead to more restrictive DCGLs.Sensitivity analyses currently do not evaluate the impact of area on the DCGL calculations.
(Section 5.2.1, Page 5-27)
Basis: For those radionuclides dominated by certain pathways (e.g., plant and water ingestion),
the assumption regarding the area (and thickness) of contamination significantly impacts theDCGL calculations. On a footnote on page 5-26 of the DP, there is some discussion regarding
use of a 1000 m2 area of contamination rather than a 100 m2 area of contamination; however,
sensitivity analysis results do not address larger assumed areas of contamination. Assumptions
regarding the distribution of contamination brought up from drilling a cistern should be furtherevaluated as the DCGL for many radionuclides would be more restrictive if a change in
assumption regarding the area of contamination is made.
NRC Path Forward: Suggest calculating DCGLs considering a 100 m 2 and larger areas (e.g.,
1000 m2) of contamination and use the more limiting DCGL for the list of 18 radionuclides
evaluated or provide additional justification for why an assumed 100 m 2 area of contamination isreasonable.
DOE Response: The assumed 100 M 2 area of the contamination zone is considered to bereasonable. The size of this area in the model is limited by the relatively small volume of material
brought to the surface during construction of the hypothetical cistern, which is approximately 30i 3.
A sensitivity analysis was performed as described below. However, the multi-source conceptualmodel described in the response to RAI 5C9 has effectively superseded the original base-case
conceptual model for subsurface soil DCGL development. Additional information on the multi-
source model is provided below.
Sensitivity Analysis Performed
A sensitivity analysis for the combined contamination zone thickness and area has beenperformed, using areas of 300 square meters and 50 square meters, compared to the 100 squaremeters base case, which has a thickness of 0.3 meter. (The area and thickness parameters are
positively correlated due to the small volume of material brought to the surface.) Table 5C10-1
shows the results.
11/6/09 54
UPDATED DOE RESPONSES TO WVDP PHASE 1 DECOMMISSIONING PLAN RAls
RAI5C10
Subject: subsurface DCGL model contaminated area
RAI: For certain pathways and radionuclides, the assumption that contamination is distributed over a larger area (e.g ., 1000 m2
) rather than 100 m2 would lead to more restrictive DCGLs. Sensitivity analyses currently do not evaluate the impact of area on the DCGL calculations.
(Section 5.2.1, Page 5-27)
Basis: For those radionuclides dominated by certain pathways (e.g., plant and water ingestion), the assumption regarding the area (and thickness) of contamination significantly impacts the DCGL calculations. On a footnote on page 5-26 of the DP, there is some discussion regarding use of a 1000 m2 area of contamination rather than a 100 m2 area of contamination; however, sensitivity analysis results do not address larger assumed areas of contamination. Assumptions regarding the distribution of contamination brought up from drilling a cistern should be further evaluated as the DCGL for many radionuclides would be more restrictive if a change in assumption regarding the area of contamination is made.
NRC Path Forward: Suggest calculating DCGLs considering a 100 m2 and larger areas (e.g., 1000 m2
) of contamination and use the more limiting DCGL for the list of 18 radionuclides evaluated or provide additional justification for why an assumed 100 m2 area of contamination is reasonable.
*******************
DOE Response: The assumed 100 m2 area of the contamination zone is considered to be reasonable. The size of this area in the model is limited by the relatively small volume of material brought to the surface during construction of the hypothetical cistern, which is approximately 30
m3.
A sensitivity analysis was performed as described below. However, the multi-source conceptual model described in the response to RAI 5C9 has effectively superseded the original base-case conceptual model for subsurface soil DCGL development. Additional information on the multisource model is provided below.
Sensitivity Analysis Performed
A sensitivity analysis for the combined contamination zone thickness and area has been performed, using areas of 300 square meters and 50 square meters, compared to the 100 square meters base case, which has a thickness of 0.3 meter. (The area and thickness parameters are positively correlated due to the small volume of material brought to the surface.) Table 5C10-1 shows the results.
11/6/09 54
•
•
•

UPDATED DOE RESPONSES TO WVDP PHASE 1 DECOMMISSIONING PLAN RAIS
Table 5C10-1. Contamination Zone Thickness/Area Sensitivity Analysis Results•11
0.1 m/300 m 2 0.6 m/50 m2
NuclideDCLhagYear of Peak Dose DCGL Change Year of Peak Dose DCGL Change
(%)(%
Am-241 0 -1% 0 16%
C-14 0 86% 0 -33%
Cm-243 0 4% 0 10%
Cm-244 0 3% 0 22%
Cs-137 0 14% 0 9%
1-129 10.4 -58% 10.5 86%
Np-237 22.5 -61% 22.6 87%
Pu-238 0 3% 0 22%
Pu-239 0 3% 0 22%
Pu-240 0 3% 0 22%
Pu-241 60.7 0% 64.5 15%
Sr-90 0 170% 0 0%
Tc-99 2.06 204% 0 -3%
U-232 3.58 70% 6.69 -4%
U-233 327 -64% 327 91%
U-234 327 -65% 327 98%
U-235 0 9% 0 8%
U-238 327 -65% 0 70%
NOTE: (1) The base case is a 0.3 m thickness with an area of 100 M2.
The results in the table show that:
" The DCGL for Sr-90, the radionuclide expected to dominate contamination at the bottoms
of the deep excavations based on available data, increased as the contaminated materialwas spread over a larger area and remained unchanged when the contaminated area
was reduced.
* The DCGLs for the following radionuclides significantly decreased with the smaller
thickness/larger area contamination zone geometry: 1-129, Np-237, U-233, U-234, and U-
238.
* The DCGLs for most radionuclides increased with the larger thickness/smaller area
condition, with only C-14 exhibiting a significant decrease.
Note that the influence of the source geometry on the DCGL is mainly due to external exposure
and groundwater pathways. The external exposure dose increases with increases incontaminated zone area. The dilution factor increases with increases in contaminated zone area
in the subsurface model, due to increased leachate infiltration rates. However, the reduction in
11/6/09 55
•
•
•
UPDATED DOE RESPONSES TO WVDP PHASE 1 DECOMMISSIONING PLAN RAls
Table 5C10-1. Contamination Zone Thickness/Area Sensitivity Analysis Results(1)
0.1 m/300 m2 0.6 m/50 m2 .
Nuclide DCGL Change DCGL Change Year of Peak Dose (%)
Year of Peak Dose (%)
Am-241 0 -1% 0 16%
C-14 0 86% 0 -33%
Cm-243 0 4% 0 10%
Cm-244 0 3% 0 22%
Cs-137 0 14% 0 9%
1-129 10.4 -58% 10.5 86%
Np-237 22.5 -61% 22.6 87%
Pu-238 0 3% 0 22%
Pu-239 0 3% 0 22%
Pu-240 0 3% 0 22%
Pu-241 60.7 0% 64.5 15%
Sr-90 0 170% 0 0%
Tc-99 2.06 204% 0 -3%
U-232 3.58 70% 6.69 -4%
U-233 327 -64% 327 91%
U-234 327 -65% 327 98%
U-235 0 9% 0 8%
U-238 327 -65% 0 70%
NOTE: (1) The base case is a 0.3 m thickness with an area of 100 m2.
The results in the table show that:
• The DCGL for Sr-90, the radionuciide expected to dominate contamination at the bottoms
of the deep excavations based on available data, increased as the contaminated material was spread over a larger area and remained unchanged when the contaminated area
was reduced.
• The DCGLs for the following radionuclides significantly decreased with the smaller
thickness/larger area contamination zone geometry: 1-129, Np-237, U-233, U-234, and U-
238.
• The DCGLs for most radionuclides increased with the larger thicknesslsmaller area condition, with only C-14 exhibiting a significant decrease.
Note that the influence of the source geometry on the DCGL is mainly due to external exposure and groundwater pathways. The external exposure dose increases with increases in contaminated zone area. The dilution factor increases with increases in contaminated zone area in the subsurface model, due to increased leachate infiltration rates. However, the reduction in
11/6/09 55

UPDATED DOE RESPONSES TO WVDP PHASE I DECOMMISSIONING PLAN RAIS
source thickness shortens the travel times to the groundwater receptor. The effect of thecombination of these factors is radionuclide specific.
The results showing lower DCGLs for C-14, 1-129, Np-237, U-233, U-234, and U-238 are being
taken into account in revising the cleanup goals for subsurface soil in the deep excavations. Thismatter is addressed in the response to RAI 5C15, which describes the probabilistic uncertainty
analysis undertaken to evaluate degree of conservatism in conceptual model input parameters.
Note that the results of alternate scenario analyses, such as the resident gardener scenario
discussed in the response to RAI 5C18, are also being taken into account in revising the cleanup
goals.
Additional Information on Multi-Source Modeling
Because additional groundwater modeling using the STOMP code showed that diffusion ofradioactivity from the bottom of the deep excavations must be taken into account in establishingthe subsurface soil DCGLs and cleanup goals, additional analyses were performed using amodified conceptual model. The updated response to RAI 5C9 describes this model, which
accounts for continuing release of residual radioactivity from the bottom of the deep excavationas a secondary source of contamination.
The modified conceptual model makes use of larger contamination zone areas of 2000 m2 for the
residential gardener scenario and 10,000 m2 for the resident farmer scenario.
The updated response to RAI 5C9 provides the reduced DCGLs and cleanup goals that take the
results of this analysis into account. This updated response includes a new DP subsection 5.2.6
that describes the modified conceptual model, the mathematical models used, and the results ofthe analysis.
The updated response to RAI 5CI5 includes revised tables for section 5 of the DP such as Table5-14 that specifies the cleanup goals to be used in soil and sediment remediation associated withPhase 1 of the decommissioning.
Changes to the Plan: The changes to the plan related to the sensitivity analysis involve makingthe following changes to Section 5:
Changing the second data row of Table 5-10 as indicated below (the remainder of the table is
unchanged insofar as this RAI response is concerned).
Table 5-10. Summary of Parameter Sensitivity Analyses - Subsurface Soil DCGLs(1 )
Parameter Run Change Minimum DCGL Change Maximum DCGL Change
(Base Case) Made Change Nuclide(s) Change Nuclide(s)
Indoor/Outdoor 1 -32% -25% Cs-137 0.1% U-234Fraction (0.66/0.25) _
2 21% -1% U-238 35% U-232
Contaminated Zone 1 -670/61 -65% U-234, U-238 204% Tc-99thickness/area +200%(0.3 n/l0 in2) 2 +100%/ -33% C-14 98% U-234
-50%
NOTES: (1) Information from the DCGLEMC calculations provides additional information on how reductions in thesize of the contamination zone affect the DCGLs. DCGLs generally increased with smaller areas.
11/6/09 56
UPDATED DOE RESPONSES TO WVDP PHASE 1 DECOMMISSIONING PLAN RAls
source thickness shortens the travel times to the groundwater receptor. The effect of the combination of these factors is radionuclide specific.
The results showing lower DCGLs for C-1 4, 1-129, Np-237, U-233, U-234, and U-238 are being taken into account in revising the cleanup goals for subsurface soil in the deep excavations. This matter is addressed in the response to RAI 5C15, which describes the probabilistic uncertainty analysis undertaken to evaluate degree of conservatism in conceptual model input parameters. Note that the results of alternate scenario analyses, such as the resident gardener scenario discussed in the response to RAI 5C18,are also being taken into account in revising the cleanup goals.
Additional Information on Multi-Source Modeling
Because additional groundwater modeling using the STOMP code showed that diffusion of radioactivity from the bottom of the deep excavations must be taken into account in establishing the subsurface soil DCGLs and cleanup goals, additional analyses were performed using a modified conceptual model. The updated response to RAI 5C9 describes this model, which accounts for continuing release of residual radioactivity from the bottom of the deep excavation as a secondary source of contamination.
The modified conceptual model makes use of larger contamination zone areas of 2000 m2 for the residential gardener scenario and 10,000 m2 for the resident farmer scenario.
The updated response to RAI 5C9 provides the reduced DCGLs and cleanup goals that take the results of this analysis into account. This updated response includes a new DP subsection 5.2.6 that describes the modified conceptual model, the mathematical models used, and the results of the analysis.
The updated response to RAI 5C15 includes revised tables for section 5 of the DP such as Table 5-14 that specifies the cleanup goals to be used in soil and sediment remediation associated with Phase 1 of the decommissioning.
Changes to the Plan: The changes to the plan related to the sensitivity analysis involve making the following changes to Section 5:
Changing the second data row of Table 5-10 as indicated below (the remainder of the table is unchanged insofar as this RAI response is concerned).
11/6/09
Table 5·10. Summary of Parameter Sensitivity Analyses - Subsurface Soil DCGLs(1J
Parameter Run Change Minimum DCGL Change Maximum DCGL Change
(Base Case) Made Change Nuclide(s) Change Nuclide(s)
Indoor/Outdoor 1 -32% -25% Cs-137 0.1% U-234 Fraction (0.66/0.25)
2 21% -1% U-238 35% U-232
Contaminated Zone 1 -67%/ -65% U-234, U-238 204% Tc-99 thickness/area +200% (0.3 m/100 m2)
2 +100%/ -33% C-14 98% U-234 -50%
. . NOTES: (1) Information from the DCGLEMc calcu lations prOVides additional information on how reductions in the
size of the contamination zone affect the DCGLs. DCGLs generally increased with smaller areas.
56
•
•
•
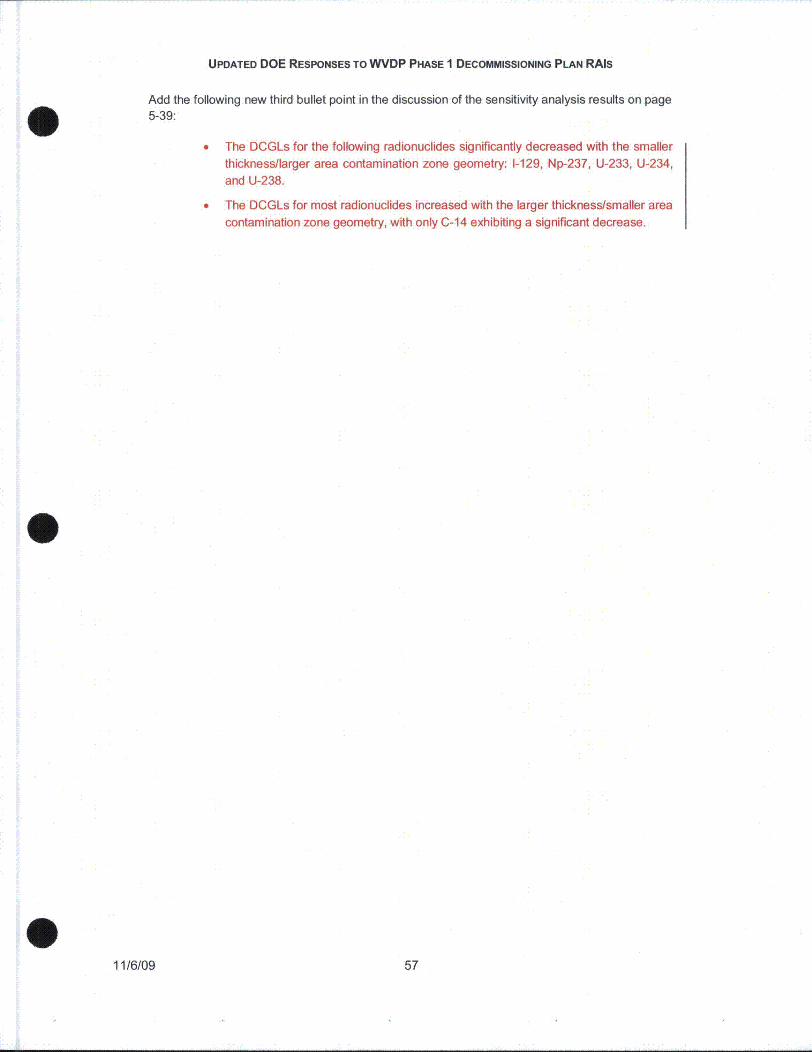
UPDATED DOE RESPONSES TO WVDP PHASE 1 DECOMMISSIONING PLAN RAIS
Add the following new third bullet point in the discussion of the sensitivity analysis results on page5-39:
" The DCGLs for the following radionuclides significantly decreased with the smaller
thickness/larger area contamination zone geometry: 1-129, Np-237, U-233, U-234,
and U-238.
* The DCGLs for most radionuclides increased with the larger thickness/smaller area
contamination zone geometry, with only C-14 exhibiting a significant decrease.
11/6/09 57
•
•
•
UPDATED DOE RESPONSES TO WVDP PHASE 1 DECOMMISSIONING PLAN RAls
Add the following new third bullet point in the discussion of the sensitivity analysis results on page 5-39:
11/6/09
• The DCGLs for the following radionuclides significantly decreased with the smaller
thickness/larger area contamination zone geometry: 1-129, Np-237, U-233, U-234, and U-238.
• The DCGLs for most radionucl ides increased with the larger thickness/smaller area contamination zone geometry, with only C-14 exhibiting a significant decrease.
57

UPDATED DOE RESPONSES TO WVDP PHASE I DECOMMISSIONING PLAN RAIS
RAI 5C12 (17)
Subject: Inhalation pathway in streambed sediment model 40
RAI: The streambed sediment DCGL development does not include the inhalation of airborne
radioactivity from resuspended contaminated sediment because of the assumed moisturecontent and limited resuspension. However, this argument may not consider the dynamic
aspects of sediment deposition, stream water levels, and soil moisture content. (Section 5.2.1,
Page 5-29)
Basis: In general, streambed sediments will have relatively high moisture content and would
experience limited resuspension. However, mobilization of contaminants from source areas may
increase during storm events and result in deposition of the contaminants in areas that are
above the normal water levels, such as a flood plain. Moisture content of these environments willbe very dynamic, ranging from saturated to quite dry depending on the frequency the locationexperiences high water.
Path Forward: Provide an evaluation of the importance of the inhalation pathway relative to the
other pathways that have been included in the streambed sediment DCGL development. The
evaluation should consider the natural inherent variability in deposition processes and sediment
moisture contents.
DOE Response:
NOTE
Changes from the previous version of this response submitted to NRC on 8/14/09have been to recognize the multi-source model for subsurface soil DCGLdevelopment, which takes into account release of residual radioactivity by diffusionfrom the bottoms of the deep excavations. The code verification package andcalculation packages that document the multi-source analysis will become Attachment3 to Appendix C.
Note that changes from the 8/14/09 version of this response in Appendix C that are
shown in blue will be shown in red in Revision 2 of the plan.
The inhalation pathway has been incorporated into the deterministic model for streambed
sediment DCGL development without regard to considerations of moisture content, in the interest
of conservatism. This change had no significant impact on the DCGLs, as shown below. The
probabilistic uncertainty analysis described in the response to RAI 5C15 also includes the
inhalation pathway in the streambed sediment model.
Note that the response to RAI 5C11 discusses the streambed conceptual model and natural
inherent variability in deposition processes, including changes in water level.
Table 5C12-1 compares the streambed sediment DCGLs included in Revision 1 to the DP with
the deterministic DCGLs with the inhalation pathway active. Note that several other parameter
changes were also made as discussed below.
11/6/09 58
UPDATED DOE RESPONSES TO WVDP PHASE 1 DECOMMISSIONING PLAN RAls
RAI 5C12 (17)
Subject: Inhalation pathway in streambed sediment model
RAI: The streambed sediment DCGL development does not include the inhalation of airborne radioactivity from resuspended contaminated sediment because of the assumed moisture
content and limited resuspension. However, this argument may not consider the dynamic
aspects of sediment deposition, stream water levels, and soil moisture content. (Section 5.2.1, Page 5-29)
Basis: In general, streambed sediments will have relatively high moisture content and would
experience limited resuspension. However, mobilization of contaminants from source areas may
increase during storm events and result in deposition of the contaminants in areas that are
above the normal water levels, such as a flood plain. Moisture content of these environments will be very dynamic, ranging from saturated to quite dry depending on the frequency the location experiences high water.
Path Forward: Provide an evaluation of the importance of the inhalation pathway relative to the
other pathways that have been included in the streambed sediment DCGL development. The
evaluation should consider the natural inherent variability in deposition processes and sediment
moisture contents.
*******************
DOE Response:
NOTE
Changes from the previous version of this response submitted to NRC on 8/14109 have been to recognize the multi-source model for subsurface soil DCGL development, which takes into account release of residual radioactivity by diffusion from the bottoms of the deep excavations. The code verification package and calculation packages that document the multi-source analysis will become Attachment 3 to Appendix C.
Note that changes from the 8/14109 version of this response in Appendix C that are shown in blue will be shown in red in Revision 2 of the plan.
The inhalation pathway has been incorporated into the deterministic model for streambed sediment DCGL development without regard to considerations of moisture content, in the interest
of conservatism. This change had no significant impact on the DCGLs, as shown below. The
probabilistic uncertainty analysis described in the response to RAI 5C15 also includes the inhalation pathway in the streambed sediment model.
Note that the response to RAI 5C 11 discusses the streambed conceptual model and natural
inherent variability in deposition processes, including changes in water level.
Table 5C12-1 compares the streambed sediment DCGLs included in Revision 1 to the DP with
the deterministic DCGLs with the inhalation pathway active. Note that several other parameter
changes were also made as discussed below.
11/6109 58
•
•
•

UPDATED DOE RESPONSES TO WVDP PHASE 1 DECOMMISSIONING PLAN RAIS
Table 5C12-1. Streambed Sediment DCGL Comparison
Nuclide DCGLw Values from Table 5-8 DCGLw Values With Inhalation
of Revision I (pCilg) Pathway Active (pCilg)
Am-241 1.6E+04 1.6E+04
C-14 3.4E+03 3.4E+03
Cm-243 3.6E+03 3.6E+03
Cm-244 4.7E+04 4.8E+04
Cs-137(1) 1.3E+03 1.3E+03
1-129 3.7E+03 3.7E+03
Np-237 5.4E+02 5.2E+02
Pu-238 2.OE+04 2.OE+04
Pu-239 1.8E+04 1.8E+04
Pu-240 1.8E+04 1.8E+04
Pu-241 5.2E+05 5.1E+05
Sr-9001 ) 9.5E+03 9.5E+03
Tc-99 2.2E+06 2.2E+06
U-232 2.7E+02 2.6E+02
U-233 5.8E+04 5.7E+04
U-234 6.1 E+04 6.OE+04
U-235 2.9E+03 2.9E+03
U-238 1.3E+04 1.2E+04
NOTE: (1) Reflects 30 years decay.
The other parameter changes are identified in the revised Appendix C, which follows. Many of the
parameter changes were made for consistency with dose modeling in the Decommissioning EIS.
Note that Appendix C is included in its entirety for the sake of completeness, even though only
limited portions were changed from Revision 1. The text in blue in Appendix C signifies changes
made in Revision 1. The Revision 2 changes are shown in red with change bars in the right
margin as with the other RAI responses.
Changes to the Plan: The value for strontium in the sand and gravel layer in Table 3-20 will bechanged from 6.16 to 4.5 mUg (cm 3/g).
Table 5-8 will be changed to reflect the slightly revised DCGLw values as indicated in the updated
response to RAI 5C21.
The revised Appendix C that follows will be incorporated into the plan.
11/6/09 59
•
•
•
UPDATED DOE RESPONSES TO WVDP PHASE 1 DECOMMISSIONING PLAN RAls
Table 5C12-1. Streambed Sediment DCGL Comparison
Nuclide DCGLw Values from Table 5-8 DCGLw Values With Inhalation
of Revision 1 (pCi/g) Pathway Active (pCi/g)
Am-241 1.6E+04 1.6E+04
C-14 3.4E+03 3.4E+03
Cm-243 3.6E+03 3.6E+03
Cm-244 4.7E+04 4.8E+04
Cs-137(1) 1.3E+03 1.3E+03
1-129 3.7E+03 3.7E+03
Np-237 S.4E+02 S.2E+02
Pu-238 2.0E+04 2.0E+04
Pu-239 1.8E+04 1.8E+04
Pu-240 1.8E+04 1.8E+04
Pu-241 S.2E+OS S.1E+OS
Sr-90(1) 9.SE+03 9.SE+03
Tc-99 2.2E+06 2.2E+06
U-232 2.7E+02 2.6E+02.
U-233 S.8E+04 5.7E+04
U-234 6.1E+04 6.0E+04
U-235 2.9E+03 2.9E+03
U-238 1.3E+04 1.2E+04
NOTE: (1) Reflects 30 years decay.
The other parameter changes are identified in the revised Appendix C, which follows. Many of the parameter changes were made for consistency with dose modeling in the Decommissioning EIS. Note that Appendix C is included in its entirety for the sake of completeness, even though only limited portions were changed from Revision 1. The text in blue in Appendix C signifies changes made in Revision 1. The Revision 2 changes are shown in red with change bars in the right margin as with the other RAI responses.
Changes to the Plan: The value for strontium in the sand and gravel layer in Table 3-20 will be changed from 6.16 to 4.5 mUg (cm3/g) .
Table 5-8 will be changed to reflect the slightly revised DCGLw values as indicated in the updated response to RAI 5C21 .
The revised Appendix C that follows will be incorporated into the plan.
11/6/09 59

UPDATED DOE RESPONSES TO WVDP PHASE 1 DECOMMISSIONING PLAN RAIS
APPENDIX C
DETAILS OF DCGL DEVELOPMENTAND THE INTEGRATED DOSE ASSESSMENT
PURPOSE OF THIS APPENDIX
The purpose of this appendix is to provide supporting information related todevelopment of derived concentration guideline levels (DCGLs) and the limitedintegrated dose assessment performed to ensure that cleanup criteria for surfacesoil, subsurface soil, and streambed sediment used in Phase 1 of the proposeddecommissioning would support any decommissioning approach that may beselected for Phase 2.
INFORMATION IN THIS APPENDIX
This appendix provides the following information:
* Table C-1 in Section 1 provides a complete list of RESRAD inputparameters, except for distribution coefficients, and the bases for theseparameters.
" Table C-2 in Section 1 provides a list of distribution coefficients and theirbases.
* Table C-3 in Section 1 provides the exposure pathways considered in theanalysis.
* Table C-4 in Section 1 provides data on measured radionuclideconcentrations in the Lavery till in the area of the large excavations inWaste Management Area 1 and Waste Management Area 2.
* Section 2 describes the information that comprises Attachment 1, whichsupports the calculation of DCGL and Cleanup Goal values presented inSection 5 of the Decommissioning Plan.
" Attachment 1 provides electronic RESRAD input and output files for thethree base cases (surface soil, subsurface soil, and streambed sediment),the limited integrated dose analysis, and the input parameter sensitivityanalyses performed, along with the associated Microsoft Excelspreadsheets.
• Attachment 2 provides an additional electronic file (a Microsoft Excelspreadsheet) used in the preliminary dose assessments.
" Attachment 3 provides the basis for development of the multi-sourceDCGLs, which consider the bottoms of the deep excavations as acontinuing source of contamination to groundwater.
RELATIONSHIP TO OTHER PLAN SECTIONS
This appendix provides supporting information for Section 5. Information provided inSection 5 and in Section 1 on the project background will help place the informationin this appendix into context.
11/6/09 6011/6/09
UPDATED DOE RESPONSES TO WVDP PHASE 1 DECOMMISSIONING PLAN RAls
APPENDIXC
DETAILS OF DCGL DEVELOPMENT AND THE INTEGRATED DOSE ASSESSMENT
PURPOSE OF THIS APPENDIX
The purpose of this appendix is to provide supporting information related to development of derived concentration . guideHne levels (DCGLs) and the Hmited integrated dose assessment performed to ensure that cleanup criteria for surface soil, subsurface soil, and streambed sediment used in Phase 1 of the proposed decommissioning would support any decommissioning approach that may be selected for Phase 2.
INFORMATION IN THIS APPENDIX
This appendix provides the following information:
• Table C-1 in Section 1 provides a complete Hst of RESRAD input parameters, except for distribution coefficients, and the bases for these parameters.
• Table C-2 in Section 1 provides a list of distribution coefficients and their bases.
• Table C-3 in Section 1 provides the exposure pathways considered in the analysis.
• Table C-4 in Section 1 provides data on measured radionuclide concentrations in the Lavery till in the area of the large excavations in Waste Management Area 1 and Waste Management Area 2.
• Section 2 describes the information that comprises Attachment 1, which supports the calculation of DCGL and Cleanup Goal values presented in Section 5 of the Decommissioning Plan.
• Attachment 1 provides electronic RESRAD input and output files for the three base cases (surface soil, subsurface soil, and streambed sediment), the Hmited integrated dose analysis, and the input parameter sensitivity analyses performed, along with the associated Microsoft Excel spreadsheets.
• Attachment 2 provides an additional electronic file (a Microsoft Excel spreadsheet) used in the preHminary dose assessments.
• Attachment 3 provides the basis for development of the multi-source DCGLs, which consider the bottoms of the deep excavations as a continuing source of contamination to groundwater.
RELATIONSHIP TO OTHER PLAN SECTIONS
This appendix provides supporting information for Section 5. Information provided in Section 5 and in Section 1 on the project background will help place the information in this appendix into context.
60
•
•
•

UPDATED DOE RESPONSES TO WVDP PHASE I DECOMMISSIONING PLAN RAIS
1.0 Tabulated Data
Table C-1 identifies input parameters used in the RESRAD models, except for the
distribution coefficients, which are included in Table C-2. Input parameters are provided for
the three source exposure scenarios: surface soil (SS), subsurface soil (SB), and stream
bank sediment (SD). The RESRAD input parameters presented in Table C-1 were selected
as discussed in Section 5.
Distribution coefficients (Kd) are presented in Table C-2 for chemical elements of the 18
radionuclides and their decay progeny for each of the three analyses (SS, SB and SD) for
each of the modeled media (contaminated zone, unsaturated zone and saturated zone)
used in RESRAD. The conceptual models assume the sand and gravel unit isrepresentative of the three RESRAD zones, except that in the SB and SD analyses, the
contaminated zone is assumed to be represented by the Lavery till. The table includes the
RESRAD default value, the specific value input into the RESRAD model for DCGLw
calculations, either measured site-specific or reference values (as identified in Note 1 to
table C-2), and the range of values used in the sensitivity analysis. The Kd values were
selected to represent the central tendency of the site-specific data or were based onspecific soil strata characteristics where available. Variability/uncertainty in the Kd valueswas addressed through the sensitivity analysis.
The exposure pathways presented in Table C-3 were based on the critical groupsidentified for each of the source media. The resident farmer was the critical receptor for
soil exposure and the recreationist was identified as the critical receptor for stream bank
sediment exposure. Alternate receptors were considered as discussed in Section 5,including acute dose from subsurface material to a well driller during cistern installation,
dose from subsurface material during installation of a natural gas well, and dose fromsurface and subsurface material to a resident gardener. Additionally, a separate multi-
source evaluation was conducted to assess the impact of the bottoms of the deepexcavations as a continuing source to groundwater (see Attachment 3).
The data in Table C-4 are the basis for the maximum radionuclide concentration data in
Table 5-1. These data comprise the available characterization data for radionuclides in the
Lavery till within the footprints of the large excavations for the Process Building-Vitrification
area and the Low-Level Waste Treatment Facility area that are described in Section 7.
Preliminary dose assessments have been performed for the remediated WMA 1 and
WMA 2 excavations. These assessments made use of the maximum measured
radioactivity concentration in the Lavery till for each radionuclide as summarized in Table
CA, and the maximum detection level concentration for non-detected radionuclides. (It
should be noted that the minimum detection levels for non-detected radionuclides may
range several orders of magnitude. Use of the maximum detection level concentration for
non-detected radionuclides results in added conservatism in the reported preliminary dose
assessment. The results are based on the most limiting exposure scenario (see Section 5)
and include consideration of the bottoms of the deep excavations as a continuing source to
groundwater. The dose estimates were:
WMA 1, a maximum of approximately 8 mrem a year
11/6/09 61
•
•
•
UPDATED DOE RESPONSES TO WVDP PHASE 1 DECOMMISSIONING PLAN RAls
1.0 Tabulated Data
11/6/09
Table C-1 identifies input parameters used in the RESRAD models, except for the distribution coefficients, which are included in Table C-2. Input parameters are provided for the three source exposure scenarios: surface soil (SS), subsurface soil (SB), and stream bank sediment (SD). The RESRAD input parameters presented in Table C-1 were selected as discussed in Section 5.
Distribution coefficients (~) are presented in Table C-2 for chemical elements of the 18 radionuclides and their decay progeny for each of the three analyses (SS, SB and SD) for each of the modeled media (contaminated zone, unsaturated zone and saturated zone) used in RESRAD. The conceptual models assume the sand and gravel unit is representative of the three RESRAD zones, except that in the SB and SD analyses, the contaminated zone is assumed to be represented by the Lavery till. The table includes the RESRAD default value, the specific value input into the RESRAD model for DCGLw calculations, either measured site-specific or reference values (as identified in Note 1 to table C-2), and the range of values used in the sensitivity analysis. The ~ values were selected 'to represent the central tendency of the site-specific data or were based on specific soil strata characteristics where available. Variability/uncertainty in the ~ values was addressed through the sensitivity analysis.
The exposure pathways presented in Table C-3 were based on the critical groups identified for each of the source media. The resident farmer was the critical receptor for soil exposure and the recreationist was identified as the critical receptor for stream bank sediment exposure. Alternate receptors were considered as discussed in Section 5, including acute dose from subsurface material to a well driller during cistern installation, dose from subsurface material during installation of a natural gas well, and dose from surface and subsurface material to a resident gardener. Additionally, a separate multisource evaluation was conducted to assess the impact of the bottoms of the deep excavations as a continuing source to groundwater (see Attachment 3).
The data in Table C-4 are the basis for the maximum radionuclide concentration data in
Table 5-1. These data comprise the available characterization data for radionuclides in the Lavery till within the footprints of the large excavations for the Process Building-Vitrification area and the Low-Level Waste Treatment Facility area that are described in Section 7.
Preliminary dose assessments have been performed for the remediated WMA 1 and WMA 2 excavations. These assessments made use of the maximum measured radioactivity concentration in the Lavery till for each radionuclide as summarized in Table
C-4, and the maximum detection level concentration for non-detected radionuclides. (It should be noted that the minimum detection levels for non-detected radionuclides may
range several orders of magnitude. Use of the maximum detection level concentration for non-detected radio nuclides results in added conservatism in the reported preliminary dose assessment. The results are based on the most limiting exposure scenario (see Section 5) and include consideration of the bottoms of the deep excavations as a continuing source to groundwater. The dose estimates were:
WMA 1, a maximum of approximately 8 mrem a year
61
.

UPDATED DOE RESPONSES TO WVDP PHASE 1 DECOMMISSIONING PLAN RAIS
WMA 2, a maximum of approximately 0.2 mrem a year
Given the limited data available, these results must be viewed as order-of-magnitude
estimates. However, they do suggest that actual potential doses from the two remediated
areas are likely to be substantially below 25 mrem per year. Table C-4B in Attachment 2
shows how these doses were estimated.
11/6/09 6211/6/09
UPDATED DOE RESPONSES TO WVDP PHASE 1 DECOMMISSIONING PLAN RAls
WMA 2, a maximum of approximately 0.2 mrem a year
Given the limited data available, these results must be viewed as order-of-magnitude
estimates. However, they do suggest that actual potential doses from the two remediated areas are likely to be substantially below 25 mrem per year. Table C-4B in Attachment 2
shows how these doses were estimated.
62
•
•
•

UPDATED DOE RESPONSES TO WVDP PHASE I DECOMMISSIONING PLAN RAIs
Table C-1. RESRAD Input Parameters
RESRAD Parameter (Units) Default Value Medium CommentlReference
Area of contaminated zone (M2) 1.OOE+04 1.OOE+04 SS Assumed area of 10,000 m2 for subsistence farmer scenario; garden is 2,000 M2.
1.OOE+04 1.OOE+02 SB Assumed area of 100 m2 for excavated contaminated cistern cuttings scenario.Alternative configurations were considered in the sensitivity analysis.
1.OOE+04 1.OOE+03 SD Assumed 1000 M2 area along stream bank (3 m wide by -330 m length).
Thickness of contaminated zone (m) 2.OOE+00 1.OOE+00 SS, SD Assumed surface soil contaminated zone thickness.
2.OOE+00 3.OOE-01 SB Assumed thickness of contaminated cistern cuttings spread on surface over a100 m2 area. Alternative configurations were considered in the sensitivityanalysis.
Length parallel to aquifer flow (m) 1.00E+02 1.65E+02 SS Selected to achieve site specific groundwater dilution factor of 0.2, based onDEIS groundwater model correlation. Only applicable for non-dispersion model.
Time since placement of material (y) 0.OOE+00 0.OOE+00 All Only non-zero if Kd values are not available. (Site-specific Kds are available).
Cover depth (m) 0.OOE+00 0.OOE+00 All No cover considered.
Density of cover material (g/cm3) 0.OOE+00 not used All No cover considered.
Cover depth erosion rate (mly) 0.OOE+00 not used All No cover considered.
Density of contaminated zone (g/cm 3) 1.50E+00 1.70E+00 All WVNSCO 1993a and WVNSCO 1993c.
Contaminated zone erosion rate (m/y) 1.00E-03 0.OOE+00 All Assumed for no source depletion.
Contaminated zone total porosity 4.OOE-01 3.60E-01 All WVNSCO 1993c.
Contaminated zone field capacity 2.OOE-01 2.OOE-01 All WVNSCO 1993c.
Contaminated zone hydraulic conductivity (mly) 1.OOE+01 1.40E+02 All Average for Sand and Gravel Thick Bedded Unit (4.43E-03 cm/s from Table 3-19)divided by 10 to provide vertical conductivity that accounts for potential anisotropy(DEIS Appendix E, Table E-3).
Contaminated zone b parameter 5.30E+00 1.40E+00 All Yu, et al. 2000, Aft. C table 3.5-1, mean for loamy sand (ln(mean)=0.305).
Average annual wind speed (m/sec) 2.OOE+00 2.60E+00 All WVNSCO 1993d.
Humidity in air (g/m3) 8.OOE+00 not used All Applicable for tritium exposures only.
Evapotranspiration coefficient 5.OOE-01 7.80E-01 All Evapotranspiration and runoff coefficients selected to achieve infiltration rate of0.26 m/y.
11/6/09 63
• • • UPDATED DOE RESPONSES TO WVDP PHASE 1 DECOMMISSIONING PLAN RAls
Table C-1. RESRAD Input Parameters
RESRAD Parameter (Units) Default Value Medium CommentlReference
Area of contaminated zone (m2) 1.00E+04 1.00E+04 SS Assumed area of 10,000 m2 for subsistence farmer scenario; garden is 2,000 m2.
1.00E+04 1.00E+02 SB Assumed area of 100 m2 for excavated contaminated cistern cuttings scenario. Alternative configurations were considered in the sensitivity analysis.
1.00E+04 1.00E+03 SO Assumed 1000 m2 area along stream bank (3 m wide by -330 m length).
Thickness of contaminated zone (m) 2.00E+00 1.00E+00 SS,SD Assumed surface soil contaminated zone thickness.
2.00E+00 3.00E-01 SB Assumed thickness of contaminated cistern cuttings spread on surface over a 100 m2 area. Alternative configurations were considered in the sensitivity analysis.
Length parallel to aquifer flow (m) 1.00E+02 1.65E+02 SS Selected to achieve site specific groundwater dilution factor of 0.2, based on DEIS groundwater model correlation. Only applicable for non-dispersion model.
Time since placement of material (y) O.OOE+OO O.OOE+OO All Only non-zero if Ko values are not available. (Site-specific KdS are available).
Cover depth (m) O.OOE+OO O.OOE+OO All No cover considered.
Density of cover material (g/cm3) O.OOE+OO not used All No cover considered.
Cover depth erosion rate (m/y) O.OOE+OO not used All No cover considered. -
Density of contaminated zone (g/cm3) 1.50E+00 1.70E+00 All WVNSCO 1993a and WVNSCO 1993c.
Contaminated zone erosion rate (m/y) 1.00E-03 O.OOE+OO All Assumed for no source depletion.
Contaminated zone total porosity 4.00E-01 3.60E-01 All WVNSCO 1993c.
Contaminated zone field capacity 2.00E-01 2.00E-01 All WVNSCO 1993c.
Contaminated zone hydraulic conductivity (m/y) 1.00E+01 1.40E+02 All Average for Sand and Gravel Thick Bedded Unit (4.43E-03 cm/s from Table 3-19) divided by 10 to provide vertical conductivity that accounts for potential anisotropy (DE IS Appendix E, Table E-3).
Contaminated zone b parameter 5.30E+00 1.40E+00 All Yu, et al. 2000, Att. C table 3.5-1, mean for loamy sand (In(mean)=0.305).
Average annual wind speed (m/sec) 2.00E+00 2.60E+00 All WVNSCO 1993d.
Humidity in air (g/m3) B.OOE+OO not used All Applicable for tritium exposures only.
Evapotranspiration coefficient 5.00E-01 7.BOE-01 All Evapotranspiration and runoff coefficients selected to achieve infiltration rate of 0.26 m/y.
11/6/09 63

UPDATED DOE RESPONSES TO WVDP PHASE 1 DECOMMISSIONING PLAN RAIs
Table C-1. RESRAD Input Parameters
RESRAD Parameter (Units) Defa~ult Value Medium Commient/Reference
Precipitation (m/y) 1.00E+00 1.16E+00 All WVNSCO 1993d.
Irrigation (m/y) 2.00E-01 4.70E-01 SS, SB Beyeler, et al. 1999.
2.OOE-01 0.00E+00 SD Not applicable for non-farming scenario.
Irrigation mode overhead overhead All Site-specific.
Runoff coefficient 2.OOE-01 4.10E-01 All Runoff and evapotranspiration coefficients selected to achieve infiltration rate of0.26 m/y.
Watershed area for nearby stream or pond (M2) 1.OOE+06 1.37E+07 All Based on drainage area of site of 13.7 km2 or -5.2 mi2 for Buttermilk Creek.
Accuracy for water/soil computations 1.OOE-03 1.OOE-03 All Default assumed.
Saturated zone density (g/cm3) 1.50E+00 1.70E+00 All WVNSCO 1993a and WVNSCO 1993c.
Saturated zone total porosity 4.OOE-01 3.60E-01 All WVNSCO 1993c.
Saturated zone effective porosity 2.OOE-01 2.50E-01 All WVNSCO 1993c.
Saturated zone field capacity 2.OOE-01 2.OOE-01 All WVNSCO 1993c.
Saturated zone hydraulic conductivity (m/y) 1.00E+02 1.40E+03 All Average for Sand and Gravel Thick Bedded Unit (4.43E-03 cm/s from Table 3-19)
Saturated zone hydraulic gradient 2.OOE-02 3.00E-02 All WVNSCO 1993b.
Saturated zone b parameter 5.30E+00 1.40E+00 All Yu, et al. 2000, Aft. C table 3.5-1, mean for loamy sand (In(mean)=0.305).
Water table drop rate (m/y) 1.OOE-03 0.OOE+00 All Site Specific.
Well pump intake depth (m below water table) 1.OOE+01 5.OOE+00 SS Assumption based on site hydrogeology and site-specific groundwater dilutionfactor. Only applicable to non-dispersion model.
Model: Non-dispersion (ND) or Mass-Balance ND ND SS Applicable to areas >1,000 m2 (Yu, etal. 2001, p.E-18)(MB)
MB MB SB, SD Applicable to areas <1,000 m2 (Yu, et. al. 2001, pE-18)
Well pumping rate (m3/y) 2.50E+02 5.72E+03 SS, SB Based on 2.9 m3/y drinking water (2 L/d per 4 people for 365 days), 329 m3/yhousehold water (225 Lid per 4 people for 365 day), 385 m3/y livestock watering(5 beef cattle at 50 L/d, 5 milk cows 160 Lid) and 5,000 m3/y for irrigation of10,000 rm2 (at rate of 0.5 m/y) from Yu, et al. 2000, Attachment C, Section 3.10.
2.50E+02 0.OOE+00 SD Not applicable for non-farming scenario.
11/6/09 64
0
UPDATED DOE RESPONSES TO WVDP PHASE 1 DECOMMISSIONING PLAN RAls
Table C-1. RESRAD Input Parameters
'R~S~D P,~raitfet;r (Qnits) ~ " " :Va)ue ,,~ iC. : . ,. " - ~ .'. ~
. ~. "". .;~. .. ~.f· .• " ',;;. !" qef~'llt Me.dium CommentIRefereh$=e . , .. ;'( . " ~ ,. ':';;i'~' ,11.. " .~;. ,.,
Precipitation (m/y) 1.00E+00 1.16E+00 All WVNSCO 1993d.
Irrigation (m/y) 2.00E-01 4.70E-01 SS, SB Beyeler, et al. 1999.
2.00E-01 O.OOE+OO SO Not applicable for non-farming scenario.
Irrigation mode overhead overhead All Site-specific.
Runoff coefficient 2.00E-01 4.10E-01 All Runoff and evapotranspiration coefficients selected to achieve infiltration rate of 0.26 m/y.
Watershed area for nearby stream or pond (m2) 1.00E+06 1.37E+07 All Based on drainage area of site of 13.7 km2 or -5.2 mi2 for Buttermilk Creek.
Accuracy for water/soil computations 1.00E-03 1.00E-03 All Oefault assumed.
Saturated zone density (g/cm3) 1.50E+00 1.70E+00 All WVNSCO 1993a and WVNSCO 1993c.
Saturated zone total porosity 4.00E-01 3.60E-01 All WVNSCO 1993c.
Saturated zone effective porosity 2.00E-01 2.50E-01 All WVNSCO 1993c.
Saturated zone field capacity 2.00E-01 2.00E-01 All WVNSCO 1993c.
Saturated zone hydraulic conductivity (m/y) 1.00E+02 1.40E+03 All Average for Sand and Gravel Thick Bedded Unit (4.43E-03 cm/s from Table 3-19)
Saturated zone hydraulic gradient 2.00E-02 3.00E-02 All WVNSCO 1993b.
Saturated zone b parameter 5.30E+00 1.40E+00 All Yu, et al. 2000, Att. C table 3.5-1 , mean for loamy sand (In(mean)=0.305).
Water table drop rate (m/y) 1.00E-03 O.OOE+OO All Site Specific.
Well pump intake depth (m below water table) 1.00E+01 5.00E+00 SS Assumption based on site hydrogeology and site-specific groundwater dilution factor. Only applicable to non-dispersion model.
Model: Non-dispersion (NO) or Mass-Balance NO NO SS Applicable to areas >1,000 m2 (Yu, et.al. 2001 , p.E-1 8) (MB)
MB MB SB, SO Applicable to areas <1,000 m2 (Yu, et. al. 2001, pE-18)
Well pumping rate (m3/y) 2.50E+02 5.72E+03 SS,SB Based on 2.9 m3/y drinking water (2 Ud per 4 people for 365 days), 329 m3/y household water (225 Ud per 4 people for 365 day), 385 m3/y livestock watering (5 be.ef cattle at 50 Ud, 5 milk cows 160 Ud) and 5,000 m3/y for irrigation of 10,000 m2 (at rate of 0.5 m/y) from Yu, et al. 2000, Attachment C, Section 3.10.
2.50E+02 O.OOE+OO SO Not applicable for non-farming scenario.
11/6/09 64
• • •

UPDATED DOE RESPONSES TO WVDP PHASE 1 DECOMMISSIONING PLAN RAIs
Table C-1. RESRAD Input Parameters
RESRAD Paameter (Units) Default Value Medium Comment/Reference
Number of unsaturated zone strata 1.00E+00 1.OOE+00 All Assumed.
Unsaturated zone thickness (m) 4.00E+00 2.OOE+00 SS, SB Site specific.
4.00E+00 0.00E+00 SD Assumed saturated for stream bank.
Unsaturated zone soil density (g/cM3) 1.50E+00 1.70E+00 SS, SB WVNSCO 1993a and WVNSCO 1993c.Unsaturated zone total porosity 4.00E-01 3.60E-01 S-, SB WVNSCO 1993c.
Unsaturated zone effective porosity 2.00E-01 2.50E-01 SS, SB WVNSCO 1993c.
Unsaturated zone field capacity 2.00E-01 2.OOE-01 SS, SB WVNSCO 1993c.
Unsaturated zone hydraulic conductivity (m/y) 1.00E+01 1.40E+02 SS, SB Average for Sand and Gravel Thick Bedded Unit (4.43E-03 cm/s from Table 3-19)divided by 10 to provide vertical conductivity that accounts for potential anisotropy(DEIS Appendix E, Table E-3).
Unsaturated zone b parameter 5.30E+00 1.40E+00 SS, SB Yu, et al. 2000, Aft. C table 3.5-1, mean for loamy sand (In(mean)=0.305).
Distribution coefficients - radionuclides
Contaminated zone (mUg) varies Site specific All See Table C-2 for distribution coefficients.
Unsaturated zone 1 (mUg) varies Site specific All See Table C-2 for distribution coefficients.
Saturated zone (mUg) varies Site specific All See Table C-2 for distribution coefficients.
Plant Transfer Factor varies Chemical- All Default values assumed.specific
Fish Transfer Factor Varies Chemical- SD Default values assumed.specific
Leach rate (l/y) varies not used All Using site-specific Kd values instead of assigning leach rate.
Solubility constant varies not used All Using site-specific Kd values instead of assigning solubility constant.
Inhalation rate (m3/y) 8.40E+03 8.40E+03 All Beyeler, et al. 1999.
Mass loading for inhalation (g/m3) 1.00E-04 1.48E-05 All Beyeler, et al. 1999. Based on relative time fractions and mean dust loadings.Assumes 288 hours of active farming per year.
Exposure duration (y) 3.00E+01 1.OOE+00 All Yearly dose estimates calculated.
11/6/09 65
• • • UPDATED DOE RESPONSES TO WVDP PHASE 1 DECOMMISSIONING PLAN RAls
Table C-1. RESRAD Input Parameters
RESRAD Parameter (Units) Default Value Medium CommentiReference
Number of unsaturated zone strata 1.00E+00 1.00E+00 All Assumed.
Unsaturated zone thickness (m) 4.00E+00 2.00E+OO SS,SB Site specific.
4.00E+00 O.OOE+OO SO Assumed saturated for stream bank.
Unsaturated zone soil density (g/cm3) 1.50E+00 1.70E+00 SS, SB WVNSCO 1993a and WVNSCO 1993c. -- ~----
Unsaturated zone total porosity 4.00E-01 3.60E-01 SS, SB WVNSCO 1993c.
Unsaturated zone effective porosity 2.00E-01 2.50E-01 SS, SB WVNSCO 1993c.
Unsaturated zone field capacity 2.00E-01 2.00E-01 SS,SB WVNSCO 1993c.
Unsaturated zone hydraulic conductivity (m/y) 1.00E+01 1.40E+02 SS,SB Average for Sand and Gravel Thick Bedded Unit (4.43E-03 em/s from Table 3-19) divided by 10 to provide vertical conductivity that accounts for potential anisotropy (DEIS Appendix E, Table E-3).
Unsaturated zone b parameter 5.30E+OO 1.40E+OO SS,SB Yu, et al. 2000, At!. C table 3.5-1, mean for loamy sand (In(mean)=0.305).
Distribution coefficients - radionuclides
Contaminated zone (mUg) varies Site specific All See Table C-2 for distribution coefficients.
Unsaturated zone 1 (mUg) varies Site specific All See Table C-2 for distribution coefficients.
Saturated zone (mUg) varies Site specific All See Table C-2 for distribution coefficients.
Plant Transfer Factor varies Chemical- All Default values assumed. specific
Fish Transfer Factor Varies Chemical- SO Default values assumed. specific
Leach rate (l/y) varies not used All Using site-specific Kd values instead of assigning leach rate.
Solubility constant varies not used All Using site-specific Kd values instead of assigning solubility constant.
Inhalation rate (m3/y) 8.40E+03 8.40E+03 All Beyeler, et al. 1999.
Mass loading for inhalation (g/m3) 1.00E-04 1.48E-05 All Beyeler, et al. 1999. Based on relative time fractions and mean dust loadings. Assumes 288 hours of active farming per year.
Exposure duration (y) 3.00E+01 1.00E+00 All Yearly dose estimates calculated.
11/6/09 65

UPDATED DOE RESPONSES TO WVDP PHASE I DECOMMISSIONING PLAN RAIs
Table C-1. RESRAD Input Parameters
RESRAD Parameter (Units) Default Value Miedium Commen~t/Reference
Filtration factor, inhalation 4.00E-01 1.OOE+00 SS, SB Beyeler, et al. 1999.
Shielding factor, external gamma 7.OOE-01 2.73E-01 SS, SB Yu, et al. 2000, Aft. C Figure 7.10-1, mean of distribution approximates a framehouse with slab or basement.
Fraction of time spent indoors 5.00E-01 6.60E-01 SS, SB Yu, et al. 2000, Aft. C Figure 7.6-2, value represents -50th percentile ofdistribution.
5.O0E-01 0.00E+00 SD Assumed.
Fraction of time spent outdoors 2.50E-01 2.50E-01 SS, SB RESRAD default value used.
2.50E-01 1.20E-02 SD Based on 104 hours/year (2 hours/day, 2 day/week, 26 weeks/y) spent on thestream bank over 8760 residence hours per year (24 hr/day, 365 days/y)
Shape factor flag, external gamma 1.00E+00 1.00E+00 SS, SB RESRAD default.
Fruits, vegetables and grain consumption (kg/y) 1.60E+02 1.12E+02 SS, SB Beyeler, et al. 1999.
Leafy vegetable consumption (kg/y) 1.40E+01 2.10E+01 SS, SB Beyeler, et al. 1999.
Milk consumption (L/y) 9.20E+01 2.33E+02 SS, SB Beyeler, et al. 1999.
Meat and poultry consumption (kg/y) 6.30E+01 6.50E+01 All Beyeler, et al. 1999.
Fish consumption (kg/y) 5.40E+00 9.OOE+00 SD Exposure Factors Handbook (EPA, 1999). The value represents the 95t,percentile of fish consumption by recreational anglers
Other seafood consumption (kg/y) 9.OOE-01 0.OOE+00 SD Assumes only fish consumed from the stream
Soil ingestion rate (g/y) 3.65E+01 1.83E+01 All Yu, et al. 2000, Aft C. Figure 5.6-1, value represents mean of distribution forresident farmer (50 mg/d).
Drinking water intake (L/y) 5.10E+02 7.30E+02 SS, SB Beyeler, et al. 1999.
5.1 OE+02 1.OOE+00 SD Based on 104 hour/year exposure and 10 mL/hr for wading scenario(http:/iwww.epa.gov/Region4/waste/ots/healtbul.htm)
Contamination fraction of drinking water 1.0 1.0 All Assumed. For streambed sediment, this is 100% of incidental ingestion.
Contamination fraction of household water 1.0 1.0 SS, SB Assumed.
Contamination fraction of livestock water 1.0 1.0 SS, SB Assumed.
Contamination fraction of groundwater 1.0 0 SD All water ingested is from surface water.
11/6/09 66
S
UPDATED DOE RESPONSES TO WVDP PHASE 1 DECOMMISSIONING PLAN RAls
Table C-1. RESRAD Input Parameters , . -~ . ," '"" Default '" Val~e ", Medium . C~mnie'!tIReferente ~ ,:. r~" !": . ;t1"~,
~,,'
':')1'-RESRAD .. P'lfil.rnet~r (Units) "", -11" ~, '.; ''1;., ,
Filtration factor, inhalation 4,OOE-01 1.00E+OO SS,SB Beyeler, et. al. 1999.
Shielding factor, external gamma 7.00E-01 2.73E-01 SS,SB Yu, et al. 2000, Alt. C Figure 7.10-1, mean of distribution approximates a frame house with slab or basement.
Fraction of time spent indoors 5.00E-01 6.60E-01 SS,SB Yu, et al. 2000, Alt. C Figure 7.6-2, value represents -50th percentile of distribution,
5.00E-01 O.OOE+OO SO Assumed.
Fraction of time spent outdoors 2.50E-01 2.50E-01 SS,SB RESRAD default value used.
2.50E-01 1.20E-02 SO Based on 104 hours/year (2 hours/day, 2 day/week, 26 weeks/y) spent on the stream bank over 8760 residence hours per year (24 hr/day, 365 days/y)
Shape factor flag, external gamma 1.00E+00 1.00E+00 SS,SB RESRAD default.
Fruits, vegetables and grain consumption (kg/y) 1,60E+02 1.12E+02 SS,SB Beyeler, et al. 1999.
Leafy vegetable consumption (kg/y) 1.40E+01 2.10E+01 SS,SB Beyeler, et al. 1999.
Milk consumption (Uy) 9.20E+01 2.33E+02 SS,SB Beyeler, et al. 1999.
Meat and poultry consumption (kgly) 6.30E+01 6.50E+01 All Beyeler, et al. 1999.
Fish consumption (kg/y) 5.40E+00 9,00E+00 SO Exposure Factors Handbook (EPA, 1999). The value represents the 95th
percentile of fish consumption by recreational anglers
Other seafood consumption (kg/y) 9.00E-01 O.OOE+OO SO Assumes only fish consumed from the stream
Soil ingestion rate (g/y) 3.65E+01 1.83E+01 All Yu, et al. 2000, Alt C. Figure 5.6-1, value represents mean of distribution for resident farmer (50 rng/d) .
Drinking water intake (Uy) 5.10E+02 7.30E+02 SS, SB Beyeler, et al. 1999.
5.10E+02 1.00E+OO SO Based on 104 hour/year exposure and 10 mUhr for wading scenario (http://www,epa.gov/Region4/waste/otslhealtbul,htm)
Contamination fraction of drinking water 1.0 1.0 All Assumed, For streambed sediment, th is is 100% of incidental ingestion,
Contamination fraction of household water 1.0 1.0 SS,SB Assumed.
Contamination fraction of livestock water 1.0 1.0 SS,SB Assumed.
Contamination fraction of groundwater 1.0 0 SO All water ingested is from surface water.
11/6/09 66
• • •

0UPDATED DOE RESPONSES TO WVDP PHASE I DECOMMISSIONING PLAN RAIs
Table C-1. RESRAD Input Parameters
RESRAD Parameter (Units) Default Value Medium Comment/Reference
Contamination fraction of irrigation water 1.0 1.0 SS, SB Assumed.
Contamination fraction of aquatic food 1.0 1.0 SD Assumed.
Contamination fraction of plant food -1 1.0 SS, SB Assumes all ingestion is from the contaminated source.
Contamination fraction of meat -1 1.0 All Assumes all ingestion is from the contaminated source.
Contamination fraction of milk -1 1.0 SS, SB Assumes all ingestion is from the contaminated source.
Livestock fodder intake for meat (kg/day) 6.80E+01 2.73E+01 SS, SB Beyeler, et al. 1999.
6.80E+01 2.25E+00 SD Assumption for deer.
Livestock fodder intake for milk (kg/day) 5.50E+01 6.42E+01 SS, SB Beyeler, et al. 1999.
Livestock water intake for meat (L/day) 5.OOE+01 5.00E+01 All Beyeler, et al. 1999, assumed for venison exposure to sediment source.
Livestock water intake for milk (L/day) 1.60E+02 1.60E+02 SS, SB RESRAD default value used.
Livestock soil intake (kg/day) 5.OOE-01 5.OOE-01 All RESRAD default, assumed for venison exposure to sediment source.
Mass loading for foliar deposition (gIm 3) 1.OOE-04 4.OOE-04 SS, SB Beyeler, et al. 1999.
Depth of soil mixing layer (m) 1.50E-01 1.50E-01 SS, SB Beyeler, et al. 1999.
Depth of roots (m) 9.OOE-01 9.OOE-01 All RESRAD default, represents crops with short growing seasons.
Drinking water fraction from ground water 1.0 1.0 All Assumed.
Household water fraction from ground water 1.0 1.0 SS, SB Assumed.
Livestock water fraction from ground water 1.0 1.0 SS, SB Assumed.
Irrigation fraction from ground water 1.0 1.0 SS, SB Assumed.
Wet weight crop yield for non-leafy (kg/M2) 7.OOE-01 1.75E+00 SS, SB Yu, et al. 2000, Aft. C Figure 6.5-1 value is mean of distribution.
Wet weight crop yield for leafy (kg/m 2) 1.50E+00 1.50E+00 SS, SB RESRAD default.
Wet weight crop yield for fodder (kg/m 2) 1.1 OE+00 1.10E+00 SS, SB RESRAD default.
Growing season for non-leafy (years) 1.70E-01 1.70E-01 SS, SB RESRAD default.
Growing season for leafy (years) 2.50E-01 2.50E-01 SS, SB RESRAD default.
Growing season for fodder (years) 8.OOE-02 8.OOE-02 SS, SB RESRAD default.
11/6/09 67
• • • UPDATED DOE RESPONSES TO WVDP PHASE 1 DECOMMISSIONING PLAN RAls
Table C-1. RESRAD Input Parameters
RESRAD Parameter (Units) Default Value Medium CommentJReference
Contamination fraction of irrigation water 1.0 1.0 SS,SB Assumed.
Contamination fraction of aquatic food 1.0 1.0 SD Assumed.
Contamination fraction of plant food -1 1.0 SS, SB Assumes all ingestion is from the contaminated source.
Contamination fraction of meat -1 1.0 All Assumes all ingestion is from the contaminated source.
Contamination fraction of milk -1 1.0 SS, SB Assumes all ingestion is from the contaminated source.
Livestock fodder intake for meat (kg/day) 6.80E+01 2.73E+01 SS,SB Beyeler, et al. 1999.
6.80E+01 2.25E+OO SD Assumption for deer.
Livestock fodder intake for milk (kg/day) 5.50E+01 6.42E+01 SS,SB Beyeler, et al. 1999.
Livestock water intake for meat (Uday) 5.00E+01 5.00E+01 All Beyeler, et al. 1999, assumed for venison exposure to sediment source.
Livestock water intake for milk (Uday) 1.60E+02 1.60E+02 SS,SB RESRAD default value used.
Livestock soil intake (kg/day) 5.00E-01 5.00E-01 All RESRAD default, assumed for venison exposure to sediment source. - --- -
Mass loading for foliar deposition (g/m3) 1.00E-04 4.00E-04 SS,SB Beyeler, et al. 1999.
Depth of soil mixing layer (m) 1.50E-01 1.50E-01 SS,SB Beyeler, et al. 1999.
Depth of roots (m) 9.00E-01 9.00E-01 All RESRAD default, represents crops with short growing seasons.
Drinking water fraction from ground water 1.0 1.0 All Assumed.
Household water fraction from ground water 1.0 1.0 SS,SB Assumed.
Livestock water fraction from ground water 1.0 1.0 SS,SB Assumed.
Irrigation fraction from ground water 1.0 1.0 SS,SB Assumed.
Wet weight crop yield for non-leafy (kg/m2) 7.00E-01 1.75E+00 SS, SB Yu, et al. 2000, Att. C Figure 6.5-1 value is mean of distribution.
Wet weight crop yield for leafy (kg/m2) 1.50E+OO 1.50E+00 SS, SB RESRAD default.
Wet weight crop yield for fodder (kg/m2) 1.10E+00 1.10E+00 SS, SB RESRAD default.
Growing season for non-leafy (years) 1.70E-01 1.70E-01 SS, SB RESRAD default.
Growing season for leafy (years) 2.50E-01 2.50E-01 SS,SB RESRAD default. -
Growing season for fodder (years) 8.00E-02 8.00E-02 SS,SB RESRAD default.
11/6/09 67

UPDATED DOE RESPONSES TO WVDP PHASE 1 DECOMMISSIONING PLAN RAIS
Table C-1. RESRAD Input Parameters
RESRAD Parameter (Units) Default Value Medium Comment/Reference
Translocation factor for non-leafy 1.00E-01 1.00E-01 SS, SB RESRAD default.
Translocation factor for leafy 1.00E+00 1.00E+00 SS, SB RESRAD default.
Translocation factor for fodder 1.00E+00 1.00E+00 SS, SB RESRAD default.
Dry foliar interception fraction for non-leafy 2.50E-01 2.50E-01 SS, SB RESRAD default.
Dry foliar interception fraction for leafy 2.50E-01 2.50E-01 SS, SB RESRAD default.
Dry foliar interception fraction for fodder 2.50E-01 2.50E-01 SS, SB RESRAD default.
Wet foliar interception fraction for non-leafy 2.50E-01 2.50E-01 SS, SB RESRAD default.
Wet foliar interception fraction for leafy 2.50E-01 6.70E-01 SS, SB Yu, et al. 2000, Att. C Figure 6.7-1 represent the most likely value.
Wet foliar interception fraction for fodder 2.50E-01 2.50E-01 SS, SB RESRAD default.
Weathering removal constant (l/y) 2.00E+01 1.80E+01 SS, SB Yu, et al. 2000, Aft. C Figure 6.6-1 represent the most likely value
Carbon-14-related exposure parameters
C-12 concentration in water (g/cc) 2.OOE-05 2.OOE-05 All RESRAD default.
C-12 concentration in soil (g/g) 3.OOE-02 3.OOE-02 All RESRAD default.
Fraction of vegetable carbon from soil 2.OOE-02 2.00E-02 All RESRAD default.
Fraction of vegetable carbon from air 9.80E-01 9.80E-01 All RESRAD default.
C-14 evasion layer thickness in soil (m) 3.00E-01 3.OOE-01 All RESRAD default.
C-14 evasion flux rate from soil (1/sec) 7.00E-07 7.OOE-07 All RESRAD default.
C-12 evasion flux rate from soil (1/sec) 1.OOE-10 1.OOE-10 All RESRAD default.
Fraction of grain in beef cattle feed 0.8 0.8 All RESRAD default.
Fraction of grain in milk cow feed 0.2 0.2 All RESRAD default.
Storage times of contaminated foodstuff (days)
Fruits, non-leafy vegetables, and grain 1.40E+01 1.40E+01 SS, SB RESRAD default.
Leafy vegetables 1.OOE+00 1.OOE+00 SS, SB RESRAD default.
Milk 1.OOE+00 1.OOE+00 SS, SB RESRAD default.
11/6/09 68
0
UPDATED DOE RESPONSES TO WVDP PHASE 1 DECOMMISSIONING PLAN RAls
Table C-1. RESRAD Input Parameters
RESRAD Parameter (Units) Default Value Medium Comment/Reference -
Translocation factor for non-leafy 1.00E·01 1.00E-01 SS,SB RESRAD default.
Translocation factor for leafy 1.00E+00 1.00E+00 SS, SB RESRAD default.
Translocation factor for fodder 1.00E+00 1.00E+00 SS,SB RESRAD default.
Dry foliar interception fraction for non-leafy 2.50E-01 2.50E-01 SS,SB RESRAD default.
Dry foliar interception fraction for leafy 2.50E-01 2.50E-01 SS,SB RESRAD default.
Dry foliar interception fraction for fodder 2.50E-01 2.50E-01 SS, SB RESRAD default.
Wet foliar interception fraction for non-leafy 2.50E-01 2.50E-01 SS,SB RESRAD default.
Wet foliar interception fraction for leafy 2.50E-01 6.70E-01 SS,SB Yu, et al. 2000, Att. C Figure 6.7-1 represent the most likely value.
Wet foliar interception fraction for fodder 2.50E-01 2.50E-01 SS,SB RESRAD default.
Weathering removal constant (1/y) 2.00E+01 1.BOE+01 SS,SB Yu, et al. 2000, Att. C Figure 6.6-1 represent the most likely value
Carbon-14-related exposure parameters
C-12 concentration in water (g/cc) 2.00E-05 2.00E-05 All RESRAD default.
C-12 concentration in soil (gig) 3.00E-02 3.00E-02 All RESRAD default.
Fraction of vegetable carbon from soil 2.00E-02 2.00E-02 All RESRAD default.
Fraction of vegetable carbon from air 9.BOE-01 9.BOE-01 All RESRAD default.
C-14 evasion layer thickness in soil (m) 3.00E-01 3.00E-01 All RESRAD default.
C-14 evasion flux rate from soil (1/sec) 7.00E-07 7.00E-07 All RESRAD default.
C-12 evasion flux rate from soil (1/sec) 1.00E-10 1.00E-10 All RESRAD default.
Fraction of grain in beef cattle feed O.B O.B All RESRAD default.
Fraction of grain in milk cow feed 0.2 0.2 All RESRAD default.
Storage times of contaminated foodstuff (days)
Fruits, non-leafy vegetables, and grain 1.40E+01 1.40E+01 SS, SB RESRAD default.
Leafy vegetables 1.00E+00 1.00E+00 SS,SB RESRAD default.
Milk 1.00E+00 1.00E+00 SS,SB RESRAD default.
11/6/09 68
• • •

UPDATED DOE RESPONSES TO WVDP PHASE 1 DECOMMISSIONING PLAN RAIs
Table C-1. RESRAD Input Parameters
RESRAD Parameter (Units) Default Value Medium Comment/Reference
Meat 2.OOE+01 2.OOE+01 SS, SB RESRAD default.
Fish 7.OOE+00 7.OOE+00 SD RESRAD default.
Crustacea and mollusks 7.OOE+00 7.OOE+00 Not used RESRAD default.
Well water 1.OOE+00 1.OOE+00 SS, SB RESRAD default.
Surface water 1.OOE+00 1.OOE+00 SS, SB RESRAD default.
Livestock fodder 4.50E+01 4.50E+01 SS, SB RESRAD default
Radon-related exposure parameters
Thickness of building foundation (m) 1.50E-01 not used All Applicable for Radon exposures only
Bulk density of building foundation (g/cc) 2.40E+00 not used All Applicable for Radon exposures only.
Total porosity of cover material 4.OOE-01 not used All Applicable for Radon exposures only.
Total porosity of building foundation 1.OQE-01 not used All Applicable for Radon exposures only.
Volumetric water constant of the cover material 5.O0E-02 not used All Applicable for Radon exposures only.
Volumetric water constant of the foundation 3.OOE-02 not used All Applicable for Radon exposures only.
Diffusion coefficient for radon gas (m2/sec)
in cover material 2.OOE-06 not used All Applicable for Radon exposures only.
in foundation material 3.OOE-07 not used All Applicable for Radon exposures only.
in contaminated zone soil 2.OOE-06 not used All Applicable for Radon exposures only.
Radon vertical dimension of mixing (m) 2.OOE+00 not used All Applicable for Radon exposures only.
Average building air exchange rate (1/hr) 5.O0E-01 not used All Applicable for Radon exposures only.
Height of building or room (m) 2.50E+00 not used All Applicable for Radon exposures only.
Building indoor area factor O.OOE+00 not used All Applicable for Radon exposures only.
Building depth below ground surface (m) -1 not used All Applicable for Radon exposures only.
Emanating power of Rn-222 gas 2.50E-01 not used All Applicable for Radon exposures only.
11/6/09 69
• • • UPDATED DOE RESPONSES TO WVDP PHASE 1 DECOMMISSIONING PLAN RAls
Table C-1. RESRAD Input Parameters
RESRAD Parameter (Units) Default Value Medium Comment/Reference
Meat 2.00E+01 2.00E+01 SS,SB RESRAD default.
Fish 7.00E+OO 7.00E+OO SD RESRAD default.
Crustacea and mollusks 7.00E+OO 7.00E+OO Not used RESRAD default.
Well water 1.00E+OO 1.00E+OO SS, SB RESRAD default.
Surface water 1.00E+OO 1.00E+OO SS,SB RESRAD default.
Livestock fodder 4.50E+01 4.50E+01 SS,SB RESRAD default
Radon-related exposure parameters
Thickness of building foundation (m) 1.50E-01 not used All Applicable for Radon exposures only
Bulk density of building foundation (glee) 2.40E+OO not used All Applicable for Radon exposures only.
Total porosity of cover material 4.00E-01 not used All Applicable for Radon exposures only.
Total porosity of building foundation 1.00E-01 not used All Applicable for Radon exposures only.
Volumetric water constant of the cover material 5.00E-02 not used All Applicable for Radon exposures only.
Volumetric water constant of the foundation 3.00E-02 not used All Applicable for Radon exposures only.
Diffusion coefficient for radon gas (m2/sec)
in cover material 2.00E-06 not used All Applicable for Radon exposures only.
in foundation material 3.00E-07 not used All Applicable for Radon exposures only.
in contaminated zone soil 2.00E-06 not used All Applicable for Radon exposures only.
Radon vertical dimension of mixing (m) 2.00E+OO not used All Applicable for Radon exposures only.
Average building air exchange rate (1/hr) 5.00E-01 not used All Applicable for Radon exposures only.
Height of building or room (m) 2.50E+OO not used All Applicable for Radon exposures only.
Building indoor area factor O.OOE+OO not used All Applicable for Radon exposures only.
Building depth below ground surface (m) -1 not used All Applicable for Radon exposures only.
Emanating power of Rn-222 gas 2.50E-01 not used All Applicable for Radon exposures only.
11/6/09 69

UPDATED DOE RESPONSES TO WVDP PHASE I DECOMMISSIONING PLAN RAIs
Table C-1. RESRAD Input Parameters
RESRAD Parameter (Units) Default Value Medium Comment/Reference
Emanating power of Rn-220 gas 1.50E-01 not used All Applicable for Radon exposures only.
LEGEND: SS = surface soil, SB = subsurface soil, SD = streambed sediment.
Table C-2. SoilNVater Distribution Coefficients"_)
RESRAD Surface Soil DCGL Subsurface Soil DCGL Sediment DCGL Unsaturated(2) Saturated(3)Radionuclide Default Contaminated Contaminated Contaminated Zone (mUg) Zone (mUg)
(mug) Zone (mUg) Zone (mUg) Zone (mUg)
Principal Elements
Americium 20 1900(4) 4000(5) 4000(') 1900(4) 1900(4)
(420 - 111,000) (420 - 111,000) (420 - 111,000) (420 - 111,000) (420 - 111,000)
Carbon 0 5(4) 7(5) 7(5) 5(4) 5(4)
(0.7- 12) (0.7- 12) (0.7- 12) (0.7- 12) (0.7- 12)
Curium(6 ) calculated 6760 6760 6760 6760 6760
(780 - 22,970) (780 - 22,970) (780 - 22,970) (780 - 22,970) (780 - 22,970)
Cesium 4600 280(4) 480(5) 480(5) 280(4) 280(4)
(48 - 4800) (48 - 4800) (48 - 4800) (48- 4800) (48- 4800)
Iodine calculated 11(4) 2(7) 2 (7) 1(4) 1(4)
(0.4- 3.4) (0.4- 3.4) (0.4- 3.4) (0.4- 3.4) (0.4- 3.4)
Neptunium calculated 2.3(8) 3(5) 3(5) 2.3(8) 2.3(8)
(0.5 - 5.2) (0.5 - 5.2) (0.5 - 5.2) (0.5 - 5.2) (0.5 - 5.2)
Plutonium 2000 2600(8) 3000(') 3000(') 2600(8) 2600(8)
(5 - 27,900) (5 - 27,900) (5 - 27,900) (5 - 27,900) (5 - 27,900)
Strontium 30 5(9) 15(5) 15(5) 5(9) 5(9)
(1-32) (1-32) (1-32) (1-32) (1-32)
Technetium 0 0.1(4) 4.1(7) 4.1(7) 0.1(4) 0.1(4)
(0.01 -4.1) (1-10) (1- 10) (0.01 -4.1) (0.01-4.1)
Uranium 50 35(4) 10(9) 10(9) 35(4) 35(4)
(10-350) (1-100) (1-100) (10-350) (10-350)
11/6/090 70
0
UPDATED DOE RESPONSES TO WVDP PHASE 1 DECOMMISSIONING PLAN RAls
Table C-1. RESRAD Input Parameters
RESRAD Parameter (Units) Default Value Medium CommentIReference " " ~
~ , Emanating power of Rn-220 gas 1.50E-01 not used All Applicable for Radon exposures only.
LEGEND: SS = surface soil, S8 = subsurface soil, SO = streambed sediment.
Table C-2. SoillWater Distribution Coefficients(1)
RESRAD Surface Soil DCGL Subsurface Soil DCGL Sediment DCGL Unsaturated(2) Saturated(3) Radionuclide Default Contaminated Contaminated Contaminated
(mUg) Zone (mUg) Zone (mUg) Zone (mUg) Zone (mUg) Zone (mUg)
Principal Elements
Americium 20 1900(4) 4000(5) 4000(5) 1900(4) 1900(4)
(420 - 111 ,000) (420 - 111,000) (420 - 111 ,000) (420 - 111 ,000) (420 - 111 ,000)
Carbon 0 S(4) 7(5) 7(5) S(4) S(4)
(0.7 - 12) (0.7 - 12) (0.7 - 12) (0.7 - 12) (0.7 - 12) Curium(6) calculated 6760 6760 6760 6760 6760
(780 - 22,970) (780 - 22,970) (780 - 22,970) (780 - 22,970) (780 - 22,970)
Cesium 4600 280(4) 480(5) 480(5) 280(4) 280(4)
(48 - 4800) (48 - 4800) (48 - 4800) (48 - 4800) (48 - 4800)
Iodine calculated 1(4) 2(7) 2(7) 1 (4) 1 (4)
(0.4 - 3.4) (0.4 - 3.4) (0.4 - 3.4) (0.4 - 3.4) (0.4 - 3.4)
Neptunium calculated 2.3(8) 3(5) 3(5) 2.3(8) 2.3(8)
(O.S - S.2) (O.S - S.2) (O.S - S.2) (O.S - S.2) (O.S - S.2)
Plutonium 2000 2600(8) 3000(5) 3000(5) 2600(8) 2600(8)
(S - 27 ,900) (S - 27,900) (S - 27,900) (S - 27,900) (S - 27,900)
Strontium 30 S(9) 1S(5) 1S(5) S(9) S(9)
(1 - 32) (1 - 32) (1 - 32) (1 - 32) (1 - 32)
Technetium 0 0.1(4) 4.1(7) 4.1 (7) 0.1(4) 0. 1(4)
(0.01 - 4.1) (1 - 10) (1 - 10) (0.01 - 4.1) (0.01 - 4.1)
Uranium SO 3S(4) 10(9) 10(9) 3S(4) 3S(4)
(10 - 3S0) (1 - 100) (1 - 100) (10 - 3S0) (10 - 3S0)
11 /6/09 70
• • •

S 0 0UPDATED DOE RESPONSES TO WVDP PHASE I DECOMMISSIONING PLAN RAIs
Table C-2. SolliWater Distribution Coefficients"')
RESRAD Surface Soil DCGL Subsurface Soil DCGL Sediment DCGL Unsaturated(2 ) Saturated (3Radionuclide Default Contaminated Contaminated Contaminated Zone (mUg) Zone (mug)(mug) Zone (mUg) Zone (mUg) Zone (mUg)
Progeny Elements(10)
Actinium 20 1740 1740 1 1740 1740 1740
Lead 100 2400 2400 2400 2400 2400
Protactinium 50 2040 2040 2040" 2040 2040Radium 70 3550 3550 3550 3550 3550Thorium 60,000 5890 5890 5890 5890 5890
NOTES: (1) Sources of Kd values considered included Table 3-20; NUREG-5512 (Beyeler, et al. 1999), Table 6.7; RESRAD User's Guide (Yu, et al. 2001), Tables E-3, E-4;Sheppard, et. al. 2006, and Sheppard and Thibault 1990. Values in parentheses are the bounds used in the sensitivity evaluation, selected considering site-specificand literature values to reflect a reasonable range.
(2) Sediment model assumes no unsaturated zone. Values used for surface and subsurface soil evaluation only.(3) Values presented here are those used for surface soil DCGLs based on the non-dispersion model.
(4) From Sheppard and Thibault 1990, for sand.(5) Site specific value for the unweathered Lavery till (see Section 3.7.8, Table 3-20).
(6) Beyeler, et. al. 1999(7) Site specific value for the Lavery till (see Section 3.7.8, Table 3-20).
(8) Site specific value for the sand and gravel unit (see Section 3.7.8, Table 3-20). The value of 5 mUg is consistent with the value used in the Decommissioning EIS.(9) Site specific data (Dames and Moore 1995a, 1995b)
(10) Progeny Kds were not included in the sensitivity analysis; DEIS values were used in all cases.
11/6/09 71
• • • UPDATED DOE RESPONSES TO WVDP PHASE 1 DECOMMISSIONING PLAN RAls
Table C-2. SoilIWater Distribution Coefficients(1)
RESRAD Surface Soil DCGL Subsurface Soil DCGL Sediment DCGL Unsaturated(2) Saturated(3) Radionuclide Default Contaminated Contaminated Contaminated
(mUg) Zone (mUg) Zone (mUg) Zone (mUg) Zone (mUg) Zone (mUg)
Progeny Elements(10)
Actinium 20 1740 1740 1740 1740 1740 Lead 100 2400 2400 2400 2400 2400 Protactinium 50 2040 2040 2040' 2040 2040 Radium 70 3550 3550 3550 3550 3550 Thorium 60,000 5890 5890 5890 5890 5890
NOTES: (1 ) Sources of K. values considered included Table 3-20; NUREG-5512 (Beyeler, et al. 1999), Table 6.7; RESRAD User's Guide (Yu, et al. 2001), Tables E-3, E-4; Sheppard, et. al. 2006, and Sheppard and Thibault 1990. Values in parentheses are the bounds used in the sensitivity evaluation, selected considering site-specific and literature values to reflect a reasonable range.
1116/09
(2) Sediment model assumes no unsaturated zone. Values used for surface and subsurface soil evaluation only. (3) Values presented here are those used for surface soil DCGLs based on the non-dispersion model. (4) From Sheppard and Thibault 1990, for sand.
(5) Site specific value for the unweathered Lavery till (see Section 3.7.8, Table 3-20). (6) Beyeler, et. at. 1999 (7) Site specific value for the Lavery till (see Section 3.7.8, Table 3-20).
(8) Site specific value for the sand and gravel unit (see Section 3.7.8, Table 3-20). The value of 5 mUg is consistent with the value used in the Decommissioning EIS. (9) Site specific data (Dames and Moore 1995a, 1995b)
(10) Progeny K.s were not included in the sensitivity analysis; DEIS values were used in all cases.
71
-

DOE RESPONSES TO WVDP PHASE 1 DECOMMISSIONING PLAN RAIs
Table C-3 Scenario exposure pathways for WVDP DCGL development
Resident Farmer RecreationistExposure Pathways (surface soil and (sediment
Lavery Till source) source)
Incidental ingestion of source 0 e
External exposure to source • 0
Inhalation of airborne source 0
Ingestion of groundwater impacted by source 0 X
Ingestion of milk impacted by soil and water sources 0 X
Ingestion of beef impacted by soil and water sources " X
Ingestion of produce impacted by soil and water 0 Xsources
Incidental ingestion of surface water impacted by o 0source
Ingestion of fish impacted by source o •
Ingestion of venison impacted by sediment and water o 0sources
LEGEND:
* - Pathway is considered complete and is included in DCGL development.
o - Pathway is considered potentially complete but unlikely, and is not included in DCGL development.
x - Pathway is considered incomplete and is not included in DCGL development.
11/6/09 72
DOE RESPONSES TO WVDP PHASE 1 DECOMMISSIONING PLAN RAls
Table C-3 Scenario exposure pathways for WVDP DCGL development
Resident Farmer Recreationist
11/6/09
Exposure Pathways (surface soil and Lavery Till source)
Incidental ingestion of source • External exposure to source • Inhalation of airborne source • Ingestion of groundwater impacted by source • Ingestion of milk impacted by soil and water sources • Ingestion of beef impacted by soil and water sources • Ingestion of produce impacted by soil and water • sources
Incidental ingestion of surface water impacted by 0
source
Ingestion of fish impacted by source 0
Ingestion of venison impacted by sediment and water 0
sources
LEGEND:
• - Pathway is conSidered complete and is included in DCGL development.
o - Pathway is conSidered potentially complete but unlikely, and is not included in DCGL development.
x - Pathway is considered incomplete and is not included in DCGL development.
72
(sediment source)
e
• • X
X
X
X
•
• •
•
•
•

DOE RESPONSES TO WVDP PHASE 1 DECOMMISSIONING PLAN RAIs
Table C-4. Radiological Concentrations from Soil Samples Containing Lavery Till in theWMA 1 and WMA 2 Excavation Areas(1 )
Location 1d Sample DepthnNuclide Result (pCi/g) Interval (ft)
BH-17 (WMA 6,1993) Sr-90 11E-01 26-28Depth to Lavery till - 27 ft Cs-137 2.6E-02 26-28
U-232 < 3.2E-03 26-28
U-233/234 1.6E-01 26-28
U-235 < 5.8E-03 26-28
U-235/236 < 6.9E-03 26-28
U-238 1.1E-01 26-28
Pu-238 < 4.3E-03 26-28
Pu-239/240 < 4.3E-03 26-28
Pu-241 1.3E+00 26-28
Am-241 < 9.6E-03 26-28
BH-21A (WMA 1, 1993) Sr-90 4.5E+02 36-38Depth to Lavery till - 37.5 ft Cs-137 < 3.0E-02 36-38
U-232 < 7.4E-03 36-38
U-233/234 8.6E-02 36-38
U-235 < 5.1E-03 36-38
U-235/236 < 7.2E-03 36-38
U-238 7.1 E-02 36-38
Pu-238 < 4.8E-03 36-38
Pu-239/240 < 4.8E-03 36-38
Pu-241 < 1.1E+00 36-38
Am-241 < 7.2E-03 36-38
GP3098 (WMA 1, 1998) Sr-90 6.6E+00 36.5-37Depth to Lavery till - 37 ft Sr-90 4.2E+00 37-37.5
Sr-90 6.3E+00 37.5-38
Sr-90 5.5E+01 38-38.5
Sr-90 5.9E+01 38.5-39
Sr-90 3.4E+01 39-39.5
Sr-90 2.9E+01 39.5-40
GP3008 (WMA 1, 2008)Depth to Lavery till - 37 ft
C-14 < 3.0E-01 37-39Sr-90 1.7E+00 37-39Tc-99 < 5.5E-01 37-391-129 < 1.1E-01 37-39Cs-1 37 < 2.OE-02 37-39U-232 < 2.2E-02 37-39
U-233/234 9.7E-01 37-39
U-235/236 1.3E-01 37-39U-238 1.1 E+00 37-39
11/6/09 73
•
•
•
DOE RESPONSES TO WVDP PHASE 1 DECOMMISSIONING PLAN RAls
Table C-4. Radiological Concentrations from Soil Samples Containing Lavery Till in the WMA 1 and WMA 2 Excavation Areas(1)
Location Nuclide Result (pCi/g) Sample Depth
Interval (tt) .
BH-17 (WMA 6, 1993) Sr-90 1.1E-01 26-28 Depth to Lavery till - 27 ft Cs-137 2.6E-02 26-28
U-232 < 3.2E-03 26-28
U-233/234 1.6E-01 26-28
U-235 < 5.8E-03 26-28
U-235/236 < 6.9E-03 26-28
U-238 1.1E-01 26-28
Pu-238 < 4.3E-03 26-28
Pu-239/240 < 4.3E-03 26-28
Pu-241 1.3E+00 26-28
Am-241 < 9.6E-03 26-28
BH-21A (WMA 1,1993) Sr-90 4.5E+02 36-38 Depth to Lavery till- 37.5 ft Cs-137 < 3.0E-02 36-38
U-232 < 7.4E-03 36-38
U-233/234 8.6E-02 36-38
U-235 < 5.1 E-03 36-38
U-235/236 < 7.2E-03 36-38
U-238 7.1 E-02 ·36-38
Pu-238 < 4.8E-03 36-38
Pu-239/240 < 4.8E-03 36-38
Pu-241 < 1.1E+00 36-38
Am-241 < 7.2E-03 36-38
GP3098 (WMA 1,1998) Sr-90 6.6E+00 36.5-37 Depth to Lavery till - 37 ft Sr-90 4.2E+00 37-37.5
Sr-90 6.3E+OO 37.5-38
Sr-90 5.5E+01 38-38.5
Sr-90 5.9E+01 38.5-39
Sr-90 3.4E+01 39-39.5
Sr-90 2.9E+01 39.5-40
GP3008 (WMA 1, 2008) C-14 < 3.0E-01 37-39 Depth to Lavery till - 37 ft Sr-90 1.7E+00 37-39
Tc-99 < 5.5E-01 37-39 1-129 < 1.1E-01 37-39 Cs-137 < 2.0E-02 37-39 U-232 < 2.2E-02 37-39
U-233/234 9.7E-01 37-39
U-235/236 1.3E-01 37-39 U-238 1.1E+00 37-39
11/6/09 73

DOE RESPONSES TO WVDP PHASE 1 DECOMMISSIONING PLAN RAIS
Table C-4. Radiological Concentrations from Soil Samples Containing Lavery Till in theWMA 1 and WMA 2 Excavation Areas(')
Location Nuclide Result (pCi/g) Sample DepthInterval (ft)
Np-237 < 9.8E-03 37-39Pu-238 < 1.1 E-02 37-39
Pu-239/240 < 1.2E-02 37-39
Pu-241 < 4.8E-01 37-39
Am-241 < 1.2E-02 37-39
Cm-243/244 < 1.2E-02 37-39
GP7398 (WMA 1, 1998) Sr-90 1.9E+00 40-40.5
Depth to Lavery till - 39 ft Sr-90 1.8E+00 40.5-41
Sr-90 5.2E+00 41-41.5
Sr-90 8.4E+00 41.5-42
GP7608 (WMA 1, 2008) C-14 < 3.4E-01 38-40Depth to Lavery till - 38 ft Sr-90 1.8E+01 38-40
Tc-99 < 3.9E-01 38-40
1-129 < 2.3E-01 38-40
Cs-137 7.9E+00 38-40
U-232 < 2.8E-01 38-40
U-233/234 1.9E+00 38-40
U-235/236 < 4.2E-01 38-40U-238 8.8E-01 38-40
Np-237 < 3.6E-01 38-40
Pu-238 < 3.4E-01 38-40Pu-239/240 < 3.1E-01 38-40Pu-241 < 3.4E+01 38-40
Am-241 < 2.OE-01 38-40
Cm-243/244 < 2.2E-01 38-40
GP7808 (WMA 1, 2008) C-14 < 2.9E-01 37-39
Depth to Lavery till - 37 ft Sr-90 8.6E+00 37-39Tc-99 < 4.4E-01 37-39
1-129 < 2.3E-01 37-39
Cs-137 < 2.2E-02 37-39U-232 < 1.3E-02 37-39U-233/234 8.2E-01 37-39
U-235/236 9.2E-02 37-39
U-238 1.1E+00 37-39Np-237 < 2.1E-02 37-39
Pu-238 < 1.1 E-02 37-39Pu-239/240 < 1.5E-02 37-39Pu-241 < 4.9E-01 37-39
Am-241 < 1.7E-02 37-39
Cm-243/244 < 1.6E-02 37-39
GP8098 (WMA 1, 1998)Depth to Lavery till - 41 ft
C-14 < 8.6E-02 40-42
Sr-90 1.3E+01 j 40-42
11/6/09 74
DOE RESPONSES TO WVDP PHASE 1 DECOMMISSIONING PLAN RAls
Table C-4. Radiological Concentrations from Soil Samples Containing Lavery Till in the WMA 1 and WMA 2 Excavation Areas(l)
Location Nuclide Result (pCi/g) Sample Depth
Interval (ft)
Np-237 < 9.8E-03 37-39 Pu-238 < 1.1E-02 37-39 Pu-239/240 < 1.2E-02 37-39 Pu-241 < 4.8E-01 37-39 Am-241 < 1.2E-02 37-39 Cm-243/244 < 1.2E-02 37-39
GP7398 (WMA 1, 1998) Sr-90 1.9E+00 40-40.5 Depth to Lavery till - 39 ft Sr-90 1.8E+00 40.5-41
Sr-90 5.2E+00 41-41.5
Sr-90 8.4E+00 41.5-42
GP7608 (WMA 1, 2008) C-14 < 3.4E-01 38-40 Depth to Lavery till - 38 ft Sr-90 1.8E+01 38-40
Tc-99 < 3.9E-01 38-40 1-129 < 2.3E-01 38-40 Cs-137 7.9E+00 38-40 U-232 < 2.8E-01 38-40
U-233/234 1.9E+00 38-40 U-235/236 < 4.2E-01 38-40 U-238 8.8E-01 38-40 Np-237 < 3.6E-01 38-40 Pu-238 < 3.4E-01 38-40 Pu-239/240 < 3.1 E-01 38-40 Pu-241 < 3.4E+01 38-40 Am-241 < 2.0E-01 38-40 Cm-243/244 < 2.2E-01 38-40
GP7808 (WMA 1, 2008) C-14 < 2.9E-01 37-39 Depth to Lavery till - 37 ft Sr-90 8.6E+00 37-39
t. Tc-99 < 4.4E-01 37-39 1-129 < 2.3E-01 37-39 Cs-137 < 2.2E-02 37-39 U-232 < 1.3E-02 37-39 U-233/234 8.2E-01 37-39 U-235/236 9.2E-02 37-39 U-238 1.1E+00 37-39 Np-237 < 2.1E-02 37-39 Pu-238 < 1.1E-02 37-39 Pu-239/240 < 1.5E-02 37-39 Pu-241 < 4.9E-01 37-39 Am-241 < 1.7E-02 37-39 Cm-243/244 < 1.6E-02 37-39
GP8098 (WMA 1, 1998) C-14 < 8.6E-02 40-42 Depth to Lavery till - 41 ft Sr-90 1.3E+01 40-42
11/6/09 74
•
•
•

DOE RESPONSES TO WVDP PHASE 1 DECOMMISSIONING PLAN RAIs
Table C-4. Radiological Concentrations from Soil Samples Containing Lavery Till in theWMA 1 and WMA 2 Excavation Areas(l)
Location 1 d R Sample DepthLo nNuclide Result (pCi/g) Interval (ft)
Tc-99 < 2.6E-01 40-421-129 < 2.3E-01 40-42Cs-1 37 < 2.2E-02 40-42Pu-241 < 2.1E+00 40-42
GP8008 (WMA 1, 2008) C-14 < 2.8E-01 39-41Depth to Lavery till - 40 ft C-14 < 2.8E-01 41-43
Sr-90 5.3E+00 39-41Sr-90 1.4E+00 41-43Tc-99 < 3.4E-01 39-41Tc-99 < 3.7E-01 41-431-129 < 1.2E-01 39-411-129 < 1.2E-01 41-43Cs-1 37 < 2.3E-02 39-41Cs-137 < 2.8E-02 41-43U-232 < 1.OE-02 39-41U-232 < 1.3E-02 41-43U-233/234 5.2E-01 39-41U-233/234 1.1 E+00 41-43U-235/236 3.9E-02 39-41U-235/236 1.1E-01 41-43U-238 8.2E-01 39-41U-238 1.4E+00 41-43Np-237 < 1.1E-02 39-41Np-237 < 1.2E-02 41-43Pu-238 < 1.5E-02 39-41Pu-238 < 1.5E-02 41-43Pu-239/240 < 1.6E-02 39-41Pu-239/240 < 1.5E-02 41-43Pu-241 < 4.4E-01 39-41Pu-241 < 5.2E-01 41-43Am-241 < 1.2E-02 39-41Am-241 < 1.5E-02 41-43Cm-243/244 < 1.3E-02 39-41Cm-243/244 < 1.6E-02 41-43
GP8308 (WMA 1, 2008) C-14 < 3.5E-01 40-42
Depth to Lavery till - 41.5 ft Sr-90 1.5E+00 40-42Tc-99 < 3.6E-01 40-421-129 2.4E-01 40-42Cs-1 37 < 2.7E-02 40-42U-232 < 2.4E-02 40-42U-233/234 9.8E-01 40-42
U-235/236 2.2E-01 40-42
U-238 1.1E+00 40-42
11/6/09 75
•
•
•
DOE RESPONSES TO WVDP PHASE 1 DECOMMISSIONING PLAN RAls
Table C-4. Radiological Concentrations from Soil Samples Containing Lavery Till in the WMA 1 and WMA 2 Excavation Areas(1)
Location Nuclide Result (pCi/g) Sample Depth
Interval (tt)
Tc-99 < 2.6E-01 40-42
1-129 < 2.3E-01 40-42 Cs-137 < 2.2E-02 40-42
Pu-241 < 2.1E+00 40-42
GP8008 (WMA 1, 2008) C-14 < 2.8E-01 39-41 Depth to Lavery till - 40 ft C-14 < 2.8E-01 41-43
Sr-90 5.3E+00 39-41
Sr-90 1.4E+00 41-43 Tc-99 < 3.4E-01 39-41 Tc-99 < 3.7E-01 41-43
1-129 < 1.2E-01 39-41
1-129 < 1.2E-01 41-43 Cs-137 < 2.3E-02 39-41
Cs-137 < 2.8E-02 41-43
U-232 < 1.0E-02 39-41 U-232 < 1.3E-02 41-43 U-233/234 5.2E-01 39-41 U-233/234 1.1E+00 41-43
U-235/236 3.9E-02 39-41
U-235/236 1.1E-01 41-43
U-238 8.2E-01 39-41
U-238 1.4E+00 41-43 Np-237 < 1.1E-02 39-41 Np-237 < 1.2E-02 41-43 Pu-238 < 1.5E-02 39-41 Pu-238 < 1.5E-02 41-43
Pu-239/240 < 1.6E-02 39-41 Pu-239/240 < 1.5E-02 41-43 Pu-241 < 4.4E-01 39-41 Pu-241 < 5.2E-01 41-43 Am-241 < 1.2E-02 39-41 Am-241 < 1.5E-02 41-43 Cm-243/244 < 1.3E-02 39-41
Cm-243/244 < 1.6E-02 41-43
GP8308 (WMA 1, 2008) C-14 < 3.5E-01 40-42
Depth to Lavery till - 41.5 ft Sr-90 1.5E+00 40-42 Tc-99 < 3.6E-01 40-42 1-129 2.4E-01 40-42 Cs-137 < 2.7E-02 40-42
U-232 < 2.4E-02 40-42
U-233/234 9.8E-01 40-42 U-235/236 2.2E-01" 40-42 U-238 1.1E+00 40-42
11/6/09 75

DOE RESPONSES TO WVDP PHASE 1 DECOMMISSIONING PLAN RAts
Table C-4. Radiological Concentrations from Soil Samples Containing Lavery Till in theWMA 1 and WMA 2 Excavation Areas(1)
o N d Sample DepthLocation Nuclide Result (pCi/g) Interval (ft)
Np-237 < 1.3E-02 40-42Pu-238 < 1.1E-02 40-42Pu-239/240 < 1.1 E-02 40-42
Pu-241 < 2.7E-01 40-42
Am-241 < 1.2E-02 40-42
Cm-243/244 < 1.8E-02 40-42
GP8698 (WMA 1, 1998) Sr-90 2.2E+00 39-39.5Depth to Lavery till - 39 ft Sr-90 1.OE+00 39.5-40
Sr-90 3.OE+00 40-40.5
Sr-90 1.OE+01 40.5-41
Sr-90 4.1E+01 41-41.5
Sr-90 3.OE+01 41.5-42
GP10008 (WMA 1, 2008) C-14 < 3.OE-01 37-39Depth to Lavery till - 37 ft Sr-90 6.7E+00 37-39
Tc-99 < 4.0E-01 37-39
1-129 < 1.4E-01 37-39Cs-1 37 < 2.7E-02 37-39
U-232 < 1.3E-02 37-39U-233/234 7.6E-01 37-39
U-235/236 7.5E-02 37-39
U-238 9.5E-01 37-39Np-237 < 1.2E-02 37-39
Pu-238 < 2.2E-02 37-39
Pu-239/240 < 1.1 E-02 37-39Pu-241 < 4.3E-01 37-39Am-241 < 1.4E-02 37-39
Cm-243/244 < 2.3E-02 37-39
GP10108 (WMA 1,2008) C-14 < 3.1E-01 32-34
Depth to Lavery till - 33 ft Sr-90 6.3E-01 32-34Tc-99 < 5.4E-01 32-34
1-129 < 9.1E-02 32-34
Cs-1 37 < 2.6E-02 32-34
U-232 < 1.6E-01 32-34
U-233/234 6.OE-01 32-34U-235/236 5.OE-02 32-34
U-238 7.3E-01 32-34Np-237 < 1.OE-02 32-34
Pu-238 < 9.5E-03 32-34
Pu-239/240 < 8.8E-03 32-34
Pu-241 < 4.7E-01 32-34Am-241 < 1.1E-02 32-34
Cm-243/244 < 1.1E-02 32-34
11/6/09 76
DOE RESPONSES TO WVDP PHASE 1 DECOMMISSIONING PLAN RAls
Table C-4. Radiological Concentrations from Soil Samples Containing Lavery Till in the WMA 1 and WMA 2 Excavation Areas(1)
Location Nuclide Result (pCi/g) Sample Depth
Interval (ft)
Np-237 < 1.3E-02 40-42 Pu-238 < 1.1 E-02 40-42 Pu-239/240 < 1.1 E-02 40-42 Pu-241 < 2.7E-01 40-42 Am-241 < 1.2E-02 40-42 Cm-243/244 < 1.8E-02 40-42
GP8698 (WMA 1, 1998) Sr-90 2.2E+00 39-39.5 Depth to Lavery till - 39 ft Sr-90 1.0E+00 39.5-40
Sr-90 3.0E+00 40-40.5
Sr-90 1.0E+01 40.5-41
Sr-90 4.1E+01 41-41.5
Sr-90 3.0E+01 41.5-42
GP10008 (WMA 1, 2008) C-14 < 3,OF-01 37-~~
Depth to Lavery till - 37 ft Sr-90 6.7E+00 37-39 Tc-99 < 4.0E-01 37-39
1-129 < 1.4E-01 37-39 Cs-137 < 2.7E-02 37-39
U-232 < 1.3E-02 37-39
U-233/234 7.6E-01 37-39 U-235/236 7.5E-02 37-39
U-238 9.5E-01 37-39 Np-237 < 1.2E-02 37-39 Pu-238 < 2.2E-02 37-39 Pu-239/240 < 1.1 E-02 37-39
Pu-241 < 4.3E-01 37-39 Am-241 < 1.4E-02 37-39 Cm-243/244 < 2.3E-02 37-39
GP10108 (WMA 1, 2008) C-14 < 3.1E-01 32-34 Depth to Lavery till - 33 ft Sr-90 6.3E-01 32-34
Tc-99 < 5.4E-01 32-34 1-129 < 9.1E-02 32-34 Cs-137 < 2.6E-02 32-34
U-232 < 1.6E-01 32-34 U-233/234 6.0E-01 32-34 U-235/236 5.0E-02 32-34
U-238 7.3E-01 32-34 Np-237 < 1.0E-02 32-34 Pu-238 < 9.5E-03 32-34 Pu-239/240 < 8.8E-03 32-34 Pu-241 < 4.7E-01 32-34 Am-241 < 1.1 E-02 32-34 Cm-243/244 < 1.1 E-02 32-34
11/6/09 76
•
•
•

DOE RESPONSES TO WVDP PHASE 1 DECOMMISSIONING PLAN RAts
Table C-4. Radiological Concentrations from Soil Samples Containing Lavery Till in theWMA 1 and WMA 2 Excavation Areas(1 )
g;) Sample DepthLocation Nuclide Result (pCi/g) Inter Deth
Nuclde [Interval (ft)GP10408 (WMA 1, on border of WMA 2) C-14 < 3.6E-01 24-26Depth to Lavery till - 24 ft Sr-90 7.4E+00 24-26
Tc-99 < 5.1E-01 24-26
1-129 < 1.1E-01 24-26
Cs-137 < 5.5E-02 24-26
U-232 4.1 E-02 24-26U-233/234 8.8E-01 24-26
U-235/236 1.4E-01 24-26U-238 7.9E-01 24-26
Np-237 < 6.9E-03 24-26
Pu-238 < 1.2E-02 24-26
Pu-239/240 < 1.2E-02 24-26Pu-241 < 3.1E-01 24-26
Am-241 < 1.3E-02 24-26
Cm-243/244 < 1.4E-02 24-26
BH-05 (WMA 2,1993), located Sr-90 8.5E-01 12-14downgradient of Lagoon 1 Cs-137 4.5E-01 12-14Depth to Lavery till - 12 ft U-232 1.2E-02 12-14
U-233/234 1.8E-01 12-14
U-235 < 5.9E-03 12-14
U-235/236 < 8.3E-03 12-14
U-238 1.1E-01 12-14
Pu-238 1.1E-02 12-14
Pu-239/240 < 5.9E-03 12-14
Pu-241 < 1.3E+00 12-14
Am-241 3.OE-02 12-14
BH-07 (WMA 2, 1993) Sr-90 1.3E-01 12-14
Depth to Lavery till - 13 ft Cs-137 7.5E-02 12-14
U-232 < 8.7E-03 12-14
U-233/234 2.2E-01 12-14
U-235 < 6.6E-03 12-14
U-235/236 < 7.6E-03 12-14
U-238 1.5E-01 12-14
Pu-238 < 4.7E-03 12-14
Pu-239/240 < 6.2E-03 12-14
Pu-241 9.5E-01 12-14
Am-241 < 5.1E-03 12-14
BH-08 (WMA 2, 1993), locateddowngradient of Lagoon 1
Sr-90 1.8E+02 10-12
Cs-137 2.5E+02 10-12
11/6/09 77
•
•
•
DOE RESPONSES TO WVDP PHASE 1 DECOMMISSIONING PLAN RAls
Table C-4. Radiological Concentrations from Soil Samples Containing Lavery Till in the WMA 1 and WMA 2 Excavation Areas(1)
Location Nuclide Result (pCi/g) Sample Depth
Interval (ft)
GP10408 (WMA 1, on border of WMA 2) C-14 < 3.6E-01 24-26 Depth to Lavery till - 24 ft Sr-90 7.4E+00 24-26
Tc-99 < 5.1E-01 24-26 1-129 < 1.1E-01 24-26
Cs-137 < 5.5E-02 24-26 U-232 4.1E-02 24-26 U-233/234 8.8E-01 24-26 U-235/236 1.4E-01 24-26 U-238 7.9E-01 24-26 Np-237 < 6.9E-03 24-26 Pu-238 < 1.2E-02 24-26 Pu-239/240 < 1.2E-02 24-26 Pu-241 < 3.1 E-01 24-26 Am-241 < 1.3E-02 24-26 Cm-243/244 < 1.4E-02 24-26
BH-05 (WMA 2, 1993), located Sr-90 8.5E-01 12-14 downgradient of Lagoon 1 Cs-137 4.5E-01 12-14 Depth to Lavery till - 12 ft
U-232 1.2E-02 12-14
U-233/234 1.8E-01 12-14
U-235 < 5.9E-03 12-14
U-235/236 < 8.3E-03 12-14
U-238 1.1E-01 12-14
Pu-238 1.0E-02 12-14
Pu-239/240 < 5.9E-03 12-14
Pu-241 < 1.3E+00 12-14
Am-241 3.0E-02 12-14
BH-07 (WMA 2, 1993) Sr-90 1.3E-01 12-14 Depth to Lavery till - 13 ft Cs-137 7.5E-02 12-14
U-232 < 8.7E-03 12-14
U-233/234 2.2E-01 12-14
U-235 < 6.6E-03 12-14
U-235/236 < 7.6E-03 12-14
U-238 1.5E-01 12-14
Pu-238 < 4.7E-03 12-14
Pu-239/240 < 6.2E-03 12-14
Pu-241 9.5E-01 12-14
Am-241 < 5.1E-03 12-14
BH-08 (WMA 2, 1993), located Sr-90 1.8E+02 10-12 downgradient of Lagoon 1 Cs-137 2.5E+02 10-12
11/6/09 77

DOE RESPONSES TO WVDP PHASE 1 DECOMMISSIONING PLAN RAIS
Table C-4. Radiological Concentrations from Soil Samples Containing Lavery Till in theWMA 1 and WMA 2 Excavation Areas(1 )
~Sample DepthLocation Nuclide Result (pCi/g) Interval (ft)
Depth to Lavery till - 11.5 ft U-232 1.9E+01 10-12
U-233/234 9.7E+00 10-12
U-235 3.2E-01 10-12
U-235/236 5.OE-01 10-12
U-238 1.3E+01 10-12
Pu-238 3.9E+00 10-12
Pu-239/240 7.6E+00 10-12
Pu-241 2.7E+01 10-12
Am-241 1.1E+01 10-12
BH-12 (WMA 2, 1993) Sr-90 1.8E-01 14-16
Depth to Lavery till - 15.5 ft Cs-137 < 2.2E-02 14-16
U-232 < 6.OE-03 14-16
U-233/234 1.1E-01 14-16
U-235 < 7.OE-03 14-16
U-235/236 1.3E-02 14-16
U-238 9.7E-02 14-16
Pu-238 < 4.9E-03 14-16
Pu-239/240 < 4.9E-03 14-16
Pu-241 < 1.OE+00 14-16
Am-241 < 4.6E-03 14-16
BH-13 (WMA 2, 1993) Sr-90 1.8E-01 18-20
Depth to Lavery till - 19 ft Cs-137 2.7E+00 18-20
U-232 1.6E-02 18-20
U-233/234 8.5E-02 18-20
U-235 < 5.1E-03 18-20
U-235/236 < 8.2E-03 18-20
U-238 5.3E-02 18-20
Pu-238 2.4E-02 18-20
Pu-239/240 2.6E-02 18-20
Pu-241 < 8.1E-01 18-20
Am-241 9.5E-02 18-20
BH-14 (WMA 2, 1993)Depth to Lavery till - 15 ft
Sr-90 1.8E+01 14-16
Cs-137 1.9E+00 14-16
U-232 2.OE-02 14-16
U-233/234 1.9E-01 14-16
U-235 < 7.9E-03 14-16
U-235/236 < 1.1E-02 14-16
11/6/09 78
DOE RESPONSES TO WVDP PHASE 1 DECOMMISSIONING PLAN RAls
Table C-4. Radiological Concentrations from Soil Samples Containing Lavery Till in the WMA 1 and WMA 2 Excavation Areas(1)
Location Nuclide Result (pCi/g) Sample Depth .
Interval (tt) .
Depth to Lavery till - 11.5 ft U-232 1.9E+01 10-12
U-233/234 9.7E+00 10-12
U-235 3.2E-01 10-12
U-235/236 5.OE-01 10-12
U-238 1.3E+01 10-12
Pu-238 3.9E+00 10-12
Pu-239/240 7.6E+00 10-12
Pu-241 2.7E+01 10-12
Am-241 1.1 E+01 10-12
BH-12 (WMA 2, 1993) Sr-90 1.8E-01 14-16
Depth to Lavery till - 15.5 ft Cs-137 < 2.2E-02 14-16
U-232 < 6.0E-03 14-16
U-233/234 1.1E-01 14-16
U-235 < 7.0E-03 14-16
U-235/236 1.3E-02 14-16
U-238 9.7E-02 14-16
Pu-238 < 4.9E-03 14-16
Pu-239/240 < 4.9E-03 14-16
Pu-241 < 1.0E+00 14-16
Am-241 < 4.6E-03 14-16
BH-13 (WMA 2,1993) Sr-90 1.8E-01 18-20
Depth to Lavery till - 19 ft Cs-137 2.7E+00 18-20
U-232 1.6E-02 18-20
U-233/234 8.5E-02 18-20
U-235 < 5.1E-03 18-20
U-235/236 < 8.2E-03 18-20
U-238 5.3E-02 18-20
Pu-238 2.4E-02 18-20
Pu-239/240 2.6E-02 18-20
Pu-241 < 8.1 E-01 18-20
Am-241 9.5E-02 18-20
BH-14 (WMA 2,1993) Sr-90 1.8E+01 14-16 Depth to Lavery till - 15 ft Cs-137 1.9E+00 14-16
U-232 2.0E-02 14-16
U-233/234 t.9E-01 14-16
U-235 < 7.9E-03 14-16
U-235/236 < 1.1 E-02 14-16
11/6/09 78
•
•
•