updated report of geotechnical investigation south …
TRANSCRIPT

UPDATED REPORT OFGEOTECHNICAL INVESTIGATION SOUTH MISSION BEACH GREEN
INFRASTRUCTURE PROJECTCITY OF SAN DIEGO
Submitted to:
RICK ENGINEERING COMPANY5620 Friars RoadSan Diego, CA
Prepared By:
ALLIED GEOTECHNICAL ENGINEERS, INC.9500 Cuyamaca Street, Suite 102
Santee, California 92071-2685
AGE Project No. 190 GS-18-D
March 8, 2019(Updated August 15, 2019)
March 8, 2019(Updated August 15, 2019)
Mr. Kevin Gibson, P.E.Project ManagerRick Engineering Company 5620 Friars RoadSan Diego, CA
Subject: UPDATED REPORT OF GEOTECHNICAL INVESTIGATION SOUTH MISSION BEACH GREEN INFRASTRUCTURE PROJECTCITY OF SAN DIEGOAGE Project No. 190 GS-18-D
Dear Mr. Gibson:
Allied Geotechnical Engineers, Inc. is pleased to submit the accompanying updated report to presentthe findings, opinions, and recommendations of a geotechnical investigation that was performed toassist Rick Engineering Company with their design of the subject project.
We appreciate the opportunity to be of service on this project. If you have any questions regardingthe contents of this report or need further assistance, please feel free to contact our office.
Sincerely,
ALLIED GEOTECHNICAL ENGINEERS, INC.
Nicholas E. Barnes, P.G., C.E.G. Sani Sutanto, P.E.Senior Geologist Project Manager
NEB/SS/TJL:cal 06/30/2020
Distr. (1 electronic) Addressee
05/31/2020

AGE Project No. 190 GS-18-DMarch 8, 2019 (Updated August 15, 2019)Page i
REPORT OF GEOTECHNICAL INVESTIGATION SOUTH MISSION BEACH GREEN INFRASTRUCTURE PROJECT
CITY OF SAN DIEGO
TABLE OF CONTENTS
Page No.
1.0 INTRODUCTION. . . . . . . . . . . . . . . . . . . . . . . . . . . . . . . . . . . . . . . . . . . . . . . 1
2.0 SITE AND PROJECT DESCRIPTION. . . . . . . . . . . . . . . . . . . . . . . . . . . . . . . 2
3.0 OBJECTIVE AND SCOPE OF INVESTIGATION. . . . . . . . . . . . . . . . . . . . . 3 3.1 Information Review. . . . . . . . . . . . . . . . . . . . . . . . . . . . . . . . . . . . . . . . 3 3.2 Geotechnical Field Exploration. . . . . . . . . . . . . . . . . . . . . . . . . . . . . . . 3 3.3 Laboratory Testing. . . . . . . . . . . . . . . . . . . . . . . . . . . . . . . . . . . . . . . . . 7
4.0 GEOLOGIC CONDITIONS. . . . . . . . . . . . . . . . . . . . . . . . . . . . . . . . . . . . . . . 8 4.1 Geologic Setting and Site Physiography. . . . . . . . . . . . . . . . . . . . . . . . 8 4.2 Tectonic Setting. . . . . . . . . . . . . . . . . . . . . . . . . . . . . . . . . . . . . . . . . . . 8 4.3 Geologic Units. . . . . . . . . . . . . . . . . . . . . . . . . . . . . . . . . . . . . . . . . . . . 9
4.3.1 Fill Materials. . . . . . . . . . . . . . . . . . . . . . . . . . . . . . . . . 9 4.3.2 Old paralic Deposits.. . . . . . . . . . . . . . . . . . . . . . . . . . . 9
4.4 Groundwater. . . . . . . . . . . . . . . . . . . . . . . . . . . . . . . . . . . . . . . . . . . . 10
Allied Geotechnical Engineers, Inc.

AGE Project No. 190 GS-18-DMarch 8, 2019 (Updated August 15, 2019)Page ii
TABLE OF CONTENTS(Continued)
Page No.
5.0 DISCUSSIONS, OPINIONS, AND RECOMMENDATIONS. . . . . . . . . . . . 12 5.1 Potential Geologic Hazards. . . . . . . . . . . . . . . . . . . . . . . . . . . . . . . . . 12
5.1.1 Faulting. . . . . . . . . . . . . . . . . . . . . . . . . . . . . . . . . . . . 12 5.1.2 Fault Ground Rupture & Ground Lurching. . . . . . . . . 13 5.1.3 Soil Liquefaction. . . . . . . . . . . . . . . . . . . . . . . . . . . . . 13 5.1.4 Landslides. . . . . . . . . . . . . . . . . . . . . . . . . . . . . . . . . . 14 5.1.5 Lateral Spread Displacement. . . . . . . . . . . . . . . . . . . . 14 5.1.6 Differential Seismic-Induced Settlement.. . . . . . . . . . 15 5.1.7 Secondary Hazards.. . . . . . . . . . . . . . . . . . . . . . . . . . . 15
5.2 Soil Corrosivity. . . . . . . . . . . . . . . . . . . . . . . . . . . . . . . . . . . . . . . . . . 15 5.3 Expansive Soil. . . . . . . . . . . . . . . . . . . . . . . . . . . . . . . . . . . . . . . . . . . 17 5.4 Fill Material. . . . . . . . . . . . . . . . . . . . . . . . . . . . . . . . . . . . . . . . . . . . . 17 5.5 Cut-and-Cover Construction. . . . . . . . . . . . . . . . . . . . . . . . . . . . . . . . 18
5.5.1 Soil and Excavation Characteristics. . . . . . . . . . . . . . 18 5.5.2 Pipe Loads and Settlement.. . . . . . . . . . . . . . . . . . . . . 18 5.5.3 Trench Backfill. . . . . . . . . . . . . . . . . . . . . . . . . . . . . . 19 5.5.4 Placement and Compaction of Backfill. . . . . . . . . . . . 21 5.5.5 Groundwater Bouyant Uplift. . . . . . . . . . . . . . . . . . . . 22
5.6 Buried Structures. . . . . . . . . . . . . . . . . . . . . . . . . . . . . . . . . . . . . . . . . 22 5.6.1 Placement and Compaction of Backfill. . . . . . . . . . . . 23 5.6.2 Foundations. . . . . . . . . . . . . . . . . . . . . . . . . . . . . . . . . 23 5.6.3 Walls Below Grade. . . . . . . . . . . . . . . . . . . . . . . . . . . 24
5.7 Infiltration Testing. . . . . . . . . . . . . . . . . . . . . . . . . . . . . . . . . . . . . . . . 25
Allied Geotechnical Engineers, Inc.

AGE Project No. 190 GS-18-DMarch 8, 2019 (Updated August 15, 2019)Page iii
TABLE OF CONTENTS(Continued)
Page No.
6.0 CONSTRUCTION-RELATED CONSIDERATIONS. . . . . . . . . . . . . . . . . . 26 6.1 Construction Dewatering. . . . . . . . . . . . . . . . . . . . . . . . . . . . . . . . . . . 26 6.2 Temporary Shoring. . . . . . . . . . . . . . . . . . . . . . . . . . . . . . . . . . . . . . . 26 6.3 Environmental Considerations.. . . . . . . . . . . . . . . . . . . . . . . . . . . . . . 28
7.0 GENERAL CONDITIONS. . . . . . . . . . . . . . . . . . . . . . . . . . . . . . . . . . . . . . . 30 7.1 Post-Investigation Services. . . . . . . . . . . . . . . . . . . . . . . . . . . . . . . . . 30 7.2 Uncertainties and Limitations. . . . . . . . . . . . . . . . . . . . . . . . . . . . . . . 30
8.0 REFERENCES.. . . . . . . . . . . . . . . . . . . . . . . . . . . . . . . . . . . . . . . . . . . . . . . . 32
Tables
Table 1 Summary of Subsurface Conditions. . . . . . . . . . . . . . . . . . . . . . . . . . . 4
Table 2 Summary of Corrosivity Test Results. . . . . . . . . . . . . . . . . . . . . . . . . 16
Allied Geotechnical Engineers, Inc.

AGE Project No. 190 GS-18-DMarch 8, 2019 (Updated August 15, 2019)Page iv
TABLE OF CONTENTS(Continued)
Page No.
Figures
Figure 1 Alignments Map
Figures 2 through 5 Location Map
Figure 6 Photograph
Figure 7 Lateral Pressures for Cantilever Walls
Figure 8 Lateral Pressures for Restrained Walls
Figure 9 Foundation Induced Wall Pressures
Figure 10 Traffic and Surcharge Pressures
Appendices
Appendix A Field Exploration Program
Appendix B Laboratory Testing
Appendix C RCP Pipes Buoyancy Calculations
Allied Geotechnical Engineers, Inc.

SECTION ONE INTRODUCTION
1.0 INTRODUCTION
Allied Geotechnical Engineers, Inc. (AGE) is pleased to submit this report to present the findings,
opinions, and recommendations of a geotechnical investigation conducted to assist Rick Engineering
Company (Rick Engineering) with their design of the South Mission Beach Green Infrastructure
Project for the City of San Diego (City). The investigation was performed in conformance with
AGE’s proposal dated July 11, 2018 (revised July 24, 2018), and the subconsultant agreement
entered into by and between Rick Engineering and AGE on November 1, 2018. This report has been
updated to incorporate the results of a subsurface geotechnical investigation performed by Southern
California Soil and Testing, Inc. (SCS&T), dated April 16, 2019 and to provide additional
recommendations to mitigate the groundwater bouyant uplift forces on the proposed storm drain
pipelines.
This report has been prepared for the exclusive use of Rick Engineering and its design team and the
City in their design of the project as described herein. The information presented in this report is
not sufficient for any other uses or the purposes of other parties.
AGE Project No. 190 GS-18-DMarch 8, 2019 (Updated August 15, 2019)Page 1 of 34 Allied Geotechnical Engineers, Inc.

SECTION TWO SITE AND PROJECTDESCRIPTION
2.0 SITE AND PROJECT DESCRIPTION
The project alignments Map is shown on Figure 1. Based on a review of the 60% submittal plans
prepared by Rick Engineering Company, undated, it is our understanding that the scope of the
proposed project will include the following:
• design and construction of approximately 88 feet of concrete lined channel;
• design and construction of approximately 6,253 feet of storm drain pipelines;
• design and construction of approximately 142 feet of encased storm drain;
• design and construction of 16 feet of culvert; and
• design and construction of associated headwalls, inlets, connectors, cleanouts,
outlets, tidegates and weep sumps.
The proposed project alignments extend along public right-of-ways in the South Mission Beach area
of San Diego. The proposed pipelines will consist of 18-, 30-, 36- and 48-inch diameter reinforced
concrete pipes (RCP). It is anticipated that the proposed pipelines will be installed using
conventional cut-and-cover construction method with cover thickness on the order of 2 to 13 feet
above the pipe crown.
Existing improvements along the project alignments include a mix of residential and commercial
developments as well as Mission Beach and Mission Bay Park. The topography along the project
alignments varies from level to very gently sloping with elevations which vary from sea level to
approximately 13 feet above mean sea level (msl).
AGE Project No. 190 GS-18-DMarch 8, 2019 (Updated August 15, 2019)Page 2 of 34 Allied Geotechnical Engineers, Inc.

SECTION THREE OBJECTIVE AND SCOPEOF INVESTIGATION
3.0 OBJECTIVE AND SCOPE OF INVESTIGATION
The objectives of this investigation were to characterize the subsurface conditions along the project
alignments and to develop geotechnical recommendations for use in the design of the currently
proposed project. The scope of our investigation included several tasks which are described in
more detail in the following sections.
3.1 Information Review
This task involved a review of readily available information pertaining to the project study area,
including the preliminary project plans, as-built utility maps, topographic maps, published geologic
literature and maps, and AGE’s in-house references. In addition AGE also perform a review of a
report of Geotechnical Investigation prepared by Souther California Soil & Testing for the Mission
Beach Water and Sewer Replacement City of San Diego Task #17CD03, dated April 16, 2019.
3.2 Geotechnical Field Exploration
The field exploration program for this project was performed on February 11 and 12, 2019. A total
of four (4) soil borings, four (4) infiltration test holes, and two (2) pavement corings were performed
at the approximate locations shown on Figures 2 through 5. In addition, AGE attempted to perform
infiltration testing inside an existing weep sump located on the west side of Mission Boulevard, at
the entrance of an alley located between Brighton Court and Capistrano Place. The soil borings
were advanced to depths ranging from 15 feet to 16.5 feet below the existing ground surface (bgs).
The infiltration test holes were hand-augured to depths ranging from 36 inches to 63 inches bgs.
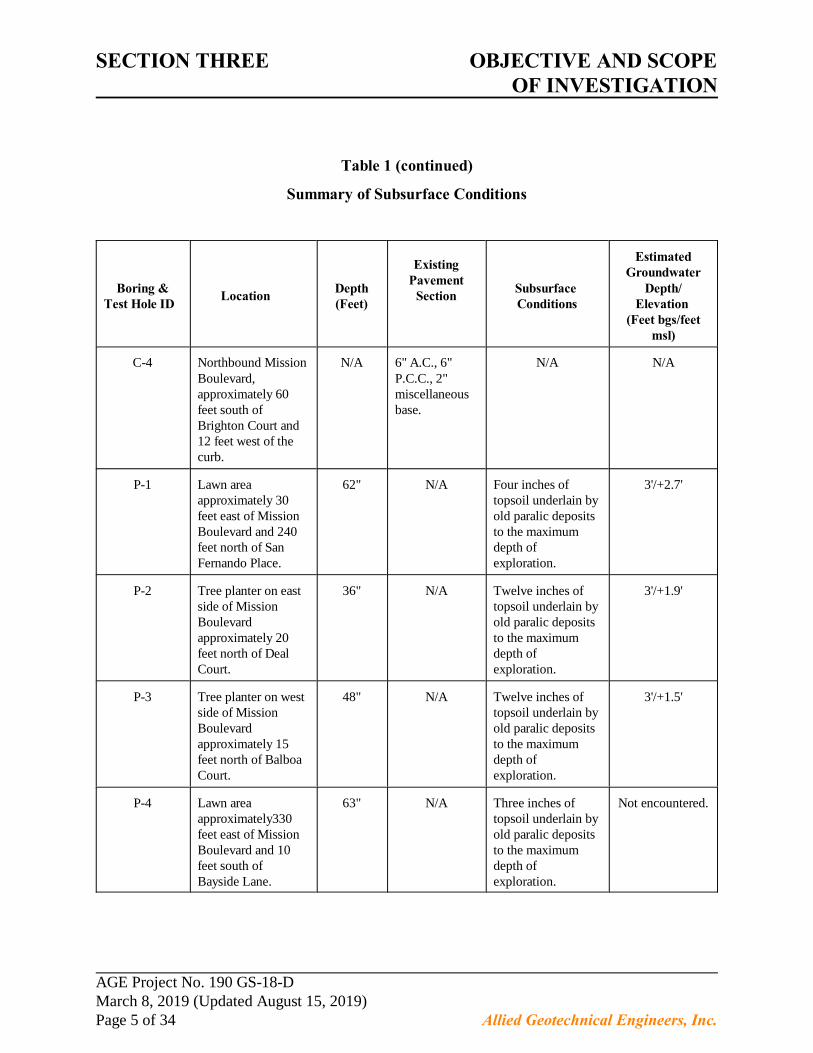
A brief description of the location and depth, pavement sections, groundwater level, and subsurface
conditions encountered in the borings and infiltration test holes is presented in Table 1 on the next
page. A more detailed description of the excavation and sampling activities, and logs of the soil
borings are presented in Appendix A.
AGE Project No. 190 GS-18-DMarch 8, 2019 (Updated August 15, 2019)Page 3 of 34 Allied Geotechnical Engineers, Inc.

SECTION THREE OBJECTIVE AND SCOPEOF INVESTIGATION
Table 1
Summary of Subsurface Conditions
Boring &Test Hole ID
LocationDepth(Feet)
Existing Pavement
SectionSubsurface Conditions
EstimatedGroundwater
Depth/Elevation
(Feet bgs/feetmsl)
B-1 Mission Bay beach,approximately 10feet east of BaysideWalk at intersectionwith San FernandoPlace.
16.5 N/A Hydraulic fill to 10feet and old paralicdeposits to themaximum depth ofexploration.
11/-3.7
B-2 Southbound MissionBoulevard,approximately 40feet south of SanFernando Place and4 feet west of thecenter median.
15 4" A.C. over8" P.C.C.underlain by 6"miscellaneousbase.
Old paralic depositsto the maximumdepth ofexploration.
4.25/+2.0
C-2 Southbound MissionBoulevard,approximately 40feet south of SanFernando Place and12 feet east of thecurb.
N/A 4.5" A.C. over9.5" P.C.C.Unable todifferentiatebase materials.
N/A N/A
B-3 Mission Bay beach,approximately 20feet east of BaysideWalk at intersectionwith CoronadoCourt.
16.5 N/A Hydraulic fill to 10feet and old paralicdeposits to themaximum depth ofexploration.
4/+1.2
B-4 Southbound MissionBoulevard,approximately 60feet south ofBrighton Court and4 feet west of thecenter median.
15 4.5" A.C. over7.5" P.C.C.underlain by 4"miscellaneousbase.
Old paralic depositsto the maximumdepth ofexploration.
3.25/+1.75
AGE Project No. 190 GS-18-DMarch 8, 2019 (Updated August 15, 2019)Page 4 of 34 Allied Geotechnical Engineers, Inc.
SECTION THREE OBJECTIVE AND SCOPEOF INVESTIGATION
Table 1 (continued)
Summary of Subsurface Conditions
Boring &Test Hole ID
LocationDepth(Feet)
Existing Pavement
SectionSubsurface Conditions
EstimatedGroundwater
Depth/Elevation
(Feet bgs/feetmsl)
C-4 Northbound MissionBoulevard,approximately 60feet south ofBrighton Court and12 feet west of thecurb.
N/A 6" A.C., 6"P.C.C., 2"miscellaneousbase.
N/A N/A
P-1 Lawn areaapproximately 30feet east of MissionBoulevard and 240feet north of SanFernando Place.
62" N/A Four inches oftopsoil underlain byold paralic depositsto the maximumdepth ofexploration.
3'/+2.7'
P-2 Tree planter on eastside of MissionBoulevardapproximately 20feet north of DealCourt.
36" N/A Twelve inches oftopsoil underlain byold paralic depositsto the maximumdepth ofexploration.
3'/+1.9'
P-3 Tree planter on westside of MissionBoulevardapproximately 15feet north of BalboaCourt.
48" N/A Twelve inches oftopsoil underlain byold paralic depositsto the maximumdepth ofexploration.
3'/+1.5'
P-4 Lawn areaapproximately330feet east of MissionBoulevard and 10feet south ofBayside Lane.
63" N/A Three inches oftopsoil underlain byold paralic depositsto the maximumdepth ofexploration.
Not encountered.
AGE Project No. 190 GS-18-DMarch 8, 2019 (Updated August 15, 2019)Page 5 of 34 Allied Geotechnical Engineers, Inc.

SECTION THREE OBJECTIVE AND SCOPEOF INVESTIGATION
Prior to commencement of the field exploration activities, several site reconnaissance visits were
performed to observe existing conditions and to select suitable locations for the soil borings and
infiltration test holes. Subsequently, Underground Service Alert (USA) was contacted to coordinate
clearance of the proposed boring and test hole locations with respect to existing buried utilities. The
utility clearance effort revealed the presence of the following buried utilities: potable water and
sanitary sewer pipelines; storm drains; natural gas and electrical transmission lines; and cable,
telephone, and fiber optic lines.
Traffic control permits were obtained from the City of San Diego to perform the borings (B-2 and
B-4) and pavement cores (C-2 and C-4) that are located within the public right-of-way. Borings B-1
and B-3, and percolation holes P-1 and P-4 which are located in Mission Bay Park were performed
with prior verbal approval from the City of San Diego Parks & Recreation Department.
Due to the presence of shallow groundwater inside test holes P-1, P-2 and P-3, AGE was unable to
perform infiltration testing inside these holes. The existing weep sump was installed on top of an
existing City of San Diego sewer trench. Furthermore, when AGE attempted to perform the
infiltration testing, AGE uncovered an 18-inch diameter green PVC pipe filled with 3/4-inch crushed
rock (see photograph in Figure 6). Therefore, AGE was unable to perform infiltration testing inside
the weep sump. Infiltration testing was only performed in test hole P-4.
AGE Project No. 190 GS-18-DMarch 8, 2019 (Updated August 15, 2019)Page 6 of 34 Allied Geotechnical Engineers, Inc.

SECTION THREE OBJECTIVE AND SCOPEOF INVESTIGATION
3.3 Laboratory Testing
Selected soil samples obtained from the soil borings were tested in the laboratory to verify field
classifications and evaluate certain engineering characteristics. The geotechnical laboratory tests
were performed in general conformance with the American Society for Testing and Materials
(ASTM) or other generally accepted testing procedures.
The laboratory tests included: in-place density and moisture content, maximum density and
optimum moisture content, sieve (wash) analysis, consolidation, shear strength, and R-value. In
addition, representative samples of the onsite soil materials were collected and delivered to
Clarkson Laboratories and Supply, Inc. for chemical (analytical) testing to determine soil pH and
resistivity, soluble sulfate and chloride concentrations, and bicarbonate content.
AGE Project No. 190 GS-18-DMarch 8, 2019 (Updated August 15, 2019)Page 7 of 34 Allied Geotechnical Engineers, Inc.

SECTION FOUR GEOLOGIC CONDITIONS
4.0 GEOLOGIC CONDITIONS
4.1 Geologic Setting and Site Physiography
The project alignments are located in Mission Beach, a narrow sandbar situated between the Pacific
Ocean and Mission Bay. The sandbar is underlain by marine sediments which range from
Pleistocene to Holocene in age. Hydraulically placed fill materials were added along the eastern
and southern portions of the sandbar during development of Mission Bay from the 1940's into the
1950's. Shallow mechanically placed fill materials were also encountered in the study area.
4.2 Tectonic Setting
Tectonically, the San Diego region is situated in a broad zone of northwest-trending, predominantly
right-slip faults that span the width of the Peninsular Ranges and extend offshore into the California
Continental Borderland Province west of California and northern Baja California. At the latitude
of San Diego, this zone extends from the San Clemente fault zone, located approximately 60 miles
to the west, and the San Andreas fault located about 95 miles to the east.
Major active regional faults of tectonic significance include the Coronado Bank, San Diego Trough,
San Clemente, and Newport Inglewood/Rose Canyon fault zones which are located offshore; the
faults in Baja California, including the San Miguel-Vallecitos and Agua Blanca fault zones; and the
faults located further to the east in Imperial Valley which include the Elsinore, San Jacinto and San
Andreas fault zones.
AGE Project No. 190 GS-18-DMarch 8, 2019 (Updated August 15, 2019)Page 8 of 34 Allied Geotechnical Engineers, Inc.

SECTION FOUR GEOLOGIC CONDITIONS
4.3 Geologic Units
Based on their origin and compositional characteristics, the soil types encountered in the borings
can be categorized into two geologic units which include (in order of increasing age) fill materials
and old paralic deposits. A brief description of each unit is presented below.
4.3.1 Fill Materials
Hydraulically placed fill materials were encountered in borings B-1 and B-3 to depths of
approximately 10 feet bgs. The hydraulic fill generally consists of fine to medium grained sand with
silt and containing scattered sub-rounded gravel. During the field investigation we met refusal in
boring B-3 on a large buried rock or concrete at a depth of 3 feet bgs. We moved approximately
10 feet to the east and re-drilled to the target depth.
Mechanically placed fill materials on the order of 12 inches or less in thickness were encountered
in infiltration test holes P-1 thru P-4. These materials generally consist of silty sands and organic-
rich topsoil for lawns and street trees. Documentation pertaining to the original placement of the
fill materials is unavailable.
Fill materials were also encountered in SCS&T (2019) borings P-1 through P-3 which are located
along Mission Boulevard to depth ranging between 2 to 5 feet bgs. Fill materials were encountered
in SCS&T (2019) boring P-4 to the maximum depth of exploration of 21.5 feet bgs. The fill
materials encountered in SCS&T (2019) borings posses the same consistency as those encountered
in AGE’s borings.
AGE Project No. 190 GS-18-DMarch 8, 2019 (Updated August 15, 2019)Page 9 of 34 Allied Geotechnical Engineers, Inc.

SECTION FOUR GEOLOGIC CONDITIONS
4.3.2 Old Paralic Deposits
Late to mid-Pleistocene age old paralic deposits (Kennedy and Tan, 2008) were encountered below
fill materials in borings B-1 and B-3, and below paving in borings B-2 and B-4 to the maximum
depth of exploration. These deposits are generally described as poorly sorted, moderately
permeable, reddish brown interfingered strandline, beach, estuarine and colluvial deposits composed
of siltstone, sandstone and conglomerate resting on a now emergent wave-cut platform preserved
by regional uplift (Kennedy and Tan, 2008). The deposits can generally be excavated with
conventional heavy duty construction equipment. Although not encountered during the field
exploration, localized conglomerate layers may present difficult excavation conditions.
The old paralic deposits encountered in our test borings generally consisted of fine-to medium
grained sands and silty sands with scattered to trace amounts of sub-rounded gravel and shell
fragments. The soil deposits are generally uncemented, damp to wet, and in a medium dense to
dense condition.
Old paralic deposits were encountered below the fill materials in SCS&T (2019) borings P-1 and
P-3 to the maximum depth of exploration which ranges between 20.5 and 21 feet bgs. The old
paralic deposits encountered in SCS&T (2019) borings posses the same consistency as those
encountered in AGE’s borings.
4.4 Groundwater
At the time of our field investigation, groundwater was measured in the soil borings and test holes
at depths ranging from 3 feet to 11 feet bgs (approximate elevations -2 feet to +7 feet msl). Tidal
coefficients in Mission Bay (Quivira Basin) on the days of the field exploration based on National
Oceanic and Atmospheric Administration (NOAA) data are shown on the next page.
AGE Project No. 190 GS-18-DMarch 8, 2019 (Updated August 15, 2019)Page 10 of 34 Allied Geotechnical Engineers, Inc.

SECTION FOUR GEOLOGIC CONDITIONS
Date
Low Tide High Tide
TimeHeight (MLLW)
Height (MSL)Time
Height (MLLW)
Height (MSL)
02/11/2019 7:34 am -1.7 feet
-4.5 feet
1:03 pm +3.0 feet
+ 0.2 feet
02/12/2019 9:15 am -1.5 feet
-4.3 feet
3:07 pm +2.6 feet
+0.2 feet
02/13/2019 10:47 am -0.9 feet
-3.7 feet
5:18 pm +2.7 feet
-0.1 feet
No groundwater was encountered in infiltration hole P-4. Fill and formational materials
encountered in the soil borings and infiltration test holes are generally considered to possess very
high permeability characteristics. Based on the anticipated depth of excavations, it is anticipated
that groundwater will be encountered along the project alignments during construction.
Groundwater was encountered in borings SCS&T (2019) borings between elevations + 1 and +2 feet
msl. Monitoring with vibrating wire piezometer between March 5 and April 9l 2019 inside the
borings indicate groundwater level fluctuation on the order of 0.5 to 0.75 foot.
AGE Project No. 190 GS-18-DMarch 8, 2019 (Updated August 15, 2019)Page 11 of 34 Allied Geotechnical Engineers, Inc.

SECTION FIVE DISCUSSIONS, OPINIONSAND RECOMMENDATIONS
5.0 DISCUSSIONS, OPINIONS AND RECOMMENDATIONS
5.1 Potential Geologic Hazards
The majority of the project study area is classified in the City of San Diego Seismic Safety Study
(2008), as Hazard Category 52 - Other Terrain, defined as, “Other level areas, gently sloping to steep
terrain, favorable geologic structure, Low Risk”. The beach area in the eastern portion of the study
area, as well as Mission Point Park in the southeast portion of the study area adjacent to the Mission
Bay Channel is classified as Hazard Category 31 - Liquefaction, defined as, “High potential-
Shallow groundwater, major drainages, hydraulic fills. Neither classifications are anticipated to
affect the proposed project as described herein.
5.1.1 Faulting
The northwest trending Point Loma fault is mapped 2,000 feet east of the project study area
(Kennedy, 1975; Kennedy and Tan, 2008), This fault is concealed below Mission Bay and Holocene
age fill materials east of the project study area. To the southeast the mapped trace of the fault
crosses the Point Loma peninsula, where it is concealed beneath Pleistocene age old paralic
deposits. The Point Loma fault is classified in the City of San Diego Seismic Safety Study (2008)
as “potentially active, inactive, presumed inactive, or activity unknown.”
For the purpose of this project we consider the Rose Canyon fault zone (RCFZ) to represent the most
significant seismic hazard. The RCFZ is a complex set of anastomosing and en-echelon,
predominantly strike slip faults that extend from off the coast near Carlsbad to offshore south of
downtown San Diego (Treiman, 1993). Previous geologic investigations on the RCFZ in the Rose
AGE Project No. 190 GS-18-DMarch 8, 2019 (Updated August 15, 2019)Page 12 of 34 Allied Geotechnical Engineers, Inc.

SECTION FIVE DISCUSSIONS, OPINIONSAND RECOMMENDATIONS
Creek area (Rockwell et. al., 1991) and in downtown San Diego (Patterson et. al., 1986) found
evidence of multiple Holocene earthquakes. Based on these studies, several fault strands within the
RCFZ have been classified as active faults, and are included in Alquist-Priolo Special Studies
Zones. In San Diego Bay, this fault zone is believed to splay into multiple, subparallel strands; the
most pronounced of which are the Silver Strand, Spanish Bight and Coronado Bank faults.
A study by Kleinfelder (2017) at the San Diego International Airport identified two zones of active
faulting. One of these faults was named the East Bay fault and the second fault was determined to
be a northward extension of the Spanish Bight fault. Recent study by Ninyo & Moore (2018) at
Seaport Village found evidence of recent movement along a fault that was determined to be a
northward extension of the active Coronado fault. The project alignments are not located within
an Alquist-Priolo Earthquake Study Zone.
5.1.2 Fault Ground Rupture & Ground Lurching
There are no known (mapped) active or potentially active faults crossing the project alignments
(Kennedy, 1975; Kennedy and Tan, 2008; City of San Diego, 2008). Therefore, the potential for
fault ground rupture and ground lurching along the project alignments is considered insignificant.
5.1.3 Soil Liquefaction
Seismically-induced soil liquefaction is a phenomenon in which loose to medium dense, saturated
granular materials undergo matrix rearrangement, develop high pore water pressure, and lose shear
strength due to cyclic ground vibrations induced by earthquakes.
AGE Project No. 190 GS-18-DMarch 8, 2019 (Updated August 15, 2019)Page 13 of 34 Allied Geotechnical Engineers, Inc.

SECTION FIVE DISCUSSIONS, OPINIONSAND RECOMMENDATIONS
Hydraulically placed fill materials in the east and southerly portions of the project alignments are
classified in the City of San Diego Seismic Safety Study (2008) as having a high liquefaction
potential. The findings of our investigation determined that the hydraulic fill materials encountered
in borings B-1 and B-3 are in a medium dense condition, and therefore are considered to have a low
liquefaction potential. However, it is likely that liquefaction prone soil materials will be
encountered during construction.
5.1.4 Landslides
A review of the published geologic maps indicates that there are no known (mapped) ancient
landslides in the project study area (Kennedy, 1975; Kennedy and Tan, 2008; City of San Diego,
2008). Therefore, landsliding is not considered a significant risk.
5.1.5 Lateral Spread Displacement
The project alignments are located in an area that is flat, therefore, the risk of lateral spread
displacement during a seismic event is considered remote.
AGE Project No. 190 GS-18-DMarch 8, 2019 (Updated August 15, 2019)Page 14 of 34 Allied Geotechnical Engineers, Inc.

SECTION FIVE DISCUSSIONS, OPINIONSAND RECOMMENDATIONS
5.1.6 Differential Seismic-Induced Settlement
Differential seismic settlement occurs when seismic shaking causes one type of soil to settle more
than another type. It may also occur within a soil deposit with largely homogeneous properties if
the seismic shaking is uneven due to variable geometry or thickness of the soil deposit. Based on
the results of our investigation, it is our opinion that there is a slight potential of differential
settlement in areas underlain by deep hydraulically placed man-made fills.
5.1.7 Secondary Hazards
The project alignments are located within the tsunami inundation zone (California Geological
Survey, 2009). Therefore, there is a high potential of property damage from seismic-induced
tsunamis. The project alignments are located within the Special Flood Hazard Areas, 100- and 500-
year flood zone (FEMA Flood Insurance Rate Map, 2012). Therefore the potential for flooding
along the project alignments is considered high to very high.
5.2 Soil Corrosivity
In accordance with the City of San Diego Water Facility Design Guidelines, Book 2, Chapter 7, soil
is generally considered aggressive to concrete if its chloride concentration is greater than 300 parts
per million (ppm) or sulfate concentration is greater than 1,000 ppm, or if the pH is 5.5 or less.
AGE Project No. 190 GS-18-DMarch 8, 2019 (Updated August 15, 2019)Page 15 of 34 Allied Geotechnical Engineers, Inc.

SECTION FIVE DISCUSSIONS, OPINIONSAND RECOMMENDATIONS
Analytical testing was performed on representative sample of the onsite soil materials to determine
pH, resistivity, soluble sulfate, chlorides and bicarbonates content. The tests were performed in
accordance with California Test Method Nos. 643, 417 and 422. A summary of the test results is
presented in Table 2 below. Copies of the analytical laboratory test data reports are included in
Appendix B.
Table 2
Summary of Corrosivity Test Results
pH
Resistivity
(ohm-cm)
Sulfate Conc.
(ppm)
Chloride Conc.
(ppm)
Bicarbonates Conc.
(ppm)
B-1 Sample No. 4
@14'-15'
8.3 130 1,050 3,630 46
B-2 Sample No. 3
@8'-9'
9.3 3,200 70 50 66
B-3 Sample No.3
@9'-10'
9.3 7,700 30 30 66
B-4 Sample No. 4
@10'-11'
9.2 730 140 620 46
The test results indicate that some of the soils along the project alignments are considered
aggressive to concrete. Therefore, Type 5 Portland Cement Concrete should be used for proposed
facilities along the project alignments. It should be noted here that the most effective way to prevent
sulfate attack is to keep the sulfate ions from entering the concrete in the first place. This can be
done by using mix designs that give a low permeability (mainly by keeping the water/cement ratio
low) and, if practical, by placing moisture barriers between the concrete and the soil.
AGE Project No. 190 GS-18-DMarch 8, 2019 (Updated August 15, 2019)Page 16 of 34 Allied Geotechnical Engineers, Inc.

SECTION FIVE DISCUSSIONS, OPINIONSAND RECOMMENDATIONS
AGE does not practice in the field of corrosion engineering. In the event that corrosion sensitive
facilities are planned, we recommend that a corrosion engineer be retained to perform the necessary
corrosion protection evaluation and design.
5.3 Expansive Soil
Based on visual observations and soil classifications, the soil materials encountered in the borings
and test holes are considered to be non-expansive.
5.4 Fill Material
Fill material for trench backfill should be free of biodegradable material, hazardous substance
contamination, other deleterious debris, and or rocks or hard lumps greater than 6 inches. If the fill
material contains rocks or hard lumps, at least 70 percent (by weight) of its particles shall pass a
4U.S. Standard / -inch sieve. Fill material should consists of predominantly granular soil (less than3
40 percent passing the U.S. Standard #200 sieve) with Expansion Index of less than 50.
The majority of the onsite soil materials are considered suitable for use as compacted backfill
materials. It is noted that since the majority of the excavations will extend below the groundwater
level, the majority of the soil materials generated from excavations along the project alignments will
be wet, and will require drying prior to use as trench backfill materials.
AGE Project No. 190 GS-18-DMarch 8, 2019 (Updated August 15, 2019)Page 17 of 34 Allied Geotechnical Engineers, Inc.

SECTION FIVE DISCUSSIONS, OPINIONSAND RECOMMENDATIONS
5.5 Cut-and-Cover Construction
Since no changes to the existing ground surface along the cut-and-cover segment of the proposed
storm drain pipeline alignment are planned, the net stress change in the underlying soils is
considered negligible. Furthermore, the soils at the proposed invert level along the storm drain
pipeline alignment are expected to provide a stable trench bottom. In the event that loose or
disturbed soils are encountered at the trench bottom, it is recommended that they be over-excavated
and replaced with pipe bedding or other approved materials. The depth of the overexcavation
should be determined during construction by the City’s Resident Engineer.
5.5.1 Soil and Excavation Characteristics
The materials within the anticipated depths of the storm drain pipe trench excavation will likely be
comprised of materials which can be readily excavated with conventional heavy-duty construction
equipment.
5.5.2 Pipe Loads and Settlement
Pipes should be designed for all loads applied by surrounding soils including dead load from soils,
loads applied at the ground surface, uplift loads, and earthquake loads. Soil loading above and
below the groundwater level may be estimated assuming a density of 100 pcf and 130 pcf,
respectively, for properly compacted backfill materials.
AGE Project No. 190 GS-18-DMarch 8, 2019 (Updated August 15, 2019)Page 18 of 34 Allied Geotechnical Engineers, Inc.

SECTION FIVE DISCUSSIONS, OPINIONSAND RECOMMENDATIONS
Where a pipe changes direction abruptly, resistance to thrust forces can be provided by means of
thrust blocks. For design purposes, for the passive resistance against thrust blocks embedded in
dense formational material and/or properly compacted filled ground, an equivalent fluid density of
200 pcf may be used. Thrust blocks should be embedded a minimum of 3 feet beneath the ground
surface.
Buried flexible pipes are generally designed to limit deflections caused by applied loads. The
deflections can be estimated using the Modified Spangler equation. A modulus of soil reaction, E',
equal to 1,000 and 2,000 psi may be used to represent a minimum of 6 inches of compacted pipe
bedding materials of low plasticity (LL < 50) with less than 12 percent fines passing the #200
standard sieve and crushed rock materials, respectively.
5.5.3 Trench Backfill
Pipe Bedding Zone and Pipe Zone
"Pipe Bedding Zone" is defined as the area below the bottom of the pipe and extending over the full
trench width, and should be at least 6 inches thick in order to provide a uniform firm foundation
material directly beneath the pipe.
The "Pipe Zone" is defined as the full width of a trench from the bottom of the pipe to a horizontal
level about 6 inches above the top (crown) of the pipe. In order to provide uniform support and to
minimize external loads, trench widths should be selected such that a minimum clear space of 6
inches is provided on each side of the pipe. During backfilling, it is recommended that the backfill
materials be placed on each side of the pipe simultaneously to avoid unbalanced loads on the pipe.
AGE Project No. 190 GS-18-DMarch 8, 2019 (Updated August 15, 2019)Page 19 of 34 Allied Geotechnical Engineers, Inc.

SECTION FIVE DISCUSSIONS, OPINIONSAND RECOMMENDATIONS
Backfill materials placed in the "Pipe Bedding Zone" and "Pipe Zone" should consist of clean, free
draining sand or crushed rock. Sand should be free of clay, organic matter, and other deleterious
materials and conform to the gradation shown in the following table.
Sieve Size
Percent Passing
by Weight
(percent)
½ inch 100
#4 75-100
#16 35-75
#50 10-40
#200 0-10
Crushed rock should conform to Section 200-1.2 and 200-1.3 of the Standard Specifications for
Public Works Construction (SSPWC) for 3/4-inch crushed rock gradation. It must be noted that,
since the native soil materials do not meet these specifications, import backfill materials will be
required for the "Pipe Bedding Zone" and "Pipe Zone". If crushed rock is to be used for pipe zone
and bedding backfill materials, we recommend that the rock materials be wrapped in geotextile
filter fabric such as Mirafi 140N or equivalent. The purpose of the filter fabric is to prevent
migration of fine grained materials from the backfill materials, and the sides and bottom of the
trench into the rock bedding materials.
AGE Project No. 190 GS-18-DMarch 8, 2019 (Updated August 15, 2019)Page 20 of 34 Allied Geotechnical Engineers, Inc.

SECTION FIVE DISCUSSIONS, OPINIONSAND RECOMMENDATIONS
Above Pipe Zone
The "Above Pipe Zone" is defined as the full width of the trench from the top of the "Pipe Zone" to
the finish grade or bottom of the pavement section. Backfill material placed in this zone should
meet or exceed the criteria presented in Section 5.4. for either flowable fill or soil backfill.
5.5.4 Placement and Compaction of Backfill
Prior to placement, all soil backfill material should be moisture-conditioned, spread and placed in
lifts (layers) not-to-exceed 6 inches in loose (uncompacted) thickness, and uniformly compacted to
at least 90 percent relative compaction. During backfilling, the soil moisture content should be
maintained at or within 2 to 3 percent above the optimum moisture content of the backfill materials.
The maximum dry density and optimum moisture content of the backfill materials should be
determined in the laboratory in accordance with the ASTM D1557 testing procedures. Field density
testing shall be performed in accordance with either the Sand Cone Method (ASTM D1556) or the
Nuclear Gauge Method (ASTM D2922 and D3017).
Small hand-operated compacting equipment should be used for compaction of the backfill materials
to an elevation of at least 4 feet above the top (crown) of the pipes. Flooding or jetting should not
be used to densify the backfill.
AGE Project No. 190 GS-18-DMarch 8, 2019 (Updated August 15, 2019)Page 21 of 34 Allied Geotechnical Engineers, Inc.

SECTION FIVE DISCUSSIONS, OPINIONSAND RECOMMENDATIONS
5.5.5 Groundwater Bouyant Uplift
AGE has performed a buoyancy analysis for 18-, 30-, 36- and 48-inch diameter RCP pipes which
are proposed for the subject project. The analysis is included in Appendix C. The results indicate
that the RCP pipes installed as recommended in this section with minimum 24 inches of cover are
not expected to float. It is our opinion that no additional mitigation measures are required.
5.6 Buried Structures
It is recommended that any proposed buried structures be founded on firm native soils or approved
compacted materials. In areas where loose or soft soils are encountered at the bottom of any
manhole/box structure excavations, it is recommended that the loose/soft materials be removed and
replaced with 3/4-inch crushed rock materials wrapped in geotextile fabric which meets or exceeds
the specifications shown below.
Fabric Property Min. Certified Values Test Method
Grab Tensile Strength 300 lb ASTM D 4632
Grab Tensile Elongation 35% (MAX) ASTM D 4632
Burst Strength 600 psi ASTM D 3786
Trapezoid Tear Strength 120 lb ASTM D 4533
Puncture Strength 130 lb ASTM D 4833
AGE Project No. 190 GS-18-DMarch 8, 2019 (Updated August 15, 2019)Page 22 of 34 Allied Geotechnical Engineers, Inc.
SECTION FIVE DISCUSSIONS, OPINIONSAND RECOMMENDATIONS
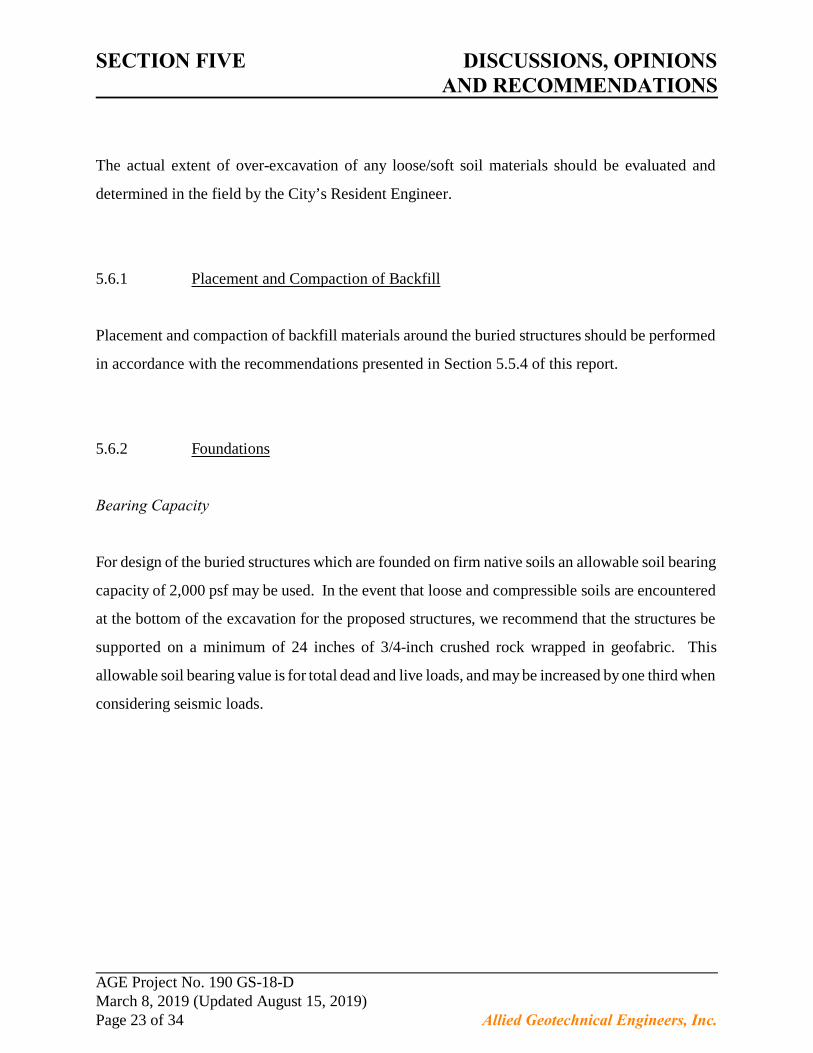
The actual extent of over-excavation of any loose/soft soil materials should be evaluated and
determined in the field by the City’s Resident Engineer.
5.6.1 Placement and Compaction of Backfill
Placement and compaction of backfill materials around the buried structures should be performed
in accordance with the recommendations presented in Section 5.5.4 of this report.
5.6.2 Foundations
Bearing Capacity
For design of the buried structures which are founded on firm native soils an allowable soil bearing
capacity of 2,000 psf may be used. In the event that loose and compressible soils are encountered
at the bottom of the excavation for the proposed structures, we recommend that the structures be
supported on a minimum of 24 inches of 3/4-inch crushed rock wrapped in geofabric. This
allowable soil bearing value is for total dead and live loads, and may be increased by one third when
considering seismic loads.
AGE Project No. 190 GS-18-DMarch 8, 2019 (Updated August 15, 2019)Page 23 of 34 Allied Geotechnical Engineers, Inc.

SECTION FIVE DISCUSSIONS, OPINIONSAND RECOMMENDATIONS
Anticipated Settlement
Under static condition, total settlement of the slab foundation is estimated to be less than 0.25 inch.
Differential settlement between the center and the edge of the slab foundation is expected not to
exceed 0.25 inch. No permanent deformation and/or post-construction settlement is anticipated,
provided that backfill around the structures is properly compacted in accordance with the project
specifications.
Resistance to Lateral Loads
Resistance to lateral loads may be developed by a combination of friction acting at the base of the
slab foundation and passive earth pressure developed against the sides of the foundations below
grade. Passive pressure and friction may be used in combination, without reduction, in determining
the total resistance to lateral loads.
An allowable passive earth pressure of 200 psf per foot of foundation embedment below grade may
be used for the sides of foundations placed against competent native soils. A coefficient of friction
of 0.4 may be used for foundation cast directly on competent native soils or crushed rock wrapped
in geofabric.
5.6.3 Walls Below Grade
Lateral earth pressures for walls below grade for structures less than 48 inches in horizontal
dimensions may be treated as a shaft structure. Walls below grade for structures larger than 48
inches in horizontal dimensions should be designed to resist the lateral earth pressures presented in
AGE Project No. 190 GS-18-DMarch 8, 2019 (Updated August 15, 2019)Page 24 of 34 Allied Geotechnical Engineers, Inc.

SECTION FIVE DISCUSSIONS, OPINIONSAND RECOMMENDATIONS
Figures 7 and 8 provided that the wall backfill materials are properly placed and compacted in
conformance with the recommendations presented in this report. Surcharge and foundation loads
occurring within a horizontal distance equal to the wall height should be added to the lateral
pressures as presented in Figures 9 and 10.
Buried structures located below the groundwater table will be subject to buoyant uplift forces.
Geotechnical parameters for use in calculating uplift resistance of the surrounding backfill soil
materials is presented in Figures 11 and 12.
5.7 Infiltration Testing
AGE attempted to perform infiltration testing in test hole P-4, but was unable to maintain a
consistent free head inside the test hole during the 24-hour pre-soak period. During the test on
February 14, 2019, AGE personnel had to add water into the test hole 24 times over a period of four
(4) hours. The infiltration rate based on the last reading was calculated to be 90 inch per hour. It
is our understanding that Rick Engineering is planning to install biofiltration basins with partial
retention along the project alignments. It is our opinion that the soil underlying the project
alignments are suitable for installation of partial retention biofiltration basins.
AGE Project No. 190 GS-18-DMarch 8, 2019 (Updated August 15, 2019)Page 25 of 34 Allied Geotechnical Engineers, Inc.

SECTION SIX CONSTRUCTION-RELATEDCONSIDERATIONS
6.0 CONSTRUCTION-RELATED CONSIDERATIONS
6.1 Construction Dewatering
Groundwater and flowing sand conditions are anticipated to be encountered at or above the
proposed pipe invert elevations along the project alignments. Because of the anticipated high rate
of transmissivity of the underlying soils along the project alignments and the potential for
encountering flowing sand condition, we recommend that groundwater be kept out of the trenched
excavations using sheet piles in combination with sump pumps. Sheet piles should be extended to
a depth of at least 10 feet below the bottom of the proposed trenched excavations.
The design, installation, and operation of any construction dewatering measures necessary for the
project shall be the sole responsibility of the contractor.
6.2 Temporary Shoring
Since the anticipated pipe invert depths will be more than 4 feet below the ground surface,
prevailing Federal and Cal OSHA safety regulations require that the trenched excavation be either
sloped (if sufficient construction space or easement is available), shored, braced, or protected with
approved sliding trench shield. Limited construction space, the presence of other buried utilities,
and the need to avoid excessive community disruption dictate that a shored excavation will be
needed along the entire pipeline alignment. Design and construction of temporary shoring should
be the sole responsibility of the contractor.
AGE Project No. 190 GS-18-DMarch 8, 2019 (Updated August 15, 2019)Page 26 of 34 Allied Geotechnical Engineers, Inc.

SECTION SIX CONSTRUCTION-RELATEDCONSIDERATIONS
Settlement
Settlement of existing street improvements and/or utilties adjacent to the shoring may occur in
proportion to both the distance between shoring system and adjacent structures or utilities and the
amount of horizontal deflection of the shoring system. Vertical settlement will be maximum
directly adjacent to the shoring system, and decreases as the distance from the shoring increases.
At a distance equal to the height of the shoring, settlement is expected to be negligible. Maximum
vertical settlement is estimated to be on the order of 75 percent of the horizontal deflection of the
shoring system. It is recommended that shoring be designed to limit the maximum horizontal
deflection to 1-inch or less where structures or utilities are to be supported.
It is recommended that pre- and post-construction surveys be conducted to document existing site
conditions. Documentation should include photographic and video surveys of the existing facilities
and site improvements, as well as field surveys of building floors and pavement structures. We
further recommend that a weekly survey of existing utilities be performed during the construction
phase.
Lateral Earth Pressures
Temporary shoring should be designed to resist the pressure exerted by the retained soils and any
additional lateral forces due to loads placed near the top of the excavation. For design of braced
shorings supporting fill materials and old paralic deposits, the recommended lateral earth pressure
should be 32H psf, where H is equal to the height of the retained earth in feet. Any surcharge loads
AGE Project No. 190 GS-18-DMarch 8, 2019 (Updated August 15, 2019)Page 27 of 34 Allied Geotechnical Engineers, Inc.

SECTION SIX CONSTRUCTION-RELATEDCONSIDERATIONS
would impose uniform lateral pressure of 0.3q, where "q" equals the uniform surcharge pressure.
The surcharge pressure should be applied starting at a depth equal to the distance of the surcharge
load from the top of the excavation. In the event that the bottom of the excavation is located below
the groundwater level, hydrostatic pressure should be added to the lateral loads.
The recommended lateral earth pressures have been prepared based on the assumptions that the
shored earth is level at the surface and that the shoring system is temporary in nature.
Lateral Bearing Capacity
Resistance to lateral loads will be provided by passive soil resistance. The allowable passive
pressure for the fill materials and old paralic deposits may be assumed to be equivalent to a fluid
weighing 200 pcf.
6.3 Environmental Considerations
The scope of AGE’s investigation did not include the performance of a Phase I Environmental Site
Assessment (Phase I ESA) to evaluate the possible presence of soil and/or groundwater
contamination beneath the project alignments. During our subsurface investigation soil samples
were field screened for the presence of volatile organics using a RAE Systems MiniRAE 3000
organic vapor meter (OVM). The field screening did not reveal elevated levels of volatile organics
in the samples.
AGE Project No. 190 GS-18-DMarch 8, 2019 (Updated August 15, 2019)Page 28 of 34 Allied Geotechnical Engineers, Inc.

SECTION SIX CONSTRUCTION-RELATEDCONSIDERATIONS
In the event that hazardous or toxic materials are encountered during the construction phase, the
contractor should immediately notify the City and be prepared to handle and dispose of such
materials in accordance with current industry practices and applicable Local, State and Federal
regulations.
AGE Project No. 190 GS-18-DMarch 8, 2019 (Updated August 15, 2019)Page 29 of 34 Allied Geotechnical Engineers, Inc.

SECTION SEVEN GENERAL CONDITIONS
7.0 GENERAL CONDITIONS
7.1 Post-Investigation Services
Post-investigation geotechnical services are an important continuation of this investigation, and we
recommend that the City’s Construction Inspection Division performs the necessary geotechnical
observation and testing services during construction. In the event that the City is unable to perform
said services, it is recommended that our firm be retained to provide the services.
Sufficient and timely observation and testing should be performed during excavation, pipeline
installation, backfilling and other related earthwork operations. The purpose of the geotechnical
observation and testing is to correlate findings of this investigation with the actual subsurface
conditions encountered during construction and to provide supplemental recommendations, if
necessary.
7.2 Uncertainties and Limitations
The information presented in this report is intended for the sole use of Rick engineering and other
members of the project design team and the City for project design purposes only and may not
provide sufficient data to prepare an accurate bid. The contractor should be required to perform an
independent evaluation of the subsurface conditions at the project site prior to submitting his/her
bid.
AGE Project No. 190 GS-18-DMarch 8, 2019 (Updated August 15, 2019)Page 30 of 34 Allied Geotechnical Engineers, Inc.

SECTION SEVEN GENERAL CONDITIONS
AGE has observed and investigated the subsurface conditions only at selected locations along the
project alignments. The findings and recommendations presented in this report are based on the
assumption that the subsurface conditions beneath all project alignments do not deviate substantially
from those encountered in the exploratory test pits. Consequently, modifications or changes to the
recommendations presented herein may be necessary based on the actual subsurface conditions
encountered during construction.
California, including San Diego County, is in an area of high seismic risk. It is generally considered
economically unfeasible to build a totally earthquake-resistant project and it is, therefore, possible
that a nearby large magnitude earthquake could cause damage at the project site.
Geotechnical engineering and geologic sciences are characterized by uncertainty. Professional
judgments and opinions presented in this report are based partly on our evaluation and analysis of
the technical data gathered during our present study, partly on our understanding of the scope of the
proposed project, and partly on our general experience in geotechnical engineering.
In the performance of our professional services, we have complied with that level of care and skill
ordinarily exercised by other members of the geotechnical engineering profession currently
practicing under similar circumstances in southern California. Our services consist of professional
consultation only, and no warranty of any kind whatsoever, expressed or implied, is made or
intended in connection with the work performed. Furthermore, our firm does not guarantee the
performance of the project in any respect.
AGE does not practice or consult in the field of safety engineering. The contractor will be
responsible for the health and safety of his/her personnel and all subcontractors at the construction
site. The contractor should notify the City if he or she considers any of the recommendations
presented in this report to be unsafe.
AGE Project No. 190 GS-18-DMarch 8, 2019 (Updated August 15, 2019)Page 31 of 34 Allied Geotechnical Engineers, Inc.

SECTION EIGHT REFERENCES
8.0 REFERENCES
California Geological Survey, “Tsunami Inundation Map for Emergency Planning, La Jolla
Quadrangle”, map prepared on USGS base map by California Emergency Management
Agency, California Geological Survey, and University of Southern California, dated June
1, 2009.
City of San Diego, Public Works Department, “Standard Drawings for Public Work Construction”,
2012 Edition.
City of San Diego Seismic Safety Study, Geologic Hazards and Faults, Sheet No. 20, 2008
edition.
Department of Conservation, California Geological Survey Regulatory Hazard Zones Maps for
Earthquake Faults, Liquefaction and Landslide Zones, 2009.
Geotracker Data Base - (http://geotracker.waterboards.ca.gov).
International Conference of Building Officials, 1997, Maps of Known Active Fault Near Source
Zones in California and Adjacent Portions of Nevada.
Kennedy, M.P., 1975, Geology of the San Diego Metropolitan Area, California: California Division
of Mines & Geology, Bulletin 200.
Kennedy, M.P., et.al., 1975, Character and Recency of Faulting, San Diego Metropolitan Area,
California: California Division of Mines and Geology, Special Report 123.
AGE Project No. 190 GS-18-DMarch 8, 2019 (Updated August 15, 2019)Page 32 of 34 Allied Geotechnical Engineers, Inc.

SECTION TEN REFERENCES
Kennedy, M.P, and Tan, S.S, 2008, “Geologic Map of the San Diego 30' x 60' Quadrangle,
California”, Digital Preparation by U.S. Geological Survey.
Kleinfelder, “Fault Hazard study, CIP 400002B ADP - Programmatic Document - ADC San Diego
International Airport, San Diego, California”, prepared for San Diego County Regional
Airport Authority, dated May 22, 2017.
Lindvall, S.C., and Rockwell, T.K., 1995, “Holocene Activity of the Rose Canyon fault zone in San
Diego, California” in Journal of Geophysical Research, v. 100, No. B12, pp. 24,121 -
124,132.
Marshall, M., 1989, "Detailed Gravity Studies and the Tectonics of the Rose Canyon--Point Loma--
La Nacion Fault System, San Diego, California" in Proceedings of Workshop on "The
Seismic Risk in the San Diego Region: Special Focus on the Rose Canyon Fault System"
(Glenn Roquemore, et.al, Editors).
Ninyo & Moore, “Fault Hazard Evaluation, World Class Waterfront Development, San Diego,
California” report dated February 26, 2018.
Patterson, R.H., D.L. Schug, and B.E. Ehleringer, 1986, "Evidence of Recent Faulting in Downtown
San Diego, California" in Geological Society of America, Abstracts With Programs, v. 18,
No. 2, p. 169.
Rick Engineering Company, “South Mission Beach WMP, Rec. Improvements: Low SLR (3.6')”,
dated January 2019.
AGE Project No. 190 GS-18-DMarch 8, 2019 (Updated August 15, 2019)Page 33 of 34 Allied Geotechnical Engineers, Inc.
SECTION TEN REFERENCES
Rick Engineering Company, “South Mission Beach WMP, Geotechnical Investigation Locations
Map”, dated 10/2/2018.
Rick Engineering Company, “South Mission Beach, City of San Diego Utility Data”, dated
1/7/2019.
Rick Engineering Company, “Plans for the Construction of South Mission Beach Storm Drain and
Green Infrastructure”, 60% submittal plans, undated.
Rockwell, T.K., et.al., 1991, "Minimum Holocene Slip Rate for the Rose Canyon Fault in SanDiego,
California" in Environmental Perils in the San Diego Region (P.L. Abbott and W.J. Elliott,
editors): San Diego Association of Geologists, pp. 37-46.
Southern California Soil & Testing, “Geotechnical Investigation, Mission Beach Water and Sewer
Replacement, City of San Diego Task #17CD03", unpublished consulting report, dated April
16, 2019.
Treiman, J.A., 1993, “The Rose Canyon Fault Zone, Southern California”, California Division of
Mines and Geology Open File Report No. 93-02.
Standard Specifications for Public Works Construction ("Green Book"), including the Regional
Standards, 2010 Edition.
AGE Project No. 190 GS-18-DMarch 8, 2019 (Updated August 15, 2019)Page 34 of 34 Allied Geotechnical Engineers, Inc.
FIGURES

ALLIED GEOTECHNICAL ENGINEERS, INC.PROJECT NO.190 GS-18-D FIGURE 1
SOUTH MISSION BEACH GREEN INFRASTRUCTURE PROJECTALIGNMENTS MAP

ALLIED GEOTECHNICAL ENGINEERS, INC.PROJECT NO.190 GS-18-D FIGURE 2
LOCATION MAPSOUTH MISSION BEACH GREEN INFRASTRUCTURE PROJECT
40 FEET
Scale Bar
N
P-1
B-1
B-2
C-2
LEGEND
Approximate Infiltration Test Hole Location
Approximate Boring Location
Approximate Pavement Core Location
B-2
C-2
P-1
Mis
sio
n B
lvd
.
San Fernando PL.

ALLIED GEOTECHNICAL ENGINEERS, INC.PROJECT NO.190 GS-18-D FIGURE 3
LOCATION MAPSOUTH MISSION BEACH GREEN INFRASTRUCTURE PROJECT
40 FEET
Scale Bar
N
P-2
B-3
LEGEND
Approximate Infiltration Test Hole Location
Approximate Boring Location
Approximate Pavement Core Location
B-2
C-2
P-1
Mis
sio
n B
lvd
.
Coronado Ct.

ALLIED GEOTECHNICAL ENGINEERS, INC.PROJECT NO.190 GS-18-D FIGURE 4
LOCATION MAPSOUTH MISSION BEACH GREEN INFRASTRUCTURE PROJECT
40 FEET
Scale Bar
N
LEGEND
Approximate Infiltration Test Hole Location
Approximate Boring Location
Approximate Pavement Core Location
B-2
C-2
P-1
B-4C-4
P-3
Existing weep sumpbetween BrightonCourt and CapistranoPlace
Mis
sio
n B
lvd
.
Brighton Ct.

ALLIED GEOTECHNICAL ENGINEERS, INC.PROJECT NO.190 GS-18-D FIGURE 5
LOCATION MAPSOUTH MISSION BEACH GREEN INFRASTRUCTURE PROJECT
40 FEET
Scale Bar
N
LEGEND
Approximate Infiltration Test Hole Location
Approximate Boring Location
Approximate Pavement Core Location
B-2
C-2
P-1
P-4
Mission Blvd.
Mission Bay Park

ALLIED GEOTECHNICAL ENGINEERS, INC.PROJECT NO.190 GS-18-D FIGURE 6
WEEP SUMP PHOTOGRAPHSOUTH MISSION BEACH GREEN INFRASTRUCTURE PROJECT

LATERAL PRESSURES FOR CANTILEVER WALLSSOUTH MISSION BEACH GREEN INFRASTRUCTURE PROJECT
PROJECT NO.190 GS-18-D
Ignored for shaftconstruction.
FIGURE 7

LATERAL PRESSURES FOR RESTRAINED WALLSSOUTH MISSION BEACH GREEN INFRASTRUCTURE PROJECT
FIGURE 8PROJECT NO.190 GS-18-D
Ignored for shaftconstruction.

FOUNDATION INDUCED WALL PRESSURESOUTH MISSION BEACH GREEN INFRASTRUCTURE PROJECT
FIGURE 9PROJECT NO.190 GS-18-D

TRAFFIC INDUCED WALL PRESSURESSOUTH MISSION BEACH GREEN INFRASTRUCTURE PROJECT
FIGURE 10PROJECT NO.190 GS-18-D

APPENDIX A
FIELD EXPLORATION PROGRAM

Project No. 190 GS-18-DAppendix A, Sheet 1
APPENDIX A
FIELD EXPLORATION PROGRAM
The field exploration program for this project was performed on February 11 and 12, 2019. A totalof four (4) soil borings, four (4) infiltration test holes, and two (2) pavement corings were performedat the approximate locations shown on Figures 2 through 5. In addition, AGE attempted to performinfiltration testing inside an existing weep sump located on the west side of Mission Boulevard, atthe entrance of an alley located between Brighton Court and Capistrano Place. The soil boringswere advanced to depths ranging from 15 feet to 16.5 feet below the existing ground surface (bgs). The infiltration test holes were hand-augured to depths ranging from 36 inches to 63 inches bgs. A brief description of the location and depth, pavement sections, groundwater level, and subsurfaceconditions encountered in the borings and infiltration test holes is presented in Table 1.
Borings B-2 and B-4 which were located in Mission Boulevard were performed with a CME-75truck mounted drill rig. Borings B-1 and B-3 which were located on Mission Bay Park wereperformed with an all-terrain mounted drill rig. The soils encountered in the soil borings werevisually classified and logged by an experienced engineering geologist from AGE. A Key to Logsis presented on Figures A-1 and A-2, and logs of the borings are presented on Figures A-3 thru A-6. The logs depict the various soil types encountered and indicate the depths at which samples wereobtained for laboratory testing and analysis.
Prior to commencement of the field exploration activities, several site visits were performed toobserve existing conditions and to select suitable locations for the soil borings and test holes.Subsequently, Underground Service Alert (USA) was contacted to coordinate clearance of theproposed boring and test hole locations with respect to existing buried utilities. The borings and testholes located in Mission Bay Park were performed in coordination with and with the approval fromthe City of San Diego Parks & Recreation Department.
During drilling, Standard Penetration Tests (SPT) were performed at selected depth intervals. TheSPT tests involve the use of a specially manufactured “split spoon” sampler which is driven adistance of approximately 18 inches into the soils at the bottom of the borehole by dropping a 140-pound weight from a height of 30 inches. The number of blows required to penetrate each 6-inchincrement was counted and recorded on the field logs, and have been used to evaluate the relativedensity and consistency of the materials. The blow counts were subsequently corrected for soil type,hammer model, groundwater and surcharge. The corrected blow counts are shown on the boringlogs.
ALLIED GEOTECHNICAL ENGINEERS, INC.

Project No. 190 GS-18-DAppendix A, Sheet 2
Relatively undisturbed samples were obtained by driving a 3-inch (OD) diameter standard Californiasampler with a special cutting tip and inside lining of thin brass rings into the soils at the bottom ofthe borehole. The sampler is driven a distance of approximately 18 inches into the soil at the bottomof the borehole by dropping a 140-pound weight from a height of 30 inches. A 6-inch long sectionof soil sample that was retained in the brass rings was extracted from the sampling tube andtransported to our laboratory in close-fitting, waterproof containers. The samples were fieldscreened for the presence of volatile organics using a RAE Systems MiniRAE 3000 organic vapormeter (OVM). The OVM readings are indicated on the logs. In addition, loose bulk samples werealso collected.
Infiltration testing inside test hole P-4 was performed using Borehole Percolation Test Methodsdescribed in Appendix F - Storm Water Infiltration/Percolation BMPs of the City of San DiegoGuidelines for Geotechnical Report (2011) and Appendix D - Approved Infiltration RateAssessment Methods of the San Diego Region Model BMP Design Manual (2018).
Upon completion of the drilling, sampling and testing activities, the borings were backfilled usingbentonite grout and/or bentonite chips to approximately 12 inches below the ground surface. Borings B-1 and B-3 which were located at the beach were capped with on-site beach sand. BoringsB-2 and B-4 which were performed in Mission Boulevard were capped with rapid-set concrete tomatch the adjacent pavement surface. Pavement coreholes C-2 and C-4 were also capped withrapid-set concrete to match the adjacent pavement surface. The infiltration test holes werebackfilled with soil cuttings generated during excavation.
ALLIED GEOTECHNICAL ENGINEERS, INC.

190 GS-18-D
Approximate groundwater elevation

190 GS-18-D
Rick Engineering Company
work was
Strata symbols
Poorly graded sandwith silt

1
2
3
4
5
6
7
8
9
10
11
12
13
14
15
16
17
18
19
20
21
22
23
24
25
26
27
28
29
30
31
32
33
34
35
36
37
1
2
3
4
5
25
17
23
1.6
?
0.1
HYDRAULIC FILL
Light gray, damp, medium grained poorly gradedmicaceous sand (SP-SM) with traces of broken shells.
OLD PARALIC DEPOSITS
Dark greenish gray, wet, medium grained poorly gradedmicaceous sand (SP-SM)
NOTES:
Boring terminated at depth of 16.5' bgs. No refusal.Water level measured at depth of 11' bgs 10 minutes aftercompletion of the drilling operations.
6.2
22.2
30.3
105.6
95.1
?
BORING NO. B-1DATE OF DRILLING: February 11, 2019 TOTAL BORING DEPTH: 16.5’
GENERAL LOCATION: On the beach, 20' east of Bayside walk at San Fernando Place
APPROXIMATE SURFACE ELEV.: + 7.3' msl DRILLING CONTRACTOR: Tri-County Drilling
DRILLING METHOD: Hollow-Stem Auger LOGGED BY: Nicholas Barnes
PROJECT NO.190 GS-18-D
ALLIED GEOTECHNICAL ENGINEERS, INC. FIGURE A-3
DE
PT
H(F
EE
T)
SA
MP
LE
S
BLO
W C
OU
NT
SB
LO
WS
/FO
OT
OV
M R
EA
DIN
G(P
PM
)
GR
AP
HIC
LO
G
SOIL DESCRIPTION
FIE
LD
MO
IST
UR
E%
DR
Y W
T.
DR
Y D
EN
SIT
YLB
S./C
U. F
T.
REMARKS

1
2
3
4
5
6
7
8
9
10
11
12
13
14
15
16
17
18
19
20
21
22
23
24
25
26
27
28
29
30
31
32
33
34
35
36
37
1
2
3
4
5
34
26
PAVEMENT SECTION:
4" A.C. over 8" P.C.C. underlain by 6" of miscellaneous base
OLD PARALIC DEPOSITS
Greenish gray, wet, medium grained poorly-gradedmicaceous sand with silt (SP-SM) with traces of brokenshells.
NOTES:
Boring terminated at depth of 15' bgs. No refusal.Water level measured at depth of 4'-3" bgs at thecompletion of the drilling operation.
26.0
26.3
24.7
BORING NO. B-2DATE OF DRILLING: February 12, 2019 TOTAL BORING DEPTH: 15’
GENERAL LOCATION: Southbound Mission Boulevard, approximately 40' south of San Fernando Place and 4' from median.
APPROXIMATE SURFACE ELEV.: +6.3' msl DRILLING CONTRACTOR: Tri-County Drilling
DRILLING METHOD: Hollow-Stem Auger LOGGED BY: Nicholas Barnes
PROJECT NO.190 GS-18-D
ALLIED GEOTECHNICAL ENGINEERS, INC. FIGURE A-4
DE
PT
H(F
EE
T)
SA
MP
LE
S
BLO
W C
OU
NT
SB
LO
WS
/FO
OT
OV
M R
EA
DIN
G(P
PM
)
GR
AP
HIC
LO
G
SOIL DESCRIPTION
FIE
LD
MO
IST
UR
E%
DR
Y W
T.
DR
Y D
EN
SIT
YLB
S./C
U. F
T.
REMARKS

1
2
3
4
5
6
7
8
9
10
11
12
13
14
15
16
17
18
19
20
21
22
23
24
25
26
27
28
29
30
31
32
33
34
35
36
37
1
2
3
4
5
27
26
?
HYDRAULIC FILL
Greenish gray, wet, fine- to medium-grained poorly gradedmicaceous silty sand (SP-SM)
OLD PARALIC DEPOSITS
Greenish gray, wet, fine- to medium-grained poorly gradedmicaceous silty sand (SP-SM)
NOTES:
Boring terminated at depth of 16.5' bgs. No refusal.Water level measured at depth of 4' bgs at the completionof the drilling operation.
25.5
21.4
24.9
?Heaving sand. No samplerecovery.
BORING NO. B-3DATE OF DRILLING: February 11, 2019 TOTAL BORING DEPTH: 16.5
GENERAL LOCATION: On the beach, 20' east of Bayside walk at Coronado Court
APPROXIMATE SURFACE ELEV.: +5.2' msl DRILLING CONTRACTOR: Tri-County Drilling
DRILLING METHOD: Hollow-Stem Auger LOGGED BY: Nicholas Barnes
PROJECT NO.190 GS-18-D
ALLIED GEOTECHNICAL ENGINEERS, INC. FIGURE A-5
DE
PT
H(F
EE
T)
SA
MP
LE
S
BLO
W C
OU
NT
SB
LO
WS
/FO
OT
OV
M R
EA
DIN
G(P
PM
)
GR
AP
HIC
LO
G
SOIL DESCRIPTION
FIE
LD
MO
IST
UR
E%
DR
Y W
T.
DR
Y D
EN
SIT
YLB
S./C
U. F
T.
REMARKS
First attempt encountered refusal at 3’ bgs and the boringlocation was moved 10 feet to the east.

1
2
3
4
5
6
7
8
9
10
11
12
13
14
15
16
17
18
19
20
21
22
23
24
25
26
27
28
29
30
31
32
33
34
35
36
37
1
2
3
4
5
35
2.0
2.2
0.5
PAVEMENT SECTION:
4.5" A.C. over 7.5" P.C.C. underlain by 4" of miscellaneousbase
OLD PARALIC DEPOSITS
Greenish gray, wet, medium grained poorly-gradedmicaceous sand with silt (SP-SM) with traces of brokenshells and rounded gravels.
NOTES:
Boring terminated at depth of 15' bgs. No refusal.Water level measured at depth of 3'-3" bgs at thecompletion of the drilling operation.
29.1
29.6
24.2
BORING NO. B-4DATE OF DRILLING: February 12, 2019 TOTAL BORING DEPTH: 15
GENERAL LOCATION: Southbound Mission Boulevard, approximately 60' south of Brighton Court
APPROXIMATE SURFACE ELEV.: +5' msl DRILLING CONTRACTOR:
DRILLING METHOD: LOGGED BY: Nicholas Barnes
PROJECT NO.190 GS-18-D
ALLIED GEOTECHNICAL ENGINEERS, INC. FIGURE A-6
DE
PT
H(F
EE
T)
SA
MP
LE
S
BLO
W C
OU
NT
SB
LO
WS
/FO
OT
OV
M R
EA
DIN
G(P
PM
)
GR
AP
HIC
LO
G
SOIL DESCRIPTION
FIE
LD
MO
IST
UR
E%
DR
Y W
T.
DR
Y D
EN
SIT
YLB
S./C
U. F
T.
REMARKS

APPENDIX B
LABORATORY TESTING

Project No. 190 GS-18-DAppendix B, Sheet 1
APPENDIX B
LABORATORY TESTING
Selected soil samples were tested in the laboratory to verify visual field classifications and toevaluate certain engineering characteristics. The testing was performed in accordance with theAmerican Society for Testing and Materials (ASTM) or other generally accepted test methods, andincluded the following:
• Determination of in-place moisture content (ASTM D2216). The final test resultsare presented on the test pit logs;
• Determination of in-place dry density and moisture content (ASTM D2937) basedon relatively undisturbed drive samples. The final test results are presented on thetest pit logs;
• Maximum density and optimum moisture content (ASTM D1557). The final testresults are presented on Figures B-1 thru B-3;
• Sieve analyses (ASTM D422), and the final test results are plotted as gradationcurves on Figures B-4 and B-5;
• Direct shear test (ASTM D3080). The test results are presented on Figures B-6 andB-7; and
• Consolidation (ASTM D2435). The test results are presented on Figure B-8.
In addition, representative samples of the onsite soil materials were delivered to ClarksonLaboratory and Supply, Inc. for analytical (chemical) testing to determine soil pH and resistivity,soluble sulfate and chloride concentrations, and bicarbonate content. Copies of Clarkson’slaboratory test data reports are included herein.
Representative samples of the soil materials underlying Mission Boulevard were delivered toSouthern California Soil & Testing (SCS&T) for R-Value testing. Copies of SCS&T’s laboratorytest data reports are included herein.
ALLIED GEOTECHNICAL ENGINEERS, INC.

COMPACTION TEST REPORT
Dry
de
nsi
ty, p
cf
80
90
100
110
120
130
Water content, %
0 5 10 15 20 25 30
1 2 3 4 5 6
Curve No.
Test Specification:
TESTING DATA
TEST RESULTS Material Description
Remarks:
Project No. Client:
Project:
Source of Sample: B-1 Depth: 5 Sample Number: 1 Checked by:
Allied Geotechnical Engineers, Inc.
Santee, CA
Title:
Figure
ASTM D 1557-91 Procedure A Modified
10 lb.
18 in.
five
25
0.03333 cu. ft.
#4
6.2
2.6
Dark greenish gray poorly-graded sand withsilt (SP-SM)
190 GS-18-D Rick Engineering Company
B-1
Preparation Method
Hammer Wt.
Hammer Drop
Number of Layers
Blows per Layer
Mold Size
Test Performed on Material
Passing Sieve
NM LL PI
Sp.G. (ASTM D 854)
%>#4 %<No.200
USCS AASHTO
Date Sampled
Date Tested
Tested By
WM + WS
WM
WW + T #1
WD + T #1
TARE #1
WW + T #2
WD + T #2
TARE #2
MOISTURE
DRY DENSITY
South Mission Beach Project
COMPACTION TEST REPORT
Dry
de
nsi
ty, p
cf
109
110
111
112
113
114
Water content, %
6 7.5 9 10.5 12 13.5 15
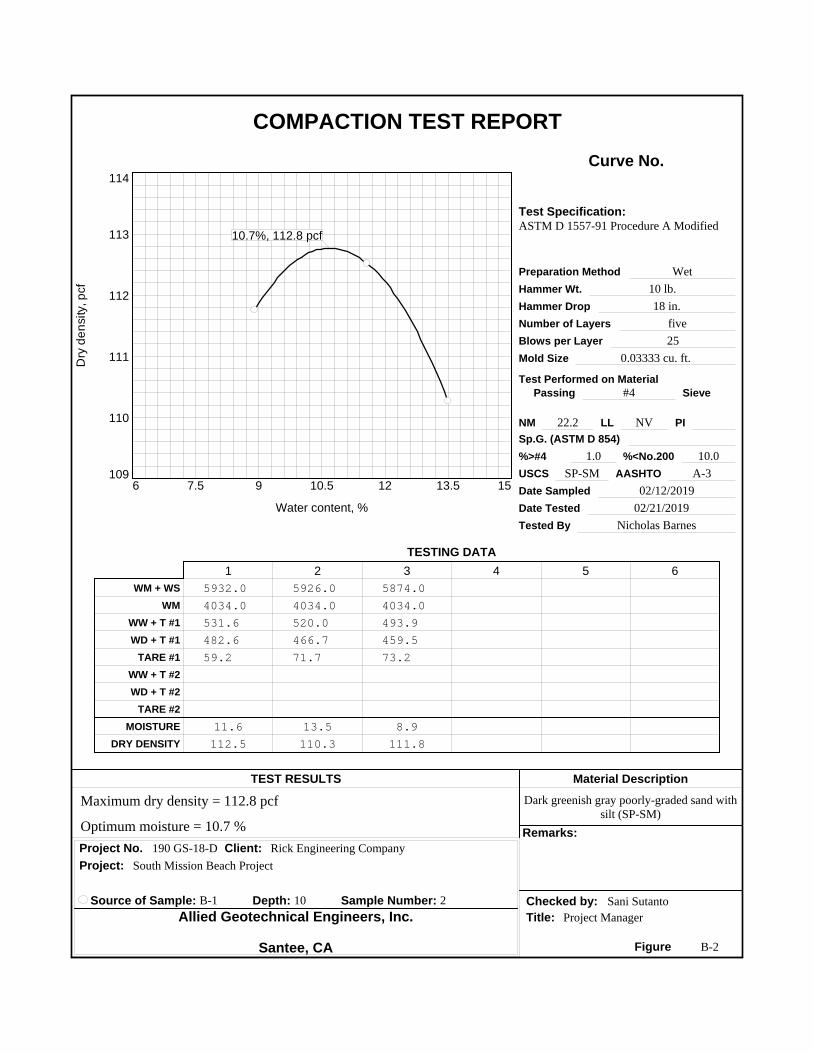
10.7%, 112.8 pcf
1 2 3 4 5 6
Curve No.
Test Specification:
TESTING DATA
TEST RESULTS Material Description
Remarks:
Project No. Client:
Project:
Source of Sample: B-1 Depth: 10 Sample Number: 2 Checked by:
Allied Geotechnical Engineers, Inc.
Santee, CA
Title:
Figure
ASTM D 1557-91 Procedure A Modified
Wet
10 lb.
18 in.
five
25
0.03333 cu. ft.
#4
22.2 NV
1.0 10.0
SP-SM A-3
02/12/2019
02/21/2019
Nicholas Barnes
Dark greenish gray poorly-graded sand withsilt (SP-SM)
190 GS-18-D Rick Engineering Company
Sani Sutanto
Project Manager
B-2
Preparation Method
Hammer Wt.
Hammer Drop
Number of Layers
Blows per Layer
Mold Size
Test Performed on Material
Passing Sieve
NM LL PI
Sp.G. (ASTM D 854)
%>#4 %<No.200
USCS AASHTO
Date Sampled
Date Tested
Tested By
WM + WS
WM
WW + T #1
WD + T #1
TARE #1
WW + T #2
WD + T #2
TARE #2
MOISTURE
DRY DENSITY
5932.0 5926.0 5874.0
4034.0 4034.0 4034.0
531.6 520.0 493.9
482.6 466.7 459.5
59.2 71.7 73.2
11.6 13.5 8.9
112.5 110.3 111.8
Maximum dry density = 112.8 pcf
Optimum moisture = 10.7 %
South Mission Beach Project

COMPACTION TEST REPORT
Dry
de
nsi
ty, p
cf
103
104
105
106
107
108
Water content, %
12 13 14 15 16 17 18
14.6%, 106.7 pcf
1 2 3 4 5 6
Curve No.
Test Specification:
TESTING DATA
TEST RESULTS Material Description
Remarks:
Project No. Client:
Project:
Source of Sample: B-3 Depth: 6 Checked by:
Allied Geotechnical Engineers, Inc.
Santee, CA
Title:
Figure
ASTM D 1557-91 Procedure A Modified
Wet
10 lb.
18 in.
five
25
0.03333 cu. ft.
#4
NV
0.1 5.1
SP-SM A-3
02/12/2019
02/21/2019
Nicholas Barnes
Greenish gray poorly graded sand with silt(SP-SM)
190 GS-18-D Rick Engineering Company
Sani Sutanto
Project Manager
B-3
Preparation Method
Hammer Wt.
Hammer Drop
Number of Layers
Blows per Layer
Mold Size
Test Performed on Material
Passing Sieve
NM LL PI
Sp.G. (ASTM D 854)
%>#4 %<No.200
USCS AASHTO
Date Sampled
Date Tested
Tested By
WM + WS
WM
WW + T #1
WD + T #1
TARE #1
WW + T #2
WD + T #2
TARE #2
MOISTURE
DRY DENSITY
5826.0 5872.0 5876.0
4034.0 4034.0 4034.0
491.0 475.3 486.0
440.0 424.2 428.2
53.6 62.8 62.1
13.2 14.1 15.8
104.7 106.5 105.2
Maximum dry density = 106.7 pcf
Optimum moisture = 14.6 %
South Mission Beach Project

Particle Size Distribution Report
PE
RC
EN
T F
INE
R
0
10
20
30
40
50
60
70
80
90
100
GRAIN SIZE - mm.
0.0010.010.1110100
% +3"Coarse
% Gravel
Fine Coarse Medium
% Sand
Fine Silt
% Fines
Clay
0.8 13.3 74.9 10.0
6 in
.
3 in
.
2 in
.
1½
in.
1 in
.
¾ in
.
½ in
.
3/8
in.
#4
#1
0
#2
0
#3
0
#4
0
#6
0
#1
00
#1
40
#2
00
Test Results (ASTM D 422 & ASTM D 1140)
Opening Percent Spec.* Pass?
Size Finer (Percent) (X=Fail)
Material Description
Atterberg Limits (ASTM D 4318)
Classification
Coefficients
Date Received: Date Tested:
Tested By:
Checked By:
Title:
Date Sampled:Source of Sample: B-1 Depth: 10Sample Number: 2
Client:
Project:
Project No: Figure
Dark greenish gray poorly-graded sand with silt (SP-SM)
0.375#4#8#10#16#30#40#50
#100#200
99.699.098.498.297.894.884.969.027.910.0
NP NV NP
SP-SM A-3
0.4940 0.4263 0.25750.2199 0.1566 0.0998
02/21/2019
Nicholas Barnes
Sani Sutanto
Project Manager
02/12/2019
Rick Engineering Company
South Mission Beach Project
190 GS-18-D
PL= LL= PI=
USCS (D 2487)= AASHTO (M 145)=
D90= D85= D60=D50= D30= D15=D10= Cu= Cc=
Remarks
* (no specification provided)
Allied Geotechnical Engineers, Inc.
Santee, CA B-4

Particle Size Distribution Report
PE
RC
EN
T F
INE
R
0
10
20
30
40
50
60
70
80
90
100
GRAIN SIZE - mm.
0.0010.010.1110100
% +3"Coarse
% Gravel
Fine Coarse Medium
% Sand
Fine Silt
% Fines
Clay
0.9 4.9 89.0 5.1
6 in
.
3 in
.
2 in
.
1½
in.
1 in
.
¾ in
.
½ in
.
3/8
in.
#4
#1
0
#2
0
#3
0
#4
0
#6
0
#1
00
#1
40
#2
00
Test Results (ASTM D 422 & ASTM D 1140)
Opening Percent Spec.* Pass?
Size Finer (Percent) (X=Fail)
Material Description
Atterberg Limits (ASTM D 4318)
Classification
Coefficients
Date Received: Date Tested:
Tested By:
Checked By:
Title:
Date Sampled:Source of Sample: B-3 Depth: 6
Client:
Project:
Project No: Figure
Greenish gray poorly graded sand with silt (SP-SM)
#4#8#10#16#30#40#50
#100#200
99.999.199.098.998.194.175.114.5
5.1
NP NV
SP-SM A-3
0.3806 0.3460 0.25270.2279 0.1846 0.15140.1079 2.34 1.25
02/12/2019 02/21/2019
Nicholas Barnes
Sani Sutanto
Project Manager
02/12/2019
Rick Engineering Company
South Mission Beach Project
190 GS-18-D
PL= LL= PI=
USCS (D 2487)= AASHTO (M 145)=
D90= D85= D60=D50= D30= D15=D10= Cu= Cc=
Remarks
* (no specification provided)
Allied Geotechnical Engineers, Inc.
Santee, CA B-5

Tested By: Nicholas Barnes
DIRECT SHEAR TEST REPORT
Allied Geotechnical Engineers, Inc.Santee, CA
Client: Rick Engineering Company
Project: South Mission Beach Project
Source of Sample: B-1 Depth: 15
Sample Number: 5
Proj. No.: 190 GS-18-D Date Sampled: 02/12/2019
Sample Type: Ring
Description:
Assumed Specific Gravity= 2.6
Remarks:
Figure B-6
Sample No.
Water Content, %
Dry Density, pcf
Saturation, %
Void Ratio
Diameter, in.
Height, in.
Water Content, %
Dry Density, pcf
Saturation, %
Void Ratio
Diameter, in.
Height, in.
Normal Stress, ksf
Fail. Stress, ksf
Displacement, in.
Ult. Stress, ksf
Displacement, in.
Strain rate, in./min.
Initi
al
At T
estSh
ea
r S
tre
ss, ks
f
0
0.5
1
1.5
2
2.5
3
Horiz. Displacement, in.
0 0.05 0.1 0.15 0.2
1
2
3
Fa
il. S
tre
ss, ks
f
0
1
2
3
Normal Stress, ksf
0 1 2 3 4 5 6
C, ksf
f, deg
Tan(f)
Results
0.27
36.5
0.74
1
31.5
94.1
113.0
0.7253
2.38
1.00
0.0
95.4
0.0
0.7012
2.38
0.991.00
1.020.09
0.008
2
31.0
95.8
116.0
0.6944
2.38
1.00
0.0
96.8
0.0
0.6774
2.38
0.992.00
1.730.13
0.008
3
30.7
94.6
111.6
0.7159
2.38
1.00
0.0
95.3
0.0
0.7039
2.38
0.993.00
2.490.12
0.008
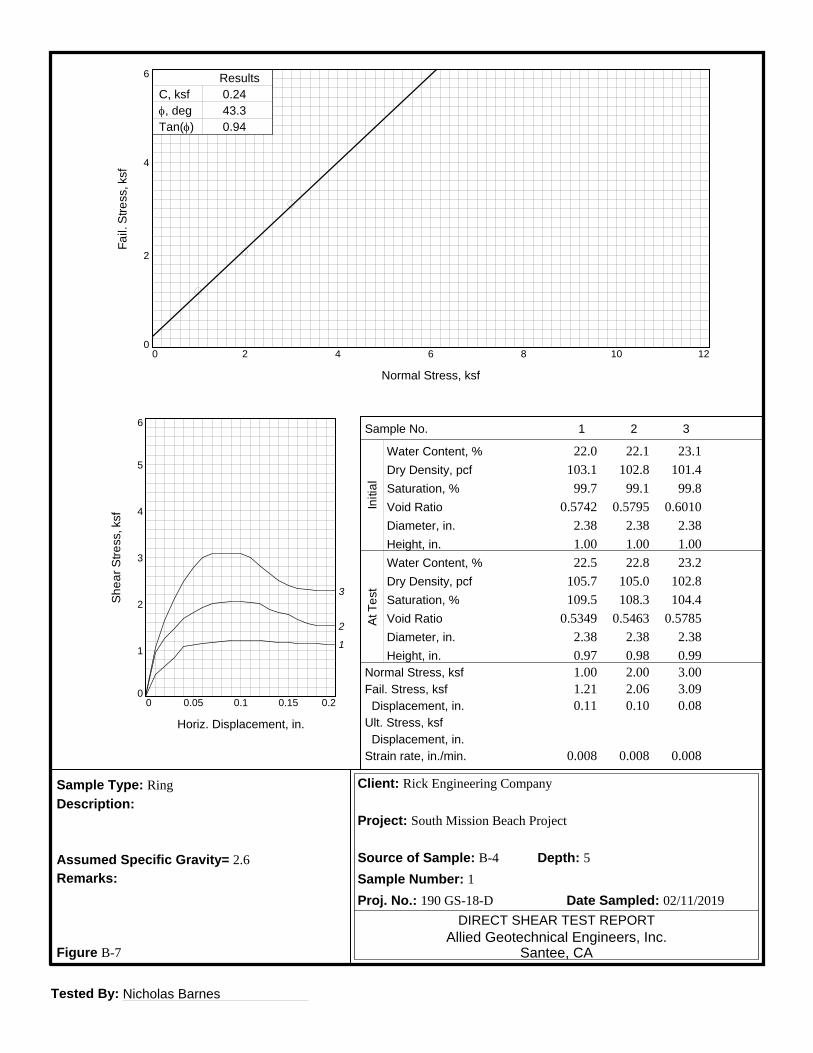
Tested By: Nicholas Barnes
DIRECT SHEAR TEST REPORT
Allied Geotechnical Engineers, Inc.Santee, CA
Client: Rick Engineering Company
Project: South Mission Beach Project
Source of Sample: B-4 Depth: 5
Sample Number: 1
Proj. No.: 190 GS-18-D Date Sampled: 02/11/2019
Sample Type: Ring
Description:
Assumed Specific Gravity= 2.6
Remarks:
Figure B-7
Sample No.
Water Content, %
Dry Density, pcf
Saturation, %
Void Ratio
Diameter, in.
Height, in.
Water Content, %
Dry Density, pcf
Saturation, %
Void Ratio
Diameter, in.
Height, in.
Normal Stress, ksf
Fail. Stress, ksf
Displacement, in.
Ult. Stress, ksf
Displacement, in.
Strain rate, in./min.
Initi
al
At T
estSh
ea
r S
tre
ss, ks
f
0
1
2
3
4
5
6
Horiz. Displacement, in.
0 0.05 0.1 0.15 0.2
1
2
3
Fa
il. S
tre
ss, ks
f
0
2
4
6
Normal Stress, ksf
0 2 4 6 8 10 12
C, ksf
f, deg
Tan(f)
Results
0.24
43.3
0.94
1
22.0
103.1
99.7
0.5742
2.38
1.00
22.5
105.7
109.5
0.5349
2.38
0.971.00
1.210.11
0.008
2
22.1
102.8
99.1
0.5795
2.38
1.00
22.8
105.0
108.3
0.5463
2.38
0.982.00
2.060.10
0.008
3
23.1
101.4
99.8
0.6010
2.38
1.00
23.2
102.8
104.4
0.5785
2.38
0.993.00
3.090.08
0.008

Tested By: Nicholas Barnes Checked By: Sani Sutanto
CONSOLIDATION TEST REPORT
Perc
ent S
train
4.5
4.0
3.5
3.0
2.5
2.0
1.5
1.0
0.5
0.0
-0.5
Applied Pressure - tsf0.1 1
Natural Dry Dens.LL PI Sp. Gr.
Overburden Pc Cc CrInitial Void
Saturation Moisture (pcf) (tsf) (tsf) Ratio
34.0 % 7.1 % 98.2 2.6 0.1 0.2 0.07 0.543
Dark greenish gray poorly-graded sand with silt (SP-SM)
190 GS-18-D Rick Engineering Company
South Mission Beach Project
B-8
MATERIAL DESCRIPTION USCS AASHTO
Project No. Client: Remarks:
Project:
Source of Sample: B-1 Depth: 5 Sample Number: 1
Allied Geotechnical Engineers, Inc.
Santee, CA Figure

L A B O R A T O R Y R E P O R T
Telephone (619) 425-1993 Fax 425-7917 Established 1928
C L A R K S O N L A B O R A T O R Y A N D S U P P L Y I N C. 350 Trousdale Dr. Chula Vista, Ca. 91910 www.clarksonlab.com
A N A L Y T I C A L A N D C O N S U L T I N G C H E M I S T S
Date: February 19, 2019 Purchase Order Number: 190GS18-D Sales Order Number: 43345Account Number: ALLGTo: *-------------------------------------------------* Allied Geotechnical Engineers1810 Gillespie Way Ste 104El Cajon, CA 92020Attention: Sani Sutanto
Laboratory Number: SO7200-4 Customers Phone: 449-5900 Fax: 449-5902
Sample Designation: *-------------------------------------------------* One soil sample received on 02/15/19 at 9:00am,from South Mission Beach Green Infrastructure Project marked as B-4#4@10'-11' Analysis By California Test 643, 1999, Department of TransportationDivision of Construction, Method for Estimating the Service Life ofSteel Culverts. pH 9.2
Water Added (ml) Resistivity (ohm-cm)
10 22005 15005 11005 9305 8805 7505 7305 8305 840
27 years to perforation for a 16 gauge metal culvert.35 years to perforation for a 14 gauge metal culvert.48 years to perforation for a 12 gauge metal culvert.62 years to perforation for a 10 gauge metal culvert.75 years to perforation for a 8 gauge metal culvert.
Water Soluble Sulfate Calif. Test 417 0.014% (140 ppm)
Water Soluble Chloride Calif. Test 422 0.062% (620 ppm)
Bicarbonate (as CaCO 3) 46 ppm(on a saturated soil paste extract)
______________________________Laura TorresLT/dbb

L A B O R A T O R Y R E P O R T
Telephone (619) 425-1993 Fax 425-7917 Established 1928
C L A R K S O N L A B O R A T O R Y A N D S U P P L Y I N C. 350 Trousdale Dr. Chula Vista, Ca. 91910 www.clarksonlab.com
A N A L Y T I C A L A N D C O N S U L T I N G C H E M I S T S
Date: February 19, 2019 Purchase Order Number: 190GS18-D Sales Order Number: 43345Account Number: ALLGTo: *-------------------------------------------------* Allied Geotechnical Engineers1810 Gillespie Way Ste 104El Cajon, CA 92020Attention: Sani Sutanto
Laboratory Number: SO7200-3 Customers Phone: 449-5900 Fax: 449-5902
Sample Designation: *-------------------------------------------------* One soil sample received on 02/15/19 at 9:00am,from South Mission Beach Green Infrastructure Project marked as B-3#3@9'-10' Analysis By California Test 643, 1999, Department of TransportationDivision of Construction, Method for Estimating the Service Life ofSteel Culverts. pH 9.3
Water Added (ml) Resistivity (ohm-cm)
10 390005 290005 190005 140005 100005 88005 77005 83005 9300
71 years to perforation for a 16 gauge metal culvert. 92 years to perforation for a 14 gauge metal culvert.127 years to perforation for a 12 gauge metal culvert.162 years to perforation for a 10 gauge metal culvert.198 years to perforation for a 8 gauge metal culvert.
Water Soluble Sulfate Calif. Test 417 0.003% (30 ppm)
Water Soluble Chloride Calif. Test 422 0.003% (30 ppm)
Bicarbonate (as CaCO 3) 66 ppm(on a saturated soil paste extract)
______________________________Laura TorresLT/dbb

L A B O R A T O R Y R E P O R T
Telephone (619) 425-1993 Fax 425-7917 Established 1928
C L A R K S O N L A B O R A T O R Y A N D S U P P L Y I N C. 350 Trousdale Dr. Chula Vista, Ca. 91910 www.clarksonlab.com
A N A L Y T I C A L A N D C O N S U L T I N G C H E M I S T S
Date: February 19, 2019 Purchase Order Number: 190GS18-D Sales Order Number: 43345Account Number: ALLGTo: *-------------------------------------------------* Allied Geotechnical Engineers1810 Gillespie Way Ste 104El Cajon, CA 92020Attention: Sani Sutanto
Laboratory Number: SO7200-2 Customers Phone: 449-5900 Fax: 449-5902
Sample Designation: *-------------------------------------------------* One soil sample received on 02/15/19 at 9:00am, from South Mission Beach Green Infrastructure Project marked as B-2#3@8'-9' Analysis By California Test 643, 1999, Department of TransportationDivision of Construction, Method for Estimating the Service Life ofSteel Culverts. pH 9.3
Water Added (ml) Resistivity (ohm-cm)
10 130005 95005 69005 51005 40005 35005 32005 35005 3600
49 years to perforation for a 16 gauge metal culvert. 64 years to perforation for a 14 gauge metal culvert. 89 years to perforation for a 12 gauge metal culvert.113 years to perforation for a 10 gauge metal culvert.138 years to perforation for a 8 gauge metal culvert.
Water Soluble Sulfate Calif. Test 417 0.007% (70 ppm)
Water Soluble Chloride Calif. Test 422 0.005% (50 ppm)
Bicarbonate (as CaCO 3) 66 ppm(on a saturated soil paste extract)
_____________________________Laura TorresLT/dbb

L A B O R A T O R Y R E P O R T
Telephone (619) 425-1993 Fax 425-7917 Established 1928
C L A R K S O N L A B O R A T O R Y A N D S U P P L Y I N C. 350 Trousdale Dr. Chula Vista, Ca. 91910 www.clarksonlab.com
A N A L Y T I C A L A N D C O N S U L T I N G C H E M I S T S
Date: February 19, 2019 Purchase Order Number: 190GS18-D Sales Order Number: 43345Account Number: ALLGTo: *-------------------------------------------------* Allied Geotechnical Engineers1810 Gillespie Way Ste 104El Cajon, CA 92020Attention: Sani Sutanto
Laboratory Number: SO7200-1 Customers Phone: 449-5900 Fax: 449-5902
Sample Designation: *-------------------------------------------------* One soil sample received on 02/15/19 at 9:00am, from South Mission Beach Green Infrastructure Project marked as B-1#4@14'-15'. Analysis By California Test 643, 1999, Department of TransportationDivision of Construction, Method for Estimating the Service Life ofSteel Culverts. pH 8.3
Water Added (ml) Resistivity (ohm-cm)
20 2705 2205 1405 1305 1305 1305 1305 1405 160
13 years to perforation for a 16 gauge metal culvert.17 years to perforation for a 14 gauge metal culvert.24 years to perforation for a 12 gauge metal culvert.30 years to perforation for a 10 gauge metal culvert.37 years to perforation for a 8 gauge metal culvert.
Water Soluble Sulfate Calif. Test 417 0.105% (1050 ppm)
Water Soluble Chloride Calif. Test 422 0.363% (3630 ppm)
Bicarbonate (as CaCO 3) 46 ppm(on a saturated soil paste extract)
______________________________Laura TorresLT/dbb

In accordance with your request, SCST has performed the subject laboratory testing. Test results are presented in the attached report.
If you have any additional questions or concerns, please contact us at 619.280.4321
Respectfully Submitted,SCST, Inc.
In accordance with your request, SCST has performed the subject laboratory testing. Test results are presented in the attached report.
If you have any additional questions or concerns, please contact us at 619.280.4321
Respectfully Submitted,SCST, Inc.
In accordance with your request, SCST has performed the subject laboratory testing. Test results are presented in the attached report.See RValue 37891.pdf in the documents section at the end of this report.
If you have any additional questions or concerns, please contact us at 619.280.4321
Respectfully Submitted,SCST, Inc.
RValueCal 301, ASTM D2844
3/11/2019Report Date:
SCST, LLC San DiegoLEA: 47, Exp: 04/25/20216280 Riverdale StreetSan Diego, CA 92120Phone: (619) 2804321Fax: (619) 2804717
Client:
Allied Geotechnical Engineering9500 Cuyamaca Street #102Santee, CA 920712685
Project:
180035LAllied Geotechnical 2018 Lab Testing9500 Cuyamaca Street Suite 102 Santee CA9207...
Page 1 of 2Page 1 of 1Page 1 of 4

Job Name: Job Number:Client: Sample No.:Date: By:Location:Description:
A B C D3/5/2019 3/5/2019 3/5/2019
PSI 350 350 350% 0.4 0.4 0.4
GRAMS 850 850 850ML 90 103 84% 10.6 12.2 9.9% 11 12.6 10.3
GRAMS 2983 2985 2979GRAMS 929 944 924
IN 2.49 2.52 2.52PCF 101.8 100.8 100.7PSI 305 245 425PSF 0 0 0PSI 13 13 12PSI 23 24 22
Turns 5.65 5.70 5.6072 71 74
FT 0.4 0.42 0.37FT 0 0 0
0000 0000 00000 0 0
72 71 74
0 0 04.5 4.5 4.5
R-Value at Equivalent 72
Expansion Dial Reading
PH at 2000 PoundsPH at 1000 Pounds
Traffic IndexR-Value by Expansion Pressure
Stabilometer ThicknessR' ValueDisplacement
180035L37891
Weight of Briquette & Tare
Expansion Pressure
Briquette Height
Initial Moisture
Allied Geotechnical 2018 Lab Testing
Test Specimen
Moisture At Compaction
DRBAllied Geotechnical Engineering3/5/2019
Date Tested
CTM 301 Resistance Value of Treated and Untreated Bases, Subbases and Basement Soils
B-4-2 @ 5'-8'Light Tan Sand
72
Soil Wt. Added
N/A
R' Value Modifier
Net Weight of Briquette
Gravel EquivalentR-Value by Exudation PressureCorrected R-Value
Expansion Thickness
Compactor Air Pressure
Exudation PressureDensity
Water AddedWater Added
Page 2 of 4

Job Name:By: DRB Date:Job No.: 180035L Sample No.:Gravel Equ: 0 Plate No.:
Allied Geotechnical 2018 Lab Testing3/5/2019
B-4-2 @ 5'-8'
0
0.1
0.2
0.3
0.4
0.5
0.6
0.7
0.8
0.9
1
1.1
1.2
1.3
1.4
1.5
1.6
1.7
1.8
1.9
2
2.1
2.2
2.3
2.4
0 0.10.20.30.40.50.60.70.80.9 1 1.11.21.31.41.51.61.71.81.9 2 2.12.22.32.42.52.62.72.82.9 3 3.13.23.33.43.53.63.73.83.9 4 4.14.24.34.44.54.64.74.84.9 5
CO
VER
TH
ICK
NES
S B
Y ST
ABIL
OM
ETER
-FEE
T
COVER THICKNESS BY EXPANSION PRESSURE-FEET
EXPANSION PRESSURE CHART
0 1.00.80.60.42 1.2 1.4 1.6 1.8 2.00.2 2.2 2.4 2.6 2.8 3.0 3.2 3.4 3.6 3.8 4.0 4.2 4.4 4.6 4.8 5.0
Page 3 of 4

Job Name:By: DRB Date:Job No.: 180035L Sample No.:R-Value by Ex.: 72 Plate No.:
Allied Geotechnical 2018 Lab Testing3/5/2019
B-4-2 @ 5'-8'
0
10
20
30
40
50
60
70
80
90
100
0100200300400500600700800
R-v
alue
Exudation Pressure (psi)
R-value By Exudation Pressure
Page 4 of 4

In accordance with your request, SCST has performed the subject laboratory testing. Test results are presented in the attached report.
If you have any additional questions or concerns, please contact us at 619.280.4321
Respectfully Submitted,SCST, Inc.
In accordance with your request, SCST has performed the subject laboratory testing. Test results are presented in the attached report.
If you have any additional questions or concerns, please contact us at 619.280.4321
Respectfully Submitted,SCST, Inc.
In accordance with your request, SCST has performed the subject laboratory testing. Test results are presented in the attached report.See RValue 37892.pdf in the documents section at the end of this report.
If you have any additional questions or concerns, please contact us at 619.280.4321
Respectfully Submitted,SCST, Inc.
RValueCal 301, ASTM D2844
3/11/2019Report Date:
SCST, LLC San DiegoLEA: 47, Exp: 04/25/20216280 Riverdale StreetSan Diego, CA 92120Phone: (619) 2804321Fax: (619) 2804717
Client:
Allied Geotechnical Engineering9500 Cuyamaca Street #102Santee, CA 920712685
Project:
180035LAllied Geotechnical 2018 Lab Testing9500 Cuyamaca Street Suite 102 Santee CA9207...
Page 1 of 2Page 1 of 1Page 1 of 4

Job Name: Job Number:Client: Sample No.:Date: By:Location:Description:
A B C D3/5/2019 3/5/2019 3/5/2019
PSI 350 350 350% 0.7 0.7 0.7
GRAMS 910 900 890ML 85 95 108% 9.4 10.6 12.2% 10.1 11.3 12.9
GRAMS 3100 3097 3101GRAMS 986 985 989
IN 2.56 2.53 2.49PCF 106.0 106.0 106.6PSI 675 585 290PSF 0 0 0PSI 14 14 15PSI 24 25 26
Turns 5.00 5.10 5.2074 73 71
FT 0.35 0.39 0.42FT 0 0 0
0000 0000 00002 0 0
76 73 71
0 0 04.5 4.5 4.5
71
Soil Wt. Added
N/A
R' Value Modifier
Net Weight of Briquette
Gravel EquivalentR-Value by Exudation PressureCorrected R-Value
Expansion Thickness
Compactor Air Pressure
Exudation PressureDensity
Water AddedWater Added
180035L37892
Weight of Briquette & Tare
Expansion Pressure
Briquette Height
Initial Moisture
Allied Geotechnical 2018 Lab Testing
Test Specimen
Moisture At Compaction
DRBAllied Geotechnical Engineering3/5/2019
Date Tested
CTM 301 Resistance Value of Treated and Untreated Bases, Subbases and Basement Soils
B-2-2 @ 5'-8'Light Grey Brown Silty Sand
R-Value at Equivalent 71
Expansion Dial Reading
PH at 2000 PoundsPH at 1000 Pounds
Traffic IndexR-Value by Expansion Pressure
Stabilometer ThicknessR' ValueDisplacement
Page 2 of 4

Job Name:By: DRB Date:Job No.: 180035L Sample No.:Gravel Equ: 0 Plate No.:
Allied Geotechnical 2018 Lab Testing3/5/2019
B-2-2 @ 5'-8'
0
0.1
0.2
0.3
0.4
0.5
0.6
0.7
0.8
0.9
1
1.1
1.2
1.3
1.4
1.5
1.6
1.7
1.8
1.9
2
2.1
2.2
2.3
2.4
0 0.10.20.30.40.50.60.70.80.9 1 1.11.21.31.41.51.61.71.81.9 2 2.12.22.32.42.52.62.72.82.9 3 3.13.23.33.43.53.63.73.83.9 4 4.14.24.34.44.54.64.74.84.9 5
CO
VER
TH
ICK
NES
S B
Y ST
ABIL
OM
ETER
-FEE
T
COVER THICKNESS BY EXPANSION PRESSURE-FEET
EXPANSION PRESSURE CHART
0 1.00.80.60.42 1.2 1.4 1.6 1.8 2.00.2 2.2 2.4 2.6 2.8 3.0 3.2 3.4 3.6 3.8 4.0 4.2 4.4 4.6 4.8 5.0
Page 3 of 4

Job Name:By: DRB Date:Job No.: 180035L Sample No.:R-Value by Ex.: 71 Plate No.:
Allied Geotechnical 2018 Lab Testing3/5/2019
B-2-2 @ 5'-8'
0
10
20
30
40
50
60
70
80
90
100
0100200300400500600700800
R-v
alue
Exudation Pressure (psi)
R-value By Exudation Pressure
Page 4 of 4

APPENDIX C
RCP PIPES BUOYANCY CALCULATIONS

South Mission Beach Green Infrastructure RCP Pipes Buoyancy Calculations
Pipe Material: Reinforced ConcretePipe Dimensions:OD = 54 inches = 4.5 feetID = 48 inches = 4.0 feetConc. Unit Weight = 150 pcfCompacted Fill Unit Weight Above Water = 130 pcfCompacted Fill Unit Weight Below Water = 125 pcf (include 62.4 pcf for unit weight of water)Water Unit Weight = 62.4 pcf
Note: Assume pipe in empty for calculation purposes & GW level at ground surface elevation.
Pipe Weight per Unit Length =2 2((3.14 x 2.25 ) - (3.14 x 2.0 )) cf/ft x 150 pcf =
(15.9 - 12.6) cf/ft x 150 pcf =3.3 cf/ft x 150 pcf = 495.0 pounds/ft
Bouyant Uplift per Unit Length of Pipe =2(3.14 x 2.25 ) cf/ft x 62.4 pcf = 992.2 pounds/ft
Excess Bouyant Uplift =992.2 pounds/ft - 495.0 pounds/ft = 497.2 pounds/ft
Minimum Thickness of Compacted Backfill Cover = (497.2 pounds/ft / (4.5 feet x 125 pcf)) x 1.5 (F.S.) = 1.325 foot rounded to 1.5 foot.
Project No. 190 GS-18-DAppendix C, Sheet 1

Pipe Material: Reinforced ConcretePipe Dimensions:OD = 42 inches = 3.5 feetID = 36 inches = 3.0 feetConc. Unit Weight = 150 pcfCompacted Fill Unit Weight Above Water = 130 pcfCompacted Fill Unit Weight Below Water = 125 pcf (include 62.4 pcf for unit weight of water)Water Unit Weight = 62.4 pcf
Note: Assume pipe in empty for calculation purposes & GW level at ground surface elevation.
Pipe Weight per Unit Length =2 2((3.14 x 1.75 ) - (3.14 x 1.5 )) cf/ft x 150 pcf =
(9.6 - 7.1) cf/ft x 150 pcf =2.5 cf/ft x 150 pcf = 375 pounds/ft
Bouyant Uplift per Unit Length of Pipe =2(3.14 x 1.75 ) cf/ft x 62.4 pcf = 600.0 pounds/ft
Excess Bouyant Uplift =600.0 pounds/ft - 375.0 pounds/ft = 225.0 pounds/ft
Minimum Thickness of Compacted Backfill Cover = (225.0 pounds/ft / (3.5 feet x 125 pcf)) x 1.5 (F.S.) = 0.77 foot rounded to 1.0 foot.
Project No. 190 GS-18-DAppendix C, Sheet 2
South Mission Beach Green Infrastructure RCP Pipes Buoyancy Calculations

Pipe Material: Reinforced ConcretePipe Dimensions:OD = 36 inches = 3.0 feetID = 30 inches = 2.5 feetConc. Unit Weight = 150 pcfCompacted Fill Unit Weight Above Water = 130 pcfCompacted Fill Unit Weight Below Water = 125 pcf (include 62.4 pcf for unit weight of water)Water Unit Weight = 62.4 pcf
Note: Assume pipe in empty for calculation purposes & GW level at ground surface elevation.
Pipe Weight per Unit Length =2 2
((3.14 x 1.5 ) - (3.14 x 1.25 )) cf/ft x 150 pcf =(7.1 - 4.9) cf/ft x 150 pcf =2.2 cf/ft x 150 pcf = 330.0 pounds/ft
Bouyant Uplift per Unit Length of Pipe =2(3.14 x 1.5 ) cf/ft x 62.4 pcf = 443.0 pounds/ft
Excess Bouyant Uplift =443.0 pounds/ft - 330.0 pounds/ft = 113.0 pounds/ft
Minimum Thickness of Compacted Backfill Cover = (113.0 pounds/ft / (3 feet x 125 pcf)) x 1.5 (F.S.) = 0.452 foot rounded to 0.5 foot.
Project No. 190 GS-18-DAppendix C, Sheet 3
South Mission Beach Green Infrastructure RCP Pipes Buoyancy Calculations

Pipe Material: Reinforced ConcretePipe Dimensions:OD = 22 inches = 1.83 feetID = 18 inches = 1.5 feetConc. Unit Weight = 150 pcfCompacted Fill Unit Weight Above Water = 130 pcfCompacted Fill Unit Weight Below Water = 125 pcf (include 62.4 pcf for unit weight of water)Water Unit Weight = 62.4 pcf
Note: Assume pipe in empty for calculation purposes & GW level at ground surface elevation.
Pipe Weight per Unit Length =2 2((3.14 x 0.915 ) - (3.14 x 0.75 )) cf/ft x 150 pcf =
(2.64 - 1.77) cf/ft x 150 pcf =0.87 cf/ft x 150 pcf = 130.5 pounds/ft
Bouyant Uplift per Unit Length of Pipe =2(3.14 x 0.915 ) cf/ft x 62.4 pcf = 164.7 pounds/ft
Excess Bouyant Uplift =164.7 pounds/ft - 130.5 pounds/ft = 34.2 pounds/ft
Minimum Thickness of Compacted Backfill Cover = (34.2 pounds/ft / (1.83 feet x 125 pcf)) x 1.5 (F.S.) = 0.22 foot rounded to 0.5 foot.
Project No. 190 GS-18-DAppendix C, Sheet 4
South Mission Beach Green Infrastructure RCP Pipes Buoyancy Calculations

November 27, 2019
Mr. Kevin Gibson, P.E.Project ManagerRick Engineering Company 5620 Friars RoadSan Diego, CA
Subject: RESPONSE TO CITY OF SAN DIEGODEVELOPMENT SERVICES DEPARTMENTREVIEW COMMENTS PERTAINING TOREPORT OF GEOTECHNICAL INVESTIGATION SOUTH MISSION BEACH GREEN INFRASTRUCTURE PROJECTCITY OF SAN DIEGOAGE Project No. 190 GS-18-D
Dear Kevin,
This letter provides our response to Mr. Kreg Mills of the City of San Diego Development ServicesDepartment review comments dated October 7, 2019. The general and specific comments that wereceived and our response are presented in the table below.
No. Development Services Department Comment
AGE Response
1 Updated Report of Geotechnical Investigation, SouthMission Beach Green Infrastructure Project, City of SanDiego, prepared by Allied Geotechnical Engineers, Inc.dated March 15, 2019 (their project no. 170446P4.1)Development Plans for South Mission Beach StormDrain and Green Infrastructure, Drawing no. 41306-D,prepared by Rick Engineering Company for the City ofSan Diego Transportation and Storm Water, datedAugust 2, 2019
Reference only.
2 The project's geotechnical consultant must submit anaddendum geotechnical report or update letter for thepurpose of an environmental review that specificallyaddresses the proposed development plans and thefollowing:
An updated report which specifically addresses the 100% Submittalproject plans prepared by Rick Engineering Company is attached.

No. Development Services DepartmentComment
AGE Response
3 To delineate the proposed footprint of the project, theproject's geotechnical consultant should clarify ifremedial grading will be anticipated outside the limitsof grading or limits of work currently shown on thereferenced development plans.
Remedial grading outside the limit of proposed excavations for the subjectproject is not anticipated (first paragraph of Section 5.5 - Cut-and-CoverConstruction page 19 of the Updated Geotechnical Repor).
4 The development plans indicate Infiltration is proposedfor the bioretention basins. The geotechnical consultantmust address the feasibility of on-site storm waterdisposal/ infiltration systems and potential impactsregarding fill settlement, piping of soil, and prematurefailure of pavement. The geotechnical consultant shouldindicate whether or not the proposed on-site stormwater disposal/ infiltration systems will have adverseimpacts on adjacent properties.
The basins are not anticipated to cause settlement, soil piping, prematurepavement failure and/or adverse impacts on adjacent properties. Adiscussion is presented in Section 5.7 - Infiltration Testing and Basins onpage 26 of the Updated Geotechnical Report.
5 The project's geotechnical consultant should provide aconclusion regarding if the proposed development willdestabilize or result in settlement of adjacent propertyor the right of way.
Based on a review of the 100% Submittal project plans prepared by RickEngineering, the proposed project is not anticipated to destabilize orresults in settlement of adjacent property or the right-of-way (firstparagraph of Section 5.1 - Potential Geologic Hazards page 13 of theUpdated Geotechnical Report).
6 Submit a digital copy (on CD or USB data storagedevice) of all geotechnical reports submitted for reviewwith the next re-submittal.
Reference only.
If you have any questions regarding the contents of this letter or if we may be of further assistance,please feel free to give us a call.
Very truly yours,
ALLIED GEOTECHNICAL ENGINEERS, INC.
Sani Sutanto, P.E.Project Manager 06/30/2020
SS/TJL:cal
Project No. 190 GS-18-DNovember 27, 2019Page 2 of 2 Allied Geotechnical Engineers, Inc.
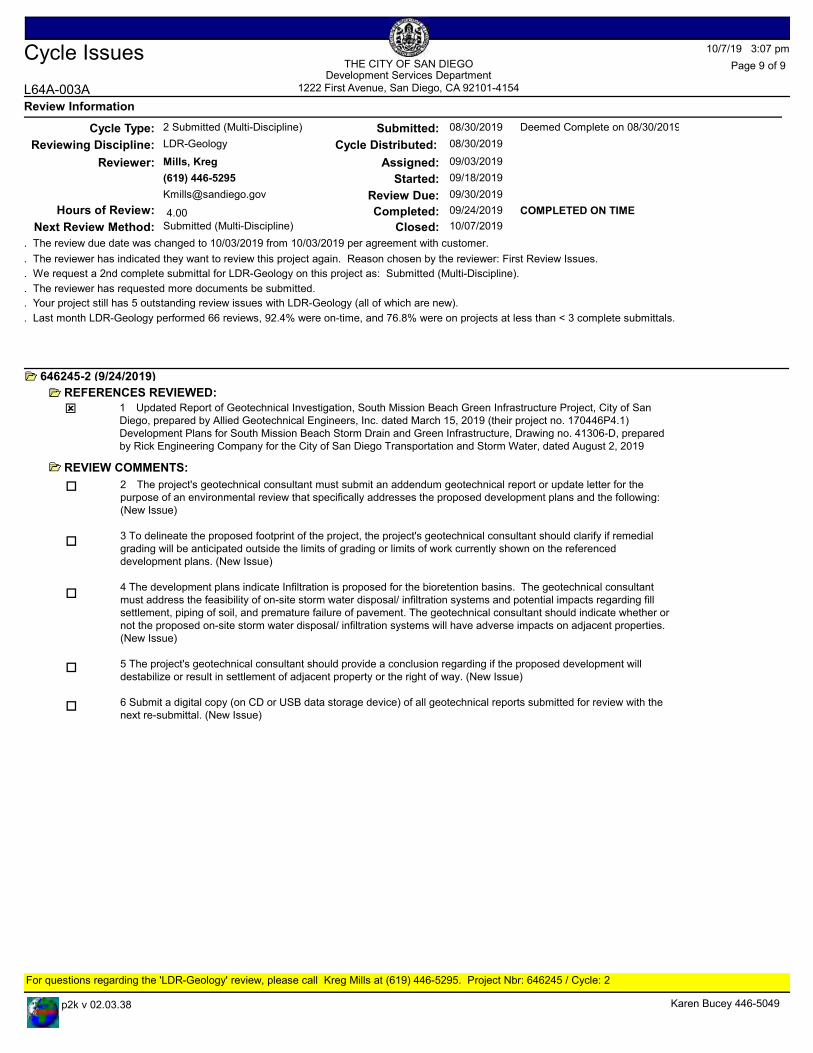
L64A-003A
Cycle Issues 10/7/19 3:07 pm
1222 First Avenue, San Diego, CA 92101-4154
THE CITY OF SAN DIEGODevelopment Services Department
Page 9 of 9
Review Information
Cycle Type: Submitted: 08/30/2019 Deemed Complete on 08/30/20192 Submitted (Multi-Discipline)
10/07/2019Closed:
LDR-Geology
09/18/2019
09/24/2019
09/03/2019Mills, Kreg
(619) 446-5295
Submitted (Multi-Discipline)
Review Due:
Next Review Method:
Reviewing Discipline:
Started:
Completed:
Assigned:Reviewer:
COMPLETED ON TIME
08/30/2019Cycle Distributed:
09/30/2019
Hours of Review: 4.00
. The review due date was changed to 10/03/2019 from 10/03/2019 per agreement with customer.
. The reviewer has indicated they want to review this project again. Reason chosen by the reviewer: First Review Issues.
. We request a 2nd complete submittal for LDR-Geology on this project as: Submitted (Multi-Discipline).
. The reviewer has requested more documents be submitted.
. Your project still has 5 outstanding review issues with LDR-Geology (all of which are new).
. Last month LDR-Geology performed 66 reviews, 92.4% were on-time, and 76.8% were on projects at less than < 3 complete submittals.
646245-2 (9/24/2019)REFERENCES REVIEWED:
1 Updated Report of Geotechnical Investigation, South Mission Beach Green Infrastructure Project, City of San Diego, prepared by Allied Geotechnical Engineers, Inc. dated March 15, 2019 (their project no. 170446P4.1)Development Plans for South Mission Beach Storm Drain and Green Infrastructure, Drawing no. 41306-D, prepared by Rick Engineering Company for the City of San Diego Transportation and Storm Water, dated August 2, 2019
ý
REVIEW COMMENTS:2 The project's geotechnical consultant must submit an addendum geotechnical report or update letter for the purpose of an environmental review that specifically addresses the proposed development plans and the following: (New Issue)
3 To delineate the proposed footprint of the project, the project's geotechnical consultant should clarify if remedial grading will be anticipated outside the limits of grading or limits of work currently shown on the referenced development plans. (New Issue)
4 The development plans indicate Infiltration is proposed for the bioretention basins. The geotechnical consultant must address the feasibility of on-site storm water disposal/ infiltration systems and potential impacts regarding fill settlement, piping of soil, and premature failure of pavement. The geotechnical consultant should indicate whether or not the proposed on-site storm water disposal/ infiltration systems will have adverse impacts on adjacent properties. (New Issue)
5 The project's geotechnical consultant should provide a conclusion regarding if the proposed development will destabilize or result in settlement of adjacent property or the right of way. (New Issue)
6 Submit a digital copy (on CD or USB data storage device) of all geotechnical reports submitted for review with the next re-submittal. (New Issue)
o
o
o
o
o
For questions regarding the 'LDR-Geology' review, please call Kreg Mills at (619) 446-5295. Project Nbr: 646245 / Cycle: 2
p2k v 02.03.38 Karen Bucey 446-5049

UPDATED REPORT OFGEOTECHNICAL INVESTIGATION SOUTH MISSION BEACH GREEN
INFRASTRUCTURE PROJECTCITY OF SAN DIEGO
Submitted to:
RICK ENGINEERING COMPANY5620 Friars RoadSan Diego, CA
Prepared By:
ALLIED GEOTECHNICAL ENGINEERS, INC.9500 Cuyamaca Street, Suite 102
Santee, California 92071-2685
AGE Project No. 190 GS-18-D
March 8, 2019(Updated November 27, 2019)
March 8, 2019(Updated November 27, 2019)
Mr. Kevin Gibson, P.E.Project ManagerRick Engineering Company 5620 Friars RoadSan Diego, CA
Subject: UPDATED REPORT OF GEOTECHNICAL INVESTIGATION SOUTH MISSION BEACH GREEN INFRASTRUCTURE PROJECTCITY OF SAN DIEGOAGE Project No. 190 GS-18-D
Dear Mr. Gibson:
Allied Geotechnical Engineers, Inc. is pleased to submit the accompanying updated report to present thefindings, opinions, and recommendations of a geotechnical investigation that was performed to assist RickEngineering Company with their design of the subject project. We have reviewed the 100% Submittal plansfor the subject project, prepared by Rick Engineering Company, undated. It is our opinion that the 100%Submittal project plans were prepared in conformance with the design recommendations provided herein. This report incorporates our response to the review comments that we received from the City of San DiegoDevelopment Services Department dated October 7, 2019.
We appreciate the opportunity to be of service on this project. If you have any questions regarding thecontents of this report or need further assistance, please feel free to contact our office.
Sincerely,
ALLIED GEOTECHNICAL ENGINEERS, INC.
Nicholas E. Barnes, P.G., C.E.G. Sani Sutanto, P.E.Senior Geologist Project Manager
NEB/SS/TJL:cal 06/30/2020
Distr. (1 electronic) Addressee
05/31/2020

AGE Project No. 190 GS-18-DMarch 8, 2019 (Updated November 27, 2019)Page i
UPDATED REPORT OF GEOTECHNICAL INVESTIGATION SOUTH MISSION BEACH GREEN INFRASTRUCTURE PROJECT
CITY OF SAN DIEGO
TABLE OF CONTENTS
Page No.
1.0 INTRODUCTION. . . . . . . . . . . . . . . . . . . . . . . . . . . . . . . . . . . . . . . . . . . . . . . 1
2.0 SITE AND PROJECT DESCRIPTION. . . . . . . . . . . . . . . . . . . . . . . . . . . . . . . 2
3.0 OBJECTIVE AND SCOPE OF INVESTIGATION. . . . . . . . . . . . . . . . . . . . . 4 3.1 Information Review. . . . . . . . . . . . . . . . . . . . . . . . . . . . . . . . . . . . . . . . 4 3.2 Geotechnical Field Exploration. . . . . . . . . . . . . . . . . . . . . . . . . . . . . . . 4 3.3 Laboratory Testing. . . . . . . . . . . . . . . . . . . . . . . . . . . . . . . . . . . . . . . . . 8
4.0 GEOLOGIC CONDITIONS. . . . . . . . . . . . . . . . . . . . . . . . . . . . . . . . . . . . . . . 9 4.1 Geologic Setting and Site Physiography. . . . . . . . . . . . . . . . . . . . . . . . 9 4.2 Tectonic Setting. . . . . . . . . . . . . . . . . . . . . . . . . . . . . . . . . . . . . . . . . . . 9 4.3 Geologic Units. . . . . . . . . . . . . . . . . . . . . . . . . . . . . . . . . . . . . . . . . . . 10
4.3.1 Fill Materials. . . . . . . . . . . . . . . . . . . . . . . . . . . . . . . . 10 4.3.2 Old paralic Deposits.. . . . . . . . . . . . . . . . . . . . . . . . . . 11
4.4 Groundwater. . . . . . . . . . . . . . . . . . . . . . . . . . . . . . . . . . . . . . . . . . . . 11
Allied Geotechnical Engineers, Inc.

AGE Project No. 190 GS-18-DMarch 8, 2019 (Updated November 27, 2019)Page ii
TABLE OF CONTENTS(Continued)
Page No.
5.0 DISCUSSIONS, OPINIONS, AND RECOMMENDATIONS. . . . . . . . . . . . 13 5.1 Potential Geologic Hazards. . . . . . . . . . . . . . . . . . . . . . . . . . . . . . . . . 13
5.1.1 Faulting. . . . . . . . . . . . . . . . . . . . . . . . . . . . . . . . . . . . 13 5.1.2 Fault Ground Rupture & Ground Lurching. . . . . . . . . 14 5.1.3 Soil Liquefaction. . . . . . . . . . . . . . . . . . . . . . . . . . . . . 14 5.1.4 Hydroconsolidation. . . . . . . . . . . . . . . . . . . . . . . . . . . 15 5.1.5 Landslides. . . . . . . . . . . . . . . . . . . . . . . . . . . . . . . . . . 15 5.1.6 Lateral Spread Displacement. . . . . . . . . . . . . . . . . . . . 16 5.1.7 Differential Seismic-Induced Settlement.. . . . . . . . . . 16 5.1.8 Secondary Hazards.. . . . . . . . . . . . . . . . . . . . . . . . . . . 16
5.2 Soil Corrosivity. . . . . . . . . . . . . . . . . . . . . . . . . . . . . . . . . . . . . . . . . . 17 5.3 Expansive Soil. . . . . . . . . . . . . . . . . . . . . . . . . . . . . . . . . . . . . . . . . . . 18 5.4 Fill Material. . . . . . . . . . . . . . . . . . . . . . . . . . . . . . . . . . . . . . . . . . . . . 18 5.5 Cut-and-Cover Construction. . . . . . . . . . . . . . . . . . . . . . . . . . . . . . . . 19
5.5.1 Soil and Excavation Characteristics. . . . . . . . . . . . . . 19 5.5.2 Pipe Loads and Settlement.. . . . . . . . . . . . . . . . . . . . . 20 5.5.3 Trench Backfill. . . . . . . . . . . . . . . . . . . . . . . . . . . . . . 20 5.5.4 Placement and Compaction of Backfill. . . . . . . . . . . . 22 5.5.5 Groundwater Bouyant Uplift. . . . . . . . . . . . . . . . . . . . 23
5.6 Buried Structures. . . . . . . . . . . . . . . . . . . . . . . . . . . . . . . . . . . . . . . . . 23 5.6.1 Placement and Compaction of Backfill. . . . . . . . . . . . 24 5.6.2 Foundations. . . . . . . . . . . . . . . . . . . . . . . . . . . . . . . . . 24 5.6.3 Walls Below Grade. . . . . . . . . . . . . . . . . . . . . . . . . . . 25
5.7 Infiltration Testing and Basins. . . . . . . . . . . . . . . . . . . . . . . . . . . . . . . 26
Allied Geotechnical Engineers, Inc.

AGE Project No. 190 GS-18-DMarch 8, 2019 (Updated November 27, 2019)Page iii
TABLE OF CONTENTS(Continued)
Page No.
6.0 CONSTRUCTION-RELATED CONSIDERATIONS. . . . . . . . . . . . . . . . . . 29 6.1 Construction Dewatering. . . . . . . . . . . . . . . . . . . . . . . . . . . . . . . . . . . 29 6.2 Temporary Shoring. . . . . . . . . . . . . . . . . . . . . . . . . . . . . . . . . . . . . . . 29 6.3 Environmental Considerations.. . . . . . . . . . . . . . . . . . . . . . . . . . . . . . 31
7.0 GENERAL CONDITIONS. . . . . . . . . . . . . . . . . . . . . . . . . . . . . . . . . . . . . . . 33 7.1 Post-Investigation Services. . . . . . . . . . . . . . . . . . . . . . . . . . . . . . . . . 33 7.2 Uncertainties and Limitations. . . . . . . . . . . . . . . . . . . . . . . . . . . . . . . 33
8.0 REFERENCES.. . . . . . . . . . . . . . . . . . . . . . . . . . . . . . . . . . . . . . . . . . . . . . . . 35
Tables
Table 1 Summary of Subsurface Conditions. . . . . . . . . . . . . . . . . . . . . . . . . . . 5
Table 2 Summary of Corrosivity Test Results. . . . . . . . . . . . . . . . . . . . . . . . . 17
Allied Geotechnical Engineers, Inc.

AGE Project No. 190 GS-18-DMarch 8, 2019 (Updated November 27, 2019)Page iv
TABLE OF CONTENTS(Continued)
Page No.
Figures
Figure 1 Alignments Map
Figures 2 through 5 Location Map
Figure 6 Photograph
Figure 7 Lateral Pressures for Cantilever Walls
Figure 8 Lateral Pressures for Restrained Walls
Figure 9 Foundation Induced Wall Pressures
Figure 10 Traffic and Surcharge Pressures
Appendices
Appendix A Field Exploration Program
Appendix B Laboratory Testing
Appendix C RCP Pipes Buoyancy Calculations
Allied Geotechnical Engineers, Inc.

SECTION ONE INTRODUCTION
1.0 INTRODUCTION
Allied Geotechnical Engineers, Inc. (AGE) is pleased to submit this report to present the findings,
opinions, and recommendations of a geotechnical investigation conducted to assist Rick Engineering
Company (Rick Engineering) with their design of the South Mission Beach Green Infrastructure
Project for the City of San Diego (City). The investigation was performed in conformance with
AGE’s proposal dated July 11, 2018 (revised July 24, 2018), and the subconsultant agreement
entered into by and between Rick Engineering and AGE on November 1, 2018. This report was
previously updated on September 10, 2019 to incorporate the results of a subsurface geotechnical
investigation performed by Southern California Soil and Testing, Inc. (SCS&T), dated April 16,
2019 and to provide additional recommendations to mitigate the groundwater bouyant uplift forces
on the proposed storm drain pipelines. The current updated report incorporates the results of our
review of Rick Engineering’s 100% Submittal project plans and response to City of San Diego
Development Services Department review comments dated October 7, 2019.
This report has been prepared for the exclusive use of Rick Engineering and its design team and the
City in their design of the project as described herein. The information presented in this report is
not sufficient for any other uses or the purposes of other parties.
AGE Project No. 190 GS-18-DMarch 8, 2019 (Updated November 27, 2019)Page 1 of 37 Allied Geotechnical Engineers, Inc.

SECTION TWO SITE AND PROJECTDESCRIPTION
2.0 SITE AND PROJECT DESCRIPTION
The project alignments Map is shown on Figure 1. Based on a review of the 100% Submittal plans
prepared by Rick Engineering Company, undated, it is our understanding that the scope of the
proposed project will include the following:
• design and construction of approximately 88 feet of concrete lined channel;
• design and construction of approximately 6,253 feet of storm drain pipelines;
• design and construction of approximately 142 feet of encased storm drain;
• design and construction of 16 feet of culvert;
• design and construction of five (5) biofiltration basins and three (3) bioretention
basins identified as Basins 1 through 8 on the 100% Submittal project plans; and
• design and construction of associated headwalls, inlets, connectors, cleanouts,
outlets, tidegates and weep sumps.
The proposed project alignments extend along public right-of-ways in the South Mission Beach area
of San Diego. The proposed pipelines will consist of 18-, 30-, 36- and 48-inch diameter reinforced
concrete pipes (RCP) and 6-inch diameter PVC pipes. It is anticipated that the proposed pipelines
will be installed using conventional cut-and-cover construction method with cover thickness on the
order of 2 to 13 feet above the pipe crown.
AGE Project No. 190 GS-18-DMarch 8, 2019 (Updated November 27, 2019)Page 2 of 37 Allied Geotechnical Engineers, Inc.
SECTION TWO SITE AND PROJECTDESCRIPTION
Existing improvements along the project alignments include a mix of residential and commercial
developments as well as Mission Beach and Mission Bay Park. The topography along the project
alignments varies from level to very gently sloping with elevations which vary from sea level to
approximately 13 feet above mean sea level (msl).
AGE Project No. 190 GS-18-DMarch 8, 2019 (Updated November 27, 2019)Page 3 of 37 Allied Geotechnical Engineers, Inc.

SECTION THREE OBJECTIVE AND SCOPEOF INVESTIGATION
3.0 OBJECTIVE AND SCOPE OF INVESTIGATION
The objectives of this investigation were to characterize the subsurface conditions along the project
alignments and to develop geotechnical recommendations for use in the design of the currently
proposed project. The scope of our investigation included several tasks which are described in
more detail in the following sections.
3.1 Information Review
This task involved a review of readily available information pertaining to the project study area,
including the preliminary project plans, as-built utility maps, topographic maps, published geologic
literature and maps, and AGE’s in-house references. In addition AGE also perform a review of a
report of Geotechnical Investigation prepared by Souther California Soil & Testing for the Mission
Beach Water and Sewer Replacement City of San Diego Task #17CD03, dated April 16, 2019.
3.2 Geotechnical Field Exploration
The field exploration program for this project was performed on February 11 and 12, 2019. A total
of four (4) soil borings, four (4) infiltration test holes, and two (2) pavement corings were performed
at the approximate locations shown on Figures 2 through 5. In addition, AGE attempted to perform
infiltration testing inside an existing weep sump located on the west side of Mission Boulevard, at
the entrance of an alley located between Brighton Court and Capistrano Place. The soil borings
were advanced to depths ranging from 15 feet to 16.5 feet below the existing ground surface (bgs).
The infiltration test holes were hand-augured to depths ranging from 36 inches to 63 inches bgs.
A brief description of the location and depth, pavement sections, groundwater level, and subsurface
conditions encountered in the borings and infiltration test holes is presented in Table 1 on the next
page. A more detailed description of the excavation and sampling activities, and logs of the soil
borings are presented in Appendix A.
AGE Project No. 190 GS-18-DMarch 8, 2019 (Updated November 27, 2019)Page 4 of 37 Allied Geotechnical Engineers, Inc.

SECTION THREE OBJECTIVE AND SCOPEOF INVESTIGATION
Table 1
Summary of Subsurface Conditions
Boring &Test Hole ID
LocationDepth(Feet)
Existing Pavement
SectionSubsurface Conditions
EstimatedGroundwater
Depth/Elevation
(Feet bgs/feetmsl)
B-1 Mission Bay beach,approximately 10feet east of BaysideWalk at intersectionwith San FernandoPlace.
16.5 N/A Hydraulic fill to 10feet and old paralicdeposits to themaximum depth ofexploration.
11/-3.7
B-2 Southbound MissionBoulevard,approximately 40feet south of SanFernando Place and4 feet west of thecenter median.
15 4" A.C. over8" P.C.C.underlain by 6"miscellaneousbase.
Old paralic depositsto the maximumdepth ofexploration.
4.25/+2.0
C-2 Southbound MissionBoulevard,approximately 40feet south of SanFernando Place and12 feet east of thecurb.
N/A 4.5" A.C. over9.5" P.C.C.Unable todifferentiatebase materials.
N/A N/A
B-3 Mission Bay beach,approximately 20feet east of BaysideWalk at intersectionwith CoronadoCourt.
16.5 N/A Hydraulic fill to 10feet and old paralicdeposits to themaximum depth ofexploration.
4/+1.2
B-4 Southbound MissionBoulevard,approximately 60feet south ofBrighton Court and4 feet west of thecenter median.
15 4.5" A.C. over7.5" P.C.C.underlain by 4"miscellaneousbase.
Old paralic depositsto the maximumdepth ofexploration.
3.25/+1.75
AGE Project No. 190 GS-18-DMarch 8, 2019 (Updated November 27, 2019)Page 5 of 37 Allied Geotechnical Engineers, Inc.

SECTION THREE OBJECTIVE AND SCOPEOF INVESTIGATION
Table 1 (continued)
Summary of Subsurface Conditions
Boring &Test Hole ID
LocationDepth(Feet)
Existing Pavement
SectionSubsurface Conditions
EstimatedGroundwater
Depth/Elevation
(Feet bgs/feetmsl)
C-4 Northbound MissionBoulevard,approximately 60feet south ofBrighton Court and12 feet west of thecurb.
N/A 6" A.C., 6"P.C.C., 2"miscellaneousbase.
N/A N/A
P-1 Lawn areaapproximately 30feet east of MissionBoulevard and 240feet north of SanFernando Place.
62" N/A Four inches oftopsoil underlain byold paralic depositsto the maximumdepth ofexploration.
3'/+2.7'
P-2 Tree planter on eastside of MissionBoulevardapproximately 20feet north of DealCourt.
36" N/A Twelve inches oftopsoil underlain byold paralic depositsto the maximumdepth ofexploration.
3'/+1.9'
P-3 Tree planter on westside of MissionBoulevardapproximately 15feet north of BalboaCourt.
48" N/A Twelve inches oftopsoil underlain byold paralic depositsto the maximumdepth ofexploration.
3'/+1.5'
P-4 Lawn areaapproximately330feet east of MissionBoulevard and 10feet south ofBayside Lane.
63" N/A Three inches oftopsoil underlain byold paralic depositsto the maximumdepth ofexploration.
Not encountered.
AGE Project No. 190 GS-18-DMarch 8, 2019 (Updated November 27, 2019)Page 6 of 37 Allied Geotechnical Engineers, Inc.

SECTION THREE OBJECTIVE AND SCOPEOF INVESTIGATION
Prior to commencement of the field exploration activities, several site reconnaissance visits were
performed to observe existing conditions and to select suitable locations for the soil borings and
infiltration test holes. Subsequently, Underground Service Alert (USA) was contacted to coordinate
clearance of the proposed boring and test hole locations with respect to existing buried utilities. The
utility clearance effort revealed the presence of the following buried utilities: potable water and
sanitary sewer pipelines; storm drains; natural gas and electrical transmission lines; and cable,
telephone, and fiber optic lines.
Traffic control permits were obtained from the City of San Diego to perform the borings (B-2 and
B-4) and pavement cores (C-2 and C-4) that are located within the public right-of-way. Borings B-1
and B-3, and percolation holes P-1 and P-4 which are located in Mission Bay Park were performed
with prior verbal approval from the City of San Diego Parks & Recreation Department.
Due to the presence of shallow groundwater inside test holes P-1, P-2 and P-3, AGE was unable to
perform infiltration testing inside these holes. The existing weep sump was installed on top of an
existing City of San Diego sewer trench. Furthermore, when AGE attempted to perform the
infiltration testing, AGE uncovered an 18-inch diameter green PVC pipe filled with 3/4-inch crushed
rock (see photograph in Figure 6). Therefore, AGE was unable to perform infiltration testing inside
the weep sump. Infiltration testing was only performed in test hole P-4.
AGE Project No. 190 GS-18-DMarch 8, 2019 (Updated November 27, 2019)Page 7 of 37 Allied Geotechnical Engineers, Inc.
SECTION THREE OBJECTIVE AND SCOPEOF INVESTIGATION
3.3 Laboratory Testing
Selected soil samples obtained from the soil borings were tested in the laboratory to verify field
classifications and evaluate certain engineering characteristics. The geotechnical laboratory tests
were performed in general conformance with the American Society for Testing and Materials
(ASTM) or other generally accepted testing procedures.
The laboratory tests included: in-place density and moisture content, maximum density and
optimum moisture content, sieve (wash) analysis, consolidation, shear strength, and R-value. In
addition, representative samples of the onsite soil materials were collected and delivered to
Clarkson Laboratories and Supply, Inc. for chemical (analytical) testing to determine soil pH and
resistivity, soluble sulfate and chloride concentrations, and bicarbonate content.
AGE Project No. 190 GS-18-DMarch 8, 2019 (Updated November 27, 2019)Page 8 of 37 Allied Geotechnical Engineers, Inc.

SECTION FOUR GEOLOGIC CONDITIONS
4.0 GEOLOGIC CONDITIONS
4.1 Geologic Setting and Site Physiography
The project alignments are located in Mission Beach, a narrow sandbar situated between the Pacific
Ocean and Mission Bay. The sandbar is underlain by marine sediments which range from
Pleistocene to Holocene in age. Hydraulically placed fill materials were added along the eastern
and southern portions of the sandbar during development of Mission Bay from the 1940's into the
1950's. Shallow mechanically placed fill materials were also encountered in the study area.
4.2 Tectonic Setting
Tectonically, the San Diego region is situated in a broad zone of northwest-trending, predominantly
right-slip faults that span the width of the Peninsular Ranges and extend offshore into the California
Continental Borderland Province west of California and northern Baja California. At the latitude
of San Diego, this zone extends from the San Clemente fault zone, located approximately 60 miles
to the west, and the San Andreas fault located about 95 miles to the east.
Major active regional faults of tectonic significance include the Coronado Bank, San Diego Trough,
San Clemente, and Newport Inglewood/Rose Canyon fault zones which are located offshore; the
faults in Baja California, including the San Miguel-Vallecitos and Agua Blanca fault zones; and the
faults located further to the east in Imperial Valley which include the Elsinore, San Jacinto and San
Andreas fault zones.
AGE Project No. 190 GS-18-DMarch 8, 2019 (Updated November 27, 2019)Page 9 of 37 Allied Geotechnical Engineers, Inc.
SECTION FOUR GEOLOGIC CONDITIONS
4.3 Geologic Units
Based on their origin and compositional characteristics, the soil types encountered in the borings
can be categorized into two geologic units which include (in order of increasing age) fill materials
and old paralic deposits. A brief description of each unit is presented below.
4.3.1 Fill Materials
Hydraulically placed fill materials were encountered in borings B-1 and B-3 to depths of
approximately 10 feet bgs. The hydraulic fill generally consists of fine to medium grained sand with
silt and containing scattered sub-rounded gravel. During the field investigation we met refusal in
boring B-3 on a large buried rock or concrete at a depth of 3 feet bgs. We moved approximately
10 feet to the east and re-drilled to the target depth.
Mechanically placed fill materials on the order of 12 inches or less in thickness were encountered
in infiltration test holes P-1 thru P-4. These materials generally consist of silty sands and organic-
rich topsoil for lawns and street trees. Documentation pertaining to the original placement of the
fill materials is unavailable.
Fill materials were also encountered in SCS&T (2019) borings P-1 through P-3 which are located
along Mission Boulevard to depth ranging between 2 to 5 feet bgs. Fill materials were encountered
in SCS&T (2019) boring P-4 to the maximum depth of exploration of 21.5 feet bgs. The fill
materials encountered in SCS&T (2019) borings posses the same consistency as those encountered
in AGE’s borings.
AGE Project No. 190 GS-18-DMarch 8, 2019 (Updated November 27, 2019)Page 10 of 37 Allied Geotechnical Engineers, Inc.

SECTION FOUR GEOLOGIC CONDITIONS
4.3.2 Old Paralic Deposits
Late to mid-Pleistocene age old paralic deposits (Kennedy and Tan, 2008) were encountered below
fill materials in borings B-1 and B-3, and below paving in borings B-2 and B-4 to the maximum
depth of exploration. These deposits are generally described as poorly sorted, moderately
permeable, reddish brown interfingered strandline, beach, estuarine and colluvial deposits composed
of siltstone, sandstone and conglomerate resting on a now emergent wave-cut platform preserved
by regional uplift (Kennedy and Tan, 2008). The deposits can generally be excavated with
conventional heavy duty construction equipment. Although not encountered during the field
exploration, localized conglomerate layers may present difficult excavation conditions.
The old paralic deposits encountered in our test borings generally consisted of fine-to medium
grained sands and silty sands with scattered to trace amounts of sub-rounded gravel and shell
fragments. The soil deposits are generally uncemented, damp to wet, and in a medium dense to
dense condition.
Old paralic deposits were encountered below the fill materials in SCS&T (2019) borings P-1 and
P-3 to the maximum depth of exploration which ranges between 20.5 and 21 feet bgs. The old
paralic deposits encountered in SCS&T (2019) borings posses the same consistency as those
encountered in AGE’s borings.
4.4 Groundwater
At the time of our field investigation, groundwater was measured in the soil borings and test holes
at depths ranging from 3 feet to 11 feet bgs (approximate elevations -2 feet to +7 feet msl). Tidal
coefficients in Mission Bay (Quivira Basin) on the days of the field exploration based on National
Oceanic and Atmospheric Administration (NOAA) data are shown on the next page.
AGE Project No. 190 GS-18-DMarch 8, 2019 (Updated November 27, 2019)Page 11 of 37 Allied Geotechnical Engineers, Inc.

SECTION FOUR GEOLOGIC CONDITIONS
Date
Low Tide High Tide
TimeHeight (MLLW)
Height (MSL)Time
Height (MLLW)
Height (MSL)
02/11/2019 7:34 am -1.7 feet
-4.5 feet
1:03 pm +3.0 feet
+ 0.2 feet
02/12/2019 9:15 am -1.5 feet
-4.3 feet
3:07 pm +2.6 feet
+0.2 feet
02/13/2019 10:47 am -0.9 feet
-3.7 feet
5:18 pm +2.7 feet
-0.1 feet
No groundwater was encountered in infiltration hole P-4. Fill and formational materials
encountered in the soil borings and infiltration test holes are generally considered to possess very
high permeability characteristics. Based on the anticipated depth of excavations, it is anticipated
that groundwater will be encountered along the project alignments during construction.
Groundwater was encountered in borings SCS&T (2019) borings between elevations + 1 and +2 feet
msl. Monitoring with vibrating wire piezometer between March 5 and April 9l 2019 inside the
borings indicate groundwater level fluctuation on the order of 0.5 to 0.75 foot.
Groundwater flow rate is anticipated to be low due to the flat topography. Depending on the
locations within the project study area, groundwater flow is anticipated to be toward the Pacific
Ocean or San Diego Bay. Based on the results of our study, shallow groundwater and highly
permeable soil materials are present beneath the project alignment. Given these site conditions,
significant groundwater inflows can be expected in anticipated deep excavations required for the
construction project unless adequate engineering measures are taken to mitigate the groundwater
inflow. It must be noted that large variations in the elevation of the groundwater table should be
expected in response to seasonal and tidal fluctuations in San Diego Bay and the Pacific Ocean.
AGE Project No. 190 GS-18-DMarch 8, 2019 (Updated November 27, 2019)Page 12 of 37 Allied Geotechnical Engineers, Inc.

SECTION FIVE DISCUSSIONS, OPINIONSAND RECOMMENDATIONS
5.0 DISCUSSIONS, OPINIONS AND RECOMMENDATIONS
5.1 Potential Geologic Hazards
The majority of the project study area is classified in the City of San Diego Seismic Safety Study
(2008), as Hazard Category 52 - Other Terrain, defined as, “Other level areas, gently sloping to steep
terrain, favorable geologic structure, Low Risk”. The beach area in the eastern portion of the study
area, as well as Mission Point Park in the southeast portion of the study area adjacent to the Mission
Bay Channel is classified as Hazard Category 31 - Liquefaction, defined as, “High potential-
Shallow groundwater, major drainages, hydraulic fills. Neither classifications are anticipated to
affect the proposed project as described herein. Based on a review of the 100% Submittal project
plans prepared by Rick Engineering, the proposed project is not anticipated to destabilize or results
in settlement of adjacent property or the right-of-way.
5.1.1 Faulting
The northwest trending Point Loma fault is mapped 2,000 feet east of the project study area
(Kennedy, 1975; Kennedy and Tan, 2008), This fault is concealed below Mission Bay and Holocene
age fill materials east of the project study area. To the southeast the mapped trace of the fault
crosses the Point Loma peninsula, where it is concealed beneath Pleistocene age old paralic
deposits. The Point Loma fault is classified in the City of San Diego Seismic Safety Study (2008)
as “potentially active, inactive, presumed inactive, or activity unknown.”
For the purpose of this project we consider the Rose Canyon fault zone (RCFZ) to represent the most
significant seismic hazard. The RCFZ is a complex set of anastomosing and en-echelon,
predominantly strike slip faults that extend from off the coast near Carlsbad to offshore south of
downtown San Diego (Treiman, 1993). Previous geologic investigations on the RCFZ in the Rose
AGE Project No. 190 GS-18-DMarch 8, 2019 (Updated November 27, 2019)Page 13 of 37 Allied Geotechnical Engineers, Inc.

SECTION FIVE DISCUSSIONS, OPINIONSAND RECOMMENDATIONS
Creek area (Rockwell et. al., 1991) and in downtown San Diego (Patterson et. al., 1986) found
evidence of multiple Holocene earthquakes. Based on these studies, several fault strands within the
RCFZ have been classified as active faults, and are included in Alquist-Priolo Special Studies
Zones. In San Diego Bay, this fault zone is believed to splay into multiple, subparallel strands; the
most pronounced of which are the Silver Strand, Spanish Bight and Coronado Bank faults.
A study by Kleinfelder (2017) at the San Diego International Airport identified two zones of active
faulting. One of these faults was named the East Bay fault and the second fault was determined to
be a northward extension of the Spanish Bight fault. Recent study by Ninyo & Moore (2018) at
Seaport Village found evidence of recent movement along a fault that was determined to be a
northward extension of the active Coronado fault. The project alignments are not located within
an Alquist-Priolo Earthquake Study Zone.
5.1.2 Fault Ground Rupture & Ground Lurching
There are no known (mapped) active or potentially active faults crossing the project alignments
(Kennedy, 1975; Kennedy and Tan, 2008; City of San Diego, 2008). Therefore, the potential for
fault ground rupture and ground lurching along the project alignments is considered insignificant.
5.1.3 Soil Liquefaction
Seismically-induced soil liquefaction is a phenomenon in which loose to medium dense, saturated
granular materials undergo matrix rearrangement, develop high pore water pressure, and lose shear
strength due to cyclic ground vibrations induced by earthquakes.
AGE Project No. 190 GS-18-DMarch 8, 2019 (Updated November 27, 2019)Page 14 of 37 Allied Geotechnical Engineers, Inc.
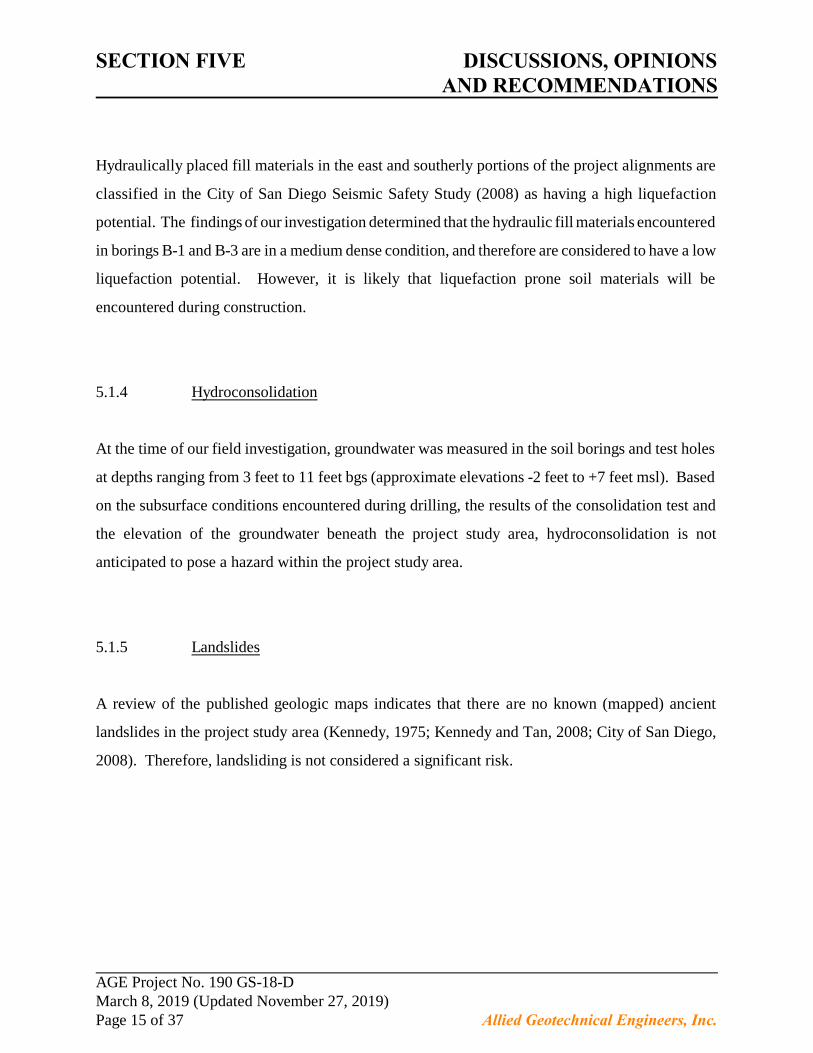
SECTION FIVE DISCUSSIONS, OPINIONSAND RECOMMENDATIONS
Hydraulically placed fill materials in the east and southerly portions of the project alignments are
classified in the City of San Diego Seismic Safety Study (2008) as having a high liquefaction
potential. The findings of our investigation determined that the hydraulic fill materials encountered
in borings B-1 and B-3 are in a medium dense condition, and therefore are considered to have a low
liquefaction potential. However, it is likely that liquefaction prone soil materials will be
encountered during construction.
5.1.4 Hydroconsolidation
At the time of our field investigation, groundwater was measured in the soil borings and test holes
at depths ranging from 3 feet to 11 feet bgs (approximate elevations -2 feet to +7 feet msl). Based
on the subsurface conditions encountered during drilling, the results of the consolidation test and
the elevation of the groundwater beneath the project study area, hydroconsolidation is not
anticipated to pose a hazard within the project study area.
5.1.5 Landslides
A review of the published geologic maps indicates that there are no known (mapped) ancient
landslides in the project study area (Kennedy, 1975; Kennedy and Tan, 2008; City of San Diego,
2008). Therefore, landsliding is not considered a significant risk.
AGE Project No. 190 GS-18-DMarch 8, 2019 (Updated November 27, 2019)Page 15 of 37 Allied Geotechnical Engineers, Inc.

SECTION FIVE DISCUSSIONS, OPINIONSAND RECOMMENDATIONS
5.1.6 Lateral Spread Displacement
The project alignments are located in an area that is flat, therefore, the risk of lateral spread
displacement during a seismic event is considered remote.
5.1.7 Differential Seismic-Induced Settlement
Differential seismic settlement occurs when seismic shaking causes one type of soil to settle more
than another type. It may also occur within a soil deposit with largely homogeneous properties if
the seismic shaking is uneven due to variable geometry or thickness of the soil deposit. Based on
the results of our investigation, it is our opinion that there is a slight potential of differential
settlement in areas underlain by deep hydraulically placed man-made fills.
5.1.8 Secondary Hazards
The project alignments are located within the tsunami inundation zone (California Geological
Survey, 2009). Therefore, there is a high potential of property damage from seismic-induced
tsunamis. The project alignments are located within the Special Flood Hazard Areas, 100- and 500-
year flood zone (FEMA Flood Insurance Rate Map, 2012). Therefore the potential for flooding
along the project alignments is considered high to very high.
AGE Project No. 190 GS-18-DMarch 8, 2019 (Updated November 27, 2019)Page 16 of 37 Allied Geotechnical Engineers, Inc.

SECTION FIVE DISCUSSIONS, OPINIONSAND RECOMMENDATIONS
5.2 Soil Corrosivity
In accordance with the City of San Diego Water Facility Design Guidelines, Book 2, Chapter 7, soil
is generally considered aggressive to concrete if its chloride concentration is greater than 300 parts
per million (ppm) or sulfate concentration is greater than 1,000 ppm, or if the pH is 5.5 or less.
Analytical testing was performed on representative sample of the onsite soil materials to determine
pH, resistivity, soluble sulfate, chlorides and bicarbonates content. The tests were performed in
accordance with California Test Method Nos. 643, 417 and 422. A summary of the test results is
presented in Table 2 below. Copies of the analytical laboratory test data reports are included in
Appendix B.
Table 2
Summary of Corrosivity Test Results
pH
Resistivity
(ohm-cm)
Sulfate Conc.
(ppm)
Chloride Conc.
(ppm)
Bicarbonates Conc.
(ppm)
B-1 Sample No. 4
@14'-15'
8.3 130 1,050 3,630 46
B-2 Sample No. 3
@8'-9'
9.3 3,200 70 50 66
B-3 Sample No.3
@9'-10'
9.3 7,700 30 30 66
B-4 Sample No. 4
@10'-11'
9.2 730 140 620 46
AGE Project No. 190 GS-18-DMarch 8, 2019 (Updated November 27, 2019)Page 17 of 37 Allied Geotechnical Engineers, Inc.
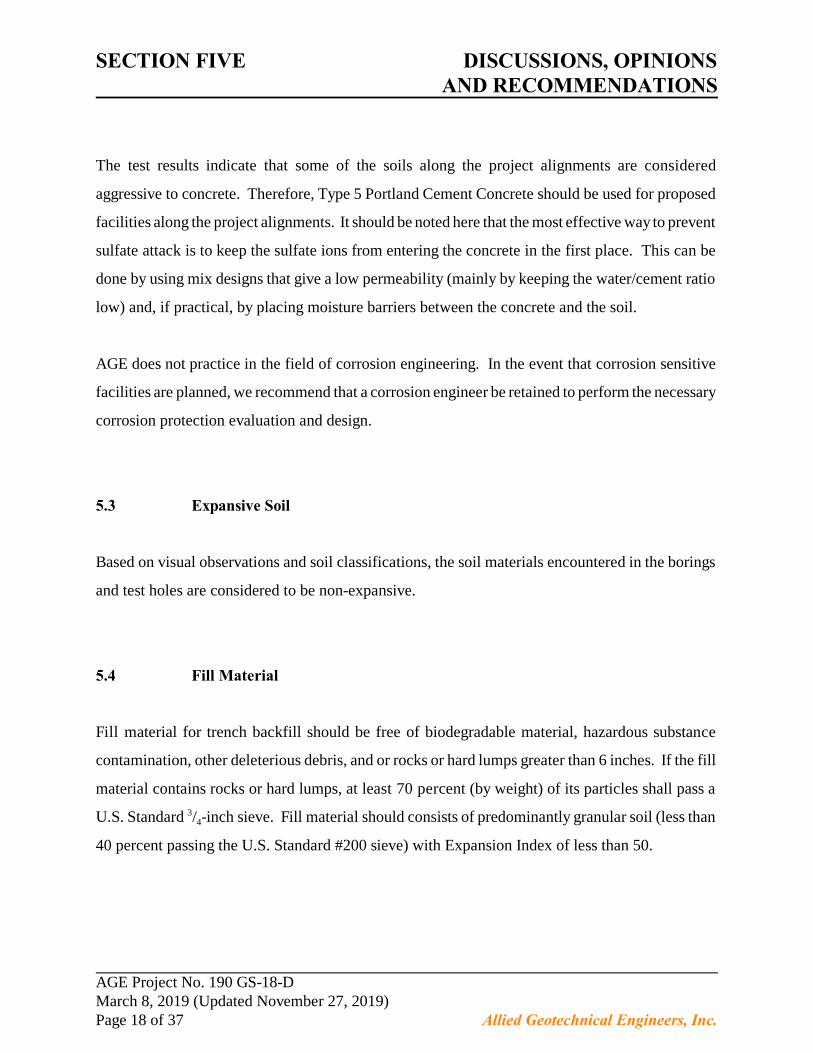
SECTION FIVE DISCUSSIONS, OPINIONSAND RECOMMENDATIONS
The test results indicate that some of the soils along the project alignments are considered
aggressive to concrete. Therefore, Type 5 Portland Cement Concrete should be used for proposed
facilities along the project alignments. It should be noted here that the most effective way to prevent
sulfate attack is to keep the sulfate ions from entering the concrete in the first place. This can be
done by using mix designs that give a low permeability (mainly by keeping the water/cement ratio
low) and, if practical, by placing moisture barriers between the concrete and the soil.
AGE does not practice in the field of corrosion engineering. In the event that corrosion sensitive
facilities are planned, we recommend that a corrosion engineer be retained to perform the necessary
corrosion protection evaluation and design.
5.3 Expansive Soil
Based on visual observations and soil classifications, the soil materials encountered in the borings
and test holes are considered to be non-expansive.
5.4 Fill Material
Fill material for trench backfill should be free of biodegradable material, hazardous substance
contamination, other deleterious debris, and or rocks or hard lumps greater than 6 inches. If the fill
material contains rocks or hard lumps, at least 70 percent (by weight) of its particles shall pass a
4U.S. Standard / -inch sieve. Fill material should consists of predominantly granular soil (less than3
40 percent passing the U.S. Standard #200 sieve) with Expansion Index of less than 50.
AGE Project No. 190 GS-18-DMarch 8, 2019 (Updated November 27, 2019)Page 18 of 37 Allied Geotechnical Engineers, Inc.

SECTION FIVE DISCUSSIONS, OPINIONSAND RECOMMENDATIONS
The majority of the onsite soil materials are considered suitable for use as compacted backfill
materials. It is noted that since the majority of the excavations will extend below the groundwater
level, the majority of the soil materials generated from excavations along the project alignments will
be wet, and will require drying prior to use as trench backfill materials.
5.5 Cut-and-Cover Construction
Since no changes to the existing ground surface along the cut-and-cover segment of the proposed
storm drain pipeline alignment are planned, the net stress change in the underlying soils is
considered negligible. Furthermore, the soils at the proposed invert level along the storm drain
pipeline alignment are expected to provide a stable trench bottom. In the event that loose or
disturbed soils are encountered at the trench bottom, it is recommended that they be over-excavated
and replaced with pipe bedding or other approved materials. The depth of the overexcavation
should be determined during construction by the City’s Resident Engineer. Remedial grading
outside the limit of proposed excavations for the subject project is not anticipated.
5.5.1 Soil and Excavation Characteristics
The materials within the anticipated depths of the storm drain pipe trench excavation will likely be
comprised of materials which can be readily excavated with conventional heavy-duty construction
equipment.
AGE Project No. 190 GS-18-DMarch 8, 2019 (Updated November 27, 2019)Page 19 of 37 Allied Geotechnical Engineers, Inc.

SECTION FIVE DISCUSSIONS, OPINIONSAND RECOMMENDATIONS
5.5.2 Pipe Loads and Settlement
Pipes should be designed for all loads applied by surrounding soils including dead load from soils,
loads applied at the ground surface, uplift loads, and earthquake loads. Soil loading above and
below the groundwater level may be estimated assuming a density of 100 pcf and 130 pcf,
respectively, for properly compacted backfill materials.
Where a pipe changes direction abruptly, resistance to thrust forces can be provided by means of
thrust blocks. For design purposes, for the passive resistance against thrust blocks embedded in
dense formational material and/or properly compacted filled ground, an equivalent fluid density of
200 pcf may be used. Thrust blocks should be embedded a minimum of 3 feet beneath the ground
surface.
Buried flexible pipes are generally designed to limit deflections caused by applied loads. The
deflections can be estimated using the Modified Spangler equation. A modulus of soil reaction, E',
equal to 1,000 and 2,000 psi may be used to represent a minimum of 6 inches of compacted pipe
bedding materials of low plasticity (LL < 50) with less than 12 percent fines passing the #200
standard sieve and crushed rock materials, respectively.
5.5.3 Trench Backfill
Pipe Bedding Zone and Pipe Zone
"Pipe Bedding Zone" is defined as the area below the bottom of the pipe and extending over the full
trench width, and should be at least 6 inches thick in order to provide a uniform firm foundation
material directly beneath the pipe.
AGE Project No. 190 GS-18-DMarch 8, 2019 (Updated November 27, 2019)Page 20 of 37 Allied Geotechnical Engineers, Inc.

SECTION FIVE DISCUSSIONS, OPINIONSAND RECOMMENDATIONS
The "Pipe Zone" is defined as the full width of a trench from the bottom of the pipe to a horizontal
level about 6 inches above the top (crown) of the pipe. In order to provide uniform support and to
minimize external loads, trench widths should be selected such that a minimum clear space of 6
inches is provided on each side of the pipe. During backfilling, it is recommended that the backfill
materials be placed on each side of the pipe simultaneously to avoid unbalanced loads on the pipe.
Backfill materials placed in the "Pipe Bedding Zone" and "Pipe Zone" should consist of clean, free
draining sand or crushed rock. Sand should be free of clay, organic matter, and other deleterious
materials and conform to the gradation shown in the following table.
Sieve Size
Percent Passing
by Weight
(percent)
½ inch 100
#4 75-100
#16 35-75
#50 10-40
#200 0-10
Crushed rock should conform to Section 200-1.2 and 200-1.3 of the Standard Specifications for
Public Works Construction (SSPWC) for 3/4-inch crushed rock gradation. It must be noted that,
since the native soil materials do not meet these specifications, import backfill materials will be
required for the "Pipe Bedding Zone" and "Pipe Zone". If crushed rock is to be used for pipe zone
and bedding backfill materials, we recommend that the rock materials be wrapped in geotextile
filter fabric such as Mirafi 140N or equivalent. The purpose of the filter fabric is to prevent
migration of fine grained materials from the backfill materials, and the sides and bottom of the
trench into the rock bedding materials.
AGE Project No. 190 GS-18-DMarch 8, 2019 (Updated November 27, 2019)Page 21 of 37 Allied Geotechnical Engineers, Inc.

SECTION FIVE DISCUSSIONS, OPINIONSAND RECOMMENDATIONS
Above Pipe Zone
The "Above Pipe Zone" is defined as the full width of the trench from the top of the "Pipe Zone" to
the finish grade or bottom of the pavement section. Backfill material placed in this zone should
meet or exceed the criteria presented in Section 5.4. for either flowable fill or soil backfill.
5.5.4 Placement and Compaction of Backfill
Prior to placement, all soil backfill material should be moisture-conditioned, spread and placed in
lifts (layers) not-to-exceed 6 inches in loose (uncompacted) thickness, and uniformly compacted to
at least 90 percent relative compaction. During backfilling, the soil moisture content should be
maintained at or within 2 to 3 percent above the optimum moisture content of the backfill materials.
The maximum dry density and optimum moisture content of the backfill materials should be
determined in the laboratory in accordance with the ASTM D1557 testing procedures. Field density
testing shall be performed in accordance with either the Sand Cone Method (ASTM D1556) or the
Nuclear Gauge Method (ASTM D2922 and D3017).
Small hand-operated compacting equipment should be used for compaction of the backfill materials
to an elevation of at least 4 feet above the top (crown) of the pipes. Flooding or jetting should not
be used to densify the backfill.
AGE Project No. 190 GS-18-DMarch 8, 2019 (Updated November 27, 2019)Page 22 of 37 Allied Geotechnical Engineers, Inc.

SECTION FIVE DISCUSSIONS, OPINIONSAND RECOMMENDATIONS
5.5.5 Groundwater Bouyant Uplift
AGE has performed a buoyancy analysis for 18-, 30-, 36- and 48-inch diameter RCP pipes and 6-
inch diameter PVC pipes which are proposed for the subject project. The analysis is included in
Appendix C. The results indicate that the RCP and PVC pipes installed as recommended in this
section with crushed rock backfill, within the Pipe Bedding Zone and Pipe Zone, wrapped in
geofabric as described in Section 5.5.3 and minimum 24 inches of cover are not expected to float.
It is our opinion that no additional mitigation measures are required.
5.6 Buried Structures
It is recommended that any proposed buried structures be founded on firm native soils or approved
compacted materials. In areas where loose or soft soils are encountered at the bottom of any
manhole/box structure excavations, it is recommended that the loose/soft materials be removed and
replaced with 3/4-inch crushed rock materials wrapped in geotextile fabric which meets or exceeds
the specifications shown below.
Fabric Property Min. Certified Values Test Method
Grab Tensile Strength 300 lb ASTM D 4632
Grab Tensile Elongation 35% (MAX) ASTM D 4632
Burst Strength 600 psi ASTM D 3786
Trapezoid Tear Strength 120 lb ASTM D 4533
Puncture Strength 130 lb ASTM D 4833
AGE Project No. 190 GS-18-DMarch 8, 2019 (Updated November 27, 2019)Page 23 of 37 Allied Geotechnical Engineers, Inc.

SECTION FIVE DISCUSSIONS, OPINIONSAND RECOMMENDATIONS
The actual extent of over-excavation of any loose/soft soil materials should be evaluated and
determined in the field by the City’s Resident Engineer.
5.6.1 Placement and Compaction of Backfill
Placement and compaction of backfill materials around the buried structures should be performed
in accordance with the recommendations presented in Section 5.5.4 of this report.
5.6.2 Foundations
Bearing Capacity
For design of the buried structures which are founded on firm native soils an allowable soil bearing
capacity of 2,000 psf may be used. In the event that loose and compressible soils are encountered
at the bottom of the excavation for the proposed structures, we recommend that the structures be
supported on a minimum of 24 inches of 3/4-inch crushed rock wrapped in geofabric. This
allowable soil bearing value is for total dead and live loads, and may be increased by one third when
considering seismic loads.
AGE Project No. 190 GS-18-DMarch 8, 2019 (Updated November 27, 2019)Page 24 of 37 Allied Geotechnical Engineers, Inc.

SECTION FIVE DISCUSSIONS, OPINIONSAND RECOMMENDATIONS
Anticipated Settlement
Under static condition, total settlement of the slab foundation is estimated to be less than 0.25 inch.
Differential settlement between the center and the edge of the slab foundation is expected not to
exceed 0.25 inch. No permanent deformation and/or post-construction settlement is anticipated,
provided that backfill around the structures is properly compacted in accordance with the project
specifications.
Resistance to Lateral Loads
Resistance to lateral loads may be developed by a combination of friction acting at the base of the
slab foundation and passive earth pressure developed against the sides of the foundations below
grade. Passive pressure and friction may be used in combination, without reduction, in determining
the total resistance to lateral loads.
An allowable passive earth pressure of 200 psf per foot of foundation embedment below grade may
be used for the sides of foundations placed against competent native soils. A coefficient of friction
of 0.4 may be used for foundation cast directly on competent native soils or crushed rock wrapped
in geofabric.
5.6.3 Walls Below Grade
Lateral earth pressures for walls below grade for structures less than 48 inches in horizontal
dimensions may be treated as a shaft structure. Walls below grade for structures larger than 48
inches in horizontal dimensions should be designed to resist the lateral earth pressures presented in
AGE Project No. 190 GS-18-DMarch 8, 2019 (Updated November 27, 2019)Page 25 of 37 Allied Geotechnical Engineers, Inc.

SECTION FIVE DISCUSSIONS, OPINIONSAND RECOMMENDATIONS
Figures 7 and 8 provided that the wall backfill materials are properly placed and compacted in
conformance with the recommendations presented in this report. Surcharge and foundation loads
occurring within a horizontal distance equal to the wall height should be added to the lateral
pressures as presented in Figures 9 and 10.
Buried structures located below the groundwater table will be subject to buoyant uplift forces.
Geotechnical parameters for use in calculating uplift resistance of the surrounding backfill soil
materials is presented in Figures 11 and 12.
5.7 Infiltration Testing and Basins
AGE attempted to perform infiltration testing in test hole P-4, but was unable to maintain a
consistent free head inside the test hole during the 24-hour pre-soak period. During the test on
February 14, 2019, AGE personnel had to add water into the test hole 24 times over a period of four
(4) hours. The infiltration rate based on the last reading was calculated to be 90 inch per hour.
The 100% Submittal project plans indicate that Basins 1 through 5 will be located in landscaped
areas adjacent to beach access parking facilities on the east and west side of Mission Boulevard to
the north of San Fernando Place. Basins 6 through 8 will be located along the southern edge of the
South Mission Beach Park at the southern end of the project study area. None of the basins are
located in close proximity to existing structures.
AGE Project No. 190 GS-18-DMarch 8, 2019 (Updated November 27, 2019)Page 26 of 37 Allied Geotechnical Engineers, Inc.

SECTION FIVE DISCUSSIONS, OPINIONSAND RECOMMENDATIONS
Infiltrated water flow is anticipated to be toward Mariner Basin for basins 1, 3 and 5, Pacific Ocean
for Basins 2 and 4, and toward Mission Bay for Basins 6, 7 and 8. As discussed under Sections 5.1
through 5.3 of this report, faulting, hydroconsolidation, landslide and expansive soil are not
considered to pose as hazards within the project study area. The project study area covers relatively
level area with no measurable slopes and the basins are not located adjacent to any filled or cut
slopes. Therefore, the potential for slope instability within the project area is considered very low.
Hydraulically placed fill materials in the east and southerly portions of the project study area are
classified in the City of San Diego Seismic Safety Study (2008) as having a high liquefaction
potential. The findings of our investigation determined that the hydraulic fill materials encountered
in borings B-1 and B-3 are in a medium dense condition, and therefore are considered to have a low
liquefaction potential. Furthermore, the groundwater elevation in the area of the proposed basins
at the time of the geotechnical investigation is shallow (3' to 4' below the ground surface). The
groundwater level is already at an elevation of maximum liquefaction potential. Therefore,
additional water infiltration is not anticipated to increase the hazard level.
Basins 6 and 7 are not located in the vicinity of the infiltration tests. However, the borings indicate
the entire project study area is underlain by uniform poorly graded silty sand (SP-SM). Due to the
presence of shallow groundwater, AGE was unable to perform infiltration tests in P-1 through P-3.
However, the rate in P-4 which is located the in the vicinity of Basins 6 and 7 were very high. AGE
was unable to maintain a consistent free head inside the test hole during the 24-hour pre-soak
period. During the test on February 14, 2019, AGE personnel had to add water into the test hole 24
times over a period of four (4) hours. The infiltration rate based on the last reading was calculated
to be 90 inch per hour. The test results indicate that the underlying on-site soil possess very high
infiltration rate. Due to the very high infiltration rate, lateral moisture infiltration beneath existing
pavement is not anticipated. Therefore, soil piping beneath pavement sections and premature
pavement sections failure are not anticipated.
AGE Project No. 190 GS-18-DMarch 8, 2019 (Updated November 27, 2019)Page 27 of 37 Allied Geotechnical Engineers, Inc.

SECTION FIVE DISCUSSIONS, OPINIONSAND RECOMMENDATIONS
The proposed basins are not anticipated to adversely impact the groundwater quality within the
project study area. Vertical distance to the regional groundwater table is anticipated to be less than
10 feet. A search of the Geotracker data base does not reveal the presence of any water supply wells
within 100 feet of the project study area.
AGE Project No. 190 GS-18-DMarch 8, 2019 (Updated November 27, 2019)Page 28 of 37 Allied Geotechnical Engineers, Inc.

SECTION SIX CONSTRUCTION-RELATEDCONSIDERATIONS
6.0 CONSTRUCTION-RELATED CONSIDERATIONS
6.1 Construction Dewatering
Groundwater and flowing sand conditions are anticipated to be encountered at or above the
proposed pipe invert elevations along the project alignments. Because of the anticipated high rate
of transmissivity of the underlying soils along the project alignments and the potential for
encountering flowing sand condition, we recommend that groundwater be kept out of the trenched
excavations using sheet piles in combination with sump pumps. Sheet piles should be extended to
a depth of at least 10 feet below the bottom of the proposed trenched excavations.
The design, installation, and operation of any construction dewatering measures necessary for the
project shall be the sole responsibility of the contractor.
6.2 Temporary Shoring
Since the anticipated pipe invert depths will be more than 4 feet below the ground surface,
prevailing Federal and Cal OSHA safety regulations require that the trenched excavation be either
sloped (if sufficient construction space or easement is available), shored, braced, or protected with
approved sliding trench shield. Limited construction space, the presence of other buried utilities,
and the need to avoid excessive community disruption dictate that a shored excavation will be
needed along the entire pipeline alignment. Design and construction of temporary shoring should
be the sole responsibility of the contractor.
AGE Project No. 190 GS-18-DMarch 8, 2019 (Updated November 27, 2019)Page 29 of 37 Allied Geotechnical Engineers, Inc.

SECTION SIX CONSTRUCTION-RELATEDCONSIDERATIONS
Settlement
Settlement of existing street improvements and/or utilties adjacent to the shoring may occur in
proportion to both the distance between shoring system and adjacent structures or utilities and the
amount of horizontal deflection of the shoring system. Vertical settlement will be maximum
directly adjacent to the shoring system, and decreases as the distance from the shoring increases.
At a distance equal to the height of the shoring, settlement is expected to be negligible. Maximum
vertical settlement is estimated to be on the order of 75 percent of the horizontal deflection of the
shoring system. It is recommended that shoring be designed to limit the maximum horizontal
deflection to 1-inch or less where structures or utilities are to be supported.
It is recommended that pre- and post-construction surveys be conducted to document existing site
conditions. Documentation should include photographic and video surveys of the existing facilities
and site improvements, as well as field surveys of building floors and pavement structures. We
further recommend that a weekly survey of existing utilities be performed during the construction
phase.
Lateral Earth Pressures
Temporary shoring should be designed to resist the pressure exerted by the retained soils and any
additional lateral forces due to loads placed near the top of the excavation. For design of braced
shorings supporting fill materials and old paralic deposits, the recommended lateral earth pressure
should be 32H psf, where H is equal to the height of the retained earth in feet. Any surcharge loads
AGE Project No. 190 GS-18-DMarch 8, 2019 (Updated November 27, 2019)Page 30 of 37 Allied Geotechnical Engineers, Inc.

SECTION SIX CONSTRUCTION-RELATEDCONSIDERATIONS
would impose uniform lateral pressure of 0.3q, where "q" equals the uniform surcharge pressure.
The surcharge pressure should be applied starting at a depth equal to the distance of the surcharge
load from the top of the excavation. In the event that the bottom of the excavation is located below
the groundwater level, hydrostatic pressure should be added to the lateral loads.
The recommended lateral earth pressures have been prepared based on the assumptions that the
shored earth is level at the surface and that the shoring system is temporary in nature.
Lateral Bearing Capacity
Resistance to lateral loads will be provided by passive soil resistance. The allowable passive
pressure for the fill materials and old paralic deposits may be assumed to be equivalent to a fluid
weighing 200 pcf.
6.3 Environmental Considerations
The scope of AGE’s investigation did not include the performance of a Phase I Environmental Site
Assessment (Phase I ESA) to evaluate the possible presence of soil and/or groundwater
contamination beneath the project alignments. During our subsurface investigation soil samples
were field screened for the presence of volatile organics using a RAE Systems MiniRAE 3000
organic vapor meter (OVM). The field screening did not reveal elevated levels of volatile organics
in the samples.
AGE Project No. 190 GS-18-DMarch 8, 2019 (Updated November 27, 2019)Page 31 of 37 Allied Geotechnical Engineers, Inc.

SECTION SIX CONSTRUCTION-RELATEDCONSIDERATIONS
In the event that hazardous or toxic materials are encountered during the construction phase, the
contractor should immediately notify the City and be prepared to handle and dispose of such
materials in accordance with current industry practices and applicable Local, State and Federal
regulations.
AGE Project No. 190 GS-18-DMarch 8, 2019 (Updated November 27, 2019)Page 32 of 37 Allied Geotechnical Engineers, Inc.

SECTION SEVEN GENERAL CONDITIONS
7.0 GENERAL CONDITIONS
7.1 Post-Investigation Services
Post-investigation geotechnical services are an important continuation of this investigation, and we
recommend that the City’s Construction Inspection Division performs the necessary geotechnical
observation and testing services during construction. In the event that the City is unable to perform
said services, it is recommended that our firm be retained to provide the services.
Sufficient and timely observation and testing should be performed during excavation, pipeline
installation, backfilling and other related earthwork operations. The purpose of the geotechnical
observation and testing is to correlate findings of this investigation with the actual subsurface
conditions encountered during construction and to provide supplemental recommendations, if
necessary.
7.2 Uncertainties and Limitations
The information presented in this report is intended for the sole use of Rick engineering and other
members of the project design team and the City for project design purposes only and may not
provide sufficient data to prepare an accurate bid. The contractor should be required to perform an
independent evaluation of the subsurface conditions at the project site prior to submitting his/her
bid.
AGE Project No. 190 GS-18-DMarch 8, 2019 (Updated November 27, 2019)Page 33 of 37 Allied Geotechnical Engineers, Inc.

SECTION SEVEN GENERAL CONDITIONS
AGE has observed and investigated the subsurface conditions only at selected locations along the
project alignments. The findings and recommendations presented in this report are based on the
assumption that the subsurface conditions beneath all project alignments do not deviate substantially
from those encountered in the exploratory test pits. Consequently, modifications or changes to the
recommendations presented herein may be necessary based on the actual subsurface conditions
encountered during construction.
California, including San Diego County, is in an area of high seismic risk. It is generally considered
economically unfeasible to build a totally earthquake-resistant project and it is, therefore, possible
that a nearby large magnitude earthquake could cause damage at the project site.
Geotechnical engineering and geologic sciences are characterized by uncertainty. Professional
judgments and opinions presented in this report are based partly on our evaluation and analysis of
the technical data gathered during our present study, partly on our understanding of the scope of the
proposed project, and partly on our general experience in geotechnical engineering.
In the performance of our professional services, we have complied with that level of care and skill
ordinarily exercised by other members of the geotechnical engineering profession currently
practicing under similar circumstances in southern California. Our services consist of professional
consultation only, and no warranty of any kind whatsoever, expressed or implied, is made or
intended in connection with the work performed. Furthermore, our firm does not guarantee the
performance of the project in any respect.
AGE does not practice or consult in the field of safety engineering. The contractor will be
responsible for the health and safety of his/her personnel and all subcontractors at the construction
site. The contractor should notify the City if he or she considers any of the recommendations
presented in this report to be unsafe.
AGE Project No. 190 GS-18-DMarch 8, 2019 (Updated November 27, 2019)Page 34 of 37 Allied Geotechnical Engineers, Inc.

SECTION EIGHT REFERENCES
8.0 REFERENCES
California Geological Survey, “Tsunami Inundation Map for Emergency Planning, La Jolla
Quadrangle”, map prepared on USGS base map by California Emergency Management
Agency, California Geological Survey, and University of Southern California, dated June
1, 2009.
City of San Diego, Public Works Department, “Standard Drawings for Public Work Construction”,
2012 Edition.
City of San Diego Seismic Safety Study, Geologic Hazards and Faults, Sheet No. 20, 2008
edition.
Department of Conservation, California Geological Survey Regulatory Hazard Zones Maps for
Earthquake Faults, Liquefaction and Landslide Zones, 2009.
Geotracker Data Base - (http://geotracker.waterboards.ca.gov).
International Conference of Building Officials, 1997, Maps of Known Active Fault Near Source
Zones in California and Adjacent Portions of Nevada.
Kennedy, M.P., 1975, Geology of the San Diego Metropolitan Area, California: California Division
of Mines & Geology, Bulletin 200.
Kennedy, M.P., et.al., 1975, Character and Recency of Faulting, San Diego Metropolitan Area,
California: California Division of Mines and Geology, Special Report 123.
AGE Project No. 190 GS-18-DMarch 8, 2019 (Updated November 27, 2019)Page 35 of 37 Allied Geotechnical Engineers, Inc.

SECTION TEN REFERENCES
Kennedy, M.P, and Tan, S.S, 2008, “Geologic Map of the San Diego 30' x 60' Quadrangle,
California”, Digital Preparation by U.S. Geological Survey.
Kleinfelder, “Fault Hazard study, CIP 400002B ADP - Programmatic Document - ADC San Diego
International Airport, San Diego, California”, prepared for San Diego County Regional
Airport Authority, dated May 22, 2017.
Lindvall, S.C., and Rockwell, T.K., 1995, “Holocene Activity of the Rose Canyon fault zone in San
Diego, California” in Journal of Geophysical Research, v. 100, No. B12, pp. 24,121 -
124,132.
Marshall, M., 1989, "Detailed Gravity Studies and the Tectonics of the Rose Canyon--Point Loma--
La Nacion Fault System, San Diego, California" in Proceedings of Workshop on "The
Seismic Risk in the San Diego Region: Special Focus on the Rose Canyon Fault System"
(Glenn Roquemore, et.al, Editors).
Ninyo & Moore, “Fault Hazard Evaluation, World Class Waterfront Development, San Diego,
California” report dated February 26, 2018.
Patterson, R.H., D.L. Schug, and B.E. Ehleringer, 1986, "Evidence of Recent Faulting in Downtown
San Diego, California" in Geological Society of America, Abstracts With Programs, v. 18,
No. 2, p. 169.
Rick Engineering Company, “South Mission Beach WMP, Rec. Improvements: Low SLR (3.6')”,
dated January 2019.
AGE Project No. 190 GS-18-DMarch 8, 2019 (Updated November 27, 2019)Page 36 of 37 Allied Geotechnical Engineers, Inc.

SECTION TEN REFERENCES
Rick Engineering Company, “South Mission Beach WMP, Geotechnical Investigation Locations
Map”, dated 10/2/2018.
Rick Engineering Company, “South Mission Beach, City of San Diego Utility Data”, dated
1/7/2019.
Rick Engineering Company, “Plans for the Construction of South Mission Beach Storm Drain and
Green Infrastructure”, 100% submittal plans, undated.
Rockwell, T.K., et.al., 1991, "Minimum Holocene Slip Rate for the Rose Canyon Fault in SanDiego,
California" in Environmental Perils in the San Diego Region (P.L. Abbott and W.J. Elliott,
editors): San Diego Association of Geologists, pp. 37-46.
Southern California Soil & Testing, “Geotechnical Investigation, Mission Beach Water and Sewer
Replacement, City of San Diego Task #17CD03", unpublished consulting report, dated April
16, 2019.
Treiman, J.A., 1993, “The Rose Canyon Fault Zone, Southern California”, California Division of
Mines and Geology Open File Report No. 93-02.
Standard Specifications for Public Works Construction ("Green Book"), including the Regional
Standards, 2010 Edition.
AGE Project No. 190 GS-18-DMarch 8, 2019 (Updated November 27, 2019)Page 37 of 37 Allied Geotechnical Engineers, Inc.

FIGURES

ALLIED GEOTECHNICAL ENGINEERS, INC.PROJECT NO.190 GS-18-D FIGURE 1
SOUTH MISSION BEACH GREEN INFRASTRUCTURE PROJECTALIGNMENTS MAP

ALLIED GEOTECHNICAL ENGINEERS, INC.PROJECT NO.190 GS-18-D FIGURE 2
LOCATION MAPSOUTH MISSION BEACH GREEN INFRASTRUCTURE PROJECT
40 FEET
Scale Bar
N
P-1
B-1
B-2
C-2
LEGEND
Approximate Infiltration Test Hole Location
Approximate Boring Location
Approximate Pavement Core Location
B-2
C-2
P-1
Mis
sio
n B
lvd
.
San Fernando PL.

ALLIED GEOTECHNICAL ENGINEERS, INC.PROJECT NO.190 GS-18-D FIGURE 3
LOCATION MAPSOUTH MISSION BEACH GREEN INFRASTRUCTURE PROJECT
40 FEET
Scale Bar
N
P-2
B-3
LEGEND
Approximate Infiltration Test Hole Location
Approximate Boring Location
Approximate Pavement Core Location
B-2
C-2
P-1
Mis
sio
n B
lvd
.
Coronado Ct.
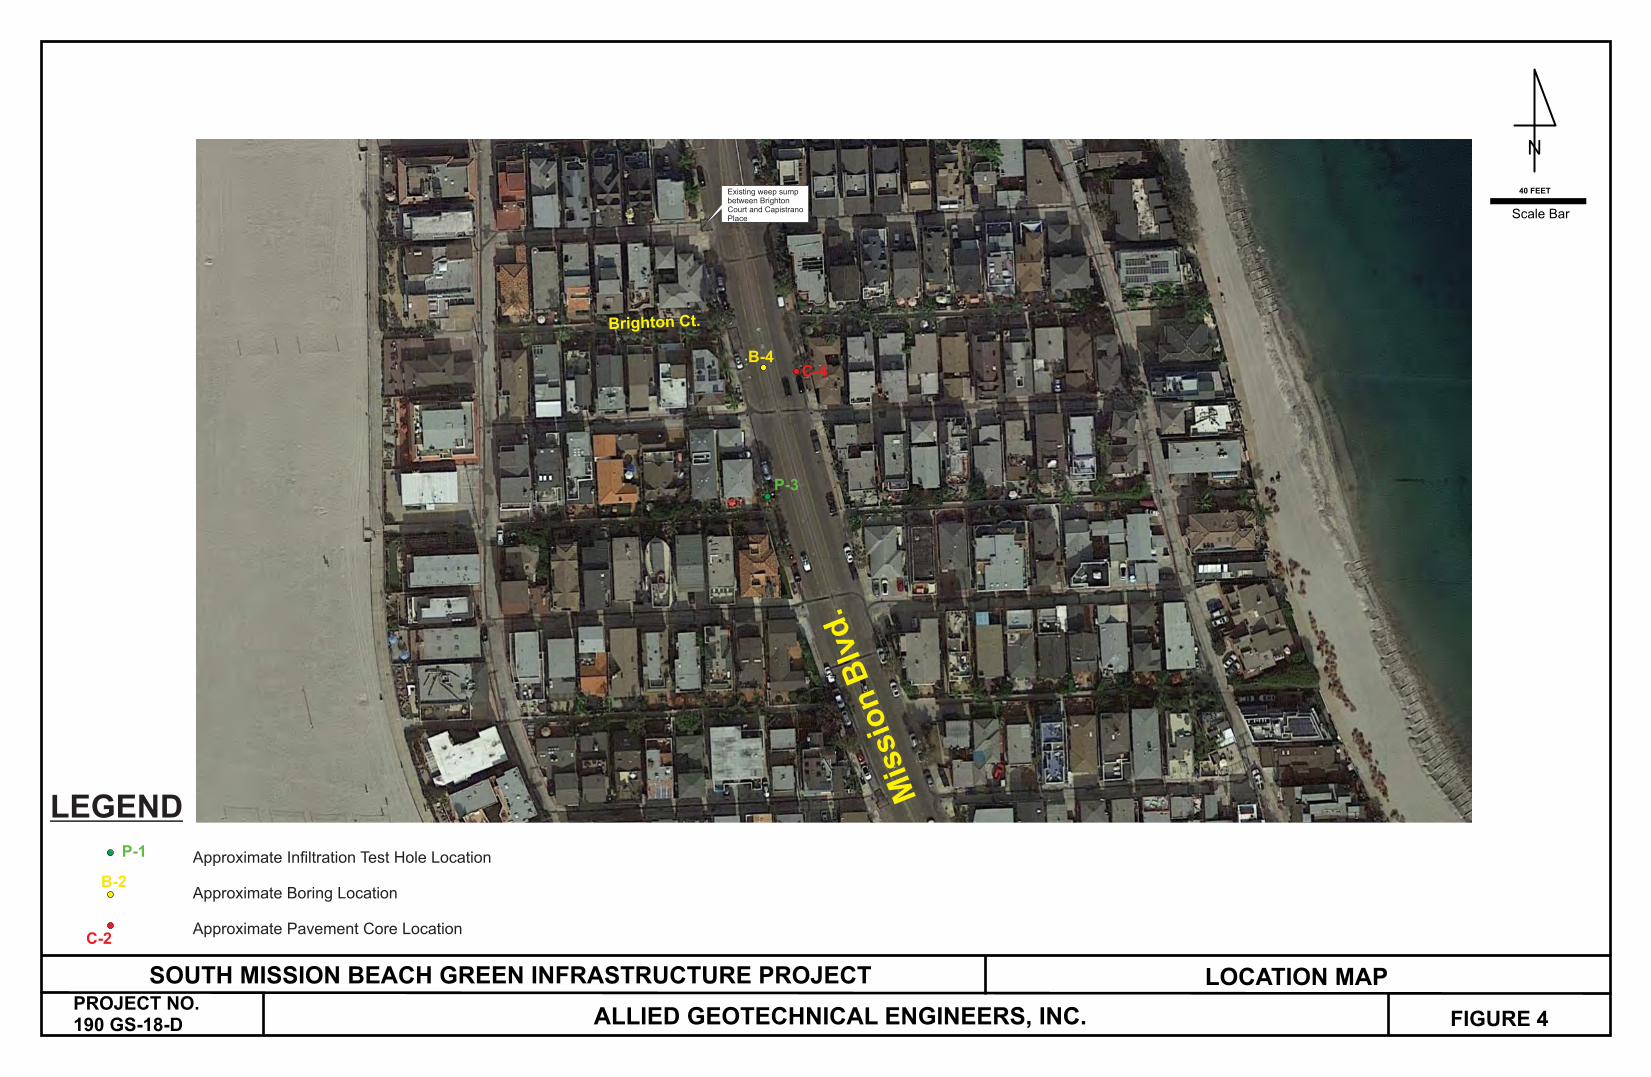
ALLIED GEOTECHNICAL ENGINEERS, INC.PROJECT NO.190 GS-18-D FIGURE 4
LOCATION MAPSOUTH MISSION BEACH GREEN INFRASTRUCTURE PROJECT
40 FEET
Scale Bar
N
LEGEND
Approximate Infiltration Test Hole Location
Approximate Boring Location
Approximate Pavement Core Location
B-2
C-2
P-1
B-4C-4
P-3
Existing weep sumpbetween BrightonCourt and CapistranoPlace
Mis
sio
n B
lvd
.
Brighton Ct.

ALLIED GEOTECHNICAL ENGINEERS, INC.PROJECT NO.190 GS-18-D FIGURE 5
LOCATION MAPSOUTH MISSION BEACH GREEN INFRASTRUCTURE PROJECT
40 FEET
Scale Bar
N
LEGEND
Approximate Infiltration Test Hole Location
Approximate Boring Location
Approximate Pavement Core Location
B-2
C-2
P-1
P-4
Mission Blvd.
Mission Bay Park

ALLIED GEOTECHNICAL ENGINEERS, INC.PROJECT NO.190 GS-18-D FIGURE 6
WEEP SUMP PHOTOGRAPHSOUTH MISSION BEACH GREEN INFRASTRUCTURE PROJECT

LATERAL PRESSURES FOR CANTILEVER WALLSSOUTH MISSION BEACH GREEN INFRASTRUCTURE PROJECT
PROJECT NO.190 GS-18-D
Ignored for shaftconstruction.
FIGURE 7

LATERAL PRESSURES FOR RESTRAINED WALLSSOUTH MISSION BEACH GREEN INFRASTRUCTURE PROJECT
FIGURE 8PROJECT NO.190 GS-18-D
Ignored for shaftconstruction.

FOUNDATION INDUCED WALL PRESSURESOUTH MISSION BEACH GREEN INFRASTRUCTURE PROJECT
FIGURE 9PROJECT NO.190 GS-18-D
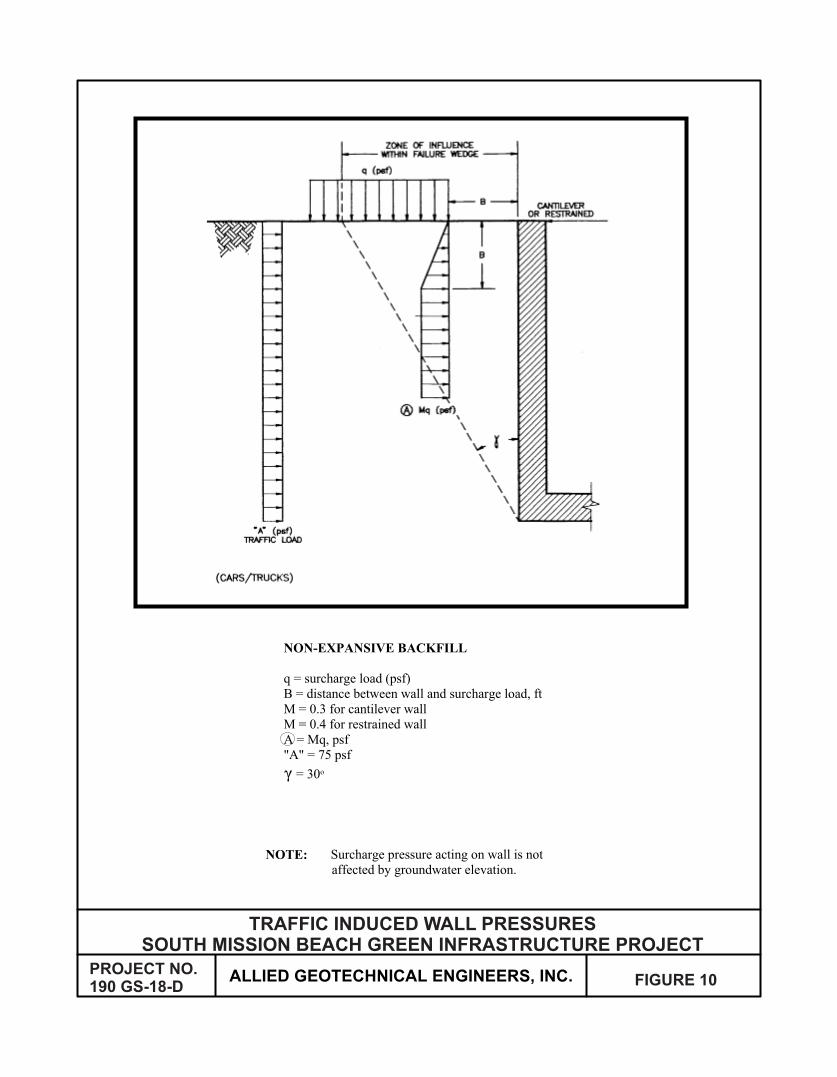
TRAFFIC INDUCED WALL PRESSURESSOUTH MISSION BEACH GREEN INFRASTRUCTURE PROJECT
FIGURE 10PROJECT NO.190 GS-18-D

FIGURE 20
UPLIFT RESISTANCE FOR WALLS WITHOUT EXTENSIONSOUTH MISSION BEACH GREEN INFRASTRUCTURE PROJECT
PROJECT NO.190 GS-18-D FIGURE 11

FIGURE 21 FIGURE 20
UPLIFT RESISTANCE FOR WALLS WITH EXTENSIONSOUTH MISSION BEACH GREEN INFRASTRUCTURE PROJECT
PROJECT NO.190 GS-18-D FIGURE 12

APPENDIX A
FIELD EXPLORATION PROGRAM

Project No. 190 GS-18-DAppendix A, Sheet 1
APPENDIX A
FIELD EXPLORATION PROGRAM
The field exploration program for this project was performed on February 11 and 12, 2019. A totalof four (4) soil borings, four (4) infiltration test holes, and two (2) pavement corings were performedat the approximate locations shown on Figures 2 through 5. In addition, AGE attempted to performinfiltration testing inside an existing weep sump located on the west side of Mission Boulevard, atthe entrance of an alley located between Brighton Court and Capistrano Place. The soil boringswere advanced to depths ranging from 15 feet to 16.5 feet below the existing ground surface (bgs). The infiltration test holes were hand-augured to depths ranging from 36 inches to 63 inches bgs. A brief description of the location and depth, pavement sections, groundwater level, and subsurfaceconditions encountered in the borings and infiltration test holes is presented in Table 1.
Borings B-2 and B-4 which were located in Mission Boulevard were performed with a CME-75truck mounted drill rig. Borings B-1 and B-3 which were located on Mission Bay Park wereperformed with an all-terrain mounted drill rig. The soils encountered in the soil borings werevisually classified and logged by an experienced engineering geologist from AGE. A Key to Logsis presented on Figures A-1 and A-2, and logs of the borings are presented on Figures A-3 thru A-6. The logs depict the various soil types encountered and indicate the depths at which samples wereobtained for laboratory testing and analysis.
Prior to commencement of the field exploration activities, several site visits were performed toobserve existing conditions and to select suitable locations for the soil borings and test holes.Subsequently, Underground Service Alert (USA) was contacted to coordinate clearance of theproposed boring and test hole locations with respect to existing buried utilities. The borings and testholes located in Mission Bay Park were performed in coordination with and with the approval fromthe City of San Diego Parks & Recreation Department.
During drilling, Standard Penetration Tests (SPT) were performed at selected depth intervals. TheSPT tests involve the use of a specially manufactured “split spoon” sampler which is driven adistance of approximately 18 inches into the soils at the bottom of the borehole by dropping a 140-pound weight from a height of 30 inches. The number of blows required to penetrate each 6-inchincrement was counted and recorded on the field logs, and have been used to evaluate the relativedensity and consistency of the materials. The blow counts were subsequently corrected for soil type,hammer model, groundwater and surcharge. The corrected blow counts are shown on the boringlogs.
ALLIED GEOTECHNICAL ENGINEERS, INC.

Project No. 190 GS-18-DAppendix A, Sheet 2
Relatively undisturbed samples were obtained by driving a 3-inch (OD) diameter standard Californiasampler with a special cutting tip and inside lining of thin brass rings into the soils at the bottom ofthe borehole. The sampler is driven a distance of approximately 18 inches into the soil at the bottomof the borehole by dropping a 140-pound weight from a height of 30 inches. A 6-inch long sectionof soil sample that was retained in the brass rings was extracted from the sampling tube andtransported to our laboratory in close-fitting, waterproof containers. The samples were fieldscreened for the presence of volatile organics using a RAE Systems MiniRAE 3000 organic vapormeter (OVM). The OVM readings are indicated on the logs. In addition, loose bulk samples werealso collected.
Infiltration testing inside test hole P-4 was performed using Borehole Percolation Test Methodsdescribed in Appendix F - Storm Water Infiltration/Percolation BMPs of the City of San DiegoGuidelines for Geotechnical Report (2011) and Appendix D - Approved Infiltration RateAssessment Methods of the San Diego Region Model BMP Design Manual (2018).
Upon completion of the drilling, sampling and testing activities, the borings were backfilled usingbentonite grout and/or bentonite chips to approximately 12 inches below the ground surface. Borings B-1 and B-3 which were located at the beach were capped with on-site beach sand. BoringsB-2 and B-4 which were performed in Mission Boulevard were capped with rapid-set concrete tomatch the adjacent pavement surface. Pavement coreholes C-2 and C-4 were also capped withrapid-set concrete to match the adjacent pavement surface. The infiltration test holes werebackfilled with soil cuttings generated during excavation.
ALLIED GEOTECHNICAL ENGINEERS, INC.

190 GS-18-D
Approximate groundwater elevation

190 GS-18-D
Rick Engineering Company
work was
Strata symbols
Poorly graded sandwith silt
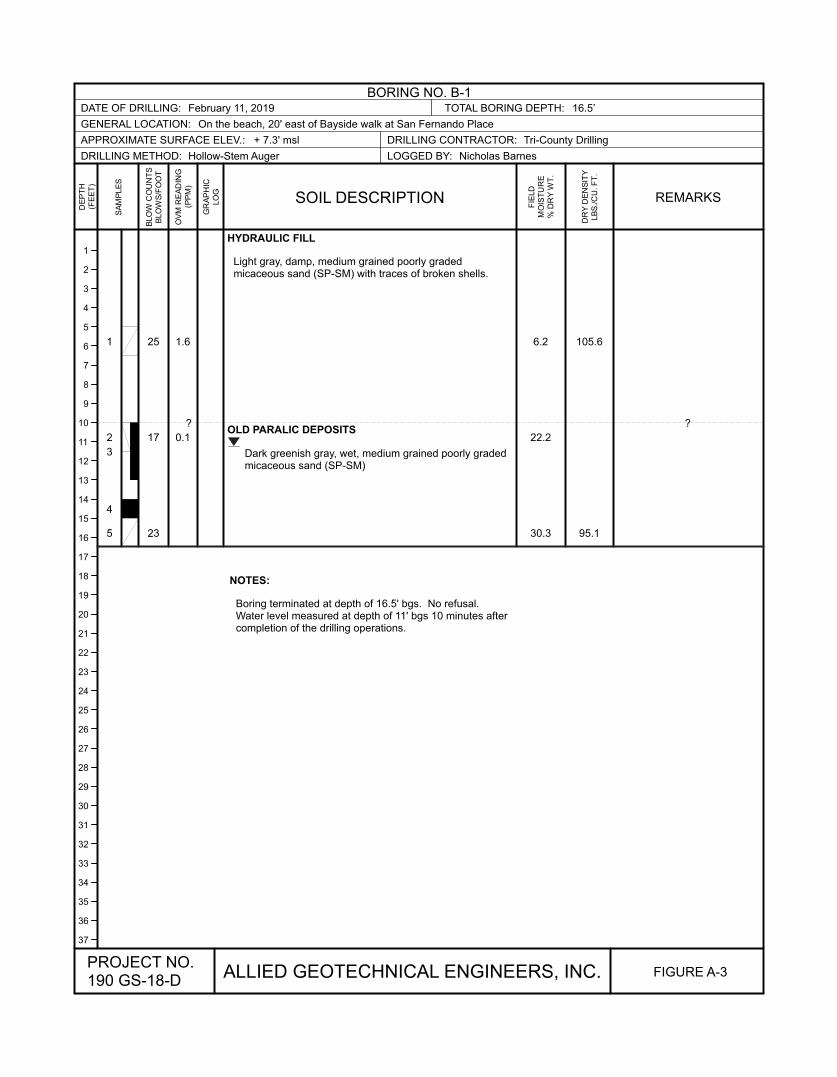
1
2
3
4
5
6
7
8
9
10
11
12
13
14
15
16
17
18
19
20
21
22
23
24
25
26
27
28
29
30
31
32
33
34
35
36
37
1
2
3
4
5
25
17
23
1.6
?
0.1
HYDRAULIC FILL
Light gray, damp, medium grained poorly gradedmicaceous sand (SP-SM) with traces of broken shells.
OLD PARALIC DEPOSITS
Dark greenish gray, wet, medium grained poorly gradedmicaceous sand (SP-SM)
NOTES:
Boring terminated at depth of 16.5' bgs. No refusal.Water level measured at depth of 11' bgs 10 minutes aftercompletion of the drilling operations.
6.2
22.2
30.3
105.6
95.1
?
BORING NO. B-1DATE OF DRILLING: February 11, 2019 TOTAL BORING DEPTH: 16.5’
GENERAL LOCATION: On the beach, 20' east of Bayside walk at San Fernando Place
APPROXIMATE SURFACE ELEV.: + 7.3' msl DRILLING CONTRACTOR: Tri-County Drilling
DRILLING METHOD: Hollow-Stem Auger LOGGED BY: Nicholas Barnes
PROJECT NO.190 GS-18-D
ALLIED GEOTECHNICAL ENGINEERS, INC. FIGURE A-3
DE
PT
H(F
EE
T)
SA
MP
LE
S
BLO
W C
OU
NT
SB
LO
WS
/FO
OT
OV
M R
EA
DIN
G(P
PM
)
GR
AP
HIC
LO
G
SOIL DESCRIPTION
FIE
LD
MO
IST
UR
E%
DR
Y W
T.
DR
Y D
EN
SIT
YLB
S./C
U. F
T.
REMARKS

1
2
3
4
5
6
7
8
9
10
11
12
13
14
15
16
17
18
19
20
21
22
23
24
25
26
27
28
29
30
31
32
33
34
35
36
37
1
2
3
4
5
34
26
PAVEMENT SECTION:
4" A.C. over 8" P.C.C. underlain by 6" of miscellaneous base
OLD PARALIC DEPOSITS
Greenish gray, wet, medium grained poorly-gradedmicaceous sand with silt (SP-SM) with traces of brokenshells.
NOTES:
Boring terminated at depth of 15' bgs. No refusal.Water level measured at depth of 4'-3" bgs at thecompletion of the drilling operation.
26.0
26.3
24.7
BORING NO. B-2DATE OF DRILLING: February 12, 2019 TOTAL BORING DEPTH: 15’
GENERAL LOCATION: Southbound Mission Boulevard, approximately 40' south of San Fernando Place and 4' from median.
APPROXIMATE SURFACE ELEV.: +6.3' msl DRILLING CONTRACTOR: Tri-County Drilling
DRILLING METHOD: Hollow-Stem Auger LOGGED BY: Nicholas Barnes
PROJECT NO.190 GS-18-D
ALLIED GEOTECHNICAL ENGINEERS, INC. FIGURE A-4
DE
PT
H(F
EE
T)
SA
MP
LE
S
BLO
W C
OU
NT
SB
LO
WS
/FO
OT
OV
M R
EA
DIN
G(P
PM
)
GR
AP
HIC
LO
G
SOIL DESCRIPTION
FIE
LD
MO
IST
UR
E%
DR
Y W
T.
DR
Y D
EN
SIT
YLB
S./C
U. F
T.
REMARKS

1
2
3
4
5
6
7
8
9
10
11
12
13
14
15
16
17
18
19
20
21
22
23
24
25
26
27
28
29
30
31
32
33
34
35
36
37
1
2
3
4
5
27
26
?
HYDRAULIC FILL
Greenish gray, wet, fine- to medium-grained poorly gradedmicaceous silty sand (SP-SM)
OLD PARALIC DEPOSITS
Greenish gray, wet, fine- to medium-grained poorly gradedmicaceous silty sand (SP-SM)
NOTES:
Boring terminated at depth of 16.5' bgs. No refusal.Water level measured at depth of 4' bgs at the completionof the drilling operation.
25.5
21.4
24.9
?Heaving sand. No samplerecovery.
BORING NO. B-3DATE OF DRILLING: February 11, 2019 TOTAL BORING DEPTH: 16.5
GENERAL LOCATION: On the beach, 20' east of Bayside walk at Coronado Court
APPROXIMATE SURFACE ELEV.: +5.2' msl DRILLING CONTRACTOR: Tri-County Drilling
DRILLING METHOD: Hollow-Stem Auger LOGGED BY: Nicholas Barnes
PROJECT NO.190 GS-18-D
ALLIED GEOTECHNICAL ENGINEERS, INC. FIGURE A-5
DE
PT
H(F
EE
T)
SA
MP
LE
S
BLO
W C
OU
NT
SB
LO
WS
/FO
OT
OV
M R
EA
DIN
G(P
PM
)
GR
AP
HIC
LO
G
SOIL DESCRIPTION
FIE
LD
MO
IST
UR
E%
DR
Y W
T.
DR
Y D
EN
SIT
YLB
S./C
U. F
T.
REMARKS
First attempt encountered refusal at 3’ bgs and the boringlocation was moved 10 feet to the east.
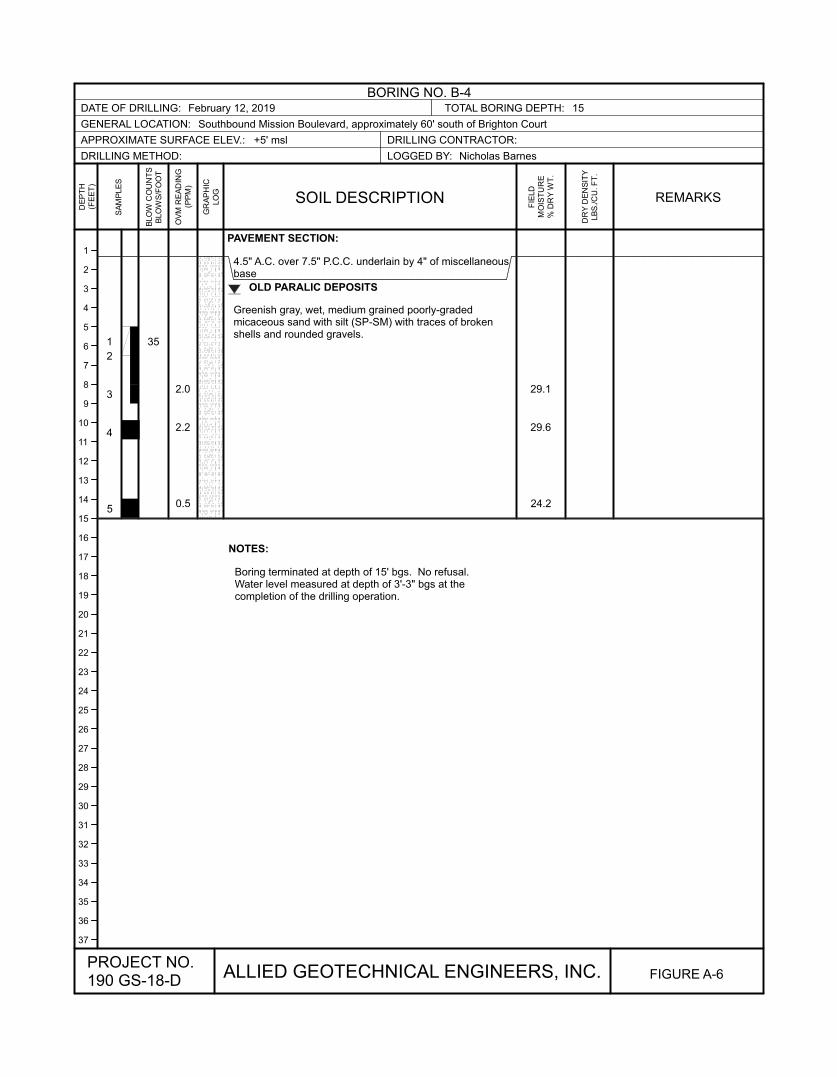
1
2
3
4
5
6
7
8
9
10
11
12
13
14
15
16
17
18
19
20
21
22
23
24
25
26
27
28
29
30
31
32
33
34
35
36
37
1
2
3
4
5
35
2.0
2.2
0.5
PAVEMENT SECTION:
4.5" A.C. over 7.5" P.C.C. underlain by 4" of miscellaneousbase
OLD PARALIC DEPOSITS
Greenish gray, wet, medium grained poorly-gradedmicaceous sand with silt (SP-SM) with traces of brokenshells and rounded gravels.
NOTES:
Boring terminated at depth of 15' bgs. No refusal.Water level measured at depth of 3'-3" bgs at thecompletion of the drilling operation.
29.1
29.6
24.2
BORING NO. B-4DATE OF DRILLING: February 12, 2019 TOTAL BORING DEPTH: 15
GENERAL LOCATION: Southbound Mission Boulevard, approximately 60' south of Brighton Court
APPROXIMATE SURFACE ELEV.: +5' msl DRILLING CONTRACTOR:
DRILLING METHOD: LOGGED BY: Nicholas Barnes
PROJECT NO.190 GS-18-D
ALLIED GEOTECHNICAL ENGINEERS, INC. FIGURE A-6
DE
PT
H(F
EE
T)
SA
MP
LE
S
BLO
W C
OU
NT
SB
LO
WS
/FO
OT
OV
M R
EA
DIN
G(P
PM
)
GR
AP
HIC
LO
G
SOIL DESCRIPTION
FIE
LD
MO
IST
UR
E%
DR
Y W
T.
DR
Y D
EN
SIT
YLB
S./C
U. F
T.
REMARKS

APPENDIX B
LABORATORY TESTING

Project No. 190 GS-18-DAppendix B, Sheet 1
APPENDIX B
LABORATORY TESTING
Selected soil samples were tested in the laboratory to verify visual field classifications and toevaluate certain engineering characteristics. The testing was performed in accordance with theAmerican Society for Testing and Materials (ASTM) or other generally accepted test methods, andincluded the following:
• Determination of in-place moisture content (ASTM D2216). The final test resultsare presented on the test pit logs;
• Determination of in-place dry density and moisture content (ASTM D2937) basedon relatively undisturbed drive samples. The final test results are presented on thetest pit logs;
• Maximum density and optimum moisture content (ASTM D1557). The final testresults are presented on Figures B-1 and B-2;
• Sieve analyses (ASTM D422), and the final test results are plotted as gradationcurves on Figures B-3 and B-4;
• Direct shear test (ASTM D3080). The test results are presented on Figures B-5 andB-6; and
• Consolidation (ASTM D2435). The test results are presented on Figure B-7.
In addition, representative samples of the onsite soil materials were delivered to ClarksonLaboratory and Supply, Inc. for analytical (chemical) testing to determine soil pH and resistivity,soluble sulfate and chloride concentrations, and bicarbonate content. Copies of Clarkson’slaboratory test data reports are included herein.
Representative samples of the soil materials underlying Mission Boulevard were delivered toSouthern California Soil & Testing (SCS&T) for R-Value testing. Copies of SCS&T’s laboratorytest data reports are included herein.
ALLIED GEOTECHNICAL ENGINEERS, INC.

COMPACTION TEST REPORT
Dry
de
nsi
ty, p
cf
109
110
111
112
113
114
Water content, %
6 7.5 9 10.5 12 13.5 15
10.7%, 112.8 pcf
1 2 3 4 5 6
Curve No.
Test Specification:
TESTING DATA
TEST RESULTS Material Description
Remarks:
Project No. Client:
Project:
Source of Sample: B-1 Depth: 10 Sample Number: 2 Checked by:
Allied Geotechnical Engineers, Inc.
Santee, CA
Title:
Figure
ASTM D 1557-91 Procedure A Modified
Wet10 lb.18 in.
five25
0.03333 cu. ft.
#4
22.2 NV
1.0 10.0SP-SM A-3
02/12/201902/21/2019
Nicholas Barnes
Dark greenish gray poorly-graded sand withsilt (SP-SM)
190 GS-18-D Rick Engineering Company
Sani SutantoProject Manager
B-1
Preparation Method
Hammer Wt.
Hammer Drop
Number of Layers
Blows per Layer
Mold Size
Test Performed on Material
Passing Sieve
NM LL PI
Sp.G. (ASTM D 854)
%>#4 %<No.200
USCS AASHTO
Date Sampled
Date Tested
Tested By
WM + WS
WM
WW + T #1
WD + T #1
TARE #1
WW + T #2
WD + T #2
TARE #2
MOISTURE
DRY DENSITY
5932.0 5926.0 5874.0
4034.0 4034.0 4034.0
531.6 520.0 493.9
482.6 466.7 459.5
59.2 71.7 73.2
11.6 13.5 8.9
112.5 110.3 111.8
Maximum dry density = 112.8 pcf
Optimum moisture = 10.7 %
South Mission Beach Project

COMPACTION TEST REPORT
Dry
de
nsi
ty, p
cf
103
104
105
106
107
108
Water content, %
12 13 14 15 16 17 18
14.6%, 106.7 pcf
1 2 3 4 5 6
Curve No.
Test Specification:
TESTING DATA
TEST RESULTS Material Description
Remarks:
Project No. Client:
Project:
Source of Sample: B-3 Depth: 6 Checked by:
Allied Geotechnical Engineers, Inc.
Santee, CA
Title:
Figure
ASTM D 1557-91 Procedure A Modified
Wet10 lb.18 in.
five25
0.03333 cu. ft.
#4
NV
0.1 5.1SP-SM A-3
02/12/201902/21/2019
Nicholas Barnes
Greenish gray poorly graded sand with silt(SP-SM)
190 GS-18-D Rick Engineering Company
Sani SutantoProject Manager
B-2
Preparation Method
Hammer Wt.
Hammer Drop
Number of Layers
Blows per Layer
Mold Size
Test Performed on Material
Passing Sieve
NM LL PI
Sp.G. (ASTM D 854)
%>#4 %<No.200
USCS AASHTO
Date Sampled
Date Tested
Tested By
WM + WS
WM
WW + T #1
WD + T #1
TARE #1
WW + T #2
WD + T #2
TARE #2
MOISTURE
DRY DENSITY
5826.0 5872.0 5876.0
4034.0 4034.0 4034.0
491.0 475.3 486.0
440.0 424.2 428.2
53.6 62.8 62.1
13.2 14.1 15.8
104.7 106.5 105.2
Maximum dry density = 106.7 pcf
Optimum moisture = 14.6 %
South Mission Beach Project

Particle Size Distribution Report
PE
RC
EN
T F
INE
R
0
10
20
30
40
50
60
70
80
90
100
GRAIN SIZE - mm.
0.0010.010.1110100
% +3"Coarse
% Gravel
Fine Coarse Medium
% Sand
Fine Silt
% Fines
Clay
0.8 13.3 74.9 10.0
6 in
.
3 in
.
2 in
.
1½
in.
1 in
.
¾ in
.
½ in
.
3/8
in.
#4
#1
0
#2
0
#3
0
#4
0
#6
0
#1
00
#1
40
#2
00
Test Results (ASTM D 422 & ASTM D 1140)
Opening Percent Spec.* Pass?
Size Finer (Percent) (X=Fail)
Material Description
Atterberg Limits (ASTM D 4318)
Classification
Coefficients
Date Received: Date Tested:
Tested By:
Checked By:
Title:
Date Sampled:Source of Sample: B-1 Depth: 10Sample Number: 2
Client:
Project:
Project No: Figure
Dark greenish gray poorly-graded sand with silt (SP-SM)
0.375#4#8#10#16#30#40#50
#100#200
99.699.098.498.297.894.884.969.027.910.0
NP NV NP
SP-SM A-3
0.4940 0.4263 0.25750.2199 0.1566 0.0998
02/21/2019Nicholas Barnes
Sani SutantoProject Manager
02/12/2019
Rick Engineering CompanySouth Mission Beach Project
190 GS-18-D
PL= LL= PI=
USCS (D 2487)= AASHTO (M 145)=
D90= D85= D60=D50= D30= D15=D10= Cu= Cc=
Remarks
* (no specification provided)
Allied Geotechnical Engineers, Inc.
Santee, CA B-3

Particle Size Distribution Report
PE
RC
EN
T F
INE
R
0
10
20
30
40
50
60
70
80
90
100
GRAIN SIZE - mm.
0.0010.010.1110100
% +3"Coarse
% Gravel
Fine Coarse Medium
% Sand
Fine Silt
% Fines
Clay
0.9 4.9 89.0 5.1
6 in
.
3 in
.
2 in
.
1½
in.
1 in
.
¾ in
.
½ in
.
3/8
in.
#4
#1
0
#2
0
#3
0
#4
0
#6
0
#1
00
#1
40
#2
00
Test Results (ASTM D 422 & ASTM D 1140)
Opening Percent Spec.* Pass?
Size Finer (Percent) (X=Fail)
Material Description
Atterberg Limits (ASTM D 4318)
Classification
Coefficients
Date Received: Date Tested:
Tested By:
Checked By:
Title:
Date Sampled:Source of Sample: B-3 Depth: 6
Client:
Project:
Project No: Figure
Greenish gray poorly graded sand with silt (SP-SM)
#4#8#10#16#30#40#50
#100#200
99.999.199.098.998.194.175.114.5
5.1
NP NV
SP-SM A-3
0.3806 0.3460 0.25270.2279 0.1846 0.15140.1079 2.34 1.25
02/12/2019 02/21/2019Nicholas Barnes
Sani SutantoProject Manager
02/12/2019
Rick Engineering CompanySouth Mission Beach Project
190 GS-18-D
PL= LL= PI=
USCS (D 2487)= AASHTO (M 145)=
D90= D85= D60=D50= D30= D15=D10= Cu= Cc=
Remarks
* (no specification provided)
Allied Geotechnical Engineers, Inc.
Santee, CA B-4

Tested By: Nicholas Barnes
DIRECT SHEAR TEST REPORT
Allied Geotechnical Engineers, Inc.Santee, CA
Client: Rick Engineering Company
Project: South Mission Beach Project
Source of Sample: B-1 Depth: 15Sample Number: 5Proj. No.: 190 GS-18-D Date Sampled: 02/12/2019
Sample Type: RingDescription:
Assumed Specific Gravity= 2.6Remarks:
Figure B-5
Sample No.
Water Content, %
Dry Density, pcf
Saturation, %
Void Ratio
Diameter, in.
Height, in.
Water Content, %
Dry Density, pcf
Saturation, %
Void Ratio
Diameter, in.
Height, in.
Normal Stress, ksf
Fail. Stress, ksf
Displacement, in.
Ult. Stress, ksf
Displacement, in.
Strain rate, in./min.
Initi
al
At T
estSh
ea
r S
tre
ss, ks
f
0
0.5
1
1.5
2
2.5
3
Horiz. Displacement, in.
0 0.05 0.1 0.15 0.2
1
2
3
Fa
il. S
tre
ss, ks
f
0
1
2
3
Normal Stress, ksf
0 1 2 3 4 5 6
C, ksf
f, deg
Tan(f)
Results
0.27
36.5
0.74
1
31.594.1
113.00.7253
2.381.00
0.095.4
0.00.7012
2.380.991.001.020.09
0.008
2
31.095.8
116.00.6944
2.381.00
0.096.8
0.00.6774
2.380.992.001.730.13
0.008
3
30.794.6
111.60.7159
2.381.00
0.095.3
0.00.7039
2.380.993.002.490.12
0.008

Tested By: Nicholas Barnes
DIRECT SHEAR TEST REPORT
Allied Geotechnical Engineers, Inc.Santee, CA
Client: Rick Engineering Company
Project: South Mission Beach Project
Source of Sample: B-4 Depth: 5Sample Number: 1Proj. No.: 190 GS-18-D Date Sampled: 02/11/2019
Sample Type: RingDescription:
Assumed Specific Gravity= 2.6Remarks:
Figure B-6
Sample No.
Water Content, %
Dry Density, pcf
Saturation, %
Void Ratio
Diameter, in.
Height, in.
Water Content, %
Dry Density, pcf
Saturation, %
Void Ratio
Diameter, in.
Height, in.
Normal Stress, ksf
Fail. Stress, ksf
Displacement, in.
Ult. Stress, ksf
Displacement, in.
Strain rate, in./min.
Initi
al
At T
estSh
ea
r S
tre
ss, ks
f
0
1
2
3
4
5
6
Horiz. Displacement, in.
0 0.05 0.1 0.15 0.2
1
2
3
Fa
il. S
tre
ss, ks
f
0
2
4
6
Normal Stress, ksf
0 2 4 6 8 10 12
C, ksf
f, deg
Tan(f)
Results
0.24
43.3
0.94
1
22.0103.1
99.70.5742
2.381.0022.5
105.7109.5
0.53492.380.971.001.210.11
0.008
2
22.1102.8
99.10.5795
2.381.0022.8
105.0108.3
0.54632.380.982.002.060.10
0.008
3
23.1101.4
99.80.6010
2.381.0023.2
102.8104.4
0.57852.380.993.003.090.08
0.008

Tested By: Nicholas Barnes Checked By: Sani Sutanto
CONSOLIDATION TEST REPORT
Perc
ent S
train
4.5
4.0
3.5
3.0
2.5
2.0
1.5
1.0
0.5
0.0
-0.5
Applied Pressure - tsf0.1 1
Natural Dry Dens.LL PI Sp. Gr.
Overburden Pc Cc CrInitial Void
Saturation Moisture (pcf) (tsf) (tsf) Ratio
34.0 % 7.1 % 98.2 2.6 0.1 0.2 0.07 0.543
Dark greenish gray poorly-graded sand with silt (SP-SM)
190 GS-18-D Rick Engineering CompanySouth Mission Beach Project
B-7
MATERIAL DESCRIPTION USCS AASHTO
Project No. Client: Remarks:
Project:
Source of Sample: B-1 Depth: 5 Sample Number: 1Allied Geotechnical Engineers, Inc.
Santee, CA Figure

L A B O R A T O R Y R E P O R T
Telephone (619) 425-1993 Fax 425-7917 Established 1928
C L A R K S O N L A B O R A T O R Y A N D S U P P L Y I N C. 350 Trousdale Dr. Chula Vista, Ca. 91910 www.clarksonlab.com
A N A L Y T I C A L A N D C O N S U L T I N G C H E M I S T S
Date: February 19, 2019 Purchase Order Number: 190GS18-D Sales Order Number: 43345Account Number: ALLGTo: *-------------------------------------------------* Allied Geotechnical Engineers1810 Gillespie Way Ste 104El Cajon, CA 92020Attention: Sani Sutanto
Laboratory Number: SO7200-4 Customers Phone: 449-5900 Fax: 449-5902
Sample Designation: *-------------------------------------------------* One soil sample received on 02/15/19 at 9:00am,from South Mission Beach Green Infrastructure Project marked as B-4#4@10'-11' Analysis By California Test 643, 1999, Department of TransportationDivision of Construction, Method for Estimating the Service Life ofSteel Culverts. pH 9.2
Water Added (ml) Resistivity (ohm-cm)
10 22005 15005 11005 9305 8805 7505 7305 8305 840
27 years to perforation for a 16 gauge metal culvert.35 years to perforation for a 14 gauge metal culvert.48 years to perforation for a 12 gauge metal culvert.62 years to perforation for a 10 gauge metal culvert.75 years to perforation for a 8 gauge metal culvert.
Water Soluble Sulfate Calif. Test 417 0.014% (140 ppm)
Water Soluble Chloride Calif. Test 422 0.062% (620 ppm)
Bicarbonate (as CaCO 3) 46 ppm(on a saturated soil paste extract)
______________________________Laura TorresLT/dbb

L A B O R A T O R Y R E P O R T
Telephone (619) 425-1993 Fax 425-7917 Established 1928
C L A R K S O N L A B O R A T O R Y A N D S U P P L Y I N C. 350 Trousdale Dr. Chula Vista, Ca. 91910 www.clarksonlab.com
A N A L Y T I C A L A N D C O N S U L T I N G C H E M I S T S
Date: February 19, 2019 Purchase Order Number: 190GS18-D Sales Order Number: 43345Account Number: ALLGTo: *-------------------------------------------------* Allied Geotechnical Engineers1810 Gillespie Way Ste 104El Cajon, CA 92020Attention: Sani Sutanto
Laboratory Number: SO7200-3 Customers Phone: 449-5900 Fax: 449-5902
Sample Designation: *-------------------------------------------------* One soil sample received on 02/15/19 at 9:00am,from South Mission Beach Green Infrastructure Project marked as B-3#3@9'-10' Analysis By California Test 643, 1999, Department of TransportationDivision of Construction, Method for Estimating the Service Life ofSteel Culverts. pH 9.3
Water Added (ml) Resistivity (ohm-cm)
10 390005 290005 190005 140005 100005 88005 77005 83005 9300
71 years to perforation for a 16 gauge metal culvert. 92 years to perforation for a 14 gauge metal culvert.127 years to perforation for a 12 gauge metal culvert.162 years to perforation for a 10 gauge metal culvert.198 years to perforation for a 8 gauge metal culvert.
Water Soluble Sulfate Calif. Test 417 0.003% (30 ppm)
Water Soluble Chloride Calif. Test 422 0.003% (30 ppm)
Bicarbonate (as CaCO 3) 66 ppm(on a saturated soil paste extract)
______________________________Laura TorresLT/dbb

L A B O R A T O R Y R E P O R T
Telephone (619) 425-1993 Fax 425-7917 Established 1928
C L A R K S O N L A B O R A T O R Y A N D S U P P L Y I N C. 350 Trousdale Dr. Chula Vista, Ca. 91910 www.clarksonlab.com
A N A L Y T I C A L A N D C O N S U L T I N G C H E M I S T S
Date: February 19, 2019 Purchase Order Number: 190GS18-D Sales Order Number: 43345Account Number: ALLGTo: *-------------------------------------------------* Allied Geotechnical Engineers1810 Gillespie Way Ste 104El Cajon, CA 92020Attention: Sani Sutanto
Laboratory Number: SO7200-2 Customers Phone: 449-5900 Fax: 449-5902
Sample Designation: *-------------------------------------------------* One soil sample received on 02/15/19 at 9:00am, from South Mission Beach Green Infrastructure Project marked as B-2#3@8'-9' Analysis By California Test 643, 1999, Department of TransportationDivision of Construction, Method for Estimating the Service Life ofSteel Culverts. pH 9.3
Water Added (ml) Resistivity (ohm-cm)
10 130005 95005 69005 51005 40005 35005 32005 35005 3600
49 years to perforation for a 16 gauge metal culvert. 64 years to perforation for a 14 gauge metal culvert. 89 years to perforation for a 12 gauge metal culvert.113 years to perforation for a 10 gauge metal culvert.138 years to perforation for a 8 gauge metal culvert.
Water Soluble Sulfate Calif. Test 417 0.007% (70 ppm)
Water Soluble Chloride Calif. Test 422 0.005% (50 ppm)
Bicarbonate (as CaCO 3) 66 ppm(on a saturated soil paste extract)
_____________________________Laura TorresLT/dbb

L A B O R A T O R Y R E P O R T
Telephone (619) 425-1993 Fax 425-7917 Established 1928
C L A R K S O N L A B O R A T O R Y A N D S U P P L Y I N C. 350 Trousdale Dr. Chula Vista, Ca. 91910 www.clarksonlab.com
A N A L Y T I C A L A N D C O N S U L T I N G C H E M I S T S
Date: February 19, 2019 Purchase Order Number: 190GS18-D Sales Order Number: 43345Account Number: ALLGTo: *-------------------------------------------------* Allied Geotechnical Engineers1810 Gillespie Way Ste 104El Cajon, CA 92020Attention: Sani Sutanto
Laboratory Number: SO7200-1 Customers Phone: 449-5900 Fax: 449-5902
Sample Designation: *-------------------------------------------------* One soil sample received on 02/15/19 at 9:00am, from South Mission Beach Green Infrastructure Project marked as B-1#4@14'-15'. Analysis By California Test 643, 1999, Department of TransportationDivision of Construction, Method for Estimating the Service Life ofSteel Culverts. pH 8.3
Water Added (ml) Resistivity (ohm-cm)
20 2705 2205 1405 1305 1305 1305 1305 1405 160
13 years to perforation for a 16 gauge metal culvert.17 years to perforation for a 14 gauge metal culvert.24 years to perforation for a 12 gauge metal culvert.30 years to perforation for a 10 gauge metal culvert.37 years to perforation for a 8 gauge metal culvert.
Water Soluble Sulfate Calif. Test 417 0.105% (1050 ppm)
Water Soluble Chloride Calif. Test 422 0.363% (3630 ppm)
Bicarbonate (as CaCO 3) 46 ppm(on a saturated soil paste extract)
______________________________Laura TorresLT/dbb

In accordance with your request, SCST has performed the subject laboratory testing. Test results are presented in the attached report.
If you have any additional questions or concerns, please contact us at 619.280.4321
Respectfully Submitted,SCST, Inc.
In accordance with your request, SCST has performed the subject laboratory testing. Test results are presented in the attached report.
If you have any additional questions or concerns, please contact us at 619.280.4321
Respectfully Submitted,SCST, Inc.
In accordance with your request, SCST has performed the subject laboratory testing. Test results are presented in the attached report.See RValue 37891.pdf in the documents section at the end of this report.
If you have any additional questions or concerns, please contact us at 619.280.4321
Respectfully Submitted,SCST, Inc.
RValueCal 301, ASTM D2844
3/11/2019Report Date:
SCST, LLC San DiegoLEA: 47, Exp: 04/25/20216280 Riverdale StreetSan Diego, CA 92120Phone: (619) 2804321Fax: (619) 2804717
Client:
Allied Geotechnical Engineering9500 Cuyamaca Street #102Santee, CA 920712685
Project:
180035LAllied Geotechnical 2018 Lab Testing9500 Cuyamaca Street Suite 102 Santee CA9207...
Page 1 of 2Page 1 of 1Page 1 of 4

Job Name: Job Number:Client: Sample No.:Date: By:Location:Description:
A B C D3/5/2019 3/5/2019 3/5/2019
PSI 350 350 350% 0.4 0.4 0.4
GRAMS 850 850 850ML 90 103 84% 10.6 12.2 9.9% 11 12.6 10.3
GRAMS 2983 2985 2979GRAMS 929 944 924
IN 2.49 2.52 2.52PCF 101.8 100.8 100.7PSI 305 245 425PSF 0 0 0PSI 13 13 12PSI 23 24 22
Turns 5.65 5.70 5.6072 71 74
FT 0.4 0.42 0.37FT 0 0 0
0000 0000 00000 0 0
72 71 74
0 0 04.5 4.5 4.5
R-Value at Equivalent 72
Expansion Dial Reading
PH at 2000 PoundsPH at 1000 Pounds
Traffic IndexR-Value by Expansion Pressure
Stabilometer ThicknessR' ValueDisplacement
180035L37891
Weight of Briquette & Tare
Expansion Pressure
Briquette Height
Initial Moisture
Allied Geotechnical 2018 Lab Testing
Test Specimen
Moisture At Compaction
DRBAllied Geotechnical Engineering3/5/2019
Date Tested
CTM 301 Resistance Value of Treated and Untreated Bases, Subbases and Basement Soils
B-4-2 @ 5'-8'Light Tan Sand
72
Soil Wt. Added
N/A
R' Value Modifier
Net Weight of Briquette
Gravel EquivalentR-Value by Exudation PressureCorrected R-Value
Expansion Thickness
Compactor Air Pressure
Exudation PressureDensity
Water AddedWater Added
Page 2 of 4

Job Name:By: DRB Date:Job No.: 180035L Sample No.:Gravel Equ: 0 Plate No.:
Allied Geotechnical 2018 Lab Testing3/5/2019
B-4-2 @ 5'-8'
0
0.1
0.2
0.3
0.4
0.5
0.6
0.7
0.8
0.9
1
1.1
1.2
1.3
1.4
1.5
1.6
1.7
1.8
1.9
2
2.1
2.2
2.3
2.4
0 0.10.20.30.40.50.60.70.80.9 1 1.11.21.31.41.51.61.71.81.9 2 2.12.22.32.42.52.62.72.82.9 3 3.13.23.33.43.53.63.73.83.9 4 4.14.24.34.44.54.64.74.84.9 5
CO
VER
TH
ICK
NES
S B
Y ST
ABIL
OM
ETER
-FEE
T
COVER THICKNESS BY EXPANSION PRESSURE-FEET
EXPANSION PRESSURE CHART
0 1.00.80.60.42 1.2 1.4 1.6 1.8 2.00.2 2.2 2.4 2.6 2.8 3.0 3.2 3.4 3.6 3.8 4.0 4.2 4.4 4.6 4.8 5.0
Page 3 of 4

Job Name:By: DRB Date:Job No.: 180035L Sample No.:R-Value by Ex.: 72 Plate No.:
Allied Geotechnical 2018 Lab Testing3/5/2019
B-4-2 @ 5'-8'
0
10
20
30
40
50
60
70
80
90
100
0100200300400500600700800
R-v
alue
Exudation Pressure (psi)
R-value By Exudation Pressure
Page 4 of 4

In accordance with your request, SCST has performed the subject laboratory testing. Test results are presented in the attached report.
If you have any additional questions or concerns, please contact us at 619.280.4321
Respectfully Submitted,SCST, Inc.
In accordance with your request, SCST has performed the subject laboratory testing. Test results are presented in the attached report.
If you have any additional questions or concerns, please contact us at 619.280.4321
Respectfully Submitted,SCST, Inc.
In accordance with your request, SCST has performed the subject laboratory testing. Test results are presented in the attached report.See RValue 37892.pdf in the documents section at the end of this report.
If you have any additional questions or concerns, please contact us at 619.280.4321
Respectfully Submitted,SCST, Inc.
RValueCal 301, ASTM D2844
3/11/2019Report Date:
SCST, LLC San DiegoLEA: 47, Exp: 04/25/20216280 Riverdale StreetSan Diego, CA 92120Phone: (619) 2804321Fax: (619) 2804717
Client:
Allied Geotechnical Engineering9500 Cuyamaca Street #102Santee, CA 920712685
Project:
180035LAllied Geotechnical 2018 Lab Testing9500 Cuyamaca Street Suite 102 Santee CA9207...
Page 1 of 2Page 1 of 1Page 1 of 4

Job Name: Job Number:Client: Sample No.:Date: By:Location:Description:
A B C D3/5/2019 3/5/2019 3/5/2019
PSI 350 350 350% 0.7 0.7 0.7
GRAMS 910 900 890ML 85 95 108% 9.4 10.6 12.2% 10.1 11.3 12.9
GRAMS 3100 3097 3101GRAMS 986 985 989
IN 2.56 2.53 2.49PCF 106.0 106.0 106.6PSI 675 585 290PSF 0 0 0PSI 14 14 15PSI 24 25 26
Turns 5.00 5.10 5.2074 73 71
FT 0.35 0.39 0.42FT 0 0 0
0000 0000 00002 0 0
76 73 71
0 0 04.5 4.5 4.5
71
Soil Wt. Added
N/A
R' Value Modifier
Net Weight of Briquette
Gravel EquivalentR-Value by Exudation PressureCorrected R-Value
Expansion Thickness
Compactor Air Pressure
Exudation PressureDensity
Water AddedWater Added
180035L37892
Weight of Briquette & Tare
Expansion Pressure
Briquette Height
Initial Moisture
Allied Geotechnical 2018 Lab Testing
Test Specimen
Moisture At Compaction
DRBAllied Geotechnical Engineering3/5/2019
Date Tested
CTM 301 Resistance Value of Treated and Untreated Bases, Subbases and Basement Soils
B-2-2 @ 5'-8'Light Grey Brown Silty Sand
R-Value at Equivalent 71
Expansion Dial Reading
PH at 2000 PoundsPH at 1000 Pounds
Traffic IndexR-Value by Expansion Pressure
Stabilometer ThicknessR' ValueDisplacement
Page 2 of 4
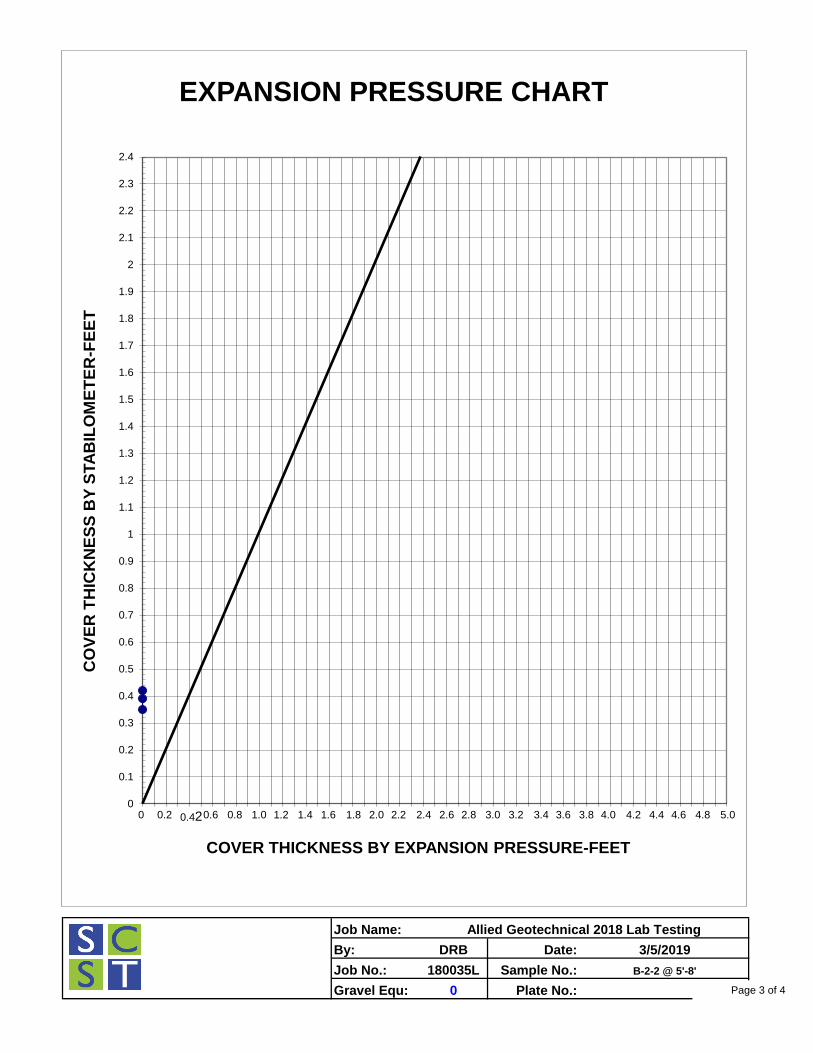
Job Name:By: DRB Date:Job No.: 180035L Sample No.:Gravel Equ: 0 Plate No.:
Allied Geotechnical 2018 Lab Testing3/5/2019
B-2-2 @ 5'-8'
0
0.1
0.2
0.3
0.4
0.5
0.6
0.7
0.8
0.9
1
1.1
1.2
1.3
1.4
1.5
1.6
1.7
1.8
1.9
2
2.1
2.2
2.3
2.4
0 0.10.20.30.40.50.60.70.80.9 1 1.11.21.31.41.51.61.71.81.9 2 2.12.22.32.42.52.62.72.82.9 3 3.13.23.33.43.53.63.73.83.9 4 4.14.24.34.44.54.64.74.84.9 5
CO
VER
TH
ICK
NES
S B
Y ST
ABIL
OM
ETER
-FEE
T
COVER THICKNESS BY EXPANSION PRESSURE-FEET
EXPANSION PRESSURE CHART
0 1.00.80.60.42 1.2 1.4 1.6 1.8 2.00.2 2.2 2.4 2.6 2.8 3.0 3.2 3.4 3.6 3.8 4.0 4.2 4.4 4.6 4.8 5.0
Page 3 of 4

Job Name:By: DRB Date:Job No.: 180035L Sample No.:R-Value by Ex.: 71 Plate No.:
Allied Geotechnical 2018 Lab Testing3/5/2019
B-2-2 @ 5'-8'
0
10
20
30
40
50
60
70
80
90
100
0100200300400500600700800
R-v
alue
Exudation Pressure (psi)
R-value By Exudation Pressure
Page 4 of 4

APPENDIX C
RCP PIPES BUOYANCY CALCULATIONS
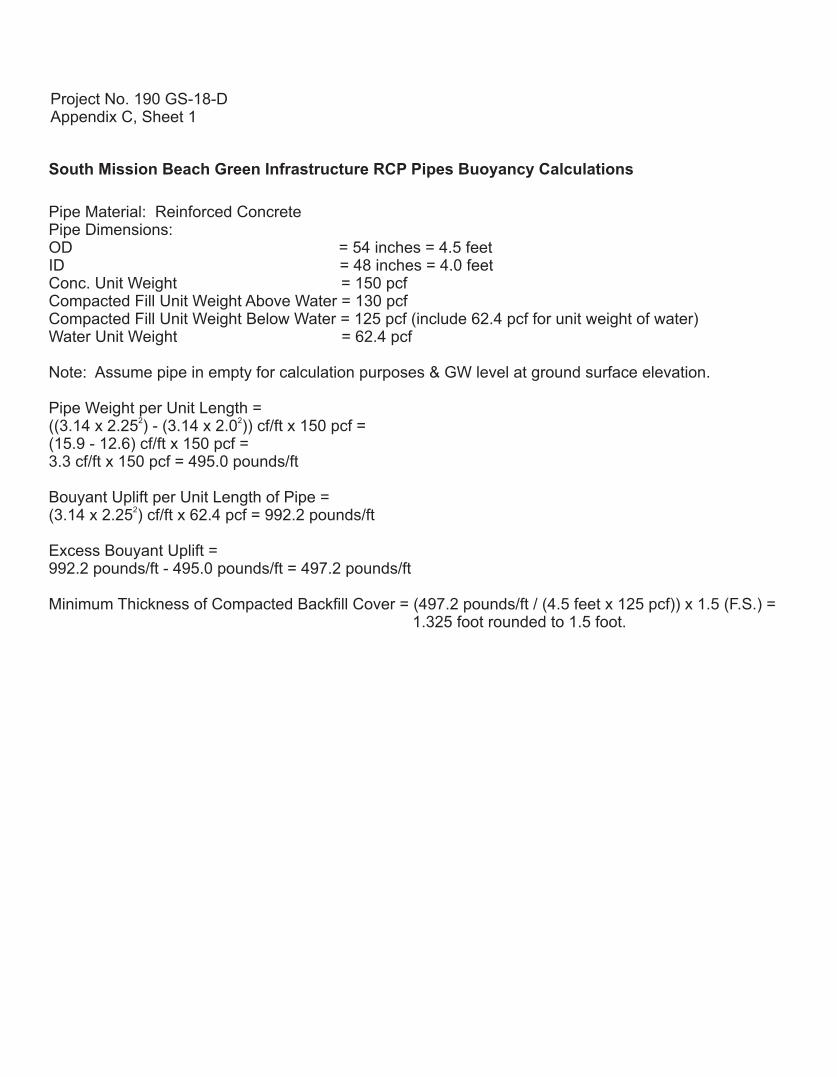
South Mission Beach Green Infrastructure RCP Pipes Buoyancy Calculations
Pipe Material: Reinforced ConcretePipe Dimensions:OD = 54 inches = 4.5 feetID = 48 inches = 4.0 feetConc. Unit Weight = 150 pcfCompacted Fill Unit Weight Above Water = 130 pcfCompacted Fill Unit Weight Below Water = 125 pcf (include 62.4 pcf for unit weight of water)Water Unit Weight = 62.4 pcf
Note: Assume pipe in empty for calculation purposes & GW level at ground surface elevation.
Pipe Weight per Unit Length =2 2((3.14 x 2.25 ) - (3.14 x 2.0 )) cf/ft x 150 pcf =
(15.9 - 12.6) cf/ft x 150 pcf =3.3 cf/ft x 150 pcf = 495.0 pounds/ft
Bouyant Uplift per Unit Length of Pipe =2(3.14 x 2.25 ) cf/ft x 62.4 pcf = 992.2 pounds/ft
Excess Bouyant Uplift =992.2 pounds/ft - 495.0 pounds/ft = 497.2 pounds/ft
Minimum Thickness of Compacted Backfill Cover = (497.2 pounds/ft / (4.5 feet x 125 pcf)) x 1.5 (F.S.) = 1.325 foot rounded to 1.5 foot.
Project No. 190 GS-18-DAppendix C, Sheet 1
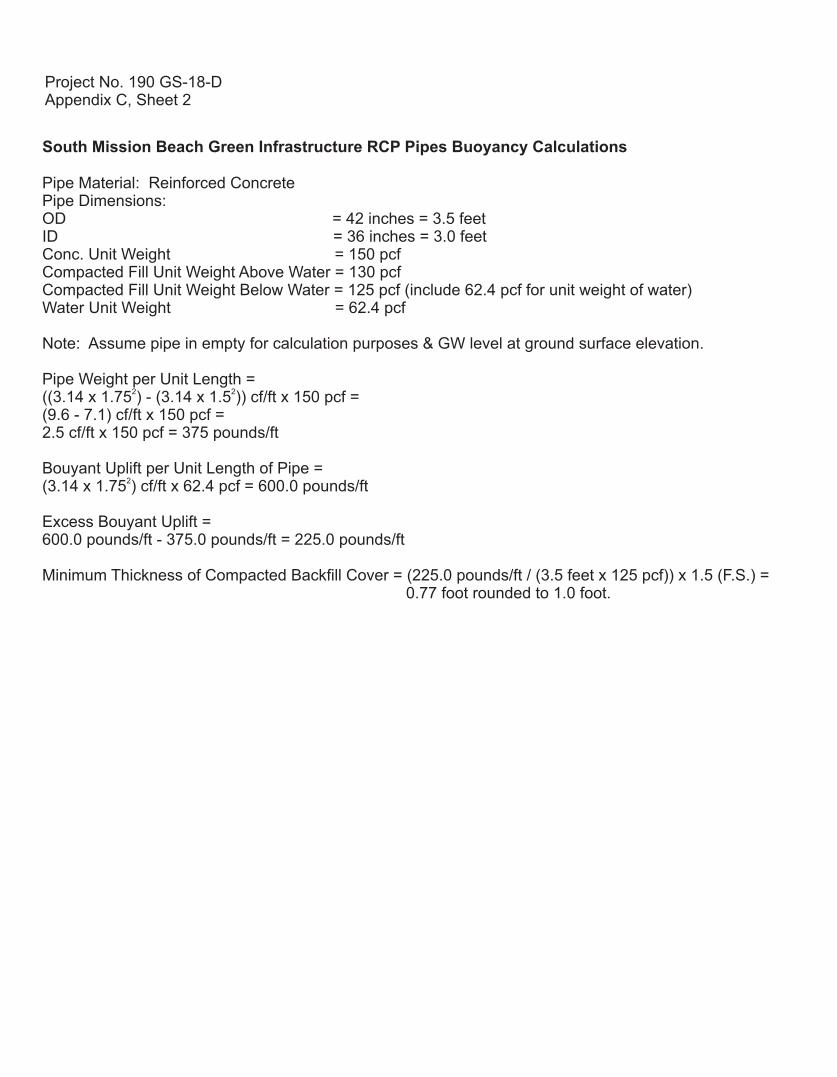
Pipe Material: Reinforced ConcretePipe Dimensions:OD = 42 inches = 3.5 feetID = 36 inches = 3.0 feetConc. Unit Weight = 150 pcfCompacted Fill Unit Weight Above Water = 130 pcfCompacted Fill Unit Weight Below Water = 125 pcf (include 62.4 pcf for unit weight of water)Water Unit Weight = 62.4 pcf
Note: Assume pipe in empty for calculation purposes & GW level at ground surface elevation.
Pipe Weight per Unit Length =2 2((3.14 x 1.75 ) - (3.14 x 1.5 )) cf/ft x 150 pcf =
(9.6 - 7.1) cf/ft x 150 pcf =2.5 cf/ft x 150 pcf = 375 pounds/ft
Bouyant Uplift per Unit Length of Pipe =2(3.14 x 1.75 ) cf/ft x 62.4 pcf = 600.0 pounds/ft
Excess Bouyant Uplift =600.0 pounds/ft - 375.0 pounds/ft = 225.0 pounds/ft
Minimum Thickness of Compacted Backfill Cover = (225.0 pounds/ft / (3.5 feet x 125 pcf)) x 1.5 (F.S.) = 0.77 foot rounded to 1.0 foot.
Project No. 190 GS-18-DAppendix C, Sheet 2
South Mission Beach Green Infrastructure RCP Pipes Buoyancy Calculations

Pipe Material: Reinforced ConcretePipe Dimensions:OD = 36 inches = 3.0 feetID = 30 inches = 2.5 feetConc. Unit Weight = 150 pcfCompacted Fill Unit Weight Above Water = 130 pcfCompacted Fill Unit Weight Below Water = 125 pcf (include 62.4 pcf for unit weight of water)Water Unit Weight = 62.4 pcf
Note: Assume pipe in empty for calculation purposes & GW level at ground surface elevation.
Pipe Weight per Unit Length =2 2
((3.14 x 1.5 ) - (3.14 x 1.25 )) cf/ft x 150 pcf =(7.1 - 4.9) cf/ft x 150 pcf =2.2 cf/ft x 150 pcf = 330.0 pounds/ft
Bouyant Uplift per Unit Length of Pipe =2(3.14 x 1.5 ) cf/ft x 62.4 pcf = 443.0 pounds/ft
Excess Bouyant Uplift =443.0 pounds/ft - 330.0 pounds/ft = 113.0 pounds/ft
Minimum Thickness of Compacted Backfill Cover = (113.0 pounds/ft / (3 feet x 125 pcf)) x 1.5 (F.S.) = 0.452 foot rounded to 0.5 foot.
Project No. 190 GS-18-DAppendix C, Sheet 3
South Mission Beach Green Infrastructure RCP Pipes Buoyancy Calculations

Pipe Material: Reinforced ConcretePipe Dimensions:OD = 22 inches = 1.83 feetID = 18 inches = 1.5 feetConc. Unit Weight = 150 pcfCompacted Fill Unit Weight Above Water = 130 pcfCompacted Fill Unit Weight Below Water = 125 pcf (include 62.4 pcf for unit weight of water)Water Unit Weight = 62.4 pcf
Note: Assume pipe in empty for calculation purposes & GW level at ground surface elevation.
Pipe Weight per Unit Length =2 2((3.14 x 0.915 ) - (3.14 x 0.75 )) cf/ft x 150 pcf =
(2.64 - 1.77) cf/ft x 150 pcf =0.87 cf/ft x 150 pcf = 130.5 pounds/ft
Bouyant Uplift per Unit Length of Pipe =2(3.14 x 0.915 ) cf/ft x 62.4 pcf = 164.7 pounds/ft
Excess Bouyant Uplift =164.7 pounds/ft - 130.5 pounds/ft = 34.2 pounds/ft
Minimum Thickness of Compacted Backfill Cover = (34.2 pounds/ft / (1.83 feet x 125 pcf)) x 1.5 (F.S.) = 0.22 foot rounded to 0.5 foot.
Project No. 190 GS-18-DAppendix C, Sheet 4
South Mission Beach Green Infrastructure RCP Pipes Buoyancy Calculations

Pipe Material: PVC Schedule 40Pipe Dimensions:OD = 6.625 inches = 0.552 feetID = 6.065 inches = 0.505 feetPVC pipe weight per foot of length = 3 lbsCompacted Fill Unit Weight Above Water = 130 pcfCompacted Fill Unit Weight Below Water = 125 pcf (include 62.4 pcf for unit weight of water)Water Unit Weight = 62.4 pcf
Note: Assume pipe in empty for calculation purposes & GW level at ground surface elevation.
Pipe Weight per Unit Length = 3 pounds/ft
Bouyant Uplift per Unit Length of Pipe =2(3.14 x 0.276 ) cf/ft x 62.4 pcf = 14.9 pounds/ft - rounded to 15 pounds/ft
Excess Bouyant Uplift =14.9 pounds/ft - 3.0 pounds/ft = 11.9 pounds/ft
Minimum Thickness of Compacted Backfill Cover = (11.9 pounds/ft / (0.552 feet x 125 pcf)) x 1.5 (F.S.) = 0.25 foot rounded to 0.5 foot.
Project No. 190 GS-18-DAppendix C, Sheet 5
South Mission Beach Green Infrastructure PVC Pipes Buoyancy Calculations