update on international operations financial performance ... · update on international operations...
TRANSCRIPT
UPDATE ON INTERNATIONAL OPERATIONS FINANCIAL PERFORMANCE AND OUTLOOK
JÁNOS SZABÓ Chief Financial Officer

UPDATE ON INTERNATIONAL OPERATIONS

KEY MARKET DEVELOPMENTS
#1 fixed and mobile voice positions
Continued leadership in mobile and fixed BB
Mobile revenues under pressure due to aggressive price competition
Increasing TV market share
Fighting back in residential segment with advanced bundles and focused investments
High level of profitability – EBITDA margin above 40%
MACEDONIA – CURRENT SNAPSHOT
Romania
Bulgaria
Hungary
Croatia
Serbia
Macedonia
Bulgaria
Hungary
Croatia
Macedonia
Hungary
Croatia
BiH Serbia
Albania
Greece
Macedonia
Kosovo
Czech Rep.Slovakia
Austria
Slovenia
Montenegro
Macedonia
Mobile BB 44%
Fixed BB 45%
TV 19%
Mobile voice 48%
Fixed voice 71%
All market share figures as of June 30, 2013 except mobile BB (as of March 31, 2013) 3

MACEDONIA – OPPORTUNITIES IN THE CURRENT CHALLENGING ENVIRONMENT
ALL IP TRANSFORMATION
PSTN to IMS migration
Following the 800 MHz and 1800 MHz spectrum acquisition, LTE launch before YE 2013
EXTENSION OPPORTUNITIES
Customer centric products
Growth potential in near-core (ICT) and non-core (M-wallet) services
INCREASE INTERNAL EFFICIENCY
Legal merger to be completed
New and leaner organization
KEEP MOBILE VOICE MARKET SHARE ABOVE 48% SUCCESSFUL MERGER
4

KEY MARKET DEVELOPMENTS
#1 fixed voice, broadband (mobile and fixed) and TV positions maintained
Leader in the postpaid mobile market
FTTH rollout to maintain long-term competitiveness in BB, TV and 3Play
Stable financial performance despite industry commoditization, competition and SIM and IPTV subscription based taxes
Mobile BB 39%
Fixed BB 82%
TV 41%
Mobile voice 35%
Fixed voice 98%
MONTENEGRO – CURRENT SNAPSHOT
Romania
Bulgaria
Hungary
Croatia
Serbia Bulgaria
Hungary
Croatia
Macedonia
Hungary
Croatia
BiH Serbia
Albania
Greece
Macedonia
Kosovo
Czech Rep.Slovakia
Austria
Slovenia
Montenegro
Montenegro
All market share figures as of June 30, 2013 5

MONTENEGRO – ADDRESSING THE CHALLENGES
INITIATIVES TO DEFEND THE CORE
FTTH rollout
Mobile BB (HSPA/LTE) focus
Evolving 4Play
Multiscreen propositions
GROWTH OPPORTUNITIES IN NEAR AND BEYOND CORE
ICT and cloud solutions
Digital push
M-payment opportunities
Smart Telco (M2M)
INCREASE SALES AND OPERATIONAL EFFICIENCY
Increasing the role of e-care and e-sale
All IP migration
E2E processes review
Cost optimization
2017 TARGET: KEEP REVENUES ABOVE EUR 100MN 2017 TARGET: KEEP EBITDA
ABOVE EUR 40MN
6

Improve sales capacity and productivity
ICT and cloud solutions
Focus on automation and e-care
7
MONTENEGRO – STRATEGIC ANSWERS TO THE CURRENT ENVIRONMENT
e-SALES: 20% SHARE IN 2017 (3% IN 2013)
OVERALL TARGET FOR 2017: KEEP REVENUES ABOVE EUR 100M
First choice provider for digital lifestyle and business solutions
Flexible and lean operating model to succeed in fast-changing world
New organizational model with reinforced performance culture
State-of-the-art IT infrastructure
Cost optimization
Exploit M2M opportunities
Future organizational model based on lean, functionally oriented organization
Effective performance managment system
Minimized bureacracy
e-COMPANY: 50% LESS PAPER UNTIL 2017
LEAN AND EFFICIENT OPERATION
FINANCIAL PERFORMANCE AND OUTLOOK

DIVIDEND POLICY MAINTAINED
8
DIVIDEND POLICY MAINTAINED
Maintain net debt ratio (net debt/total capital) target of 30% - 40% reflecting the current unpredictable environment
Dividend payment potential dependent on upcoming frequency auction
DIVIDEND PAYMENT AND POLICY
74
50 50 50
0%
10%
20%
30%
40%
50%
0
10
20
30
40
50
60
70
80
Dividend per share (HUF) Net debt ratio
2012
34.3%
2011
34.1%
2010
32.7%
2009
30.8%
June 2013
41.8%
Dividend payment Net debt ratio
Target
8

GROUP REVENUE DEVELOPMENTS
EVOLVING SALES MIX DRIVING REVENUE GROWTH
9
Core ca. 56%
Near core ca. 26%
Beyond core ca. 18%
Core ca. 84%
Near core ca. 16%
0
200
400
600
800
CAGR: ca. +2%
HUF bn
CAGR: 0%
2017E 2014E 2012 2010
Fixed voice
TV Mobile voice
Fixed BB
Mobile BB
Other core SI/IT
Equipment (fixed and mobile)
Beyond core (incl. energy)
9

DISCIPLINED COST MANAGEMENT, DECLINING CAPEX
0
250
200
150
100
50
CAGR: ca. -2% CAGR: -4%
2017E 2012 2010
HUF bn
INDIRECT OPEX* DEVELOPMENTS
*Indirect OPEX excluding D&A, SEC/DOJ investigation-related costs, special, telecom and utility taxes **Capex excluding spectrum license fees
100
80
60
40
20
0
HUF bn
2017E 2014E
CAGR: ca. -3%
2012
CAPEX** DEVELOPMENTS
10
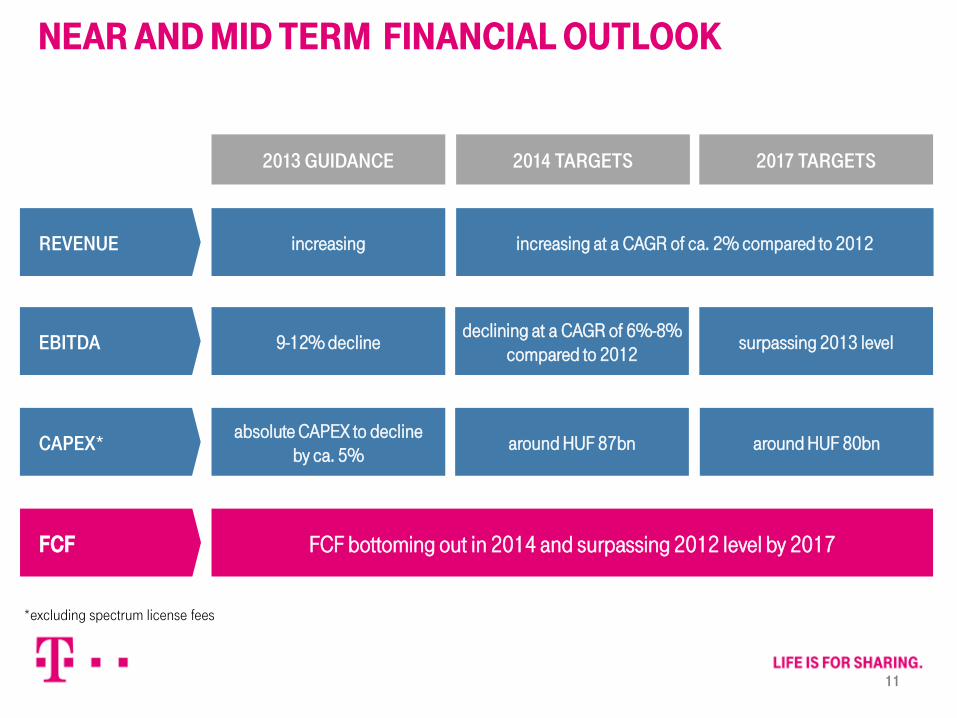
NEAR AND MID TERM FINANCIAL OUTLOOK
REVENUE
EBITDA
CAPEX*
increasing at a CAGR of ca. 2% compared to 2012
surpassing 2013 level
around HUF 80bn
declining at a CAGR of 6%-8% compared to 2012
around HUF 87bn
**excluding spectrum license fee
increasing
9-12% decline
absolute CAPEX to decline by ca. 5%
2013 GUIDANCE 2014 TARGETS 2017 TARGETS
FCF FCF bottoming out in 2014 and surpassing 2012 level by 2017
*excluding spectrum license fees
11

This presentation contains forward-looking statements. Statements that are not historical facts, including statements about our beliefs and expectations, are forward-looking statements. These statements are based on current plans, estimates and projections, and therefore should not have undue reliance placed upon them. Forward-looking statements speak only as of the date they are made, and we undertake no obligation to update publicly any of them in light of new information or future events. Forward-looking statements involve inherent risks and uncertainties. We caution you that a number of important factors could cause actual results to differ materially from those contained in any forward-looking statement. Such factors are described in, among other things, our annual financial statements for the year ended December 31, 2012, available on our website at http://www.telekom.hu which have been prepared in accordance with International Financial Reporting Standards (“IFRS”) as issued by the International Accounting Standards Board (“IASB”) and adopted by the European Union.
Abbreviations: #: Number, 2G: Second Generation, 3G: Third Generation, 4G: Fourth Generation, ADSL: Asymmetric Digital Subscriber Line, App.: Application, ARPU: Average Revenue Per User, AVG: Average, B2B2C: Business to Business to Consumer, BB: Broadband, Bn: Billion, CAGR: Compound Annual Growth Rate, CAPEX: Capital Expenditures, COAX: Coaxial Cable, CRM: Customer Relationship Management, DL: Downlink, DPS: Dividend per Share, DT: Deutsche Telekom, E2E: End-to-End, EBITDA: Earnings Before Interest, Taxes, Deprecation and Amortization, EDGE: Enhanced Data for Global Evolution, ERP: Enterprise Resource Planning FCF: Free Cash Flow, FDD: Frequency-Division Duplexing, FTTB: Fiber to the Building, FTTC: Fiber to the Cabinet, FTTH: Fiber to the Home, GDP: Gross Domestic Product, GSM: Global System for Mobile communication, GPRS: General Pocket Radio Service, H1: First half, HH: Household, HSPA: High-Speed Packet Access, HUF: Hungarian Forint, HW: Hardware, ICT: Info-Communication Technology, IMS: IP Multimedia Subsystem, IP: Internet protocol, IT: Information technology, K: Thousand, KPI: Key Performance Indicator, LTE: Long Term Evolution, Min: minute, M2M: Machine-to-Machine, M-: Mobile-, Mbps: Mega Bit Per Second, MHz: Mega Hertz, Mn: Million, OPEX: Operating Expenses, OS: Operating System, OTT: Over The Top, PSTN: Public Switched Telephone Network, SAT: Satellite, SI: System Integration, SIM: Subscriber Identity Module, SMB: Small Medium Enterprises, SOHO: Small office home office, SW: Software, T2M: Time to Market, TDD: Time-Division Duplexing, TV: Television, TWM: Total Workforce Management, UL: Uplink, UMTS: Universal Mobile Telecommunication System, USP: Universal Service Provider, VDSL: Very high bit rate Digital Subscriber Line, yr: year