upcycling of solid inorganic household...
TRANSCRIPT

UPCYCLING OF SOLID INORGANIC HOUSEHOLD WASTE
TO CREATE INSPIRED PRODUCTS TO MINIMIZE
ENVIRONMENTAL DEGRADATION
A research paper is submitted in the partial fulfillment of
the requirements for the degree of
B.A in Design, University of Nairobi
by
CHEGE IVY NYAGUTHII
B05/29049/2009
FEBRUARY 2013

2 | P a g e
DECLARATION
This project is my original work and has not been presented for a degree in any other
university or institution, I submit it partial fulfilment for the degree in Bachelor of Arts in
Design. School of the Arts and Design,The University of Nairobi, 2013.
Chege Ivy Nyaguthii
………………………. ………………………… ………………………….
CACIDATE SIGNATURE DATE
Dr.Mwituria Wa Maina
………………………. ………………………… ………………………….
SUPERVISOR SIGNATURE DATE
Dr.Onyango Walter H.
………………………. ………………………… ………………………….
DIRECTOR SIGNATURE DATE

3 | P a g e
Acknowledgements
I would like to acknowledge my supervisor Dr.Mwituria Maina for his dedicated support and
guidelines which were a useful precursor to this research paper. Dr.Lilac Osanjo for the
critique and letting me tag along to the EPC workshop that provided insight for my research
paper. I would like to extend my heartfelt gratitude to my family and friends who encouraged
me in one way or another throughout the research. Above all, glory to God for keeping me to
this day.

4 | P a g e
Abstract:
The researcher seeks to identify ways in which he/she can convert waste materials or useless
products that we dispose on a day to day basis into new materials or products of better quality
or for better environmental and aesthetic value. More value. Let‟s think about that for a
second. How often do you throw away plastic shopping bags, old clothes, or anything else
that you‟re “done with” without giving it a second thought? Fairly often. Because you think,
as we‟ve been trained to think, that once an objects intended use is complete that it no longer
has value. But what many of us don‟t realize is that in this day and age we just can‟t afford to
throw things away – neither our wallets, nor our environment can afford that kind of waste.

5 | P a g e
Table of Contents
1. Introduction to the Study................................................................................................................. 8
1.2 Overview ................................................................................................................................. 8
1.3 Statement Of The Problem ................................................................................................... 10
1.4 Aim of the Study ................................................................................................................... 10
1.5 Objective of the Study .......................................................................................................... 10
1.6 Research questions ............................................................................................................... 10
1.6.1 Main research question; ............................................................................................... 10
1.6.2 Other research questions; ............................................................................................. 10
1.7 Hypotheses ........................................................................................................................... 11
1.8 Significance Of The Study ...................................................................................................... 11
1.9 Limitations............................................................................................................................. 11
1.10 Definition of terms ................................................................................................................ 12
CHAPTER 2 ......................................................................................................................................... 14
2 LITERATURE REVIEW ............................................................................................................. 14
2.1 Overview ............................................................................................................................... 14
2.2 Product Life Assessment ....................................................................................................... 15
The Choice of Materials ................................................................................................................ 15
The manufacturing process ........................................................................................................... 16
The finished product ..................................................................................................................... 16
Transporting the product ............................................................................................................... 17
2.3 Product Assessment (victor Papanek, 1995) ........................................................................ 17
2.3.1 Environmental issues in Life Cycle Assessment .......................................................... 18
2.4 SOLID WASTE MANAGEMENT IN NAIROBI SURVEY: A SITUATION ANALYSIS (Prepared by:
Allison Kasozi and Harro von Blottnitz, Environmental & Process Systems Engineering Group,
University of Cape Town For the City Council of Nairobi on Contract for the UNEP) ...................... 18
2.6 Residential/Domestic Waste Characterization ..................................................................... 20
2.8 Waste Character - a function of Generator type or Zonal location in the city? ................... 23
2.9 Total Solid Waste Quantities generated in Nairobi currently ............................................... 24
2.10 Waste Quantification at Source ............................................................................................ 24
2.11 Current Waste Sinks in Nairobi (where waste ends up) ....................................................... 26
2.11.1 Waste Recycling and Reuse .......................................................................................... 26
2.11.2 Plastics Recycling and Reuse ........................................................................................ 28
2.11.3 Paper Recycling ............................................................................................................. 29
2.11.4 Glass Recycling ............................................................................................................. 29
2.11.5 Metal Reuse and Recycling ........................................................................................... 31

6 | P a g e
2.11.6 Organic/Biodegradable Waste Reuse ............................................................................ 31
2.12 Waste Collection levels and Safe Disposal ............................................................................ 32
2.12.1 Summary of Waste Sinks .............................................................................................. 32
2.13 Solid Waste Quantities generated vs. Total Collection levels, CCN and Private Collection
contributions, and levels of total safe waste disposal over time ..................................................... 33
2.14 Private Actors & CBOs involved in Solid Waste Management activity ................................. 34
2.15 Informal Waste Recovery and Trading Market Prices ........................................................... 34
2.16 Changing Character of Nairobi City’s Waste Stream............................................................. 35
2.17 Illegal Dumpsites ................................................................................................................... 36
2.18 Disposal Costs – currently at Dandora dumpsite, and in future at Ruai landfill ................... 36
2.19 Implications of Nairobi’s SWM System Behavioural Trends ................................................. 37
2.20 Discussion Of Specific Intervention Actions .......................................................................... 37
2.20.1 Reducing Waste Generation at Source .......................................................................... 37
2.20.2 Achieving Waste Reduction at source: Flat rates or Weight-Based Waste Collection
Fees? 38
2.20.3 Implications of Source separation and amplified economic value of waste materials .. 40
2.21 Specific Recyclable Stream Strategies ................................................................................... 40
2.22 Landfill or End-of-Life Treatment Levies on Problematic Waste Materials .......................... 41
2.23 Ground Implementation of Weight Based Charges and Mechanisms for Charge collection 43
2.24 Getting general waste collection and safe disposal right ...................................................... 43
2.25 Waste Diversion Strategies: Enabling Waste Recovery & Reuse/Recycling through source
separation of waste ........................................................................................................................... 46
2.25.1 Waste Separation at Source with Incentives ................................................................. 47
2.25.2 Generator Incentive: Reduced Streamlined Collection fees for separated high purity
recyclable and organic waste......................................................................................................... 47
2.25.3 Waste Collector Incentive: Minimising waste disposal transportation costs, and
maximising waste value on the Waste Recovery & Trading Market to improve profit margins .. 48
2.26 End fate of residual or un-diverted solid waste in the City: Construction and Capitalisation
of Sanitary Landfill at Ruai ................................................................................................................. 49
CHAPTER 3 ......................................................................................................................................... 50
3 RESERCH DESIGN AND METHODOLOGY ........................................................................... 50
3.1 Population and Sample ......................................................................................................... 50
3.1.1 Sampling Method .......................................................................................................... 50
3.1.2 Data collection Procedures/Instruments used ............................................................... 50
3.2 Primary sources of data: ....................................................................................................... 51
3.2.1 Pilot surveys .................................................................................................................. 51
3.1.1 Participatory observation .............................................................................................. 51

7 | P a g e
3.1.2 Interview guides ............................................................................................................ 51
3.1.3 Questionnaires ............................................................................................................... 51
3.1.4 Photography .................................................................................................................. 52
3.2 Secondary sources of data .................................................................................................... 52
CHAPTER FOUR ................................................................................................................................. 53
4 ANALYSIS, PRESENTATION AND INTERPRETATION OF FINDINGS ............................. 53
4.1 Data Analysis Fron the Questionaire .................................................................................... 53
CHAPTER FIVE .................................................................................................................................. 58
5. FINDINGS AND RECOMMENDATIONS ....................................................................................... 58
5.1 Summary ............................................................................................................................... 58
5.2 Recommendations ................................................................................................................ 58
5.2.1 Separation of waste at source ........................................................................................ 58
5.2.2 Sensitize people on pollution and its effects ................................................................. 59
5.2.3 Upcycling ...................................................................................................................... 59
APPENDICES ...................................................................................................................................... 65
Appendix1 ......................................................................................................................................... 65
QUESTIONNAIRE: .............................................................................................................................. 65
Appenxix 2 ......................................................................................................................................... 66
INTERVIEW GUIDE: ............................................................................................................................ 66
Appendix3-Maps................................................................................................................................... 67
Buruburu Phase 2 ................................................................................................................................. 67
BIBLIOGRAPHY ................................................................................................................................. 71

8 | P a g e
CHAPTER 1
“ONE MANS TRASH IS ANOTHER MANS TREASURE”
1. Introduction to the Study
1.2 Overview
All Design is goal-directed play. Only our questions change. We no longer ask, „How does it
look?‟ or „How does it work?‟ We are more interested now in the answer to, „How does it
relate?‟ (The Green Imparative, Victor Papanek)
This project will focus on how design relates to the environment. Sustainability in our society
has come a long way but we still have much further to go as industrialization and technology
advance the more the natural resources are exploited and the more the pollution on our
environment. People are developing ways and means of getting the best out of the products
that are produced, along with being more environmentally friendly and being better care
takers of Mother Earth but many people have still not embraced this movement. Among the
methods that are being used to make our surroundings safer, more beautiful, sustainable and
reaching their fullest potential are: Upcycling, Recycling, Biodegration etc. Upcycling is
defined by Terracycle as using every aspect of waste as value. This is very much a mentality
of waste not, want not. Use the product you have, and then instead of discarding the
packaging or its other remnants, keep it and make constructive use of it again. It is like the
concept of reincarnation. The used product comes to life in another capacity. It keeps the
material out of the landfill and furthers the utility of the item in question.
This proposal is intended to inform on how creatively upcycling products that would
otherwise have been disposed could benefit the environment. Good design should help to
improve the quality of life (Nathan Shapire, UCLA). Design should be green, sustainable,
social, cultural and sensitive to add value to the product. Upcycling is the process of

9 | P a g e
converting waste materials or useless products into new materials or products of better
quality or for better environmental value. The first recorded use of the term upcycling was by
Reiner Pilz of Pilz GmbH in an interview by Thornton Kay of Salvo in 1994.
In the impending EU Demolition Waste Streams directive, "Recycling," he said, "I call it
downcycling. They smash bricks, they smash everything. What we need is upcycling, where
old products are given more value not less." He despairs of the German situation and recalls
the supply of a large quantity of reclaimed woodblock from an English supplier for a contract
in Nuremberg while just down the road a load of similar blocks was scrapped. In the road
outside his premises, was the result of the Germans' demolition waste recycling. It was a
pinky looking aggregate with pieces of handmade brick, old tiles and discernible parts of
useful old items mixed with crushed concrete. Is this the future for Europe?
Upcycling is the opposite of downcycling, which is the other half of the recycling process.
Downcycling involves converting materials and products into new materials of lesser quality.
Most recycling involves converting or extracting useful materials from a product and creating
a different product or material.
For example, during the recycling process of plastics other than those used to create bottles,
many different types of plastics are mixed, resulting in a hybrid. This hybrid is used in the
manufacturing of plastic lumber applications. However, unlike the engineered polymer ABS
which hold properties of several plastics well, recycled plastics suffer phase-separation that
causes structural weakness in the final product.
In developing countries, where new raw materials are often expensive, upcycling is
commonly practiced, largely due to impoverished conditions.
Upcycling has seen an increase in use due to its current marketability and the lowered cost of
reused materials.

10 | P a g e
1.3 Statement Of The Problem
The problem is that solid waste materials and products generated and disposed on a day to
day basis from homesteads greatly contribute to the trash in landfills. Homestead paper and
wastes account for the largest share of the municipal waste stream, and much of this can be
upcycled or recycled directly or composted if organic.
1.4 Aim of the Study
Owing to the above mentioned problem, this study is essentially aimed at presenting a
plausible solution that will develop solutions on how upcycling of solid inorganic waste can
be a major measure in reducing the amount of garbage going to landfills. Hence, decreasing
the pollution levels at landfills.
1.5 Objective of the Study
i. To determine how upcycling can preserves habitats.
ii. To determine how upcycling can reduce landfills.
iii. To analyze how up upcycling can reduce energy consumption.
iv. To investigate on how upcycling can lead to decrease in pollution
v. To design products using solid household wastes.
1.6 Research questions
This research will respond to the following questions:
1.6.1 Main research question;
How can upcycling of solid homestead waste benefit the environment?
1.6.2 Other research questions;
i. How can upcycling of solid homestead waste reduce landfill?
ii. How can upcycling of solid homestead waste reduce energy consumption?

11 | P a g e
iii. How can upcycling of solid homestesd waste decrease pollution?
iv. How can upcycling of solid homestead waste preserve habitats?
v. How can solid household waste be used to make products?
1.7 Hypotheses
Upcycling of solid inorganic homestesd waste could reduce the trash going to landfills and
reduce pollution on the environment.
1.8 Significance Of The Study
a)This study will benefit other designers who could be creating products using the
philosophy of upcycling.
b)This study will benefit NGO‟s that are involved in upcycling and sustainable design
initiatives.
c)This study will benefit government institutions that are involved in upcycling and
sustainable design initiatives.
d)This Study will benefit the environment as upcycling will reduce the amount of waste
going into landfills hence reducing pollution.
e)This study will benefit the people in general as upcycling reduces pollution it will make it
more habitable and safe for them.
1.9 Limitations
a) The area covered was quite a small representative of the general population.
b) The time available to carry out the research was inadequate.
c) Unwilling respondents.
d) Financial constraints.
e) Limited information on upcycling.

12 | P a g e
Assumptions
a) That all homesteads in the sample have solid waste that they produce.
b) That at least one person in each of the homesteads in the sample will be willing to
answer the questionnaire.
c) hat the people in the homestead will be willing to respond to the interview questions.
1.10 Definition of terms
Up cycling- Upcycling is the process of converting waste materials or useless
products into new materials or products of better quality or for better environmental
value. The first recorded use of the term upcycling was by Reiner Pilz of Pilz GmbH
in an interview by Thornton Kay of Salvo in 1994.
Landfill- A landfill site (also known as tip, dump, rubbish dump or dumping
ground and historically as a midden) is a site for the disposal of waste materials by
burial and is the oldest form of waste treatment. Historically, landfills have been the
most common methods of organized waste disposal and remain so in many places
around the world.
Homestead- a house and the land surrounding it or the home place; the place where
the home is
Solid waste- commonly known as trash or garbage (US), refuse or rubbish (UK) is
a waste type consisting of everyday solid items that are discarded by the public.
Inorganic waste- refers to waste composed of materials other than plant or animal
matter. This includes dust, dust, glass and many other synthetics. Research on SWM
however normally considers waste materials such as paper, sand, dust, glass, plastic,
rubber, metal, bones, textiles and leather as inorganic although they are arguably
organic. The unique aspect of inorganic waste is its non or slow biodegradability, as a

13 | P a g e
result of which its disposal presents particularly ominous implications on the capacity
of local and global waste sinks.
Abbreviations
ISWM- Integrated Solid Waste Management
JICA- Japan International Cooperation Agency
ITDG- Integrated Technology Development Group, now, Practical Action
UNEP- United Nations Environmental Programme
NEMA- National Environmental Management Authority
SWM- Solid Waste Management
LDPE- Low Density Polyetheylene
NCC- Nairobi City Council
NTT- National Task Team

14 | P a g e
CHAPTER 2
2 LITERATURE REVIEW
2.1 Overview
The aim of this chapter is to develop an appropriate theoretical framework for evaluation with
which to analyse data collected in the exploration of the problem. The task of drawing an
appropriate evaluation frame work is accomplished through a literature review of a number of
relevant issues that insight the problem.
The upcycling concept was a theme of the 1999 book with the same title written by Johannes
F. Hartkemeyer. The concept was later incorporated by William McDonough and Michael
Braungart in their 2002 book Cradle to Cradle: Remaking the Way We Make Things. They
state that the goal of upcycling is to prevent wasting potentially useful materials by making
use of existing ones. This reduces the consumption of new raw materials when creating new
products. Reducing the use of new raw materials can result in a reduction of energy usage, air
pollution,water pollution and even greenhouse gas emissions.
According to the book “Cradle to Cradle: Remaking the Way We Make Things” by William
McDonough & Michael Braungart… “Imagine what you would come upon today at a typical
landfill: old furniture, upholstery, carpets, televisions, clothing, shoes, telephones, computers,
complex products and plastic packaging, as well as organic materials such as diapers, paper,
wood and food wastes. Most of this products were made from valuable materials that
required effort and expense to extract and make, billions of dollars‟ worth of material assests.
The biodegradable materials such as food matter and paper have value too- they could
decompose and return biological nutrients to the soil. Unfortunately, all these things are

15 | P a g e
heaped in a landfill, where the value is wasted. They are the ultimate products of an industrial
system that is designed on a linear, one-way cradle-to-grave model. Recourses are extracted,
shaped into products, sold and eventually disposed in a “grave” of some kind, usually a
landfill or incinerator. You are probably familiar with the end of this process because, you,
the customer are responsible for dealing with its detritus. Think about it, you may be referred
to as a consumer, but there is very little that you actually consume- some food, some liquids.
Everything else is designed for you to throw away when you are finished with it. But where is
“away”? of course, “away” does not really exist. “Away” has gone away.
Cradle-to-grave designs dominate modern manufacturing. According to some accounts more
than 90 percent of materials extracted to make durable goods in the United States become
waste almost immediately. Sometimes the product itself scarcely lasts longer. It is often
cheaper to buy a new version of even the most expensive appliance than to track down
someone to repair the original item. In fact, many products are designed with “built-in
obsolescence”, to only last only for a certain period of time, to allow- to encourage- the
customer to get rid of the thing and buy a new model. Also, most people see in their garbage
cans is just the tip pa a material iceberg; the product itself contains an average of only 5
percent of the raw materials involved in the process of making and delivering it.”
In Victor Papanek‟s book, „The Green Imperative‟ he describes the Product Life
Assessment as follows:
2.2 Product Life Assessment
The Choice of Materials
The materials chosen by designer and manufacturer are crucial. Mining metal for cars creates
atmospheric pollution, and uses oil and petrol, thus wasting natural recourses that cannot be
replaced. The designer‟s decision to use foam plastics to make cheap, throw-away food
containers damages the ozone layer. This is not a prescription for doing nothing at all, but an

16 | P a g e
attempt to make designers aware that every choice and dilemma in their work can have far-
reaching and long-term ecological consequences.
The manufacturing process
The questions facing the designer are: Is there anything in the manufacturing process itself
that might endanger the workplace or the workers, such as toxic fumes or radio-active
materials? Are there air pollutants from factory smoke stack, such as the gases that cause acid
rain. Are liquid waste from the factory leaking into the ground and destroying agricultural
land or – worse still – entering the water supply.
Packaging the product
Further ecological choices face the designer when developing the package in which the
product is transported, marketed and distributed. From plastics, which pose acute dangers to
the ecological balance, and used by designers as a protection for fragile products. It is now
known that propellants (such as CFCs) for lacquer sprays and other products are directly
implicated in the depletion of the ozone layer. Considerations of materials and methods are
therefore crucial in the packaging phase of ecologically aware design.
The finished product
There are too many different versions of the same item available in many cases. Since the
manufacture of most industrial or consumer products uses irreplaceable raw materials, the
profusion of objects in the market place constitutes a profound ecological threat. To give a
typical example: in western Europe, Canada, Japan and the USAthere are now more than 250
different video cameras available to consumers; the difference between them are minimal – in
some cases they are identical but the name-plate. The choice of consumer products in the
West is highly artificial. Other products threaten the ecological balance even more directly.
Snow-mobiles, which are largely sold as winter-sports and recreation equipment, are so noisy
that when they go into roadless terrain they destroy breeding grounds and habitats. Yet, at the
same time they have assumed an important role in hunting and herding cycles and are now

17 | P a g e
important tools for survival among the Inuit of Canada and Alaska. „Off-road; vehicles and
„mountain bikes‟ affect the precious layer of topsoil and humus that can grow crops. „dunes
buggies‟ harm the sand-dune layers at the critical edge between ocean and land.
Transporting the product
The transporting of materials and products further contributes to pollution by the burning of
fossil fuels, and by the necessity for a whole complex of roads, rails, airports and depots.
There is transportation from the mill to the factory, the factory to the destination centre, from
there to the shops and, eventually, to the end-user.
Waste
Many products can have negative consequences after the useful product life is over. One only
has to see the huge automobile graveyards in many countries to understand that these vast
amounts of rusting metals, decaying paints and shellacs, deteriorating plastic upholstery,
leaking oils and petrol and leaching directly into the ground, poisoning the soil, the water-
supply and the wildlife, besides visually destroying the landscape. It has been estimated that
the average family in the technologically developed countries throws away some 16 to 20
tons of garbage and waste a year. This is not only an environmental hazard, but is also an
enormous waste of materials that could be recycled responsibly. This is one area in which the
so-called Third World countries are leading the way – because of material scarcities,
recycling is an accepted way of life there and has been for generations.
2.3 Product Assessment (victor Papanek, 1995)
The relationship between design and ecology is a very close one, and makes for some
unexpected complexities. The designed product goes through at least six potentially
ecologically dangerous phases. Product Life Cycle Assessment is the evaluation
incorporating all of them, from the original acquisition of raw materials, through the

18 | P a g e
manufacturing process and assembly, the purchase of the complete product (which also
includes shipping, packaging, advertising and the printing of instruction manuals), the use,
the collection of the product after use, and finally the re-use of recycling and final disposal.
At the moment Life Cycle Assessment is very new, and can be profoundly complicated,
demanding a great deal of study, testing and experimentation.
2.3.1 Environmental issues in Life Cycle Assessment
The exhaustion of scarce or finite resources
The production of greenhouse gases
The production of chlorofluorocarbons leading to ozone depletion
The production of acid rain
Habitat destruction and species extinction
Materials or processes that harm plants, animals and humans
Air, soil and water pollution
Noise pollution with its deleterious effect on the human psyche
Visual pollution
2.4 SOLID WASTE MANAGEMENT IN NAIROBI SURVEY: A SITUATION
ANALYSIS (Prepared by: Allison Kasozi and Harro von Blottnitz, Environmental
& Process Systems Engineering Group, University of Cape Town For the City
Council of Nairobi on Contract for the UNEP)
Nairobi is literally under garbage. Of the estimated 1,500 tons of solid waste generated daily
in the city, only about 25 percent gets collected. The rest is left in open spaces, markets, bus
stops, drains and roadsides forming mountains of rotting, smelly and unsightly waste.
Discarded polythene papers of all colours and sizes decorate the city landscape. Solid waste

19 | P a g e
collection, transport and disposal are thus generally chaotic. It has not been always so,
however, as recently as 1977, the Nairobi City Council (NCC) collected almost all the waste
generated. Dismal performance started in the late 1970s and persists.
Recycling, Reuse and Composting
Although recycling, reuse and composting are significant sub-sectors within the solid waste
management system in Nairobi, collection efforts by the NCC and private firms are not
geared in any way towards these concerns. There is no policy or any official support for
source separation, recycling, reuse and minimization/prevention of waste generation. Any
relationship that exists is accidental and the result of initiatives outside the public sector
(NGOs, CBOs, international organizations, and some private handling companies). 5 percent
of them are involved in waste separation.
2.5 Results and Implications of Waste Characterization Surveys
In the course of the Integrated Solid Waste Management (ISWM) project, waste
characterization surveys were carried out by the National Task Team (NTT) in 2009 in
July and September at designated CCN communal points, and at immediate source
(waste taken directly from households and commerce and institutional premises)
respectively, to determine the current character of Nairobi‟s waste. The sample numbers
taken and used for the characterisations achieved theoretical 99 percent Confidence
levels for residential/domestic and non-domestic waste characterization at immediate
source, and 95% and 90% Confidence levels respectively for domestic and non-
domestic characterisation at communal waste collection points. The results of the
characterizations are summarized in the sections following:

20 | P a g e
2.6 Residential/Domestic Waste Characterization
A total of 568 samples spread over a week were taken directly from households in three
zones, namely; Starehe, Makadara and Westlands for waste characterisation at immediate
source while a total of 163 communal waste collection points located in residential areas
spread were sampled for waste characterisation at collection points. The results of the
residential/domestic waste characterisations carried out at immediate source and at
communal waste collectionpoints are summarised in Table below:
Table 1: Waste characterization at immediate source and at communal collection points
for Residential generators
Waste Type Composition (%)
At immediate Source
At Communal Waste Collection Points located
(directly from Households) in Residential areas Organic/Biodegradable 58.6 46.1
Paper 11.9 8.9 Plastics 15.9 15.4 Glass 1.9 5.6 Metal 2.0 2.3
Other 9.7 21.7
2.7 Overall Waste Characteristics in the City
UNEP/NEMA (2003) (cited in Ngau & Kahiu, 2009 – ISWM Secondary Data Report) found
that domestic waste contributes 68% of the total waste generated in Nairobi; while non-
domestic waste from industrial, markets, roads & other activities contributed a combined total
of about 32% of the total waste generated, broken down as follows; Industrial: 14 %; roads: 8
%; hospitals: 2 %; markets: 1 %; and 7 % from other sources. The overall the city-wide waste
characterisation at immediate source and at communal collection points is estimated at:

21 | P a g e
Table 2: Summary of City-wide waste characteristics at immediate source and at communal
collection points
City-wide waste Compositions (%)
Waste type
At immediate source
At Communal Waste Collection Pts
Organics 50.9 43.0
Paper 17.5 12.1
Plastic 16.1 15.1
Glass 2.0 5.6
Metals 2.0 2.7
Other 11.4 21.7
While it might be expected that there should be similarity in the waste characterisations at
source and at collection points as theoretically waste generated at source ends up at collection
points, this is not the case in reality. The difference between immediate source and collection
points based waste characteristics may be attributed to some of the waste at source not
passing through CCN communal waste collection points, but going straight to disposal dump
as in the case of middle to high income residential areas and larger businesses that use door to
door private collection; and in the instances where it does go through communal collection
points first as in the lower income areas, the difference is likely due to natural degradation of
organic waste and paper, and is also likely strong evidence of the active informal recovery
and trading of recyclable material in the City as observed in previous studies (Karanja, 2005;
Baud et al, 2004) as well as in the course of the 2009 Waste Characterisation surveys and as
voiced at UNEP/CCN ISWM Stakeholder workshops in Dec. 2009; resulting in an overall
decrease in potentially recyclable material and an increase in residual waste at collection
points.
Due to the highly differentiated nature of non-domestic waste generators sampled at
immediate source (i.e. Business, Commerce, Institutions, Markets – it is not known currently
what the individual sub-generators‟ contribution to non-domestic waste is) relative to

22 | P a g e
communal waste collection points (with mixed waste coming from general
Business/Commercial areas with no sub-generator specificity), a direct statistical comparison
of non-domestic waste compositions at immediate source and at communal collection points
was not possible. An Analysis of Variance (Anova analysis) however of Nairobi‟s major
residential waste stream (68% of total waste generated), providing a direct comparison
between characterisation at immediate source and communal waste collection points was
possible due to the homogeneity of generators sampled in the residential category at
immediate source and at collection points; and was done to determine if there are indeed any
differences in the waste character between source and collection points given the sample
numbers taken, and their respective standard deviations and averages. The results of this are
summarised in the Table below, and show that there are indeed differences in the waste
composition of organics, paper, glass and the „other‟ or residual streams between immediate
source and communal collection points; generally supporting the conclusions drawn above.
While the decline in the organics and paper streams, and subsequent increase in residual
waste may be attributed to natural degradation and informal waste recovery activity, the
general increase in glass composition between source and collection points is curious and
could be due to non desirability of the material for waste recovery owing to a lack of broken
glass recycling capacity in the City, a scenario that is also alluded to by Karanja (2005)
Table 3: Anova analysis of residential waste compositions at immediate source and at communal
waste collection points
Enough evidence of Statistical difference of waste component means between Source & Collection Pts?
Paper Glass Plastic Organics Metals Other
Yes Yes No Yes No Yes
Overall the waste composition at immediate source shows three major categories that would aid in
the effective source separation of waste material to enhance downstream material recovery and

23 | P a g e
value generation in the development of the ISWM plan namely; Organic material –
50.9%, Potentially recyclable materials - 37.7% and Other/Residual material.
2.8 Waste Character - a function of Generator type or Zonal location in the city?
An Analysis of Variance (Anova) - essentially a statistical comparison of the waste
compositions collected from the collection points in the different zones, was done to
determine if there are any differences in the waste character between the different zones.
Waste compositions at communal waste collection points were compared for this purpose as
collection points by their communal nature are more representative of the generator mix and
demographics across the city, and typically allowed larger samples volume-wise; allowing for
a quicker and broader comparison of waste character city-wide than would be possible with
individual samples taken at immediate source.
Table 4: Summary of Anova analysis to determine if waste characterisation at communal
waste collection points is statistically different across zones
Enough evidence of Statistical difference in waste compositions across zones?
Generator Paper only Glass only Plastic only Organics only Metals only Recyclables Combined Residential N
o No
Yes
No*
No
No Business/Commerc
e No
No
No
No
No
No
Table 5: Summary of Anova analysis to determine if waste characterisation at communal
waste collection points is statistically different across generator types
Enough evidence of Statistical difference in waste compositions across generators?
Paper only Glass only Plastic only Organics only Metals only Recyclables Combined Across generators
Yes
No
No
Yes
No
Yes

24 | P a g e
The results show a relative indifference in waste compositions between zones with the
exception of plastic, and therefore no strong evidence for the need for specific zone based
waste intervention activities. The analysis instead shows that waste character in Nairobi is
different across generator types, and is a stronger function of the responsible generators
i.e. residences/households and commerce/institutions, than of the geographical location of
generators. Any detailed intervention policies developed targeting specific waste types
should therefore be directed at specific generator groups exhibiting strong compositions of
the particular material of interest.
2.9 Total Solid Waste Quantities generated in Nairobi currently
Total waste quantities being generated in Nairobi were determined using GIS based
scale up techniques from communal waste collection point quantity estimates, and via
quantifications done at immediate source during the source characterisation survey.
2.10 Waste Quantification at Source
Quantification of waste generation at source was done in households in Makadara, Starehe,
and Westland zones and yielded the following results:
Makadara zone (low to middle income level households) residential per capita
generation rates vary from 0.21 – 0.65 kg/person/day, with a mean of 0.49
kg/person/day.
Starehe zone (low to middle income level households) residential per capita
generation rates vary from 0.24 – 0.82 kg/person/day, with a mean of 0.43
kg/person/day.
Westlands zone (mostly high income level households) generation rates vary
from 0.41-0.79 kg/person/day with a mean of 0.65 kg/person/day.

25 | P a g e
JICA in 1998 estimated total City waste generation at 1530 tons/day, of which 82.8%
was from households; equivalent to 263 tons/day non-domestic waste, and 1267
tons/day domestic or residential waste. This gave an average per capita
residential waste generation of 0.59 kg/person/day given the population at the time
(2,143,254 people in 1999). ITDG in 2004 estimated total solid waste generation at 2400
tons/day (Bahri, 2005). From UNEP/NEMA‟s (2003) (cited in Ngau & Kahiu, 2009)
determination that domestic waste contributes 68% of the total waste generated in Nairobi;
the residential waste generation per capita of the city‟s 2,656,997 residents in 2004 had
increased to about 0.61 kg/capita/day in that year. Because JICA (1998) conducted the
characterisation surveys twice over the course of the year six months apart (May &
November), their results would have better accounted for seasonal fluctuations in
waste generation in the City at the time. From the household source waste
characterisation surveys done in October 2009, an average of 0.53 kg/person/day was
determined from all the households sampled in all zones. However in cognisance of the
planning nature of this work, and because there are typically fluctuations in waste
quantities generated over varying seasons; the upper 0.65 kg/person/day observed from
sampling in Westlands Zone is taken as the city-wide estimate of waste generation per
capita to cater for maximum volume waste generation. This coupled with the city‟s current
population estimate at 3.265 million gives a maximum residential waste generation estimate
of 2122 tons/day. UNEP/NEMA (2003) (cited in Ngau & Kahiu, 2009) found that
domestic waste contributes 68% of the total waste generated in Nairobi; it can therefore be
estimated that current Non-domestic waste generation is about 999 tons/day, and Total
waste generation in the City in turn is currently at most about 3121 tons/day. This represents
an increase of 30% from the estimate waste generation figures of 2400 tons/day in 2004 by
ITDG (Bahri, 2005), and a full doubling of waste generation in ten years from 1530 tons/day
in 1998 (JICA, 1998).

26 | P a g e
2.11 Current Waste Sinks in Nairobi (where waste ends up)
2.11.1 Waste Recycling and Reuse
The Waste Materials Recovery, Trading and Recycling Supply chain in Nairobi:
Waste pickers to Large Scale Recycling
Inorganic waste recycling in Nairobi is comprised of licensed waste dealers who buy
from large groups of unregistered individual waste pickers and neighbourhood based
itinerant waste traders, and sell in bulk to large scale waste recyclers (Baud et al, 2004). Baud
et al (2004) and Karanja (2005) found that Waste picking activities in Nairobi are split into
street picking - mainly in small open city waste sites, streets and dustbins; and waste dump
pickers – pickers that operate at large formal or informal waste dumps, mainly the Dandora
dumpsite. 20% of the pickers at Dandora reside at the dump itself, and the streets are home
to significant numbers of street pickers who utilise garbage as a source of cash and non-
cash income. Waste pickers and dealers earning their living off the recovery and sale of
recyclables at the Dandora dumpsite alone number over 2000 (Karanja, 2005). Itinerant
waste traders or buyers based in neighbourhoods also play a role in waste recovery
activities, sourcing materials from household waste put out for collection. The
incidence of neighbourhood based waste traders is however decreasing in residential
areas due to security concerns (Karanja, 2005). Waste dealers form the main central link
between accumulated recyclable material quantities from pickers and buyers, and large
scale waste recyclers who require high volumes. Many waste dealer activities are
concentrated around dump sites and like waste pickers, decrease in number outwards from
the centre of the city, and are rarely found in higher income areas which are mostly serviced
by private collectors (Karanja, 2005). 80% of the recovered materials at Dandora are sold to
the Mukuru Recycling project, a church based CBO initiated to help circumvent exploitative
dealers operating around the site, resulting in higher prices and incomes for pickers at
Dandora (Baud et al, 2004). Materials from the project go directly to recycling factories.

27 | P a g e
While street pickers tend to fall outside of these arrangements, they earn higher incomes
on average than dump pickers because they retrieve relatively cleaner materials as street
sources proximate points of generation, and because the dealers street pickers sell to offer
better prices due to their geographical variability, while dealers at dumps tend to control
prices more tightly due to close proximity (Karanja, 2005). There is no material
specialisation amongst pickers.
Neighbourhood based itinerant waste traders‟ incomes of about US$1.5/day are slightly higher
than pickers‟ earnings at US$1.3/day (JICA, 1998). Waste dealer‟s incomes average
US$163/month (US$5.4/day), and range from US$31 – US$500/month (Karanja, 2005). Most
waste dealers also earn from supplementary activities; 60% of the dealers reported secondary
activity in 2nd hand clothes and 48% in charcoal. Some do this to diversify, others as an
exit strategy should business decline (Baud et al, 2004).
The Mukuru project at Dandora, involving about 60 members, earned KShs.1.55m in 1996
(≈ US$ 0.9/person/day) from the recovery of 1018 tons per year (JICA, 1998). The incomes
however were not sufficient to cover the members living costs and cost of improving
operational efficiency. Their major problem is securing a stable market for recovered
materials, especially for waste paper and compost. Important waste materials on the waste
recovery market include; paper, scrap iron - used by local artisans and metal working
companies, plastics and whole bottles.

28 | P a g e
Image: The Dandora Dumpsite, which is the largest in Nairobi.
2.11.2 Plastics Recycling and Reuse
As of 2005 the level of re-use and recycling of post-consumer plastic in Nairobi was very
low, with approximately only 1% recycled (ITDG, 2005 cited in Ngau & Kahiu, 2009;
Bahri, 2005). Assuming a plastics composition of about 15% as a bridge between
JICA(1998) and the 2009 Characterisation survey results, and using ITDG‟s (2004) total
waste generation estimation of 2400 tons/day in 2004; plastic reuse in 2005 was about 3.6
tons/day. The ISWM Secondary data and Preliminary Survey Report (Ngau & Kahiu, 2009)
reported the presence of some private companies and groups actively involved in plastic
waste recycling in Nairobi currently including; Devani, RH, Green Loop International,
Eurasia plastics and community based recyclers. One of these groups, Green Loop
International, has a total waste plastic recycling/re-manufacturing capacity of about 450
ton/month (15tons/day) of HDPE, LDPE and plastic lumber (Bahri, 2005). During
Preliminary Zone surveys prior to characterisation surveys in 2009 it was also noted that a

29 | P a g e
number of community based recyclers are currently being supported by Practical Action
(formerly ITDG) which has identified thirteen (13) functional plastic waste collection
points, thirty seven (37) recycling groups and one thousand six hundred and thirteen (1,613)
individuals in the city‟s Eastland‟s area that can spearhead the recycling program through a
legally defined cooperative framework (Ngau & Kahiu,2009). The registered cooperative is
operating on a 5-year business plan. In July 2006, the KNCPC, supported by UNDP and UNEP
also finalized a Comprehensive Plastic Waste Strategy for Nairobi City centred on the
reduction, reuse and recycling of plastic wastes in the city. Its progress to date however has
not yet been documented (KNCPC, 2006). Given the capacity of Green Loop International
by itself, the ITDG estimates in 2005, and the presence of other private and sub-national
players in the plastics recycling industry; it is conceivable that current plastics recycling and
reuse capacity in the City could be in the region of 20-25 tons/day, equivalent to approximately
5% of the available waste plastic in the city.
2.11.3 Paper Recycling
Chandaria and Madhupaper have previously been noted to be the most established and
dominant players in the trade and recycling of waste paper in Nairobi (Karanja, 2005), with
remanufacturing capacities about 24 tons/day and 20 tons/day respectively of waste paper
summing up to about 8% of total waste paper in the city. Another previously sizable
entity involved in the waste paper recovery and recycling, Webuye Paper Mills, has however
closed (Kahiu, 2009).
2.11.4 Glass Recycling
Glass recycling in Nairobi is dominated by Central Glass Industries (CGI), a subsidiary
of Kenya Breweries Ltd (KBL). CGI uses about 720 tons of clear glass and 1260 tons of
green/amber glass per month (about 66 tonnes glass /day) of which (Karanja, 2005).
Karanja (2005) however noted that glass recycling of especially broken glass is on the
decline as the reprocessing of broken glass was found to be too costly and unprofitable due

30 | P a g e
to high maintenance costs of the imported precision equipment. Power constraints (shortages
resulting in rationing), economic conditions and increasing competition from lighter and more
durable aluminum cans, plastics and Tetra-pack containers from the early 2000‟s were also
attributed as likely contributing factors. Progress to date on this is not clear, although the
presence of elevated glass levels in the communal waste collection point
characterizations relative to at immediate source as discussed earlier could indicate the
lack of informal recovery activity interest in the predominantly broken glass at the collection
point stage.
With an estimate 2% waste glass composition in Nairobi‟s current waste stream, equal to
about 62 tons/day of glass, it would seem that CGI‟s capacity was once sufficient to
reuse a substantial amount of the waste glass available but has since declined due to
high costs of broken glass recycling. Current recycle levels are not known.
Another company that is recycling glass is an unusual environmental friendly family
run glass blowing and recycling studio just outside Nairobi (Kitengela) It is home to some of
Kenya's finest artisans, who transform recycled glass and scraps of other materials into
beautiful work of artworks, jewellery and home ware. Kitengela Glass operates with a defined
purpose, they employ over fifty people, support a local orphanage, award scholarships, loan
school fees, and even repair roads. They have planted thousands of trees, and recycle raw
materials and fuel and all their packaging is second hand. All objects are handmade and often
combine different disciplines- there are combinations of casted and blown glass, mixed with
metal, mosaic, stained glass, beads, cement work, mirror and many other recycled materials.
Recycled glass chandelier by Kitengela Glass.

31 | P a g e
2.11.5 Metal Reuse and Recycling
Karanja (2005) notes the presence of up to 9 rolling mills in Nairobi, some of which were
however closed at the time of the researcher‟s work. One of the largest and still in
operation, Roll Mill Ltd, however consumes about 30 tons of scrap/day equivalent to about
half of the available 62 tons/day of total metal in Nairobi‟s waste. There is also a very vibrant
Jua Kali small scale metal recycling and reworking industry in the City. Given that not all the
waste metal available is necessarily scrap metal suitable for reuse or metal working, and also
that the capacity mentioned is only consumed by one entity, it seems reasonable to conclude
that Nairobi is not in need of any further metal recycling apparatus besides the efficient
separation and movement of the available waste metal to the above mentioned interested
actors.
2.11.6 Organic/Biodegradable Waste Reuse
A number of Community Based Organizations and private holdings are involved in the
composting of organic waste for sale. A survey done on the biggest entities involved in
the activity including community/self help groups and private companies showed a
combined compost production capacity of about 1.2 tons/day in the City (Onduru et al,
2009), equivalent to about 2.4 tons/day of raw organic waste feed assuming an average 50%
mass reduction during the process. This in turn is equivalent to less than 1% of available
organic biodegradable material, the bulk of which is food material.
There is also qualitative evidence of the active current use and sizable potential in the use of
fresh raw organic wastes especially from markets and restaurants by urban and peri-urban
farmers as animal and livestock feed (Karanja, 2005; Onduru et al, 2009; Ngau & Kahiu,
2009). Organic waste material amounts reused in this way are however were unquantified at
the time. Early work by Mazingira Institute (Mazingira, 1987 cited by Karanja, 2005)

32 | P a g e
indicated that 12-14% of animal producers in Nairobi fed their animals on urban organic
waste. Karanja (2005) also found that 42.9% of markets and institutions interviewed in her
work reported that organic waste from their premises was used as animal feed, mostly pigs.
With feeding alone accounting for between 60 to 80% of the total livestock production costs
in Kenya (Githinji et al, 2009 cited by Onduru et al, 2009) and from the work cited above, it
seems evident that there is an active interest in using fresh urban organic waste in this way,
and it looks likely that this will only gain in importance in future.
2.12 Waste Collection levels and Safe Disposal
Current total waste collection levels in Nairobi are estimated at 50% (UNEP/CCN
2009 ISWM Framework Report) at best, in general agreement with previous studies that
found that over half of Nairobi‟s residents don‟t receive any waste collection service (
Karanja (2005) in a survey of 128 households found 48% did not receive any service). This
equates to total collection levels of about 1560 tons/day. Based on April 2009 CCN
records, CCN collection levels at the moment are approximately an average of 430
tons/day (Njenga, 2009a). Weighbridge records at the official Dandora dumpsite over the
period 2006 to end 2008 indicated an average 830 tons/day were disposed there (NTT,
2009).
2.12.1 Summary of Waste Sinks
The total waste reuse and recycling estimates discussed put combined reuse and recycling
efforts in the city at about 100-150 tons/day, and taking the upper limit of 150 tons/day,
approximately equivalent to 5% of total waste generated. This coupled with an average
waste disposal as legally required at Dandora dumpsite of 830 tons/day, means that at
most (assuming collection of recyclables/reusables happens before final disposal) only
980 tons/day of the collected 1560 tons/day are in fact properly disposed at the designated
Dandora dumpsite or properly treated.

33 | P a g e
The difference in the total collection and safe disposal figures above of 580 tons/day, summed
to the uncollected 1560 tons/day gives a grand total of 2140 tons/day; which could be
assumed to be largely disposed of in inappropriate ways such as burning and
illegal/indiscriminate dumping either by collectors or due to non-collection; all of which
practices were noted to be wide spread during the characterisation surveys and from
observation by various stakeholders (ISWM Stakeholders Workshop Report, 2009).
2.13 Solid Waste Quantities generated vs. Total Collection levels, CCN and Private Collection
contributions, and levels of total safe waste disposal over time
From the information available, it‟s seen that while the absolute waste collection levels of
the CCN (including contracts awarded to private companies to execute some of the work)
have increased from 1998 to 2009, their overall contribution to waste collection in the city
has dropped from 16% to 14%. Private Collector contributions - in the form of private
companies and CBOs, to the amounts of total waste collected seem to have increased from 8%
to 36% over the same period.
Given that CCN no longer actively collects service charges from residents, this trend could be
due to the emergence of more efficient private waste collection (with its more efficient non-
central charge collection mechanisms), whose service the populace is better satisfied with and
in turn finds more agreeable to pay for. Over time, this will have led to an increase in the
capacity, market power and political clout of private collector companies (through residents‟
satisfaction - who can protest and influence public officials‟ sentiment against extra CCN
spending, through company owners that could have political sympathisers, and through greater
general public embrace and silent forcing of the political hand) relative to the CCN DoE;
thereby leading to reduced government willingness to spend on SWM budget funds to CCN

34 | P a g e
and in time constraining its performance. In this position, CCN is poorly placed to redeem
the waste collection „market‟ it once held, and is better positioned to take on a regulatory
role using the one position of authority it still has and can still fund- its government given
mandate to mange SWM in the city.
2.14 Private Actors & CBOs involved in Solid Waste Management activity
The entry of private collectors in solid waste management in Nairobi started in 1986 owing to
declining waste collection performance by CCN, with the emergence of 2 of the oldest
companies in the city (Karanja, 2005). Community Based Organisations and Youth Groups
involved in Solid Waste Management (SWM) activity including collection, composting and
recovery and sale of recyclables started to emerge later in 1994 (Karanja, 2005) with the
heightened lack of service delivery especially in low income areas and informal settlements.
From miniscule beginnings, both sets of actors in Nairobi‟s SWM system have blossomed to
counts of 115 registered Private Waste Collectors/Companies and over 135 CBOs and Youth
Groups as of 2009 (Ngau & Kahiu, 2009), explaining the rapid increase in private collection
since 1998.
2.15 Informal Waste Recovery and Trading Market Prices
Based on Karanja‟s (2005) general investigation into informal waste market pricing, and
more recent and more specific information on waste material prices collected during the Pre-
characterisation Zonal waste surveys leading to the compilation of the ISWM Secondary
data report; the table constructed below suggests a general gradual increase in the value of
inorganic waste materials in the informal waste recovery and trading market, with the
exception of broken glass which again appears to be undesirable amongst the waste recovery
circles.

35 | P a g e
Table 6
Type
Avg. selling price (1998)
Avg. selling price (2009)
KShs/kg US$/kg KShs/kg US$/kg Paper 3 0.0375 4 0.0537 Old newspapers - - 15 – 27 Broken glass 3 0.0375 1 0.0134 Unbroken glass 50 cts per bottle Steel 5 0.0625 Scrap iron 5 0.0625 Plastic 5 0.0625 PET 6 0.0805 HDPE 20 0.2685 Trash Bags 20 0.2685 Whole bottles 1-15/kg 0.0125 - 0.1875 Bones 4 0.05 Aluminium 12 0.15 15 0.2013 Copper 10 0.125 Old Tyres 50 - 300 per tire
2.16 Changing Character of Nairobi City’s Waste Stream
Nairobi‟s general waste character has also been evolving, and a summary is shown in the table
below of Nairobi City‟s solid waste characteristics over time as determined from several
previous studies.
Table 7: Nairobi's evolving Waste Character
Type
Avg. selling price (1998)
Avg. selling price (2009)
KShs/kg US$/kg KShs/kg US$/kg Paper 3 0.0375 4 0.0537 Old newspapers - - 15 - 27 Broken glass 3 0.0375 1 0.0134 Unbroken glass 50 cts per bottle Steel 5 0.0625 Scrap iron 5 0.0625 Plastic 5 0.0625 PET 6 0.0805 HDPE 20 0.2685 Trash Bags 20 0.2685 Whole bottles 1-15/kg 0.0125 - 0.1875 Bones 4 0.05 Aluminium 12 0.15 15 0.2013 Copper 10 0.125 Old Tyres 50 - 300 per tire

36 | P a g e
While the waste character varies slightly between the 1998, 2004 and 2009 surveys as
carried out by different researchers, what is unmistakably observable in the space of about
20 years since MoLG & FARID (1985) cited in Kibwage (1996) is the general sharp
decrease in the organic material content of Solid Waste in the city, alongside an increase in
the amount of paper and even more sharply of plastic content. This suggests a gradual
shift in the lifestyles of Nairobi‟s residents towards the consumption of more packaged
goods, and the emergence of more paper and stationery in the day to day lives and
business/enterprise of the City‟s residents. There also seems to be a growing residual or „other‟
waste stream consisting of material not traditionally present in Nairobi‟s solid waste.
2.17 Illegal Dumpsites
Illegal dumpsites in the city currently number 60 (Ngau & Kahiu, 2009). These numerous
dumpsites point to the low collection service delivery levels highlighted earlier, and are likely
where most of the collected but improperly disposed waste ends
2.18 Disposal Costs – currently at Dandora dumpsite, and in future at Ruai landfill
Using average CCN disposal costs per ton waste in April 2009 (Njenga, 2009a) for waste from
different zones to Dandora dumpsite 7.5 km East of the CBD, approximations can be made as
to the future cost of waste disposal straight to the proposed new landfill at Ruai, 30 km East of
the CBD using the factor increase in transportation distance. These are shown below:
Table 8:Disposal Costs to Dandora designated and Ruai landfill
Zone Cost/ton to Dandora
(KShs)
Estimated Rate/ton to Ruai
(KShs)
CBD 1144 4576 Kamukunj
i
943 3772 Starehe 990 3960 Embakasi 852 3408 Dagoretti 1210 4840 Westlands 1155 4620 Langata 1144 4576 Makadara 849 3396 Kasarani 891 3564

37 | P a g e
From these figures average disposal costs to Dandora dumpsite are computed at 1020 Kshs/ton
waste disposed, and will increase approximately four fold to about 4089 Kshs/ton waste
disposed at Ruai.
2.19 Implications of Nairobi’s SWM System Behavioural Trends
The major trends observable from the evolution of Nairobi‟s Solid Waste Management as
discussed above may be synthesized as follows;
CCN‟s control of Waste Collection and Management faces several physical and
financial capacity limitations owing to resource constraints amongst a multitude of
other factors.
Private Waste Collection by private companies and CBOs is growing in importance as
an alternate route for the provision of waste collection service, and it seems rational to
encourage the growth of this arm instead for collection service provision, with CCN
taking on a more supervisory role.
Waste Collection levels remain low, but are growing with the contribution of private
collectors and CBOs.
The bulk of Nairobi‟s generated and collected waste does not actually get to designated
disposal sites.
Nairobi‟s Waste Character is becoming increasingly inorganic in nature.
There is a vibrant Waste Recovery and Trading sector in the City.
Disposal Costs to Ruai will likely be too costly for most of Nairobi‟s residents.
2.20 Discussion Of Specific Intervention Actions
2.20.1 Reducing Waste Generation at Source
Due to the highlighted rapid growth of municipal solid waste in Nairobi and the
resulting implications in terms of required landfill space and disposal costs, the reduction of

38 | P a g e
waste generation at source will be particularly important in the City‟s waste management
strategy here on.
2.20.2 Achieving Waste Reduction at source: Flat rates or Weight-Based Waste Collection
Fees?
While there is a temptation to have waste collection paid for in Nairobi using flat or fixed
rates, perhaps via differentiated charges for different income level residents as in the past and
as is the case traditionally in many other areas globally; flat rate or fixed collection
fees regardless of differentiated charges for low, middle and high income residents or
enterprises cannot lead to behavioural change as regards the reduction of waste for
disposal at source. This is because residents or generators are buffered from the direct,
actual cost of waste disposal relative to how much they themselves are generating, and any
marketing or other campaigns to induce behavioural change towards less waste generation will
have little effect without an economic penalty inherent in higher charges for excessive waste
generation – which acts as a behavioural feed back loop. An inherent economic penalty or
cost for excessive waste generation and disposal is especially easily comprehensible by all
generators as monetary cost for service is a virtually universal language. This system of
paying for waste collection service can also be argued to be fairer and more sensitive to
different generators whether residential, non-domestic, or of differing income levels, as the
rich typically generate more waste (as is evident in the different waste generation rates of the
different income level zones sampled at immediate source) and in turn pay should pay more
for its disposal. The accountability or responsibility for the charges ultimately collected from
the generator also becomes internal and blame is not placed on external parties or collectors
who might be accused of charging exorbitant per household or business/commercial rates
determined from averages. The use of Pay as you Throw schemes in other countries such as
Sweden, Belgium, Denmark has been observed to lead to decreased waste generation by
residents through genuine behavioural change, however in some instances also through

39 | P a g e
evasion by illegal dumping; and to increased separation of waste for recycling to decrease
amounts set out for disposal (Dahlén & Lagerkvist, 2010; UNEP/CCN 3rd ISWM
Stakeholder‟s Workshop, 2009). In the Nairobi context, efficient supervisory and
regulatory oversight by the CCN and by responsible community associations will be
crucial to overcome possible evasion and illegal dumping resulting from the use of the Polluter
Pay principle in charging for waste collection service. Issues regarding supervision and
regulatory oversight of the waste management system in Nairobi is a crucial element. Other
crucial elements in this system include the determination of appropriate streamlined collection
fees per kilogram of waste generated including source waste separation costs for all residents to
refer to; determination of on ground implementation implications and charge collection
mechanisms in the Nairobi Context; zoning and contracting arrangements for service provision;
and importantly efficient regulation and supervisory oversight to ensure residents and collectors
are not discarding waste indiscriminately or illegally to avoid charges.
Waste Collector Incentive: Minimising waste disposal transportation costs, and
maximising waste value on the Waste Recovery & Trading Market to improve profit
margins
The inclusion of source separation costs in the streamlined waste collection charges proposed
means the activity can be facilitated infrastructually, with the remainder of the effort towards
achieving behavioural change towards separation largely in the realm of the social (e.g.
awareness campaigns, education curriculum changes etc), and possibly economic incentives.
With the formalisation of waste recovery and trading, and a somewhat low profit margin
above the capturing of bare disposal costs to designated landfill in streamlined collection
charges for private collectors; private waste collectors/CBOs will have an incentive to
encourage separation of waste at source amongst their generator clients and to trade the
resulting high quality recyclables from this on to actors in the waste recovery market, as

40 | P a g e
well as to move generated pure organic waste to semi-decentralised anaerobic digester
facilities to gain higher profit margins through either direct payment at gate for purity, or from
reduced disposal distances as a result of utilising these facilities to offload quality organic
waste. (The potential use of Anaerobic Digester facilities close to source - likely adjacent
to Material Recovery & Transfer Facilities, to handle the organic/biodegradable waste
fraction and benefits.
2.20.3 Implications of Source separation and amplified economic value of waste materials
As a result of the actions proposed above, it is hoped that there will be an up turn in the
quality and amount of available recyclable materials and organic waste. The challenge from
here is to ensure that the City‟s recycling capacity as expressed in Private enterprise, NGO
projects, or other small scale and informal activity, can cope with the increased availability
recyclable material now and in the future. At the moment, reuse and recycling capacity
remains very low in the City.
2.21 Specific Recyclable Stream Strategies
The current total recycling capacity in Nairobi is very low relative to total waste amounts
being generated. With the implementation of waste separation at source as proposed, there
will be an even more urgent need to increase total recycling capacity to take up the increased
volumes of separated quality recyclable material so as to realise significant waste diversion
from landfill.
In July 2006, the KNCPC, supported by UNDP and UNEP, finalized a Comprehensive
Plastic Waste Strategy for Nairobi City centred on the reduction, reuse and recycling of
plastic wastes in the city; with the CCN and the active participation of neighbourhood
associations and CBOs helping to drive this strategy (KNCPC, 2006). While its progress to
date is not yet officially documented, there is a need to develop similar strategies for other
recyclable waste streams chiefly paper. The active involvement here of organisations such

41 | P a g e
as NEMA, various NGOs involved in the waste-to-resource activity, and Academic and
Research Institutions would help aid this. Paper is not a problematic material besides its
capture with minimal contamination, and options exist for its profitable use in direct recycling
in Nairobi for good quality papers, and for its anaerobic digestion for energy and/or thermal
energy recovery in the form of briquetting technologies when unrecyclable. Strategy
efforts similar to the KNCPC Plastics Strategy should therefore be steered towards the
encouragement of private enterprise in paper recycling, organisation and securing of
dependable supply chains for quality material, into research and development of
various technologies to tap into its value, and provision of seed funding for intending
entrepreneurs.
Problematic waste materials that are difficult to recycle or for which recycling capacity is
currently non-existent or overly expensive are proposed to be dealt with via Extended
Producer Responsibility.
2.22 Landfill or End-of-Life Treatment Levies on Problematic Waste Materials

42 | P a g e
Some waste materials generated do not currently have recycling infrastructure in the City or
are altogether not readily recyclable and therefore pose end-of-life problems. Some of these
include broken glass which has limited appropriate recycling infrastructure; and plastic bags
especially less than 30 microns, polystyrene food packaging, waxed paper, tetrapak containers,
Construction & Demolition waste etc which are generally more difficult materials to recycle.
Other candidates to this list would include e-waste, for which no recycling capacity and
legislature currently exists. A proposal here is made to institute National level landfill taxes on
problematic materials, which may also be interpreted as end-of-life treatment or disposal
planning taxes. These taxes or levies would be payable at the gate of manufacturers,
importers or relevant sellers whichever is appropriate, in line with the ethos of Extended
Producer Responsibility, and would flow into a central pool fund to enable the purchase and/or
development of appropriate recycling capacity or end of life treatment infrastructure.
An example of the application of Extended Producer Responsibility is the 2008 Government
exercise duty of 120% on carrier bags, and ban on production of plastic bags of less than 30
micron thickness. In instances where national tax disincentives for such materials already
exist such as in the case of plastic bags, recommendation would be towards the rigorous
implementation of the same.
A successful example of this model of planning for the end-of-life treatment of problematic
wastes is Municipal Council of Nakuru which stipulates under Section 197(i) of their
environmental management by-laws for instance “Any person who uses polythene bags for
whatever purpose in his business or elseswhere shall bear the cost of treating or disposing of
that polythene. (ii) The cost shall not exceed 20% of the Business Permit fee unless the Council
otherwise decides“ (Muraya, 2010; pers. communication).
A similar approach could be taken in Nairobi where manufacturers, businesses, commerce or
other activity as appropriate from which these materials initially originate before entering the
public space would help pay for the infrastructure necessary to recycle or safely dispose these

43 | P a g e
materials, through their annual renewal fees for business permits or licenses. The funds from
this would then go into a central pool for this purpose as described above.
2.23 Ground Implementation of Weight Based Charges and Mechanisms for Charge
collection
A weight based waste collection and fee system seems reasonably implementable in the
Nairobi context through the use of portable hanging scales, with waste weighed under the
supervision of collectors and house/business owners followed by the provision of a receipt
as proof, prior to the receipt of the waste by the collector. In the case of communes such as
apartments or flats where generator differentiation might be difficult, total wastes collected
can be weighed, and the amount due divided evenly and receipted amongst the known
numbers of households or generators in the commune. The generators would then pay
according to the amounts generated, and fee collections can be done directly by the collectors
who would know the area and communities they are dealing with well; bypassing the
need for centralised charge collection with its associated high administration costs
and mismanagement as has been the case in the past (Karanja, 2005).
2.24 Getting general waste collection and safe disposal right
While the ultimate goals of Integrated Solid Waste Management are to reduce waste
being generated at source, derive value from as much of the waste as possible and safely
dispose of residual or left over waste, these goals require long term behavioural changes
and policies whose impact will not be felt from the get go. It is therefore logical to begin any
planning towards this end by getting the general waste collection and disposal system to work
effectively, before emphasis can be turned to waste diversion and value derivation.
While plans for the privatisation of Solid Waste Collection in Nairobi are rightly underway
following JICA‟s (1998) recommendations, the organisation of private waste collection in
the city needs to resolve two major issues;

44 | P a g e
The scattered distribution of private collectors‟ clients (Baud et al, 2004;
Karanja, 2005; UNEP/CCN 3rd ISWM Stakeholder Workshop – Dec. 2009). Because
private waste collectors are profit driven and no legal bounds exist as to their
operational areas or to tie residents to service providers in their locality, collection
service costs will only increase, alienating pockets of residents that cannot afford
the desired rates and in the process running counter to the aims of reasonable collection
charges and equitable collection levels. This is due to the use of non- optimal
collection routes and accumulation of high transport distances on the part of collectors
in trying to get to scattered perceived higher income clients and will
increasingly alienate residents that cannot afford the service.
The non regulation or streamlining of collection fees under the current regime
of open unregulated competition (Baud et al, 2004; Karanja, 2005; UNEP/CCN 3rd
ISWM Stakeholder Workshop – Dec. 2009). The collection of arbitrary service
charges directly from generators by private collectors, especially from households,
only promotes the provision of service to those who can pay the desired arbitrary
rates, leading to the alienation of lower income areas by the majority of private
companies. The official streamlining of charges, along with the formalisation and
encouragement of CBOs as private collection entities free to operate in the lower
income areas they have already become established in, can however help to increase
service provision at reasonable rates in especially lower income areas. Participation in
waste collection generally needs to appeal both to economic viability and the
common good, and streamlined charges should try to balance the two. Indeed there
is evidence to suggest that the „poor‟ are in fact willing to pay for improved service
levels. Esho (1997) (cited in Baud et al, 2004) found that 47% of residents less than
KShs 100/month were willing to pay more than KShs. 200, while 50% of those

45 | P a g e
paying KShs. 300 – 400/month were willing to pay as much as Kshs. 800/month.
Further to this, more recent evidence suggests the same willingness with 76%,
59%, 58% and 67% of respondents in high, middle, low income and surrounding
areas respectively willing to pay for improved waste collection services (UNEP/CCN
3rd ISWM Stakeholder Workshop – Dec. 2009).
Jutta (2010) notes several pivotal lessons learned over the past years from research on
Co-op recycling and is cited directly below:
“Government support is crucial to the recyclers, since they have no capital to
invest in infrastructure and capacity building. Co-operative recycling should not be
treated as a separate program, but rather be integrated into the municipal solid
waste program. Government recognition and commitment are essential.
Co-ops need to work in autonomy, allowing them to adjust to prevailing local
conditions and specific municipal waste management frameworks.
Taking topography into consideration is decisive for pushcartdriven waste collection,
therefore dividing the area into water catchments works well.
Professional relations need to gear the relationship between recycling groups
and the municipality. Paternalistic approaches maintain or create dependency.
A social assistance approach needs to focus on empowerment of the recycling groups
and on strengthening their autonomy.
Recovering the dignity and citizenship of recyclers needs to become a public
responsibility.
Overall, there are many social, environmental, and economic gains for the municipality
from the collection and separation of recyclables; these benefits need to be fully recognized
and valued.

46 | P a g e
A network of recycling social enterprises needs to be in place, together with
adequate policies, protecting the sector against market and price fluctuations.”
2.25 Waste Diversion Strategies: Enabling Waste Recovery & Reuse/Recycling through
source separation of waste
With the efficient collection, streamlined charging and regulation of waste collection in the
City, attention can then turn to diversion strategies to avoid bulk waste volumes going
straight to landfill. The longer term successful diversion of waste necessitates the early
(source) separation of waste to ease downstream recovery and improve captured material
quality at minimal cost. The early implementation of source separation in Nairobi‟s waste
management system would help the City avoid the trap of more expensive and
inflexible mixed-waste mechanical separation systems as is the used in much of the
developed world, where considerable effort and expense has long gone into trying to
disintegrate wastes that are collected mixed. It is also hoped that the amplified economic
value of recyclable and pure organic waste as a result of source separation would create
a reinforcing loop towards more waste recovery and trading activity, and material reuse
and recycling. Waste diversion actions towards enabling waste recovery and
reuse/recycling are described.

47 | P a g e
2.25.1 Waste Separation at Source with Incentives
Source separation is seen as a key component to realising any significant reduction
in waste transported and disposed of at landfill, through its diversion via recovery, trading,
inorganic material recycling and organic waste reuse activity. Several Incentives are
proposed to encourage the separation of waste at source at both the generator and collector
level.
2.25.2 Generator Incentive: Reduced Streamlined Collection fees for separated high
purity recyclable and organic waste
The collection charges described in above are what would be due if residents chose to
simply put all their waste out for disposal with no regard for separation, or in instances
where „separated‟ waste is of low purity. To encourage the active separation of waste for
the down stream recovery of recyclable and upcyclable material, 3 bags would be provided
under this scheme at any one time in the month for the separation of waste into
organic/biodegradable, recyclable and residual fractions. Source separation is also
proposed to be incentivised through a reduced collection fee equal to three quarters of the
residual disposal rates determined for high purity separated recyclables and organic waste.
In line with this, the collection fee applicable for high purity separated recyclables and
quality separated organic waste would be KShs. 2.4/kg separated recyclable or
separated organic residential waste and KShs. 1.5/kg separated recyclable or separated
organic Non-Domestic waste, whereas any residual waste set out for disposal to Dandora
would be charged the previously determined KShs. 3.2/kg residential waste and KShs.
2/kg non-domestic waste. When Ruai becomes the official designated landfill site,
these charges would increase to KShs. 6.9/kg of separated recyclable or separated
organic residential waste, and KShs. 6/kg separated recyclable or separated organic Non-
Domestic waste.

48 | P a g e
The onus for claiming this reduced charge would be placed on the generators (mass media
campaign to make this known to all) to entice them to separate effectively so as to be in a
position to claim the reduction. In the same spirit, private collectors and CBOs/CBEs would
also seek to encourage source separation amongst their clientele in order for them to
collect high purity recyclables and organic waste which can then be traded at higher values
on the waste recovery market and at organic waste anaerobic digester facilities. The reduced
collection service fee for recyclable a n d u p c yc l a b l e waste provides an incentive for
the collectors to „recover‟ and possibly exceed the resulting reduced profit margin through
their active downstream participation in the waste recovery and trading market where
recyclables are traded at an average of about KShs. 2/kg, in effect potentially doubling
the amount they would earn from simply taking the bare disposal cost; - this before
taking into account that waste dealers and traders would likely be located locally meaning
reduced transport distances and costs for collectors for recyclable wastes. Under the reduced
fees for separated recyclables, households and generators actively separating at source
would in turn also pay less for the collection service.
2.25.3 Waste Collector Incentive: Minimising waste disposal transportation costs, and
maximising waste value on the Waste Recovery & Trading Market to improve
profit margins
The inclusion of source separation costs in the streamlined waste collection charges
proposed means the activity can be facilitated infrastructually, with the remainder of the
effort towards management by-laws for instance “Any person who uses polythene bags for
whatever purpose in his business or elseswhere shall bear the cost of treating or disposing
of that polythene. (ii) The cost shall not exceed 20% of the Business Permit fee unless
the Council otherwise decides“ (Muraya,2010; pers. communication).

49 | P a g e
A similar approach could be taken in Nairobi where manufacturers, businesses, commerce
or other activity as appropriate from which these materials initially originate before entering
public space would help pay for the infrastructure necessary to recycle or safely dispose
of these materials, through their annual renewal fees for business permits or licenses. The
funds from this would then go into a central pool for this purpose as described above.
2.26 End fate of residual or un-diverted solid waste in the City: Construction and
Capitalisation of Sanitary Landfill at Ruai
Given that the official designated dumpsite at Dandora has reached full capacity and has
been noted to be responsible for gross environmental and public health hazards (Kimani,
2007), there is an urgent need to accelerate the movement of residual waste disposal to the
proposed new engineered landfill at Ruai as per JICA‟s (1998) recommendations. This
would result in minimised environmental pollutions from the waste, and have long term
implications towards the future ecological and general health of the city. It is envisaged
that such an engineered landfill facility would be primarily for the end disposal of
residual waste with greater emphasis placed on waste diversion for recyclable and
organic/biodegradable materials via value; in order reduce overall disposal distances and
costs, and extend landfill life expectancy.

50 | P a g e
CHAPTER 3
3 RESERCH DESIGN AND METHODOLOGY
This was the overall plan for connecting the conceptual research problems to the pertinent
(and achievable) empirical research. The purpose of the inquiry was to explore on how
various homesteads manage their solid inorganic waste. The main aim of this exploratory
research is to explore the boundaries of the environment in which the problems, opportunities
or situations of interest are likely to reside, and to identify the salient factors or variables that
might be found there and be of relevance to the research.
3.1 Population and Sample
The population in the research were home owners, other people in the home or and especially
those who are concern with the household trash.
3.1.1 Sampling Method
The researcher used random sampling whereby all the possible samples that he/she could take
from the population had the same probability of being chosen, that is, all the elements of the
population had the same probability of being chosen to belong to the sample. The researcher
randomly chose five homesteads for each of the three different estates in Nairobi which are of
different statuses, i.e. Westlands- upper middle to high class
Buruburu-upper low to middle class, and,
Kayole-low to lower middle class
3.1.2 Data collection Procedures/Instruments used
For this study, the main research instruments that were used to collect data and investigate
ways in which homesteads deal with their solid waste were:

51 | P a g e
3.2 Primary sources of data:
3.2.1 Pilot surveys
The researcher conducted a preliminary piece of research before the complete survey to test
the effectiveness of the research methodology. This was completed before the final survey
commenced. The intention was to alert the surveyor to any difficulties that are not anticipated
at the survey proposal stage.
3.1.1 Participatory observation
This was carried out by the researcher through playing an established participant role in the
scenes studied. It is a method of data collection done in the qualitative research paradigm to
gain a close and intimate familiarity with a given group of individuals and their practices
through intensive involvement with people in their cultural environment. (Leedy, 2005,
p.138). This instrument will be appropriate where comprehensive information cannot be
elicited by interviews alone and when the researcher is more interested in behaviour rather
than perceptions of people.
3.1.2 Interview guides
This is a data collection tool involved in presentation of oral-verbal stimuli between the
researcher and the and respondents, the researcher asks questions and the respondent
responds verbally . These face-to-face interviews were employed while the researcher took
notes on the various responses.
3.1.3 Questionnaires
This were a series of questions that the researcher gave the respondents to get certain
information on the topic of upcycling and waste management. The questionnaires were in the
form of a self administered questionnaire i.e. where the respondents were requested to
complete the questionnaire at their own time, it is free from bias of interviewer and
respondents had more time to give well thought answers. The questionnaire was given to
fifteen randomly picked households in three Nairobi estates, five households for each estate.

52 | P a g e
The estates are namely; Westlands, Buruburu and Kayole. The following is a summary of the
data collected:
3.1.4 Photography
The researcher took photographs of the typical residential garbage that are otherwise done
away with but could be upcycled to reduce the amount of waste going to landfills.
3.2 Secondary sources of data
The researcher also used secondary sources of information from text books, journals, the
internet and research papers to provide professional opinions on the problem of solid
household waste going into landfills and causing pollution and also gaining some knowledge
on sustainability in design, more so, upcycling. In addition, the researcher used other
literature from the UN library, The Main Campus Library and the School of Arts and Design
Library

53 | P a g e
CHAPTER FOUR
4 ANALYSIS, PRESENTATION AND INTERPRETATION OF FINDINGS
4.1 Data Analysis Fron the Questionaire
From the series of questions that the researcher gave respondents to get certain information
on the topic of waste management the following is a summary of the responses given
represented in pie charts and frequency polygons.
The researcher found out that an average of 46.67% of homesteads get their trash collected
once a week, 40% twice a week and 13.33% do not get their trash collected, they dispose it
themselves.

54 | P a g e
The researcher found out that an average of 86.69% of people in homesteads know about upcycling
while 13.33% don’t.
The researcher found out that an average of 46% of homesteads re-use their waste, 27%
upcycle and 27% recycle.
Source; Author 2013

55 | P a g e
The researcher found out that an average of 47% of people in homesteads know or have heard about
upcycling while 53% don’t.
Source; Author 2013
The researcher found out that 93% of people know about recycling or have heard about it while 7%
don’t.

56 | P a g e
From the participatory observation and interviews the researcher found out that more waste is
generated at estates of higher income generation because they buy and consume more than
lower generating estates, the researcher also found out an almost negligible amount of people
in homesteads separate their waste (organic and inorganic), others don‟t mainly because they
do not know the importance. Upcycling is a foreign term to many, people should be
sensitized on it and its importance in preserving the environment. People who are more open
to upcycling and recycling know about the pollution caused by waste and hence the masses
should be educated on the above and the importance of solid waste management. The
individual shouldknow that its starts with them, it starts with you.
An average homesteads trash can
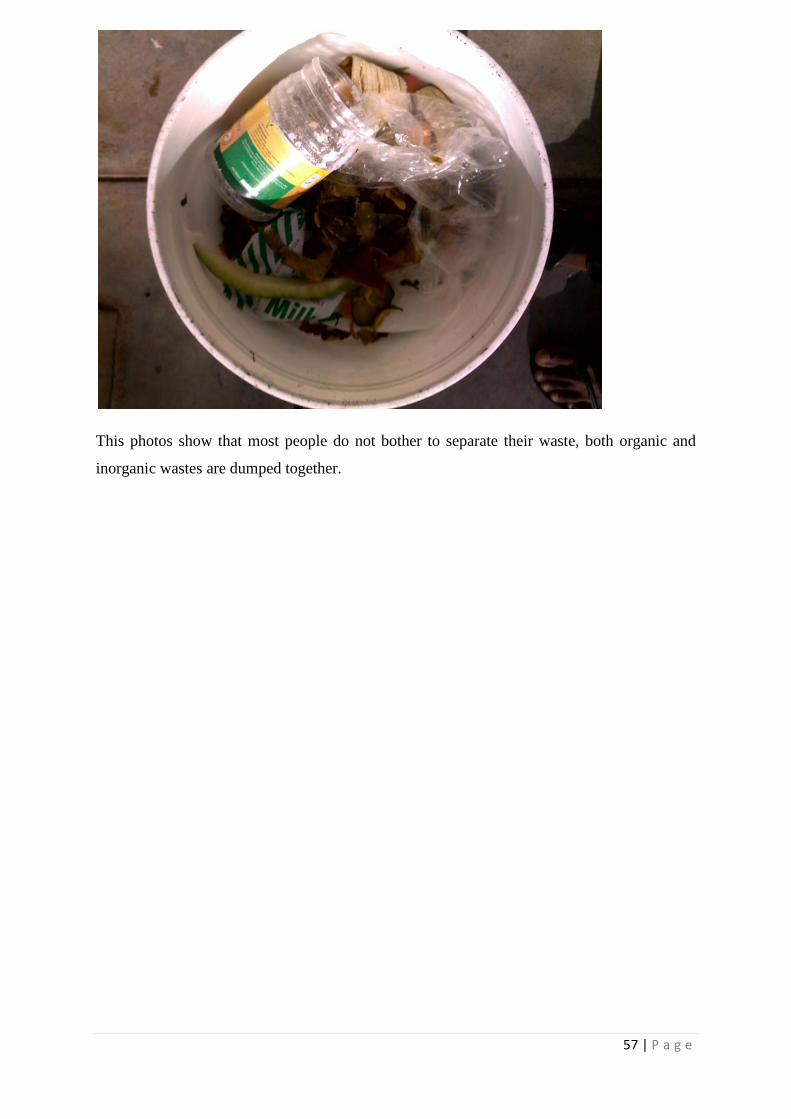
57 | P a g e
This photos show that most people do not bother to separate their waste, both organic and
inorganic wastes are dumped together.

58 | P a g e
CHAPTER FIVE
5. FINDINGS AND RECOMMENDATIONS
5.1 Summary
The survey was successful in answering the research questions and getting insight on the
research problem. The researcher was then able to make recommendations from the
information gathered and the knowledge gained on the subject. The problem is that solid
inorganic waste produced in homesteads ends up in landfills or other dumps and create
pollution in our environment. It is evident that people are not doing enough to reduce their
environmental footprint. In most cases it is because the people are ignorant on the effects of
their homestead waste on the environment, they perceive their waste as being to little to have
any harm but what they do not know is that it is just a tip of the iceberg. For some people it is
because they have not been adequately sensitized on the importance of preserving the
environment and that it starts with the individual. Most people have a mentality that pollution
is only caused by factories and big industries, a big misconception. From the research carried
out and the findings, the researcher was able to come up with recommendations to solving
this problem:
5.2 Recommendations
5.2.1 Separation of waste at source
The researcher recommends that homesteads separate their waste at the source before it is
collected. This will make it simpler for upcycling purposes. The overall goal is to collect and
separate domestic waste at source in an organized way, ensuring that all types of waste, such
as organic waste, recyclable waste and waste for landfill, will be separated and used or
treated based on their characteristics, thereby contributing to environmental protection and
recovery of natural resources.
The specific recommendations are to:

59 | P a g e
To increase public awareness of the need for environmental protection in the city
through waste separation at source that will be carried out by the people themselves.
To recover upcyclable waste and minimize the volume of waste that is sent to the
landfill.
To promote compost production from organic waste.
To minimize the number of dust-carts and trucks on the streets.
To minimize and eventually stop the collection of upcyclable or recyclable waste in
landfill sites, thus protecting workers from diseases arising from an unsanitary
working environment.
5.2.2 Sensitize people on pollution and its effects
People should be sensitized on the importance of conserving the environment so that they can
start picking up practices that promote conservation, example, upcycling, recycling, reusing
etc. It is very important that people know about the magnitude of the problem of pollution at
the moment and the negative effects it has on our environment and the people in general. This
could be done through advertisements, NGO‟s and government institutions should initiate
campaigns on sensitizing people on environmental conservation. Children in schools should
also be educated on the importance of conserving the environment.
5.2.3 Upcycling
Upcycling is greener than recycling and it ultimately decreases the amount of waste we
produce. You find a new purpose for your unwanted items before you throw them away. It‟s
all about taking disposable things and creating something useful from them. Typically, the
designer wants their customers to know the items have been creatively designed from used
products, reaching out to a customer base that appreciates this practice. The former use of the
product is often apparent, rather than hidden, to play up the creative aspect. Usually the only
energy being used is your own and it can save you money too. It also reduces the need for
new virgin material to be harvested as feedstock for new generations of product. In the case
of plastic, this means less oil wells drilled. For metals, less mountains mined. For paper, less

60 | P a g e
trees felled. The researcher will incorporate and merge the following waste items below that
would have otherwise been thrown away in jewellery, sculptures, leatherwork and ceramics
production. This will give a new interpretation to the waste. The researcher will create green,
sustainable, social and cultural sensitive designs.
5.2.3.1 Some of the household waste the researcher recommends for upcycling
Glass Bottles

61 | P a g e
Cosmetics Packaging
Glass

62 | P a g e
Plastic CD covers
Plastic Paperbags

63 | P a g e
Newspapers
Scrap Material

64 | P a g e
Old Clothes
Electronics
Wheel Cups

65 | P a g e
APPENDICES
Appendix1
QUESTIONNAIRE:
Demographic data
Name………………
Age………………...
Location…………...
1.How many times a week is your trash collected?
o Once
o Twice
o Three times
o Other
2.Do you separate your trash? (plastics, glass, organics etc.)
o Yes
o No
3.Do you knowabout recycling?
o Yes
o No
4.Do you know about upcycling? (converting waste materials or useless products into new
materials or products of better quality or for better environmental value)
o Yes
o No
5.Do you reuse, recycle or upcycle your solid waste (or none)?
o Reuse Neither
o Recycle
o Upcycle

66 | P a g e
Appenxix 2
INTERVIEW GUIDE:
1. What is the average amount of waste produced in a homestead?
2. What kind of waste is produced at homesteads?
3. How do homesteads deal with their waste?
4. Do people upcycle their solid waste?
5. Do people separate their waste before collection?

67 | P a g e
Appendix3-Maps
Buruburu Phase 2

68 | P a g e
Westlands

69 | P a g e
Dandora

70 | P a g e
Kayole

71 | P a g e
BIBLIOGRAPHY
William McDonough & Micheal Braungart, Cradle to Cradle, Remaking the Way We Make Things,
2002, Canada: North Point Press.
The GeoJournal Library, edited by Isa Baud, Johan Post and Christine Furedy: Solid Waste
Management and Recycling, 2004, The Netherlands: Kluwer Academic Publishers.
Victor Papanek, The Green Imperative, Ecology and Ethics in Design and Architecture, 2003, United
Kingdom, Thames & Hudson
Baud, I.S.A., Post, J. & Furedy, C. 2004. Solid waste management and recycling actors, partnerships
and policies in Hyderabad, India and Nairobi, Kenya. Illustrated ed.Springer.
Kahiu, 2009. Presentation: Assessment of Current Waste Management Systems: Technology &
Infrastructure. 2nd UNEP/CCN ISWM Training Workshop II – June 2009. Pan Afric Hotel, Nairobi.
Karanja, A. 2005. Solid Waste Management in Nairobi: Actors, Institutional Arrangements and
Contributions to Sustainable Development. PhD in Development Studies, Institute of Social Studies,
The Hague, Netherlands. Available: http://www.shaker.nl.
Kibwage, J. 1996. Towards the Privatisation of Household Solid Waste Management Services in the
City of Nairobi. Masters Thesis. [Online]. Available from:
www.tobaccotobamboo.com/masters_thesis/coverpage.pdf.
Kimani, N.G. 2007. Environmental Pollution and Impacts on Public Health: Implications of the
Dandora Municipal Dumping site in Nairobi, Kenya. United Nations Environment Programme
(UNEP) http://www.unep.org/urban_environment/PDFs/DandoraWasteDump-ReportSummary.pdf
Ngau & Kahiu, 2009. ISWM Secondary Data Report on Solid Waste Inventory in Nairobi: Report of

72 | P a g e
the National Technical Taskforce (NTT) on Preparation of An Integrated Solid Waste management
Plan for Nairobi. Nairobi.
Epc workshop, by Kwami
UNEP & UN-HABITAT- Kenya 2007. City of Nairobi Enviromental Outlook. Nairobi, Kenya,:
United Nations Environmental Programme (UNEP) &United Nations Human Settlementsts in
Developing Countries. Eawag Aquatic Reserch.
Njenga, 2009a. Presentation: Financing Mechanism - Current Earnings & Expenditures - City
Council of Nairobi. 2nd UNEP/CCN ISWM Workshop - July 2009. Pan Afric Hotel, Nairobi, Kenya.
http://www.joelkhovi.wordpress.com/2001/09/07/dandora
http://www.greenling.nationalgeographic.com/recycling vs upcycling
http://www.wikipedia.com
http://www.britannica.com
http://www.entrepreneur.com/articl
http://howstuffworks.com
http://www.googlemaps.com