uob group fixed income investor presentation · aa1 1.11%aa– aa– a2 a aa– a2 68.2%bbb+ a+...
TRANSCRIPT

Discla imer: This mater ial that fol lows is a presentat ion of general background informat ion about the Bank’s act iv i t ies current at the date of the presentat ion. It is informat ion
given in summary form and does not purport to be complete. It is not to be rel ied upon as advice to investors or potentia l investors and does not take into account the
investment object ives, f inancial s ituat ion or needs of any part icular investor . This mater ial should be considered with professional advice when decid ing if an investment is
appropriate. UOB accepts no liabil ity whatsoever with respect to the use of this document or its content.
UOB Group Fixed Income Investor Presentation Strong Business Performance and Balance Sheet Position
September 2018
Private & Confidential
Agenda
2
1. Overview of UOB Group
2. Strong UOB Fundamentals
3. Our Growth Drivers
4. Resilience of the Singapore Housing Market & UOB’s Cover Pool
Appendix:
A. Latest Financials
B. Additional Information on UOB’s Covered Bond Program
C. Macroeconomic Outlook and Banking Regulations
Overview of UOB Group
3
UOB Overview
4
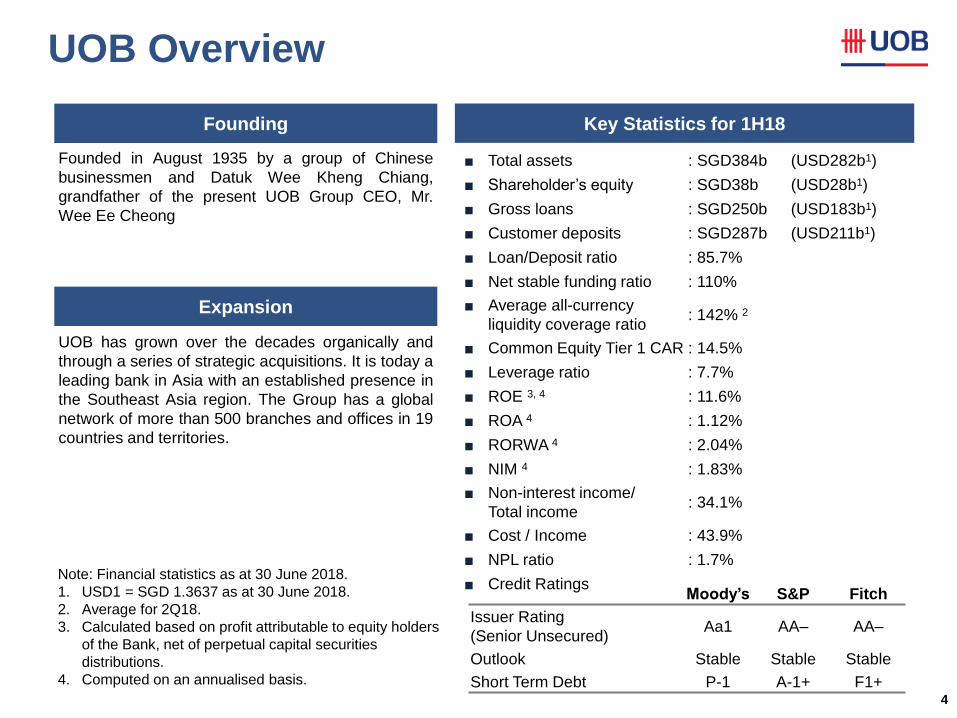
UOB has grown over the decades organically and
through a series of strategic acquisitions. It is today a
leading bank in Asia with an established presence in
the Southeast Asia region. The Group has a global
network of more than 500 branches and offices in 19
countries and territories.
Founding Key Statistics for 1H18
Expansion
Founded in August 1935 by a group of Chinese
businessmen and Datuk Wee Kheng Chiang,
grandfather of the present UOB Group CEO, Mr.
Wee Ee Cheong
Note: Financial statistics as at 30 June 2018.
1. USD1 = SGD 1.3637 as at 30 June 2018.
2. Average for 2Q18.
3. Calculated based on profit attributable to equity holders
of the Bank, net of perpetual capital securities
distributions.
4. Computed on an annualised basis.
Moody’s S&P Fitch
Issuer Rating
(Senior Unsecured) Aa1 AA– AA–
Outlook Stable Stable Stable
Short Term Debt P-1 A-1+ F1+
■ Total assets : SGD384b (USD282b1)
■ Shareholder’s equity : SGD38b (USD28b1)
■ Gross loans : SGD250b (USD183b1)
■ Customer deposits : SGD287b (USD211b1)
■ Loan/Deposit ratio : 85.7%
■ Net stable funding ratio : 110%
■ Average all-currency
liquidity coverage ratio : 142% 2
■ Common Equity Tier 1 CAR : 14.5%
■ Leverage ratio : 7.7%
■ ROE 3, 4 : 11.6%
■ ROA 4 : 1.12%
■ RORWA 4 : 2.04%
■ NIM 4 : 1.83%
■ Non-interest income/
Total income : 34.1%
■ Cost / Income : 43.9%
■ NPL ratio : 1.7%
■ Credit Ratings
A Leading Singapore Bank; Established Franchise in Core Market Segments
5
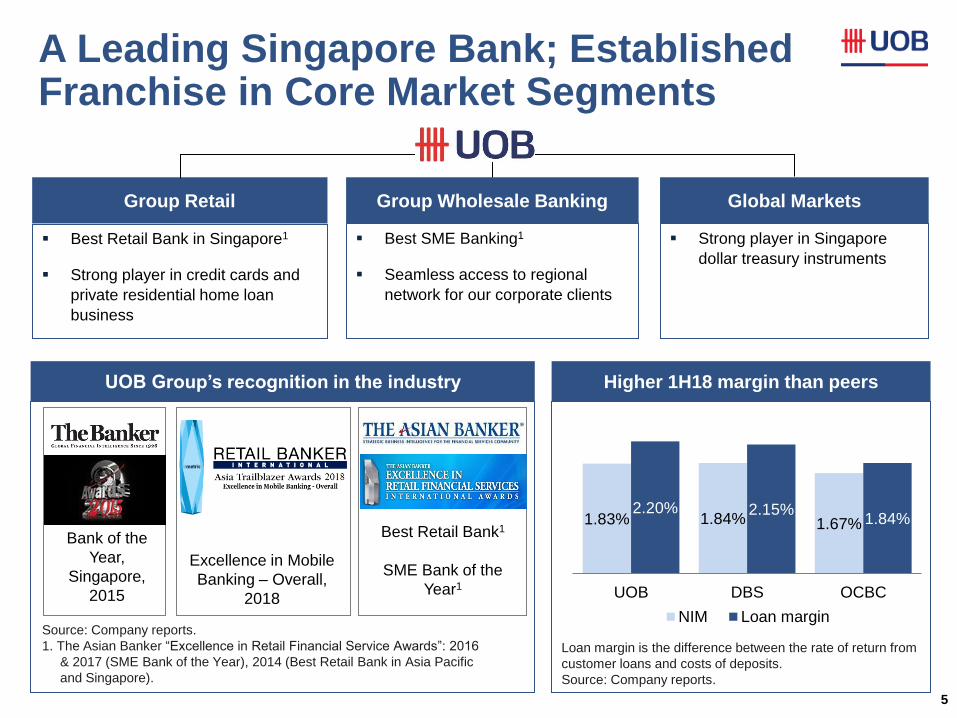
Best Retail Bank in Singapore1
Strong player in credit cards and
private residential home loan
business
Best SME Banking1
Seamless access to regional
network for our corporate clients
Strong player in Singapore
dollar treasury instruments
Group Retail Group Wholesale Banking Global Markets
Best Retail Bank1
SME Bank of the
Year1
Bank of the
Year,
Singapore,
2015
UOB Group’s recognition in the industry Higher 1H18 margin than peers
Source: Company reports.
1. The Asian Banker “Excellence in Retail Financial Service Awards”: 2016
& 2017 (SME Bank of the Year), 2014 (Best Retail Bank in Asia Pacific
and Singapore).
Excellence in Mobile
Banking – Overall,
2018 33% 58%
41% 1.83% 1.84% 1.67%
2.20% 2.15% 1.84%
UOB DBS OCBC
NIM Loan margin
Loan margin is the difference between the rate of return from
customer loans and costs of deposits.
Source: Company reports.
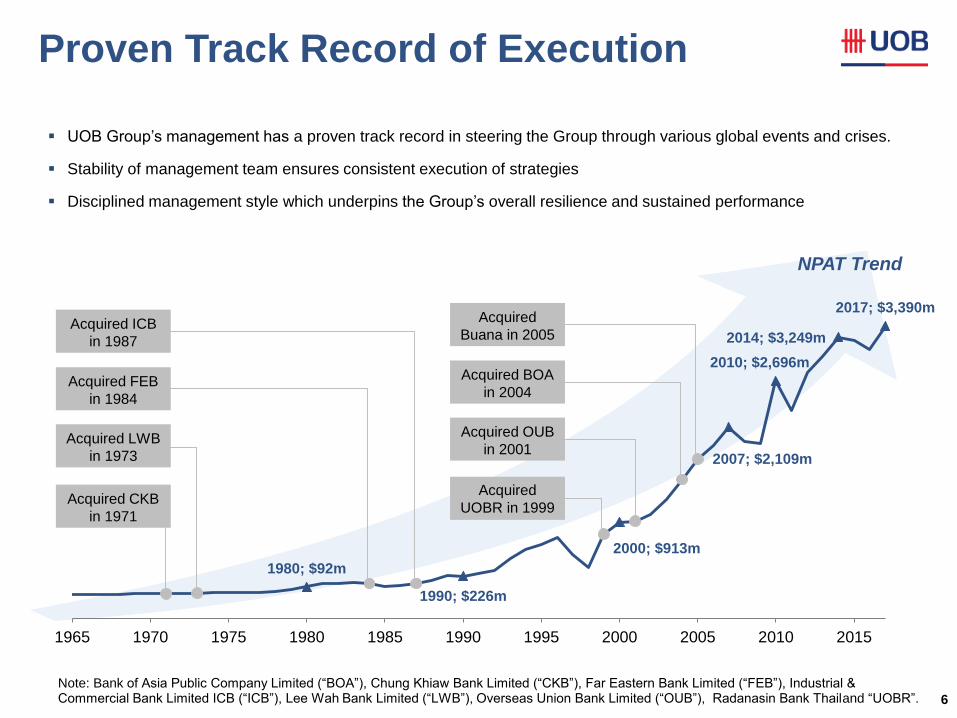
1980; $92m
1990; $226m
2000; $913m
2007; $2,109m
2010; $2,696m
2014; $3,249m
2017; $3,390m
1965 1970 1975 1980 1985 1990 1995 2000 2005 2010 2015
Proven Track Record of Execution
6
UOB Group’s management has a proven track record in steering the Group through various global events and crises.
Stability of management team ensures consistent execution of strategies
Disciplined management style which underpins the Group’s overall resilience and sustained performance
Acquired
UOBR in 1999
Acquired BOA
in 2004
Acquired OUB
in 2001
Acquired CKB
in 1971
Acquired LWB
in 1973
Acquired FEB
in 1984
Acquired ICB
in 1987
Acquired
Buana in 2005
Note: Bank of Asia Public Company Limited (“BOA”), Chung Khiaw Bank Limited (“CKB”), Far Eastern Bank Limited (“FEB”), Industrial & Commercial Bank Limited ICB (“ICB”), Lee Wah Bank Limited (“LWB”), Overseas Union Bank Limited (“OUB”), Radanasin Bank Thailand “UOBR”.
NPAT Trend
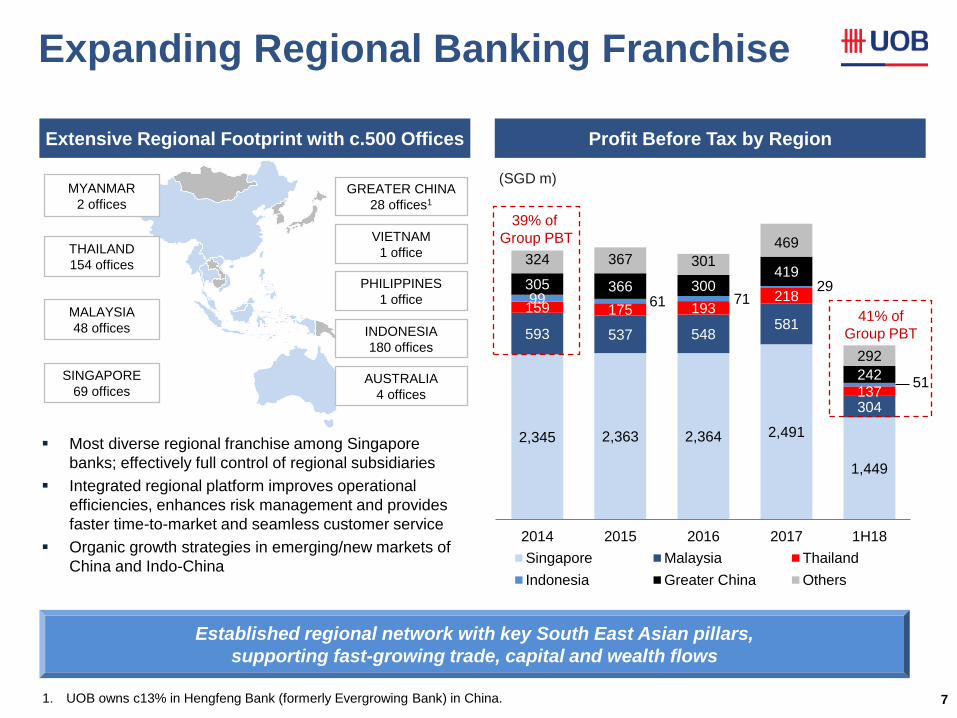
2,345 2,363 2,364 2,491
1,449
593 537 548 581
304
159 175 193 218
137
99 61 71 29
51
305 366 300 419
242
324 367 301
469
292
2014 2015 2016 2017 1H18
Singapore Malaysia Thailand
Indonesia Greater China Others
41% of
Group PBT
Expanding Regional Banking Franchise
7
SINGAPORE
69 offices
THAILAND
154 offices
MALAYSIA
48 offices INDONESIA
180 offices
VIETNAM
1 office
GREATER CHINA
28 offices1
Established regional network with key South East Asian pillars,
supporting fast-growing trade, capital and wealth flows
Profit Before Tax by Region Extensive Regional Footprint with c.500 Offices
Most diverse regional franchise among Singapore
banks; effectively full control of regional subsidiaries
Integrated regional platform improves operational
efficiencies, enhances risk management and provides
faster time-to-market and seamless customer service
Organic growth strategies in emerging/new markets of
China and Indo-China
(SGD m) MYANMAR
2 offices
39% of
Group PBT
1. UOB owns c13% in Hengfeng Bank (formerly Evergrowing Bank) in China.
AUSTRALIA
4 offices
PHILIPPINES
1 office
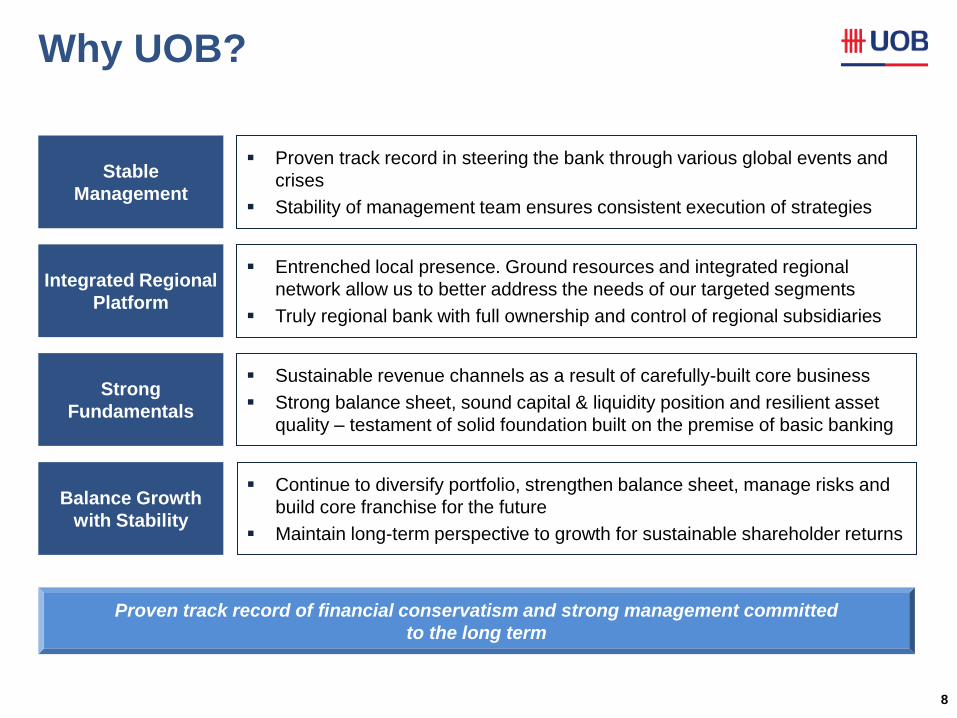
Why UOB?
8
Integrated Regional
Platform
Entrenched local presence. Ground resources and integrated regional
network allow us to better address the needs of our targeted segments
Truly regional bank with full ownership and control of regional subsidiaries
Stable
Management
Proven track record in steering the bank through various global events and
crises
Stability of management team ensures consistent execution of strategies
Strong
Fundamentals
Sustainable revenue channels as a result of carefully-built core business
Strong balance sheet, sound capital & liquidity position and resilient asset
quality – testament of solid foundation built on the premise of basic banking
Balance Growth
with Stability
Continue to diversify portfolio, strengthen balance sheet, manage risks and
build core franchise for the future
Maintain long-term perspective to growth for sustainable shareholder returns
Proven track record of financial conservatism and strong management committed
to the long term
Strong UOB Fundamentals
9
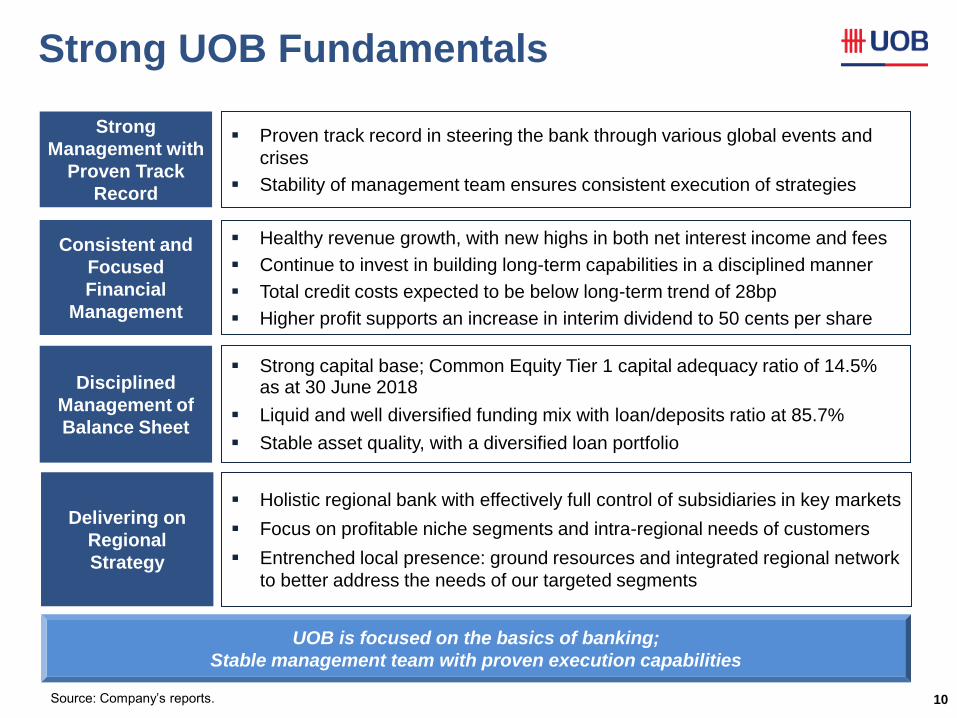
Strong UOB Fundamentals
10
UOB is focused on the basics of banking;
Stable management team with proven execution capabilities
Consistent and
Focused
Financial
Management
Healthy revenue growth, with new highs in both net interest income and fees
Continue to invest in building long-term capabilities in a disciplined manner
Total credit costs expected to be below long-term trend of 28bp
Higher profit supports an increase in interim dividend to 50 cents per share
Strong
Management with
Proven Track
Record
Proven track record in steering the bank through various global events and
crises
Stability of management team ensures consistent execution of strategies
Disciplined
Management of
Balance Sheet
Strong capital base; Common Equity Tier 1 capital adequacy ratio of 14.5% as at 30 June 2018
Liquid and well diversified funding mix with loan/deposits ratio at 85.7%
Stable asset quality, with a diversified loan portfolio
Delivering on
Regional
Strategy
Holistic regional bank with effectively full control of subsidiaries in key markets
Focus on profitable niche segments and intra-regional needs of customers
Entrenched local presence: ground resources and integrated regional network
to better address the needs of our targeted segments
Source: Company’s reports.
Need to think
what to say
Dividend?

Managing Risks for Stable Growth
11
UOB’s GRAS
Manage concentration
risk
Maintain balance sheet
strength
Optimise capital usage
Limit earnings volatility
Build sound reputation
and operating
environment
Nurture core talent
Prudent approach has been
key to delivering sustainable
returns over the years
Institutionalised framework
through Group Risk Appetite
Statement (GRAS):
– Outlines risk and return
objectives to guide strategic
decision-making
– Comprises 6 dimensions and
14 metrics
– Entails instilling prudent
culture as well as establishing
policies and guidelines
– Invests in capabilities,
leverage integrated regional
network to ensure effective
implementation across key
markets and businesses
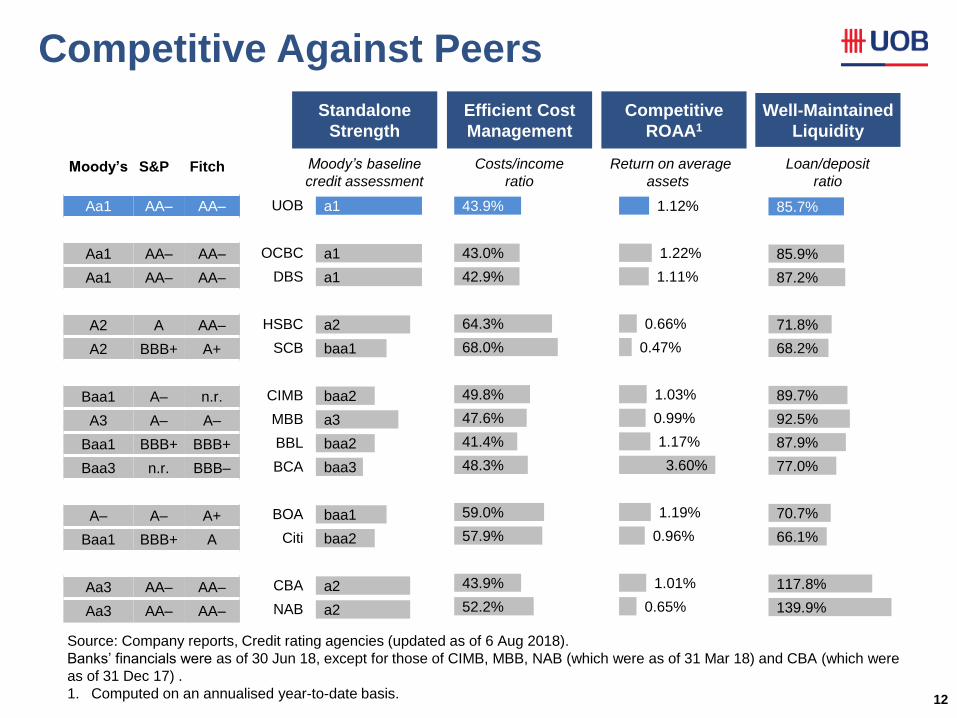
Competitive Against Peers
12
Standalone
Strength
Efficient Cost
Management
Competitive
ROAA1
Well-Maintained
Liquidity
Update to the
latest dataset
(see excel file).
Include all
results
announcements
until 6 Aug 2018
Source: Company reports, Credit rating agencies (updated as of 6 Aug 2018).
Banks’ financials were as of 30 Jun 18, except for those of CIMB, MBB, NAB (which were as of 31 Mar 18) and CBA (which were
as of 31 Dec 17) .
1. Computed on an annualised year-to-date basis.
Moody’s S&P Fitch
Aa1 AA– AA–
Aa1 AA– AA–
Aa1 AA– AA–
A2 A AA–
A2 BBB+ A+
Baa1 A– n.r.
A3 A– A–
Baa1 BBB+ BBB+
Baa3 n.r. BBB–
A– A– A+
Baa1 BBB+ A
Aa3 AA– AA–
Aa3 AA– AA–
Moody’s baseline
credit assessment Costs/income
ratio
Return on average
assets1
Loan/deposit
ratio
a1
a1
a1
a2
baa1
baa2
a3
baa2
baa3
baa1
baa2
a2
a2
UOB
OCBC
DBS
HSBC
SCB
CIMB
MBB
BBL
BCA
BOA
Citi
CBA
NAB
43.9%
43.0%
42.9%
64.3%
68.0%
49.8%
47.6%
41.4%
48.3%
59.0%
57.9%
43.9%
52.2%
1.12%
1.22%
1.11%
0.66%
0.47%
1.03%
0.99%
1.17%
3.60%
1.19%
0.96%
1.01%
0.65%
85.7%
85.9%
87.2%
71.8%
68.2%
89.7%
92.5%
87.9%
77.0%
70.7%
66.1%
117.8%
139.9%
16.0% 7.7% 7.0% 7.0% 6.7% 6.6% 6.4% 5.8% 5.6% 5.4% 5.4%
BCA UOB OCBC DBS BOA Citi CIMB SCB NAB HSBC CBA
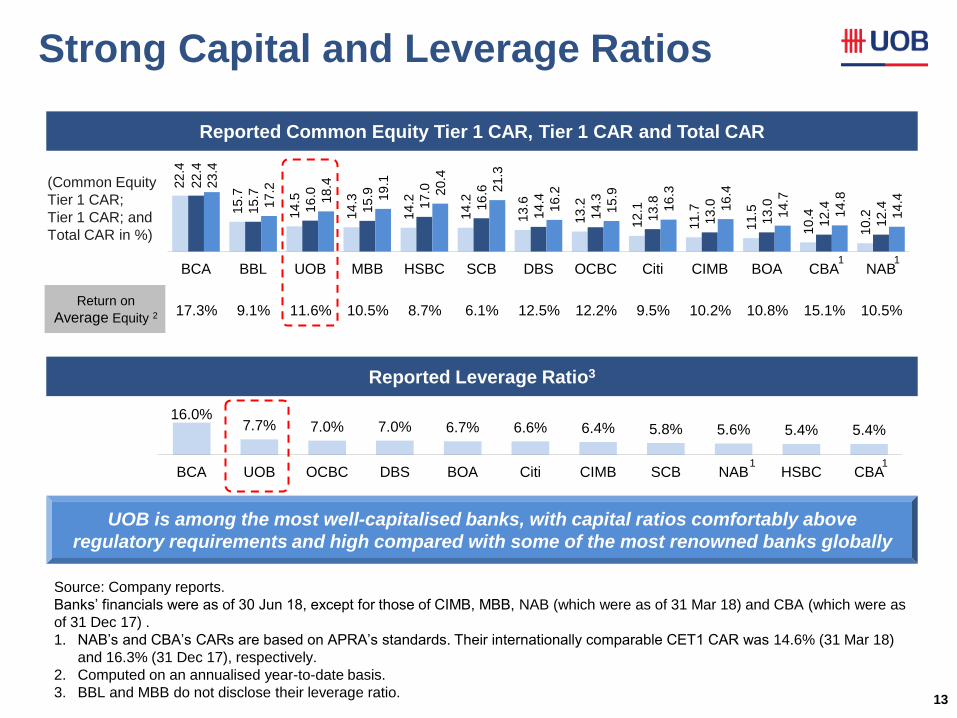
Strong Capital and Leverage Ratios
13
Reported Leverage Ratio3
Reported Common Equity Tier 1 CAR, Tier 1 CAR and Total CAR
UOB is among the most well-capitalised banks, with capital ratios comfortably above
regulatory requirements and high compared with some of the most renowned banks globally
Update to the
latest dataset (see
excel file).
Include all results
announcements
until 6 Aug 2018
Update to the
latest dataset (see
excel file).
Include all results
announcements
until 6 Aug 2018
Update to the latest
dataset (see excel
file).
Include all results
announcements
until 6 Aug 2018
22.4
15.7
14.5
14.3
14.2
14.2
13.6
13.2
12.1
11.7
11.5
10.4
10.2
22.4
15.7
16.0
15.9
17.0
16.6
14.4
14.3
13.8
13.0
13.0
12.4
12.4
23.4
17.2
18.4
19.1
20.4
21.3
16.2
15.9
16.3
16.4
14.7
14.8
14.4
BCA BBL UOB MBB HSBC SCB DBS OCBC Citi CIMB BOA CBA NAB
(Common Equity
Tier 1 CAR;
Tier 1 CAR; and
Total CAR in %)
Return on
Average Equity 2
Source: Company reports.
Banks’ financials were as of 30 Jun 18, except for those of CIMB, MBB, NAB (which were as of 31 Mar 18) and CBA (which were as
of 31 Dec 17) .
1. NAB’s and CBA’s CARs are based on APRA’s standards. Their internationally comparable CET1 CAR was 14.6% (31 Mar 18)
and 16.3% (31 Dec 17), respectively.
2. Computed on an annualised year-to-date basis.
3. BBL and MBB do not disclose their leverage ratio.
1 1
17.3% 9.1% 11.6% 10.5% 8.7% 6.1% 12.5% 12.2% 9.5% 10.2% 10.8% 15.1% 10.5%
1 1
14
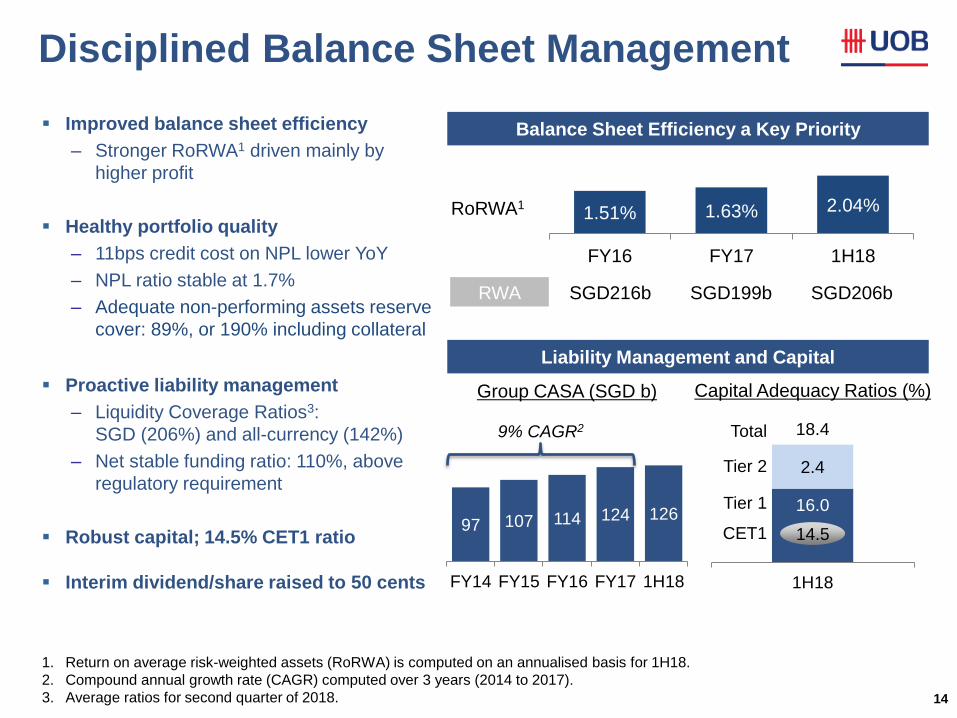
Improved balance sheet efficiency
– Stronger RoRWA1 driven mainly by
higher profit
Healthy portfolio quality
– 11bps credit cost on NPL lower YoY
– NPL ratio stable at 1.7%
– Adequate non-performing assets reserve
cover: 89%, or 190% including collateral
Proactive liability management
– Liquidity Coverage Ratios3:
SGD (206%) and all-currency (142%)
– Net stable funding ratio: 110%, above
regulatory requirement
Robust capital; 14.5% CET1 ratio
Interim dividend/share raised to 50 cents
Capital Adequacy Ratios (%) Group CASA (SGD b)
Balance Sheet Efficiency a Key Priority
Liability Management and Capital
16.0
2.4
18.4
1H18
14.5
Total
Tier 2
Tier 1
CET1
1.51% 1.63% 2.04%
FY16 FY17 1H18
RWA SGD216b SGD199b SGD206b
RoRWA1
Disciplined Balance Sheet Management
97 107 114 124 126
FY14 FY15 FY16 FY17 1H18
9% CAGR2
1. Return on average risk-weighted assets (RoRWA) is computed on an annualised basis for 1H18.
2. Compound annual growth rate (CAGR) computed over 3 years (2014 to 2017).
3. Average ratios for second quarter of 2018.
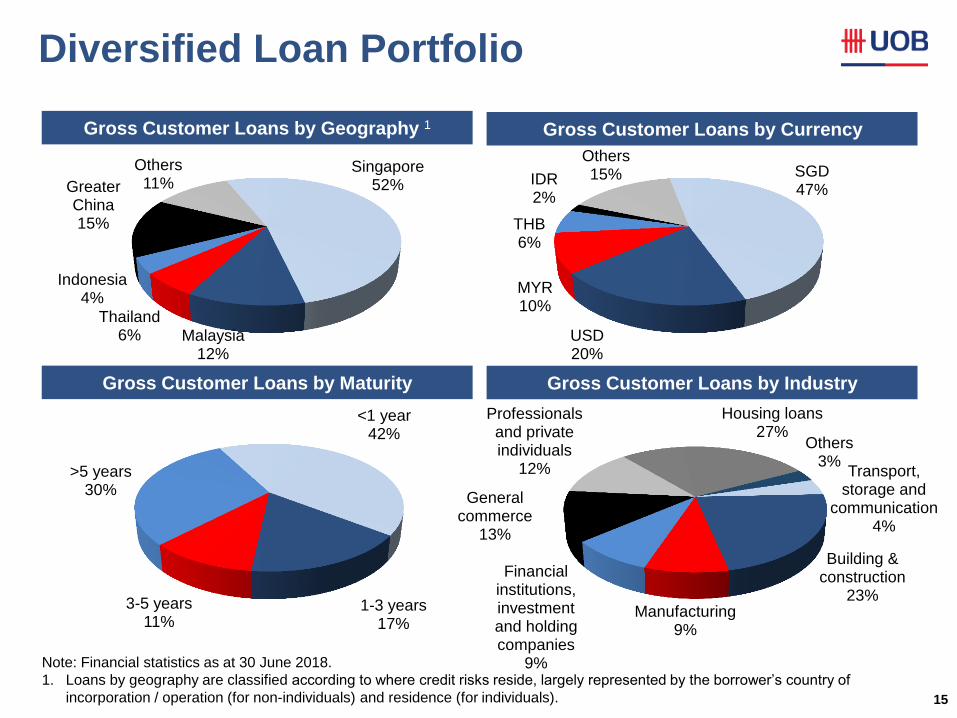
Diversified Loan Portfolio
15
Gross Customer Loans by Maturity
Gross Customer Loans by Industry
Gross Customer Loans by Currency Gross Customer Loans by Geography 1
Singapore 52%
Malaysia 12%
Thailand 6%
Indonesia 4%
Greater China 15%
Others 11%
<1 year 42%
1-3 years 17%
3-5 years 11%
>5 years 30%
Transport, storage and
communication 4%
Building & construction
23% Manufacturing
9%
Financial institutions, investment and holding companies
9%
General commerce
13%
Professionals and private individuals
12%
Housing loans 27%
Others 3%
Note: Financial statistics as at 30 June 2018.
1. Loans by geography are classified according to where credit risks reside, largely represented by the borrower’s country of
incorporation / operation (for non-individuals) and residence (for individuals).
SGD 47%
USD 20%
MYR 10%
THB 6%
IDR 2%
Others 15%
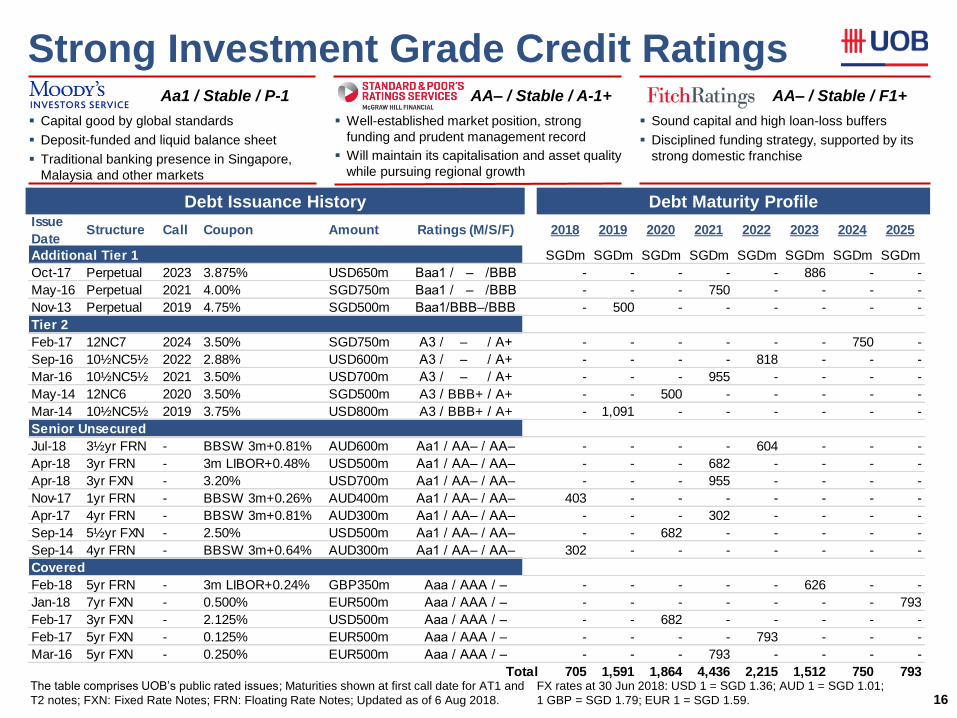
Strong Investment Grade Credit Ratings
16
Issue
DateStructure Call Coupon Amount Ratings (M/S/F) 2018 2019 2020 2021 2022 2023 2024 2025
Additional Tier 1 SGDm SGDm SGDm SGDm SGDm SGDm SGDm SGDm
Oct-17 Perpetual 2023 3.875% USD650m Baa1 / – /BBB - - - - - 886 - -
May-16 Perpetual 2021 4.00% SGD750m Baa1 / – /BBB - - - 750 - - - -
Nov-13 Perpetual 2019 4.75% SGD500m Baa1/BBB–/BBB - 500 - - - - - -
Tier 2
Feb-17 12NC7 2024 3.50% SGD750m A3 / – / A+ - - - - - - 750 -
Sep-16 10½NC5½ 2022 2.88% USD600m A3 / – / A+ - - - - 818 - - -
Mar-16 10½NC5½ 2021 3.50% USD700m A3 / – / A+ - - - 955 - - - -
May-14 12NC6 2020 3.50% SGD500m A3 / BBB+ / A+ - - 500 - - - - -
Mar-14 10½NC5½ 2019 3.75% USD800m A3 / BBB+ / A+ - 1,091 - - - - - -
Senior Unsecured
Jul-18 3½yr FRN - BBSW 3m+0.81% AUD600m Aa1 / AA– / AA– - - - - 604 - - -
Apr-18 3yr FRN - 3m LIBOR+0.48% USD500m Aa1 / AA– / AA– - - - 682 - - - -
Apr-18 3yr FXN - 3.20% USD700m Aa1 / AA– / AA– - - - 955 - - - -
Nov-17 1yr FRN - BBSW 3m+0.26% AUD400m Aa1 / AA– / AA– 403 - - - - - - -
Apr-17 4yr FRN - BBSW 3m+0.81% AUD300m Aa1 / AA– / AA– - - - 302 - - - -
Sep-14 5½yr FXN - 2.50% USD500m Aa1 / AA– / AA– - - 682 - - - - -
Sep-14 4yr FRN - BBSW 3m+0.64% AUD300m Aa1 / AA– / AA– 302 - - - - - - -
Covered
Feb-18 5yr FRN - 3m LIBOR+0.24% GBP350m Aaa / AAA / – - - - - - 626 - -
Jan-18 7yr FXN - 0.500% EUR500m Aaa / AAA / – - - - - - - - 793
Feb-17 3yr FXN - 2.125% USD500m Aaa / AAA / – - - 682 - - - - -
Feb-17 5yr FXN - 0.125% EUR500m Aaa / AAA / – - - - - 793 - - -
Mar-16 5yr FXN - 0.250% EUR500m Aaa / AAA / – - - - 793 - - - -
Total 705 1,591 1,864 4,436 2,215 1,512 750 793
Aa1 / Stable / P-1 AA– / Stable / A-1+ AA– / Stable / F1+
Capital good by global standards
Deposit-funded and liquid balance sheet
Traditional banking presence in Singapore,
Malaysia and other markets
Well-established market position, strong
funding and prudent management record
Will maintain its capitalisation and asset quality
while pursuing regional growth
Sound capital and high loan-loss buffers
Disciplined funding strategy, supported by its
strong domestic franchise
The table comprises UOB’s public rated issues; Maturities shown at first call date for AT1 and
T2 notes; FXN: Fixed Rate Notes; FRN: Floating Rate Notes; Updated as of 6 Aug 2018.
Debt Issuance History Debt Maturity Profile
FX rates at 30 Jun 2018: USD 1 = SGD 1.36; AUD 1 = SGD 1.01;
1 GBP = SGD 1.79; EUR 1 = SGD 1.59.
Review Moody’s
A3 rating on T2
17
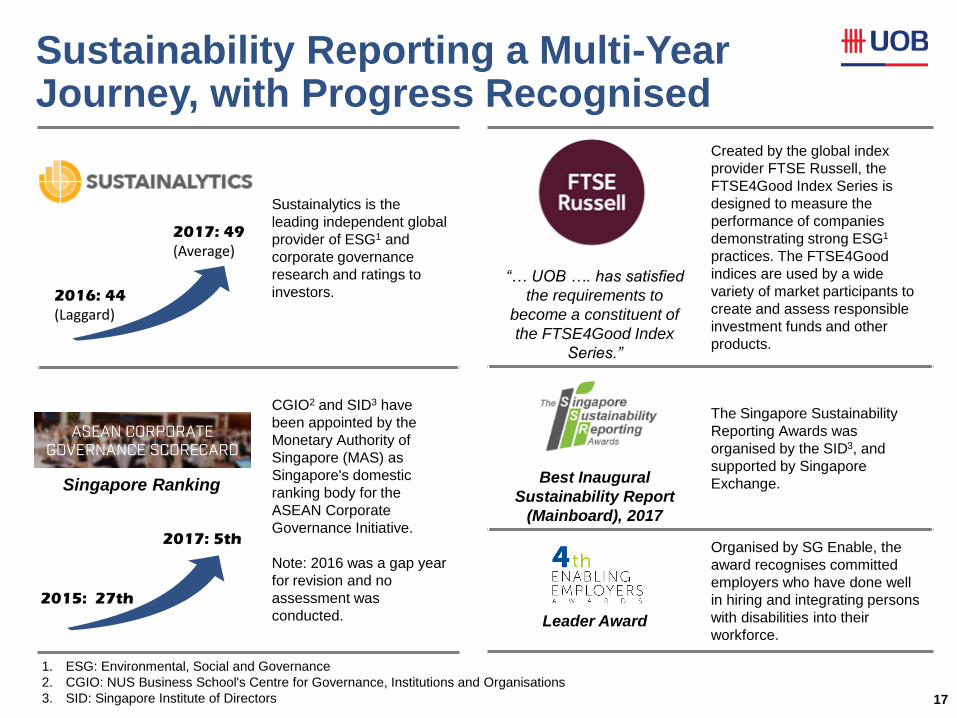
Sustainability Reporting a Multi-Year Journey, with Progress Recognised
Sustainalytics is the
leading independent global
provider of ESG1 and
corporate governance
research and ratings to
investors.
CGIO2 and SID3 have
been appointed by the
Monetary Authority of
Singapore (MAS) as
Singapore's domestic
ranking body for the
ASEAN Corporate
Governance Initiative.
Note: 2016 was a gap year
for revision and no
assessment was
conducted.
2016: 44
(Laggard)
2017: 49
(Average)
2015: 27th
2017: 5th
Singapore Ranking
“… UOB …. has satisfied
the requirements to
become a constituent of
the FTSE4Good Index
Series.”
Created by the global index
provider FTSE Russell, the
FTSE4Good Index Series is
designed to measure the
performance of companies
demonstrating strong ESG1
practices. The FTSE4Good
indices are used by a wide
variety of market participants to
create and assess responsible
investment funds and other
products.
Best Inaugural
Sustainability Report
(Mainboard), 2017
The Singapore Sustainability
Reporting Awards was
organised by the SID3, and
supported by Singapore
Exchange.
Leader Award
Organised by SG Enable, the
award recognises committed
employers who have done well
in hiring and integrating persons
with disabilities into their
workforce.
UOB DBS OCBC
Sustainaltyics
2017 49 52 48
2016 44 47 47
2015 44
2014 42
GTI
2017 100
(11th)
117
(3rd)
104
(9th)
2016 (revised) 93
(14th)
121
(2nd)
101
(9th)
2015 74
2014 75
2013 65
2012 44
2011 41
1. ESG: Environmental, Social and Governance
2. CGIO: NUS Business School's Centre for Governance, Institutions and Organisations
3. SID: Singapore Institute of Directors

Our Growth Drivers
18
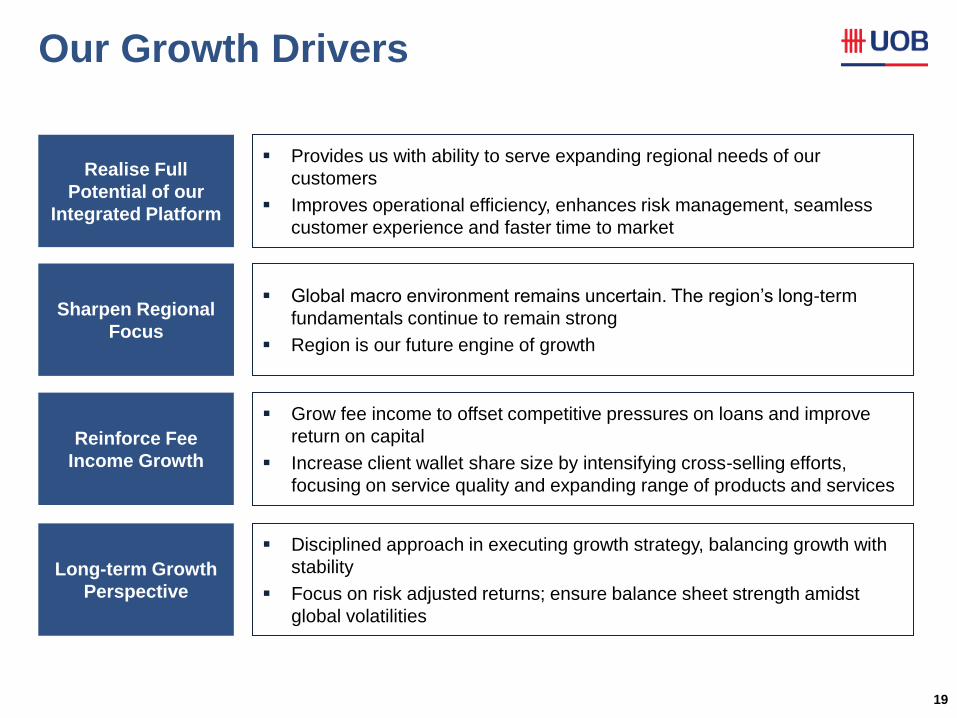
Our Growth Drivers
19
Realise Full
Potential of our
Integrated Platform
Provides us with ability to serve expanding regional needs of our
customers
Improves operational efficiency, enhances risk management, seamless
customer experience and faster time to market
Sharpen Regional
Focus
Global macro environment remains uncertain. The region’s long-term
fundamentals continue to remain strong
Region is our future engine of growth
Grow fee income to offset competitive pressures on loans and improve
return on capital
Increase client wallet share size by intensifying cross-selling efforts,
focusing on service quality and expanding range of products and services
Long-term Growth
Perspective
Disciplined approach in executing growth strategy, balancing growth with
stability
Focus on risk adjusted returns; ensure balance sheet strength amidst
global volatilities
Reinforce Fee
Income Growth
20
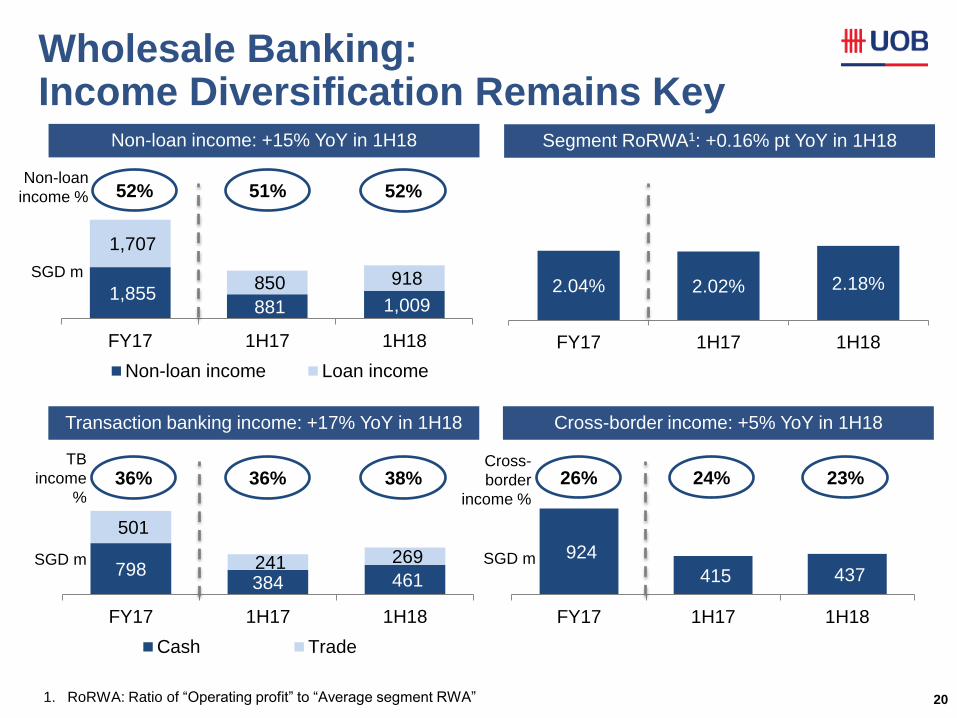
798 384 461
501
241 269
FY17 1H17 1H18
Cash Trade
36% 36% 38%
2.04% 2.02% 2.18%
FY17 1H17 1H18
TB
income
%
SGD m
1,855 881 1,009
1,707
850 918
FY17 1H17 1H18
Non-loan income Loan income
924
415 437
FY17 1H17 1H18
52% 51% 52% Non-loan
income %
26% 24% 23% Cross-
border
income %
SGD m
SGD m
Non-loan income: +15% YoY in 1H18
Cross-border income: +5% YoY in 1H18 Transaction banking income: +17% YoY in 1H18
Segment RoRWA1: +0.16% pt YoY in 1H18
Wholesale Banking: Income Diversification Remains Key
1. RoRWA: Ratio of “Operating profit” to “Average segment RWA”
21
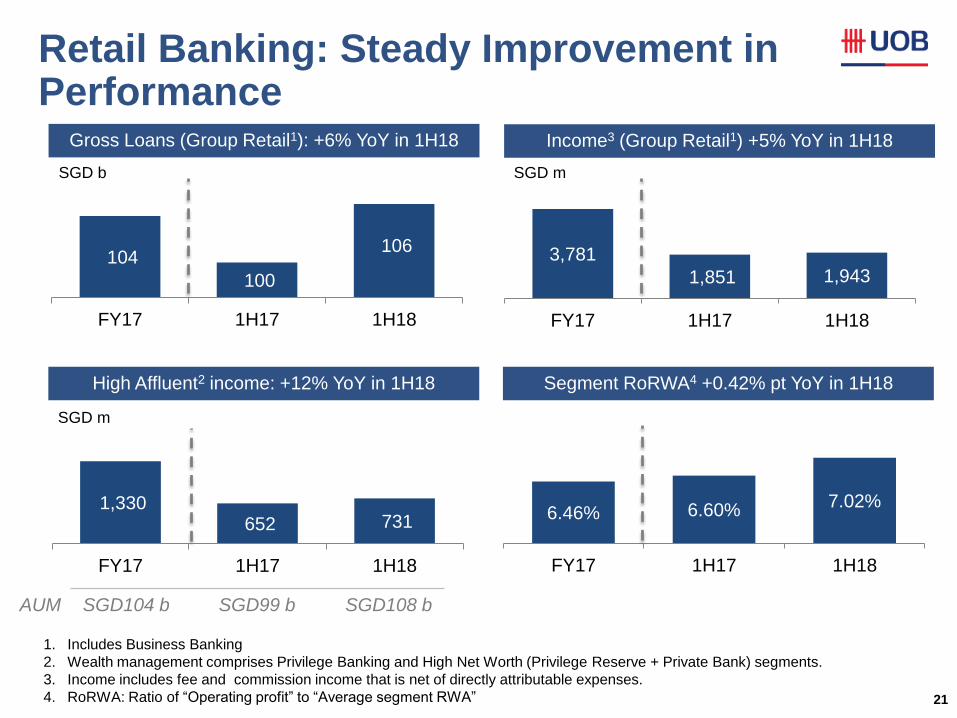
6.46% 6.60% 7.02%
FY17 1H17 1H18
104
100
106
FY17 1H17 1H18
3,781
1,851 1,943
FY17 1H17 1H18
1. Includes Business Banking
2. Wealth management comprises Privilege Banking and High Net Worth (Privilege Reserve + Private Bank) segments.
3. Income includes fee and commission income that is net of directly attributable expenses.
4. RoRWA: Ratio of “Operating profit” to “Average segment RWA”
SGD b
SGD m
SGD m
Gross Loans (Group Retail1): +6% YoY in 1H18
Segment RoRWA4 +0.42% pt YoY in 1H18 High Affluent2 income: +12% YoY in 1H18
Income3 (Group Retail1) +5% YoY in 1H18
Retail Banking: Steady Improvement in Performance
1,330 652 731
FY17 1H17 1H18
AUM SGD104 b SGD99 b SGD108 b
22
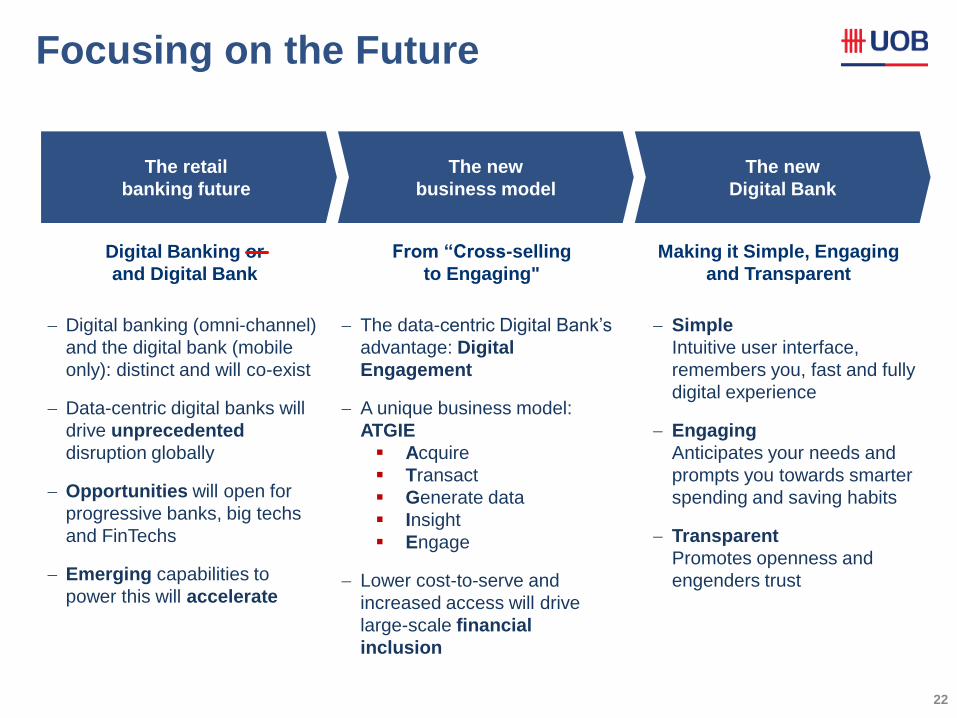
Focusing on the Future
From “Cross-selling
to Engaging"
Making it Simple, Engaging
and Transparent
The new
business model
The new
Digital Bank
The retail
banking future
Digital Banking or
and Digital Bank
Digital banking (omni-channel)
and the digital bank (mobile
only): distinct and will co-exist
Data-centric digital banks will
drive unprecedented
disruption globally
Opportunities will open for
progressive banks, big techs
and FinTechs
Emerging capabilities to
power this will accelerate
The data-centric Digital Bank’s
advantage: Digital
Engagement
A unique business model:
ATGIE
Acquire
Transact
Generate data
Insight
Engage
Lower cost-to-serve and
increased access will drive
large-scale financial
inclusion
Simple
Intuitive user interface,
remembers you, fast and fully
digital experience
Engaging
Anticipates your needs and
prompts you towards smarter
spending and saving habits
Transparent
Promotes openness and
engenders trust
23
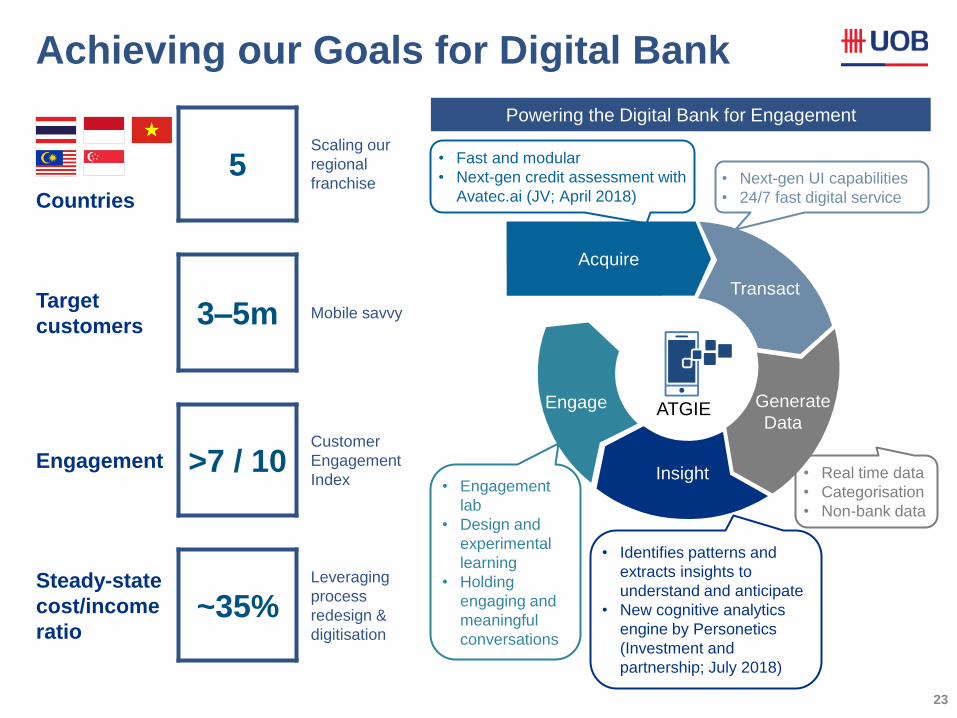
Achieving our Goals for Digital Bank
Countries
5 Scaling our
regional
franchise
Target
customers 3–5m Mobile savvy
Engagement >7 / 10 Customer
Engagement
Index
Steady-state
cost/income
ratio ~35%
Leveraging
process
redesign &
digitisation
Acquire
Transact
Generate
Data
Insight
Engage
Powering the Digital Bank for Engagement
ATGIE
• Fast and modular
• Next-gen credit assessment with
Avatec.ai (JV; April 2018) • Next-gen UI capabilities
• 24/7 fast digital service
• Real time data
• Categorisation
• Non-bank data
• Identifies patterns and
extracts insights to
understand and anticipate
• New cognitive analytics
engine by Personetics
(Investment and
partnership; July 2018)
• Engagement
lab
• Design and
experimental
learning
• Holding
engaging and
meaningful
conversations
Resilience of the Singapore Housing Market & UOB’s Cover Pool
24
49 SG, 46
34
HK, 25
51 CH, 46
17 US, 17 21 AU, 21
2007 2009 2011 2013 2015 2017
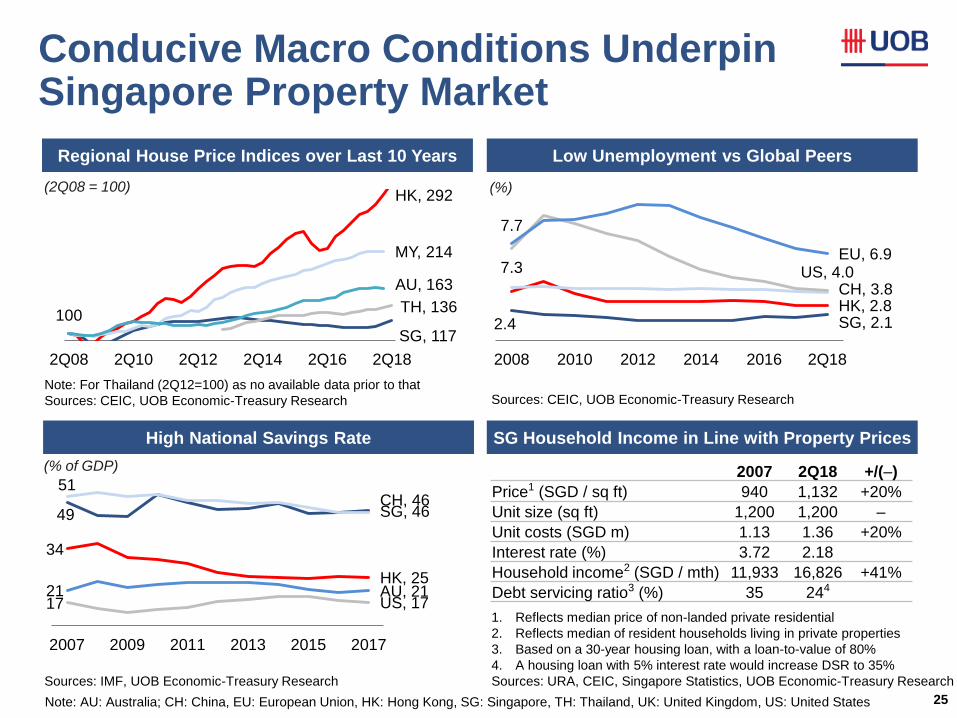
High National Savings Rate SG Household Income in Line with Property Prices
Regional House Price Indices over Last 10 Years Low Unemployment vs Global Peers
SG, 117
HK, 292
100
MY, 214
TH, 136
AU, 163
2Q08 2Q10 2Q12 2Q14 2Q16 2Q18
Conducive Macro Conditions Underpin Singapore Property Market
25
Update 4Q17 to
the latest
dataset
Update 2017 to
the latest
dataset
Update 2017 to
the latest
dataset
Update 2017 to
the latest
dataset
Note: For Thailand (2Q12=100) as no available data prior to that
Sources: CEIC, UOB Economic-Treasury Research
(2Q08 = 100)
Sources: IMF, UOB Economic-Treasury Research
(% of GDP)
(%)
Sources: CEIC, UOB Economic-Treasury Research
1. Reflects median price of non-landed private residential
2. Reflects median of resident households living in private properties
3. Based on a 30-year housing loan, with a loan-to-value of 80%
4. A housing loan with 5% interest rate would increase DSR to 35%
Sources: URA, CEIC, Singapore Statistics, UOB Economic-Treasury Research
2.4 SG, 2.1 HK, 2.8 CH, 3.8
7.3 US, 4.0
7.7
EU, 6.9
2008 2010 2012 2014 2016 2Q18
2007 2Q18 +/(–)
Price1 (SGD / sq ft) 940 1,132 +20%
Unit size (sq ft) 1,200 1,200 –
Unit costs (SGD m) 1.13 1.36 +20%
Interest rate (%) 3.72 2.18
Household income2 (SGD / mth) 11,933 16,826 +41%
Debt servicing ratio3 (%) 35 244
Note: AU: Australia; CH: China, EU: European Union, HK: Hong Kong, SG: Singapore, TH: Thailand, UK: United Kingdom, US: United States
0
20
40
60
80
100
120
140
160
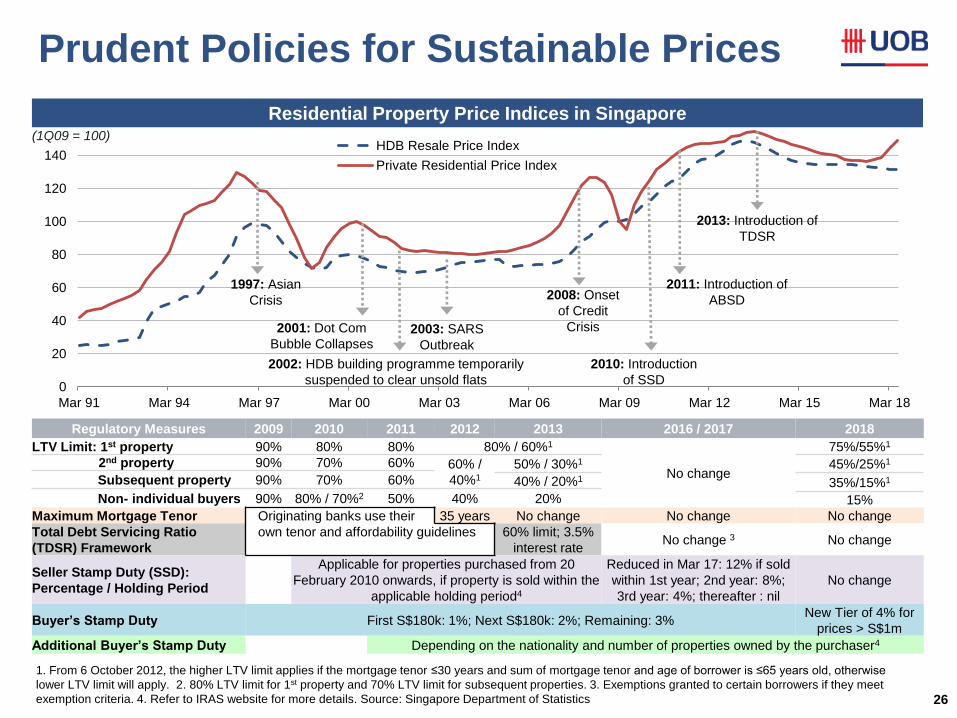
Mar 91 Mar 94 Mar 97 Mar 00 Mar 03 Mar 06 Mar 09 Mar 12 Mar 15 Mar 18
HDB Resale Price Index
Private Residential Price Index
Residential Property Price Indices in Singapore
26
1997: Asian
Crisis
2001: Dot Com
Bubble Collapses
2002: HDB building programme temporarily
suspended to clear unsold flats
2003: SARS
Outbreak
2008: Onset
of Credit
Crisis
2011: Introduction of
ABSD
2010: Introduction
of SSD
2013: Introduction of
TDSR
Regulatory Measures 2009 2010 2011 2012 2013 2016 / 2017 2018
LTV Limit: 1st property 90% 80% 80% 80% / 60%1
No change
75%/55%1
2nd property 90% 70% 60% 60% /
40%1
50% / 30%1 45%/25%1
Subsequent property 90% 70% 60% 40% / 20%1 35%/15%1
Non- individual buyers 90% 80% / 70%2 50% 40% 20% 15%
Maximum Mortgage Tenor Originating banks use their 35 years No change No change No change
Total Debt Servicing Ratio
(TDSR) Framework
own tenor and affordability guidelines 60% limit; 3.5%
interest rate No change 3 No change
Seller Stamp Duty (SSD):
Percentage / Holding Period
Applicable for properties purchased from 20
February 2010 onwards, if property is sold within the
applicable holding period4
Reduced in Mar 17: 12% if sold
within 1st year; 2nd year: 8%;
3rd year: 4%; thereafter : nil No change
Buyer’s Stamp Duty First S$180k: 1%; Next S$180k: 2%; Remaining: 3% New Tier of 4% for
prices > S$1m
Additional Buyer’s Stamp Duty Depending on the nationality and number of properties owned by the purchaser4
Updated by
CTU 31 Aug
2018
1. From 6 October 2012, the higher LTV limit applies if the mortgage tenor ≤30 years and sum of mortgage tenor and age of borrower is ≤65 years old, otherwise
lower LTV limit will apply. 2. 80% LTV limit for 1st property and 70% LTV limit for subsequent properties. 3. Exemptions granted to certain borrowers if they meet
exemption criteria. 4. Refer to IRAS website for more details. Source: Singapore Department of Statistics
Prudent Policies for Sustainable Prices
(1Q09 = 100)
27
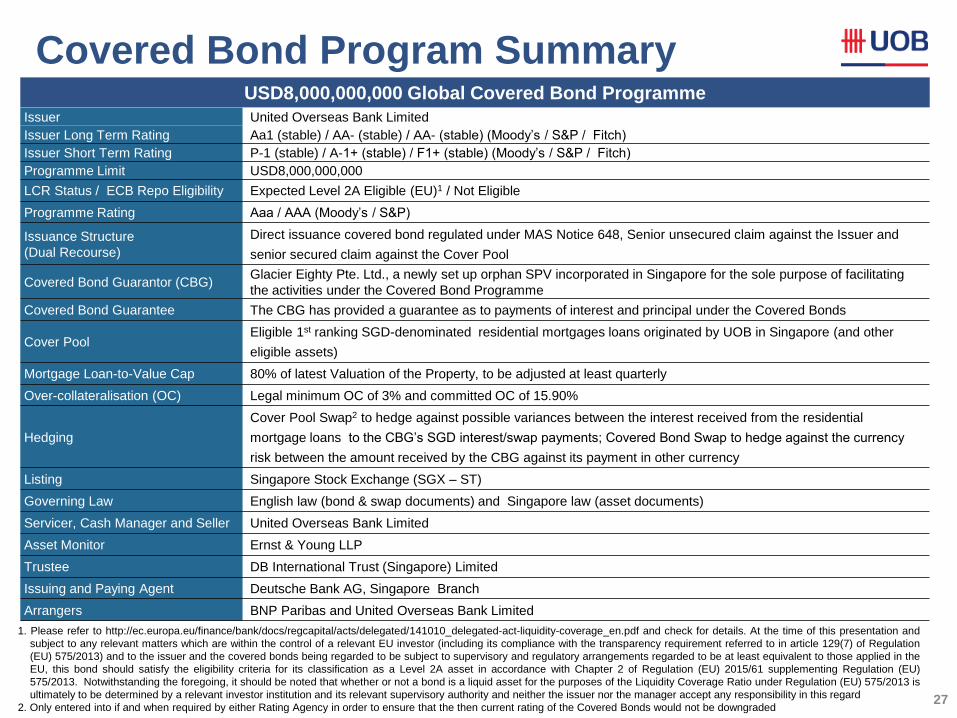
Covered Bond Program Summary USD8,000,000,000 Global Covered Bond Programme
1. Please refer to http://ec.europa.eu/finance/bank/docs/regcapital/acts/delegated/141010_delegated-act-liquidity-coverage_en.pdf and check for details. At the time of this presentation and
subject to any relevant matters which are within the control of a relevant EU investor (including its compliance with the transparency requirement referred to in article 129(7) of Regulation
(EU) 575/2013) and to the issuer and the covered bonds being regarded to be subject to supervisory and regulatory arrangements regarded to be at least equivalent to those applied in the
EU, this bond should satisfy the eligibility criteria for its classification as a Level 2A asset in accordance with Chapter 2 of Regulation (EU) 2015/61 supplementing Regulation (EU)
575/2013. Notwithstanding the foregoing, it should be noted that whether or not a bond is a liquid asset for the purposes of the Liquidity Coverage Ratio under Regulation (EU) 575/2013 is
ultimately to be determined by a relevant investor institution and its relevant supervisory authority and neither the issuer nor the manager accept any responsibility in this regard
2. Only entered into if and when required by either Rating Agency in order to ensure that the then current rating of the Covered Bonds would not be downgraded
Issuer United Overseas Bank Limited
Issuer Long Term Rating Aa1 (stable) / AA- (stable) / AA- (stable) (Moody’s / S&P / Fitch)
Issuer Short Term Rating P-1 (stable) / A-1+ (stable) / F1+ (stable) (Moody’s / S&P / Fitch)
Programme Limit USD8,000,000,000
LCR Status / ECB Repo Eligibility Expected Level 2A Eligible (EU)1 / Not Eligible
Programme Rating Aaa / AAA (Moody’s / S&P)
Issuance Structure
(Dual Recourse)
Direct issuance covered bond regulated under MAS Notice 648, Senior unsecured claim against the Issuer and
senior secured claim against the Cover Pool
Covered Bond Guarantor (CBG) Glacier Eighty Pte. Ltd., a newly set up orphan SPV incorporated in Singapore for the sole purpose of facilitating
the activities under the Covered Bond Programme
Covered Bond Guarantee The CBG has provided a guarantee as to payments of interest and principal under the Covered Bonds
Cover Pool Eligible 1st ranking SGD-denominated residential mortgages loans originated by UOB in Singapore (and other
eligible assets)
Mortgage Loan-to-Value Cap 80% of latest Valuation of the Property, to be adjusted at least quarterly
Over-collateralisation (OC) Legal minimum OC of 3% and committed OC of 15.90%
Hedging
Cover Pool Swap2 to hedge against possible variances between the interest received from the residential
mortgage loans to the CBG’s SGD interest/swap payments; Covered Bond Swap to hedge against the currency
risk between the amount received by the CBG against its payment in other currency
Listing Singapore Stock Exchange (SGX – ST)
Governing Law English law (bond & swap documents) and Singapore law (asset documents)
Servicer, Cash Manager and Seller United Overseas Bank Limited
Asset Monitor Ernst & Young LLP
Trustee DB International Trust (Singapore) Limited
Issuing and Paying Agent Deutsche Bank AG, Singapore Branch
Arrangers BNP Paribas and United Overseas Bank Limited
Should not
change
28
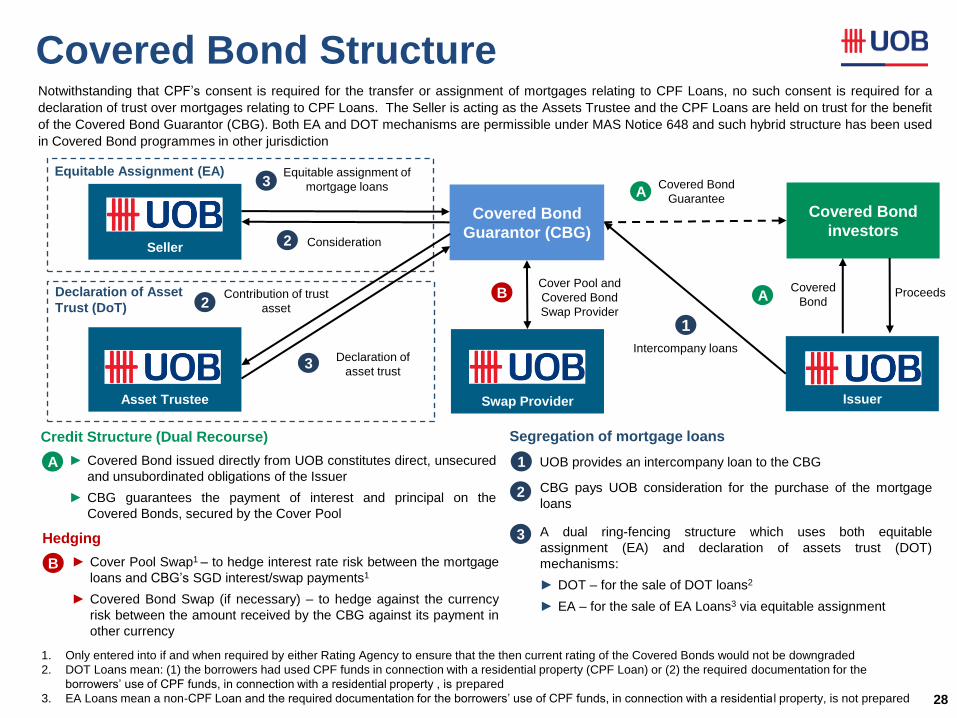
Covered Bond Structure Notwithstanding that CPF’s consent is required for the transfer or assignment of mortgages relating to CPF Loans, no such consent is required for a
declaration of trust over mortgages relating to CPF Loans. The Seller is acting as the Assets Trustee and the CPF Loans are held on trust for the benefit
of the Covered Bond Guarantor (CBG). Both EA and DOT mechanisms are permissible under MAS Notice 648 and such hybrid structure has been used
in Covered Bond programmes in other jurisdiction
Covered
Bond
Covered Bond
Guarantor (CBG) Seller Consideration
Equitable assignment of
mortgage loans
Asset Trustee
Declaration of
asset trust
Equitable Assignment (EA)
Declaration of Asset
Trust (DoT) Contribution of trust
asset
Issuer
Covered Bond
investors
Intercompany loans
Covered Bond
Guarantee
1
Proceeds
Swap Provider
Cover Pool and
Covered Bond
Swap Provider 2
2
3
3
A
A
B
2
Segregation of mortgage loans
A dual ring-fencing structure which uses both equitable
assignment (EA) and declaration of assets trust (DOT)
mechanisms:
► DOT – for the sale of DOT loans2
► EA – for the sale of EA Loans3 via equitable assignment
1 UOB provides an intercompany loan to the CBG
CBG pays UOB consideration for the purchase of the mortgage
loans
3
Credit Structure (Dual Recourse)
A ► Covered Bond issued directly from UOB constitutes direct, unsecured
and unsubordinated obligations of the Issuer
► CBG guarantees the payment of interest and principal on the
Covered Bonds, secured by the Cover Pool
Hedging
B ► Cover Pool Swap1 – to hedge interest rate risk between the mortgage
loans and CBG’s SGD interest/swap payments1
► Covered Bond Swap (if necessary) – to hedge against the currency
risk between the amount received by the CBG against its payment in
other currency
1. Only entered into if and when required by either Rating Agency to ensure that the then current rating of the Covered Bonds would not be downgraded
2. DOT Loans mean: (1) the borrowers had used CPF funds in connection with a residential property (CPF Loan) or (2) the required documentation for the
borrowers’ use of CPF funds, in connection with a residential property , is prepared
3. EA Loans mean a non-CPF Loan and the required documentation for the borrowers’ use of CPF funds, in connection with a residentia l property, is not prepared
Should not
change
29
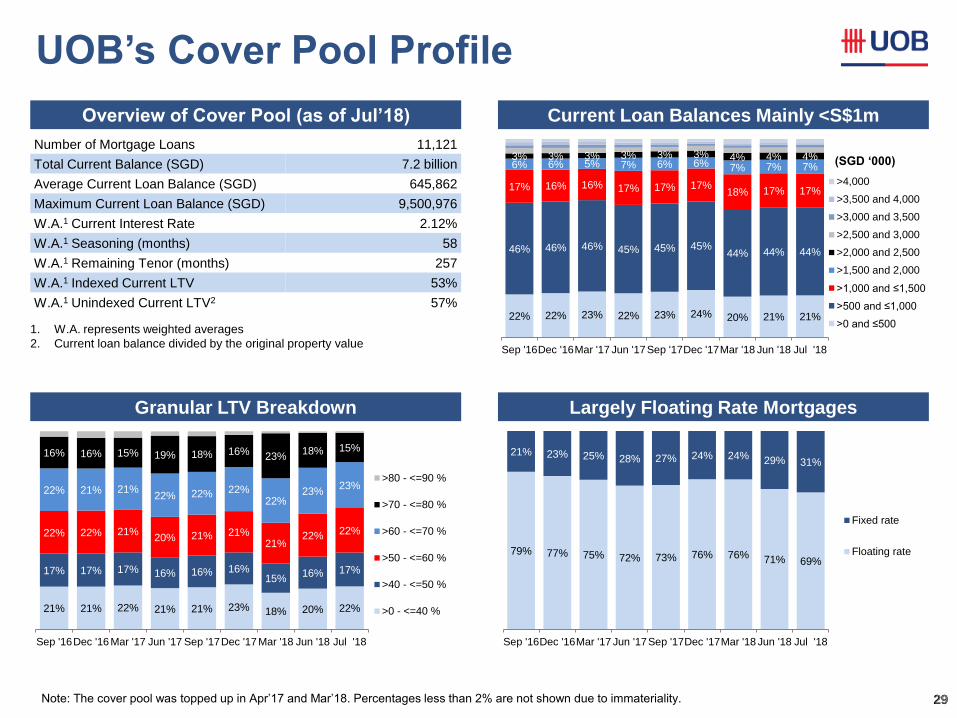
Overview of Cover Pool (as of Jul’18) Current Loan Balances Mainly <S$1m
Granular LTV Breakdown Largely Floating Rate Mortgages
Number of Mortgage Loans 11,121
Total Current Balance (SGD) 7.2 billion
Average Current Loan Balance (SGD) 645,862
Maximum Current Loan Balance (SGD) 9,500,976
W.A.1 Current Interest Rate 2.12%
W.A.1 Seasoning (months) 58
W.A.1 Remaining Tenor (months) 257
W.A.1 Indexed Current LTV 53%
W.A.1 Unindexed Current LTV2 57%
1. W.A. represents weighted averages
2. Current loan balance divided by the original property value
29
Updated by
CTU 31 Aug
2018 22% 22% 23% 22% 23% 24% 20% 21% 21%
46% 46% 46% 45% 45% 45% 44% 44% 44%
17% 16% 16% 17% 17% 17% 18% 17% 17%
6% 6% 5% 7% 6% 6% 7% 7% 7% 3% 3% 3% 3% 3% 3% 4% 4% 4%
Sep '16Dec '16Mar '17 Jun '17Sep '17Dec '17Mar '18 Jun '18 Jul '18
>4,000
>3,500 and 4,000
>3,000 and 3,500
>2,500 and 3,000
>2,000 and 2,500
>1,500 and 2,000
>1,000 and ≤1,500
>500 and ≤1,000
>0 and ≤500
(SGD ‘000)
21% 21% 22% 21% 21% 23% 18% 20% 22%
17% 17% 17% 16% 16% 16% 15%
16% 17%
22% 22% 21% 20% 21% 21%
21% 22% 22%
22% 21% 21% 22% 22% 22%
22% 23%
23%
16% 16% 15% 19% 18% 16% 23% 18% 15%
Sep '16Dec '16 Mar '17 Jun '17 Sep '17Dec '17Mar '18 Jun '18 Jul '18
>80 - <=90 %
>70 - <=80 %
>60 - <=70 %
>50 - <=60 %
>40 - <=50 %
>0 - <=40 %
79% 77% 75% 72% 73% 76% 76% 71% 69%
21% 23% 25% 28% 27% 24% 24% 29% 31%
Sep '16Dec '16Mar '17 Jun '17Sep '17Dec '17Mar '18 Jun '18 Jul '18
Fixed rate
Floating rate
UOB’s Cover Pool Profile
Note: The cover pool was topped up in Apr’17 and Mar’18. Percentages less than 2% are not shown due to immateriality.
30
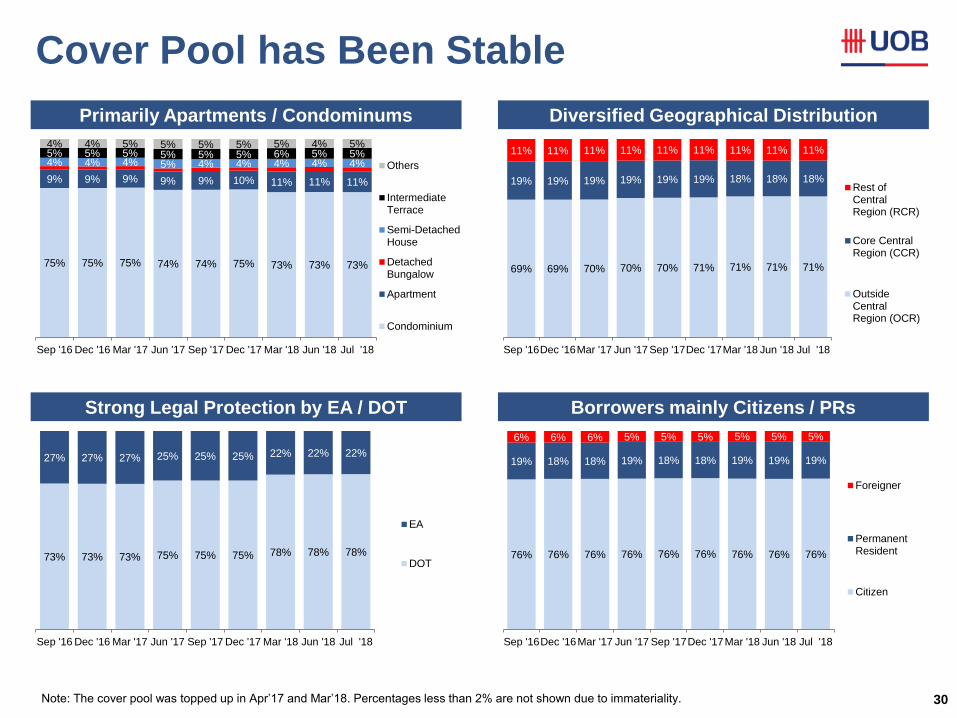
Primarily Apartments / Condominums Diversified Geographical Distribution
Strong Legal Protection by EA / DOT Borrowers mainly Citizens / PRs
Updated by
CTU 31 Aug
2018
75% 75% 75% 74% 74% 75% 73% 73% 73%
9% 9% 9% 9% 9% 10% 11% 11% 11%
4% 4% 4% 5% 4% 4% 4% 4% 4% 5% 5% 5% 5% 5% 5% 6% 5% 5% 4% 4% 5% 5% 5% 5% 5% 4% 5%
Sep '16 Dec '16 Mar '17 Jun '17 Sep '17 Dec '17 Mar '18 Jun '18 Jul '18
Others
IntermediateTerrace
Semi-DetachedHouse
DetachedBungalow
Apartment
Condominium
69% 69% 70% 70% 70% 71% 71% 71% 71%
19% 19% 19% 19% 19% 19% 18% 18% 18%
11% 11% 11% 11% 11% 11% 11% 11% 11%
Sep '16Dec '16Mar '17 Jun '17 Sep '17Dec '17Mar '18 Jun '18 Jul '18
Rest ofCentralRegion (RCR)
Core CentralRegion (CCR)
OutsideCentralRegion (OCR)
73% 73% 73% 75% 75% 75% 78% 78% 78%
27% 27% 27% 25% 25% 25% 22% 22% 22%
Sep '16 Dec '16 Mar '17 Jun '17 Sep '17 Dec '17 Mar '18 Jun '18 Jul '18
EA
DOT76% 76% 76% 76% 76% 76% 76% 76% 76%
19% 18% 18% 19% 18% 18% 19% 19% 19%
6% 6% 6% 5% 5% 5% 5% 5% 5%
Sep '16Dec '16Mar '17 Jun '17 Sep '17Dec '17Mar '18 Jun '18 Jul '18
Foreigner
PermanentResident
Citizen
Cover Pool has Been Stable
Note: The cover pool was topped up in Apr’17 and Mar’18. Percentages less than 2% are not shown due to immateriality.
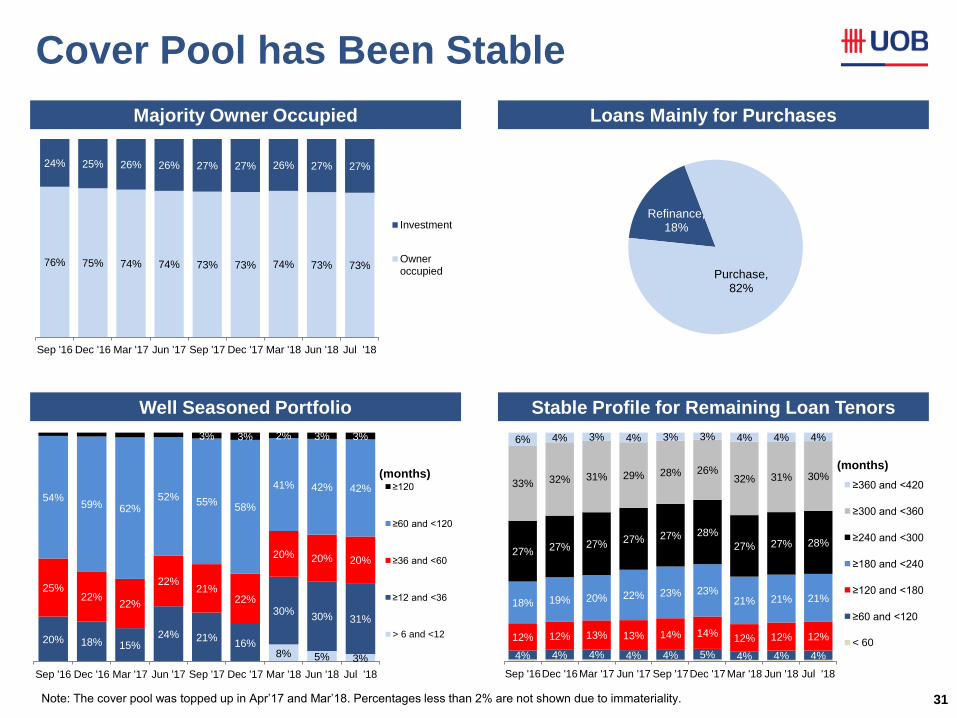
Majority Owner Occupied Loans Mainly for Purchases
Well Seasoned Portfolio Stable Profile for Remaining Loan Tenors
31
Updated by
CTU 31 Aug
2018
Refinance, 18%
Purchase, 82%
76% 75% 74% 74% 73% 73% 74% 73% 73%
24% 25% 26% 26% 27% 27% 26% 27% 27%
Sep '16 Dec '16 Mar '17 Jun '17 Sep '17 Dec '17 Mar '18 Jun '18 Jul '18
Investment
Owneroccupied
4% 4% 4% 4% 4% 5% 4% 4% 4%
12% 12% 13% 13% 14% 14% 12% 12% 12%
18% 19% 20% 22% 23% 23% 21% 21% 21%
27% 27% 27% 27% 27% 28%
27% 27% 28%
33% 32% 31% 29% 28% 26% 32% 31% 30%
6% 4% 3% 4% 3% 3% 4% 4% 4%
Sep '16Dec '16 Mar '17 Jun '17 Sep '17Dec '17 Mar '18 Jun '18 Jul '18
≥360 and <420
≥300 and <360
≥240 and <300
≥180 and <240
≥120 and <180
≥60 and <120
< 60
Cover Pool has Been Stable
Note: The cover pool was topped up in Apr’17 and Mar’18. Percentages less than 2% are not shown due to immateriality.
(months) (months)
8% 5% 3%
20% 18% 15% 24% 21%
16%
30% 30% 31%
25% 22%
22%
22% 21%
22%
20% 20% 20%
54% 59% 62%
52% 55%
58%
41% 42% 42%
3% 3% 2% 3% 3%
Sep '16 Dec '16 Mar '17 Jun '17 Sep '17 Dec '17 Mar '18 Jun '18 Jul '18
≥120
≥60 and <120
≥36 and <60
≥12 and <36
> 6 and <12
Appendix A: Latest Financials
32
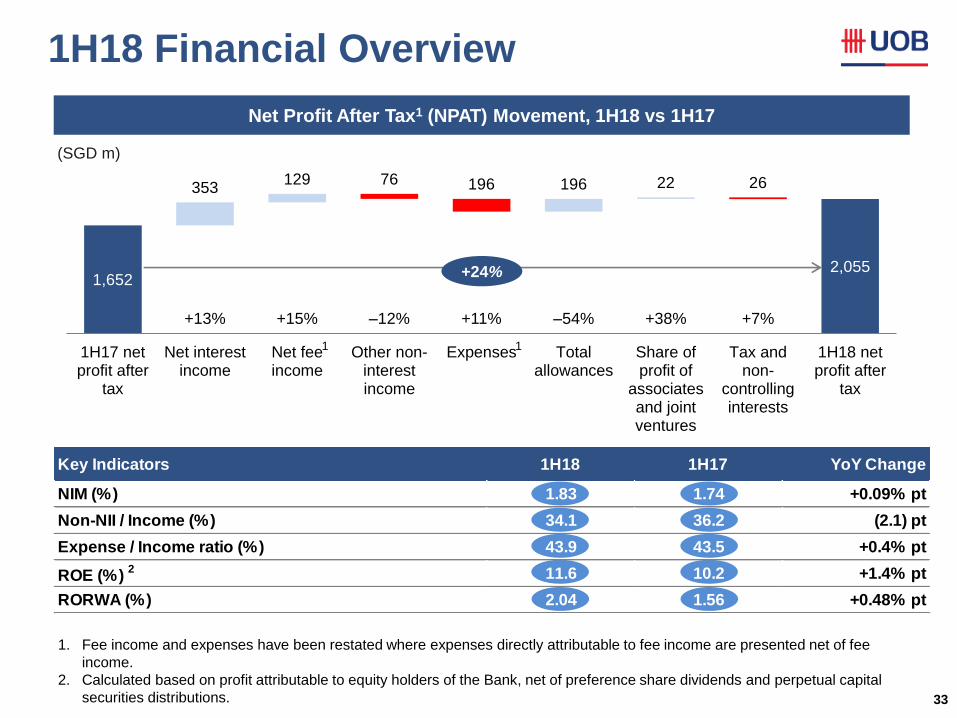
1H18 Financial Overview
33
Net Profit After Tax1 (NPAT) Movement, 1H18 vs 1H17
(SGD m)
+13% +15% +11% +38% +7% –12% –54%
1,652 2,055
353 129 196 22 76 196 26
1H17 netprofit after
tax
Net interestincome
Net feeincome
Other non-interestincome
Expenses Totalallowances
Share ofprofit of
associatesand jointventures
Tax andnon-
controllinginterests
1H18 netprofit after
tax
+24%
1. Fee income and expenses have been restated where expenses directly attributable to fee income are presented net of fee
income.
2. Calculated based on profit attributable to equity holders of the Bank, net of preference share dividends and perpetual capital
securities distributions.
1 1
Key Indicators 1H18 1H17 YoY Change
NIM (%) 1.83 1.74 +0.09% pt
Non-NII / Income (%) 34.1 36.2 (2.1) pt
Expense / Income ratio (%) 43.9 43.5 +0.4% pt
ROE (%) 2 11.6 10.2 +1.4% pt
RORWA (%) 2.04 1.56 +0.48% pt
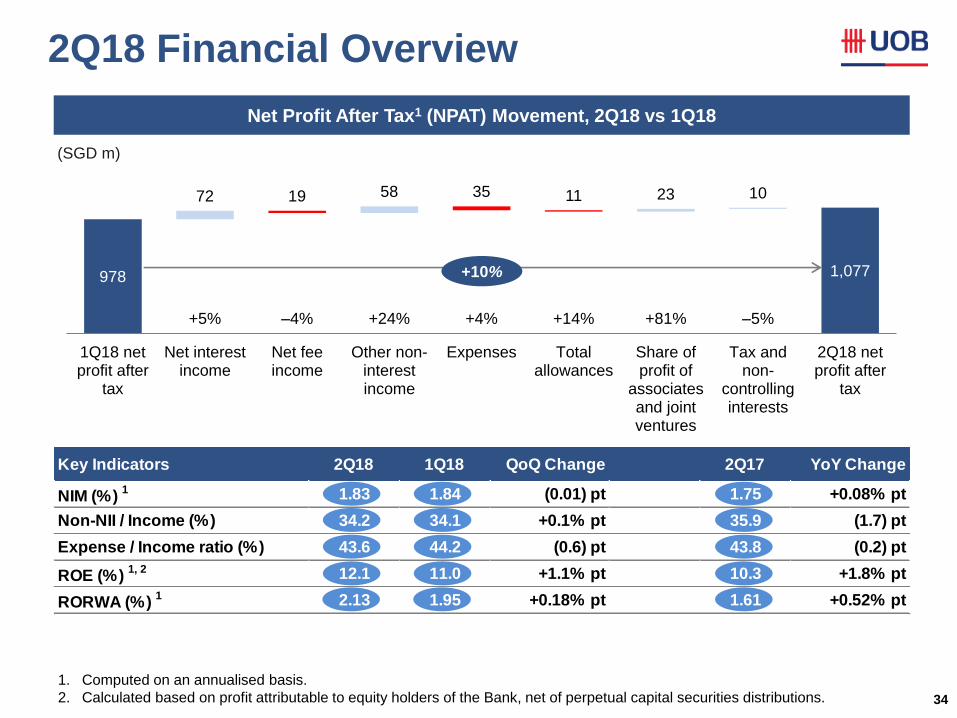
2Q18 Financial Overview
34
Net Profit After Tax1 (NPAT) Movement, 2Q18 vs 1Q18
(SGD m)
+5% +24% +4% +14% +81% –4% –5%
978 1,077
72 58 23 10 19 35 11
1Q18 netprofit after
tax
Net interestincome
Net feeincome
Other non-interestincome
Expenses Totalallowances
Share ofprofit of
associatesand jointventures
Tax andnon-
controllinginterests
2Q18 netprofit after
tax
+10%
1. Computed on an annualised basis.
2. Calculated based on profit attributable to equity holders of the Bank, net of perpetual capital securities distributions.
Key Indicators 2Q18 1Q18 QoQ Change 2Q17 YoY Change
NIM (%) 1 1.83 1.84 (0.01) pt 1.75 +0.08% pt
Non-NII / Income (%) 34.2 34.1 +0.1% pt 35.9 (1.7) pt
Expense / Income ratio (%) 43.6 44.2 (0.6) pt 43.8 (0.2) pt
ROE (%) 1, 2 12.1 11.0 +1.1% pt 10.3 +1.8% pt
RORWA (%) 1 2.13 1.95 +0.18% pt 1.61 +0.52% pt
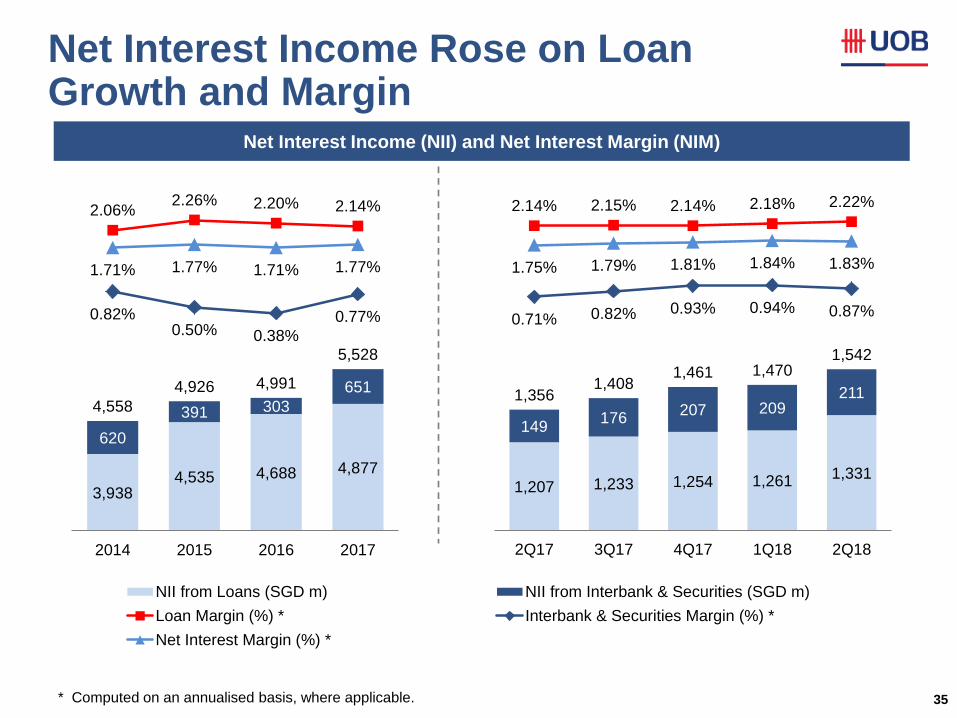
Net Interest Income Rose on Loan Growth and Margin
35 * Computed on an annualised basis, where applicable.
3,938 4,535 4,688 4,877
620
391 303
651
4,558
4,926 4,991
5,528
2.06% 2.26% 2.20% 2.14%
0.82% 0.50% 0.38%
0.77%
1.71% 1.77% 1.71% 1.77%
-4.00%
-3.00%
-2.00%
-1.00%
0.00%
1.00%
2.00%
3.00%
2,500
3,500
4,500
5,500
6,500
7,500
8,500
2014 2015 2016 2017
NII from Loans (SGD m) NII from Interbank & Securities (SGD m)
Loan Margin (%) * Interbank & Securities Margin (%) *
Net Interest Margin (%) *
1,207 1,233 1,254 1,261 1,331
149 176
207 209 211 1,356
1,408 1,461 1,470
1,542
2.14% 2.15% 2.14% 2.18% 2.22%
0.71% 0.82% 0.93% 0.94% 0.87%
1.75% 1.79% 1.81% 1.84% 1.83%
-4.00%
-3.00%
-2.00%
-1.00%
0.00%
1.00%
2.00%
3.00%
800
1,000
1,200
1,400
1,600
1,800
2,000
2,200
2,400
2Q17 3Q17 4Q17 1Q18 2Q18
Net Interest Income (NII) and Net Interest Margin (NIM)
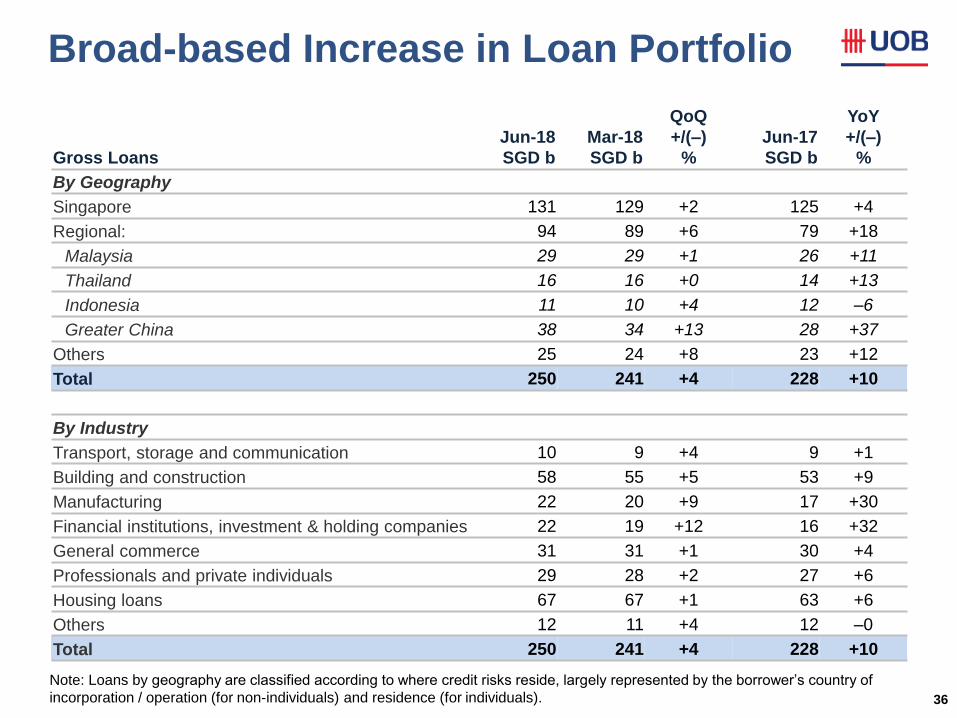
Broad-based Increase in Loan Portfolio
36
Gross Loans
Jun-18
SGD b
Mar-18
SGD b
QoQ
+/(–)
%
Jun-17
SGD b
YoY
+/(–)
%
By Geography
Singapore 131 129 +2 125 +4
Regional: 94 89 +6 79 +18
Malaysia 29 29 +1 26 +11
Thailand 16 16 +0 14 +13
Indonesia 11 10 +4 12 –6
Greater China 38 34 +13 28 +37
Others 25 24 +8 23 +12
Total 250 241 +4 228 +10
By Industry
Transport, storage and communication 10 9 +4 9 +1
Building and construction 58 55 +5 53 +9
Manufacturing 22 20 +9 17 +30
Financial institutions, investment & holding companies 22 19 +12 16 +32
General commerce 31 31 +1 30 +4
Professionals and private individuals 29 28 +2 27 +6
Housing loans 67 67 +1 63 +6
Others 12 11 +4 12 –0
Total 250 241 +4 228 +10
Note: Loans by geography are classified according to where credit risks reside, largely represented by the borrower’s country of
incorporation / operation (for non-individuals) and residence (for individuals).
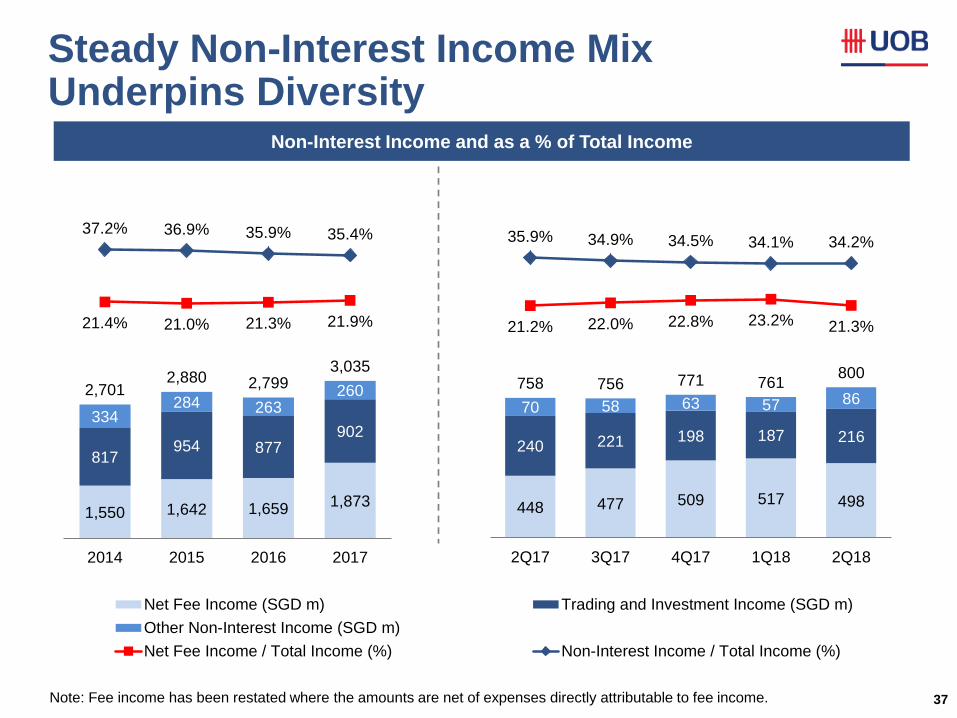
Steady Non-Interest Income Mix Underpins Diversity
37
1,550 1,642 1,659 1,873
817 954 877
902 334
284 263 260 2,701
2,880 2,799 3,035
21.4% 21.0% 21.3% 21.9%
37.2% 36.9% 35.9% 35.4%
-50.0%
-40.0%
-30.0%
-20.0%
-10.0%
0.0%
10.0%
20.0%
30.0%
40.0%
50.0%
800
1,300
1,800
2,300
2,800
3,300
3,800
4,300
4,800
5,300
2014 2015 2016 2017
Net Fee Income (SGD m) Trading and Investment Income (SGD m)
Other Non-Interest Income (SGD m)
Net Fee Income / Total Income (%) Non-Interest Income / Total Income (%)
448 477 509 517 498
240 221 198 187 216
70 58 63 57 86 758 756 771 761
800
21.2% 22.0% 22.8% 23.2% 21.3%
35.9% 34.9% 34.5% 34.1% 34.2%
-50.0%
-40.0%
-30.0%
-20.0%
-10.0%
0.0%
10.0%
20.0%
30.0%
40.0%
50.0%
200
400
600
800
1000
1200
1400
2Q17 3Q17 4Q17 1Q18 2Q18
Non-Interest Income and as a % of Total Income
Note: Fee income has been restated where the amounts are net of expenses directly attributable to fee income.
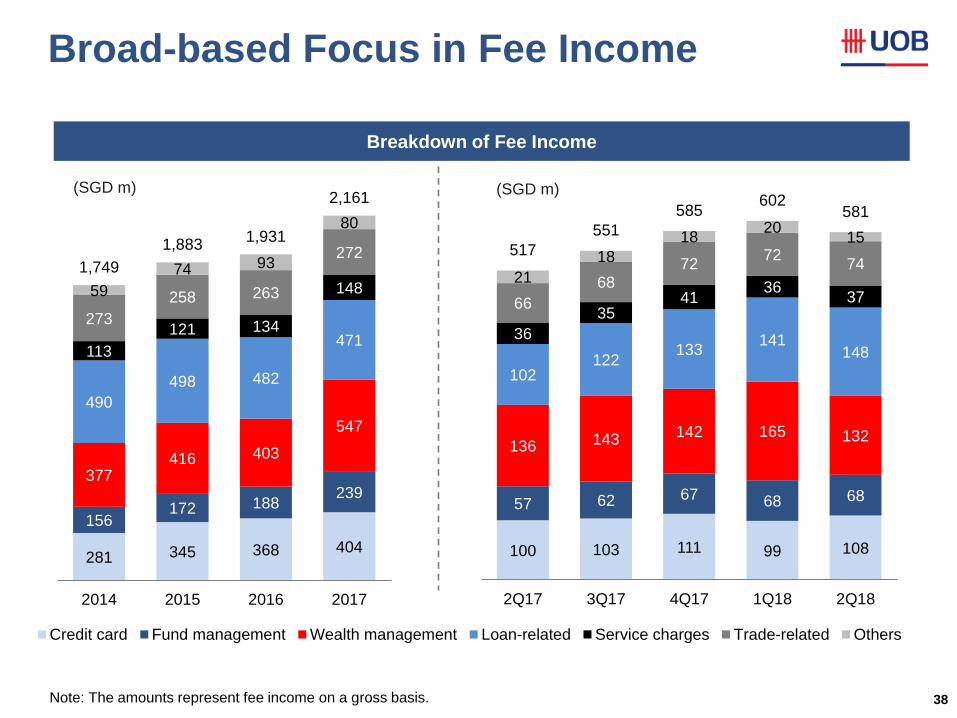
Broad-based Focus in Fee Income
38
281 345 368 404
156 172 188
239 377
416 403
547
490
498 482
471 113
121 134
148
273
258 263
272
59
74 93
80
1,749
1,883 1,931
2,161
0
500
1,000
1,500
2,000
2014 2015 2016 2017
Credit card Fund management Wealth management Loan-related Service charges Trade-related Others
100 103 111 99 108
57 62 67 68 68
136 143 142 165 132
102 122
133 141
148 36
35 41
36 37 66
68 72
72 74
21
18
18 20
15 517
551
585 602
581
0
100
200
300
400
500
600
2Q17 3Q17 4Q17 1Q18 2Q18
(SGD m) (SGD m)
Breakdown of Fee Income
Note: The amounts represent fee income on a gross basis.
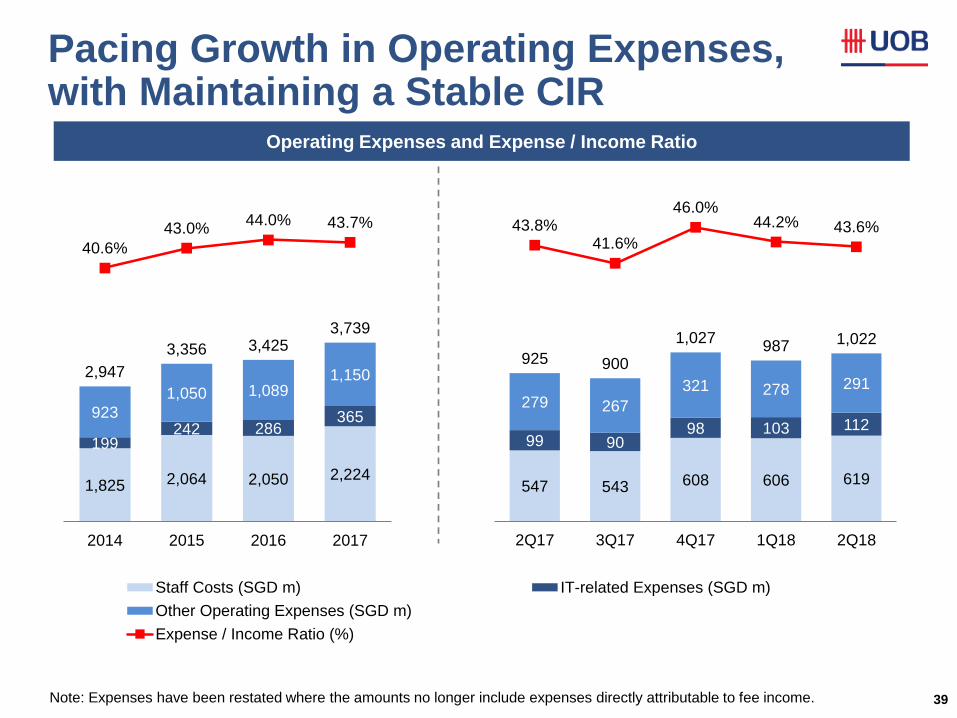
Pacing Growth in Operating Expenses, with Maintaining a Stable CIR
39
1,825 2,064 2,050 2,224
199 242 286
365 923
1,050 1,089 1,150 2,947
3,356 3,425 3,739
40.6%
43.0% 44.0% 43.7%
10.0%
15.0%
20.0%
25.0%
30.0%
35.0%
40.0%
45.0%
50.0%
500
1,500
2,500
3,500
4,500
5,500
6,500
2014 2015 2016 2017
Staff Costs (SGD m) IT-related Expenses (SGD m)
Other Operating Expenses (SGD m)
Expense / Income Ratio (%)
547 543 608 606 619
99 90 98 103 112
279 267
321 278 291
925 900
1,027 987 1,022
43.8% 41.6%
46.0% 44.2% 43.6%
10.0%
15.0%
20.0%
25.0%
30.0%
35.0%
40.0%
45.0%
50.0%
200
400
600
800
1,000
1,200
1,400
1,600
1,800
2Q17 3Q17 4Q17 1Q18 2Q18
Operating Expenses and Expense / Income Ratio
Note: Expenses have been restated where the amounts no longer include expenses directly attributable to fee income.
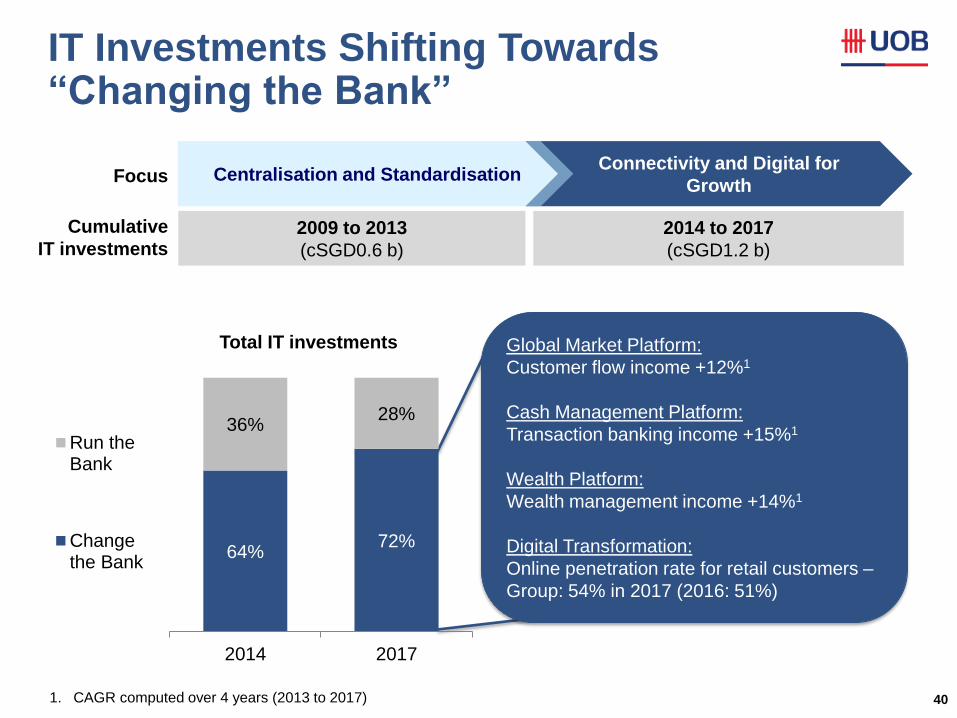
40
Total IT investments Global Market Platform:
Customer flow income +12%1
Cash Management Platform:
Transaction banking income +15%1
Wealth Platform:
Wealth management income +14%1
Digital Transformation:
Online penetration rate for retail customers –
Group: 54% in 2017 (2016: 51%)
Connectivity and Digital for
Growth
2009 to 2013
(cSGD0.6 b)
2014 to 2017
(cSGD1.2 b)
Cumulative
IT investments
Focus Centralisation and Standardisation
1. CAGR computed over 4 years (2013 to 2017)
IT Investments Shifting Towards “Changing the Bank”
64% 72%
36% 28%
2014 2017
Run theBank
Changethe Bank
41
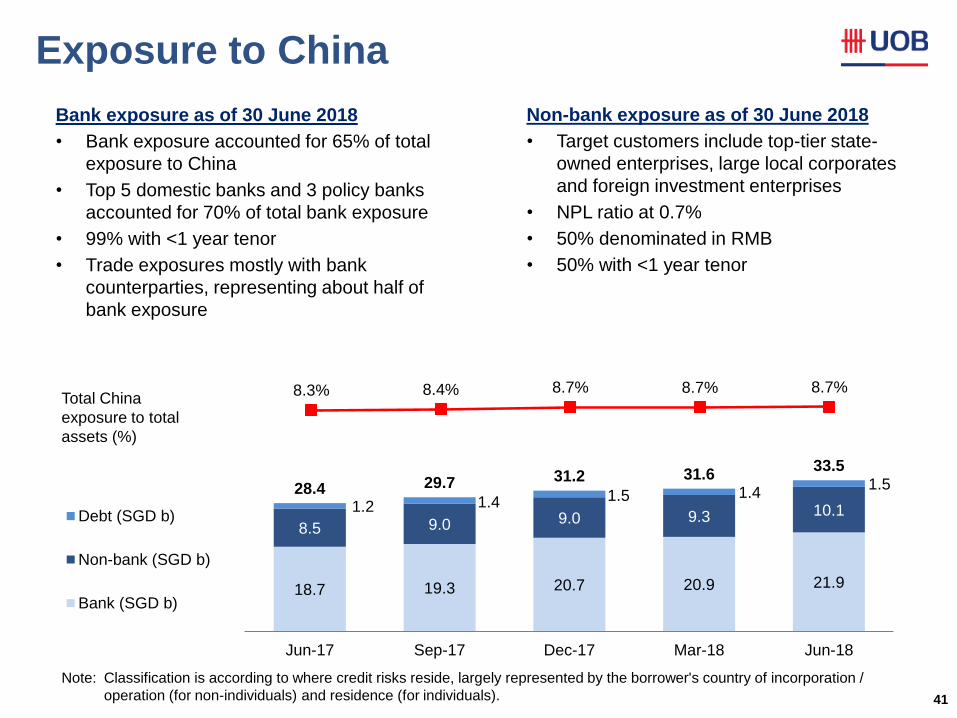
Exposure to China
Bank exposure as of 30 June 2018
• Bank exposure accounted for 65% of total
exposure to China
• Top 5 domestic banks and 3 policy banks
accounted for 70% of total bank exposure
• 99% with <1 year tenor
• Trade exposures mostly with bank
counterparties, representing about half of
bank exposure
Note: Classification is according to where credit risks reside, largely represented by the borrower's country of incorporation /
operation (for non-individuals) and residence (for individuals).
18.7 19.3 20.7 20.9 21.9
8.5 9.0 9.0 9.3 10.1 1.2 1.4 1.5 1.4 1.5 28.4 29.7 31.2 31.6
33.5
0.0
5.0
10.0
15.0
20.0
25.0
30.0
35.0
40.0
Jun-17 Sep-17 Dec-17 Mar-18 Jun-18
Debt (SGD b)
Non-bank (SGD b)
Bank (SGD b)
Non-bank exposure as of 30 June 2018
• Target customers include top-tier state-
owned enterprises, large local corporates
and foreign investment enterprises
• NPL ratio at 0.7%
• 50% denominated in RMB
• 50% with <1 year tenor
Total China
exposure to total
assets (%)
8.3% 8.4% 8.7% 8.7% 8.7%
5.0%
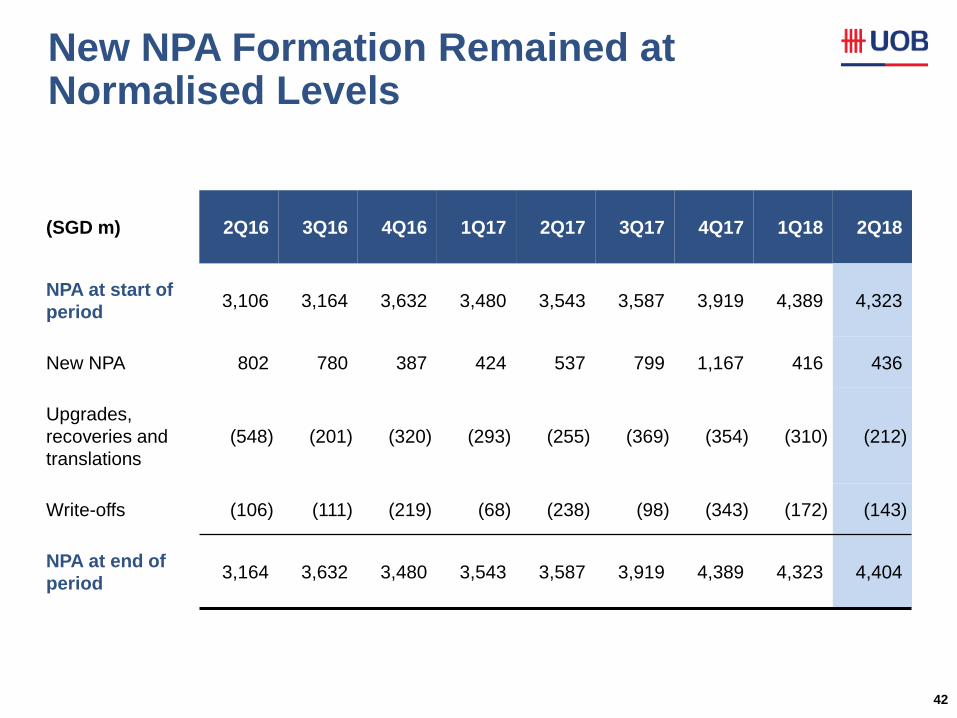
New NPA Formation Remained at Normalised Levels
42
(SGD m) 2Q16 3Q16 4Q16 1Q17 2Q17 3Q17 4Q17 1Q18 2Q18
NPA at start of
period 3,106 3,164 3,632 3,480 3,543 3,587 3,919 4,389 4,323
New NPA 802 780 387 424 537 799 1,167 416 436
Upgrades,
recoveries and
translations
(548) (201) (320) (293) (255) (369) (354) (310) (212)
Write-offs (106) (111) (219) (68) (238) (98) (343) (172) (143)
NPA at end of
period 3,164 3,632 3,480 3,543 3,587 3,919 4,389 4,323 4,404
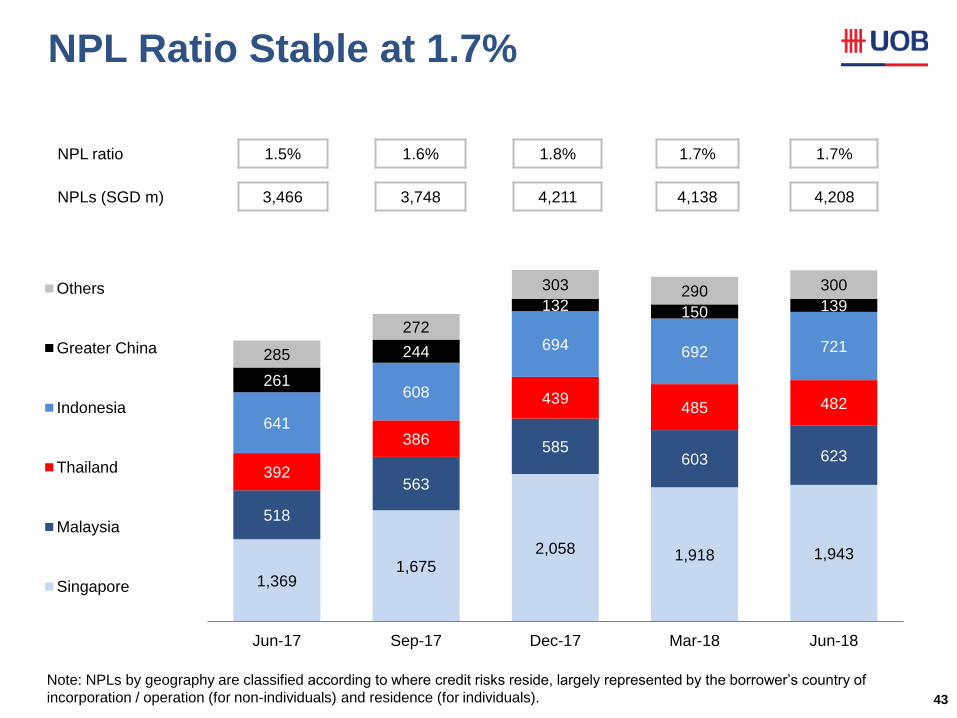
NPL Ratio Stable at 1.7%
43
NPL ratio 1.5% 1.6% 1.8% 1.7% 1.7%
NPLs (SGD m) 3,466 3,748 4,211 4,138 4,208
1,369 1,675
2,058 1,918 1,943
518
563
585 603 623
392
386
439 485 482
641
608
694 692 721
261
244
132 150 139
285
272
303 290 300
500
1,000
1,500
2,000
2,500
3,000
3,500
4,000
4,500
Jun-17 Sep-17 Dec-17 Mar-18 Jun-18
Others
Greater China
Indonesia
Thailand
Malaysia
Singapore
Note: NPLs by geography are classified according to where credit risks reside, largely represented by the borrower’s country of
incorporation / operation (for non-individuals) and residence (for individuals).
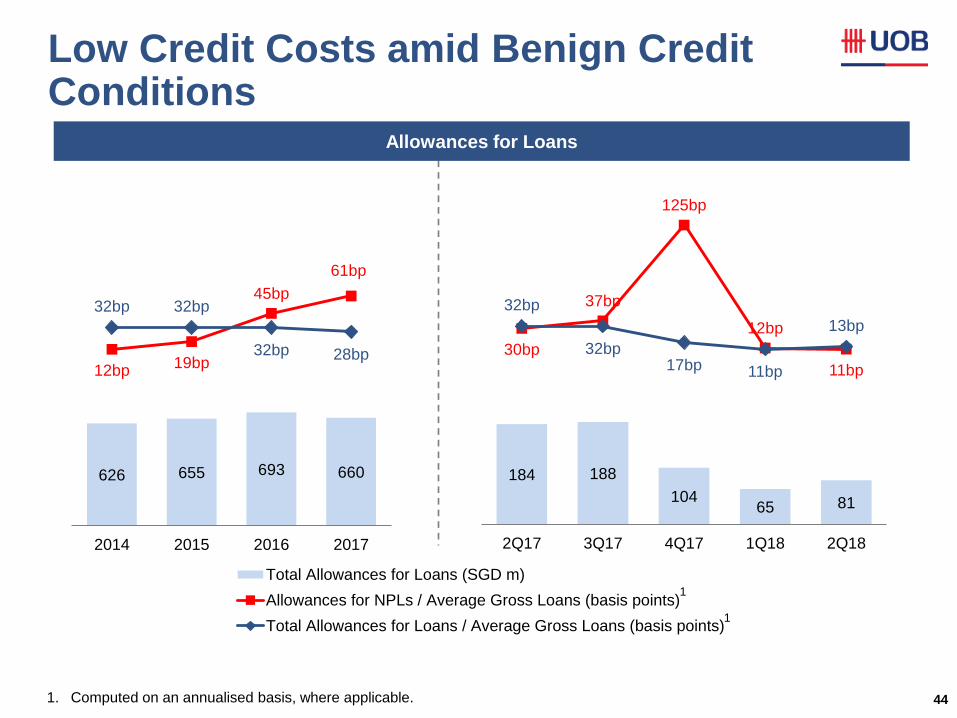
Low Credit Costs amid Benign Credit Conditions
44
626 655 693 660
12bp 19bp
45bp
61bp
32bp 32bp
32bp 28bp
(150)bp
(100)bp
(50)bp
0bp
50bp
100bp
150bp
0
200
400
600
800
1,000
1,200
1,400
1,600
1,800
2,000
2014 2015 2016 2017
Total Allowances for Loans (SGD m)
Allowances for NPLs / Average Gross Loans (basis points)
Total Allowances for Loans / Average Gross Loans (basis points)
184 188
104 65 81
30bp
37bp
125bp
12bp
11bp
32bp
32bp 17bp 11bp
13bp
(150)bp
(100)bp
(50)bp
0bp
50bp
100bp
150bp
0
100
200
300
400
500
600
2Q17 3Q17 4Q17 1Q18 2Q18
Allowances for Loans
1. Computed on an annualised basis, where applicable.
1
1
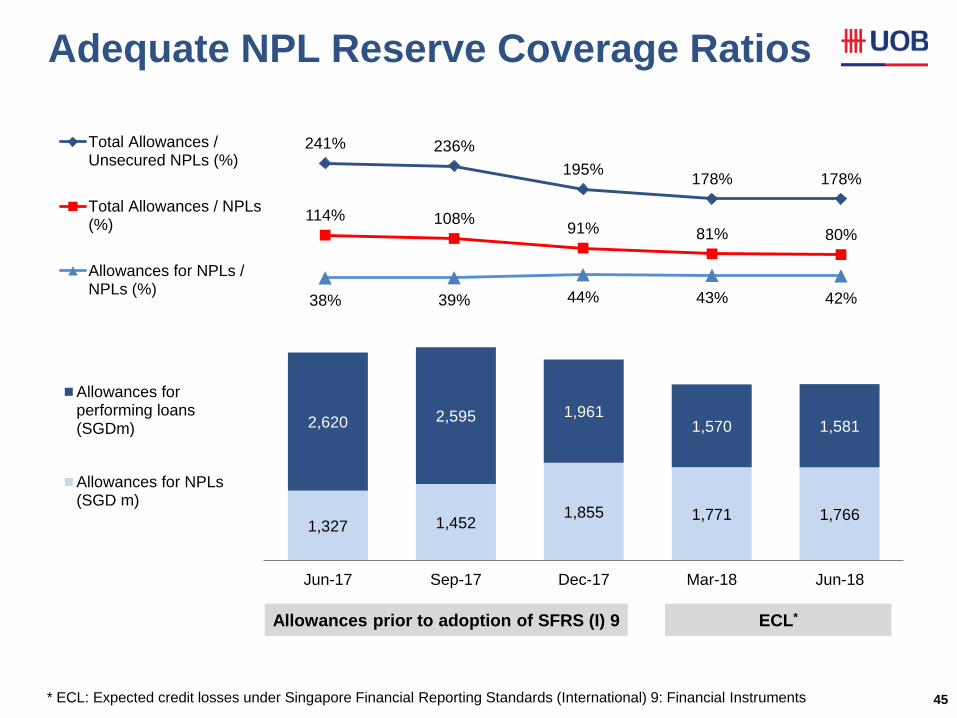
Adequate NPL Reserve Coverage Ratios
45
1,327 1,452 1,855 1,771 1,766
2,620 2,595 1,961 1,570 1,581
0
500
1,000
1,500
2,000
2,500
3,000
3,500
4,000
4,500
Jun-17 Sep-17 Dec-17 Mar-18 Jun-18
Allowances forperforming loans(SGDm)
Allowances for NPLs(SGD m)
241% 236%
195% 178% 178%
114% 108% 91% 81% 80%
38% 39% 44% 43% 42% 0%
50%
100%
150%
200%
250%
300%Total Allowances /Unsecured NPLs (%)
Total Allowances / NPLs(%)
Allowances for NPLs /NPLs (%)
Allowances prior to adoption of SFRS (I) 9 ECL*
* ECL: Expected credit losses under Singapore Financial Reporting Standards (International) 9: Financial Instruments
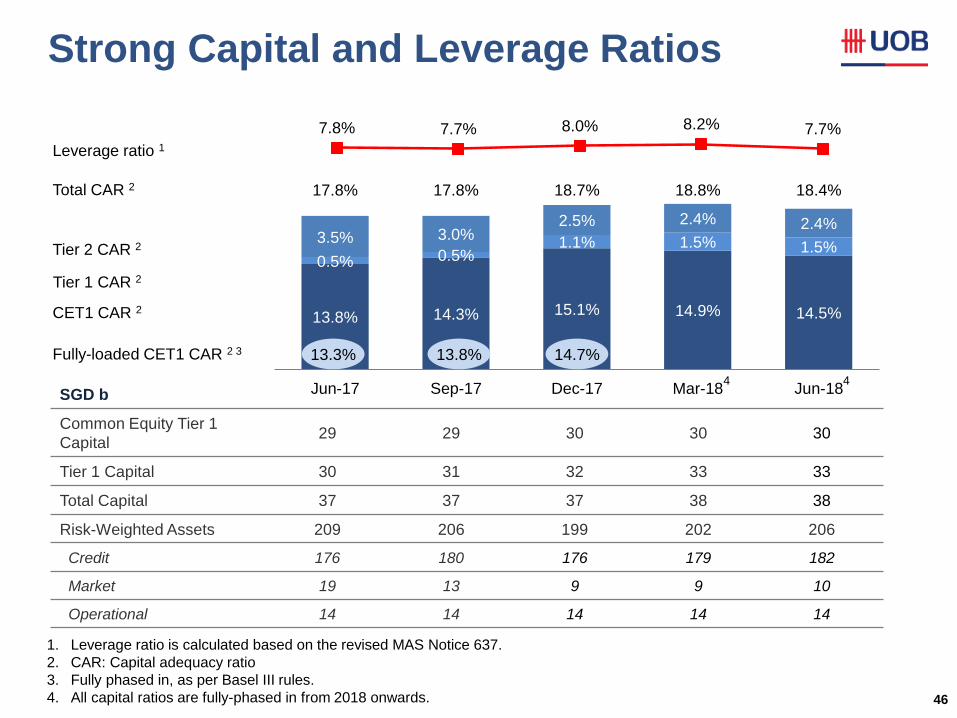
Strong Capital and Leverage Ratios
46
Tier 2 CAR 2
Total CAR 2
CET1 CAR 2
SGD b
Common Equity Tier 1
Capital 29 29 30 30 30
Tier 1 Capital 30 31 32 33 33
Total Capital 37 37 37 38 38
Risk-Weighted Assets 209 206 199 202 206
Credit 176 180 176 179 182
Market 19 13 9 9 10
Operational 14 14 14 14 14
Leverage ratio 1
13.8% 14.3% 15.1% 14.9% 14.5%
0.5% 0.5% 1.1% 1.5% 1.5%
3.5% 3.0% 2.5% 2.4% 2.4%
17.8% 17.8% 18.7% 18.8% 18.4%
-100000%
-80000%
-60000%
-40000%
-20000%
0%
5.0%
7.0%
9.0%
11.0%
13.0%
15.0%
17.0%
19.0%
Jun-17 Sep-17 Dec-17 Mar-18 Jun-18
14.7% 13.8% 13.3% Fully-loaded CET1 CAR 2 3
7.8% 7.7% 8.0% 8.2% 7.7%
5.0%
Tier 1 CAR 2
1. Leverage ratio is calculated based on the revised MAS Notice 637.
2. CAR: Capital adequacy ratio
3. Fully phased in, as per Basel III rules.
4. All capital ratios are fully-phased in from 2018 onwards.
4 4
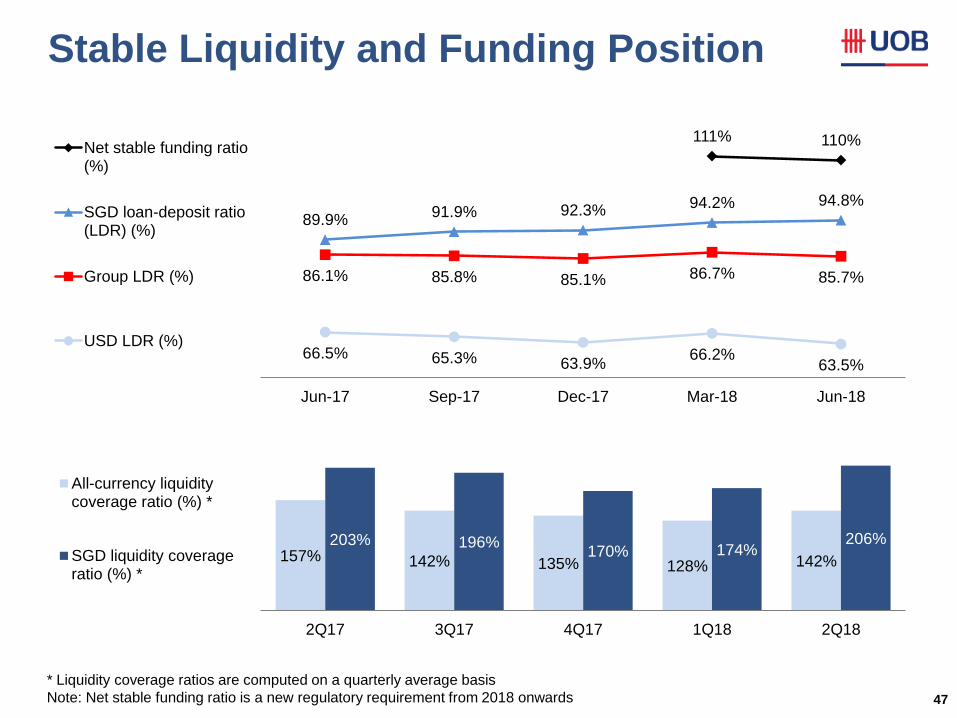
Stable Liquidity and Funding Position
47
157% 142% 135% 128% 142%
203% 196% 170% 174%
206%
0%
50%
100%
150%
200%
250%
2Q17 3Q17 4Q17 1Q18 2Q18
All-currency liquiditycoverage ratio (%) *
SGD liquidity coverageratio (%) *
111% 110%
89.9% 91.9% 92.3%
94.2% 94.8%
86.1% 85.8% 85.1% 86.7% 85.7%
66.5% 65.3% 63.9% 66.2%
63.5% 0.55
0.65
0.75
0.85
0.95
1.05
1.15
Jun-17 Sep-17 Dec-17 Mar-18 Jun-18
Net stable funding ratio(%)
SGD loan-deposit ratio(LDR) (%)
Group LDR (%)
USD LDR (%)
* Liquidity coverage ratios are computed on a quarterly average basis
Note: Net stable funding ratio is a new regulatory requirement from 2018 onwards
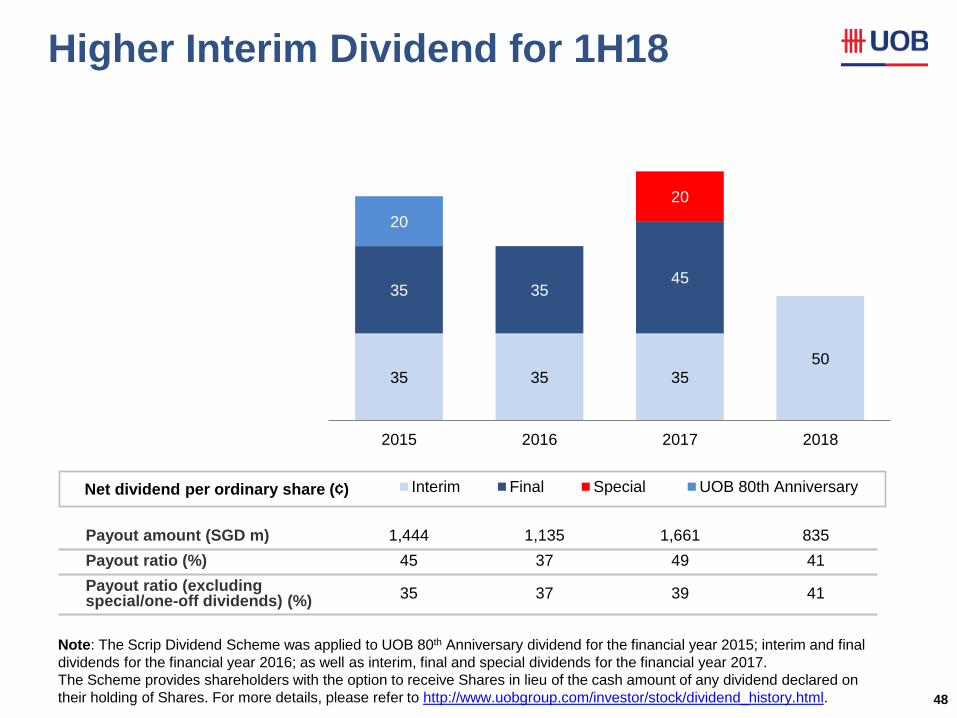
Higher Interim Dividend for 1H18
48
Net dividend per ordinary share (¢)
Payout amount (SGD m) 1,444 1,135 1,661 835
Payout ratio (%) 45 37 49 41
Payout ratio (excluding special/one-off dividends) (%)
35 37 39 41
35 35 35 50
35 35 45
20
20
2015 2016 2017 2018
Interim Final Special UOB 80th Anniversary
Note: The Scrip Dividend Scheme was applied to UOB 80th Anniversary dividend for the financial year 2015; interim and final
dividends for the financial year 2016; as well as interim, final and special dividends for the financial year 2017.
The Scheme provides shareholders with the option to receive Shares in lieu of the cash amount of any dividend declared on
their holding of Shares. For more details, please refer to http://www.uobgroup.com/investor/stock/dividend_history.html.
Appendix B: Additional Information on UOB’s Covered Bond Program
49
50 Source : UOB Global Covered Bond Programme Offering Circular; CPF Board website https://www.cpf.gov.sg/members, Ministry of Manpower www.mom.gov.sg
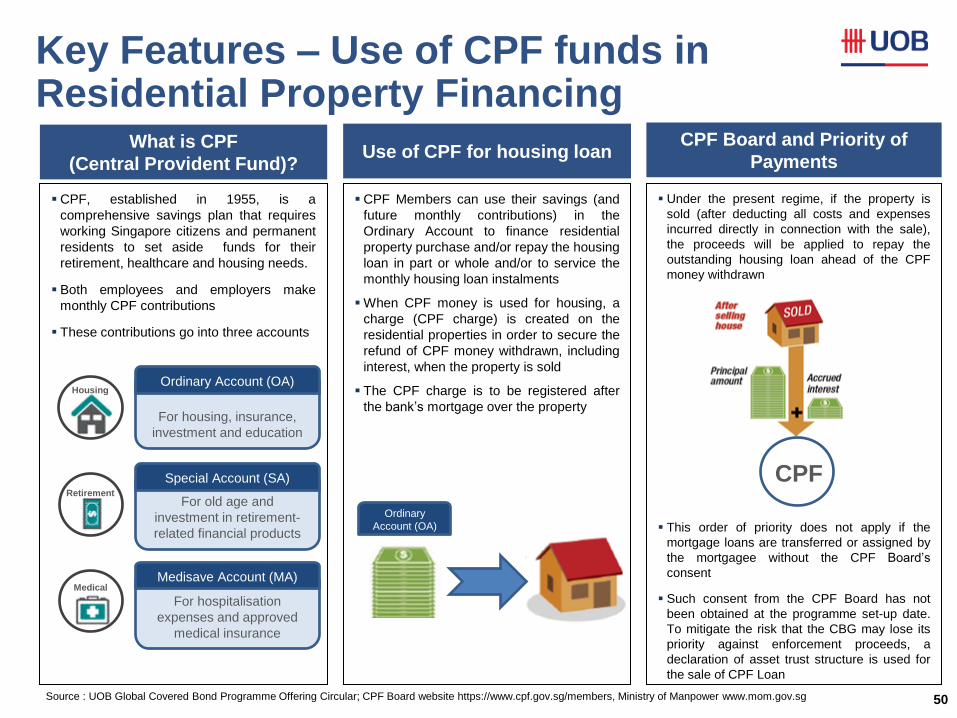
CPF, established in 1955, is a
comprehensive savings plan that requires
working Singapore citizens and permanent
residents to set aside funds for their
retirement, healthcare and housing needs.
Both employees and employers make
monthly CPF contributions
These contributions go into three accounts
What is CPF
(Central Provident Fund)?
Retirement
Housing
Medical
For housing, insurance,
investment and education
CPF Members can use their savings (and
future monthly contributions) in the
Ordinary Account to finance residential
property purchase and/or repay the housing
loan in part or whole and/or to service the
monthly housing loan instalments
When CPF money is used for housing, a
charge (CPF charge) is created on the
residential properties in order to secure the
refund of CPF money withdrawn, including
interest, when the property is sold
The CPF charge is to be registered after
the bank’s mortgage over the property
Use of CPF for housing loan
Ordinary Account (OA)
Ordinary
Account (OA)
For old age and
investment in retirement-
related financial products
Special Account (SA)
For hospitalisation
expenses and approved
medical insurance
Medisave Account (MA)
Under the present regime, if the property is
sold (after deducting all costs and expenses
incurred directly in connection with the sale),
the proceeds will be applied to repay the
outstanding housing loan ahead of the CPF
money withdrawn
This order of priority does not apply if the
mortgage loans are transferred or assigned by
the mortgagee without the CPF Board’s
consent
Such consent from the CPF Board has not
been obtained at the programme set-up date.
To mitigate the risk that the CBG may lose its
priority against enforcement proceeds, a
declaration of asset trust structure is used for
the sale of CPF Loan
CPF Board and Priority of
Payments
CPF
Key Features – Use of CPF funds in Residential Property Financing
51
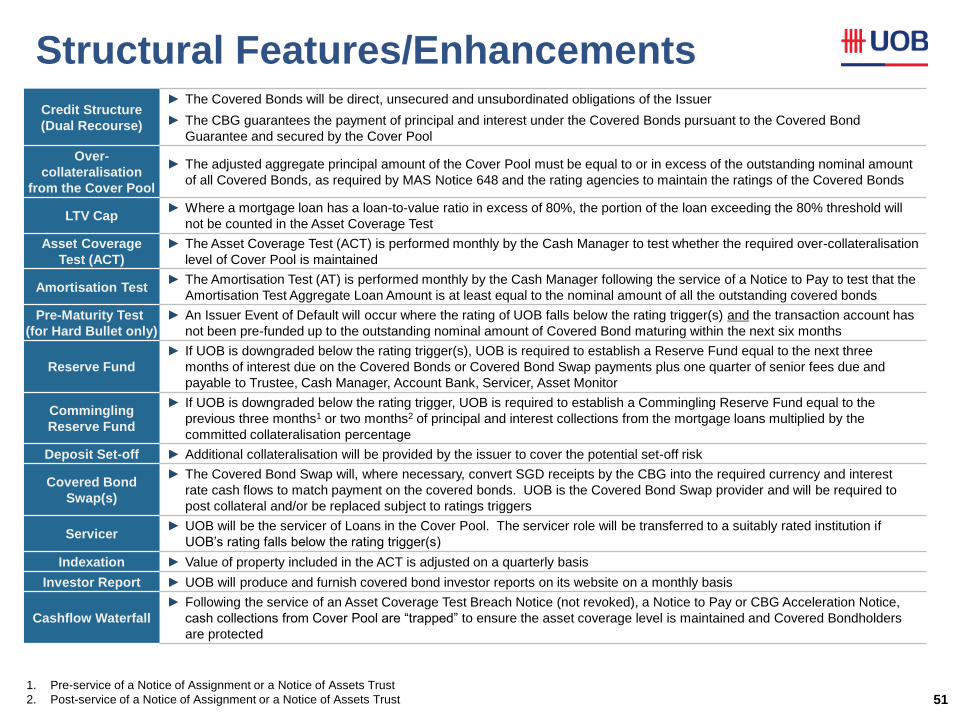
Credit Structure
(Dual Recourse)
► The Covered Bonds will be direct, unsecured and unsubordinated obligations of the Issuer
► The CBG guarantees the payment of principal and interest under the Covered Bonds pursuant to the Covered Bond
Guarantee and secured by the Cover Pool
Over-
collateralisation
from the Cover Pool
► The adjusted aggregate principal amount of the Cover Pool must be equal to or in excess of the outstanding nominal amount
of all Covered Bonds, as required by MAS Notice 648 and the rating agencies to maintain the ratings of the Covered Bonds
LTV Cap ► Where a mortgage loan has a loan-to-value ratio in excess of 80%, the portion of the loan exceeding the 80% threshold will
not be counted in the Asset Coverage Test
Asset Coverage
Test (ACT)
► The Asset Coverage Test (ACT) is performed monthly by the Cash Manager to test whether the required over-collateralisation
level of Cover Pool is maintained
Amortisation Test ► The Amortisation Test (AT) is performed monthly by the Cash Manager following the service of a Notice to Pay to test that the
Amortisation Test Aggregate Loan Amount is at least equal to the nominal amount of all the outstanding covered bonds
Pre-Maturity Test
(for Hard Bullet only)
► An Issuer Event of Default will occur where the rating of UOB falls below the rating trigger(s) and the transaction account has
not been pre-funded up to the outstanding nominal amount of Covered Bond maturing within the next six months
Reserve Fund
► If UOB is downgraded below the rating trigger(s), UOB is required to establish a Reserve Fund equal to the next three
months of interest due on the Covered Bonds or Covered Bond Swap payments plus one quarter of senior fees due and
payable to Trustee, Cash Manager, Account Bank, Servicer, Asset Monitor
Commingling
Reserve Fund
► If UOB is downgraded below the rating trigger, UOB is required to establish a Commingling Reserve Fund equal to the
previous three months1 or two months2 of principal and interest collections from the mortgage loans multiplied by the
committed collateralisation percentage
Deposit Set-off ► Additional collateralisation will be provided by the issuer to cover the potential set-off risk
Covered Bond
Swap(s)
► The Covered Bond Swap will, where necessary, convert SGD receipts by the CBG into the required currency and interest
rate cash flows to match payment on the covered bonds. UOB is the Covered Bond Swap provider and will be required to
post collateral and/or be replaced subject to ratings triggers
Servicer ► UOB will be the servicer of Loans in the Cover Pool. The servicer role will be transferred to a suitably rated institution if
UOB’s rating falls below the rating trigger(s)
Indexation ► Value of property included in the ACT is adjusted on a quarterly basis
Investor Report ► UOB will produce and furnish covered bond investor reports on its website on a monthly basis
Cashflow Waterfall
► Following the service of an Asset Coverage Test Breach Notice (not revoked), a Notice to Pay or CBG Acceleration Notice,
cash collections from Cover Pool are “trapped” to ensure the asset coverage level is maintained and Covered Bondholders
are protected
1. Pre-service of a Notice of Assignment or a Notice of Assets Trust
2. Post-service of a Notice of Assignment or a Notice of Assets Trust
Structural Features/Enhancements
52
Moody’s Trigger
Events
S&P Trigger
Events Long-
term
Short-
term
Long-
term
Short-
term
Aaa
P-1 No impact
AAA
A-1+
No impact
Aa1 AA+
Aa2 AA
Aa3 AA-
A1 A+ A-1
A2 A
A3
P-2
►Pre-maturity Test
►Reserve Fund A- A-2 ►Pre-maturity Test
►Reserve Fund
►Transfer of
Account Bank
►Collateral
Posting for
Swap(s)†
►Procure a
Guarantee/Repla
cement for
Swap(s)
Provider†
Baa1
►Deposit Set-off
►Collateral Posting
for Swap(s)
BBB+
Baa2
P-3
►Procure a
Guarantee/Replac
ement for Swap(s)
Provider
BBB A-3
Baa3 BBB- ►Deposit Set-off
►Commingling
Reserve
Below
Investment
Grade
►Replacement of
Servicer
►Perfection of
Title/Transfer of
Asset Trustee
►Transfer of
Account Bank
Below
Investment
Grade
►Replacement of
Servicer
►Perfection of
Title/Transfer of
Asset Trustee
†Rating level based on current selected option
UOB’s current rating
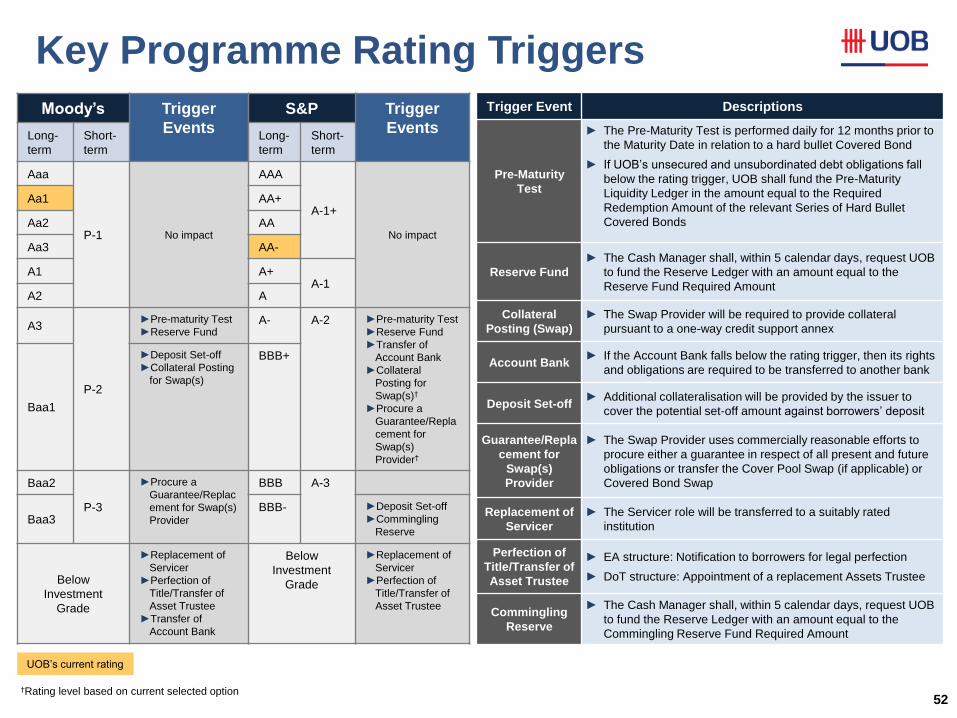
Trigger Event Descriptions
Pre-Maturity
Test
► The Pre-Maturity Test is performed daily for 12 months prior to
the Maturity Date in relation to a hard bullet Covered Bond
► If UOB’s unsecured and unsubordinated debt obligations fall
below the rating trigger, UOB shall fund the Pre-Maturity
Liquidity Ledger in the amount equal to the Required
Redemption Amount of the relevant Series of Hard Bullet
Covered Bonds
Reserve Fund
► The Cash Manager shall, within 5 calendar days, request UOB
to fund the Reserve Ledger with an amount equal to the
Reserve Fund Required Amount
Collateral
Posting (Swap)
► The Swap Provider will be required to provide collateral
pursuant to a one-way credit support annex
Account Bank ► If the Account Bank falls below the rating trigger, then its rights
and obligations are required to be transferred to another bank
Deposit Set-off ► Additional collateralisation will be provided by the issuer to
cover the potential set-off amount against borrowers’ deposit
Guarantee/Repla
cement for
Swap(s)
Provider
► The Swap Provider uses commercially reasonable efforts to
procure either a guarantee in respect of all present and future
obligations or transfer the Cover Pool Swap (if applicable) or
Covered Bond Swap
Replacement of
Servicer
► The Servicer role will be transferred to a suitably rated
institution
Perfection of
Title/Transfer of
Asset Trustee
► EA structure: Notification to borrowers for legal perfection
► DoT structure: Appointment of a replacement Assets Trustee
Commingling
Reserve
► The Cash Manager shall, within 5 calendar days, request UOB
to fund the Reserve Ledger with an amount equal to the
Commingling Reserve Fund Required Amount
Key Programme Rating Triggers
53
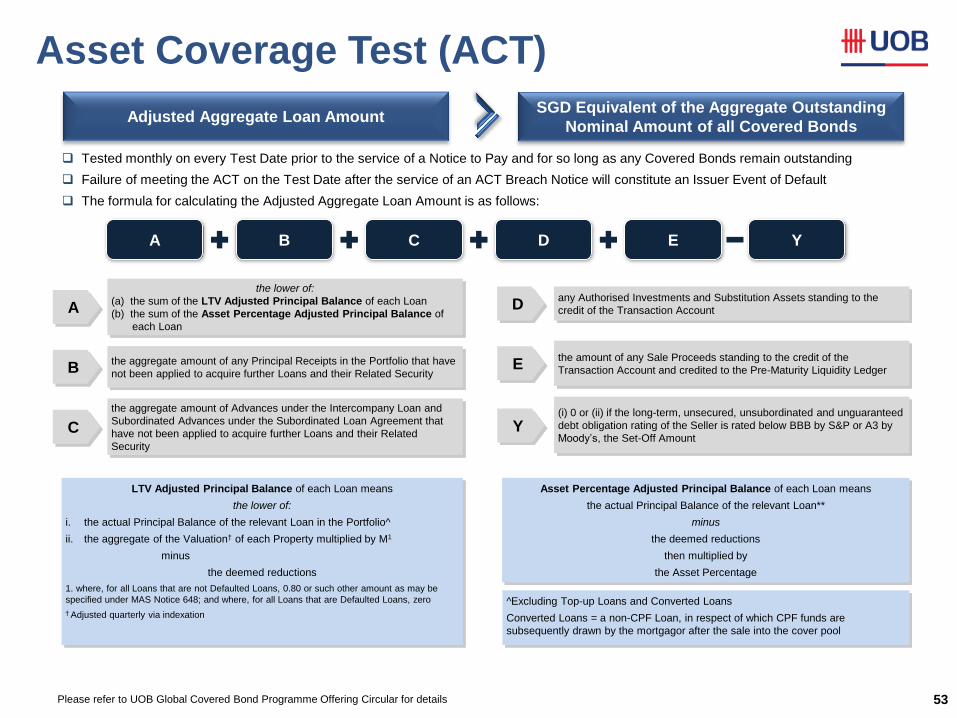
Tested monthly on every Test Date prior to the service of a Notice to Pay and for so long as any Covered Bonds remain outstanding
Failure of meeting the ACT on the Test Date after the service of an ACT Breach Notice will constitute an Issuer Event of Default
The formula for calculating the Adjusted Aggregate Loan Amount is as follows:
Adjusted Aggregate Loan Amount SGD Equivalent of the Aggregate Outstanding
Nominal Amount of all Covered Bonds
A B C E Y
the lower of:
(a) the sum of the LTV Adjusted Principal Balance of each Loan
(b) the sum of the Asset Percentage Adjusted Principal Balance of
each Loan
A
B the aggregate amount of any Principal Receipts in the Portfolio that have
not been applied to acquire further Loans and their Related Security
C
the aggregate amount of Advances under the Intercompany Loan and
Subordinated Advances under the Subordinated Loan Agreement that
have not been applied to acquire further Loans and their Related
Security
D
Y
any Authorised Investments and Substitution Assets standing to the
credit of the Transaction Account
(i) 0 or (ii) if the long-term, unsecured, unsubordinated and unguaranteed
debt obligation rating of the Seller is rated below BBB by S&P or A3 by
Moody’s, the Set-Off Amount
LTV Adjusted Principal Balance of each Loan means
the lower of:
i. the actual Principal Balance of the relevant Loan in the Portfolio^
ii. the aggregate of the Valuation† of each Property multiplied by M1
minus
the deemed reductions
1. where, for all Loans that are not Defaulted Loans, 0.80 or such other amount as may be
specified under MAS Notice 648; and where, for all Loans that are Defaulted Loans, zero
† Adjusted quarterly via indexation
Asset Percentage Adjusted Principal Balance of each Loan means
the actual Principal Balance of the relevant Loan**
minus
the deemed reductions
then multiplied by
the Asset Percentage
D
E the amount of any Sale Proceeds standing to the credit of the
Transaction Account and credited to the Pre-Maturity Liquidity Ledger
^Excluding Top-up Loans and Converted Loans
Converted Loans = a non-CPF Loan, in respect of which CPF funds are
subsequently drawn by the mortgagor after the sale into the cover pool
Please refer to UOB Global Covered Bond Programme Offering Circular for details
Asset Coverage Test (ACT)
54
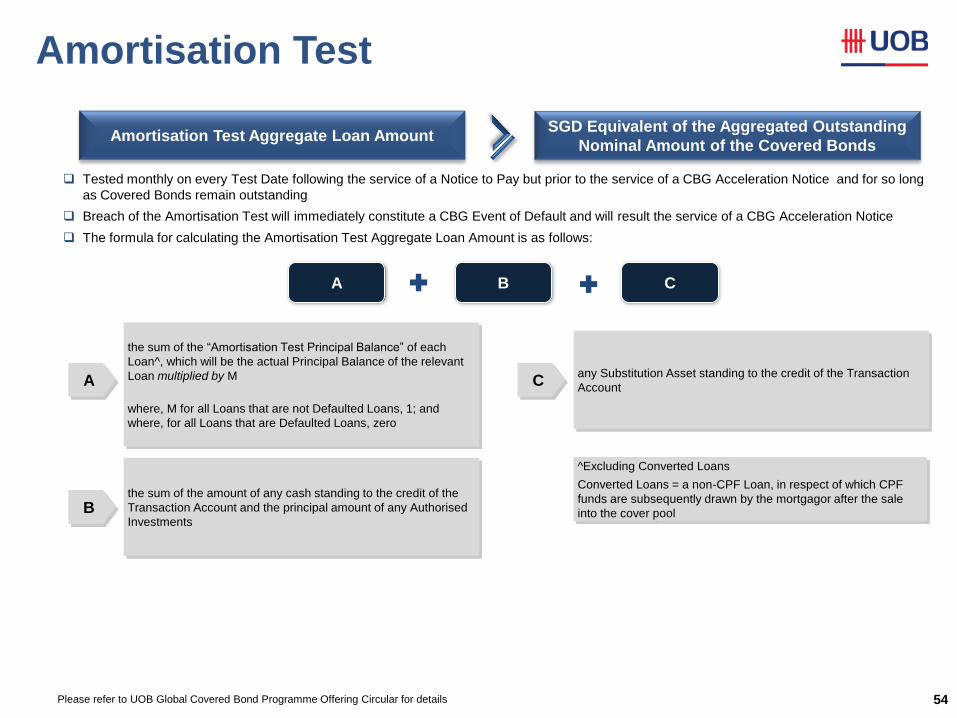
Tested monthly on every Test Date following the service of a Notice to Pay but prior to the service of a CBG Acceleration Notice and for so long
as Covered Bonds remain outstanding
Breach of the Amortisation Test will immediately constitute a CBG Event of Default and will result the service of a CBG Acceleration Notice
The formula for calculating the Amortisation Test Aggregate Loan Amount is as follows:
Please refer to UOB Global Covered Bond Programme Offering Circular for details
Amortisation Test Aggregate Loan Amount SGD Equivalent of the Aggregated Outstanding
Nominal Amount of the Covered Bonds
A B C
the sum of the “Amortisation Test Principal Balance” of each
Loan^, which will be the actual Principal Balance of the relevant
Loan multiplied by M
where, M for all Loans that are not Defaulted Loans, 1; and
where, for all Loans that are Defaulted Loans, zero
the sum of the amount of any cash standing to the credit of the
Transaction Account and the principal amount of any Authorised
Investments
any Substitution Asset standing to the credit of the Transaction
Account A
B
C
^Excluding Converted Loans
Converted Loans = a non-CPF Loan, in respect of which CPF
funds are subsequently drawn by the mortgagor after the sale
into the cover pool
Amortisation Test
55
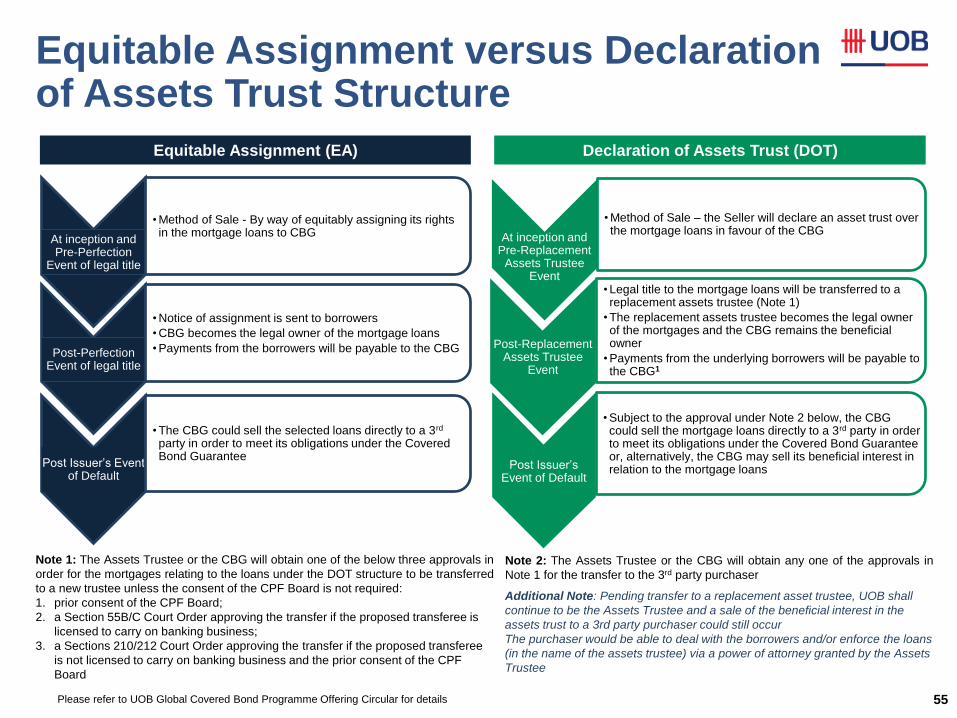
Equitable Assignment (EA) Declaration of Assets Trust (DOT)
At inception and Pre-Perfection
Event of legal title
• Method of Sale - By way of equitably assigning its rights in the mortgage loans to CBG
Post-Perfection Event of legal title
• Notice of assignment is sent to borrowers
• CBG becomes the legal owner of the mortgage loans
• Payments from the borrowers will be payable to the CBG
Post Issuer’s Event of Default
• The CBG could sell the selected loans directly to a 3rd party in order to meet its obligations under the Covered Bond Guarantee
At inception and Pre-Replacement
Assets Trustee Event
• Method of Sale – the Seller will declare an asset trust over the mortgage loans in favour of the CBG
Post-Replacement Assets Trustee
Event
• Legal title to the mortgage loans will be transferred to a replacement assets trustee (Note 1)
• The replacement assets trustee becomes the legal owner of the mortgages and the CBG remains the beneficial owner
• Payments from the underlying borrowers will be payable to the CBG1
Post Issuer’s Event of Default
• Subject to the approval under Note 2 below, the CBG could sell the mortgage loans directly to a 3rd party in order to meet its obligations under the Covered Bond Guarantee or, alternatively, the CBG may sell its beneficial interest in relation to the mortgage loans
Note 1: The Assets Trustee or the CBG will obtain one of the below three approvals in
order for the mortgages relating to the loans under the DOT structure to be transferred
to a new trustee unless the consent of the CPF Board is not required:
1. prior consent of the CPF Board;
2. a Section 55B/C Court Order approving the transfer if the proposed transferee is
licensed to carry on banking business;
3. a Sections 210/212 Court Order approving the transfer if the proposed transferee
is not licensed to carry on banking business and the prior consent of the CPF
Board
Note 2: The Assets Trustee or the CBG will obtain any one of the approvals in
Note 1 for the transfer to the 3rd party purchaser
Additional Note: Pending transfer to a replacement asset trustee, UOB shall
continue to be the Assets Trustee and a sale of the beneficial interest in the
assets trust to a 3rd party purchaser could still occur
The purchaser would be able to deal with the borrowers and/or enforce the loans
(in the name of the assets trustee) via a power of attorney granted by the Assets
Trustee
Please refer to UOB Global Covered Bond Programme Offering Circular for details
Equitable Assignment versus Declaration of Assets Trust Structure
56
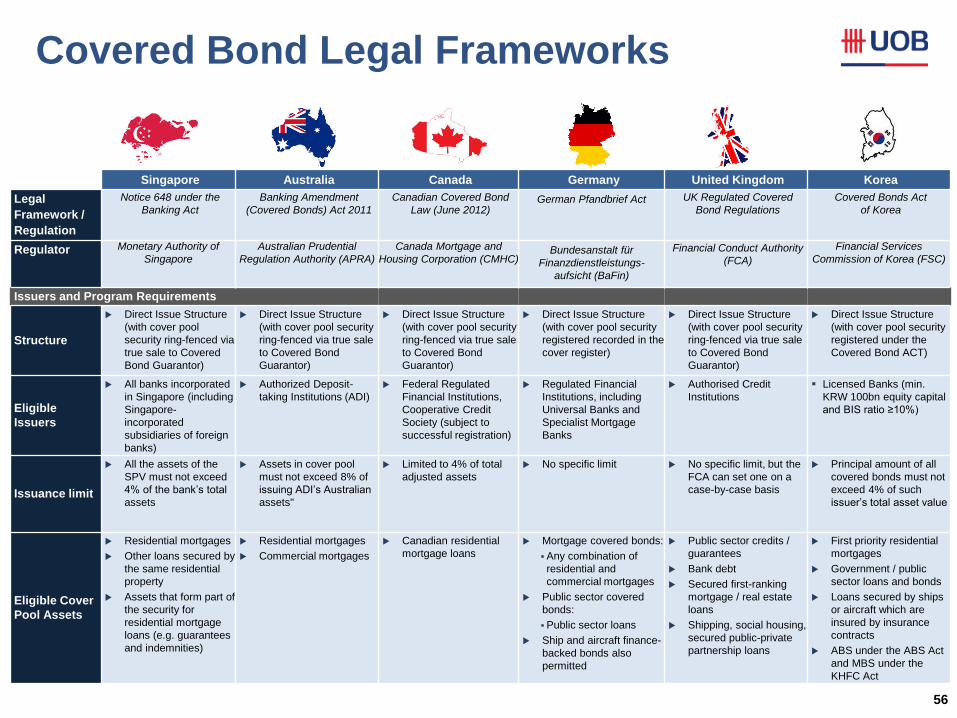
Singapore Australia Canada Germany United Kingdom Korea
Legal
Framework /
Regulation
Notice 648 under the
Banking Act
Banking Amendment
(Covered Bonds) Act 2011
Canadian Covered Bond
Law (June 2012) German Pfandbrief Act UK Regulated Covered
Bond Regulations
Covered Bonds Act
of Korea
Regulator Monetary Authority of
Singapore
Australian Prudential
Regulation Authority (APRA)
Canada Mortgage and
Housing Corporation (CMHC)
Bundesanstalt für
Finanzdienstleistungs-
aufsicht (BaFin)
Financial Conduct Authority
(FCA)
Financial Services
Commission of Korea (FSC)
Issuers and Program Requirements
Structure
Direct Issue Structure
(with cover pool
security ring-fenced via
true sale to Covered
Bond Guarantor)
Direct Issue Structure
(with cover pool security
ring-fenced via true sale
to Covered Bond
Guarantor)
Direct Issue Structure
(with cover pool security
ring-fenced via true sale
to Covered Bond
Guarantor)
Direct Issue Structure
(with cover pool security
registered recorded in the
cover register)
Direct Issue Structure
(with cover pool security
ring-fenced via true sale
to Covered Bond
Guarantor)
Direct Issue Structure
(with cover pool security
registered under the
Covered Bond ACT)
Eligible
Issuers
All banks incorporated
in Singapore (including
Singapore-
incorporated
subsidiaries of foreign
banks)
Authorized Deposit-
taking Institutions (ADI)
Federal Regulated
Financial Institutions,
Cooperative Credit
Society (subject to
successful registration)
Regulated Financial
Institutions, including
Universal Banks and
Specialist Mortgage
Banks
Authorised Credit
Institutions
Licensed Banks (min.
KRW 100bn equity capital
and BIS ratio ≥10%)
Issuance limit
All the assets of the
SPV must not exceed
4% of the bank’s total
assets
Assets in cover pool
must not exceed 8% of
issuing ADI’s Australian
assets"
Limited to 4% of total
adjusted assets
No specific limit
No specific limit, but the
FCA can set one on a
case-by-case basis
Principal amount of all
covered bonds must not
exceed 4% of such
issuer’s total asset value
Eligible Cover
Pool Assets
Residential mortgages
Other loans secured by
the same residential
property
Assets that form part of
the security for
residential mortgage
loans (e.g. guarantees
and indemnities)
Residential mortgages
Commercial mortgages
Canadian residential
mortgage loans
Mortgage covered bonds:
Any combination of
residential and
commercial mortgages
Public sector covered
bonds:
Public sector loans
Ship and aircraft finance-
backed bonds also
permitted
Public sector credits /
guarantees
Bank debt
Secured first-ranking
mortgage / real estate
loans
Shipping, social housing,
secured public-private
partnership loans
First priority residential
mortgages
Government / public
sector loans and bonds
Loans secured by ships
or aircraft which are
insured by insurance
contracts
ABS under the ABS Act
and MBS under the
KHFC Act
Covered Bond Legal Frameworks
57
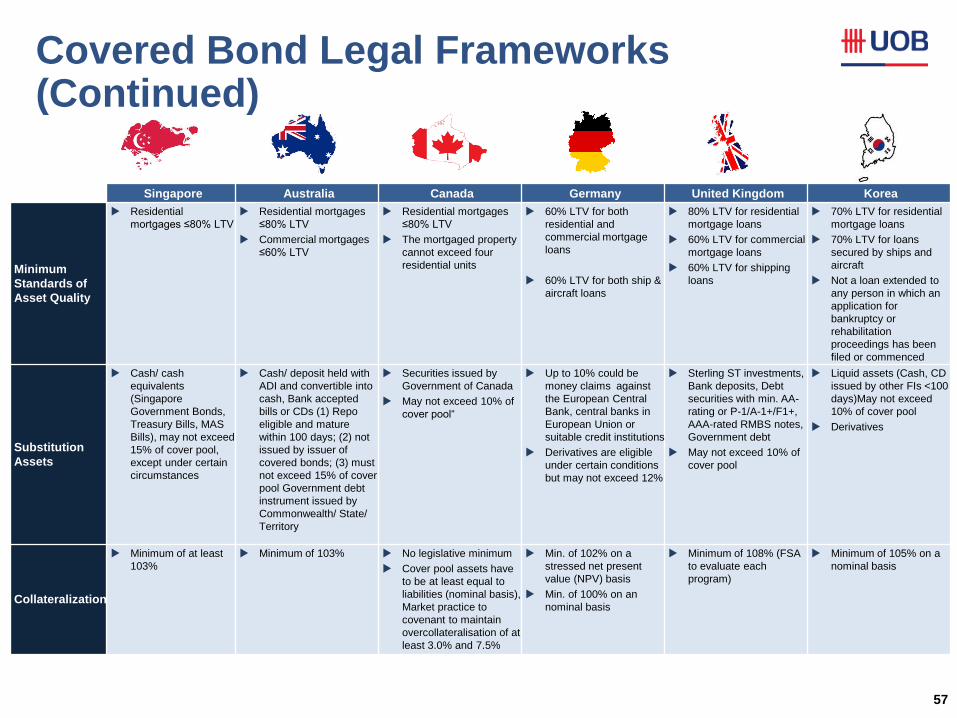
Singapore Australia Canada Germany United Kingdom Korea
Minimum
Standards of
Asset Quality
Residential
mortgages ≤80% LTV
Residential mortgages
≤80% LTV
Commercial mortgages
≤60% LTV
Residential mortgages
≤80% LTV
The mortgaged property
cannot exceed four
residential units
60% LTV for both
residential and
commercial mortgage
loans
60% LTV for both ship &
aircraft loans
80% LTV for residential
mortgage loans
60% LTV for commercial
mortgage loans
60% LTV for shipping
loans
70% LTV for residential
mortgage loans
70% LTV for loans
secured by ships and
aircraft
Not a loan extended to
any person in which an
application for
bankruptcy or
rehabilitation
proceedings has been
filed or commenced
Substitution
Assets
Cash/ cash
equivalents
(Singapore
Government Bonds,
Treasury Bills, MAS
Bills), may not exceed
15% of cover pool,
except under certain
circumstances
Cash/ deposit held with
ADI and convertible into
cash, Bank accepted
bills or CDs (1) Repo
eligible and mature
within 100 days; (2) not
issued by issuer of
covered bonds; (3) must
not exceed 15% of cover
pool Government debt
instrument issued by
Commonwealth/ State/
Territory
Securities issued by
Government of Canada
May not exceed 10% of
cover pool“
Up to 10% could be
money claims against
the European Central
Bank, central banks in
European Union or
suitable credit institutions
Derivatives are eligible
under certain conditions
but may not exceed 12%
Sterling ST investments,
Bank deposits, Debt
securities with min. AA-
rating or P-1/A-1+/F1+,
AAA-rated RMBS notes,
Government debt
May not exceed 10% of
cover pool
Liquid assets (Cash, CD
issued by other FIs <100
days)May not exceed
10% of cover pool
Derivatives
Collateralization
Minimum of at least
103%
Minimum of 103% No legislative minimum
Cover pool assets have
to be at least equal to
liabilities (nominal basis),
Market practice to
covenant to maintain
overcollateralisation of at
least 3.0% and 7.5%
Min. of 102% on a
stressed net present
value (NPV) basis
Min. of 100% on an
nominal basis
Minimum of 108% (FSA
to evaluate each
program)
Minimum of 105% on a
nominal basis
Covered Bond Legal Frameworks (Continued)
Appendix C: Macroeconomic Outlook and Banking Regulations
58
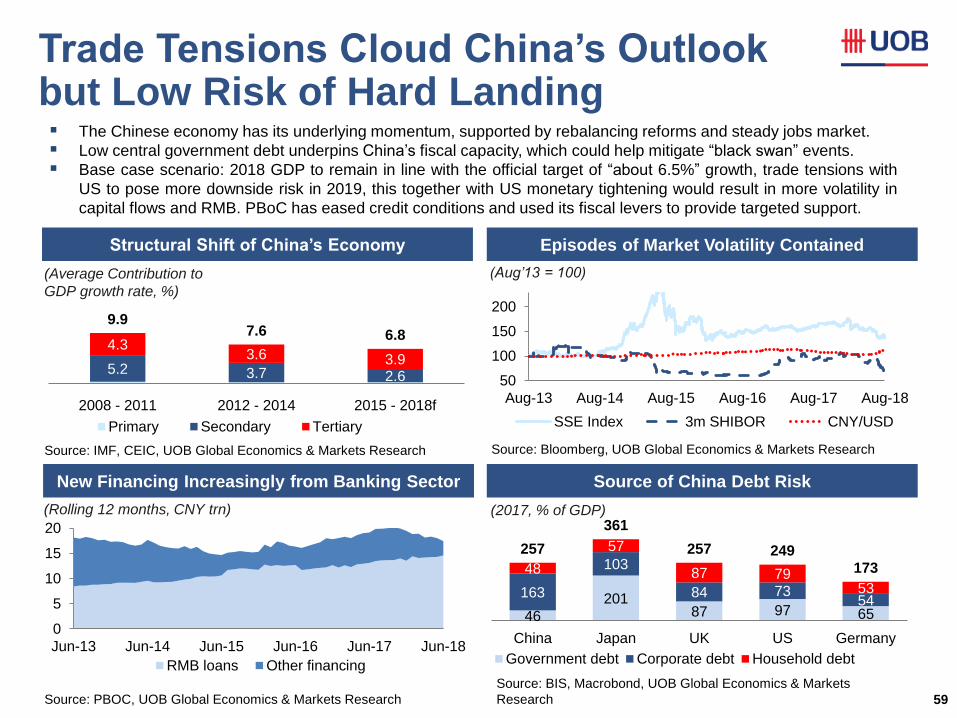
0
5
10
15
20
Jun-13 Jun-14 Jun-15 Jun-16 Jun-17 Jun-18
RMB loans Other financing
50
100
150
200
Aug-13 Aug-14 Aug-15 Aug-16 Aug-17 Aug-18
SSE Index 3m SHIBOR CNY/USD
5.2 3.7 2.6
4.3 3.6 3.9
9.9 7.6 6.8
2008 - 2011 2012 - 2014 2015 - 2018f
Primary Secondary Tertiary Total
Trade Tensions Cloud China’s Outlook but Low Risk of Hard Landing
59
46
201 87 97 65
163
103
84 73 54
48
57
87 79 53
257
361
257 249
173
China Japan UK US Germany
Government debt Corporate debt Household debt
New Financing Increasingly from Banking Sector
Structural Shift of China’s Economy
The Chinese economy has its underlying momentum, supported by rebalancing reforms and steady jobs market.
Low central government debt underpins China’s fiscal capacity, which could help mitigate “black swan” events.
Base case scenario: 2018 GDP to remain in line with the official target of “about 6.5%” growth, trade tensions with
US to pose more downside risk in 2019, this together with US monetary tightening would result in more volatility in
capital flows and RMB. PBoC has eased credit conditions and used its fiscal levers to provide targeted support.
Source: IMF, CEIC, UOB Global Economics & Markets Research
(Average Contribution to
GDP growth rate, %)
Source: PBOC, UOB Global Economics & Markets Research
(Rolling 12 months, CNY trn)
Episodes of Market Volatility Contained
Source of China Debt Risk
(Aug’13 = 100)
Source: Bloomberg, UOB Global Economics & Markets Research
(2017, % of GDP)
Source: BIS, Macrobond, UOB Global Economics & Markets
Research
Update until
2018f, if
available
Update Mar
2018 to the
latest dataset, if
available
Provide daily
data set from
2010 onwards
Update 2016 to
the latest
dataset, if
available
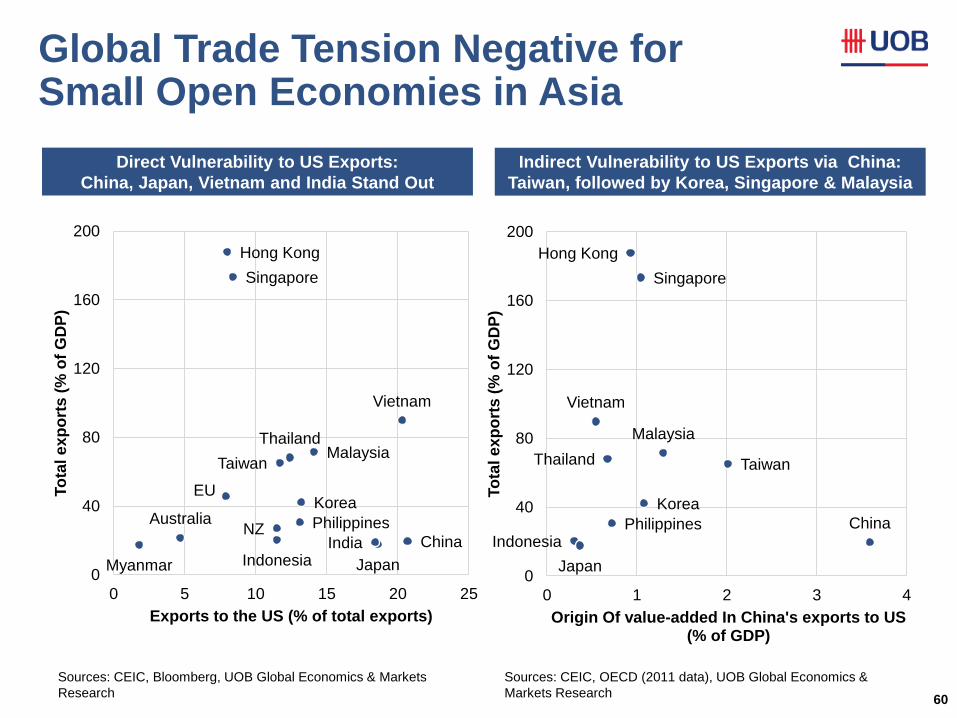
Global Trade Tension Negative for Small Open Economies in Asia
60
China Indonesia Japan
Korea
Malaysia
Myanmar
Philippines
Singapore
Taiwan
Thailand
Vietnam
Hong Kong
Australia
EU
India NZ
0
40
80
120
160
200
0 5 10 15 20 25
To
tal e
xp
ort
s (
% o
f G
DP
)
Exports to the US (% of total exports)
Sources: CEIC, Bloomberg, UOB Global Economics & Markets
Research
Direct Vulnerability to US Exports:
China, Japan, Vietnam and India Stand Out
Indirect Vulnerability to US Exports via China:
Taiwan, followed by Korea, Singapore & Malaysia
Indonesia
Japan
Vietnam
Thailand
Philippines
Hong Kong
Singapore
Korea
Malaysia
Taiwan
China
0
40
80
120
160
200
0 1 2 3 4
To
tal e
xp
ort
s (
% o
f G
DP
)
Origin Of value-added In China's exports to US (% of GDP)
Sources: CEIC, OECD (2011 data), UOB Global Economics &
Markets Research
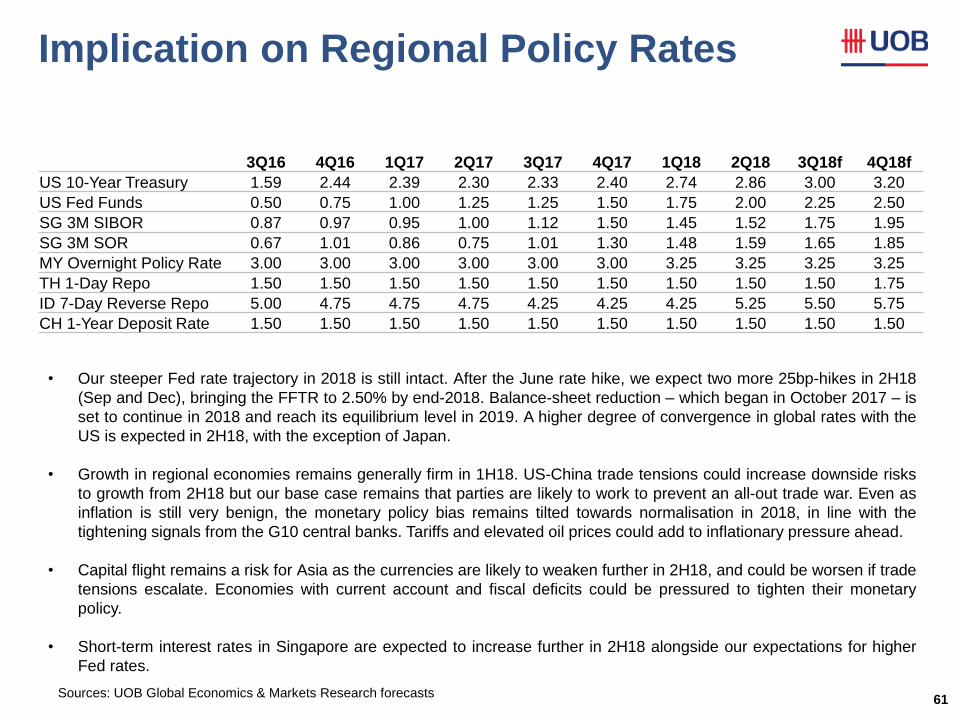
Implication on Regional Policy Rates
61 Sources: UOB Global Economics & Markets Research forecasts
Update where
relevant
3Q16 4Q16 1Q17 2Q17 3Q17 4Q17 1Q18 2Q18 3Q18f 4Q18f
US 10-Year Treasury 1.59 2.44 2.39 2.30 2.33 2.40 2.74 2.86 3.00 3.20
US Fed Funds 0.50 0.75 1.00 1.25 1.25 1.50 1.75 2.00 2.25 2.50
SG 3M SIBOR 0.87 0.97 0.95 1.00 1.12 1.50 1.45 1.52 1.75 1.95
SG 3M SOR 0.67 1.01 0.86 0.75 1.01 1.30 1.48 1.59 1.65 1.85
MY Overnight Policy Rate 3.00 3.00 3.00 3.00 3.00 3.00 3.25 3.25 3.25 3.25
TH 1-Day Repo 1.50 1.50 1.50 1.50 1.50 1.50 1.50 1.50 1.50 1.75
ID 7-Day Reverse Repo 5.00 4.75 4.75 4.75 4.25 4.25 4.25 5.25 5.50 5.75
CH 1-Year Deposit Rate 1.50 1.50 1.50 1.50 1.50 1.50 1.50 1.50 1.50 1.50
• Our steeper Fed rate trajectory in 2018 is still intact. After the June rate hike, we expect two more 25bp-hikes in 2H18
(Sep and Dec), bringing the FFTR to 2.50% by end-2018. Balance-sheet reduction – which began in October 2017 – is
set to continue in 2018 and reach its equilibrium level in 2019. A higher degree of convergence in global rates with the
US is expected in 2H18, with the exception of Japan.
• Growth in regional economies remains generally firm in 1H18. US-China trade tensions could increase downside risks
to growth from 2H18 but our base case remains that parties are likely to work to prevent an all-out trade war. Even as
inflation is still very benign, the monetary policy bias remains tilted towards normalisation in 2018, in line with the
tightening signals from the G10 central banks. Tariffs and elevated oil prices could add to inflationary pressure ahead.
• Capital flight remains a risk for Asia as the currencies are likely to weaken further in 2H18, and could be worsen if trade
tensions escalate. Economies with current account and fiscal deficits could be pressured to tighten their monetary
policy.
• Short-term interest rates in Singapore are expected to increase further in 2H18 alongside our expectations for higher
Fed rates.
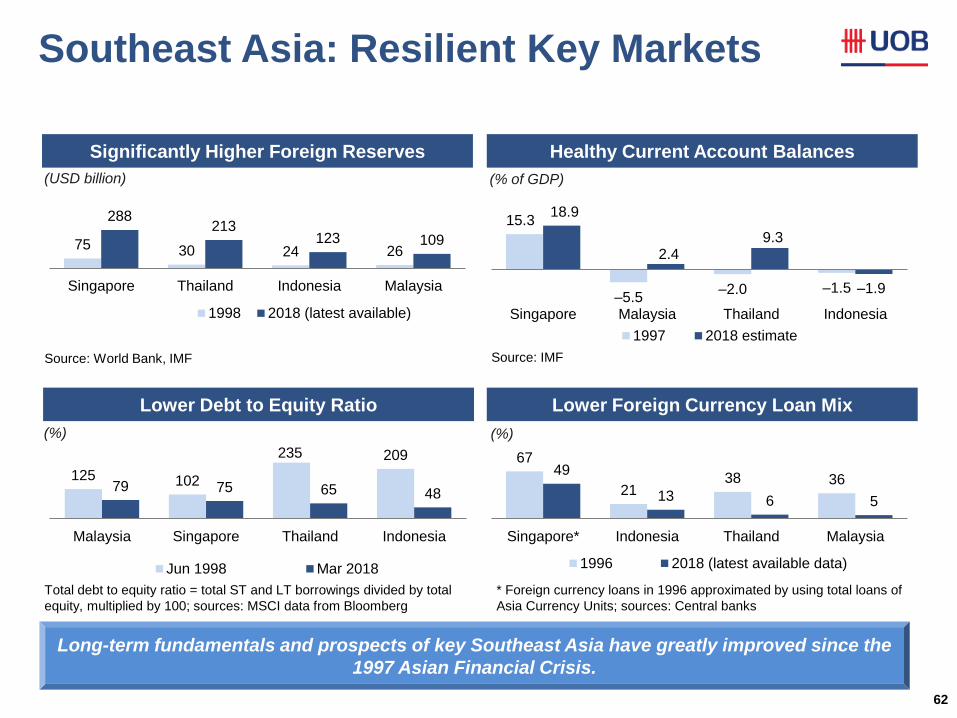
Southeast Asia: Resilient Key Markets
62
Lower Debt to Equity Ratio
Significantly Higher Foreign Reserves Healthy Current Account Balances
Lower Foreign Currency Loan Mix
Update 2018 to
the latest
dataset (see
excel file within)
Update Oct’17
to the latest
dataset (see
excel file within)
Update 2018e to
the latest
dataset (see
excel file within)
Update 2017 to
the latest
dataset (see
excel file within)
Source: World Bank, IMF
(USD billion)
Total debt to equity ratio = total ST and LT borrowings divided by total
equity, multiplied by 100; sources: MSCI data from Bloomberg
(%)
(% of GDP)
Source: IMF
(%)
* Foreign currency loans in 1996 approximated by using total loans of
Asia Currency Units; sources: Central banks
Long-term fundamentals and prospects of key Southeast Asia have greatly improved since the
1997 Asian Financial Crisis.
125 102
235 209
79 75 65 48
Malaysia Singapore Thailand Indonesia
Jun 1998 Mar 2018
67
21 38 36
49
13 6 5
Singapore* Indonesia Thailand Malaysia
1996 2018 (latest available data)
15.3
–5.5 –2.0 –1.5
18.9
2.4 9.3
–1.9
Singapore Malaysia Thailand Indonesia
1997 2018 estimate
75 30 24 26
288 213
123 109
Singapore Thailand Indonesia Malaysia
1998 2018 (latest available)
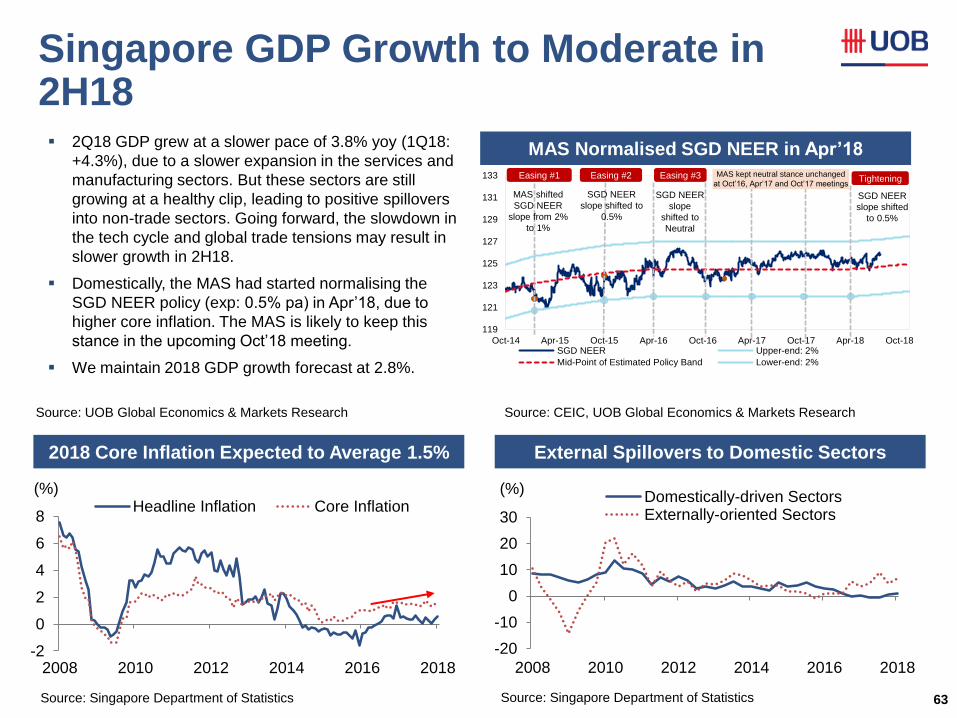
Singapore GDP Growth to Moderate in 2H18
63
MAS Normalised SGD NEER in Apr’18
External Spillovers to Domestic Sectors
2Q18 GDP grew at a slower pace of 3.8% yoy (1Q18:
+4.3%), due to a slower expansion in the services and
manufacturing sectors. But these sectors are still
growing at a healthy clip, leading to positive spillovers
into non-trade sectors. Going forward, the slowdown in
the tech cycle and global trade tensions may result in
slower growth in 2H18.
Domestically, the MAS had started normalising the
SGD NEER policy (exp: 0.5% pa) in Apr’18, due to
higher core inflation. The MAS is likely to keep this
stance in the upcoming Oct’18 meeting.
We maintain 2018 GDP growth forecast at 2.8%.
Source: Singapore Department of Statistics
2018 Core Inflation Expected to Average 1.5%
Source: UOB Global Economics & Markets Research Source: CEIC, UOB Global Economics & Markets Research
Source: Singapore Department of Statistics
Update where
relevant
Pls provide a chart
file where the excel
source file can be
assessed.
Update the charts to
latest available data.
-2
0
2
4
6
8
2008 2010 2012 2014 2016 2018
(%) Headline Inflation Core Inflation
-20
-10
0
10
20
30
2008 2010 2012 2014 2016 2018
(%) Domestically-driven SectorsExternally-oriented Sectors
119
121
123
125
127
129
131
133
Oct-14 Apr-15 Oct-15 Apr-16 Oct-16 Apr-17 Oct-17 Apr-18 Oct-18SGD NEER Upper-end: 2%
Mid-Point of Estimated Policy Band Lower-end: 2%
MAS shifted
SGD NEER
slope from 2%
to 1%
SGD NEER
slope shifted to
0.5%
SGD NEER
slope
shifted to
Neutral
Easing #1 Easing #2 Easing #3 MAS kept neutral stance unchanged
at Oct’16, Apr’17 and Oct’17 meetings
SGD NEER
slope shifted
to 0.5%
Tightening
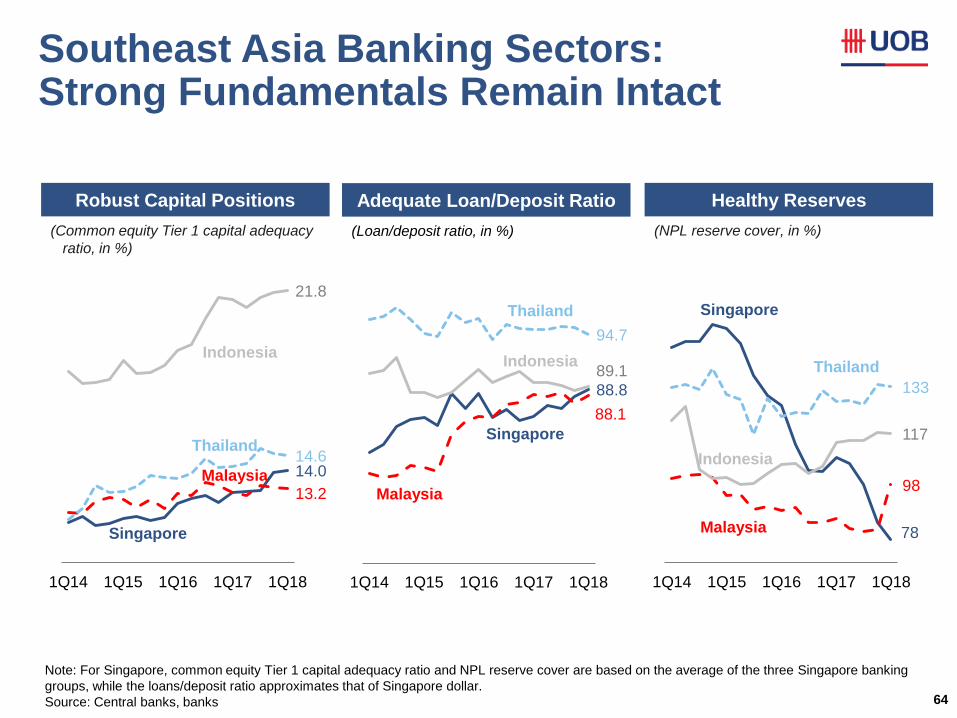
Southeast Asia Banking Sectors: Strong Fundamentals Remain Intact
64
Robust Capital Positions
Update MRQ to
the latest
dataset (see
excel file)
Update MRQ to
the latest
dataset (see
excel file)
Update MRQ to
the latest
dataset (see
excel file)
(Common equity Tier 1 capital adequacy
ratio, in %)
14.0
13.2
14.6
21.8
1Q14 1Q15 1Q16 1Q17 1Q18
Note: For Singapore, common equity Tier 1 capital adequacy ratio and NPL reserve cover are based on the average of the three Singapore banking
groups, while the loans/deposit ratio approximates that of Singapore dollar.
Source: Central banks, banks
Adequate Loan/Deposit Ratio
(Loan/deposit ratio, in %)
88.8
88.1
94.7
89.1
1Q14 1Q15 1Q16 1Q17 1Q18
Healthy Reserves
(NPL reserve cover, in %)
78
98
133
117
1Q14 1Q15 1Q16 1Q17 1Q18
Singapore
Malaysia
Thailand
Indonesia
Malaysia
Singapore
Indonesia
Thailand Singapore
Thailand
Malaysia
Indonesia
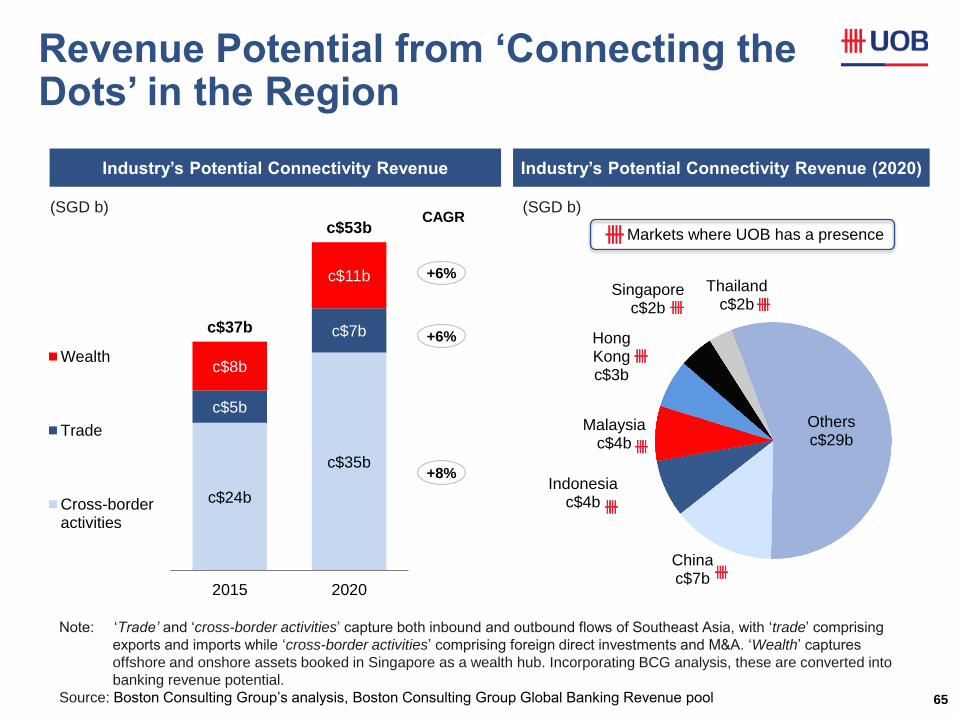
Revenue Potential from ‘Connecting the Dots’ in the Region
65
c$24b
c$35b
c$5b
c$7b
c$8b
c$11b
c$37b
c$53b
2015 2020
Total
Wealth
Trade
Cross-borderactivities
Note: ‘Trade’ and ‘cross-border activities’ capture both inbound and outbound flows of Southeast Asia, with ‘trade’ comprising
exports and imports while ‘cross-border activities’ comprising foreign direct investments and M&A. ‘Wealth’ captures
offshore and onshore assets booked in Singapore as a wealth hub. Incorporating BCG analysis, these are converted into
banking revenue potential.
Source: Boston Consulting Group’s analysis, Boston Consulting Group Global Banking Revenue pool
Source: BCG
+6%
CAGR
+6%
+8%
Industry’s Potential Connectivity Revenue
China c$7b
Indonesia c$4b
Malaysia c$4b
Hong Kong c$3b
Singapore c$2b
Thailand c$2b
Others c$29b
Industry’s Potential Connectivity Revenue (2020)
(SGD b) (SGD b)
Markets where UOB has a presence
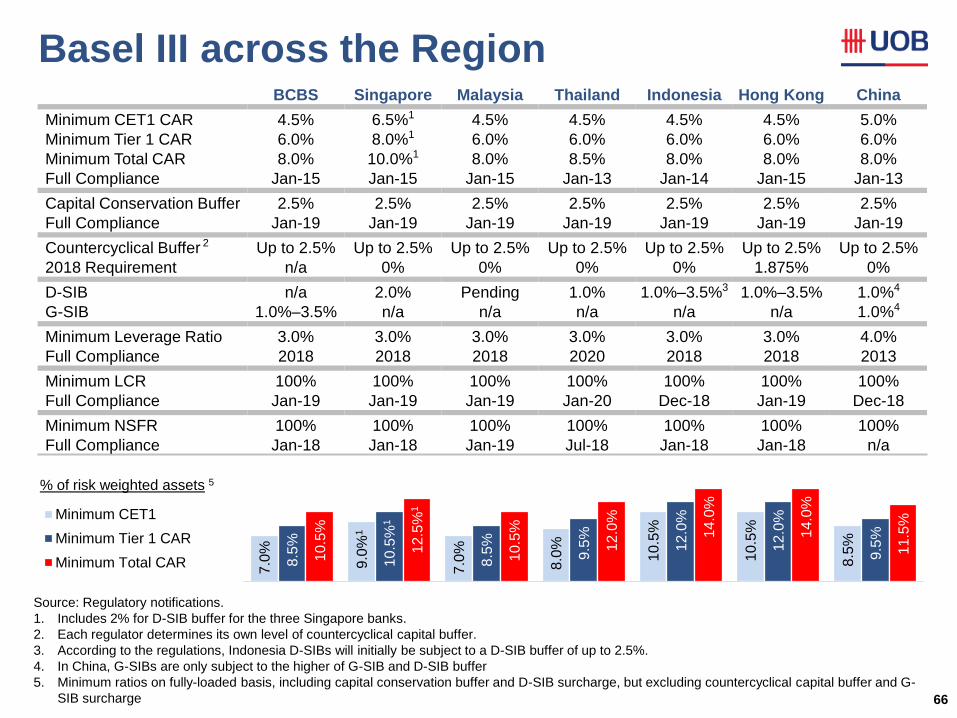
7.0
%
9.0
%1
7.0
%
8.0
%
10.5
%
10.5
%
8.5
%
8.5
%
10.5
%1
8.5
%
9.5
%
12.0
%
12.0
%
9.5
%
10.5
%
12.5
%1
10.5
%
12.0
%
14.0
%
14.0
%
11.5
%
BCBS Singapore Malaysia Thailand Indonesia Hong Kong China
Minimum CET1
Minimum Tier 1 CAR
Minimum Total CAR
% of risk weighted assets 5
Basel III across the Region
66
Update where
appropriate
BCBS Singapore Malaysia Thailand Indonesia Hong Kong China
Minimum CET1 CAR 4.5% 6.5%1 4.5% 4.5% 4.5% 4.5% 5.0%
Minimum Tier 1 CAR 6.0% 8.0%1 6.0% 6.0% 6.0% 6.0% 6.0%
Minimum Total CAR 8.0% 10.0%1 8.0% 8.5% 8.0% 8.0% 8.0%
Full Compliance Jan-15 Jan-15 Jan-15 Jan-13 Jan-14 Jan-15 Jan-13
Capital Conservation Buffer 2.5% 2.5% 2.5% 2.5% 2.5% 2.5% 2.5%
Full Compliance Jan-19 Jan-19 Jan-19 Jan-19 Jan-19 Jan-19 Jan-19
Countercyclical Buffer 2 Up to 2.5% Up to 2.5% Up to 2.5% Up to 2.5% Up to 2.5% Up to 2.5% Up to 2.5%
2018 Requirement n/a 0% 0% 0% 0% 1.875% 0%
D-SIB n/a 2.0% Pending 1.0% 1.0%–3.5%3 1.0%–3.5% 1.0%4
G-SIB 1.0%–3.5% n/a n/a n/a n/a n/a 1.0%4
Minimum Leverage Ratio 3.0% 3.0% 3.0% 3.0% 3.0% 3.0% 4.0%
Full Compliance 2018 2018 2018 2020 2018 2018 2013
Minimum LCR 100% 100% 100% 100% 100% 100% 100%
Full Compliance Jan-19 Jan-19 Jan-19 Jan-20 Dec-18 Jan-19 Dec-18
Minimum NSFR 100% 100% 100% 100% 100% 100% 100%
Full Compliance Jan-18 Jan-18 Jan-19 Jul-18 Jan-18 Jan-18 n/a
Source: Regulatory notifications.
1. Includes 2% for D-SIB buffer for the three Singapore banks.
2. Each regulator determines its own level of countercyclical capital buffer.
3. According to the regulations, Indonesia D-SIBs will initially be subject to a D-SIB buffer of up to 2.5%.
4. In China, G-SIBs are only subject to the higher of G-SIB and D-SIB buffer
5. Minimum ratios on fully-loaded basis, including capital conservation buffer and D-SIB surcharge, but excluding countercyclical capital buffer and G-
SIB surcharge
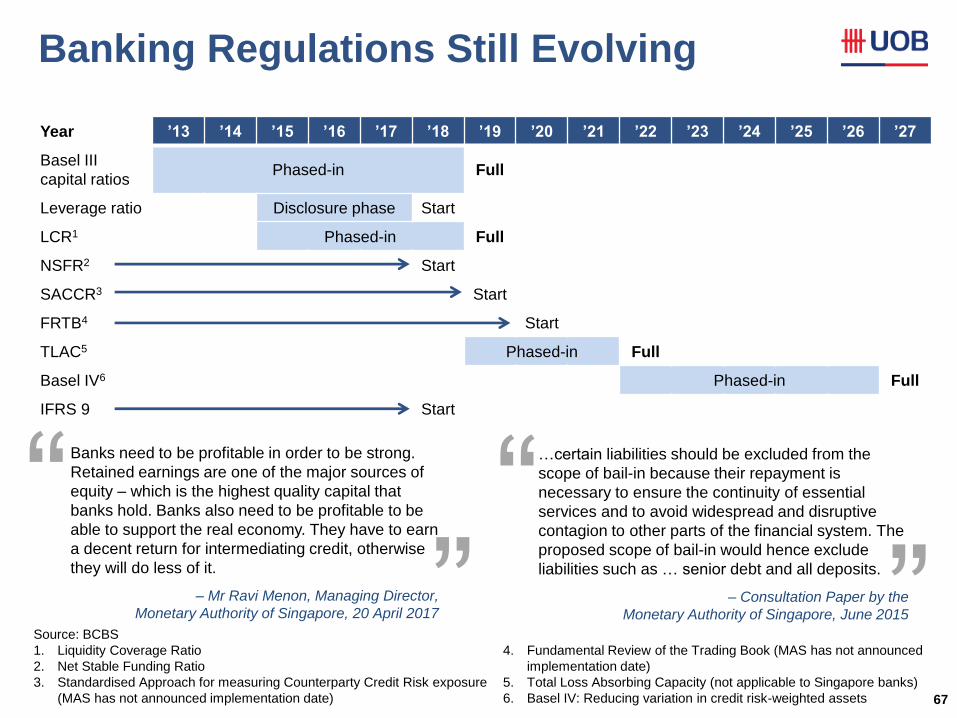
Source: BCBS
1. Liquidity Coverage Ratio
2. Net Stable Funding Ratio
3. Standardised Approach for measuring Counterparty Credit Risk exposure
(MAS has not announced implementation date)
Banking Regulations Still Evolving
67
Year ’13 ’14 ’15 ’16 ’17 ’18 ’19 ’20 ’21 ’22 ’23 ’24 ’25 ’26 ’27
Basel III
capital ratios Phased-in Full
Leverage ratio Disclosure phase Start
LCR1 Phased-in Full
NSFR2 Start
SACCR3 Start
FRTB4 Start
TLAC5 Phased-in Full
Basel IV6 Phased-in Full
IFRS 9 Start
Banks need to be profitable in order to be strong.
Retained earnings are one of the major sources of
equity – which is the highest quality capital that
banks hold. Banks also need to be profitable to be
able to support the real economy. They have to earn
a decent return for intermediating credit, otherwise
they will do less of it.
– Mr Ravi Menon, Managing Director,
Monetary Authority of Singapore, 20 April 2017
…certain liabilities should be excluded from the
scope of bail-in because their repayment is
necessary to ensure the continuity of essential
services and to avoid widespread and disruptive
contagion to other parts of the financial system. The
proposed scope of bail-in would hence exclude
liabilities such as … senior debt and all deposits.
– Consultation Paper by the
Monetary Authority of Singapore, June 2015
4. Fundamental Review of the Trading Book (MAS has not announced
implementation date)
5. Total Loss Absorbing Capacity (not applicable to Singapore banks)
6. Basel IV: Reducing variation in credit risk-weighted assets
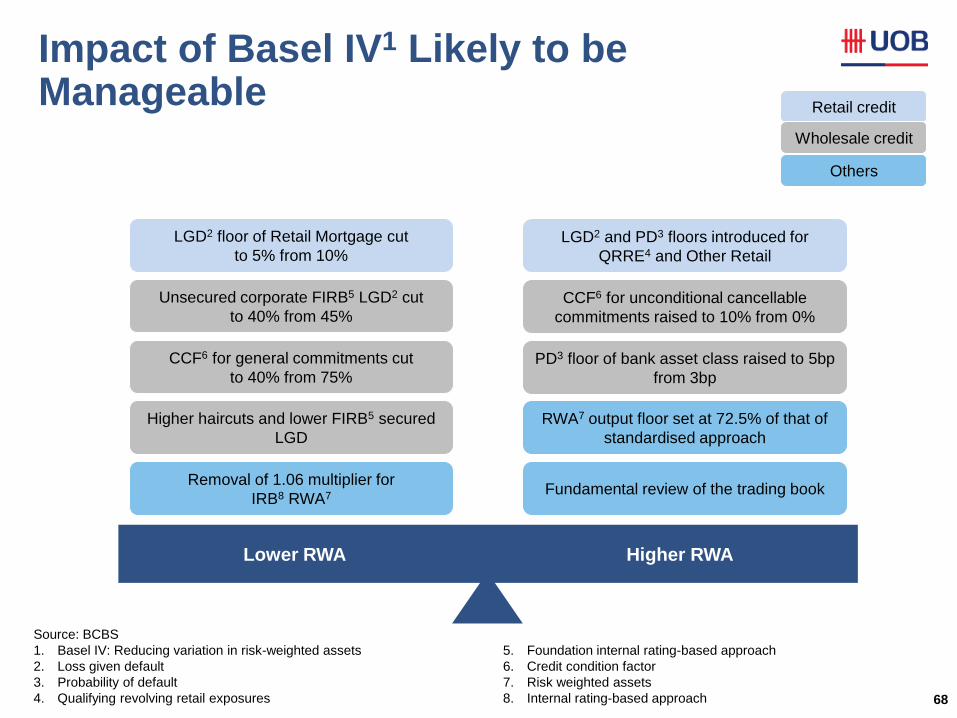
68
Impact of Basel IV1 Likely to be Manageable
LGD2 floor of Retail Mortgage cut
to 5% from 10%
Lower RWA Higher RWA
Unsecured corporate FIRB5 LGD2 cut
to 40% from 45%
CCF6 for general commitments cut
to 40% from 75%
Higher haircuts and lower FIRB5 secured
LGD
Removal of 1.06 multiplier for
IRB8 RWA7
LGD2 and PD3 floors introduced for
QRRE4 and Other Retail
CCF6 for unconditional cancellable
commitments raised to 10% from 0%
PD3 floor of bank asset class raised to 5bp
from 3bp
Fundamental review of the trading book
Source: BCBS
1. Basel IV: Reducing variation in risk-weighted assets
2. Loss given default
3. Probability of default
4. Qualifying revolving retail exposures
5. Foundation internal rating-based approach
6. Credit condition factor
7. Risk weighted assets
8. Internal rating-based approach
Retail credit
Wholesale credit
Others
RWA7 output floor set at 72.5% of that of
standardised approach
Thank You