unsteady flow interactions within the inlet cavity of a turbine … · · 2015-05-21interactions...
TRANSCRIPT

A. Pfaue-mail: [email protected]
J. Schlienger
D. Rusch
A. I. Kalfas
R. S. Abhari
Turbomachinery Laboratory,Swiss Federal Institute of Technology,
8092 Zurich, Switzerland
Unsteady Flow InteractionsWithin the Inlet Cavity of aTurbine Rotor Tip Labyrinth SealThis paper focuses on the flow within the inlet cavity of a turbine rotor tip labyrinth sealof a two stage axial research turbine. Highly resolved, steady and unsteady three-dimensional flow data are presented. The probes used here are a miniature five-holeprobe of 0.9 mm head diameter and the novel virtual four sensor fast response aerody-namic probe (FRAP) with a head diameter of 0.84 mm. The cavity flow itself is not onlya loss producing area due to mixing and vortex stretching, it also adversely affects thefollowing rotor passage through the fluid that is spilled into the main flow. The associatedfluctuating mass flow has a relatively low total pressure and results in a negative inci-dence to the rotor tip blade profile section. The dominating kinematic flow feature in theregion between cavity and main flow is a toroidal vortex, which is swirling at highcircumferential velocity. It is fed by strong shear and end wall fluid from the pressure sideof the stator passage. The static pressure field interaction between the moving rotorleading edges and the stator trailing edges is one driving force of the cavity flow. It forcesthe toroidal vortex to be stretched in space and time. A comprehensive flow model in-cluding the drivers of this toroidal vortex is proposed. This labyrinth seal configurationresults in about 1.6% turbine efficiency reduction. This is the first in a series of papersfocusing on turbine loss mechanisms in shrouded axial turbines. Additional measure-ments have been made with variations in seal clearance gap. Initial indications show thatvariation in the gap has a major effect on flow structures and turbine loss.�DOI: 10.1115/1.2008973�
IntroductionThe development of turbo machinery blade design is currently
focusing on the characteristics of highly loaded stages. These areadvantageous because the use of fewer blades that produce thesame power at the same efficiency results in a substantially lowercost and a higher power density. Concerning low aspect ratioblades, as they are used in intermediate and high pressure tur-bines, the inherent strong secondary flows are enhanced by thedesign of higher turning airfoils. Consequently, the aerodynamicsecondary flow losses increase.
In order to decrease secondary flows and reduce the migrationof the low kinetic energy fluid into the main flow, the design ofend wall regions has been increasingly addressed. Gregory-Smithet al. �1� successfully introduced the use of end wall profilingprocedures to modify the secondary flow. Sauer et al. �2� proposedthe use of leading edge modifications at the tip region to decreasesecondary losses. These studies have shown effectiveness in con-trolling the secondary flow under controlled inflow conditions.
In shrouded turbines however, the inlet flow condition to ablade row is disturbed at the end wall by flow interactions withopen cavities. Those open cavities are present at the inlet and exitof the labyrinth seals. The size of these cavities is determined bythe axial thrust variation or the mechanical and thermal growth ofthe rotor assembly. As such the aerodynamic design has to allowfor large inlet and exit cavities, particularly for steam turbine ap-plications. Prior observations seem to suggest that secondary flowstructures and losses are influenced by the steady and unsteadyinteractions with the cavity flow field.
The subject of cavity interactions in turbines was addressed thefirst time by Denton and Johnson �3�. However, it is only in recent
Contributed by the International Gas Turbine Institute and presented at the Inter-national Gas Turbine and Aeroengine Congress and Exhibition, Atlanta, GA, June16–19, 2003. Manuscript received by the IGTI December 1, 2002; final revision
March 1, 2003. Paper No. 2003-GT-38271. Review Chair: H. R. Simmons.Journal of Turbomachinery Copyright © 20
years that this subject has been the focus of much research. Peterset al. �4� examined the effect of gap size on the steady interactionbetween the leakage flow and the secondary flow field of a sub-sequent stator in a 1.5 stage, shrouded axial turbine. Hunter andManwaring �5� reported about two extra vortices generated in adownstream stator blade row. Wallis et al. �6� observed that stronginteractions are present in open cavities of shrouded turbineblades. The following blade rows were found to receive the tipflow at a negative incidence. Anker and Mayer �7� numericallyinvestigated the leakage interaction with the main flow and foundthat the tip leakage flow is not uniform in the pitch wise direction.Schlienger et al. �8� changed the geometry of the labyrinth exitcavities and compared the effects on the main flow as well as onthe efficiency. These studies have focused mainly on the interac-tion happening in the main flow and following blade passages.
However, as the origins of these interactions are open cavities,an increased emphasis must be placed on the associated unsteadyflow interactions within these cavities. The unsteady fluctuationsmay create large amplitude deviations to the time-averaged struc-ture of the cavity flow. Thus, the actual cavity flow may be quitedifferent than the steady model as proposed by Pfau et al. �9�.
In the present work the inlet cavity to the second rotor tiplabyrinth seal of a two stage axial turbine is investigated. Thisflow may be expected to have features similar to the unsteadywake flow avenues described by Binder �10� and unsteady vortexinteractions observed by Chaluvadi et al. �11�. As the cavity re-gion is small these flow features can only be experimentally mea-sured with miniature probes of minimized blockage. Thus, aunique element of this work is the application of the new fastresponse aerodynamic probe �FRAP�, which is described in acompanion paper by Pfau et al. �12�. This probe provides spatiallyand temporally highly resolved measurements of the three-
dimensional flow field.OCTOBER 2005, Vol. 127 / 67905 by ASME

Methodology
Test Case and Measurement Technology. The cavity interac-tion flow was investigated in the two-stage low speed axial turbine“LISA.” The test rig is described in detail in Sell et al. �13� Themain characteristics of the turbine are summarized in Table 1.
The constant annulus and the four blade rows are depicted inFig. 1. The stepped shrouds on the blades together with threesealing fins form the labyrinth seal. The geometry under investi-gation is similar to steam turbine applications, where large inletand exit cavities allow for axial movement of the rotor blades.Consequently, the blade profiles are of a medium loaded type withleaned stator blades.
The tip gap was set to 0.36% of the blade height. In comparisonto real applications this value is small, as gaps of 0.7%–1% bladeheight are commonly employed. The small gap was, however,chosen in order to increase the pure cavity to main flow interac-tion by sucking less leakage mass flow out of the inlet cavity. Theexperiments were performed at a rotational speed of 2700 rpmand a mass flow of 9.86 kg/s. In real steam turbine the fluiddynamic conditions are Re=3�106 and M=0.3 with a suctionpeak velocity of around M=0.8. Therefore, compressibility aswell as viscous effects are not exactly modeled in this turbine.However, as the velocity triangles and reduced frequencies matchto a real stage, unsteady effects, like vortex or potential field in-teractions, are comparable.
The coordinate system used to display the results is cylindrical.The radial direction r is made dimensionless with the bladeheight, such that R=0 denotes the hub and R=1 the tip radius ofthe blades. The cavity floor of the labyrinth is at R=1.22. Thedirection of the turbine axis is denoted with z, where a local non-dimensional coordinate Z is introduced �see also Fig. 2�. It startsat the cavity entry lip and is made dimensionless with the axialwidth of the cavity �zcav=15 mm�. The circumferential direction iscounted positive with the sense of rotation. The chosen view inthe diagrams is upstream as the observer in Fig. 1 indicates.Therefore, the circumferential axis in the diagrams is reversedpointing into anti-rotational direction.
The data sets presented here comprise 2640 steady and 1725time resolved measurement points. The 2640 steady data pointsare distributed onto six axial measurement planes as indicated inFig. 2�a�. Each plane is resolved by 23�19 points covering 1.1
Table 1 Main characteristics of the test turbine
Pressure ratio 1.32 Mass flow 9.86 kg/s
Max. power 400 kW Turbine speed 2700 rpmTinlet 40 °C Pexit
AmbientMach 0.1…0.4 ReCax 105
n �rotor/stator� 42 Tip diameter 800 mmSeal gap 0.35 mm Blade aspect ratio 1.8
Fig. 1 Cross section of the test geometry
680 / Vol. 127, OCTOBER 2005
pitches. A miniature five hole pneumatic probe of 0.9 mm headdiameter was applied. The calibration range of the aerodynamicmodel was ±10° in yaw and ±30° in pitch direction. The errorband width in flow angle is ±0.3° and ±60 Pa and ±120 Pa totaland static pressure, respectively �14�. In terms of non-dimensionalpressures Cp this equals ±0.0019 and ±0.0038 for total and staticpressure. Downstream of a stator, flow velocities of M=0.3 arepresent, which is measured accurate to within ±1.3%. The accu-racy of the velocity components depend on the flow angles. Theworst case of error band width of the non-dimensional velocitieswas found to be ±0.007 in axial �vz�, ±0.016 in tangential �v��and ±0.005 in radial �vr� direction.
The unsteady data points cover the same downstream five axialpositions as the pneumatic data grid but with an average resolu-tion of 23�15 points per plane �see Fig. 2�b��. Due to geometricconstraints the measurement plane at Z=0.28 ranges from the cav-ity floor to R=0.95 only. The virtual four sensor fast responseaerodynamic probe, that was used, is characterized by low block-age with a head diameter of 0.84 mm and the capability of mea-suring three-dimensional flow up to a frequency of 25 kHz. Theprobe’s calibration limits the range to ±30° for yaw and −30° to+21° for the pitch angle. The probe concept is described in detailin Pfau et al. �12�. Flow angles are measured to ±0.4° for yaw and±0.8° for pitch angle. The accuracies of total and static pressureare ±120 Pa and ±85 Pa which result in a typical error of 1.2% forMach number. These numbers do not include unsteady aerody-namic effects on the probe tip.
Unsteady Data Postprocessing. Each position of the measure-ment grid is measured for 3 s at 200 kHz. The data sets are pro-cessed to yield the basic flow quantities, i.e., flow angles, total andstatic pressure by applying a phase lock average of 100 events.One event covers three consecutive rotor blade passages. Eachrotor passage is resolved by 106 samples. In comparison to thehighest frequency measured in the spectrum this temporal resolu-tion results in an over sampled data set. However, for applyingfast response measurement technology in a virtual three or foursensor mode this is a necessity, so that the measured relative po-sition to the rotor of each probe is accurately known. A detaileddescription of the data postprocessing is given in Pfau et al.12
The basic flow quantities are reduced to Mach number andvelocity components. The instantaneous velocity field is furtherprocessed to calculate the instantaneous vorticity. This is possible,because the data are highly resolved in both space and time andthus, a quasi-steady analysis at each instant of time can be cor-rectly performed. Partial time derivatives of the vorticity are cal-culated by applying a time marching differential scheme on thecontrol volume data sets. Therefore, all terms of the unsteadyvorticity equation can be calculated, which allows for further de-scription of the loss production mechanisms.
The data are measured in the absolute coordinate system. The
Fig. 2 Locations of measurement
transformation into the rotating coordinate system is done by
Transactions of the ASME
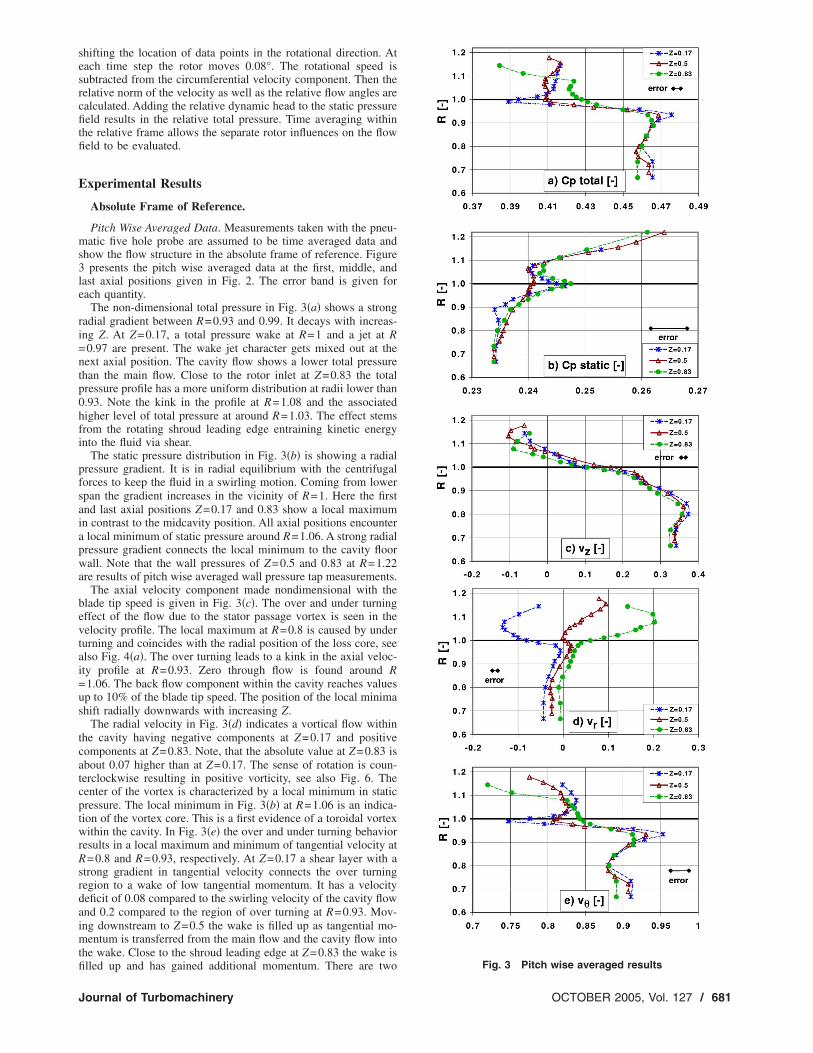
Fig. 3 Pitch wise averaged results
shifting the location of data points in the rotational direction. Ateach time step the rotor moves 0.08°. The rotational speed issubtracted from the circumferential velocity component. Then therelative norm of the velocity as well as the relative flow angles arecalculated. Adding the relative dynamic head to the static pressurefield results in the relative total pressure. Time averaging withinthe relative frame allows the separate rotor influences on the flowfield to be evaluated.
Experimental Results
Absolute Frame of Reference.
Pitch Wise Averaged Data. Measurements taken with the pneu-matic five hole probe are assumed to be time averaged data andshow the flow structure in the absolute frame of reference. Figure3 presents the pitch wise averaged data at the first, middle, andlast axial positions given in Fig. 2. The error band is given foreach quantity.
The non-dimensional total pressure in Fig. 3�a� shows a strongradial gradient between R=0.93 and 0.99. It decays with increas-ing Z. At Z=0.17, a total pressure wake at R=1 and a jet at R=0.97 are present. The wake jet character gets mixed out at thenext axial position. The cavity flow shows a lower total pressurethan the main flow. Close to the rotor inlet at Z=0.83 the totalpressure profile has a more uniform distribution at radii lower than0.93. Note the kink in the profile at R=1.08 and the associatedhigher level of total pressure at around R=1.03. The effect stemsfrom the rotating shroud leading edge entraining kinetic energyinto the fluid via shear.
The static pressure distribution in Fig. 3�b� is showing a radialpressure gradient. It is in radial equilibrium with the centrifugalforces to keep the fluid in a swirling motion. Coming from lowerspan the gradient increases in the vicinity of R=1. Here the firstand last axial positions Z=0.17 and 0.83 show a local maximumin contrast to the midcavity position. All axial positions encountera local minimum of static pressure around R=1.06. A strong radialpressure gradient connects the local minimum to the cavity floorwall. Note that the wall pressures of Z=0.5 and 0.83 at R=1.22are results of pitch wise averaged wall pressure tap measurements.
The axial velocity component made nondimensional with theblade tip speed is given in Fig. 3�c�. The over and under turningeffect of the flow due to the stator passage vortex is seen in thevelocity profile. The local maximum at R=0.8 is caused by underturning and coincides with the radial position of the loss core, seealso Fig. 4�a�. The over turning leads to a kink in the axial veloc-ity profile at R=0.93. Zero through flow is found around R=1.06. The back flow component within the cavity reaches valuesup to 10% of the blade tip speed. The position of the local minimashift radially downwards with increasing Z.
The radial velocity in Fig. 3�d� indicates a vortical flow withinthe cavity having negative components at Z=0.17 and positivecomponents at Z=0.83. Note, that the absolute value at Z=0.83 isabout 0.07 higher than at Z=0.17. The sense of rotation is coun-terclockwise resulting in positive vorticity, see also Fig. 6. Thecenter of the vortex is characterized by a local minimum in staticpressure. The local minimum in Fig. 3�b� at R=1.06 is an indica-tion of the vortex core. This is a first evidence of a toroidal vortexwithin the cavity. In Fig. 3�e� the over and under turning behaviorresults in a local maximum and minimum of tangential velocity atR=0.8 and R=0.93, respectively. At Z=0.17 a shear layer with astrong gradient in tangential velocity connects the over turningregion to a wake of low tangential momentum. It has a velocitydeficit of 0.08 compared to the swirling velocity of the cavity flowand 0.2 compared to the region of over turning at R=0.93. Mov-ing downstream to Z=0.5 the wake is filled up as tangential mo-mentum is transferred from the main flow and the cavity flow intothe wake. Close to the shroud leading edge at Z=0.83 the wake is
filled up and has gained additional momentum. There are twoJournal of Turbomachinery
OCTOBER 2005, Vol. 127 / 681
sources of tangential momentum entrainment in this flow region:the rotating shroud and the higher swirl component of the mainflow. The shroud outer diameter at R=1.06 coincides with thekink in the tangential velocity profile.
Pressure and Velocity Field. The total pressure distribution at mid-cavity position Z=0.5 is displayed in Fig. 4�a�. The cavity floor isdepicted with a thick line. The tip radius and the trailing edgeposition of the stator are indicated with dashed lines. The distri-bution shows similar features as described in Pfau et al. �9�. Thecavity flow has a lower level of total pressure. The main flowexhibits the secondary flow structure of a blade passage showing aloss core at R=0.76. On the pressure side of the stator wake thehigh total pressure gradient reaches the tip radius R=1. Here thethin boundary layer created on the passage tip end wall meets thecavity flow. The fluid has positive radial velocity and is movinginto the cavity as the arrow indicates. Above the loss core, i.e., onthe suction side of the blade wake, a low total pressure region hasformed at R=0.97 showing the same order of magnitude as theloss core. This region is part of a wake in tangential momentum,as described in Fig. 3�e�. It originates from the backward facingsurface of the cavity at a radial position slightly higher than 1. Thearrow illustrates the negative radial velocity and the flow out ofthe cavity.
The static pressure field in Fig. 4�b� is circumferential nonuni-form due to the stator trailing edge. Close to the position of the
Fig. 4 a… Total pressure Cpo†−‡, b… Static pressure Cp†−‡
Fig. 5 Radial velocity vr†−‡, R=1 „tip radius…
682 / Vol. 127, OCTOBER 2005
trailing edge around C=0.35 a high static pressure is induced. AtC=−0.1 the distance to the suction side surface is larger and there-fore the static pressure is lower. This circumferential distributionpropagates into the cavity volume and varies over one pitch by±0.003 at R=1.06.
Comparing Figs. 4�a� and 4�b� the blade wake has convected�C=−0.4 from the trailing edge position. The local minimum in
Fig. 6 Vorticity components at C=0.25
Fig. 7 Circumferential vorticity ��†−‡
Transactions of the ASME

static pressure at R=1.06 coincides with streaks of higher totalpressure. The inflow region marked with the arrow encounters alow local static pressure. High kinetic energy fluid is pushed intothe cavity.
The convective path of flow in and out of the cavity is shownwith a contour plot of radial velocity in Fig. 5. The view is in thepositive radial direction. The thick line at C=0.35 indicates theposition of the trailing edge at R=1. At Z=0 and 1 thick linesmark the axial position of the inlet corner and the shroud leadingedge. Positive and negative radial velocities can be observed par-allel to a line of zero radial velocity indicated with a dashed line.Close to the upstream corner radial velocities are negative, sincethe toroidal vortex pushes fluid into the main flow. On the down-stream side of the axial gap the vortex moves fluid particles intothe cavity. In addition, the centrifugal forces induced by the rotat-ing shroud leading edge surface contribute to the inflow.
Vorticity Field. Flow in the cavity is three dimensional with a highlevel of unsteadiness in pressure and velocity. Representing theflow structure in terms of vorticity in this case permits a betterphysical insight into the entrainment and loss generation usingonly a single scaler. Figure 6 presents the non-dimensional cir-cumferential and axial vorticity components of a circumferentialposition of C=0.25. The vorticity is made nondimensional assum-ing solid body rotation and taking a reference angular speed cal-culated with the blade passing frequency. High positive tangentialvorticity dominates the measurement volume inside the cavity.Maximum values occur in a round region at Z=0.4 and R=1.07 aswell as in the vicinity of the shroud leading edge. Close to thecorner formed by the sealing fin and cavity floor the sign of vor-ticity changes. This may indicate the presence of a second coun-terrotating vortex with the center approximately at Z=1 and R=1.15 as the circular arrow indicates.
The axial vorticity component shows an alternating pattern ofhigh positive, high negative and back to high positive values at theZ=0.17 as R increases. Since axial vorticity in cylindrical coordi-nates is defined as �z=1/r�r�� /�r−1/r��r /��, it is a measure oftangential shear, if radial shear is comparably small. The region ofhigh and low axial vorticity at R=1 and R=0.96 is confining thecenter of the tangential momentum wake, which was found in Fig.3�e�. The higher axial vorticity at R=0.9 as well as the lower atR=0.96 is induced by the overturning profile also found in Fig.3�e� at R=0.94. As the gradients in tangential velocity decreasewith Z, the axial vorticity also decreases. Note that some negativeaxial vorticity is induced from the rotating shroud leading edge.
A combined view of axial and tangential vorticity reveals thecenter of the toroidal vortex. The condition for the center of atoroidal vortex is zero vorticity in radial and axial direction, whichis fulfilled in the local maximum of tangential vorticity at R=1.073 and Z=0.41. Closer to the shroud the tangential vorticitystays positive. However, the axial vorticity becomes negative.These two conditions can be explained with a skewed boundarylayer induced by the tangential shear and the radial pumping ef-fect of the rotating shroud and rotor leading edge. An importantfinding is, that the center of the toroidal vortex is found to be at aslightly higher span than it was determined with circumferentialaveraged data in Fig. 3�b�. This indicates a pitch wise variation ofthe vortex center.
In Fig. 7, the tangential vorticity component at different circum-ferential positions is presented. Taking C=0.25 as a starting point,the diagrams Fig. 7�a� through d follow the convective directionof the toroidal vortex at C=−0.05, −0.35, and −0.5. In positionC=−0.05 the main flow shows a high negative tangential vorticity.It is generated by the change of negative radial migration presentin the blade wake with increasing Z. The high positive tangentialvorticity at R=1 and Z=0.17 indicates the point on the pressureside of the stator wake where the inflow to the cavity starts. Com-paring with Fig. 5, it seems that at C=−0.35, the region of high
tangential vorticity is detached from the cavity corner and hasJournal of Turbomachinery
moved into the midaxial gap position. This movement is contin-ued in the next circumferential position while the magnitude ofvorticity diminishes. At the end of the periodic cycle the region ofhigher vorticity merges with the flow region close to the shroud ascan be observed in Fig. 6�a�. It is through this process that vor-ticity is entrained into the toroidal vortex.
The radial position and the angular speed defined at the centerof the toroidal vortex are presented in Fig. 8. As the cavity flowswirls in negative C direction, the vortex encounters stretchingand tilting in the absolute frame. The cause of the spinning up anddown of the vortex can be found in the static pressure field givenin Fig. 4�b�. Within the cavity at C=0.4 a local maximum of staticpressure is observed, and vorticity of the toroidal vortex is low.The fluid within the vortex accelerates due to a favorable tangen-tial static pressure gradient. At C=−0.1 the vortex reaches a lowpressure field and vorticity is high. While passing one stator pitchthe vortex is pushed outward to R=1.08 and the moves back to thelower radius R=1.07. The maximum absolute difference in radialposition is 1.4 mm which is 7% of the cavity height. The resolu-tion of the measurement grid in axial direction is not sufficient todetect an axial displacement of the vortex. Therefore, the axialposition is given to Z=0.41 as discussed in Fig. 6.
Mass Flows Involved. The leakage mass flow, which passes thelabyrinth, can be estimated using an empirical correlation. Thecorrelation applied is given in Traupel �15�,
mleak = Se�p� �1�
where S is the gap area and e denotes the discharge coefficient.The latter depends on the pressure ratio and the number of sealingfins and was determined to be 0.17. With the conditions present inthe inlet cavity to the labyrinth and the average gap width of0.36% blade span the leakage mass flow is calculated to 0.52% ofthe main mass flow.
Table 2 compares the estimated leakage mass flow with theintegrated probe measurements. The corresponding locations ofintegration are given in Fig. 9. Non-slip boundary conditions atZ=0 and Z=1 are considered in the integration procedure. Thecontinuity of mass within the cavity states that all investigatedmass flows must satisfy the equation
Fig. 8 Vorticity and radial position of the toroidal vortex
Table 2 Mass flows, % of main mass flow
Station In �vr�0� Out �vr0� Sum
1�a� 1.56 −1.44 0.121�b� 2.42 −1.85 0.57
2 ¯ −1.52 ¯
Traupel ¯ ¯ 0.52
OCTOBER 2005, Vol. 127 / 683

mleak = min + mout �2�Integrating the radial velocity components at position 1a, gives
a lower net mass flow than the estimated leakage mass flow. Thegrid spacing in axial direction is too coarse to capture the flowgradients close to the shroud leading edge. In addition, the toroi-dal vortex is cut far away from the center, which reduces theradial velocity components. At area 1b, much more rotating massis involved, since this plane cuts the vortex close to the center.Furthermore, the new boundary layer at the shroud leading edgehas grown, which results in an integrated mass flow close to theleakage mass flow.
In station 2 an area of 0.93R1 and −0.45C−0.1 wasintegrated. This area fulfills two conditions. First, the streamlineshave passed the outflow region on the suction side of the wake,e.g., in Fig. 5 C=0.15. . .0.2 and Z=0.25. Second, the radial ve-locity is negative. The fluid particles enter the rotor passage. Theaxial velocity component sums up to 1.52% of the main massflow, which is about three times higher than the leakage massflow.
Integrating the tangential velocity components from R=0.99 toR=1.22 and Z=0 to Z=1, a swirling mass flow of 0.3% is found.The missing part of the cavity flow of Z�1 was estimated to have0.1% assuming an average tangential velocity as in the measuredpart of the cavity flow. The swirling mass flow in the boundariesof R=0 to 0.99, and form trailing to leading edge was estimated at1.7%. Therefore, the cavity flow comprises an estimated 24% ofthe swirling mass flow between the blade rows.
Relative Frame of Reference. In this section the measurementresults of the virtual four sensor probe are presented in the relativeframe of reference. Figure 10 shows the time averaged relative
Fig. 9 Stations of mass flow integration
Fig. 10 Time averaged relative total pressure Cporel†−‡ rotor
relative, Z=0.5684 / Vol. 127, OCTOBER 2005
total pressure. The tip radius is indicated with a thick dashed line.The leading edge position of the rotor is given by the verticaldashed line at Crel=0. The view is upstream and the arrow indi-cates the sense of rotation of the coordinate system.
Within the cavity the relative total pressure shows a wavy struc-ture but has a lower variation than in the main flow region. At thecavity floor, the relative total pressure is higher than upstream ofthe shroud leading edge.
The incoming flow field to the rotor passage is dominated by ahigh relative total pressure region at Crel=0. The pressure con-tours are a result of two superimposed effects of the rotor blade onthe upstream flow field. One is the leading edge potential fieldbeing responsible for an increase in static pressure. The other isfound in the through flow distribution which is set up in a rotorpassage due to the turning of the flow. The highest velocity ispresent on the suction side of an airfoil, where the local axialthrough flow reaches a maximum. The upstream effect of thisinteraction causes a higher relative dynamic head on the suctionside of the leading edge. Figure 10 confirms this observation,where a region of higher relative total pressure at Crel=−0.15 andR=0.81 is present.
The relative circumferential velocity distribution at Z=0.5 isgiven in Fig. 11. The cavity flow is swirling at a lower tangentialvelocity than the rotational speed of the rotor. Close to the cavityfloor the values are high negative. The center of the cavity vortexat R=1.07 is accelerated and decelerated according to the staticpressure field. The cavity vortex fluid moves into positive Creldirection. The fluid is accelerated out of the high static pressureregion across the leading edge position until it reaches the maxi-mum relative velocity at Crel=0.4. The static pressure there istherefore low. Close to the rotor leading edge the static pressurefield induced by its potential field is clearly evident. Figure 12shows a high static pressure upstream of the rotor leading edge.This pressure field propagates into the cavity at the speed ofsound. In the main flow region a low pressure faces the rotorpassage.
The potential field causes the distribution of relative radial ve-locity as presented in Fig. 13. In the time average the tip end wallof the rotor passage �R=1� exceeds positive and negative radialflow over the entire pitch. Additional radial inflow must occurcloser to the shroud leading edge �Z�0.83� since the radial ve-locity is highly positive at R=1.08 and Crel=0.25. Surprisingly,the highest positive radial velocity is not found at Crel=0 directlyabove the leading edge. One reason could be that the relativemovement of the fluid particles from the location of the inflow�Z�0.83,Crel=0� up to the location of measurement results in acircumferential shift. Looking at the relative tangential velocity�Fig. 11�, one can observe values of around −0.2 in the relevant
Fig. 11 Time averaged relative tangential velocity v�rel†−‡ rotorrelative, Z=0.5
area and an average radial velocity of 0.1 can be given. The di-
Transactions of the ASME

rection of relative convection is indicated from the vector additionof the corresponding arrow of the radial and tangential velocitycomponents. The resulting vector points from the intersectionpoint of the stator leading edge and shroud to the maximum ofradial velocity.
Unsteady Flow Field. The unsteady flow field is discussedwith the help of Figs. 14 and 15, which show the non-dimensionaltotal pressure and the non-dimensional tangential vorticity com-ponent. One period of rotor blade passing is resolved with fourtime frames. The data are given in the absolute frame of reference.The thick dashed lines indicate the blade tip radius as well as theleading edge position of the rotor. For clarity the latter is shown asa straight line.
The total pressure sequence starts with the rotor leading edgealigned with the stator wake. Comparing Figs. 4�a� and 14�a� theloss core has an increased value due to the potential effect. Fol-lowing the time sequence the loss core region undergoes largechanges in position, size and magnitude of pressure. If the openrotor passage is facing the loss core, as in t /T=0.5, the loss corecovers a large area and values are low due to the acceleratinglower static pressure.
Directing the attention to the cavity flow, regions of high andlow total pressure are apparent. They move with rotor blade ve-locity. The high pressure region is �C=0.15 ahead of the rotorleading edge position. Note, that it is more round shaped andcovers 30% of pitch, whereas the low pressure region is morenarrow shaped and covers 70% of pitch. The low pressure regionalso coincides with the region of high negative relative tangentialvelocity in Fig. 11.
The wavy shear layer has changed the form in comparison to
Fig. 12 Time averaged static pressure Cp†−‡ rotor relative, Z=0.83
Fig. 13 Time averaged radial velocity vr†−‡ rotor relative, Z
=0.83Journal of Turbomachinery
the time averaged picture. At C=0 in the initial time step the shearlayer enters the main flow as deep as R=0.94. The S shape withthe center at C=−0.1 is more pronounced. At t /T=0.25 it reachesto R=0.91 but has a minimum total pressure at R=0.96 and C=0. The outflow area, as it was determined in Fig. 4, undergoesunsteady periodic variations. The changes to the position of inflow�C=−0.25,R=0.98�, however, are less affected by the rotorinteractions.
The rotor passage experiences an unsteady flow field as bound-ary condition. The mass flow is varying in time, since the area andvelocity are changing with time. Recalling the results found ofTable 2 in Fig. 9, unsteady fluctuations will also be encountered.Further investigations are planned to quantify the unsteady massflow interactions with the rotor tip area.
The time sequence of the nondimensional circumferential vor-ticity component as given in Fig. 15 shows the unsteady vortexevolution within the cavity as well as the secondary flow field ofthe stator exit flow. At the first time step high positive values atC=0.1 and R=0.89 indicate the position of the passage vortex.The region of high negative values at C=−0.05 and R=0.8 coin-cides with the tangential total pressure gradient in Fig. 14. Radialmigration within the wake and the loss core can have this effecton vorticity. The loss core region faces the rotor leading edge. Asthe rotor moves in time, both regions change their size and value.At t /T=0.5, the covered area is large and the measured vorticityvalues are lower than at the beginning of the sequence. Thus, therotor passage is facing the loss core region.
The center of the toroidal vortex is found at radii around 1.1.This is located higher than the position determined with the fivehole probe measurements in Fig. 8. Regions of high and low vor-ticity alternate in a similar manner as the total pressure in Fig. 14.The high vorticity coincides with low total pressure regions.Looking at the first time step t /T=0 the pitch wise variation ofvorticity at R=1.1 ranges from 0.1 to 0.4. The maximum timeaveraged value found in Fig. 6 was 0.3. The vortex changes rota-tional speed in both space and time. The amplitude of the un-steady vorticity fluctuation is larger than the time averaged, pitchwise variations measured with the five hole probe in Fig. 8. Thesign of vorticity does not change in time.
Furthermore, the unsteady mechanism of vorticity entrainmentinto the toroidal vortex can be discussed. The inflow region at R=1 and C=−0.35 encounters a local positive maximum of tangen-tial vorticity �Figs. 4�a� and 8�b��. While the region of high vor-ticity within the cavity passes this position, both areas merge to-gether �t /T=0.74�. Due to higher gradients vorticity is alsotransferred into the low vorticity regions of the toroidal vortex atthis point �t /T=0.25�.
Summary
Comprehensive Flow Model.
Overview. The flow field of the inlet cavity and the interactionzone is dominated by a three-dimensional, periodic unsteady staticpressure field. Four independent sources of pressure fields arepresent:
• stator pressure field �uncovered turning�;• rotor pressure field �leading edge�;• cavity recess �step in and out�; and• annular casing �radial pressure gradient�.
The periodic unsteadiness stems from the relative movement ofthe rotor pressure field. Due to the interference of the stator androtor pressure field, the kinematic flow parameters, e.g., flowangles, velocity components, mass flows, experience high and lowamplitudes, which depend on space and time.
The kinematic boundary condition to the flow area is set up bythe stator exit flow containing wakes, boundary layers and sec-
ondary flow structures. This results in specific areas of inflow andOCTOBER 2005, Vol. 127 / 685

Fig. 14 Time sequence of total pressure C †−‡, Z=0.5
po686 / Vol. 127, OCTOBER 2005
Fig. 15 Time sequence of tangential vorticity � †−‡, Z=0.5
�Transactions of the ASME

outflow for the cavity flow. Close to the exit of the flow area thekinematic effects are shaped by the radial pumping effect of therotor leading edge alternating with the open rotor passage.
The interaction zone between main flow and cavity flow isdominated by a toroidal vortex. Additionally, this vortex moves atan average tangential velocity of 90% of the blade tip speed. Thisvortex undergoes stretching and tilting in space and time causedby different drivers of the cavity flow. They are summarized inTable 3.
Detailed Discussion. A sketch of the flow drivers is given in Fig.16. The inflow and outflow regions are boundary conditions set bythe exit flow field of the stator. The high potential fluid originatingfrom the stator pressure side corner has enough kinetic energy topenetrate into the cavity. Radial equilibrium is not maintained inthis area and the fluid follows a tangential direction, feeding tan-gential momentum to the cavity fluid. Due to the high axial ve-locity component, which is then turned into radial flow, the in-coming fluid also contributes to the rotational movement of thevortex.
The outflow contains mixed cavity fluid of low total pressure,low tangential momentum, and negative incidence to the rotor tipprofile section. This fluid affects the rotor passage flow field in anadverse way by increasing secondary flows and by doing lesswork on the rotor blades. Because of continuity, it balances thecavity inflow.
The cavity vortex system swirls at a lower velocity than therotational speed of the shroud tip. This is due to mixing losses
Table 3 Identified drivers of the toroidal vortex
Stator Rotor
Tangential momentum In flow Non-slip conditionPotential field
Tangential vorticity In flowAxial velocity shear
profile
Radial pumping
Stretching Potential field Potential field
Fig. 16 Flow model: Side and above view
Journal of Turbomachinery
within the vortices as well as to shearing effects of the boundarylayer at the non-rotating walls. In addition the leakage mass flowtransports tangential momentum into the next cavity.
In order to better understand the effects on the fluid movements,a flow relative system is helpful. A vortex relative coordinate sys-tem is proposed as described in Fig. 17. It rotates at the averagetangential velocity of the toroidal vortex. By moving with thevortex in the swirling direction, rotor and stator events pass at twodifferent relative velocities. These events correspond to twocounter moving waves assuming rotor and stator pressure fieldsare standing sinusoidal waves in space. Then a dual frequencymodulation acts on the vortex. Both frequencies satisfy the rela-tion
f = f rotor,rel + fstator,rel. �3�In this case the frequencies are split into 17% of blade passing
frequency for the rotor relative and 83% for the stator relativefrequency. The wavelength of the two frequencies is also depictedschematically in Fig. 17.
Further investigations will be dedicated to derive a mathemati-cal model by describing the flow in the vortex relative system.The goal is to model unsteady loss production terms and comparethem to the experimental data in a quantitative way. A small per-turbation analysis will then allow us to derive important param-eters and scales for the loss production in this area. Additionally,the question might be answered as to whether unsteady loss ishigher or lower than the steady loss. Future work will be dedi-cated to the mathematical modeling of the vortex and the quanti-fication of steady and unsteady loss production terms with thehelp of the vortex relative system.
Impact on Efficiency. Using the available time averaged results, itis estimated that this labyrinth seal configuration results in a lossof about 1.6% per stage in efficiency for this turbine. The circum-ferential momentum of the leakage mass flow gets mixed outacross the labyrinth. Measurements of the leakage jet entering theexit cavity indicate low circumferential momentum. The toroidalvortex by itself seems to contribute a small portion of efficiencyloss around 0.1%. However, further losses in the rotor blade rowdue to the vortex interaction and the reentering cavity mass floware not accounted for. These are estimated values based on theavailable data. It is planned that a more detailed integration andsensitivity analysis will be performed and presented at a latertime. Additional measurements have been made with variations inseal clearance gap. Initial indications show that variation in thegap has a major effect on flow structures and turbine loss.
ConclusionsThis paper presents a highly resolved experimental data set
taken in an inlet cavity of a rotor tip labyrinth seal. The highresolution in space and time of flow angles and total and staticpressure make it possible to derive further parameters, e.g., the
Fig. 17 Vortex relative system
velocity field or the vorticity field.
OCTOBER 2005, Vol. 127 / 687

The drivers of the cavity flow could be identified. The unsteadyflow interaction stems from the unsteady static pressure field in-teraction. The toroidal vortex found in the inlet cavity is describedin detail. It is subject to unsteady vortex stretching and tilting. Thetotal pressure fluctuations in the cavity outflow suggest an un-steady, low total pressure disturbance of the rotor tip region. As-sociated with this are a negative incidence and an average massflow of 1.5% of the main mass flow. A vortex relative coordinatesystem swirling at the same average speed as the toroidal vortex isproposed.
AcknowledgmentThe flow measurements in the turbine were supported by the
German Federal Ministry of Economy �BMWI� under file Nos.0327060D and 0327060F. The authors gratefully acknowledgeAG Turbo, Alstom Power and Rolls-Royce Germany for theirsupport and permission to publish this paper.
Nomenclaturea speed of sound
r ,� ,z cylindrical coordinate systemh blade height, 90 mm
zcav axial cavity width, 15 mmn numbers of blades, 42
fblade blade passing frequencyp blade pitch, 360°/42t time
C non-dimensional circumferential position � / pM Mach numberR non-dimensional radial height
r − rHub
rTip − rHub
Re Reynolds numberT blade passing period 1/ fblade, temperatureU blade tip speedZ non-dimensional axial distance z /zcavv non-dimensional velocity uloc /U
C non-dimensional pressure
p688 / Vol. 127, OCTOBER 2005
Cp =plocal − pstat,out
ptotal,in − pstat,out
� yaw angle� pitch angle nondimensional vorticity � / �4�fblade�
References�1� Gregory-Smith, D. G., Ingram, G., Jayaraman, P., Harvey, N. W., and Rose, M.
G., 2001, “Non-Axisymmetric Turbine End Wall Profiling,” Proc. Inst. Mech.Eng., 215�A6�, pp. 721–734.
�2� Sauer, H., Muller, R., and Vogeler, K., 2001, “Reduction of Secondary FlowLosses in Turbine Cascades by Leading Edge Modifications at the Endwall,” J.Turbomach., 123, pp. 207–213.
�3� Denton, J. D., and Johnson, C. G., 1976, “An Experimental Study of the TipLeakage Flow around Shrounded Turbine Blades,” CEGB research Report No.CEGB-R/M/N848.
�4� Peters, P., Breisig, V., Giboni, A., Lerner, C., and Pfost, H., 2000, “The Influ-ence of the Clearance of Shrouded Rotor Blades on the Development of theFlow Field and Losses in the Subsequent Stator,” ASME Paper No. GT2000-0478.
�5� Hunter, S. D., Manwaring, S. R., 2000, “Endwall Cavity Flow Effects onGaspath Aerodynamics in an Axial Flow Turbine: Part 1-Experimental andNumerical Investigation,” ASME Paper No. GT2000-065.
�6� Wallis, A. M., Denton, J. D., and Demargne, A. A. J., 2001, “The Control ofShroud Leakage Flows to Reduce Aerodynamic Losses in a Low Aspect Ratio,Shrouded Axial Flow Turbine,” Appl. Math. Model., 123, pp. 334–341.
�7� Anker, J. E., and Mayer, J. F., 2002, “Simulation of the Interaction of Laby-rinth Seal Leakage Flow and Main Flow in an Axial Turbine,” ASME PaperNo. GT2002-30348, ASME Turbo Expo, June, Amsterdam.
�8� Schlienger, J., Pfau, A., Kalfas, A. I., and Abhari, R. S., 2003, “Effects ofLabyrinth Seal Variation on Multistage Axial Turbine Flow,” ASME Paper No.GT2003-38128.
�9� Pfau, A., Treiber, M., Sell, M., and Gyarmathy, G., 2001, “Flow Interactionfrom the Exit Cavity of an Axial Turbine Blade Row Labyrinth Seal,” J.Turbomach., 123, pp. 342–352.
�10� Binder, A., 1985, “Turbulence Production Due to Secondary Vortex Cutting ina Turbine Rotor,” J. Eng. Gas Turbines Power, 107�4�, pp. 1039–1046.
�11� Chaluvadi, V. S. P., Kalfas, A. I., Baniegbal, M. R., Hodson, H. P., and Denton,J. D., 2001, “Blade Row Interaction in a High Pressure Turbine,” AIAA J.,17�4�, pp. 892–901.
�12� Pfau, A., Schlienger, J., Kalfas, A. I., and Abhari, R. S., 2003, “Unsteady,3-Dimensional Flow Measurement Using a Miniature Virtual 4 Sensor FastResponse Aerodynamic Probe �FRAP�,” ASME Paper No. GT2003-38128.
�13� Sell, M., Schlienger, J., Pfau, A., Treiber, M., and Abhari, R. S., 2001, “The2-Stage Axial Turbine Test Facility LISA,” ASME Paper No. GT2001-0492.
�14� Treiber, M., Kupferschmied, P., and Gyarmathy, G., 1998, “Analysis of theError Propagation Arising from Measurements with a Miniature Pneumatic5-Hole Probe,” Proc., 13th Symp. on Measuring Techniques in Cascades andTurbomachines, Limerick, Ireland.
�15� Traupel, W., 1977, Thermische Strömungsmaschinen, Springer, Berlin.
Transactions of the ASME