unsecured and insecure? - citizens advice and... · unsecured and insecure? ... and relationships?...
TRANSCRIPT

Unsecured and insecure?
Exploring the UK’s mountain of unsecured personal debt—and how it affects people’s lives
Anne Pardoe
Joe Lane
Pippa Lane
Debra Hertzberg

This report draws on data sources that cover different geographies within the UK. Unless otherwise specified, data from Citizens Advice covers England and Wales while data from the Office for National Statistics, Bank of England, Office for Budget Responsibility and Wealth and Assets Survey covers the UK.
It is important to be aware that any aggregate figures can hide big variations between the countries and regions of the UK, particularly where devolved responsibilities and powers are at play, for example in the case of the statutory debt remedy landscape.
1

Contents
Chapter 1: How much is owed? 6
Chapter 2: How is debt changing? 13
Chapter 3: Who is most exposed? 25
Chapter 4: The debt effect 40
Conclusion 50
2
Executive summary
For the last seven years, public policy debate in the UK has been defined by debt. In the main this has been a conversation about government debt and, lately, secured borrowing and the likely impact of an interest rate rise. But what about unsecured debt and the loans, credit cards and overdue bills that define most people’s day to day experience of borrowing and owing money? How much do UK households owe and who is it owed to? What effect does this have on our lives, attitudes, behaviours and relationships? And is enough being done, effectively enough, to help people avoid money troubles and to find a way out when problems develop? This report launches a landmark new project to explore unsecured borrowing in the UK. As the country’s biggest multi-channel provider of free debt advice, our advisors help 400,000 people find a way forwards with debt problems every year. These conversations show us first-hand and in rich detail how debt and money troubles play out in practice. We see how profound an effect debt can have on everything from mental health to relationship stability; how inextricably debt issues are linked to wider problems, from housing to employment; and how preventable money problems can be if only the right support is available at the right time. In this project we will explore these aspects of debt in greater detail. This report starts by surveying the terrain. In Chapter 1 we recap briefly on the headline data that describe unsecured personal borrowing in the UK. We find that this year marks a turning point in the story of UK debt with government debt now starting to fall as a percentage of GDP just as personal debt rises again relative to incomes. Already UK households owe £170 billion and forecasts suggest this could hit £300-350 billion by 2020. Unsecured debt is growing faster than secured debt and faster than incomes, pushing debt to income ratios back toward pre-crisis levels by 2020. In Chapter 2 we drill down into debt, exploring how debt problems are changing. Mainstream credit products, from credit cards to loans, still make up most unsecured lending. But when it comes to debt problems we are seeing an historic shift away from mainstream credit issues towards problems with arrears on council tax, rent and energy bills. Five years ago, credit cards were the main debt issue we saw. Now council tax arrears top the list. Meanwhile, a combination of squeezed incomes and tighter access to credit has seen an explosion in high cost credit. As a surge in payday loans recedes after effective regulation, we see rising demand for other toxic products such as logbook and guarantor loans. Unsecured borrowing is not only historically high; debt is also shifting in ominous ways. In Chapter 3 we ask which groups are most exposed to troubling levels of unsecured debt. Our new analysis reveals a staggering jump in borrowing among
3
young adults—and one that runs well beyond student loans. In latest data, 15-24 year olds have average debts of £12,215, up from £5,785 in 2008-10 and £3,988 in 2006-08. This is not merely accounted for by the increase in student loans. Among 15-24 year olds, personal loans were nearly five times higher in the latest data than in 2006-08, while loans from friends and family rose from an average of just over £30 to more than £1,000, and arrears are at heightened levels. Meanwhile, with home-ownership rates having collapsed among the next generation, this new cohort also has unusually low wealth. And indeed we find that people with no property wealth are nearly three times as likely to be in arrears as those with a small amount of property wealth. We do not yet know whether this change is temporary, or if recent years have permanently elevated levels of personal debt. If the latter comes to pass, how could this affect our society? In Chapter 4 we explore our data and case notes, describing three recurring features of the debt problems we see. First, debt problems are unusually interconnected with other issues in people’s lives; half of our debt clients are also seeking help with another issue, making debt the most interlinked of the main issues we see. Second, debt has profound effects, corroding everything from mental health to relationship stability; 78 per cent of our debt clients felt anxious or depressed compared to 66 per cent of our clients overall. Third, debt problems are often preventable and can easily spiral, meaning it is vital that support is available in the right way at the right time. In all, this survey of the terrain suggests that unsecured borrowing deserves a more prominent place in our public debate. With public debt now starting to fall as a share of GDP, and private debt once again rising relative to incomes, now is a good time to reflect on the balance of emphasis between the two. In the coming months we will be exploring in more detail the nature of the problems associated with burdensome levels of personal debt, with work to explore:
- How the state and other non-financial services firms behave as creditors. As problem debt shifts away from mainstream banks, and towards arrears to the state and other firms, from energy to telecoms companies, we want to know if this exposes people to more aggressive debt collection practices.
- The effect of debt on people’s outlooks, behaviours and attitudes. We are
working with economists at the London School of Economics to understand whether debt affects life outcomes independent of other factors, just as assets are known to have an effect on life outcomes. 1
- The changing face of high-cost credit, particularly in light of tougher
regulations on payday loans. We want to understand how the market is
1 McKnight, A. (2011) Estimates of the asset-effect: the search for a causal effect of assets on adult health and employment outcomes
4

changing, and whether further action is needed to protect people from other high cost credit products like logbook and guarantor loans.
Through this work we hope to understand better how today’s infrastructure of support for debt or money issues—from levy-funded debt and money advice to a range of statutory and voluntary debt remedies and insolvency regimes—could be built into a more strategic approach that matches the scale of the challenge.
5

Chapter 1: How much is owed?
Summary
● After falling from 2008 to 2015, the household debt to income ratio is now rising just as the ratio of government debt to GDP is starting to fall, marking a new chapter in the recent story of debt in the UK.
● UK households hold £170 billion of unsecured debt, a figure that is set to reach between £300 billion and £350 billion by 2020.
● Unsecured debt is growing faster than secured debt, growing by over 6 per cent last year compared to 1.5 per cent growth for secured debt.
● By current estimates, the ratio of unsecured household debt to income is set to reach somewhere from 20 to 24 per cent by the first quarter of 2021, potentially surpassing its pre-crisis peak.
Introduction Debt has been the defining feature of UK policy debate in recent years, with the focus overwhelmingly on government debt and, to a lesser degree, mortgage borrowing. But as government debt now starts to fall as a percentage of GDP, we see a worsening picture for personal unsecured debt. In this chapter we explore the key trends in public and private debt, showing that unsecured lending is growing twice as fast as secured lending and faster than household incomes.
Public and private debt The government’s efforts have reduced the public sector deficit from 10.2 per cent of GDP in 2008/9 to 4.9 per cent in 2014/15, slowing the growth in public debt. In the years following 2008, this process ran alongside a decrease in the amount of private debt households held as a proportion of their income. As Figure 1.1 shows, however, this trend is now changing as personal unsecured borrowing rises as a proportion of income. Just as government debt has begun to turn the corner as a proportion of GDP, unsecured personal borrowing relative to incomes is on the rise again.
6

Figure 1.1: A new chapter in UK debt ONS and OBR forecasts for public debt as a proportion of GDP and private debt to income ratio
Source: Citizens Advice analysis of ONS and OBR data
In recent years, where attention has been given to private debt, this has primarily been directed at secured lending. On one level this makes sense; the vast majority of household debt is secured mortgage debt. Of the £1.4 trillion of private debt in the UK, £1.2 trillion is secured on people’s houses. As a result, trends in mortgage borrowing drive overall household debt levels and, therefore, the overall level of borrowing. A debate has taken place around secured lending and the extent to which it poses a risk to growth and stability, with some commentators arguing that mortgage borrowing presents considerable risks as interest rates rise, while others have argued for a more sanguine view. Throughout these years, less attention has been given to unsecured consumer borrowing, from credit cards to personal loans to arrears and money lent to friends or family. This form of lending now stands at £170 billion and in many ways it is a simpler story than mortgage borrowing, less driven by asset prices, and reflecting the simpler question of whether household spending is rising faster or slower than household incomes. 2
There are a number of reasons for policymakers to pay more attention to trends in unsecured lending. For one thing, unsecured lending is rising more quickly than secured lending. In recent years, after an initial recovery recovery of mortgage
2Lilovski, N., (2015) Lending to individuals - annual update of data including student loans, Bank of England, See box 1 for a full explanation of unsecured debt estimates.
7

borrowing on the back of rising house prices, official forecasts for secured borrowing have been downgraded. In contrast, Bank of England data, which provides a monthly seasonally adjusted picture, shows that unsecured borrowing, which had started to shrink in 2009/10, is now growing at around 2 per cent a quarter. Looking at the annual figures, unsecured debt grew by over 6 per cent last year compared a 1.5 per cent growth of the total of secure debt. This rise in unsecured lending in part reflects growing 3
consumer confidence and has indeed been one important aspect of the early economic recovery. Yet related to these trends has been a steady and significant decline in the savings ratio, as household spending growth has begun to recover sooner than household incomes.
Figure 1.2: Unsecured debt is rising more quickly than secured debt Quarterly rate of % change for secured and unsecured lending in the UK (2000-2014)
Source: Bank of England
As well as outpacing secured borrowing, unsecured debt is growing more quickly than incomes, and borrowing relative to incomes is forecast to continue to grow. Starting with overall debt to income ratios (for total borrowing, including secured borrowing), we see that, in the early 2000s, total household debt as a share of income rose sharply from 110 to 170 per cent, before falling back to 144 per cent following the 2008 credit crunch. Now forecasts suggest that the total debt to income ratio will rise over the next five years, surpassing its pre-downturn peak in the third quarter of 2020. 4
3 Citizens Advice Analysis of Bank of England data (LPQB3PS) 4 As is often the case with such forecasts, there has been discussion around how accurate the OBR’s current forecast is. In each of their last three forecasts, the growth of household debt has been delayed. There is also some disagreement around whether a rise in debt levels of the magnitude
8

Figure 1.3: The household savings ratio has fallen since 2009 UK economic accounts published and cash only household saving ratios, per cent United Kingdom, Quarter 1 (Jan to Mar) 1997 to Quarter 1 (Jan to Mar) 2015
Source: ONS
Box 1: How much debt are we in? Reconciling the different measures of household debt
The Office for National Statistics (ONS) publishes figures on overall levels of debt in the National Economic Accounts. These figures are authoritative and compiled in line with international and European expectations. However, there are some limitations. First, the liabilities of households are combined with those of non-profit institutions which serve households. Second, borrowing is not 5
definitively broken down by secured and unsecured debt. Due to these limitations, we have looked at a range of sources in order to build a fuller picture of how much debt households currently hold in the UK. There are three main sources of data on household debt: the ONS, Bank of England and Wealth and Assets survey. The table below summarises the key figures from these sources. A more detailed explanation of these data sets, and the differences between them, can be found in Annex A.
forecasted will be borne out in reality. See, for example, Goodwin, A., Beck, M. (2015) The UK economic outlook 5 http://eur-lex.europa.eu/LexUriServ/LexUriServ.do?uri=OJ:L:2013:174:0001:0727:EN:PDF - page 79
9

Sources of data
Wealth and Assets Survey
Bank of England Office for National Statistics
Total debt £ 1 trillion £1.43 trillion £1.68 trillion
Secured debt
£896 billion £1.26 trillion £1.26 trillion
Unsecured debt
£104 billion £170 billion £179 billion*
Notes Covers Great Britain Direct survey of households
Covers UK Data provided by financial institutions
Covers UK Includes ‘non-profit institutions serving households’
* This figure is for ‘short-term’ debt and includes non-profit institutions serving households (e.g. charities). The £9 billion difference between the Bank of England and ONS estimates can largely be explained by the inclusion of the debts of ‘Non-Profit Institutions Serving Households’ (NPISH) alongside those of households in the ONS ‘short 6
term loans’ category. Accounting for the far more significant difference between the WAS estimate and those of the Bank of England and ONS is more complex. There are three main factors which help to explain the discrepancy:
● Time - The WAS total is developed from data collected 2010-12. The Bank of England recorded total debt of £1.38 trillion, and unsecured debt of £157 billion in 2012, figures significantly more closely aligned with the WAS estimate.
● Geographical area - WAS does not cover Northern Ireland whereas both the Bank of England and the ONS record data for the whole of the United Kingdom.
● Data collection - Quality assurance of the WAS found that individuals tend to underestimate their level of indebtedness.
Despite there being no single comprehensive explanation as to why the WAS estimate is so much lower than those produced by the Bank of England and the ONS, there is good evidence to support the case that the WAS totals are underestimates.
6 NPISH organisations include charities, trade unions, churches, political parties and recreational and sports clubs, where their principal income is from voluntary contributions.
10

For these reasons, we believe that the Bank of England data gives us the most accurate picture of how much GB individuals are borrowing, while WAS data provides the best estimate of how borrowing is distributed. We therefore refer to the Bank of England’s £170 billion figure as the unsecured debt total throughout this report and use WAS data to understand the composition of borrowing.
What does this mean for the future path of unsecured borrowing? The OBR does not forecast total household unsecured debt or an equivalent debt to income ratio. However, by combining data from the ONS, OBR and Bank of England we can create two scenarios for the likely direction of unsecured borrowing over the next few years. Figure 1.4 shows the results of these scenarios. The scenarios are constructed from the OBR’s forecasts for ‘other’ debt. The limitation of this category is that it combines unsecured household borrowing with other types of debt including pension liabilities and financial derivatives. We therefore look at historic data that shows us the relationship between this category of ‘other’ debt and the more specific category of ‘short-term loans’ (a closer proxy for unsecured household debt from the Bank of England). We find that, in the latest data, the ratio of short-term loans to ‘other debt’ is 40 per cent. This is lower than the historic average over the last 15 years, which stands at 49 per cent. In our first scenario (the green line in figure 1.4) we therefore assume that short term loans remain at 40 per cent of other debts and grow at the same pace in coming years. In this scenario, unsecured borrowing rises from its current level of £170 billion to £300 billion in 2020. On the basis of the OBR’s forecasts of household incomes, this would represent an unsecured debt to income ratio of 20 per cent. In our second scenario (the purple line), we assume short-term loans return to the average proportion seen over the last 15 years (49 per cent), growing slightly faster than the total category of ‘other’ debts. In this scenario, unsecured borrowing rises to £350 billion in 2020, representing an unsecured debt to income ratio of 24 per cent.
11

Figure 1.4: Two possible scenarios for the future direction of the household unsecured debt to income ratio
Citizens Advice estimate of future debt to income ratio based on data from the ONS, the OBR and the Bank of England
Source: Citizens Advice analysis of Bank of England, ONS and OBR data
These scenarios are not forecasts. But they give us a sense of the plausible lower and upper boundaries of the path of unsecured debt, and unsecured debt to income ratios, over the coming years. It is notable that, in our second scenario, the unsecured debt to income ratio would exceed the pre-crisis peak of just under 23 per cent. Under both our scenarios, and any likely path for unsecured borrowing, debt to income ratios are heading back towards pre-crisis levels. 7
This gives us a sense of the scale of the challenge. But to understand the effect of debt on people’s lives, the composition of borrowing is just as important as the overall level. In the next chapter we drill down into the UK’s £170 billion mountain of unsecured debt, looking at how it is distributed across products and how the debt problems we see at Citizens Advice are changing over time.
7 http://core.ac.uk/download/pdf/6482478.pdf
12
Chapter 2: How is debt changing?
Summary
● Credit (including credit cards and hire purchase) and loans make up the bulk of unsecured debt, representing 38 and 42 per cent of the total respectively.
● While problems with credit cards and loans are the most common debt issue we see within mainstream credit products, overall these two categories only amount to 17 per cent of debt enquiries to Citizens Advice, with other non-mainstream debt issues, including arrears, associated with relatively more problems.
● Our data also reveal two important changes in the composition of debt problems over time:
○ An ominous shift away from consumer credit problems towards problems with arrears. The most common debt problem we see is now council tax arrears, up 21 per cent in four years, and surpassing credit card debts. Rent and energy bills arrears are also up.
○ A surge in demand for high cost credit, first feeding through into problems with payday loans and now, after tough new rules on payday lending, seen in elevated demand for other high cost, high detriment products, such as logbook loans and guarantor loans.
Introduction In this chapter we get under the skin of the UK’s unsecured debt, using data from our debt advice work and from the Wealth and Assets Survey. We begin by breaking down unsecured debt into its main component parts and we then turn to our own, more timely data to explore two key changes in debt problems since 2008: a worrying shift away from problems with mainstream consumer credit towards problems with priority bills and arrears, and an explosion in demand for short-term, high cost credit products.
Breaking down unsecured debt As discussed in Chapter 1, the Wealth and Assets survey, while underestimating the total amount of unsecured debt, provides a breakdown of the composition of that borrowing. In the most recent wave of the survey, in 2010-12, total unsecured
13

borrowing had risen by 7.5 per cent over the preceding two years. Figure 2.1 shows the breakdown of unsecured borrowing by different types of debt. The largest categories are credit and loans. The loans category, which includes bank loans, payday-type loans and loans from friends and family, has increased consistently across all three waves of the survey, rising from 33.8 billion to 41.6 billion between 2006 and 2012. The credit category, which includes credit cards, hire purchase and catalogue debts, has been more stable, dipping slightly between wave one and wave two before rising again to 38.4 billion in wave three.
Figure 2.1 - Credit cards and loans make up the bulk of unsecured debt Total GB non-mortgage debt broken down by category of debt (2006-2012)
Source: Analysis of Wealth and Assets Survey for Citizens Advice by Tooley Street Research Note: As discussed in Chapter 1, the Wealth and Assets Survey provides a lower total for unsecured borrowing than data from the Bank of England or Office for National Statistics.
At Citizens Advice, from the hundreds of thousands of people who come to us each year with debt problems, we see live - updated each evening - the debt problems that are being reported across England and Wales. Turning to this data, amongst mainstream consumer credit products, credit cards and unsecured loans, continue to be the most commonly reported consumer credit problems to our service. 8
However, a closer interrogation of our data reveals two important changes in the
8 Overall, we have seen a reduction in the total number of people receiving debt advice from our service. This is primarily due to a reduction in specialist debt advice capacity at local Citizens Advice as a result of a loss of funding, rather than a reduction in demand. For this reason, it is more useful to focus on the changing proportions of issues we see rather than absolute numbers.
14

unsecured debt landscape since the financial crash: a shift away from problems with mainstream credit products and towards problems associated with arrears on priority debts, and a high and evolving demand for high cost credit.
Figure 2.2: Credit cards and unsecured personal loans dominate in enquiries to local Citizens Advice in relation to consumer credit debts
Selected credit products as a proportion of all debt problems reported to local Citizens Advice (2011-2015)
Source: Citizens Advice Note: Payday loans have only been measured as a specific category since 2012/13 in response to the number of related problems seen by local Citizens Advice.
1. The shift towards arrears Figure 2.3 tracks the composition of the debt problems we have seen over the last four years. This data, updated in real time from the 1,000 debt problems we help people with every day, gives us a dynamic picture of how debt problems are changing. The dominant trend in this data is that problems with arrears have grown since 2012 while problems with mainstream credit products, from credit cards to personal loans, are falling as a proportion of all debt problems. Council tax arrears are now the most common debt problem our advisers see, having surpassed
15

problems associated with credit card debts. Citizens Advice helped with nearly 200,000 council tax arrears problems in the last year.
Figure 2.3: Council tax arrears are now the most common debt problem our advisers see
Selected debt issues as a proportion of all debt issues dealt with by local Citizens Advice (2011-2015)
Source: Citizens Advice
One reason this development matters for our clients is that arrears on priority bills are chased more aggressively than late payments in relation to mainstream credit products. Priority debts have severe consequences if they go unpaid, such as the loss of housing, gas or electricity supply or the prospect of a fine or imprisonment. Indeed, a key part of debt advice is helping clients classify debts as priority and non-priority debts and to repay debts in the least damaging order.
We see this clearly in our data, which shows rapid growth in problems associated with bailiffs and, as shown in Figure 2.4, an increase in the number of people seeking help with court judgments against them for arrears. The chart shows trends in the number of issues we have seen in relation to various types of county court judgments. The strongest growth relates to council tax. In other areas we have seen a general decline in issues with court claims over the last four years offset by an increase in the last year.
16

Figure 2.4: We are helping a growing number of clients with court claims against them
Breakdown of number of people approaching local Citizens Advice with a problem with a court claim against them in relation to selected debts (Q1 2011 - Q4 2014)
Source: Citizens Advice. Note: Council Tax code is for Liability Order Summons / Hearing, other codes are for Court Claims.
Box 2: Council tax arrears
Council tax arrears have emerged as the biggest single debt issue seen by Citizens Advice, since 2013/14 in England and 2014/15 in Wales. The abolition of Council Tax Benefit in April 2013 and the introduction of its replacement, localised Council Tax Support, alongside low and irregular incomes has corresponded with this rise. National statistics reveal that council tax collection rates have fallen for the first time in 2013/14 in England, with £152 million additional outstanding in arrears. This has not been the case in Wales, where collection rates have risen by 0.3 per cent. The past year Citizens Advice has seen a 21 per cent rise from nearly 160,000 to over 193,000 problems with council tax arrears. Along with the rising
17
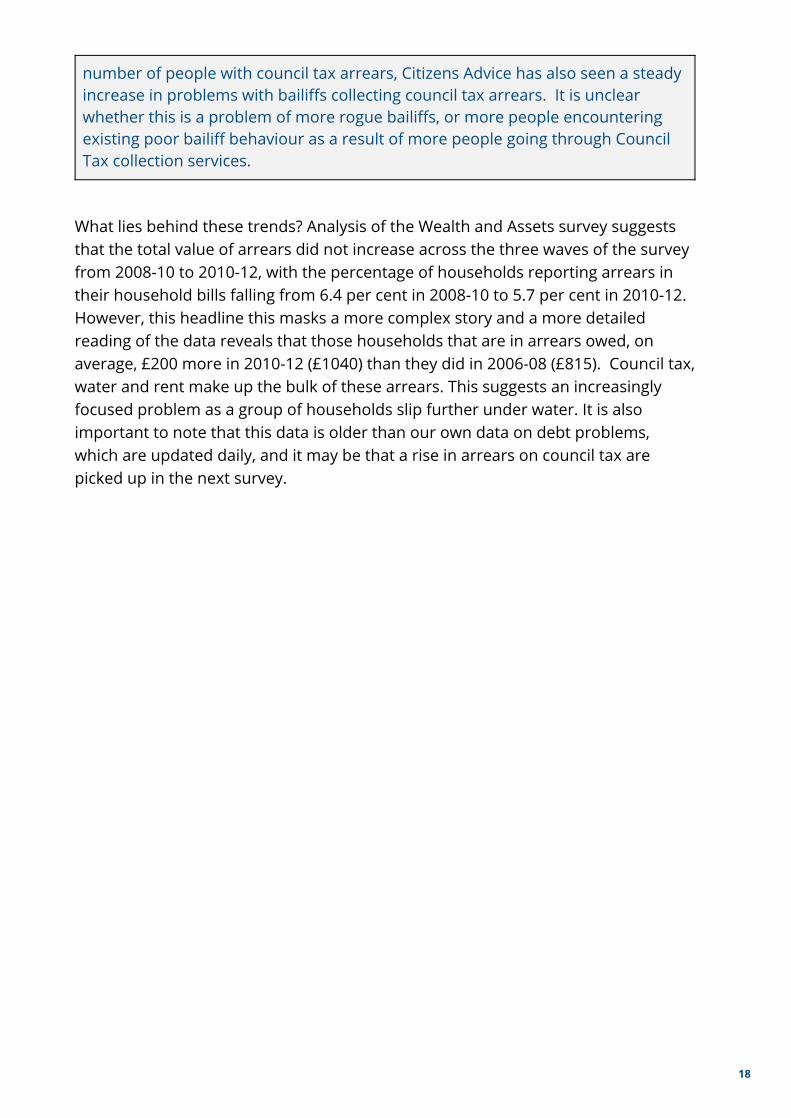
number of people with council tax arrears, Citizens Advice has also seen a steady increase in problems with bailiffs collecting council tax arrears. It is unclear whether this is a problem of more rogue bailiffs, or more people encountering existing poor bailiff behaviour as a result of more people going through Council Tax collection services.
What lies behind these trends? Analysis of the Wealth and Assets survey suggests that the total value of arrears did not increase across the three waves of the survey from 2008-10 to 2010-12, with the percentage of households reporting arrears in their household bills falling from 6.4 per cent in 2008-10 to 5.7 per cent in 2010-12. However, this headline this masks a more complex story and a more detailed reading of the data reveals that those households that are in arrears owed, on average, £200 more in 2010-12 (£1040) than they did in 2006-08 (£815). Council tax, water and rent make up the bulk of these arrears. This suggests an increasingly focused problem as a group of households slip further under water. It is also important to note that this data is older than our own data on debt problems, which are updated daily, and it may be that a rise in arrears on council tax are picked up in the next survey.
18
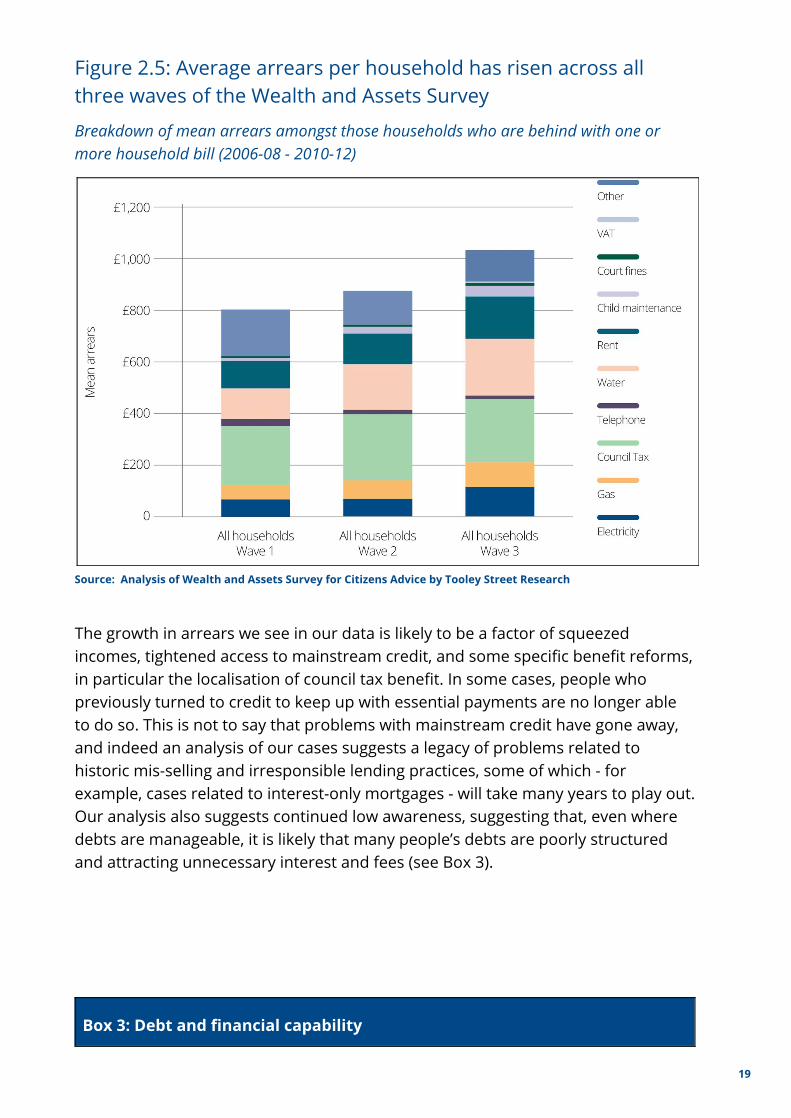
Figure 2.5: Average arrears per household has risen across all three waves of the Wealth and Assets Survey
Breakdown of mean arrears amongst those households who are behind with one or more household bill (2006-08 - 2010-12)
Source: Analysis of Wealth and Assets Survey for Citizens Advice by Tooley Street Research
The growth in arrears we see in our data is likely to be a factor of squeezed incomes, tightened access to mainstream credit, and some specific benefit reforms, in particular the localisation of council tax benefit. In some cases, people who previously turned to credit to keep up with essential payments are no longer able to do so. This is not to say that problems with mainstream credit have gone away, and indeed an analysis of our cases suggests a legacy of problems related to historic mis-selling and irresponsible lending practices, some of which - for example, cases related to interest-only mortgages - will take many years to play out. Our analysis also suggests continued low awareness, suggesting that, even where debts are manageable, it is likely that many people’s debts are poorly structured and attracting unnecessary interest and fees (see Box 3).
Box 3: Debt and financial capability
19

What is important is not just the amount of debt people have, but also the type of credit people have and how they use it. Debt problems can be exacerbated if people do not manage their debts well. People could often save significantly on the overall cost of borrowing by managing their debts more actively, for example by switching to another product or provider. A recent nationally representative survey commissioned by Citizens Advice revealed that knowledge of interest rates varied widely depending depending on the type of credit product. For example: 87 per cent of people with credit union loans knew their interest rate compared with 33 per cent of store card holders. We asked whether people had compared their product with others in the market in the past twelve months, and whether they had switched their product in that time. The vast majority of people had not switched. Credit cards were the most commonly switched at 15 percent. Overdrafts (2%), Hire Purchase Agreements (1%), car finance (1%) and credit union loans (0%) were the least switched. We also found that significantly more people had compared their current product with others on the market than had followed through to complete a switch. For example, over a third (38%) of people with unsecured loans had compared interest rates for similar products, but only 7 per cent had switched their debt to another similar product. When asked why they had not switched, by far the most common reason given (ranging from 62 to 95 per cent for each product) was that people were happy with the current product or service that they were using. However, given the very low rates of awareness of interest rates, comparison and switching, it is likely that many of these consumers are not getting the best deal available to them.
2. The evolving demand for high cost credit The financial crisis of 2008 and subsequent recession led to a tightening of lending criteria by the banks and other mainstream lenders. This meant that lower income consumers, who had already been hit hard by the downturn, were less able to turn to the mainstream sources of credit they had previously relied upon to see them through tough times. This provided fertile ground for the growth of the payday loans industry, which offered hard pressed consumers short term, high cost loans that could be approved and paid into their bank account in minutes.
In 2009 1.2 million adults in the UK took out 4.1 million payday loans totalling £1.2 billion. By 2013 this had grown to 1.6 million customers taking out 10 million 9
9 Keeping the Plates Spinning, Consumer Focus, 2010
20
payday loans totalling £2.5 billion. The growth of this market may in part explain 10
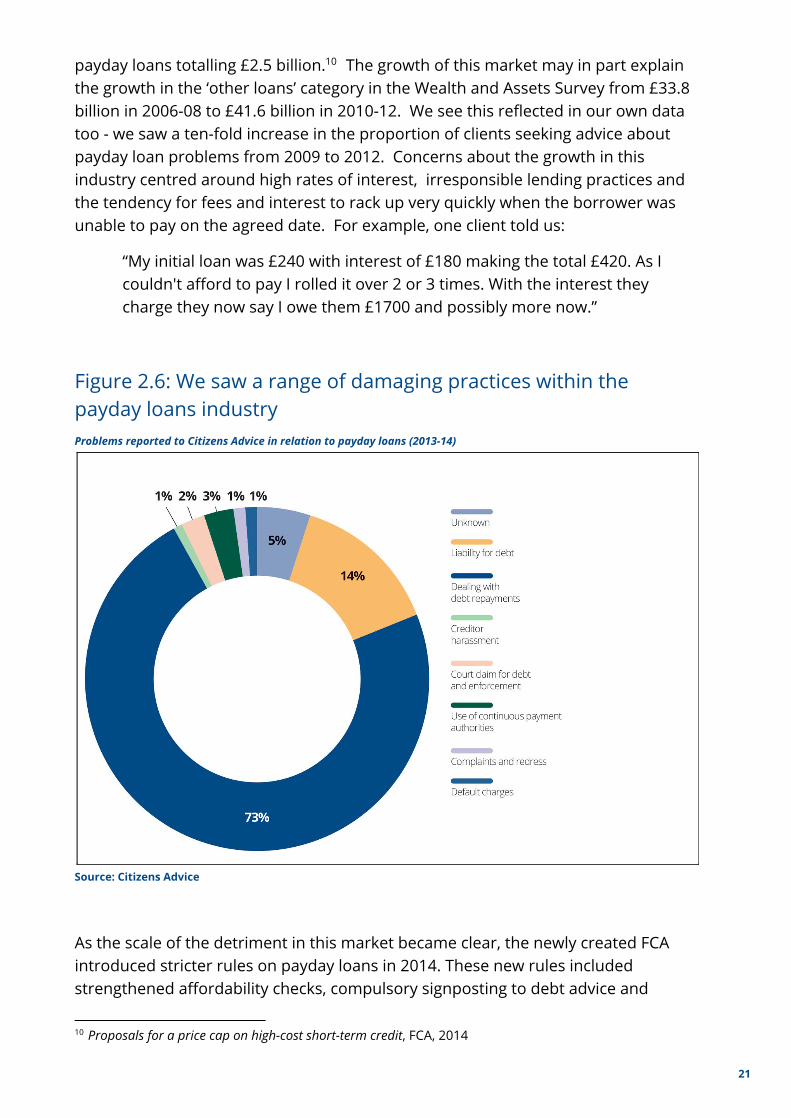
the growth in the ‘other loans’ category in the Wealth and Assets Survey from £33.8 billion in 2006-08 to £41.6 billion in 2010-12. We see this reflected in our own data too - we saw a ten-fold increase in the proportion of clients seeking advice about payday loan problems from 2009 to 2012. Concerns about the growth in this industry centred around high rates of interest, irresponsible lending practices and the tendency for fees and interest to rack up very quickly when the borrower was unable to pay on the agreed date. For example, one client told us:
“My initial loan was £240 with interest of £180 making the total £420. As I couldn't afford to pay I rolled it over 2 or 3 times. With the interest they charge they now say I owe them £1700 and possibly more now.”
Figure 2.6: We saw a range of damaging practices within the payday loans industry Problems reported to Citizens Advice in relation to payday loans (2013-14)
Source: Citizens Advice
As the scale of the detriment in this market became clear, the newly created FCA introduced stricter rules on payday loans in 2014. These new rules included strengthened affordability checks, compulsory signposting to debt advice and
10 Proposals for a price cap on high-cost short-term credit, FCA, 2014
21

limiting how many times a loan could be ‘rolled over’. In January 2015 a daily interest cap of 0.8% and a total cost cap came into force. Consumers can no longer be required to pay back more than double what they borrowed, including interest, fees and charges.
Early signs suggest that these regulations have been effective - the number of payday loan problems coming through our doors have more than halved since they came into force. In the first quarter of 2014, we saw 10,115 problems with payday loans. This fell to 4,315 in the first quarter of 2015. As the FCA anticipated, many payday lending firms are exiting the market as a result of the cap and those that remain have introduced more stringent lending criteria.
Figure 2.7 The number of payday loan problems we see has halved since the first quarter of 2015 Total number of payday loan problems reported to Citizens Advice (Q1 2013 - Q1 2015)
Source: CItizens Advice
Although the cleaning up of the payday loan industry is a welcome development, the demand for short term loans to fill the gap in household budgets remains. There is a risk that people will turn to other high cost credit products to meet this need. We are already seeing worrying signs of growth and sharp practices in the bill
22
of sale (logbook loans) and guarantor loan markets - products which are often specifically targeted at people locked out of mainstream credit products. These 11
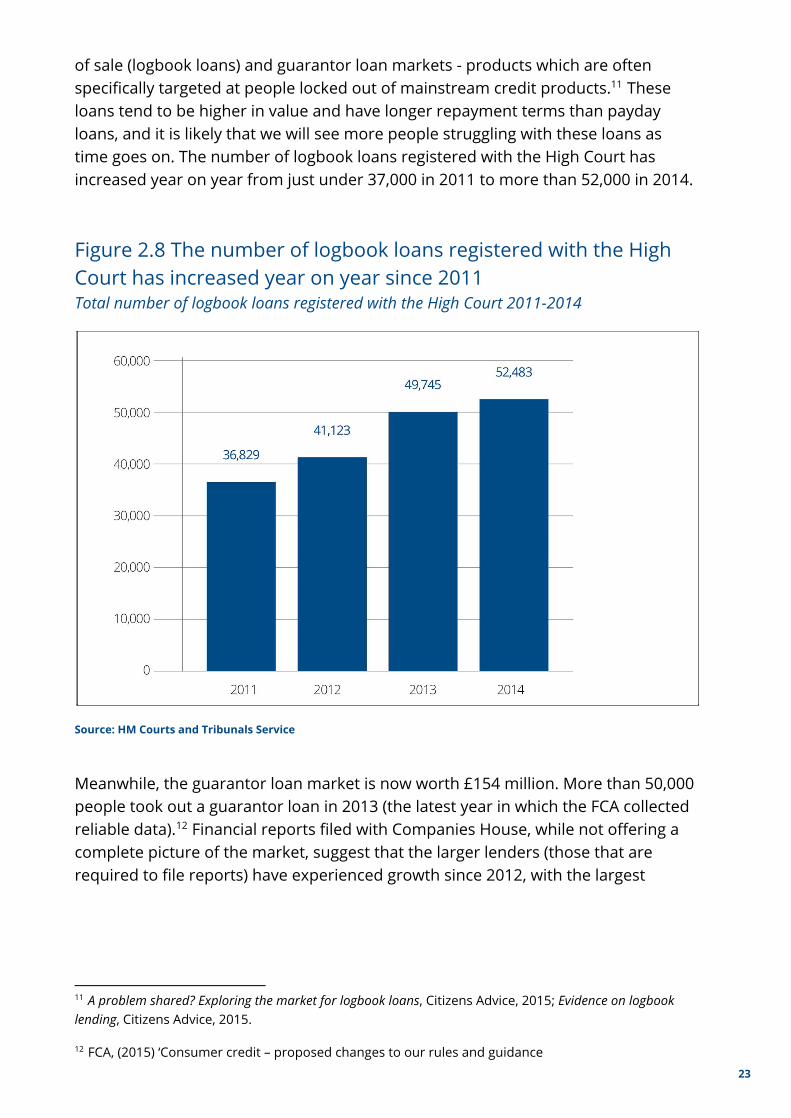
loans tend to be higher in value and have longer repayment terms than payday loans, and it is likely that we will see more people struggling with these loans as time goes on. The number of logbook loans registered with the High Court has increased year on year from just under 37,000 in 2011 to more than 52,000 in 2014.
Figure 2.8 The number of logbook loans registered with the High Court has increased year on year since 2011 Total number of logbook loans registered with the High Court 2011-2014
Source: HM Courts and Tribunals Service
Meanwhile, the guarantor loan market is now worth £154 million. More than 50,000 people took out a guarantor loan in 2013 (the latest year in which the FCA collected reliable data). Financial reports filed with Companies House, while not offering a 12
complete picture of the market, suggest that the larger lenders (those that are required to file reports) have experienced growth since 2012, with the largest
11 A problem shared? Exploring the market for logbook loans, Citizens Advice, 2015; Evidence on logbook lending, Citizens Advice, 2015.
12 FCA, (2015) ‘Consumer credit – proposed changes to our rules and guidance 23
guarantor lender reporting over 30 per cent growth in revenue and 40 per cent growth in profits between 2012/13 and 2013/14. 13
Conclusion These findings suggest that, beneath the headlines, debt is shifting in worrying ways. The bulk of unsecured borrowing lies with credit cards and personal loans. However, Citizens Advice’s more recent and granular data reveals how debt problems are changing over time. The rise of payday lending led to significant consumer detriment and it is important that the FCA continues to take an aggressive approach to credit products marketed at high risk consumers. Meanwhile the move to arrears raises important questions about the debt collection practices of organisations from Local Authorities to energy and telecoms providers. This, alongside poor financial capability across the population highlights the urgent need to improve skills and behaviours in managing debt. In the following chapters of this report we look in greater depth at debt as a problem.
13 Company reports of the sampled lenders were accessed in April 2015, we only included companies in our calculations whose main business was guarantor lending.
24

Chapter 3: Who is most exposed?
Summary
An in depth interrogation of the Wealth and Assets Survey reveals that three groups within the population are at increased risk of problem debt:
● Young people aged 15-24 had the highest average unsecured debt to income ratio of any age group in 2010-12. The average total debts of 15-24 year olds grew by more than 200 per cent between 2006 and 2012 - more than ten times more quickly than the average debts of the wider population. Young people continue to stand out as a highly indebted group even after student loans are removed from the equation.
● Those with few assets, including property wealth, pension and savings, emerge as another highly indebted group. Those with no property wealth were nearly three times as likely to be in arrears than those with property wealth of up to £68,000 in 2010-12.
● Single people, and particularly lone parents, make up our final at risk group. One in five lone parents was behind on at least one priority bill in 2010-12, compared to 7 per cent of the wider population.
Introduction In this chapter we turn to debt as a problem. A detailed analysis of two indicators recorded in the Wealth and Assets Survey - debt to income ratios and household 14
arrears - reveals that three groups within the population are at increased risk of experiencing debt as a defining and distorting feature in their lives: young people, those with few assets and single people.
In this chapter we look at each of these groups in turn, setting out the findings of our analysis of the Wealth and Assets Survey data before turning to our own, more granular and up to date data to understand the experience of these groups in greater depth.
14 The debt to income ratios presented in this chapter represent the absolute value of household consumer debt divided by the household’s annual income. We use debt to income ratios, rather than debt to earning ratios, to ensure that we take full account of the household’s total income, including any benefit income.
25

1. Young people Our analysis reveals that young people shoulder a disportionate amount of unsecured debt in the UK. Across the population as a whole, levels of consumer debt rise in early adulthood, stabilise in middle age and then are paid off in the run up to, and following, retirement; a trend which has been reinforced by the increase in student loans in the last decade.
As a result, the majority of the UK’s debt sits with younger people. £82 billion of the UK’s £170 billion mountain of unsecured private debt sits with people under the age of 35. The under 35s make up 29 per cent of the adult population and hold 48 per cent of the debt. On average people aged 15-24 had unsecured debts of £12,215, compared to £7,253 for 25-29 year olds (again the second highest) and £1867 for 65-69 year olds.
Although the cyclical nature of debt through the course of adult life is well recognised and long established, the rate at which young people have been accumulating debt over the last few years is a cause for renewed concern. While the average level of debt grew by nearly 20 per cent between 2006 and 2012, the debt of 15-24 year olds grew more than ten times faster (by 206 per cent) over the same period.
This worrying trend is also reflected in this cohort’s significantly above average and fast rising unsecured debt to income ratio. In 2010-12, the most recent wave of the Wealth and Assets Survey, young people aged 15-24 had an average debt to income ratio of nearly 70 per cent, compared to 34 per cent for 25-29 year olds (the age group with the second highest debt to income ratio) and 11 per cent for 60-64 year olds.
26
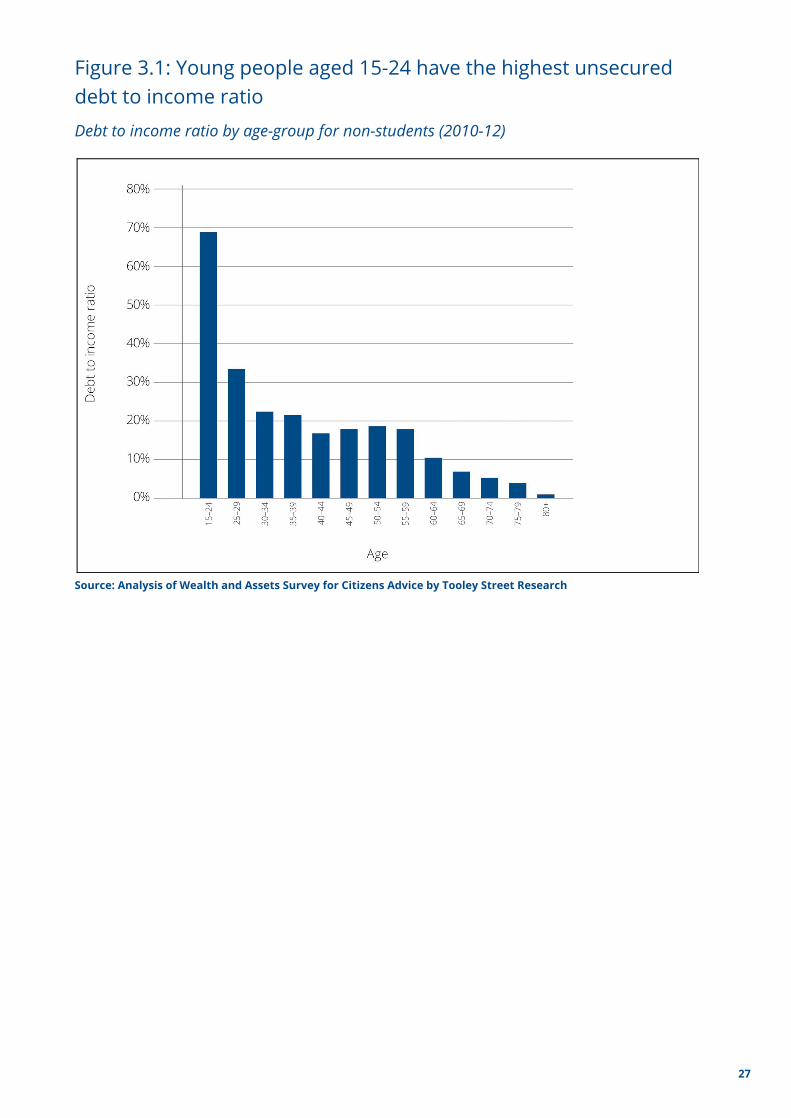
Figure 3.1: Young people aged 15-24 have the highest unsecured debt to income ratio
Debt to income ratio by age-group for non-students (2010-12)
Source: Analysis of Wealth and Assets Survey for Citizens Advice by Tooley Street Research
27
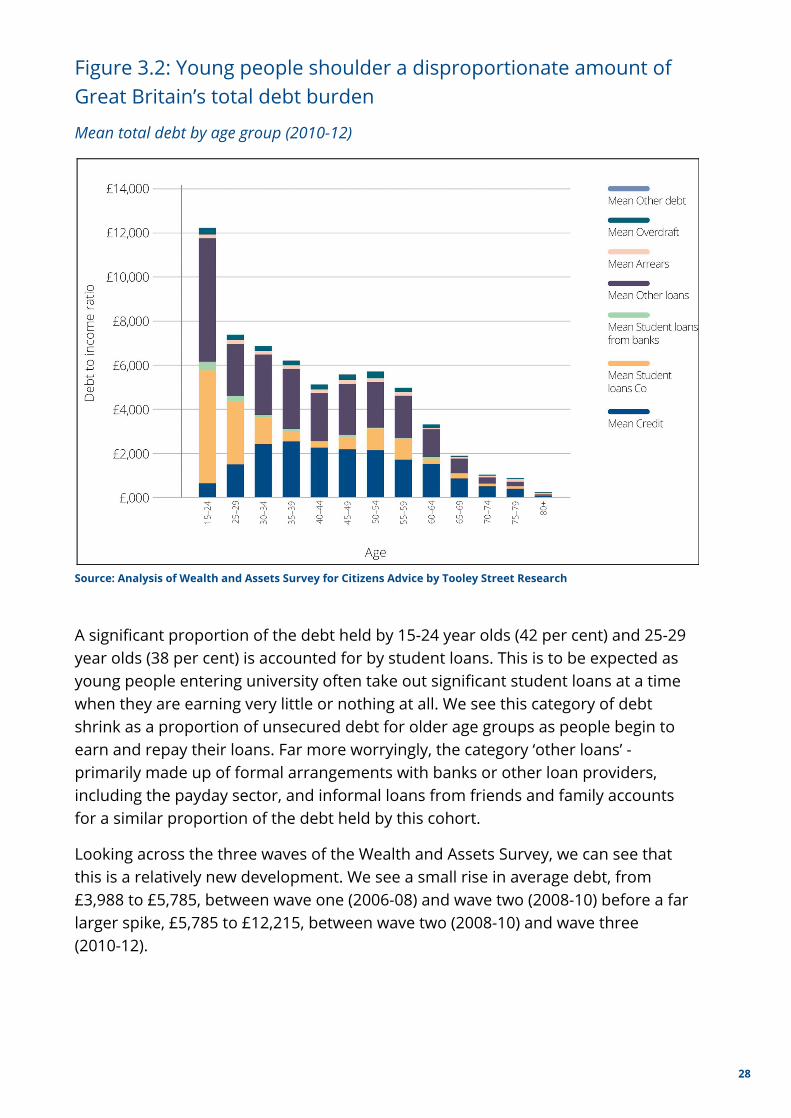
Figure 3.2: Young people shoulder a disproportionate amount of Great Britain’s total debt burden
Mean total debt by age group (2010-12)
Source: Analysis of Wealth and Assets Survey for Citizens Advice by Tooley Street Research
A significant proportion of the debt held by 15-24 year olds (42 per cent) and 25-29 year olds (38 per cent) is accounted for by student loans. This is to be expected as young people entering university often take out significant student loans at a time when they are earning very little or nothing at all. We see this category of debt shrink as a proportion of unsecured debt for older age groups as people begin to earn and repay their loans. Far more worryingly, the category ‘other loans’ - primarily made up of formal arrangements with banks or other loan providers, including the payday sector, and informal loans from friends and family accounts for a similar proportion of the debt held by this cohort.
Looking across the three waves of the Wealth and Assets Survey, we can see that this is a relatively new development. We see a small rise in average debt, from £3,988 to £5,785, between wave one (2006-08) and wave two (2008-10) before a far larger spike, £5,785 to £12,215, between wave two (2008-10) and wave three (2010-12).
28
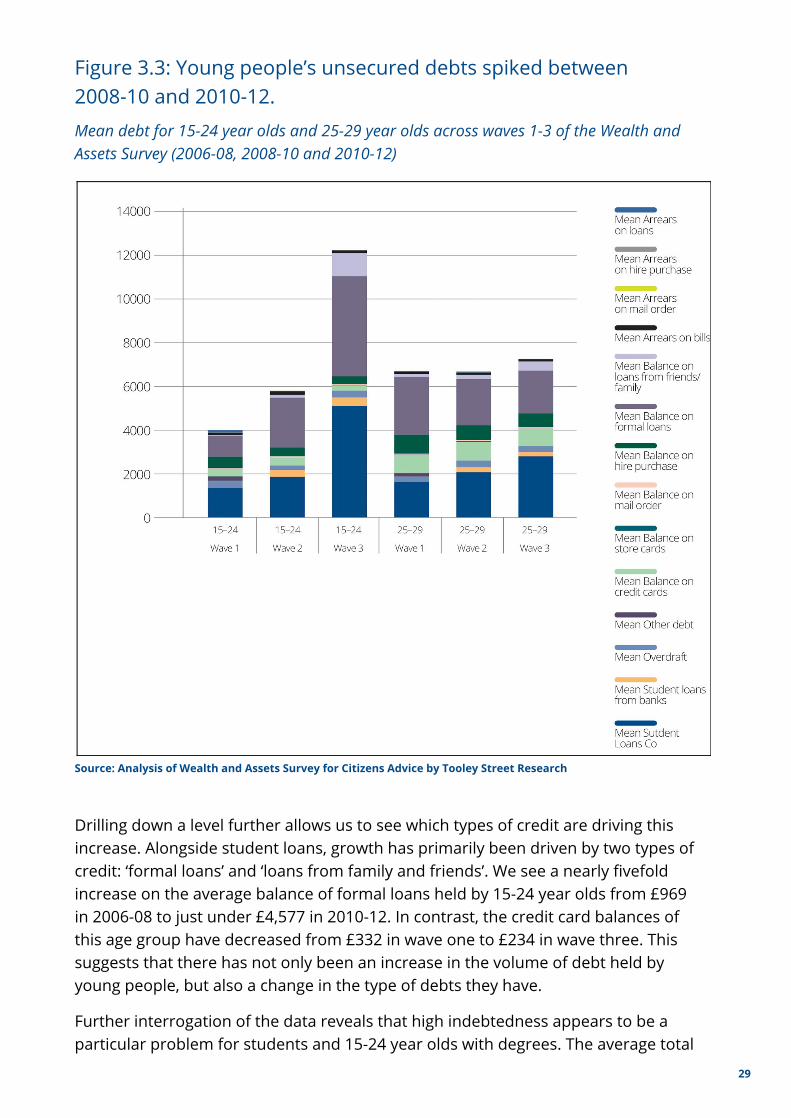
Figure 3.3: Young people’s unsecured debts spiked between 2008-10 and 2010-12.
Mean debt for 15-24 year olds and 25-29 year olds across waves 1-3 of the Wealth and Assets Survey (2006-08, 2008-10 and 2010-12)
Source: Analysis of Wealth and Assets Survey for Citizens Advice by Tooley Street Research
Drilling down a level further allows us to see which types of credit are driving this increase. Alongside student loans, growth has primarily been driven by two types of credit: ‘formal loans’ and ‘loans from family and friends’. We see a nearly fivefold increase on the average balance of formal loans held by 15-24 year olds from £969 in 2006-08 to just under £4,577 in 2010-12. In contrast, the credit card balances of this age group have decreased from £332 in wave one to £234 in wave three. This suggests that there has not only been an increase in the volume of debt held by young people, but also a change in the type of debts they have.
Further interrogation of the data reveals that high indebtedness appears to be a particular problem for students and 15-24 year olds with degrees. The average total
29

debt for 15-24 year olds in wave three (2010-12) was just over £12,000. In contrast, 20-24 year olds who were at university at the time of the study reported average debts of over £35,000. Those in this age group who had already completed their degree reported average debts of around £15,000. This discrepancy cannot be entirely explained by the increase in tuition fees from £3,000 to £9,000 at this time. Non-student loan debt accounts for more than half of the debt of 20-24 year olds who are currently students and just under half of the total debt of 20-24 year olds who are educated to degree level or above.
Young people are also most likely to be behind with their household bills - more than 20 per cent of 15-24 year olds were in arrears on at least one household bill, compared to just over 10 per cent of 25-29 year olds and two per cent of 60-64 year olds. The prevalence of arrears amongst this age group is particularly concerning as arrears are often an indicator of financial difficulty.
When money is tight most people prioritise paying what they perceive to be important household bills, such as mortgage or rent payments and energy bills, first. Being in arrears is often therefore a stronger indicator that someone is struggling financially than, for example, a high balance on a credit card or personal loan.
30

Figure 3.4 Young people aged 15-24 are more likely than any other age group to be behind on one or more household bill Proportion of people behind with any household bills by age group (2010-12)
Source: Analysis of Wealth and Assets Survey for Citizens Advice by Tooley Street Research
This detailed reading of the Wealth and Assets Survey builds a strong picture of an emerging cohort of young people with higher volumes of debt than older generations and previous generations of young people. We turn now to our own data, gathered from across the Citizens Advice network.
Figure 3.5 compares the top ten debt issues presented by Citizens Advice debt clients aged under 25 with the top ten debt issues we see across our debt clients as a whole. Council tax arrears come top for both groups, but further down the list some important differences emerge. Among young people, telephone and broadband debts are the third most common debt problem, making up eight per cent of debt issues. This is twice as common as among debt clients as a whole (four per cent). Young people are also much more likely to have a Magistrate’s Court fine (six per cent compared to three per cent for all debt clients). Conversely, they are less likely to have credit, store or charge card debts - these make up five per cent of young people’s debt problems compared with 10 per cent of debt problems overall.
31

Figure 3.5 How do the debts held by our clients aged under 25 differ from those of our wider debt client population?
Top ten debt issues dealt with by local Citizens Advice for clients aged under 25 and all debt clients (2014/15)
Source: Citizens Advice
The impact of this unprecedented level of debt among young people is not yet clear. However, as we set out in the following chapter, problem debt can have a serious and long term impact on people’s lives. What is clear is that there is reason to be concerned about the health of young people’s finances, and further work to understand the causes and consequences of this worrying trend should be a priority for government and the wider debt community.
2. Households with low wealth Households with low wealth emerged from the Wealth and Assets Survey as the second of our three groups at increased risk of problem debt. Perhaps unsurprisingly, our analysis of the Wealth and Assets survey reveals a strong inverse relationship between household wealth and arrears. This is true across all three indicators of wealth tested - savings, pensions and property wealth.
32

Figure 3.6: People with few assets are more likely to be behind with one or more household bills % of people behind with any household bills by quintile of household property wealth (2010-12)
Source: Analysis of the Wealth and Assets Survey for Citizens Advice by Tooley Street Research
Even a relatively small amount of property wealth makes a big difference to the likelihood that a household will be behind with one or more household bills - people with no property wealth at all (those who don’t own a property or are in negative equity) were nearly three times as likely to be in arrears than those with property wealth of up to £68,000 in 2010-12 (14 per cent and 5 per cent respectively).
Similarly stark is the relationship with savings. Less than two per cent of those who had saved any money at all in the past two years were in arrears on one or more household bill, compared with more than ten per cent of those who had not saved at all. A similar story emerges when it comes to pensions wealth. Those with no pension savings were twice as likely to be in arrears than those with pension savings of up to £18,000 (14 per cent and 7 per cent respectively).
33

Figure 3.7: People with low pension savings are more likely to be behind with one or more household bill
% of people behind with any household bill by quintile of household pension wealth (2010-12)
Source: Analysis of the Wealth and Assets Survey for Citizens Advice by Tooley Street Research
Citizens Advice does not routinely collect information about the wealth of our clients. However, we do collect information on their housing tenure. The strong association between housing wealth and arrears makes a comparison of the debt profile of clients living in rented properties and our wider client base a reasonable proxy. Renters are over-represented amongst clients with complex or severe debt problems - they make up 70 per cent of clients who receive specialist debt advice compared to 60 per cent of our total client population.
Although renters are over-represented amongst our debt clients, the profile of their debts is very similar to that of our wider client population. Renters are slightly more likely than average to have council tax arrears (15 per cent compared to 12 per cent) and debt relief orders (10 per cent compared to 8 per cent) but less likely to have credit, store or charge card debts (8 per cent compared to 10 per cent).
34
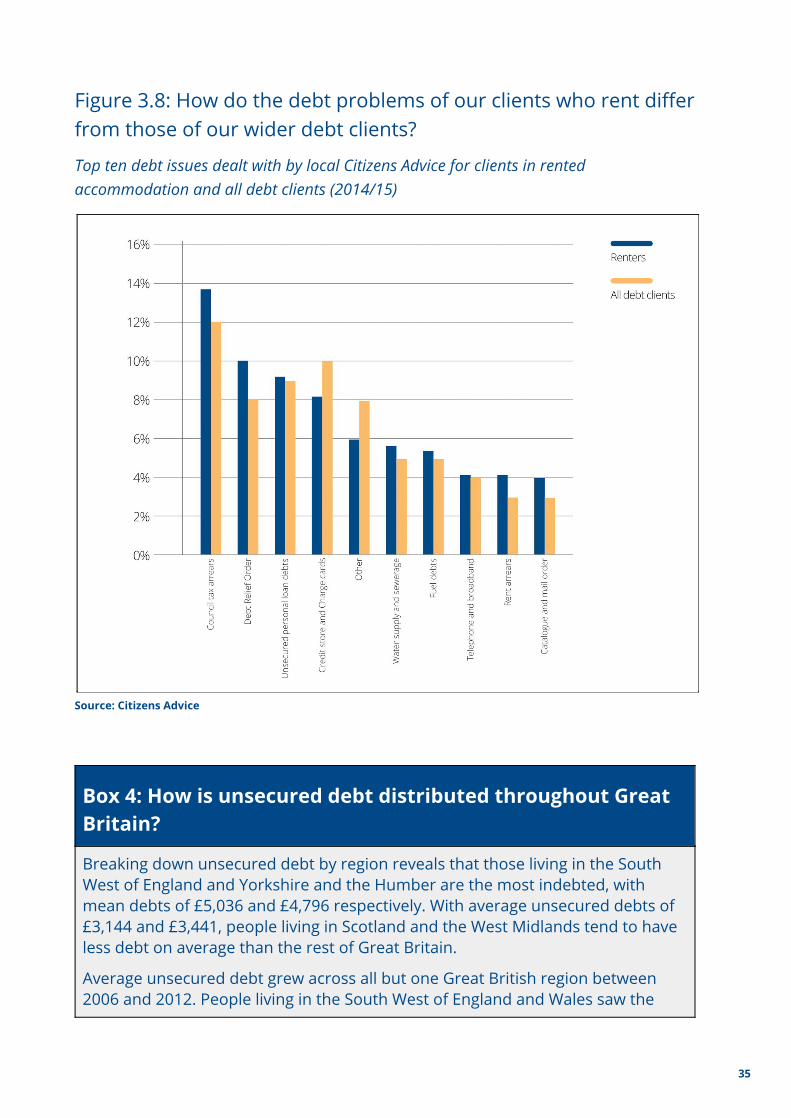
Figure 3.8: How do the debt problems of our clients who rent differ from those of our wider debt clients?
Top ten debt issues dealt with by local Citizens Advice for clients in rented accommodation and all debt clients (2014/15)
Source: Citizens Advice
Box 4: How is unsecured debt distributed throughout Great Britain?
Breaking down unsecured debt by region reveals that those living in the South West of England and Yorkshire and the Humber are the most indebted, with mean debts of £5,036 and £4,796 respectively. With average unsecured debts of £3,144 and £3,441, people living in Scotland and the West Midlands tend to have less debt on average than the rest of Great Britain.
Average unsecured debt grew across all but one Great British region between 2006 and 2012. People living in the South West of England and Wales saw the
35
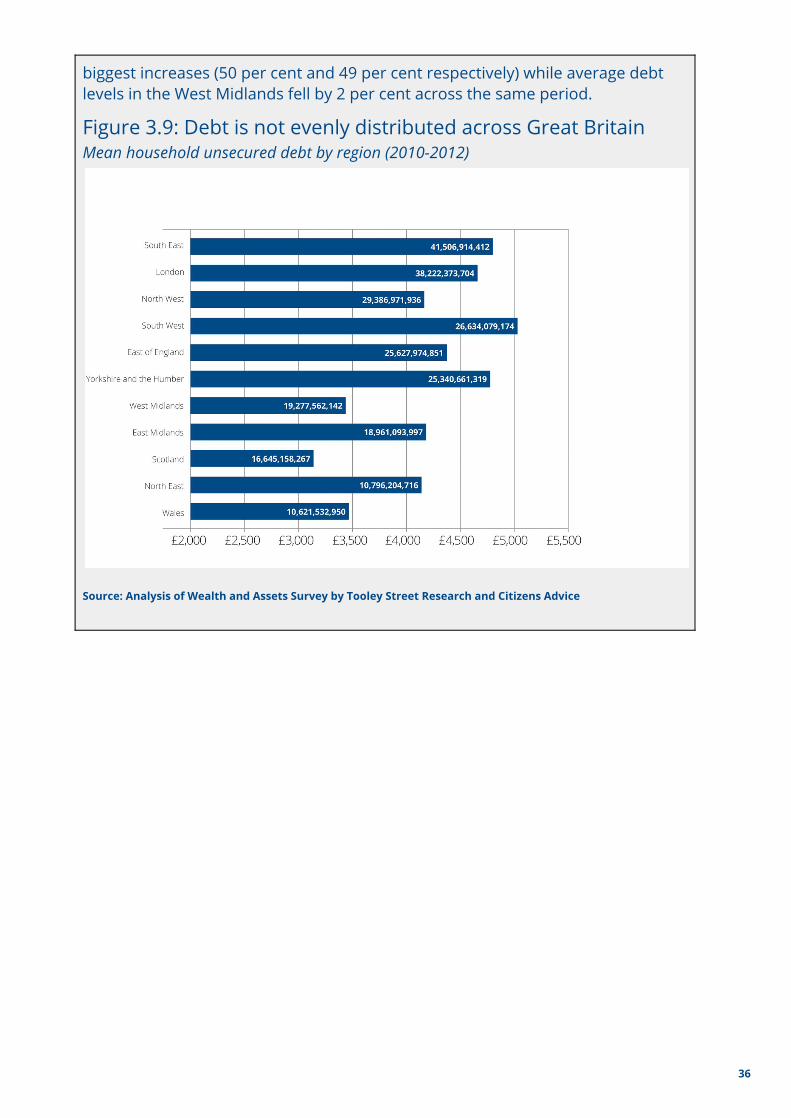
biggest increases (50 per cent and 49 per cent respectively) while average debt levels in the West Midlands fell by 2 per cent across the same period.
Figure 3.9: Debt is not evenly distributed across Great Britain Mean household unsecured debt by region (2010-2012)
Source: Analysis of Wealth and Assets Survey by Tooley Street Research and Citizens Advice
36

Figure 3.10: Household unsecured debt grew most quickly in the South West of England and Wales
% change in mean household unsecured debt between 2006-08 and 2010-12 by region
Source: Analysis of Wealth and Assets Survey by Tooley Street Research and Citizens Advice
3. Single households The third highly indebted group emerging from our analysis of the Wealth and Assets Survey is single households. Lone parents with dependent children were the most likely to be in arrears on one or more household bill (20 per cent) followed by lone parents with non-dependent children (11 per cent) and single households under state pension age (10 per cent). This compares with 7 per cent of couples with dependent children and just 2 per cent of couples under state pension age with no children.
37
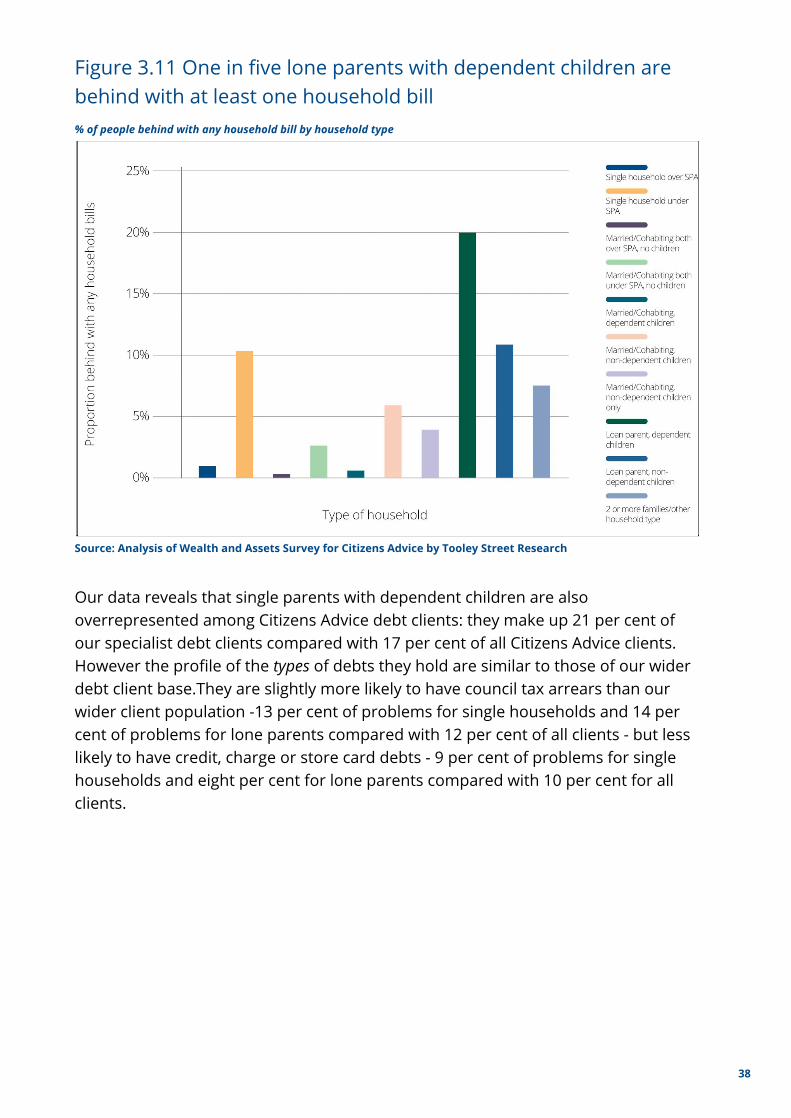
Figure 3.11 One in five lone parents with dependent children are behind with at least one household bill % of people behind with any household bill by household type
Source: Analysis of Wealth and Assets Survey for Citizens Advice by Tooley Street Research
Our data reveals that single parents with dependent children are also overrepresented among Citizens Advice debt clients: they make up 21 per cent of our specialist debt clients compared with 17 per cent of all Citizens Advice clients. However the profile of the types of debts they hold are similar to those of our wider debt client base.They are slightly more likely to have council tax arrears than our wider client population -13 per cent of problems for single households and 14 per cent of problems for lone parents compared with 12 per cent of all clients - but less likely to have credit, charge or store card debts - 9 per cent of problems for single households and eight per cent for lone parents compared with 10 per cent for all clients.
38

Figure 3.12: How do the debt problems of our single clients differ from those of our wider debt clients?
Top ten debt issues dealt with by local Citizens Advice for single people, lone parents and our wider debt clients (2014/15)
Source: Citizens Advice
Conclusion Three groups emerge from our analysis of the Wealth and Assets Survey as showing signs of problem debt: young people, single households and those with few assets. Most striking are the unprecedented levels of indebtedness among those aged under 25. Though student loans are an important component of this debt, this group also has historically high levels of other loans. Citizens Advice data shows that young people are disproportionately likely to have telephone and broadband debts and serious debt problems including Debt Relief Orders and Magistrate’s Court fines. The long-term consequences for this highly indebted generation are unclear but we do know that debt has a significant and long term impact on people’s lives, behaviours and attitudes. The final chapter explores these issues in greater depth.
39
Chapter 4: The debt effect
Summary
● There is an established link between high levels of personal debt and lower living standards, mental health and labour market outcomes.
● Our data suggests debt problems have a number of recurring features. For example, they are unusually intertwined with other issues; they have particularly profound effects on people’s lives, from mental health to relationship stability; and they are often preventable.
● A newer body of work now suggests that debt also affects people’s behaviours and attitudes. This is an issue we are exploring in collaboration with economists at the London School of Economics.
Introduction In this chapter we drill down into the effect debt has on people’s lives. First we look at the themes emerging from a well-established body of academic literature on the links between debt and other issues. We then draw lessons from our own data and cases and, finally, we consider a newer body of work that explores the impact debt can have on decision-making, behaviours and attitudes.
Evidence of the debt effect There is a long-standing academic literature that explores the complex links between debts and other challenges in people’s lives. A review of this literature reveals well-established links between debt and a number of other outcomes:
● A number of studies have found a strong and consistent link between high levels of personal debt and lower standards of living and well being. For 15
example, there is a well established link between problem debt and reduced spending on food and other household essentials. This link is partly 16
explained by the higher share of income that is spent on debt servicing costs by individuals that have higher levels of debt relative to their incomes.
15 Hartfree, Y. and Collard , S., (2014) Poverty, debt and credit: An expert-led review; Dearden, C., Goode, J., Whitfield, G., and Cox, L., (2010) Credit and debt in low-income families 16 Stepchange and the Children’s Society, (2014) Exposing the impact of problem debt on children
40
● Debt has been linked to financial exclusion, with highly indebted individuals
often struggling to access mainstream credit products in a way that can exacerbate debt problems, pushing people into a cycle of ever more expensive borrowing over time. 17
● There is strong evidence of a negative association between personal debt
and mental and physical health. Research by the mental health charity Mind found links between personal debt and anxiety, stress, clinical depression and physical ill-health. Crucially, these links have been shown to be 18
independent of the effects of poverty. Worrying connections have also been made between problem debt and suicide. Anxiety has also been found to 19
be higher amongst children living in highly indebted households. 20
● Debt has also been found to have a harmful effect on personal relationships
and some studies suggest debt can contribute to family breakdown. More 21
than half (56 per cent) of respondents to a survey run by the Money Advice Service indicated that personal debt had had a negative impact on their family life, not least by raising levels of stress and anxiety. 22
● Finally, links have been made between personal debt and poor labour market
outcomes. One study, for example, found that high levels of indebtedness can be viewed by unemployed people as a disincentive to find work, with any additional earnings eaten up by unsatisfying interest repayments rather than feeding through into higher disposable income. 23
This literature confirms that the effects of debt are widespread and go beyond the obvious and direct effects of debt on disposable incomes and living standards. Much of this literature, however, focuses on finding associations between debt and individual characteristics in large scale survey data. As a result, it says little about why debt can have such profound effects and throws little light on the kind of support people need to avoid and address money troubles in their lives. To do this, it is useful to look at the lessons we can draw from our own work advising 400,000 people a year on how to deal with a personal debt problem.
17 Kempson, E., Whyley, C., Caskey, J. and Collard, S. (2000) In or out? Financial exclusion: a literature and research review. Financial Services Authority Consumer Research Report 18 Mind, (2008) In the Red 19 Lea, S.. Behaviour Change: Personal Debt 20 Step Change and The Children’s Society: found that 58% of children whose family were in arrears ‘reported feeling worried about their family’s financial situation. This compares to 31% of those not in arrears.’ 51% felt embarrassed about the things they did not have and 19% of children growing up in families in arrears had been bullied for that reason. 21 Pleasence, P., Buck, A., Balmer, N., Williams, K. (2005) A Helping Hand: The Impact of Debt Advice on People’s Lives 22 Money Advice Service, (2013) Indebted Lives 23 Hartfree, Y. and Collard , S., (2014) Poverty, debt and credit: An expert-led review
41

Lessons from across our service Our advisers speak to over 1,000 people a day about a problem with personal debt. Many of these conversations explore people’s financial situations in significant detail, working through wider issues in the person’s life to resolve the problem. As well as helping our clients to find a way forward with their immediate problem we also increasingly embed preventative money advice into our work to help reduce the risk that problems will recur.
So what do these conversations tell us about the nature of debt problems? The cases we see vary hugely, affecting people in a wider diversity of ways and playing out very differently. But a number of themes recur time and again when exploring our data and reading through our case notes, with debt problems having three particularly distinctive characteristics.
1. Debt problems are inextricably linked to other issues in people’s lives
Our clients’ problems rarely occur in isolation; while services divide neatly into different departments, companies or sectors, people’s lives are not so neatly compartmentalised. So it is no surprise that the debt issues we see are often entwined with other issues from employment to housing and benefits.
But our data suggests that debt is more intertwined with other problems than other issues. Half of the 400,000 debt clients we helped with a debt issue last year also had at least one non-debt issue. Figure 4.1 shows how this figure compares with the other top five issues we help people with. Debt is the second most common issue reported by our clients, after benefits and tax credits, and it is the most interlinked of any of our top five issues. While 45 per cent of our debt clients are also seeking help with one other non-debt issue, the equivalent figure for housing, benefits, relationships and employment are 41, 39, 38, and 34 per cent respectively.
42

Figure 4.1: Our clients’ debt problems are closely entwined with other issues in their lives Total number of issues reported to Citizens Advice in relation to selected issues, and the proportion of the cases in these categories which involved at least one other connected issue (Q1 2015)
Source: Citizens Advice
Interestingly, we see a similar pattern among clients who originally approached us about an issue other than debt. Even among clients who came to us with an a serious problem that was not about debt, twenty per cent of these clients turned out to need help with at least one debt problem. Put another way, debt or money 24
issues often sit behind other problems in people’s lives, and it is when people seek help with these wider problems that we have a chance to help with the related issues with money or debt.
So what are the additional problems our debt clients seek help with? Figure 4.2 brings home the sheer complexity of these links. It maps the issues reported by our debt clients, with the links showing the issues that co-occur most frequently. Problems with the administration of benefits commonly co-occur with debt problems. This is likely to reflect not only the well-established links between debt and low incomes but also the impact of unexpected hits to income, for example from a disputed benefit claim or mistaken calculation.
24 This data relates to clients that receive in-depth support from a caseworker because their problem is particularly severe or complex. This constitutes around 35 per cent of clients seen by local Citizens Advice.
43
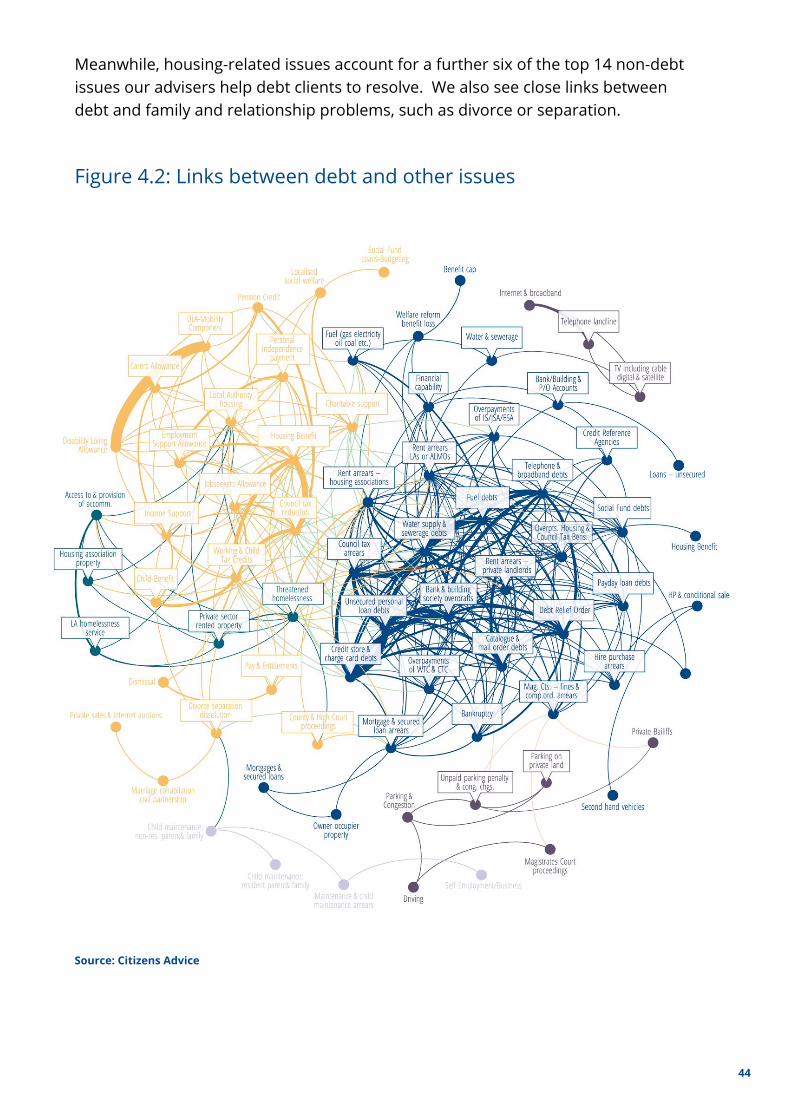
Meanwhile, housing-related issues account for a further six of the top 14 non-debt issues our advisers help debt clients to resolve. We also see close links between debt and family and relationship problems, such as divorce or separation.
Figure 4.2: Links between debt and other issues
Source: Citizens Advice
44

It is when we turn to our case notes, however, that we get a deeper understanding of why exactly debt problems prove to be so enmeshed with wider issues in people’s lives. For example, the following case illustrates the links:
Bev sought advice from her local Citizens Advice about a persistent damp problem in her privately rented property. She had little money to spare and, while waiting for her landlord to deal with the damp, she was spending substantial sums keeping the property warm and dry through the winter. The additional cost had forced Bev to choose between food and repayments for her existing debts, pushing her further into arrears on her rent and utility bills arrears, raising a risk of eviction and court action.
We also see, time and again, how sudden shocks to income from an employment or health problem can feed quickly through to debt problems, even for households on moderate incomes. Such loss of income can render previously manageable debt repayments suddenly unaffordable. The following case is typical:
John came into his local Citizens Advice for help after he was unable to continue working as a caretaker due to a decline in his health following a heart attack. John had received statutory sick pay for a limited period after his heart attack but this was now due to come to an end and he was concerned that this drop in his income would leave him unable to meet the repayments on multiple debts, pushing him deeper into financial trouble.
In other cases, unexpected expenditure, for example a broken washing machine or broken down car, can be as damaging to fragile household finances as a sudden drop in income, with some of our clients pushed into debt after losing out as a result of a consumer scams or due to overly weak consumer protections.
2. Debt can have a profound effect on people’s lives, attitudes and behaviours
The second distinctive feature of debt problems is that they can have profound effects on people’s outlooks. We find many examples amongst our case studies of individuals who are unable to adequately feed themselves or their families because of the burden of servicing their debts. The stress of dealing with problem debts can also take a toll on people's mental health.
Citizens Advice has conducted research into the effect of our advice on wider aspects of people’s lives including mental health. It shows that, before seeking advice, 73 per cent of our debt clients said they felt stressed, depressed or anxious. This compares to 66 per cent of clients with any problem. After receiving advice 89 per cent of our debt clients said they felt less stressed, depressed or anxious, compared to 81 per cent of clients with any problem. 25
25 CItizens Advice (2014) National Outcomes Impact Research. 45

Again, it is when we explore the real stories behind this data that we understand why people feel this way. The impacts of debt on mental and physical health, for example, often come down not to the level of debt per se but to the debt collection practices pursued by the creditor. For example:
Jen was in debt to her gas company and paid for her gas through a prepayment meter. Her gas provider had calibrated the meter to collect her debt each time she topped up with the result that most of each top-up went to repay debts rather than paying for gas. Rather than allow Jen to repay her debts in summer, when her overall bill would be lower, the company continued debt collection through the winter. As a result Jen had stopped topping up the meter, leaving her and her five year old child living in an unheated home in February.
We also see the corrosive impact debt problems can have on people’s relationships, particularly as irresponsible lenders take advantage of people in financial difficulties, and as people then try to shield the true scale of the problem from their loved ones. For example:
Selina visited her local Citizens Advice for help after accruing debts of more than £9,000. Most of this debt was made up of a cash loan of £6,100 taken out from a doorstep lender. Selina was unemployed and relied on ‘housekeeping money’ from her partner as her sole source of income yet she had been given the loan solely in her name and with little clarity over interest repayments. Selina felt unable to tell her partner about the loan and had become increasingly consumed by the debt as a result, reducing the amount of money she had available for household expenses and harming her relationship with her partner.
Another emotional and practical impact of problem debt is the way it can trap people, sometimes for many years, making it hard to rebuild their lives after an unexpected knock. For example:
Ben sought advice from his local Citizens Advice after losing his job. Having lost his income, he had built up £1,700 in rent arrears which resulted in him being evicted from his home. Ben had been placed on a waiting list for housing but he had been told he was ineligible to bid for properties until he had reduced his arrears to £700 by paying back £5 a week, a process that would take nearly four years. Ben struggled to pay more than this, and indeed struggled to pay even £5 a week without a steady income. Without work or a home and facing four years before he was able to bid for properties, he was unsure how to move forwards with his life.
46

These cases bring home, each in their own way, just why debt problems are distinctively damaging in the extent and duration of their emotional and practical effects.
3. Debt problems often prove to have been preventable with the right support
In many of the cases we see, debt problems could have been avoided, or prevented from escalating if the client had been given independent, accurate information at the right time. For example:
Jamal sought advice from a local Citizens Advice after becoming concerned about the affordability of the debt management plan he had entered into. Jamal had been cold called by a fee charging company and agreed to sign up to a debt management plan to repay his non-priority debt totalling £220. The fee for this service was £760, more than three times his total debt. Jamal was concerned that the £760 fee would be added to his existing debts even if the creditors refused to agree to the proposed plan. There was no obligation for them to do so. He had not been made aware of the existence of fee-free debt management plans which would have allowed him to deal with his debt without incurring additional debt.
Jamal was clearly receptive to a debt management solution, but was not made aware of the full range of options available to him either before he received the call from the fee charging debt management company, or by the company’s representative during the call. Accessing independent advice earlier on would have given him access to information on all of the options available to him and the opportunity to get an affordable plan put in place at a far earlier stage.
In other cases, low levels of financial capability, which can include poor budgeting and money management skills or a lack of understanding about financial products and how to get the best from them, can exacerbate existing debt problems or lead to new debts being built up.
Although a range of statutory and voluntary debt remedies have been developed to support people to put their debt repayments on a sustainable footing, some people encounter barriers in accessing these schemes. When this happens, as in the example below, people’s financial difficulties can escalate quickly:
Lorna visited a local Citizens Advice when she was no longer able to manage her multiple debts. Our advisor identified bankruptcy as her best option but, as a single mother working part time in a low paying job, Lorna could not afford the bankruptcy fee. She was unable to borrow the fee from friends or family and so saved up for nine months to be able to pay the fee. In this time, she fell further into debt as fees and charges wracked up. Lorna’s creditors were unwilling to cease collection activity while she saved up enough money to pay the bankruptcy fee and she faced county court judgements and
47

bailiffs seeking immediate repayment of her council tax arrears. The situation also exacerbated her existing mental health problems, which included anxiety and depression.
Lessons for support
The range and interconnected nature of the problems our clients bring to our service presents a real challenge - advisers often find that they must first address the wider obstacles people face in their lives before they can begin to resolve the client’s debt problems. Our service, which prides itself on giving advice to anyone on any issue, is already relatively well positioned to overcome these challenges. However, we are increasingly looking at ways to further integrate our debt advice with wider financial capability and generalist advice services in recognition of the need to deal with the full range of issues our clients face in a holistic way.
The effect of debt on attitudes and decision-making Although existing research has shown that problem debt correlates to a range of negative outcomes, such as physical and mental health, it has been far less successful at establishing causality. These studies tend to look at data which captures a snapshot - which will tell us that debt tends to exist alongside other problems - rather than longitudinal data which follows a chain of events over a number of months of years. A more longitudinal approach would allow us to observe the sequence of events leading up to problem debt, the interplay between debt and other other issues, and, crucially, the long term effects debt has on people’s future attitudes, behaviours and outcomes.
However, a new body of literature is emerging which begins to explore some of these questions. For example, a number of studies have found possible links between debt and the following behaviours:
● Attitudes towards being in debt. Research has linked indebtedness with a more tolerant attitude towards borrowing. While the extent to which more 26
tolerant attitudes towards debt are a cause or a symptom of problem debt is not yet clear, evidence from studies of the impact of student loans on attitudes towards borrowing suggests that being in debt makes people less fearful of future borrowing. 27
26 Lea, S.E.G., Webley, P. & Walker, C.M. (1993). The Economic Psychology of Consumer Debt 27 Brown, S., Garino, G. and Taylor, K., (2013) Household debt and attitudes towards risk; Haultain, S., Kemp, S. and Chernyshenko, O.S. (2010) The structure of attitudes to student debt
48
● Impaired ability to make decisions. Research has also found that people who are under financial pressure experience a reduction in their ability to perform cognitive tasks. As a result, people who are concerned about their financial situation may find it difficult to make important decisions about their debt and other aspects of their lives, or make poor decisions they might otherwise not have taken, such as taking out a high-cost, short term loan.28
This may go some way to explaining why people in debt tend to be more likely to take a short term approach to managing their debts, for example paying back smaller, less expensive loans before the more daunting larger loans despite the greater potential for these loans to quickly accrue additional fees and charges if ignored. 29
In order for debt charities and policy makers to provide the support people need to recover from debt and money problems, it is vital that we have a clear picture of the full range of effects debt can have on people’s behaviours and outcomes. The growing body of literature in this area is welcome, but a number of gaps in our knowledge remain. Citizens Advice is therefore working with researchers at the London School of Economics (LSE) to begin to fill some of these gaps. We hope to be able to publish the outcome of this research in the coming months.
Conclusion An established literature suggests that debt affects everything from mental and physical health to labour market outcomes. Our own work shows that debt can have a profound effect on people’s lives. Our data reveals the issues that co-occur with debt and shows that debt is a more ‘interlinked’ problem than many other challenges people encounter, often proving to be inseparable from other problems in people’s lives. What is less clear are the long term effects on the future attitudes, behaviours and outcomes of people who experience debt as a problem in their lives. A growing body of work hints at these links, but a number of gaps remain. We are working with researchers at LSE to begin to fill some of these gaps.
28 Mani , A., Mullainathan, S., Shafir, E. and Zhao, J. (2013) Poverty impedes cognitive function; Lea, S.. Behaviour Change: Personal Debt 29 Amar, M., Ariely, D., Ayal, S., Cryder, C. and Rick, S. (2011) Winning the Battle but Losing the War: The Psychology of Debt Management
49

Conclusion
In this report we have surveyed the UK’s stock of unsecured personal debt and the problems that relate to this debt. In chapter 1 we saw that this year marks a turning point for debt as government borrowing starts to fall as a percentage of GDP just as private debt to incomes ratios start to rise again. Unsecured lending is growing faster than secured lending as spending has outstripped incomes and the UK’s £170 billion of unsecured lending is set to reach £300-350 billion by 2020, representing an overall debt to income ratio of 20-24 per cent.
In chapter 2 we saw that the composition of debt and debt problems is changing in worrying ways. While credit cards and personal loans still dominate lending, when it comes to debt problems we are seeing an historic shift away from mainstream credit issues and towards arrears on priority debts including council, rent and energy bills. Council tax bills are now the most common debt problem we see at nearly 200,000 a year, up 21 per cent in four years while credit card issues are down 11 per cent. Meanwhile we have seen growth in demand for short term high cost credit, starting with payday loans loans and now, with tougher regulation restraining payday lending, in other products from logbook loans to guarantor loans.
In chapter 3 we looked at who is most exposed to troubling levels of borrowing, finding a staggering rise in debt in among the next generation of adults. Average debts among 15-24 year olds more than trebled between 2006 and 2012 and only 45 per cent of this rise was accounted for by students loans; personal loans have seen a more than four-fold increase and loans from friends and family have risen from an average of around £30 to more than £1,000. Moreover, squeezed out of home ownership, this generation has lower levels of assets than previous cohorts, and we find that in general people with no property wealth are more than three times as likely to be in arrears than those with property wealth of up to £68,000.
Finally, in chapter 4, we turned to the implications of debt for people’s lives. There is an established literature suggesting that debt affects everything from mental and physical health to labour market outcomes. We know from our own work at Citizens Advice that debt can have a profound effect on people’s lives. Our data and cases show that debt problems are unusually interlinked, with 45 per cent of our debt clients also seeking help with an issue other than debt. We also know that debt’s knock-on effects are profound, affecting everything from mental health to relationship stability, and that debt problems are often preventable. Economists are only just starting to understand how debt also affects decision-making, attitudes and behaviours, something we are exploring ourselves in new work.
50

A key question raised by this overview is whether today’s regime of support for debt and money problems is adequate and how this support could more effectively help prevent and address problems related to unsecured personal debt. In the coming months we will be exploring these issues in more detail, looking at issues from the evolving demand for high cost credit, to the behaviour of the state as a creditor in cases of arrears, to the effect of debt on people’s behaviours, attitudes and life outcomes, reflecting on what this means for the way support is designed and provided.
51
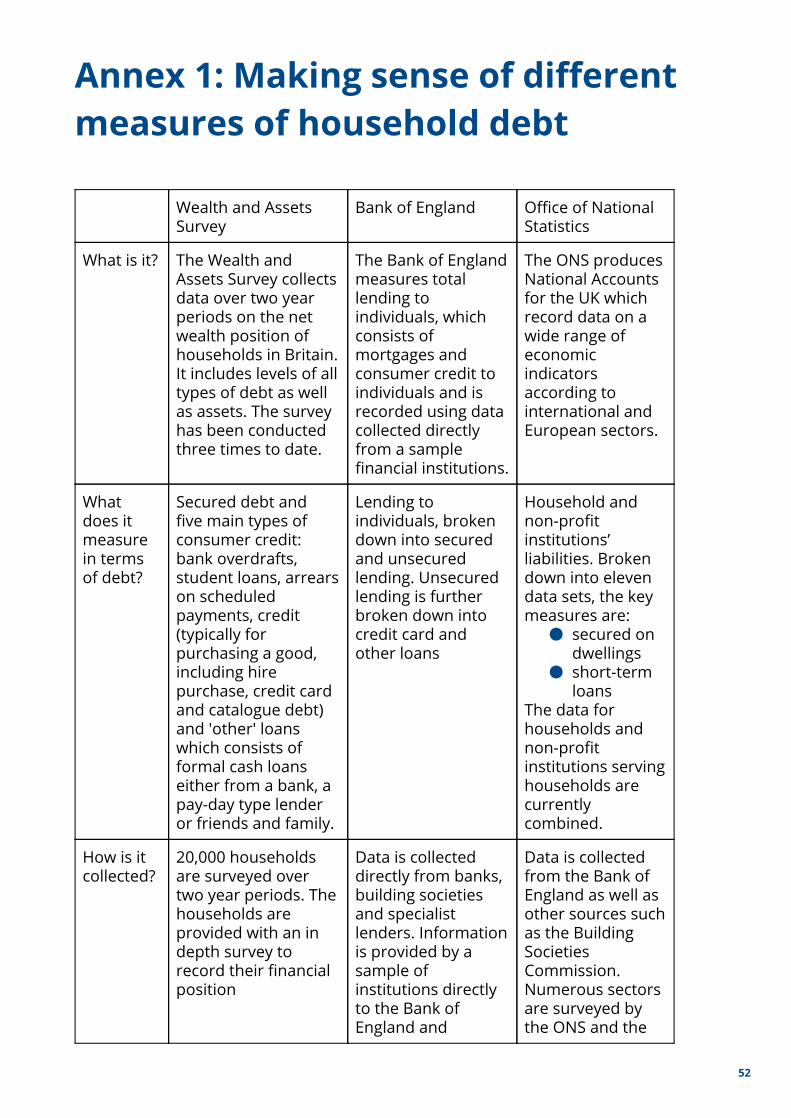
Annex 1: Making sense of different measures of household debt
Wealth and Assets Survey
Bank of England Office of National Statistics
What is it? The Wealth and Assets Survey collects data over two year periods on the net wealth position of households in Britain. It includes levels of all types of debt as well as assets. The survey has been conducted three times to date.
The Bank of England measures total lending to individuals, which consists of mortgages and consumer credit to individuals and is recorded using data collected directly from a sample financial institutions.
The ONS produces National Accounts for the UK which record data on a wide range of economic indicators according to international and European sectors.
What does it measure in terms of debt?
Secured debt and five main types of consumer credit: bank overdrafts, student loans, arrears on scheduled payments, credit (typically for purchasing a good, including hire purchase, credit card and catalogue debt) and 'other' loans which consists of formal cash loans either from a bank, a pay-day type lender or friends and family.
Lending to individuals, broken down into secured and unsecured lending. Unsecured lending is further broken down into credit card and other loans
Household and non-profit institutions’ liabilities. Broken down into eleven data sets, the key measures are:
● secured on dwellings
● short-term loans
The data for households and non-profit institutions serving households are currently combined.
How is it collected?
20,000 households are surveyed over two year periods. The households are provided with an in depth survey to record their financial position
Data is collected directly from banks, building societies and specialist lenders. Information is provided by a sample of institutions directly to the Bank of England and
Data is collected from the Bank of England as well as other sources such as the Building Societies Commission. Numerous sectors are surveyed by the ONS and the
52

combined with data from the ONS on non-bank lending. (Consumer Credit Grantors Survey)
final figures are modeled using historical and current data from a wide range of sources.
Total debt £ 1 trillion £1.43 trillion £1.68 trillion
Secured debt
£896 billion £1.26 trillion £1.26 trillion
Unsecured debt
£104 billion £170 billion £179 billion (short-term, include NPSH)
Key points Great Britain only Survey of households directly
UK data Data is provided directly by financial institutions
UK data Non-profit institutions serving households included Data provided by Bank of England but combined Household and NPSH
53