unsd questionnaire 2001 on environment...
TRANSCRIPT
UNSD Questionnaire 2001 on Environment Statistics Guidance Document
2
1. INTRODUCTION.............................................................................................................................. 3 2. WATER .............................................................................................................................................. 5
2.1 Introduction.................................................................................................................................... 5 2.2 Specific Table Notes on Water ...................................................................................................... 6
Table W1 Renewable Fresh Water Resources................................................................................. 6 Table W2 Water Use by Source....................................................................................................... 6 Table W3 Water Supply by Supply Categories and Activities........................................................ 6 Table W4 Waste Water Treatment .................................................................................................. 7 Table W5 Pollutant Discharges ....................................................................................................... 7 Table W6 Water Quality of Selected Rivers.................................................................................... 7 Table W7 Water Quality of Selected Lakes .................................................................................... 7 Table W8 Water Quality in Coastal Areas ...................................................................................... 8
2.3 Definitions for the Water Section .................................................................................................. 8 3. AIR .................................................................................................................................................... 12
3.1 Introduction.................................................................................................................................. 12 3.2 Source Specifications for Air Emissions ..................................................................................... 13 3.3 Specific Table Notes on Air......................................................................................................... 13
Table A1 Emissions of Sulphur Dioxide (SO2) ............................................................................. 13 Table A2 Emissions of Nitrogen Oxides (NOx) ............................................................................ 14 Table A3 Emissions of Non-Methane Volatile Organic Compounds (NM-VOCs) ...................... 14 Table A4 Emissions of Lead (Pb) .................................................................................................. 14 Table A5 Emissions of Carbon Dioxide (CO2).............................................................................. 14 Table A6 Emissions of Methane (CH4) ......................................................................................... 14 Table A7 Emissions of Nitrous Oxide (N2O) ................................................................................ 15 Table A8 Annual Mean Concentrations of Sulphur Dioxide (SO2) in Ambient Air ..................... 15 Table A9 Annual Mean Concentrations of Nitrogen Dioxide (NO2) in Ambient Air................... 15 Table A10 Annual Mean Concentrations of Suspended Particulate Matter (SPM10) in Ambient Air ................................................................................................................................................... 15
4. WASTE ............................................................................................................................................. 18 4.1 Introduction.................................................................................................................................. 18 4.2 Specific Table Notes on Waste .................................................................................................... 19
Table R1 Generation and Treatment of Waste .............................................................................. 19 Table R2 Waste Treatment Facilities............................................................................................. 19
4.3 Definitions for the Waste Section ................................................................................................ 19 5. LAND ................................................................................................................................................ 21
5.1 Introduction.................................................................................................................................. 21 5.2 Specific Table Notes on Land...................................................................................................... 21
Table L1 Land Use......................................................................................................................... 21 Table L2 Soil Erosion .................................................................................................................... 22 Table L3 Salinization..................................................................................................................... 22 Table L4 Desertification ................................................................................................................ 22
5.3 Definitions for the Land Section.................................................................................................. 23 6. TECHNICAL NOTES..................................................................................................................... 27
6.1 Questionnaire ............................................................................................................................... 27 6.2 Tables ........................................................................................................................................... 27 6.3 Supplementary Information Sheet ............................................................................................... 30
Annex I Conversion Matrices ............................................................................................................. 31

3
1. INTRODUCTION 1.1 The objective of the United Nations Statistics Division’s (UNSD) Questionnaire 2001 on Environment Statistics is to collect, in a uniform manner, the best available environmental data and statistics for international purposes. The UNSD Questionnaire focuses on selected fields of environment statistics that are not covered by other international data collection activities and addresses all countries except those who report environment statistics to the Organization for Economic Cooperation and Development (OECD) and the Statistical Office of the European Union (Eurostat). The data collection contributes to the development and regular update of the UNSD Environment Statistics Database, which will be used for the planned biennial UNSD Compendium of Environment Statistics and Indicators and will be made available to countries, United Nations specialized agencies and other regional and international institutions. 1.2 UNSD undertook the first international compilation of environment statistics in 1999. The current Questionnaire 2001 benefits from the experiences gained, comments and suggestions received from countries as well as from close cooperation with OECD and Eurostat. It also draws upon the methodological work of other international organizations and intergovernmental bodies1. 1.3 The Questionnaire 2001 addresses environment statistics related to four main areas:
• Water resources, use, pollution and quality • Air pollution and ambient air quality • Waste generation and treatment • Land use and land degradation
1.4 The present Guidance Document introduces each of the above-mentioned areas and briefly explains the relevance and significance of the variables selected for compilation. It assists in the completion of the tables with specific table notes and brings together the explanations of terms used throughout the Questionnaire. 1.5 Wherever possible, particular effort was made to ensure consistency with internationally adopted and/or recognized definitions and classifications. Countries are asked to provide data as consistent with the proposed definitions as possible. However, if countries cannot follow the definition or classification given in the Questionnaire, they are encouraged to provide the available statistics in the existing form and give detailed explanations in the table-specific footnotes or in the Supplementary Information Sheets. In this case, please refer to the Technical Notes in this Guidance Document for the procedure to follow. 1.6. The Questionnaire 2001 is available both as paper and electronic version. The tables have been pre-filled, when available, with the data provided by the countries in the UNSD Questionnaire 1999 on Environmental Indicators and with data from other international sources. If, in the meantime, data have been revised, countries are asked to revise and update their time series accordingly. 1.7 Respondents are kindly asked to provide any additional information that facilitates the analysis and interpretation of country data as footnotes in the space below each table or in the Supplementary Information Sheet at the end of each section. 1 Food and Agriculture Organization of the United Nations (FAO), Intergovernmental Panel for Climate Change (IPCC), World Conservation Union (IUCN), United Nations Convention to Combat Desertification (UNCCD), United Nations Environment Programme (UNEP), United Nations Framework Convention for Climate Change (UNFCCC) and the World Health Organization (WHO).

4
1.8 Given the multidisciplinary nature of environment statistics, data are often collected and provided by many different institutions in a country. Therefore, the National Focal Point for the Questionnaire 2001 on Environment Statistics, usually the National Statistical Office, needs to contact the respective institutions and compile national data from different sources. UNSD would like to facilitate this process and is therefore sending a copy of the Questionnaire to the Ministry of Environment or the appropriate national institution for their information. 1.9 We kindly ask you to return the completed Questionnaire to UNSD before 30 November 2001. As environment statistics is a relatively new field of statistics in many countries, questionnaires that are only partially completed will also be highly appreciated. For further inquiries, please contact us: E-mail: [email protected] Fax: (212) 963 0623 Phone: Maila Puolamaa (212) 963-4571, Reena Shah (212) 963-4586, Tanja Srebotnjak (212) 963-8564 We thank you very much for completing the UNSD Questionnaire 2001 on Environment Statistics. United Nations Statistics Division Environment Statistics Section
5
2. WATER 2.1 Introduction 2.1 The section deals with the core information for water resource management in a country. This relates to the availability of water resources and their use for human activities as well as water pollution as a potential consequence of these activities. Shortcomings in water supply may severely impair the agricultural and industrial production and affect human consumption of water in a country. Waste water treatment fulfills an important task in attenuating excessive seasonal or annual loadings of the aquatic environment. Water pollution due to excess loading with biological matter, nutrients or toxic compounds may hinder water abstractions from water bodies and affect conditions of species and ecosystems in a country. 2.2 Water use in countries is dominated by the use of fresh surface and ground water. However, desalinization of sea or brackish water may alleviate the scarcity of water in some areas of the world. Usually, the main water users are agriculture, energy production, industry and households. The volume of water used in agriculture is dependent on the climatic conditions as well as cultivation and breeding practices applied in the country. Respectively, the magnitude of industrial water consumption varies according to the structure of industrial production. 2.3 Human activities are the main cause for excess loading of water bodies with nutrients, organic matter, toxins and other pollutants. Nevertheless, the overall pollution of water bodies is dependent on the waste water treatment capacities in the country. Physical treatment facilitates the sedimentation of the coarsest particles, while biological treatment enables the decomposition of biological matter contained in wastewater. Advanced treatment enables the removal of water-soluble nutrients and heavy metals. 2.4 Various methods exist for the monitoring of water resources and pollutant discharges. Depending on national practices, data compilation may take place at on-site monitoring stations as well as through statistical modeling. Excessive pollution loadings can be estimated according to internationally developed loading factors (e.g. those of the World Bank in Decision Support System for Industrial Pollution (DSS-IPC), World Bank, WHO, PAHO, 1997) that are compiled for the calculation of the magnitudes of pollutant loadings in the countries or on the basis of regular measurements of pollution of water bodies. The follow-up of the water quality in water bodies is usually the result of national or international monitoring programmes. 2.5 The monitoring of water resources and their abstraction for human activities, waste water treatment, water quality in rivers, lakes and coastal areas may take place in different institutions in a country. Generally, the Hydrological Institute is responsible for the collection of data on water resources (precipitation, evapotranspiration, surface and ground waters), while data on water use and treatment very often come from surveys of industrial establishments, waterworks and waste water treatment plants. These surveys may be conducted by the Central Statistical Office or other institutions such as the National Board of Waters and the Environment or the Ministry of Environment and Natural Resources that are usually also responsible for monitoring water quality of rivers, lakes and coastal areas.
6
2.6 The following specific table notes explain in detail the scope and objectives of the information requested. However, due to the complex nature of water-related environmental issues, it is highly appreciated if countries can provide additional information, which could be helpful for the analysis and interpretation of the data. This information can be added as footnotes in the space below each table or in the Supplementary Information Sheet at the end of the Water Section of the Questionnaire. 2.2 Specific Table Notes on Water Table W1 Renewable Fresh Water Resources 2.7 The table aims at taking stock of renewable fresh water resources available on the national territory, and their inflows and outflows. The concept of renewable resources excludes by definition the non-renewable resources, i.e. water reserves (essentially ground water), fossil waters and the non-renewable portions of ground water and lakes. In order to avoid double counting when computing regional and other aggregates, a breakdown of inflows and outflows from and to neighbouring countries has been included. If the space provided for this breakdown is not sufficient, countries are asked to include additional data in the Supplementary Information Sheet. Underground flows of surface water are included under Inflow and Outflow and should also be given in the Supplementary Information Sheet. 2.8 Please specify the reference period for each type of flow and the calculation method for the long-term annual average in the Supplementary Information Sheet for the Water Section. Table W2 Water Use by Source 2.9 The table asks for information on the abstraction of fresh surface water, ground water and other water (including marine and brackish water) as well as imports and exports of water as a commodity through pipelines and/or by ship. 2.10 Water returns are usually not measured but estimated. For instance, 95 per cent of the water used in households is returned, while the respective share for water used in industrial production is estimated to lie around 85 per cent and for energy production around 99 per cent. Depending on climatic conditions, economic structure, applied technology etc., these shares may differ between countries. 2.11 If data on water abstraction by selected activity categories according to the International Standard Industrial Classification of All Economic Activities (ISIC/Rev.3) are available, please provide them in the Supplementary Information Sheet. Table W3 Water Supply by Supply Categories and Activities 2.12 The table asks for information on the total quantity of water supplied according to supply category (public, self and other), economic activities (classified according to ISIC/Rev.3), and households. The table allows for the analysis and identification of the main water users. If the country follows a different classification, please provide the available information, together with a reference to the classification used, in the Supplementary Information Sheet.
7
Table W4 Waste Water Treatment 2.13 The table asks for information on the total amount of waste water generated and the amount of waste water that undergoes treatment by type and ownership of the treatment facility. Tables 4 and 5 facilitate a joint analysis of the level of waste water management in the country and the pressure exerted on the environment. Table W5 Pollutant Discharges 2.14 The table asks for information on the total amount of pollutants discharged to inland water bodies or directly into the sea. Together with Table W4, this table allows for an evaluation of the level of waste water management and pressures on the aquatic environment. Additional data on other water quality parameters should, if available, be given in the allocated space in the table. Table W6 Water Quality of Selected Rivers 2.15 Table W6 asks for information on the water quality of the two most polluted rivers in the country. The core variables address quality concerns related to oxygen regime (BOD5, COD, DO, TSP), eutrophication (total phosphorus and nitrogen) and toxic dispersion of heavy metals (lead, cadmium, mercury). The background data on the rivers provide core characteristics on the size and length of the river as well as the location of the measuring station with respect to the mouth or downstream frontier of the river. 2.16 The selection of the two most polluted rivers should be based on an evaluation of the national economic, demographic and geographic importance of the rivers as well as the statistical quality and quantity of the information available for them. 2.17 If information is available for rivers and/or stations other than those reported in the Questionnaire 1999, please copy the blank table for each measuring station and name the station and river it refers to. In case the country does not have rivers, please indicate this in the footnotes and report, if possible, on other significant water bodies such as streams, brooks etc. Table W7 Water Quality of Selected Lakes 2.18 Table W7 asks for information on the water quality of the two most polluted lakes in the country. The core variables address quality concerns related to oxygen regime (BOD5, COD, TSP), eutrophication (chlorophyll-a, total phosphorus and nitrogen) and toxic dispersion of heavy metals (lead, cadmium, mercury). The background data provide those core characteristics of the lake, which may also greatly affect its natural capacity to assimilate the various pollutants originating from human activities. 2.19 The selection of the two most polluted lakes should be based on the evaluation of the national economic, demographic and geographic importance of the lakes as well as the statistical quality and quantity of the information available for them. 2.20 If information is available on lakes and/or measuring stations other than those reported in the Questionnaire 1999, please copy the blank table for each measuring station and name the station and lake it refers to. Respectively, if the country does not have lakes, please indicate this in the footnotes and report, if possible, on other significant water bodies such as ponds, lagoons, reservoirs etc.
8
Table W8 Water Quality in Coastal Areas 2.21 Table W8 asks for information on the water quality of the two most polluted coastal areas in the country. The core variables address quality concerns related to oxygen regime (BOD5, COD, TSP), eutrophication (chlorophyll-a, total phosphorus and nitrogen) and toxic dispersion of heavy metals (lead, cadmium, mercury). Background data on the coastal area provide information on those general characteristics that may affect the area’s natural capacity to assimilate the various pollutants originating from human activities. 2.22 The selection of an estuary should be based on the evaluation of the national economic, demographic and geographic importance of the area as well as the statistical quality and quantity of the information available for the estuary. 2.3 Definitions for the Water Section Advanced treatment: Process capable of reducing specific constituents in waste water not normally achieved by other treatment options. For the purpose of this questionnaire, advanced treatment technology covers all unit operations, which are not considered to be mechanical or biological. In waste water treatment this includes e.g. chemical coagulation, flocculation and precipitation, break-point chlorination, stripping, mixed media filtration, micro-screening, selective ion exchange, activated carbon adsorption, reverse osmosis, ultra-filtration, electro-flotation. Advanced treatment processes are also used in combination and/or in conjunction with mechanical and biological unit operations. Biochemical oxygen demand (BOD5): Amount of dissolved oxygen required by organisms for the aerobic decomposition of organic matter present in water. This is measured at 20 degrees Celsius for a period of five days. The parameter yields information on the degree of water pollution with organic matter. Biological treatment: Process, which employs aerobic or anaerobic micro-organisms and results in decanted effluents and separated sludge containing microbial mass together with pollutants. Biological treatment processes are also used in combination and/or in conjunction with mechanical and advanced unit operations. Cadmium (Cd): Sum of organic and inorganic cadmium compounds measured as cadmium. Cadmium is a heavy metal that is toxic to humans and animals if inhaled or swallowed. Chemical oxygen demand (COD): Index of water pollution measuring the mass concentration of oxygen consumed by the chemical breakdown of organic and inorganic matter. For waste water this is a measure of potassium dichromate (K2Cr2O7) consumed, while for natural water bodies it is measured in potassium permanganate (KMnO4) consumed, both calculated in terms of oxygen equivalent. Chlorophyll-a (Chl-a): Chlorophyll is the green compound found in leaves and green stems of plants that consists of two components, chlorophyll a and b in the ratio of 3 to 1. Chlorophyll-a is an indicator for the degree of eutrophication of water bodies. Dependable surface water resources: Portion of the surface water resource that can be depended on for annual water development over the long-term, usually 19 out of 20 consecutive years.
9
Distance to mouth or downstream frontier: Distance between measuring station and mouth or downstream frontier of the river. Evapotranspiration: Total volume of annual evaporation from soil, water and plant surfaces and transpiration of plants and animals. Exports of water: Total volume of pure water that is exported as a commodity by pipelines or ships. Faecal Coliform: Micro-organisms found in the intestinal tract of human beings and animals. Their presence in water indicates faecal pollution rendering water unsuitable for drinking without prior treatment. Fossil ground water: Water infiltrated into an aquifer during an ancient geological period under climatic and morphological conditions different from the present and stored since that time. Fresh ground water: Water, which is being held in, and can usually be recovered from, or via, an underground formation. Includes all permanent and temporary deposits of water, both artificially and naturally charged, in sufficient quantity for at least seasonal use. This category includes phreatic water-bearing strata as well as deep strata under pressure or not, contained in porous or fractured soils. Fresh surface water: Water which flows over, or rests on the surface of a land mass, natural watercourses such as rivers, streams, brooks, lakes, etc., as well as artificial watercourses such as irrigation, industrial and navigation canals, drainage systems and artificial reservoirs. This includes water in transit from precipitation via the ground to a surface watercourse or other water body. Imports of water: Total volume of pure water that is imported as a commodity by pipelines or ships. Independent treatment facilities: Individual private treatment facilities to treat domestic and other waste water in cases where a public waste water network is not available or not justified either because it would produce no environmental benefit or it would involve excessive cost. Examples of such systems are treatment in septic tanks. Inflow: Total volume of annual inflow of surface and ground water from a neighbouring country or countries. Lead (Pb): Lead is a heavy metal whose inorganic and organic compounds are poisonous to animals and human health. Lead is used in gasoline, metal industry, metal products etc., and contributes to the dispersion of toxins to the environment. Long-term annual average: Average for the last 30 consecutive years. Mechanical treatment: Process of a physical and mechanical nature, which results in decanted effluents and separate sludge. Mechanical processes are also used in combination and/or in conjunction with biological and advanced unit operations. Mechanical treatment is understood to include at least such processes as sedimentation, flotation, etc. Mercury (Hg): Sum of organic and inorganic mercury compounds measured in terms of mercury. Mercury is a heavy metal that is toxic to humans and animals if inhaled or swallowed. In addition, mercury accumulates in the food chain.

10
Other supply: Any supply of water not specified elsewhere. In particular, supplies from commercial and industrial establishments, whether marketed or not. Also included is supply of reusable water. Other surface water resources: Includes abstraction from direct atmospheric precipitation, seawater, from permanent bodies of stagnant water (natural and artificial), mine water, drainage water (reclamations), and transitional water, such as brackish swamps, lagoons and estuarine areas. Other waste water treatment: Treatment of waste water in private treatment plants, i.e. industrial waste water plants. Excluded from Other waste water treatment is treatment in facilities covered under independent treatment facilities such as septic tanks. Outflow: Total volume of annual outflow of surface and ground water to a neighbouring country or countries or into the sea. Precipitation: Total volume of annual atmospheric wet precipitation (rain, snow, hail, dew etc.) on the national territory. Public supply: Water supply by public waterworks. Deliveries of water from one waterworks to another are excluded. Public waste water treatment: All treatment of waste water in municipal treatment plants by official authorities, or by private companies for local authorities, whose main purpose is waste water treatment. Renewable ground water available for annual abstraction: Estimate of the volume of water that can be abstracted annually from the national ground water resources under prevailing economic and technical conditions, without leading to the depletion of the resource base in the long-term. Residence time: The time interval that a portion of water is in a lake. Sampling frequency: Minimum and maximum number of samples taken per calendar year. Self-supply: Abstraction of water for own final use. Stratification: The arrangement of a body of a lake into two or more horizontal layers of differing characteristics, such as temperature, density, etc. The main types refer to dimictic (two annual overturns in a water body) and meromictic (water remains partly or wholly unmixed with the main water mass). Total dissolved solids (TDS): Total weight of dissolved mineral constituents in water. Excessive amounts make water unsuitable for drinking or for use in industrial processes. Total nitrogen: Sum of inorganic and organic nitrogen compounds (excluding N2) in water measured in terms of nitrogen. Excess amounts of nitrogen, together with phosphorus, contribute to the eutrophication of water bodies. Total phosphorus: Sum of inorganic and organic phosphorus compounds in water measured in terms of phosphorus. Phosphorus is an element that, while being essential to life as a key limiting nutrient factor, nevertheless contributes, together with nitrogen, to the eutrophication of water bodies.

11
Total renewable fresh water resources: = precipitation (1) + inflow (3) - evapotranspiration (2) - outflow (4). Please note that the outflows refer to the total allocated amounts possibly regulated by bi-lateral or multi-lateral agreement(s) on shared waters. If there are no agreements on outflows, total renewable fresh water resources = precipitation (1) + inflow (3) - evapotranspiration (2). Total return flows: Total volume of water returned to the environment during a specified time period. Total suspended solids (TSS): Small particles of solid pollutants in waste water that contribute to turbidity and resist separation by conventional means. Total water abstraction: Water removed from any source, either permanently or temporarily, during a specified period of time. Mine water and drainage water are included. Water abstraction from groundwater resources in any given time period are defined as the difference between the total amount of water withdrawn from aquifers and the total amount charged artificially or injected into aquifers. The amounts of water artificially charged or injected are attributed to abstractions from that water resource from which they were originally withdrawn. Total water consumption: The part of water intake that is evaporated, incorporated into products or crops, consumed by humans and livestock or otherwise removed from the hydrological cycle. It can be calculated as: consumption = total abstractions + imports - exports - total returns. Treatment plant: Installation to render waste water, sludge or storm water fit to meet applicable environmental standards or other quality norms for recycling or reuse. Water loss during transport: Volume of water lost during transport between a point of abstraction and a point of use, and between points of use and reuse. Water supply: Delivery of water to users and abstraction for own final use. Total water supply excludes water used in hydropower generation. Waste water: Water which is of no further immediate value to the purpose for which it was used or in the pursuit of which it was produced because of its quality, quantity or time of occurrence. However, waste water from one user can be a potential supply to a user elsewhere. Returned cooling water is not considered to be waste water for the purpose of this questionnaire. Waste water treatment: Process to render waste water fit to meet applicable environmental standards or other quality norms for recycling or reuse. Three broad types of treatment are distinguished in the questionnaire: mechanical, biological and advanced. For the purpose of calculating the total amount of treated waste water, volumes reported should be shown only under the highest type of treatment to which it was subjected. Thus, waste water treated mechanically as well as biologically should be shown under biological treatment, and waste water treated in accordance with all three types should be reported under advanced treatment. Waste water treatment does not include the collection of waste water or storm water, even when no treatment will be possible without collection. Water use: Water that is used for a specific purpose such as for domestic use, irrigation, or industrial processing. Water use pertains to human's interaction with and influence on the hydrologic cycle, and includes elements, such as water abstraction from surface and ground water sources, water delivery to homes and businesses, consumptive use of water, water released from waste water treatment plants and water returned to the environment. For the purposes of this questionnaire, water use for hydropower generation is excluded.
12
3. AIR 3.1 Introduction 3.1 The section deals with air pollution and ambient air quality in a country. Emissions of air pollutants affect local air quality directly and contribute to regional and global environmental problems, such as acidification, eutrophication and climate change. Excess of nuisance substances in the air affects both human health and the state of environment. Air pollution also increases chemical weathering of buildings and infrastructure causing economic losses and subsequent dissipative releases of pollutants, e.g. heavy metals. Due to the transboundary movement of air pollutants, emissions from one country may also affect the state of the environment and human health in other countries. 3.2 Air emissions predominantly arise from the combustion of fossil fuels, mainly from transport activities, power plants, refineries and other kinds of fuel combustion activities. These activities generate a large variety of air pollutants of which carbon dioxide (CO2), sulphur dioxide (SO2), nitrogen oxides (NOx) and non-methane volatile organic compounds (NM-VOCs) are among the most significant ones. Industrial processes and agriculture also contribute to the emissions of the above-mentioned pollutants as well as to emissions of other greenhouse gases such as nitrous oxide (N2O) and methane (CH4). Transport and the metal industry are the main sources of lead (Pb) emissions. Transport and energy production facilities are furthermore the main factors affecting ambient air quality in cities. 3.3 Air emissions data are usually estimated according to international methodologies on the basis of national statistics on energy balances, industrial and agricultural production, waste management and land use, etc. The most important international methodologies for air emission estimations are the revised 1996 Guidelines of the Intergovernmental Panel for Climate Change (IPCC) (see http://www.ipcc-nggip.iges.or.jp/public/gl/invs4.htm), and the UNECE/EMEP/Corinair Guidebook (see http://reports.eea.eu.int/EMEPCORINAIR/en ). The source categories in the Questionnaire and their definitions are aggregated versions of the IPCC source categories. 3.4 Ambient air quality is monitored by regular national or international air quality monitoring programmes in the countries. Due to the diversity of national conditions and the scope of these programmes, the spatial and temporal coverage of the data collected may vary greatly between and within countries. For the purposes of this Questionnaire, only the core pollutants such as sulphur dioxide, nitrogen oxides and suspended particulate matter smaller than 10 µm (SPM10) were selected for the description of ambient air quality at industrial, residential and background stations. 3.5 Data production on air emissions and ambient air quality may take place in several institutions in a country. The estimation of air emissions may take place in the National Statistical Office, but often it is done by other specialized institutions such as the Environmental Protection Agency, the Meteorological Institute, the Ministry of Environment and Natural Resources or in other ministries responsible for specific sectors such as the Ministries of Trade and Industry, Agriculture or Transport. Monitoring of the ambient air quality is usually a responsibility of the Meteorological Institute or the Environmental Protection Agency.
13
3.6 The tables have been pre-filled with data from the UNSD Questionnaire 1999 and from the United Nations Framework Convention for Climate Change (UNFCCC). Please note that countries that regularly report their data on emissions of CO2, CH4, N2O, SO2, NOx and NM-VOCs to UNFCCC, are not supposed to send the respective data to UNSD, as they will be available directly from UNFCCC. 3.7 The following text on source specifications and specific table notes explains in detail the scope and objectives of the information requested. Due to the varying national priorities in the field of emission estimations and air quality monitoring, it is highly appreciated if the country can provide additional information on estimation methods used, monitoring programmes etc. that could be helpful for the analysis of air pollution data. This information can be added as footnotes in the space below each table or in the Supplementary Information Sheet at the end of the Air Section of the Questionnaire. 3.2 Source Specifications for Air Emissions 3.8 The source specifications of the Revised IPCC Guidelines 1996 on National Greenhouse Gas Inventories (see http://www.ipcc-nggip.iges.or.jp/public/gl/guidelin/ch1ri.pdf ) have been used for defining the aggregated source categories in this Questionnaire. The IPCC Guidelines provide a globally coherent source for the estimation methodologies for a large variety of pollutants contributing to climate change (CO2, CH4 and N2O) as well as to acidification (SO2 and NOx), eutrophication (NOx) and ground level ozone formation (NM-VOCs and NOx). The existing conversion system between the IPCC and Corinair source categories (see http://www.ipcc-nggip.iges.or.jp/public/gl/guidelin/annex2ri.pdf ) makes the use of the IPCC based source definitions possible also for Pb emissions. 3.9 The main source categories refer to Energy, Industrial processes, Solvent use, Agriculture and Other sources. The Energy category that covers both production and use of energy is further divided into Transport, Energy industries, Industrial fuel combustion (in manufacturing and construction) and Other fuel combustion. The Energy industries category refers to the same sectors as used in the national energy balances. For Transport and Energy industries, fugitive emissions of fuels are included in the respective source categories. 3.10 Other source categories refer to emissions from a large variety of processes, either in industries, agriculture, and services or in households. Industrial processes cover all but solvent based processes such as painting, degreasing, dry cleaning etc. that are covered under Solvent use and that are the main source for emissions of NM-VOCs. Agriculture, on the other hand, refers to the main agricultural processes except agricultural fuel combustion, which is included under Energy/Other fuel combustion. The last source category, Other sources, refers to activities such as waste and waste water management, land use changes, forestry and other activities. 3.3 Specific Table Notes on Air Table A1 Emissions of Sulphur Dioxide (SO2) 3.11 The table asks for estimates of annual emissions of SO2 by source. SO2 together with NOx and ammonia are the main contributors to acidification. Emission estimates are usually based on statistics on energy, industry and transport as well as technical data on fuel characteristics and pollution control equipment in use. Both the revised IPCC Guidelines 1996 and the UNECE/Corinair Guidebook provide methods for estimating SO2 emissions.

14
Table A2 Emissions of Nitrogen Oxides (NOx) 3.12 The table asks for estimates of annual emissions of NOx by source. NOx contribute to acidification, eutrophication, the formation of ground level ozone and, indirectly, to climate change. Emission estimates are usually based on statistics on energy, industry, transport, and fertilizer use as well as technical data on fuel characteristics, combustion processes and pollution control equipment in use. Both the revised IPCC Guidelines 1996 and the UNECE/Corinair Guidebook provide methods for estimating emissions of NOx. Table A3 Emissions of Non-Methane Volatile Organic Compounds (NM-VOCs) 3.13 The table asks for estimates of annual emissions of NM-VOCs by source. NM-VOCs together with NOx are the main contributors to the formation of ground level ozone. Emission estimates are usually based on statistics on energy, transport as well as statistics on trade and production in industries using solvents and solvent based products. Both the revised IPCC Guidelines 1996 and the UNECE/Corinair Guidebook provide methods for estimating emissions of NM-VOCs. Table A4 Emissions of Lead (Pb) 3.14 The table asks for estimates of the annual emissions of Pb by source. Pb is one of the most important heavy metals contributing to the dispersion of toxins. Emission estimates are usually based on data of Pb content in fuels, mainly in gasoline, and statistics on the fuel consumption as well as statistics on production in metal industry. The UNECE/Corinair Guidebook provides methods for estimating Pb emissions and the conversion from UNECE/Corinair source categories to the IPCC ones. Table A5 Emissions of Carbon Dioxide (CO2) 3.15 The table asks for estimates of the annual emissions of CO2 by source. CO2, CH4, and N2O are major contributors to climate change. Emission estimates are usually based on statistics on energy, industry (in particular the cement industry), transport, agriculture and other sources as well as technical data on fuel characteristics. Both the revised IPCC Guidelines 1996 and the UNECE/Corinair Guidebook provide methods for estimating CO2 emissions. Table A6 Emissions of Methane (CH4) 3.16 The table asks for estimates of the annual emissions of CH4 by source. CH4 contributes to climate change and the formation of ground level ozone. Emission estimates are usually based on statistics on livestock breeding, rice cultivation, energy (e.g. coal mining, natural gas extraction), waste and waste water management. Both the revised IPCC Guidelines 1996 and the UNECE/Corinair Guidebook provide methods for estimating CH4 emissions.
15
Table A7 Emissions of Nitrous Oxide (N2O) 3.17 The table asks for estimates of the annual emissions of N2O by source. N2O contributes to climate change. Emission estimates are usually based on statistics on industrial production, transport, and fertilizer use as well as data on the use of catalysts in vehicles etc. Both the revised IPCC Guidelines 1996 and the UNECE/Corinair Guidebook provide methods for estimating N2O emissions. Table A8 Annual Mean Concentrations of Sulphur Dioxide (SO2) in Ambient Air 3.18 The table investigates air quality trends in terms of SO2 at urban, industrial and background stations. According to this classification, measuring stations located in the largest city, in an industrial city where the population is exposed to the highest levels of air pollutants, and in an area remote from industrial activities and high population densities, should be selected for reporting. The recommended annual data completeness criteria for each site would be to collect at least 50 per cent of its scheduled number of annual observations. For example, if the monitor is a 24-hour bubbler with a scheduled sampling once every six days or 60 observations per year, then the minimum number of samples for the annual data completeness criteria would be to collect at least 30 observations per year. 3.19 Please specify the method of air quality monitoring in the table column titled Analytical Method and provide information on the frequency of sampling and the number of observations in the Supplementary Information Sheet. Table A9 Annual Mean Concentrations of Nitrogen Dioxide (NO2) in Ambient Air 3.20 The table investigates air quality trends in terms of NO2 at urban, industrial and background stations. According to this classification, the measuring stations should be located in the largest city, an industrial city where the population is exposed to the highest levels of air pollutants and an area remote from industrial activities and high population densities, respectively. The recommended annual data completeness criteria for each site would be to collect at least 50 per cent of its scheduled number of annual observations. 3.21 Please specify the method of air quality monitoring in the table column titled Analytical Method and provide information on the frequency of sampling and the number of observations in the Supplementary Information Sheet. Table A10 Annual Mean Concentrations of Suspended Particulate Matter (SPM10) in Ambient Air 3.22 The table investigates air quality trends in terms of SPM10 that is particulate matter smaller than 10 µm in diameter, at urban, industrial and background stations. According to this classification, the measuring stations should be located in the largest city, an industrial city where the population is exposed to the highest levels of air pollutants and an area remote from industrial activities and high population densities, respectively. The recommended annual data completeness criteria would be for the site to collect at least 50 per cent of its scheduled number of annual observations. 3.23 Please specify the method of air quality monitoring in the table column titled Analytical Method and provide information on the frequency of sampling and the number of observations in the Supplementary Information Sheet on Air. If Total Suspended Particulates (TSP), including particle

16
sizes between 0-50 µm, is monitored instead of SPM10, please provide the corresponding data and indicate it in the footnotes. 3.4 Definitions for the Air Section Annual mean concentration: Arithmetic mean over all valid measurements for the respective year. Background site: A monitoring station remote from any industrial and densely populated area. Carbon dioxide (CO2): Carbon dioxide is a colourless, odourless and non-poisonous gas, present in the atmosphere or formed by the burning of fossil fuels and in industrial processes. Carbon dioxide is considered to be the main contributor to climate change. Emission sources: The classification of emission sources used in this questionnaire is based on the Revised 1996 IPCC Guidelines for National Greenhouse Gas Inventories. Emissions sources - Agriculture: Emissions from the breeding of livestock, rice cultivation, field burning of agricultural residues, prescribed burning of savannas and other agricultural activities. Emission sources - Energy: Emissions from production and use of energy including fuel combustion as well as fugitive emissions. Emission sources - Energy industries: Emissions from fuel combustion in public electricity and heat production, in petroleum refining, manufacturing of solid fuels and other energy industries. For the purposes of this questionnaire, fugitive emissions from fuels (coal mining, oil and gas fields, venting and flaring etc.) are also allocated to this category. Evaporative emissions from vehicles are included under Transport. Emission sources - Industrial fuel combustion: Emissions from fuel combustion in manufacturing industries (except coke ovens that are allocated under Energy industries) and construction. Emission sources - Industrial processes: Emissions from processes such as chemical industry, metal industry, production and use of mineral products and other industries. Emission sources - Other fuel combustion: Emissions from fuel combustion in commercial, institutional and residential buildings, agriculture, forestry, fishing and other non-specified fuel combustion (e.g. military). The fishing sector includes domestic inland, coastal and deep-sea fishing. Emission sources – Other sources: Emissions from waste water treatment, waste disposal on land, waste incineration, land-use changes, forestry and other activities. Emission sources - Solvent use: Emissions from paint application, degreasing and dry cleaning, manufacturing and processing of chemical products, and other processes using solvents and other solvent based products. Emission sources - Transport: Emissions from fuel combustion in transport activities such as domestic air transport, road transport, railways, navigation and other transport. Evaporative emissions from vehicles are also included in this category. Emissions from international aviation and marine transport are excluded.
17
Industrial city: Industrial city in which a significant number of inhabitants are exposed to the highest level of pollution. Largest city: City of largest population. Lead (Pb): Lead is a heavy metal whose inorganic and organic compounds are poisonous to animals and human health. Lead is used in gasoline, metal industry, metal products etc. and contributes to the dispersion of toxins to the environment. Methane (CH4): Methane is a pungent, colourless, flammable, and non-poisonous gas, that is produced in anaerobic (without air) decomposition of organic material, e.g. in waste water treatment, landfills, livestock breeding, rice cultivation. Methane is an important contributor to climate change as its global warming potential is 21 times higher than that of carbon dioxide. Nitrogen oxides (NOx): Nitrogen oxides are irritating gases produced in the combustion of fossil fuels in transport, power plants as well as in industrial processes etc. NOx contribute to acidification, eutrophication and the formation of ground level ozone. NOx is the sum of nitric oxide, nitrogen dioxide and other oxides of nitrogen, calculated as nitrogen dioxide. Nitrous oxide (N2O): Nitrous oxide is a colourless gas with a slightly sweet odour produced in fuel combustion, soil cultivation, in the use of nitrogen fertilizers, microbial processes in the soil etc. It is an important contributor to climate change as its global warming potential is 310 times higher than that of carbon dioxide. Non-methane volatile organic compounds (NM-VOCs): A group of solvent-like organic compounds that easily evaporate at normal temperatures. They are produced mainly in fuel combustion and in processes that use solvents or solvent-based products such as painting, metal degreasing etc. Several of these chemicals are harmful to human health if inhaled, ingested, and drunk or get in contact with skin. NM-VOCs are significant precursors to ground level ozone formation. NM-VOCs are the sum of all hydrocarbon air pollutants except methane. Sulphur dioxide (SO2): Sulphur dioxide is a heavy, pungent, colourless gas formed primarily during the combustion of fossil fuels and in industrial processes. It is harmful to human beings and vegetation, and contributes to acidification. The data may refer to different forms of sulphur oxides calculated as sulphur dioxide. Suspended Particulate Matter (smaller than 10 µµµµm) (SPM10): Solid particles or liquid droplets suspended or carried in the air. The particulate matter smaller than 10 micrometres in diameter can penetrate to the upper part of lungs impairing their functioning. In addition, particulates cause soiling of the environment. Total emissions: Emissions from human activities in the country. Emissions from international aviation and maritime transport are excluded.

18
4. WASTE 4.1 Introduction 4.1 The generation of waste accompanies any kind of production and consumption. The amount of waste generated is an indication of resource efficiency and also of the pressure exerted on the environment by using it as a sink to absorb waste and the related pollution. Waste disposal facilities use a lot of space, and inappropriate waste management causes releases of pollutants contributing directly or indirectly to various environmental problems. Imports and exports of waste contribute to environmental pollution in recipient countries. Therefore, reducing the volume of waste generated in the different production and consumption processes, increasing the share of recycled, reused and recovered waste materials and the environmentally sound management of waste that has to be disposed of to the environment are key concerns of the sustainable management of natural resources and the environment. 4.2 Waste statistics can be obtained from different points in the waste management system. The quantity and quality of data on waste depends very much on the countries’ waste regulations. Data on waste generation and management are usually compiled through a) surveys to economic operators and municipalities, b) permit compliancy reporting and c) estimations based on specific human activities. National practices may differ considerably regarding the institutions and bodies involved. Municipalities and private enterprises acting on behalf of municipalities usually compile data on municipal waste collection, while, depending on national practices and legislation, waste treatment facilities and industrial establishments may be obliged to report to authorities on waste generation and treatment. The national data compilation on waste may take place in the National Statistical Office, the Environment Protection Agency, the Ministry of the Environment and Natural Resources and/or research institutions. 4.3 The most developed areas of national waste statistics usually cover hazardous wastes, where most countries have to comply with national and international regulations; municipal wastes, where the sources of data are usually the municipalities or the enterprises acting on their behalf, and certain types of industrial wastes, where industrial establishments report on their waste generation. The Questionnaire therefore focuses on the generation of these categories of wastes and on the availability of waste treatment services and facilities in the country. 4.4 A separate sheet for supplementary information is provided at the end of the Waste Section of the Questionnaire. It has been designed to collect additional information, quantitative and/or qualitative in nature that may be available on issues relevant to the environment with respect to Waste such as waste definitions, information on the imports and exports of hazardous waste, and the number and capacities of treatment facilities for hazardous waste etc. Please use this sheet to provide the relevant information or comments.

19
4.2 Specific Table Notes on Waste Table R1 Generation and Treatment of Waste 4.5 The table asks for information on the generation and management of core waste categories and total waste generated in the country. In this questionnaire, waste is defined as substances or objects, which are disposed of or are intended to be disposed of or are required to be disposed of by the provisions of national law. Countries are asked to provide the national definition of waste and various waste categories in the Supplementary Information Sheet. 4.6 Due to practical constraints present in many countries, only the most common waste categories and the most common types of waste management are specified in the table. Please note that the waste categories specified in the table do not cover all types of wastes, therefore their sum does not equal to the total amount of waste generated in the country. As countries may use different definitions of waste as well as different methods for the compilation of data on waste, it is likely that the data on the core categories overlap with each other. If this is the case, please provide the data available and explain the methodologies applied, possible overlaps between waste categories, etc., in the Supplementary Information Sheet. Should more disaggregated data be available for certain waste categories or waste flows, please also provide them in the Supplementary Information Sheet. Table R2 Waste Treatment Facilities 4.7 The table focuses on the waste treatment facilities in place in the country and the share of the total, urban and rural population that is served by waste management services. The treatment facilities are specified according to recycling/reuse/recovery, incineration, landfills and other treatment facilities, which allows drawing conclusions on national waste treatment practices. If more detailed data are available, e.g. on the size and capacity of the waste treatment facilities, countries are invited to provide them in the Supplementary Information Sheet. 4.3 Definitions for the Waste Section Hazardous waste: Wastes which due to their toxic, poisonous, explosive, corrosive, flammable, radioactive, eco-toxic and infectious character, pose a substantial, actual, or potential hazard to human health and/or the environment. For the purposes of this questionnaire, "hazardous wastes" comprise all those materials and products, which are considered to be hazardous in accordance with practices in each country. Incineration: The combustion of waste on land or at sea. Incineration plants: Plants for waste combustion with or without thermal energy recovery. Industrial waste: Industrial waste refers to waste from mining and quarrying, manufacturing, energy production as well as construction and demolition. Industrial waste may contain some hazardous waste and waste similar to household waste. Landfill: The final placement of waste in or on the land in a controlled or uncontrolled way according to national sanitary, environmental protection and other security requirements. This includes waste kept in permanent storage.

20
Landfill sites: Sites which manage the final placement of waste in or on the land in a controlled or uncontrolled way according to national sanitary, environment protection and other security requirements, including permanent storage facilities. Municipal waste: Waste similar to household waste and arising from various activities. Generally, municipal waste is managed by a local government or by private enterprises acting on behalf of the municipality. Municipal waste may contain hazardous and industrial waste. Other treatment plants: Plants for other waste treatment than recycling/reuse/recovery, incineration or landfills. Other waste treatment: This includes physico-chemical and biological waste treatment as well as waste dumping on land, in the sea and inland waters. Recycling/reuse/recovery: The refining and/or reprocessing of waste that can serve the same purpose or another purpose other than its initial use. Composting should be included in this stream. Waste incineration with thermal energy recovery is covered under Incineration. Recycling/Reuse/Recovery plants: Plants where wastes are recycled, reused or recovered. Total waste generation: Waste generated in human activities. Waste: Substances or objects, which are disposed of, or are intended to be disposed of, or are required to be disposed of by the provisions of national law. Waste may arise from a wide variety of economic activities and households. Waste treatment facilities: Facilities for the treatment of non-hazardous, hazardous and/or both waste. Transfer stations of waste collection are excluded from this definition. Waste water treatment sludge: The accumulated settled solids separated from various types of water, either moist or mixed with a liquid component as a result of natural or artificial processes.
21
5. LAND 5.1 Introduction 5.1 Statistics on land use reflect the availability and use of spatial resources in a country. The changes in land use may pose threats to nature both on the global and national scale. The fertile agricultural land may be irreversibly converted to built-up land and natural ecosystems may be lost to human activities such as the clearing of forests, drying out wetland areas for agriculture, building hydropower dams etc. These changes can lead to ecosystem destruction as well as to changes in the climatic conditions and in the circulation of materials. In addition, land degradation leading to qualitative changes in the productive capacity of the soil may also affect land utilization in the medium and long term. 5.2 The present section focuses on data on land use and land degradation. Land information is needed at local, national and international levels for land use planning and management, resource policies and other environmental policies/protection activities, as well as for global trend analyses. The categories used in the Questionnaire are a combination of both land cover and land utilization for human activities. The analysis of the corresponding data allows for the assessment of the net changes in land use over time and, potentially, of the environmental repercussions of land use activities. This information can be further supplemented by data concerning land degradation and other topics investigating the quality of the land. 5.3 Data on land use are usually obtained from land registers/inventories, land use or cartographic surveys, aerial photography, remote-sensing techniques and through satellite imagery. Generally, national data production on land takes place in the Cartographic Institution, at the Ministry of Environment, Natural Resources and Planning, or in the Ministry of Agriculture and Forestry or equivalent institution. 5.4 A separate sheet for supplementary information is provided at the end of the Land Section of the Questionnaire. It has been designed to collect additional information, quantitative and/or qualitative in nature, that may be available have on issues relevant to the environment and with respect to land degradation such as national classifications for soil erosion, salinization and desertification. Please, use this sheet to provide the relevant information. 5.2 Specific Table Notes on Land Table L1 Land Use 5.5 The data asked for in the table provide a general overview of the trends in land use over the past decades. Please note that the required data will be used for the calculation of net changes of land use, therefore, if possible, please provide complete time series and follow the classification. If the national data or classification do not make it possible to classify the total land area according to this questionnaire, please indicate in the footnotes the size of the unclassified (or differently classified) areas and the classes into which they would probably fall. 5.6 The table has been pre-filled with data compiled by the Food and Agriculture Organization of the United Nations (FAO), UNSD, and with data received in the UNSD Questionnaire 1999 from the countries. If national data on agricultural and forest land differ from those of FAO, respondents are

22
kindly asked to modify the data in the table and provide explanations of the differences in the Supplementary Information Sheet. 5.7 The definitions of forest and its sub-categories in the Questionnaire are those adopted by FAO in the Global Forest Resources Assessment (FRA) 2000. Please note that the FAO forest data used for the pre-filling follow the definitions of the 1990 and 1995 forest assessments, which slightly differ from those used in 2000. As opposed to the earlier assessments, the FRA 2000 applies a common set of definitions for developed and developing countries. The pre-filled data for “non-coniferous forest” in earlier years cover both broadleaved forests and forests consisting of bamboos, palms or other tree-form plants, while these forests represent two separate categories in the classification adopted in FRA 2000. 5.8 Protected area according to the World Conservation Union (IUCN) includes six categories which are: Category Ia: Strict Nature Reserve and Category Ib: Wilderness Area, Category II: National Park, Category III: Natural Monument, Category IV: Habitat/Species Management Area, Category V: Protected Landscape/Seascape, Category VI: Managed Resource Protected Area. However, if the national scheme for protected areas does not allow data provision according to the IUCN definition, please provide the data according to national definition and give the definition in the Supplementary Information Sheet. Table L2 Soil Erosion 5.9 Soil erosion is the process of loss of soil from the land, a naturally occurring process, which can be accelerated and exacerbated by human activities. Reducing plant cover by overgrazing and deforestation can decrease the soil binding capacity and increase the rate of erosion. Other causes are inappropriate farming methods, especially on steep slopes, wind, frost, rain and water runoff, as well as extreme climatic events. Soil erosion not only reduces the agricultural productivity of the land but may also result in excessive loadings of organic matter in water bodies, and various other economic losses. 5.10 Since soil erosion is a dynamic environmental process, a broad classification into four stages (United Nations Environment Programme, World Atlas of Desertification, Second Edition, 1997) is used, which are characterized by an increasing loss of productivity and increasing economic costs that were necessary to reverse the erosion process. If the country has developed a classification for the severity of soil erosion, please provide the data according to the national classification and give a detailed explanation of the system in the Supplementary Information Sheet. Table L3 Salinization 5.11 Salinization is the process of increasing salt concentrations in the topsoil often due to overuse of irrigation. It can cause severe and often irreversible damage to the natural vegetation and fauna resulting in economic losses from reduced soil productivity and carrying capacity. The table intends to investigate the total land area affected by salinization for selected categories of land use. If the country has developed a national classification for land affected by salinization, please provide the data according to the classification and give a detailed explanation of the system in the Supplementary Information Sheet. Table L4 Desertification 5.12 Desertification is defined as land degradation in arid, semi-arid and dry sub-humid areas resulting from various factors, including climatic variations and human activities (United Nations

23
Convention to Combat Desertification, 1994). Desertification results in the diminution or destruction of the biological potential of the land, ultimately leading to the formation of desert-like conditions. These processes may be due to a multitude of factors such as natural land and soil characteristics, climatic factors (e.g. drought), as well as the degree and ways of human exploitation of the land (e.g. overgrazing, deforestation, extensive burning). The process thus reduces the resilience of the land to natural climate variability, which often implies substantial socio-economic consequences. Countries are asked to provide data according to the national definition of desertification. Please give the definition as well as the description of the methodology applied and, if it exists, the national severity classification of desertification in the Supplementary Information Sheet. 5.3 Definitions for the Land Section Agricultural land: This refers to the major classes of land use on agricultural holdings. For classification the gross area is surveyed for each class. Agricultural land includes land under scattered farm buildings, yards and their annexes, permanently uncultivated land, such as uncultivated patches, banks, footpaths, ditches, headlands and shoulders. All other agricultural land, n.e.s.: This includes all agricultural land, which is not specified elsewhere. Such land may be potentially productive or not. Included are scattered farm buildings, i.e. isolated buildings not belonging to closed villages or similar rural localities. Arable land: This refers to all land generally under rotation whether for temporary crops or meadows, or left fallow. Arid area: Arid areas have a precipitation to potential evapotranspiration ratio equal to or greater than 0.05 and less than 0.20, and mean annual precipitation values up to approximately 200 millimetres/year. Inter-annual variability is between 50 per cent and 100 per cent. Bamboo /Palms formations: Forest on which more than 75 per cent of the crown cover consists of tree species other than coniferous or broadleaved species (e.g. tree-form species of the bamboo, palm and fern families). Broadleaved forest: Forest with a predominance (more than 75 per cent of tree crown cover) of trees of broadleaved species. Built-up and related land: Land under houses, roads, mines and quarries and any other facilities, including their auxiliary spaces, deliberately installed for the pursuit of human activities. Included are also certain types of open land (non-built-up land), that are closely related to these activities, such as waste tips, derelict land in built-up areas, junkyards, city parks and gardens, etc. Land occupied by scattered farm buildings, yards and their annexes (classified in category 3.4) is excluded. Land under closed villages or similar rural localities are included. Desertification: The process of land degradation in arid, semi-arid and dry sub-humid areas resulting from various factors including climatic variations and human activities. These factors include droughts as well as direct and indirect human activities such as overgrazing, intensive agricultural cultivation and burning of land. Climatic effects associated with this phenomenon include increased albedo, reduced atmospheric humidity, and greater atmospheric dust (aerosol) loading.

24
Dry open land with special vegetation cover: Non-wooded land, which is covered by low vegetation (less than 2 metres). Dry sub-humid area: Dry sub-humid areas have a precipitation to potential evapotranspiration ratio of equal to or greater than 0.50 and less than 0.65, with highly seasonal rainfall regimes and less than 25 per cent interannual rainfall variability. Such areas are very susceptible to degradation, probably enhanced by the seasonality of rainfall, drought periods and the increasing intensity of human use. Erosion: Refers to wind and water erosion (sheet and rill) and is divided into four categories, light, moderate, strong and extreme. Erosion - Extreme: Terrain is irreclaimable and beyond restoration. Original biotic functions are fully destroyed. Erosion - Light: Terrain has somewhat reduced agricultural productivity, but is suitable in local farming systems. Restoration to full productivity is possible by modifications of the management systems. Original biotic functions largely intact. Erosion - Moderate: Terrain has greatly reduced agricultural productivity, but is still suitable for use in local farming systems. Major improvements are required to restore productivity. Original biotic functions are partially destroyed. Erosion - Strong: Terrain is not reclaimable at farm level. Major investments - engineering works - are required for terrain restoration. Original biotic functions are largely destroyed. Fallow agricultural land: Arable land not under rotation that is set at rest for a period of time ranging from one to five years before it is cultivated again, or land usually under permanent crops, meadows or pastures, which is not being used for that purpose for a period of at least one year. Arable land which is normally used for the cultivation of temporary crops, but which is temporarily used for grazing is included. Forest: Land with tree crown cover (or equivalent stocking level) of more than 10 per cent and area of more than 0.5 hectares. May consist either of closed forest formations where trees of various storeys and undergrowth cover a high proportion of the ground; or open forest formations with a continuous vegetation cover in which tree crown cover exceeds 10 per cent. Young natural stands and all plantations established for forestry purposes which have yet to reach a crown density of 10 per cent are included under forest, as are areas normally forming part of the forest area which are temporarily unstocked as a result of human intervention or natural causes but which are expected to revert to forest. Included are forest nurseries and seed orchards that constitute an integral part of the forest; forest roads, cleared tracts, firebreaks and other small open areas; forest in national parks, nature reserves and other protected areas such as those of specific scientific, historical, cultural or spiritual interest; windbreaks and shelterbelts of trees with an area of more than 0.5 hectares and width of more than 20 metres; plantations primarily used for forestry purposes, including rubber wood plantations and cork oak stands. Excludes land predominantly used for agricultural practices. Forest and other wooded land: Land with tree crown cover (or equivalent stocking level) of more than 10 per cent and area of more than 0.5 hectares and land either with a crown cover (or equivalent stocking level) of 5-10 per cent of trees able to reach a height of 5 metres at maturity in situ; or a crown cover (or equivalent stocking level) of more than 10 per cent of trees not able to reach a height of 5

25
metres at maturity in situ (e.g. dwarf or stunted trees); or with shrub or bush cover of more than 10 per cent. Industrial land, excluding land used for quarries, pits, mines and related facilities: Land on which mainly manufacturing activities (ISIC/Rev.3 divisions 15-37) are pursued, including all auxiliary grounds, such as private roads, parking, storage grounds, office grounds, etc. Included is land used by enterprises primarily engaged in construction work (ISIC/Rev.3 division 45). However, actual construction sites are to be classified in category 5.2. Harbour areas and their storage facilities, although possibly extending to industrial premises, are excluded. Also excluded is land used for quarries, mines, pits and related facilities. Land under coniferous forest: This relates to land covered by forest as defined above with a predominance (more than 75 per cent of tree crown cover) of trees of coniferous species (Gymnospermae). Land under mixed forest: Forest in which neither coniferous, nor broadleaved, nor palms, bamboos account for more than 75 per cent of the tree crown cover. Land under non-coniferous forest: This relates to land covered by forest as defined above with a predominance (more than 75 per cent of tree crown cover) of trees of non-coniferous species (Angiospermae). Excludes broadleaved species and tree-form species of the bamboo, palm and fern families. Land under permanent crops: This signifies land used for crops occupying it for a long period of time and which do not have to be planted for several years after each harvest. Land under trees and shrubs producing flowers, such as roses and jasmine, is so classified, as are nurseries (except those for forest trees, which should be classified under forests and other wooded land). Permanent meadows and pastures are excluded. Land under permanent meadows and pastures: This means land used permanently (i.e., for five years and more) for herbaceous forage crops. Permanent meadows and pastures on which trees and shrubs are grown should be recorded under this heading only if the growing of forage crops is the most important use of the area. Measures may be taken to keep or increase productivity of the land (i.e. use of fertilizers, mowing or systematic grazing by domestic animals). Open land without, or with insignificant, vegetation cover: Non-built up land the surface of which either is not covered at all by vegetation or scarcely covered by some vegetation, which precludes its inclusion in other categories of the classification. Other built-up land: Land not included above, including commercial land, land used for public services, land of mixed use, land used for transport and communication and technical infrastructure, and land used for recreational and other open land. Other wooded land: Land either with a crown cover (or equivalent stocking level) of 5-10 per cent of trees able to reach a height of 5 metres at maturity in situ; or a crown cover (or equivalent stocking level) of more than 10 per cent of trees not able to reach a height of 5 metres at maturity in situ (e.g. dwarf or stunted trees); or with shrub or bush cover of more than 10 per cent. Protected land: An area of land and/or sea especially dedicated to the protection and maintenance of biological diversity, and of natural and associated cultural resources, and managed through legal or
26
other effective means. Residential land: Land, which is mainly covered by residential, or mainly residential, buildings, irrespective of whether they are actually occupied or temporarily vacant. Included in residential land are attached private gardens and small green areas, which are mainly used by the inhabitants of the buildings to which they are attached. Residential areas also comprise parking facilities and small playgrounds, which are essentially reserved for use by the local population. Excluded is land used for purposes specified elsewhere, even if it is mainly used by the local population. Respondents should specify the criteria used as a basis for determining whether a building is mainly residential or mainly non-residential. Salinization: The increase in salt concentration in an environmental medium, notably soil. Salinization can be a result of the clearing of native vegetation, or the overuse of irrigation. Semi-arid area: Semi-arid areas have a precipitation to potential evapotranspiration ratio of equal to or greater than 0.20 and less than 0.50, with distinctly highly seasonal rainfall regimes and mean annual values up to 800 millimetres/year in summer rainfall areas and 500 millimetres/year in winter regimes. Inter-annual variability ranges between 25 per cent and 50 per cent, so despite the apparent suitability for grazing in semi-arid grasslands, this and sedentary agricultural activities are susceptible to seasonal and inter-annual moisture deficiency. Waters: This relates to the part of the national territory, which is covered by surface waters. The national territory is defined as the surface enclosed by all inland borders and, if applicable, the normal baseline (low-water mark) on the seaward side. Wet open land: Non-wooded sites partially, temporarily or permanently waterlogged, the water of which may be fresh, brackish or saline, on blanket or raised peat lands. The water may be either stagnant or running, and is usually shallow, especially if it is saline.
27
6. TECHNICAL NOTES 6.1 Questionnaire 6.1 The present Questionnaire is available as a hard copy and as an electronic version in order to facilitate data processing and compilation. Whenever possible, countries are encouraged to use the electronic version. 6.2 The Questionnaire is sent out via mail to the National Statistical Offices. The electronic versions of the blank Questionnaire are downloadable from the following Internet address http://www.un.org/Depts/unsd/enviro/environment.htm. The electronic questionnaire contains sets of tables according to environmental topics in various Excel formats. The users can choose between Excel version 5.0 for Windows 95, Excel for Windows 97-2000 and Adobe Acrobat pdf according to their software requirements. The Guidance Document is available in Word 6.0 for Windows 95, Word 2000, as text file (txt) as well as Adobe Acrobat pdf document. Upon request, the pre-filled electronic questionnaire can also be sent to respondents in the required format as an e-mail attachment. 6.3 Countries are requested not to deviate from the structures of the tables which means that the National Statistical Offices and other institutions contacted for the completion of the Questionnaire should not add or delete lines or columns or change cell formats. Only the content of the cells may be changed. At the end of each table sufficient space has been reserved for explanatory footnotes. Additional information should be provided in the Supplementary Information Sheets at the end of each section of the Questionnaire. 6.2 Tables Contact Information 6.4 The cover sheets for each section ask for contact information on the Focal Point that is the institution responsible for coordinating the compilation of environment statistics for the Questionnaire 2001 from different institutions in a country. Generally, the National Statistical Office is the Focal Point for the Questionnaire. Accordingly, the contact person is the person in charge of the Questionnaire 2001 in the Focal Point. 6.5 The tables and Supplementary Information Sheets ask for contact information on contact persons and institutions providing environment statistics to the Focal Point. If the Focal Point is the same as the data provider, please provide the contact information only once in the cover sheet. Data availability and coverage 6.6 If no data are available for a complete table, the table should be crossed out diagonally with the appropriate note, such as “Not tabulated” or “Not yet available”. 6.7 The tables are pre-filled by default with ‘...’ (please refer to Notation for further details) and, where available, with data from the Questionnaire 1999 on Environmental Indicators and other sources which are indicated in the footnotes. Please note that high priority data are indicated with ‘!’ in the tables. Countries are asked to provide data (by writing over the default ‘…’) for all years and periods requested or, if these are not available, for approximate dates and similar time periods. This will allow for the analysis of time trends.

28
Data revision 6.8 If data previously provided to UNSD have been revised, updated or otherwise changed, countries are asked to cross out the corresponding pre-filled data and to provide the new data as footnotes in their response. See the following table for an example (adjusted to space). Please note that the codes in the first column of the pre-filled tables are for UNSD use only. Example 1. Data revision Code Category Unit Long term
annual average b
1990 1991 1992 1993 1994 1995
6 Precipitation c Mio m3 136,185.60 1 151,963.20 1 ... 122,276.40 1 141,168.00 1 132,033.60 1 127,258.80 1
7 Evapotranspiration d Mio m3 83,247.60 1 2 91,344.00 1 3 ... 4 69,130.80 1 73,282.80 1 77,642.40 1 98,194.80 1
8 Annual inflow of surface and ground waters d Miom3 23,200.00 30,200.00 ... 19,300.00 25,100.00 28,300.00 22,700.00
9 of which: inflow from country (total) Mio m3 34,700.00 41,000.00 ... 30,000.00 41,600.00 43,400.00 31,000.00
13 Annual outflow of surface and ground waters e Mio m3 ... ... ... ... ... ... ...
14 of which: outflow to country/sea (total) Mio m3 57,900.00 71,200.00 ... 49,300.00 66,700.00 71,700.00 53,700.00
124 Total renewable water resources Mio m3 ... ... ... ... ... ... ...
Footnotes
1 Calculated by UNSD
Footnotes Code Footnote text 2 Revised figure: 85230 Mio m3 Source: National Meteorological Service, 2000 3 Revised figure: 92000 Mio m3 Source: National Meteorological Service, 2000 4 Update: 92500 Mio m3 Source: National Meteorological Service, 2000 Data source specification 6.9 Wherever possible, the source of the data (name of the institution that collected the data or reference to the report or article where data was published) should be specified by footnoting the corresponding cell and adding the reference in the footnotes. Please note that in the pre-filled tables the source specification is missing when the data refer to the UNSD Questionnaire 1999 on Environmental Indicators. Definitions 6.10 Particular effort was made to ensure consistency with internationally adopted and/or otherwise recognized definitions and classifications. However, if it is not possible to supply data classified or defined exactly as indicated in the tables, countries are asked to report the available data and to specify the classifications or definitions used in the footnotes provided below each table or in the Supplementary Information Sheet at the end of each section.
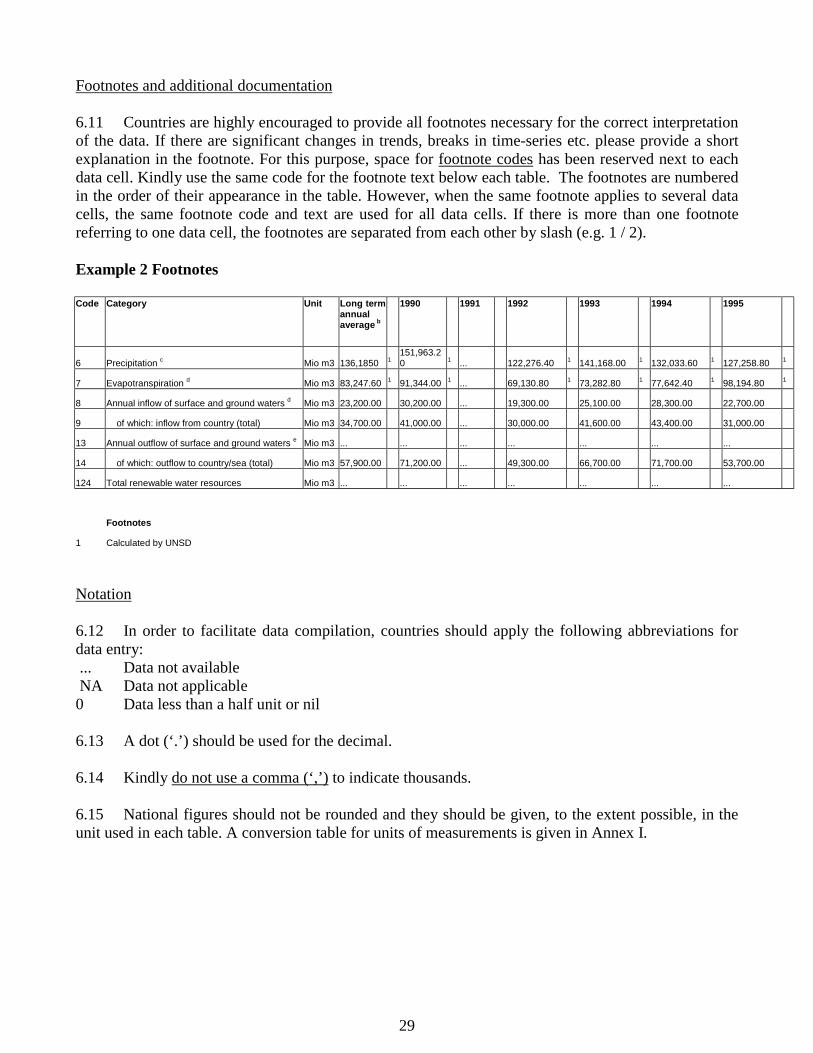
29
Footnotes and additional documentation 6.11 Countries are highly encouraged to provide all footnotes necessary for the correct interpretation of the data. If there are significant changes in trends, breaks in time-series etc. please provide a short explanation in the footnote. For this purpose, space for footnote codes has been reserved next to each data cell. Kindly use the same code for the footnote text below each table. The footnotes are numbered in the order of their appearance in the table. However, when the same footnote applies to several data cells, the same footnote code and text are used for all data cells. If there is more than one footnote referring to one data cell, the footnotes are separated from each other by slash (e.g. 1 / 2). Example 2 Footnotes Code Category Unit Long term
annual average b
1990 1991 1992 1993 1994 1995
6 Precipitation c Mio m3 136,1850 1 151,963.20 1 ... 122,276.40 1 141,168.00 1 132,033.60 1 127,258.80 1
7 Evapotranspiration d Mio m3 83,247.60 1 91,344.00 1 ... 69,130.80 1 73,282.80 1 77,642.40 1 98,194.80 1
8 Annual inflow of surface and ground waters d Mio m3 23,200.00 30,200.00 ... 19,300.00 25,100.00 28,300.00 22,700.00
9 of which: inflow from country (total) Mio m3 34,700.00 41,000.00 ... 30,000.00 41,600.00 43,400.00 31,000.00
13 Annual outflow of surface and ground waters e Mio m3 ... ... ... ... ... ... ...
14 of which: outflow to country/sea (total) Mio m3 57,900.00 71,200.00 ... 49,300.00 66,700.00 71,700.00 53,700.00
124 Total renewable water resources Mio m3 ... ... ... ... ... ... ...
Footnotes
1 Calculated by UNSD
Notation 6.12 In order to facilitate data compilation, countries should apply the following abbreviations for data entry: ... Data not available NA Data not applicable 0 Data less than a half unit or nil 6.13 A dot (‘.’) should be used for the decimal. 6.14 Kindly do not use a comma (‘,’) to indicate thousands. 6.15 National figures should not be rounded and they should be given, to the extent possible, in the unit used in each table. A conversion table for units of measurements is given in Annex I.
30
6.3 Supplementary Information Sheet 6.16 Any kind of supplementary information from countries is highly appreciated as it further facilitates the analysis and interpretation of national data and trends. It may refer to additional data or proxies that are available, explanations of the national methods, concepts and classifications or national reports and publications related to the respective section. The information will also contribute to the better adjustment of the Questionnaire to country needs. 6.17 The Supplementary Information Sheet has been designed to collect this additional information, quantitative and/or qualitative in nature. The text in the sheet is intended to serve as a general guideline as to what information is of particular interest to UNSD but countries are also invited to submit all other data and information considered necessary for the evaluation of trends and status of the environment.
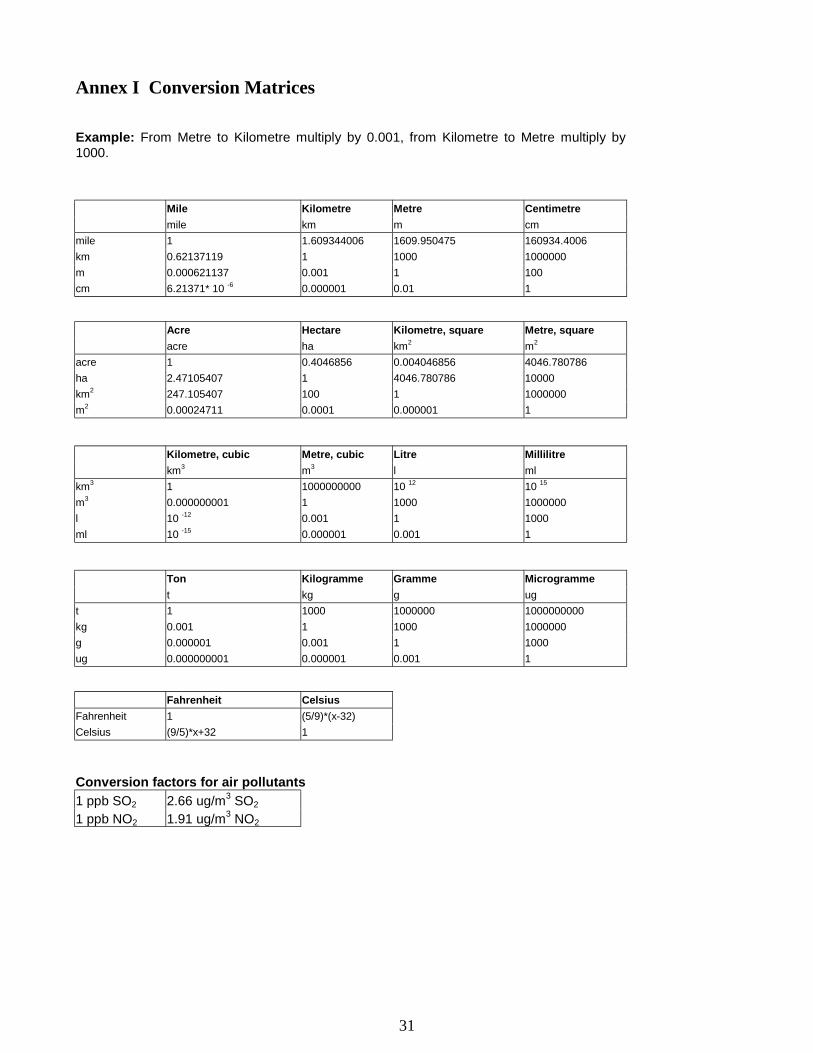
31
Annex I Conversion Matrices
Example: From Metre to Kilometre multiply by 0.001, from Kilometre to Metre multiply by 1000.
Mile Kilometre Metre Centimetre mile km m cm mile 1 1.609344006 1609.950475 160934.4006 km 0.62137119 1 1000 1000000 m 0.000621137 0.001 1 100 cm 6.21371* 10 -6 0.000001 0.01 1
Acre Hectare Kilometre, square Metre, square acre ha km2 m2 acre 1 0.4046856 0.004046856 4046.780786 ha 2.47105407 1 4046.780786 10000 km2 247.105407 100 1 1000000 m2 0.00024711 0.0001 0.000001 1
Kilometre, cubic Metre, cubic Litre Millilitre km3 m3 l ml km3 1 1000000000 10 12 10 15 m3 0.000000001 1 1000 1000000 l 10 -12 0.001 1 1000 ml 10 -15 0.000001 0.001 1
Ton Kilogramme Gramme Microgramme t kg g ug t 1 1000 1000000 1000000000 kg 0.001 1 1000 1000000 g 0.000001 0.001 1 1000 ug 0.000000001 0.000001 0.001 1
Fahrenheit Celsius Fahrenheit 1 (5/9)*(x-32) Celsius (9/5)*x+32 1
Conversion factors for air pollutants
1 ppb SO2 2.66 ug/m3 SO2
1 ppb NO2 1.91 ug/m3 NO2