unreliable water supplies and household coping strategies
TRANSCRIPT
Unreliable water supplies and household coping
strategies in peri-urban South Africa
Batsirai Majuru
Thesis submitted for the degree of
Doctor of Philosophy
Norwich Medical School
University of East Anglia, Norwich
March 2015
© This copy of the thesis has been supplied on condition that anyone who consults it is
understood to recognise that its copyright rests with the author and that use of any
information derived there from must be in accordance with current UK Copyright Law.
In addition, any quotation or extract must include full attribution

i
Abstract
Many developing countries face severe challenges with the reliability of water supplies.
These supplies are often characterised by intermittence, low pressure and poor water
quality. Despite its contribution towards water-related illness and the significant coping
burden it imposes on households, water supply reliability remains a difficult attribute to
measure. A key challenge is the lack of a universal definition of water supply reliability.
The issue of unreliability in water supply and the financial cost it imposes on
households is of profound relevance in South Africa – a country whose social policies
include a Free Basic Water policy which entitles all households to a free lifeline supply
of 6,000 litres per month. This thesis examines household experiences of unreliable
water supplies and in particular, explores the question as to what constitutes a reliable
water supply, and household responses to unreliable water supplies.
The analysis draws on literature reviews and a household survey conducted in peri-
urban communities in the Limpopo Province of South Africa in 2012. A systematic
review of definitions and assessment criteria used in studies of water supply reliability
demonstrates that there is no consensus on what constitutes a reliable water supply.
Assessment criteria also vary greatly, with the most common criterion in urban settings
being the duration and/or continuity of supply in hours per day. In rural settings, the
proportion of functional water systems is commonly assessed. A discrete choice
experiment was conducted to elicit households’ preferences for a reliable water supply.
Results indicate that overall, households value notification of interruptions and having
water available for longer durations during the day, and would be willing to pay for
these improvements. However, there is some heterogeneity in these preferences as
wealthier households, who have drilled their own wells and are no longer dependant on
the public supply are less willing to pay for improvements in the water supply.
Findings from a systematic review of household strategies to cope with unreliability
reveal that relatively wealthy households incur significant direct costs from strategies
such as drilling wells and installing water storage tanks, poor households expend time
and energy in collecting water from other sources. Income, level of education, land
tenure and extent of unreliability are the main determinants of which strategies are
adopted. Results from the survey in Limpopo highlight that Free Basic Water is not
actually free; households spend significant proportions of their income on buying water,

ii
drilling wells and treating the water prior to consumption. Coping costs increase with
wealth status and are higher in communities without alternative water sources such as
springs. Notably, for many households the lifeline supply of 6,000 litres per month is
unmet.
The findings from this thesis highlight the need for consensus on the definition, and
assessment approach for water supply reliability. Further, the analysis of households’
responses to unreliable water supplies in South Africa draws attention to how poor
reliability negates the Free Basic Water policy. Without reliable water supply services,
the objectives of improving public health and promoting equity cannot be met.

iii
Contents
Abstract i
List of tables vii
List of figures ix
List of appendices x
Acronyms xi
Acknowledgements xii
1 Introduction .................................................................................................... 1
1.1 Background and rationale .............................................................................. 2
1.2 Study objectives and methods ....................................................................... 3
1.3 Contribution of the thesis .............................................................................. 4
1.3.1 Why South Africa? ........................................................................................ 5
1.3.2 Previous work ................................................................................................ 6
1.4 Scope and definitions of terms ...................................................................... 6
1.5 Structure of thesis .......................................................................................... 7
2 Setting the waterscape.................................................................................... 9
2.1 An overview of water supply services in South Africa ............................... 10
2.1.1 The legacy of apartheid ................................................................................ 10
2.1.2 Legislative, policy and institutional framework .......................................... 11
2.1.3 Funding mechanisms ................................................................................... 14
2.1.4 Free Basic Water services ............................................................................ 15
2.1.5 Cracks in the rural water service pipeline .................................................... 16
2.2 The study area ............................................................................................. 18
2.2.1 The study communities ................................................................................ 19
2.2.2 Communities 1 and 2 ................................................................................... 20
2.2.3 Community 3 ............................................................................................... 22
2.2.4 Water supply problems in the study communities ....................................... 23
Conclusions 24
3 Methods........................................................................................................ 26
3.1 Background ................................................................................................. 27
3.2 Research strategy ......................................................................................... 28
3.2.1 Sampling ...................................................................................................... 28
3.3 Data collection ............................................................................................. 31
3.3.1 Household surveys ....................................................................................... 31

iv
3.3.2 Key informant interviews ............................................................................ 31
3.3.3 Community observations ............................................................................. 32
3.3.4 Fieldworkers ................................................................................................ 33
3.3.5 Ethics and household recruitment ................................................................ 33
3.3.6 Survey procedures ........................................................................................ 34
3.3.7 Key variables ............................................................................................... 34
3.4 Data management and analyses ................................................................... 38
3.4.1 Preliminary steps for key variable data ........................................................ 38
3.4.2 Interview data analyses ................................................................................ 43
Conclusions 44
4 Sample characteristics and key variables ..................................................... 45
4.1 Sample characteristics ................................................................................. 46
4.2 Current water supply ................................................................................... 47
4.2.1 Water sources ............................................................................................... 47
4.2.2 Reliability of the current water supply......................................................... 48
4.2.3 Multiple source use ...................................................................................... 49
4.2.4 Perceptions of the water supply ................................................................... 50
4.3 Key variables ............................................................................................... 52
4.3.1 Water use ..................................................................................................... 52
4.3.2 Household socio-economic status ................................................................ 52
4.3.3 Coping cost .................................................................................................. 55
4.4 Discussion ................................................................................................... 56
Conclusions 58
5 Reliability of water supplies in developing countries: A review of definitions
and assessment approaches .......................................................................... 59
6 Preferences for reliability of water supply in Limpopo ............................... 91
6.1 Introduction ................................................................................................. 92
6.1.1 Eliciting preferences .................................................................................... 93
6.1.2 Why a discrete choice experiment? ............................................................. 93
6.2 Objectives .................................................................................................... 94
6.3 Methods ....................................................................................................... 94
6.3.1 Establishing attributes and assigning attribute levels .................................. 95
6.3.2 Designing the choice sets and generating the questionnaire ........................ 97
6.3.3 Administering the choice survey ................................................................. 99
6.3.4 Analysis........................................................................................................ 99

v
6.4 Results ....................................................................................................... 104
6.4.1 Preferences for the overall sample ............................................................. 105
6.4.2 Preferences by type of water supply .......................................................... 107
6.4.3 Preferences by community cluster ............................................................. 109
6.4.4 Predicted choice probabilities .................................................................... 112
6.5 Discussion ................................................................................................. 112
Conclusions 116
7 Household responses to unreliable water supplies: A review .................... 117
7.1 Introduction ............................................................................................... 118
7.2 Conceptual background of reliability and coping ..................................... 119
7.3 Methods ..................................................................................................... 120
7.3.1 Quality appraisal ........................................................................................ 121
7.4 Results ....................................................................................................... 122
7.4.1 Coping strategies ........................................................................................ 132
7.4.2 Factors influencing choice of coping strategies employed ........................ 136
7.4.3 Costs of coping .......................................................................................... 137
7.4.4 Coping costs and willingness to pay .......................................................... 138
7.4.5 Distribution of coping strategies across socio-economic groups ............... 140
7.4.6 Health and social outcomes related to coping ............................................ 141
7.4.7 Effectiveness of coping strategies adopted ................................................ 141
7.5 Discussion ................................................................................................. 142
Conclusions 146
8 Household responses to unreliable water supplies and Free Basic Water in
Limpopo ..................................................................................................... 147
8.1 Objectives .................................................................................................. 148
8.2 Methods ..................................................................................................... 148
8.2.1 Data collection ........................................................................................... 148
8.2.2 Analysis...................................................................................................... 149
8.3 Results ....................................................................................................... 151
8.3.1 Distribution of coping strategies across population groups ....................... 153
8.3.2 Coping components ................................................................................... 155
8.3.3 Factors associated with coping strategies .................................................. 156
8.3.4 Coping and Free Basic Water .................................................................... 158
8.4 Discussion ................................................................................................. 164
Conclusions 168

vi
9 Discussion and conclusions ....................................................................... 170
9.1 Overview ................................................................................................... 171
9.2 Summary of main findings ........................................................................ 172
9.3 Contribution of thesis and significance of findings ................................... 173
9.4 Limitations ................................................................................................. 174
9.5 Implications for policy and practice .......................................................... 175
9.6 Further work .............................................................................................. 176
References ................................................................................................................ 178

vii
List of tables
Table 2.1: Main legislative and policy documents relating to the provision of water
supply services in South Africa ............................................................... 12
Table 3.1: Asset-based indicators of household socio-economic status ................... 36
Table 3.2: Scenarios used in sensitivity analyses of coping costs ............................ 43
Table 4.1: Characteristics of study sample ............................................................... 46
Table 4.2: Main water sources .................................................................................. 47
Table 4.3: Alternative water sources ........................................................................ 48
Table 4.4: Reliability characteristics of water supply, by type of supply ................. 48
Table 4.5: Reliability characteristics of main water supply, by community cluster . 49
Table 4.6: Summary statistics of water use data ....................................................... 52
Table 4.7: Summary statistics of household income data......................................... 53
Table 4.8: Weights of variables included in asset index .......................................... 53
Table 4.9: Summary statistics of wealth index scores, by wealth quintile ............... 54
Table 4.10: Summary statistics of household crowding index data ........................... 54
Table 4.11: Summary statistics of initial and running cost data ................................. 55
Table 4.12: Summary statistics of total coping cost data ........................................... 56
Table 5.1: Databases and search engines used ......................................................... 61
Table 5.2: Studies in urban settings .......................................................................... 64
Table 5.3: Studies in rural settings ........................................................................... 71
Table 5.4: Studies in both urban and rural settings .................................................. 78
Table 5.5: Assessment criteria for reliability of urban water supplies ..................... 83
Table 5.6: Assessment criteria for reliability of rural water supply ......................... 85
Table 6.1: Attributes and levels from water service benchmarks ............................. 95
Table 6.2: Attributes of water supply reliability and their levels ............................. 96
Table 6.3: Service scenarios used in predicting uptake of water supply services .. 103

viii
Table 6.4: Frequencies of service options chosen, by type of supply and community
cluster .................................................................................................... 104
Table 6.5: Water supply preferences for overall sample ........................................ 105
Table 6.6: Willingness to pay estimates for overall sample ................................... 106
Table 6.7: Preferences by type of water supply ...................................................... 108
Table 6.8: Willingness to pay estimates, by type of water supply ......................... 109
Table 6.9: Preferences by community cluster......................................................... 110
Table 6.10: Willingness to pay by community cluster ............................................. 111
Table 6.11: Predicted choice probabilities for hypothetical service options versus the
current service ....................................................................................... 112
Table 7.1: Studies conducted in urban settings ...................................................... 124
Table 7.2: Studies conducted in rural settings ........................................................ 130
Table 7.3: Studies conducted in both urban and rural settings ............................... 131
Table 7.4: Coping strategies identified from the literature ..................................... 133
Table 7.5: Coping costs and their components ....................................................... 137
Table 7.6: Willingness to pay and coping .............................................................. 139
Table 8.1: Rotated component matrix of coping strategy variables ....................... 155
Table 8.2: Linear regression of factors associated with coping strategies ............. 157
Table 8.3: Monthly household coping costs, by asset quintile ............................... 159
Table 8.4: Monthly household coping costs, by community .................................. 159
Table 8.5: Determinants of aggregate household monthly coping costs ................ 161
Table 8.6: Linear regression of determinants of household water use ................... 163
Table 8.7: Median coping costs for households who meet and those who do not
meet the 25 ℓ per capita per day benchmark ......................................... 164

ix
List of figures
Figure 2.1: Map of South Africa and location of Limpopo Province ........................ 18
Figure 2.2: A communal tap in Community 1 ........................................................... 20
Figure 2.3: Drilled well and storage tank in Community 2 ....................................... 21
Figure 2.4: Water treatment plant in Community 3 ................................................... 22
Figure 2.5: Weir in Community 3 .............................................................................. 24
Figure 3.1: Steps in annuitizing capital costs of coping ............................................ 42
Figure 4.1: Reasons for using multiple water sources ............................................... 50
Figure 4.2: Ratings of the reliability of the main water supply ................................. 51
Figure 4.3: Household concerns with the main water supply .................................... 51
Figure 6.1: An example of the choice scenario .......................................................... 98
Figure 7.1: Flow chart of study selection process .................................................... 122
Figure 7.2: Geographic distribution of studies included in review .......................... 123
Figure 8.1: Household strategies to cope with unreliable water supply .................. 152
Figure 8.2: Harvesting rainwater ............................................................................. 152
Figure 8.3: Household water treatment methods ..................................................... 153
Figure 8.4: Household coping strategies, by wealth status ...................................... 154
Figure 8.5: Household coping strategies, by community......................................... 154
Figure 8.6: Number of households reporting diarrhoea, by wealth status and
community ............................................................................................. 158
Figure 8.7: Median coping costs as a proportion of median household income, by
wealth status and community ................................................................ 160
Figure 8.8: Number of households meeting water use benchmark, by wealth status
and community ...................................................................................... 162

x
List of appendices
Appendix 1.1: Health impact of small-community water supply reliability ............... 190
Appendix 1.2: Water service benchmarks and reliability ........................................... 191
Appendix 3.1: DfID project inception report .............................................................. 192
Appendix 3.2a: Ethics approval from University of East Anglia ................................. 193
Appendix 3.2b: Ethics approval from Tshwane University of Technology ................. 194
Appendix 4: Imputation procedures ......................................................................... 195
Appendix 6.1: Results of structured search of discrete choice studies of reliability
water supply ........................................................................................ 205
Appendix 6.2: Odds ratios of preferences for reliability of water supply .................. 218
Appendix 7.1: General study appraisal tool ................................................................ 222
Appendix 7.2: Adapted SEPA study appraisal tool .................................................... 228
Appendix 8: Correlation of coping strategies, and components of coping costs ..... 239

xi
Acronyms
AfDB African Development Bank
ADB Asian Development Bank
DWA Department of Water Affairs
DCE Discrete choice experiment
DfID Department for International Development
FBW Free Basic Water
JMP Joint Monitoring Programme
MDGs Millennium Development Goals
RDP Reconstruction and Development Programme
SPSS Statistical Package for the Social Sciences
TUT Tshwane University of Technology
UEA University of East Anglia
UNC University of North Carolina
UNICEF United Nations Children’s Fund
USAID United States Agency for International Development
WHO World Health Organisation
WSA Water Service Authority
WSP Water Service Provider

xii
Acknowledgements
I would like to express my gratitude to the following organisations for their
contributions towards this work:
• The University of East Anglia, for funding my studentship;
• The UK Department for International Development for funding the fieldwork; and
• Tshwane University of Technology for collaborating on the fieldwork.
On a personal level, I have been blessed to receive unwavering support from many
individuals. My immense gratitude goes to my primary supervisor Professor Paul
Hunter, for his guidance, advice and friendship. Choosing to do my PhD under his
under his supervision was one of the best decisions I ever made. I am also grateful to
my secondary supervisor Professor Marc Suhrcke, who was also ready to give insightful
advice, particularly in my new-found interest in economics.
In South Africa, I am especially grateful to the longsuffering households in Maelula and
Sinthumule, who welcomed me into their homes and shared with me their struggles in
accessing water. The fieldwork would not have been possible without the assistance of
Dr Stanley Mukhola, Michael Mokoena, Aifheli Mudau, Rendani Nemakanga, Violet
Ramalira, Mashudu Mphaphuli and in particular, Masala Nembaleni and Constance
Matamela.
I would not have had the courage to enrol for my PhD had it not been for the
encouragement that I received from Tinotenda Mukarakate: thank you. Throughout my
studies, I have been blessed to have friends and family that have encouraged me and
believed in me in whatever I have done: Deline Somo, Chipo Chipudhla, Delight Moyo,
Cardnas Ngavaite, Molifia Manyasha, Arnold Njanji, Tafadzwa Shumba, Taonashe
Kuseka, Zvaonzeni Majuru, Edwick Bandera Murungu, Burden Mavunga and Brian
Matemachani. I owe a debt of gratitude to Rufaro Mavunga and Sarah Kudzibatira, who
always guaranteed a laugh, and always provided emotional and spiritual support.
I cannot offer enough appreciation to Stanley Nzvere: from fixing IT mishaps to
soothing anxieties with good humour, encouragement and simply forbearance, your
support has been beyond measure.
My time at UEA was made all the richer by the friends that I met: Ada Mackovova
Ivanecka, Kenna Slim, Penny Murage, Lucy Bain, Henriette Finck, Cecilia Makupe,

xiii
Lewis Peake, Liane Lewis, Rudee Wongchum, Nok Mueannadon and Girmaye Dinsa.
A big thank you also to Amanda Brandish and Christine Raschka, who brought some
welcome distraction in the form of pilates sessions on Friday evenings. I am forever
indebted to the Geere family: Jo, Jon, Nic and Sol (), who became my family away
from home; guiding me into a new culture, and introducing me to the delectable delights
of sticky toffee pudding.
My heartfelt thanks go to Matthew England, whose support and encouragement have
meant far much more than words can ever express.
This thesis is dedicated to my parents. To my father, who has never wavered in his trust
of my academic ability; and to my late mother, whose memories continue to inspire and
give strength.

1
1 Introduction

Chapter 1: Introduction
2
This introductory chapter provides a brief overview of the problem of poor reliability of
water supplies in developing countries. It outlines the research needs, as well as the
thesis objectives. The scope and definitions of terms used throughout the thesis are also
outlined, and the chapter concludes with an overview of the thesis structure.
1.1 Background and rationale
By 2012, 116 countries – representing an estimated 89 % of the world’s population –
reportedly had access to improved water sources (WHO/UNICEF, 2014). Seemingly,
the Millennium Development Goal (MDG) target to halve the proportion of the world’s
population without access to safe drinking water by 2015 had already been met. South
Africa is one of the few countries in sub-Saharan Africa classified as having already met
the drinking water target in the Joint Monitoring Programme’s (JMP) 2014 update
(WHO/UNICEF, 2014). However, the laudability of this achievement may be
debatable when confronted with the local reality of unreliable water supplies; with taps
running dry for weeks on end [Appendix 1.2 (Majuru et al., 2012)].
The problem is not unique to South Africa alone; the subject of poor reliability of water
supplies in developing countries is one that is all too familiar. Even where basic water
supply infrastructure exists, in many developing countries water services are
characterised by low pressure, intermittent supply and poor water quality (Vásquez et al.,
2009). A third of hand-pumps in rural parts of sub-Saharan Africa are reported to be
non-functional (Rural Water Supply Network, 2009), and in urban parts of south and
south-eastern Asia piped water is available for only a few hours each day (IBNET,
2011).
Piped water supplies may be contaminated due to fluctuating pressure in distribution
systems, or poor storage and handling practices during supply interruptions (Kumpel
and Nelson, 2013) or households may be forced to revert to unsafe water sources
[Appendix 1.1 (Majuru et al., 2011)], resulting in diarrhoeal illness. But the impacts of
unreliable household water supplies are not limited to health; livelihoods are affected
(Hunter et al., 2010), and households incur significant costs that arise from the coping
strategies employed to avoid or mitigate these consequences (Pattanayak et al., 2005).
Despite its significance, water supply reliability is not addressed in the current MDG
indicators; a major obstacle to its inclusion being the lack of consensus on the definition
and assessment criteria for reliability of water supply (WHO/UNICEF, 2012). While

Chapter 1: Introduction
3
much has been written on the subject, the notion of reliability in water supply has
remained rather nebulous. For the households that are continually faced with the task of
obtaining sufficient quantities of safe water, what constitutes a reliable supply?
An equally important issue is how households respond to, or cope with unreliability.
Most studies on this topic have focused on assessing coping costs as indirect estimates
of willingness to pay for water service improvements (Widiyati, 2011, Mycoo, 1996,
Dutta and Tiwari, 2005) and have been conducted mainly in urban settings. Overall,
these studies have highlighted that households are willing to pay for improved and more
reliable water services, although the amount varies widely.
However, the dominance of this ‘means to an end’ approach, in which household coping
strategies are assessed for the sole purpose of determining willingness to pay for
improved services, has meant that relatively little attention has been devoted to
understanding the underlying perceptions of water supply reliability that enable the
adoption of specific coping strategies, and much less so the policy arena in which water
services are located. Further, few studies have drawn on any structured research into
household strategies to cope with unreliable water supplies in peri-urban and rural areas.
This thesis examines household experiences of unreliable water supplies in South Africa,
and in particular, explores the notion of reliability in water supply, and household
strategies to cope with unreliable water supplies.
1.2 Study objectives and methods
The absence of an agreed upon definition of water supply reliability has important
implications on monitoring of progress on the global development agenda, and the
ability to translate the findings of such monitoring into effective policy interventions.
Without a clear indication of the extent of the problem and where the most affected
areas are, it is difficult to target interventions to mitigate the effects of unreliable water
supplies. Further, knowledge of the extent of unreliability is of limited relevance if it is
not completed by an understanding of what unreliability in water supply means to
households, and how they cope with it. What deficiencies in the supply are they
compensating for; in what ways do they compensate; and how effective are these
compensating / coping strategies? Such knowledge is relevant to both practice and
policy in the interdisciplinary areas of water, health and development, where it can
contribute to the formulation of improved policy, and evidence for practice.

Chapter 1: Introduction
4
The objective of this study is to investigate households’ experiences of and responses to
unreliable water supply. Specifically, the study seeks to address the following questions
and sub-questions:
What is a reliable household water supply?
How is reliability defined and assessed?
What attributes of water supply reliability do households value?
How do households respond to unreliable water supplies?
What coping strategies do households employ?
What are the costs of coping with unreliable water supplies?
The study uses a combination of literature reviews and empirical survey data from peri-
urban communities in South Africa to address the research questions. The reviews of
both grey and peer reviewed literature provide a broader research context for the study,
focusing on the assessment of water supply reliability, and household responses to
unreliable water supplies. Analyses of the survey data allows for a more localised, and
perhaps more nuanced perspective. Discrete choice analysis is employed to assess
household preferences for water supply reliability. The survey dataset includes
information on household coping strategies and coping costs, which are also analysed.
This quantitative data is complemented by qualitative data from key informant
interviews with water supply technicians in the study area. The data from the
interviews are used to provide a service provider perspective of the water supply
systems and problems with water provision in the study area.
1.3 Contribution of the thesis
The need for consensus on a definition and assessment approach for water supply
reliability is articulated in the 2012 update on the MDG target for drinking water, and
efforts are underway to refine the monitoring indicators for the post-2015 development
agenda (WHO/UNICEF, 2012). The review of definitions and assessment for water
supply reliability represents a timely contribution to the ongoing policy debate about
indicators in the post-2015 development agenda. Related work in this area has
reviewed reliability only in part; within a broader concept of water security (Bradley
and Bartram, 2013), and as a component of a monitoring index (Kayser et al., 2013).
The review presented herein – to my knowledge – is the first to focus solely on
reliability.
Chapter 1: Introduction
5
The discrete choice experiment complements the review by providing a user perspective
of the concept of reliability in water supply. As will be covered more extensively in
Chapter 5, the few discrete choice surveys that have focused on water reliability have
been conducted mainly in developed countries. The even fewer studies that have been
conducted in developing countries have been in urban settings. The discrete choice
experiment in Chapter 6 contributes to the thin empirical literature in non-urban settings
in developing countries.
If effective interventions are to be designed to target the consequences of unreliability,
an understanding of household responses to unreliability is required (Kudat et al., 1993).
To my knowledge, the review in Chapter 7 is the first to synthesise existing literature on
household strategies to cope to with unreliable water supplies. As with the discrete
choice experiment, the survey of coping strategies in Limpopo adds to the limited
literature covering this topic in non-urban settings in developing countries.
1.3.1 Why South Africa?
The setting of the survey in South Africa provides a particularly interesting vantage
point for several reasons. In 2010, 97 % of the country’s population was reported to
have access to basic water supplies. However, as stated in the Department of Water
Affairs’ 2009/2010 report, these figures “only reflect infrastructure provided and do not
reflect quality of ongoing service provision” (Department of Water Affairs, 2010a).
Peri-urban and rural communities in particular are still challenged by significant
problems in the quality of water services (Statistics South Africa, 2011), and provide an
opportune setting for studying household water supply beyond the dichotomous view of
whether or not access is provided.
South Africa’s legislative and policy framework for water services is widely lauded as
being among the most progressive in the world (Tissington et al., 2008). Driven by
equity concerns in the provision of water services, the country’s Free Basic Water
policy provides each household with a free minimum water allowance of 6,000 ℓ per
month (Department of Water Affairs, 2007). The uniqueness of the policy, Szabo (2009)
notes, lies in that the water is actually free, unlike in other settings where the term is
used loosely to describe a fixed fee for the first units of water. Ostensibly, the Free
Basic Water policy guarantees that the minimum water requirements of the poorest

Chapter 1: Introduction
6
households – most often in peri-urban and rural communities – are met. But when the
water supply is unreliable, how ‘free’ is Free Basic Water?
1.3.2 Previous work
The study is largely driven by my previous experience in working on water and health
in South Africa. As a masters’ student, my dissertation was part of a larger project that
had been commissioned by the South African Water Research Commission. The
overall aim of the project was to measure the benefits of water supply and sanitation
service provision, since the end of apartheid (Jagals, 2012).
My MSc dissertation assessed whether upgrading water supply systems in rural
communities in Limpopo Province improved water service attributes of access (distance
and time to source), availability (quantity of water available and reliability of supply)
and potability (microbial water quality) (Majuru, 2010). Although there were
remarkable improvements in access to water sources (distances and collection times
greatly reduced), the associated benefits, such as having sufficient quantities of water
and improvement in water quality were minimal (Majuru et al., 2012). The water
supply was unreliable, and in the most affected communities diarrhoeal illness rates
were relatively high (Majuru et al., 2011). The role that poor reliability played in
undermining the impact of these water supply interventions drove my interest in the
topic.
1.4 Scope and definitions of terms
This study uses literature reviews and empirical analyses to addresses reliability of
water supply and households’ responses within a number of boundaries. First, the
literature on water supply in developing countries is often interspersed with terms such
as sustainability and reliability and other synonyms. Although these terms are often
used interchangeably in the literature, a distinction is made between the two in this
thesis, to avoid ambiguity. Sustainability, in the context of this thesis, refers to the
capacity of water supply systems to continue to provide intended health, social and
economic benefit to recipients in a manner that has no significant environmental,
economic and social adverse effects (Barnes, 2009). The term encompasses aspects
such as the renewability of the water resource, financial, administrative and technical
capacities in managing the resource, as well as cultural and political dimensions (Carter
and Rwamwanja, 2006). The scope of this thesis is limited to quality of the water

Chapter 1: Introduction
7
supply service i.e. reliability and focuses on the operational performance of water
supply and the ability of the supply to meet household water needs. While Chapter 2
outlines the reasons behind poor water supplies in the communities surveyed, a full
discussion of why water supplies in developing countries are unreliable lies beyond the
scope of this thesis.
The study is limited to domestic water supply in developing countries. ‘Developing
countries’ are as defined by the World Bank’s country classification for 2011 (World
Bank, 2011). Although the empirical work presented is based exclusively on data
collected from South Africa and may be site-specific, the implications of the findings
can be understood as broadly applicable to developing country settings.
The term ‘peri-urban’ as used in this thesis refers to communities that are in a sense,
transitional between rural and urban. In such communities, the population density may
be higher than is typical of rural communities, with livelihoods characterised by a mix
of small-scale agriculture, informal economies and migrant labour. The presence of
urban characteristics such as paved roads, street lighting and sewerage may also be low
(Iaquinta and Drescher, 2000, United Nations Children’s Fund, 2012).
1.5 Structure of thesis
The nine chapters in this thesis are organised into four parts. Part 1 is an introduction to
the thesis, and provides some background to the study. The two main research
questions are addressed in Parts 2 and 3, and Part 4 concludes the thesis.
The present chapter has given an overview of the study; outlining the gaps in existing
knowledge and study objectives. The following three chapters in this part of the thesis
continue to sketch a background of the thesis. Chapter 2 sets the scene by providing an
overview of the existing policy and institutional frameworks contextualising water
supply services in South Africa. It further describes the study communities in the
Limpopo Province of South Africa, and their water supply systems. The findings from
key informant interviews provide useful insights of the context of water supply
problems in the study communities. An overview of the data and methods used in the
study, as well as the sampling procedures, data handling and methods of analysis is
presented in Chapter 3. Key variables used in the analyses of survey data are also
introduced. In Chapter 4, the demographic characteristics of the study sample, as well
descriptive statistics of the key variables are presented.

Chapter 1: Introduction
8
Part 2 addresses the question as to what constitutes a reliable water supply. Chapter 5
considers this question in a broader context, through a literature review of the
definitions and assessment criteria used in studies on water supply reliability. The
review highlights that despite the importance of the subject and the number of studies
that have been conducted, consensus on what is meant by water reliability and how it
should be assessed is lacking. Chapter 6 presents a more local perspective, exploring
household preferences for water supply reliability in the study communities in Limpopo.
Most notably, the results of the discrete choice analysis are useful in highlighting the
value that households place on notification of interruptions.
Part 3 is aimed at investigating households’ responses to unreliable water supplies.
Chapter 7 begins with a conceptual background around coping with unreliable water
supplies, noting some of the early work on the topic. The literature on household
coping strategies is then examined, including the factors that influence choice of coping
strategy, costs of coping and welfare outcomes associated with coping. Chapter 8
presents the results of the survey on household strategies to cope with unreliable water
supplies in Limpopo, including household coping costs, and the ability of household to
meet minimum water requirements. The chapter explores whether Free Basic Water is
in fact ‘free’, and the extent to which ‘basic’ water requirements are being met.
Part 4 gives an overview of the thesis, in which the study objectives and related main
findings are reviewed, as well as its strengths and limitations of the study. The
synthesis chapter, Chapter 9, offers comment on the implications of the work presented,
and some recommendations for future research.

9
2 Setting the waterscape

Chapter 2: Setting the waterscape
10
Before turning to the existing state of water supplies services in the study area, it is
important to outline the context within which these services are located. This chapter
outlines the history of water supply services in rural South Africa, and provides a brief
background of the policy, legislative and institutional frameworks that have shaped
water supply services in the country. The chapter serves as policy reference point for
the empirical work presented in the thesis. The study area is then described, and the
chapter concludes with an overview of the state of water supplies in the area.
2.1 An overview of water supply services in South Africa
The Republic of South Africa was established in 1994, when the apartheid era of white
minority rule was abolished. In the 2011 census, the country’s population was
estimated at just below 52 million (Statistics South Africa, 2012b), and the Human
Development Index ranking for 2012 is 121 out of 187 countries. GDP per capita (PPP)
was US$9,594 and life expectancy for both men and women was 53.4 (United Nations
Development Programme, 2013). The country boasts the largest and most industrialised
economy in Africa, with an estimated two thirds of the population now living in urban
areas.
Despite being one of the emerging economic powerhouses along with China, Brazil,
Russia and India, huge socio-economic inequalities exist between urban and rural areas.
In 2010, 66 % of households in urban areas sourced their main income from wages and
salaries, compared to 43 % in rural areas. A third of rural households depended on
remittances and social grants or pensions, and two thirds survived on less than $2 a day
(Turok, 2012). As in most other countries, a major reason for these inequalities is the
differences in economic opportunities in urban and rural areas, and particularly in South
Africa, the aftermaths of the apartheid era.
2.1.1 The legacy of apartheid
When the country’s first democratically elected government came into power in 1994,
they inherited substantial backlogs in public services, of which water supply is a prime
example. An estimated 12 million people – close to one third of the country’s
population – were without adequate supply to drinking water (Republic of South Africa,
1994).

Chapter 2: Setting the waterscape
11
The majority of those without water supply services were in rural areas formerly known
as ‘homelands’ or ‘reserves’. These homelands were administrative territories created
by the apartheid government in which the country’s African ethnic groups were made to
settle in (Van Koppen et al., 2005). Much of the land in the rural areas was infertile,
limiting the potential for self-sustaining economic activity.
Control over water resources was unequally divided between the white central
government and the black ‘homelands’, which comprise most of rural South Africa.
While the central government invested heavily in infrastructure and services in white
communities, the black rural areas remained largely underdeveloped (Tissington et al.,
2008). In these areas, the management of water supply was under partial control of
local chiefs and tribal councils. Because of the systematic underdevelopment and
consequent poverty in these areas, water and other public services were heavily reliant
on whatever finances were provided by the central government (Cothren, 2013).
2.1.2 Legislative, policy and institutional framework
Since 1994, water service provision in the country has focused on extending water
services to rural areas where they were previously non-existent, and improving /
upgrading existing water services that are rudimentary. To facilitate this process, the
government set about establishing various legislative, policy and institutional
frameworks for water services as summarised in Table 2.1.
The Reconstruction and Development Programme (RDP) is viewed as the major
statement of intent by the post-apartheid government in tackling the huge inequities that
existed in the country. As the blueprint for socio-economic development, the RDP
aimed to redress social, economic and spatial inequalities that existed in various public
services, infrastructural development etc.

Chapter 2: Setting the waterscape
12
Table 2.1: Main legislative and policy documents relating to the provision of water supply
services in South Africa
Document Brief description of objective
White Paper on Reconstruction and
Development Programme (1994) Sets out the framework for socio-economic policy in
post-apartheid South Africa
White Paper on Water Supply and
Sanitation Policy (1994) Sets out policy and institutional goals related to water
services
Constitution of the Republic of South
Africa (1996) Establishes access to water as a human right, and binds
national, provincial and local government to the
realisation of the right
Water Services Act(1997) Legislates access to water by clarifying the role of
water services institutions
National Water Act (1998b) Governs water resource management by legislating the
way in which water resources are protected, used,
developed, conserved, managed and controlled
Municipal Structures Act (1998a) Provides for the establishment of municipalities in
accordance with the requirements relating to categories
and types of municipality and to provide for an
appropriate division of functions and powers between
categories of municipality. The Act allocates the
responsibility for water services to the District
Municipality or the local municipality if authorised by
the Minister of Provincial and Local Government.
Municipal Systems Act (2000) Outlines the specific duties of and requirements for
municipalities, and distinguishes between the functions
of a water service authority and that of a provider. It
also identifies the importance of alternative
mechanisms for providing municipal services and sets
out certain requirements for entering into partnerships.
Strategic Framework for Water
Services(2003) Sets out the national framework for water services,
including norms for water service coverage and quality
and aligns policies, legislation and strategies in the
provision of water services
Free Basic Water Implementation
Strategy (2007) Targets water needs of poor household by guaranteeing
a free minimum quantity of water
National Water Services
Infrastructure Asset Management
(IAM) Strategy (2010b)
Establishes DWA as sector leader in guiding and
empowering water service institutions in management
of water service infrastructure and assets, and ensuring
optimal utility from water service infrastructure through
reliable and sustainable service provision
National Water Services Regulation
Strategy (draft) (2010c) Establishes DWA as national regulator of water
services, whose objective is the protection of the
consumer and public interest
The RDP set out a three-phase programme for universal water services in South Africa.
In the immediate term, the programme aimed to ensure that all households had access to
at least 20-30 litres of water per capita per day (ℓcd), and within 200 m. Thereafter, the

Chapter 2: Setting the waterscape
13
medium term goal was to provide on-site supply of 50-60 ℓcd and in the long term,
supply on demand (African National Congress, 1994). The White Paper on Water
Supply and Sanitation Policy gave effect to the RDP immediate term goal of supplying
20-30 ℓcd within 200 m, as a minimum standard for basic water supply (Smith, 2009).
The right to water is enshrined in the constitution, whose Bill of Rights state that
everyone has the right to have access to sufficient water (Republic of South Africa,
1996). The Constitution binds national, provincial and local government to realise this
right.
Along with water policy and legislation, the institutional frameworks for provision of
water services in South Africa also underwent transitions. While water services were
heavily centralised under the apartheid government, the present day approach is to shift
the delivery and management of these services from national to local government. The
national government has the responsibility of establishing frameworks that enable the
realisation of the right to water, while local government is tasked with the actual
delivery of water to communities (Gowlland-Gualtieri, 2007).
At the level of local government, Water Service Authorities (WSAs) are responsible for
ensuring access to water services within their area of jurisdiction. A WSA may be a
metropolitan, district or local municipality, or a rural council. The operational
responsibility of providing water services in the WSA’s area of jurisdiction lies with a
Water Services Provider (WSP). WSAs may perform the functions of the WSPs
themselves, contract an external entity to act as WSP or set up a joint venture with
another water services entity to provide water services (Republic of South Africa, 1997).
For instance, the City of Cape Town acts as both the WSA and the WSP within its area
of jurisdiction, while in Durban, Ethekwini Metropolitan Municipality is the WSA and
Umgeni Water is the WSP.
Under the mandate of the Constitution and the Water Services Act, the national
Department of Water Affairs (DWA) monitors the performance of all water service
institutions. The specifics of this role have been somewhat unclear until the recent
drafting of the National Water Services Regulation Strategy (Department of Water
Affairs, 2010c). The main objective of the Strategy is stated as “the protection of the
consumer and public interest” (Department of Water Affairs, 2010c). The Strategy
outlines DWA’s role as the national regulator of water services, and tasks the

Chapter 2: Setting the waterscape
14
departments with providing support and encouragement for performance improvement
of WSAs. WSAs themselves have a regulatory function at local level, by ensuring good
performance of their WSPs who are tasked with the operational responsibility of
providing water services.
The decision surrounding the institutional arrangements for the provision of water
services is governed by Section 78 of the Municipal Systems Act, which describes the
process of delineating or appointing a WSP. Essentially, the process entails a status quo
assessment of the municipality’s infrastructure, water resources, financial resources and
institutional capacity. Internal service delivery mechanisms are then assessed, and a
decision is then made as to whether the services should be provided internally or
externally (Tissington et al., 2008).
2.1.3 Funding mechanisms
With the devolvement of power to local government, municipalities now bear the
financial and technical responsibility of providing water services. Much of the focus
has been on eliminating backlogs in water services. While most urban municipalities
can generate sufficient revenue from internal tariff cross-subsidies, in rural
municipalities where a substantial proportion of households may be poor the situation is
problematic.
Unlike many other countries in sub-Saharan Africa that have relied strongly on donor
funding, South Africa has largely funded water supply and sanitation programmes itself
(Water and Sanitation Program, 2011). To facilitate the elimination of service backlogs,
the national government provides various grants, the main ones being the Municipal
Infrastructure Grant (MIG) and Equitable Share (EQ). The Municipal Infrastructure
Grant (MIG) is a conditional grant for capital investment. Specifically, the grant is
designed to fund the capital costs of providing basic service infrastructure for poor
households, with the ultimate goal of removing backlogs in basic water services by
2013 (Department of Water Affairs and Forestry, 2002).
The Equitable Share (ES) is intended to subsidise operating costs, particularly for poor
households. The subsidy contributes to the general operating budget of municipalities
in which the operational costs of delivering water services exceeds the amount that is
billed to poor households. The grant is unconditional, thus municipalities are not

Chapter 2: Setting the waterscape
15
obliged to report how it is allocated or spent (Department of Water Affairs and Forestry,
2002, Tissington et al., 2008).
2.1.4 Free Basic Water services
The implementation of the subsidies for poor households is through the Free Basic
Water (FBW) policy. Prior to 2001 when FBW was implemented, all water consumed
had to be paid for, which meant that even with the extension of water services to
previously un-serviced areas, the services remained out of the reach of poor households.
FBW was introduced to ensure that all households, particularly the poor, households
have access to water supplies. Under the policy, each household receives a ‘basic’
supply of 6,000 litres of water free of charge each month. Assuming an average
household size of 8 persons, this equates to 25 litres per capita per day (ℓcd), and
consumption above this amount incurs charges (Department of Water Affairs, 2007). In
rural areas and informal settlements where the common mode of supply is communal
taps, it is assumed that households are unlikely to use over 6,000 ℓ per month, thus
water is not charged for.
In essence, the FBW policy subsidises the operation and maintenance costs of providing
a basic water supply service, which is defined as the provision of basic water supply
infrastructure, its sustainable operation and the communication of good water-use,
hygiene and related practices. The sustainable operation is qualified as the availability
of water for at least 350 days per year, with interruptions not exceeding 48 consecutive
hours per incident (Department of Water Affairs, 2003).
Basic water supply infrastructure is in turn defined as infrastructure necessary to supply
25 ℓ of potable water per capita per day, within 200 m of the household and at a
minimum flow rate of 10 ℓ/min in the case of communal water supplies. In the case of
yard or household connections, the quantity is 6,000 ℓ of potable water supplied to each
formal connection per month (Department of Water Affairs, 2003).
At the time of writing (May 2014), the Department of Water Affairs is in the process of
reviewing its water policies, including the Free Basic Water policy (Department of
Water Affairs, 2013). The proposed changes would see a shift from providing the basic
allocation to all households, to a targeted approach in which the Free Basic Water is
provided only to indigent households.

Chapter 2: Setting the waterscape
16
2.1.5 Cracks in the rural water service pipeline
With these policy, legislative and institutional frameworks in place, it is perhaps
unsurprising that South Africa’s approach to water resources and service provision has
been widely lauded as being among the most progressive in the world (MacKay et al.,
2004, Movik, 2011, Tarmann, 2000). However, closer scrutiny suggests that the
situation on the ground is rather complex. In theory, access to water is recognised as a
human right, and equity in service provision is emphasised as being imperative to
alleviating poverty, improving health and promoting economic development. In reality,
controversies exist over whether these policies have actually translated into tangible
improvements, particularly for previously marginalised poor rural households.
The reasons for these controversies are diverse, but perhaps of greater interest to the
study presented herein are those relating to FBW and the reliability of rural water
supplies. The definition of basic water services sets out criteria for quantity, distance,
quality and reliability, and the Department of Water Affairs (DWA) is tasked with the
overall monitoring and national regulation of the water services. In reality, such
regulation on the part of DWA appears to predominantly focus on the monitoring of
water quality in urban areas, and much of the regulation of other aspects of water
services is left to local municipalities (Tissington et al., 2008).
In turn, the overriding concern of rural municipalities appears to be meeting the distance
criterion by providing infrastructure within 200 m. In some rural communities of
Limpopo, the 25 ℓcd allocation is not met, water supply is unavailable for weeks on end
and the quality of water consumed at the point of use does not meet national drinking
water quality standards, but the majority of taps are within 200 m (Majuru et al., 2012).
According to the Department of Water Affairs, although 97 % of the country population
were reported to have access to basic water supplies by 2010, “the figures only reflect
infrastructure provided and do not reflect quality of on-going service provision”
(Department of Water Affairs, 2010).
Although the microbial quality of water supplied at the communal taps generally meets
national standards, the quality at the point of use often does not, due to re-contamination
of the water during transportation, handling and storage. The DWA maintains that its
responsibility in relation to monitoring of water quality ends at the tap as the point of
use, and in the case of communal water sources the responsibility of ensuring safe water

Chapter 2: Setting the waterscape
17
quality beyond the point of collection lies with the Department of Health (Swart, 2013).
However, it is not clear how, and the extent to which this responsibility is carried out by
the Department of Health.
In relation to water quantity, it is perhaps worth reiterating here that the 25 ℓcd
allocation was only intended as an initial target to ensure that there was “some for all,
rather than all for some” (Republic of South Africa, 1994), particularly for rural areas
that had previously had no water services at all. Thus, rural water supply projects were
to be constructed in consultation with communities and with the capacity for upgrading,
in accordance with communities’ desires for higher levels of service (Department of
Water Affairs, 2003, Republic of South Africa, 1994).
However, in many rural water supply projects the 25 ℓcd has become a de facto
maximum; projects are constructed with permanent assumptions of 25 ℓcd and
relatively constant populations (Bond and Dugard, 2008). The potential for service
upgrade is limited by the use of small pipes, low abstraction capacity in the case of
groundwater resources and communal sources. In some municipalities, even
households that can afford to upgrade to a higher level of service such as a yard or in-
house connection are discouraged from doing so as it diverts the focus from meeting
backlogs in basic services (Tissington et al., 2008). As a result of these frustrations,
vandalism and hosepipe connections from the communal taps are not uncommon.
In a country in which an estimated 10 % of the population were living with HIV in 2013
(Statistics South Africa, 2013a), the adequacy of the FBW allocation for basic domestic
needs, let alone the increased hygiene needs of those who may be ill, has been heavily
criticised (Smith, 2009).
The potential for productive use of water and livelihoods under this 25 ℓcd allocation is
also slim. The limited evidence on water and livelihoods suggests that a supply of 50-
150 ℓcd within 150 m is the level of service at which significant productive use of water
occurs (Smits et al., 2010). Even then the water supply has to be reliable, which has
been difficult to achieve in rural water supplies in the country.
The often cited reason for unreliability of rural water supplies is the limited potential for
cost recovery from largely poor households. Although funding such as the Municipal
Infrastructure Grant and Equitable Share can still be drawn from national government,
municipalities are increasingly being urged to become financially self-sufficient and

Chapter 2: Setting the waterscape
18
implement cost-recovery mechanisms (Tissington et al., 2008). Ironically, while
allowing for productive uses in water supply is likely to improve the ability of rural
households to pay for water services or at the very least contribute towards the
maintenance of the water supply systems (International Water Management Institute,
2006), there is a reluctance to move these households up the service ladder.
The resulting implication is that by restricting rural / peri-urban households to the
minimum level of service, this perpetuates the cycle of households not being able to
generate livelihoods from the water supply, poor or even no cost recovery for water
service providers, and unreliable water services. Thus, for many rural households, the
viability of free basic water supply services as a poverty alleviation and health
promotion mechanism is yet to be proven.
2.2 The study area
The study is set in the Vhembe District of Limpopo Province, in the northern parts of
South Africa (Figure 2.1). The district is largely rural, and consists of two territories
that were the former homelands of Venda and Gazankulu. According to the 2011
census, the estimated population of the province is just over 5,4 million (Statistics South
Africa, 2012b), making up almost one tenth of the country’s total population.
Figure 2.1: Map of South Africa and location of Limpopo Province
Source: http://www.bbc.co.uk/news/world-africa-11532759

Chapter 2: Setting the waterscape
19
The median age in the province is 22 years; slightly below the national median of 25. A
quarter of the persons aged 15 years or older are functionally illiterate i.e. they either
have no schooling, or their highest educational attainment is less than Grade 7, which is
the highest level of primary schooling in the country.
The average household size in the province is 3.8 (Statistics South Africa, 2012a).
Households in the province have the lowest average annual income of R56,844
(US$6,633), compared to the national average of R103,204 (US$12,0421). A third
(33.1 %) of this income is from social grants2 and almost one fifth (17.7 %) is from
remittances3 (Statistics South Africa, 2013b).
Access to piped water in the yard/ dwelling in Limpopo Province is among the lowest in
the country. While results from the 2011 census indicate that 73.4 % of the country’s
population had piped water within the yard / dwelling, in Limpopo Province just over
half (52.3 %) of households have piped water in the dwelling or yard, 33.7 % have
piped water outside the yard, and the remaining 14 % are reported to have no access to
piped water (Statistics South Africa, 2012b). Diarrhoea remains the leading cause of
death among children aged under 5 in the country, and in Limpopo Province accounted
for 22 % of deaths in the period 2006-2009 (Statistics South Africa, 2012e).
2.2.1 The study communities
The communities in which the study was conducted are located in the peripheries of
Makhado town, formerly known as Louis Trichardt. The town lies at the foot of the
Soutpansberg Mountain Range, on the main route linking South Africa to Botswana,
Mozambique and Zimbabwe.
Rainfall is low and temperatures relatively high in the areas west of Makhado and
north-west of the mountain range, with the vegetation mainly being savannah plains and
thorn bushveld. East of the town, temperatures are mild and rainfall relatively high,
with lush sub-tropical vegetation. Game and cattle ranching, forestry and farming of
sub-tropical fruits such as avocados, litchis and bananas are the main agricultural
activities (Makhado Municipality, Unknown).
1 Exchange rate in 2012 of US$1: ZAR8.57
2 Social grants refer to welfare support for older persons, people with disabilities, war veterans, care
dependents, foster children and general child support. 3 Remittances refer to money transfers from family members
Chapter 2: Setting the waterscape
20
The three study communities can be described as transitioning from rural to peri-urban.
Formerly part of the Venda ‘homelands’, the communities now fall under the
jurisdiction of the greater Makhado Local Municipality, and have strong urban
influences. Due to the close proximity and ease of access to Makhado town, the
communities are expanding rapidly. Settlements are relatively dense, as an increasing
number of people opt to commute from these areas to work in Makhado town centre.
2.2.2 Communities 1 and 2
Communities 1 and 2 are located in the areas known as Sinthumule-Kutama,
approximately 9 kilometres south-west of Makhado town. The area is dry, and
comprises about 19 villages spread over 19,000 hectares of flat plain (Wainwright,
1983). The groundwater is saline and has high nitrate concentrations (Wainwright,
1983). High calcium and magnesium content also make the water hard, and incrustation
of water pipes is a recognised problem in the area (du Toit, 2002).
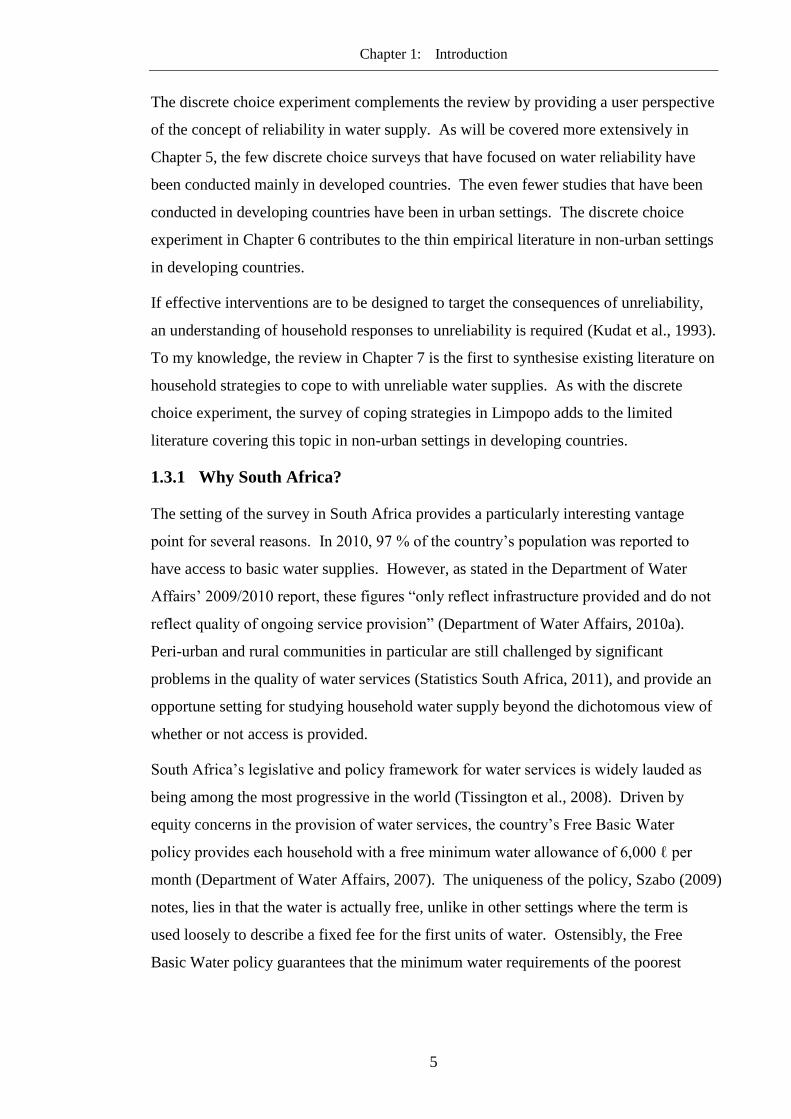
Water sources in the study communities are generally those classified as improved
sources, according to the WHO/UNICEF Joint Monitoring Programme for water and
sanitation (WHO/UNICEF, 2011). Shared water supplies in the area are in the form of
communal taps (Figure 2.2). The water supply is drawn from groundwater that is
accessed through several boreholes that have been drilled around the communities.
Figure 2.2: A communal tap in Community 1
Source: Author

Chapter 2: Setting the waterscape
21
From these boreholes the water is pumped to three reservoirs in the area. The water is
then chlorinated while in the reservoirs, before being distributed under gravity feed to
communal taps though a network of pipes. There are 28 communal taps in Community
1, and 57 in Community 2. Vhembe District Municipality is the water service authority,
and Makhado Local Municipality is the water service provider. This means that while
Vhembe District Municipality is responsible for providing access to water services in
the area, the operational responsibility of delivering the water supplies lies with
Makhado Local Municipality. Because the supply from the communal taps is
intermittent, the two communities also have water delivered by a municipality tanker
each week. The tanker draws treated water from Makhado town on a given day and,
over several trips, delivers water around the communities. Households queue up at
designated spots and collect water from the tanker in an assortment of containers;
including 20-ℓ plastic jerry cans, buckets and 5-ℓ bottles.
Figure 2.3: Drilled well and storage tank in Community 2
Source: Author

Chapter 2: Setting the waterscape
22
Some households in the area have privately set up boreholes in their yards. Water
abstracted from these boreholes is pumped to a storage tank (Figure 2.3), which may be
connected to a yard tap or to taps in the house. Due to the high salinity of the
groundwater, some of these households who have privately drilled boreholes rely on
municipal tanker supply for their drinking water, and use the water from the boreholes
for domestic purposes other than drinking.
2.2.3 Community 3
Community 3 (C3) is located north-east of Makhado town, in the area known as
Tshifhire-Maleula. The area is hilly, with lush vegetation, numerous springs and
frequently enveloped in mist rolling off the tops of the Soutpansberg mountain range.
Public water sources are communal taps and protected springs. The community has a
small treatment plant (Figure 2.4) which draws raw water from a river in the area. The
water is diverted to a weir close to the plant, from where it is pumped up for treatment.
There are 27 communal taps in the area. Because of the hilly terrain, the municipal
supply does not reach some of the households that higher up along the hills. These
households rely on protected springs as their main source of water. ‘Private supply’ in
Community 3 consists of households with municipal connections into the yard / house,
Figure 2.4: Water treatment plant in Community 3
Source: Author

Chapter 2: Setting the waterscape
23
or those that have privately connected pipes from the protected springs in the area to
storage tanks in the yard.
2.2.4 Water supply problems in the study communities
From interviews with water supply technicians in the study communities, several factors
affecting the water services were cited. In Communities 1 and 2, the main problem
cited was that the boreholes that supply water to the community reservoirs often do not
function well. Depending on the size of the reservoir, filling it up can take up to four
days if there are problems with one or more of the boreholes. According to the
technician, none of the boreholes can go for three months without breaking down. Once
broken down, repairs are often late in coming. The boreholes are managed by the
Vhembe District Municipality (Makhado Municipality, 2012).
Apart from the machinery breaking down, vandalism and theft of cables and
transformers linked to the pumping devices are also common. Further, because the
groundwater in the area is hard, water pipes often become blocked from the build-up of
minerals.
In Community 3, the major problem cited was that the plant capacity is only 864 ℓ,
which is insufficient to supply the entire community. In order to boost the water supply,
staff at the treatment plant work in 24-hour shifts. Even then, the water is not enough to
meet the needs of the estimated 12,900 people living in the community. Further, there
are not enough booster pumps in the distribution network to ensure that the water is of
sufficient pressure to reach households located further up on the hills.
As in Communities 1 and 2, vandalism and theft of plant machinery and cables also
pose significant problems for the community’s water supply. Many of the copper
faucets on the communal taps and other metallic parts in the distribution network are
stolen and sold to scrap metal dealers.
Agricultural activities and waste management practices in the area also impact on the
operation of the treatment plant. Many households in the area cultivate avocados for
commercial purposes. However, because the terrain is hilly, a lot of the surface run-off
that occurs in the rainy months of November to March ends up in the river from which
the plant’s raw water is drawn. The water becomes highly turbid, which the plant is not
designed for. Treatment is suspended until most of the sediment has settled in the
bottom of the weir and the water is clearer. At the time of the interview, the water in

Chapter 2: Setting the waterscape
24
the weir was indeed muddy (Figure 2.5) and plant operations had been suspended until
the mud settled.
In relation to waste management, the major issue cited is that waste material such as
plastic bags and disposable nappies end up in the river, and consequently block pipes at
the canal. At the time of the interview, the community had recently been without water,
due to pipes in the weir being blocked, and the pumps that draw water into plant not
working properly. The Department of Water Affairs’ Vhembe District office had been
informed, and they in turn had sent out a contractor to fix the problem. The contractor
had unblocked the pipes, but replaced the pumps with those that were equally faulty.
From the time that the pipes got blocked to the time the problems with the contractor
were resolved, the plant had not been operating for six weeks.
Conclusions
This chapter has outlined the transitions that have taken place in relation to water
service in South Africa since 1994. These transitions have been facilitated by
legislative, policy and institutional frameworks which seek to achieve the goal of
universal and equitable access to water in a progressive manner, particularly in rural
communities. Laudable as these reforms are, their implementation has been
Figure 2.5: Weir in Community 3
Source: Author

Chapter 2: Setting the waterscape
25
problematic. The chapter locates these problems within the Free Basic Water policy
which appears to have stagnated at providing basic water supply infrastructure with the
quality of services receiving less consideration.
26
3 Methods

Chapter 3: Methods
27
This chapter lays out the general research strategy and techniques applied in addressing
the empirical component of the study. The survey design, sampling process and key
variables are described. Some general information about data collection and analyses is
outlined; the specific methods are detailed in each chapter as appropriate. The chapter
concludes with an outline of the preliminary statistical analyses for the key variables.
3.1 Background
The data for the study were collected alongside that of a larger multi-country study
funded by the United Kingdom’s Department for International Development (DfID) in
Ghana, South Africa and Vietnam. My involvement in the DfID study and how it
relates to the study presented herein are outlined in the following sections.
The DfID study was aimed at assessing whether at-house / in-house water supplies have
significantly greater health, social and economic benefits than shared / communal water
supply (Evans et al., 2013). Of key interest therefore, was the relationship between
water source (in / at-house or off-site), usage and selected health and socio-economic
outcomes.
This relationship is complex and often is mediated by various factors. In my
involvement with the DfID study, I specifically sought to address the role that water
supply reliability plays in this relationship. I contributed to the design of the study and
the development of survey instruments. The same survey instruments were used in the
data collection in the three study countries. I was responsible for the management of the
fieldwork in South Africa, where I assisted in training the fieldworkers and then
supervised the data collection and management.
The data for the study were collected in collaboration with Tshwane University of
Technology (TUT), a South African university based in Pretoria. Under the
collaboration TUT provided local support relating to liaison with communities and
recruitment of field assistants. My current involvement with the DfID study is in data
analysis, writing the report to DfID (Evans et al., 2013) and subsequent publications.
The DfID study upon which this thesis is built essentially tests the association between
level of water service (at / in-house and communal water supplies) and selected health,
social and economic outcomes in the three study countries. The empirical work
presented in this thesis is complementary to the DfID survey in South Africa, and

Chapter 3: Methods
28
explores reliability in more detail, by exploring households’ preferences for reliable
water supplies, strategies to cope with unreliable supplies and the consequent
implications for the country’s Free Basic Water policy.
3.2 Research strategy
The study design was a mixed-methods cross-sectional survey, utilising a variety of data
collection techniques. Quantitative research methods used were: structured and semi-
structured questionnaires on household characteristics, health, coping strategies and
coping costs; and discrete choice surveys to elicit households’ preferences for reliable
water supplies. Qualitative methods were used to collect background information on
the study area, and included key informant interviews with operators of water treatment
plants, and structured community observation sheets.
Designing a research study entails a number of decisions and is often a balancing act of
competing needs, a prime example being the need to balance project resources with the
scope of enquiry. While it would have been ideal to investigate water supply reliability
over a longer period of time in each of the three study countries, this was not feasible
within the project budget. Due to the same practicalities, the study presented in this
thesis is embedded within the broader design of the DfID study. The study also draws
on some of the complementary data from the DfID study, such as households’ socio-
economic profiles and existing water services.
3.2.1 Sampling
The basic sampling unit in the study was the household, as all members of the
household would likely share the same water sources. The term ‘household’ requires
some clarification here, as it can have significant implications on measures such as
water consumption and household wealth.
In the study setting, households can be made up of nuclear, multigenerational or
extended families. Owing to migration to urban areas, a number may be further
classified as ‘split households’, in which family members who would ‘normally’ be
living in the same residence actually live elsewhere. In the survey, a household was
defined as a group of people who lived and ate together. To account for visitors or
migrant family members, persons usually residing in the house for less than six months
of the year were excluded from the analyses.

Chapter 3: Methods
29
3.2.1.1 Sample size
Because the DfID study had multiple outcomes of interest (binary, count and scalar), the
sample size was computed to account for these different outcomes. A sample size of
200 households was deemed sufficient to detect an outcome affecting 10 % of the
population using a power of 80 %, and a significance level of 5 %. A detailed
explanation of the approach used in determining this sample size is included in
Appendix 3.1.
With the difference between in / at-house and communal water supplies underpinning
the study, sampling from a general population would unlikely provide sufficient
resolution for this comparison. The need to sufficiently balance this mix in level of
service with ability to generalise findings was met through semi-purposive selection of
the study site, followed by stratified random selection of households.
3.2.1.2 Site selection
Selection of the study site was based on a number of methodological and practical
considerations. The criteria for selecting the study site were as follows:
Representation of peri-urban and / or rural areas in which people are provided
with a variety of water supply service levels and technologies i.e. private and
shared water supplies;
The location of homes and water source points used by the community have been
or can be readily mapped;
Established working relationships with a core institution;
Permission to access and work in the area is granted by the appropriate local
authorities, community members generally willing to participate in the study.
Of key importance in the DfID study was that the selected site would exhibit the various
levels of water services i.e. shared / communal water supplies, in-house connections or
yard connections, while still being broadly comparable to other poor communities in the
country and region.
Vhembe District, located in the Limpopo Province of South Africa, was an opportune
setting for a number of reasons. The province itself is mainly rural, and until fairly
recently, had substantial backlogs in water and sanitation service provision (Department
of Water Affairs, 2011, van der Merwe, 2011). According to the results of the 2011

Chapter 3: Methods
30
census, 43.5 % of households in Vhembe District have access to piped water in the yard
/dwelling compared to the national average of 73.4 %. The majority (44.8 %) access
water outside the yard/dwelling and the remaining 11.7 % have no access to piped water
(Statistics South Africa, 2012a).
An understanding of the local context is a key component in any field study and perhaps
more so when working across cultures and languages. I have previously been involved
in environmental and epidemiological research in various parts of the district through
Tshwane University of Technology in South Africa, where I obtained my previous
qualifications. In the process, I had also visited the study communities investigated in
this thesis and owing to their variability in environmental factors which likely affect
water access such as elevation and terrain, as well in levels of water service, had
identified them as potential study sites.
3.2.1.3 Sampling frame and household sampling
The sampling frame for the survey was two village clusters in the peripheries of
Makhado town, in Vhembe District. Sinthumule in the south-west of Makhado town
comprises approximately 10,000 households spread out over 9 communities. Tshifhire-
Maelula is situated north-east of the town, and is essentially one large village of
approximately 1,000 households.
The survey was preceded by another survey conducted by the collaborating institution,
Tshwane University of Technology in 2011. During this time all households and
communal water sources were mapped using Global Positioning System (GPS) devices.
Where possible, an indication of the water source (in / at-house) was provided. The
coordinates from the mapping exercise were then used to generate unique identities for
the households and water sources.
The identities generated from this preceding study were used to facilitate sampling of
households. Households were selected through stratified random sampling to include
households using public water supplies and those using private supplies. Owing to the
practical logistics of carrying out the survey and the related transport costs, the decision
was made to include only a sub-sample of the nine communities in Sinthumule. Two
communities were randomly drawn from the nine communities in Sinthumule. From
these two communities (Community 1 and Community 2) 100 households were
randomly selected, and an additional 100 randomly selected from Tshifhire-Maelula.

Chapter 3: Methods
31
3.3 Data collection
A combination of quantitative and qualitative approaches was employed to collect data,
so as to provide a comprehensive picture within the setting studied. For the quantitative
component, the household surveys were the data source. These surveys were supported
by key-informant interviews, as well as community observation checklists.
3.3.1 Household surveys
The survey was in two parts. Part 1 related to household demographics, history of water
services in the community, reliability of the water supply, perceived risks from the
water supply, strategies to cope with unreliability of the water supply and the coping
costs. Part 2 was a discrete choice experiment of households’ preferences for water
supply reliability, and included sections on the respondents’ characteristics, an
introduction to the choice experiment and the choice sets.
These instruments were designed using a number of sources. The starting point for
gathering the study population’s perspective and experience of water supply services,
and the legislative frameworks guiding these services was published and grey literature,
including water policy documents. Other resources were survey instruments used in
previous studies and the World Bank’s Living Standard Measurement Survey (LSMS)
guidance manual (Grosh and Glewwe, 2000).
The original surveys instruments were compiled in English. They were then translated
into the local language of TshiVenda by a field assistant, who is fluent in both English
and TshiVenda, and has basic understanding of the key concepts of the subject under
investigation. The TshiVenda versions of the survey instruments were then back-
translated by a professional translation service, to determine whether the content
matched that in the original survey instruments.
To evaluate the survey instruments, preliminary drafts were circulated among
individuals from the collaborating institution for review during the design phase.
Cognitive interviews were conducted with the fieldworkers during their training, and a
field test of the instruments was also run prior to the implementation of the survey.
3.3.2 Key informant interviews
Key informant interviews with water supply technicians in the study communities were
valuable in balancing the picture of water supply services in the communities, providing

Chapter 3: Methods
32
some insights into the water problems from the supplier perspectives. ‘Key informant’
as used in this sense refers to individuals interviewed owing to their first-hand
knowledge about the topic under investigation. As the persons tasked with the
operation of water supply systems in the communities, the technicians were deemed
knowledgeable on the operational problems facing the water supplies.
The interviews were semi-structured, with a set of key themes used as a general guide.
These themes included: a description of the water supply technician’s job
responsibilities; how water is supplied to the study communities; challenges
encountered in their role as water supply technician; reasons underlying these
challenges and potential solutions to the problems in the water supply.
As an opening question, the technicians were asked to provide some background about
themselves and their job in the municipality. The sequencing of the themes to be
covered was flexible, and generally determined by the flow of the interview. At the end
of each interview, the opportunity to raise issues of potential relevance that had not been
covered in the interview was provided. Interviewees were asked: “Is there anything that
we did not discuss that you would like to share?”
Separate interviews were conducted with the technicians in the two village clusters.
The interviews were conducted through face to face interaction, and recorded on a
digital recorder. Prior to the interview, the purpose of the study was explained, as well
as the interviewees’ rights and assurances in line with principles of research ethics. It
was also made clear that their identities would remain anonymous in all publications
ensuing from the study. Such anonymity was maintained by not naming the
interviewees, and not naming the communities that they work in; the communities are
referred to as Communities 1, 2 and 3 throughout the thesis. The interviews were
conducted largely in TshiVenda, with the field assistant acting as the English-
TshiVenda translator.
3.3.3 Community observations
A profile of each community was compiled prior to commencing fieldwork. Structured
observation sheets were used to collect data on the status, extent and usage of
communal water supplies, solid waste disposal facilities and general housing and
environmental conditions in the area. As with the key informant interviews, these

Chapter 3: Methods
33
observations mainly served the purpose of providing context and texture to the data
collected from the surveys.
3.3.4 Fieldworkers
Fieldworkers were recruited from the study area. Amongst the requirements for
recruitment were fluency in both local TshiVenda language and English, literacy and
numeracy skills sufficient for the data collection requirements of the study, and an
understanding of the cultural norms and appropriate behaviours in the study sites. I
delivered training on ethics requirements, consent, the survey instruments and field risk
assessment. Training methods used included Round Robin discussions, vignette case
studies, group discussions and role plays.
3.3.5 Ethics and household recruitment
Ethical approval to conduct the study was granted by the research ethics committees of
the University of East Anglia (Appendix 3.2a) and Tshwane University of Technology
(Appendix 3.2b). Formal permission to work in the area was obtained from the local
tribal council. A meeting was held at the Sinthumule-Kutama Tribal Council, during
which the overall purpose of the project was explained to the tribal leadership in the
area and community members who were in attendance.
Before commencing work in each of the three communities that were finally selected
for inclusion in the study, informal meetings were held with the community headmen.
This was mainly to establish rapport and provide an opportunity to address any further
questions or queries that communities may have had.
At the households, voluntary and informed consent was sought from an adult normally
responsible for dealing with water supply-related issues; usually the female spouse in
the household. It was made clear to respondents that their participation in the study was
entirely voluntary, and that although permission to work in the communities had been
granted by the respective tribal leadership, this did not mean that households randomly
selected for the study were obliged to participate. No incentives were offered to
households participating in the study.

Chapter 3: Methods
34
3.3.6 Survey procedures
This survey was conducted from September to December 2012. This period covers the
two seasons of spring, when the weather is relatively dry and warm, and mid-summer,
when it is hot, humid and raining.
The survey was conducted during the same period as that of the DfID study, and where
possible, amongst the same households. The actual survey visits to the households were
however lagged, to allow respondents time between the two surveys. Where a
household decided that they no longer wished to take part in the reliability survey, they
were replaced with the next one in the list.
The survey was administered through face to face interviews. The questionnaire was
piloted on four households; two with private supplies and two with shared water
supplies. Of key interest in the pilot was to afford the fieldworkers an opportunity to
identify and comment on feasibility and ease of use of the survey procedure and
instruments. Minor modifications to the instruments were made thereafter, relating
mainly to the wording in the local TshiVenda language.
I was also supported by a field assistant from the collaborating institution, who assisted
in liaising with community leaders and the field logistics of transporting fieldworkers to
and from study sites and management of water quality sampling. During data collection,
fieldworkers checked responses for logic, and if unclear, verified the answers with the
respondent. At the end of each day I checked the completed survey forms for gaps and
inconsistencies. Where gaps or inconsistencies were found, fieldworkers were asked to
re-visit the household to fill in or verify the information. Re-training was conducted at
periodic intervals, as each of the fieldworkers was sometimes confronted with unique
challenges. Highlighting these challenges and resolving them as a group meant that the
team could learn from each other.
3.3.7 Key variables
A number of key variables are used in much of the empirical work presented in this
thesis. These key variables and the methods used in the data collection are outlined
below.
Chapter 3: Methods
35
3.3.7.1 Water use
Water use is a variable of key interest in both the broader DfID study and the study
reported herein. In the context of the DfID study, the difference between in / at-house
and communal access to water supply was hypothesised to have an influence on the
quantity of water used, and consequently on hygiene and health as well as livelihood or
productive use of water. However, a key mediator in this relationship is the reliability
of the water supply, and how it influences the quantity of water used.
Data on water use were derived from the DfID survey database. The data were
collected using a combination of direct observation and prompted recall methods. For
households using communal water supplies, respondents were asked to show the
fieldworkers the containers that the water was stored in. From this, the capacities of the
containers could be recorded. Respondents could then give an estimate of the number
of containers of each capacity that were used in the household each day. An estimate of
household water use was then derived by multiplying the number of containers by the
capacity (often 20-ℓ plastic jerry cans).
For households using in / at-house water supplies however, this was more complicated.
Many of the households had drilled their own wells and set up storage tanks with
connections to yard or in-house taps, with no meters. The few that had yard taps
connected to the municipal supply either did not have meters or if they did, the meters
did not work. To help respondents in these households estimate their water
consumption, prompts were used during the survey interviews. Respondents were
asked about the capacity of their storage tanks and how often these tanks were filled.
For instance, a 2,500-ℓ storage tank that was filled every 10 days implied that the
volume used by the household used each day was about 250 ℓ.
3.3.7.2 Household socio-economic status
An assumption made in the design of the study was that in / at-house connections in the
communities studied are costly and often only available to the wealthier households.
Thus socio-economic status was deemed an important confounder that the analyses had
to take into account.
A number of variables from the DfID survey database were used as proxy indicators of
households’ socio-economic status. These were: household income, household wealth
index and a household crowding index.

Chapter 3: Methods
36
Household income
In many developing country settings household income may have multiple streams of
income from for instance, the informal economy, self-employment and causal labour
(Howe et al., 2012). In addition, households may also receive remittances from family
members, or social grants, as was the case in the communities studied. The
measurement of income therefore had to take these multiple sources into account.
In the survey, respondents were asked to estimate i) wage earnings from labour services;
ii) revenue from renting out land e.g. farming or grazing land; iii) revenue from property
rentals; iv) remittances from family members v) social grants such as pensions, child
support etc. and vi) any other sources of income otherwise not covered. Where other
adult household members were present at the time of the interview, they could also
provide some answers on what activities they engaged in and the amount of income
they brought into the household.
Household wealth index
The second socio-economic indicator used was the wealth index. The wealth index
approach arises mainly from the Demographic and Health Surveys (DHS) (Filmer and
Pritchett, 2001, Rutstein and Johnson, 2004), and is now commonly used in low and
middle income countries where income data may not be readily available or reliable. In
the DfID survey data were collected on households’ ownership / presence of key assets
and amenities shown in Table 3.1.
Table 3.1: Asset-based indicators of household socio-economic status
Household assets Household amenities
Radio / radio cassette player Type of flooring
Television Type of roofing
Mobile phone Electricity
Refrigerator Number of rooms used for sleeping
Washing machine
Car
Bicycle
Stove (gas, electric or kerosene)
The underlying principle in asset-based measures of socio-economic status is that
ownership of certain assets provides some insight into households’ wealth. The asset

Chapter 3: Methods
37
variables as well as variables relating to household amenities such as toilet facilities and
electricity are then aggregated into a single composite index for each household.
In relation to possessions such as cars, radios, televisions etc., a key issue that Howe et
al.(2012) raise is the quality, or functionality of the items. Ownership of a washing
machine may suggest that a household is wealthy, but the washing machine may be very
old or non-functional. To address this quality issue, the assets listed in the survey were
only those that were functional.
Household crowding
The household crowding index measures household space in relation to the number of
inhabitants, and has been viewed as a proxy indicator of household socio-economic
status. In the DfID survey, respondents in each household were asked about the number
of rooms used for sleeping, excluding the times when there were visitors staying over.
3.3.7.3 Coping cost
Households respond to unreliable water supplies through various coping strategies.
Parallel to this is the costs that are associated with the various coping strategies. Direct
coping costs refer to expenditures arising from installing fixtures to augment the water
supply such as drilled wells, electric pumps and storage tanks, purchase of water and
treatment of water.
In the case of fixtures, data were collected on the year in which fixtures were installed,
the initial cost of purchasing and installing the fixture as well as the running costs. For
household who bought water from neighbours, data were collected on the unit cost e.g.
the cost of a 20-ℓ container of water, and the estimated total amount spent on water each
month. A similar approach was followed in the case of expenditures on bottled water;
data were collected on the typical capacity of the water bottles, the unit cost of each
bottle and an estimate of the total spent on bottled water each month.
Respondents in each household were also asked about water treatment practices;
specifically the type(s) of treatment as well as the frequency of treatment. Data were
collected on the approximate amounts spent on chlorination products each month, as
well as cost of purchasing filtration devices and the replacement of filters, as a running
cost.

Chapter 3: Methods
38
3.4 Data management and analyses
Survey data were entered into Epi Info 7 (Centers for Disease Control and Prevention,
2012) and SPSS 18 databases (SPSS Inc., 2009). During the data entry, data were
checked further for quality, and any noticeable inconsistences were raised with the
fieldworkers.
A key consideration in the data management was that household data from the two
surveys had to be matched. The household identifiers used were the same as those used
in the DfID survey database to facilitate this matching.
Data from the household surveys were cleaned and checked prior to analysis. The
checking process related mainly to missing data, creation of new variables and
consistency checks with the DfID dataset. The checks and analyses were done in SPSS
18 (SPSS Inc., 2009) and Stata 12.1 (Stata Corp, 2011).
3.4.1 Preliminary steps for key variable data
The preliminary procedures applied to key variable data relate mainly to handling
missing data and the creation of composite variables for use in subsequent analysis.
These procedures are outlined in the sections that follow, while the details of their
application in the analyses are provided in the appropriate chapter.
3.4.1.1 Imputation of missing data
In a typical household survey dataset, there may be unit non-response, in which data for
a sampled household may be completely missing. There may also be item non-response,
in which data may be missing for specific variables (Yan and Curtin, 2010). While there
was no unit non-response observed in the study’s dataset, item non-response was
problematic in some key variables. Missing data for these key variables were imputed
using single and multiple imputation techniques. The rationale behind using these
imputation approaches is outlined in Appendix 4.1.
Single imputation was applied for the variable relating to the year when fixtures were
installed / capital costs incurred, with missing values replaced with the mid-point of the
earliest reported installation date (1981) and the latest reported installation date (2012),
which was 1997.
Multiple imputation was applied for the other variables with missing data; namely water
use, household income and the capital and running costs of fixtures. The method
Chapter 3: Methods
39
employed in the multiple imputation was derived from Rubin (1987). An initial step in
multiple imputation is to explore the patterns and mechanisms of missingness. The
proportions of missing values for each of the key variables are reported in Section 4.3 of
Chapter 4.
The next step is to build the imputation model. The imputation model is the same
model that would be used in the analyses. Thus, for each of the key variables to be
imputed, independent variables were selected that would reasonably be expected to be
related to key outcome variables. Pairwise correlations were run in Stata for each of the
outcome variables, and other variables with a correlation of p value < 0.10 with the key
variable to be imputed were included in the imputation model. These included:
indicators of socio-economic status, such as education, household crowding and assets
owned; number of people living in a household; and type of water supply. Stata offers a
suite of commands which can be used in multiple imputation, whose basic steps are
outlined as:
1. Re-shaping the dataset so that it can accommodate the imputed variables to be
filled in
2. Registering the variable to be imputed
3. Specifying the number of imputations to be run, which in this case was 15
imputations for each of the key variables. The rule of thumb is between 5 to 20
imputations (Baraldi and Enders, 2010), with a complete dataset being generated
each time.
4. Running the imputation model with the specified number of imputations.
Essentially the analyses were performed within each of the 15 datasets, and the
resulting parameter estimate from each dataset then pooled by averaging into one
estimate. The pooling accounts for variation from both within and between
imputed datasets.
As will be shown in the next chapter, some of the variables to be imputed were not
normally distributed. Imputing these variables directly would have resulted in biased
estimates, as many of the popular multiple imputation procedures assume that data are
normally distributed (Sterne et al., 2009). The variables were transformed to their
natural logarithm prior to imputation, and transformed back to their original scale after
the imputation.

Chapter 3: Methods
40
3.4.1.2 Water use
After the multiple imputation, the average of estimates from each of the 15 imputation
datasets was used to calculate daily per capita water use. This was done by dividing the
estimated (and imputed) amount used in household each day by the number of persons
living in the household.
3.4.1.3 Indicators of socio-economic status
Total household income
The total monthly income of each household was calculated by adding up the incomes
from the various sources. The aggregate was then used to construct income quintiles for
the survey sample.
Household wealth index
The wealth index was constructed using Principal Component Analysis (PCA), which is
essentially a data reduction technique that summarises variability among variables
(Howe et al., 2012). The underlying concept is that PCA analyses all the variance in a
given set of variables, then reorganises it into sets of ‘principal components’ which
account for the majority of the variability in the data. The components themselves are
linear combinations of the original variables which are multiplied by a weight or
eigenvalue which describes the principal component. Much of the variance in the data
is explained by the first component, with the subsequent components accounting for
progressively lower proportions of the remaining variability. Since most of the variance
is captured by the first component, the common practice is to use only this first
component in the wealth index.
In the context of the household asset and amenity variables presented earlier in Table
2.1, the application of PCA reduces the variables into a single composite wealth index.
The wealth index was created following the method of Filmer and Pritchett (2001).
PCA was performed in SPSS, and the first component retained. The index was
computed using the score command, to produce an index for each household. As with
the household income data, quintiles were then constructed in order to categorise
households in various socio-economic groups.
Following Balen et al. (2010),Cronbach’s alpha statistic was used to determine the
internal consistency of the wealth index. In this context, the test can be used to

Chapter 3: Methods
41
determine the extent to which the variables included in creating the index measure a
single latent concept or variable i.e. wealth.
Household crowding index
The number of rooms used for sleeping provides some indication of the extent of
crowding in households. The household crowding index was calculated by dividing the
number of household members by the number of rooms normally used for sleeping.
3.4.1.4 Coping costs
The total coping costs for each household were estimated by summing up the various
cost components. The costs of capital expenditures such as those relating to drilling
wells, installing electric pumps and storage tanks and connecting pipes to yard / in-
house taps were annuitized to reflect the monthly coping costs. Annuitizing essentially
spreads the capital cost of fixtures over their useful lifespan. The method of annuitizing
costs applied herein is derived from Drummond et al. (2005) and the Centers for
Disease Control and Prevention (2013).
In annuitizing the capital costs of fixtures, the following assumptions were made:
The useful lifespan of a fixture would be 32 years
The scrap value in relation to the initial value is 10 %
The base discount rate is 8.5%
The lifespan of the water supply fixture is based on the oldest recorded fixture in the
survey. The scrap value of 10 % is arbitrary; most existing studies do not provide detail
on the scrap value used, and simply state that parameters used in the amortisation were
based on ‘expert knowledge’ or ‘field notes’ [see for instance Altaf (1994) and
Pattanayak et al.(2005)]. The base discount rate of 8.5% was obtained from the South
African Reserve Bank (2013). The capital costs were annuitized using the formulae
outlined in Figure 3.1. An initial step was to determine the present value of the fixture’s
scrap value. The scrap value in this sense relates to the resale value of a fixture such as
a tank, pump, etc. after its useful lifespan. This scrap value was subtracted from the
purchase cost of the fixture. The difference between these two costs (purchase cost
minus the present value of the scrap) was divided by the annuity factor.

Chapter 3: Methods
42
Figure 3.1: Steps in annuitizing capital costs of coping
Source: Cost analysis (Centers for Disease Control and Prevention, 2013)
Sensitivity analyses were performed in order to determine the effect of varying some of
these assumptions on annuitized cost figures. The discount rate and scrap value in the
model were modified to observe the effect on the cost figures (Table 3.2).
Calculate the fixture’s Equivalent Annual Cost (EAC)
EAC = ( PC - PV ) / A
where:
PC = Purchase/Replacement cost of the capital item
PV = Present value of scrap value
3
Determining the fixture’s annuity factor
A = ( 1 / r ) - ( 1 / ( r ( 1 + r )n) )
where:
r = Discount rate
n = Length of the fixture's useful life
2
Determine the present value of the fixture's
scrap value
PV = SV x 1 / (1 + r)n
where:
SV = Scrap value;
r = Discount rate; and
n = Length of the fixture's useful life
1

Chapter 3: Methods
43
Table 3.2: Scenarios used in sensitivity analyses of coping costs
Scenario Discount rate (%) Scrap value (%)
1 8.5 5
2 8.5 10
3 8.5 15
4 8.5 20
5 7 5
6 7 10
7 7 15
8 7 20
9 10 5
10 10 10
11 10 15
12 10 20
The results from these sensitivity analyses models were compared to the results from
the base model. The annuitized coping costs were divided by 12, to obtain an estimate
of the monthly capital cost of the fixtures. Similarly, the annual running costs of the
fixtures were divided by 12, to obtain an estimate of monthly running costs. These were
summed up, together with any monthly costs from purchasing water or water treatment
products where relevant, to make up the total coping costs for each household.
3.4.2 Interview data analyses
Recordings of the key informant interviews with water supply technicians were
transcribed and translated by professionals at the Wits Language School Translation and
Transcription Services located at the University of the Witwatersrand in South Africa.
Where applicable, the interviewee responses in TshiVenda were translated into English.
Each of these transcripts was examined line by line, and the data organised according to
the themes outlined in the interview guide. Together with the data from the community
observations, these interviews are not a direct contribution to the results of the study,
but serve mainly to provide some context to the water supply problems in the study
communities. These were reported in the second section of Chapter 2, which set the
scene for the study and described the study communities and their water supplies.

Chapter 3: Methods
44
Conclusions
This chapter has outlined the methods used in the study, including the research strategy
and data collection methods. The key variables used in the thesis were presented,
namely water use, income, coping costs and indicators of socio-economic status. In the
chapter that follows, the characteristics of the study sample are presented, as well as the
descriptive statistics of the key variables.

45
4 Sample characteristics and key variables
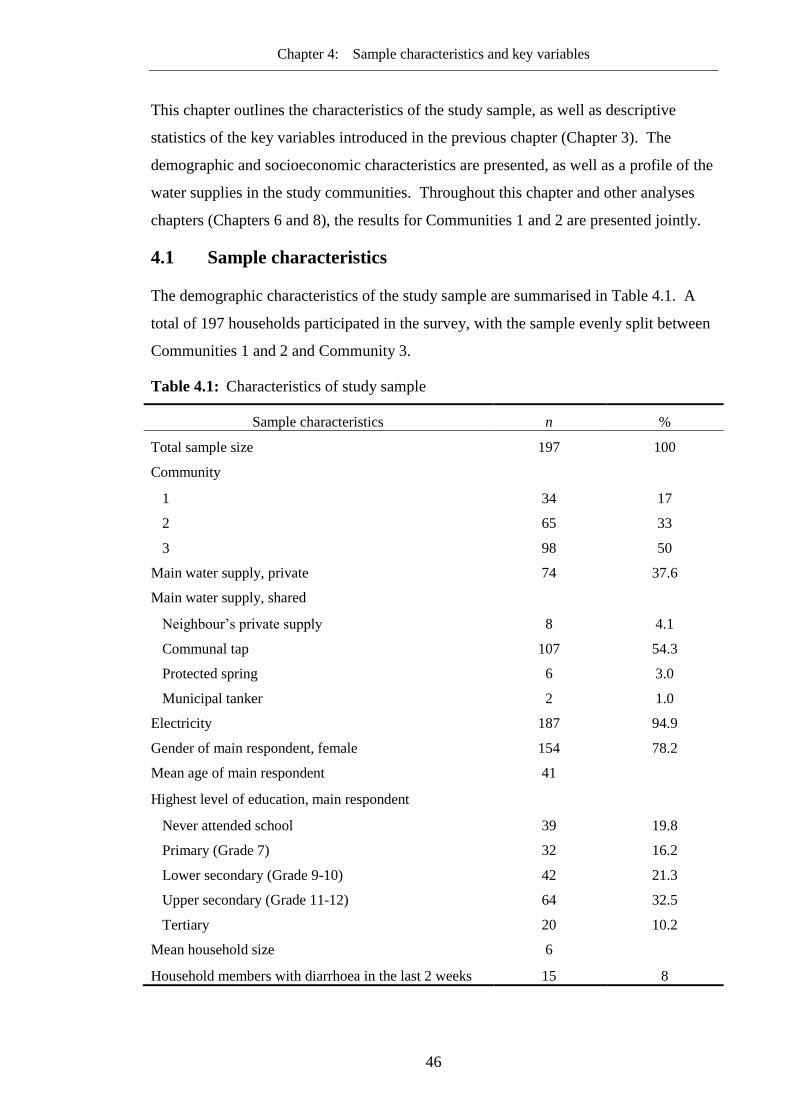
Chapter 4: Sample characteristics and key variables
46
This chapter outlines the characteristics of the study sample, as well as descriptive
statistics of the key variables introduced in the previous chapter (Chapter 3). The
demographic and socioeconomic characteristics are presented, as well as a profile of the
water supplies in the study communities. Throughout this chapter and other analyses
chapters (Chapters 6 and 8), the results for Communities 1 and 2 are presented jointly.
4.1 Sample characteristics
The demographic characteristics of the study sample are summarised in Table 4.1. A
total of 197 households participated in the survey, with the sample evenly split between
Communities 1 and 2 and Community 3.
Table 4.1: Characteristics of study sample
Sample characteristics n %
Total sample size 197 100
Community
1 34 17
2 65 33
3 98 50
Main water supply, private 74 37.6
Main water supply, shared
Neighbour’s private supply 8 4.1
Communal tap 107 54.3
Protected spring 6 3.0
Municipal tanker 2 1.0
Electricity 187 94.9
Gender of main respondent, female 154 78.2
Mean age of main respondent 41
Highest level of education, main respondent
Never attended school 39 19.8
Primary (Grade 7) 32 16.2
Lower secondary (Grade 9-10) 42 21.3
Upper secondary (Grade 11-12) 64 32.5
Tertiary 20 10.2
Mean household size 6
Household members with diarrhoea in the last 2 weeks 15 8

Chapter 4: Sample characteristics and key variables
47
Households using communal water supplies made up the majority (62 %) of the sample,
and almost all households surveyed (94.9 %) had electricity. Just over three quarters
(78 %) of the main respondents were female. The mean age was 41 years, and the
majority had completed secondary schooling.
4.2 Current water supply
In the sections that follow, the characteristics of the water supply are presented, relating
mainly to the reliability and households’ perceptions of their water supply.
4.2.1 Water sources
The main water sources in the study communities are shown in Table 4.2.
Table 4.2: Main water sources
Communities 1 and 2 Community 3
n % n %
Private supply
Drilled well with yard / house tap 26 26.3 - -
Municipal or spring connection
with yard / house tap - - 48 49.0
Communal supply
Communal tap 66 66.7 41 41.8
Neighbour’s yard tap 5 5.1 3 3.1
Municipal tanker truck 2 2.0 - -
Protected spring - - 6 6.1
Private supplies in Communities 1 and 2 are drilled wells with taps in the yard and / or
house, while in Community 3 the private supplies are municipal or spring connections.
In both clusters the main water source for households using communal supplies are
communal taps.
The alternative water sources are presented in Table 4.3. Almost three quarters (71.7 %)
of households in Communities 1 and 2 rely on neighbours’ drilled wells as their
alternative water source.

Chapter 4: Sample characteristics and key variables
48
Table 4.3: Alternative water sources
Communities 1 and 2 Community 3
n % n %
Communal tap 9 9.1 2 2.0
Neighbour’s yard tap / drilled well 71 71.7 21 21.4
Rainwater harvesting - - - -
Municipal tanker truck 5 5.1 - -
Protected spring - - 79 80.6
None 19 19.2 7 7.1
Note: Totals do not add up to 100 % as households may use more than one alternative source
In Community 3, the majority (80.6 %) of households rely on the protected springs in
the area as their alternative source. While 19 % of the households in Communities 1
and 2 report that they rely solely on their main water source, the proportion in
Community 3 is smaller, with 7 % reporting that they do not use an alternative water
source.
4.2.2 Reliability of the current water supply
Households using private water supplies report an average of 2 breakdowns in the water
supply system each year, while those using communal supplies as their main source
report 3 breakdowns a year (Table 4.4).
Table 4.4: Reliability characteristics of water supply, by type of supply
Private supply Communal supply
Characteristic n mean n mean
Hours of water supply during the day 74 17.4 122 15.0
Days of water supply during the week 74 5.8 122 3.8
Time taken to restore water supply (downtime) 72 20.1 118 36.8
Number of breakdowns in the year 74 1.5 117 2.7
Prior notification of interruptions (%)
Always
Sometimes
Never
41
-
-
55.4
116
5.7
1.6
87.0
Flow rate (%)
High
Moderate
Low
73
68.9
23.0
6.8
123
52.0
35.0
13.0

Chapter 4: Sample characteristics and key variables
49
The average time taken to restore the water supply after breakdowns amongst
households using private supplies is reported as just under 3 weeks, while for
households using communal supplies the average is just over 5 weeks. Households
using private water supplies report having water available for 17 hours a day, while
those using communal supplies report an average of 15 hours a day. For both private
and communal supplies the flow rate is generally rated as high.
Table 4.5: Reliability characteristics of main water supply, by community cluster
Communities 1 and 2 Community 3
Characteristic n mean n mean
Hours of water supply during the day 98 14.1 98 17.7
Days of water supply during the week 98 3.5 98 5.5
Time taken to restore water supply 94 41.5 96 19.7
Number of interruptions in the year 95 2.6 96 1.8
Prior notification of interruptions (%)
Always
Sometimes
Never
99
2.0
-
70.7
85
5.1
2.0
79.6
Flow rate (%)
High
Moderate
Low
99
47.5
33.3
19.2
97
69.4
27.6
2.0
On average, households in Communities 1 and 2 report having water available from the
main source for 14 hours a day, while in Community 3 water is available for about 18
hours a day (Table 4.5). Breakdowns in the water supply system in Communities 1 and
2 take almost 6 weeks to repair on average, and just under 3 weeks in Community 3.
The majority of households report that they are never notified of any interruptions in the
water supply. In all three communities the flow rate is generally rated as high.
4.2.3 Multiple source use
The majority of households (86.8 %) rely on more than one water source. The reasons
for using multiple water sources are presented in Figure 4.1.

Chapter 4: Sample characteristics and key variables
50
Figure 4.1: Reasons for using multiple water sources
Among 157 (92.8 %) of the households, poor reliability of the main water supply is
cited as the reason for using more than water source. Other reasons include the quantity
of water available, the quality of water and distance to the water sources.
4.2.4 Perceptions of the water supply
Of the 197 households surveyed, almost two thirds (65 %) rate their main water supply
as being very unreliable, while about one quarter (24 %) rated their water supply as
being very reliable (Figure 4.2).
0
0
0
1
3
8
8
9
157
0 20 40 60 80 100 120 140 160
queuing
seasonal availability
time
cost
other
distance to source
water quality
water quantity
reliability

Chapter 4: Sample characteristics and key variables
51
Figure 4.2: Ratings of the reliability of the main water supply
The main concerns that households have with their water supply relate to the quantity of
water supplied and the time it takes to collect it (Figure 4.3). About two thirds (65.3 %)
of households are very concerned about getting enough water to meet their day to day
requirements.
Figure 4.3: Household concerns with the main water supply
65%
4%
7%
24%
very unreliable
unreliable
fairly reliable
very reliable
0
20
40
60
80
100
120
140
160
180
200
getting enough
water
getting sick from
the water
time spent
collecting water
not at all concerned
not very concerned
moderately concerned
very concerned

Chapter 4: Sample characteristics and key variables
52
The second greatest concern is the amount of time it takes to collect water; 54.54 % of
households report that they are very concerned. Getting sick from the water ranks as the
least of households’ concerns; 80.6 % report that they are not at all concerned.
4.3 Key variables
The descriptive statistics of key variables introduced in Chapter 3 are summarised in the
sections below. Detailed results of the imputation for water use, income and initial and
running costs are provided in Appendix 4.
4.3.1 Water use
Table 4.6 presents the summary statistics for non-imputed and imputed water use data.
Respondents found it difficult to estimate their households’ water consumption in 39
(52.7 %) of households with private supplies and 15 (12.2 %) of those with shared water
supplies, bringing the total of missing values to 54 (27%).
Table 4.6: Summary statistics of water use data
Variable n Mean Standard
deviation Median Proportion of
missing
values (%)
Non-imputed household
water use 143 90.1 52.3 75.0 27.4
Imputed household water
use 197 88.7 46.7 80 -
Note: Water use is in litres (ℓ) per household per day
The parameter estimates from the non-imputed and imputed datasets are fairly similar.
The mean water use in the non-imputed dataset is 90.1 ℓ per household per day, while in
the imputed dataset the mean is 88.7 ℓ per household per day. Assuming an average
household of 6 people from Table 4.1, this equates to just below 15 ℓ per capita per day.
4.3.2 Household socio-economic status
4.3.2.1 Household income
In 7.6 % of all households, respondents preferred not to say, or were not sure of the
households’ total monthly income. The mean household income in the non-imputed
dataset is just under R2,295 per month (Table 4.7). At the exchange rate of R8.57 per
United States (US) dollar in 2012 (South African Reserve Bank, 2014), this is
approximately US$268 per month.
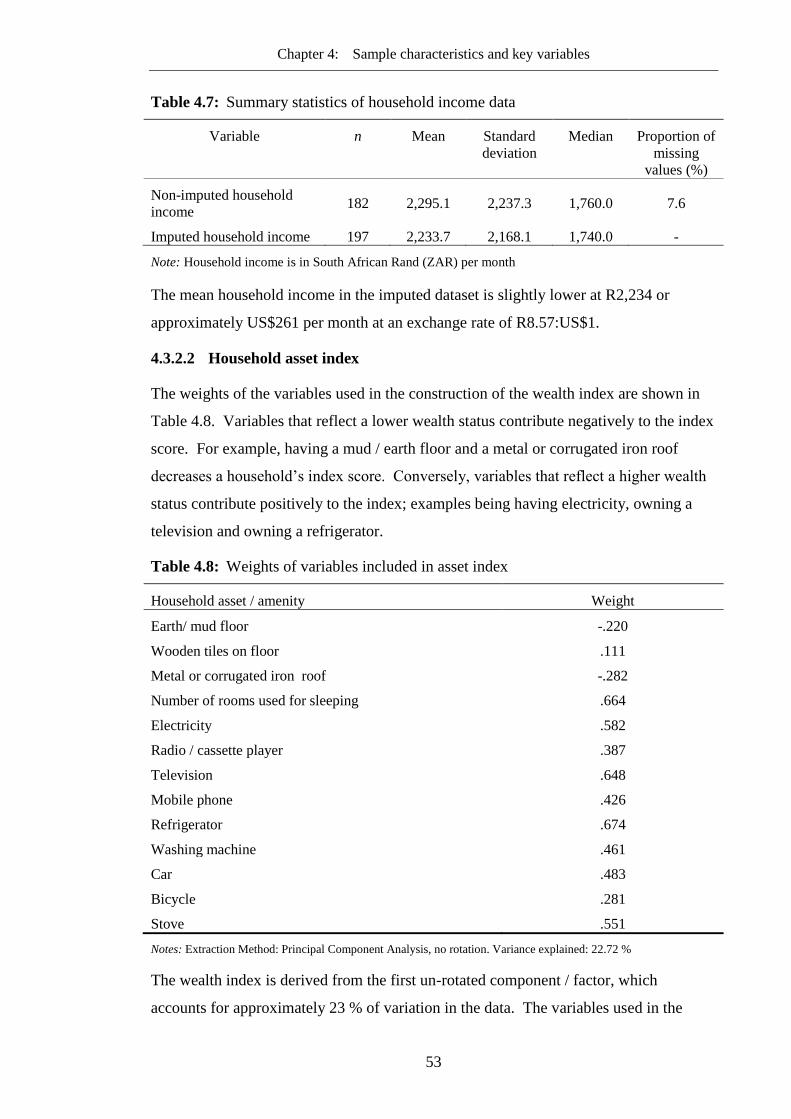
Chapter 4: Sample characteristics and key variables
53
Table 4.7: Summary statistics of household income data
Variable n Mean Standard
deviation Median Proportion of
missing
values (%)
Non-imputed household
income 182 2,295.1 2,237.3 1,760.0 7.6
Imputed household income 197 2,233.7 2,168.1 1,740.0 -
Note: Household income is in South African Rand (ZAR) per month
The mean household income in the imputed dataset is slightly lower at R2,234 or
approximately US$261 per month at an exchange rate of R8.57:US$1.
4.3.2.2 Household asset index
The weights of the variables used in the construction of the wealth index are shown in
Table 4.8. Variables that reflect a lower wealth status contribute negatively to the index
score. For example, having a mud / earth floor and a metal or corrugated iron roof
decreases a household’s index score. Conversely, variables that reflect a higher wealth
status contribute positively to the index; examples being having electricity, owning a
television and owning a refrigerator.
Table 4.8: Weights of variables included in asset index
Household asset / amenity Weight
Earth/ mud floor -.220
Wooden tiles on floor .111
Metal or corrugated iron roof -.282
Number of rooms used for sleeping .664
Electricity .582
Radio / cassette player .387
Television .648
Mobile phone .426
Refrigerator .674
Washing machine .461
Car .483
Bicycle .281
Stove .551
Notes: Extraction Method: Principal Component Analysis, no rotation. Variance explained: 22.72 %
The wealth index is derived from the first un-rotated component / factor, which
accounts for approximately 23 % of variation in the data. The variables used in the
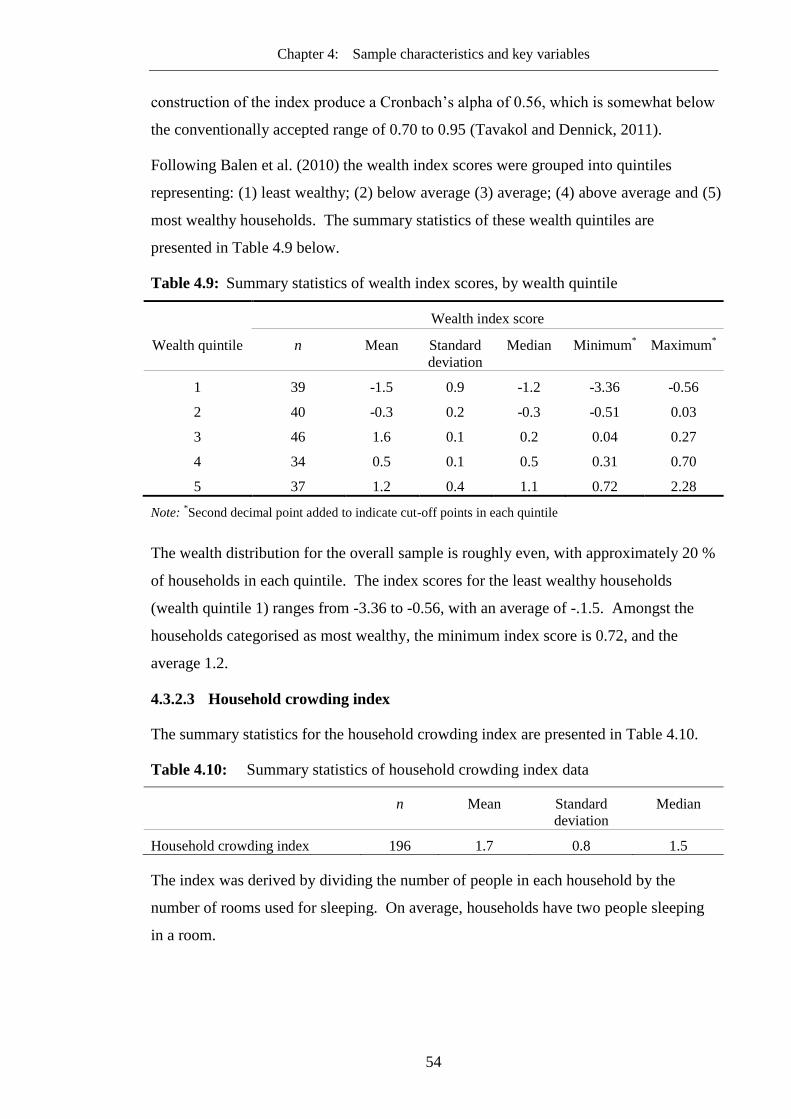
Chapter 4: Sample characteristics and key variables
54
construction of the index produce a Cronbach’s alpha of 0.56, which is somewhat below
the conventionally accepted range of 0.70 to 0.95 (Tavakol and Dennick, 2011).
Following Balen et al. (2010) the wealth index scores were grouped into quintiles
representing: (1) least wealthy; (2) below average (3) average; (4) above average and (5)
most wealthy households. The summary statistics of these wealth quintiles are
presented in Table 4.9 below.
Table 4.9: Summary statistics of wealth index scores, by wealth quintile
Wealth index score
Wealth quintile n Mean Standard
deviation Median Minimum
* Maximum*
1 39 -1.5 0.9 -1.2 -3.36 -0.56
2 40 -0.3 0.2 -0.3 -0.51 0.03
3 46 1.6 0.1 0.2 0.04 0.27
4 34 0.5 0.1 0.5 0.31 0.70
5 37 1.2 0.4 1.1 0.72 2.28
Note: *Second decimal point added to indicate cut-off points in each quintile
The wealth distribution for the overall sample is roughly even, with approximately 20 %
of households in each quintile. The index scores for the least wealthy households
(wealth quintile 1) ranges from -3.36 to -0.56, with an average of -.1.5. Amongst the
households categorised as most wealthy, the minimum index score is 0.72, and the
average 1.2.
4.3.2.3 Household crowding index
The summary statistics for the household crowding index are presented in Table 4.10.
Table 4.10: Summary statistics of household crowding index data
n Mean Standard
deviation Median
Household crowding index 196 1.7 0.8 1.5
The index was derived by dividing the number of people in each household by the
number of rooms used for sleeping. On average, households have two people sleeping
in a room.

Chapter 4: Sample characteristics and key variables
55
4.3.3 Coping cost
The coping costs are reported in two parts. The first part presents the summary
statistics of the non-imputed and imputed initial and running costs for households with
private supplies. In the second part, the annuitized initial and running costs are
presented, as well as the costs incurred by households without private supplies.
4.3.3.1 Initial and running costs of fixtures
The initial and running costs incurred by households with private supplies are
summarised in Table 4.11.
Table 4.11: Summary statistics of initial and running cost data
Variable n Mean Standard
deviation Median Proportion of
missing
values (%)
Non-imputed year fixture
installed 31 - - - 58.1
Imputed year fixture installed 74 - - - -
Non-imputed initial cost 18 8,685.0 11,986.7 1,975.0 75.7
Imputed initial cost 74 7,341.2 11,000.9 1,275.5
Non-imputed running cost 24 1,283.8 1,856.5 425.0 67.6
Imputed running cost 74 815.7 1,768.6 52.5
Note: Costs are in South African Rand (ZAR)
Of the 74 households with private water supplies, 43 (58 %) could not recall when the
fixtures were installed. Three quarters of the respondents did not know or could not
recall the initial costs of installing the fixtures and 68 % did not know or could not
recall the running costs.
The year of installation was imputed as 1997; the mid-point between the earliest
recalled installation date (1981) and the latest recalled date (2012). Both the initial and
running cost data are highly skewed. In the imputed dataset the mean installation cost is
R11,000, against a median of R1,275; approximately US$1,284 and US$149
respectively. Similarly, the mean running costs in the imputed dataset are R816 (US$95)
and the median costs R53 (US$6).
4.3.3.2 Total coping costs
The monthly coping costs are summarised in Table 4.12. For households with private
supplies, these costs include the annuitized initial and running costs, as well as the costs

Chapter 4: Sample characteristics and key variables
56
of any other coping strategies such as buying bottled water, chlorination etc. For
households without private supplies, the costs included are those incurred from buying
water from neighbours, buying bottled water and chlorination.
Table 4.12: Summary statistics of total coping cost data
Variable n Mean Standard
deviation Median
Households with private supply 74 139.1 209.4 22
Households with communal supply 123 45.7 60.7 20
All households 197 81.3 144.6 21
Note: Costs are in South African Rand (ZAR) per month
The average coping costs for households with private supplies are R139 a month
(approximately US$16 at a 2012 exchange rate of R8.57: US$1), while the median costs
are much lower, at R22 (US$3). Households with communal supplies spend R46 (US$5)
a month on coping costs on average. Their median coping costs are in fact similar to
those of households with private supplies, at R20 (US$2) a month.
4.4 Discussion
The objective of this chapter was to present the social and demographic characteristics
of the study sample as well as summarise the key variables relevant to the thesis.
The results regarding the reliability of the water supplies are generally consistent with
the results for the Limpopo Province. Results of the 2011 General Household Survey
(GHS) (Statistics South Africa, 2011) indicate that households in the province
experienced the highest number of interruptions in 2010, with 81.2 % of households
having their water supply interrupted. The province also had the second highest
duration of interruptions in the country, with interruptions likely to last 15 days or
longer.
Households are least concerned about getting sick from drinking water, which would
suggest that they perceive the water to be generally of good quality. Supporting
evidence of this can again be drawn from the GHS (Statistics South Africa, 2011),
which shows that household water treatment has been steadily declining in Limpopo
Province since 2006.
The Free Basic Water (FBW) policy allows for 6,000 litres per household per month,
based on an average household size of eight and 25 ℓ being available to each individual

Chapter 4: Sample characteristics and key variables
57
daily (Department of Water Affairs, 2003). This translates to 150 ℓ a day for a
household of 6 persons. Households in the study communities use an average of about
90 ℓ per day; well below 150 ℓ.
In terms of socio-economic status, the average household income of R2,234 per month
equates to R26,808 per annum, which is below the district’s average of R49,440 and the
province’s average of R56,841 from the 2011 census (Statistics South Africa, 2012a).
The census report for the province does not distinguish between urban, peri-urban and
rural households. It is plausible that the reported annual income for the sample may be
similar to that of other peri-urban households in the province. Further, under-reporting
remains a significant issue in surveys of income (Moore et al., 2000). Although care
was taken to probe respondents about the different streams of income, and where
possible, obtain income information directly from household members engaged in
income-generating activities, it is not excluded that the income data may have been
under-reported. The item non-response rate of 7.6 % for income data is relatively low,
compared to the non-response rates of 10-20 % that have been reported in for instance
the South African Social Attitudes Survey (Human Sciences Research Council, 2010)
and the 2007 Community Survey (Porter et al., 2013).
The proportions of missing data for initial and running costs of fixtures are rather high.
The summary statistics for these costs and results ensuing from analyses of total coping
costs for households with private supplies therefore need to be interpreted with caution
as they are to a large extent based on imputed data. Given that for many households the
installation of such fixtures represents a once-off expenditure, it is plausible that they
may have indeed forgotten how much money was spent. To the author’s knowledge, no
studies have been published that report on households’ capital expenditures related to
coping with unreliable water supplies in the country. This makes it difficult to
determine (i) typical response rates when eliciting such information in surveys; (ii) data
collection techniques that can improve the quality of information obtained and response
rates; and (iii) estimates of what might reasonably be lower and upper boundaries of the
costs.
Little insight can be drawn from studies conducted in other countries. In their eminent
study of coping costs in Nepal, Pattanayak et al. (2005) state that: “In general, most
parameters used in the calculations (e.g., lifespan estimates) are based on average
statistics from our sample or from other studies in Nepal (when none was available from

Chapter 4: Sample characteristics and key variables
58
our survey) or our field notes (based on our discussions with key informants or experts).”
No detailed information is provided in their study nor indeed in many other studies, of
the response rates and recall issues that arise in the collection of such data. In many
developing countries household water management is a gendered phenomenon in which
the responsibility lies mainly with women (Porter et al., 2013), hence the decision to
target senior females / female spouses in the interviews. However, it is plausible that
higher item response rates could have been achieved if senior males / male spouses had
been targeted for the particular questions, as they are more likely to be in paid
employment (Statistics South Africa, 2012c) and possibly be responsible for high-cost
investments such as drilling wells and purchasing storage tanks.
The mean initial and running costs are much larger than the median costs, indicating
that the cost data are positively skewed. These results are expected, as the costs of
drilling wells in Communities 1 and 2 can be reasonably expected to be much higher
than the costs of setting up pipe connections to the springs in Community 3.
Conclusions
The chapter has presented the characteristics of the study sample, including descriptive
characteristics of the households surveyed, water supply in the communities, as well as
summary descriptives of the key variables. Overall, the results of this chapter highlight
that while households have access to improved water sources, the majority perceive
their water supply as being unreliable, and water use is generally below the
recommended minimum of 25 ℓcd. In the following chapters, the issue of unreliability
in water supply is explored in more detail; reviewing the definitions and criteria used in
assessing reliability (Chapter 5), and eliciting households’ preferences for reliable water
supplies (Chapter 6).
.

59
5 Reliability of water supplies in developing
countries: A review of definitions and assessment
approaches

Chapter 5: A review of definitions and assessment approaches for water supply reliability
60
Unreliable water supplies in developing countries are a widely recognised concern.
However, unreliability means different things in the variety of literature on water
supplies, and no unified definition or assessment criteria exist. This chapter reviews
definitions of water supply reliability used in existing literature, as well as the various
ways in which it is assessed.
5.1 Introduction
In recent years there has been growing criticism of the approaches used in measuring
progress towards Millennium Development Goal target 7c, which aimed to halve the
proportion of worlds’ population without access to an improved drinking water source
by 2015. Among the major criticisms is the way in which key concepts of safety and
access are addressed and measured (see for instance, Clasen (2012), Devi and Bostoen
(2009), Onda et al. (2012) and Dar (2009)). Further – and of main interest in this
review – is the acknowledgement in the MDG update that reliability is not addressed in
the existing indicators (WHO/UNICEF, 2012).
Although unreliability of water supplies in developing countries is widely recognised as
a significant concern, robust literature on the scope of the problem remains lacking. No
unified definition or standard way of measuring water supply reliability exists
(WHO/UNICEF, 2012), and the data that is available is often sketchy (Kleemeier, 2010).
Much of the often-cited data on the reliability of water supplies in urban areas is from
the World Bank’s International Benchmarking Network for Water and Sanitation
Utilities (IBNET, 2011). The database contains information on duration of supply in
hours per day and / or proportion of residential customers receiving intermittent supply
from utilities in 85 countries. Because the data is as reported by the utilities themselves,
the quality of the data depends greatly on the accuracy of this reporting (WHO/UNICEF,
2011).
Systematically collected data on the reliability of water supplies in rural or peri-urban
communities is even more limited. The most often cited figures are from the Rural
Water Supply Network(Rural Water Supply Network, 2009), which are themselves a
compilation from various sources and report only on functionality of handpumps in sub-
Saharan Africa. Thus, the little systematic data that is available is often limited to
specific communities, regions or water supply technologies and is sometimes not
necessarily nationally representative. Further, various reports use their own definitions

Chapter 5: A review of definitions and assessment approaches for water supply reliability
61
of reliability and indicators, with the result that aggregation of data across studies is
difficult.
Safe, reliable water supplies play an important role in achieving the benefits of water
supply improvements (Hunter et al., 2010) and monitoring of progress in this regard
depends greatly on the quality of indicators used. The aim of this chapter is to provide a
review of the various definitions and assessment criteria of water supply reliability
currently used in the literature. It is hoped that this summary will contribute to the
identification of clear definitions and assessment criteria that can be used to evaluate the
reliability of water supplies in developing countries.
5.2 Methods
Water supply reliability as considered in this review is distinguished from sustainability.
While the terms are often used interchangeably in the literature, in this thesis
sustainability is distinguished as the capacity of a water supply to continue to provide
intended health, social and economic benefit to recipients in a manner that has no
significant environmental, economic and social adverse effects.
A scoping search was conducted prior to the actual search for the review to identify the
various terminology used in relation to reliability in the water supply literature.
Literature searches for grey and published literature were then conducted in a number of
databases and websites shown in Table 5.1.
Table 5.1: Databases and search engines used
Academic Search engines NGO / Donor Agencies
CINHAL EBSCOHost Google Scholar Asian Development Bank (ADB)
MEDLINE Ovid Google Web African Development bank (AfDB)
ProQuest Dissertations and
theses
Inter-American Development Bank
(IDB)
PubMed Department for International
Development (DFID)
Scirus (Elsevier) United States Agency for International
Development (USAID)
Scopus Water Aid
Web of Knowledge World Bank
World Health Organisation (WHO)
The search terms used were:

Chapter 5: A review of definitions and assessment approaches for water supply reliability
62
"water supply" OR "safe water" OR "drinking water" OR "domestic water" OR
"household water" OR “water point” AND reliab* OR sustainab* OR availab* OR
function* OR regular OR access OR intermitten* OR interrupt* OR constant OR
continu* OR consistent OR “operation and maintenance” OR breakdown
Papers retrieved from the search were screened for relevance according to the following
criteria:
Report on reliability of domestic water supply
Based on primary data from developing countries
Report on operational reliability of water supply, not water scarcity, e.g. due to
drought
Provide a definition and / or assessment criteria of reliability
The full texts of papers whose abstracts met the criteria were retrieved and reviewed in
detail. The reference lists of these included studies were also checked for potentially
relevant studies. Data were also extracted from major national surveys of the Asian
Development Bank (ADB) and Pan American Health Organisation (PAHO) Evaluation
of Drinking Water and Sanitation Services (Evaluation 2000). Developing countries
(low and medium income) were defined as per the World Bank classification(2011).
5.3 Results
Seventy-eight documents were reviewed for this assessment and 34 were found to be
relevant. Amongst those excluded, reasons included lack of clarity on both how
reliability was defined and consequently assessed and results being presented as an
overall index of sustainability, from which data on reliability could not be extracted.
Two of the papers (Zerah, 1998; 2000) were based on the same study and were regarded
as one study for the purposes of the review.
Of the 34 studies reviewed, half were carried out in sub-Saharan Africa (Tables 2a-c).
The data from PAHO covered 19 countries in Latin America and the Caribbean region,
while that from ADB covered 40 utilities in Lao, Malaysia and Vietnam. Sixteen of the
studies evaluated reliability in rural settings, 13 in urban and 5 in both rural and urban
settings. The ADB survey data from south-east Asia was for utilities in urban areas,
whereas that of PAHO covered both urban and rural areas.

Chapter 5: A review of definitions and assessment approaches for water supply reliability
63
5.3.1 Definitions of reliability
Definitions or descriptions of reliability are explicitly stated in seven of the studies. A
comprehensive list of these studies and others in the review is given in Tables 5.2-5.4.

Chapter 5: A review of definitions and assessment approaches for water supply reliability
64
Table 5.2: Studies in urban settings
Author(s), year Study objective(s) Setting, year of study
and sample
Methods Definition of
reliability/synonym
Type of supply Estimates of
(un)reliability
Aderibigbe et al.
(2008)
Determine the
availability, adequacy
and quality of water
supply
Urban Nigeria
750 female respondents
randomly selected from
3 communities
Descriptive cross-
sectional study, using
structured
questionnaires
None stated 62.9 % of respondents
house connection
15 % had water more
than 3 times a week
30.1 % had water 2 or 3
times a week
54.9 % had water
occasionally or once a
week
Andey & Kelkar
(2009)
Evaluate influence of
continuous and
intermittent water on
domestic water
consumption
Urban India,
4 cities; Ghaziabad: 35
households out of 48;
Jaipur: 195 households
out of 206; Nagpur: 214
households out of 330;
Panji: 51 households
out of 120 households
Six measurements
repeated times over 1
year for both modes of
supply. Average
consumption calculated
from meter readings,
duration of survey and
number of people in
households
None stated Piped supply Ghaziabad: 10
hours/day
Jaipur: 3 hours/day
Nagpur: 16 hours/day
Panji: 5 hours/day
Asian
Development
Bank, (2007)
Help water utilities
southeast Asia to assess
their performance
Urban southeast Asia
2005
40 water utilities; 17
from Vietnam, 17 from
the Philippines, 5 from
Malaysia and 1 from
Lao PDR.
Water utility
questionnaire
None stated Piped supply 24 hours a day on
average for Malaysia
and Lao;
23 hours a day on
average for Vietnam
and the Philippines

Chapter 5: A review of definitions and assessment approaches for water supply reliability
65
Author(s), year Study objective(s) Setting, year of study
and sample
Methods Definition of
reliability/synonym
Type of supply Estimates of
(un)reliability
Ayoub &
Malaeb (2006)
Investigate impact of
intermittent supply on
water quality
Urban Lebanon
2003-2004
181 water samples
Quantitative. Samples
collected from water
network before storage
in household tanks and
after storage from
household tanks
None stated Piped supply Once every two days
Baisa et al.
(2010)
i) Develop a model
describing the optimal
intertemporal depletion
of each household's
private water storage if
it is uncertain when
water will next arrive to
replenish supplies
ii) evaluate the potential
welfare gains that
would occur if
alternative modes of
water provision were
implemented
Urban Mexico
2005 data
Model calibrated using
data from the Mexican
National Household
Survey of Income and
Expenditure survey
None stated Piped supply 1 day per week: 2.8%
2 days per week: 2.1%
3 days per week: 3.8%
4 days per week: 0.2%
5 days per week: 1.3%
6 days per week: 0.2%
Daily at limited hours:
21.6%
Daily at all hours:
68.0%
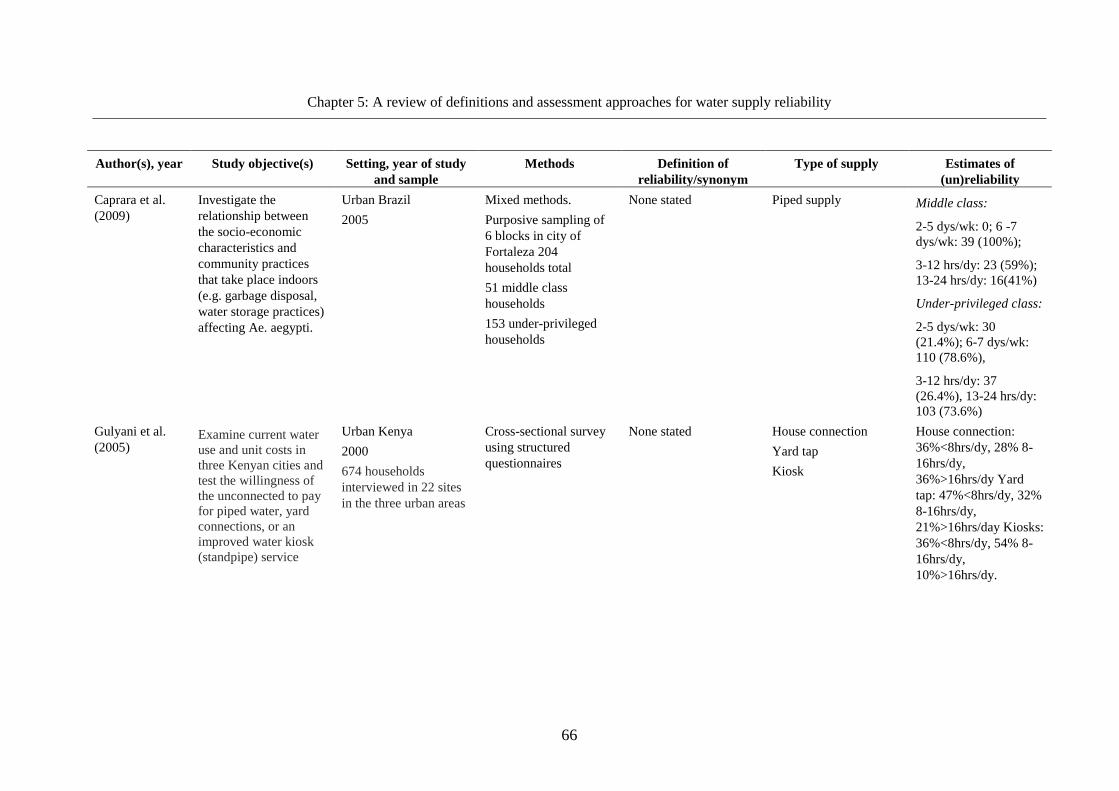
Chapter 5: A review of definitions and assessment approaches for water supply reliability
66
Author(s), year Study objective(s) Setting, year of study
and sample
Methods Definition of
reliability/synonym
Type of supply Estimates of
(un)reliability
Caprara et al.
(2009)
Investigate the
relationship between
the socio-economic
characteristics and
community practices
that take place indoors
(e.g. garbage disposal,
water storage practices)
affecting Ae. aegypti.
Urban Brazil
2005
Mixed methods.
Purposive sampling of
6 blocks in city of
Fortaleza 204
households total
51 middle class
households
153 under-privileged
households
None stated Piped supply Middle class:
2-5 dys/wk: 0; 6 -7
dys/wk: 39 (100%);
3-12 hrs/dy: 23 (59%);
13-24 hrs/dy: 16(41%)
Under-privileged class:
2-5 dys/wk: 30
(21.4%); 6-7 dys/wk:
110 (78.6%),
3-12 hrs/dy: 37
(26.4%), 13-24 hrs/dy:
103 (73.6%)
Gulyani et al.
(2005) Examine current water
use and unit costs in
three Kenyan cities and
test the willingness of
the unconnected to pay
for piped water, yard
connections, or an
improved water kiosk
(standpipe) service
Urban Kenya
2000
674 households
interviewed in 22 sites
in the three urban areas
Cross-sectional survey
using structured
questionnaires
None stated House connection
Yard tap
Kiosk
House connection:
36%<8hrs/dy, 28% 8-
16hrs/dy,
36%>16hrs/dy Yard
tap: 47%<8hrs/dy, 32%
8-16hrs/dy,
21%>16hrs/day Kiosks:
36%<8hrs/dy, 54% 8-
16hrs/dy,
10%>16hrs/dy.

Chapter 5: A review of definitions and assessment approaches for water supply reliability
67
Author(s), year Study objective(s) Setting, year of study
and sample
Methods Definition of
reliability/synonym
Type of supply Estimates of
(un)reliability
Howard (2002) Develop a model of
water supply
surveillance for urban
areas of developing
countries that provides
reliable assessment of
water supplies, with
particular emphasis on
the urban poor
Urban Uganda
1997-200
1,652 water points in 10
locations
Multi-criteria zoning to
identify vulnerable
communities and
structured observation
of water points and
structured
questionnaires
Discontinuity was
defined as being the
physical absence of
water flowing from the
source
Piped water
Point sources: protected
springs boreholes/
tubewells with
handpumps, dug wells
with handpump
309 (18.7%) water
points had
discontinuity. Piped:
245 (25.7%); Protected:
33 (6.7%) Unprotected:
31 (15.1%).
Discontinuity
occasional (70%)
seasonal interruption
relatively common and
daily/monthly
interruptions far less
common.
Mycoo (1996) Provide a demand-
oriented perspective on
water provision for
domestic users,
examining cost
recovery potential
based on household
willingness to pay more
for an improved service
and water pricing
Urban Trinidad
Stratified sampling of 6
settlements (total of
420, sampling rate
0.34%). Criteria:
location, elevation and
slope, income, housing
and land tenure, level of
service and the number
of hours of water
received.
Cross-sectional survey
using contingent
ranking, contingent
valuation and observed
behaviour of the
household in producing
water
None stated Piped:
House connection
Yard tap
Communal tap
4S% of customers
receive a 24 hour
supply seven days a
week

Chapter 5: A review of definitions and assessment approaches for water supply reliability
68
Author(s), year Study objective(s) Setting, year of study
and sample
Methods Definition of
reliability/synonym
Type of supply Estimates of
(un)reliability
Pattanayak et al.
(2005)
Evaluate how coping
costs and willingness to
pay vary across types of
water users and income
Urban Nepal
2001
Clustered sampling
(probability-to-size),
1500 households in five
municipalities of
Kathmandu Valley
Mixed methods cross-
sectional survey using
17 purposive, open-
ended discussions, 2
focus groups, and 150
pre-tests in designing
the survey instrument
None stated 70% piped,
30%: private wells,
public taps, stone
spouts, and water
vendors. About 1% of
the connected
households share a
connection with other
households
Water was available
from private
connections on average
about 2 hours per day
in the wet season and 1
hour per day in the dry
season
Shah (2003) Establish the value of
water supply services to
people of Zanzibar
Town by measuring
willingness to pay for
reliable water services,
to provide basis for
change of the financing
policy for water supply
services management.
Urban Zanzibar
300 households out of
10 Shehias; (0.94 % of
the town’s households).
In some instances
household shad to be
targeted to balance
political affiliations
Cross-sectional survey
using structured
questionnaire
Availability of water at
a point of consumption
(household or public
stand-pipe) for 24 hrs a
day, 7 days a week, 365
days a year.
Piped supply 20.7 % had 'no
problem' with supply,
27% had water for 1-5
hrs/dy; 24.3% for 5-
10hrs/dy; 13% 5-
10hrs/dy; 12.7% for 15-
24 hrs/dy; 0.3% did not
respond and 0.7% did
not know
Thompson et al.
(2000)
Assess changes in
domestic water use
Urban Kenya,
Tanzania, Uganda
1997
Unpiped households:
99
Piped households: 349
Cross-sectional follow
up study, 30 years later,
using semi-structured
interviews, observation,
interviews with key
informants, , field
observation, review of
secondary literature
None stated Piped in house
connection
Water available
24hrs/dy: 56%,
<12hrs/dy:
approximately 40%;
1-5hrs/dy:
approximately 20%

Chapter 5: A review of definitions and assessment approaches for water supply reliability
69
Author(s), year Study objective(s) Setting, year of study
and sample
Methods Definition of
reliability/synonym
Type of supply Estimates of
(un)reliability
Virjee & Gaskin
(2010)
Ascertain the
willingness to pay for
changes in the level of
service experienced by
users
Trinidad and Tobago
2003
The Central Statistical
Office’s Continuous
Sample Survey of
Population sampling
method was used to
randomly select 1419
households,
using a two-stage
stratification scheme
based on geography and
labour force
characteristics
Cross-sectional multi-
part survey
None stated WASA in-house piped
connection only;
WASA in-house
connection + secondary
source;
No in-house connection
Water available
24hrs/dy, 7dys/week:
27%, Almost 30%
received no water from
WASA at all during the
time of the survey. 68%
had water storage tanks
on their premises with
an average installed
capacity of 610 gallons.
As a result of these
coping mechanisms,
82% of those with tanks
had a 24-hour water
supply
Widiyati (2011) Present evidence of
willingness to pay to
avoid costs associated
with intermittent water
supply from Bandung
Municipality in
Indonesia
Urban Indonesia
2011
200 people interviewed
in survey
Cross-sectional survey
using structured
questionnaires
None stated Piped 24 hour supply: 60%
For about 40%: water is
rationed from 1hour
every 2days to about 18
hours per day. Mean
hours of supply in
actual study was 2.4
based on a numbered
scale of 1: ≤3hrs/day,
2:3-6hrs/dy, 3: 7-
10hrs/dy, 4:11-
13hrs/dy, 5:other

Chapter 5: A review of definitions and assessment approaches for water supply reliability
70
Author(s), year Study objective(s) Setting, year of study
and sample
Methods Definition of
reliability/synonym
Type of supply Estimates of
(un)reliability
Zérah
(1998, 2000a)
Study 1: Measure the
costs of unreliability
Study 2: understand the
household demand for a
service by assessing the
actual behaviour
adopted by households
when they have to cope
with an inadequate
service.
Urban India
1995
Two stratified sample
of 678 households in
four zones of urban
Delhi
Cross-sectional survey
using structured
questionnaires
A service is reliable if it
is provided in time, and
with the quality and the
quantity required
Piped On average, 13hrs/dy,
about 40 % have water
around the clock about
13 % do not get water
at all;
High pressure: 8.5%;
Average pressure:
49.1% Low pressure:
32.9%; No pressure:
9.5%
>12hrs: 50.3%; 6-
12hrs:8.6%, 2-6hrs:
28.2%, ≤2hrs: 12.8%
Zérah (2002) Determine the level of
service provided by the
Vijayawada Municipal
Corporation (VMC);
assess the existing
households’ coping
strategies; evaluate the
cost of water supply
and sanitation and
measure the level of
satisfaction of the
inhabitants of
Vijayawada
Urban India
2002
167 households in 15
wards (out of 50
wards) and in
neighbouring villages
of Vijayawada
Cross-sectional survey
using structured
questionnaires
None stated Piped connections,
private boreholes,
public taps
Municipal water
connection: 3.83 hours
of supply in summer,
3.73 in winter. Private
boreholes: On average,
households spend
almost 2 hours to pump
water.Public taps: water
is available every day
in winter in 93% of the
cases and in 96% of the
cases in summer.
Otherwise water is
available on alternate
days. In winter and in
summer, supply is
similar (around 6 hrs).
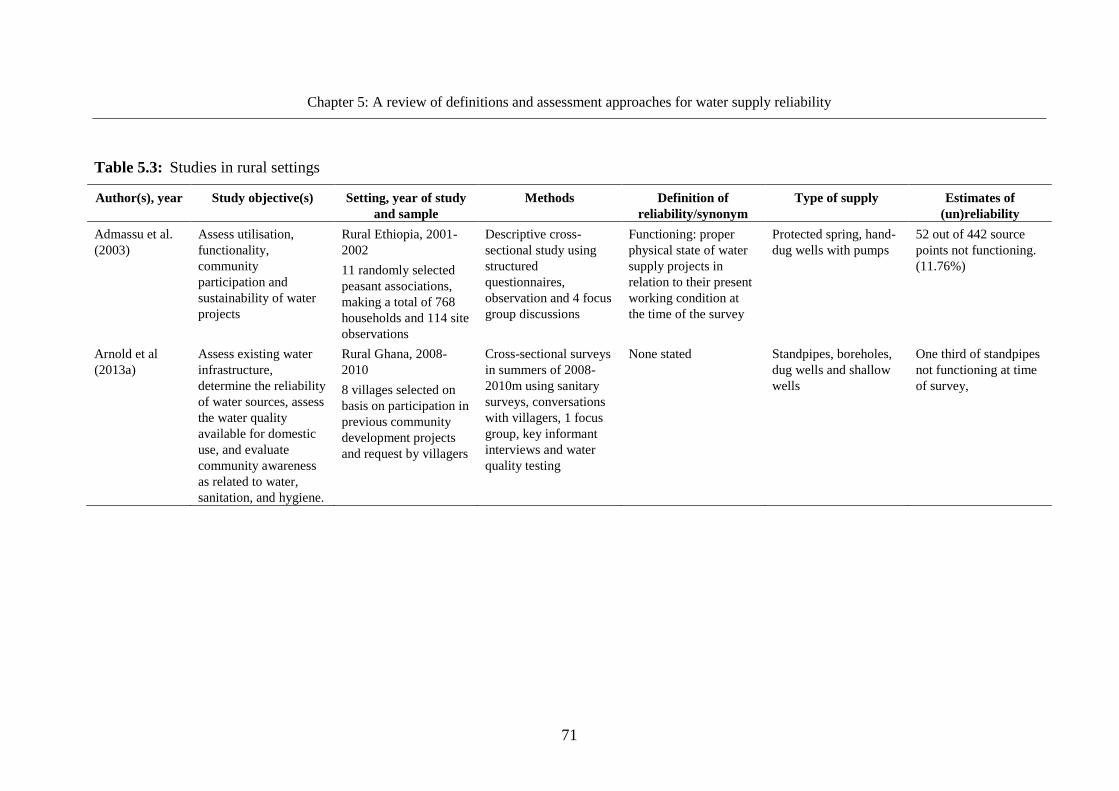
Chapter 5: A review of definitions and assessment approaches for water supply reliability
71
Table 5.3: Studies in rural settings
Author(s), year Study objective(s) Setting, year of study
and sample
Methods Definition of
reliability/synonym
Type of supply Estimates of
(un)reliability
Admassu et al.
(2003)
Assess utilisation,
functionality,
community
participation and
sustainability of water
projects
Rural Ethiopia, 2001-
2002
11 randomly selected
peasant associations,
making a total of 768
households and 114 site
observations
Descriptive cross-
sectional study using
structured
questionnaires,
observation and 4 focus
group discussions
Functioning: proper
physical state of water
supply projects in
relation to their present
working condition at
the time of the survey
Protected spring, hand-
dug wells with pumps
52 out of 442 source
points not functioning.
(11.76%)
Arnold et al
(2013a)
Assess existing water
infrastructure,
determine the reliability
of water sources, assess
the water quality
available for domestic
use, and evaluate
community awareness
as related to water,
sanitation, and hygiene.
Rural Ghana, 2008-
2010
8 villages selected on
basis on participation in
previous community
development projects
and request by villagers
Cross-sectional surveys
in summers of 2008-
2010m using sanitary
surveys, conversations
with villagers, 1 focus
group, key informant
interviews and water
quality testing
None stated Standpipes, boreholes,
dug wells and shallow
wells
One third of standpipes
not functioning at time
of survey,

Chapter 5: A review of definitions and assessment approaches for water supply reliability
72
Author(s), year Study objective(s) Setting, year of study
and sample
Methods Definition of
reliability/synonym
Type of supply Estimates of
(un)reliability
Davis et al.
(2008)
Explore the
contribution of various
types of post-
construction support
(PCS) to the
sustainability of rural
water supply systems in
Bolivia
Rural Bolivia
2005
99 communities
Cross-sectional mixed
methods using
household survey,
system operator survey,
focus group with
village leaders, focus
group with women,
focus group with
village water committee
None stated 94 % had house
connections or yard
taps
27 % had public taps
8 % had wells
Breakdowns as reported
by operators: mean 2,
household members:
mean 3, women's focus
groups: mean 2.9
Typical duration of
breakdowns (dys)
operator: mean: 4.2,
household members:
9.8, women’s focus
groups mean 15.8.
Systems received prior
to 2000, range between
5 and 8 years in age
Gleitsmann et
al. (2007)
Assess the impact of
stakeholder
participation on the
management of water
sources; examining i)
choice-of technology
preferences ii) water
use patterns for
domestic and
agricultural purposes
among stakeholders
Rural Mali
2004
3 communities, 30
women, 60 men
Consultation with
World Vision and
village representatives
led to selection of a
representative cross
section that included all
ethnic groups
Mixed methods case
study using focus
groups, key informant
structured and
unstructured interviews
Success was defined as
a pump that was in-use
by the community.
Wide-diameter wells
and boreholes with
handpumps
Success rates of
different manual pumps
in the study area:
UPM 4/21 (19%);
India-Mali 6/11 (55%);
Vergnet 6/7 (86%)
Total 16/39 (41%)
If WHO minimum flow
rate guidelines of 13
l/min are applied,
success rate:4/39
(10%).

Chapter 5: A review of definitions and assessment approaches for water supply reliability
73
Author(s), year Study objective(s) Setting, year of study
and sample
Methods Definition of
reliability/synonym
Type of supply Estimates of
(un)reliability
Hoko & Hertle
(2006)
Evaluate the
sustainability of a rural
water point
rehabilitation project
that was carried by a
local NGO
Rural Zimbabwe
144 water points
Mwenezi: 37
Gwanda: 41
Bulilima: 38
Mangwe: 28
Cross-sectional
quantitative study
using structured
observation of water
points and structured
questionnaires
None stated Boreholes with
handpumps
Water points not
working in Mwenezi:
4%, Gwanda: 17%,
Bulilima: 13%
Mangwe: 25%.
Operation of the water
points deemed difficult
by a minimum of 19%
(Mwenezi) to a
maximum of 64%
(Mangwe) of
respondents.
Jiménez &
Pérez-Foguet,
(2011)
Establish relationships
between technology,
functionality and
durability of rural water
points
Rural Tanzania
2005-2006
5.921 water points 15
districts covering 15 %
of rural population
Quantitative cross-
sectional survey (Water
Aid data)
None stated Handpumps 2,326
(39.3%)
Motorised pumping
systems 2,180 936.8%)
Gravity fed 1,263
(21.3%)
Other (protected
springs, rainwater-
harvesting, windmill
powered water point):
152 (2.6%)
*
*Functionality: Handpumps 45.31%, gravity -fed systems: 48.61% motorised pumps 44.36%, other systems: 36.18% Aggregated functionality: 45.4%.
Handpump functionality dropped from 61% in first 5yrs to 6% in the 25yr period: Motorised systems started at 77% and dropped to 13%, gravity fed systems 66% to 20%.
Aggregated rate: 35-47% working 15 yrs after installation.
>30% of WP become non-functional after the first 5yrs and after this the functionality rate decreases at a slower rate (another 30% become non-functional in following 15yrs) -
handpumps show least favourable functionality rate; gravity-fed show irregular trend between periods but best performance in the long-run; motorised pumping systems have a
very good performance in the first period and maintain a similar descending slope as others in the long term

Chapter 5: A review of definitions and assessment approaches for water supply reliability
74
Author(s), year Study objective(s) Setting, year of study
and sample
Methods Definition of
reliability/synonym
Type of supply Estimates of
(un)reliability
Kleemeier
(2000)
Explore the assumption
about the link between
participation and
sustainability by
presenting findings
from a study of
operation and
maintenance on rural
water supplies that were
constructed under a
program widely praised
for its exemplary
approach to community
participation
Rural Malawi
1997-1998
Sample includes
schemes from all three
of Malawi’s
administrative regions.
Sample limited to
schemes that originally
had less than 120 km of
pipeline. 17 schemes
visited for one day and
a follow-up visit to four
of the schemes
Cross-sectional survey
involving discussion
with water schemes’
monitoring assistant,
main committee, tap
committees, repair
teams and observation
of schemes
None stated Piped- communal taps Overall, 66% of the
taps supplied water a
minimum of 50% of the
days in the previous 3
months. In 4 of the
smallest schemes (13-
37 taps), 80% or more
of the taps supply water
on a regular, if not
continuous basis
Majuru et al
(2012)
Assess the impact of
unreliability on water
service indicators of
distance to source,
water quantity and
quality
Rural South Africa
2007-2008
3 communities of which
one was a
control/reference
community, 114
households in total
Quasi-experimental
with repeated cross-
sectional surveys of
water supplies and daily
symptom diaries over
56 weeks
None stated Piped- communal taps
Drilled wells with
handpumps
Water tanks
Handpumps: broke
down for about 2 weeks
every 3 months; 83% ;
Tanks: water ran out
after 2 weeks: 50%
Communal taps
Community 1: 2
breakdowns 89%,
Community 2: 4
breakdowns: 58%
Moon (2006) Assess the role of
private sector
participation in
developing and
sustaining rural water
schemes
Rural Tanzania
2004-2006
6,812 distribution
points in 3 regions and
1 district in another
region
Quantitative cross-
sectional survey (Water
Aid data)
‘Functionality’ is the
ratio of functional
systems within the
population.
Four commonly used
extraction systems in
the study area: pump
and engine, Afridev
handpumps, Tanira
handpumps, and gravity
systems.
Pump and engine
schemes have a
functionality rate of
48% and the others
vary between 60% and
70%

Chapter 5: A review of definitions and assessment approaches for water supply reliability
75
Author(s), year Study objective(s) Setting, year of study
and sample
Methods Definition of
reliability/synonym
Type of supply Estimates of
(un)reliability
Musonda (2004) Identify factors that
contribute to the
promotion of
sustainability of rural
water supplies in
Zambia
Rural Zambia
2001
16 water points in
Mazabuka District
Mixed methods cross-
sectional survey with
structured
questionnaires and
observations
None stated Hand-dug well and
boreholes with
handpumps
8 functioning out of 16,
3 in disrepair for 2
months, 1 in disrepair
for 4 years, 1 very
difficult to operate, 3
functioning but had
problems. Five years
was the average age for
functional handpumps,
as they had been
constructed between
1995 and 2000. All
semi-functional
handpumps had been
constructed between
1980 and 1996
Norwegian
Agency for
Development
Cooperation
(2008)
Carry out a descriptive
based analysis of
Norad’s previous
support to the WSS
sectors in partner
countries, with
emphasis on Kenya and
Tanzania during the
period 1975 - 1995
Rural Kenya and
Tanzania
Archive search and
literature study, single
and group interviews
cross-sectional field
work
None stated Kenya: piped water
supply Tanzania:
Handpumps, gravity
schemes
Rukwa: between 65 %
and 74 % of 2,000
water points still
operating and in daily
use.
Kigoma: between 76 %
and 78 % of 800 water
points still working and
in daily use.
Kenya:
16 towns, 91 % of
water points still
working and in daily
use.

Chapter 5: A review of definitions and assessment approaches for water supply reliability
76
Author(s), year Study objective(s) Setting, year of study
and sample
Methods Definition of
reliability/synonym
Type of supply Estimates of
(un)reliability
Schweitzer
(2009)
Evaluate the efficacy of
community
management in
sustainability of rural
water supply
Rural Dominican
Republic
2008-2009
Stratified random
sample of 64 water
systems built in the DR
by initiatives of the
National Institute of
Potable Water (INAPA,
23) and Peace Corps
(41) out of a total
cohort of 185 (118 PC
and 67 INAPA)
Mixed methods using
secondary data analysis
observation (participant
and non-participant)
focus group/key
informant interviews
household surveys
formal versus informal
interviews
None stated INAPA (21): Public or
shared taps
1%, Patio connections
77%, Household
connections
9%, Multiple
connections
14%;
Peace Corps
(40):Public or shared
taps 6%, Patio
connections 68%,
Household connections
8%, Multiple
connections 18%.
Systems with major
repairs within last
month:
INAPA: 80 %, Peace
Corps 45%
Days per week with
water INAPA: 5.7,
Peace Corps: 6.2
Hours per day with
water INAPA: 11.4,
Peace Corps: 16.6
Average system age
(years) INAPA: 5;
Peace Corps: 6.85

Chapter 5: A review of definitions and assessment approaches for water supply reliability
77
Author(s), year Study objective(s) Setting, year of study
and sample
Methods Definition of
reliability/synonym
Type of supply Estimates of
(un)reliability
World Bank –
Netherlands
Water
Partnersrhip
(2009)
Investigate how the
provision of support to
communities after the
construction of a rural
water supply project
affected project
performance in the
medium term
Rural Peru, and Ghana.
Peru mid-2004, Ghana
late 2004
Peru: 99 villages, 25
households on each
village, 1,360 male and
1,089 female
respondents
Cross-sectional mixed
methods using
household survey,
system operator survey,
focus group with
village leaders, focus
group with women,
focus group with
village water committee
None stated Handpumps, public taps
and house connections
∞
∞Peru: Taps working (operator data): FONCODES Average: 95%; SANBASUR Average 93%; Average hours of operation/day (household data): FONCODES: 18.8;
SANBASUR: 19.9; Average major unplanned interruptions in water supply service for at least one day in past 6 months (operator data): FONCODES: 89%; SANBASUR: 59%;
(Leaders): FONCODES: 70%; SANBASUR: 55%; Average system age: FONCODES: 7.57 years; SANBASUR: 6.13 years; Average number of days to fix major problem
operator: FONCODES: 4.53; SANBASUR: 1.06; leaders: FONCODES: 2.08; SANBASUR: 2.58
Ghana: % of villages where all project handpumps are working (89): Brong Ahafo: 88; Volta: 92; % villages with working systems that had a breakdown in last 6 months (57):
Brong Ahafo: 58; Volta: 55; Average years since completion: Brong Ahafo: 6.2; Volta: 5.8 (Average 6); Median days to repair the system last time it broke (reported by hhs) (20):
Brong Ahafo: 18; Volta: 22

Chapter 5: A review of definitions and assessment approaches for water supply reliability
78
Table 5.4: Studies in both urban and rural settings
Author(s), year Study objective(s) Setting, year of study
and sample
Methods Definition of
reliability/synonym
Type of supply Estimates of
(un)reliability
Akosa (1990) Develop of a Data
Envelopment Analysis
method to combine
assessment of technical,
financial, economic,
institutional, social and
environmental aspects
of water supply and
sanitation projects
Rural and urban Ghana,
1986-1988
6 water supply projects
over a 30-month period
Cross sectional surveys
with Observation,
records from treatment
plants, interviews with
plant operators
None stated Piped
Drilled wells with
handpumps
Hand-dug wells with
handpumps
*
*Accra-Tema Water Supply: Power outages involved 193 faults lasting a total of 707 hrs 7mm in 3 years (1986-88). Frequency of fault: 1 fault in 5.67 days. Duration: average
3.67 hrs/fault. Plant down time: 2.7%.
Borehole Water Supply: 21.7% down time.
Package Plant Water Supply: 20.3 % down time. % of time when plant was operating with inadequate supply of chemicals (including periods of chemical rationing) 58.7%.
2500 Drilled Wells Water Supply: Target established is 90% of pump operational at all times. Achievement is 85% of all handpumps operational. Down time is 15%.
3000 Drilled Well Water Supply: Target established is 90% of pumps operating at all times. Achievement is 40% of all hand pumps operational. Down time is 60%.
Hand Dug Well: Pump down time is calculated as 2.3% but water is available through the hatch

Chapter 5: A review of definitions and assessment approaches for water supply reliability
79
Author(s), year Study objective(s) Setting, year of study
and sample
Methods Definition of
reliability/synonym
Type of supply Estimates of
(un)reliability
Asian
Development
Bank (2009)
Assess project
performance and
identify lessons for
maximizing the
development
effectiveness of water
supply and sanitation
interventions, by
conducting rigorous
impact evaluation
Rural and urban
Punjab, Pakistan. 7
randomly selected
districts of the 30
covered by the Punjab
Rural Water Supply &
Sanitation Project
(PCWSSP) and the
Punjab Community
Water Supply &
Sanitation Project
(PCWSS). 115
subprojects were
identified using
stratified random
sampling, A total of
1,301 treatment
households covered by
a project and 1,301
comparison households
outside the projects
Mixed methods using
key informant
interviews, focus group
discussions, and
household surveys.
Comparison
communities identified
using district census
reports. Community-
level parameters used
for matching:
i) total village area
ii) number of
households with
potable water
iii) average household
size
iv) literacy rates.
None stated 92 % of the project
communities had a
community water
supply system, while
8% of comparison
communities
did.
24% depended on hand
pumps in project areas
and 54% than in the
comparison
communities
40 % served by tube
wells in project
communities and 24 %
in comparison
communities
89% PCWSSP
functional, and 68 % of
PRWSSP
Households receiving
water received on
average 5 hours of
supply per day.
18 % of households in
project areas used
suction machines to
deal with low pressure.
Down time less than 3
days for 2/3 of major
repairs
Bourgois et al.
(2013)
Survey of the quantity
and quality of existing
water access points in
three districts in Sierra
Leone
Rural and Urban Sierra
Leone
2,859 drinking water
access systems in 3
districts
Survey of water points
and interviewers with
local leaders of villages
Rate of functionality
defined as access to
water throughout the
year and a working
pump
Spring box : 2
bore hole : 499
Hand dung well : 2028
Open well : 330
30 % of the finished,
complete borehole
systems were non-
functional due to a
broken pump

Chapter 5: A review of definitions and assessment approaches for water supply reliability
80
Author(s), year Study objective(s) Setting, year of study
and sample
Methods Definition of
reliability/synonym
Type of supply Estimates of
(un)reliability
O’Hara et al.
(2008)
Quantify current level
of access to safe water
and sanitation in rural
and urban communities
across the Republic of
Kazakhstan.
Rural and urban
Kazakhstan
2005
7,515 people
(0.05% of the
population)
Cross-sectional in-
depth questionnaire
survey administered
to7,515 people; 250
semi-structured
interviews with
individuals from urban
and rural settlements, as
well as officials
working in various
organisations concerned
with water supply and
health issues; and 16
focus group discussions
with a range of
stakeholder groups
None stated Piped Urban dwellers report
service cuts on 6 days a
month for 8-10 hours
per day. Rural dwellers
report cuts of 15-16
hours on an average of
21 days a month.
People living in upper
floors of high-rise
buildings have cut-offs
due to low pressure

Chapter 5: A review of definitions and assessment approaches for water supply reliability
81
Author(s), year Study objective(s) Setting, year of study
and sample
Methods Definition of
reliability/synonym
Type of supply Estimates of
(un)reliability
Pan American
Health
Organisation
(2001)
Monitor and evaluate
the situation of drinking
water and sanitation in
the Region of the
Americas
Rural and urban parts
of the Americas*
Questionnaires
collation of information
already existing in the
countries, through
consultations of
documents and reports
of entities of the sector
and government
institutions, results of
household surveys,
applied research and
Sectoral Analysis or
other pertinent studies
conducted in the sector.
None stated Piped and un-piped Urban systems
provided with water
intermittently: 0 -100%
Urban population
provided with water
intermittently: 0-99.9 %
Rural systems in
operation: 6-100%
*Countries covered in the survey were: Anguilla, Antigua & Barbuda, Argentina, Bahamas, Barbados, Belize, Bolivia, Chile, Colombia, Costa Rica, Cuba, Dominica, Dominican
Republic, Ecuador, El Salvador, French Guiana, Grenada, Guadalupe, Guatemala, Guyana, Haiti, Honduras, Montserrat, Nicaragua, Panama, Paraguay, Peru, Puerto
Rico, Saint Kitts & Nevis, Saint Lucia, Suriname, Trinidad & Tobago, Turks & Caicos Islands, Uruguay, Venezuela and Virgin Islands

Chapter 5: A review of definitions and assessment approaches for water supply reliability
82
These definitions vary considerably, including: “the ratio of functional water systems in
the population” (Moon, 2006); “the physical absence of water flowing from the tap”
(Howard, 2002); “availability of water at a point of consumption (household or public
stand-pipe) for 24 hours a day, 7 days a week, 365 days a year” (Shah, 2003) and “a
service is reliable if it is provided in time, and with the quality and quantity required”
(Zérah, 1998).
Although none of the definitions are shared by more than one study, there is some
degree of commonality in the features used by the different studies as part of their
definition. One is to define reliability in terms of the water supply system and how it
works (3 out of 7 studies) (Admassu et al., 2003, Howard, 2002, Moon, 2006). The
other defines reliability in relation to the extent to which the needs of water users are
met (2 out of 7 studies) (Zérah, 1998, Zérah, 2000a, Gleitsmann et al., 2007).
5.3.2 Assessment of reliability
The criteria used to assess reliability also differ somewhat. For example, Akosa (1990)
quantifies reliability as the “fraction of the time when the service is available to the
user”, while Kleemeier (2000) reports on the “proportion of taps supplying water at
time of survey and preceding 3 months”. Some assessment criteria are shared by more
than one study and seem to be related to the setting i.e. rural or urban.
The assessment criteria used in urban settings are presented in Table 5.5. The most
common criterion used to assess reliability of water supplies in urban settings is
duration of supply in hours per day. This criterion is used in 12 of the 18 studies
reporting on urban settings (Andey and Kelkar, 2009, Asian Development Bank, 2007,
Baisa et al., 2010, Caprara et al., 2009, Gulyani et al., 2005, Pan American Health
Organization, 2001, Pattanayak et al., 2005, Shah, 2003, Thompson et al., 2000, Virjee
and Gaskin, 2010, Widiyati, 2011, Zérah, 2002, Zérah, 1998, Zérah, 2000a, Jiménez
and Pérez-Foguet, 2011).

Chapter 5: A review of definitions and assessment approaches for water supply reliability
83
Table 5.5: Assessment criteria for reliability of urban water supplies
Ad
eribig
be et al. (2
00
8)
Ak
osa (1
990
)
An
dey
& K
elkar (2
00
9)
Asian
Dev
elop
men
t Ban
k
(20
07
)
Ay
ou
b &
Malaeb
(20
06)
Baisa et al. (2
01
0)
Cap
rara et al. (20
09
)
Gu
lyan
i et al. (20
05)
Ho
ward
(20
02)
My
coo
(19
96
)
Pan
Am
erican H
ealth
Org
anisatio
n (2
00
1)
Pattan
ayak
et al. (20
05)
Sh
ar (200
3)
Th
om
pso
n et al. (2
00
0)
Virjee &
Gask
in (2
01
0)
Wid
iyati (2
01
1)
Zérah
(19
98, 2
00
0a,
20
02)
Frequency of supply per week*
Frequency of supply in days per
week
Duration of supply in hours per day
Fraction of the time water is
available
Frequency and length of service
interruptions
Interruption in supply in the
previous week
Pressure
Proportion of systems with
intermittence
Proportion of population served by
intermittent systems
*Unit not specified
Chapter 5: A review of definitions and assessment approaches for water supply reliability
84
Amongst the literature covering rural settings, 7 studies (Admassu et al., 2003, Arnold
et al., 2013a, Asian Development Bank, 2009, Davis et al., 2008, Jiménez and Pérez-
Foguet, 2011, Pan American Health Organization, 2001, World Bank - Netherlands
Water Partnership, 2009) report on the proportion of water sources functional at the
time of the survey (Table 5.6). Downtime (duration of breakdowns in the water supply
system) is reported in 5 of the studies (Arnold et al., 2013a, Asian Development Bank,
2009, Davis et al., 2008, Majuru et al., 2012, World Bank - Netherlands Water
Partnership, 2009). In the study by Davis et al. (2008) the authors note that
discrepancies in the reported duration of breakdowns may have been due to respondents
classifying events of low pressure that resulted in limited or no supply as breakdowns.
Three of the studies report on ease of operation of handpumps. In a study in Mali,
Gleitsmann et al. (2007) report that some households had stopped using the handpumps
altogether due to - amongst other reasons - difficulty in manually operating the pumps.
This difficulty in operating handpumps is also reported in a study of the sustainability of
rehabilitation of rural water systems in Zimbabwe by Hoko and Hertle (2006). In some
instances up to 100 strokes were required before water was discharged from handpumps,
and up to 64 % of respondents reported having difficulty in using the handpumps.
Similarly, Musonda (2004) finds that women and children in particular sometimes had
difficulty in collecting water from handpumps because they were too stiff to operate.

Chapter 5: A review of definitions and assessment approaches for water supply reliability
85
Table 5.6: Assessment criteria for reliability of rural water supply
Ad
mas
su e
t al
. (2
003
)
Arn
old
et
al.
(201
3b
)
Asi
an D
evel
op
men
t B
ank
(2
00
9)
Bo
urg
ois
et
al.,
(2
01
3)
Dav
is e
t al
. (2
008
)
Gle
itsm
ann
et
al.
(20
07
)
Ho
ko
& H
ertl
e (2
006
)
Jim
énez
& P
érez
-Fo
gu
et (
2011
)
Kle
emei
er (
20
00
)
Maj
uru
et
al.
(20
12
)
Mo
on
(2
006
)
Mu
son
da
(20
04
)
No
rweg
ian
Ag
ency
for
Dev
elo
pm
ent
Co
op
erat
ion
(2
00
8)
O’H
ara
ett
al.
(200
8)
Pan
Am
eric
an H
ealt
h
Org
anis
atio
n (
20
01
)
Sch
wei
tzer
(2
009
)
Wo
rld
Ban
k –
Net
her
land
s W
ater
Par
tner
ship
(2
00
9)
Age of water supply system
Breakdowns in previous 6 months
Breakdowns in study period
Down time
Duration of supply hours per day
Duration of supply days per week
Duration of supply interruptions in
hours/day and days/week
Ease of operation of handpumps
Flow rate
Hours/days water was available
per week

Chapter 5: A review of definitions and assessment approaches for water supply reliability
86
Adm
assu
et
al.
(2003
)
Arn
old
et
al. (2
013b
)
Asi
an D
evel
opm
ent
Ban
k (
2009
)
Bourg
ois
et
al.,
(2013)
Dav
is e
t al
. (2
008)
Gle
itsm
ann e
t al
. (2
007)
Hoko &
Her
tle
(2006)
Jim
énez
& P
érez
-Foguet
(2011
)
Kle
emei
er (
2000)
Maj
uru
et
al. (2
012)
Moon (
2006)
Muso
nda
(2004
)
Norw
egia
n A
gen
cy f
or
Dev
elopm
ent
Cooper
atio
n (
2008
)
O’H
ara
ett
al.
(2008
)
Pan
Am
eric
an H
ealt
h O
rgan
isat
ion
(2001)
Sch
wei
tzer
(2009
)
Worl
d B
ank –
Net
her
lands
Wat
er
Par
tner
ship
(2009
)
Lifespan of water system
(proportion functional over a
period of time)
Number of pumps in use at time of
survey
Proportion of taps supplying water
at time of survey and preceding 3
months
Proportion of functional water
sources at time of survey
Proportion of non-functional water
sources at time of survey
Sources with major repairs within
last month

Chapter 5: A review of definitions and assessment approaches for water supply reliability
87
5.3.3 Lifespan of water supply systems
Five studies assess reliability in relation to the age of water supply systems. Kleeimeier
(2000) evaluated the Malawi Rural Piped Water Scheme Program and reports that
although the smallest and newest schemes were performing well 3 to 26 years after
completion, overall almost half of the schemes were performing poorly. In a survey of
16 water points in a district in rural Zambia, Musonda (2004) found that 10 years was
the average age for functional handpumps, whereas semi-functional hand pumps were
approximately 13 years old or more. Functional handpumps were those that typically
served 360 people, whereas non-functional ones were those that had served about 506
people. This correlation between age and functionality of water supply systems is also
reported by Moon (2006). Anecdotal evidence from the study suggests that hand pumps
require major rehabilitation after 7-8 years. Most pump and engine systems have
significant maintenance costs within a few years but a few seem to work after 30 years,
while gravity systems seem relatively unaffected by age.
Jiménez and Pérez-Foguet (2011) surveyed water points in 15 districts covering 15 % of
the rural population in Tanzania. They find that functionality rates did not vary greatly
between hand pumps, gravity-fed systems and motorised pumping systems.
Functionality of hand pumps dropped from 61 % in the first five years of installation to
6 % over a period of 25 years. In the same period, motorised pumps dropped from 77 %
to 13 %, while gravity-fed systems dropped from 66 % to 20 %. The aggregated
functionality for three technologies was 35-47 % of functional water points after 15
years. The authors conclude that generally 30 % of water points became non-functional
within the first five years of operation, after which period the decrease in functionality
is at a slower rate.
In contrast, Bourgois et al. (2013) find that the performance of older systems is
significantly better than that of newer ones. In their survey of water points in three
districts in Sierra Leone, 73 % of the water systems that were 22 years old were
functioning at the time of the survey, compared to 40 % of those that were a year old.
5.4 Discussion
The review has explored definitions of and criteria used to assess water supply
reliability, and noted some reports on the lifespans of various water supply technologies.

Chapter 5: A review of definitions and assessment approaches for water supply reliability
88
Only about a fifth (7/34) of studies in the review give explicit definitions of reliability.
These definitions vary, but two common features appear to underlie these definitions;
the functionality of the water supply system itself, and the extent to which it meets the
needs of water users. The most common criterion used to assess water supply reliability
in urban settings is the duration / continuity of supply in hours per day, whereas in rural
settings the proportion of functional water systems is more commonly used. Results
from four out of five studies reporting on the lifespans of water supply systems indicate
a correlation between age and functionality; older systems are less likely to be
functional. These results are contradicted in one study which finds better functionality
amongst older systems.
Before discussing the implications of these findings, there are some limitations to the
review that should be noted. The first of these arises from the lack of consensus on
what is meant by water supply reliability. Studies use various terms synonymous to
reliability, and although efforts were made to capture this variation in terminology in
the search terms, it is likely that there are some that were missed. The studies retrieved
must be considered in the light of this limitation. Although the literature reviewed is by
no means exhaustive, it does cover a range of grey and published literature, including
literature from key agencies in the water sector and some results from multi-country
monitoring activities.
Turning now to the results of the review, an interesting finding is that the geographic
distribution of studies appears to be biased towards sub-Saharan Africa, as half of the
studies reviewed were from there. Notably, this is in contrast to the number of studies
from the same region on how households cope with unreliable water supplies (Chapter
7). The spread between rural and urban settings is somewhat more even.
The two features underlying the definitions of reliability are reflective of the conundrum
that characterises the assessment of other features of water supply. Should the
definition and subsequent assessment be based on a binary approach of whether the
supply is reliable, accessible or safe, or rather one that better reflects the quality of these
water supply features?
The results indicate that current practice appears to favour assessment criteria based on
the former in rural settings, and the latter in urban settings. The most common
assessment criterion that is reported in rural settings is the proportion of water sources

Chapter 5: A review of definitions and assessment approaches for water supply reliability
89
that are functional at the time of the survey. Given that the majority of studies reviewed
are from sub-Saharan Africa where the majority of rural dwellers rely on handpumps
(WHO/UNICEF, 2011), it is likely that the assessment approach might have been
shaped on this basis.
There are some challenges that the approach presents. First, although handpumps are
quite common as the supply technology in rural areas, there are some countries that are
making significant progress in ‘moving up the service ladder’ by providing piped
technologies, either at communal points, within yards or within the home, South Africa
being an example (see Tissington et al., (2008)). In these settings water supply systems
may not stop functioning completely, but gradually deteriorate in performance
(Lockwood et al., n.d.), and failure to take this into account would yield inaccurate
estimates of the real situation on the ground.
Further, these ‘snap-shots’ of the proportion of functional systems do not always take
into whether the breakdown is short-term, pending repair, or if the water source is
completely non-functional (Koestler et al., 2010, Lockwood et al., n.d.). The difficulty
in operating handpumps that is noted as a significant problem in three studies perhaps
alludes to the limitations of considering reliability of handpump supplies as a binary
issue of whether or not the pump works.
The dominance of a particular assessment criterion in a particular setting should also not
be assumed to mean that it is necessarily the most appropriate. For instance, although
duration of supply appears to be the de facto assessment criterion in urban settings,
evidence suggests that for instance, adequate flow rate is also of importance to water
users (Davis et al., 2008), and that pressure fluctuations in piped systems can negatively
affect water quality and subsequently health (Klasen et al., 2012, Lechtenfeld, 2012).
Taking this into account plus the range of assessment criteria found in this review, the
findings point towards reliability of water supply being a multi-attribute concept.
Conclusions
The review has shown that there is a lot of variation in the definitions and assessment
criteria used in studies on water supply reliability in developing countries. That said,
there is some degree of commonality in the assessment criteria used, depending on the
setting. Many of the studies conducted in urban settings report on duration of supply in

Chapter 5: A review of definitions and assessment approaches for water supply reliability
90
hours per day, whereas in rural settings the proportion of functional water supply
systems is more commonly reported.
Although these particular criteria dominate in the existing literature, care should be
exercised to not assume that they are necessarily the most appropriate. First, the
heterogeneity in the definitions and assessment criteria used is perhaps indicative of a
multi-attribute nature of the concept of reliability. Failure to take this into account in
the assessment process – regardless of setting – would likely yield an inaccurate
depiction of the situation. Secondly, the reliance on a binary indication of functionality
in rural settings may not take into account the changing landscape of water supply
technologies in these areas, where supply systems may not necessarily fail altogether
but perform at a sub-optimal level. Thirdly, there is no indication that the perspectives
of water users – those actually faced with unreliable water supplies – are taken into
account when deciding upon assessment criteria. The next chapter addresses this issue
by assessing households’ preferences for reliable water supplies.

91
6 Preferences for reliability of water supply in
Limpopo

Chapter 6: Preferences for reliability of water supply in Limpopo
92
This chapter builds on the systematic review presented in Chapter 5 and empirically
explores the question as to what constitutes a reliable water supply. A discrete choice
experiment is applied to elicit households’ preferences for reliability of water supplies.
It addresses three main points in households’ preferences: i) the attributes of reliability
that are of interest to households and their relative importance, ii) how much households
would be willing to pay for these attributes, and iii) the proportion of households who
will accept hypothetical water services, if given specific levels of reliability.
6.1 Introduction
Understanding preferences for reliable water supplies is important for several reasons.
First, households’ preferences for water supplies can have a significant impact on the
willingness to use water services. With increasing emphasis on involving users in
decision-making about services, eliciting preferences is an important step towards
designing appropriate services (Yang et al., 2006). Further, as efforts to develop
indicators to succeed those of the MDGs gather momentum, it should be highlighted
that the primary challenge presented by water supply reliability is how to define and
assess it in a framework that is cognisant of:
the multi-attribute nature of water supply reliability
the various water supply technologies
the feasibility and cost of assessment
the role of water supply reliability as a predictor of health, social and economic
outcomes
Evidently, the development of this framework and subsequent definition and assessment
criteria requires the continued collaborative efforts of those providing water supplies,
funders and monitoring agencies. Further, understanding the value water users place on
various attributes of reliability is necessary to better tailor assessment criteria that
broadly recognise user perspectives. Amongst the studies reviewed in the previous
chapter, little account is given as to how the criteria used to assess reliability were
arrived at, or water users’ preferences for reliability.
The 2013 update on the MDG target for water and sanitation outlines proposed
definitions and targets for the post-2015 agenda. Amongst these is the proposed
definition of “Intermediate drinking water supply at home” as “the use of an improved
source that is on the premises and from which water is “available in acceptable

Chapter 6: Preferences for reliability of water supply in Limpopo
93
quantities at least 12 of the past 14 days” (WHO/UNICEF, 2013). But even in this
report it is not evident how this definition was arrived at, nor the extent to which it
matches water users’ own perceptions or definitions of unreliable water supply. Are
there other attributes not reflected in this definition that would constitute unreliable
water supplies, from the perspective of the user? How closely is what is measured in
global monitoring programmes indicative of water users / households actual experience?
If indeed the adage that what gets measured gets improved is true, then greater emphasis
should be given to understanding households’ own preferences for water supply
reliability, and where improvements can be targeted.
6.1.1 Eliciting preferences
Preferences can be elicited through various qualitative and quantitative techniques. The
former typically entails surveys of sample households and key informants, or group-
based approaches such as community meetings or focus groups (Ryan et al., 2001). A
major limitation of this technique is that is that it essentially produces a list of
preferences, with no indication of how they are prioritised (World Health Organization,
2012).
Quantitative approaches include ranking, rating as well as choice-based techniques.
Essentially, in ranking exercises respondents assign an ordinal ranking a given set of
options, and in rating exercises a numeric or semantic scale is assigned to given criteria
or scenarios. However, the limitation that these approaches present is that they do not
provide information on strength of preference or trade-offs that respondents may be
willing to make.
6.1.2 Why a discrete choice experiment?
Discrete choice experiments (DCEs) are a powerful choice-based approach aimed at
assessing stated preferences for a given phenomenon, as a function of the
phenomenon’s characteristics. The approach is based on the economic theory that users’
decisions with regards to goods or services are based primarily on the characteristics or
attributes of those goods or services. DCEs have been applied widely in transport,
health and environmental economics (World Health Organization, 2012).
As applied to this study, the technique is based on the premise that the reliability of
water supplies can be described by attributes of reliability, and the extent to which
households value the reliability of water supplies depends on levels of these attributes.

Chapter 6: Preferences for reliability of water supply in Limpopo
94
In the discrete choice survey, respondents are presented with a number of choice sets,
each describing a series of attributes at different levels. By varying the levels of
attributes in the various choice sets and asking respondents to make their choices again,
the relative importance that individuals place on these attributes can be determined
(Phillips et al., 2006). If there is a cost attribute included in the DCE, the preferences
can be quantified in monetary terms i.e. a monetary value attached to them.
When well-designed and conducted, DCEs can provide information on:
The characteristics of a water service that are most important for households
How much households are willing to pay for water services of given attributes and
attribute levels
How characteristics such as sex, socio-economic status, community etc., can
influence preferences for water services
What proportion of households would be interested in defined services levels
6.2 Objectives
The discrete choice experiment sought to address the following questions:
Which attributes of water supply reliability are of importance to households?
How much are households willing to pay for improvements in these attributes?
Do preferences and willingness to pay for attributes differ between various
subgroups?
What proportion of households would be interested in water services of defined
level of reliability?
Understanding the preferences of households is useful for policy and planning in water
supply services. Optimal levels of water supply reliability can be determined, and
through willingness to pay estimates, some insights into the monetary value of the
levels of reliability can be drawn.
6.3 Methods
Several stages are involved in the design of discrete choice experiments (DCEs). These
are: identifying the attributes; assigning attribute levels; designing the choice sets and
generating the questionnaire.

Chapter 6: Preferences for reliability of water supply in Limpopo
95
6.3.1 Establishing attributes and assigning attribute levels
To establish the attributes and levels, the findings from the review of definitions and
assessment criteria for reliability (Chapter 5) were integrated with the findings of a
purposive literature search on DCEs on water supply improvements, water supply
service benchmarks in South Africa and discussions with researchers from the
collaborating university who themselves reside in the vicinity of the study communities.
The search terms, databases, characteristics of the studies, attributes and levels
identified from the DCE literature are tabled in Appendix 6.1.
Three attributes were identified from the literature search: availability of supply during
the day (in hours per day); availability of supply during the week (in days per week) and
prior notification of water supply interruptions. From the Strategic Framework for
Water Services (Department of Water Affairs, 2003) and the guide for water supply
service levels(Department of Water Affairs, 2000), 3 attributes were identified that were
thought to be potentially relevant to the respondents and the water supply policy in the
country (Table 6.1). The Strategic Framework for Water Services sets out norms for
water service coverage and quality, as well the roles of various spheres of government,
while the guide serves to assist local government in the selection of appropriate levels
of water services.
Table 6.1: Attributes and levels from water service benchmarks
Attribute Service benchmark Interpretation
Downtime (time taken to
repair breakdowns) Not to exceed 48 consecutive
hours (2 days) Maximum downtime is 2
consecutive days
Flow rate 10 ℓ/min Ideally 2 min to fill up a 20-ℓ
container
Number of breakdowns Availability of water for at
least 350 days per year Maximum 15 days without
supply; with a maximum
downtime of 2 days, translates to
about 8 breakdowns
Note: South African water service benchmarks from the Department of Water Affairs (2000, 2003)
One of the attributes that had initially been included was ‘ease of operation’ of hand-
pumps. After discussions with environmental health researchers from the local
university this attribute was dropped, as it was established that there were no longer any
hand-pumps in the study area. The attributes and levels finally included in the choice
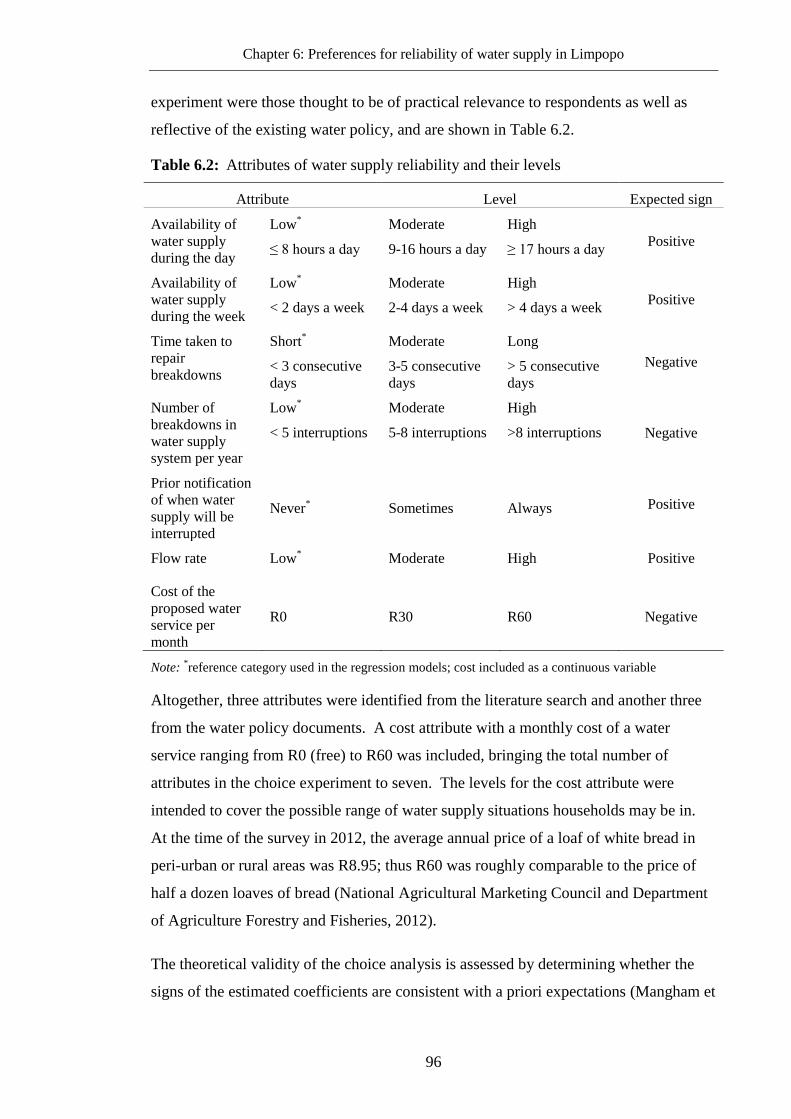
Chapter 6: Preferences for reliability of water supply in Limpopo
96
experiment were those thought to be of practical relevance to respondents as well as
reflective of the existing water policy, and are shown in Table 6.2.
Table 6.2: Attributes of water supply reliability and their levels
Attribute Level Expected sign
Availability of
water supply
during the day
Low*
≤ 8 hours a day
Moderate
9-16 hours a day
High
≥ 17 hours a day Positive
Availability of
water supply
during the week
Low*
< 2 days a week
Moderate
2-4 days a week
High
> 4 days a week Positive
Time taken to
repair
breakdowns
Short*
< 3 consecutive
days
Moderate
3-5 consecutive
days
Long
> 5 consecutive
days
Negative
Number of
breakdowns in
water supply
system per year
Low*
< 5 interruptions
Moderate
5-8 interruptions
High
>8 interruptions Negative
Prior notification
of when water
supply will be
interrupted
Never* Sometimes Always Positive
Flow rate Low* Moderate High Positive
Cost of the
proposed water
service per
month
R0 R30 R60 Negative
Note: *reference category used in the regression models; cost included as a continuous variable
Altogether, three attributes were identified from the literature search and another three
from the water policy documents. A cost attribute with a monthly cost of a water
service ranging from R0 (free) to R60 was included, bringing the total number of
attributes in the choice experiment to seven. The levels for the cost attribute were
intended to cover the possible range of water supply situations households may be in.
At the time of the survey in 2012, the average annual price of a loaf of white bread in
peri-urban or rural areas was R8.95; thus R60 was roughly comparable to the price of
half a dozen loaves of bread (National Agricultural Marketing Council and Department
of Agriculture Forestry and Fisheries, 2012).
The theoretical validity of the choice analysis is assessed by determining whether the
signs of the estimated coefficients are consistent with a priori expectations (Mangham et

Chapter 6: Preferences for reliability of water supply in Limpopo
97
al., 2009). The expected signs of the coefficients for each of the attributes are shown in
the last column of Table 6.2. The signs of the coefficients were expected to be positive,
with the exception of time taken to repair breakdowns, number of breakdowns and
monthly cost of the service. For instance, households would be expected to prefer
shorter repair times, fewer breakdowns and lower water prices, all indicated by a
negative sign on the coefficients for these the attributes.
6.3.2 Designing the choice sets and generating the questionnaire
With seven attributes and each of them with three levels, the design would generate
2,187 scenarios are possible. A fractional factorial design was used to reduce this to a
more practical number. An D-efficient design (Kuhfeld, 2005) was generated in SAS
9.3 software(SAS Institute Inc, 2010), resulting in 18 scenarios. The questionnaire was
first compiled in English, translated into the local language of TshiVenda, and thereafter
back-translated into English to verify linguistic and contextual accuracy. An example
of the English version of a choice scenario is shown in Figure 6.1.

Chapter 6: Preferences for reliability of water supply in Limpopo
98
Characteristic Service A Service B Your Current service
Availability of water
supply during the day
Moderate
Water available 9-16
hours per day
Low
Water available 8 hours
per day and less
This is the service your
household currently
experiences
Availability of water
supply during the
week
Moderate
Water available 2-4
days per week
High
Water available more
than 4 days per week
Time taken to repair
breakdowns
Long
More than 5
consecutive days
Short
Not more than 2
consecutive days
Number of
breakdowns per year
(12 months)
Moderate
5-8 interruptions
High
More than 8
interruptions
Prior notification of
when water supply
will be interrupted Always Never
Pressure High Moderate
Cost of the proposed
water service per
month R30 R0
If you had the option
to choose, which of the
three services would
you opt for?
(please tick one)
Figure 6.1: An example of the choice scenario
Respondents were asked to consider a choice set with two hypothetical choice
alternatives, along with an opt-out alternative if they did not prefer any of the
hypothetical alternatives. This opt-out alternative was the current water supply.

Chapter 6: Preferences for reliability of water supply in Limpopo
99
6.3.3 Administering the choice survey
The survey was administered through face to face interviews with trained interviewers.
The survey was pre-tested on four households; two with private supplies and two with
shared water supplies. Minor modifications were made thereafter, relating mainly to the
wording in the local TshiVenda language. The survey began with a warm-up exercise,
in which respondents were introduced to the choice situation and the attributes and
levels were explained. The interviewers then went through an example of a choice
scenario with the respondents, and answered any questions that arose. The attribute
levels for the ‘current service’ were based on respondents’ reviews in Part 1 of the
survey and are summarised in Chapter 4. These were read out to the respondents as
they went through the DCE questionnaire. Respondents were given the choice to either
read the questionnaire themselves or have it read out by the interviewer. To aid in
comprehension, respondents who chose to have it read out to them were still shown
copies of each of the choice scenarios during the interview.
6.3.4 Analysis
In each choice scenario, a respondent n faces a choice among J = 3 alternatives; two
hypothetical water supply reliability options and their current supply reliability, with T
= 18 such choice scenarios. The 3 alternatives in each scenario are described in terms
of the reliability attributes shown in Figure 6.1. A respondent n faces attributes of
alternative j in choice scenario t that are represented by the vector Vnjt. The respondent
n derives a certain level of utility from each of the three alternatives in the choice
scenario, and in the case of alternative j, this utility is expressed as:
𝑼𝒏𝐣𝐭 = 𝜷𝐧𝑽𝒏𝐣𝐭 + ɛ𝒏𝒋𝒕 ( 1 )
where βn is a coefficient vector relating the respondent n and the alternative Vnjt to their
utility for that alternative. εnjt is an unknown random component denoting factors that
influence utility but are not captured in βnVnjt.
In each of the 18 choice scenarios, the respondent chooses the alternative with the
highest utility. The researcher cannot observe the respondent’s utility but can observe
their choice. Therefore, the probability that respondent n will choose alternative j is that
alternative j has a higher utility than alternative i; i.e. choose j if Unjt > Unit.

Chapter 6: Preferences for reliability of water supply in Limpopo
100
6.3.4.1 Conditional logit model
Households’ preferences were estimated using McFadden’s (1973) conditional logit
model in Stata 12.1 (Stata Corp, 2011) using the equation:
𝑉 = 𝛽0 + 𝛽1_𝑎𝑣𝑎𝑖𝑙𝑎𝑏𝑙𝑒 ≤8 ℎ𝑟𝑠/𝑑𝑎𝑦 + 𝛽2_𝑎𝑣𝑎𝑖𝑙𝑎𝑏𝑙𝑒 9−16ℎ𝑟𝑠/𝑑𝑎𝑦
+ 𝛽3_𝑎𝑣𝑎𝑖𝑙𝑎𝑏𝑙𝑒 >16ℎ𝑟𝑠/𝑑𝑎𝑦 + 𝛽4_𝑎𝑣𝑎𝑖𝑙𝑎𝑏𝑙𝑒 < 2𝑑𝑎𝑦𝑠/𝑤𝑒𝑒𝑘
+ 𝛽5_𝑎𝑣𝑎𝑖𝑙𝑎𝑏𝑙𝑒 2−4 𝑑𝑎𝑦𝑠/𝑤𝑒𝑒𝑘 + 𝛽6_𝑎𝑣𝑎𝑖𝑙𝑎𝑏𝑙𝑒 >4𝑑𝑎𝑦𝑠/𝑤𝑒𝑒𝑘
+ 𝛽7_𝑏𝑟𝑒𝑎𝑘𝑑𝑜𝑤𝑛𝑠< 3𝑑𝑎𝑦𝑠 𝑡𝑜 𝑟𝑒𝑝𝑎𝑖𝑟
+ 𝛽8_𝑏𝑟𝑒𝑎𝑘𝑑𝑜𝑤𝑛𝑠 3−5𝑑𝑎𝑦𝑠 𝑡𝑜 𝑟𝑒𝑝𝑎𝑖𝑟
+ 𝛽9_𝑏𝑟𝑒𝑎𝑘𝑑𝑜𝑤𝑛𝑠>5𝑑𝑎𝑦𝑠 𝑡𝑜 𝑟𝑒𝑝𝑎𝑖𝑟 + 𝛽10_𝑏𝑟𝑒𝑎𝑘𝑑𝑜𝑤𝑛𝑠<5/𝑦𝑒𝑎𝑟
+ 𝛽11_𝑏𝑟𝑒𝑎𝑘𝑑𝑜𝑤𝑛𝑠 5−8/𝑦𝑒𝑎𝑟 + 𝛽12_𝑏𝑟𝑒𝑎𝑘𝑑𝑜𝑤𝑛𝑠>8/𝑦𝑒𝑎𝑟
+ 𝛽13_𝑛𝑜𝑡𝑖𝑓𝑖𝑐𝑎𝑡𝑖𝑜𝑛 𝑛𝑒𝑣𝑒𝑟 + 𝛽14_𝑛𝑜𝑡𝑖𝑓𝑖𝑐𝑎𝑡𝑖𝑜𝑛 𝑠𝑜𝑚𝑒𝑡𝑖𝑚𝑒𝑠
+ 𝛽15_𝑛𝑜𝑡𝑖𝑓𝑖𝑐𝑎𝑡𝑖𝑜𝑛 𝑎𝑙𝑤𝑎𝑦𝑠 + 𝛽16_𝑝𝑟𝑒𝑠𝑠𝑢𝑟𝑒 𝑙𝑜𝑤
+ 𝛽17_𝑝𝑟𝑒𝑠𝑠𝑢𝑟𝑒 𝑚𝑜𝑑𝑒𝑟𝑎𝑡𝑒 + 𝛽18_𝑝𝑟𝑒𝑠𝑠𝑢𝑟𝑒 ℎ𝑖𝑔ℎ + 𝛽19_𝑐𝑜𝑠𝑡/𝑚𝑜𝑛𝑡ℎ
+ 𝜀
( 2 )
Where V is utility derived from a water service scenario, the betas (β) are the
coefficients indicating the strength of preference for attribute levels in the service and ε
is the error term representing unobservable factors. McFadden’s conditional logit
model is based on the assumption that the error terms ε between service scenarios are
independent and identically distributed (iid). Thus, the odds of choosing between two
alternatives are assumed to be independent of the presence or absence of a third
alternative (Independence of Irrelevant Alternatives (IIA)).
Although all households in the study communities in theory receive Free Basic Water
services (see Chapter 2), many households incur water related costs, depending on the
strategies they engage in to cope with the unreliable water supply. Estimates of the
monthly coping costs for each household were included in the analysis as the costs of
the current water supply.

Chapter 6: Preferences for reliability of water supply in Limpopo
101
6.3.4.2 Analysing preferences for subgroups
Preferences for water supply reliability are likely to differ across population groups,
depending on various factors, such as the existing water situation, socio-demographic
characteristics, and perceptions of the water quality (Nam and Son, 2005). Among the
households surveyed, intuition suggested that the preferences would differ among
households with private water supply and those with shared supplies, as well those in
Communities 1 and 2 and those in Community 3. As described in Chapter 2,
households with private supplies were those who had either drilled their own wells in
Communities 1 and 2; or paid for a municipal yard connection or set up a yard
connection from the springs in Community 3. These investments may be indicative of
household’s valuation of improved water services (Nam and Son, 2005). Further,
because households in Communities 1 and 2 incurred significantly higher coping costs
compared to those in Community 3, it is plausible that this could have an influence on
their preferences (Nam and Son, 2005). To investigate how preferences for water
supply reliability differ over the groups, the same model was run for subgroups of
households with private versus communal supply; and households in Communities 1
and 2 versus Community 3.
6.3.4.3 Willingness to pay
The inclusion of the cost attribute in the choice experiment enables the estimation of the
monetary value of each of the attributes i.e. how much money a respondent was willing
to pay for an improvement in an attribute of their water supply. This was estimated as a
ratio of an attribute coefficient to negative coefficient of the cost attribute. The equation
for estimating willingness to pay for a generic attribute x is shown below as:
𝒘𝒕𝒑𝒙 = −(𝜷𝒙/𝜷𝒄) ( 3 )
where βx is the coefficient for attribute x and βc is the coefficient for the cost of the
water service per month. After estimation for all attributes in the overall model, similar
analyses were performed to investigate how willingness to pay varied amongst the
subgroups. Confidence intervals were estimated using the Delta method (Hole, 2007).
6.3.4.4 Predicting choice probabilities
Of further interest was the impact of various water supply reliability improvements by
testing ‘what if’ scenarios. In other words, this was the change in the probability of
choosing a baseline service alternative because of a change in the level of one or more

Chapter 6: Preferences for reliability of water supply in Limpopo
102
of the reliability attributes. The averages of the reliability attributes of the current water
supply and the median coping costs reported in Chapter 4 were used to construct a base
service alternative. Two hypothetical services alternatives were also constructed, with
the levels for the reliability set to ‘high’ and ‘moderate’ for the other, and three levels of
potential monthly service costs: R0 (free), R30, and R60. This resulted in one base
alternative and 6 hypothetical alternatives (Table 6.3).
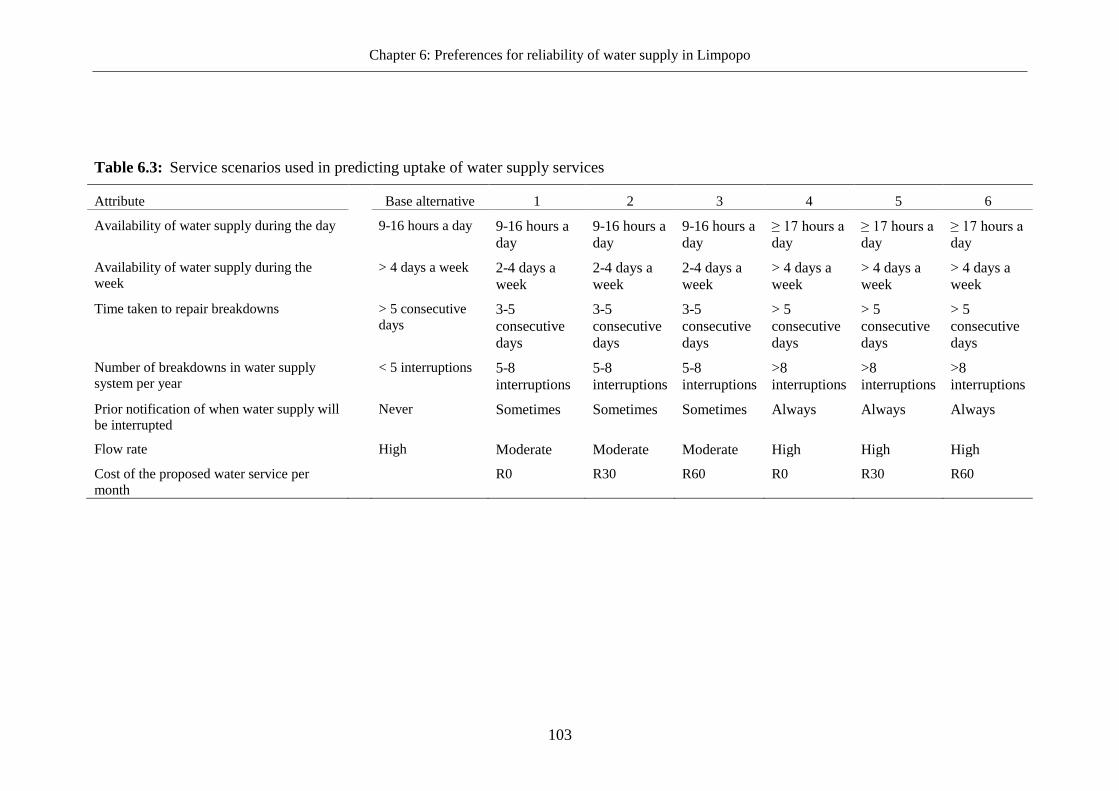
Chapter 6: Preferences for reliability of water supply in Limpopo
103
Table 6.3: Service scenarios used in predicting uptake of water supply services
Attribute Base alternative 1 2 3 4 5 6
Availability of water supply during the day 9-16 hours a day 9-16 hours a
day 9-16 hours a
day 9-16 hours a
day ≥ 17 hours a
day ≥ 17 hours a
day ≥ 17 hours a
day
Availability of water supply during the
week
> 4 days a week 2-4 days a
week 2-4 days a
week 2-4 days a
week > 4 days a
week > 4 days a
week > 4 days a
week
Time taken to repair breakdowns > 5 consecutive
days 3-5
consecutive
days
3-5
consecutive
days
3-5
consecutive
days
> 5
consecutive
days
> 5
consecutive
days
> 5
consecutive
days
Number of breakdowns in water supply
system per year
< 5 interruptions 5-8
interruptions 5-8
interruptions 5-8
interruptions >8
interruptions >8
interruptions >8
interruptions
Prior notification of when water supply will
be interrupted
Never Sometimes Sometimes Sometimes Always Always Always
Flow rate High Moderate Moderate Moderate High High High
Cost of the proposed water service per
month
R0 R30 R60 R0 R30 R60

Chapter 6: Preferences for reliability of water supply in Limpopo
104
The method used to calculate the probability of uptake of water services follows that
that of Ryan et al. (2008). The indirect utility of each of the service alternatives was
calculated by adding up the coefficients of the relevant attribute levels derived from the
conditional logit analysis. The probability of taking up e.g. service alternative 5, a
highly reliable service that is provided at a cost of R30 per month, versus the base
(current) service would be given by
𝑷 = 𝒆𝒔𝒆𝒓𝒗𝒊𝒄𝒆𝟓/(𝒆𝒔𝒆𝒓𝒗𝒊𝒄𝒆𝟓 + 𝒆𝒄𝒖𝒓𝒓𝒆𝒏𝒕) ( 4 )
Where P is the probability of taking up service alternative 5, service5 is the indirect
utility of service alternative 5 and current is the indirect utility of the current service.
The predicted measures provide an estimate of the percentage of the sample that would
prefer a service that offers the presented attribute levels to the current service.
6.4 Results
The majority (41.7 %) of households with private supplies prefer their current service.
In contrast, most households using communal supplies prefer the hypothetical Services
A and B.
Table 6.4: Frequencies of service options chosen, by type of supply and community
cluster
Service A Service B Current service
Type of supply
Private 364
(27.6 %)
405
(30.7 %)
551
(41.7 %)
Communal 993
(45.0 %)
1,056
(47.8 %)
159
(7.2 %)
Community cluster
Communities 1 and 2 720
(40.5 %)
759
(42.7 %)
298
(16.8 %)
Community 3 637
(36.4 %)
702
(40.1 %)
412
(23.5 %)
Looking at the options by community cluster, 83 % of the choices made by households
in Communities 1 and 2 are for the hypothetical Services A and B. In Community 3,
about three quarters of the choices made are for the hypothetical services.

Chapter 6: Preferences for reliability of water supply in Limpopo
105
6.4.1 Preferences for the overall sample
Table 6.5 presents the estimated coefficients and standard errors from the conditional
logit model for the overall sample. The odds ratios and confidence intervals can be
found in Appendix 6.2. The model is significant (P < 0.001) as indicated by the
likelihood ratio test. All coefficients are significant, with the exception of ‘availability
of water supply during the week’. The coefficients are relative to the reference category
for each attribute, which is ‘low’, as shown in Table 6.2.
Table 6.5: Water supply preferences for overall sample
Coefficient Standard error
Availability of water supply during the day
9-16 hours a day 0.2548*** 0.0604
More than 16 hours a day 0.3788*** 0.0569
Availability of water supply during the week
2-4 days a week 0.0210 0.0577
More than 4 days a week 0.1135 0.0595
Time taken to repair breakdowns
3-5 consecutive days 0.0584 0.0602
More than 5 consecutive days -0.2299*** 0.0572
Number of water supply system breakdowns per
year
5-8 breakdowns 0.3262*** 0.0603
More than 8 breakdowns 0.3202*** 0.0577
Prior notification of water supply interruptions
Sometimes 0.3448*** 0.0602
Always 0.6238*** 0.0544
Flow rate
Moderate 0.1685** 0.0629
High 0.1199* 0.0605
Price -0.0257*** 0.0010
N 9,036
Pseudo-R2 0.2138
Likelihood ratio degrees of freedom 13
Note: *p < 0.05,
**p < 0.01,
***p < 0.001
Compared to the current service, households are more likely to choose a service option
with the following attributes, in order of preference:

Chapter 6: Preferences for reliability of water supply in Limpopo
106
there is prior notification of interruptions in supply;
water is available for a longer duration during the day;
time taken to repair breakdowns is shorter;
the flow rate is higher; and
the service cost is lower.
The significant coefficients generally bear the expected signs, with the exception of
number of breakdowns, whose positive sign implies that more breakdowns would be
preferable. Households are willing to pay R14.71 (US$24) for water supply that is
available for more than 16 hours a day (Table 6.6).
Table 6.6: Willingness to pay estimates for overall sample
WTP 95 % confidence
interval
Availability of water supply during the day
9-16 hours a day 9.90*** 5.28 - 14.51
More than 16 hours a day 14.71*** 10.25 - 19.18
Availability of water supply during the
week
2-4 days a week 0.82 -3.58 - 5.21
More than 4 days a week 4.41 -0.17 - 8.99
Time taken to repair breakdowns
3-5 consecutive days 2.27 -2.31 - 6.85
More than 5 consecutive days -8.93*** -13.27 - -4.59
Number of water supply system
breakdowns per year
5-8 breakdowns 12.67*** 7.95 - 17.39
More than 8 breakdowns 12.43*** 7.95 - 16.92
Prior notification of water supply
interruptions
Sometimes 13.39*** 8.84 - 17.95
Always 24.23*** 19.87 - 28.59
Flow rate
Moderate 6.55** 1.69 - 11.40
High 4.66* 0.02 - 9.29
Note: *p < 0.05,
**p < 0.01,
***p < 0.001; WTP estimates are in South African Rand (ZAR)
4 Exchange rate in 2012 of US$1: ZAR8.57

Chapter 6: Preferences for reliability of water supply in Limpopo
107
Households are willing to pay R8.93 for a service in which breakdowns are repaired
within 2 consecutive days, compared to one in which it repairs taken more than 5
consecutive days. Prior notification of supply interruptions is highly preferred, and
households are on average willing to pay R24.33 for a service in which they are always
notified, compared to one which they are never notified.
6.4.2 Preferences by type of water supply
The coefficients and willingness to pay estimates according to type of water supply are
presented in Tables 6.7 and 6.8 respectively. Having water available for a longer period
during the day and notification of interruptions in supply are particularly important to
households using communal water supplies. The willingness to pay estimates are R16-
R19 and R23-R35 respectively (Table 6.8).

Chapter 6: Preferences for reliability of water supply in Limpopo
108
Table 6.7: Preferences by type of water supply
Private supply Communal supply
Coefficient Standard
error
Coefficient Standard
error
Availability of water supply
during the day
9-16 hours a day -0.0601 0.1116 0.4032***
0.0743
More than 16 hours a day 0.2777* 0.1079 0.4527
*** 0.0692
Availability of water supply
during the week
2-4 days a week -0.2224* 0.1126 0.0554 0.0697
More than 4 days a week -0.0611 0.1140 0.1380 0.0733
Time taken to repair breakdowns
3-5 consecutive days 0.3730***
0.1127 -0.0573 0.0732
More than 5 consecutive days 0.1998 0.1054 -0.3728***
0.0701
Number of water supply system
breakdowns per year
5-8 breakdowns 0.3135**
0.1115 0.3568***
0.0742
More than 8 breakdowns 0.1038 0.1112 0.4249***
0.0689
Prior notification of water supply
interruptions
Sometimes -0.1159 0.1129 0.5665***
0.0734
Always 0.0858 0.1064 0.8545***
0.0651
Flow rate
Moderate 0.1290 0.1214 0.1625* 0.0761
High -0.0115 0.1173 0.1010 0.0728
Price -0.0303***
0.0020 -0.0245***
0.0012
N 2,704 6,332
Pseudo-R2 0.1873 0.2549
Likelihood ratio degrees of freedom 13 13
Note: *p < 0.05,
**p < 0.01,
***p < 0.001
For the households using private water supplies, several of the significant coefficients
bear signs that are opposite to what might be expected: availability of water supply
during the week; time taken to repair breakdowns and number of breakdowns.

Chapter 6: Preferences for reliability of water supply in Limpopo
109
Table 6.8: Willingness to pay estimates, by type of water supply
Private supply Shared supply
WTP 95 %
confidence
interval
WTP 95 %
confidence
interval
Availability of water supply
during the day
9-16 hours a day -1.98 -9.20 - 5.24 16.49*** 10.47 - 22.51
More than 16 hours a day 9.16* 2.10 - 16.22 18.51
*** 12.73 - 24.30
Availability of water supply
during the week
2-4 days a week -7.34* -14.64 - -0.03 2.27 -3.32 - 7.86
More than 4 days a week -2.02 -9.38 - 5.35 5.64 -0.35 - 11.64
Time taken to repair
breakdowns
3-5 consecutive days 12.31*** 5.10 - 19.51 -2.34 -8.20 - 3.52
More than 5 consecutive
days 6.59 -0.22 - 13.40 -15.25
*** -20.83 - -9.66
Number of water supply
system breakdowns per year
5-8 breakdowns 10.34** 3.17 - 17.52 14.59
*** 8.36 - 20.82
More than 8 breakdowns 3.42 -3.74 - 10.59 17.37*** 11.61 - 23.13
Prior notification of water
supply interruptions
Sometimes -3.82 -11.16 - 3.52 23.17*** 17.24 - 29.09
Always 2.83 -4.07 - 9.73 34.94*** 29.10 - 40.78
Flow rate
Moderate 4.25 -3.65 - 12.16 6.65* 0.43 - 12.86
High -0.38 -7.96 - 7.20 4.13 -1.73 - 10.00
Note: *p < 0.05,
**p < 0.01,
***p < 0.001; WTP estimates are in South African Rand (ZAR)
Amongst the households using shared water supplies, the signs on the significant
coefficients are as expected, with the exception of number of breakdowns.
6.4.3 Preferences by community cluster
Tables 6.9 and 6.10 present the coefficients and willingness to pay estimates for
Communities 1 and 2 and Community 3. Households in Communities 1 and 2 are more
likely to opt for a service in which:
Water is available for longer periods during the day (more than 8 hours);

Chapter 6: Preferences for reliability of water supply in Limpopo
110
Water is available for more than 4 days a week;
They are notified prior to interruptions in the water supply;
The flow rate is not low (moderate or high)
The service cost is low
Table 6.9: Preferences by community cluster
Communities 1 and 2 Community 3
Coefficient Standard
error Coefficient Standard
error
Availability of water supply during
the day
9-16 hours a day 0.3268*** 0.0897 0.1365 0.0828
More than 16 hours a day 0.5773*** 0.0924 0.2450
** 0.0762
Availability of water supply during
the week
2-4 days a week 0.1160 0.0878 -0.1376 0.0805
More than 4 days a week 0.4859*** 0.0939 -0.1459 0.0811
Time taken to repair breakdowns
3-5 consecutive days 0.0944 0.0952 0.0964 0.0797
More than 5 consecutive days -0.0694 0.0903 -0.2364** 0.0754
Number of water supply system
breakdowns per year
5-8 breakdowns 0.2415** 0.0932 0.3565
*** 0.0804
More than 8 breakdowns 0.3028** 0.0926 0.2285
** 0.0783
Prior notification of water supply
interruptions
Sometimes 0.5767*** 0.0955 0.1159 0.0802
Always 0.8127*** 0.0863 0.4220
*** 0.0728
Flow rate
Moderate 0.2992** 0.0970 0.1092 0.0853
High 0.2698** 0.0969 0.0328 0.0821
Price -0.0296*** 0.0015 -0.0216
*** 0.0014
n 4,162 4,874
Pseudo-R2 0.3685 0.1065
Likelihood ratio degrees of freedom 13 13
Note: *p < 0.05,
**p < 0.01,
***p < 0.001

Chapter 6: Preferences for reliability of water supply in Limpopo
111
In Community 3 however, the number of days that water is available during the week
and the flow rate do not seem important.
Table 6.10: Willingness to pay by community cluster
Communities 1 and 2 Community 3
WTP 95 %
confidence
interval
WTP 95 %
confidence
interval
Availability of water supply
during the day
9-16 hours a day 11.02*** 5.03 - 17.02 6.33 -1.19 - 13.85
More than 16 hours a day 19.47*** 13.11 - 25.84 11.36
** 4.32 - 18.41
Availability of water supply
during the week
2-4 days a week 3.91 -1.88 - 9.71 -6.38 -13.72 - 0.96
More than 4 days a week 16.39*** 10.02 - 22.76 -6.77 -14.10 - 0.56
Time taken to repair breakdowns
3-5 consecutive days 3.19 -3.11 - 9.48 4.47 -2.77 - 11.71
More than 5 consecutive days -2.34 -8.31 - 3.63 -10.97** -17.80 - -4.13
Number of water supply system
breakdowns per year
5-8 breakdowns 8.15* 1.85 - 14.44 16.54
*** 8.97 - 24.10
More than 8 breakdowns 10.22** 3.90 - 16.53 10.60
** 3.46 - 17.73
Prior notification of water supply
interruptions
Sometimes 19.45*** 13.24 - 25.67 5.38 -1.86 - 12.61
Always 27.42*** 21.41 - 33.42 19.57
*** 12.79 - 26.35
Flow rate
Moderate 10.09** 3.59 - 16.59 5.06 -2.79 - 12.92
High 9.10** 2.71 - 15.50 1.52 -5.96 - 9.00
Note: *p < 0.05,
**p < 0.01,
***p < 0.001; WTP estimates are in South African Rand (ZAR)
In both clusters the signs for the number of breakdowns are positive, implying that more
breakdowns would be preferred. Households in Communities 1 and 2 are willing to pay
R19.45 a month for a service in which they are sometimes notified of interruptions, and
R27.42 for one in which they are always notified.

Chapter 6: Preferences for reliability of water supply in Limpopo
112
6.4.4 Predicted choice probabilities
Table 6.11 shows the predicted probabilities of choosing a supply option with given
reliability characteristics over the current supply. The most preferred service option is
one in which the service is provided for free; and the probability of uptake decreases as
the water service costs increase.
Table 6.11:Predicted choice probabilities for hypothetical service options versus the
current service
Free R30 R60
Service option 1
Water available more than 16 hours a
day
Water available more than 4 days a
week
Breakdowns repaired in 2 days
Not more than 4 breakdowns a year
Always notified of interruptions to
supply
Flow rate high
83.3% 69.8% 51.6 %
Service option 2
Water available 9-16 hours a day
Water available 2-4 days a week
Breakdowns repaired in 3-5 days
5-8 breakdowns a year
Sometimes notified of interruptions to
supply
Flow rate moderate
81.1 % 66.5 % 47.8 %
Note: Service costs are in South African Rand (ZAR) per month
A service in which all reliability characteristics are set to ‘high’ and the service is free
would be preferred by 83 % of households, whereas the same service provided at a cost
of R60 a month would be preferred by 51.6 %. Even with all attributes set to ‘moderate’
(Service option 2), 81 % of households would still prefer this service if it were provided
for free.
6.5 Discussion
A discrete choice experiment was conducted to elicit preferences for reliability of water
supply in peri-urban communities in Limpopo, South Africa. The study is amongst the

Chapter 6: Preferences for reliability of water supply in Limpopo
113
few that focus specifically on water supply reliability (Hensher et al., 2005, MacDonald
et al., 2003), and also adds to the relatively small literature on rural / peri-urban
preferences in developing countries.
The few studies of households’ preferences for water supply reliability have found that
decreases in water supply reliability were undesirable (Griffin and Mjelde, 2000, Howe
et al., 1994, Koss and Khawaja, 2001), and that households were willing to pay for
reduced duration and frequency of supply interruptions (Hensher et al., 2005,
MacDonald et al., 2003). The results of the choice experiment for the overall sample
are generally in line with these previous findings: households prefer to have water
available for more hours during the day; breakdowns repaired within shorter periods;
higher flow rate and lower service costs.
Similar to the findings of Hensher et al. (2005), households greatly value notice of
water supply interruptions. The willingness to pay estimates for water being available
for longer periods of the day of R17-R19 (about USD2 at the 2012 exchange rate of
USD1: ZAR8.57) for households using communal supplies and R9 (approximately
USD1) for households using private supplies are comparable to those reported by
Kanyoka et al. (2008). In their study of preferences for multiple use water services in
rural Limpopo, the authors report willingness to pay estimates of R15 (just under USD2)
for households using communal supplies and R7 (just under USD1). While these
amounts may seem small, they do not necessarily reflect a low valuation of the water
supply. As Carter et al. (2010) note, spending priorities as well as genuine inability to
pay may mean that there may be a mismatch between households’ willingness to pay
estimates and their actual demand for improved supplies.
When extending the analysis to subgroups of private versus communal water supply and
Communities 1 and 2 versus Community 3, the results are rather mixed, indicating
heterogeneity in preference. For the subgroup using private water supplies in particular,
the directions of preference for several attributes are contrary to theoretical expectations.
There are two possible explanations for this. First, it should be borne in mind that
households categorised as having ‘private’ water supplies have either drilled their own
wells and set up high-capacity storage tanks (Communities 1 and 2) or have a municipal
yard connection / set up a connection from a spring, with a high-capacity storage tank.

Chapter 6: Preferences for reliability of water supply in Limpopo
114
Such investments afford these households a considerable degree of autonomy, and
would likely result in low preference for improvement in the reliability of the supply.
As Table 6.4 shows, almost 42 % of the options selected by this sub-group are for the
current service, implying that they are less willing to consider other service options.
Such influence of the current supply has been found in other studies. In Mexico, (Soto
Montes de Oca and Bateman, 2006) find that households with better levels of water
supply prefer to maintain the status quo. Similarly, Virjee and Gaskin (2010) report
significant reductions in willingness to pay for service improvements in Trinidad and
Tobago. They surmise that continued unreliability of the supply resulted in households
no longer believing that the services could improve and increasing investment in coping
strategies that award them immunity from the unreliability of the supply.
The second explanation, and linked to the first, is that some households using private
water supplies, particularly those that have drilled their own wells may have had weak
preferences for some of the attributes, and thus had little incentive to make trade-offs in
the choice sets presented. By taking on the role of both producer and consumer
(Humplick et al., 1993), such households may have effectively ‘exited’ the water supply
system (Zérah, 2000a), and may be indifferent to any proposed improvements.
The results of the analyses for the Communities 1 and 2 versus Community 3 show
similar heterogeneity in preference and willingness to pay, with some attributes being
insignificant for Community 3. Again, this could be explained by the coping strategies
employed in the two clusters. Households in Communities 1 and 2 have either drilled
their own wells or buy water from those that have the wells, both of which represent
significant initial or ongoing costs. In contrast, households in Community 3 face the
lower costs of installing storage tanks and setting up connections from springs, or only
the opportunity cost of walking to the nearest spring or neighbour’s yard tap. This
difference in main coping strategies, and more importantly, associated coping costs,
may well influence households’ preferences.
The attribute relating to number of breakdowns was consistently positive in both the
overall and subgroup models. A possible explanation for this may lie in the current
(existing) water supplies in the studies. Households using communal supplies as their
main source may perceive their current water services as always worse than the attribute
levels presented in the hypothetical service options, resulting in the observed positive
coefficient for an otherwise negative attribute. As shown in Table 6.4, the current

Chapter 6: Preferences for reliability of water supply in Limpopo
115
service option is the least popular amongst households using communal water supplies.
Further, households using communal water supplies have water available 4 days a week,
on average. Because they may not always be aware of the reasons underlying the
unavailability of water on the other 3 days, they may generally perceive all episodes of
day to day unavailability as breakdowns, in which case the attribute levels in the choice
experiment would still be better than the perceived current levels.
The number of days water is available appears to be of relatively little importance in the
models for the overall sample and for private versus communal supply. Commenting
on similar findings, (Virjee, 2005) suggests that this may suggest that the way in which
households use water does not require daily supply. Households using private supply
are unlikely to fill up their storage tanks on a daily basis. Similarly, households using
communal supplies may not necessarily go and collect water everyday.
Unsurprisingly, the predicted uptake rates of hypothetical services decreases with an
increase in the service cost. It is however interesting to note that the differences in the
uptake rates for a ‘highly reliable’ Service option 1 and a ‘moderately reliable’ Service
option 2 are very small. This could again be a reflection of the perception that any
service option other than the current one is better.
There are a number of limitations in the discrete choice experiment reported that should
be noted. First, although the attribute levels included are validated in literature and
tractable with existing water policy, the design of the experiment would likely have
benefited from focus group discussions with a sub-sample of the households. This
could perhaps have aided in determining any potential influence of the current water
supply situation and adapting the choice experiment to better assess this influence.
From an analytical perspective, the conditional logit model has been considered
restrictive in its assumption that the odds of choosing between two alternatives are
independent of the presence or absence of a third alternative (IIA). More recently, it has
been argued that the violation of the IIA assumption may not be much of an issue if, as
in this case, the objective is to estimate individual’s average preferences (Cushing and
Cushing, 2007). The violation is however more of a concern when predicting uptake
rates. Thus, applicability of the uptake rates presented herein may be limited. The
second major assumption in the conditional logit is that differences in preference arise

Chapter 6: Preferences for reliability of water supply in Limpopo
116
only from differences in the probability of selecting choice alternatives. To minimise
this bias, sub-group analyses were performed to assess the difference in preference.
Conclusions
The limitations of the survey notwithstanding, there are some implications from the
study that are worth noting. First, many stated preference studies focus on cost as the
main determinant of water demand (Jones et al., 2006). The results of this choice
experiment highlight that households are not only interested in the cost of water supply
services, but also in reliability attributes such as notice of interruptions, duration of
supply each day and time taken to repair breakdowns.
Secondly, the evaluation of preference over subgroups highlights the need for targeted
and prioritised approaches to service improvements. Households using communal
supplies have relatively higher demand for service improvements, and improvements
would do well to target them. Priority could also be given to improving services where
alternative water sources such as the protected springs in Community 3 may not be
available.
In the following chapters, the question as to what happens when water supplies are
unreliable is tackled. Chapter 7 reviews the existing literature on household strategies
to cope with unreliable water supplies, followed by empirical analyses of coping
strategies among the study communities in Limpopo in Chapter 8.

117
7 Household responses to unreliable water supplies:
A review

Chapter 7: A review of household responses to unreliable water supplies
118
Households employ a variety of strategies to mitigate and / or cope with the risks that
unreliable water supplies pose. This chapter reviews these coping strategies, including
the related coping costs, their distribution across socio-economic groups and the
effectiveness of coping strategies in meeting household water requirements.
7.1 Introduction
With the Millennium Development Goal era drawing to an end, emphasis has been
growing on the importance of reliable water supplies in meeting critical health goals
(Clasen, 2012, Hunter et al., 2010) and the development of indicators of reliability as
part of the post-2015 strategy (WHO/UNICEF, 2012). An equally important issue is
how households are actually responding to unreliable water supplies. Although there is
a growing body of literature on this matter, much of it is focused on assessing
household costs of coping with unreliable of water supplies as indirect estimates of
willingness to pay for improved water supplies (Widiyati, 2011, Mycoo, 1996, Dutta
and Tiwari, 2005). The usefulness of this approach may be limited if household
responses to unreliable water supplies are to be understood beyond their implications on
water demand and pricing options in service improvements. For instance, the
association between reverting to untreated water sources during supply interruptions
and diarrhoeal illness (Hunter et al., 2009, Majuru et al., 2011) has been documented.
To the best of my knowledge there has not been an attempt to review existing literature
on how households cope with unreliable water supplies. Consequently, the review
sought to address the following questions:
How do households respond to unreliable water supplies?
What factors influence the choice of coping strategies?
What are the financial costs of coping strategies?
What health and social outcomes are associated with coping with unreliability?
How effective are these strategies e.g. are water quantity, quality and pressure
needs met?
How are coping strategies distributed across socio-economic groups?
In attempting to answer these questions, the review identifies what is known and what is
missing from the literature on coping with unreliable water supplies in developing
countries. Before turning to the methods used to address the review questions above, an

Chapter 7: A review of household responses to unreliable water supplies
119
overview of the conceptual background surrounding the notions of ‘reliability’ and
‘coping’ in the context of water supplies is provided.
7.2 Conceptual background of reliability and coping
As is pointed out in the 2012 update on the MDG water target, although the general
consensus is that reliability is an important aspect of water supply, there is yet no
agreement on how it should be defined or consequently measured (WHO/UNICEF,
2012). ‘Reliability’ as considered in this review is a feature of water supply that is
made up of several attributes. These attributes include: consistency with which water is
supplied, e.g. 24 hours a day, everyday, or for part of the day on some days; the
predictability of the supply, e.g. supply that is not continuous, but provided at regular
intervals, or not continuous and at irregular intervals; the pressure of the supply, e.g.
pressure fluctuations may result in limited or no supply. This definition also extends to
breakdowns in the supply systems itself, which are distinguished in this review from
intermittent / discontinuous supply, which may be more indicative of sub-optimal
functionality than complete non-functionality.
Amongst the early attempts to systematically describe and analyse the impact of
unreliability was a study funded by the World Bank to assess the extent of private costs
that Nigerian firms incurred due to deficiencies in public services (Lee and Anas, 1992).
The methodology from this study was subsequently applied on household water
supplies in India, Pakistan and Turkey around 1990-1992. From the three case studies,
the authors suggested a conceptual framework and methods for analysis of unreliability
of water supply and its impact on households (Humplick et al., 1993, Madanat and
Humplick, 1993) and summarised the households’ responses to unreliability and their
costs (Kudat et al., 1993). This conceptual framework was later applied in another
World Bank-funded study conducted in Azerbaijan in 1994 by Kudat et al. (1997) and
has shaped much of the often-cited work on the topic.
In their conceptual framework, Kudat et al. (1993) and Humplick et al. (1993) posit that
as a commodity, water has three main attributes: quantity, quality and pressure. Where
the water supply does not meet the optimum levels of these three attributes, the supply
is said to be unreliable, and households will adopt strategies to mitigate risks from this
unreliability. These activities can be broadly categorised as extending on the concept of
‘exit, voice and loyalty’ (1970). Faced with chronic unreliability, households may ‘exit’

Chapter 7: A review of household responses to unreliable water supplies
120
the unreliable water system by adopting strategies such as drilling wells, installing large
capacity storage tanks or even relocating to areas where water supply is more reliable.
The ‘voice’ strategy includes complaints and protests to water utilities or local
authorities. Households could also be loyal, and engage in accommodative strategies
such as rescheduling activities to when water is actually available, collecting from
alternative sources and consuming less water.
The authors also suggest that factors associated with the choice of coping strategies can
be grouped into three levels: (i) household level e.g. socio-economic status, gender, age
structure; (ii) settlement level e.g. water service level, formal / informal settlement and
(iii) national level e.g. urbanisation, privatisation of water supply sector, regulatory and
policy framework (Humplick et al., 1993, Kudat et al., 1997). Subsequent studies have
drawn upon the work of Kudat et al., focusing mainly on measuring the costs of coping
strategies (Choe et al., 1996, Zerah, 1998, Zérah, 2000b) as indirect estimates of
willingness to pay for more reliable services.
7.3 Methods
Literature searches were conducted in CINAHL EBSCOHost, Embase Ovid, PuBMed
Central, Scopus, ScienceDirect, Scirus and Web of Knowledge. The search terms used
were:
TITLE-ABSTR-KEY(“water supply” OR “safe water” OR “drinking water” OR
“domestic water” OR “household water” OR “water point”) and TITLE-ABSTR-
KEY(reliab* OR sustainab* OR availab* OR function* OR regular OR access OR
intermitten* OR interrupt* OR constant OR continu* OR consistent OR “operation
and maintenance” OR breakdown) AND TITLE-ABSTR-KEY(cope OR coping OR
“coping strategies” OR avert OR “averting behaviour” OR respond)
Searches were also conducted in Google and Google Scholar search engines, where the
first 50 hits were checked for potentially relevant papers. Papers obtained from the
search were screened for relevance according to the following criteria:
Report strategies employed to cope with unreliable domestic / household water
supply
Collect and report data on developing countries
Based on empirical research

Chapter 7: A review of household responses to unreliable water supplies
121
Although the scarcity of water resources contributes to unreliability of water supplies
the world over, in many developing countries a significant proportion of the problem
lies in decaying infrastructure, rapid growth of settlements and poor water management.
Thus, the review focuses on responses to unreliability relating to the performance or
functionality of water supply systems and distribution networks. Developing (low and
medium) countries were defined as per the World Bank classification (2011). Studies
that only listed coping strategies with no other accompanying coping-related
information such as costs, determinants of coping etc. were excluded. Full texts of
papers whose abstracts and titles met the criteria were retrieved and reviewed in detail
for study quality and findings. The reference lists of relevant papers were also checked
for other potentially relevant papers.
7.3.1 Quality appraisal
Study quality appraisal was in two parts; a general appraisal tool adapted from
Hellenbrandt et al. (2011) that was applied to all studies, and an additional appraisal
tool developed by the Swedish Environmental Protection Agency [SEPA (2006)] for
studies that use econometric valuation techniques. Hellenbrandt et al.’s (2011) tool is
largely based on assessment criteria suggested in the Cochrane and EPPI frameworks,
which they adapted to suit the heterogeneity in study outcomes and study design
encountered in their own review. The appraisal in this review is similarly broad, and
considers the clarity of research objective, clarity of methods used, description of water
supply conditions, reporting of results, researcher bias, and any other issues that may
influence study quality. Based on these criteria, the risk of bias was categorised as high,
moderate or low. A copy of this tool is attached as Appendix 7.1.
The SEPA (2006) tool is aimed at assessing the quality of valuation studies and
considers bias in two parts: the quality of studies in general, regardless of the valuation
technique, as well as factors related to specific valuation techniques. Study quality was
assessed using a modified version of the generic component of this tool, following the
example of (Söderqvist and Soutukorva, 2009). Using this tool, economic valuation
studies were classified as being of high, moderate or low quality. A copy of this tool as
applied in the review is attached as Appendix 7.2.

Chapter 7: A review of household responses to unreliable water supplies
122
7.4 Results
A total of 1,398 papers were found from the database search (Figure 7.1). Of these, 357
were duplicates and the majority focused on agricultural or industrial water supply, or
reported on coping with water scarcity from drought, climate change, and thus did not
meet the inclusion criteria. Four studies were found from perusing reference lists of
other studies, bringing the total number of studies reviewed to 23.
Figure 7.1: Flow chart of study selection process
Almost half (47 %) of the studies were carried out in South Asia (Figure 7.2; Tables
7.1-7.3). Of the 23 studies reviewed, 19 were conducted in urban settings, 2 covered
both rural and urban areas, and 2 conducted in a rural setting (Tables 7.1-7.3). All
studies reported on cross-sectional data and a third estimated willingness to pay for
improved / more reliable water services. Six studies simultaneously measured coping
costs and used them as indirect estimates of willingness to pay.
Total references
retrieved 1,143
Duplicates
357
1,041 references
assessed for eligibility
1,031 excluded
12 studies included Reference lists of
included studies
4
Google and
Google Scholar
7
23 references
included in total

Chapter 7: A review of household responses to unreliable water supplies
123
Figure 7.2: Geographic distribution of studies included in review
Using the generic appraisal tool adapted from Hellenbrandt et al. (2011), 11 of the
studies were categorised as having low risk of bias, 10 moderate risk and 2 high risk.
Common sources of possible bias were in the methods used to address study objectives
and the subsequent reporting of results not being clear. For instance, three of the studies
(Chaminuka and Nyatsanza, 2013, Potter and Darmame, 2010, Olsson and Karlsson,
2010) use convenience or snowball sampling techniques without any clear justification
for doing so. Such samples are prone to selection bias as they are unlikely to be
representative of the population (Sedgwick, 2013).
The SEPA appraisal tool (Appendix 7.2) was applied to the 8 studies that apply
valuation techniques. Six of the studies were categorised as moderate quality and two
as low quality. Among the sections that scored least were those relating to reporting of
statistical uncertainty and non-response. Six of the studies do not report confidence
intervals and standard errors of the estimated economic values, and half of the studies
provide no information on the response rate.

Chapter 7: A review of household responses to unreliable water supplies
124
Table 7.1: Studies conducted in urban settings
Author(s), year Study objective(s) Setting, type of supply and sample Findings
Baisa et al., (2010) Estimate the welfare costs of unreliable water
supply
Urban Mexico,
Piped supply
Model calibrated for Mexico City using data
from the Mexican National Household Survey
of Income and Expenditure
Common storage tank capacity was 750 ℓ
Normalising delivery time across time and
households had large social gains and average total
lifetime gains of 9,382 pesos ($833) per household
Caprara et al., (2009) Investigate the relationship between socio-
economic characteristics and community
practices affecting Aedes aegypti vector
ecology
Urban Fortaleza, Brazil, 2005
Piped and unpiped supply
Purposive sample of 204 households, with
mixed methods descriptive case study
approach
Water was stored in roof tanks, drums and other
containers. Poorer households could not afford
roof tanks with lids or mesh and thus provided
breeding areas for dengue
Chaminuka &
Nyatsanza, (2013)
Assess the causes and extent of water
shortages and coping mechanisms used by
affected residents in Harare
Urban Zimbabwe
Piped supply
Convenience sample through a snowballing
techniques 40 respondents in total
Coping strategies included collection from
boreholes, rainwater harvesting in the rainy season,
drilling wells, collecting water from neighbours
with wells
Choe et al., (1996) Estimate the real costs of an intermittent
supply and predict how much people would
pay for a continuous full-service metered
supply
Urban Dehra Dun, Utter Pradesh, India, 1995
Random-stratified cluster sample of 1,100
households drawn from the 1995 electoral roll
Coping strategies included storage in tanks,
enhancing pressure and improving water quality
Coping costs matched willingness to pay estimates
Coping costs were at least as great as the amount
paid in water billings
Households with piped supply invested in storage
tanks, while those without spent time queuing for
water
Dutta et al., (2005) Examine how much money people in
unplanned areas are willing to pay to support
a policy that provides them with a better and
reliable water supply
Urban India
28.92 % had piped supply
Multistage stratified random sampling, with
650 interviews conducted in 4 unplanned
settlements
Coping strategies included drilling wells, installing
booster pumps, storage
Average annual coping cost was 3,112 Rupees

Chapter 7: A review of household responses to unreliable water supplies
125
Author(s), year Study objective(s) Setting, type of supply and sample Findings
Gerlach & Franceys,
(2009)
Investigate the status of water supply service
and regulatory arrangements with respect to
poor and vulnerable consumers
Urban Jordan, 2005
Piped in-house, tanker trucks in event of
distribution problems.
Semi-structured interviews with key
stakeholders, survey of 10 households each in
9 selected poor neighbourhoods and small-
scale surveying of private water tanker
operations
Household coping strategies are: buying water from
private tankers, buying from neighbours; storing
water in the home; collecting from wells, springs
and buying bottled water, scheduling major
household activities to when water is available and
generally limiting water use
Households using bottled water report buying an
average of 31.6 l per week at an average price that
corresponds to 24 times the price per cubic metre
for water taken from the network.
Lower-income households are supported through
more frequent supplies of 2–3 days per week, but
have limited storage capacity. With as little as 0.13
m3 household-level storage per person available
amongst this group, 4% of the total sample have
less than 30 lpcd, and 8% no more than 50 lpcd,
unless additional supplies are bought in.
Gulyani et al., (2005) Examine current water use and unit costs and
test the willingness of the unconnected to pay
for piped water, yard connections, or an
improved water kiosk (standpipe) service
Urban Kenya, 2000
Piped in-house; yard taps; standpipe, vendors,
groundwater
674 randomly selected households were
interviewed in 22 sites in the three urban areas
Average capacity of a private water storage system
was about 1,058 ℓ and the average investment for
such a system was about Ksh 5,399 (US$72)
Humplick et al., (1993);
Madanat & Humplick,
(1993)
Present a model and methods for analysis of
households’ responses to unreliable water
supply
Urban Pakistan and Turkey
1990-1992
Piped and unpiped supply
Case studies with a detailed sample of 30
households in Istanbul, Turkey and less
detailed but larger sample of 900 in
Faisalabad, Pakistan
High income households have the most options
Low income households spend a higher proportion
of their income on coping costs

Chapter 7: A review of household responses to unreliable water supplies
126
Author(s), year Study objective(s) Setting, type of supply and sample Findings
Jamal & Raman., (2012) Explore impacts of gas and water supply
crises and document coping strategies
Urban Bangladesh, 2010
Type of supply not clear
Participatory rural appraisal applied to urban
setting
Household coping strategies are drilling wells,
collecting from shared sources, buying water and
treating water.
Middle income families spend up to Tk1,500 on
buying water each month
Community strategy is to raise funds for a tube well
to be constructed.
Kudat et al., (1993) Assess households’ responses to unreliable
water supply
Urban India, Pakistan and Turkey 1990-1992
Piped and unpiped supply
Case studies of 30 households in Istanbul,
Turkey, 900 in Faisalabad, Pakistan and 1,011
in Jamshedphur, India
Suggested quantity, quality and pressure as key
reliability attributes Categorised coping strategies
into enhancement and accommodating strategies
Low income households are unable to invest in
facilities to improve supply, and reduce water use
instead
Kudat et al., (1997) Present a methodology for a Social
assessment for the World Bank’s Greater
Baku Water Supply Rehabilitation Project
Urban Baku, Azerbaijan, 1994
Piped supply
Rapid user surveys with 150 respondents and
400 respondents, consultations, stakeholder
workshop
Female headed households had more difficulty
coping, expended more labour than capital
Average tank storage capacity was 948 cm3 and
cost $94 at the time
Boiling was most common treatment Opportunity
cost of time spent collecting was 4-16 % of
household income
Low income households more likely to adopt
accommodative than enhancement strategies
Mycoo, (1996) Examine cost recovery potential based on
household willingness to pay more for an
improved service and water pricing
Urban Trinidad
Piped supply
Stratified sample of 420 households, stratified
according to slope, land elevation and income.
Survey of households and interviews of
professionals in the water sector
Most common tank capacity was 420 gallons with
capital and maintenance monthly costs estimated at
TT$67
Households paid private water trucks about
TT$150 per trip to fill up the tanks when water
supply was off for several days and their reserves
were exhausted

Chapter 7: A review of household responses to unreliable water supplies
127
Author(s), year Study objective(s) Setting, type of supply and sample Findings
Pattanayak et al. (2005) Evaluate how coping costs and willingness to
pay vary across types of water users and
income
Urban Nepal, 2001
70% piped; 30%: private wells, public taps,
stone spouts, and water vendors. About 1% of
the connected households shared a connection
with other households
Clustered sampling (probability-to-size), 1500
households in five municipalities of
Kathmandu Valley
Coping costs (1) were equivalent to 1% of current
incomes - majority attributed to time spent
collecting water; (2) were correlated with but were
significantly lower than WTP; and (3) varied across
households with different socioeconomic profiles
Potter & Darmame,
(2010)
Examine potential social equity dimensions in
the use of water within Greater Amman
Urban Jordan, Greater Amman
Piped supply
Snowball sample of 25 low income and 25
high income households
High income households had average storage
capacities of 16.24m3, compared to low income
households whose average storage capacity was
3.12 m3
Subbaraman et al.,
(2013)
Evaluate an informal water distribution
system in Kaula Bandar (KB), a non-notified
slum in Mumbai
Slum in urban India
Informal system of water hoses delivering
water to households
A Baseline Needs Assessment survey of 959
households in 2008 and a Seasonal Water
Assessment in 2011, in which 229 samples
were collected for water quality testing over
three seasons
Alternative sources during system failures are at
least one kilometre away, private tankers are also
used
Extra costs of water during system failures average
US$8.42 per 1,000 ℓ.
95 % of households use less than 50 ℓ of water per
capita per day during system failures
Vásquez et al., (2009) Elicit household willingness to pay responses
for safe and reliable drinking water in Parral,
Mexico
Urban Mexico
Piped supply
Stratified random sample of 398 households
in 6 geographic zones
Combined expenditure on tap and bottled water
was 7.49 % of reported median income

Chapter 7: A review of household responses to unreliable water supplies
128
Author(s), year Study objective(s) Setting, type of supply and sample Key findings
Vásquez, (2012) Investigate the relationship between
perceptions of water supply reliability and
household expenditures on water storage
devices in León, Nicaragua
Urban Nicaragua, 2009
Piped supply
Stratified random sample of 891 households
in 8 geographic zones
Perceptions of water supply reliability are the main
determinant of household expenditures on water
storage devices.
Findings also indicate that perceptions of water
supply reliability are associated with service
performance (as measured by daily hours with
water supply) and assessment of service hours
relative to peers
Income and home ownership also positively impact
those expenditures.
Virjee & Gaskin, (2010) Ascertain the willingness to pay for changes
in the level of service experienced by users
Trinidad and Tobago, 2003
Piped in-house; Piped in-house + secondary
source; no in-house connection
The Central Statistical Office’s Continuous
Sample Survey of Population sampling
method was used to randomly select 1,419
households, using a two-stage stratification
scheme based on geography and labour force
characteristics
68% had water storage tanks on their premises with
an average installed capacity of 610 gallons., thus
82% of those with tanks had simulated a 24-hour
water supply
58% of poorer households had water storage tanks
compared to 84% of wealthier households
Households with coping infrastructure (storage
tanks) had a lower demand for service changes.
Households with no in-house piped supply had
highest WTP, possibly because of the utility
derived from having water close by

Chapter 7: A review of household responses to unreliable water supplies
129
Author(s), year Study objective(s) Setting, type of supply and sample Key findings
Zérah, (1998, 2000a) Article 1: Measure the costs of unreliability
Article 2: Estimate the household demand for
a service by assessing the actual behaviour
adopted by households when they have to
cope with an inadequate service
Urban India, 1995
Piped
Two stratified sample of 678 households in
four zones of urban Delhi
Annual coping costs were 15.7% of monthly
income for households in the lower income bracket
and 1.4% for higher income households
Bills to the water utility were less than a sixth of
coping costs
Aggregated coping costs were almost twice the
expenditure of the utility on water supply, while
revenue to the utility was 8.5 times lower than the
coping costs
High income, very low reliability and ownership of
houses influenced adoption of tubewells as coping
strategy
Probability of rescheduling activities increased if
reliability was low and households had low
incomes
Average storage capacity was 200 ℓ for households
with a tank with tubewells, 150 ℓcd for households
with tanks linked to municipal water and 30 ℓ for
households with handpumps or who collect from
outside sources.
Households with incomes above Rs. 8,000 had
storage capacity of 203 ℓ, and households with
income below Rs. 3,500 stored 100 ℓ
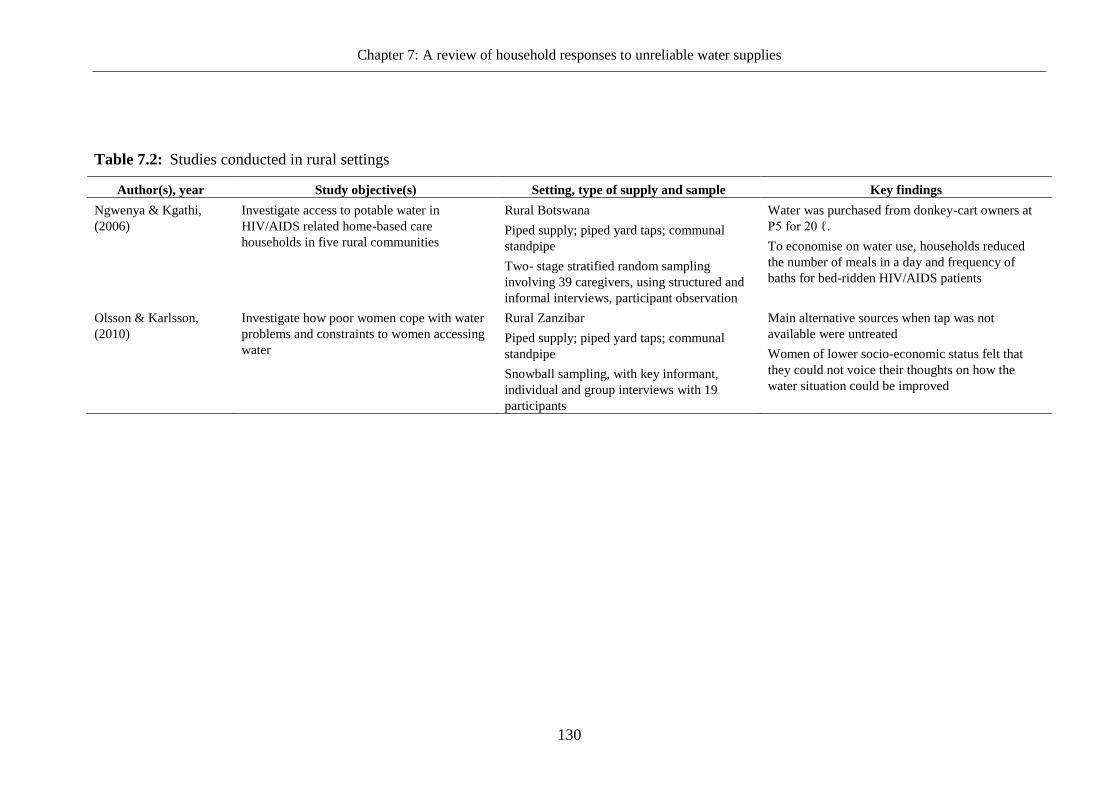
Chapter 7: A review of household responses to unreliable water supplies
130
Table 7.2: Studies conducted in rural settings
Author(s), year Study objective(s) Setting, type of supply and sample Key findings
Ngwenya & Kgathi,
(2006)
Investigate access to potable water in
HIV/AIDS related home-based care
households in five rural communities
Rural Botswana
Piped supply; piped yard taps; communal
standpipe
Two- stage stratified random sampling
involving 39 caregivers, using structured and
informal interviews, participant observation
Water was purchased from donkey-cart owners at
P5 for 20 ℓ.
To economise on water use, households reduced
the number of meals in a day and frequency of
baths for bed-ridden HIV/AIDS patients
Olsson & Karlsson,
(2010)
Investigate how poor women cope with water
problems and constraints to women accessing
water
Rural Zanzibar
Piped supply; piped yard taps; communal
standpipe
Snowball sampling, with key informant,
individual and group interviews with 19
participants
Main alternative sources when tap was not
available were untreated
Women of lower socio-economic status felt that
they could not voice their thoughts on how the
water situation could be improved

Chapter 7: A review of household responses to unreliable water supplies
131
Table 7.3: Studies conducted in both urban and rural settings
Author(s), year Study objective(s) Setting, type of supply and sample Key findings
Altaf, (1994) Describe household response to inadequate
public piped water supply systems and to
highlight the economic implications of their
efforts to improve level of service and
reliability
Rural and urban Punjab, Pakistan
Public piped water systems and those without
Stratified random samples of 968 urban and
756 rural households
Households using handpumps as a back-up to the
public connection incur costs of Rs 36-Rs 66 per
month, Households using a motor pump as a back-
up incur costs of over Rs 80 per month
Katuwal & Bohara,
(2011)
Estimate the effect of wealth, education,
information, gender, caste/ethnicity and
opinion about water quality on drinking water
treatment behaviours
Rural and urban Kathmandu, Nepal, 2005
Piped and unpiped supply
Authors used from a 2005 survey by the
Central Bureau of Statistics with 2,000
households
Wealthier households increased boiling and
filtering, instead of using one treatment method
Exposure to information increased treatment
behaviour by 21 %
Increase in household size increased cost of
treatment, leading to use of cheaper methods or less
frequent treatment
Probability of treatment decreased by 11 % if
household head was male

Chapter 7: A review of household responses to unreliable water supplies
132
7.4.1 Coping strategies
Three main categories of coping strategies were identified from the review: enhancing
and conserving quantity of water available, improving the quality of water and
enhancing flow rate. A fourth category is also considered: collective action and voice.
Although there is some overlap between these categories, each is considered in turn.
7.4.1.1 Enhancing and conserving water
The storage of water is reported in the majority of the studies (Table 7.4). Storage
vessels vary from large capacity overhead tanks to smaller vessels such as pots and
buckets. While overhead tanks can fill up automatically whenever the municipal supply
becomes available (Choe et al., 1996), the storage process for smaller vessels can be
tedious. In Fortaleza, Brazil, Caprara et al. (2009) report that households got up at
dawn when the municipal water supply became available in order to start filling up
drums, pots and buckets. Households may spend 38 minutes storing water (Zérah,
2000a), or several hours (Olsson and Karlsson, 2010) if the water is to be collected from
an alternative source over several trips.

Chapter 7: A review of household responses to unreliable water supplies
133
Table 7.4: Coping strategies identified from the literature
Altaf (1
99
4)
Baisa et al. (2
01
0)
Cap
rara et al. (200
9)
Ch
amin
uk
a & N
yatsan
za, 201
3
Ch
oe et al. (1
99
6)
Du
tta et al. (200
5)
Gerlach
& F
rancey
s, 20
09
Gu
lyan
i et al. (200
5)
Jamal &
Rah
man
. 20
12
Ku
dat et al. (1
99
3)
Ku
dat &
Mu
sayev
, (199
7)
Katu
wal &
Bo
hara, (2
011
)
My
coo
(19
96
)
Ng
wen
ya &
Kg
athi, (2
00
6)
Olsso
n &
Karlsso
n, 2
010
Pattan
ayak
et al. (20
05
)
Po
tter & D
armam
e, 20
10
Su
bb
araman
et al., 201
2
Vasq
uez et al. (2
009
)
Vasq
uez (2
01
2)
Virjee &
Gask
in (2
010
)
Zerah
(199
8; 2
000
)
Install storage tanks
Store water in buckets,
bottles etc
Collect water from
alternative sources
Drill wells, install hand
pumps
Purchase water
Install electric pump
Treat water (boil/ filter/
chlorinate)
Recycle water
Use water sparingly
Harvest rainwater

Chapter 7: A review of household responses to unreliable water supplies
134
Altaf (1
99
4)
Baisa et al. (2
01
0)
Cap
rara et al. (200
9)
Ch
amin
uk
a & N
yatsan
za, 201
3
Ch
oe et al. (1
99
6)
Du
tta et al. (200
5)
Gerlach
& F
rancey
s, 20
09
Gu
lyan
i et al. (200
5)
Jamal &
Rah
man
. 20
12
Ku
dat et al. (1
99
3)
Ku
dat &
Mu
sayev
, (199
7)
Katu
wal &
Bo
hara, (2
011
)
My
coo
(19
96
)
Ng
wen
ya &
Kg
athi, (2
00
6)
Olsso
n &
Karlsso
n, 2
010
Pattan
ayak
et al. (20
05
)
Po
tter & D
armam
e, 20
10
Su
bb
araman
et al., 201
2
Vasq
uez et al. (2
009
)
Vasq
uez (2
01
2)
Virjee &
Gask
in (2
01
0)
Zerah
(199
8; 2
000
)
Reschedule activities
Protest / complain
Move to another house/
area
Install extra storage space
Reduce baths and/ or alter
diet

Chapter 7: A review of household responses to unreliable water supplies
135
In a number of studies the households tried to conserve their stored water by carrying
out domestic activities requiring a lot of water on the days when water was available
(Gerlach and Franceys, 2009, Mycoo, 1996, Ngwenya and Kgathi, 2006, Zérah, 2000a).
Water conservation strategies included reducing intake of fresh fruit and vegetables that
would need to be washed, reducing frequency of bathing and laundering (Kudat et al.,
1993) and flushing toilets only once a day (Chaminuka and Nyatsanza, 2013).
Ngwenya and Kgathi (2006) investigate water access in households caring for family
members with HIV/AIDS related illnesses in rural Botswana. Carers in households that
did not have means of transport (donkey carts, wheelbarrows, bicycles etc) to enable
them to collect water from alternative sources limited their domestic water use. This
entailed reducing the number of meals cooked per day, reserving potable water for
drinking only by family members, reducing the number of baths given to the ill family
members and keeping soiled laundry until there was water available to wash it.
7.4.1.2 Improving water quality
Of all the possible responses to unreliable water supply, household water treatment is
perhaps the most researched, both in developing and developed countries. Unreliable
water supplies often lead to poor water quality in various ways. Intrusion of
contaminants into pipes can occur when the flow rate is low or supply cut off, or when
water collected from alternative sources is unsafe or re-contaminated during collection
and storage (Kumpel and Nelson, 2013).
Water treatment through boiling, filtration or use of chemical treatment products is
reported in twelve studies (Table 7.4). Of these, boiling and filtering appear most
common, with households using either one of the two methods or both (Dutta and
Tiwari, 2005, Katuwal and Bohara, 2011, Pattanayak et al., 2005). In Kathmandu,
Nepal, (Katuwal and Bohara, 2011) find that households tend use more than one method
if they are wealthier. The authors also note some urban-rural differences in treatment
behaviour, with the proportion of urban households that boil water higher than those in
rural areas.
7.4.1.3 Enhancing flow rate
There is some overlap in the needs that some coping strategies fulfil. For instance, the
installation of overhead tanks enables households to store large quantities of water and
also have such water flow into the water supply pipes at a reasonable pressure (Choe et

Chapter 7: A review of household responses to unreliable water supplies
136
al., 1996, Zérah, 2000a). Other pressure-enhancing strategies are installing electric
pumps to convey water from storage tanks or installing motors directly onto municipal
water connections to boost the flow rate (Zérah, 1998).
7.4.1.4 Collective action and voice
The strategies reviewed above have focused on action undertaken within the household.
Another route of action can be collective action amongst households and ‘voice’;
defined by (Zérah, 2000b) as “complaints, demonstration and associations”.
In their study of strategies to cope with unreliable gas and water supplies in Dhaka,
Bangladesh, Jamal and Rahman (2012) find that in addition to adopting various coping
strategies at household level, community action was sought through contributing
towards the establishment of a tube well. Households in Turkey, are reported to have
created joint community actions and pressured for better services, although no further
details are provided (Kudat et al., 1993).
7.4.2 Factors influencing choice of coping strategies employed
Income, education and land tenure are reported to be significant determinants of choice
of coping strategy in eight of the studies. Households that are relatively wealthier, more
educated and/ or own the property they live on are more likely to drill wells and/or
install storage tanks (Caprara et al., 2009, Choe et al., 1996, Kudat et al., 1993, Kudat et
al., 1997, Pattanayak et al., 2005, Virjee and Gaskin, 2010, Zérah, 2000b, Vásquez,
2012).
Katuwal and Bohara (2011) focus on water treatment as a coping strategy in Nepal and
find positive associations with wealth, education, gender, caste/ethnicity and
perceptions of water quality. Of the 2,000 households surveyed, 40 % used filtration
methods and 34 % boiled water.
Extent of unreliability also plays a role, as a quarter of households with tube-wells in
the study by Zerah (2000b) had very limited duration of supply (less than 4 hours day).
Vásquez (2012) also finds perceptions of water supply reliability to be the main
determinant of expenditure on water storage devices; households with lower perceptions
of the reliability of their supply spending more on storage devices than those with
higher perceptions. However, these perceptions are themselves mainly influenced by
how households assess the reliability of their supply relative to that of their peers.

Chapter 7: A review of household responses to unreliable water supplies
137
7.4.3 Costs of coping
Thirteen of the studies report data related to the costs of coping with unreliable water
supply. These costs typically arise from installation and maintenance of storage
facilities, time spent collecting water from alternative water sources, drilling wells and
installing pumps, purchasing water, household water treatment and treatment of water
related disease. As shown in Table 7.5, the actual components of the total coping costs
vary widely.
Table 7.5: Coping costs and their components
Alt
af,
19
94
Ch
oe
et a
l. (
199
6)
Du
tta
et a
l. (
20
05
)
Ku
dat
& M
usa
yev
,
(19
97
)
Ger
lach
& F
ran
cey
s,
20
09
My
coo
(1
996
)
Pat
tan
ayak
et
al.
(20
05)
Vás
qu
ez
et a
l. (
20
09
)
Vas
qu
ez (
20
12
)
Zer
ah (
19
98)
Capital cost of infrastructure
Operation of infrastructure
Maintenance of infrastructure
Installation of water storage
vessels
Water treatment
Treatment of water related
illness
Income losses due to illness
Opportunity cost of water
collection
Purchasing water
Coping costs range from average monthly costs equivalent to 1 % of monthly income in
Nepal (Pattanayak et al., 2005) to 15.7 % for households in the lower income bracket in
India (Zerah, 1998). In Zimbabwe, buying water from vendors can cost as much as $1
for each 20-ℓ bucket (Chaminuka and Nyatsanza, 2013). Coping costs range from
being at least as great as amounts paid in water bills (Choe et al., 1996) to as much as
six times the bill amounts (Zerah, 1998). In two studies (Altaf, 1994, Zerah, 1998)
aggregated coping costs exceed the water utility’s full cost of supply. In Amman,
Jordan, Gerlach and Franceys (2009) report average weekly expenditures on bottled
water that are 24 times the price per cubic metre of water from the supply network.

Chapter 7: A review of household responses to unreliable water supplies
138
It is worth bearing in mind that the household responses considered in this review are in
relation to deficiencies in water supply services and not the lack of service provision
altogether. In other words, the households are connected to or have access (in theory) to
a formal service, which is or has become deficient. Thus, in some studies households
still incur water utility bills, in addition to their coping costs. For instance, although
some households in the study by (Chaminuka and Nyatsanza, 2013) went for more than
a month without municipal water supply, they were still required to pay fixed water
charges which are mandatory for households with piped supply.
7.4.4 Coping costs and willingness to pay
Of the thirteen studies reporting on coping costs, eight include surveys of willingness to
pay for improved/ more reliable water services. Key work in this area includes the
study by Pattanayak et al. (2005) in Kathmandu, Nepal. They find that coping costs are
correlated to willingness to pay estimates as well as water bills across the income
distribution. Mean willingness to pay is reported to be almost 6 times greater (US$17)
than mean coping costs (US$3), confirming their hypothesis that coping costs are a
lower bound for willingness to pay. The reasons for this divergence, the authors note,
are that: i) the coping costs they estimated do not include lost wage income, cost of
illness and pain and suffering and ii) the willingness to pay estimates do not necessarily
reflect the true willingness to pay due to the hypothetical nature of the contingent
valuation questions. They thus suggest that future studies of coping costs could serve as
a screening tool in cost-benefit analyses of water supply improvements; coping costs
that exceed the cost of water service improvements would be indicative of cost-
beneficial policy. Four other studies compare coping costs to willingness to pay
estimates (Table 7.6).

Chapter 7: A review of household responses to unreliable water supplies
139
Table 7.6: Willingness to pay and coping
Author(s), year Water service
improvement
Elicitation format Coping
cost - willingness to pay
difference
Altaf, 1994 (1) In the rural area with
sweet groundwater: extra
4 hours of supply from
the existing piped water
system
(2) In the rural area with
brackish groundwater and
in the urban area: an
improved system which
would supply clean and
safe water continuously
with adequate pressure
and reliability
Not reported Rural area with sweet
groundwater = +Rs 22
Rural area with brackish
groundwater = +Rs 15
Urban area = +Rs 46
Choe et al., 1996 (1) Improve quality, by
enhancing water
purification and repairing
leakage
(2) Increase quantity, by
adding more tube-wells
and overhead tanks
(3) Improve reliability, by
adding additional power
generators.
Referendum question was
followed by an open-
ended question to
estimate the WTP
Individual connection = -
Rps 0.11
Public tap users = +Rps
39.45
All = +Rps 7
Dutta et al., 2005 (1) Longer hours of
service that would
gradually move from
intermittent to continuous
scheme
(2) Good quality water
with no health risk of
contamination
Split bidding game, with
different subgroups
facing starting point in
increasing or decreasing
order - the starting bid
being 3 times higher or
lower than the actual cost.
The bidding game was
followed by a final open-
ended question on
households’ maximum
willingness to pay
+Rs 158
Mycoo, 1996 (1) Better reliability: no
disruptions and a 24 hour
per day supply
(2) Better pressure: no
drops in volume of water
per second/minute in tap
(3) Better water quality:
clear, odourless, good
taste
(4) A service upgrade
(relevant to standpipe and
yard tap users)
Respondents were shown
a payment card of the
prices charged by WASA
to domestic users on a
quarterly basis, and were
instructed to use these in
guiding their responses
and indicate the
maximum amount they
were willing to pay per
month
No significant difference
+TT$0.14
Results vary: Altaf (1994), Choe (1996) and Dutta (2005) report coping costs that are
significantly higher than willingness to pay estimates in India. In a survey conducted in

Chapter 7: A review of household responses to unreliable water supplies
140
1994, Mycoo (1996) found that coping costs equalled willingness to pay estimates in
Trinidad; the monthly capital and maintenance costs of storage tanks in Trinidadian
dollars were $66.86 and estimated willingness to pay of $67.
A later study in 2003 by Virjee and Gaskin (2010) in Trinidad and Tobago did not
compare willingness to pay estimates to coping costs, but to the average water bills in
the sample. Willingness to pay amongst households with piped connections and storage
tanks or secondary water sources was lower than the average water bills. In the study,
68 % of households had invested in storage tanks, with capacities averaging 610 gallons,
leaving them with little need for service improvement. However, households without
piped connections were willing to pay 10 % more than the average water bills for a
service improvement that included an upgrade to a piped connection. The authors
highlight that might be indicative of scope sensitivity, as the utility derived from having
their own piped supply would have been larger.
7.4.5 Distribution of coping strategies across socio-economic groups
Pattanayak et al. (2005) find that collecting water from alternative sources constituted
56 % of total coping costs for poor households (classified as households in the lowest
four income deciles), compared to 34 % of wealthier households in Kathmandu, Nepal.
Katuwal and Bohara’s (2011) study in the same city finds that wealthier households in
the first and second wealth quartile households were more likely to use more than one
treatment method.
In another study, female-headed households are found to have more difficulty coping
and were more likely to expend labour than capital through collecting water from other
sources (Kudat et al., 1997). In Delhi, India, households were more likely to drill their
own well if their monthly income was 8,000 Rupees, reliability was low and if they
owned the residential property(Zérah, 2000a).
Although almost all households in the studies reviewed store water, income appears to
be a significant determinant of storage capacity. Gerlach and Franceys (2009) find that
few low-income households in Jordan had access to large storage devices. Average
storage capacity per capita amongst these households was 64 ℓ, and a minimum of 13 ℓ.

Chapter 7: A review of household responses to unreliable water supplies
141
7.4.6 Health and social outcomes related to coping
No studies were found whose primary focus is specific health and / or social outcomes
related to coping. However, some of the studies draw attention to linkages between
water storage practices and dengue vectors (Caprara et al., 2009), microbial regrowth in
storage containers (Gerlach and Franceys, 2009), and the cost of water-related illness
(Zérah, 1998, Dutta and Tiwari, 2005). Caprara et al. (2009) report that households in
lower income areas stored water in open containers such as barrels, drums and pots,
which provided breeding sites for Aedes aegypti mosquitoes.
Another important issue that arises from the literature concerns gender and household
responses to unreliable water supplies. Again, none of the studies reviewed directly
sought to investigate this in depth. However, in the literature reviewed there are several
references to women and children primarily bearing the burden of collecting water from
alternative sources (Chaminuka and Nyatsanza, 2013, Ngwenya and Kgathi, 2006,
Olsson and Karlsson, 2010). Chaminuka and Nyatsanza (2013) found that in Harare,
Zimbabwe, when the piped supply was unavailable women got up at 4 am to queue for
water from boreholes in the area. In Zanzibar, women complained about having ‘head
pains’ and chest pain from carrying water from alternative sources (Olsson and Karlsson,
2010).
Baisa et al. (2010) calibrate a model of depletion of stored water to assess the welfare
effects of unreliable water supply in Mexico City. Households in their sample store
water in overhead tanks when it is available, and purchase water from tanker trucks
when the storage tanks are depleted. Amongst their findings is that significant welfare
gains can be derived if the city’s water utility provides equal quantities of water at
regular intervals, compared to the existing supply that is discontinuous and irregular,
with no additional infrastructure or price increases.
7.4.7 Effectiveness of coping strategies adopted
None of the studies in the review sought to assess the effectiveness of coping strategies
in meeting household water needs or any other outcome. However, some insights can
be drawn from studies comparing coping strategies to water quantities stored. Installing
storage tanks allowed households to store greater quantities of water, and where these
were set up as overhead tanks or there were electrical pumps, households had the added
advantage of improved flow rate. Zerah (2000b) report storage capacities of 200 ℓcd

Chapter 7: A review of household responses to unreliable water supplies
142
for households with storage tanks relying on tubewells, 150 ℓcd for tanks linked to
municipal water and 30ℓcd for households using communal handpumps or other
unpiped sources.
Three studies report on the perceived effectiveness of having large-capacity storage
tanks. Respondents reported having continuous water supply and sufficient pressure
through the installation of overhead storage tanks of average capacities of 400-500
gallons (Altaf, 1994), 948 m3 (Kudat et al., 1997) and 620 gallons (Virjee and Gaskin,
2010).
Perhaps the most important question to be answered regarding the voice strategy is
whether it is effective in pressuring water utilities to improve services. Although none
of the studies seek to address this question, Zérah (2000b) notes that after
demonstrations over water and electricity in Delhi in 1998, bottled water companies and
water vendors emerged, although no supporting evidence is provided. Prior to these
demonstrations, the use of the ‘voice’ strategy was rare. Possible reasons are that
households may not believe that anything would come out of it, or may lack structures
necessary to voice their concerns in an organised manner (Chaminuka and Nyatsanza,
2013, Zérah, 2000b).
7.5 Discussion
The chapter reviewed 23 studies relating to household strategies to cope with unreliable
water supplies in developing countries. To my knowledge, no other studies have
attempted to synthesise the literature on this issue.
Before discussing the implications of the literature reviewed, it is important to note
some limitations. In the most fundamental sense the review is limited by the current
lack of a universally agreed upon definition of water supply reliability. Although
efforts were made to capture the various terminology used in the literature on reliability
in the search terms, the studies retrieved must be considered in the light of this
limitation. In addition, there may have been studies assessing some coping behaviours
that do not state this in the abstract of the paper and would consequently be missing
from the review.
Secondly, the literature on coping with unreliability is widely dispersed across various
disciplines, as evidenced in the sources we searched. While this is not necessarily a
limitation, it does bring up significant variations in the reporting structure and
Chapter 7: A review of household responses to unreliable water supplies
143
consequently makes it difficult to synthesise results in a systematic manner. In this
review, a thematic approach was used to analyse the literature. The heterogeneity in
study methods and reporting of study outcomes also makes appraisal of study quality
through common appraisal tools less useful. Although efforts to mitigate this have been
made by adapting some existing appraisal tools, this only allows for broad indications
of study quality.
The above notwithstanding, the results of this review have several implications for both
research and practice in the water supply sector. From a methodological perspective,
two issues are worth noting. First, given that reliability of supply is particularly
problematic in both south Asia and sub-Saharan Africa (WHO/UNICEF, 2011), one
might expect that studies on coping from both these regions would be widespread.
However, almost half of the studies reviewed on household coping strategies are from
south Asia compared to four from sub-Saharan Africa. Further, only 4 of the 23 studies
cover rural settings. This suggests geographic bias at a regional level, towards south-
Asia; and at a country level, towards urban areas. The reasons for the south-Asia focus
are not clear, but in the latter, a possible explanation may lie in that a number of studies
reviewed were mainly aimed at assessing demand for improved water services. The
perception that willingness and / or ability to pay amongst rural households is low
(Abramson et al., 2011) may influence whether studies are conducted in these areas.
Secondly, the literature reviewed herein is characterised by a reliance on mainly small-
scale cross-sectional studies. Although such studies have been useful in describing the
typology of coping strategies and their determinants, clear evidence on issues related to
health and social welfare is scarce. The health and social issues identified in this review
are rather anecdotal, partly because they are not the central focus of many studies, or
rigorous scientific approaches are not applied.
These methodological limitations make it close to impossible to address the question as
to how effective various coping strategies are; a matter of key relevance for policy and
practice in the water sector. It is plausible that coping strategies may be ineffective or
even counter-productive (Few et al., 2004). For example, some urban households in
Zimbabwe have resorted to digging shallow wells, whose contamination is now thought
to have exacerbated the 2008-2009 cholera outbreak in the country (Chambers, 2009,
Mangizvo and Kapungu, 2010). There is therefore a need to step up research into large

Chapter 7: A review of household responses to unreliable water supplies
144
scale, rigorous evaluations of what strategies work, why they work, at what cost, and in
what contexts.
This is not to say that smaller studies should be abandoned. On the contrary, one can
argue their importance in bringing to light some of the more nuanced or less explored
issues around households’ coping strategies and their outcomes. Notable examples are
the studies by Chaminuka and Nyatsanza (2013), Kudat et al. (1993) and Ngwenya and
Kgathi (2006), which point to potential relationships between coping strategies and
outcomes in sanitation practices, nutritional status and HIV. However, the need for
more rigorous approaches in these small-scale studies is emphasised as well.
Results from eight studies support Kudat et al.’s (1993) theory that low income
households are more likely to engage in ‘accommodative’ strategies by spending time
collecting water from alternative sources, than enhancing strategies such as drilling
wells or installing storage tanks. While it is somewhat obvious that households with
higher income would have more coping options, the key implication is the added
vulnerability of relatively poor households to unreliable water supplies (Vásquez, 2012).
The broader consequences extend towards undermining poverty alleviations
mechanisms through losses in labour productivity, erratic school attendance particularly
for girls, reduced potential for productive water uses (Kudat et al., 1993), as well
negative mental health outcomes (Wutich and Ragsdale, 2008).
The results also suggest that wealthier households drill wells or install storage tanks that
practically afford them continuous supply and are, by implication, able to ‘look after
themselves’ (Gerlach and Franceys, 2009). In many developing countries self-supply
initiatives such as households drilling wells (Oluwasanya et al., 2011), and local water
enterprises such as water kiosks (Opryszko et al., 2009) are increasingly being
promoted. However, regulation of these initiatives is generally weak (Gerlach and
Franceys, 2009), and concerns have been raised of their implications on groundwater
levels (Grönwall, 2010, Zérah, 2000b), water quality (Oluwasanya, 2009, Stoler et al.,
2012), health (Risebro et al., 2012) and affordability (Opryszko et al., 2009).
The findings on coping costs and willingness to pay for improved reliability are worth
noting. In some of the studies, households’ coping costs are at the minimum, the
equivalent of bills from water utilities, or even greater and willingness to pay for
improved public supplies is low among relatively wealthier households. This represents

Chapter 7: A review of household responses to unreliable water supplies
145
a significant diversion of potential revenue for the many water utilities in developing
countries that are already struggling to recover revenue from water users.
Also of interest is that strategies such as communities setting up communal water
supplies are relatively uncommon. Such community action would be perhaps indicative
of a willingness to seek collective and long-term solutions that would provide economy
of scale, particularly for households of lower socio-economic status. Some insights on
this matter can be drawn from Manzungu et al. (2012), who warn that collective action
may not be easily achieved where the state has previously assumed the role of service
delivery, as in the studies reviewed herein. Further, collective action may require levels
of social cohesion and trust that other households will pay their contribution (Fjeldstad,
2004) that should not be assumed to exist. A potential area of enquiry therefore could
be the conditions necessary for households to seek collective action.
Developing feasible solutions is perhaps a more challenging task than diagnosing the
nature and extent of the problem. Strategic action is required to implement effective
measures to alleviate the problems posed by unreliable water supplies.
In the immediate to medium term, there is an urgent need to develop a sound decision
base for coping strategies that can be promoted that promote good health, while being
environmentally sustainable and applicable at scale. In parallel, such evidence needs to
be translated to mitigatory action that can be undertaken at both the water supplier and
household level. For instance, water utilities may benefit from developing contingency
measures to supply water to communities during water supply interruptions. In
particular, the findings by Baisa et al. (2010) on the welfare gains of supplying water at
regular intervals are worth noting as a potential short-term solution where continuous
supply may not be immediately feasible. As poor households are often the ones least
able to cope, such interventions could be targeted towards mitigating water supply
shortages amongst these sections of the society. At household level, effective
mechanisms of disseminating information and education on best practice coping
strategies that are locally relevant are key.
It is also important to acknowledge that in many developing countries the delivery of
basic services and politics, governance and institutions are intricately linked (National
Agricultural Marketing Council and Department of Agriculture Forestry and Fisheries,

Chapter 7: A review of household responses to unreliable water supplies
146
2012). Thus, lasting solutions are likely those that also address the improvement of
water service delivery at various spheres of government.
Conclusions
The review of how households in developing countries cope with unreliable water
supplies has shown that households engage in a variety of strategies, with storage being
a common one. The factors influencing the choice of strategies vary, but income, level
of education, tenure and extent of unreliability appear fairly significant. The costs of
these coping strategies vary widely, and are in some cases comparable to water utility
bills.
The evidence that is available indicates that the poorest sections of society suffer most
from the impacts of unreliable water supplies and are least able to develop effective
coping strategies. Consequently the poorest sections of society may be missing out on
the health and other benefits of access to safe water supplies even when they are
reported as being served by improved supplies, and efforts aimed at mitigating
unreliability of water supplies would do well to target them. The following chapter
provides an empirical assessment of households’ coping strategies, and the implications
on the Free Basic Water Policy in South Africa.

147
8 Household responses to unreliable water supplies
and Free Basic Water in Limpopo

Chapter 8: A survey of household responses to unreliable water supplies in Limpopo
148
This chapter builds on the systematic review in Chapter 7 by providing empirical
evidence of household responses to unreliable water supplies. The chapter examines
household strategies to cope with unreliable water supplies, as well as the factors
associated with the adoption of these strategies. The crucial question of Free Basic
Water is examined, taking into account the costs of coping, and the quantity of water
households are able to obtain.
8.1 Objectives
The overall aim of this chapter is to assess the implications of unreliable water supplies
for households in Limpopo. The specific objectives are to:
Describe household coping strategies
Identify factors associated with coping strategies
Describe the distribution of coping strategies across population groups
Explore the implications of household coping strategies in the context of Free
Basic Water, by assessing:
The costs of coping with unreliable water supplies
Whether the Free Basic Water allocation is met
The last of these objectives is of particular relevance to policy, as it considers the issue
of unreliable water supplies in the broader national context of the Free Basic Water
policy. Specifically, the objective is to answer the question as to whether water is
actually free, and whether the 25 ℓ per capita per day (ℓcd) water allocation is actually
being met amongst the households studied.
8.2 Methods
Details of the questionnaire design, sampling and survey procedures have been
presented in Chapter 3. The analyses presented in this chapter also draw on the key
variables presented in Chapters 3 and 4; namely indicators of household socio-economic
status, household coping costs and water use.
8.2.1 Data collection
The survey instrument comprised several sections relating to the household
demographics, socio-economic status, water use, strategies to cope with unreliability,
and the coping costs. For respondents that reported treating water amongst their coping

Chapter 8: A survey of household responses to unreliable water supplies in Limpopo
149
strategies, follow up questions were asked about the treatment method(s) used and the
frequency of treatment.
8.2.1.1 Coping costs
The methods used to derive monthly costs of having a drilled well and / or storage tank
have been described in Chapter 3. Other cost data that were collected were those
relating to buying water from neighbours, treating water through chlorination and
buying bottled water. For households that reported buying water from neighbours,
questions were asked about whether they paid for the water or got it free, the mode of
payment i.e. charged per container of water or a flat rate, and the estimated total spent
each month on buying water. Questions were also asked about the costs of treating
water; the amount spent on purchasing filter equipment; the costs, if applicable, of
replacing filters; and the amount of money spent on chlorinating products. For
households that bought bottled water, data were collected on the number of bottles
bought each month and the price of each bottle of water.
8.2.1.2 Cost of illness
Data were also collected on the occurrence of water-related illness, namely diarrhoea in
the household, as well as the costs of treatment. Respondents were asked if anyone in
the household had experienced diarrhoea in the last two weeks. A household member
was considered to have had an episode of diarrhoea if they had passed three or more
loose stools within a 24-hour period (World Health Organisation, 2014). Where
diarrhoea was reported, follow-up questions were asked about the treatment method (if
any); the costs related to travel when seeking treatment; the cost of the treatment itself,
as well as any primary daily activities (e.g. schooling, work) that were missed during
that time.
8.2.2 Analysis
Analyses were performed in SPSS 18 (SPSS Inc., 2009) and Stata 12.1 (Stata Corp,
2011), and graphs plotted in Excel 2010 (Microsoft, 2010) and Stata (Stata Corp, 2011).
8.2.2.1 Assessing the distribution of coping strategies
Household coping strategies and the related costs were anticipated to differ, depending
on the wealth status of the household as well as the community that they were in. To

Chapter 8: A survey of household responses to unreliable water supplies in Limpopo
150
investigate these differences, the coping strategies were grouped by wealth status and
community.
8.2.2.2 Factor analysis of coping strategies
Because several of the coping strategies were highly correlated (Table A8.1.1,
Appendix 8.1), factor components were used in the analyses instead of the original
variables. Factor analysis is a multivariate statistical technique which identifies a set of
underlying factors that explain relationships among correlated variables (Heck and
Thomas, 2009). Because the extracted factors are usually fewer than the original set of
variables, it can be applied as a data reduction technique. Factor analysis was done in
SPSS (SPSS Inc., 2009), and Principal Component Analysis (PCA) was used for
extraction of the factors and equamax rotation. The equamax rotation is orthogonal and
derives non-correlated factors. Items with factor loadings greater than 0.5 were retained
for further analysis.
8.2.2.3 Determining factors associated with coping strategies
To identify the factors associated with the various coping strategies, linear regression
was performed in Stata (Stata Corp, 2011) for each of the components derived from the
PCA. Backward stepwise regression models were used to select potential explanatory
variables, with significance level for removal set to 0.05. This technique is useful in
creating simple models using variables that make most valuable contribution to the
relationship under consideration (Portney and Watkins, 2000). The final models
included significant variables identified from the stepwise regression procedures, as
well as the indicators of socio-economic status, which were included as control
variables and household perceptions of the water supply.
8.2.2.4 Assessing the ‘free’ and ‘basic’
The question of what the implications of unreliable water supplies are on the Free Basic
Water policy was considered from the perspective of whether water in three study
communities is actually free, and whether households are able to obtain the basic
minimum of 25 ℓ per capita per day. The three outcomes of interest were the costs of
water-related illness, the costs of coping with unreliable water supply, and average per
capita water use.
The monetary costs of illness comprise the travel costs to a health facility / practitioner
for both the household member who was ill and anyone accompanying them, as well as

Chapter 8: A survey of household responses to unreliable water supplies in Limpopo
151
the costs of consultation at the facility / practitioner, and any medicines prescribed.
Where any of the costs were covered by some form of health insurance, this was
deducted from the cost of treatment / medication, to give the out-of-pocket expenses
incurred by the household.
Coping costs comprise the aggregate monetary costs of having a drilled well and / or
storage tank, buying water from neighbours, chlorinating water and buying bottled
water for each household each month. As with the coping strategies, the distribution of
these costs was assessed by wealth status and community. The Kruskal-Wallis test was
used to compare coping costs across groups, as the coping costs were not normally
distributed. Sidak, Bonferroni and Scheffe multiple comparison tests were conducted to
examine differences in means between each pair of grouping variables.
Water use data were compared to the water service benchmark specified in the criteria
used to define Free Basic Water. This benchmark is set at 6,000 ℓ a month for a
household of 8 people; essentially translating to the 25 ℓ for each household member a
day (Department of Water Affairs, 2003, Department of Water Affairs, 2007).
Assuming that all households employ at least one strategy to cope with the unreliable
water supplies, effective coping would be defined as achieving average per capita water
use of at least 25 ℓ per day, at zero cost.
Linear regression models were used to identify the determinants of coping costs and
water use, using log transformed variables of household monthly coping cost and
household water use. Backward stepwise regression with significance level for removal
set to 0.05 was used to identify variables for inclusion. The final models included the
variables identified from the stepwise regression; indicators of socio-economic status as
control variables; perceptions about the water supply; and community.
8.3 Results
The coping strategies adopted by households in the three communities are presented in
Figure 8.1. Most households engage in several strategies, with the most common being
storing water in vessels such as buckets, drums etc., as well as harvesting rainwater in
the summer.

Chapter 8: A survey of household responses to unreliable water supplies in Limpopo
152
Figure 8.1: Household strategies to cope with unreliable water supply
A typical set-up for harvesting rainwater is to place drums or buckets at the edge of a
gutter, as shown in Figure 8.2.
Figure 8.2: Harvesting rainwater
Source: Author
0 50 100 150 200
store water in buckets, drums etc
harvest rainwater
recycle wastewater
collect water from other sources
buy water from neighbours
reschedule activities
use water sparingly
treat water
install storage tank(s)
drill well
protest or complain
buy bottled water
Number of households adopting strategy
Co
pin
g s
tra
teg
y

Chapter 8: A survey of household responses to unreliable water supplies in Limpopo
153
Collecting water from other sources is distinguished from buying water from
neighbours, in that the water is obtained for free i.e. without payment. Recycling
wastewater includes re-using laundry water for bathing, mopping floors, cleaning toilets
etc. Only when the water is very greasy, soapy or dirty is it used to water flower or
vegetable patches. Amongst the households that report using water sparingly, this is
mainly by skipping baths, dry bathing or simply wiping with a wet towel. Rescheduling
domestic activities typically entails postponing laundry washing and thorough mopping
of floors until more water is available.
Water treatment is reported by 16 % (32) of the households. The treatment methods are
presented in Figure 8.3.
Figure 8.3: Household water treatment methods
The most common treatment method is chlorination, by adding bleach solution to water.
None of the households practise solar disinfection. A few households (6 %) report
filtering water when it is particularly turbid, by sieving it through kitchen towels or
muslin cloths.
8.3.1 Distribution of coping strategies across population groups
Figure 8.4 shows the distribution of the various coping strategies by wealth status.
While the majority of strategies are employed by households across all wealth groups,
drilling wells is exclusively done by the wealthiest households; i.e. households in
35%
56%
6%
3%
boiling
chlorination
filtration
let it stand and settle

Chapter 8: A survey of household responses to unreliable water supplies in Limpopo
154
quintile 5. Storage tanks are installed by households whose wealth status is categorised
as average, above average and wealthiest.
Figure 8.4: Household coping strategies, by wealth status
When looking at the coping strategies by community, Figure 8.5 shows that there is a
fairly even spread of the strategies across the three communities. However, collecting
water from other sources is most prevalent in Community 3.
Figure 8.5: Household coping strategies, by community
0 50 100 150 200
store water in buckets, drums etc
harvest rainwater
recycle wastewater
collect water from other sources
buy water from neighbours
reschedule activities
use water sparingly
treat water
install storage tank(s)
drill well
protest or complain
buy bottled water
Number of households adopting strategy
Co
pin
g s
tra
teg
y
least wealthy
below average
average
above average
wealthiest
0 50 100 150 200
store water in buckets, drums etc
harvest rainwater
recycle wastewater
collect water from other sources
buy water from neighbours
reschedule activities
use water sparingly
treat water
install storage tank(s)
drill well
protest or complain
buy bottled water
Number of households adopting strategy
Cop
ing s
trate
gy
Community 1
Community 2
Community 3

Chapter 8: A survey of household responses to unreliable water supplies in Limpopo
155
Conversely, buying water from neighbours is most prevalent in Communities 1 and 2,
with only one household in Community 3 reporting that they buy from neighbours.
Preliminary discussions with the local headmen and informal discussions with
respondents revealed that in Community 3, the chief had forbidden the sale water. Thus,
although some households have spent money in setting up the connections from the
springs and storage tanks, they cannot charge neighbours who come to collect water
from them. Drilling wells is reported only in Communities 1 and 2, and buying bottled
water is also more prevalent in these two communities than in Community 3.
8.3.2 Coping components
Four components were extracted from the data on coping strategies, and together these
four components represent 64.5 % of the variance in the original variables. The rotated
component matrix of the variables is shown in Table 8.1.
Table 8.1: Rotated component matrix of coping strategy variables
Component
Coping strategy 1 2 3 4
Drilled well .930 -.014 .009 -.139
Storage tank .891 -.052 .058 -.158
Treat water .110 .120 -.275 -.659
Store water -.792 .146 .073 .081
Buy water from neighbours -.036 .849 .122 .187
Buy bottled water .426 .218 -.269 .271
Collect water from alternative sources -.366 -.813 -.049 -.021
Recycle waste water -.139 .089 .802 .109
Harvest rainwater .176 .232 .713 .022
Use water sparingly -.190 .619 .156 .243
Reschedule household activities -.268 .663 .220 -.184
Protest/complain to local authority -.072 .188 -.080 .685
Notes: Extraction Method: Principal Component Analysis. Rotation Method: Equamax with Kaiser Normalization.
Variance explained: 64.48 %.
Factor 1 is associated with drilling wells and installing storage tanks, with scores of
0.930 and 0.891 respectively. This component was named drilling and storing. Factor
2 was named buying and accommodating, and is associated with buying water from
neighbours (0.849), using water sparingly (0.619) and rescheduling activities (0.663).
Factor 3 is associated with recycling wastewater and harvesting rainwater, and was

Chapter 8: A survey of household responses to unreliable water supplies in Limpopo
156
named recycling and harvesting, while Factor 4 is protesting / complaining to local
authorities.
8.3.3 Factors associated with coping strategies
The results of the linear regression for each of the coping factors are shown in Table 8.2.
Drilling wells and / or installing storage tanks are positively associated with a higher
wealth status and a perception that there is a problem with the quality of the water.
There is a strongly negative association between drilling wells and /or installing storage
tanks and being in Community 3, compared to Community 1. Buying water from
neighbours, using water sparingly and rescheduling activities (Factor 2) is marginally
associated with more people in the household having episodes of diarrhoea; has a
strongly negative association with being in Community 3; has a moderately negative
association with problems with water quality being a reason for using multiple sources;
and is marginally associated with a decrease in the number of days that water is
available per week.
Recycling wastewater and harvesting rainwater is marginally associated with a higher
household crowding index; is negatively associated with being very concerned about the
time spent collecting water; and also negatively associated with the perception that there
are generally no problems with the water supply. Protesting or complaining is
marginally associated with lower household incomes and longer time taken to repair
breakdowns.

Chapter 8: A survey of household responses to unreliable water supplies in Limpopo
157
Table 8.2: Linear regression of factors associated with coping strategies
Drill wells/ storage Buy water and
accommodating
Recycling and
harvesting
Protest/ complain
Least wealthy a
Below average -0.0148
(-0.3429 - 0.3132)
-0.0739
(-0.3683 - 0.2205)
-0.0255
(-0.4712 - 0.4202)
-0.2238
(-0.7291 - 0.2814)
Average -0.0077
(-0.3445 - 0.3291)
-0.1875
(-0.4761 - 0.1010)
-0.1808
(-0.6218 - 0.2603)
0.1821
(-0.3121 - 0.6763)
Above average 0.5697**
(0.1782 - 0.9612)
-0.1686
(-0.5070 - 0.1697)
0.1917
(-0.3403 - 0.7237)
-0.0622
(-0.6471 - 0.5227)
Wealthiest 0.4689*
(0.0376 - 0.9002)
-0.2631
(-0.6383 - 0.1121)
-0.3137
(-0.8931 - 0.2656)
0.3121
(-0.3285 - 0.9527)
Household crowding index -0.0522
(-0.2412 - 0.1367)
-0.1444
(-0.3120 - 0.0233)
0.3059*
(0.0507 - 0.5610)
0.0384
(-0.2488 - 0.3256)
Household income 0.0498
(-0.0999 - 0.1995)
0.0122
(-0.1233 - 0.1477)
-0.0272
(-0.2339 - 0.1794)
-0.2313*
(-0.4626 - -0.0000)
Community 1a
2 -0.4073*
(-0.7575 - -0.0570)
-0.0963
(-0.4256 - 0.2330)
0.4218
(-0.0730 - 0.9166)
0.1671
(-0.4068 - 0.7411)
3 -0.7155**
(-1.2208 - -0.2102)
-1.5300***
(-1.9720 - -1.0881)
0.4539
(-0.0185 - 0.9264)
0.0196
(-0.5461 - 0.5853)
No of household members
reporting diarrhoea
-0.0235
(-0.2055 - 0.1585)
0.1759*
(0.0177 - 0.3342)
0.0014
(-0.2391 - 0.2420)
-0.0905
(-0.3605 - 0.1795)
Water quality problem 0.2531*
(0.0073 - 0.4988)
Availability of water, in
days per week
-0.0469*
(-0.0931 - -0.0006)
Not at all concerned about
time spent collecting watera
Moderately concerned -0.1560
(-1.3486 - 1.0365)
0.2822
(-1.0598 - 1.6242)
Very concerned -0.0378
(-0.2583 - 0.1827)
-0.5708**
(-0.9252 - -0.2164)
Reason for multiple source:
water quality
-0.7234**
(-1.2240 - -0.2228)
0.0981
(-0.6457 - 0.8419)
No problem with water
supply
-0.5386*
(-0.9904 - -0.0867)
Time to repair breakdowns 0.0049*
(0.0003 - 0.0096)
n 167 160 165 160
R2 0.2998 0.7586 0.3205 0.1499
Note: 95 % confidence interval in parentheses; abase category,
*p < 0.05,
**p < 0.01,
***p < 0.001

Chapter 8: A survey of household responses to unreliable water supplies in Limpopo
158
8.3.4 Coping and Free Basic Water
The following sections present the results of the assessment of water-related illness,
coping costs and their distribution across populations groups and water use.
8.3.4.1 Water-related illness
Among the households surveyed, 15 (7.6 %) reported at least one episode of diarrhoea
within the preceding two weeks. Almost half of these cases are reported in Community
2 (Figure 8.6). In relation to wealth status, the highest number of cases (4) is reported
amongst the least wealthy households, compared to only one among the wealthiest.
Figure 8.6: Number of households reporting diarrhoea, by wealth status and community
With regards to the treatment method, five (5) households reporting using no treatment;
five (5) went to a local clinic, three used oral rehydration therapy, and two (2) altered
their normal diet until the diarrhoea had cleared up. Among those that went to the local
clinic, no treatment costs were charged. In terms of transport costs, two (2) households
reported that they walked to the clinic and thus incurred no transport costs, two (2) got a
lift to the clinic from neighbours and one (1) spent R50 (approximately US$6 at a 2012
exchange rate of US$1: ZAR8.57) on transport to and from the clinic.
8.3.4.2 Is Free Basic Water actually ‘free’?
The total monthly coping costs comprise the costs of drilling wells, installing storage
tanks, buying water from neighbours, chlorinating water and buying bottled water. The
0
1
2
3
4
5
least wealthy below
average
average above
average
wealthiest
Nu
mb
er o
f d
iarr
hoea
ca
ses
Wealth status
Community 1
Community 2
Community 3

Chapter 8: A survey of household responses to unreliable water supplies in Limpopo
159
costs for each of these coping strategies are presented in Table A8.1.2 in Appendix 8.1.
The aggregate monthly coping costs in each wealth quintile are summarised in Table
8.3. Median coping costs range from R0 to R89, for the least wealthy to the wealthiest
households.
Table 8.3: Monthly household coping costs, by asset quintile
Wealth status Mean Median Standard
deviation Minimum Maximum
Least wealthy 26.54 0.00 48.98 0 200.00
Below average 47.30 13.00 94.21 0 545.00
Average 44.39 14.50 67.08 0 310.00
Above average 145.15 69.00 214.65 0 1,097.00
Wealthiest 158.27 89.00 191.82 0 662.00
Note: Coping costs are in South African Rand (ZAR)
Results of the Kruskal-Wallis test indicate a significant difference in coping costs across
the wealth quintiles, with F(4,191) = 8.00 and p = 0.00. Post-hoc analysis using the
Sidak, Bonferroni and Scheffe methods showed that coping costs are significantly lower
at the 0.05 level amongst least wealthy households (wealth quintile 1), below average
(wealth quintile 2) and average households (wealth quintile), compared to the above
average (wealth quintile 4) and wealthiest households (wealth quintile 5) for all
methods.
The distribution of the coping costs across the three communities is summarised in
Table 8.4. The lowest costs are incurred by households in Community 3, who have
median costs of R1, compared to the R105 and R100 in Communities 1 and 2
respectively.
Table 8.4: Monthly household coping costs, by community
Community Mean Median Standard
deviation Minimum Maximum
1 162.56 105.50 156.54 0 574.00
2 134.94 100.00 184.69 0 1,097.00
3 17.47 1.00 55.10 0 417.00
Note: Coping costs are in South African Rand (ZAR)
Results of the Kruskal-Wallis test indicate that these differences are significant, with
F(2,194) = 23.93 and p = 0.00. Sidak, Bonferroni and Scheffe results confirm that

Chapter 8: A survey of household responses to unreliable water supplies in Limpopo
160
coping costs are significantly lower in Community 3 compared to Communities 1 and 2
at the 0.05 level.
Figure 8.7 presents the median coping costs as a proportion of the median household
income for each month. Overall, the median household income per month is R1,760,
and R21 (median value) is spent on coping costs each month, which comes to 1.2 % of
the monthly income spent on coping costs.
Figure 8.7: Median coping costs as a proportion of median household income, by wealth status
and community
However, as Figure 8.7 shows, when examining the distribution of these coping costs
by community, households in Communities 1 and 2 incur coping costs of between 1.3
and 21.2 % of their monthly income overall. There is an overall increase in the
proportion of household income spent on coping costs, with a higher wealth status. The
least wealthy households in Communities 1 and 2 spend 1.3 and 6.8 % of their income
on coping costs, while those in the above average wealth category spend 8.3 and 21.2 %
respectively. In contrast, the least wealthy and below average households in
Community 3 incur no coping costs, while those in the average to wealthiest categories
incur costs that are less than 0.5 % of their monthly household income.
In order to provide some insight into the household determinants of coping costs, Table
8.5 presents the results of a linear regression of log-transformed coping costs, socio-
economic indicators, perceptions about the water supply and community.
0.0%
5.0%
10.0%
15.0%
20.0%
25.0%
30.0%
35.0%
least
wealthy
below
average
average above
average
wealthiest
Pro
port
ion
of
ho
use
ho
ld i
nco
me
spen
t
on
co
pin
g c
ost
s
Wealth status
Community 1
Community 2
Community 3

Chapter 8: A survey of household responses to unreliable water supplies in Limpopo
161
Table 8.5: Determinants of aggregate household monthly coping costs
Coefficient 95 % Confidence interval
Least wealthy a
Below average 0.5211 -0.1425 - 1.1847
Average 0.6157 -0.0057 - 1.2371
Above average 1.5682*** 0.8716 - 2.2649
Wealthiest 1.5340*** 0.7908 - 2.2773
Household crowding index 0.1461 -0.1319 - 0.4241
Household income 0.0009 -0.2935 - 0.2954
Community 1 a
2 -0.1577 -0.8675 - 0.5521
3 -3.1450*** -3.8094 - -2.4806
Diarrhoea in the household in last 2
weeks -0.2609 -1.0182 - 0.4963
Availability of water, in hours per
day -0.0403
* -0.0751 - -0.0054
Availability of water, in days per
week 0.1219 -0.0147 - 0.2585
Time to repair breakdowns 0.0061* 0.0010 - 0.0112
Reliability of water supply expected
to be worse in the next two years a
Better than it currently is 0.2601 -0.4526 - 0.9727
The same 0.3460 -0.2134 - 0.9055
Do not know 0.7565* 0.0806 - 1.4325
Not at all concerned about time spent
collecting water a
Moderately concerned -1.0945 -2.9120 - 0.7231
Very concerned 0.7743** 0.2863 - 1.2622
n 183
R2 0.6349
Note: abase category,
*p < 0.05,
**p < 0.01,
***p < 0.001
Coping costs increase with a higher wealth status, uncertainty about how reliable the
water supply in the future (the next 2 years), the time taken to repair breakdowns and
households being very concerned about the time spent collecting water. However,
households in Community 3 are more likely to have significantly lower coping costs
compared to those in Communities 1 and 2. Further, coping costs increase as the
number of hours that water is available each day decreases.

Chapter 8: A survey of household responses to unreliable water supplies in Limpopo
162
8.3.4.3 Is ‘basic’ actually basic?
Although households employ a variety of strategies to cope with unreliable water
supplies, only 34 households (17.3 %) are able to meet the minimum water use
benchmark of 25 ℓ per capita per day (Figure 8.8).
Figure 8.8: Number of households meeting water use benchmark, by wealth status and
community
Across the three communities, the highest proportion of households in which the
benchmark is met is in Community 2, where 23.1 % of households have a daily per
capita use of at least 25 ℓ. When looking at the results by wealth status, the highest
proportion of households meeting the 25 ℓ benchmark are those in the average wealth
category.
The overall determinants of household water use are presented in Table 8.6. Household
water use increases with a higher wealth status and the number of years that the
household has lived on their premises. There is also a positive association between
household water use and the household crowding index.
0
2
4
6
8
10
12
least wealthy below
average
average above
average
wealthiestNu
mb
er o
f h
ou
seh
old
s u
sin
g a
t le
ast
25
lit
res
of
wa
ter
per
ca
pit
a p
er d
ay
Wealth status
Community 1
Community 2
Community 3

Chapter 8: A survey of household responses to unreliable water supplies in Limpopo
163
Table 8.6: Linear regression of determinants of household water use
Coefficient Confidence interval
Least wealthy a
Below average 0.0811 -0.1554 - 0.3176
Average 0.1877 -0.0458 - 0.4213
Above average 0.2512 -0.0109 - 0.5132
Wealthiest 0.4072** 0.1228 - 0.6916
Household crowding index 0.2403*** 0.1438 - 0.3368
Household income 0.0209 -0.0748 - 0.1166
Community 1 a
2 0.0394 -0.1889 - 0.2677
3 -0.1441 -0.4530 - 0.1647
Diarrhoea in the household in last 2
weeks -0.2955 -0.5926 - 0.0016
Number of years household has lived
on the premises 0.0078
* 0.0018 - 0.0139
Monthly coping cost -0.0092 -0.0730 - 0.0545
Coping factors
Drill wells, storage tanks 0.0086 -0.1044 - 0.1216
Buy water, reschedule, use
sparingly -0.0312 -0.1722 - 0.1099
Recycle, harvest -0.0285 -0.1065 - 0.0496
Protest, complain -0.0104 -0.0817 - 0.0609
n 164
R2 0.2728
Note: abase category,
*p < 0.05,
**p < 0.01,
***p < 0.001
8.3.4.4 How much does the basic water supply cost?
If only 34 (17.3 %) of households can actually meet the benchmark minimum of 25 ℓcd,
how much are they paying, in terms of coping costs? Overall, the median coping cost
for households that use at least 25 ℓcd is R30 per month. However, these costs range
from R0 in Community 3 to R168 in Community 1 (Table 8.7).

Chapter 8: A survey of household responses to unreliable water supplies in Limpopo
164
Table 8.7: Median coping costs for households who meet and those who do not meet
the 25 ℓ per capita per day benchmark
Community 1 Community 2 Community 3
Wealth status ≥ 25 ℓcd < 25 ℓcd ≥ 25 ℓcd < 25 ℓcd ≥ 25 ℓcd < 25 ℓcd
Least wealthy - 20.00 30.00 100.00 0.00 0.00
Below average - 63.50 30.00 75.00 0.00 0.00
Average 168.00 83.00 15.00 75.00 25.00 0.00
Above average - 275.00 45.00 100.00 39.00 9.00
Wealthiest 15.00 199.50 100.00 115.00 167.50 8.00
Note: Coping costs are in South African Rand (ZAR); costs are per household per month
Across the three communities, the median costs for households that meet the 25 ℓcd
benchmark are R124 in Community 1, R35 in Community 2 and R1 in Community 3.
By wealth status, median coping costs for households using at least 25 ℓcd are R0.50 for
the least wealthy; R11 for those below average; R34 for the average; R40 for the above
average; and R73 for the wealthiest. Coping costs for the least wealthy and below
average households in Community 3 (n = 8) are R0; i.e. these are the households that do
have free (R0) and basic (≥ 25 ℓcd) water.
Overall, households that use less than 25 ℓcd pay R106 in coping costs in Community 1,
R100 in Community 2 and R1 in Community 3. By wealth status, the median coping
costs for households using less than 25 ℓcd are R0 for the least wealthy; R15 for those
below average; R10 for the average; R100 for those above average; and R89 for the
wealthiest.
8.4 Discussion
This chapter set out to examine household strategies to cope with unreliable water
supplies, factors associated with the adoption of these strategies, as well as the coping
costs and quantity of water obtained, within the context of the Free Basic Water policy.
The key findings of the chapter are: the high prevalence of rainwater harvesting as a
coping strategy across all three communities; the significantly lower coping costs
incurred by households in Community 3; the very small number of households that meet
the minimum water use benchmark of 25 ℓ per capita per day; and consequently the
even smaller number of households that do in fact have Free Basic Water, defined as
zero coping costs and water use of at least 25 ℓcd.
Chapter 8: A survey of household responses to unreliable water supplies in Limpopo
165
There are some limitations to the findings presented in this chapter that should be noted.
First, the coping costs presented in this chapter are limited to the direct monetary costs
only, and do not include opportunity costs of time lost by households, or the indirect
costs on livelihoods. Further, the costs of household water treatment relate only to the
costs of bleach solutions, and do not include the energy costs of boiling water. Thus,
the full economic costs of coping may well be higher than those presented herein.
The data presented herein (coping costs, water use, diarrhoea and reliability of the water
supply) are based on self-reports from the household respondents and may be subject to
recall bias. It was not possible to triangulate the self-reported with, for instance,
financial records of coping expenditures, water meter readings, microbiological
diagnosis of diarrhoea or water utility records of service performance. To try and
minimise the potential bias, prompted recall techniques were used in the survey, where
instead of asking respondents to simply state e.g. the amount of money spent on buying
bottled water, prompts such as the number of water bottles bought, their capacity and
the price per bottle were provided. Similar prompted recall techniques were also used
in the household water use survey questions. With regards to the diarrhoea data, the
survey employed a specific case definition to reduce subjectivity in the self-reports and
potential bias. However, it should be highlighted that while the quality of the water
supply service can have a significant impact on health outcomes such as the occurrence
of diarrhoea, other factors such as sanitation also play a major role. Thus, the observed
diarrhoeal prevalence cannot be attributed entirely to unreliability in the water supply.
Water use, handling practices and water-related illness may be influenced by seasonal
changes (Brown et al., 2013). Thus, the study period may have been too short to
observe these seasonal influences and other contextual factors that impact on coping
behaviours.
Turning now to the findings, the relatively low prevalence of household water treatment
(16 %), suggests that households do not hold the perception that the water is of poor
quality. As reported in Chapter 4, 80.6 % of households report that they are not at all
concerned about getting sick from their drinking water, and household water treatment
has generally been declining in the Limpopo Province (Statistics South Africa, 2011).
Unsurprisingly, drilling wells is done by only the wealthiest households in Communities
1 and 2, given the high costs associated with this coping strategy. Households in

Chapter 8: A survey of household responses to unreliable water supplies in Limpopo
166
Community 3 would have no need to drill wells because of the availability of springs in
the area, from which they either collect water directly or set up pipe connections to the
yard. The community’s hilly terrain would also likely be a deterrent to drilling wells.
As has been noted in the literature, the analysis of the determinants of household coping
strategies is complicated by the fact that households often employ several strategies, and
some more than others. Analysing each of the strategies individually would require
insight into the sequence in which they adopted, which is rather complex (Zérah, 2000a).
Existing studies provide only a descriptive analysis of the distribution of strategies
across population groups (e.g. Caprara et al., (2009); Choe et al., (1996) and Kudat et al.
(1993); focus their analysis on the determinants of a particular coping strategy (e.g.
Vásquez (2012) and Zérah (2000a)) or analyse the determinants of the aggregate coping
costs (e.g. Pattanayak et al., (2005). The use of the extracted principal components in
the analysis thus represents a novel approach in the analysis of household strategies to
cope with unreliable water supplies. This approach allowed two distinct advantages.
As an exploratory technique, it revealed underlying patterns in the adoption of coping
strategies. Second, as a data reduction technique, it simplified analysis which would
have otherwise been tedious with 12 coping strategy variables, and likely compromised
variance estimates in the regression analyses (Portney and Watkins, 2000).
Interestingly, the factors extracted from the principal component analysis are broadly in
line with the concept of ‘exit, voice and loyalty’ (Hirschman, 1970, Zérah, 2000a)
outlined in the systematic review of coping strategies (Chapter 7). Factor 1, drilling
wells and installing storage tanks, corresponds with the ‘exit’ concept; households exit
the unreliable water supply system by becoming producers of water themselves or
having as little reliance on the unreliable supply as possible by storing large quantities
of water. Factor 2 (buying water, rescheduling activities and using water sparingly) and
Factor 3 (recycling wastewater and harvesting rainwater) are broadly representative of
‘loyalty’; households accommodate unreliable water supplies by working their water
use and domestic activity around it. The last of these, the ‘voice’ option is evidenced in
Factor 4; the households that protest or complain to the local authorities.
Turning to the determinants of coping strategies, the positive association between
Factor 2 (buying water, rescheduling activities and using water sparingly) and diarrhoea
in the household is worth noting. A possible explanation is that cost could be a limiting
factor in the quantity of water that households can buy – hence the need to use it

Chapter 8: A survey of household responses to unreliable water supplies in Limpopo
167
sparingly – and consequently in hygiene practices such as hand-washing and bathing.
The relatively small sample size limits the ability to conduct sophisticated analyses of
the diarrhoea data, such as determinants of diarrhoea occurrence and age-specific
estimates.
Recycling wastewater and harvesting rainwater (Factor 3) is positively associated with
the household crowding index. This suggests that households of a lower socio-
economic status (indicated by a higher household crowding index) are more likely to be
‘loyal’ and accommodate unreliable water supplies, and supports the findings of the
review in Chapter 7.
Protesting and / complaining to local authorities (Factor 4) is associated with lower
household income. As the findings in this chapter suggests that households of a higher
socio-economic status are more likely to ‘exit’ the unreliable water supply by drilling
their own wells, it perhaps makes sense they would not be willing to engage with the
local authorities by voicing their problems. The association between protesting and / or
complaining and with the length of time taken to repair breakdowns also makes intuitive
sense; as shown in Chapter 4, breakdowns could take over a month before they were
repaired, during which time households would likely get frustrated and approach local
authorities.
Unsurprisingly, the lowest coping costs are reported in Community 3, as pipe
connections from springs would be relatively cheap compared to drilling wells, and also
because even when households collect water from their neighbours they are not charged
for it. Perhaps worth bearing in mind when considering the annuitized monthly coping
costs for households with drilled wells (Appendix 8.1) is that they may actually be
offset by the income that comes from selling water to neighbours. Although such data
was not collected in the survey itself, it is plausible that a reasonable proportion of these
costs could be recovered in this way. A simple projection is that if a household sells
water to two neighbours, at an overall price of R70 per month each, the income
generated is R140; over half of the households’ median coping costs.
According to the results of the 2010/2011 Income and Expenditure Survey, the
proportion of household income spent on water supply and miscellaneous services
related to their dwelling annually is on average 3.1 % for the country as a whole, and
1.4 % for households in Limpopo Province (Statistics South Africa, 2012d). While

Chapter 8: A survey of household responses to unreliable water supplies in Limpopo
168
coping costs among the three communities are overall comparable to these figures (1.2 %
of household income), the proportion of household income spent on coping costs in
Communities 1 and 2 specifically is much higher.
Amongst the determinants of coping costs is uncertainty about the reliability of the
water supply in the next 2 years. This finding is generally in line with Kudat et al.’s
(1993) hypothesis that household expectations of unreliability induce them to employ
more permanent, and usually more costly coping strategies. Also noteworthy is the
strongly negative association between coping costs and being in Community 3. Much
of the existing analyses of the determinants of coping costs focus on socio-economic
factors; observed and reported quality of the water supply; and other household
characteristics as determinants of coping strategies and the ensuing costs. The results of
the analysis of determinants demonstrate the influence of environment i.e. the presence
of springs in Community 3, on household coping costs. This is an issue that received
very little attention in the literature, with the exception of the early studies on coping by
Humplick et al. (1993) and Kudat and Musayev (1997). These studies do not present
any empirical evidence of this relationship, but do highlight it in their framework of
assessing household strategies to cope with unreliable water supply.
While households in Community 3 are seemingly at an advantage in relation to the
lower coping costs they incur, this does not seem to necessarily translate to higher water
use than households in Communities 1 and 2. The low proportion of households that
actually meet the 25 ℓ per capita per day minimum is consistent with the findings from
another survey conducted in the north-eastern parts of the province (Majuru et al., 2012).
Amongst the determinants of increased water use is a higher crowding index. A high
crowding index suggests a lower socio-economic status, but also relates to a high
number of household members, which is known to have a positive association with
water use (Nauges and Whittington, 2010).
Conclusions
Much of the analyses of household coping costs have been aimed at indirectly
estimating willingness to pay for more reliable water supplies. The application of such
information is often in settings where costs recovery or pricing options are under
consideration, where coping costs are used as a lower bound of willingness to pay

Chapter 8: A survey of household responses to unreliable water supplies in Limpopo
169
(Pattanayak et al., 2005). However, the Free Basic Water policy presents a unique
context, in which the goal is to in fact provide a specific allocation of water for free.
The median coping cost in Communities 1 and 2 is about R100 a month, and only 8
households out of the 197 surveyed have Free Basic Water; i.e. spend R0 on coping
costs and use at least 25 ℓ of water per capita per day. This finding raises some critical
questions about the effectiveness of not only household coping strategies, but also the
Free Basic Water policy, in enabling households to meet basic water needs.

170
9 Discussion and conclusions

Chapter 9: Discussion and conclusions
171
9.1 Overview
Access to adequate quantities of safe and reliable water supplies is essential to the
attainment and maintenance of good health. Yet, as the Millennium Development Goal
era draws to a close, a sobering reality is that although many developing countries have
made significant progress in extending access to water supply services, these supplies
are unreliable.
The primary objective of this thesis has been to improve understanding on how
households in developing countries experience, perceive and respond to unreliable
water supplies. The thesis draws on a combination of structured literature reviews and
analyses of primary data from a case study in South Africa to address two main
questions: what is a reliable water supply, and how do households respond to unreliable
water supplies. The specific questions that the thesis sought to address are:
What is a reliable household water supply?
How is reliability defined and assessed?
What attributes of water supply reliability do households value?
How do households respond to unreliable water supplies?
What coping strategies do households employ?
What are the costs of coping with unreliable water supplies?
The thesis presents a diverse set of findings concerning improved understanding of
water supply reliability as a concept, and household experiences of unreliable water
supplies. In locating the empirical analyses in peri-urban South Africa, the study is
well-placed explore the implication of unreliable water supplies on the country’s Free
Basic Water policy.
The main findings of the thesis have been summarised within the respective results
chapters: General Results (Chapter 4); Definitions and assessment criteria for water
supply reliability (5); Household preferences for water supply reliability (6); Review of
household coping strategies (Chapter 7) and Coping with unreliable water supplies in
Limpopo (Chapter 8). This chapter synthesises the main findings from these chapters to
answer the two main research questions of the study. These findings are presented at a
broader, international level, drawing from literature reviews; and at a local level, from
the results of the survey in South Africa.

Chapter 9: Discussion and conclusions
172
9.2 Summary of main findings
Chapter 5 and Chapter 6 highlight some important conceptual points relating to the
question as to what is meant by a reliable water supply. The first of these is that water
supply reliability is a concept that encompasses several attributes, as evidenced in
the myriad of assessment approaches that are found in the literature review. Although
‘snapshot’ approaches such as duration of supply each day and functionality at the time
of the assessment have become common, long-term aspects such frequency of
breakdowns in a given time period are as important. Unfortunately, the articulation of
reliability as a multi-attribute concept is neither clear nor consistent in the existing
literature. Consequently, evaluation approaches are largely ad-hoc.
While households would generally prefer water supplies that are reliable, the high value
placed on prior notification of interruptions suggests that they would be tolerant of
water supplies that were frequently interrupted, provided that there is some pattern or
degree of predictability in the interruptions. Presumably, the significance of such
notification lies in enabling households to adapt through appropriate coping strategies
(Hensher et al., 2005). Taken together, the findings from the discrete choice experiment
in Chapter 6 and coping survey in Chapter 8 support the idea that household coping
costs arise mainly from the uncertainty of not knowing when next water will be
supplied (Baisa et al., 2010).
Unsurprisingly, household coping strategies are strongly influenced by socio-
economic status, and of course, the extent of unreliability. In both the review in
Chapter 7 and the survey in Chapter 8, the adoption of particular coping strategies is
shaped by inequalities relating to wealth status, level of education and housing tenure.
However, the combination of ad-hoc evaluation approaches and lack of prioritisation of
health linkages has meant that beyond typologies of coping strategies, related coping
costs and determinants, current understanding of the wider implications of unreliable
water supplies – including health – remains largely anecdotal.
The survey findings in Chapter 8 are therefore important in shedding light on other
issues related to household coping strategic that have received less attention. The first
of these is that environmental conditions account for substantial differences in
coping costs. The stark difference in coping costs between Communities 1 and 2 and
Community 3 highlight environmental conditions as a strong determinant of coping

Chapter 9: Discussion and conclusions
173
costs. Unlike households in Communities 1 and 2 who spend substantial amounts of
money on either drilling wells or buying water, households in Community 3 spend
considerably less in setting up pipe connections from springs to storage tanks, or simply
collect water from the springs at no financial cost.
The second – and the most critical – is that poor reliability negates the Free Basic
Water policy. Coverage data on access to basic water services mask the impact of
unreliable water supplies on households. While in theory, households in the
communities surveyed do not pay for basic water supply services, in reality, substantial
amounts are spent on drilling wells, buying water and on treating the water prior to
consumption.
9.3 Contribution of thesis and significance of findings
This thesis has sought to contribute to improved understanding of water supply
reliability in developing countries and households’ coping strategies. From a policy
perspective, both international and local definitions and assessment approaches are
important in priority setting (Evans et al., 2013). An important contribution of this
thesis is the presentation of the concept of water supply reliability, both in terms of
assessment approaches in literature and households’ preferences.
At the time of writing, South Africa’s water policies, including the Free Basic Water
policy are under review (Department of Water Affairs, 2013). Although exploratory in
nature, the findings from the survey offer timely and equally sobering insights into the
realisation of the Free Basic Water policy on the ground. To date, studies of the Free
Basic Water policy have mainly been centred around low income urban households and
the adequacy of the 25 ℓ per capita day / 6,000 ℓ per household per month allocation,
and the steep tariff structure for water use beyond the 6,000 ℓ (Bond and Dugard, 2008,
Mosdell and Leatt, 2005, Smith and Green, 2005, Smith, 2010).
The basis for these existing approaches is that households are actually receiving the free
basic allocation of water, but it is inadequate, and that tariff structure prohibits
consumption beyond this basic allocation. The survey findings on water use and coping
costs are therefore crucial in highlighting that not only are peri-urban / rural unable to
even meet the minimum water allocation of 25 ℓcd, but are also essentially paying for
the little water that they can get.

Chapter 9: Discussion and conclusions
174
9.4 Limitations
There are some caveats to be noted in this study. The work presented herein relates
primarily to operational unreliability of water supplies, and does not extend to
unreliability resulting from seasonal shortages factors or drought. It must be noted
however, that the two may be strongly correlated. The empirical findings in the thesis
are based on data from peri-urban communities in the northern parts of South Africa.
Given the differences in socio-economic conditions and the quality of the water supply
services, these findings may not be readily generalised to more urban settings.
Preferences and willingness to pay for reliability of water supply in particular, differ
depending on the existing quality of water service provision and households’ socio-
economic status (Soto Montes de Oca and Bateman, 2006). There are however, broad
similarities between patterns of water use and the reliability of the water supply between
the communities studied herein and those previously studied in other parts of the
province (Majuru et al., 2012, Majuru et al., 2011). This suggests that the findings in
this thesis may have wider resonance with these communities.
A second limitation to the survey is the use of a cross-sectional design. Although the
study was conducted over a time period that covered two seasons (late spring to mid-
summer), this was not sufficient to compare seasonal variations in water use and coping
behaviour, which would likely have significant implications on the coping costs and
diarrhoeal incidence. It is also important to note that this study examined household
experiences of unreliable water supplies based primarily on reported data on service
quality, coping costs and diarrhoeal illness. As with most self-reported studies, the
results must be considered alongside the possibility of upward or downward bias.
A major limitation with regard to the reviews on assessment of reliability and coping
strategies relates to the nature of the literature on water supply reliability. With the
various terminology used, it is possible that not all studies that meet the inclusion
criteria may have been identified. This partly emanates from the fact that the
terminology around water supply reliability varies greatly. To identify all potentially
relevant studies would have required the application of all possible terminologies in the
searches, and would have required the screening of tens of thousands of studies.
Further, much of the literature on water supply reliability is based on single-case studies
with no uniformity in reporting across studies. This makes the application of a quality
appraisal tool difficult.

Chapter 9: Discussion and conclusions
175
9.5 Implications for policy and practice
The findings of this thesis have a number of important implications for both policy
makers and practitioners alike. Definitions and approaches to monitoring are of critical
importance in policy, as they can determine how matters are prioritised (Evans et al.,
2013). At the most fundamental level, the need for consensus on assessment of
reliability is apparent. Based on the findings from Chapters 5 and 6, a reasonable
approach could be to adopt a multi-criteria indicator that takes into account both the
long-term and day-to-day reliability of water supplies.
Setting out definitions and assessment criteria does not, on its own, enable water
supplies to be reliable; it must be translated into the appropriate regulatory measures.
Chapter 4 highlights that although South Africa’s water policies set out clear criteria for
the provision of basic water services including reliability, in practice, the scope of
regulation is largely limited to water quality in urban areas. Admittedly, lack of
capacity and monitoring structures and resources contribute greatly to this problem, not
only in South Africa, but in developing countries in general. This implies a need for
renewed focus on strengthening institutional capacities for peri-urban and rural
water service provision.
A second implication is that water supply reliability should gain greater prominence
as a key determinant of health. Beyond institutional limitations, it is evident from the
literature that unlike water quality-health linkages which occupy a defined space in the
water discourse, the main discourses that define reliability problems have been largely
framed within the context of operation and maintenance and cost recovery, with no clear
articulation of the links to health. There is a need for this paradigm to shift to one in
which water supply reliability is prioritised as a key component of mainstream health
and economic development policies.
The objective behind seeking household perspectives is to understand household
behaviours, and in turn, what the impact of potential service changes or improvements
might be. It is perhaps all too easy to conclude from the estimates of willingness to pay
(Chapter 7) and coping costs (Chapter 8), that households can afford and should pay
some amount towards their water supply services. However, it is important to note that
coping strategies such as drilling wells represent high capital, long-term investments
which are irreversible, even if water supply services were to improve. Barring dramatic

Chapter 9: Discussion and conclusions
176
and urgent improvements in the reliability of water supply services, it is likely that
households become less willing to accept and pay for public water services (Altaf,
1994).
The analysis of households’ responses to unreliable water supplies in South Africa and
implications on the Free Basic Water policy offers some important lessons in this regard.
By focusing primarily on the quantitative aspect of water service provision (i.e.
extending service), it has meant that the country has managed to achieve almost
universal provision of water supply services, with the poor – for whom the policy was
intended – not deriving maximum benefit from water services. This draws attention to
how poor water services can undermine social policies that would be otherwise
transformative in enhancing livelihoods of the poor. Without reliable water supply
services, the objectives of improving public health and promoting equity cannot be met.
9.6 Further work
It is fairly likely that for the foreseeable future households in developing countries will
continue to be confronted with the challenge of obtaining sufficient quantities of water,
ensuring that such water is safe for consumption, and achieving these two objectives at
a reasonable cost. While the goal of providing universal access to safe and reliable
water supplies remains, strategic action is required in the interim to alleviate the
problems posed by unreliable water supplies. Potential avenues of enquiry and action
are outlined below.
At the time of writing, South Africa’s water policies are under review. Among
the proposed changes is that the Free Basic Water allocation of 6000-ℓ be made
available only to indigent households, while everyone else will be required to pay
(Department of Water Affairs, 2013). This underscores the need for improved
understanding of who the indigent households are, where they are and their needs.
While the finding that socio-economic factors are key determinants of household
coping strategies is unsurprising, it is the wider implication on poverty alleviation
and social equity that should be a primary concern. Parallel to the need for
understanding of poor households is the monitoring that not only takes into
account reliability of water supply, but is also disaggregated to enable focus on
inequalities and effective targeting of the most vulnerable populations.

Chapter 9: Discussion and conclusions
177
The findings in Chapter 8 highlight that apart from socio-economic status,
environmental conditions are important mediating factors in how households cope
with unreliable water supplies. As a priority, attention should be given to
circumstances where low socio-economic status and unavailability of alternative
water sources intersect.
There is therefore an urgent need to develop a sound decision base for coping
strategies that can be promoted that promote good health, while being
environmentally sustainable and applicable at scale.
Analyses of water supply reliability have largely focused at the household level.
A more holistic understanding of the impacts of unreliable water supplies can be
facilitated by research conducted in other spheres of activity. How, for instance,
do schools, workplaces and healthcare facilities cope with unreliable water
supplies, and what are the health, social and economic implications within those
spheres?
The high value that households place on prior notification of interruptions
warrants further examination of what the implications are for situations in which
fully reliable water supplies are not a feasible option. How do health, social and
economic outcomes in these situations compare to those in which supply
interruptions are random?
There are important ways in which further work may improve upon the design and
scope of the survey in South Africa. The first of these is the replication of the study
with a larger sample, and over a longer period of time; allowing more refined analyses
of health outcomes and to better capture the effects of seasonality. Secondly, with the
review of the Free Basic Water under consideration, it may be valuable to determine
how coping costs of peri-urban households that are supposedly receiving Free Basic
Water compare to (i) the costs of providing reliable public water supplies and (ii) the
bills that are paid by urban households with piped water supplies.

178
References

References
179
ABRAMSON, A., BECKER, N., GARB, Y. & LAZAROVITCH, N. 2011. Willingness to pay,
borrow, and work for rural water service improvements in developing countries. Water
Resources Research, 47, W11512.
ADERIBIGBE, S., AWOYEMI, A. & OSAGBEMI, G. 2008. Availability, adequacy and
quality of water supply in Ilorin Metropolis, Nigeria. European Journal of Scientific
Research, 23, 528-536.
ADMASSU, M., KUMIE, A. & FANTAHUN, M. 2003. Sustainability of drinking water supply
projects in rural of North Gondar, Ethiopia Ethiopian Journal of Health Development,
17, 221-229.
AFRICAN NATIONAL CONGRESS 1994. Reconstruction and Development Programme
White Paper. Johannesburg: Umanyano Publications.
AKOSA, G. 1990. Appraisal and evaluation of water supply and sanitation projects: Ghana as
a case study. PhD Thesis, Loughborough University.
ALTAF, M. A. 1994. The economics of household response to inadequate water supplies. Third
World Planning Review, 16, 41.
ANDEY, S. P. & KELKAR, P. S. 2009. Influence of intermittent and continuous modes of
water supply on domestic water consumption. Water Resources Management, 23, 2555-
2566.
ARNOLD, M., TAYLOR, B., BENSON, S., ALLEN, S., JOHNSON, M., KIEFER, J.,
BOAKYE, I., ARHINN, B. & ANSONG, D. 2013a. Drinking water quality and source
reliability in rural Ashanti region, Ghana. Journal of Water and Health, 11, 161-172.
ARNOLD, M., VANDERSLICE, J. A., TAYLOR, B., BENSON, S., ALLEN, S., JOHNSON,
M., KIEFER, J., BOAKYE, I., ARHINN, B., CROOKSTON, B. T. & ANSONG, D.
2013b. Drinking water quality and source reliability in rural Ashanti region, Ghana.
Journal of Water and Health, 11, 161-172.
ASIAN DEVELOPMENT BANK 2007. Data book of south-east Asian water utilities 2005.
The Southeast Asian Water Utilities Network and Asian Development Bank.
ASIAN DEVELOPMENT BANK, A. 2009. Impact of rural water supply and sanitation in
Punjab, Pakistan. Independent Evaluation Department.
AYOUB, G. M. & MALAEB, L. 2006. Impact of intermittent water supply on water quality in
Lebanon. International Journal of Environment and Pollution, 26, 379-397.
BAISA, B., DAVIS, L. W., SALANT, S. W. & WILCOX, W. 2010. The welfare costs of
unreliable water service. Journal of Development Economics, 92, 1-12.
BALEN, J., MCMANUS, D. P., LI, Y.-S., ZHAO, Z.-Y., YUAN, L.-P., UTZINGER, J.,
WILLIAMS, G. M., LI, Y., REN, M.-Y., LIU, Z.-C., ZHOU, J. & RASO, G. 2010.
Comparison of two approaches for measuring household wealth via an asset-based
index in rural and peri-urban settings of Hunan province, China. Emerging Themes in
Epidemiology, 7.
BARNES, R. 2009. Planning for sustainable water and sanitation projects in rural, developing
communities. PhD, University of New South Wales.
BOND, P. & DUGARD, J. 2008. The case of Johannesburg water: What really happened at the
pre-paid ‘Parish pump’. Law, Democracy & Development, 12, 1-28.
BOURGOIS, F., DE CAO, P., KONTEH, Y., TRUAN, B. & REDON, P. 2013. Existing water
access points in the districts of Bo, Koinadugu and Tonkolili in Sierra Leone. Survey.
Geneva: Inter Aide and Fondation Pro Victimis.

References
180
BRADLEY, D. J. & BARTRAM, J. K. 2013. Domestic water and sanitation as water security:
monitoring, concepts and strategy. Philosophical Transactions of the Royal Society A:
Mathematical, Physical and Engineering Sciences, 371.
BROWN, J., HIEN, V. T., MCMAHAN, L., JENKINS, M. W., THIE, L., LIANG, K., PRINTY,
E. & SOBSEY, M. D. 2013. Relative benefits of on-plot water supply over other
‘improved’ sources in rural Vietnam. Tropical Medicine & International Health, 18, 65-
74.
CAPRARA, A., LIMA, J. W. D. O., MARINHO, A. C. P., CALVASINA, P. G., LANDIM, L.
P. & SOMMERFELD, J. 2009. Irregular water supply, household usage and dengue: a
bio-social study in the Brazilian Northeast. Cadernos de Saúde Pública, 25, S125-S136.
CENTERS FOR DISEASE CONTROL AND PREVENTION 2012. Epi Info: Version 7.1.0.6.
Atlanta, Georgia (USA): Centers for Disease Control and Prevention (CDC).
CENTERS FOR DISEASE CONTROL AND PREVENTION. 2013. Cost analysis [Online].
Centers for Disease Control and Prevention (CDC). Available:
http://www.cdc.gov/owcd/eet/Cost/4.html#adjustingcosts [Accessed September 3, 2013.
CHAMBERS, K. 2009. Zimbabwe's battle against cholera. The Lancet, 373, 993-994.
CHAMINUKA, L. & NYATSANZA, T. D. 2013. An assessment of water shortages and coping
mechanisms of Harare residents: A case of Msasa Park and Dzivaresekwa Extension.
Journal of Agriculture and Veterinary Science, 4, 21-35.
CHOE, K., VARLEY, R. C. G. & BIJLANI, H. U. 1996. Coping with intermittent water supply:
Problems and prospects. Environmental Health Project. Dehra Dun, Uttar Pradesh,
India: USAID.
CLASEN, T. F. 2012. Millennium Development Goals water target claim exaggerates
achievement. Tropical Medicine and International Health.
COTHREN, P. G. 2013. Understanding rural water supply and access in South Africa. Master
of Natural Resources Dissertation, North Carolina State University.
CUSHING, C. & CUSHING, B. 2007. Conditional logit, IIA, and alternatives for estimating
models of interstate migration. 46th Annual Meeting of the Southern Regional Science
Association. Charleston, South Carolina.
DAVIS, J., LUKACS, H., JEULAND, M., ALVESTEGUI, A., SOTO, B., LIZÁRRAGA, G.,
BAKALIAN, A. & WAKEMAN, W. 2008. Sustaining the benefits of rural water
supply investments: Experience from Cochabamba and Chuquisaca, Bolivia. Water
Resources Research, 44.
DEPARTMENT OF WATER AFFAIRS 2000. Water supply service levels. A guide for local
authorities. Pretoria: Department of Water Affairs (DWA).
DEPARTMENT OF WATER AFFAIRS 2003. Strategic framework for water services. Water is
life, sanitation is dignity. Pretoria: DWA.
DEPARTMENT OF WATER AFFAIRS 2007. Free Basic Water Implementation Strategy 2007:
Consolidating and maintaining. Pretoria: Department of Water Affairs.
DEPARTMENT OF WATER AFFAIRS 2010a. Annual report of the Department of Water
Affairs 2009/2010. Pretoria: Department of Water Affairs.
DEPARTMENT OF WATER AFFAIRS 2010b. National Water Services Infrastructure Asset
Management (IAM) Strategy. In: DEPARTMENT OF WATER AFFAIRS SOUTH
AFRICA (ed.). Pretoria.
DEPARTMENT OF WATER AFFAIRS 2010c. National Water Services Regulation Strategy:
Protecting the Interests of the Consumer and Public Through the Effective Regulation
of Water Supply and Sanitation Services, Department of Water Affairs South Africa.

References
181
DEPARTMENT OF WATER AFFAIRS 2011. Vhembe District Municipality Water Services
Authority: Status quo booklet. Water Services Councillor Awareness Programme 2011.
DEPARTMENT OF WATER AFFAIRS 2013. National water policy review: Water policy
positions. In: DEPARTMENT OF WATER AFFAIRS (ed.). Pretoria: Department of
Water Affairs,.
DEPARTMENT OF WATER AFFAIRS AND FORESTRY 2002. The development of
sanitation policy and practice in South Africa. African Sanitation and Hygiene
Conference. Johannesburg, South Africa.
DEVI, A. & BOSTOEN, K. 2009. Extending the critical aspects of the water access indicator
using East Africa as an example. International Journal of Environmental Health
Research, 19, 329-341.
DRUMMOND, M., SCULPER, M., TORRANCE, G., O'BRIEN, B. & STODDART, G. 2005.
Methods for the economic evaluation of health care programmes, New York, Oxford
University Press.
DU TOIT, W. H. 2002. Carbonate encrustation of the groundwater supply infrastructure at
Kutama/Sinthumule in Limpopo Province Polokwane, South Africa Department of
Water Affairs and Forestry, Directorate Water Resource Management, Sub-directorate
Geohydrology.
DUTTA, V. & TIWARI, A. P. 2005. Cost of services and willingness to pay for reliable urban
water supply: A study from Delhi, India. Water Economics, Statistics and Finance, 5,
135-144.
EVANS, B., BARTRAM, J., HUNTER, P., RHODERICK WILLIAMS, A., GEERE, J.,
MAJURU, B., BATES, L., FISHER, M., OVERBO, A. & SCHMIDT, W.-P. 2013.
Public health and social benefits of at-house water supplies. London: UK Department
for International Development (DfID).
FEW, R., AHERN, M., MATTHIES, F. & KOVATS, S. 2004. Floods, health and climate
change: A strategic review. Tyndall Centre for Climate Change Research.
FILMER, D. & PRITCHETT, L. H. 2001. Estimating wealth effects without expenditure data-
or tears: An application to educational enrollments in states of India. Demography, 38,
115-132.
FJELDSTAD, O.-H. 2004. What’s trust got to do with it ? Non-payment of service charges in
local authorities in South Africa. Journal of Modern African Studies, 42, 539-562.
FOGELBERG, K. 2010. Filling the knowledge gap: Monitoring postconstruction water and
sanitation sustainability. Waterlines 29, 220-235.
GERLACH, E. & FRANCEYS, R. 2009. Regulating water services for the poor: The case of
Amman. Geoforum, 40, 431-441.
GLEITSMANN, B. A., KROMA, M. M. & STEENHUIS, T. 2007. Analysis of a rural water
supply project in three communities in Mali: Participation and sustainability. Natural
Resources Forum, 31, 142-150.
GOWLLAND-GUALTIERI, A. 2007. South Africa's water law and policy framework:
Implications for the right to water. Switzerland: International Environmental Law
Research Centre.
GRIFFIN, R. C. & MJELDE, J. W. 2000. Valuing water supply reliability. American Journal of
Agricultural Economics, 82, 414-426.
GRÖNWALL, J., MULENGA, M., AND MCGRANAHAN, G 2010. Groundwater, self-supply
and poor urban dwellers: A review with case studies of Bangalore and Lusaka. London:
International Institute for Environment and Development (IIED).

References
182
GROSH, M. & GLEWWE, P. 2000. Designing household survey questionnaires for developing
countries: Lessons from 15 Years of the Living Standards Measurement Study, The
World Bank.
GULYANI, S., TALUKDAR, D. & KARIUKI, R. M. 2005. Water for the urban poor: Water
markets, household demand, and service preferences in Kenya. Water Supply and
Sanitation Sector Board Discussion Paper Series. World Bank.
HECK, R. H. & THOMAS, S. L. 2009. An introduction to multilevel modeling techniques New
York, Routledge.
HELLEBRANDT, D., SIKOR, T., HOOPER, L. & DAW, T. 2011. Is the use of renewable
natural resources in the developing world more or less sustainable, pro-poor and
profitable under controlled access compared to open access? : School of International
Development, University of East Anglia.
HENSHER, D., SHORE, N. & TRAIN, K. 2005. Households willingness to pay for water
service attributes. Environmental and Resource Economics, 32, 509-531.
HIRSCHMAN, A. O. 1970. Exit, voice, and loyalty: Responses to decline in firms,
organizations, and states Cambridge, MA, Harvard University Press.
HOKO, Z. & HERTLE, J. 2006. An evaluation of the sustainability of a rural water
rehabilitation project in Zimbabwe. Physics and Chemistry of the Earth, Parts A/B/C,
31, 699.
HOLE, A. R. 2007. A comparison of approaches to estimating confidence intervals for
willingness to pay measures. Health Economics, 16, 827-840.
HOWARD, G. 2002. Effective approaches to water supply surveillance in urban areas of
developing countries. PhD Thesis, University of Surrey.
HOWE, C. W., SMITH, M. G., BENNETT, L., BRENDECKE, C. M., FLACK, J. E., HAMM,
R. M., MANN, R., ROZAKLIS, L. & WUNDERLICH, K. 1994. The value of water
supply reliability in urban water systems. Journal of Environmental Economics and
Management, 26, 19-30.
HOWE, L. D., GALOBARDES, B., MATIJASEVICH, A., GORDON, D., JOHNSTON, D.,
ONWUJEKWE, O., PATEL, R., WEBB, E. A., LAWLOR, D. A. & HARGREAVES, J.
R. 2012. Measuring socio-economic position for epidemiological studies in low- and
middle-income countries: a methods of measurement in epidemiology paper.
International Journal of Epidemiology, 41, 871-886.
HUMAN SCIENCES RESEARCH COUNCIL 2010. South African social attitudes, 2nd Report:
Reflections on the age of hope, HSRC Press.
HUMPLICK, F., KUDAT, A. & MADANAT, S. 1993. Modeling household responses to water
supply: A service quality approach. Washington, DC: World Bank.
HUNTER, P. R., MACDONALD, A. M. & CARTER, R. C. 2010. Water supply and health.
PLoS Med, 7, e1000361.
HUNTER, P. R., ZMIROU-NAVIER, D. & HARTEMANN, P. 2009. Estimating the impact on
health of poor reliability of drinking water interventions in developing countries.
Science of The Total Environment, 407, 2621.
IAQUINTA, DAVID L. & DRESCHER, AXEL W. 2000. Defining the peri-urban: Rural-urban
linkages and institutional connections. Land Reform, Land Settlement and Cooperatives.
Food and Agriculture Organization.
IBNET. 2011. The International Benchmarking Network for Water and Sanitation Utilities
[online database] [Online]. World Bank. Available: http://www.ib-net.org/en/
[Accessed August 1, 2013.

References
183
INTERNATIONAL WATER MANAGEMENT INSTITUTE 2006. Taking a multiple-use
approach to meeting the water needs of poor communities brings multiple benefits.
Water Policy Briefing: Putting research knowledge into action. The Hague, The
Netherlands.
JAMAL, S. & RAHMAN, S. 2012. Adopted Community Strategies to Offset Utility Crises in a
Middle Income Locality of Dhaka, Bangladesh. Developing Country Studies, 2, 12-21.
JIMÉNEZ, A. & PÉREZ-FOGUET, A. 2011. The relationship between technology and
functionality of rural water points: evidence from Tanzania. Water Science and
Technology, 63, 948--955.
JONES, K., VAN DEN BERG, C., JONSON, F. R., CAROL MANSFIELD, PATTANAYAK,
S. K. & YANG, J.-C. 2006. Unpackaging demand for water service quality : Evidence
from conjoint surveys in Sri Lanka. Policy Research. World Bank
KANYOKA, P., FAROLFI, S. & MORARDET, S. 2008. Households' preferences and
willingness to pay for multiple use water services in rural areas of South Africa: an
analysis based on choice modelling. Water SA, 34, 715-723.
KATUWAL, H. & BOHARA, A. K. 2011. Coping with poor water supplies: Empirical
evidence from Kathmandu, Nepal. Journal of Water and Health, 9, 143.
KAYSER, G. L., MORIARTY, P., FONSECA, C. & BARTRAM, J. 2013. Domestic water
service delivery indicators and frameworks for monitoring, evaluation, policy and
planning: A review. International Journal Environmental Research and Public Health,
10, 4812-4835.
KLASEN, S., LECHTENFELD, T., MEIER, K. & RIECKMANN, J. 2012. Benefits trickling
away: the health impact of extending access to piped water and sanitation in urban
Yemen. Journal of Development Effectiveness, 4, 537-565.
KLEEMEIER, E. 2000. The impact of participation on sustainability: An analysis of the Malawi
Rural Piped Scheme Program. World Development, 28, 929-944.
KLEEMEIER, E. L. 2010. Private operators and rural water supplies: A desk review of
experience. Water Papers. World Bank.
KOESTLER, L., KOESTLER, A. G., KOESTLER, M. A. & KOESTLER, V. J. 2010.
Improving sustainability using incentives for operation and maintenance: The concept
of water-person-years. Waterlines, 29, 147-162.
KOSS, P. & KHAWAJA, M. S. 2001. The value of water supply reliability in California: A
contingent valuation study. Water Policy, 3, 165-174.
KUDAT, A., ALIKRAM, A. & MUSAYEV, A. 1997. A social assessment of the Baku Water
Supply Project. In: CERNEA, M. M. & KUDAT, A. (eds.) Social assessments for
better development: Case studies in Russia and Central Asia. Washington, DC: World
Bank.
KUDAT, A., BELL, M. E., BOLAND, J. J., HUMPLICK, F., MADANAT, S. & MUKHERJEE,
N. I. 1993. Reliability of urban water supply in developing countries: The emperor has
no clothes. Working Paper. The World Bank.
KUHFELD, W. F. 2005. Marketing research methods in SAS: Experimental design, choice,
conjoint, and graphical techniques. In: SAS (ed.). Cary, NC, USA: SAS Institute Inc.
KUMPEL, E. & NELSON, K. L. 2013. Comparing microbial water quality in an intermittent
and continuous piped water supply. Water Research, 47, 5176-5188.
LECHTENFELD, T. 2012. Why does piped water not reduce diarrhea for children? Evidence
from urban Yemen. Courant Research Centre PEG.

References
184
LEE, K. S. & ANAS, A. 1992. Impacts of infrastructure deficiencies on Nigerian manufacturing:
Private alternatives and policy options. Infrastructure and urban development report.
Washington, DC: World Bank.
LOCKWOOD, H., BAKALIAN, A. & WAKEMAN, W. Assessing sustainability in rural water
supply: The role of follow-up support to communities. Literature review and desk
review of rural water supply and sanitation project documents. World Bank.
MACDONALD, D. H., BARNES, M., BENNETT, J., MORRISON, M. & YOUNG, M. D.
2003. What consumers value regarding water supply disruptions: A discrete choice
analysis. Australian Meeting of the Econometric Society. Sydney, New South Wales.
MACKAY, H., ROGERS, K. & ROUX, D. 2004. Implementing the South African water policy:
Holding the vision while exploring an uncharted mountain. Water SA, 29, 353-358.
MADANAT, S. & HUMPLICK, F. 1993. A model of household choice of water supply systems
in developing countries. Water Resources Research, 29, 1353-1358.
MAJURU, B., JAGALS, P. & HUNTER, P. R. 2012. Assessing rural small community water
supply in Limpopo, South Africa: Water service benchmarks and reliability. Science of
the Total Environment, 435-436, 479-486.
MAJURU, B., MOKOENA, M. M., JAGALS, P. & HUNTER, P. R. 2011. Health impact of
small-community water supply reliability. International Journal of Hygiene and
Environmental Health, 214, 162-166.
MAJURU, B., SUHRCKE, M. & HUNTER, P. R. 2013. How do households in developing
countries cope with unreliable water supplies? (Draft manuscript). University of East
Anglia.
MAKHADO MUNICIPALITY 2012. Makhado Municipality Integrated Development Plan
2012/13 -2016/17 Makhado: Makhado Municipality.
MAKHADO MUNICIPALITY Unknown. Makhado Municipality: A comprehensive guide for
investors, developers and tourists. In: MUNICIPALITY, M. (ed.). Makhado, South
Africa.
MANGHAM, L. J., HANSON, K. & MCPAKE, B. 2009. How to do (or not to do) …
Designing a discrete choice experiment for application in a low-income country. Health
Policy and Planning, 24, 151-158.
MANGIZVO, R. V. & KAPUNGU, N. 2010. Urban domestic water crisis in Zimbabwe: The
case of Kadoma City. Journal of Sustainable Development in Africa, 12, 254-263.
MANZUNGU, E., MANGWANYA, L. & DZINGIRAI, V. 2012. Can collective action lead to
sustainable outcomes in the provision and management of domestic water in
Zimbabwean urban areas? Journal of Sustainable Development, 5, 65-75.
MCFADDEN, D. 1973. Conditionial logit analvsis of qualitative choice behavior. In:
ZAREMBKA, P. (ed.) Frontiers in Econometrics. New York: Wiley.
MICROSOFT 2010. Microsoft Excel Redmond, Washington: Microsoft.
MOON, S. 2006. Private operation in the rural water supply in central Tanzania: Quick fixes
and slow transitions. WaterAid Tanzania.
MOORE, J., STINSON, L. & WELNIAK, J. E. 2000. Income measurement error in surveys: A
review. Journal of Official Statistics, 16, 331-361.
MOSDELL, T. & LEATT, A. 2005. On tap: A review of the Free Basic Water policy. In:
LEATT, A. & ROSA, S. (eds.) Towards a means to live: Targeting poverty alleviation
to make children’s rights real. Cape Town: Children’s Institute, University of Cape
Town.

References
185
MOVIK, S. 2011. Allocation discourses: South African water rights reform. Water Policy, 13,
161–177.
MUSONDA, K. 2004. Issues regarding the sustainability of rural water supply in Zambia.
Master of Arts Dissertation, University of South Africa.
MYCOO, M. 1996. Water provision improvements: A case study of Trinidad. Willingness to
pay, pricing policy, cost reduction and institutional strengthening. PhD Thesis, McGill
University.
NAM, P. K. & SON, T. V. H. 2005. Household demand for improved water services in Ho Chi
Minh City: A comparison of contingent valuation and choice modelling estimates.
Research report No. 2005-RR3. Economy and Environment Program for South East
Asia.
NATIONAL AGRICULTURAL MARKETING COUNCIL & DEPARTMENT OF
AGRICULTURE FORESTRY AND FISHERIES 2012. South African Food Cost
Review 2012. Pretoria: The National Agricultural Marketing Council and Department
of Agriculture, Forestry and Fisheries.
NAUGES, C. & WHITTINGTON, D. 2010. Estimation of water demand in developing
countries: An overview. The World Bank Research Observer, 25, 263-294.
NGWENYA, B. & KGATHI, D. 2006. HIV/AIDS and access to water: A case study of home-
based care in Ngamiland, Botswana. Physics and Chemistry of the Earth, Parts A/B/C,
31, 669-680.
NORWEGIAN AGENCY FOR DEVELOPMENT COOPERATION 2008. Fiction, facts &
future: NORAD’s assistance to water supply and sanitation development in Tanzania
and Kenya during the 70s, 80s and 90s. Oslo: Norwegian Agency for Development
Cooperation (NORAD).
O'HARA, S., HANNAN, T. & GENINA, M. 2008. Assessing access to safe water and
monitoring progress on MDG7 target 10 (access to safe water and basic sanitation):
Lessons from Kazakhstan. Water Policy, 10, 1-24.
OLSSON, B. & KARLSSON, J. 2010. Women’s access to safe water - In times of change and
uncertainty. A case study from Mangapwani in Zanzibar, Tanzania. BSc Bachelor
Thesis, University of Gothenburg.
OLUWASANYA, G. O. 2009. Better safe than sorry: Towards appropriate water safety plans
for urban self supply systems. PhD thesis, Cranfield University.
OLUWASANYA, G. O., SMITH, J. & CARTER, R. 2011. Self supply systems: Urban dug
wells in Abeokuta, Nigeria. Water Science and Technology: Water Supply, 11, 172-178.
ONDA, K., LOBUGLIO, J. & BARTRAM, J. 2012. Global access to safe water: Accounting
for water quality and the resulting impact on MDG progress. International Journal of
Environmental Research and Public Health, 9, 880-894.
OPRYSZKO, M. C., HUANG, H., SODERLUND, K. & SCHWAB, K. J. 2009. Data gaps in
evidence-based research on small water enterprises in developing countries. Journal of
Water and Health, 07, 609.
PAN AMERICAN HEALTH ORGANIZATION 2001. Regional report on the Evaluation 2000
in the region of the Americas: Water supply and sanitation, current status and prospects.
In: SOARES, L. C. R. (ed.). Washington D.C.: PAHO.
PATTANAYAK, S. K., YANG, J.-C., WHITTINGTON, D. & KUMAR, K. C. B. 2005.
Coping with unreliable public water supplies: Averting expenditures by households in
Kathmandu, Nepal. Water Resources Research, 41.

References
186
PORTER, G., HAMPSHIRE, K., DUNN, C., HALL, R., LEVESLEY, M., BURTON, K.,
ROBSON, S., ABANE, A., BLELL, M. & PANTHER, J. 2013. Health impacts of
pedestrian head-loading: A review of the evidence with particular reference to women
and children in sub-Saharan Africa. Social Science & Medicine, 88, 90-97.
PORTNEY, L. G. & WATKINS, M. P. 2000. Multivariate analysis. Foundations of clinical
research: Applications to practice. New Jersey: Prentice-Hall, Inc.
POTTER, R. B. & DARMAME, K. 2010. Contemporary social variations in household water
use, management strategies and awareness under conditions of ‘water stress’: The case
of Greater Amman, Jordan. Habitat International, 34, 115-124.
REPUBLIC OF SOUTH AFRICA 1994. Water supply and sanitation policy White Paper:
Water - an indivisible national asset. In: DEPARTMENT OF WATER AFFAIRS AND
FORESTRY (ed.). Cape Town
REPUBLIC OF SOUTH AFRICA 1996. Constitution of the Republic of South Africa. Act No.
108 of 1996. South Africa: 27(1)(b).
REPUBLIC OF SOUTH AFRICA 1997. Water Services Act. Act No. 108 of 1997. South Africa.
REPUBLIC OF SOUTH AFRICA 1998a. Municipal Structures Act. Act No. 117 of 1998. South
Africa.
REPUBLIC OF SOUTH AFRICA 1998b. National Water Act. Act No. 36 of 1998. South Africa.
REPUBLIC OF SOUTH AFRICA 2000. Municipal Systems Act. Act No. 32 of 2000. South
Africa.
RISEBRO, H., BRETON, L., AIRD, H., HOOPER, A. & HUNTER, P. R. 2012. Risk of
infectious intestinal disease in consumers drinking from private water supplies: A
prospective cohort study. PLOS One 7, e42762.
ROSENBERG, D. E., TALOZI, S. & LUND, J. R. 2008. Intermittent water supplies:
Challenges and opportunities for residential water users in Jordan. Water International,
33, 488-504.
RUBIN, D. B. 1987. Multiple imputation for non-response in surveys, Hoboken, New Jersey,
John Wiley & Sons, Inc.
RURAL WATER SUPPLY NETWORK 2009. Handpump data: Selected countries in sub-
Saharan Africa. In: HARVEY, P. (ed.) Sustainable rural water supplies.
RUTSTEIN, S. O. & JOHNSON, K. 2004. The DHS Wealth Index. DHS Comparative Reports
No. 6. Calverton, Maryland: ORC Macro.
RYAN, M., GERARD, K., WATSON, V., STREET, D. J. & BURGESS, L. 2008. Practical
issues in conducting a discrete choice experiment. In: RYAN, M., GERARD, K. &
AMAYA-AMAYA, M. (eds.) Using discrete choice experiments to value health and
health care. Springer Netherlands.
SAS INSTITUTE INC 2010. SAS 9.3. Cary, NC: SAS Institute Inc.
SCHWEITZER, R. W. 2009. Community managed rural water supply systems in the
Dominican Republic: Assessment of sustainability of systems built by the National
Institute of Potable Water and Peace Corps, Dominican Republic. Master of Science in
Environmental Engineering, Michigan Technological University.
SEDGWICK, P. 2013. Snowball sampling. BMJ, 347.
SHAH, A. S. 2003. The value of improvements in water supply reliability in Zanzibar Town.
Masters in Environmental Management Dissertation, Yale University.
References
187
SMITH, J. 2009. Social policy, welfare in urban services in South Africa. A case study of free
basic water, indigency and citizenship in Eastwood, Pietermaritzburg, KwaZulu-Natal
(2005-2007). PhD Thesis, Rhodes University.
SMITH, J. A. 2010. How much water is enough? Domestic metered water consumption and free
basic water volumes: The case of Eastwood, Pietermaritzburg. Water SA, 36, 595-606.
SMITH, J. A. & GREEN, J. M. 2005. Free basic water in Msunduzi, KwaZulu-Natal: Is it
making a difference to the lives of low-income households? Water Policy 7, 443-467.
SMITS, S., VAN KOPPEN, B., MORIARTY, P. & BUTTERWORTH, J. 2010. Multiple-use
services as an alternative to rural water supply services: A characterisation of the
approach. Water Alternatives, 3, 102-121.
SÖDERQVIST, T. & SOUTUKORVA, Å. 2009. On how to assess the quality of environmental
valuation studies. Journal of Forest Economics, 15, 15-36.
SOTO MONTES DE OCA, G. & BATEMAN, I. J. 2006. Scope sensitivity in households'
willingness to pay for maintained and improved water supplies in a developing world
urban area: Investigating the influence of baseline supply quality and income
distribution upon stated preferences in Mexico City. Water Resources Research, 42,
W07421.
SOUTH AFRICAN RESERVE BANK. 2013. Important rates [Online]. Available:
http://www.resbank.co.za/Pages/default.aspx [Accessed Sept 5, 2013].
SOUTH AFRICAN RESERVE BANK 2014. Gold and foreign exchange position (time series).
South African Reserve Bank.
SPSS INC. 2009. PASW Statistics for Windows, Version 18.0. Chicago: SPSS Inc.
STATA CORP 2011. Stata: Release 12.1 Statistical Software. College Station, Texas: StataCorp
LP.
STATISTICS SOUTH AFRICA 2011. Water and sanitation 2002-2010. In-depth analysis of the
General Household Survey data. GHS Series. Pretoria: Statistics South Africa.
STATISTICS SOUTH AFRICA 2012a. Census 2011 Municipal report – Limpopo. Pretoria:
Statistics South Africa.
STATISTICS SOUTH AFRICA 2012b. Census 2011: Statistical release - P0301.4. Pretoria:
Statistics South Africa.
STATISTICS SOUTH AFRICA 2012c. Gender statistics in South Africa, 2011. Pretoria, South
Africa: Statistics South Africa.
STATISTICS SOUTH AFRICA 2012d. Income and expenditure of households, 2010/2011.
Pretoria Statistics South Africa,.
STATISTICS SOUTH AFRICA 2012e. Levels and trends of morbidity and mortality among
children aged under-five years in South Africa, 2006–2010 Pretoria: Statistics South
Africa.
STATISTICS SOUTH AFRICA 2013a. Mid-year population estimates 2013: Statistical release
P0302. Pretoria: Statistics South Africa.
STATISTICS SOUTH AFRICA 2013b. General household survey 2012. Pretoria: Statistics
South Africa.
STOLER, J., FINK, G., WEEKS, J. R., OTOO, R. A., AMPOFO, J. A. & HILL, A. G. 2012.
When urban taps run dry: Sachet water consumption and health effects in low income
neighborhoods of Accra, Ghana. Health & Place, 18, 250-262.

References
188
SUBBARAMAN, R., SHITOLE, S., SHITOLE, T., SAWANT, K., O’BRIEN, J., BLOOM, D.
E. & PATIL-DESHMUKH, A. 2013. The social ecology of water in a Mumbai slum:
failures in water quality, quantity, and reliability. BMC Public Health, 13, 173.
SWART, M. 2013. Water service regulation in South Africa. SNOWS Early career scientists
working in Africa Water and Sanitation Conference. Protea Hotel Ranch Resort,
Polokwane, South Africa.
SWEDISH ENVIRONMENTAL PROTECTION AGENCY 2006. An instrument for assessing
the quality of environmental valuation studies. Stockholm: Swedish Environmental
Protection Agency.
SZABO, A. 2009. The value of free water: Analyzing South Africa's Free Basic Water policy.
University of Houston.
TARMANN, A. 2000. South Africa's water policy champions rights of people and ecosystems.
Population Today, 28, 1-2.
TAVAKOL, M. & DENNICK, R. 2011. Making sense of Cronbach's alpha. International
Journal of Medical Education, 2, 53-55.
THE SWEDISH ENVIRONMENTAL PROTECTION AGENCY 2006. An instrument for
assessing the quality of environmental valuation studies. Bromma: Naturvårdsverket.
THOMPSON, J., PORRAS, I. T., WOOD, E., TUMWINE, J. K., MUJWAHUZI, M. R.,
KATUI-KATUA, M. & JOHNSTONE, N. 2000. Waiting at the tap: Changes in urban
water use in East Africa over three decades. Environment and Urbanization, 12, 37-52.
TISSINGTON, K., DETTMANN, M., LANGFORD, M., DUGARD, J. & CONTEH, S. 2008.
Water services fault lines: An assessment of South Africa’s water and sanitation
provision across 15 municipalities. Centre for Applied Legal Studies (CALS),
Johannesburg; Centre on Housing Rights and Evictions (COHRE), Geneva and
Norwegian Centre for Human Rights (NCHR), Oslo.
TUROK, I. 2012. Urbanisation and development in South Africa: Economic imperatives,
spatial distortions and strategic responses. Urbanisation and Emerging Population
Issues. London: International Institute for Environment and Development: Human
Settlements Group
UNITED NATIONS CHILDREN’S FUND 2012. The state of the world's children 2012:
Children in urban world. The state of the world's children. New York, NY.: United
Nations Children’s Fund (UNICEF).
UNITED NATIONS DEVELOPMENT PROGRAMME 2013. The rise of the south: Human
progress in a diverse world. 2013 Human Development Report. Washington, DC:
United Nations Development Programme (UNDP).
VAN DER MERWE, H. 2011. Migration patterns in rural schools in South Africa: Moving
away from poor quality education. Education as Change, 15, 107-120.
VAN KOPPEN, B., JHA, N. & MERREY, D. J. 2005. Redressing racial inequities through
water law in South Africa: interaction and contest among legal frameworks.
International Water.(p1) Management Institute, Africa Regional Water Programme.
VÁSQUEZ, W. F. 2012. Reliability perceptions and water storage expenditures: Evidence from
Nicaragua. Water Resources Research, 48, W10547.
VÁSQUEZ, W. F., MOZUMDER, P., HERNÁNDEZ-ARCE, J. & BERRENS, R. P. 2009.
Willingness to pay for safe drinking water: Evidence from Parral, Mexico. Journal of
Environmental Management, 90, 3391-3400.
VIRJEE, K. 2005. The willingness to pay for changes in water, wastewater and electricity
services in Trinidad and Tobago. Regulated Industries Commission.

References
189
VIRJEE, K. & GASKIN, S. 2010. Coping with poor water services and the demand for change
in Trinidad and Tobago. Water International, 35, 285-297.
WAINWRIGHT, N. 1983. The groundwater potential of Sinthumule and Kutama Districts,
Republic of Venda. Johannesburg: Loxton, Venn & Associates (Pty.) Ltd. Natural
Resources Consultants.
WATER AND SANITATION PROGRAM 2011. Water supply and sanitation in South Africa:
Turning finance into services for 2015 and beyond. An AMCOW country status
overview. World Bank.
WHO/UNICEF 2011. Drinking water equity, safety and sustainability: Thematic report on
drinking water 2011. WHO/UNICEF.
WHO/UNICEF 2012. Progress on drinking water and sanitation: 2012 Update Geneva:
WHO/UNICEF Joint Monitoring Programme for water supply and sanitation.
WHO/UNICEF 2013. Progress on drinking water and sanitation: 2013 Update. Geneva:
WHO/UNICEF Joint Monitoring Programme for water supply and sanitation.
WHO/UNICEF 2014. Progress on drinking water and sanitation: 2014 Update. Geneva:
WHO/UNICEF.
WIDIYATI, N. 2011. Willingness to pay to avoid the cost of intermittent water supply: A case
study of Bandung, Indonesia. Master of Science Dissertation, University of Gothenberg.
WORLD BANK - NETHERLANDS WATER PARTNERSHIP 2009. Post-construction support
and sustainability in community-managed rural water supply. Case studies in Peru,
Bolivia and Ghana. In: BAKALIAN, A. & WAKEMAN, W. (eds.) Water Sector Board
Discussion Paper Series Washington DC: World Bank.
WORLD BANK. 2011. Country classifications [Online]. Available:
http://data.worldbank.org/about/country-classifications/country-and-lending-groups
[Accessed August 29 2012].
WORLD HEALTH ORGANISATION. 2014. Diarrhoea [Online]. World Health Organisation.
Available: http://www.who.int/topics/diarrhoea/en/ [Accessed February 6 2014].
WUTICH, A. & RAGSDALE, K. 2008. Water insecurity and emotional distress: Coping with
supply, access, and seasonal variability of water in a Bolivian squatter settlement.
Social Science & Medicine, 67, 2116-2125.
ZÉRAH, M.-H. 1998. How to assess the quality dimension of urban infrastructure: The case of
water supply in Delhi. Cities, 15, 285-290.
ZÉRAH, M.-H. 2000a. Household strategies for coping with unreliable water supplies: The case
of Delhi. Habitat International, 24, 295-307.
ZÉRAH, M.-H. 2002. Water supply and sanitation in Vijayawada: Analysis of households’
situation towards modes and cost of access, consumption and level of satisfaction.
Cerna India, Research Report. Mumbai.

190
Appendix 1.1: Health impact of small-community
water supply reliability

191
Appendix 1.2: Water service benchmarks and
reliability

192
Appendix 3.1: DfID project inception report

193
Appendix 3.2a: Ethics approval from University of
East Anglia

194
Appendix 3.2b: Ethics approval from Tshwane
University of Technology

195
Appendix 4: Imputation procedures

Appendix 4.1: Imputation procedures
196
There are several mechanisms underlying missing data. Data is said to be missing
completely at random (MCAR) if the probability of an observation being missing has no
relationship with the variable itself or any other variable in the analysis (Allison, 2001).
In other words, the missing data is unrelated to the study variables. If the probability of
an observation being missing is related to the values of some other variable i.e. the
missingness can be predicted from other variables in the dataset, the data is missing at
random (MAR). Finally, data may be missing not at random (MNAR), if the
probability that an observation is missing is related to the value of the observation itself;
the missingness depends on unobserved data. Such missing data raises the concern of
drawing invalid inferences from analyses, and essentially threatens the integrity of a
study.
Handling missing data
An easy solution for missing data would be to maximise data collection in the first
instance. However, in reality this is not always possible. Difficulty in recalling
information (such as costs of drilling wells, which may have been done years ago) and
unwillingness to disclose information such as income, are common (Groves et al., 2009).
Allison (2001) outlines a good method for handling missing data as one that:
Minimises bias
Makes maximum use of the available information
Produces good estimates of uncertainty
Based on these criteria, three main options for handling missing data considered were: 1)
dropping variables with too many missing values from the analyses; 2) analysing only
cases that have complete data i.e. dropping the households that had some item non-
responses; or 3) imputing the missing data.
The first option – omitting variables with missing data from analyses – was not viable,
as the variables that did have missing values were those that were key in the analyses.
Given that the proportion of data missing was large, complete case analyses (option 2)
was also not viable, as the size of the sample analysed would have been considerably
reduced, and consequently the statistical power (Baraldi and Enders, 2010). A further
consideration in complete-case analysis was that unless the data were missing
completely at random, results obtained from such analyses would have been biased
(Altman and Bland, 2007).
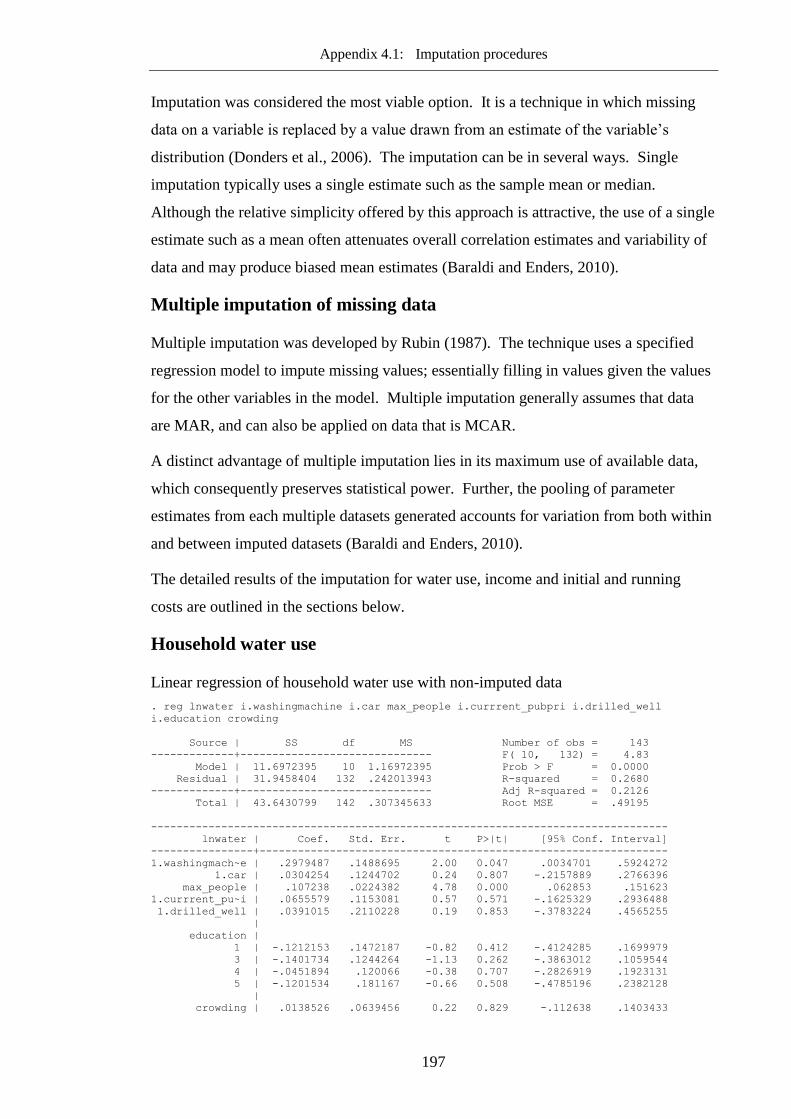
Appendix 4.1: Imputation procedures
197
Imputation was considered the most viable option. It is a technique in which missing
data on a variable is replaced by a value drawn from an estimate of the variable’s
distribution (Donders et al., 2006). The imputation can be in several ways. Single
imputation typically uses a single estimate such as the sample mean or median.
Although the relative simplicity offered by this approach is attractive, the use of a single
estimate such as a mean often attenuates overall correlation estimates and variability of
data and may produce biased mean estimates (Baraldi and Enders, 2010).
Multiple imputation of missing data
Multiple imputation was developed by Rubin (1987). The technique uses a specified
regression model to impute missing values; essentially filling in values given the values
for the other variables in the model. Multiple imputation generally assumes that data
are MAR, and can also be applied on data that is MCAR.
A distinct advantage of multiple imputation lies in its maximum use of available data,
which consequently preserves statistical power. Further, the pooling of parameter
estimates from each multiple datasets generated accounts for variation from both within
and between imputed datasets (Baraldi and Enders, 2010).
The detailed results of the imputation for water use, income and initial and running
costs are outlined in the sections below.
Household water use
Linear regression of household water use with non-imputed data
. reg lnwater i.washingmachine i.car max_people i.currrent_pubpri i.drilled_well
i.education crowding
Source | SS df MS Number of obs = 143
-------------+------------------------------ F( 10, 132) = 4.83
Model | 11.6972395 10 1.16972395 Prob > F = 0.0000
Residual | 31.9458404 132 .242013943 R-squared = 0.2680
-------------+------------------------------ Adj R-squared = 0.2126
Total | 43.6430799 142 .307345633 Root MSE = .49195
---------------------------------------------------------------------------------
lnwater | Coef. Std. Err. t P>|t| [95% Conf. Interval]
----------------+----------------------------------------------------------------
1.washingmach~e | .2979487 .1488695 2.00 0.047 .0034701 .5924272
1.car | .0304254 .1244702 0.24 0.807 -.2157889 .2766396
max_people | .107238 .0224382 4.78 0.000 .062853 .151623
1.currrent_pu~i | .0655579 .1153081 0.57 0.571 -.1625329 .2936488
1.drilled_well | .0391015 .2110228 0.19 0.853 -.3783224 .4565255
|
education |
1 | -.1212153 .1472187 -0.82 0.412 -.4124285 .1699979
3 | -.1401734 .1244264 -1.13 0.262 -.3863012 .1059544
4 | -.0451894 .120066 -0.38 0.707 -.2826919 .1923131
5 | -.1201534 .181167 -0.66 0.508 -.4785196 .2382128
|
crowding | .0138526 .0639456 0.22 0.829 -.112638 .1403433
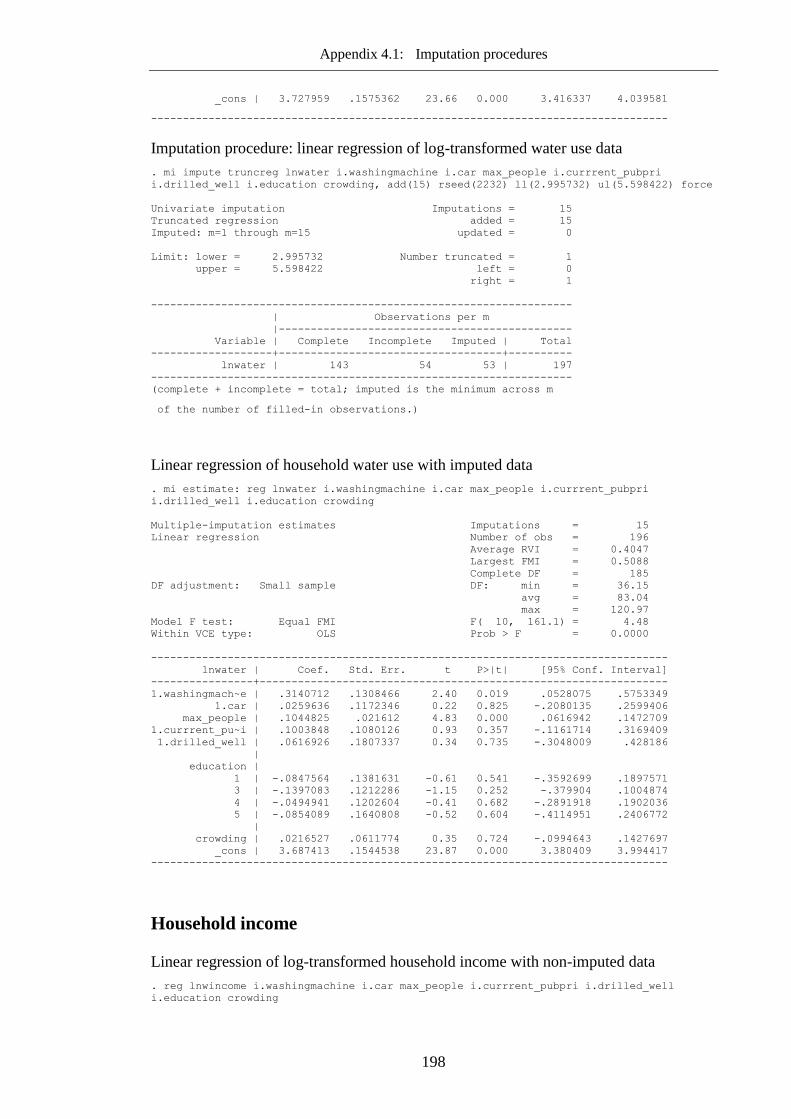
Appendix 4.1: Imputation procedures
198
_cons | 3.727959 .1575362 23.66 0.000 3.416337 4.039581
---------------------------------------------------------------------------------
Imputation procedure: linear regression of log-transformed water use data
. mi impute truncreg lnwater i.washingmachine i.car max_people i.currrent_pubpri
i.drilled_well i.education crowding, add(15) rseed(2232) ll(2.995732) ul(5.598422) force
Univariate imputation Imputations = 15
Truncated regression added = 15
Imputed: m=1 through m=15 updated = 0
Limit: lower = 2.995732 Number truncated = 1
upper = 5.598422 left = 0
right = 1
------------------------------------------------------------------
| Observations per m
|----------------------------------------------
Variable | Complete Incomplete Imputed | Total
-------------------+-----------------------------------+----------
lnwater | 143 54 53 | 197
------------------------------------------------------------------
(complete + incomplete = total; imputed is the minimum across m
of the number of filled-in observations.)
Linear regression of household water use with imputed data
. mi estimate: reg lnwater i.washingmachine i.car max_people i.currrent_pubpri
i.drilled_well i.education crowding
Multiple-imputation estimates Imputations = 15
Linear regression Number of obs = 196
Average RVI = 0.4047
Largest FMI = 0.5088
Complete DF = 185
DF adjustment: Small sample DF: min = 36.15
avg = 83.04
max = 120.97
Model F test: Equal FMI F( 10, 161.1) = 4.48
Within VCE type: OLS Prob > F = 0.0000
---------------------------------------------------------------------------------
lnwater | Coef. Std. Err. t P>|t| [95% Conf. Interval]
----------------+----------------------------------------------------------------
1.washingmach~e | .3140712 .1308466 2.40 0.019 .0528075 .5753349
1.car | .0259636 .1172346 0.22 0.825 -.2080135 .2599406
max_people | .1044825 .021612 4.83 0.000 .0616942 .1472709
1.currrent_pu~i | .1003848 .1080126 0.93 0.357 -.1161714 .3169409
1.drilled_well | .0616926 .1807337 0.34 0.735 -.3048009 .428186
|
education |
1 | -.0847564 .1381631 -0.61 0.541 -.3592699 .1897571
3 | -.1397083 .1212286 -1.15 0.252 -.379904 .1004874
4 | -.0494941 .1202604 -0.41 0.682 -.2891918 .1902036
5 | -.0854089 .1640808 -0.52 0.604 -.4114951 .2406772
|
crowding | .0216527 .0611774 0.35 0.724 -.0994643 .1427697
_cons | 3.687413 .1544538 23.87 0.000 3.380409 3.994417
---------------------------------------------------------------------------------
Household income
Linear regression of log-transformed household income with non-imputed data
. reg lnwincome i.washingmachine i.car max_people i.currrent_pubpri i.drilled_well
i.education crowding
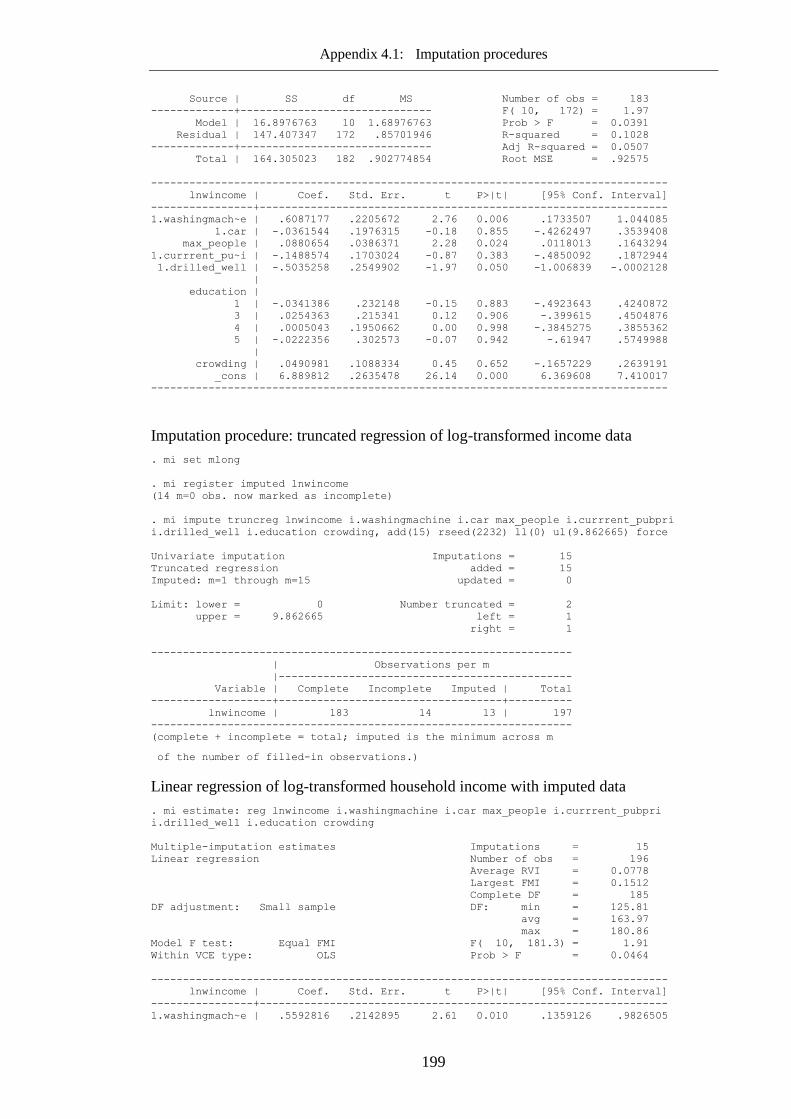
Appendix 4.1: Imputation procedures
199
Source | SS df MS Number of obs = 183
-------------+------------------------------ F( 10, 172) = 1.97
Model | 16.8976763 10 1.68976763 Prob > F = 0.0391
Residual | 147.407347 172 .85701946 R-squared = 0.1028
-------------+------------------------------ Adj R-squared = 0.0507
Total | 164.305023 182 .902774854 Root MSE = .92575
---------------------------------------------------------------------------------
lnwincome | Coef. Std. Err. t P>|t| [95% Conf. Interval]
----------------+----------------------------------------------------------------
1.washingmach~e | .6087177 .2205672 2.76 0.006 .1733507 1.044085
1.car | -.0361544 .1976315 -0.18 0.855 -.4262497 .3539408
max_people | .0880654 .0386371 2.28 0.024 .0118013 .1643294
1.currrent_pu~i | -.1488574 .1703024 -0.87 0.383 -.4850092 .1872944
1.drilled_well | -.5035258 .2549902 -1.97 0.050 -1.006839 -.0002128
|
education |
1 | -.0341386 .232148 -0.15 0.883 -.4923643 .4240872
3 | .0254363 .215341 0.12 0.906 -.399615 .4504876
4 | .0005043 .1950662 0.00 0.998 -.3845275 .3855362
5 | -.0222356 .302573 -0.07 0.942 -.61947 .5749988
|
crowding | .0490981 .1088334 0.45 0.652 -.1657229 .2639191
_cons | 6.889812 .2635478 26.14 0.000 6.369608 7.410017
---------------------------------------------------------------------------------
Imputation procedure: truncated regression of log-transformed income data
. mi set mlong
. mi register imputed lnwincome
(14 m=0 obs. now marked as incomplete)
. mi impute truncreg lnwincome i.washingmachine i.car max_people i.currrent_pubpri
i.drilled_well i.education crowding, add(15) rseed(2232) ll(0) ul(9.862665) force
Univariate imputation Imputations = 15
Truncated regression added = 15
Imputed: m=1 through m=15 updated = 0
Limit: lower = 0 Number truncated = 2
upper = 9.862665 left = 1
right = 1
------------------------------------------------------------------
| Observations per m
|----------------------------------------------
Variable | Complete Incomplete Imputed | Total
-------------------+-----------------------------------+----------
lnwincome | 183 14 13 | 197
------------------------------------------------------------------
(complete + incomplete = total; imputed is the minimum across m
of the number of filled-in observations.)
Linear regression of log-transformed household income with imputed data
. mi estimate: reg lnwincome i.washingmachine i.car max_people i.currrent_pubpri
i.drilled_well i.education crowding
Multiple-imputation estimates Imputations = 15
Linear regression Number of obs = 196
Average RVI = 0.0778
Largest FMI = 0.1512
Complete DF = 185
DF adjustment: Small sample DF: min = 125.81
avg = 163.97
max = 180.86
Model F test: Equal FMI F( 10, 181.3) = 1.91
Within VCE type: OLS Prob > F = 0.0464
---------------------------------------------------------------------------------
lnwincome | Coef. Std. Err. t P>|t| [95% Conf. Interval]
----------------+----------------------------------------------------------------
1.washingmach~e | .5592816 .2142895 2.61 0.010 .1359126 .9826505

Appendix 4.1: Imputation procedures
200
1.car | -.0227053 .1961352 -0.12 0.908 -.4105113 .3651006
max_people | .0871452 .037762 2.31 0.022 .0126321 .1616583
1.currrent_pu~i | -.1469546 .1712856 -0.86 0.392 -.4854948 .1915857
1.drilled_well | -.4651853 .2493881 -1.87 0.064 -.957418 .0270475
|
education |
1 | -.0239977 .2294946 -0.10 0.917 -.4768315 .4288361
3 | .0255133 .2118883 0.12 0.904 -.3927037 .4437303
4 | -.0044317 .1925373 -0.02 0.982 -.3843399 .3754765
5 | -.0288361 .2925948 -0.10 0.922 -.6078813 .550209
|
crowding | .0509024 .1071003 0.48 0.635 -.1604366 .2622415
_cons | 6.889869 .2579092 26.71 0.000 6.38086 7.398877
---------------------------------------------------------------------------------
Initial costs of fixtures
Linear regression model of log-transformed initial costs with non-imputed data
. regress lninitial_cost lnimp_inc i.education i.community_id i.fixtures fac1_1 fac4_1
crowding
note: 10.fixtures omitted because of collinearity
Source | SS df MS Number of obs = 18
-------------+------------------------------ F( 13, 4) = 28.46
Model | 67.3078659 13 5.17752815 Prob > F = 0.0027
Residual | .727814856 4 .181953714 R-squared = 0.9893
-------------+------------------------------ Adj R-squared = 0.9545
Total | 68.0356808 17 4.00209887 Root MSE = .42656
------------------------------------------------------------------------------
lninitial_~t | Coef. Std. Err. t P>|t| [95% Conf. Interval]
-------------+----------------------------------------------------------------
lnimp_inc | -.2126975 .3126255 -0.68 0.534 -1.080685 .65529
|
education |
1 | .7838198 .4968574 1.58 0.190 -.5956775 2.163317
3 | .701825 .8313722 0.84 0.446 -1.606434 3.010084
4 | 1.694776 .4761464 3.56 0.024 .3727819 3.01677
5 | -1.785516 .6639226 -2.69 0.055 -3.628861 .0578285
|
community_id |
1 | -.0617503 .6361631 -0.10 0.927 -1.828022 1.704522
2 | 1.620537 2.002883 0.81 0.464 -3.940358 7.181431
|
fixtures |
4 | -1.01305 .7137026 -1.42 0.229 -2.994606 .9685061
5 | 2.325802 1.055132 2.20 0.092 -.6037149 5.255318
8 | .4944514 .9844939 0.50 0.642 -2.238942 3.227845
10 | 0 (omitted)
|
fac1_1 | 1.983163 .6240054 3.18 0.034 .2506459 3.715679
fac4_1 | -.1991177 .1781051 -1.12 0.326 -.6936168 .2953813
crowding | -.211179 .2198653 -0.96 0.391 -.8216229 .3992649
_cons | 6.019216 2.585538 2.33 0.080 -1.159387 13.19782
------------------------------------------------------------------------------
Imputation procedure: truncated regression of log-transformed initial costs
. mi set mlong
. mi register imputed lninitial_cost
(56 m=0 obs. now marked as incomplete)
. mi impute truncreg lninitial_cost lnimp_inc i.education i.community_id i.fixtures
fac1_1 fac4_1 crowding, add(15) rseed(2232) ll(3.912023) ul(10.4631) force
note: 10.fixtures omitted because of collinearity
Univariate imputation Imputations = 15
Truncated regression added = 15
Imputed: m=1 through m=15 updated = 0

Appendix 4.1: Imputation procedures
201
Limit: lower = 3.912023 Number truncated = 1
upper = 10.4631 left = 0
right = 1
------------------------------------------------------------------
| Observations per m
|----------------------------------------------
Variable | Complete Incomplete Imputed | Total
-------------------+-----------------------------------+----------
lninitial_cost | 18 56 56 | 74
------------------------------------------------------------------
(complete + incomplete = total; imputed is the minimum across m
of the number of filled-in observations.)
Linear regression model of log-transformed initial costs with imputed data
. mi estimate, esampvaryok: reg lninitial_cost lnimp_inc i.education i.community_id
i.fixtures fac1_1 fac4_1 crowding
Multiple-imputation estimates Imputations = 15
Linear regression Number of obs = 73
Average RVI = 2.3223
Largest FMI = 0.9079
Complete DF = 58
DF adjustment: Small sample DF: min = 4.88
avg = 19.02
max = 49.59
Model F test: Equal FMI F( 14, 38.1) = 57.54
Within VCE type: OLS Prob > F = 0.0000
------------------------------------------------------------------------------
lninitial_~t | Coef. Std. Err. t P>|t| [95% Conf. Interval]
-------------+----------------------------------------------------------------
lnimp_inc | -.4178345 .0979366 -4.27 0.008 -.6713895 -.1642796
|
education |
1 | 1.294531 .2200038 5.88 0.000 .8291635 1.759898
3 | 2.268075 .4368552 5.19 0.003 1.171122 3.365028
4 | 1.780565 .1968819 9.04 0.000 1.365889 2.19524
5 | -.7939998 .2672696 -2.97 0.010 -1.368864 -.2191356
|
community_id |
1 | -.4307327 .2432452 -1.77 0.090 -.9338276 .0723622
2 | -.2647642 .7736697 -0.34 0.737 -1.906948 1.37742
|
fixtures |
4 | -1.43222 .4067652 -3.52 0.001 -2.253647 -.6107923
5 | .7984005 .4898291 1.63 0.113 -.1992816 1.796083
6 | .12378 .5181503 0.24 0.812 -.9171671 1.164727
8 | -1.213167 .4333523 -2.80 0.025 -2.224014 -.2023196
10 | 0 (omitted)
|
fac1_1 | .9545215 .2403548 3.97 0.006 .3778756 1.531167
fac4_1 | -.343155 .0567432 -6.05 0.000 -.4590293 -.2272807
crowding | -.3240747 .0964112 -3.36 0.004 -.5302104 -.117939
_cons | 10.45729 1.140379 9.17 0.000 7.788383 13.12621
------------------------------------------------------------------------------
Warning: estimation sample varies across imputations; results may be biased.
Sample sizes vary between 73 and 74.

Appendix 4.1: Imputation procedures
202
Running costs of fixtures
Linear regression model of log-transformed running costs with non-imputed data
regress lnwrun_cost lnimp_inc i.car max_people number_of_tanks i.change_source
reliability_days_per_week i.education i.fixture i.community
note: 8.fixtures omitted because of collinearity
note: 2.community_id omitted because of collinearity
Source | SS df MS Number of obs = 26
-------------+------------------------------ F( 14, 11) = 3.89
Model | 181.009451 14 12.9292465 Prob > F = 0.0146
Residual | 36.5759867 11 3.3250897 R-squared = 0.8319
-------------+------------------------------ Adj R-squared = 0.6180
Total | 217.585438 25 8.70341751 Root MSE = 1.8235
-------------------------------------------------------------------------------------------
lnwrun_cost | Coef. Std. Err. t P>|t| [95% Conf. Interval]
--------------------------+----------------------------------------------------------------
lnimp_inc | -1.255239 .7348881 -1.71 0.116 -2.872716 .3622393
1.car | 3.3379 1.094812 3.05 0.011 .9282354 5.747565
max_people | .7505018 .2530031 2.97 0.013 .1936457 1.307358
number_of_tanks | .7301365 2.891983 0.25 0.805 -5.635075 7.095348
1.change_source | .5975455 1.435236 0.42 0.685 -2.561387 3.756478
reliability_days_per_week | .8231816 .3629249 2.27 0.044 .0243892 1.621974
|
education |
1 | -1.843604 1.397026 -1.32 0.214 -4.918438 1.23123
3 | -8.756502 1.928544 -4.54 0.001 -13.0012 -4.511805
4 | -2.658224 1.546353 -1.72 0.114 -6.061725 .7452768
5 | -2.058064 2.77792 -0.74 0.474 -8.172224 4.056097
|
fixtures |
4 | .4318066 2.269049 0.19 0.853 -4.562336 5.42595
5 | -4.165671 2.897988 -1.44 0.178 -10.5441 2.212758
8 | 0 (omitted)
10 | 1.364387 3.960209 0.34 0.737 -7.351974 10.08075
|
community_id |
1 | 2.138882 1.592203 1.34 0.206 -1.365533 5.643297
2 | 0 (omitted)
|
_cons | 5.283938 5.776214 0.91 0.380 -7.429423 17.9973
-------------------------------------------------------------------------------------------
Imputation procedure: truncated regression of log-transformed running costs
. mi set mlong
. mi register imputed lnwrun_cost
(48 m=0 obs. now marked as incomplete)
. mi impute truncreg lnwrun_cost lnimp_inc i.car max_people number_of_tanks
i.change_source reliability_days_per_week i.education i.fixture i.community, add(15)
rseed(2232) ll(0) ul(8.89563) force
note: 8.fixtures omitted because of collinearity
note: 2.community_id omitted because of collinearity
Univariate imputation Imputations = 15
Truncated regression added = 15
Imputed: m=1 through m=15 updated = 0
Limit: lower = 0 Number truncated = 5
upper = 8.89563 left = 5
right = 0
------------------------------------------------------------------
| Observations per m
|----------------------------------------------
Variable | Complete Incomplete Imputed | Total
-------------------+-----------------------------------+----------
lnwrun_cost | 26 48 48 | 74
------------------------------------------------------------------
(complete + incomplete = total; imputed is the minimum across m of the number of filled-
in observations.)

Appendix 4.1: Imputation procedures
203
Linear regression model of log-transformed running costs with imputed data
mi estimate, esampvaryok: reg lnwrun_cost lnimp_inc i.car max_people number_of_tanks i.change_source
reliability_days_per_week i.edu
> cation i.fixture i.community
Multiple-imputation estimates Imputations = 15
Linear regression Number of obs = 70
Average RVI = 0.4813
Largest FMI = 0.6229
Complete DF = 53
DF adjustment: Small sample DF: min = 13.87
avg = 36.29
max = 49.59
Model F test: Equal FMI F( 16, 47.8) = 10.90
Within VCE type: OLS Prob > F = 0.0000
-------------------------------------------------------------------------------------------
lnwrun_cost | Coef. Std. Err. t P>|t| [95% Conf. Interval]
--------------------------+----------------------------------------------------------------
lnimp_inc | .0090745 .2170253 0.04 0.967 -.4568021 .4749512
1.car | 1.358044 .4429358 3.07 0.004 .4586135 2.257474
max_people | .5346517 .1092444 4.89 0.000 .309981 .7593224
number_of_tanks | 1.403041 1.049349 1.34 0.189 -.7172926 3.523375
1.change_source | .8925055 .5512028 1.62 0.117 -.2380128 2.023024
reliability_days_per_week | .4456877 .1415198 3.15 0.004 .1551124 .7362631
|
education |
1 | -.8652044 .6447433 -1.34 0.187 -2.166071 .4356624
3 | -4.311931 .8669633 -4.97 0.000 -6.097771 -2.526091
4 | -1.461293 .6310662 -2.32 0.026 -2.739052 -.1835349
5 | -1.06437 .9086264 -1.17 0.251 -2.920349 .7916094
|
fixtures |
4 | -.6029637 1.528376 -0.39 0.695 -3.673432 2.467504
5 | -2.369712 1.747998 -1.36 0.182 -5.89217 1.152745
6 | -1.995852 2.288108 -0.87 0.388 -6.604769 2.613065
8 | -1.462433 2.043774 -0.72 0.478 -5.573685 2.648819
10 | -2.143235 1.964598 -1.09 0.281 -6.104734 1.818264
|
community_id |
1 | .5284437 .7929517 0.67 0.508 -1.065054 2.121941
2 | 0 (omitted)
|
_cons | -.3289534 2.344675 -0.14 0.889 -5.08564 4.427733
-------------------------------------------------------------------------------------------
Warning: estimation sample varies across imputations; results may be biased. Sample sizes
vary between 70 and 74.

Appendix 4.1: Imputation procedures
204
References
ALLISON, P. D. 2001. Missing data, Thousand Oaks, CA, Sage.
ALTMAN, D. G. & BLAND, M. J. 2007. Missing data. BMJ, 334, 424-424.
BARALDI, A. N. & ENDERS, C. K. 2010. An introduction to modern missing data
analyses. Journal of School Psychology, 48, 5-37.
DONDERS, A. R. T., VAN DER HEIJDEN, G. J. M. G., STIJNEN, T. & MOONS, K.
G. M. 2006. Review: A gentle introduction to imputation of missing values.
Journal of Clinical Epidemiology, 59, 1087-1091.
GROVES, R. M., FOWLER, F. J., COUPER, M. P., LEPKOWSKI, J. M., SINGER, E.
& TOURANGEAU, R. 2009. Survey methodology, Hoboken, New Jersey, John
Wiley & Sons, Inc
RUBIN, D. B. 1987. Multiple imputation for non-response in surveys, Hoboken, New
Jersey, John Wiley & Sons, Inc.

205
Appendix 6.1: Results of structured search of discrete
choice studies of reliability water supply

Appendix 6.1: Results of structured search of discrete choice studies of reliability of water supply
206
Table A6.1.1: Literature search terms and databases
Database Date of search Type of search Search term Hits Notes
Science Direct 06/04/2013 title, abstract,
key "water supply" OR "domestic water" OR "household water" OR
"drinking water" OR "safe water" AND Conjoint OR "conjoint
analyses" OR "conjoint measurement" OR "conjoint studies" OR
"conjoint choice experiments" OR "part-worth utilities" OR
"functional measurement" OR "pairwise comparisons" OR "pairwise
choices" OR "discrete choice experiments" OR "discrete choice
modelling" OR "discrete choice conjoint experiments" OR "stated
preference"
10 -
Scirus 06/04/2013 title "water supply" OR "domestic water" OR "household water" OR
"drinking water" OR "safe water" AND Conjoint OR "conjoint
analyses" OR "conjoint measurement" OR "conjoint studies" OR
"conjoint choice experiments" OR "part-worth utilities" OR
"functional measurement" OR "pairwise comparisons" OR "pairwise
choices" OR "discrete choice experiments" OR "discrete choice
modelling" OR "discrete choice conjoint experiments" OR "stated
preference"
3 -
keyword As above 20 -
Scopus 06/04/2013 title, abstract,
key "water supply" OR "domestic water" OR "household water" OR
"drinking water" OR "safe water") AND (conjoint OR "conjoint
analyses" OR "conjoint measurement" OR "conjoint studies" OR
"conjoint choice experiments" OR "part-worth utilities" OR
"functional measurement" OR "pairwise comparisons" OR "pairwise
choices" OR "discrete choice experiments" OR "discrete choice
modelling" OR "discrete choice conjoint experiments" OR "stated
preference" OR "choice modelling" OR "choice model"
78 -

Appendix 6.1: Results of structured search of discrete choice studies of reliability of water supply
207
Database Date of search Type of search Search term Hits Notes
Scholar
Search 1
06/04/2013 "water supply" OR "domestic water" OR "household water" OR
"drinking water" OR "safe water" AND Conjoint OR "conjoint
analyses" OR "conjoint measurement" OR "conjoint studies" OR
"conjoint choice experiments"
3,530
Could not search
using the entire
search term as in
other databases
-first 100 results
exported to endnote
Search 2 06/04/2013 "water supply" OR "domestic water" OR "household water" OR
"drinking water" OR "safe water" AND "part-worth utilities" OR
"functional measurement" OR "pairwise comparisons" OR "pairwise
choices" OR "discrete choice experiments"
4,600
-first 40 results
exported to endnote
Search 3 06/04/2013 "water supply" OR "domestic water" OR "household water" OR
"drinking water" OR "safe water" AND "discrete choice modelling"
OR "discrete choice conjoint experiments" OR "stated preference"
OR "choice modelling" OR "choice model"
4,910
-first 100 results
exported to endnote

Appendix 6.1: Results of structured search of discrete choice studies of reliability of water supply
208
Table A6.1.2: Study characteristics
Authors and date Study setting Study
participants Objective of
the study Number of
attributes Number of
choice sets in
fractional
factorial
Number of
choices made
by each
respondent
Administrati
on of
questions
Choice of
attributes
was based on
Haider & Rasid,
(2002) Canada 100
respondents
from 50
randomly
selected
streets
Elicit
preferences
for municipal
water supply
options
3 18 9 Door-to-door
interview of
household
heads
-
Hensher et al.,
(2005) Australia 211 urban
households Establish the
willingness to
pay to avoid
interruptions
in water
service and
overflows of
wastewater
6 - 6 for drinking
water service
and 6 for
waste water
service
Choice
experiments
were mailed
out to
respondents,
who were then
contacted by
phone and
interviewed
about the
choice
experiments
Focus group
discussions

Appendix 6.1: Results of structured search of discrete choice studies of reliability of water supply
209
Authors and date Study setting Study
participants Objective of
the study Number of
attributes Number of
choice sets in
fractional
factorial
Number of
choices made
by each
respondent
Administrati
on of
questions
Choice of
attributes
was based on
Kloos & Tsegai,
(2009) South Africa 475 urban &
rural
households
Detect
households’
preferences
for water
services
5 6 6 Sample was
split into 2
groups;
households
with in-house
/yard
connection,
and those
using shared
supply
Focus group
discussions
Kanyoka et al.,
(2008) South Africa 169 rural
households Assess the
household
demand for
multiple use
water services
in the
Sekororo-
Letsoalo area
6 12 and 9 3 Sample was
split into 2
groups;
households
with in-house
/yard
connection,
and those
using shared
supply
Focus group
discussions

Appendix 6.1: Results of structured search of discrete choice studies of reliability of water supply
210
Authors and date Study setting Study
participants Objective of
the study Number of
attributes Number of
choice sets in
fractional
factorial
Number of
choices made
by each
respondent
Administrati
on of
questions
Choice of
attributes
was based on
Macdonald et al.,
(2005) Australia 337 urban
households Estimate
residential
customers’
willingness to
pay (WTP) for
higher
customer
service
standards
regarding
continuity of
water supply
5 - 6 An
independent
market
research firm
using a drop-
off-pick-up
method
Consultation
with industry
representative
and focus
groups
Snowball et al.,
(2008) South Africa 71 urban
households Elicit
household
willingness to
pay for water
service
improvements
in
Grahamstown
West
6 13 13 ‘Drop off and
collect’
method; 13
choice cards
of which each
questionnaire
contained 3
cards, and
respondents
instructed to
choose their
most preferred
alternative
within each
set
Interviews
with the local
council and
water supply
officials and
the
municipality’s
database of
water
complaints

Appendix 6.1: Results of structured search of discrete choice studies of reliability of water supply
211
Authors and date Study setting Study
participants Objective of
the study Number of
attributes Number of
choice sets in
fractional
factorial
Number of
choices made
by each
respondent
Administrati
on of
questions
Choice of
attributes
was based on
Tarfasa& Brouwer,
(2013) Ethiopia 145 urban
households Assess
household
WTP extra for
improved
water supply
services in an
urban centre
in Ethiopia
3 12 12 In person
interviews Authors
mention that
the experiment
was designed
in
collaboration
with the office
responsible for
maintaining
and operating
the water
system in the
city and
collecting
water fees
from
connected
domestic
households

Appendix 6.1: Results of structured search of discrete choice studies of reliability of water supply
212
Authors and date Study
setting Study
participants Objective of
the study Number
of
attributes
Number of
choice sets
in
fractional
factorial
Number of
choices
made by
each
respondent
Administration of
questions Choice of
attributes was
based on
Yacob et al., (2011) Malaysia 230
households Assess
community
preferences
and values
relating to
water service
improvement
4 5 5 Assess community
preferences and values
relating to alternative
water service
management
Literature,
government annual
reports, brochures,
and expertise
judgments
Yang et al., (2006) Sri
Lanka 1,800
households in
3 coastal
towns
Evaluate the
factors that
drive customer
demand for
alternative
water supply
and sanitation
services in Sri
Lanka
5 27 There were
27 choice
tasks grouped
into 9 blocks;
each
respondent
saw one
block of 3
choice tasks
In person interviews Focus groups,
purposive
interviews and
meetings with
officials
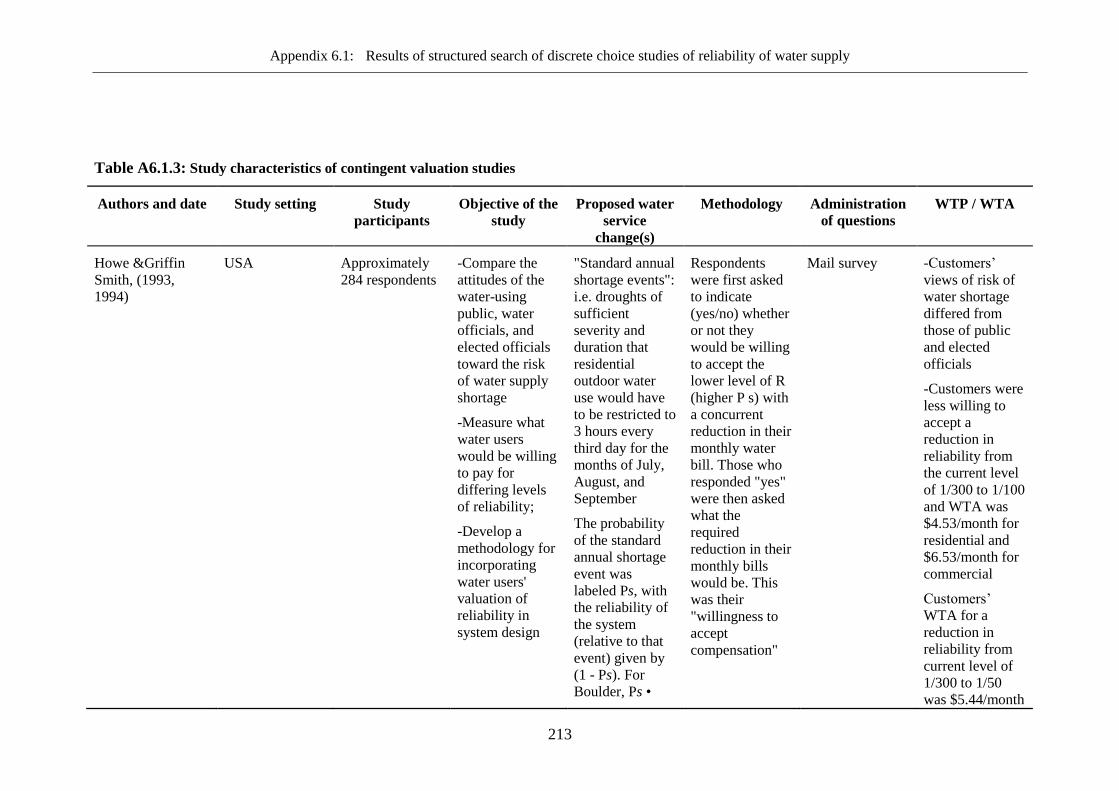
Appendix 6.1: Results of structured search of discrete choice studies of reliability of water supply
213
Table A6.1.3: Study characteristics of contingent valuation studies
Authors and date Study setting Study
participants Objective of the
study Proposed water
service
change(s)
Methodology Administration
of questions WTP / WTA
Howe &Griffin
Smith, (1993,
1994)
USA Approximately
284 respondents -Compare the
attitudes of the
water-using
public, water
officials, and
elected officials
toward the risk
of water supply
shortage
-Measure what
water users
would be willing
to pay for
differing levels
of reliability;
-Develop a
methodology for
incorporating
water users'
valuation of
reliability in
system design
"Standard annual
shortage events":
i.e. droughts of
sufficient
severity and
duration that
residential
outdoor water
use would have
to be restricted to
3 hours every
third day for the
months of July,
August, and
September
The probability
of the standard
annual shortage
event was
labeled Ps, with
the reliability of
the system
(relative to that
event) given by
(1 - Ps). For
Boulder, Ps •
Respondents
were first asked
to indicate
(yes/no) whether
or not they
would be willing
to accept the
lower level of R
(higher P s) with
a concurrent
reduction in their
monthly water
bill. Those who
responded "yes"
were then asked
what the
required
reduction in their
monthly bills
would be. This
was their
"willingness to
accept
compensation"
Mail survey -Customers’
views of risk of
water shortage
differed from
those of public
and elected
officials
-Customers were
less willing to
accept a
reduction in
reliability from
the current level
of 1/300 to 1/100
and WTA was
$4.53/month for
residential and
$6.53/month for
commercial
Customers’
WTA for a
reduction in
reliability from
current level of
1/300 to 1/50
was $5.44/month

Appendix 6.1: Results of structured search of discrete choice studies of reliability of water supply
214
1/300 for residential,
and $8.08 for
commercial
customers
-WTP for an
increase in
reliability from
1/300 to 1/600
was $4.67/month
for residential
customers and
$16.03/month
for commercial
customers
-WTP for
increase in
reliability 1/300
to 1/1000 was
$5.32/month for
residential and
$18.02/month
for commercial
customers

Appendix 6.1: Results of structured search of discrete choice studies of reliability of water supply
215
Authors and date Study setting Study
participants Objective of the
study Proposed water
service
change(s)
Methodology Administration
of questions WTP / WTA
Koss & Khawaja,
(2001) USA 3,769 surveys
across ten water
districts in
California
Estimate
households’
value of water
service reliability
Occurrence of
water shortages
of a given
frequency and
severity i.e.
Shortage/
reduction from
full service of 10
– 20%,
frequencies / of
once every 30,
20, 10, 5 or 3
years
Double-bounded
dichotomous
choice
Combined mail /
telephone survey -WTP varies
from
$11.67/month to
avoid a 10%
shortage once
every 10 years,
to $16.92/month
to avoid a 50%
shortage every
20 years
-Respondents are
willing to pay
more for larger
shortages and for
shortages that
occur with
higher frequency
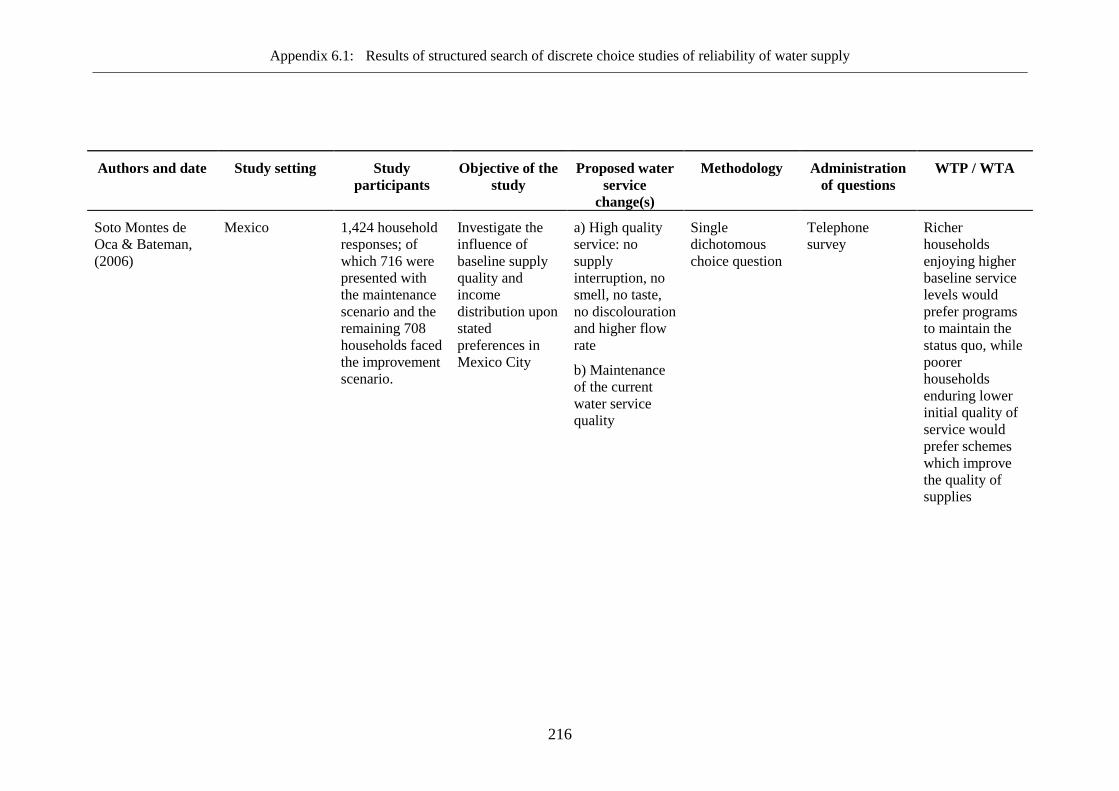
Appendix 6.1: Results of structured search of discrete choice studies of reliability of water supply
216
Authors and date Study setting Study
participants Objective of the
study Proposed water
service
change(s)
Methodology Administration
of questions WTP / WTA
Soto Montes de
Oca & Bateman,
(2006)
Mexico 1,424 household
responses; of
which 716 were
presented with
the maintenance
scenario and the
remaining 708
households faced
the improvement
scenario.
Investigate the
influence of
baseline supply
quality and
income
distribution upon
stated
preferences in
Mexico City
a) High quality
service: no
supply
interruption, no
smell, no taste,
no discolouration
and higher flow
rate
b) Maintenance
of the current
water service
quality
Single
dichotomous
choice question
Telephone
survey Richer
households
enjoying higher
baseline service
levels would
prefer programs
to maintain the
status quo, while
poorer
households
enduring lower
initial quality of
service would
prefer schemes
which improve
the quality of
supplies

Appendix 6.1: Results of structured search of discrete choice studies of reliability of water supply
217
Authors and date Study setting Study
participants Objective of the
study Proposed water
service
change(s)
Methodology Administration
of questions WTP / WTA
Vasquez et al.,
(2009) Mexico 398 households Investigate
households’
willingness to
pay for improved
water services in
the mid-sized
urban area of
Hidalgo del
Parral in
Chihuahua,
Mexico
Reduced water
contamination
(microbes,
bacterium, and
heavy metal) and
either unreliable:
with the time
they have to
access tap water
remaining
approximately
the same, OR
reliable: having
tap water 24
hours per day
every day of the
year.
Referendum In-person
interviews Households have
a median WTP
for safe and
reliable drinking
water at least
45.64% above
their current
water bills.
Validity findings
include
significant scope
sensitivity in
WTP for water
services.
218
Appendix 6.2: Odds ratios of preferences for
reliability of water supply

Appendix 6.2: Odds ratios of preferences for reliability of water supply
219
Table A9.2.1: Water supply preferences for overall sample
Odds ratio Confidence interval
Availability of water supply during the day
9-16 hours a day 1.290***
1.146 - 1.452
More than 16 hours a day 1.461***
1.306 - 1.633
Availability of water supply during the
week
2-4 days a week 1.021 0.912 - 1.144
More than 4 days a week 1.120* 0.997 - 1.259
Time taken to repair breakdowns
3-5 consecutive days 1.060 0.942 - 1.193
More than 5 consecutive days 0.795***
0.710 - 0.889
Number of water supply system breakdowns
per year
5-8 breakdowns 1.386***
1.231 - 1.560
More than 8 breakdowns 1.377***
1.230 - 1.542
Prior notification of water supply
interruptions
Sometimes 1.412***
1.254 - 1.589
Always 1.866***
1.677 - 2.076
Flow rate
Moderate 1.184***
1.046 - 1.339
High 1.127**
1.001 - 1.269
Price 0.975***
0.973 - 0.977
N 9,036
χ2 1407
Likelihood ratio degrees of freedom 13
Note: *p < 0.05,
**p < 0.01,
***p < 0.001

Appendix 6.2: Odds ratios of preferences for reliability of water supply
220
Table A9.2.2: Preferences by type of water supply
Private supply Communal supply
Odds ratio Confidence
interval
Odds ratio Confidence
interval
Availability of water supply
during the day
9-16 hours a day -0.942 0.757 - 1.172 1.497***
1.294 - 1.731
More than 16 hours a day 1.320**
1.068 - 1.631 1.573***
1.373 - 1.801
Availability of water supply
during the week
2-4 days a week 0.801**
0.642 - 0.998 1.057 0.922 - 1.212
More than 4 days a week 0.941 0.752 - 1.176 1.148* 0.994 - 1.325
Time taken to repair
breakdowns
3-5 consecutive days 1.452***
1.164 - 1.811 0.944 0.818 - 1.090
More than 5 consecutive days 1.221* 0.993 - 1.501 0.689
*** 0.600 - 0.790
Number of water supply system
breakdowns per year
5-8 breakdowns 1.368***
1.100 - 1.702 1.429***
1.235 - 1.652
More than 8 breakdowns 1.109 0.892 - 1.379 1.529***
1.336 - 1.750
Prior notification of water
supply interruptions
Sometimes 0.891 0.714 - 1.111 1.762***
1.526 - 2.035
Always 1.090 0.884 - 1.342 2.350***
2.069 - 2.670
Flow rate
Moderate 1.138 0.897 - 1.443 1.176* 1.013 - 1.366
High 0.989 0.786 - 1.244 1.106 0.959 - 1.276
Price 0.970***
0.966 - 0.974 0.976***
0.973 - 0.978
N 2,704 6,332
χ2 366.7 1,177
Likelihood ratio degrees of freedom 13 13
Note: *p < 0.05,
**p < 0.01,
***p < 0.001

Appendix 6.2: Odds ratios of preferences for reliability of water supply
221
Table A9.2.3: Preferences by community cluster
Communities 1 and 2 Community 3
Odds ratio Confidence
interval
Odds ratio Confidence
interval
Availability of water supply
during the day
9-16 hours a day 1.387***
1.163 - 1.653 1.146* 0.975 - 1.348
More than 16 hours a day 1.781***
1.486 - 2.135 1.278**
1.100 - 1.483
Availability of water supply
during the week
2-4 days a week 1.123 0.946 - 1.334 0.871* 0.744 - 1.020
More than 4 days a week 1.626***
1.352 - 1.954 0.864 0.737 - 1.013
Time taken to repair
breakdowns
3-5 consecutive days 1.099 0.912 - 1.324 1.101 0.942 - 1.287
More than 5 consecutive days 0.933 0.782 - 1.114 0.789***
0.681 - 0.915
Number of water supply system
breakdowns per year
5-8 breakdowns 1.273**
1.061 - 1.528 1.428***
1.220 - 1.672
More than 8 breakdowns 1.354**
1.129 - 1.623 1.257***
1.078 - 1.465
Prior notification of water
supply interruptions
Sometimes 1.780***
1.476 - 2.146 1.123 0.960 - 1.314
Always 2.254***
1.903 - 2.669 1.525***
1.322 - 1.759
Flow rate
Moderate 1.349**
1.115 - 1.631 1.115 0.944 - 1.318
High 1.310**
1.083 - 1.584 1.033 0.880 - 1.214
Price 0.971***
0.968 - 0.974 0.979***
0.976 - 0.981
n 4,162 4,874
χ2 1,114 378.5
Likelihood ratio degrees of
freedom 13 13
Note: *p < 0.05,
**p < 0.01,
***p < 0.001

222
Appendix 7.1: General study appraisal tool

Appendix 7.1: General study appraisal tool
223
Table A7.1.1: Assessment criteria and scoring method
Criterion Score as Categories Score
Clarity of research
objective
done’ if objective is clear, specific and addressed by methods and results Done 2
partial' if the above is covered in part only Partial 1
‘not done’ if there are problems with the above Not done 0
Clarity of study
methods
‘done’ if, for each variable of interest, sources of data and details of methods of assessment (measurement) are
described
Done 2
‘partial’ if these methods are described in part only Partial 1
‘not done’ if these methods are not well described Not done 0
Description of
conditions
‘done’ when water supply conditions and unreliability of supply are well described, and have been well investigated
on the ground
Done 2
‘partial’ when these factors are described in part only Partial 1
‘not done’ when these factors are not well described Not done 0
Reporting of results ‘done’ if results reported match objectives Done 2
‘partial’ when only one of the above is met Partial 1
‘not done’ if none of the above are met Not done 0
Researcher bias ‘ok’ if study funding and financial interests of authors declared, no bias is apparent and selection of case/ survey is
justified
Done 2
‘partial’ if funding or financial interests not declared, but selection of case/survey is justified Partial 1
‘not done’ when funding and financial interests not declared, selection of case/survey not justified, potential bias
evident
Not done 0
Other validity issues ‘done’ if there are no other issues around validity (sample size, sampling strategy) Done 1
‘not done’ if there are additional validity issues Not done 0
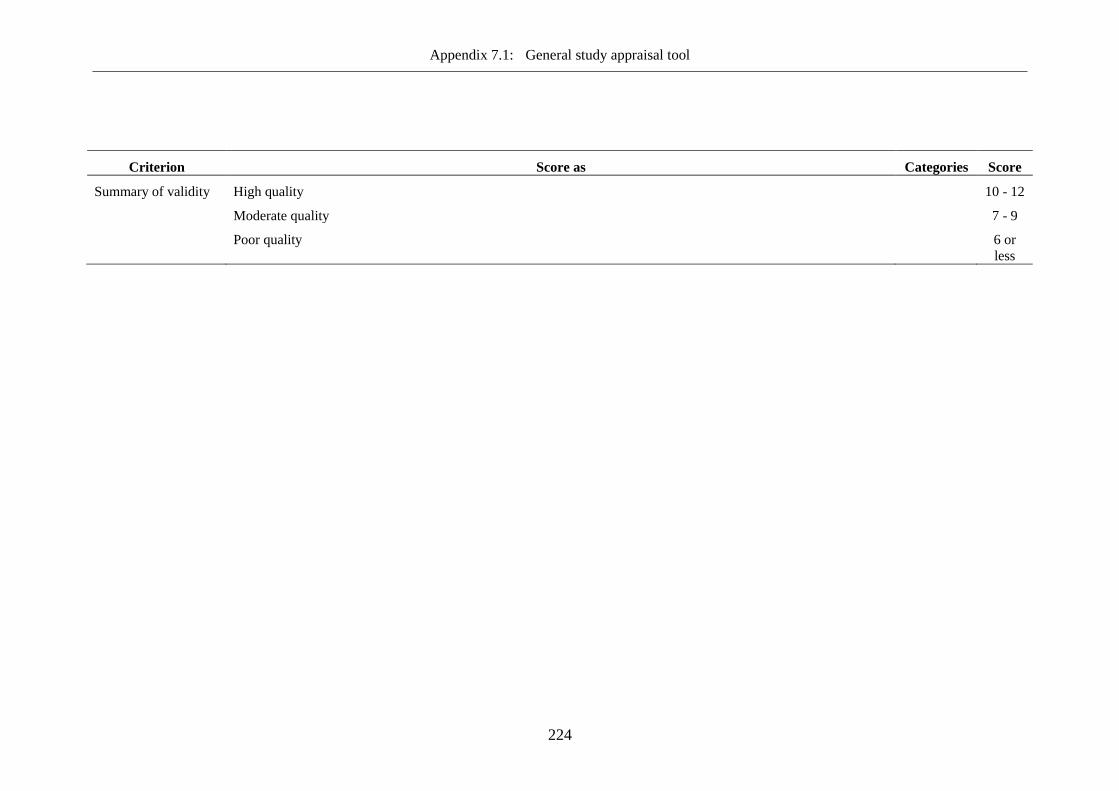
Appendix 7.1: General study appraisal tool
224
Criterion Score as Categories Score
Summary of validity High quality 10 - 12
Moderate quality 7 - 9
Poor quality 6 or
less

Appendix 7.1: General study appraisal tool
225
Table A7.1.2: Appraised studies
Author(s), year Clarity of
research
objective
Clarity of study
methods Description of
conditions Reporting of
results Researcher bias Other validity
issues Summary of
validity
Altaf, (1994) 2 1 1 2 2 1 9
Baisa et al.,
(2010) 2 2 2 2 1 1 10
Caprara et al.,
(2009) 2 2 2 2 2 1 11
Chaminuka &
Nyatsanza,
(2013) 2 1 1 1 0 0 5
Choe et al.,
(1996) 2 2 2 1 2 1 10
Dutta et al.,
(2005) 2 2 2 2 2 1 11
Gerlach &
Franceys, (2009) 2 2 2 1 2 0 9
Gulyani et al.,
(2005) 2 1 2 1 2 1 9
Humplick et al.,
(1993);
Madanat &
Humplick,
(1993) 2 1 2 1 1 0 7

Appendix 7.1: General study appraisal tool
226
Author(s), year Clarity of
research
objective
Clarity of study
methods Description of
conditions Reporting of
results Researcher bias Other validity
issues Summary of
validity
Jamal &
Rahman, (2012) 1 0 1 1 1 0 4
Katuwal &
Bohara, (2011) 2 2 2 1 1 1 9
Kudat et al.,
(1993) 2 1 2 1 1 0 7
Kudat &
Musayev, (1997) 2 1 2 1 1 0 7
Mycoo, (1996) 2 2 2 1 2 1 10
Ngwenya &
Kgathi, (2006) 2 2 2 2 0 0 8
Olsson &
Karlsson, (2010) 1 1 2 2 1 0 7
Pattanayak et al.,
(2005) 1 2 2 2 2 1 10
Potter &
Darmane, (2010) 2 1 2 2 2 0 9
Subbaraman et
al., (2013) 2 2 2 1 2 1 10
Vásquez, (2012) 2 2 2 2 2 1 11
Vásquez et al.,
(2009) 2 2 2 2 2 1 11

Appendix 7.1: General study appraisal tool
227
Author(s), year Clarity of
research
objective
Clarity of study
methods Description of
conditions Reporting of
results Researcher bias Other validity
issues Summary of
validity
Virjee & Gaskin,
(2010) 2 2 2 2 2 1 11
Zérah, (1998,
2000a) 2 1 2 2 1 1 9

228
Appendix 7.2: Adapted SEPA study appraisal tool
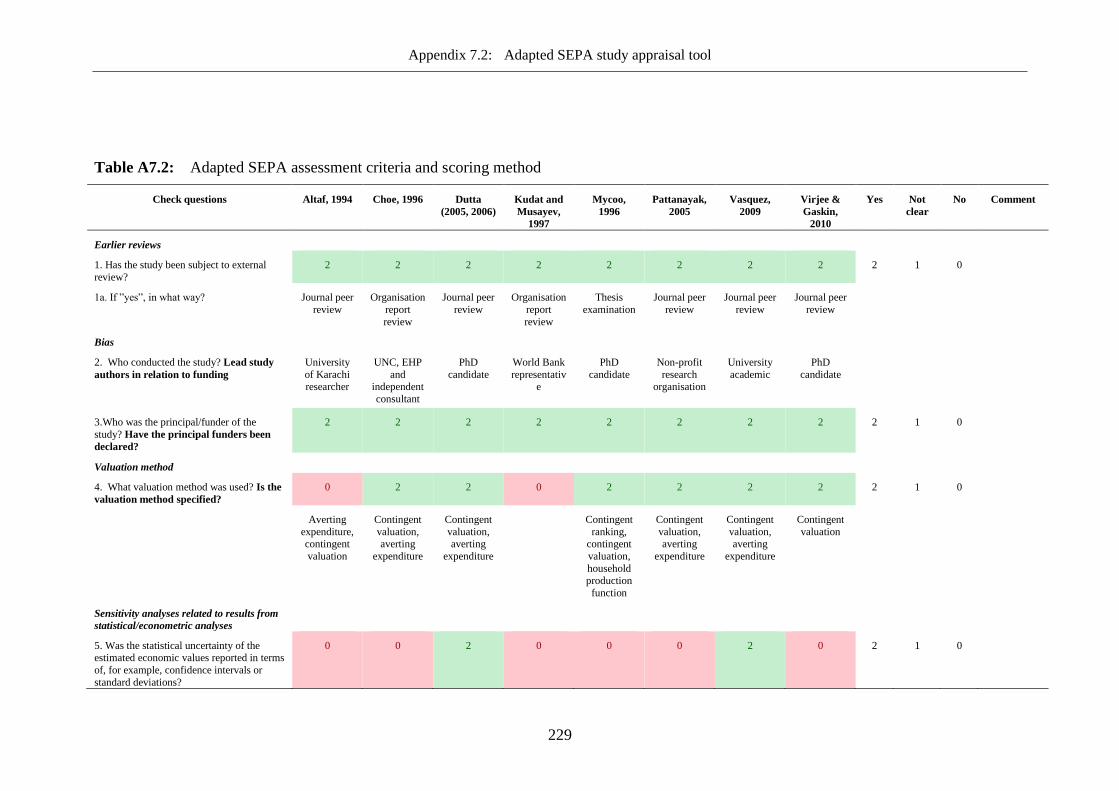
Appendix 7.2: Adapted SEPA study appraisal tool
229
Table A7.2: Adapted SEPA assessment criteria and scoring method
Check questions Altaf, 1994 Choe, 1996 Dutta
(2005, 2006)
Kudat and
Musayev,
1997
Mycoo,
1996
Pattanayak,
2005
Vasquez,
2009
Virjee &
Gaskin,
2010
Yes Not
clear
No Comment
Earlier reviews
1. Has the study been subject to external
review?
2 2 2 2 2 2 2 2 2 1 0
1a. If ”yes”, in what way? Journal peer
review
Organisation
report
review
Journal peer
review
Organisation
report
review
Thesis
examination
Journal peer
review
Journal peer
review
Journal peer
review
Bias
2. Who conducted the study? Lead study
authors in relation to funding
University
of Karachi researcher
UNC, EHP
and independent
consultant
PhD
candidate
World Bank
representative
PhD
candidate
Non-profit
research organisation
University
academic
PhD
candidate
3.Who was the principal/funder of the
study? Have the principal funders been
declared?
2 2 2 2 2 2 2 2 2 1 0
Valuation method
4. What valuation method was used? Is the
valuation method specified?
0 2 2 0 2 2 2 2 2 1 0
Averting
expenditure, contingent
valuation
Contingent
valuation, averting
expenditure
Contingent
valuation, averting
expenditure
Contingent
ranking, contingent
valuation,
household production
function
Contingent
valuation, averting
expenditure
Contingent
valuation, averting
expenditure
Contingent
valuation
Sensitivity analyses related to results from
statistical/econometric analyses
5. Was the statistical uncertainty of the estimated economic values reported in terms
of, for example, confidence intervals or
standard deviations?
0 0 2 0 0 0 2 0 2 1 0
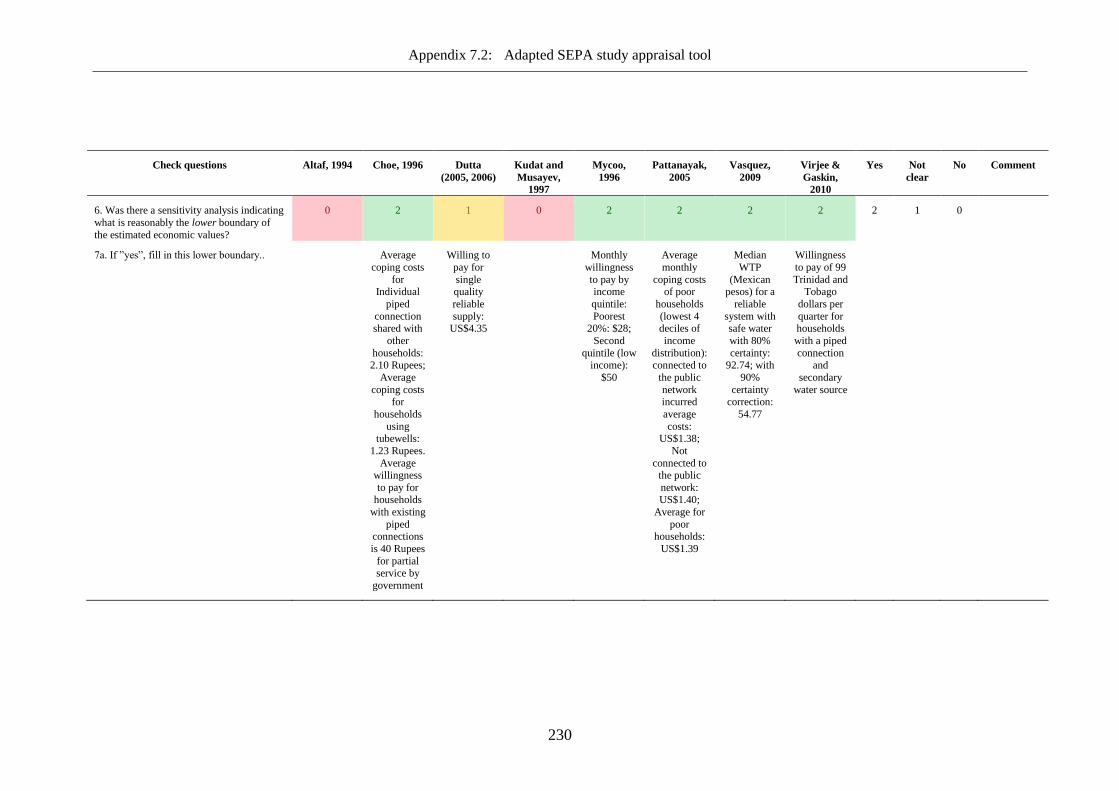
Appendix 7.2: Adapted SEPA study appraisal tool
230
Check questions Altaf, 1994 Choe, 1996 Dutta
(2005, 2006)
Kudat and
Musayev,
1997
Mycoo,
1996
Pattanayak,
2005
Vasquez,
2009
Virjee &
Gaskin,
2010
Yes Not
clear
No Comment
6. Was there a sensitivity analysis indicating
what is reasonably the lower boundary of
the estimated economic values?
0 2 1 0 2 2 2 2 2 1 0
7a. If ”yes”, fill in this lower boundary.. Average
coping costs
for Individual
piped
connection shared with
other
households:
2.10 Rupees;
Average
coping costs for
households
using tubewells:
1.23 Rupees.
Average willingness
to pay for households
with existing
piped connections
is 40 Rupees
for partial service by
government
Willing to
pay for
single quality
reliable
supply: US$4.35
Monthly
willingness
to pay by income
quintile:
Poorest 20%: $28;
Second
quintile (low
income):
$50
Average
monthly
coping costs of poor
households
(lowest 4 deciles of
income
distribution):
connected to
the public
network incurred
average
costs: US$1.38;
Not
connected to the public
network: US$1.40;
Average for
poor households:
US$1.39
Median
WTP
(Mexican pesos) for a
reliable
system with safe water
with 80%
certainty:
92.74; with
90%
certainty correction:
54.77
Willingness
to pay of 99
Trinidad and Tobago
dollars per
quarter for households
with a piped
connection
and
secondary
water source

Appendix 7.2: Adapted SEPA study appraisal tool
231
Check questions Altaf, 1994 Choe, 1996 Dutta
(2005, 2006)
Kudat and
Musayev,
1997
Mycoo,
1996
Pattanayak,
2005
Vasquez,
2009
Virjee &
Gaskin,
2010
Yes Not
clear
No Comment
7b. If "yes", what factors were considered in
the sensitivity analysis?
Water
service
levels, service
provider
Single
quality
improvement, with
provision of
potable water that
meets
standards of the World
Health
Organisation
Income
distribution
Income
distribution,
water service
connection
status
Referendum
valuation
with 80 % and 90%
certainty
correction applied on
willingness
to pay estimates
Water
service
connection status
8. Was there a sensitivity analysis indicating
what is reasonably the upper boundary of
the estimated economic values?
0 2 0 0 1 0 2 2 2 1 0

Appendix 7.2: Adapted SEPA study appraisal tool
232
Check questions Altaf, 1994 Choe, 1996 Dutta
(2005, 2006)
Kudat and
Musayev,
1997
Mycoo,
1996
Pattanayak,
2005
Vasquez,
2009
Virjee &
Gaskin,
2010
Yes Not
clear
No Comment
8a. If ”yes”, fill in this upper boundary. Average
coping costs
for Individual
piped
connection exclusively
for own use:
2.11 Rupees Average
coping costs
for
households
using public
taps or neighbours:
43.65
Rupees. Average
willingness
to pay amongst
households with existing
piped
connection with full
service
provided by a private
contractor is
$44 Rupees
Willing to
pay for dual
quality reliable
supply:
US$6.78
Monthly
willingness
to pay by income
quintile:
third quintile (middle-
income):
$55; fourth and fifth
quintile
(high-
income):
$41
Average
monthly
coping costs of non-poor
households:
connected to the public
network
incurred average
costs:
US$3.72;
Not
connected to
the public network:
US$4.90;
Average for poor
households:
US$4.00
Median
WTP
(Mexican pesos) for a
reliable
system with safe water
with no
certainty correction:
229.75; for
open-ended
question:
111.31
Willingness
to pay of
175 Trinidad and Tobago
dollars per
quarter for households
with no in-
house connection
8b. If "yes", what factors were considered in
the sensitivity analysis?
Water
service
levels,
service
provider
Dual quality
improvemen
t, with
separate
provision of
potable and non-potable
water
Income
distribution
Income
distribution,
water
service
connection
status
Open ended
valuation, no
certainty
corrections
Water
service
connection
status

Appendix 7.2: Adapted SEPA study appraisal tool
233
Check questions Altaf, 1994 Choe, 1996 Dutta
(2005, 2006)
Kudat and
Musayev,
1997
Mycoo,
1996
Pattanayak,
2005
Vasquez,
2009
Virjee &
Gaskin,
2010
Yes Not
clear
No Comment
Are future values discounted?
9. If the valuation study estimated future
economic values, did the study report how these values were converted into present
values?
Yes Yes Not
applicable
Not
applicable
Not
applicable
Not
applicable
Not
applicable
Not
applicable
Yes No Not
clear
Not
applicable
9a. If ”yes”, how was the selected discount rate motivated?
Not motivated
Assumed a 12% real
interest rate
based on the current
market price
of capital investments
Not applicable
Not applicable
Not applicable
Not applicable
Not applicable
Not applicable
9b. If "yes", what was the size of the
discount rate that was used?
^10% ^12% Not
applicable
Not
applicable
Not
applicable
Not
applicable
Not
applicable
Not
applicable
Primary data or secondary data
10. Were primary data used? Yes Yes Yes Yes Yes Yes Yes Yes Yes No Not
clear
11. If secondary data were used, was the
quality of the original data collection
evaluated?
Not
applicable
Not
applicable
Not
applicable
Not
applicable
Not
applicable
Not
applicable
Not
applicable
11a. If ”yes”, what was the result of this
evaluation?
Not
applicable
Not
applicable
Not
applicable
Not
applicable
Not
applicable
Not
applicable
Not
applicable
12. If secondary data were used, was it a
main purpose of the original data collection
to collect the data that were used in the valuation study?
Not
applicable
Not
applicable
Not
applicable
Not
applicable
Not
applicable
Not
applicable
Not
applicable
13. If secondary data were used, was the
relevance of using it for the valuation study evaluated?
Not
applicable
Not
applicable
Not
applicable
Not
applicable
Not
applicable
Not
applicable
Not
applicable
Survey, population and sample
14. Was a target population defined? 2 2 2 2 2 2 2 2 2 1 0

Appendix 7.2: Adapted SEPA study appraisal tool
234
Check questions Altaf, 1994 Choe, 1996 Dutta
(2005, 2006)
Kudat and
Musayev,
1997
Mycoo,
1996
Pattanayak,
2005
Vasquez,
2009
Virjee &
Gaskin,
2010
Yes Not
clear
No Comment
14a. If ”yes”, how was the target population
defined in time and space, and what was its
size?
Households
with
inadequate public piped
water
supplies
Dehra Dun,
Utta
Pradesh, India.
Estimated
population in 1995 was
290,000
People
living in
unplanned areas in
Delhi, India.
Estimated population
in Delhi at
time of study was 14
million
Baku,
Azerbaijan
Urban
households
in Trinidad
Kathmandu,
Nepal
Chihuahua,
Mexico
Trinidad &
Tobago
15. Was a frame population/sampling frame
defined? 2 2 2 1 1 2 2 2 2 1 0
15a. If ”yes”, how was the frame
population/sampling frame defined in time and space, and what was its size?
Sampling
frame in urban area
was 436
enumeration blocks of
approximate
ly 200-250 households.
In the rural
area the
sampling
frame was a sweet
groundwater
zone and a brackish
groundwater
zone
A total of
15,288 households
were
registered under the 52
selected
polling booths.
Approximat
ely 8.6% of
households
from each polling
booth were
randomly selected
Unplanned
residential areas that
come under
E, F, G, and H
classes
inside Municipal
Corporation
of Delhi
jurisdiction.
Size 4.9 million
Study refers
to Zones I-IV, but it is
not clear
whether these are the
sampling
frame
Capital
region, which
consists of
14 sub-regions. 6
sub-
settlements were chosen;
Goodwood
Park, Alyce
Glen, St
Barbs, Barataria,
Valsayn and
Malabar. Estimated
population
in Trinidad 1991 was
1.28 million
All
households had
previously
been enumerated.
Five
municipalities:
Kathmandu
Valley,
Kathmandu,
Lalitpur, Bhaktapur,
Kirtipur, and
Madhyapur in 2001
Parral,
Chihuahua State,
Mexico.
Estimated population
in 2005
103,519 inhabitants.
The city was
stratified
into six
geographical zones and 70
households
randomly selected
from a list of
mailing addresses in
each zone
Trinidad &
Tobago, with 1.3
million
residents in 340,000
households

Appendix 7.2: Adapted SEPA study appraisal tool
235
Check questions Altaf, 1994 Choe, 1996 Dutta
(2005, 2006)
Kudat and
Musayev,
1997
Mycoo,
1996
Pattanayak,
2005
Vasquez,
2009
Virjee &
Gaskin,
2010
Yes Not
clear
No Comment
16. Were potential differences between the
target population and the frame
population/sampling frame reported?
0 0 0 0 1 0 2 0 2 1 0
17. How did the study take into account
potential differences between the target
population and the frame population/sampling frame?
Not clear Not clear
18. What was the sample size? 756 rural
and 968 urban,
totalling
1,724
1,100
households
650
households
400
households
420
households
1,500
households
398
households
1,419
respondents
19. What type of sampling procedure was
used for constructing the sample?
Random-
stratified
clustered sampling
Random-
stratified
clustered sampling
Multistage
stratified
random sampling
Not
specified
Cluster
stratified
random sampling
Clustered
random
sampling
Stratified
random
sampling
Stratified
random
sampling
20. Was the sampling procedure a
probability sampling?
Yes Not clear Not clear Not clear Not clear Not clear Not clear Not clear Yes No Not
clear
21. On the whole, did the study meet the criteria that define a survey?
Yes Not clear Not clear Not clear Not clear Not clear Not clear Not clear
22. If "no" to question 21, was the purpose
of the study of a kind that does not motivate a survey? (For example, it might not be
necessary to carry out a survey if the study
was not aiming at computing estimates which are representative for a population.)
No No No No No No No
23. If aggregate economic values for a population were estimated, was this
estimation consistent with the sampling
procedure and the definition of the population?
Yes Not applicable
Not applicable
Not applicable
Not applicable
Not applicable
Not applicable
Not applicable
Yes No Not clear
The design of the data collection work
24 Were focus groups (or the like) used for developing and testing the survey
instrument?
1 2 2 0 0 2 2 1 2 1 0 `

Appendix 7.2: Adapted SEPA study appraisal tool
236
Check questions Altaf, 1994 Choe, 1996 Dutta
(2005, 2006)
Kudat and
Musayev,
1997
Mycoo,
1996
Pattanayak,
2005
Vasquez,
2009
Virjee &
Gaskin,
2010
Yes Not
clear
No Comment
25. Was a pilot study carried out for testing
the survey instrument? 1 2 2 0 2 2 2 2 2 1 0
Data collection method
26. What data collection method was used? Person to
person
interviews
Person to
person
interviews
Person to
person
interviews
Person to
person
interviews
Person to
person
interviews
Person to
person
interviews
Person to
person
interviews
Person to
person
interviews
27. When was the data collection carried
out?
1988-1990 September
1995 to
March 1996
Not reported July 1994 March-May
1994
2001 Not reported May – June
2003
Non-response
28. Was there a report on non-response? 0 1 0 0 2 0 1 2 2 1 0
30. How was unit non-response defined? Zero bids in the
contingent
valuation were
reported
Item non-response
was 35 out
of 420, plus another 25
that were
excluded from the
analysis for
reasons not specified.
Authors report
response rate
of 94.76% but not clear
whether this
is unit or item non-
response
Not clear No report on unit non-
response,
but one on item non-
response
31. What was the size of the unit non-
response (in per cent)?
3.50% Not reported Not reported See previous
comment
See previous
comment
12.50%
32. Was a follow-up study of non-
respondents carried out? 0 0 0 0 0 0 0 0 2 1 0

Appendix 7.2: Adapted SEPA study appraisal tool
237
Check questions Altaf, 1994 Choe, 1996 Dutta
(2005, 2006)
Kudat and
Musayev,
1997
Mycoo,
1996
Pattanayak,
2005
Vasquez,
2009
Virjee &
Gaskin,
2010
Yes Not
clear
No Comment
33. According to the study, how are
valuation results affected by the non-
response?
Not reported Not reported Not reported Not reported Not reported Not clear.
Authors
mention that non response
is due
mainly to errors in the
CSO-
supplied listing
records and
the difficulty
in accessing
some remote
areas.
34. If values at a population level were
estimated, did such estimations take non-
response into account? 1
2 1 0
Survey instrument
Was there a copy of the complete survey
instrument? 0 0 2 2 2 0 0 0 2 1 0
Access to data
Did the study mention that it is possible to get access to the data used?
0 0 0 0 0 0 0 0 2 1 0
Validity tests
37. Was there any test of internal validity? 0 0 0 0 2 2 2 0 2 1 0

Appendix 7.2: Adapted SEPA study appraisal tool
238
Check questions Altaf, 1994 Choe, 1996 Dutta
(2005, 2006)
Kudat and
Musayev,
1997
Mycoo,
1996
Pattanayak,
2005
Vasquez,
2009
Virjee &
Gaskin,
2010
Yes Not
clear
No Comment
37a. If ”yes”, what test was carried out? Convergent
validity in
the positive relationship
between
coping cost and WTP
Convergent
validity in
the positive relationship
between
coping cost and WTP
As a
measure of
construct validity,
WTP for
safe and reliable
water was
found to be positively
related to
income
37b. If "yes", did the test indicate the presence of internal validity?
2 2 2
2 1 0
38. Was there any test of external validity? 0 0 0 0 0 0 0 0 2 1 0
38a. If ”yes”, what test was carried out?
38b. If "yes", did the test indicate the
presence of external validity? 2 1 0
Natural scientific/medical basis
39. Was any expert in natural sciences/
water supply/resources involved in the
valuation study?
2 2 2 1 1 2 1 1 2 1 0
Total score 12 21 21 10 23 20 26 20 42 21 0
Rating:
Poor 0-14
Moderate 15-28
Good 29-42
Modifications to the questions are indicated in bold font

239
Appendix 8: Correlation of coping strategies, and
components of coping costs

Appendix 8: Correlation matrix of coping strategies and components of coping costs
240
Table A8.1.1: Correlation matrix of coping strategies
Drilled
well
Storage
tank
Treat
water
Store
water
Buy water
from
neighbours
Buy
bottled
water
Collect
water
from
alternative
sources
Recycle
waste
water
Harvest
rainwater
Use water
sparingly
Reschedule
household
activities
Protest/
complain
to local
authority
Drilled well 1.0000
Storage tank 0.8721***
1.0000
Treat water 0.1563**
0.1755**
1.0000
Store water -.06915***
-0.6131***
-0.0709 1.0000
Buy water from
neighbours -0.0977 -0.0855 -0.1214
* 0.2191
*** 1.0000
Buy bottled water 0.2662***
0.2482***
0.0798 -0.1562**
0.1407**
1.0000
Collect water from
alternative sources -0.3181
*** -0.2223
*** -0.0477 0.1640
** -0.7473
***
-
0.1836***
1.0000
Recycle waste
water -0.1336
* -0.0791 -0.1410
** 0.2312
*** 0.2362
*** -0.0879 -0.0579 1.0000
Harvest rainwater 0.0861 0.0935 -0.0263 -0.0127 0.2191***
0.0617 -0.2641***
0.3469***
1.0000
Use water
sparingly -0.1697
** -0.1799
** -0.1661
** 0.1825
** 0.4363
*** 0.0258 -0.3071
*** 0.1805
** 0.1825
** 1.0000
Reschedule
household activities -0.1831
*** -0.1937
*** -0.0205 0.1934
*** 0.4129
*** -0.0699 -0.3237
*** 0.2016
*** 0.1934
*** 0.4539
*** 1.0000
Protest/complain to
local authority -0.1383
* -0.1443
** -0.0688 0.1225
* 0.1789
** 0.0409 -0.1130 0.0850 0.0703 0.2028
*** 0.0662 1.0000
Notes: *p < 0.1,
**p < 0.05,
***p < 0.01
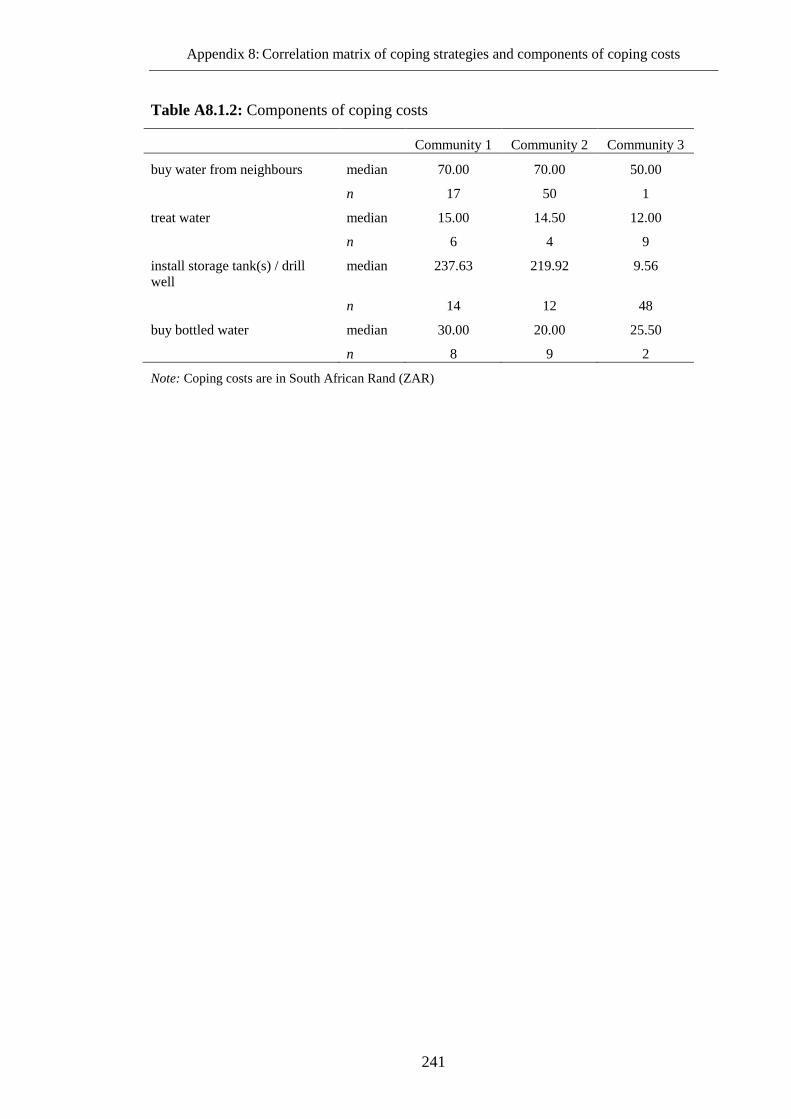
Appendix 8: Correlation matrix of coping strategies and components of coping costs
241
Table A8.1.2: Components of coping costs
Community 1 Community 2 Community 3
buy water from neighbours median 70.00 70.00 50.00
n 17 50 1
treat water median 15.00 14.50 12.00
n 6 4 9
install storage tank(s) / drill
well
median 237.63 219.92 9.56
n 14 12 48
buy bottled water median 30.00 20.00 25.50
n 8 9 2
Note: Coping costs are in South African Rand (ZAR)