unraveling the etiology of familial interstitial pneumonia
TRANSCRIPT

UNRAVELING THE ETIOLOGY OF FAMILIAL INTERSTITIAL PNEUMONIA: GENETIC INVESTIGATIONS OF A COMPLEX DISEASE
by
Anastasia Leigh Wise
University Program in Genetics and Genomics &
Integrated Toxicology and Environmental Health Program Duke University
Date:_______________________
Approved:
________________________________ David Schwartz, MD, MPH, Co-Advisor
________________________________ Jonathan Freedman, PhD, Co-Advisor
________________________________
Randy Jirtle, PhD
________________________________ Jo Rae Wright, PhD
________________________________
Dmitri Zaykin, PhD
Dissertation submitted in partial fulfillment of the requirements for the degree of Doctor of Philosophy in the University Program in Genetics and Genomics
& the Integrated Toxicology and Environmental Health Program in the Graduate School of Duke University
2008
ABSTRACT
UNRAVELING THE ETIOLOGY OF FAMILIAL INTERSTITIAL PNEUMONIA: GENETIC INVESTIGATIONS OF A COMPLEX DISEASE
by
Anastasia Leigh Wise
University Program in Genetics and Genomics &
Integrated Toxicology and Environmental Health Program Duke University
Date:_______________________
Approved:
________________________________ David Schwartz, MD, MPH, Co-Advisor
________________________________ Jonathan Freedman, PhD, Co-Advisor
________________________________
Randy Jirtle, PhD
________________________________ Jo Rae Wright, PhD
________________________________
Dmitri Zaykin, PhD
An abstract of a dissertation submitted in partial fulfillment of the requirements for the degree of Doctor of Philosophy in the University Program in Genetics and
Genomics& the Integrated Toxicology and Environmental Health Program in the Graduate School of Duke University
2008

Copyright by Anastasia Leigh Wise
2008
iv
Abstract
The Idiopathic Interstitial Pneumonias (IIPs) are complex conditions, with
limited treatment options and unknown etiology. Thus, given the complex nature
of the disease and the likelihood of genetic heterogeneity, phenotypic and
environmental factors must be taken into consideration when searching for
genetic components involved in IIP. Families with 2 or more cases of IIP
(classified as familial interstitial pneumonia, FIP) provide a unique opportunity to
study IIP genetics. Therefore, in order to better define the FIP phenotype,
families with a homogeneous pattern of disease diagnosis (Idiopathic Pulmonary
Fibrosis (IPF) only, with all individuals diagnosed with IPF) were compared to
families with a heterogeneous phenotype (mixed, with multiple different IIP
diagnoses within a single family, including at least one case of IPF). Survival
was decreased in the mixed (46%) compared to the IPF only (60%) families
(p=0.006) along with the mean age of death (69 IPF only, 64 mixed, p=0.007).
Surprisingly, the same results were found when only individuals diagnosed with
IPF from both types of families were compared (survival 40% vs. 60%, p=0.0003
and age of death 65 vs. 69, p=0.03). Using this same phenotypic classification
scheme a whole genome microsatellite screen for FIP was conducted. Two
peaks suggestive of linkage to chromosome 11 (LOD=3.3) and chromosome 10
(LOD=2.1) were identified in all 82 families, along with a third peak on

v
chromosome 12 only seen in homogeneous families (LOD=2.5). In order to
determine if the two linkage peaks seen in all 82 families were the result of
genetic heterogeneity, ordered subset analysis (OSA) was conducted. Applying
OSA, which uses family level covariate data to define a more homogeneous
subset of families that maximize linkage, low linkage to chromosome 11
maximized linkage to chromosome 10 within a subset of 63 of the 83 families
(LOD=3.4) and 27 of the mixed families (LOD=5.1). Furthermore, OSA revealed
that families with a lower proportion of smokers among affected individuals
contributed significantly to evidence in favor of linkage on chromosome 11
(LOD=4.9). It therefore appears that chromosomes 10 and 11 represent distinct
susceptibility factors for FIP. Conducting further fine-mapping of the
chromosome 11 region also identified 2 potential candidate genes, MUC2 and
MUC5AC. Re-sequencing of both genes followed by selective genotyping of the
10 most interesting SNPs revealed 7 SNPs significantly associated with FIP and
7 SNPs significantly associated with IPF, 6 of which were significant in both FIP
and IPF cases as compared to spouse controls. A haplotype consisting of 4
SNPs (1 in MUC2 and 3 in MUC5AC) was also found to be significant in both FIP
(p=0.002) and IPF cases (p=0.001). While the SNP in MUC2 is intronic, all 3
MUC5AC SNPs produce amino acid changes. Thus, non-synonymous
polymorphisms in MUC5AC are associated with both FIP and IPF.
vi
Contents
Abstract................................................................................................................ iv
List of Tables ....................................................................................................... ix
List of Figures ..................................................................................................... xii
List of Abbreviations .......................................................................................... xiv
Acknowledgments..............................................................................................xvii
1. General Introduction ........................................................................................1
1.1 Idiopathic Interstitial Pneumonia ..........................................................1
1.1.1 Idiopathic Pulmonary Fibrosis (IPF)........................................3
1.1.2 Nonspecific Interstitial Pneumonia (NSIP)..............................6
1.1.3 Cryptogenic Organizing Pneumonia (COP)............................7
1.1.4 Acute Interstitial Pneumonia (AIP)..........................................9
1.1.5 Respiratory Bronchiolitis Interstitial Lung Disease (RB-ILD) and Desquamative Interstitial Pneumonia (DIP)............................10
1.1.6 Lymphoid Interstitial Pneumonia (LIP)..................................11
1.2 Familial Interstitial Pneumonia ...........................................................13
1.2.1 Evidence for a Genetic Component......................................13
1.2.2 Evidence for an Environmental Component .........................14
1.3 Disease Pathogenesis .......................................................................14
1.4 Problem/Purpose ...............................................................................15
1.5 Hypothesis .........................................................................................15
1.6 Specific Aims......................................................................................15
1.6.1 Specific Aim 1: Defining the Phenotype................................15
vii
1.6.2 Specific Aim 2: Linkage Studies in Familial Interstitial Pneumonia ....................................................................................16
1.6.3 Specific Aim 3: Association Studies in Familial Interstitial Pneumonia ....................................................................................16
2. Defining the Phenotype..................................................................................18
2.1 Background........................................................................................18
2.1.1 Clinical Measures .................................................................18
2.2 Investigating Phenotypic Heterogeneity ...........................................20
2.2.1 Methods................................................................................20
2.2.2 Results .................................................................................23
2.2.3 Conclusions..........................................................................27
3. Linkage Studies in Familial Interstitial Pneumonia.........................................29
3.1 Background........................................................................................29
3.1.1 Linkage Analysis ..................................................................29
3.1.2 Merlin Linkage Analysis and Model Parameters...................31
3.1.3 OSA Method........................................................................33
3.2 Whole Genome Linkage Screen .......................................................34
3.2.1 Methods...............................................................................34
3.2.2 Results ................................................................................42
3.2.3 Conclusions.........................................................................49
3.3 Fine-mapping Analysis of Chromosome 10 ......................................50
3.3.1 Methods...............................................................................50
3.3.2 Results ................................................................................51
3.3.3 Conclusions.........................................................................56
viii
3.4 Ordered Subset Analysis of Chromosomes 10, 11, and 12 ..............58
3.4.1 Methods...............................................................................58
3.4.2 Results ................................................................................60
3.4.3 Conclusions.........................................................................68
4. Association Studies in Familial Interstitial Pneumonia ...................................70
4.1 Background........................................................................................70
4.1.1 Association Analyses and Linkage Disequilibrium...............70
4.1.2 Family-based Association, APL...........................................71
4.1.3 Background on Mucin Candidate Genes .............................71
4.2 Chromosome 10 Fine-mapping.........................................................74
4.2.1 Methods...............................................................................74
4.2.2 Results ................................................................................75
4.2.3 Conclusions.........................................................................78
4.3 Chromosome 11: Mucin Genes.........................................................79
4.3.1 Methods...............................................................................80
4.3.2 Results ................................................................................81
4.3.3 Conclusions.......................................................................103
5. Discussion ....................................................................................................106
5.1 Overall Conclusions and Implications .............................................106
5.2 Limitations.......................................................................................110
5.3 Future Studies.................................................................................111
References .......................................................................................................113
Biography..........................................................................................................120

ix
List of Tables
Table 1: ATS Grade of Breathlessness Scale....................................................18
Table 2: Demographic and Clinical Characteristics of 142 Families ..................24
Table 3: Demographic and clinical characteristics of affected individuals genotyped in the genomic screen for all, homogeneous, and heterogeneous families.......................................................................42
Table 4: Summary of LOD scores in genomic regions of interest ......................44
Table 5: Significant OSA results for chromosome 10, 11, and 12 interaction test......................................................................................................61
Table 6: Ordered subset analysis for Chromosome 10 (all, homogeneous, and heterogeneous families) using Chromosome 11 and 12 family-specific LOD scores as a covariate with empiric p-values ..................62
Table 7: Significant OSA results for chromosome 10, 11, and 12 testing smoking and age-of-onset covariates .................................................66
Table 8: Significant chromosome 10 fine-mapping APL results.........................76
Table 9: Linkage Disequilibrium (LD) between the 6 significant markers...........77
Table 10: Comparison of allelic trends between FIP cases and Spouse controls for significant MUC2 re-sequencing markers (X = allele 1 count, Y = allele 2 count). Significant p-values are highlighted in yellow: dark yellow highlighted columns have p-values < 0.01, light yellow columns have p-values < 0.05. Entries highlighted in bold are significant in both FIP and IPF cases. ..........................................82
Table 11: Comparison of allelic trends between IPF cases and Spouse controls for significant MUC2 re-sequencing markers (X = allele 1 count, Y = allele 2 count). Significant p-values are highlighted in yellow: dark yellow highlighted columns have p-values < 0.01, light yellow columns have p-values < 0.05. Entries highlighted in bold are significant in both FIP and IPF cases. ..........................................83

x
Table 12: Comparison of allelic trends between FIP cases and Spouse controls for significant MUC5AC re-sequencing markers (X = allele 1 count, Y = allele 2 count). Significant p-values are highlighted in yellow: dark yellow highlighted columns have p-values < 0.01, light yellow columns have p-values < 0.05. Entries highlighted in bold are significant in both FIP and IPF cases. ..........................................85
Table 13: Comparison of allelic trends between IPF cases and Spouse controls for significant MUC5AC re-sequencing markers (X = allele 1 count, Y = allele 2 count). Significant p-values are highlighted in yellow: dark yellow highlighted columns have p-values < 0.01, light yellow columns have p-values < 0.05. Entries highlighted in bold are significant in both FIP and IPF cases. ..........................................86
Table 14: 10 SNPs selected for follow-up genotyping. ......................................88
Table 15: LD between rs7944723 (in MUC2) and 9 other selected SNPs in MUC5AC.............................................................................................89
Table 16: Fisher’s exact test p-values, comparing genotypes from FIP and IPF cases versus spouse controls ......................................................90
Table 17: Odds Ratios and 95% confidence intervals for having at least one copy of the minor allele versus wild-type in FIP and IPF cases versus spouse controls. Significant ORs are highlighted in yellow for susceptibility alleles and blue for protective alleles........................91
Table 18: Linkage Disequilibrium (LD) between the 9 selected SNPs. SNPs with r2 > 0.7 in both FIP and IPF cases are highlighted in yellow. ......92
Table 19: Haplotypes for 9 SNPs genotyped in MUC2 and MUC5AC with p-value for FIP cases versus spouse controls (1 = major allele, 2 = minor allele) and +/- to indicate direction of the association (- when the haplotype is more common in controls than cases, and + when the haplotype is more common in cases than controls) ......................98
Table 20: Haplotypes for 9 SNPs genotyped in MUC2 and MUC5AC with haplotype frequencies for FIP cases and spouse controls, NA denotes haplotypes with frequencies less than 1% ............................99
Table 21: Haplotypes for 9 SNPs genotyped in MUC2 and MUC5AC with p-value for FIP cases versus spouse controls (1 = major allele, 2 = minor allele) and +/- to indicate direction of the association (- when

xi
the haplotype is more common in controls than cases, and + when the haplotype is more common in cases than controls) ....................100
Table 22: Haplotypes for 9 SNPs genotyped in MUC2 and MUC5AC with haplotype frequencies for IPF cases and spouse controls, NA denotes haplotypes with frequencies less than 1% ..........................101
xii
List of Figures
Figure 1: Comparison of Age at Death within IPF Individuals .............................26
Figure 2: Whole Genome Linkage Screen.........................................................45
Figure 3: Chromosome 11 LOD score plot: all 82 families (black dashes), 40 heterogeneous families (green line), and 42 homogeneous families (blue line)............................................................................................46
Figure 4: Chromosome 10 LOD score plot: all 82 families (black dashes), 40 heterogeneous families (green line), and 42 homogeneous families (blue line)............................................................................................47
Figure 5: Chromosome 12 LOD score plot: all 82 families (black dashes), 40 heterogeneous families (green line), and 42 homogeneous families (blue line)............................................................................................48
Figure 6: Multipoint Linkage results for Chromosome 10: all 82 families ...........52
Figure 7: Multipoint Linkage results for Chromosome 10: 42 homogeneous families ...............................................................................................53
Figure 8: Multipoint Linkage results for Chromosome 10: 40 heterogeneous families ...............................................................................................54
Figure 9: Comparison of chromosome 10 multipoint LOD scores in the region of interest between the original microsatellite mapping (53 markers on chromosome 10, grey line) and further fine-mapping with both microsatellite and SNP markers (238 markers with correction for linkage disequilibrium between markers, black line). ..........................55
Figure 10: Multipoint linkage results for Chromosome 10 with 2-pts in the region of linkage calculated for all 82 families compared to the subset of 39 families with lower Chromosome 11 LOD scores identified by OSA from the entire dataset ...........................................63
Figure 11: Multipoint linkage results for Chromosome 10 with 2-pts in the region of linkage calculated for all 82 families compared to the subset of 22 families with lower Chromosome 11 LOD scores identified by OSA from the heterogeneous families ............................64

xiii
Figure 12: Depiction of the cut-point identified by OSA between families with higher and lower family-specific chromosome 11 LOD scores. Families with low family-specific chromosome 11 LOD scores (n=39) were found to have significantly higher chromosome 10 LOD scores by OSA....................................................................................65
Figure 13: Multipoint LOD score plot for all 82 families (black dashed line), and the 43 families with a low proportion of smokers identified by OSA (orange line) for chromosome 11 ...............................................67
Figure 14: OSA cut-off between families with a high and low proportion of ever smokers for chromosome 11 ......................................................68
Figure 15: APL results from chromosome 10 fine-mapping. Results over the orange line are considered significant (p-value < 0.05). .....................76
Figure 16: Visualization of LD structure between the 6 significant chromosome 10 markers using D’. Red squares represent and D’ of 1 with high confidence (LOD > 2), grey squares a D’ of 1 with lower confidence (LOD < 2). Numbers in the white squares represent D’, for example 52 = 0.52....................................................78
Figure 17: Overlap in significant SNPs from MUC2 in FIP and IPF cases as compared to spouse controls..............................................................84
Figure 18: Overlap in significant SNPs from MUC5AC in FIP and IPF cases as compared to spouse controls .........................................................87
Figure 19: Visualization of LD structure between the 9 SNPs genotyped in MUC2 and MUC5AC using D’ in FIP cases. Red squares represent and D’ of 1 with high confidence (LOD > 2), grey squares a D’ of 1 with lower confidence (LOD < 2). Numbers represent D’ values, for example 92 = 0.92. .............................................................................95
Figure 20: Visualization of LD structure between the 9 SNPs genotyped in MUC2 and MUC5AC using D’ in IPF cases. Red squares represent and D’ of 1 with high confidence (LOD > 2), grey squares a D’ of 1 with lower confidence (LOD < 2). Numbers represent D’ values, for example 92 = 0.92. .............................................................................96
Figure 21: Comparison of the number of MUC5AC SNPs per individual with at least 1 minor allele for FIP cases, IPF cases, and spouse controls .............................................................................................103
xiv
List of Abbreviations
Bp – Base pair
Mb – Megabase
cM – Centimorgan
SNP – Single Nucleotide Polymorphism
IIP – Idiopathic Interstitial Pneumonia
IPF – Idiopathic Pulmonary Fibrosis
UIP – Usual Interstitial Pneumonia
FIP – Familial Interstitial Pneumonia
NSIP – Nonspecific Interstitial Pneumonia
COP – Cryptogenic Organizing Pneumonia
AIP – Acute Interstitial Pneumonia
RBILD – Respiratory Bronchiolitis Interstitial Lung Disease DIP – Desquamative Interstitial Pneumonia LIP – Lymphocytic Interstitial Pneumonia
BOOP – Bronchiolitis Obliterans Organizing Pneumonia
ILD – Interstitial lung disease
DPLD – Diffuse Parenchymal Lung Disease
LOD – Logarithm of the odds
NPL – Non-parametric linkage
IBS – Identity by state
xv
IBD – Identity by decent
OSA – Ordered subset analysis
LD – Linkage disequilibrium
FVC – Forced vital capacity
ATS – American Thoracic Society
ERS – European Respiratory Society
NIEHS – National Institute of Environmental Health Sciences
DLCO – Diffusing capacity of the lungs for carbon monoxide
HRCT – High Resolution Computed Tomography
TBB – Transbronchial biopsy
BAL – Bronchoalveolar lavage
SD – Standard deviation
OR – Odds Ratio
CI – Confidence interval
SFTPC – Surfactant protein C
MUC2 – Mucin 2
MUC5AC – Mucin 5AC
MUC5B – Mucin 5B
MUC6 – Mucin 6
TERT – Telomerase reverse transcriptase
TERC – Telomerase RNA component
xvi
ITIH5 – Inter-alpha (globulin) inhibitor H5
CUGBP2 – CUG triplet repeat, RNA binding protein 2

xvii
Acknowledgments
To:
� All the families, physicians, and researchers involved in the Familial
Pulmonary Fibrosis study…without you this work would not be possible
� My friends and family…for words of wisdom and endless support
� Everyone in the Speer, Freedman, and Schwartz laboratories…for all the
shared experience and laughter
� Dr. Marcy Speer…for teaching me genetic epidemiology
� Dr. Jonathan Freedman…for sticking with me through two projects
� Dr. David Schwartz…for always finding time for me, no matter what
~Thank you
1
1. General Introduction
1.1 Idiopathic Interstitial Pneumonia
The idiopathic interstitial pneumonias (IIPs) are progressive lung
conditions, with limited treatment options and unknown etiology. Though the IIPs
have been associated with both genetic risk factors and environmental
exposures, the molecular mechanisms underlying disease progression remain
poorly understood. Overall, the diagnosis of IIP covers a wide variety of disease
phenotypes, with ~60% of patients presenting with idiopathic pulmonary fibrosis
(IPF [MIM #178500]), while the remainder present with various other forms of
disease including nonspecific interstitial pneumonia (NSIP), cryptogenic
organizing pneumonia (COP), acute interstitial pneumonia (AIP), respiratory
bronchiolitis interstitial lung disease/desquamative interstitial pneumonia (RB-
ILD/DIP), and lymphocytic interstitial pneumonia (LIP) (Bjoraker et al. 1998;
American Thoracic Society and the European Respiratory Society 2002;
Dempsey 2006; Kim et al. 2006).
The IIPs are part of the larger classification of diffuse parenchymal lung
diseases (DPLDs), otherwise known as interstitial lung diseases (ILDs). There
are over 200 separate disease entities that compromise DPLD with over 150
different known causes of disease (Costabel et al. 2007). DPLD is therefore
composed of a highly heterogeneous mix of disorders of both known and

2
unknown causes, with variable onset, progression, and treatment responses. All
types of DPLD, however, are characterized by damage to the lung parenchyma
(the functional parts of the lung encompassing alveoli, respiratory bronchioles
and the alveolar duct) by inflammation and fibrosis. DPLD is further classified
into 4 main categories by the American Thoracic Society (ATS) and European
Respiratory Society (ERS): DPLD of known causes (occupational or
environmental exposures), granulomatous DPLD (such as sarcoidosis), IIPs
(including IPF), and other rare forms of DPLD (American Thoracic Society and
the European Respiratory Society 2002).
Diagnosis of an IIP is an iterative process involving review of clinical,
radiologic, and pathologic diagnoses (American Thoracic Society and the
European Respiratory Society 2002). To begin with, suspected cases of DPLD
are clinically evaluated. During this evaluation a careful patient history is taken to
determine potential environmental or occupational exposures. A physical
examination, lung function tests, and chest x-ray are also preformed. After this
initial clinical evaluation patients may be grouped into two broad categories:
cases that are known to not be IIP (due to determination of a known exposure or
associated condition), and those that may possibly represent cases of IIP.
Potential cases of IIP then receive a high-resolution computerized tomography
(HRCT) scan. From the HRCT results patients with other suspected or
diagnosable DPLDs can be separated from those with HRCT diagnosed IPF or
suspected other IIP. For individuals with other suspected IIPs that can not be

3
confirmed to be IPF based off of HRCT review, transbronchial biopsy (TBB),
bronchoalveolar lavage (BAL), or surgical lung biopsy may be used to reach a
confirmed diagnosis of IIP.
1.1.1 Idiopathic Pulmonary Fibrosis (IPF)
Diagnosis:
IPF is defined as a type of chronic fibrosing interstitial pneumonia of
unknown cause, specific to the lungs, and associated with the histopathologic
pattern of usual interstitial pneumonia (UIP) (American Thoracic Society and the
European Respiratory Society American Thoracic Society 2000; American
Thoracic Society and the European Respiratory Society 2002; Kim et al. 2006).
A definite diagnosis of IPF requires a surgical lung biopsy pattern of UIP along
with: exclusion of known causes for DPLDs, abnormal pulmonary function test
results (such as reduced vital capacity or decreased DLCO), and bibasilar (at the
base of both lungs) reticular abnormalities on chest x-ray or HRCT with minimal
ground glass (American Thoracic Society and the European Respiratory Society
American Thoracic Society 2000; Chang et al. 2002; Kim et al. 2006). A
probable diagnosis of IPF can be made off HRCT scans without surgical lung
biopsy if all of the other conditions mentioned above are met along with 3 of the 4
following minor criterion: over 50 years of age, gradual onset of unexplained
dyspnea (shortness of breath) on exertion, illness lasting greater than or equal to

4
3 months, and “Velcro” like bibasilar crackles during inhalation (American
Thoracic Society and the European Respiratory Society American Thoracic
Society 2000; Kim et al. 2006). TBB and BAL results must also support no other
alternative diagnosis in order to classify a patient as having probable IPF
(American Thoracic Society and the European Respiratory Society American
Thoracic Society 2000; Kim et al. 2006).
Clinical Features:
Onset of IPF is typically a gradual process, with symptoms commonly
present in patients for more than 6 months before diagnosis (American Thoracic
Society and the European Respiratory Society American Thoracic Society 2000;
Kim et al. 2006). IPF patients are typically over 50 years of age and show a
slight bias toward males (American Thoracic Society and the European
Respiratory Society American Thoracic Society 2000; Selman et al. 2001; Kim et
al. 2006). Though periods of rapid decline are sometimes seen (acute
exacerbations), the disease typically progresses through a gradual decline in
lung function, with early disease patients potentially presenting with pulmonary
function test results within the normal range. Overall survival, however, averages
only 2-4 years from the time of diagnosis with limited treatment options
(American Thoracic Society and the European Respiratory Society American
Thoracic Society 2000; American Thoracic Society and the European Respiratory
Society 2002; Kim et al. 2006; Noth and Martinez 2007).

5
Radiological Features:
Chest x-rays of IPF typically reveal reticular opacities most commonly
seen along the bases of the lungs. HRCT scans reveal similar features with
common honeycombing and less frequent ground glass abnormalities. As the
disease progresses areas of ground glass may decline while honeycombing,
indicating advancing fibrosis, increases. The size of honeycombing cysts may
also increase over time.
Histological Features:
The UIP pattern of histology is defined by the overall destruction of lung
architecture through the advancement of the fibrotic process. Presentation
throughout the lung is heterogeneous, with areas of fibrosis, honeycombing,
interstitial inflammation, and normal lung. Inflammation is typically only mild to
moderate, while fibrotic regions are composed of fibroblastic foci and dense
acellular collagen. Regions with honeycomb changes reveal cysts lined with
bronchiolar epithelium and filled with mucins.
Epidemiology:
The prevalence of Interstitial Pulmonary Fibrosis (IPF, the most common
IIP) was recently estimated at 14.0 to 42.7 per 100,000 for the United States
(Raghu et al. 2006), though the actual prevalence may be much higher, due to a
tendency for misdiagnosis of IIPs (Noth and Martinez 2007).

6
1.1.2 Nonspecific Interstitial Pneumonia (NSIP)
Diagnosis:
While NSIP refers to a distinct histological diagnosis separate from IPF,
there is no recognized clinical description to separate out patients with NSIP from
other IIP diagnoses. This is of clinical importance, since patients with NSIP tend
to have a much better prognosis than those with IPF and respond better to
treatment (American Thoracic Society and the European Respiratory Society
2002; Kim et al. 2006). NSIP may in fact represent multiple disease entities that
have yet to be clinically distinguished.
Clinical Features:
The clinical features of NSIP are less well defined than IPF. Patients with
NSIP, however, tend to present at a younger age than those with IPF with an
average age of onset between 40-50 years of age (American Thoracic Society
and the European Respiratory Society 2002). Symptoms have typically occurred
for a longer period of time before diagnosis, as well, with an average of 18-31
months (American Thoracic Society and the European Respiratory Society
2002). Onset of symptoms is similarly gradual, but overall lung function is
typically higher than patients with IPF diagnoses. NSIP may occur in children,
does not show any sex bias, and does not appear to be associated with cigarette
smoking. Additionally, the prognosis for NSIP patients is much better with some
7
patients exhibiting an almost complete recovery while many others stabilize upon
treatment.
Radiological Features:
NSIP HRCT scans show a predominance of ground glass due to
interstitial inflammation, with little to no honeycombing or fibrosis. Thus, NSIP
may typically be distinguished from IPF on HRCT review by the presence of high
levels of ground glass attenuation without honeycombing.
Histological Features:
The NSIP pattern may be either predominantly inflammatory or a
combination of both inflammation and fibrosis. In both variations fibroblastic foci
(a key lesion distinguishing UIP) are absent. Chronic interstitial inflammation
occurs with an infiltrate primarily consisting of lymphocytes and plasma cells.
1.1.3 Cryptogenic Organizing Pneumonia (COP)
Diagnosis and Clinical Features:
COP, otherwise known as bronchiolitis obliterans organizing pneumonia
(BOOP), is another type of IIP consistent with a pattern of organizing pneumonia
(organization within the alveoli and alveolar ducts) without organization within the
bronchioles. The mean age at onset is 55 years of age with no sex bias
8
(American Thoracic Society and the European Respiratory Society 2002). There
is however, a bias towards non-smokers in COP patients with non-smokers
outnumbering smoking patients 2:1 (American Thoracic Society and the
European Respiratory Society 2002). In general, patients with COP present
earlier, with an average of less than 3 months of symptoms including dyspnea
and cough (American Thoracic Society and the European Respiratory Society
2002). The onset of symptoms typically occurs after suspected lower respiratory
tract infection. Only rarely do cases of COP lead to respiratory failure and death,
with most patients responding well to corticosteroid treatment leading to
complete recovery. A significant number of patients relapse however, once
treatment is stopped.
Radiological Features:
Chest x-rays of COP patients typically reveal areas of consolidation, often
along the bases of the lungs. These regions of lung consolidation are also seen
on HRCT scan (predominantly of a subpleural or peribronchial distribution), with
approximately half of all COP patients also showing regions of ground glass
attenuation.

9
Histological Features:
In COP patients the lung architecture remains mainly preserved with
patches of organizing pneumonia. Most changes occur in small airways (those
with internal diameters of < 2 mm) with only mild inflammation.
1.1.4 Acute Interstitial Pneumonia (AIP)
Diagnosis and Clinical Features:
AIP is a rapidly progressing form of IIP. Patients present with a pattern
indistinguishable from acute respiratory distress syndrome (ARDS), but of
unknown cause. The mean age at onset is 50 years of age, though patients
present over a wider age range than many IIPs (American Thoracic Society and
the European Respiratory Society 2002). AIP also shows no bias associated
with sex or smoking status. There is a very rapid onset of symptoms, with severe
dyspnea developing typically over the course of only a few days and presentation
within only a few weeks of symptom onset. Many patients have also experienced
a prior viral upper respiratory tract infection. Mortality from AIP is high and often
occurs within only 1-2 months of disease onset (American Thoracic Society and
the European Respiratory Society 2002). There is no proven treatment for AIP
and those that recover may go on to relapse or develop chronic and progressive
DPLD.
10
Radiological Features:
Consolidation and ground glass attenuations are the most common
radiologic findings of AIP, with the amount of ground glass correlating with the
duration of disease. Patients with AIP are also more likely to have lower lung
involvement than similar ARDS patients.
Histological Features:
AIP patients show a pattern of diffuse alveolar damage (DAD). The
presence of hyaline membranes (a fibrous layer that develops in the alveoli) is a
hallmark of DAD and can be used to help distinguish cases of AIP from other
forms of IIP.
1.1.5 Respiratory Bronchiolitis Interstitial Lung Disease (RB-ILD) and Desquamative Interstitial Pneumonia (DIP)
Diagnosis and Clinical Features:
RB-ILD and DIP may in fact be part of a spectrum of disease, with DIP
representing the end stage of RB-ILD. Thus, these two diseases are discussed
together here. Both RB-ILD and DIP primarily affect current smokers between
40-60 years of age with an average of over 30 pack-years of cigarette smoking.
Males are also more commonly diagnosed with both diseases 2:1 (American
Thoracic Society and the European Respiratory Society 2002). Most patients
present with a gradual onset of dyspnea and cough. In RB-ILD the majority of

11
patients improve after the cessation of smoking, while DIP patients tend to
improve with smoking cessation and corticosteroid treatment. Both diseases
have high survival rates.
Radiological Features:
Both RB-ILD and DIP show ground glass attenuation upon HRCT scan,
though the ground glass is typically patchier and less extensive in RB-ILD. RB-
ILD patients also show a thickening of the walls of the central and peripheral
airways. The two diseases, however, may be indistinguishable upon radiologic
review.
Histological Features:
Both RB-ILD and DIP are characterized by the accumulation of
macrophages within airspaces. In RB-ILD this accumulation typically occurs in
respiratory bronchioles, peribronchiolar alveolar spaces, and alveolar ducts,
while in DIP the accumulation of macrophages occurs in a more diffuse and
uniform manner across the whole lung.
1.1.6 Lymphoid Interstitial Pneumonia (LIP)
Diagnosis and Clinical Features:

12
The clinical presentation of LIP is not well defined, in part due to its low
incidence as an idiopathic disease. Most patients present in their 50s though LIP
may occur at any age (American Thoracic Society and the European Respiratory
Society 2002). Women are also more frequently diagnosed with LIP than men.
Onset for LIP is a slow process typically occurring over more than 3 years with
progressively worsening dyspnea and cough (American Thoracic Society and the
European Respiratory Society 2002). Know causes for LIP such as collagen
vascular disease, immunodeficiency, and other autoimmune disorder must also
be considered. Corticosteroid treatment is typically used to improve symptoms in
LIP patients, however over a third of individuals progress to a fibrotic phenotype
(American Thoracic Society and the European Respiratory Society 2002).
Radiological Features:
HRCT scans of LIP patients show diffuse ground glass with perivascular
cysts or honeycombing. Approximately half of all LIP patients also exhibit
reticular abnormalities (American Thoracic Society and the European Respiratory
Society 2002).
Histological Features:
The LIP pattern is defined by dense interstitial lymphoid infiltrate. Diffuse
lymphoid hyperplasia (hyperplasia of bronchial mucosa-associated lymphoid
tissue (MALT)) is also frequently seen.

13
1.2 Familial Interstitial Pneumonia
1.2.1 Evidence for a Genetic Component
In support of a genetic component to IIP, the IIPs have been reported to
aggregate in families (classified as familial interstitial pneumonia, FIP) (Bitterman
et al. 1986; Marshall et al. 1997; Hodgson et al. 2002; Steele et al. 2005) and
amongst twins reared apart (Javaheri et al. 1980). Although several studies
(Mageto and Raghu; Marshall et al.; Marshall et al.) have suggested that at least
5% of IIP cases are familial, this is likely an underestimate of the true prevalence
of FIP in the population (Steele et al. 2005). Moreover, approximately half of the
families with FIP are phenotypically heterogeneous with two or more types of IIP
seen amongst family members indicating that multiple genes and/or
environmental risk factors may play a role in the pathogenesis of disease (Steele
et al. 2005). To date, polymorphisms in three genes (surfactant protein C
(SFTPC), telomerase reverse transcriptase (TERT), and the RNA component of
telomerase (TERC) (Thomas et al. 2002; Whitsett 2002; Chibbar et al. 2004;
Tredano et al. 2004; Setoguchi et al. 2006; Armanios et al. 2007; Tsakiri et al.
2007) have been reported to associate with the FIP phenotype; thus, providing
further support for genetic heterogeneity as no single gene appears to account
for all instances of disease.
14
1.2.2 Evidence for an Environmental Component
Environmental exposures such as asbestos, cigarette smoke, radiation,
viruses, and certain medications are also associated with the development of
pulmonary fibrosis (Selman et al. 2001; Dempsey 2006). It has yet to be
determined, however, how genetic and environmental risk factors interact to
modulate the risk of developing FIP. Nevertheless, environmental exposures are
difficult to quantitate, especially in late onset diseases, therefore stratification by
phenotype may allow for the identification of more homogeneous sub-groups of
families that share undefined genetic and/or environmental risk factors.
1.3 Disease Pathogenesis
The etiology of both FIP and the IIPs in general remains unknown. IPF
has been the most studied form of IIP, and yet even here current knowledge
cannot explain the pathogenesis of disease. No animal model can currently
replicate the full IPF phenotype seen in humans, for even the often used
bleomycin model of pulmonary fibrosis produces a phenotype with rapid onset
that does not mimic the progressive course of human IPF disease (Borzone et al.
2001; Chua et al. 2005; Hunninghake and Schwarz 2007). Overall there remains
no effective therapeutic treatment for IPF that can alter the progression of
disease, nor is the process through which the disease develops and progresses
understood.

15
1.4 Problem/Purpose
Identify genetic loci and candidate genes involved in the development of
familial pulmonary fibrosis.
1.5 Hypothesis
Familial Interstitial Pneumonia (FIP) is a genetically heterogeneous
disease with multiple genetic and environmental risk factors leading to a disease
phenotype in different sub-populations. Stratification of families into various sub-
groups based on environmental exposures and phenotypic classifications will
create more homogeneous populations and thus allow for easier identification of
genetic risk factors for FIP.
1.6 Specific Aims
In order to test this hypothesis, and thus identify loci and candidate genes
involved in FIP, three specific aims were set forth.
1.6.1 Specific Aim 1: Defining the Phenotype
It had previously been noted by Steele et al. that approximately half of the
families in the FIP cohort showed a homogeneous pattern of disease diagnosis
(with all individuals diagnosed with IPF) while the other half showed a

16
heterogeneous phenotype (with multiple different IIP diagnoses within a single
family, including at least one case of IPF). Given this observation, we wished to
investigate whether these two phenotypic groups (homogeneous and
heterogeneous families) exhibited differing demographic or clinical
characteristics.
1.6.2 Specific Aim 2: Linkage Studies in Familial Interstitial Pneumonia
In specific aim 2, linkage analysis methods were explored to both identify
and refine candidate genetic loci for FIP in a series of 82 families. To begin, a
microsatellite whole genome linkage screen was conducted to detect genetic loci
potentially involved in FIP. The chromosome 10 region of interest was then
looked at in more detail using additional fine-mapping SNP markers to narrow the
candidate region. Finally, ordered subset analysis (OSA) was conducted looking
at all 3 regions of interest (chromosome 10, 11, and 12) by one another to
determine if the different regions were interacting loci or a sign of genetic
heterogeneity within disease. Smoking was also examined as an environmental
risk factor using OSA for chromosomes 10, 11, and 12.
1.6.3 Specific Aim 3: Association Studies in Familial Interstitial Pneumonia
In specific aim 3, association studies were used to identify candidate
genes within the regions of interest identified by the previous linkage analysis.
17
Initially, the chromosome 10 fine-mapping markers were analyzed using family-
based association approaches. Two candidate genes identified in the
chromosome 11 linkage region were also explored, MUC2 and MUC5AC. The
mucin genes (MUC2 and MUC5AC) were re-sequenced, genotyped, and
analyzed using both single marker and haplotype association analyses.

18
2. Defining the Phenotype
2.1 Background
2.1.1 Clinical Measures
Dyspnea
Dyspnea refers to a difficulty breathing or overall shortness of breath. For
this study the ATS Grade of Breathlessness Scale (also known as the Medical
Research Council Breathlessness Scale) was used to assess the level of
dyspnea. This scale assesses functional dyspnea via a series of questions with
yes or no responses corresponding to 6 grades, 0 through 5 (Table 1).
Table 1: ATS Grade of Breathlessness Scale
Grade
0 Absent, a no response to all questions.
1 Are you ever troubled by breathlessness except on strenuous exertion?
2 If yes: Are you short of breath when hurrying on the level or walking up a slight hill?
3 If yes: Do you have to walk slower than most people on the level? Do you have to stop after a mile or so (or after 30 min) on the level at your own pace?
4 If yes to either: Do you have to stop for breath after walking about 100 yards (or after a few minutes) on the level?
5 If yes: Are you too breathless to leave the house, or breathless after undressing?

19
Forced Vital Capacity
Patients forced vital capacity (FVC) was also measured. FVC is the
amount of air that can be blown out after full inspiration, measured in liters. The
FVC test is carried out using a spirometer into which the patient is asked to
exhale as hard as possible for as long as possible. Since the FVC test is highly
dependent upon patient compliance this test is a conservative measure and
cannot overestimate vital capacity. In order to produce a more reliable measure,
the FVC test is typically repeated multiple times (ATS standards require a
minimum of three replicates) with less than or equal to 0.2L difference between
tests (Miller et al. 2005). Typically no more than 8 replicates are preformed, even
if reliability criterion cannot be met, the highest result is then reported along with
any notes about failure to meet test reliability criterion (Miller et al. 2005).
Diffusing Capacity of the Lungs for Carbon Monoxide (DLCO)
The ability of the lungs to exchange gas across the alveolar-capillary
interface is affected by a number of lung properties (both structural and functional
in nature) and thus can be used to indicate a pathological state or track its
progression over time through the measurement of the diffusing capacity of the
lungs for carbon monoxide (DLCO). Some of the structural properties of the lungs
that can affect DLCO include: the overall gas volume of the lungs, the thickness of
the alveolar capillary membrane, the volume of blood in capillaries supplying

20
ventilated alveoli, and any type of airway closure. Similarly, changes in
functional properties such as: the diffusion characteristics of the alveolar capillary
membrane, the composition of the alveolar gas, absolute levels of ventilation and
perfusion, and the uniformity of their distribution with respect to each other can all
affect DLCO. Since the process of fibrosis leads to the formation of scar tissue
and structural changes to the lungs, DLCO is decreased in patents with IIP and
continues to decrease with disease progression and declining lung function.
DLCO is typically reported by ATS standards as: mL (standard temperature,
pressure and dry (STPD))·min–1·mmHg–1 (Macintyre et al. 2005).
2.2 Investigating Phenotypic Heterogeneity
2.2.1 Methods
Family Ascertainment and Phenotyping
One hundred and forty-two families were ascertained and phenotyped
according to previous methods ((Steele et al. 2005), Speer et al. unpublished
data). Briefly, families were ascertained by a combination of web-based
advertising and direct to physician mailings. Once potential families were
identified, ascertainment was completed by one of three centers located in the
United States (Duke University Medical Center, Durham, NC; Vanderbilt
University, Nashville, TN; and National Jewish Medical and Research Center,
Denver, CO) which obtained informed consent from all participants and enrolled

21
eligible families. Families were included in the study if at least two members of a
nuclear family (parent, child, or sibling) were diagnosed with or suspected of
having a form of IIP. Families were excluded in which affected individuals were
diagnosed prior to 20 years of age, disease was of known rather than idiopathic
origin, and/or the IIP diagnosis was made as part of a larger genetic syndrome.
Institutional review board approval was received from all institutions involved in
the study along with a certificate of confidentiality obtained from the National
Institutes of Health (Bethesda, MD).
All participants from enrolled families were asked to complete a dyspnea
assessment based on the ATS-DLD-78 questionnaire (Ferris 1978) along with
chest radiography and carbon monoxide diffusing capacity (DLCO) testing at a
health facility convenient to them. Individuals who self reported an IIP diagnosis,
had an abnormal chest radiograph suggestive of IIP, unexplained dyspnea of
grade 2 or greater, or a DLCO of less than 80% were then asked to undergo an
additional high-resolution computed tomography (HRCT) scan. These radiologic
images were then given independent reads by two separate pulmonary clinicians
(MPS and DAS) on the project, who were blinded to the clinical history of the
individuals in question. In the case of disagreement between the two
investigators a consensus read was made, and when consensus was not
reached, a radiologist (PM) evaluated the radiograph. Standard classifications
for definite, probable, and possible, IIP diagnoses were made using ATS
diagnostic conventions (described in more detail below). Participants whose
22
HRCT scan was suggestive of IIP were also recommended to undergo a surgical
lung biopsy in order to make a definite diagnosis. All information received from
participant medical histories, questionnaires, DICO testing, and radiographic
images was recorded at the Center for Human Genetics at Duke University in a
secure and coded database (PEDIGENE).
Families were defined as having FIP if two or more individuals received a
consensus diagnosis of definite or probable IIP within three degrees of
relationship (i.e. parent and child, siblings, cousins, aunt/uncle and
niece/nephew). Individuals were defined as definitely affected given surgical
lung biopsy or autopsy diagnosis of IIP. A probable diagnosis was made based
on HRCT scan results indicating honeycombing or bilateral reticular
abnormalities with or without ground glass opacities given no other explanation
for interstitial abnormalities along with either a DLCO of less than 80% predicted
or a dyspnea grade of 2 or higher. Possibly affected was defined as those
individuals who exhibited signs suggestive of IIP in chest radiographs, but who
elected not to undergo additional testing necessary to make a more definite
diagnosis. In order to be classified as unaffected an individual’s chest radiograph
had to exhibit no evidence for ILD along with a DLCO greater than 80% predicted
and a dyspnea grade of 0 or 1. A classification of indeterminate was used when
the investigators felt that the quality of data available was unreliable to make a
definitive diagnosis. When families included deceased subjects with a history of
potential IIP, autopsy reports, lung biopsy specimens, pathology reports,

23
radiology reports, and medical records were reviewed by both investigators in
order to make the best possible classification given the available evidence. For
all analyses, only individuals with definite or probable IIP diagnoses were
considered affected.
The families were additionally divided into two phenotypic classifications:
homogeneous families where all cases were diagnosed with IPF and
heterogeneous families where more than one IIP diagnosis was observed
amongst the affected family members, including at least one case of IPF.
Phenotypic Assessment
Current age, age at diagnosis, age at death, mortality, gender, dyspnea
grade, percent predicted forced vital capacity, percent predicted diffusing
capacity of carbon monoxide (DLCO), and cigarette smoking history were all
evaluated between affected individuals from homogeneous and heterogeneous
families using standard statistical measures (mean and standard deviation). For
all analyses univariate comparisons were made using Fisher’s exact test and
two-tailed Student t tests with equal variance.
2.2.2 Results
One hundred and forty-two families were identified with two or more
consensus diagnosed cases of IIP; 74 of the families displayed a homogeneous

24
phenotype (177 affected individuals all with IPF diagnoses) while the remaining
68 families were considered heterogeneous (125 affected individuals with IPF
and 84 affected individuals with other IIPs (30 NSIP, 3 COP, 2 AIP, 1 RB-ILD,
and 48 other unclassifiable IIP)) (Table 2).
Table 2: Demographic and Clinical Characteristics of 142 Families
Homogeneous Families
(N=74 families)
Heterogeneous Families (N=68 families)
All Cases (All IPF-type)
All Cases
IPF-type Cases Only
Other IIP Cases Only
Probable, # 144/390 156/501 85, NA 71, NA
Definite, # 33/390 53/501 40, NA 13, NA
Male, # 106/177 110/209 69/125 41/84
Age at diagnosis, mean (SD)
68 (13) 62 (13) 61 (13) 64 (13)
Survival, # 107/177 96/209, p=0.006
50/125, p=0.0003
47/84
Age at death, mean (SD)
69 (10) 64 (12), p=0.007
65 (11), p=0.03
63 (13), p=0.01
Current smoker, # 6/151 19/178, p=0.02
7/107 12/71, p=0.002
Former smoker, # 99/151 90/178, p=0.007
59/107 31/71, p=0.002
Never smoker, # 42/151 64/178 37/107 27/71
Dyspnea class 0, # 29/138 33/138 17/76 16/62
Dyspnea class 1-2, # 34/138 36/138 21/76 15/62
Dyspnea class 3-4, # 40/138 35/138 16/76 19/62
Dyspnea class 5, # 35/138 34/138 22/76 12/62
Vital capacity, mean (SD)
68 (20) 67 (19) 65 (19) 72 (18)
DLco, mean (SD) 48 (20) 51 (21) 47 (19) 56 (23), p=0.01
25
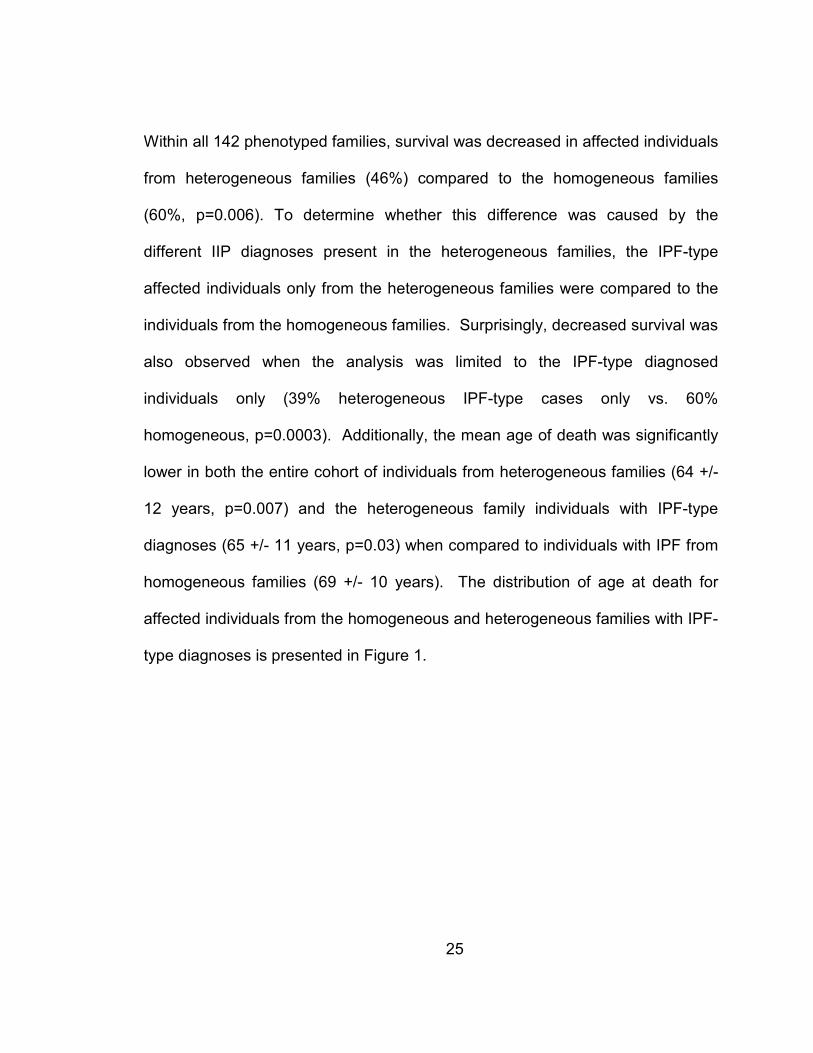
Within all 142 phenotyped families, survival was decreased in affected individuals
from heterogeneous families (46%) compared to the homogeneous families
(60%, p=0.006). To determine whether this difference was caused by the
different IIP diagnoses present in the heterogeneous families, the IPF-type
affected individuals only from the heterogeneous families were compared to the
individuals from the homogeneous families. Surprisingly, decreased survival was
also observed when the analysis was limited to the IPF-type diagnosed
individuals only (39% heterogeneous IPF-type cases only vs. 60%
homogeneous, p=0.0003). Additionally, the mean age of death was significantly
lower in both the entire cohort of individuals from heterogeneous families (64 +/-
12 years, p=0.007) and the heterogeneous family individuals with IPF-type
diagnoses (65 +/- 11 years, p=0.03) when compared to individuals with IPF from
homogeneous families (69 +/- 10 years). The distribution of age at death for
affected individuals from the homogeneous and heterogeneous families with IPF-
type diagnoses is presented in Figure 1.
26
0
2
4
6
8
10
12
14
16
18
20
40-44 45-49 50-54 55-59 60-64 65-69 70-74 75-79 80-84 85-89
Age at Death
Number of Individuals
IPF-type Heterogeneous
Homogeneous
Figure 1: Comparison of Age at Death within IPF Individuals
Moreover, affected individuals with other types of IIP from heterogeneous
families were also found to have a younger age at death when compared to
affected individuals from homogeneous families (63 +/- 13 vs. 69 +/- 10 years,
p=0.01). Furthermore, the affected individuals from the heterogeneous families
with other types of IIP exhibited a significantly higher mean DLCO than the
individuals from IPF-only families (56% +/- 23 vs. 48% +/- 20, p=0.01). Although
survival and age at death may also be related to whether a case is classified as
being definite or probable, there were no statistically significant differences in the
distribution of definite vs. probable cases within the homogeneous IPF only vs.

27
the heterogeneous families. It therefore appears that homogeneous IPF only
families and heterogeneous families have unique phenotypic characteristics that
potentially influence the course of disease, including a significantly lower average
age at death within cases from heterogeneous families regardless of IIP
diagnosis.
2.2.3 Conclusions
Individuals from heterogeneous families (with more than one type of ILD
diagnoses within the family) show decreased survival as compared to individuals
from homogeneous families (with only the IPF type diagnosis). These individuals
from the heterogeneous families also presented with a younger age at death
when compared to individuals from the homogeneous families. Since individuals
with different ILD disease diagnoses may have different survival rates, the IPF
diagnosed individuals only from the heterogeneous families (125 IPF cases)
were compared to the homogeneous family individuals (177 IPF cases), so that
only IPF diagnosed individuals were being evaluated. Surprisingly, the same
results were found in the IPF only comparison, with individuals with IPF from
heterogeneous families showing decreased survival at a younger age at death as
compared to individuals from homogeneous families. For comparison, the
individuals with ILD diagnoses other than IPF from the heterogeneous families
were also compared to the individuals from homogeneous families with IPF. The

28
individuals with other ILD diagnoses from the heterogeneous families were also
found to have a younger age at death, though their survival was similar to that of
individuals from homogeneous families. Survival and age at death may also be
related to whether a case is classified as being definite or probable. To further
ensure that the difference in survival and age at death was not due to a variation
in the distribution of definite and probable diagnoses within the two family groups,
the percentage of definite/probable cases within each group (homogeneous and
heterogeneous) was compared. There was no statistically significant difference
found in the distribution of definite vs. probable cases within the heterogeneous
and homogeneous families. Thus, it appears that individuals from
heterogeneous families are indeed presenting with more aggressive disease.
Furthermore, the differences seen between the individuals from heterogeneous
and homogeneous families argue for potential genetic heterogeneity within FIP
with different genetic susceptibilities or environmental risk factors playing a role
in the manifestation of FIP within the two groups. Evidence for genetic
heterogeneity is further supported by the apparent differences in survival and age
of death seen between individuals presenting with the same IPF phenotype
depending upon whether they come from a heterogeneous or homogeneous
family.

29
3. Linkage Studies in Familial Interstitial Pneumonia
3.1 Background
3.1.1 Linkage Analysis
When two genes are linked their alleles tend to segregate together during
meiosis more often than not. Thus, there will be fewer recombination events
between two linked genes than two unlinked genes. Two genetic loci are
completely linked when no recombinants are seen. Since genes that are close
together are less likely to have a recombination event occur between them, the
proportion of recombinant to non-recombinant events can be used to determine
the distance between two genetic loci. Therefore, linkage analysis can be used
to find regions of interest that are near to a disease gene locus. Linkage is thus
a property of loci, and indicates a location likely to harbor a disease gene.
Genetic heterogeneity is also an important component of linkage analysis,
as multiple genes may act independently to cause the same disease phenotype.
When this occurs, though the disease phenotype may be the same, multiple
genotypes are involved, so linkage scores will be reduced. Such genetic
heterogeneity is likely to be found with the FIP phenotype, due to the multiple
different IIP diagnoses seen within families. In order to help limit this
heterogeneity factor, analyses can be run using a more stringent phenotype
definition (for example, grouping families by specific FIP diagnosis).
30
Parametric Linkage Analysis
Parametric linkage analysis requires knowledge about the genetic model
to be specified. In order to run a parametric linkage analysis, mode of
inheritance, allele frequency and number, mutation rates, and penetrance must
be specified for both the disease and markers. Though it requires the most pre-
specified information, parametric linkage analysis is the most powerful method
for linkage detection. However, if the starting parameters are miss-specified
parametric linkage analysis results can prove misleading. Parametric linkage
calculations result in a traditional LOD score.
Non-parametric Linkage Analysis
Non-parametric linkage analysis, on the other hand, is a genetic model
independent approach. It does not require prior knowledge of disease/gene
model parameters, but does require an accurate definition of the disease
phenotype. Sib Pair and Affected Relative Pair methods are examples of non-
parametric linkage methods. Though not as powerful for detecting linkage, non-
parametric linkage approaches are a more conservative measure for detecting
linkage. Thus, in order to be conservative with the linkage calculation for the FIP
families non-parametric linkage methods were preferable since the genetic model
is unknown. Non-parametric linkage calculations result in statistics such as NPL
(Non-parametric linkage) scores.
31
3.1.2 Merlin Linkage Analysis and Model Parameters
Most multipoint linkage analysis packages available today are based off of
either the Elston-Stewart (Elston and Stewart 1971) or Lander-Green (Lander
and Green 1987) algorithm. Both algorithms have limitations, the Elston-Stewart
algorithm is restricted by the number of markers that can be tested, though larger
pedigrees can be run; while the Lander-Green algorithm can handle larger
numbers of markers, but is restricted by pedigree size. The Merlin program
(Abecasis et al. 2002) uses a modification of the Lander-Green algorithm in order
to improve computation time and increase the number of markers that can be
tested. Merlin implements a sparse binary tree–based pedigree analysis to
determine gene flow, rather than the traditional Markov chain calculated
likelihoods. Since many potential gene flow patterns may have the same
outcome, the use of sparse binary trees allows for identical outcomes to be
combined into symmetric and premature leaf nodes decreasing computational
time and storage requirements.
NPL scoring functions Sall and Spairs
Two individuals who have the same allele, are said to share this allele
identity by state (IBS), thus unrelated individuals can share alleles IBS. Two
individuals share an allele identity by decent (IBD), when they have the same
allele, and it can be shown that this allele was inherited from some relative
common to both individuals. Therefore, only related individuals can share alleles

32
IBD. The Spairs scoring function (Whittemore and Halpern 1994) counts the # of
pairs of alleles that distinct affected pedigree members share IBD. Alternatively,
the Sall scoring function (Whittemore and Halpern 1994) calculates the average #
of permutations that preserve a collection of alleles obtained by choosing 1 allele
from each affected person (Sall(v) = 2-a Σ [ Π bi (h)! ]). Where, a = # of affected
individuals, h = collection of alleles generated by taking 1 allele from each
affected (2a), 2f = # of founder alleles, bi(h) = # of a specific founder allele (i) in
the collection (h). Thus, Sall increases as the number of affected individuals
sharing the same allele increases. Given that the FIP pedigrees are of variable
size it is preferable to use the Spairs scoring function as a conservative measure in
order to prevent large families from having a greater influence over the NPL
score calculation.
Correcting for LD
When using large numbers of SNP markers it is also important to correct
for LD between markers since such LD between markers has been shown to
inflate multipoint linkage calculations, especially in cases where there are
missing parental genotypes for affected individuals (Boyles et al. 2005). As this
is often the case with the FIP families, a LD cut off of r2 greater or equal to 0.1
was utilized (since linkage inflation has been observed with LD as low as r2=0.16
(Boyles et al. 2005)). In order to model LD, Merlin groups both SNP and
microsatellite markers into clusters based on the r2 threshold specified.

33
Haplotype frequencies are then used to assume LD within each cluster. It is also
assumed that there is no LD between clusters and no recombination within each
cluster. These however, appear to be reasonable assumptions for most
datasets.
Linear vs. Exponential Model
A selection must also be made between using a linear or exponential
model (Kong and Cox 1997). Merlin defaults to the use of a linear model which
is quicker to calculate and good for detecting small increases in IBD sharing
amongst a large numbers of pedigrees, the typical case in many common
complex diseases. An exponential model was selected for the FIP pedigrees,
however, since it provides a better estimation for small numbers of pedigrees
with greater IBD sharing. Using an exponential model is more computationally
intense, but the results are a better approximation for pedigrees with a high level
of IBD sharing.
3.1.3 OSA Method
Ordered subset analysis (OSA) uses family level covariate data to define a
subset of families that maximize linkage, thus identifying a potentially more
homogeneous subset of families for further analysis (Kong and Cox 1997;
Hauser et al. 2004). To accomplish this, OSA adds families into the linkage

34
analysis based on their covariate level, testing families from both low-to-high and
high-to-low covariate values. Due to the multiple testing inherent in the OSA
approach, empirical p-values for the significance of the increase in linkage seen
in the OSA selected subset of families compared to the overall LOD for the
region tested are calculated based on 10,000 replicates.
3.2 Whole Genome Linkage Screen
3.2.1 Methods
Clinical data collection
Subject ascertainment occurred through web-based advertising
(www.fpf.duke.edu/ and www.nhlbi.nih.gov/studies/fibrosis/) and direct mailings
to physician members of the American Thoracic Society (ATS) to identify
potential families. A toll-free number (877-487-4411) was established to
facilitate subject participation.
Family, Ascertainment, and Phenotyping
Three sites in the United States (National Jewish Medical and Research
Center Denver, CO; Vanderbilt University, Nashville, TN; and Duke University
Medical Center, Durham, NC) were established to identify subjects with FIP, and
to enroll and phenotype probands and family members. The study was approved
by the respective institutions’ institutional review boards (IRB) and a certificate of

35
confidentiality was obtained from the National Institutes of Health. Following
informed consent, all subjects were asked to complete a detailed health and
environmental exposure questionnaire, and to obtain a chest radiograph (PA and
lateral) and a carbon monoxide diffusing capacity (DLCO) measurement at a local
health facility. Dyspnea was assessed utilizing the assessment described in the
ATS-DLD-78 questionnaire (supplemental methods) (Ferris 1978). We obtained
a high resolution chest CT (HRCT) scan in the prone and supine position on
those subjects who had either unexplained dyspnea of grade 2 or greater, an
abnormal chest radiograph suggestive of interstitial lung disease (ILD), a DLCO <
80% predicted, or those who self-reported a diagnosis of ILD. All radiologic
images were forwarded to Duke University and independently interpreted by two
investigators (MPS and DAS) who were blinded to the clinical history. Standard
criteria (American Thoracic Society and the European Respiratory Society
American Thoracic Society 2000; Hunninghake et al. 2001; American Thoracic
Society and the European Respiratory Society 2002) were used to establish the
diagnosis of IIP and inconsistencies between the individual readers were
resolved by a consensus read. In the unusual event when these readers were
unable to reach a consensus diagnosis, the HRCT was read by the study
radiologist (PM). Subjects with a HRCT scan suggestive of IIP were
recommended to undergo a surgical lung biopsy. All phenotype data, including
questionnaires, relevant medical history, digitized radiographic images, and lung
36
function measurements, were entered into PEDIGENE (Haynes et al. 1995), a
secure, coded database.
DNA Specimens
Subject DNA was isolated from whole blood with a Gentra Autopure
robotics workstation (Gentra Systems, Minneapolis MN), and quantified by UV
spectrophotometry on a Nanodrop ND-1000 spectrophotometer (Nanodrop
Technologies, Wilmington DE). All samples were barcoded and entered into an
Oracle-based LIMS database (NautilusTM LIMS, THERMO Electron Corporation,
Waltham, MA).
Diagnostic Assignment of Study Subjects
For the purposes of this study, a diagnosis of FIP required the presence of
2 or more cases of probable or definite IIP in individuals related within three
degrees. We used criteria established by the American Thoracic Society (ATS)
and European Respiratory Society (ERS) to guide the classification of patients
with ILD (American Thoracic Society and the European Respiratory Society
American Thoracic Society 2000; American Thoracic Society and the European
Respiratory Society 2002). Diagnostic categories were unaffected, possible
affected, probable affected, and definite affected. Unaffected was defined as no
evidence of interstitial lung disease on chest radiograph, DLCO ≥ 80% predicted,
and a dyspnea level of 0 or 1 using the ATS dyspnea scale. Definitely affected
37
was defined as either surgical lung biopsy or autopsy evidence of an IIP with an
appropriate clinical history. Lung biopsy samples were classified by one of us
(TAS) according to revised criteria for the diagnosis of IIPs (American Thoracic
Society and the European Respiratory Society 2002). Probably affected was
defined as bilateral reticular abnormalities associated with honeycombing on
HRCT. If honeycombing was absent, bibasilar reticular abnormalities, with or
without ground glass opacities in the absence of other explanations for interstitial
abnormalities (American Thoracic Society and the European Respiratory Society
American Thoracic Society 2000; Hunninghake et al. 2001) on HRCT, plus either
dyspnea of grade 2 or greater or a DLCO < 80% also met the definition. Possibly
affected was defined as those subjects with chest radiographs suggestive of ILD
who did not have additional testing to establish a more certain diagnosis.
Indeterminate was used for those subjects for whom the investigators thought the
technical quality of the data was unreliable. For deceased subjects, all relevant
material (medical records, radiology reports, autopsy reports, archived lung
biopsy slides, and pathology reports) was sought but among the 5 deceased
subjects only medical records were obtained. These records were independently
reviewed by study investigators (MPS and DAS), were classified using the best
available evidence, and in all 5 cases, the two investigators agreed on the
diagnosis.

38
Genotyping Methods
The initial genomic screen of 50 families included 1198 microsatellite
repeat markers, however as additional families were added at a later date the
composition of the Decode linkage panel evolved. Thus, markers with less than
95% efficiency (% called genotypes), along with marker which had been typed on
less than half the families, were eliminated from the analysis, leaving a total of
884 markers with an average inter-marker distance of 4.2 cM (range = 0.001 to
27.4 cM, 0.001 to 17.8 cM excluding the X-chromosome).
Error Checking
Mendelian pedigree inconsistencies were identified using PEDCHECK
(O'Connell and Weeks 1998) and checked by laboratory technicians who were
blinded to the pedigree structure. Further verification of inter and intra-familial
genetic relationships was performed using RELPAIR (Boehnke and Cox 1997;
Epstein et al. 2000) at the beginning of the study using the first 50 genotyped
markers and then later using all 884 genotyped markers.
Phenotypic Assessment
Current age, age at diagnosis, age at death, mortality, gender, dyspnea
grade, percent predicted forced vital capacity, percent predicted diffusing
capacity of carbon monoxide (DLCO), and cigarette smoking history were all
evaluated using all affected family members of the 82 pedigrees that were
39
genotyped and standard statistical measures (mean and standard deviation).
For all analyses univariate comparisons were made using Fisher’s exact test and
the two-tailed Student t test assuming equal variance.
Linkage Analysis
Linkage analysis was performed in a series of 82 multiplex families.
Eighty of the 111 families described in our clinical description (Steele et al. 2005)
were included in the genomic screen; the remainder of the 111 families were
excluded from the genomic screen because of lack of DNA or lack of
informativeness for linkage analysis. Two newly ascertained families, identified
using the identical ascertainment strategies as the first series of families, were
also included in this linkage analysis.
Our primary analysis consisted of all 82 families regardless of the type of
IIP within the family. However, to address the possibility of genetic
heterogeneity, we divided our 82 families into homogeneous families, those in
which affected family members only had IPF/UIP diagnoses, and heterogeneous
families in which at least one affected family member had IPF/UIP form of IIP and
at least one affected individual had another type of IIP, such as non-specific
interstitial pneumonia (NSIP), cryptogenic organizing pneumonia (COP),
respiratory bronchiolitis-associated interstitial lung disease (RBILD), or other IIP.
For all three diagnostic strategies (all families, homogeneous families, and
heterogeneous families), we used a rigorous definition of unaffected (no

40
evidence of IIP on chest radiograph, DLCO > 80%, and dyspnea class ≤ 1).
Individuals who were classified as possibly affected or indeterminate were
considered of unknown status and their data were not included in the linkage
analysis. Using this classification strategy, of the 82 families in the genomic
screen, 64 were nuclear families only and 18 were extended pedigrees (including
at least one affected relative pair more distantly related than siblings); in the
homogeneous pedigrees, 39 were nuclear and 3 were extended; and in the
heterogeneous pedigrees, 25 were nuclear and 15 were extended.
Linkage analysis for all three analytic models was performed using the
Merlin statistical genetic software package (Abecasis et al. 2002) and applying a
non-parametric linkage approach using an exponential model. Non-parametric
identity-by-descent sharing statistics (Kong and Cox LOD scores) between all
pairs of affected individuals within a pedigree were calculated using the Spairs
option since our sample consisted of pedigrees of varied sizes. Thus, though all
genotyped individuals were used to help infer the genotype of unavailable
affected individuals, only affected individuals were used to calculate the Kong
and Cox LOD score statistic. Genetic marker distance was based on maps from
Decode Genetics. Map order was verified using Map-O-Mat (Kong and Matise
2005). Marker allele frequencies were estimated from the data using all
individuals (Broman 2001). Multipoint LOD scores ≥ 2.0 were considered
suggestive of linkage, corresponding to an approximate p-value of 10-3 (Lander
41
and Kruglyak 1995), and approximate 95% confidence intervals were determined
using the one-LOD-score-down method.
To evaluate our families for genetic heterogeneity, ordered subset
analysis (OSA) (Hauser et al. 2004) was applied to the 82 families in the genomic
screen. Briefly, the OSA approach uses a family-specific continuous covariate to
rank families according to their covariate value. A subset of families with the
maximum evidence for linkage to a particular genetic marker(s), conditional on
the covariate ranking, is thus identified. This approach may identify subsets of
the data that are more homogeneous than others, thereby potentially identifying
regions of linkage evidence previously unrecognized. The evidence for an
increased linkage signal in the subset of families is then assessed statistically
using permutation testing by OSA. Non-parametric multipoint family-specific
LOD scores calculated in the genomic screen of the full set of 82 pedigrees were
used as input to the computer program. The potential contributions of disease
age-at-onset, and smoking exposure to disease risk were evaluated. For the
OSA, disease age-at-onset was defined as an average patient-reported age of
first recognition of breathlessness or, when not available, age-at-first diagnostic
CT scan was used as a surrogate. For cigarette smoking, the family-specific
variable was defined as the proportion of affected individuals within a family who
were current or former smokers among those who had smoking history data
available.

42
3.2.2 Results
Linkage Analysis in 82 Families
HRCT scans were reviewed on 300 individuals and lung biopsy material
was reviewed on 86 individuals in the 82 families, resulting in 147 cases of
probable IIP and 39 cases of definite IIP. Demographic and clinical
characteristics of the 82 families are shown in Table 3.
Table 3: Demographic and clinical characteristics of affected individuals genotyped in the genomic screen for all, homogeneous, and heterogeneous families
All Families Homogeneous Families
Heterogeneous Families
Families, # 82 42 40
Affected individuals genotyped, #
186 91 95
Affected males/ affected females, #
101/85 54/37 47/48
Male, % 54.3 59.3 49.5
Average age-at-dx, mean +/- sd 1
65.8 +/- 10.7 68.0 +/- 12.0 64.8 +/- 10.2
Affected deceased, # (%) 73 (39%) 29 (32%) 44 (46%)
Age-at-death, mean +/- sd 2
68.8 +/-9.5 72.0 +/- 7.5 66.6 +/- 10.1
Time to death from age at diagnosis in years, mean +/- sd
1.3 +/- 1.2 1.8 +/- 1.8 1.2 +/- 1.0
Smoking history, # 182 90 92
Ever, # (%) 126 (69%) 68 (76%) 58 (63%)
Never, # (%) 56 (31%) 22 (24%) 34 (37%)
Pack-years, mean +/-sd
17.4 +/- 25.4 10.9 +/- 20.4 23.5 +/- 28.4
Pack-years, range (median)
0 to 103.5 (6.0) 0 to 93.0 (0) 0 to 103.5 (17.0)

43
Table 4: Continued
All Families Homogeneous Families
Heterogeneous Families
Dyspnea score, mean +/- sd
2.7 +/- 2.0 2.7 +/- 2.0 2.7 +/- 2.0
Dyspnea grade 0, # (%) 39 (23%) 20 (23%) 19 (23%)
Dyspnea grade 1-2, # (%) 40 (24%) 20 (23%) 20 (24%)
Dyspnea grade 3-4, # (%) 46 (27%) 22 (26%) 24 (29%)
Dyspnea grade 5, # (%) 45 (26%) 24 (28%) 21 (25%)
Forced vital capacity, % predicted, mean +/- sd
69.4 +/- 19.5 72.9 +/- 19.2 66.1 +/- 19.4
Range (median) 28 to 129 (70) 38 to 129 (76) 28 to 98 (69)
Dlco, % predicted, mean +/- sd
50.6 +/- 19.8 49.1 +/- 18.6 52.0 +/- 20.9
Range (median) 3 to 132 (50) 14 to 103 (50) 3 to 132 (51)
These characteristics, as well as those for the heterogeneous and homogeneous
families, are based on only genotyped affected individuals. Of the genotyped
affected individuals in the 82 families, 54.3% were male with an average age of
diagnosis of 65.8 +/- 10.7. Overall, 69.2% of affected subjects were current or
former smokers, with an average of 17.4 pack-years. Families with
homogeneous disease (IPF only) tended to have a later age-at-diagnosis, later
mean age-at-death, were more often male, and were more likely to be cigarette
smokers than heterogeneous families (Table 3). These findings are similar to
those found when analyzing the entire cohort of 142 families in Chapter 2.
Genetic analysis of the first 50 genotyped markers identified 2 individuals
with incorrect gender and 2 individuals who were genetically inconsistent with
reported pedigree structure. These four individuals were eliminated from the
genomic screen. Additionally, three individuals formerly reported as siblings were
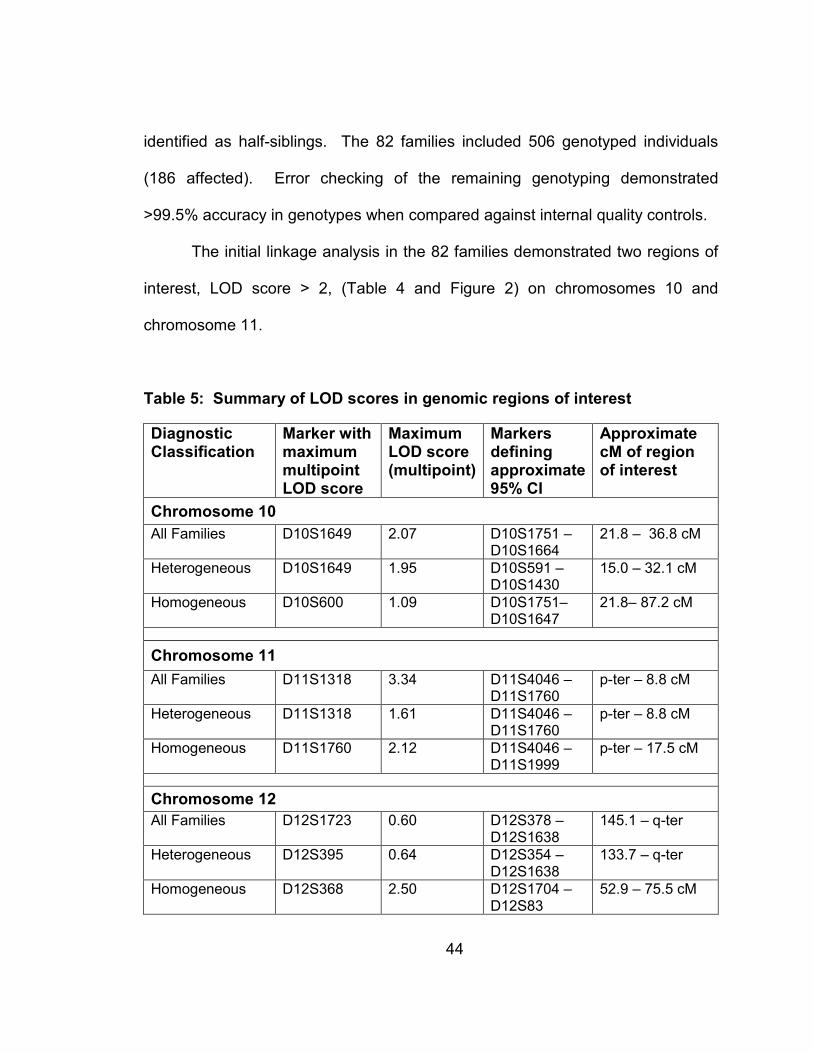
44
identified as half-siblings. The 82 families included 506 genotyped individuals
(186 affected). Error checking of the remaining genotyping demonstrated
>99.5% accuracy in genotypes when compared against internal quality controls.
The initial linkage analysis in the 82 families demonstrated two regions of
interest, LOD score > 2, (Table 4 and Figure 2) on chromosomes 10 and
chromosome 11.
Table 5: Summary of LOD scores in genomic regions of interest
Diagnostic Classification
Marker with maximum multipoint LOD score
Maximum LOD score (multipoint)
Markers defining approximate 95% CI
Approximate cM of region of interest
Chromosome 10
All Families D10S1649
2.07 D10S1751 – D10S1664
21.8 – 36.8 cM
Heterogeneous D10S1649 1.95 D10S591 – D10S1430
15.0 – 32.1 cM
Homogeneous D10S600
1.09 D10S1751– D10S1647
21.8– 87.2 cM
Chromosome 11
All Families D11S1318
3.34 D11S4046 – D11S1760
p-ter – 8.8 cM
Heterogeneous D11S1318
1.61 D11S4046 – D11S1760
p-ter – 8.8 cM
Homogeneous D11S1760
2.12 D11S4046 – D11S1999
p-ter – 17.5 cM
Chromosome 12
All Families D12S1723 0.60 D12S378 – D12S1638
145.1 – q-ter
Heterogeneous D12S395 0.64 D12S354 – D12S1638
133.7 – q-ter
Homogeneous D12S368
2.50 D12S1704 – D12S83
52.9 – 75.5 cM

45
Figure 2: Whole Genome Linkage Screen

46
The most convincing evidence for linkage occurred on chromosome 11 where
the maximum multipoint LOD score peaked at 3.3 at D11S1318. The
approximate 95% confidence interval for this marker was bounded by markers
D11S4046 and D11S1760, spanning 8.8 cM (Figure 3).
0
0.5
1
1.5
2
2.5
3
3.5
4
0 20 40 60 80 100 120 140 160
Chromosome 11 (cM)
LOD score
Figure 3: Chromosome 11 LOD score plot: all 82 families (black dashes), 40 heterogeneous families (green line), and 42 homogeneous families (blue
line)

47
A second region of interest was identified on chromosome 10, where the
maximum multipoint LOD score of 2.1 occurred at D10S1649. The region of
interest on chromosome 10 has an approximate 95% confidence interval that
spans 15 cM and is bounded by D10S1751 and D10S1664 (Figure 4).
0
0.5
1
1.5
2
2.5
0 20 40 60 80 100 120 140 160 180 200
Chromosome 10 (cM)
LOD score
Figure 4: Chromosome 10 LOD score plot: all 82 families (black dashes), 40 heterogeneous families (green line), and 42 homogeneous families (blue
line)
Linkage Analysis Defined by Phenotype
Among the 42 homogeneous families (IPF only), 243 individuals (91
affected, 75 probable, 16 definite) were genotyped. All affected individuals in
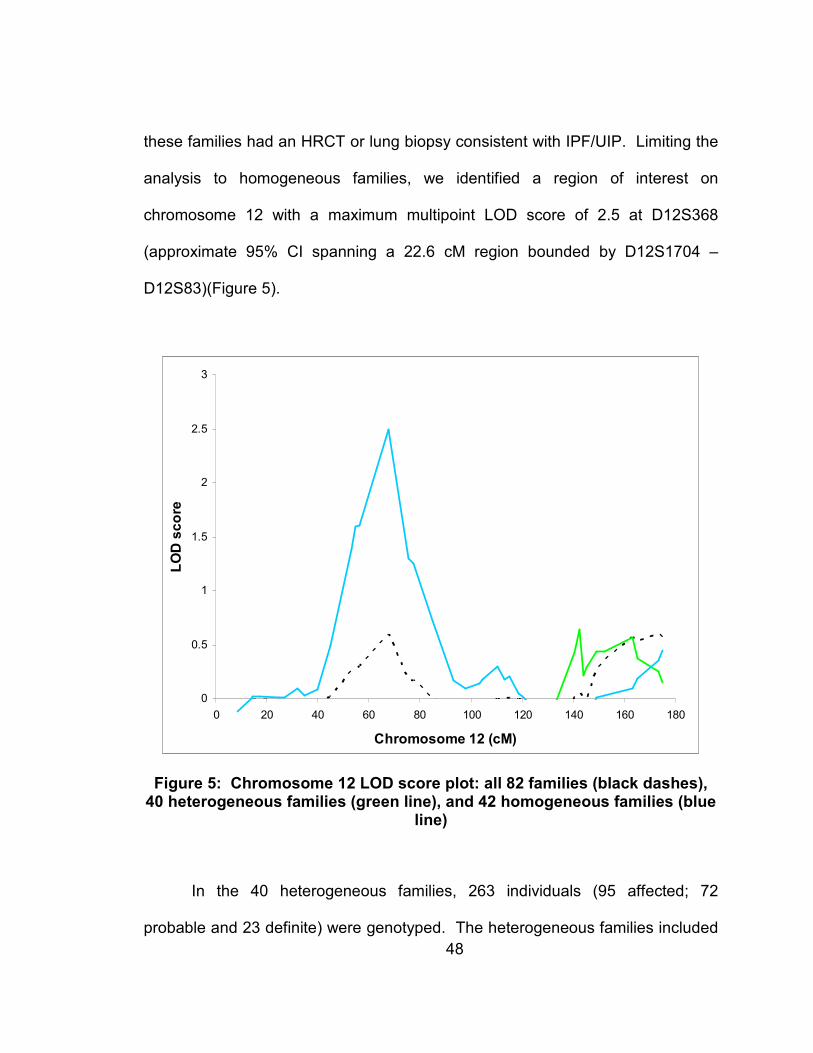
48
these families had an HRCT or lung biopsy consistent with IPF/UIP. Limiting the
analysis to homogeneous families, we identified a region of interest on
chromosome 12 with a maximum multipoint LOD score of 2.5 at D12S368
(approximate 95% CI spanning a 22.6 cM region bounded by D12S1704 –
D12S83)(Figure 5).
0
0.5
1
1.5
2
2.5
3
0 20 40 60 80 100 120 140 160 180
Chromosome 12 (cM)
LOD score
Figure 5: Chromosome 12 LOD score plot: all 82 families (black dashes), 40 heterogeneous families (green line), and 42 homogeneous families (blue
line)
In the 40 heterogeneous families, 263 individuals (95 affected; 72
probable and 23 definite) were genotyped. The heterogeneous families included

49
58 cases of IPF (44 probable and 14 definite), 12 cases of NSIP (5 probable and
7 definite), 1 case of COP (definite), 1 case of RBILD (probable), and 23 cases of
other, unclassified IIP (22 probable and 1 definite). Of the 23 cases of other,
unclassifiable IIP: 6 patients had unclassifiable forms of ILD (2 patients with
pulmonary fibrosis on either pathology or radiographic reports, 3 patients with
poor image quality but consistent with IIP, and 1 patient with end-stage
honeycomb lung on surgical lung biopsy); 7 patients had nodules in addition to
reticulation changes on chest CT; 5 patients had one or more areas of
consolidation or air-space disease suspicious for BOOP (Bronchiolitis Obliterans
Organizing Pneumonia); 3 patients had significant emphysema in addition to ILD
making the underlying pattern of ILD difficult to interpret; 1 patient subsequently
had a surgical lung biopsy demonstrating UIP; and 1 patient had pleural plaques
suggestive of asbestosis. No specific locus was identified within the
heterogeneous pedigrees.
3.2.3 Conclusions
We have found regions on chromosomes 10, 11, and 12 that likely contain
genes that contribute to the development of FIP. These findings demonstrate
that familial interstitial pneumonia (FIP) is likely influenced by multiple genetic
factors, potentially indicative of genetic heterogeneity. The evidence in favor of
linkage to 11pter is substantial, with multipoint LOD scores > 3.0 among all 82
families. Moreover, our findings indicate that the linkage on chromosome 12 is

50
evident only in the homogeneous families indicating that family phenotype may in
part be driven by variable genetic susceptibility factors. In aggregate, these
findings suggest that FIP is a complex disease, associated with multiple
phenotypes, and influenced by multiple genes.
3.3 Fine-mapping Analysis of Chromosome 10
3.3.1 Methods
Previously, all 82 families were genotyped in a whole genome
microsatellite screen which included 55 microsatellite markers typed on
chromosome 10, 38 markers on chromosome 11, and 40 markers on
chromosome 12 (Speer et al. in press). To further fine-map the region of interest
on chromosome 10, an additional 62 microsatellites and 215 single nucleotide
polymorphisms (SNPs) were typed from 6.7 to 28.4 Mb and passed quality
control giving a total of 349 markers on chromosome 10. All markers included in
the linkage analyses were checked for Mendelian inconsistencies using
PedCheck,(O'Connell and Weeks 1998) as well as familial relationships between
pairs of individuals using RELPAIR.(Boehnke and Cox 1997; Epstein et al. 2000;
Duren W.L. June 2004)
Map order for both microsatellite and SNP markers was determined using
physical map position. All linkage analyses were conducted using exponential

51
Merlin nonparametric linkage analysis (pairs option due to the diversity of family
sizes) and correcting for linkage disequilibrium (LD), which has been shown to
potentially inflate nonparametric multipoint LOD scores (only markers with r2<0.1
were used in the analyses).(Kong and Cox 1997; Abecasis et al. 2002; Abecasis
and Wigginton 2005; Boyles et al. 2005) Merlin corrects for LD by identifying
pairs of markers where r2>threshold and clustering these pairs and any
intervening markers assuming no recombination between clustered markers and
no LD between clusters.
3.3.2 Results
Given the broad region of interest on chromosome 10 identified by the
microsatellite genomic screen (Chapter 3.2 and Speer et al. in press), multipoint
nonparametric linkage analysis was run on chromosome 10 using additional
microsatellite and SNP fine-mapping markers and separating the families into
three groups based on phenotype: all 82 families, 42 homogeneous families, and
40 heterogeneous families. The initial fine-mapping linkage results using all 82
families indicated two peaks on chromosome 10 (LOD score 2.1 at 21.8 Mb,
10p12.31 and LOD score 1.4 at 9.3 Mb, 10p14; Figure 6).

52
0
0.5
1
1.5
2
0 20 40 60 80 100 120 140
Chromosome 10 (Mb)
LOD score
Figure 6: Multipoint Linkage results for Chromosome 10: all 82 families
Stratifying the analysis into homogeneous and heterogeneous families, on the
other hand, reveals each peak segregating with one of the phenotypes (the more
centromeric peak with the homogeneous IPF only families (LOD score 2.0 at
20.3 Mb, 10p12.31; Figure 7) and the more telomeric peak with the
heterogeneous families (LOD score 2.0 at 9.2 Mb, 10p14) as well as a third peak
seen only in the heterogeneous families (LOD score 1.9 at 79.6 Mb, 10q22.3;
Figure 8).
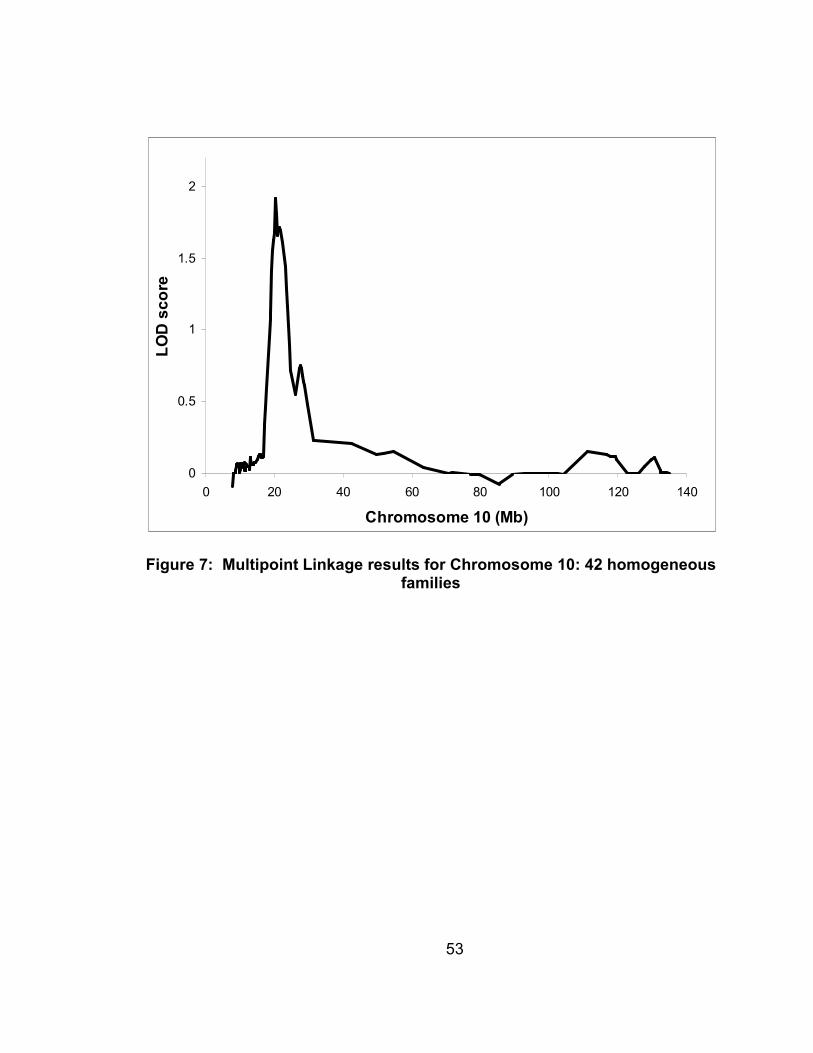
53
0
0.5
1
1.5
2
0 20 40 60 80 100 120 140
Chromosome 10 (Mb)
LOD score
Figure 7: Multipoint Linkage results for Chromosome 10: 42 homogeneous families

54
0
0.5
1
1.5
2
0 20 40 60 80 100 120 140
Chromosome 10 (Mb)
LOD score
Figure 8: Multipoint Linkage results for Chromosome 10: 40 heterogeneous families
In Figure 9 the refinement of the chromosome 10 region of interest by fine-
mapping can be seen, with what was one original peak in the whole genome
screen resolving into two separate peaks with the fine-mapping data.
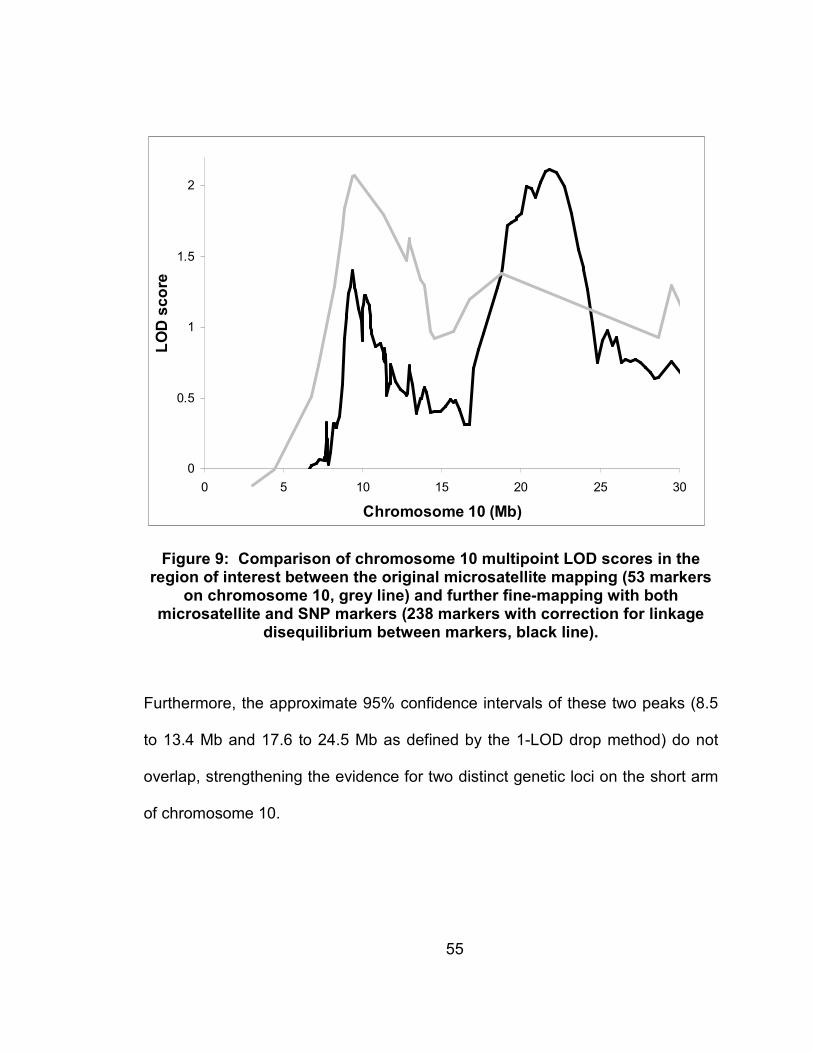
55
0
0.5
1
1.5
2
0 5 10 15 20 25 30
Chromosome 10 (Mb)
LOD score
Figure 9: Comparison of chromosome 10 multipoint LOD scores in the region of interest between the original microsatellite mapping (53 markers
on chromosome 10, grey line) and further fine-mapping with both microsatellite and SNP markers (238 markers with correction for linkage
disequilibrium between markers, black line).
Furthermore, the approximate 95% confidence intervals of these two peaks (8.5
to 13.4 Mb and 17.6 to 24.5 Mb as defined by the 1-LOD drop method) do not
overlap, strengthening the evidence for two distinct genetic loci on the short arm
of chromosome 10.
56
3.3.3 Conclusions
Our results indicate that stratification based on phenotypic (homogeneous
or heterogeneous families) improves evidence for linkage to chromosome 10 in
FIP. Furthermore, the familial phenotype of FIP (homogeneous or
heterogeneous families) is strongly related to the individual peaks on
chromosome 10. Thus, more than one gene may be playing a role in the
development of FIP on chromosome 10, and accounting for the distinct
phenotypes seen amongst families.
Stratification of the families by phenotype (all, homogenous, and
heterogeneous), identified multiple linkage peaks (9.3 Mb, 21.8 Mb, and 79.6 Mb)
on chromosome 10 associated with distinct clinical phenotypes. Within the first
region of interest (LOD score=1.4 at 9.3 Mb [approximate 95% CI 8.5-13.4 Mb])
are 26 genes, of which 14 are known genes and 12 novel or uncharacterized
proteins. The peak LOD score within this region is also located within an
apparent gene desert, making assessment of candidate genes more difficult, as
the signal driving the linkage may be in a regulatory element rather than the
coding region of a gene. Under the second region of interest (LOD score=2.1 at
21.8 Mb [approximate 95% CI 17.6-24.5 Mb]) lie 57 genes of which 27 are known
genes and 30 novel or uncharacterized proteins. Few of the fine-mapping SNPs
covered this second peak however, due to the resolution of the single peak seen
in the microsatellite screen into 2 separate peaks. Therefore, further SNP
genotyping in this region would be useful for follow-up association studies.
57
Overall, however, the lack of “obvious” biological candidates within the first two
peaks emphasizes the importance of using family-based linkage approaches as
a compliment to candidate gene studies, as the linkage approach may identify
regions of the genome that harbor novel genes involved in the disease process.
Within the third peak (LOD=1.9 at 79.6 Mb [approximate 95% CI 70.6-92.9 Mb]),
seen only in heterogeneous families, there are 244 genes, 148 known genes and
96 novel or uncharacterized proteins. This third peak also contains a number of
surfactant protein genes (SFTPA1, SFTPA2, and SFTPD) including SFTPA1
which has previously been shown to be associated with sporadic IPF in a
Mexican population.(Selman et al. 2003)
Such findings are especially interesting, as they appear to indicate that
homogeneous and heterogeneous families are distinct in etiology. Specifically,
the unique linkage peaks seen in homogeneous and heterogeneous families on
chromosome 10, suggest that these two familial phenotypes may exhibit different
genetic risk factors for the development of FIP. In fact, this is supported by the
finding that linkage of FIP to chromosome 12 is only observed among the
homogeneous families (Chapter 3.2 and Speer et al. in press). Thus, the various
IIP diagnoses seen within the heterogeneous families may represent the effects
of secondary genetic and environmental modifiers upon a uniform familial genetic
susceptibility, while, the homogeneous families may exhibit a potentially stronger
genetic effect due to a single susceptibility factor. However, until specific
58
susceptibility gene(s) that cause FIP are identified such distinctions will remain
speculative.
3.4 Ordered Subset Analysis of Chromosomes 10, 11, and 12
3.4.1 Methods
Using the microsatellite data from the initial genomic screen, family-
specific LOD scores were calculated for chromosomes 10, 11, and 12 using
Merlin. These 3 chromosomes were selected for further OSA analysis as all 3
exhibited LOD scores over 2 within at least one of the phenotypic classification
groups (all 82 families, homogeneous families, and heterogeneous families).
OSA uses family level covariate data to define a subset of families that maximize
linkage, thus identifying a potentially more homogeneous subset of families for
further analysis.(Kong and Cox 1997; Hauser et al. 2004) To accomplish this,
OSA adds families into the linkage analysis based on their covariate level, testing
families from both low-to-high and high-to-low covariate values. After stratifying
the families based on phenotypic classification (all, homogeneous, and
heterogeneous families); linkage to a chromosome was evaluated using the other
2 chromosomes family-specific LOD scores as a covariate to test for potential
genetic interactions or other correlations between the two loci. For each family,
the chromosome 10, 11 or 12 LOD score covariate was defined as the maximum

59
family-specific nonparametric multipoint LOD score within the chromosomal
region of interest, defined as a one LOD drop from the peak LOD score. Due to
the multiple testing inherent in the OSA approach, empiric p-values for the
significance of the increase in linkage seen in the OSA selected subset of
families are calculated based on 10,000 replicates using a permutation approach.
After OSA, linkage analysis was rerun on the OSA defined family subset using
Merlin in order to make a direct comparison between the stratified and
unstratified results.
For all 3 chromosomes (10, 11, and 12) smoking status and age of
diagnosis were also evaluated as covariates using OSA. For smoking status,
total smoking was defined as the proportion of affected individuals within the
family who had ever smoked (with smoking status reported by the individual
themselves, a spouse, or other relative. Age of diagnosis was defined as the
average age of diagnosis for all affected individuals in the family.
Additionally, for chromosome 10, this procedure was repeated using the
fine-mapping data. Two-point parametric LOD scores within the chromosome 10
region of interest were also calculated using VITESSE.(O'Connell and Weeks
1995)

60
3.4.2 Results
Testing for potential interactions and/or genetic heterogeneity between the
3 distinct loci on chromosomes 10, 11, and 12 revealed evidence in favor of
genetic heterogeneity between chromosomes 10 and 11, with a potential
interaction between chromosomes 10 and 12 in homogeneous families. A
summary of the results of this analysis can be found in Table 5. For
chromosome 10, evidence in favor of independently acting loci was found for the
chromosome 11 covariate. In all 82 families, a subset of 63 families was found
that showed maximization of the chromosome 10 LOD score with lower
chromosome 11 family-specific LOD scores (maximized LOD = 4.3, p-value =
0.009). Similar maximization was also seen in the heterogeneous families with a
subset of 27 of 40 families exhibiting chromosome 10 LOD score maximization
with lower chromosome 11 family-specific LOD scores (maximized LOD = 3.9, p-
value = 0.0001). Adding to the evidence of independently acting chromosome 10
and 11 loci, families with lower chromosome 10 family-specific LOD scores
maximized evidence of linkage to chromosome 11 in both a subset of all families
(50/82 families, maximized LOD = 4.2, p-value = 0.05) and heterogeneous
families (35/40 families, maximized LOD = 2.5, p-value = 0.06). Finally, evidence
of a potential interaction between the chromosome 10 and 12 loci was seen in
homogeneous families when chromosome 12 was analyzed using chromosome
10 family-specific LOD scores as a covariate (28/42 families, maximized LOD =
3.3, p-value = 0.02).
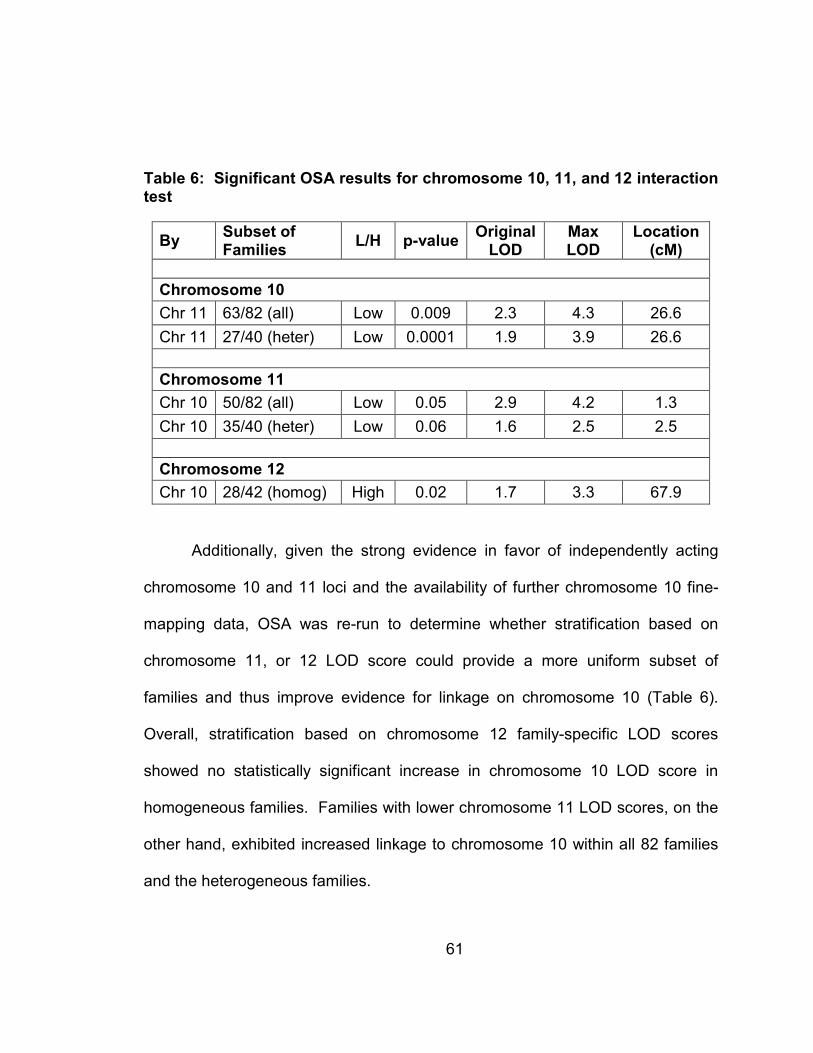
61
Table 6: Significant OSA results for chromosome 10, 11, and 12 interaction test
By Subset of Families
L/H p-value Original LOD
Max LOD
Location (cM)
Chromosome 10
Chr 11 63/82 (all) Low 0.009 2.3 4.3 26.6
Chr 11 27/40 (heter) Low 0.0001 1.9 3.9 26.6
Chromosome 11
Chr 10 50/82 (all) Low 0.05 2.9 4.2 1.3
Chr 10 35/40 (heter) Low 0.06 1.6 2.5 2.5
Chromosome 12
Chr 10 28/42 (homog) High 0.02 1.7 3.3 67.9
Additionally, given the strong evidence in favor of independently acting
chromosome 10 and 11 loci and the availability of further chromosome 10 fine-
mapping data, OSA was re-run to determine whether stratification based on
chromosome 11, or 12 LOD score could provide a more uniform subset of
families and thus improve evidence for linkage on chromosome 10 (Table 6).
Overall, stratification based on chromosome 12 family-specific LOD scores
showed no statistically significant increase in chromosome 10 LOD score in
homogeneous families. Families with lower chromosome 11 LOD scores, on the
other hand, exhibited increased linkage to chromosome 10 within all 82 families
and the heterogeneous families.

62
Table 7: Ordered subset analysis for Chromosome 10 (all, homogeneous, and heterogeneous families) using
Chromosome 11 and 12 family-specific LOD scores as a covariate with empiric p-values
Covariate
LOD Score:
Low-to-High or
High-to-Low
FIP Families
Mb Original
LOD
OSA Max
LOD
p-value Families Used
Chr 11
Low-to-High
All
9.3
1.4
3.1
0.08
63
Chr 11
High-to-Low
All
21.8
1.9
1.9
0.9
82
Chr 11
Low-to-High
Homogeneous 20.3
1.6
2.2
0.2
33
Chr 11
High-to-Low
Homogeneous 21.8
1.4
1.7
0.6
25
Chr 11
Low-to-High
Heterogeneous
9.3
1.6
3.9
1x10⁻¹⁰
27
Chr 11
High-to-Low
Heterogeneous 79.6
1.7
1.7
1.0
40
Chr 12*
Low-to-High
Homogeneous 20.3
1.6
1.8
0.6
41
Chr 12*
High-to-Low
Homogeneous 20.0
1.5
2.5
0.1
25
* For chromosome 12, only the phenotypic stratifications which showed previous evidence for linkage
(multipoint LOD score >= 2.0) were analyzed using OSA.
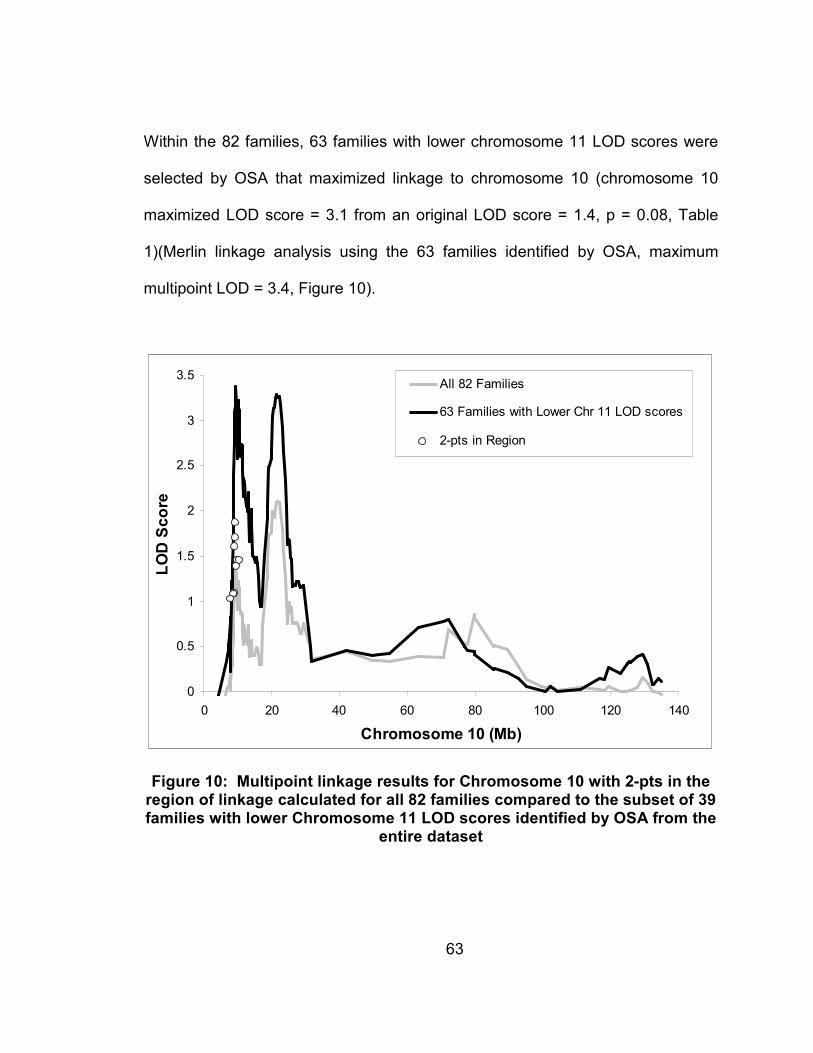
63
Within the 82 families, 63 families with lower chromosome 11 LOD scores were
selected by OSA that maximized linkage to chromosome 10 (chromosome 10
maximized LOD score = 3.1 from an original LOD score = 1.4, p = 0.08, Table
1)(Merlin linkage analysis using the 63 families identified by OSA, maximum
multipoint LOD = 3.4, Figure 10).
0
0.5
1
1.5
2
2.5
3
3.5
0 20 40 60 80 100 120 140
Chromosome 10 (Mb)
LOD Score
All 82 Families
63 Families with Lower Chr 11 LOD scores
2-pts in Region
Figure 10: Multipoint linkage results for Chromosome 10 with 2-pts in the region of linkage calculated for all 82 families compared to the subset of 39 families with lower Chromosome 11 LOD scores identified by OSA from the
entire dataset

64
Furthermore, a subset of 27 heterogeneous families with low linkage to
chromosome 11 also maximized linkage to chromosome 10 (maximized LOD =
3.9 from LOD = 1.6, p < 1x10⁻¹⁰; Table 6)(Merlin linkage analysis using the 27
heterogeneous families identified by OSA, maximum multipoint LOD = 5.1,
Figure 11).
0
1
2
3
4
5
0 20 40 60 80 100 120 140
Chromosome 10 (Mb)
LOD Score
All 82 Families
27 Heterogeneous Families with Lower Chr 11 LOD scores
2-pts in Region
Figure 11: Multipoint linkage results for Chromosome 10 with 2-pts in the region of linkage calculated for all 82 families compared to the subset of 22 families with lower Chromosome 11 LOD scores identified by OSA from the
heterogeneous families
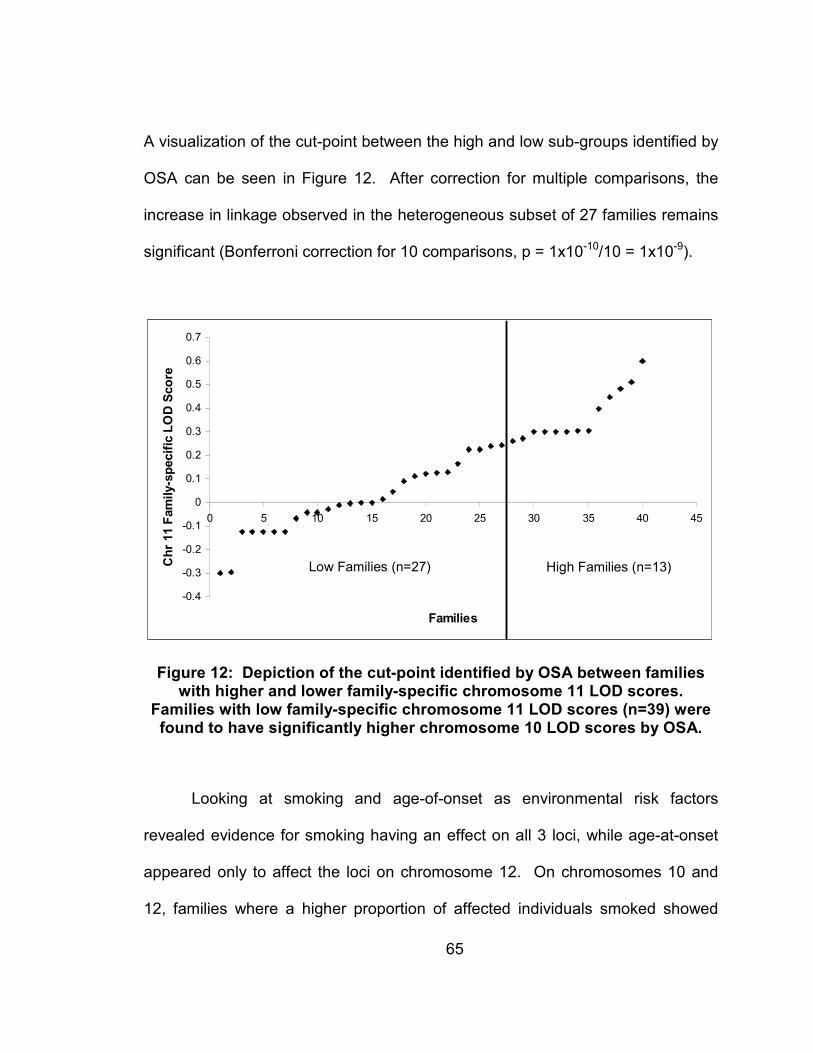
65
A visualization of the cut-point between the high and low sub-groups identified by
OSA can be seen in Figure 12. After correction for multiple comparisons, the
increase in linkage observed in the heterogeneous subset of 27 families remains
significant (Bonferroni correction for 10 comparisons, p = 1x10⁻¹⁰/10 = 1x10⁻⁹).
-0.4
-0.3
-0.2
-0.1
0
0.1
0.2
0.3
0.4
0.5
0.6
0.7
0 5 10 15 20 25 30 35 40 45
Families
Chr 11 Family-specific LOD Score
Low Families (n=27) High Families (n=13)
-0.4
-0.3
-0.2
-0.1
0
0.1
0.2
0.3
0.4
0.5
0.6
0.7
0 5 10 15 20 25 30 35 40 45
Families
Chr 11 Family-specific LOD Score
Low Families (n=27) High Families (n=13)
Figure 12: Depiction of the cut-point identified by OSA between families with higher and lower family-specific chromosome 11 LOD scores.
Families with low family-specific chromosome 11 LOD scores (n=39) were found to have significantly higher chromosome 10 LOD scores by OSA.
Looking at smoking and age-of-onset as environmental risk factors
revealed evidence for smoking having an effect on all 3 loci, while age-at-onset
appeared only to affect the loci on chromosome 12. On chromosomes 10 and
12, families where a higher proportion of affected individuals smoked showed
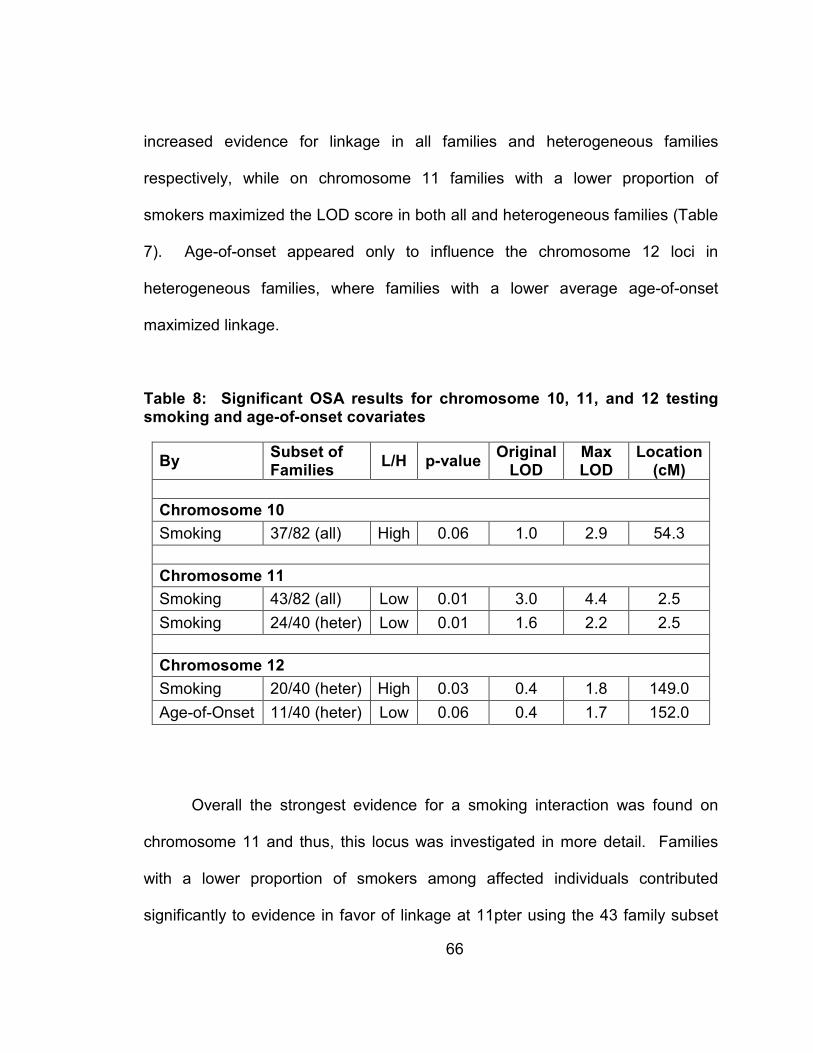
66
increased evidence for linkage in all families and heterogeneous families
respectively, while on chromosome 11 families with a lower proportion of
smokers maximized the LOD score in both all and heterogeneous families (Table
7). Age-of-onset appeared only to influence the chromosome 12 loci in
heterogeneous families, where families with a lower average age-of-onset
maximized linkage.
Table 8: Significant OSA results for chromosome 10, 11, and 12 testing smoking and age-of-onset covariates
By Subset of Families
L/H p-value Original LOD
Max LOD
Location (cM)
Chromosome 10
Smoking 37/82 (all) High 0.06 1.0 2.9 54.3
Chromosome 11
Smoking 43/82 (all) Low 0.01 3.0 4.4 2.5
Smoking 24/40 (heter) Low 0.01 1.6 2.2 2.5
Chromosome 12
Smoking 20/40 (heter) High 0.03 0.4 1.8 149.0
Age-of-Onset 11/40 (heter) Low 0.06 0.4 1.7 152.0
Overall the strongest evidence for a smoking interaction was found on
chromosome 11 and thus, this locus was investigated in more detail. Families
with a lower proportion of smokers among affected individuals contributed
significantly to evidence in favor of linkage at 11pter using the 43 family subset
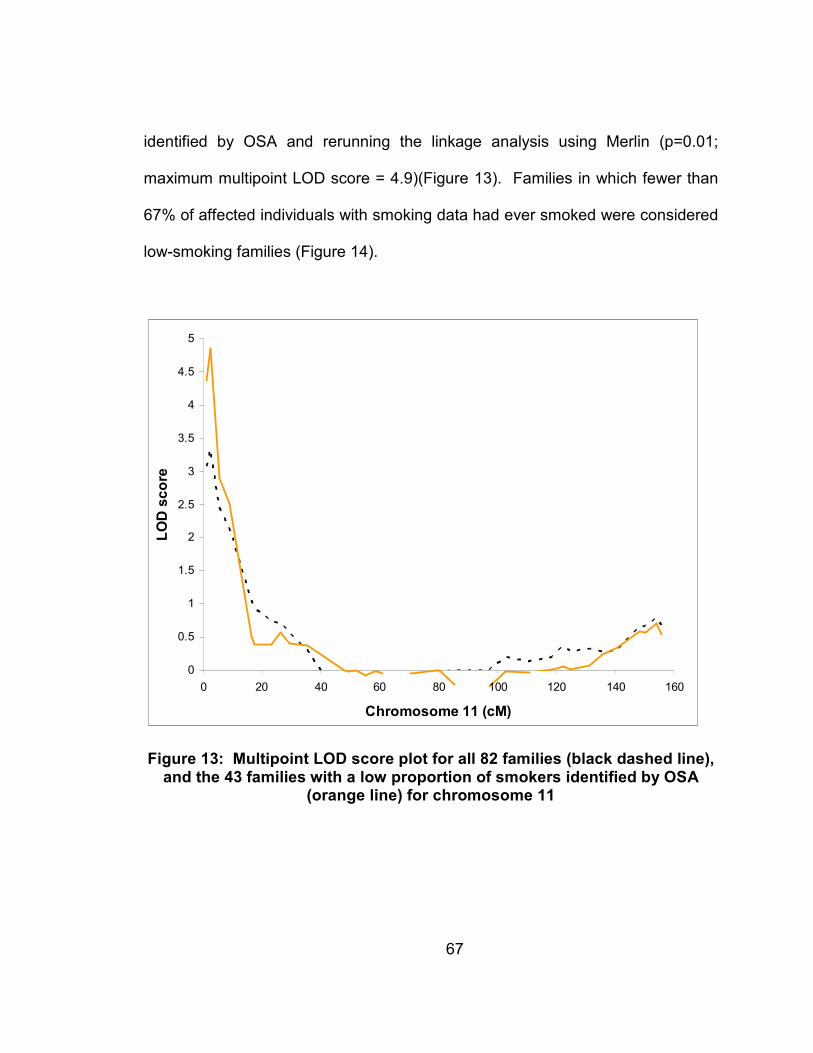
67
identified by OSA and rerunning the linkage analysis using Merlin (p=0.01;
maximum multipoint LOD score = 4.9)(Figure 13). Families in which fewer than
67% of affected individuals with smoking data had ever smoked were considered
low-smoking families (Figure 14).
0
0.5
1
1.5
2
2.5
3
3.5
4
4.5
5
0 20 40 60 80 100 120 140 160
Chromosome 11 (cM)
LOD score
Figure 13: Multipoint LOD score plot for all 82 families (black dashed line), and the 43 families with a low proportion of smokers identified by OSA
(orange line) for chromosome 11

68
0
0.2
0.4
0.6
0.8
1
1.2
0 10 20 30 40 50 60 70 80
Families
% of Cases that have Ever Smoked
0
0.2
0.4
0.6
0.8
1
1.2
0 10 20 30 40 50 60 70 80
Families
% of Cases that have Ever Smoked
Figure 14: OSA cut-off between families with a high and low proportion of ever smokers for chromosome 11
3.4.3 Conclusions
OSA reveals that both genetic and environmental risk factors influence the
3 major loci found in the genomic screen on chromosomes 10, 11, and 12. On
chromosome 10 a subset of families with lower chromosome 11 LOD scores
exhibited increased evidence for linkage to chromosome 10 within all 82 families
and the heterogeneous families. On chromosome 11, a subset of families with
lower chromosome 10 LOD scores exhibited increased evidence for linkage to
chromosome 11 in all 82 families. While on chromosome 12, a subset of families
69
with higher chromosome 10 LOD scores exhibited increased evidence for linkage
to chromosome 12 in all 82 families. Age-of-onset appeared to only influence
LOD score maximization on chromosome 12, where families with a lower age-of-
onset showed increased evidence for linkage. Cigarette smoking, on the other
hand, was an important environmental risk factor to consider for all 3 loci, though
the direction of effect varied. The strongest evidence for linkage to chromosome
11 was seen in families where a low proportion of affected individuals smoked,
while on chromosomes 10 and 12 linkage was maximized in the subset of
families where the proportion of affected individuals that smoked was highest.
Thus, OSA provides further evidence that FIP is a genetically heterogeneous
disease with smoking an important environmental risk factor.
70
4. Association Studies in Familial Interstitial Pneumonia
4.1 Background
4.1.1 Association Analyses and Linkage Disequilibrium
Association is a property of alleles, with an allele said to be associated
with a disease if a significant statistical correlation can be found between them.
Association therefore indicates an allele that directly causes the disease, or an
allele that is in linkage disequilibrium (LD) with an actual disease allele. Linkage
disequilibrium refers to alleles at two loci going together more or less often than
expected by random chance. Typically a finding of strong LD between a marker
and disease loci indicates that the marker and disease loci have had little or no
recombination between them, though LD effects can be detected between alleles
on different chromosomes. Since two unrelated families can show linkage to the
same marker loci, but be segregating different alleles, association can not always
be detected in regions of interest identified by linkage analyses. If the alleles that
are connected with the disease in multiple families are the same, however, then
the marker loci is in LD with the disease loci and association can be detected.
Genetic heterogeneity can also impact association analysis, as multiple
genes (or multiple alleles) may act independently to cause the same disease
phenotype. Association may still be found within individual families however, or
using haplotype approaches.
71
4.1.2 Family-based Association, APL
A common strategy for refining regions of interest from linkage studies
involves further localization by association testing. When using family-based
association tests, however, it is important to take into consideration the prior
linkage signal when studying late-onset diseases where parental data are often
missing. Not accounting for such bias can lead to inflated type 1 error rates,
giving an increase in false-positive results. Association in the presence of
linkage (APL) corrects for this bias by conditioning on identity by decent (IBD)
allele sharing in affected siblings when inferring parental genotypes (Martin et al.
2003).
4.1.3 Background on Mucin Candidate Genes
Mucins are a type of glycoprotein and give mucus its gel-like properties
providing lubrication, protection, and transport. Mucins all contain a highly
glycosylated region, which consist of tandem repeats of variable number rich in
serine or threonine. These tandem repeats serve as sites for potential O-
glycosylation, giving mucin its gel-like properties (Ali and Pearson 2007). Each
mucin gene has a unique repeat region, yet there is also polymorphic variation
between individuals in repeat number for any given mucin gene.

72
Respiratory mucus acts to trap inhaled foreign particles and provide
clearance through ciliary action (Ali and Pearson 2007). To facilitate this
clearance respiratory track mucus has a rapid turnover being replaced every 10
to 20 minutes (Ali and Pearson 2007). The mechanisms underlying mucus
formation, secretion, composition, and higher order organization however, are
still largely unknown. This is due in part to it being very difficult to biologically
assess the function of a single mucin gene, owing to the large number that
appear to be expressed in airways and the variable expression patterns that
appear to be influenced by physiological and pathological variables (Thornton
and Sheehan 2004; Ali and Pearson 2007). One hypothesis is that airway
mucus may form a bi-layer with gel-like mucus on top of a thin surfactant and sol
layer. The sol layer would thus act as a lubricant for beating cilia, while the
surfactant layer facilitates mucus clearance and the gel-like layer traps
particulates (Rogers 2007). To date, 20 human mucin genes have been
identified, up to 16 of which have been found to be expressed in human airways
(Voynow et al. 2006; Ali and Pearson 2007; Rogers 2007). Mucus
hypersecretion, however, can also lead to respiratory disease phenotypes such
as asthma, CF, and COPD (Rogers 2007). In airway disease both the amount
and type of mucins produced can be changed, along with the size of individual
mucins (Thornton and Sheehan 2004).
The mucin genes can be further categorized into 2 main types: secretory
and membrane-bound mucins. The secreted gel-forming mucins are also known

73
as oligomeric mucins and form multi-mucin chains, where as the membrane-
bound mucins function as monomers (Thornton and Sheehan 2004). The
majority of secreted mucins are also larger in size than membrane-bound mucins
(Williams et al. 2006). MUC2, MUC5AC and MUC5B are the main gel-forming
secreted mucins expressed in the airway, with each exhibiting distinct chemical
and physical features (Thornton and Sheehan 2004; Ali and Pearson 2007;
Rogers 2007). MUC5AC and MUC5B are the predominant gel-forming airway
mucins, while MUC2 is found in small amounts in irritated airways (Thornton and
Sheehan 2004; Rogers 2007). Since mucins are stored after production,
however, mRNA expression levels may not be an accurate reflection of the
actual make up of airway mucus (Thornton and Sheehan 2004). MUC2,
MUC5AC, and MUC5B are all secreted mucins and map to a single region on
chromosome 11, 11p15.4 to 15.5 along with MUC6 another secreted mucin (Ali
and Pearson 2007). Secreted mucins also contain cysteine-rich domains similar
to the D domains in Von Willebrand factor that are located at both the amino and
carboxyl termini (Voynow et al. 2006; Williams et al. 2006). These cysteine-rich
domains are believed to play a key role in mucin oligermization and higher order
structure formation covalently forming disulfide bonds to create mucin dimers,
which then further multimerize to form long linear mucin oligomers (Voynow et al.
2006; Williams et al. 2006). This structure contributes to the space occupying
nature of secreted mucins giving them their gel-like properties (Williams et al.
2006). Mucins are synthesized in the ER, oligomerized (joined together in long

74
strands) and sent to the Golgi for glycosylation. After glycosylation mature mucin
proteins are packaged into mucin granules and stored in the cytoplasm. When
needed, airway goblet cells, then exocytose the mucin granules (Rogers 2007).
Mucin exocytosis follows first order kinetics and proceeds rapidly as water uptake
expands the mucin product (Rogers 2007). Carbohydrates from glycosylation
can make up to 90% of a mucin gene’s molecular weight (Williams et al. 2006; Ali
and Pearson 2007). The pattern of glycosylation may also not be dependent
solely upon the amino acid sequence, but rather upon glycosyltransferase and
glycosidase expression within the local environment and the availability of
substrates (Ali and Pearson 2007). This oligosaccharide diversity may also help
to bind different bacteria to mucus for clearance in order to help prevent infection
(Thornton and Sheehan 2004).
4.2 Chromosome 10 Fine-mapping
4.2.1 Methods
Fine-mapping of the chromosome 10 region of interest was conducted by
genotyping services preformed by Illumina and GlaxoSmithKline (GSK), along
with sequencing of the candidate genes ITIH2 and ITIH5 within the lab. All data
was checked for Mendelian inconsistencies using PEDCHECK (O'Connell and

75
Weeks 1998). A map containing all markers typed within the region of interest
was generated using physical distance (base pair locations).
Given the family structure to the dataset and previous evidence of linkage
in the area, APL (Martin et al. 2003) was chosen to analyze the chromosome 10
fine-mapping data. Results with p-values less than or equal to 0.05 were
considered to be significant. Due to the high density of the SNP markers,
however, multiple SNPs may be in LD and therefore represent a single signal,
rather than multiple hits. LD between the significant markers was therefore
calculated using Haploview (Barrett et al. 2005), in order to determine if multiple
hits were due to LD between the markers.
4.2.2 Results
Six markers were identified by APL analysis to be significant (p-value <
0.05) within the 82 families (Figure 15 and Table 8). Of these markers 3
(rs3824658, ITIH5_EX14_A, and rs4749036) were found within the candidate
gene ITIH5 (inter-alpha (globulin) inhibitor H5, located on chromosome 10, 7.64-
7.75 Mb), and one was just downstream of ITIH5 (rs2508 at 7.83 Mb). The other
2 significant SNPs do not map to any know genes and were found at 9.62 Mb
(rs1324880) and 11.43 Mb (rs2378993).
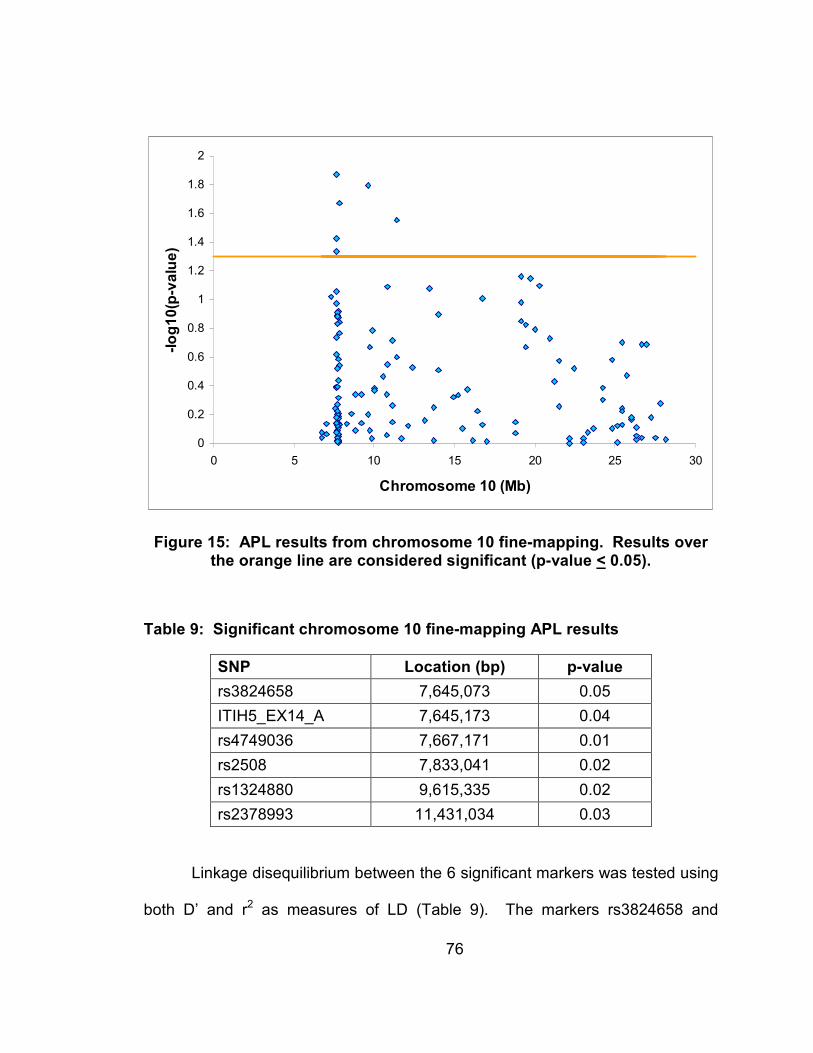
76
0
0.2
0.4
0.6
0.8
1
1.2
1.4
1.6
1.8
2
0 5 10 15 20 25 30
Chromosome 10 (Mb)
-log10(p-value)
Figure 15: APL results from chromosome 10 fine-mapping. Results over the orange line are considered significant (p-value < 0.05).
Table 9: Significant chromosome 10 fine-mapping APL results
SNP Location (bp) p-value
rs3824658 7,645,073 0.05
ITIH5_EX14_A 7,645,173 0.04
rs4749036 7,667,171 0.01
rs2508 7,833,041 0.02
rs1324880 9,615,335 0.02
rs2378993 11,431,034 0.03
Linkage disequilibrium between the 6 significant markers was tested using
both D’ and r2 as measures of LD (Table 9). The markers rs3824658 and

77
ITIH5_EX14_A were found to be in perfect LD with both a D’ and r2 of 1. SNP
rs2508 was also found to be in LD with these 2 markers with a D’ of 1, however
no other markers showed an r2 > 0.1.
Table 10: Linkage Disequilibrium (LD) between the 6 significant markers
Marker 1 Marker 2 D' r^2
rs3824658 ITIH5_EX14_A 1 1
rs3824658 rs4749036 0.04 0.001
rs3824658 rs2508 1 0.02
rs3824658 rs1324880 0.5 0.03
rs3824658 rs2378993 0.1 0.02
ITIH5_EX14_A rs4749036 0.04 0.001
ITIH5_EX14_A rs2508 1 0.02
ITIH5_EX14_A rs1324880 0.5 0.03
ITIH5_EX14_A rs2378993 0.1 0.02
rs4749036 rs2508 0.2 0.008
rs4749036 rs1324880 0.03 0
rs4749036 rs2378993 0.03 0.001
rs2508 rs1324880 0.1 0.004
rs2508 rs2378993 0.08 0
rs1324880 rs2378993 0.5 0.04
A visualization of the LD between the 6 significant markers on chromosome 10
can be seen in Figure 16.

78
Figure 16: Visualization of LD structure between the 6 significant chromosome 10 markers using D’. Red squares represent and D’ of 1 with high confidence (LOD > 2), grey squares a D’ of 1 with lower confidence (LOD < 2). Numbers in the white squares represent D’, for example 52 =
0.52.
4.2.3 Conclusions
Association analysis of the chromosome 10 region of interest using APL
reveals association in the presence of the previously detected linkage signal.
Such correlation between both linkage and association tests strengthens the

79
evidence that this region of interest under the first linkage peak on chromosome
10 is indeed a true signal. Six SNPs were identified as significantly associated
with FIP in the 82 families. Of these SNPs, 2 (rs3824658 and ITIH5_EX14_A)
are in perfect LD and thus, in effect, represent the same signal. Three of the 5
independent signals are located in or near ITIH5 (rs3824658 synonymous coding
(ITIH5_EX14_A is also located in exon 14), rs4749036 intronic, and rs2508 just
downstream of ITIH5). Of the remaining 2 SNPs, rs1324880 is located in the
middle of a gene desert and rs2378993 is just downstream of CUGBP2 (CUG
triplet repeat, RNA binding protein 2).
4.3 Chromosome 11: Mucin Genes
Illumina genotyping was conducted in the region of interest for
chromosome 11 based off the linkage results in all 82 families (from 0.6-9cM).
306 SNPs were selected from the region using LD bins and the SNPselector
program (Xu et al. 2005). 770 individuals from FIP families were genotyped (274
affected individuals (definite or probable consensus diagnosis), 51 possibly
affected (possible consensus diagnosis), 195 unknown, and 250 normal
individuals). 166 IPF cases from InterMune as well as 206 white controls from
the Duke Center for Human Genetics were also genotyped. Association tests
comparing FIP cases and controls, as well as IPF cases and controls were then
conducted using SAS Genetics linear trend test. From this testing one SNP in

80
particular stood out, rs7944723 with a p-value=1 x 10⁻⁶ in FIP cases versus
controls and p-value=0.002 in InterMune IPF cases versus controls. Located in
the intronic region of MUC2, the signal from rs7944723 started investigation into
MUC2 and the neighboring MUC5AC as candidate genes for FIP.
4.3.1 Methods
Re-sequencing of both MUC2 and MUC5AC was conducted in the
Schwartz lab and as part of the NIEHS SNPs Program at the University of
Washington (NIEHS SNPs). For both genes, the NIEHS SNPs Program at the
University of Washington re-sequenced additional cases from those sequenced
within the Schwartz lab with families with only one case available sequenced by
both groups and used as quality controls.
SAS Genetics linear trend test was chosen for case control analysis of the
re-sequencing data. This test looks for additive allele effects on the disease
penetrance. For families where more than one case was re-sequenced,
individuals were selected from families based on a set criterion: definite over
probable diagnosis, IPF over other IIP diagnoses, and if still multiple cases the
youngest individual in the family. These criterion were selected in order to
identify cases with the greatest likelihood of a shared genetic component by
selecting cases with the most confident diagnoses, most homogeneous
phenotype, and greatest potential for a genetic load. Spouse controls were also
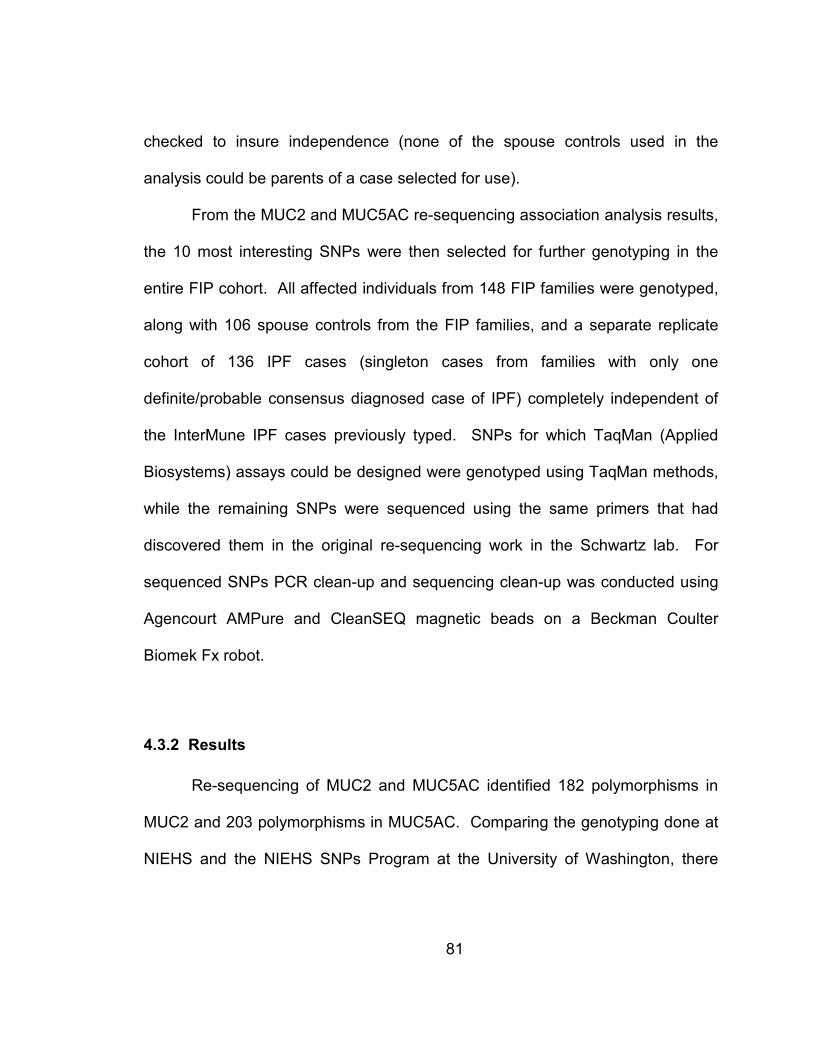
81
checked to insure independence (none of the spouse controls used in the
analysis could be parents of a case selected for use).
From the MUC2 and MUC5AC re-sequencing association analysis results,
the 10 most interesting SNPs were then selected for further genotyping in the
entire FIP cohort. All affected individuals from 148 FIP families were genotyped,
along with 106 spouse controls from the FIP families, and a separate replicate
cohort of 136 IPF cases (singleton cases from families with only one
definite/probable consensus diagnosed case of IPF) completely independent of
the InterMune IPF cases previously typed. SNPs for which TaqMan (Applied
Biosystems) assays could be designed were genotyped using TaqMan methods,
while the remaining SNPs were sequenced using the same primers that had
discovered them in the original re-sequencing work in the Schwartz lab. For
sequenced SNPs PCR clean-up and sequencing clean-up was conducted using
Agencourt AMPure and CleanSEQ magnetic beads on a Beckman Coulter
Biomek Fx robot.
4.3.2 Results
Re-sequencing of MUC2 and MUC5AC identified 182 polymorphisms in
MUC2 and 203 polymorphisms in MUC5AC. Comparing the genotyping done at
NIEHS and the NIEHS SNPs Program at the University of Washington, there
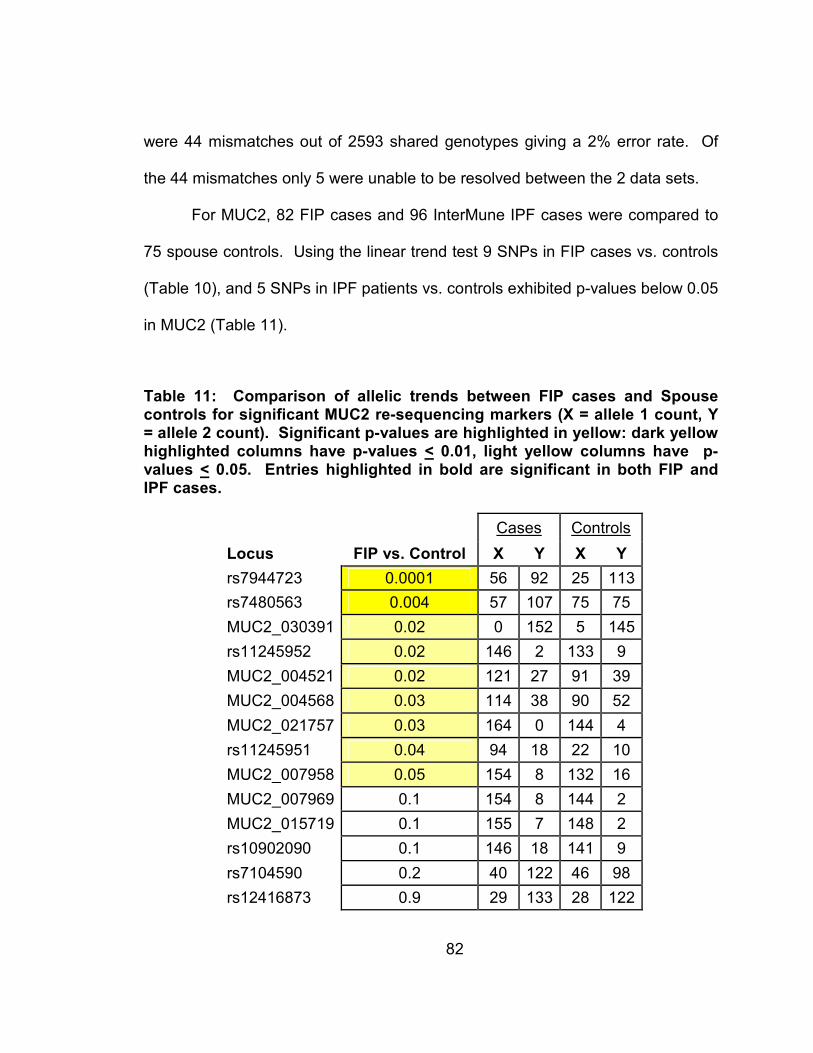
82
were 44 mismatches out of 2593 shared genotypes giving a 2% error rate. Of
the 44 mismatches only 5 were unable to be resolved between the 2 data sets.
For MUC2, 82 FIP cases and 96 InterMune IPF cases were compared to
75 spouse controls. Using the linear trend test 9 SNPs in FIP cases vs. controls
(Table 10), and 5 SNPs in IPF patients vs. controls exhibited p-values below 0.05
in MUC2 (Table 11).
Table 11: Comparison of allelic trends between FIP cases and Spouse controls for significant MUC2 re-sequencing markers (X = allele 1 count, Y = allele 2 count). Significant p-values are highlighted in yellow: dark yellow highlighted columns have p-values < 0.01, light yellow columns have p-values < 0.05. Entries highlighted in bold are significant in both FIP and IPF cases.
Cases Controls
Locus FIP vs. Control X Y X Y
rs7944723 0.0001 56 92 25 113
rs7480563 0.004 57 107 75 75
MUC2_030391 0.02 0 152 5 145
rs11245952 0.02 146 2 133 9
MUC2_004521 0.02 121 27 91 39
MUC2_004568 0.03 114 38 90 52
MUC2_021757 0.03 164 0 144 4
rs11245951 0.04 94 18 22 10
MUC2_007958 0.05 154 8 132 16
MUC2_007969 0.1 154 8 144 2
MUC2_015719 0.1 155 7 148 2
rs10902090 0.1 146 18 141 9
rs7104590 0.2 40 122 46 98
rs12416873 0.9 29 133 28 122

83
Table 12: Comparison of allelic trends between IPF cases and Spouse controls for significant MUC2 re-sequencing markers (X = allele 1 count, Y = allele 2 count). Significant p-values are highlighted in yellow: dark yellow highlighted columns have p-values < 0.01, light yellow columns have p-values < 0.05. Entries highlighted in bold are significant in both FIP and IPF cases.
Cases Controls
Locus IPF vs. Control X Y X Y
rs7944723 0.07 50 136 25 113
rs7480563 0.6 83 93 75 75
MUC2_030391 0.5 4 186 5 143
rs11245952 not typed 0 0 132 10
MUC2_004521 0.3 143 47 90 40
MUC2_004568 0.06 139 53 89 53
MUC2_021757 0.8 170 4 144 4
rs11245951 not typed 0 0 22 10
MUC2_007958 0.9 164 16 132 14
MUC2_007969 0.03 167 11 142 2
MUC2_015719 0.02 180 12 148 2
rs10902090 0.03 142 22 141 9
rs7104590 0.03 43 149 48 96
rs12416873 0.006 15 173 28 122
Of these 14 SNPs none overlapped between the FIP and IPF analyses (Figure
17).

84
Figure 17: Overlap in significant SNPs from MUC2 in FIP and IPF cases as compared to spouse controls
For MUC5AC, 69 FIP cases were compared to 72 spouse controls (due to non-
independence of 3 of the spouse controls given the selected FIP cases), while 96
InterMune IPF cases were compared to 75 spouse controls. Using the linear
trend test, 20 SNPs were identified with p-values less than or equal to 0.05 (12 in
FIP vs. controls, and 14 in IPF vs. controls; Figures 12 and 13 respectfully).
9
SNPs
5
SNPs
FIP IPF
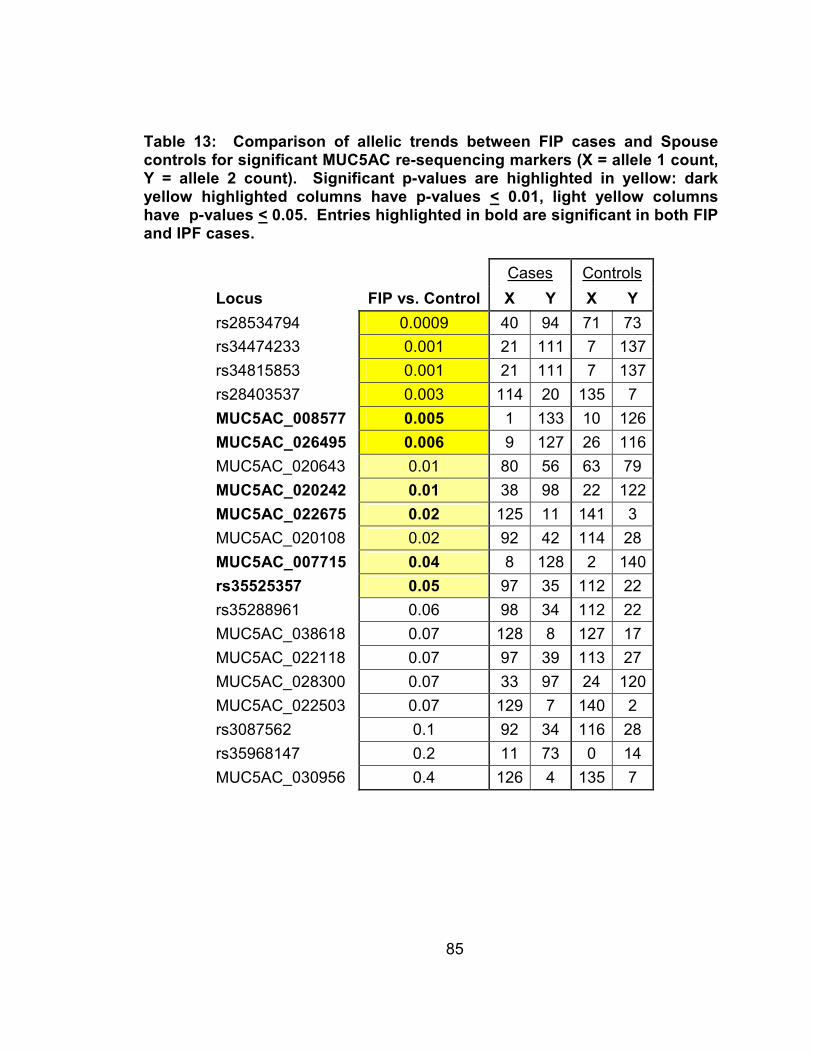
85
Table 13: Comparison of allelic trends between FIP cases and Spouse controls for significant MUC5AC re-sequencing markers (X = allele 1 count, Y = allele 2 count). Significant p-values are highlighted in yellow: dark yellow highlighted columns have p-values < 0.01, light yellow columns have p-values < 0.05. Entries highlighted in bold are significant in both FIP and IPF cases.
Cases Controls
Locus FIP vs. Control X Y X Y
rs28534794 0.0009 40 94 71 73
rs34474233 0.001 21 111 7 137
rs34815853 0.001 21 111 7 137
rs28403537 0.003 114 20 135 7
MUC5AC_008577 0.005 1 133 10 126
MUC5AC_026495 0.006 9 127 26 116
MUC5AC_020643 0.01 80 56 63 79
MUC5AC_020242 0.01 38 98 22 122
MUC5AC_022675 0.02 125 11 141 3
MUC5AC_020108 0.02 92 42 114 28
MUC5AC_007715 0.04 8 128 2 140
rs35525357 0.05 97 35 112 22
rs35288961 0.06 98 34 112 22
MUC5AC_038618 0.07 128 8 127 17
MUC5AC_022118 0.07 97 39 113 27
MUC5AC_028300 0.07 33 97 24 120
MUC5AC_022503 0.07 129 7 140 2
rs3087562 0.1 92 34 116 28
rs35968147 0.2 11 73 0 14
MUC5AC_030956 0.4 126 4 135 7

86
Table 14: Comparison of allelic trends between IPF cases and Spouse controls for significant MUC5AC re-sequencing markers (X = allele 1 count, Y = allele 2 count). Significant p-values are highlighted in yellow: dark yellow highlighted columns have p-values < 0.01, light yellow columns have p-values < 0.05. Entries highlighted in bold are significant in both FIP and IPF cases.
Cases Controls
Locus IPF vs. Control X Y X Y
rs28534794 0.2 81 109 74 76
rs34474233 0.08 18 166 7 143
rs34815853 0.08 18 166 7 143
rs28403537 0.1 174 18 141 7
MUC5AC_008577 0.009 3 189 10 132
MUC5AC_026495 0.02 19 171 28 120
MUC5AC_020643 0.08 101 89 65 83
MUC5AC_020242 0.006 52 138 23 127
MUC5AC_022675 0.02 171 15 147 3
MUC5AC_020108 0.09 140 52 119 29
MUC5AC_007715 0.02 12 180 2 146
rs35525357 0.01 126 48 117 23
rs35288961 0.02 131 49 117 23
MUC5AC_038618 0.04 181 11 132 18
MUC5AC_022118 0.05 134 52 118 28
MUC5AC_028300 0.03 51 141 25 123
MUC5AC_022503 0.03 175 11 146 2
rs3087562 0.05 138 54 121 29
rs35968147 0.002 3 1 0 18
MUC5AC_030956 0.03 188 2 141 7
Of these 20 SNPs, 6 overlapped between the FIP and IPF analysis (Figure 18).

87
FIP IPF
6
SNPs
6
SNPs
8
SNPs
FIP IPF
6
SNPs
6
SNPs
8
SNPs
Figure 18: Overlap in significant SNPs from MUC5AC in FIP and IPF cases as compared to spouse controls
From the 34 SNPs identified as being significantly associated (p-value <
0.05) with FIP or IPF in MUC2 and MUC5AC, the 10 most interesting were
selected for further follow-up genotyping in the entire FIP cohort with additional
IPF cases that form an independent replicate cohort for IPF. These SNPs
included 1 SNP from MUC2 and 9 SNPs from MUC5AC. The single SNP
selected from MUC2 is the same SNP that started the initial investigations in the
mucin genes on chromosome 11 (rs7944723). The MUC5AC SNPs include the
6 SNPs with p-values less than or equal to 0.05 in both the FIP and IPF
case/control analyses (MUC5AC_008577, MUC5AC_026495, MUC5AC_020242,
MUC5AC_022675, MUC5AC_007715, and rs35525357), along with 3 other

88
interesting exonic non-synonymous SNPs that were significant in at least 1
analysis (rs28403537, MUC5AC-028300, and rs34474233) (Table 14).
Table 15: 10 SNPs selected for follow-up genotyping.
Gene SNP Exon/Intron # Alleles AA Change
MUC2 rs7944723 intron 30 C/G
MUC5AC MUC5AC-007715 exon 2 A/G Arg/Gln
MUC5AC MUC5AC-008577 exon 3 A/G Arg/His
MUC5AC rs28403537 exon 12 C/T Ala/Val
MUC5AC MUC5AC-020242 intron 17 A/G
MUC5AC MUC5AC-022675 intron 22 G/T
MUC5AC MUC5AC-026495 intron 28 C/T
MUC5AC MUC5AC-028300 exon 31 A/G Ala/Thr
MUC5AC rs34474233 exon 46 A/G Ala/Thr
MUC5AC rs35525357 intron 49 A/-
Since the most significant SNP so far in the FIP case/control analysis was
located in MUC2, but the only SNPs with overlap between FIP and IPF analyses
were in MUC5AC, we sought to determine if there was any LD between the
MUC2 SNP and MUC5AC markers. Previous studies have shown that MUC2
and MUC5AC are in relatively strong LD with recombination hotspots between
MUC6 and MUC2 and in the early region of MUC5B (Rousseau et al. 2007).
Haploview was thus used to calculate LD (both D’ and r2 between rs794423 (in
MUC2) and the other 9 MUC5AC SNPs (Table 15).

89
Table 16: LD between rs7944723 (in MUC2) and 9 other selected SNPs in MUC5AC
FIP Cases IPF Cases Spouse Controls
MUC5AC SNP D' r^2 D' r^2 D' r^2
MUC5AC-007715 1 0.1 1 0.2 1 0.07
MUC5AC-008577 1 0.02 1 0.006 1 0.02
rs28403537 0.9 0.3 1 0.3 1 0.2
MUC5AC-020242 0.4 0.08 0.4 0.1 0.3 0.06
MUC5AC-022675 0.4 0.02 0.07 0.001 1 0.1
MUC5AC-026495 1 0.03 1 0.04 0.3 0.005
MUC5AC-028300 0.4 0.1 0.4 0.2 0.3 0.06
rs34474233 0.7 0.2 1 0.3 1 0.2
rs35525357 0.3 0.04 0.3 0.1 0.3 0.07
It can be seen that significant amounts of LD exist between the MUC2 SNP
rs7944723 and the other 9 SNPs selected from MUC5AC. In particular SNPs
rs28403537 and rs34474233 show both high D’ values (D’ > 0.7 in FIP cases,
IPF cases, and spouse controls) along with moderate r2 values (r2 > 0.2 in FIP
cases, IPF cases, and spouse controls).
Of the 10 SNPs selected for further genotyping, 5 were successfully
genotyped by TaqMan and 4 by sequencing. One SNP, MUC5AC-020242, was
both incompatible with TaqMan genotyping and unable to be read when
sequenced using the original re-sequencing primers for MUC5AC, due to the use
of a different 3730 sequencer (Applied Biosystems) from that used during the re-
sequencing project. The new 3730 sequencer has shorter read lengths, and
90
therefore could not read the SNP from either forward or reverse sequencing due
to it being located in the middle of the read. New primers for this SNP have been
designed and tested, but sequencing has not yet been completed. Thus, only 9
of the 10 SNPs selected were used in further analyses.
Using the same criterion as previous analyses, 148 FIP cases were
selected for case/control analysis along with 136 IPF cases and 106 spouse
controls. Genotypes were tested for association with FIP or IPF as compared to
spouse controls using Fisher’s exact test (Table 16). For each SNP individuals
were classified as either: 11, 12, or 22, where 1 is the “wild-type” or more
common allele and 2 is the minor allele.
Table 17: Fisher’s exact test p-values, comparing genotypes from FIP and IPF cases versus spouse controls
Gene SNP FIP Cases vs. Spouse Controls
IPF Cases vs. Spouse Controls
MUC2 rs7944723 0.0004 4 E-06
MUC5AC MUC5AC-007715 0.3 0.007
MUC5AC MUC5AC-008577 0.1 0.03
MUC5AC rs28403537 0.0005 0.0002
MUC5AC MUC5AC-022675 0.001 0.006
MUC5AC MUC5AC-026495 0.007 0.1
MUC5AC MUC5AC-028300 0.002 0.003
MUC5AC rs34474233 0.002 0.0008
MUC5AC rs35525357 0.02 0.03

91
Six of the nine SNPs tested had significant p-values (p-value < 0.05) in both FIP
and IPF analyses (rs7944723, rs28403537, MUC5AC-022675, MUC5AC-
028300, rs34474233, and rs35525357), 1 in MUC2 and 5 in MUC5AC. After
correction for multiple comparisons, 4 of the 6 SNPs remain significant in both
populations (Bonferroni correction for 18 comparisons, p < 0.05/18 = 0.003)
(rs7944723, rs28403537, MUC5AC-028300, and rs34474233), 1 in MUC2 and 3
in MUC5AC.
Next odds ratios (ORs) with 95% confidence intervals were calculated for
the 9 selected SNPs by breaking the genotypes into 2 categories: individuals with
the 11 genotype (2 “wild-type” or major alleles) and individuals with 12 or 22
genotypes (individuals having at least 1 copy of the minor allele) (Table 17).
Table 18: Odds Ratios and 95% confidence intervals for having at least one copy of the minor allele versus wild-type in FIP and IPF cases versus spouse controls. Significant ORs are highlighted in yellow for susceptibility alleles and blue for protective alleles.
Gene SNP FIP Cases vs. Spouse Controls
IPF Cases vs. Spouse Controls
MUC2 rs7944723 2.8 (1.6-4.9) 3.8 (2.1-6.7)
MUC5AC MUC5AC-007715 2.1 (0.7-7.7) 3.7 (1.3-13.0)
MUC5AC MUC5AC-008577 0.5 (0.2-1.4) 0.3 (0.06-0.9)
MUC5AC rs28403537 3.7 (1.7-9.2) 4.2 (1.8-10.3)
MUC5AC MUC5AC-022675 5.6 (1.9-22.8) 4.6 (1.5-19.0)
MUC5AC MUC5AC-026495 0.4 (0.2-0.8) 0.6 (0.3-1.1)
MUC5AC MUC5AC-028300 1.8 (1.0-3.2) 2.1 (1.2-3.7)
MUC5AC rs34474233 3.2 (1.5-7.7) 3.8 (1.7-8.9)
MUC5AC rs35525357 1.8 (1.0-3.1) 1.9 (1.1-3.4)

92
Seven of the nine selected SNPs have significant ORs that do not include 1 for
FIP cases versus spouse controls (rs7944723, rs28403537, MUC5AC-022675,
MUC5AC-026495, MUC5AC-028300, rs34474233, and rs35525357), while 8 of
the 9 selected SNPs have significant ORs for IPF cases versus spouse controls
(rs7944723, MUC5AC-007715, MUC5AC-008577, rs28403537, MUC5AC-
022675, MUC5AC-028300, rs34474233, and rs35525357). The same 6 SNPs
that had significant p-values in both FIP and IPF cases versus spouse controls,
also have significant ORs in both populations (rs7944723, rs28403537,
MUC5AC-022675, MUC5AC-028300, rs34474233, and rs35525357), 1 in MUC2
and 5 in MUC5AC.
Linkage disequilibrium between the 9 selected SNPs was also tested
using both D’ and r2 as measures of LD (Table 18). Though many of the SNPs
show a high D’ LD between one another, only 2 pairs of SNPs showed an r2 >
0.7 in both FIP and IPF cases (rs28403537 and rs34474233, MUC5AC-028300
and rs35525357). A visualization of the LD between the 9 selected SNPs can be
seen for: FIP cases in Figure 19 and IPF cases in Figure 20.
Table 19: Linkage Disequilibrium (LD) between the 9 selected SNPs. SNPs with r2 > 0.7 in both FIP and IPF cases are highlighted in yellow.
FIP Cases IPF Cases
Marker 1 Marker 2 D' r^2 D' r^2
rs7944723 MUC5AC-007715 1 0.1 0.9 0.1
rs7944723 MUC5AC-008577 1 0.01 1 0.02
rs7944723 rs28403537 0.9 0.2 1 0.2
93
Table 20: Continued
FIP Cases IPF Cases
Marker 1 Marker 2 D' r^2 D' r^2
rs7944723 MUC5AC-022675 0.6 0.08 1 0.1
rs7944723 MUC5AC-026495 0.6 0.02 0.6 0.02
rs7944723 MUC5AC-028300 0.5 0.2 0.5 0.2
rs7944723 rs34474233 0.9 0.2 0.9 0.2
rs7944723 rs35525357 0.4 0.1 0.4 0.1
MUC5AC-007715 MUC5AC-008577 1 0.002 1 0.002
MUC5AC-007715 rs28403537 1 0.004 1 0.006
MUC5AC-007715 MUC5AC-022675 1 0.003 1 0.003
MUC5AC-007715 MUC5AC-026495 1 0.006 0.8 0.005
MUC5AC-007715 MUC5AC028300 1 0.1 0.7 0.09
MUC5AC-007715 rs34474233 1 0.004 1 0.007
MUC5AC-007715 rs35525357 1 0.1 1 0.2
MUC5AC-008577 rs28403537 1 0.004 1 0.004
MUC5AC-008577 MUC5AC-022675 0.03 0.001 0.9 0.001
MUC5AC-008577 MUC5AC-026495 1 0.005 1 0.005
MUC5AC-008577 MUC5AC-028300 1 0.1 1 0.1
MUC5AC-008577 rs34474233 1 0.004 1 0.004
MUC5AC-008577 rs35525357 1 0.1 1 0.1
rs28403537 MUC5AC-022675 1 0.007 0.6 0.003
rs28403537 MUC5AC-026495 1 0.01 1 0.02
rs28403537 MUC5AC-028300 1 0.03 1 0.03
rs28403537 rs34474233 1 1 1 1
rs28403537 rs35525357 1 0.03 1 0.04
MUC5AC-022675 MUC5AC-026495 0.4 0.001 0.8 0.007
MUC5AC-022675 MUC5AC-028300 0.9 0.2 0.9 0.2
MUC5AC-022675 rs34474233 1 0.008 0.3 0.001
MUC5AC-022675 rs35525357 0.9 0.2 1 0.2
MUC5AC-026495 MUC5AC-028300 1 0.04 1 0.05
MUC5AC-026495 rs34474233 1 0.01 1 0.02
94
Table 21: Continued 2
FIP Cases IPF Cases
Marker 1 Marker 2 D' r^2 D' r^2
MUC5AC-026495 rs35525357 1 0.05 1 0.05
MUC5AC-028300 rs34474233 1 0.03 1 0.03
MUC5AC-028300 rs35525357 1 0.8 0.9 0.7
rs34474233 rs35525357 1 0.04 1 0.04
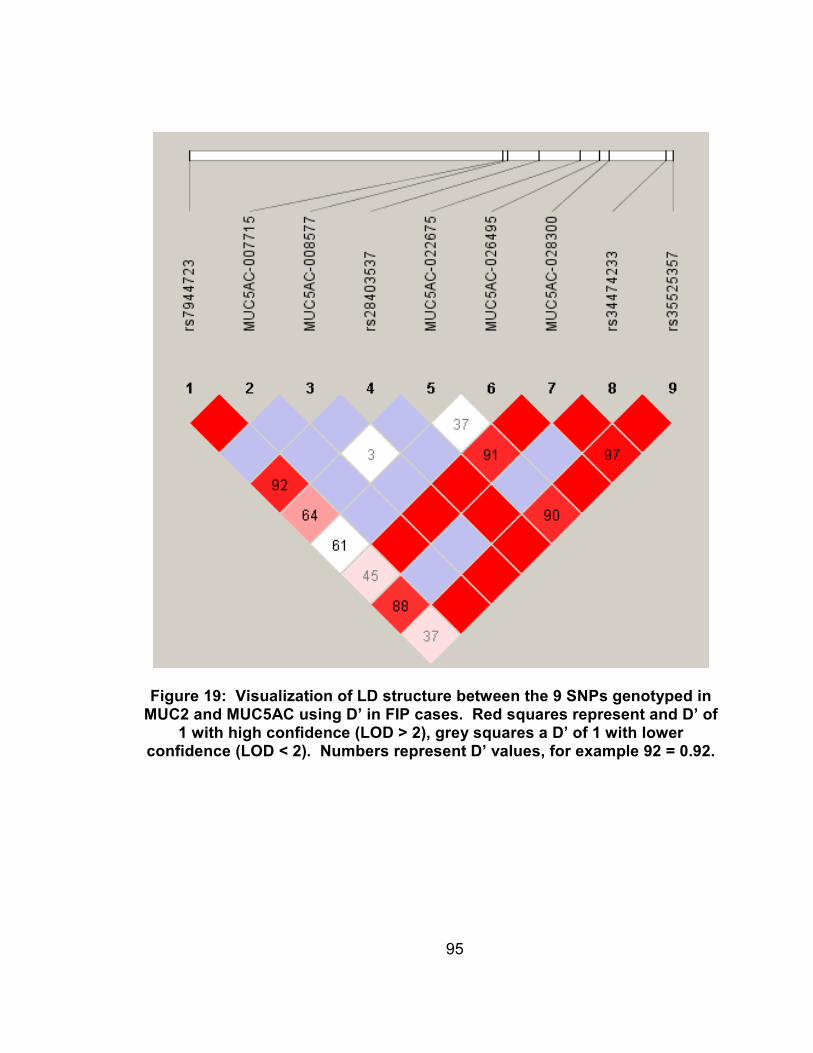
95
Figure 19: Visualization of LD structure between the 9 SNPs genotyped in MUC2 and MUC5AC using D’ in FIP cases. Red squares represent and D’ of
1 with high confidence (LOD > 2), grey squares a D’ of 1 with lower confidence (LOD < 2). Numbers represent D’ values, for example 92 = 0.92.
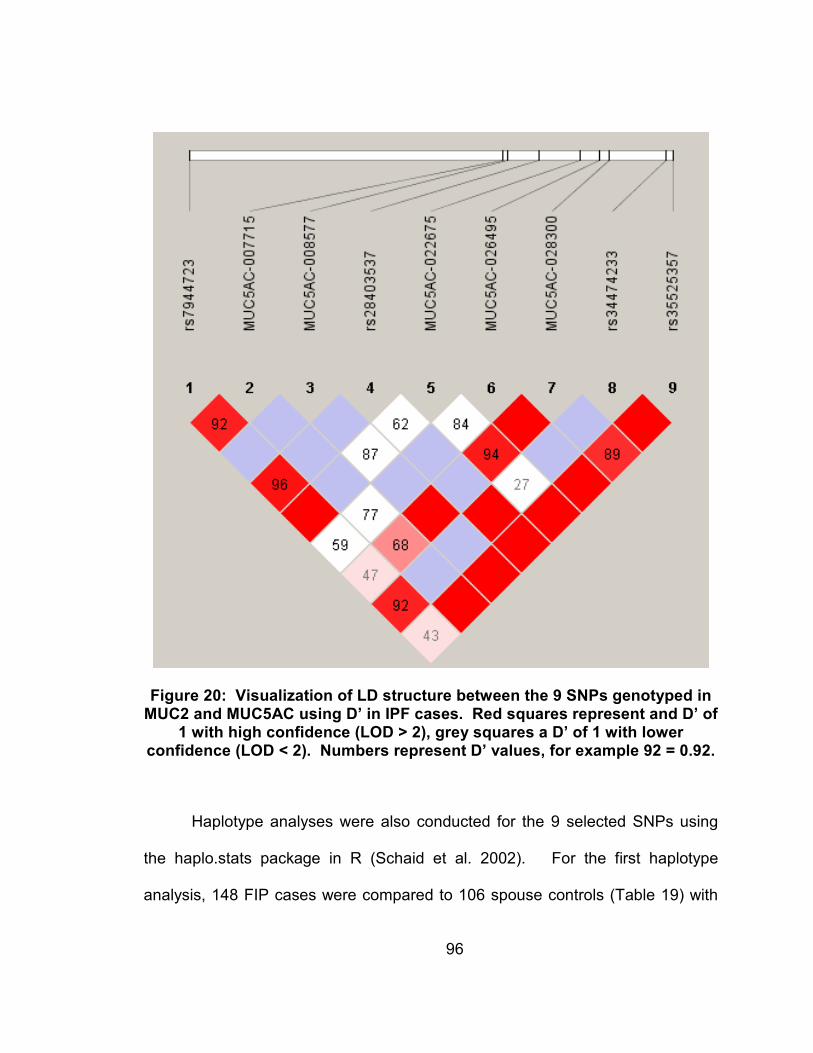
96
Figure 20: Visualization of LD structure between the 9 SNPs genotyped in MUC2 and MUC5AC using D’ in IPF cases. Red squares represent and D’ of
1 with high confidence (LOD > 2), grey squares a D’ of 1 with lower confidence (LOD < 2). Numbers represent D’ values, for example 92 = 0.92.
Haplotype analyses were also conducted for the 9 selected SNPs using
the haplo.stats package in R (Schaid et al. 2002). For the first haplotype
analysis, 148 FIP cases were compared to 106 spouse controls (Table 19) with

97
the frequency of haplotypes in both FIP cases and spouse controls given in
Table 20 for all haplotypes occurring with a frequency over 1%. The lowest p-
value was exhibited by the [rs7944723, rs28403537, and rs34474233] haplotype
including SNPs from both MUC2 and MUC5AC with a p-value = 0.002 and a
frequency of 12% in FIP cases and 4% in spouse controls. Looking at the IPF
cases (136 individuals) versus spouse controls (106 individuals) yielded similar
results (Table 21 and 22). The [rs7944723, rs28403537, and rs34474233]
haplotype also yielded the lowest p-value for IPF cases versus spouse controls,
with a p-value = 0.001 (12% IPF cases). Evaluating the OR of either having or
not having the [rs7944723, rs28403537, and rs34474233] haplotype combination
in both FIP and IPF cases versus controls yields an OR = 3.3 (95% CI = 1.5 to
7.8) for FIP cases versus spouse controls and an OR = 3.8 (95% CI = 1.4 to 5.5)
for IPF cases versus spouse controls. 41 of the 148 FIP families genotyped
(28%) have at least one member with the [rs7944723, rs28403537, and
rs34474233] haplotype. Of the 41 families, 15 families had only one individual
genotyped, while 26 had 2 or more cases genotyped. Of the 26 families with
multiple cases genotyped, in 18 families (69%) all cases typed shared the
[rs7944723, rs28403537, and rs34474233] haplotype, while in the remaining 8
families (31%) the [rs7944723, rs28403537, and rs34474233] haplotype was not
shared amongst cases.

98
Table 22: Haplotypes for 9 SNPs genotyped in MUC2 and MUC5AC with p-value for FIP cases versus spouse
controls (1 = major allele, 2 = minor allele) and +/- to indicate direction of the association (- when the haplotype
is more common in controls than cases, and + when the haplotype is more common in cases than controls)
rs7944723 MUC5AC
-007715
MUC5AC
-008577
rs28403537
MUC5AC
-022675
MUC5AC
-026495
MUC5AC
-028300
rs34474233
rs35525357
p-value
1
1
1
1
1
2
1
1
1
- 0.007
2
1
1
1
1
2
1
1
1
- 0.06
1
1
1
1
1
1
1
1
1
- 0.07
1
1
2
1
1
1
2
1
2
- 0.1
2
1
1
1
1
1
1
1
1
- 0.1
1
1
1
1
1
1
1
1
2
- 0.9
2
1
1
1
1
1
2
1
2
+
0.4
1
1
1
1
1
1
2
1
2
+
0.3
2
2
1
1
1
1
2
1
2
+
0.2
1
1
1
1
2
1
2
1
2
+
0.05
2
1
1
1
2
1
2
1
2
+
0.006
2
1
1
2
1
1
1
2
1
+
0.002
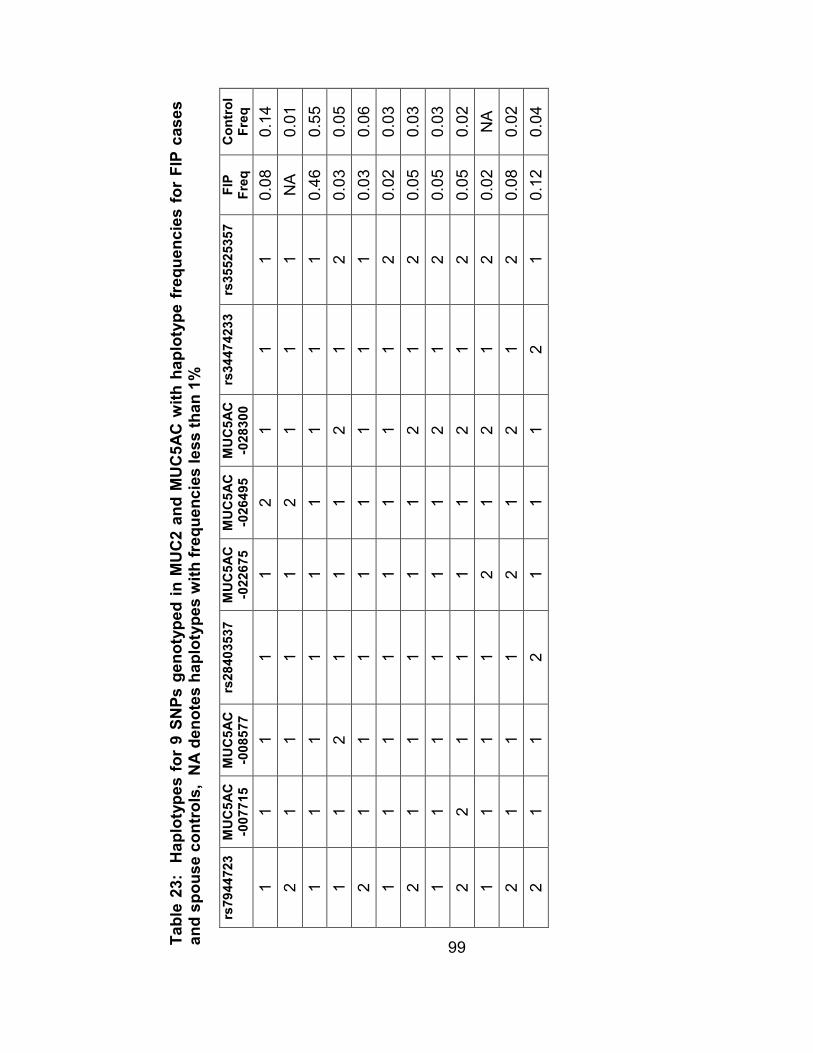
99
Table 23: Haplotypes for 9 SNPs genotyped in MUC2 and MUC5AC with haplotype frequencies for FIP cases
and spouse controls, NA denotes haplotypes with frequencies less than 1%
rs7944723 MUC5AC
-007715
MUC5AC
-008577
rs28403537
MUC5AC
-022675
MUC5AC
-026495
MUC5AC
-028300
rs34474233
rs35525357
FIP
Freq
Control
Freq
1
1
1
1
1
2
1
1
1
0.08
0.14
2
1
1
1
1
2
1
1
1
NA
0.01
1
1
1
1
1
1
1
1
1
0.46
0.55
1
1
2
1
1
1
2
1
2
0.03
0.05
2
1
1
1
1
1
1
1
1
0.03
0.06
1
1
1
1
1
1
1
1
2
0.02
0.03
2
1
1
1
1
1
2
1
2
0.05
0.03
1
1
1
1
1
1
2
1
2
0.05
0.03
2
2
1
1
1
1
2
1
2
0.05
0.02
1
1
1
1
2
1
2
1
2
0.02
NA
2
1
1
1
2
1
2
1
2
0.08
0.02
2
1
1
2
1
1
1
2
1
0.12
0.04

100
Table 24: Haplotypes for 9 SNPs genotyped in MUC2 and MUC5AC with p-value for FIP cases versus spouse
controls (1 = major allele, 2 = minor allele) and +/- to indicate direction of the association (- when the haplotype
is more common in controls than cases, and + when the haplotype is more common in cases than controls)
rs7944723 MUC5AC
-007715
MUC5AC
-008577
rs28403537
MUC5AC
-022675
MUC5AC
-026495
MUC5AC
-028300
rs34474233 rs35525357
p-value
1
1
1
1
1
1
1
1
1
- 0.007
1
1
2
1
1
1
2
1
2
- 0.02
1
1
1
1
1
2
1
1
1
- 0.04
2
1
1
1
1
1
1
1
1
- 0.1
1
1
1
1
1
1
1
1
2
- 0.2
2
1
1
1
1
2
1
1
1
- 0.4
2
1
1
1
1
1
1
1
2
+
0.5
1
1
1
1
1
1
2
1
1
+
0.4
2
1
1
1
1
1
2
1
2
+
0.3
1
1
1
1
1
1
2
1
2
+
0.3
2
2
1
1
1
1
1
1
2
+
0.07
2
1
1
2
1
1
2
2
1
+
0.07
2
2
1
1
1
1
2
1
2
+
0.05
2
1
1
1
2
1
2
1
2
+
0.009
2
1
1
2
1
1
1
2
1
+
0.001
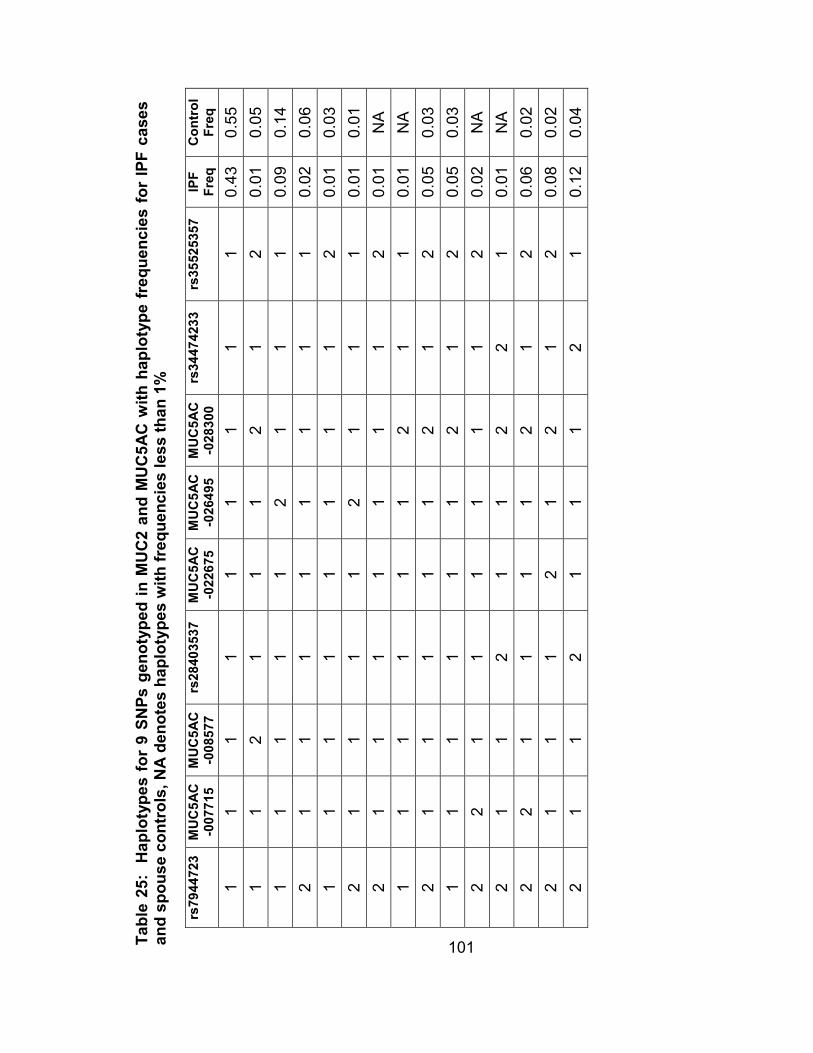
101
Table 25: Haplotypes for 9 SNPs genotyped in MUC2 and MUC5AC with haplotype frequencies for IPF cases
and spouse controls, NA denotes haplotypes with frequencies less than 1%
rs7944723 MUC5AC
-007715
MUC5AC
-008577
rs28403537
MUC5AC
-022675
MUC5AC
-026495
MUC5AC
-028300
rs34474233
rs35525357
IPF
Freq
Control
Freq
1
1
1
1
1
1
1
1
1
0.43
0.55
1
1
2
1
1
1
2
1
2
0.01
0.05
1
1
1
1
1
2
1
1
1
0.09
0.14
2
1
1
1
1
1
1
1
1
0.02
0.06
1
1
1
1
1
1
1
1
2
0.01
0.03
2
1
1
1
1
2
1
1
1
0.01
0.01
2
1
1
1
1
1
1
1
2
0.01
NA
1
1
1
1
1
1
2
1
1
0.01
NA
2
1
1
1
1
1
2
1
2
0.05
0.03
1
1
1
1
1
1
2
1
2
0.05
0.03
2
2
1
1
1
1
1
1
2
0.02
NA
2
1
1
2
1
1
2
2
1
0.01
NA
2
2
1
1
1
1
2
1
2
0.06
0.02
2
1
1
1
2
1
2
1
2
0.08
0.02
2
1
1
2
1
1
1
2
1
0.12
0.04

102
The 8 MUC5AC SNPs were also looked at as a whole to look for
associations between the disease phenotype and the MUC5AC gene in general.
A combined MUC5AC “SNP” was created by calling any individual with at least 1
minor allele in any of the 8 MUC5AC SNPs a 1 and all other individuals 0
(completely “wild-type” for all 8 SNPs). Testing this combined MUC5AC “SNP” in
both FIP and IPF cases versus spouse controls gave a p-value of 0.05 for FIP
cases versus controls and 0.0002 for IPF cases versus spouse controls. The OR
for the FIP cases overlapped with one, OR = 1.8 (95% CI 1.0 to 3.2), while the
OR for IPF cases was significant, OR = 3.3 (95% CI = 1.7 to 6.6). The number
of MUC5AC SNPs with at least one minor allele was also compared between
case and control individuals as the percent of individuals genotyped (Figure 21).
The mean and standard deviation for the number of MUC5AC SNPs per
individual was then calculated, along with two-tailed Student t tests with equal
variance for FIP and IPF cases versus spouse controls. The mean for both FIP
and IPF cases was 2 SNPs +/- 1 SNP, with a mean for spouse controls of 1 SNP
+/- 1 SNP. The t-test for both FIP and IPF cases, however, was highly significant
with p-value = 0.0005 for FIP cases versus spouse controls, and 7 x 10⁻⁶ for IPF
cases versus spouse controls.
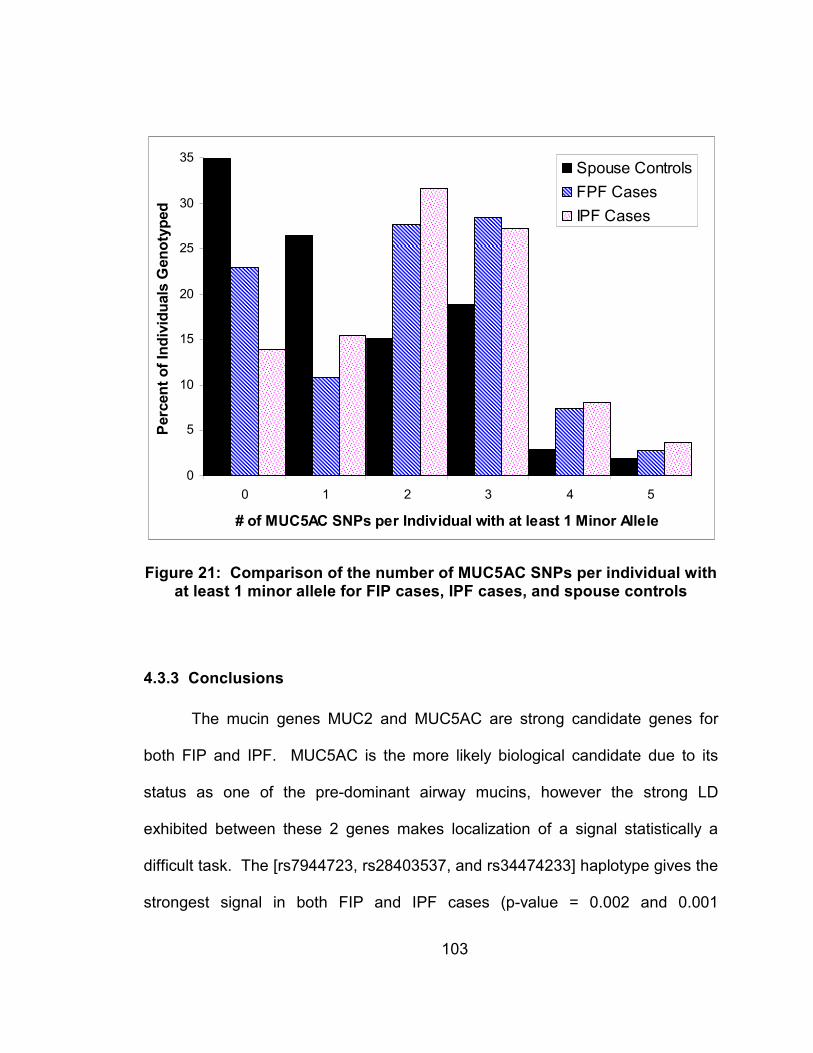
103
0
5
10
15
20
25
30
35
0 1 2 3 4 5
# of MUC5AC SNPs per Individual with at least 1 Minor Allele
Percent of Individuals Genotyped
Spouse Controls
FPF Cases
IPF Cases
Figure 21: Comparison of the number of MUC5AC SNPs per individual with at least 1 minor allele for FIP cases, IPF cases, and spouse controls
4.3.3 Conclusions
The mucin genes MUC2 and MUC5AC are strong candidate genes for
both FIP and IPF. MUC5AC is the more likely biological candidate due to its
status as one of the pre-dominant airway mucins, however the strong LD
exhibited between these 2 genes makes localization of a signal statistically a
difficult task. The [rs7944723, rs28403537, and rs34474233] haplotype gives the
strongest signal in both FIP and IPF cases (p-value = 0.002 and 0.001

104
respectively) and even accounting for the testing of multiple haplotypes, both of
these tests remain significant (Bonferroni correction for 12 comparisons in FIP
cases, corrected p-value < 0.05/12 = 0.004; Bonferroni correction for 15
comparisons in IPF cases, corrected p-value < 0.05/15 = 0.003). Both MUC2
and MUC5AC SNPs are represented in the [rs7944723, rs28403537, and
rs34474233] haplotype, however, only the SNPs in MUC5AC are located in
coding regions. The rs28403537 SNP is located in exon 12 of MUC5AC and
results in an amino acid change from alanine (Ala) to valine (Val). The other
MUC5AC SNP in the haplotype, rs34474233, is located in exon 46 and results in
an amino acid change from alanine (Ala) to threonine (Thr). This SNP however,
is in perfect LD (r2 = 1) with a neighboring SNP rs34815853 also located in exon
46 and not genotyped in the selected SNPs, since it can be predicted by
rs34474233. Since these two SNPs always occur together and are located in the
same codon, the amino acid change is actually from alanine (Ala) to lysine (Lys),
a significant shift from a nonpolar and neutral amino acid to a polar and basic
amino acid. Thus the [rs7944723, rs28403537, and rs34474233] haplotype in
effect represents at least 4 SNPs (rs7944723, rs28403537, rs34474233, and
rs34815853) with amino acid changes in exons 12 and 46 of MUC5AC. It is also
interesting to note that of the 8 families that do not share the [rs7944723,
rs28403537, and rs34474233] haplotype amongst cases, in 2 families it is the
individual with a consensus diagnosis of “other ILD probable” that does not share
the haplotype with the other IPF cases, while a third family exhibits only NSIP.

105
Thus, the [rs7944723, rs28403537, and rs34474233] haplotype may be
specifically related to IPF, a hypothesis supported by the strength of the
association in singleton IPF cases.

106
5. Discussion
5.1 Overall Conclusions and Implications
Given the complex nature of the IIPs, unraveling the etiology of FIP will be
an iterative process. Though FIP may account for only a small proportion of IIP
cases, exploring the genetics behind the familial form of disease may provide
insights into disease pathogenesis that are applicable to sporadic cases as well.
It is likely that both multiple genetic and environmental factors influence an
individual’s susceptibility to IIP. Thus, given the heterogeneous nature of
disease, it is important to be able to stratify populations in order to produce the
most homogeneous sub-set possible using the available knowledge. This
genetic heterogeneity can be seen in the results of the whole genome linkage
screen conducted in this study which revealed 3 distinct loci for FIP on
chromosomes 10, 11, and 12. Furthermore, evidence of linkage to the
chromosome 12 locus was seen only in homogeneous families, illustrating the
importance of stratification based on phenotype. Fine-mapping of the
chromosome 10 region of interest additionally revealed that the signal on
chromosome 10 may be the result of more than one locus, as stratifying into
homogeneous and heterogeneous families resulted in 2 separate peaks with
non-overlapping 95% confidence intervals. Thus, more than one gene may be
playing a role in the development of FIP on chromosome 10, perhaps accounting

107
in part for the distinct phenotypic characteristics seen amongst homogeneous
and heterogeneous families.
Following up on the linkage results using ordered subset analysis allowed
for further exploration of the linkage results through stratification based on other
genetic (linkage to other chromosomes) and environmental factors (proportion of
affected individuals that smoked within a family). These stratifications also
yielded promising results. For chromosome 10, stratification using a subset of 27
heterogeneous families defined by OSA produced an increase in LOD score from
1.6 to 5.1. Thus, stratification by both phenotype and potential genotype
increased evidence for linkage on chromosome 10. On chromosome 11,
stratification of families based on smoking status had a significant impact on
linkage to chromosome 11, with a subset of 43 families giving a LOD score of
4.9. Within this subset of families, affected individuals were less likely to have
ever smoked, with the proportion of smokers per family less than 67% for all
families. This presents an interesting case, where the genetic locus on
chromosome 11 may be a susceptibility factor for FIP independent of smoking, a
known risk factor for FIP.
Further delving into the chromosome 11 region of interest identified two
mucin candidate genes, MUC2 and MUC5AC. Both MUC2 and MUC5AC are
secreted mucins, and were likely formed from a gene duplication event. Located
next to one another on chromosome 11, the two genes map to a region from
11p15.4 to 11p15.5 that harbors 4 mucin genes (in order starting closest to the

108
telomere: MUC6, MUC2, MUC5AC, and MUC5B). There are recombination
hotspots located between MUC6 and MUC2, as well as within the early part of
MUC5B (Rousseau et al. 2007), however markers within the two mucin
candidate genes MUC2 and MUC5AC exhibit strong LD. Distinguishing the
functional location of an association signal can therefore be problematic. Though
our interest was drawn to the mucin region of chromosome 11 by a strong
association signal seen in the MUC2 SNP rs7944723, the neighboring MUC5AC
gene is a better biological candidate since it is one of the predominant mucins
expressed in the airways. Re-sequencing of both genes was therefore
conducted resulting in 34 significant SNPs with p-values < 0.05 in either FIP or
IPF cases from MUC2 and MUC5AC. To confirm these findings the 10 most
promising SNPs were selected for additional genotyping in the entire FIP cohort
(66 additional families, plus the original 82 to yield 148 total families) along with a
replicate cohort of 136 independent IPF cases (completely separate from the 96
InterMune IPF cases previously studied). All 9 of the 10 SNPs tested to date
have replicated the previous results, strongly implicating mutations in the mucin
genes in both FIP and IPF. Furthermore, a strong association was found for a
haplotype containing 4 SNPs (rs7944723, rs28403537, rs34474233, and
rs34815853) with both FIP and IPF (p-value 0.002 and 0.001 respectively).
Though the single MUC2 SNP (rs7944723) found in the haplotype is intronic, all
three of the other MUC5AC SNPs result in amino acid changes, providing further

109
evidence for polymorphisms in MUC5AC acting as the functional variants driving
the signal on chromosome 11.
To date, polymorphisms in only three genes (surfactant protein C
(SFTPC), telomerase reverse transcriptase (TERT), and the RNA component of
telomerase (TERC))(Thomas et al. 2002; Whitsett 2002; Chibbar et al. 2004;
Tredano et al. 2004; Setoguchi et al. 2006; Armanios et al. 2007; Tsakiri et al.
2007) have been associated with FIP. With the replication of non-synonymous
MUC5AC polymorphisms shown to be associated with both FIP and IPF in this
study, we hope to soon add one or more mucin genes to that list. Given that
current therapeutic approaches to IIP/FIP are limited and often inadequate,
identifying genetic and phenotypic subtypes of IIP/FIP may also prove significant
in reducing the burden of disease by identifying susceptible individuals at an
earlier age and intervening in very specific ways to delay disease development
and minimize disease progression. Thus, identification of genetic and
environmental risk factors for IIP/FIP will not only further elucidate the
understanding of disease pathogenesis, but additionally facilitate the
development of novel therapeutic and preventative approaches to treat these
progressive and devastating fibroproliferative diseases.

110
5.2 Limitations
The limitations of this study must also be taken into consideration. As with
many studies considering the genetic basis of a disease, there is a potential for
ascertainment bias in this study. Though families were recruited in such a way to
try and reduce such bias as much as possible (contacting all first degree and
connecting relatives of affected individuals, communicating with local physicians
to facilitate diagnostic testing, and aiding with information transfer both to and
from participants to improve the ease of participation in the study) some families
contacted chose not to participate in the study or give blood for DNA. Due to
Institutional Review Board restrictions, information on the demographic and
clinical characteristics of these families is unknown, and therefore it is not certain
that they represent a population similar to that enrolled in and later genotyped in
the study. For example, all 82 families in the linkage analysis were of Caucasian
decent, though outreach was made to all demographics. Thus, the applicability
of our results to other populations is unknown. Furthermore, only families with 2
or more consensus diagnosed (definite or probable) cases of IIP that were
informative for linkage analysis were used for the whole genome linkage screen.
Families with only parent/child cases are not informative for linkage analysis, and
it is unknown whether these families harbor the same genetic susceptibility as
those families used in the linkage screen. Additionally, both probable (HRCT
diagnosed) and definite (biopsy or autopsy diagnosed) cases were considered
affected for all analyses, thus not all cases were biopsy proven IIP.

111
5.3 Future Studies
Though this study represents substantial progress towards the goal of
determining genetic and environmental risk factors involved in FIP and IIP,
unraveling the etiology of FIP is an iterative process. Thus, each new discovery
can be used to design better analyses and inform future studies.
On chromosome 11 a strong signal has been detected in the mucin genes
associating MUC2 and MUC5AC with both FIP and IPF. A significant increase in
linkage signal on chromosome 11 was also observed amongst a subset of
families with low average cigarette smoking amongst cases using OSA. Thus,
given the importance of cigarette smoking as a potential risk factor for FIP in
general and the increase in linkage in low smokers on chromosome 11 in
particular, further investigation into the mucin genes incorporating individual level
smoking data is an important next step. Studies using knock-out animal models
for MUC2 and MUC5AC may also yield insights into the function of mucins in
FIP.
Heterozygous mutations in TERT and TERC have also recently been
reported (Armanios et al. 2007; Tsakiri et al. 2007) in about 10% of individuals
with FIP and fewer than 1% of sporadic IPF cases. Specific evaluation of
markers flanking TERT and TERC in our families failed to identify families that
are conclusively linked to this gene, although some families did show slightly

112
positive LOD scores. Future sequencing of the TERT and TERC genes in our
families would allow for the removal of any families associated with these genes
from future analyses, thus creating a more homogeneous population for further
gene discovery.
On chromosome 10, stratifying based upon linkage to chromosome 11
revealed a region of interest that lies primarily over a gene desert. Interestingly,
a recent whole genome association study for Crohn's disease found a similar
signal originating in a gene desert (Libioulle et al. 2007) and hypothesize that it
serves to modulate the expression of PTGER4, the next closest gene. It is
hypothesized that these regions may harbor long range regulatory features, and
thus investigation into this region may reveal novel findings relevant not only to
FIP, but the process of gene regulation in general.

113
References
Abecasis, GR, Cherny, SS, Cookson, WO and Cardon, LR (2002). "Merlin--rapid analysis of dense genetic maps using sparse gene flow trees." Nat Genet 30(1): 97-101.
Abecasis, GR and Wigginton, JE (2005). "Handling marker-marker linkage disequilibrium: pedigree analysis with clustered markers." Am J Hum Genet 77(5): 754-67.
Ali, MS and Pearson, JP (2007). "Upper airway mucin gene expression: a review." Laryngoscope 117(5): 932-8.
American Thoracic Society and the European Respiratory Society (2000). "American Thoracic Society. Idiopathic pulmonary fibrosis: diagnosis and treatment. International consensus statement. American Thoracic Society (ATS), and the European Respiratory Society (ERS)." Am J Respir Crit Care Med 161(2 Pt 1): 646-64.
American Thoracic Society and the European Respiratory Society (2002). "American Thoracic Society/European Respiratory Society International Multidisciplinary Consensus Classification of the Idiopathic Interstitial Pneumonias. This joint statement of the American Thoracic Society (ATS), and the European Respiratory Society (ERS) was adopted by the ATS board of directors, June 2001 and by the ERS Executive Committee, June 2001." Am J Respir Crit Care Med 165(2): 277-304.
Armanios, MY, Chen, JJ, Cogan, JD, Alder, JK, Ingersoll, RG, Markin, C, Lawson, WE, Xie, M, Vulto, I, Phillips, JA, 3rd, Lansdorp, PM, Greider, CW and Loyd, JE (2007). "Telomerase mutations in families with idiopathic pulmonary fibrosis." N Engl J Med 356(13): 1317-26.
Barrett, JC, Fry, B, Maller, J and Daly, MJ (2005). "Haploview: analysis and visualization of LD and haplotype maps." Bioinformatics 21(2): 263-5.

114
Bitterman, PB, Rennard, SI, Keogh, BA, Wewers, MD, Adelberg, S and Crystal, RG (1986). "Familial idiopathic pulmonary fibrosis. Evidence of lung inflammation in unaffected family members." N Engl J Med 314(21): 1343-7.
Bjoraker, JA, Ryu, JH, Edwin, MK, Myers, JL, Tazelaar, HD, Schroeder, DR and Offord, KP (1998). "Prognostic significance of histopathologic subsets in idiopathic pulmonary fibrosis." Am J Respir Crit Care Med 157(1): 199-203.
Boehnke, M and Cox, NJ (1997). "Accurate inference of relationships in sib-pair linkage studies." Am J Hum Genet 61(2): 423-9.
Borzone, G, Moreno, R, Urrea, R, Meneses, M, Oyarzun, M and Lisboa, C (2001). "Bleomycin-induced chronic lung damage does not resemble human idiopathic pulmonary fibrosis." Am J Respir Crit Care Med 163(7): 1648-53.
Boyles, AL, Scott, WK, Martin, ER, Schmidt, S, Li, YJ, Ashley-Koch, A, Bass, MP, Schmidt, M, Pericak-Vance, MA, Speer, MC and Hauser, ER (2005). "Linkage disequilibrium inflates type I error rates in multipoint linkage analysis when parental genotypes are missing." Hum Hered 59(4): 220-7.
Broman, KW (2001). "Estimation of allele frequencies with data on sibships." Genet Epidemiol 20(3): 307-15.
Chang, J, Han, J, Kim, DW, Lee, I, Lee, KY, Jung, S, Han, HS, Chun, BK, Cho, SJ, Lee, K, Lim, BJ and Shin, DH (2002). "Bronchiolitis obliterans organizing pneumonia: clinicopathologic review of a series of 45 Korean patients including rapidly progressive form." J Korean Med Sci 17(2): 179-86.
Chibbar, R, Shih, F, Baga, M, Torlakovic, E, Ramlall, K, Skomro, R, Cockcroft, DW and Lemire, EG (2004). "Nonspecific interstitial pneumonia and usual interstitial pneumonia with mutation in surfactant protein C in familial pulmonary fibrosis." Mod Pathol 17(8): 973-80.
Chua, F, Gauldie, J and Laurent, GJ (2005). "Pulmonary fibrosis: searching for model answers." Am J Respir Cell Mol Biol 33(1): 9-13.

115
Costabel, U, du Bois, RM and Egan, JJ Eds. (2007). Diffuse Parenchymal Lung Disease Progress in Respiratory Research, Karger.
Dempsey, OJ (2006). "Clinical review: idiopathic pulmonary fibrosis--past, present and future." Respir Med 100(11): 1871-85.
Duren W.L., EM, Li M., and Boehnke M.. (June 2004). RELPAIR: A Program that Infers the Relationships of Pairs of Individuals Based on Marker Data. Version 2.0.1.
Elston, RC and Stewart, J (1971). "A general model for the genetic analysis of pedigree data." Hum Hered 21(6): 523-42.
Epstein, MP, Duren, WL and Boehnke, M (2000). "Improved inference of relationship for pairs of individuals." Am J Hum Genet 67(5): 1219-31.
Ferris, BG (1978). "Epidemiology Standardization Project (American Thoracic Society)." Am Rev Respir Dis 118(6 Pt 2): 1-120.
Hauser, ER, Watanabe, RM, Duren, WL, Bass, MP, Langefeld, CD and Boehnke, M (2004). "Ordered subset analysis in genetic linkage mapping of complex traits." Genet Epidemiol 27(1): 53-63.
Haynes, C, Speer, M, Peedin, M, Roses, A, Haines, J, Vance, J and Pericak-Vance, M (1995). "PEDIGENE: a comprehensive data management system to facilitate efficient and rapid disease gene mapping." Am J Hum Genet Suppl 57: A193.
Hodgson, U, Laitinen, T and Tukiainen, P (2002). "Nationwide prevalence of sporadic and familial idiopathic pulmonary fibrosis: evidence of founder effect among multiplex families in Finland." Thorax 57(4): 338-42.
Hunninghake, GW and Schwarz, MI (2007). "Does current knowledge explain the pathogenesis of idiopathic pulmonary fibrosis? A perspective." Proc Am Thorac Soc 4(5): 449-52.

116
Hunninghake, GW, Zimmerman, MB, Schwartz, DA, King, TE, Jr., Lynch, J, Hegele, R, Waldron, J, Colby, T, Muller, N, Lynch, D, Galvin, J, Gross, B, Hogg, J, Toews, G, Helmers, R, Cooper, JA, Jr., Baughman, R, Strange, C and Millard, M (2001). "Utility of a lung biopsy for the diagnosis of idiopathic pulmonary fibrosis." Am J Respir Crit Care Med 164(2): 193-6.
Javaheri, S, Lederer, DH, Pella, JA, Mark, GJ and Levine, BW (1980). "Idiopathic pulmonary fibrosis in monozygotic twins. The importance of genetic predisposition." Chest 78(4): 591-4.
Kim, DS, Collard, HR and King, TE, Jr. (2006). "Classification and natural history of the idiopathic interstitial pneumonias." Proc Am Thorac Soc 3(4): 285-92.
Kong, A and Cox, NJ (1997). "Allele-sharing models: LOD scores and accurate linkage tests." Am J Hum Genet 61(5): 1179-88.
Kong, X and Matise, TC (2005). "MAP-O-MAT: internet-based linkage mapping." Bioinformatics 21(4): 557-9.
Lander, E and Kruglyak, L (1995). "Genetic dissection of complex traits: guidelines for interpreting and reporting linkage results." Nat Genet 11(3): 241-7.
Lander, ES and Green, P (1987). "Construction of multilocus genetic linkage maps in humans." Proc Natl Acad Sci U S A 84(8): 2363-7.
Libioulle, C, Louis, E, Hansoul, S, Sandor, C, Farnir, F, Franchimont, D, Vermeire, S, Dewit, O, de Vos, M, Dixon, A, Demarche, B, Gut, I, Heath, S, Foglio, M, Liang, L, Laukens, D, Mni, M, Zelenika, D, Van Gossum, A, Rutgeerts, P, Belaiche, J, Lathrop, M and Georges, M (2007). "Novel Crohn disease locus identified by genome-wide association maps to a gene desert on 5p13.1 and modulates expression of PTGER4." PLoS Genet 3(4): e58.
Macintyre, N, Crapo, RO, Viegi, G, Johnson, DC, van der Grinten, CP, Brusasco, V, Burgos, F, Casaburi, R, Coates, A, Enright, P, Gustafsson, P, Hankinson, J, Jensen, R, McKay, R, Miller, MR, Navajas, D, Pedersen, OF, Pellegrino, R and Wanger, J (2005). "Standardisation of the single-breath determination of carbon monoxide uptake in the lung." Eur Respir J 26(4): 720-35.

117
Mageto, YN and Raghu, G (1997). "Genetic predisposition of idiopathic pulmonary fibrosis." Curr Opin Pulm Med 3(5): 336-40.
Marshall, RP, McAnulty, RJ and Laurent, GJ (1997). "The pathogenesis of pulmonary fibrosis: is there a fibrosis gene?" Int J Biochem Cell Biol 29(1): 107-20.
Marshall, RP, Puddicombe, A, Cookson, WO and Laurent, GJ (2000). "Adult familial cryptogenic fibrosing alveolitis in the United Kingdom." Thorax 55(2): 143-6.
Martin, ER, Bass, MP, Hauser, ER and Kaplan, NL (2003). "Accounting for linkage in family-based tests of association with missing parental genotypes." Am J Hum Genet 73(5): 1016-26.
Miller, MR, Hankinson, J, Brusasco, V, Burgos, F, Casaburi, R, Coates, A, Crapo, R, Enright, P, van der Grinten, CP, Gustafsson, P, Jensen, R, Johnson, DC, MacIntyre, N, McKay, R, Navajas, D, Pedersen, OF, Pellegrino, R, Viegi, G and Wanger, J (2005). "Standardisation of spirometry." Eur Respir J 26(2): 319-38.
NIEHS SNPs. "NIEHS Environmental Genome Project." 2008, from http://egp.gs.washington.edu.
Noth, I and Martinez, FJ (2007). "Recent advances in idiopathic pulmonary fibrosis." Chest 132(2): 637-50.
O'Connell, JR and Weeks, DE (1995). "The VITESSE algorithm for rapid exact multilocus linkage analysis via genotype set-recoding and fuzzy inheritance." Nat Genet 11(4): 402-8.
O'Connell, JR and Weeks, DE (1998). "PedCheck: a program for identification of genotype incompatibilities in linkage analysis." Am J Hum Genet 63(1): 259-66.
Raghu, G, Weycker, D, Edelsberg, J, Bradford, WZ and Oster, G (2006). "Incidence and prevalence of idiopathic pulmonary fibrosis." Am J Respir Crit Care Med 174(7): 810-6.

118
Rogers, DF (2007). "Physiology of airway mucus secretion and pathophysiology of hypersecretion." Respir Care 52(9): 1134-46; discussion 1146-9.
Rousseau, K, Byrne, C, Griesinger, G, Leung, A, Chung, A, Hill, AS and Swallow, DM (2007). "Allelic association and recombination hotspots in the mucin gene (MUC) complex on chromosome 11p15.5." Ann Hum Genet 71(Pt 5): 561-9.
Schaid, DJ, Rowland, CM, Tines, DE, Jacobson, RM and Poland, GA (2002). "Score tests for association between traits and haplotypes when linkage phase is ambiguous." Am J Hum Genet 70(2): 425-34.
Selman, M, King, TE and Pardo, A (2001). "Idiopathic pulmonary fibrosis: prevailing and evolving hypotheses about its pathogenesis and implications for therapy." Ann Intern Med 134(2): 136-51.
Selman, M, Lin, HM, Montano, M, Jenkins, AL, Estrada, A, Lin, Z, Wang, G, DiAngelo, SL, Guo, X, Umstead, TM, Lang, CM, Pardo, A, Phelps, DS and Floros, J (2003). "Surfactant protein A and B genetic variants predispose to idiopathic pulmonary fibrosis." Hum Genet 113(6): 542-50.
Setoguchi, Y, Ikeda, T and Fukuchi, Y (2006). "Clinical features and genetic analysis of surfactant protein C in adult-onset familial interstitial pneumonia." Respirology 11 Suppl: S41-5.
Steele, MP, Speer, MC, Loyd, JE, Brown, KK, Herron, A, Slifer, SH, Burch, LH, Wahidi, MM, Phillips, JA, 3rd, Sporn, TA, McAdams, HP, Schwarz, MI and Schwartz, DA (2005). "Clinical and pathologic features of familial interstitial pneumonia." Am J Respir Crit Care Med 172(9): 1146-52.
Thomas, AQ, Lane, K, Phillips, J, 3rd, Prince, M, Markin, C, Speer, M, Schwartz, DA, Gaddipati, R, Marney, A, Johnson, J, Roberts, R, Haines, J, Stahlman, M and Loyd, JE (2002). "Heterozygosity for a surfactant protein C gene mutation associated with usual interstitial pneumonitis and cellular nonspecific interstitial pneumonitis in one kindred." Am J Respir Crit Care Med 165(9): 1322-8.
Thornton, DJ and Sheehan, JK (2004). "From mucins to mucus: toward a more coherent understanding of this essential barrier." Proc Am Thorac Soc 1(1): 54-61.

119
Tredano, M, Griese, M, Brasch, F, Schumacher, S, de Blic, J, Marque, S, Houdayer, C, Elion, J, Couderc, R and Bahuau, M (2004). "Mutation of SFTPC in infantile pulmonary alveolar proteinosis with or without fibrosing lung disease." Am J Med Genet A 126(1): 18-26.
Tsakiri, KD, Cronkhite, JT, Kuan, PJ, Xing, C, Raghu, G, Weissler, JC, Rosenblatt, RL, Shay, JW and Garcia, CK (2007). "Adult-onset pulmonary fibrosis caused by mutations in telomerase." Proc Natl Acad Sci U S A 104(18): 7552-7.
Voynow, JA, Gendler, SJ and Rose, MC (2006). "Regulation of mucin genes in chronic inflammatory airway diseases." Am J Respir Cell Mol Biol 34(6): 661-5.
Whitsett, JA (2002). "Genetic basis of familial interstitial lung disease: misfolding or function of surfactant protein C?" Am J Respir Crit Care Med 165(9): 1201-2.
Whittemore, AS and Halpern, J (1994). "A class of tests for linkage using affected pedigree members." Biometrics 50(1): 118-27.
Williams, OW, Sharafkhaneh, A, Kim, V, Dickey, BF and Evans, CM (2006). "Airway mucus: From production to secretion." Am J Respir Cell Mol Biol 34(5): 527-36.
Xu, H, Gregory, SG, Hauser, ER, Stenger, JE, Pericak-Vance, MA, Vance, JM, Zuchner, S and Hauser, MA (2005). "SNPselector: a web tool for selecting SNPs for genetic association studies." Bioinformatics 21(22): 4181-6.

120
Biography
Anastasia L. Wise Place of birth: Syracuse, NY Date of birth: February 25, 1982 Education University of North Carolina at Chapel Hill, Chapel Hill, North Carolina, Environmental Science, B.S., with highest honors and distinction, 2000-2003. Honors NIH Training Grant, Integrated Toxicology Program, Duke University, 2003 – 2005 Rockefeller University Advanced Linkage Analysis Course Travel Award, Dec 2004 NRSA Training Grant (1 F31 NS053282-01), NINDS, awarded Sept 2005 Intramural Research Training Award, NIEHS, March 2006 – May 2008
Articles Wise AL, Schwartz DA (updated June 2007) Familial Pulmonary Fibrosis in: GeneReviews at GeneTests: Medical Genetics Information Resource [database online]. Copyright, University of Washington, Seattle. 1997-2007. Available at http://www.genetests.org. Brass DM, Wise AL and Schwartz DA. Host-environment interactions in exposure-related diffuse lung diseases. Seminars in Respiratory and Critical Care Medicine. In press Wise AL, Speer MC, Steele MP, Burch LH, Herron A, Loyd JE, Brown KK, Phillips III JA, Slifer SH, Sporn TA, McAdams P, Schwarz MI, Schwartz DA. Linkage to Chromosome 10p in Familial Interstitial Pneumonia (FIP) Demonstrates that FIP is a Complex Disease. To be submitted to: The American Journal of Human Genetics Speer MC, Burch LH, Wise AL, Steele MP, Herron A, Loyd JE, Brown KK, Phillips III JA, Slifer SH, Potocky CF, Sporn TA, McAdams P, Schwarz MI, Schwartz DA. Familial Interstitial Pneumonia is linked to Chromosomes 10, 11, and 12. To be revised for: The American Journal of Respiratory and Critical Care Medicine