unraveling the conundrum of river response to rising sea
TRANSCRIPT

Part II of manuscript submitted to Sedimentology, May, 2006
1
Unraveling the conundrum of river response to rising sea level from
laboratory to field. Part II. The Fly-Strickland River System, Papua New
Guinea
GARY PARKERa, TETSUJI MUTOb, YOSHIHISA AKAMATSUc, WILLIAM E.
DIETRICHd and J. WESLEY LAUERe
aDept. of Civil and Environmental Engineering and Dept. of Geology, University of Illinois, Hydrosystems Laboratory, 205 N. Mathews, Urbana Illinois 61801 USA. bFaculty of Environmental Studies, Nagasaki University, 1-14 Bunkyomachi, Nagasaki 852-8521, Japan cDepartment of Environmental Science and Technology, Tokyo Institute of Technology 4259, Nagatsuda-cho, Midori-ku, Yokohama-shi, Kanagawa, 226-8502, Japan dDepartment of Earth and Planetary Science, University of California Berkeley, CA 94720-4767 USA eSt. Anthony Falls Laboratory, University of Minnesota, 2 3rd St. SE, Minneapolis, MN 55141 USA.
ABSTRACT
The most recent deglaciation resulted in a global sea level rise of some 120 m
over approximately 12000 years. A moving boundary numerical model is
developed to predict the response of rivers to this rise. The model was motivated
by experiments at small-scale, which have identified two modes describing the
transgression of a river mouth: autoretreat without abandonment of the river delta
(no sediment starvation at the topset-foreset break) and sediment-starved
autoretreat with abandonment of the delta. In the latter case transgression is far
more rapid, and its effects are felt much farther upstream of the river mouth. A
moving boundary numerical model that captures these features in experimental

Part II of manuscript submitted to Sedimentology, May, 2006
2
deltas is adapted to describe the response of the Fly-Strickland River system,
Papua New Guinea. In the absence of better information, the model is applied to
the case of sea level rise without local climate change in New Guinea. The
model suggests that a) sea level rise forced the river mouth to transgress over
700 km since the last glacial maximum, b) sediment-starved autoretreat forced
enough bed aggradation to block a tributary with a low sediment load and create
the present-day Lake Murray, c) the resulting aggradation was sufficient to move
the gravel-sand transition on the Strickland River upstream, d) the present-day
Fly Estuary may be in part a relict river valley drowned by sea level rise and
partially filled by tidal effects, and e) the Fly River is presently reforming its
bankfull geometry and prograding into the Fly Estuary. A parametric study with
the model indicates that sediment concentration during floods plays a key role in
determining whether or not, and to what extent, transgression is expressed in
terms of sediment-starved autoretreat. A sufficiently high sediment concentration
can prevent sediment-starved autoretreat during the entire sea level cycle. This
observation may explain why some present-day river mouths are expressed in
terms of deltas protruding into the sea, and others are wholly contained within
embayments or estuaries in which water has invaded landward.
Keywords rivers, deltas, transgression, sea level, autoretreat
INTRODUCTION
This paper is a companion to Parker et al. (submitted); both papers address
the response of rivers to sea level rise. The last deglaciation caused a

Part II of manuscript submitted to Sedimentology, May, 2006
3
Pleistocene-Holocene eustatic sea level rise of some 120 m. Nearly all this rise
was realized in a 12000 period between 18000 and 6000 years BP. Sea level
rise likely had a dramatic effect on rivers near their mouths, and perhaps farther
upstream.
In the companion paper, Parker et al. (submitted), a numerical model of
delta response to sea level rise is outlined and tested against the experiments of
Muto (2001). The numerical successfully captures two modes of shoreline
transgression identified by Muto (2001); autoretreat without abandonment of the
river delta (no sediment starvation at the topset-foreset break) and sediment-
starved autoretreat with abandonment of the delta. Here the model is adapted to
study the effect of Holocene sea level rise on the Fly-Strickland River system,
Papua New Guinea.
THE FLY-STRICKLAND RIVER SYSTEM, PAPUA NEW GUINEA
Overview The Fly-Strickland River system is a major river system that
drains the tectonically active highlands of New Guinea, crosses the Fly Platform
and flows into the Gulf of Papua (Fig. 1). The lower Fly River is the reach below
Everill Junction (Fig. 1). Everill Junction is formed by the confluence of the
middle Fly River from the west and the larger Strickland River from the east (Fig.
2). The total area drained by the system is about 75,000 km2.
In the highlands both the Fly and Strickland Rivers alternate between
bedrock and gravel-bed morphologies in response to a complex pattern of uplift.
As they flow onto the lower slopes of the Fly Platform they become alluvial

Part II of manuscript submitted to Sedimentology, May, 2006
4
gravel-bed streams. Farther downstream both streams undergo a transition from
gravel-bed to sand-bed morphology. The transition points appear to fall near a
hinge line, with uplift to the northeast and slow subsidence to the southwest
(Dietrich et al., 1999). Of prime interest here are the sand-bed reaches.
Three abbreviations appear in Figure 1. “EFR” denotes the downstream
end of the fluvial reach, beyond which the channel widens considerably into an
estuary. “BEF” denotes the upstream end, or beginning point downstream of
which the estuary rapidly flares outward. “OEE” denotes the outer edge of the
estuary. These points are referenced later in the paper.
Blocked-valley lakes: a relict of Pleistocene-Holocene sea level rise A
characteristic feature of the sand-bed Fly and Strickland Rivers above Everill
Junction is the presence of numerous blocked-valley lakes, the largest of which
is Lake Murray (Fig. 2). These lakes appear to have formed in response to
Pleistocene-Holocene sea level rise (Pickup, 1984; Dietrich et al., 1999). That is,
sea level rise forced aggradation on the main-stem Fly and Strickland Rivers,
both of which have sediment supplies sourced in the highlands. The small
tributaries flowing into the Fly and Strickland Rivers in Fig. 15 are not sourced in
the highlands, and as a result have much lower sediment yields per unit drainage
area. As a result they were not able to aggrade in pace with main-stem
aggradation, so resulting in the blocked-valley lakes (Pickup,1984; Dietrich et
al.,1999).
Effect of climate change The most extensive available studies of the
effect of sea level rise on large, lowland streams have been conducted on rivers

Part II of manuscript submitted to Sedimentology, May, 2006
5
at relatively high latitudes which are subject to a temperate climate under
present-day conditions. Two examples discussed in Blum and Törnqvist (2000)
are those of the Mississippi and Rhine Rivers. While sea level rise itself is an
upstream-propagating consequence of deglaciation, such rivers were also
subjected to downstream-propagating effects associated with deglaciation.
These include meltwater floods that were at times orders of magnitude larger
than the floods experienced today, and sediment loads derived from glacial till
which may also have been considerably higher than those experienced in the
present. The combination of both upstream- and downstream-propagating
effects makes the direct signature of sea level rise rather difficult to discern.
The island of New Guinea offers an obvious advantage in this regard.
New Guinea undoubtedly underwent a noticeable change in climate from the last
glacial maximum to the present. This change is evidenced by, among other
things, a dramatic reduction in glaciated area in the highlands from the last
glacial maximum to the present (Hope and Peterson, 1975; Peterson et al., 2002).
This comment notwithstanding, even at the last glacial maximum the areal
fraction of the highlands that was actually glaciated in no way compares with the
coverage of North America and Europe by continental glaciers. More precisely,
the country of Papua New Guinea occupying the eastern half of the island has an
area near 475,000 km2, of which perhaps less than 1000 km2 were glaciated
during the last glacial maximum (e.g. Peterson et al., 2002). Located at the
equator and surrounded by the Pacific Ocean, it can be surmised that climate
variation from the last glacial maximum to the present was much weaker than at

Part II of manuscript submitted to Sedimentology, May, 2006
6
higher latitudes (e.g. Loffler, 1973), and that glacial outburst floods similarly
played a much smaller role.
In the absence of more precise information, then, the following very crude
approximations are nevertheless reasonable for the case of the Fly-Strickland
River system in Papua New Guinea:
• Local climate, and in particular hydrologic regime and sediment production
rates are taken to be constant from the last glacial maximum to the
present: and
• the effect of change in conditions from the last glacial maximum to present
day is expressed solely in terms of the direct upstream-propagating effect
of 120 m of eustatic sea level rise.
These assumptions can be modified appropriately as better information is
obtained about climate change in Papua New Guinea.
Discharge and long profiles of the Fly-Strickland River system
Documentation concerning the Fly-Strickland River system is available largely
due to the needs of two mines, i.e. the Ok Tedi copper mine near the headwaters
of the Ok Tedi, a tributary of the Fly River, and the Porgera gold mine near the
headwaters of the Strickland River. Two of the authors (Dietrich and Parker)
have served as long-term consultants to the Ok Tedi mine, and one (Parker) has
served as a long-term consultant to the Porgera mine. Data obtained from these
sources are extensively used in this paper (e.g. Cui and Parker, 1999).
The Middle Fly River between D’Albertis Junction and Everill Junction has a
downchannel length of about 450 km (Figs. 1, 2). A number of smaller tributaries,

Part II of manuscript submitted to Sedimentology, May, 2006
7
but no major tributaries enter this reach. As a result the mean annual discharge
increases only from about 1900 m3/s at D’Albertis Junction to about 2250 m3/s at
Everill Junction (Higgins, 1990). At present this reach of the river is affected by
sediment input from a mine. Under pre-mine conditions, however, it is estimated
that the mean annual sediment discharge increased only from 6.9 million tons
per year at D’Albertis Junction to 8.0 million tons per year at Everill Junction.
The Fly River has a sand bed throughout this reach.
Discharges on the Strickland River upstream of Everill Junction are less
well documented. The mean annual discharge at Everill Junction is on the order
of 3100 m3/s (e.g. Higgins, 1990). The floodplain of the Strickland River is shown
in Fig. 3; a transition from gravel-bed to sand-bed morphology is located about
269 km up-channel from Everill Junction. The Strickland River is estimated to
carry an annual load near 70 million tons per year at Everill Junction (Dietrich et
al., 1999).
Both the Fly and Strickland Rivers are large tropical rivers characterized by
a remarkably small variation in flow discharge. As a result the rivers tend to be in
flood for as much as 10% to 40% of the time, and bankfull discharge is only
modestly higher than mean annual discharge (Pickup, 1984; Dietrich et al., 1999).
Long profiles of the Strickland and Fly Rivers upstream of Everill Junction
are given in Fig. 14. The slope of the Middle Fly River near Everill Junction is
near 1x10⁻⁵; the corresponding values for the sand-bed and gravel-bed Strickland
River reaches are near 1.0x10⁻⁴ and 4.6x10⁻⁴, respectively. The much higher
slope of the sand-bed Strickland River as compared to the sand-bed Middle Fly

Part II of manuscript submitted to Sedimentology, May, 2006
8
River reflects the much higher (and coarser) sediment load. The Fly River from
Everill Junction to the point where the estuary starts to flare out (BEF, or
“beginning of estuary flare” in Fig. 13) has a downchannel length of about 290 km
and an average slope of ~ 1.5x10⁻⁵.
Abstraction for the purpose of numerical modeling In so far as the
Strickland River is the dominant branch of the Fly River upstream of D’Albertis
Junction, the river system is simplified in the following way. A single stem with
no tributaries extends from the Gulf of Papua upstream to Everill Junction, and
then follows the Strickland River to the gravel-sand transition. For simplicity the
gravel-sand transition is replaced with a bedrock-sand transition. While much of
the Fly Platform below a line passing through the gravel-sand transitions of the
Fly and Strickland Rivers appears to be slowly subsiding, the rate of subsidence
appears to be low enough to justify its neglect relative to the sea level rise at an
average rate of 10 mm/year experienced over the 12000-year period between
18000 and 6000 years BP.
Like most large sand-bed rivers, both the Fly and Strickland Rivers show a
general pattern of downstream fining of characteristic grain size (e.g. Wright and
Parker, 2004a,b). It is possible to incorporate this fining into a model of the effect
of sea level rise on a large sand-bed river (Wright and Parker, 2005a,b). Here,
however, the size distribution of the sand is abstracted to a single grain size, and
downstream fining is not modeled.
Many river systems may not have maintained the same planform
morphology throughout Pleistocene-Holocene sea level rise. For example, the

Part II of manuscript submitted to Sedimentology, May, 2006
9
lower Mississippi River, which is a meandering stream today, may have been a
braided stream during the early stages of Pleistocene-Holocene sea level rise
(Fisk, 1944). In the present analysis, however, it is assumed that the planform of
the Fly-Strickland River System remained in the meandering state throughout
Pleistocene-Holocene sea level rise. This assumption is consistent with the
assumptions of constant regimes of hydrology and sediment yield introduced
earlier. The calculations presented below provide some a posteriori evidence in
justification of the assumption of a sustained meandering planform
ADAPTATION OF THE NUMERICAL MODEL TO THE FLY-STRICKLAND
RIVER SYSTEM
Overview of the adaptations The overall structure of the numerical
model used to study the response of the experimental model of Muto (2001) to
base level rise is directly applicable to field rivers. A number of modules within
this basic structure must, however, be changed in order to allow adaptation to
realistic field conditions. These are enumerated below.
• Flow intermittency In the experiments of Muto (2001), the water discharge
and sediment feed rate were held constant for the duration of the
experiments. Rivers, however, alternate between flood flows and low
flows, and tend to be morphologically inactive at low flows.
• Characterization of sand transport Equation (1) is applicable only to the
experiments of Muto (2001), and must be replaced by an equation known
to be appropriate for sand-bed rivers in application to the field.

Part II of manuscript submitted to Sedimentology, May, 2006
10
• Self-formed channel In the experiments of Muto (2001) the width of the
flow was set by the experimenter. Rivers, however, are the authors of
their own bankfull geometry.
• Backwater In contrast to the experiments of Muto (2001), in large, sand-
bed rivers the Froude number at flood flow is usually sufficiently low to
ensure that backwater effects extend far upstream of the zone of standing
water.
• Floodplain construction and wash load In the experiments of Muto (2001)
the channel was straight and had no floodplain, and the sediment feed
and deposit were composed purely of sand. Sand-bed rivers are typically
sinuous and have well-developed floodplains. They often transport more
mud (silt and clay) than sand on an annual basis. This mud is typically
transported as wash load, i.e. material that is in transport but does not
deposit on the channel bed. Wash load does, however, deposit on the
floodplain.
• Differentiation between subaerial and subaqueous basement profiles In
the experiments of Muto (2001) the model bedrock basement had a
constant slope Sb along which both the subaerial bedrock-alluvial
transition and the foreset-subaqueous basement transition migrated (Fig.
5). In large rivers, however, it can be expected that the subaerial bedrock
basement has a slope that differs from that of the subaqueous basement.
• Decoupling of shoreline water surface elevation and elevation of topset-
foreset break In the experiments of Muto (2001), the flow depth was so
Part II of manuscript submitted to Sedimentology, May, 2006
11
small that the elevation of the topset-foreset break could be approximated
as equal to that of the water surface immediately above it. The position of
both could be identified with the shoreline as long as the river mouth had
not entered sediment-starved autoretreat. When backwater effects are
included, however, the elevation of the topset-foreset break and the
elevation of standing water above it become decoupled, even when the
river mouth is not undergoing autoretreat.
Each of these items is considered in more detail below.
Intermittency In principle flow discharge should be represented in terms
of a full annual hydrograph, with a corresponding variation of sediment feed at
the upstream end. The same hydrograph could be repeated annually, or be
allowed to vary according to e.g. a Monte Carlo scheme. Its characteristics could
be varied in the long term as a proxy for climate change. Here, however, a
simple constant intermittency If is used (Paola et al., 1992). That is, the river is
approximated as in flood and morphologically active for fraction If of time, during
which the water discharge (volume water transported per unit time) is
approximated as bankfull discharge Qbf. The volume sand feed rate (sand only,
excluding pores) per unit time during floods is denoted as Qsbff. The river is
assumed to be inactive when not in flood, and If is adjusted so that the annual
average volume feed rate of sand is estimated by IfQsbff (Wright and Parker,
2005a,b).
Characterization of sand transport Sand transport is characterized in
terms of the sediment transport equation of Engelund and Hansen (1967), a

Part II of manuscript submitted to Sedimentology, May, 2006
12
relation that is known to have applicability to rivers in addition to experimental
flumes (Brownlie, 1981). The relation takes the form
2/5
f
)(C05.0q ∗∗ τ= (1)
In the above equation q* denotes the dimensionless Einstein number
characterizing sediment transport rate, τ* denotes the dimensionless Shields
number characterizing bed shear stress and Cf is a dimensionless coefficient of
bed friction, defined respectively as
2b
fbs
UC,
RgD,
DRgDqq
ρτ
=ρτ
=τ= ∗∗ (2a,b,c)
In the above relation qs denotes the volume sand transport rate (excluding pores)
per unit width, D denotes characteristic sand grain size (e.g. median or geometric
mean size), τb denotes the bed shear stress, U denotes the depth-averaged
velocity of flow, ρ denotes water density, g denotes the acceleration of gravity
and
1R s −ρρ
= (2d)
denotes the submerged specific gravity of the sediment, where ρs denotes
sediment density. In the case of quartz, for example, R is near 1.65.
The sand transport relation of Engelund and Hansen (1967) is adequate
for the present work, in which a single grain size D is assumed. A different
relation would be necessary were the analysis to be extended to mixtures.
Wright and Parker (2004a,b) provide such a formulation, and Wright and Parker

Part II of manuscript submitted to Sedimentology, May, 2006
13
(2005a,b) apply this formulation to the problem of downstream fining large in
sand-bed rivers.
Equation (1) requires a knowledge of the bed friction coefficient Cf, or
alternatively the dimensionless Chezy friction coefficient Cz, where
2/1fCCz −= (3)
In the present analysis the Chezy friction coefficient at bankfull flow Czbf is
approximated as a constant for a given river reach. Fig. 5 shows a plot of Czbf
versus downchannel bed slope S for the compendium of sand-bed streams with
values of grain size D less than 0.5 mm given in Parker et al. (1998) and the
compendium of gravel-bed streams given in Parker and Toro-Escobar (2002). It
is seen from the figure that sand-bed rivers tend to have values of Czbf between
about 8 and 26, with the larger value corresponding to lower downchannel bed
slope S. (The estimated point for the Strickland River is explained below.)
Self-formed channel A river constructs its own channel and floodplain.
The characteristics of self-formed channels can be described in terms of bankfull
parameters. Of interest here are bankfull depth Hbf and bankfull width Bbf. Now
as an idealization consider a river in local equilibrium (locally graded river) with
specified bankfull discharge Qbf, volume sand transport at bankfull flow Qsbf,
bankfull Chezy resistance coefficient Czbf, characteristic grain size D and
submerged specific gravity R. What would be the bankfull depth Hbf, bankfull
width Bbf and downchannel bed slope S of the river?
Evidently three equations are needed to specify the three parameters.
Before proceeding, however, it is necessary to introduce some standard

Part II of manuscript submitted to Sedimentology, May, 2006
14
conservation relations. The relation between total volume sand transport rate
during floods Qsbf and the corresponding volume sand transport rate (without
pores) per unit width qsbf is given by the conservation relation
bfsbfsbf BqQ = (4)
The relation between Qbf, Hbf and depth-averaged flow velocity at bankfull flow
Ubf is given by the conservation relation
bfbfbfbf HBUQ = (5)
Finally, conservation of downchannel flow momentum at equilibrium (steady,
uniform) bankfull flow requires a balance between the downstream force of
gravity per unit bed area and the resistive force at the bed per unit area, so that
where τbbf denotes the bankfull value of τb,
SgHbfbbf ρ=τ (6)
The first of the three relations needed to characterize the bankfull
geometry of streams can be obtained by reducing the relation (6) describing
momentum balance with (2c) and (5) to obtain
SHHBCz
Q2
bf
=⎟⎟⎠
⎞⎜⎜⎝
⎛ (7)
where Q denotes dimensionless bankfull discharge, B denotes dimensionless
bankfull width and H denotes dimensionless bankfull depth, defined respectively
as
D
HH,D
BB,DgD
QQ bfbf2
bf === (8a,b,c)
Part II of manuscript submitted to Sedimentology, May, 2006
15
The second relation is obtained by reducing the sand transport relation (1) with
(2) – (8) to obtain
2/5bf
2bfs )(B)Cz(05.0Q ∗τ= (9)
where
RSH,
DRgDQQ bf2
sbfs =τ= ∗ (10a,b)
denote the dimensionless sand transport rate at bankfull flow and the Shields
number at bankfull flow, respectively.
Parker et al. (1998) follow the precedent of Paola et al. (1992) in
specifying the third relation in terms of the empirical approximation of a constant
“channel-forming” value of ∗τbf here denoted as ∗τform . That is, it is assumed that
rivers co-evolve with their floodplains toward the attainment of an approximately
constant value of bankfull Shields number:
∗∗ τ≅τ formbf (11)
Parker et al. (1998) provide evidence for this for sand-bed streams with grain
sizes less than 0.5 mm, and Parker and Toro-Escobar (2002) provide similar
evidence for gravel-bed streams. The data in question are shown in Fig. 19. In
the case of the sand-bed streams, the approximate specification of ∗τform of 1.86
is yielded from the average of the sand-bed data in Fig. 6. (The estimated point
for the Strickland River is explained below.)
Equations (7), (9) and (11) thus provide the three relations needed to
solve for Hbf, Bbf and S for a channel in local equilibrium. These relations are
found upon reduction to be

Part II of manuscript submitted to Sedimentology, May, 2006
16
s
2/1
2formbf
R)(Cz05.0H
∗τ= (12)
( ) 5.2form
2bf
s
Cz05.0QB
∗τ= (13)
Cz05.0RS s
formbf
2/3
∗τ= (14)
Equation (14) provides a sand transport relation for a self-formed channel
transporting sediment in accordance with the transport equation of Engelund and
Hansen (1967) at bankfull flow with constant bankfull Shields number. That is,
rearranging (14),
SRCz05.0
2/3formbf
bf
sbf∗τ
= (15)
A comparison of (15) for field sand-bed rivers and (1) for the experiments of Muto
(2001) indicates that the two relations at least have similar structures.
Backwater The treatment of the previous section is appropriate for river
reaches in local equilibrium, in which backwater effects are sufficiently small to
allow streamwise momentum balance to be approximated by (6). Sand-bed
streams flowing into the sea are however, likely to be strongly affected by
backwater, i.e. the upstream-propagating effect of ponded water. Backwater can
be described by generalizing the statement of momentum balance of (6) to
include quasi-steady pressure and inertial forces at bankfull flow. The
appropriate relation is (e.g. Henderson, 1966)
bf
bbfbfbfbf H
gSdx
dHgdx
dUUρτ
−=+ (16a)

Part II of manuscript submitted to Sedimentology, May, 2006
17
where x denotes a downchannel coordinate and S is given as
x
S∂η∂
−= (16b)
. Note that if the flow is spatially uniform the two terms on the left-hand side of
(16a) vanish, and the equation reduces to (6).
In a channel of constant bankfull discharge Qbf and bankfull width Bbf, the
conservation equation (5) reduces to the form
constHUq bfbfwbf == (17a)
where
bfbfwbf B/Qq = (17b)
denotes the water discharge per unit width at bankfull flow. Reducing (16a) with
(17) and (2c) yields the standard backwater equation of open-channel flow (at
bankfull conditions):
( ) fricbf SS
dxdH1 −=− 2
bfFr (18)
In the above equation Sfric denotes the bankfull friction slope, given as
2bffbffric CS Fr= (19)
In addition, Cfbf denotes the bankfull value of Cf and Frbf denotes the
dimensionless Froude number at bankfull flow, defined as
3bf
2wbf2
bf gHq
=Fr (20)
Backwater effects can be neglected when the left-hand side of (18) is
small compared to the right-hand side, in which case (18) can be reduced with
the aid of (2c), (17) and (20) to the relation (6) describing momentum balance for

Part II of manuscript submitted to Sedimentology, May, 2006
18
normal flow. This is typically the case when the square of the Froude number in
(18) is relatively high, i.e. near or above unity. While this was true for the
experiments of Muto (2001), it is not the case for sand-bed rivers. Fig. 7
provides a plot of Frbf versus S for the same set of sand-bed and gravel-bed
rivers as in Figs. 5 and 6. It is seen that Frbf can be as low as 0.2 for low-slope
sand-bed rivers; the corresponding value of 2bfFr is 0.04. ((The estimated point
for the Strickland River is explained below.)
The formulation of (18) is, however, not directly applicable to the case of
self-formed sand-bed rivers considered here because of the assumption of
constant channel width used in its derivation. It is thus necessary to return to the
more primitive form (16a). Between (2b) and (2c) it is found that
fbf
bfbf
CRgDU ∗τ
= (21)
For the case of constant values of ∗τbf , Cfbf, R and D considered here, the
implication is that flow velocity Ubf remains constant downstream.
The condition described by (21), i.e. flow velocity at bankfull flow that
remains constant in the downstream direction, is approximate, and is only as
good as the assumptions of constant friction coefficient Cfbf and Shields number
∗τbf in (21). These caveats notwithstanding, a considerable body of evidence
suggests that Ubf increases only slowly downstream, with values of m between 0
and 0.1 in the proportionality
mbfbf QU ∝ (22)

Part II of manuscript submitted to Sedimentology, May, 2006
19
(e.g. Richards, 1982). In the present case of a stream reach without tributaries, it
can be expected that the exponent m would be toward the lower end of this
range.
For self-formed rivers, then, (16a) reduces with the aid of (2b), (11) and
(21) to
bf
formfricfric
bf
HRDS,SS
dxdH ∗τ
=−= (23a,b)
That is, (23) provides an appropriate description of backwater in self-formed
sand-bed streams. The boundary condition on (23a) is given by a form of (8a)
applied at the topset-foreset break to bankfull flow. As outlined below, however,
when backwater effects are included the position of the topset-foreset break,
here denoted as x = stf(t), can no longer be unambiguously identified with the
shoreline position x = ss(t) used in the analysis of the experiments of Muto (2001).
Thus (8a) becomes
]t),t(s[)t(]t),t(s[H tftfbf η−ξ= (24)
If at any time the sea level ξ(t) and the bed profile η(x,t) up to x = stf(t) are known,
the streamwise profile of bankfull depth Hbf(x,t) can be computed from a solution
of (23a) subject to (24)
A backwater formulation describes a mildly disequilibrium flow in a river.
Here it is also assumed that the morphodynamics of the river itself is in mild
disequilibrium as it responds to sea level rise. More precisely, it is assumed that
as the river aggrades it has enough time to build a channel and floodplain so that

Part II of manuscript submitted to Sedimentology, May, 2006
20
the bankfull Shields number defined by friction slope can be maintained at a
nearly constant channel-forming value close to 1.86, i.e.
∗∗ τ==τ formfricbf
bf RDSH (25)
This by no means implies that the channel is in grade, because in order to
achieve a completely graded channel Sfric would need to be precisely equal to
bed slope S (no backwater effects) and the local sand transport rate Qsbf would
have to be equal to the feed rate Qsbff.
The quasi-equilibrium forms (12), (13) and (14) must be generalized as
follows to include the case of non-negligible backwater effects. The constant
flow velocity Ubf is calculated from (21). Consider a topset bed profile
)t(sx)t(s,)t,x( tfba ≤≤η that is known at any time t. Downchannel bed slope S is
then calculated from this profile according to (2). Channel depth Hbf(x,t) is
computed at time t by integrating (23a) subject to (24). Channel width Bbf(x,t) is
then computed from (5) and the known values of Qbf, Ubf and Hbf, i.e.
bfbf
bfbf HU
QB = (26)
Finally the sediment transport rate Qsbf(x,t) is computed from (9), which takes the
dimensioned form
5.2form
2bfbfsbf )(Cz05.0DRgDBQ ∗τ= (27)
It is easily verified that this formulation reduces to (12) – (14) in the event that
backwater is neglected in (23).
The above formulation cannot be used all the way to the topset-foreset
break during sediment-starved autoretreat driven by base level rise. This is

Part II of manuscript submitted to Sedimentology, May, 2006
21
because the topset-foreset break is abandoned during sediment-starved
autoretreat, resulting in the formation of an embayment (Fig. 8). The embayment
perforce drowns the river and renders channel-forming processes inoperative.
Were a channel with constant Shields number ∗τform applied through the
embayment, the result would be an ever-narrower channel in ever-deeper water
that would still be capable of transporting at least some sediment. This can be
seen from (26) reduced with (21) and (25);
bfform
bffbfbf HRgD
QCB
∗τ= (28)
Since all terms in (28) are approximated here as constants except flow depth Hbf,
ever-increasing depth in the embayment would imply ever-decreasing bankfull
width in a zone where channel construction has been turned off due to drowning
(Fig. 8).
In order for the model to be physically realistic, then, it is necessary to
abandon the assumption of a self-formed channel within the embayment. The
existence of an embayment of essentially standing water can be recognized in
terms of the ratio of the friction slope Sfric given by (23) to the bed slope S. When
the condition
1S
Sfric << (29)
is satisfied, (23) reduces with (2) to the approximate form
)t(xinconstHbf ξ==+η (30)
That is, the elevation of the water surface in the river valley becomes equal to
that of the sea, implying drowning of the valley.
Part II of manuscript submitted to Sedimentology, May, 2006
22
In the present analysis the channel floodplain width Bf (which is assumed
to be consonant with the valley width) is taken to be a constant. Drowning during
sediment-starved autoretreat can be reproduced in the model by generalizing
(23), (26) and (27) to the forms
)drownedchannel(rS/S,)t,x()t(H
)presentchannelactive(rS/S,SSdx
dH
Sfricbf
Sfricfricbf
<η−ξ=
≥−= (31a,b)
⎪⎩
⎪⎨⎧
<
≥=
)drownedchannel(rS/S,B
)presentchannelactive(rS/S,HU
QB
Sff
Sfbfbf
bf
bf (32)
⎩⎨⎧
<≥τ
=∗
)drownedchannel(rS/S,0)presentchannelactive(rS/S,)(Cz05.0DRgDB
Q
Sfric
Sfric5.2
form2bfbf
sbf
(33)
where rS is a suitable constant less than unity. In the calculations below this
constant is set equal to 0.3. This value was determined by trial and error such
that the shoreline was identified correctly when the river mouth underwent
sediment-starved autoretreat.
The above adaptation of the model is illustrated in Fig. 8. During
sediment-starved autoretreat the approximate position of the shoreline is equal to
the point x where Sfric/S becomes equal to rS, a point that can be well upstream of
the abandoned topset-foreset break.
Floodplain construction and wash load The form of the Exner equation
of sediment conservation (3) of Part I used to describe the experiments of Muto
(2001) is too simple to describe the response of sand-bed rivers to aggradation

Part II of manuscript submitted to Sedimentology, May, 2006
23
over thousands of years. Here it is assumed that as the river bed aggrades, the
river is eventually able to rework its floodplain by means of channel migration and
avulsion.
Sediment in transport is typically divided into “bed material load,” i.e.
moving sediment of a size range that actively exchanges with the bed, and “wash
load,” i.e. moving sediment that is too fine to be contained in measurable
quantities in the bed. Wash load is typically taken to be material finer than 62 µm,
and is therefore material in the silt/clay size range (mud). In standard treatments
of morphodynamics the wash load is ignored. Here, however, it is treated as
“floodplain material load” that actively exchanges with the floodplain. That is,
while the river bed is assumed to be composed solely of sand at any time, the
process of migration and avulsion allows the deposition of considerable
quantities of mud on the floodplain.
The volume sand (bed material) load at bankfull flow is denoted as before
as Qsbf, and the volume mud (floodplain material) load at bankfull flow is denoted
as Qmbf. The mean annual mass transport rates of sand Msand and sediment
(sand + mud) Msed are thus given as
)QQ(IM
QIM
mbfsbffssed
sbffssand
+ρ=
ρ= (34a,b)
Denoting the feed rate of mud from upstream as Qmbff, the mean annual feed
rates of sand Msandf and sediment (sand + mud) Msedf to the reach to be modeled
are
)QQ(IM
QIM
mbffsbfffssedf
sbfffssandf
+ρ=
ρ= (34c,d)
Part II of manuscript submitted to Sedimentology, May, 2006
24
Consider the diagram of Fig. 9. The downchannel coordinate is x and the
downvalley coordinate is xv. Averaging over many meander bends, the relation
between the two is
Ω=vdx
dx (35)
where Ω denotes channel sinuosity, here taken to be constant. Sediment is
transported in a channel of width Bbf, but in the long term is deposited over a
much wider floodplain with width Bf, here taken to be constant. Thus sediment
conservation for the reach in question is
( ) ( )xxmbfsbffsxmbfsbffsvpfs QQIQQIx)1(B
t ∆++ρ−+ρ=∆ηλ−ρ
∂∂
(36)
where λp denotes the mean porosity of the channel-floodplain complex.
Reducing (36) with (35), then,
⎟⎠⎞
⎜⎝⎛
∂∂
+∂
∂Ω−=
∂η∂
λ−x
Qx
QBI
t)1( mbfsbf
f
fp (37)
The process of floodplain deposition is not particularly well understood.
With this in mind, the problem is simplified as follows. For every unit of sand
deposited in the channel-floodplain complex, it is assumed that Λ units of mud
are deposited. That is,
x
Qx
Q sbfmbf
∂∂
Λ=∂
∂ (38)
where here Λ is approximated as a constant. The value of Λ can be estimated
by means of an analysis of deposits in channel-floodplain complexes (e.g.

Part II of manuscript submitted to Sedimentology, May, 2006
25
Törnqvist, 1993). Between (37) and (38), then, the final form of the Exner
equation of sediment conservation for the long-term evolution of an aggrading
sand-bed river is obtained:
( )x
QBI1
t)1( sbf
f
fp ∂
∂ΩΛ+−=
∂η∂
λ− (39)
Differentiation between subaerial and subaqueous basement profiles
In the experiments of Muto (2001) the model bedrock basement had a spatially
constant slope Sb in each experiment. Thus the subaerial bedrock-alluvial
transition and the foreset-subaqueous basement transition occurred on a
basement of the same slope. In the case of rivers, however, the subaerial
bedrock slope near the bedrock-alluvial transition can differ from that of the
subaqueous basement over which the delta progrades. In order to represent this
in a simple way, the basement slope at the bedrock-alluvial transition is denoted
as Sbb and the basement slope at the foreset-subaqueous basement transition is
denoted as Ssb, as illustrated in Fig. 10. That is,
sbba s
basesb
s
basebb x
S,x
S∂η∂
−=∂η∂
−= (40a,b)
Both are kept constant in any given numerical run, but they need not be equal.
Decoupling of shoreline water surface elevation and topset-foreset
break elevation In the experiments of Muto (2001), as long as the river delta
was not in sediment-starved autoretreat it was possible to equate the elevation of
the topset-foreset break with that of the water surface there. In large rivers with
significant backwater effects, however, the depth H is sufficiently large to render
this approximation inaccurate. The condition (8a) may thus be rephrased for

Part II of manuscript submitted to Sedimentology, May, 2006
26
bankfull flow as (24), according to which the difference between sea level and the
bed elevation at the topset-foreset break is equal to the river depth at the topset-
foreset break.
Condition (8c) must then be replaced with the following relation obtained
from the chain rule. Recalling that the position of the topset-foreset break is
denoted as x = stf(t),
topset,tftf s
ttfttfs
tf xS,sS
t]t),t(s[
dtd
∂η∂
−=−∂η∂
=η & (41a,b)
where Sttf specifically denotes the topset slope at the topset-foreset transition. A
comparison of (8c) and (41) clearly reveals that the elevation of the topset-
foreset break has been decoupled from that of the water surface above it in the
latter relation. The continuity condition (11) still holds at the foreset-subaqueous
basement break; taking the derivative with respect to time and reducing with
(37a) instead of (8c) results in:
tfssbfore
tfsbfore
ttfforesb tSS
1sSSSSs
∂η∂
−+
−−
= && (42)
The shock condition across the foreset is obtained by integrating (39) from
ss to ssb under the condition of vanishing load at the foreset-subaqueous
basement break. It is assumed here that only sand deposits on the foreset, with
the mud delivered to the shoreline dispersed in a negligibly thin layer over a wide
area of sea floor. This allows the approximation of Λ as 0 across the foreset.
Differentiating (9) with respect to time and reducing with (41) yields the following
form for ∂η/∂t on the foreset:

Part II of manuscript submitted to Sedimentology, May, 2006
27
tfttffores
s)SS(tt
tf
&−+∂η∂
=∂η∂ (43)
Integrating (39) from ss to ssb and reducing the result with (43) and the condition
of vanishing load at the foreset-subaqueous basement break results in the
following shock condition:
tftf
sxsbffsx
tfttfforetfsbfp QIt
s)SS()ss(B)1(=
=
=⎥⎥⎦
⎤
⎢⎢⎣
⎡
∂η∂
+−−λ− & (44)
The above relation describes the shock condition applied when the delta is
not in sediment-starved autoretreat. The case of sediment-starved autoretreat is
described by a shoreline located at the position where
SrS Sfric = (45)
as described above.
NUMERICAL FORMULATION AND IMPLEMENTATION: FIELD SCALE
Initial conditions The initial conditions represent a modest adaptation of those
used to model the experiments of Muto (2001). As in the case of those
experiments, sba is initially set equal to 0, stf is initially set equal to stfi and the
initial downchannel fluvial bed slope to Sfi. Because the elevation of the topset-
foreset break and sea level has been decoupled, however, it is necessary to
specify the initial values of these two separately;
ititfi )0(,]0,s[ ξ=ξη=η (46a,b)
where ξi > η[stfi, 0]. Where ssbi denotes the initial value of ssb, the initial elevation
of the foreset-subaqueous basement break is given as

Part II of manuscript submitted to Sedimentology, May, 2006
28
bisbi ]0,s[ η=η (47)
The relation between ssi, ssbi ηti and ηbi is seen from Fig. 8a of Part I to be
fore
bititfisbi S
ss η−η+= (48)
Transformation to moving boundary coordinates The moving
boundary coordinates are identical to those used in the modeling of the
experiments of Muto (2001) with the exception of the transformation tfs ss → . In
analogy to (22) of Part I (Parker et al., submitted), the Exner equation of
sediment continuity (39) transforms to
x
Q)ss)(1(B
)1(Ixss
]s)x1(sx[t
sbf
batfpf
f
batf
batf
∂∂
−λ−Λ+Ω
−=∂η∂
−−+
−∂η∂ &&
(49)
The analog of (23) of Part I is the upstream boundary condition
sbff0xsbf QQ ==
(50)
The analog of (24) of Part I is the following condition for the migration speed of
the bedrock-alluvial transition:
0xbb
ba tS1s
=∂η∂
−=& (51)
No analog to (25) of Part I is used in the application to rivers, because sea level
and topset-foreset break elevation have been decoupled from each other. The
analogs of (26) and (27) of Part I are, respectively,
⎟⎟⎠
⎞⎜⎜⎝
⎛∂η∂
+−
==1x
tfforesbfore
sb tsS
SS1s && (52)
⎥⎦
⎤⎢⎣
⎡
∂η∂
−−λ−
Ω=
==
1x1xsbf
tfsbfp
f
foretf t
Q)ss(B)1(
IS
1s& (53)
Part II of manuscript submitted to Sedimentology, May, 2006
29
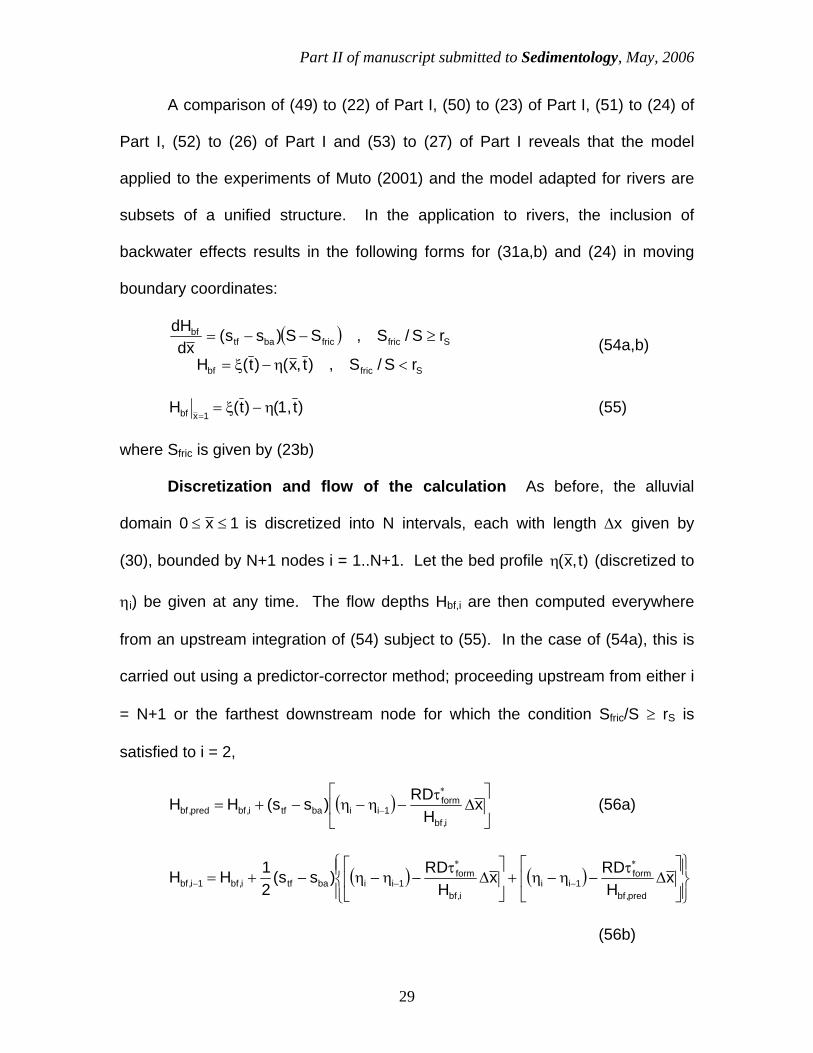
A comparison of (49) to (22) of Part I, (50) to (23) of Part I, (51) to (24) of
Part I, (52) to (26) of Part I and (53) to (27) of Part I reveals that the model
applied to the experiments of Muto (2001) and the model adapted for rivers are
subsets of a unified structure. In the application to rivers, the inclusion of
backwater effects results in the following forms for (31a,b) and (24) in moving
boundary coordinates:
( )Sfricbf
Sfricfricbatfbf
rS/S,)t,x()t(H
rS/S,SS)ss(xd
dH
<η−ξ=
≥−−= (54a,b)
)t,1()t(H1xbf η−ξ==
(55)
where Sfric is given by (23b)
Discretization and flow of the calculation As before, the alluvial
domain 1x0 ≤≤ is discretized into N intervals, each with length x∆ given by
(30), bounded by N+1 nodes i = 1..N+1. Let the bed profile )t,x(η (discretized to
ηi) be given at any time. The flow depths Hbf,i are then computed everywhere
from an upstream integration of (54) subject to (55). In the case of (54a), this is
carried out using a predictor-corrector method; proceeding upstream from either i
= N+1 or the farthest downstream node for which the condition Sfric/S ≥ rS is
satisfied to i = 2,
( ) ⎥⎦
⎤⎢⎣
⎡∆
τ−η−η−+=
∗
− xH
RD)ss(HHi,bf
form1iibatfi,bfpred,bf (56a)
( ) ( )⎪⎭
⎪⎬⎫
⎪⎩
⎪⎨⎧
⎥⎦
⎤⎢⎣
⎡∆
τ−η−η+⎥
⎦
⎤⎢⎣
⎡∆
τ−η−η−+=
∗
−
∗
−− xH
RDxH
RD)ss(21HH
pred,bf
form1ii
i,bf
form1iibatfi,bf1i,bf
(56b)

Part II of manuscript submitted to Sedimentology, May, 2006
30
Channel width Bbf,i is computed everywhere from (32) and the sand transport rate
Qsbf,i is computed everywhere from (33). The migration speeds bas& , tfs& and sbs&
are computed from (51), (53) and (52) respectively. Once Qsbf, bas& , tfs& and sbs&
are known the bed elevation profile at time t∆ later is computed from a
discretized version of (49);
tx
Q)ss)(1(B
)1(Itxss
]s)x1(sx[
i
sbf
batfpf
f
ibatf
baitfiitti ∆
∂∂
−λ−Λ+Ω
−∆∂η∂
−−+
+η=η∆+
&&
(57)
where ηi denotes the bed elevation at the ith node at time t , and the indicated
derivates are computed as follows:
⎪⎩
⎪⎨
⎧
+=∆η−η
=∆
η−η
=∂η∂
−
+
1Ni,x
N..1i,x
x 1ii
i1i
i
(58a,b)
⎪⎩
⎪⎨
⎧
+=∆−
=∆−
=∂
∂− 1N..2i,
xQQ
1i,xQQ
xQ
1i,sbfi,sbf
sbffi,sbf
i
sbf (59a,b)
Relations (51), (52), (53) and (57) are implicit, in that a knowledge of
t/ ∂η∂ at 0x = and 1x = is required in order to compute bas& , tfs& and sbs& , but a
knowledge of bas& , tfs& and sbs& is required to compute t/ ∂η∂ , and thus η at tt ∆+ .
The relations can be made explicit by adding two compatibility relations obtained
by evaluating (49) at 0x = and 1x = ;
0x
sbf
batfpf
f
0xbatf
ba
0x xQ
)ss)(1(B)1(I
xsss
t === ∂∂
−λ−Λ+Ω
−∂η∂
−=
∂η∂ &
(60)

Part II of manuscript submitted to Sedimentology, May, 2006
31
1x
sbf
batfpf
f
1xbatf
tf
1x xQ
)ss)(1(B)1(I
xsss
t === ∂∂
−λ−Λ+Ω
−∂η∂
−=
∂η∂ &
(61)
Treatment of sediment-starved autoretreat, and recommencement of
delta progradation after the cessation of sea level rise The analog of (28)
describing a sediment-starved shoreline is (45). In principle, when the river delta
goes into sediment-starved autoretreat the transformation stf → ss should be
made in equations (49), (52), (53), (54), (56), (57), (60) and (61), where the
position of the shoreline ss is found iteratively from the relation
Ssx
f rSS
s
==
(62)
While the position of the shoreline during sediment-starved autoretreat is tracked
in the implementation below, the transformation stf → ss is not made in the
formulation for two reasons. The first is because little error appears to result over
the conditions studied. The second relates to the cessation of sediment-starved
autoretreat upon the stabilization of sea level. Preservation of the entire mesh
from 0x = to tfsx = in memory (without truncation at the shoreline) allows for a
resumption of delta progradation over the antecedent bed without regridding and
interpolating. When delta progradation resumes, the delta is located by means of
shock-capturing rather than the shock-fitting technique of (53). The abandoned
topset-foreset break is reactivated, and (53) re-implemented, when the shock-
captured delta progrades beyond the delta abandoned by sediment-starved
autoretreat.
QUANTIFICATION OF THE FLY-STRICKLAND RIVER SYSTEM

Part II of manuscript submitted to Sedimentology, May, 2006
32
As noted above, it is crudely assumed here that both local hydrologic regime and
sediment supply have not been greatly altered in the Fly-Strickland River system
from the last glacial maximum to the present. As a result, in the present analysis
it is assumed that the effect of global climate change on the sand-bed Fly-
Strickland River System is driven solely by 120 m of eustatic sea level rise. As
also noted above, the sand-bed system is abstracted to a single sand-bed
stream with no tributaries.
The Strickland River from the gravel-sand transition to Everill Junction has
a channel sinuosity Ω of about 2.25 and a floodplain width Bf of 8000 m; from
Everill Junction to the end of the fluvial reach (EFF in Fig. 1) the corresponding
values are 1.6 and 15000 m. For simplicity the two reaches are lumped together
here as a single reach with a constant sinuosity Ω of 2.0 and a constant
floodplain width Bf of 12000 m. It is reasonable to assume that at low stand the
river extended to a point near the present shelf-slope break. Using the adjusted
sinuosity of 2.0, the following downchannel distances are estimated.
• Present-day gravel-sand transition to Everill Junction: 240 km.
• Everill Junction to end of fluvial reach (EFR of Fig. 1): 240 km.
• EFR to beginning of the estuary flare (BEF of Fig. 1): 200 km.
• BEF to outer edge of the estuary (OEE of Fig. 1): 160 km.
• OEE to shelf-slope break: 290 km.
Thus the adjusted downchannel distance from the present-day gravel-sand
transition to the present-day shelf-slope break is estimated to be 1130 km. Note
that the downchannel distance from Everill Junction to the gravel-sand transition

Part II of manuscript submitted to Sedimentology, May, 2006
33
given above, i.e. 240 km, differs from the actual value of 269 km given in the
section “THE FLY-STRICKLAND RIVER SYSTEM, PAPUA NEW GUINEA,”
because the value of 240 km is based on an overall bulk sinuosity for the entire
Strickland River of 2.0 rather than the actual value of 2.25 over the reach in
question.
The mean annual discharges of the Strickland and Fly Rivers at Everill
Junction were previously quoted as 3100 m3/s and 2240 m3/s. Recalling that
bankfull discharges in the sand-bed Fly-Strickland River system are only
modestly above mean annual values, a single bankfull discharge Qbf of 5700
m3/s is selected to model a single reach with no tributaries from the gravel-sand
transition of the Strickland River to the mouth. A relatively high flood
intermittency If of 0.175 is selected to reflect the relative frequency of overbank
events. Hydrologic measurements on the Strickland River are not of sufficient
detail to verify this number. The number is, however, in the measured range for
the Fly River near D’Albertis Junction (Fig. 1), a reach with similar characteristics
to the Strickland River, i.e. S ~ 0.00005 (about half of the Strickland River at
Everill Junction) and D ~ 0.25 mm (about the same as the Strickland River at
Everill Junction (Cui and Parker, 1999). A single sediment size D of 0.25 mm is
selected for this reach based on measurements by Ok Tedi Mining Ltd. at Ogwa,
a bar just below Everill Junction. Sediment specific gravity is assumed to be 2.65,
so that R = 1.65.
The present-day slope of the Strickland River from the gravel-sand
transition to Everill Junction is about 0.00010. The slope of the gravel-bed reach
Part II of manuscript submitted to Sedimentology, May, 2006
34
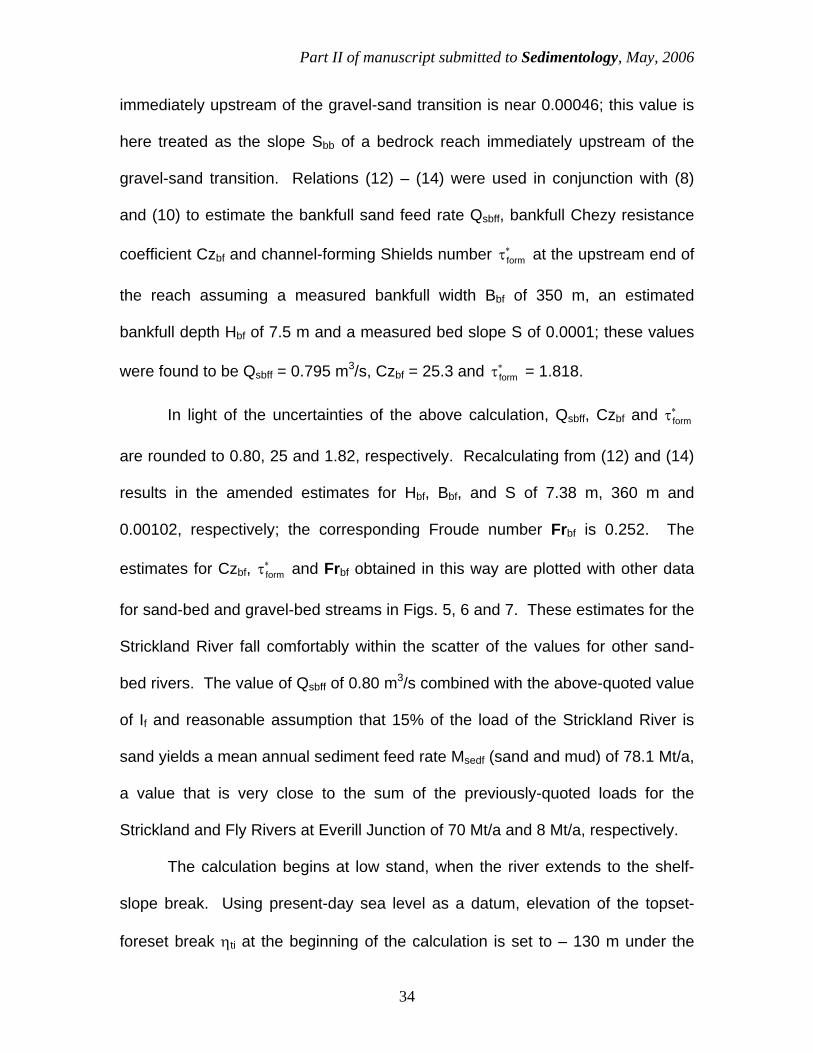
immediately upstream of the gravel-sand transition is near 0.00046; this value is
here treated as the slope Sbb of a bedrock reach immediately upstream of the
gravel-sand transition. Relations (12) – (14) were used in conjunction with (8)
and (10) to estimate the bankfull sand feed rate Qsbff, bankfull Chezy resistance
coefficient Czbf and channel-forming Shields number ∗τform at the upstream end of
the reach assuming a measured bankfull width Bbf of 350 m, an estimated
bankfull depth Hbf of 7.5 m and a measured bed slope S of 0.0001; these values
were found to be Qsbff = 0.795 m3/s, Czbf = 25.3 and ∗τform = 1.818.
In light of the uncertainties of the above calculation, Qsbff, Czbf and ∗τform
are rounded to 0.80, 25 and 1.82, respectively. Recalculating from (12) and (14)
results in the amended estimates for Hbf, Bbf, and S of 7.38 m, 360 m and
0.00102, respectively; the corresponding Froude number Frbf is 0.252. The
estimates for Czbf, ∗τform and Frbf obtained in this way are plotted with other data
for sand-bed and gravel-bed streams in Figs. 5, 6 and 7. These estimates for the
Strickland River fall comfortably within the scatter of the values for other sand-
bed rivers. The value of Qsbff of 0.80 m3/s combined with the above-quoted value
of If and reasonable assumption that 15% of the load of the Strickland River is
sand yields a mean annual sediment feed rate Msedf (sand and mud) of 78.1 Mt/a,
a value that is very close to the sum of the previously-quoted loads for the
Strickland and Fly Rivers at Everill Junction of 70 Mt/a and 8 Mt/a, respectively.
The calculation begins at low stand, when the river extends to the shelf-
slope break. Using present-day sea level as a datum, elevation of the topset-
foreset break ηti at the beginning of the calculation is set to – 130 m under the

Part II of manuscript submitted to Sedimentology, May, 2006
35
assumption of a channel with a bankfull depth of 10 m and a bank elevation of –
120 m. Based on available field bathymetry, the initial elevation of the foreset-
subaqueous basement break ηbi is set equal to – 170 m. The distance from the
topset-foreset break to the foreset-subaqueous basement break is 25 km, so that
Sfore becomes 0.0016 (0.092°). The slope Sbs of the subaqueous basement, i.e.
the continental shelf, was found to be near 0.00075 (0.043°).
In the absence of other guiding information, the initial fluvial bed slope Sfi
at the glacial maximum is set equal to the value 0.0001 estimated to be near the
equilibrium (graded) slope of the sand-bed stream at the present-day gravel-sand
transition. Since the distance from Everill Junction to the shelf edge is estimated
to be 890 km, the implication is an initial elevation at Everill Junction of – 41 m.
The porosity λp of the deposit in the channel-floodplain complex is
estimated as 0.35, a value that is intended to account for the effect of compaction
over thousands of years. Perhaps the hardest parameter to estimate accurately
is Λ, i.e. the ratio of mud deposited per unit sand. The boreholes and seismic
surveys necessary to estimate this parameter are not available for the Fly-
Strickland River system. Here Λ is crudely set equal to unity based on
information pertaining to the Rhine River (Törnqvist, personal communication in
2003).
The input parameters outlined above are summarized in Table 1.
MODELING SCENARIOS
Part II of manuscript submitted to Sedimentology, May, 2006
36
Three cases are considered in the calculations of the next section. All three
begin at - 21000 years relative to the present (21000 years BP). Case A is a
reference case for which sea level is held constant at – 120 m for 21000 years.
In Case B, sea level is constant at – 120 m for the first 3000 years, rises at 10
mm/year for 12000 years to an elevation of 0 m, and is subsequently constant for
6000 years; the total simulated time is again 21000 years. As shown in Fig. 1,
Case B thus provides a reasonably approximation of Pleistocene-Holocene sea
level rise as described by the curve of Fig. 1 of Part I due to Bard et al. (1996).
Case C is identical to Case B except that a) the sand feed rate Qsbff is increased
by a factor of 2.92 from 0.80 m3/s to 2.336 m3/s, and b) the initial fluvial bed slope
Sfi is increased by the same factor. The increase in Sfi along with Qsbff, while not
necessary for the calculations, ensures comparability of the results. This is
because the parameters for Case B were determined by assuming from the use
of e.g. (15) and the assumption of an initial channel that is in grade. According to
(14), the slope S (initial value Sfi in this case) increases linearly with bankfull
sand discharge Qsbf (feed value Qsbff in this case) in a graded channel in which all
other parameters are held constant.
The initial length of the fluvial reach stfi must be close to the present
downchannel distance from the gravel-sand transition to the shelf edge, here
estimated as 1130 km. A value of stfi of 970 km was found to reproduce this
distance under the conditions of Case B outlined above. This value is thus
adopted for all calculations given below.
Part II of manuscript submitted to Sedimentology, May, 2006
37
Case A addresses the following scenario: what if Pleistocene-Holocene
sea level rise never occurred, and instead sea level remained constant at its
value corresponding to the glacial maximum from – 21000 years until 0 years
(present)? Case B addresses a scenario that is reasonably close to what
actually occurred, i.e. 3000 years at minimum stand, 12000 years of sea level
rise at 10 mm/year, and then 6000 years at the present high stand. As outlined
below, the calculation indicates that the Fly River mouth goes into sediment-
starved autoretreat, and moves some 768 km upstream of the abandoned delta,
before forming a new delta and resuming progradation.
Case C addresses the following query: is there a sediment feed rate
sufficiently high to prevent the Strickland River from going into sediment-starved
autoretreat throughout the 120 m of Pleistocene-Holocene sea level rise? In
performing the calculations, Qsbff and Sfi were both increased by the multiplicative
factor Qsrat, leaving all other parameters the same as Case B, and the lowest
value of Qsrat for which the shoreline never abandons the delta was sought. This
was found to be Qsrat = 2.92, or Qsbff = 2.336 m3/s (as compared to 0.80 m3/s for
Case B).
In the calculations for the three cases below the number of spatial
intervals N has been set equal to 135 and the time step t∆ has been set equal to
1.5 years.
MODELING RESULTS

Part II of manuscript submitted to Sedimentology, May, 2006
38
Throughout this section reference is made to a “gravel-sand transition.” It should
be borne in mind, however, that in the model this transition is approximated as a
bedrock-alluvial transition.
Case A Results for Case A are summarized in Figs. 11a-e. Fig. 11a
shows the bed profiles for the eight times t = -21000 years, - 18000 years, -
15000 years, -12000 years, - 9000 years, - 6000 years, -3000 years and 0 years
(present), as well as the water surface profile at 0 years (present). The river
delta monotonically progrades outward (shoreline regresses) the whole time.
The profiles appear to have an almost constant slope. In fact the profiles are
upward concave, with a slope that decreases downstream, but the decrease is
slight. By 0 years (present) the bed slope decreases from 0.000103 at the
gravel-sand transition to 0.0000921 at the topset-foreset break some 1086 km
downstream, i.e. a decrease of only 10.4%.
Part of the reason for the slight upward concavity is due to the fact that the
delta progrades onto a subaqueous basement (continental shelf) that has a slope
some 7 ~ 8 times higher than ambient river slopes. When the same calculation is
performed on a horizontal subaqueous basement, the corresponding
downstream decrease in slope is 20.9%.
Figures 11b and 11c show the streamwise variation in bankfull river width
Bbf and volume sand transport rate at bankfull flow Qsbf at the same eight times
as above, i.e. t = -21000 years, - 18000 years, -15000 years, -12000 years, -
9000 years, - 6000 years, -3000 years and 0 years (present). These two
parameters track each other in accordance with (13). The slight upward

Part II of manuscript submitted to Sedimentology, May, 2006
39
concavity of Fig. 11a implies that the sand transport rate slightly declines
downstream as sediment deposits in the channel/floodplain complex. As a result,
Qsbf decreases only slightly downstream. Since at the same bankfull discharge
Qbf a lower value of Qsbf can be transported by a narrower channel in accordance
with (13), Bbf also decreases slightly downstream. For practical purposes,
however both parameters are nearly constant downstream by – 18000 years,
and remain so until the present. Note that all the lines after t = - 21000 years
approximately collapse together in a self-similar form, with the profile simply
elongating in time as the delta progrades.
Figure 11d shows the corresponding streamwise variation in bankfull
depth Hbf. Note that the depth strongly increases near the downstream end of
the reach at the initial time t = - 21000 years. This is because the initial bed
profile, which has absolutely no concavity (Sfi = 0.0001 everywhere), must first
develop a weak upward concavity before it can prograde outward in an
approximately self-similar form. By – 18000 years, however, such an
approximate form is reached, and all subsequent curves plot roughly on top of
each other.
Fig. 11e shows the position of the topset-foreset break stf(t) along with the
position of the shoreline ss(t) as identified by (62). The two are always equal to
each other, and the delta is seen to prograde outward at an ever-decreasing rate.
This is because as the delta progrades more and more sediment must be
deposited on the elongating topset, leaving ever less to deposit on the foreset.

Part II of manuscript submitted to Sedimentology, May, 2006
40
Over 21000 years the gravel-sand transition migrates upstream 19.7 km,
and the river bed aggrades some 7.02 m above the elevation at the initial gravel-
sand transition. The topset-foreset break progrades out 96.1 km over the same
period. By t = 0 (present), the sand load Qsbf declines modestly downstream
from 0.80 m3/s to 0.723 m3/s, and bankfull width Bbf correspondingly declines
modestly from 360 m to 326 m. Bankfull depth Hbf correspondingly increases
modestly from 7.39 m to 8.16 m.
Case B Results for Case B are summarized in Figs. 12a-g. The formats
of the first five of these figures are the same as Figs. 11a-e. Fig. 12a shows
eight bed profiles, including the final one at t = 0 (present), along with the final
water surface. The effect of 120 m of sea level rise between t = - 18000 years
and t = - 6000 years is dramatic. The delta progrades outward for the first 3000
years of constant low stand. As sea level rise commences, the progradation rate
declines, and eventually the original delta is abandoned and shoreline begins to
transgress. The details of this transgression are elaborated below. It suffices to
mention here that the shoreline transgresses well over 700 km by the time sea
level stabilizes at high stand at t = - 6000 years. A new delta then forms and
progrades outward to its final position at t = 0 (present).
Figs. 12b-c illustrate the variation in Bbf and Qsbf under the conditions of
Case B. The sudden increase Bbf to the valley width Bf of 12000 m in Fig. 25b
tracks the point at which the river mouth is drowned, which is also where the
sand transport rate drops to zero in Fig. 25c. It is thus seen in the figures that
the river mouth undergoes sediment-starved autoretreat between about t = -

Part II of manuscript submitted to Sedimentology, May, 2006
41
18000 years and about t = - 6000 years, and then forms a new delta and
progrades outward.
The notable downstream decreases in sand load in Fig. 12c and
corresponding decrease in bankfull width in Fig. 12b during autoretreat are
clearly reflected in the bed elevation profiles of Fig. 12a. Autoretreat forces a
high rate of sediment deposition and consequent bed aggradation that
propagates well upstream of the shoreline. The result is a gravel-sand transition
that propagates some 134.5 km upstream over 21000 years as sand onlaps onto
the steeper slope. This value compares with only 19.7 km in Case A. Similarly,
in Case B the river bed aggrades 48.0 m above the elevation at the initial gravel-
sand transition; in Case A the corresponding value was only 7.0 m.
Lake Murray, shown in Figs. 1 and 2, is the largest blocked-valley lake on
the Fly-Strickland River system. The Herbert River connects Lake Murray to the
Strickland River; it joins the Strickland River between Everill Junction and the
gravel-sand transition. The predicted riverbed aggradation of ~ 50 m in this
reach seen in Fig. 25a would have been more than sufficient to create Lake
Murray.
The downstream decreases in Bbf and Qsbf in Figs. 12b-c corresponding to
a pattern of bankfull depth Hbf that increases strongly in the downstream direction
during autoretreat, as seen in Fig. 12d. This strong increase documents the
gradual drowning of the river valley by the encroaching sea. The downstream
increase in Hbf and decreases in Bbf and Qsbf are seen to be ameliorated after t =

Part II of manuscript submitted to Sedimentology, May, 2006
42
- 6000 years, when sea level rise stops and a new delta begins to prograde
outward.
Fig. 12e documents the distance from the original position of the gravel-
sand transition to a) the topset-foreset break of the original delta and b) the
shoreline for Case B. The initial delta is abandoned by about t = - 15000 years
and the river mouth goes into autoretreat until sea level rise stops at t = - 6000
years. After this time a new delta forms and progrades outward, forcing
shoreline regression. Autoretreat causes the river mouth to step back some 767
km by end of sea level rise (t = - 6000 years). The new delta then progrades
outward another 140.3 km, ending up 627.4 km upstream of initial position of
delta.
Fig. 12f provides an expanded view of Fig. 12e that documents the details
of autoretreat. The original delta is able to prograde outward from t = - 21000
years to t = - 15750 years, in spite of the fact that sea level rise starts at t = -
18000 years. From t = - 15750 years to t = - 14175 years the delta slowly
backsteps in autoretreat without sediment starvation. Autobreak is reached at
about t = - 14175 years, after which the river mouth retreats rapidly upstream
under conditions of sediment starvation. While the details differ, the picture
painted by the results of the numerical model is identical to that seen in Figs. 4
and 5 of the experiments of Muto (2001).
Fig. 12g provides a partial check on the model results. The plot shows
profiles of the Strickland River upstream of Everill Junction. The small gray
squares denote SRTM (Shuttle Radar Topographic Mission) data on river bank

Part II of manuscript submitted to Sedimentology, May, 2006
43
elevations. The solid diamonds denote bankfull water surface elevation
computed at t = 0 (present) for Case B. (Computed distances have been
adjusted so that the downchannel distance from the gravel-sand transition is the
actual value of 269 km, not the nominal value of 240 km used in the model. This
reflects the fact that the bulk channel sinuosity of the lumped Strickland River
system was taken to be 2.0, whereas the channel sinuosity between Everill
Junction and the gravel-sand transition is 2.25, as outlined in the section
“QUANTIFICATION OF THE FLY-STRICKLAND RIVER SYSTEM”).
The agreement between the measured profile and the computed profile for
Case B at t = 0 (present), while not perfect, is remarkably good in so far as no
attempt was made to match the profiles. The model uses a first assumption as to
what the river profile must have been like at the last glacial maximum, i.e. a bed
profile with a nearly constant slope ~ 0.0001 extending upstream from an
elevation of – 130 m at the shelf edge. When subjected to the approximate sea
level curve of the dashed line of Fig. 1 of Part I, the computed river profile
between Everill Junction and the gravel-sand transition is in fact close to what is
observed. The average computed water surface slope in Fig. 25g is 0.000078,
or about 78% of the observed value. It is remarkable that this value is as close
as it is to the observed value, in that parameters dependent on local climate such
as Qbf, If Qsbff and D have been held constant throughout 21000 years.
One other point of interest can be seen by comparing Figs. 1 and 12a.
Both figures contain the notation “EFR” denoting “end of the fluvial reach.” As
seen in Fig. 1, downstream of this point the river merges into a much-wider

Part II of manuscript submitted to Sedimentology, May, 2006
44
estuary. It is seen from Fig. 14a that the predicted present position of the delta
that reforms after the end of sea level rise is not far from the end of the fluvial
reach.
The modeling thus suggests that the end of the fluvial reach in Fig. 11
denotes the present-day position of a prograding delta, downstream of which is a
tidal-dominated estuary. That is, the present-day estuary of the Fly River
between points EFR and OEE (“outer edge of estuary”) in Fig. 1 may be in part a
consequence of autoretreat due to Pleistocene-Holocene sea level rise. The Fly
River may be prograding outward into the Fly Estuary, constructing a fluvial
channel as it does so, as it recovers from sea level rise.
The delta in Fig. 12a at t = 0 (present) has a foreset height of 33.4 m. No
such high delta face is in fact observed near point EFR in Fig, 14. One reason
for this may be that the modern Fly Estuary is subject to a notable tidal influence
which has not been included in the model. The effect of cycled tides would be to
smear out the foreset and pull sand well into the estuary. Perhaps more
importantly, mud that reaches the topset-foreset break is not allowed to deposit
to form an estuarine bottomset in the present simplified model. The deposition of
mud would act to reduce the height of any delta. Kostic and Parker (2003a,b)
and Swenson et al. (2005) provide numerical models which include bottomset or
prodelta deposition.
Case C As illustrated by Muto (2001), all river mouths would go into
autoretreat if sea level rise were sustained for a sufficiently long time. In the
case of the Earth, however, the total amount and duration of sea level rise is

Part II of manuscript submitted to Sedimentology, May, 2006
45
controlled by the total amount of ice sequestered in glaciers at the glacial
maximum. As a result, sea level rise cannot be sustained indefinitely.
All other factors being constant, an increase in sediment supply should act
to delay the onset of autoretreat. If autoretreat is delayed beyond the time of
cessation of sea level rise, a river delta may not be drowned at all. Even if the
river does go into sediment-starved autoretreat, a river with a higher sediment
load can be expected to recover faster. This factor may help explain the
difference between the estuaries of Fig. 2 and the delta of Fig. 3, both of Part I.
Numerical experiments were performed to explore this issue. In particular,
the sediment feed rate Qsbff and initial fluvial slope Sfi were both increased by the
same multiplicative factor Qsrat, keeping all other parameters constant, until a
delta that barely fails to go into sediment-starved autoretreat was obtained. The
critical value of Qsrat was found to be 2.92, corresponding to the values Qsbff =
2.336 m3/s and Sfi = 0.000292. These values were used for Case C, which is
identical to Case B in all other respects.
The results for Case C are documented in Figs. 13a-e. It is seen in Fig.
13a that the delta does go into autoretreat without sediment starvation for a
period, the shoreline never abandons the delta. The gravel-sand transition
migrates upstream some 137 km in the course of the run, a value that is higher
than the 134.5 km observed in Case B. This is because the much larger
sediment load of Case C yields a much larger value of the alluvial slope Saba at
the transition, thus increasing the rate of onlapping in accordance with (7a). Only
24.4 m of aggradation, however, occurs at the original position of the gravel-sand

Part II of manuscript submitted to Sedimentology, May, 2006
46
transition, as compared to a value of 48 m computed for Case B. It can be seen
from a comparison of Figs. 12a and 13a the absence of sediment-starved
autoretreat in Case C has greatly reduced the upstream propagation of riverbed
aggradation driven by sea level rise as compared to Case B, even though the
sediment supply rate is nearly three times higher in Case C.
Figs. 13b-d document the changes in Bbf, Qbf and Hbf computed for Case
C. All three figures document a minor drowning of the delta at t = - 21000 years,
i.e. the beginning of the run. This is because the profile has not yet reached an
approximately self-similar state associated with progradation at constant sea
level (as documented for Case A). This state is, however, achieved by t = -
18,000 years, at which time the delta is actively prograding outward. Sea level
rise commences at t = - 18000 years and ends at – 6000 years, as in Case B, but
the river mouth is never drowned and the delta is never abandoned.
The fact that in Case C the shoreline never abandons the delta is
documented in Fig. 13e. The delta undergoes mild autoretreat without sediment
starvation from – 16500 years (1500 years after the start of sea level rise) – 3750
years (2250 years after the cessation of sea level rise).
Parametric study of the effect of increasing sediment load The effect
of increasing sediment supply on river response to sea level rise is studied
parametrically in Fig. 14. Seven cases are considered, all of which have the
same parameters as Case B except for Qsbff and Sfi, both of which have been
multiplied by the same factor Qsrat. The values of Qsrat studied are 0.8, 1 (Case
B), 1.4, 1.8, 2.4, 2.65 and 2.92 (Case C), corresponding to Qsbff = 0.64, 0.80,

Part II of manuscript submitted to Sedimentology, May, 2006
47
1.12, 1.44, 1.76, 2.12 and 2.336 m3/s. Included in the plot are a) the position of
the delta topset-foreset break ( = shoreline) for Qsrat = 2.92 (Case C), and the
positions of the shorelines for the other cases, plotted as functions of time.
In all cases except Qsrat = 2.92 the delta first progrades outward, and then
slowly backsteps in autoretreat without sediment starvation. Eventually
autobreak is reached, and the river mouth abandons the delta and goes into
rapid sediment-starved autoretreat. Upon the cessation of sea level rise a new
delta forms and progrades outward. It is seen from the figure that the extent of
autoretreat is strongly dependent on the sediment supply, as quantified in terms
of Qsbff.
In all cases for which autoretreat is observed, the new delta progrades
toward the position of the abandoned delta after the cessation of sea level rise.
In only on case (Qsrat = 2.65) does the new delta reach and merge with the
abandoned delta before t = 0 (present).
It should be noted that in the above calculation only the sand supply rate
Qsbff was varied (and by implication mud supply Qmbff, since Λ is held constant);
bankfull discharge Qbw is unmodified. The relevant parameter governing the
extent of autoretreat is not Qsbff itself, but rather the ratio Qsbff/Qbw, or more
familiarly the concentration of sediment in the river during floods. The mass
concentration of sediment in mg/l at bankfull flow Cmbf is given as
mbffsbffbf
mbffsbffs
6mbf QQQ
)QQ(10x1C
++
+ρρ
= − (63)

Part II of manuscript submitted to Sedimentology, May, 2006
48
where Qbf, Qsbff and Qmbff are given in m3/s. Assuming as before that 15% of the
sediment feed is sand, Cmbf varies from 2480 mg/l to 7220 mg/l in the calculation
of Fig. 27, the higher value preventing sediment-starved autoretreat during
Pleistocene-Holocene sea level rise.
Effect of sediment load on river morphology In both cases B and C
the channel sinuosity Ω has been held constant at 2.0, implying a strongly
meandering river. The only differences in input between Cases B and C are in
the values of sand feed rate Qsbff and initial fluvial slope Sfi. In a natural river,
however, sinuosity itself is linked to other parameters used as input in the
calculation. Fisk (1944), for example, has argued that the Mississippi River,
which is a strongly meandering river today, was a braided river during the earlier
part of the sea level rise documented in Fig. 1. A braided stream can be
expected to have a much lower sinuosity Ω than a meandering stream. Whether
or not a stream meanders or braids is in turn strongly governed by the channel
bankfull width-depth ratio Bbf/Hbf and downvalley bed slope Sv, here given as
SSv Ω= (64)
(e.g. Engelund and Skovgaard, 1973; Parker, 1976; Fredsoe, 1978; Blondeaux
and Seminara, 1985).
This issue is briefly studied here in terms of a hypothetical equilibrium
(graded) channel associated with Cases B and C. In the case of the Fly-
Strickland River system, such an approximately graded channel may have
prevailed at or near the last glacial maximum, as discussed in the context of Figs.
24a-d. Calculations are performed using the relations (12) – (14) for channel

Part II of manuscript submitted to Sedimentology, May, 2006
49
bankfull characteristics and the following input parameters from Table 1: Qbf =
5700 m3/s, Cz = 25, 82.1form =τ∗ , D = 0.25 mm and R = 1.65. Table 2 documents
the computed graded values of bankfull flow velocity Ubf, bankfull width Bbf,
bankfull depth Hbf, bankfull Froude number Frbf, bankfull sediment concentration
Cmbf in mg/l (sand + mud, again based on the assumption that 15% of the feed is
sand), bankfull width-depth ratio Bbf/Hbf, downchannel bed slope S and
downvalley slope Sv for cases B (Qsbbf = 0.80 m3/s) and C (Qsbff = 2.336 m3/s).
The values of the computed parameters for Case B all happen to be close
to the values presently prevailing on the Strickland River between the gravel-
sand transition and Everill Junction. This reach of the river is in fact meandering,
and has a sinuosity of 2.25, i.e. close to the bulk value of 2.0 used to model Case
B. The computed bankfull width-depth ratio Bbf/Hbf is 48.8.
In Case C, however, the computed value of Bbf/Hbf is 416, i.e. a value that
is 8.5 times higher than Case B. In increase in Bbf/Hbf from 48.8 to 416 can be
expected to push stream morphology strongly in the direction of a braided sand-
bed stream such as the present-day Brahmaputra River, Bangladesh. With this
in mind, Case C was modified to Case C’ for which the sinuosity was lowered to
1.2, as documented in Table 2. Also shown in Table 2 is the valley slope Sv for
Case C’, which at 0.000357 is 1.75 time higher than the value for Case B.
The values of (Bbf/Hbf, Sv) for Case C’ are thus (8.5, 1.75) times higher
than Case B. A calculation was performed for Case C’ in which in addition to the
modifications of Qsbff and Ω, the initial downchannel reach length stfi was reduced
from 970 km to 582 km in order to ensure that both Cases B and C describe a

Part II of manuscript submitted to Sedimentology, May, 2006
50
river with the same initial valley distance from the gravel-sand transition to the
shelf edge. The results were qualitatively no different than those for the original
Case C; again the delta did not go into sediment-starved autoretreat.
The calculations for Case B indicate that the ratio Bbf/Hbf never exceeds
50, i.e. a value close to its present value, throughout 21000 years of calculation.
This provides a partial a posteriori justification of the assumption that the river
was meandering at low stand and remained so throughout Pleistocene-Holocene
sea level rise to the present day.
CONCLUSIONS AND CAVEATS
Conclusions The main conclusions of this analysis are outlined below.
1. As illustrated in the companion paper, Part I, the small-scale
experiments of Muto (2001), and in particular the phenomenon of sediment-
starved autoretreat identified therein, is of direct relevance to the response of
large sand-bed rivers to Pleistocene-Holocene sea level rise.
2. An appropriately modified version of the moving boundary formulation
of Swenson et al. (2000) provides a framework for a numerical model that can
encompass both the experiments of Muto (2001) and large sand-bed rivers. The
most important adaptation is a quantification of the morphodynamics of bedrock-
alluvial transitions.
3. Such a numerical model can capture with reasonable accuracy the
river response to sea level rise modeled experimentally by Muto (2001). In

Part II of manuscript submitted to Sedimentology, May, 2006
51
particular, it can capture the phenomenon of drowning of the river mouth during
sediment-starved autoretreat.
4. The introduction of a number of modifications allow adaptation of the
numerical model to field sand-bed rivers. The more innovative of these include:
• Use of a channel-forming Shields number to quantitatively describe self-
formed channels for which bed slope, bankfull width and bankfull depth
are all dependent variables;
• Adaptation of the treatment to include backwater effects, and adaptation of
the backwater formulation to describe channels that maintain a set
channel-forming Shields number;
• Introduction of a criterion for the drowning of the channel during sediment-
starved autoretreat; and
• Modification of the equation of sediment conservation to describe
washload (mud) as well as bed material load (sand), and to describe the
co-evolution of the channel/floodplain complex under net depositional
conditions;
5. The adapted numerical model allows for quantitative predictions of the
effect of sea level rise on large sand-bed rivers as long as appropriate input
parameters can be reasonably estimated. An example of such a calculation is
presented for the Fly-Strickland River System.
6. The model applied at field scale suggests that the effect of Pleistocene-
Holocene sea level rise on the Fly-Strickland River system was likely profound,
and likely propagated as far upstream as the present-day gravel-sand transition.

Part II of manuscript submitted to Sedimentology, May, 2006
52
The predicted values of river aggradation in the reach between Everill Junction
and the gravel-sand transition are more than sufficient to create the present-day
blocked-valley Lake Murray.
7. The same application of the model suggests that Pleistocene-Holocene
sea level rise forced the mouth of the Fly-Strickland River into over 700 km of
sediment-starved autoretreat, and that the Fly Estuary may be to a large degree
a consequence of the resulting drowning of the river valley.
8. Sediment-starved autoretreat forces considerably more rapid shoreline
transgression and more substantial riverbed aggradation that propagates much
farther upstream of that produced by autoretreat without sediment starvation.
9. The approximate correspondence between the predicted position of the
present-day delta of the Fly River and the observed point at which the river gives
way to an estuary suggests that the river may presently be constructing a new
self-formed channel into the estuary as it recovers from Pleistocene-Holocene
sea level rise.
10. If the same river system subjected to the same sea level rise curve
has a higher sediment feed rate, the degree to which the stream undergoes
autoretreat is reduced. For a sufficiently high sediment feed rate the river delta
could have continued to prograde throughout Pleistocene-Holocene sea level
rise.
11. Sediment feed concentration thus strongly influences the degree to
which a river mouth transgresses for a given curve of sea level rise. With all
other factors equal, a river with a sufficiently high feed concentration would be

Part II of manuscript submitted to Sedimentology, May, 2006
53
expected to end in a prograding delta protruding into the sea today, whereas a
river with a sufficiently low feed concentration would be expected to end in a
delta contained in an estuary that intrudes landward from the general shoreline.
Caveats The analysis reported here has been performed at relatively a
high level of quantification and detail compared to previous models of the effect
of sea level rise on rivers in particular and margins in general (e.g. Jordan and
Flemings, 1991). Having said this, the analysis still remains broad-brush
compared to real rivers. It is thus of use to enumerate briefly a number of
caveats concerning the model.
• The model assumes constant values of bankfull discharge, flood
intermittency, feed rates of sand and mud and sand grain size over a time
span of 21000 years, from the last glacial maximum until today. While this
is unlikely to be true, it is likely less of an error for the case of New Guinea
than a region at a higher latitude that was subjected to floods resulting
from the melting of continental glaciers. The input parameters can be
modified as more information about climate change becomes available.
• The model assumes a river slope at low stand at the beginning of the
calculation that is equal to the observed present slope, i.e. 0.0001. While
there appears to be little doubt that the Strickland River aggraded in
response to sea level rise, the predicted aggradation of ~ 50 m near Lake
Murray appears high. This suggests that the river slope at low stand may
have been higher than the present-day value.
Part II of manuscript submitted to Sedimentology, May, 2006
54
• The model does not include downstream fining. This aspect can be
remedied with the formulation of Wright and Parker (in press(a),(b) (c)).
• The model assumes constant floodplain width, includes no tributaries, and
does not account for increasing discharge in the downstream direction due
to rainfall on the floodplain. All of these factors could be addressed with
appropriate changes in data input.
• A gravel-sand transition is not synonymous with a bedrock-alluvial
transition. Gravel deposition at the transition acts to resist upstream
migration. As a result the model likely overpredicts upstream migration of
the gravel-sand transition. This issue can be addressed by introducing a
gravel-sand transition, at the expense of adding complexity to the model.
• The present-day gravel-sand transition of the Strickland River also
appears to be located at a hinge between uplift and subsidence.
Uplift/subsidence is not included in the present model. It could be
included using, for example, the formulation of Swenson et al. (2000).
Uplift of the reach upstream of the gravel-sand transition would also
reduce the upstream migration of this point.
• No tidal effects are included in the model, nor is mud allowed to deposit in
the estuary. The effect of tides would be to smear out the sand delta and
draw sand well into the present-day Fly Estuary. By increasing the
delivery of sand to the Fly Estuary, tides could also reduce, perhaps
substantially, the amount of aggradation experienced by the river
upstream. The inclusion of tides in the model is technically possible, but

Part II of manuscript submitted to Sedimentology, May, 2006
55
would require an extremely short time step (much smaller than a single
tidal cycle) over a calculation period of 21000 years. The deposition of
mud in the estuary would also substantially reduce the height of any delta.
The work of Kostic and Parker (2003a,b) and Swenson et al. (2005)
suggest ways to address the issue of mud deposition beyond the delta.
• Tidal effects have also likely strongly influenced the present-day funnel-
shaped morphology of the Fly Estuary, an issue that is not addressed by
the model.
• The Pleistocene-Holocene sea level rise did not occur at a constant rate of
10 mm/year over 12000 years, as approximated here. The curve of Fig. 1
due to Bard et al. (1996) includes one step associated with meltwater
pulse 1A at about 14000 years BP, and the work of Webster et al. (2004)
suggests multiple steps. Work is in progress to generalize the analysis to
stepped sea level curves.
• The present analysis is quasi-one-dimensional. It cannot represent
changes in deltaic depocenter over scales larger than one floodplain width,
and also cannot represent the two-dimensional phenomenon of
autostepping during transgression observed by Muto and Steel (2001).
The work of Sun et al. (2002) offers a possibility for generalizing the model
in this direction.
• Some evidence suggests that the Strickland River not only created Lake
Murray by valley blocking, but may have actually blocked part of the lower

Part II of manuscript submitted to Sedimentology, May, 2006
56
Middle Fly River during at least part of the Pleistocene-Holocene sea level
rise. This issue is being investigated separately.
In summary, the model presented here should be interpreted as representing the
first step in a quantitative determination of the effect of sea level rise on a large
river. Many improvements and modifications can be expected in the future.
The numerical calculations reported here were performed using code
written in Visual Basic for Applications, and embedded in an Excel workbook.
One of the spreadsheets of the workbook constitutes the Graphical User
Interface. The workbook is available from the first author upon request.
ACKNOWLEDGEMENTS
This paper and the companion paper, Parker et al. (submitted) include material
from two papers in conference proceedings: Parker and Muto (2003) and Parker
et al. (2004). The scope of the research has been greatly extended in the
present paper. A personal communication from T. Törnqvist in December of
2003 proved valuable. Bathymetric information for the Gulf of Papua was
provided by C. Nittrouer.
This research was funded by the National Science Foundation Source to
Sink Program (Collaborative Research: Processes Controlling Depositional
Signals of Environmental Change in the Fly River Sediment Dispersal System:
Rates and Mechanisms of Floodplain Deposition, EAR-0203296) and the
National Center for Earth-surface Dynamics (NCED), a National Science
Foundation Science and Technology Center (EAR-0120914). This paper is a
Part II of manuscript submitted to Sedimentology, May, 2006
57
contribution of the research effort of NCED in the area of channel dynamics. The
participation of Y. Akamatsu was enabled by a grant from the Japan Society for
the Promotion of Science.
REFERENCES
Bard, E., Hamelin, B., Arnold, M., Montaggioni, L., Cabioch, G., Faure, G. and Rougerie, F. (1996) Deglacial sea-level record from Tahiti corals and the timing of global meltwater discharge. Nature, 382, pp. 241-244.
Blondeaux, P. and Seminara, G. (1985) A unified bar-bend theory of river meanders. Journal of Fluid Mechanics, 157, 449-470.
Blum, M. B. and Törnqvist, T. E. (2000) Fluvial responses to climate and sea-level change: a review and look forward. Sedimentology, 47 (Suppl. 1), 2-48.
Brownlie, W. R. (1981) Prediction of flow depth and sediment discharge in open channels. Report No. KH-R-43A, W. M. Keck Laboratory of Hydraulics and Water Resources, California Institute of Technology, Pasadena, California, USA, 232 p.
Cui, Y. and Parker, G. (1999). Sediment transport and deposition in the Ok Tedi-Fly River System, Papua New Guinea; the modeling of 1998-1999. Report, Ok Tedi Mining Ltd.
Dietrich, W. E., Day, G. and Parker, G. (1999) The Fly River, Papua New Guinea: inferences about river dynamics, floodplain sedimentation and fate of sediment. In Varieties of Fluvial Form, Miller, A. J. and Gupta, A., eds., John Wiley and Sons, New York, 345-376.
Engelund, F. and Hansen, E. (1967) A Monograph on Sediment Transport in Alluvial Streams, Technisk Vorlag, Copenhagen, Denmark.
Engelund, F. and Skovgaard, O. (1973) On the origin of meandering and braiding in alluvial streams. Journal of Fluid Mechanics, 57, 289-302.
Fisk, H. N. (1944) Geological Investigation of the Alluvial Valley of the Lower Mississippi River, Mississippi River Commission, Vicksburg.
Fredsoe J. (1978) Meandering and braiding of rivers. Journal Fluid Mechanics, 84, 609-624.
Henderson, F. M. (1966) Open Channel Flow. Macmillan, New York. Higgins, R. (1990) Off-river storages as sources and sinks for environmental
contaminants. Regulated Rivers, 5, 401-412. Hope, G.S. and Peterson, J.A. (1975) Glaciation and vegetation in the high New
Guinea Mountains. Bull. Roy. Soc. N.Z., 13, 155-162. Jordan, T. E. and P. B. Flemings (1991) Large-scale stratigraphic architecture,
eustatic variation, and unsteady tectonism: A theoretical evaluation. Journal of Geophysical Research 96, 6681-6699.
Kostic, S. and Parker, G. (2003a) Progradational sand-mud deltas in lakes and reservoirs. Part I. Theory and numerical modeling. Journal of Hydraulic Research, 41(2), 127-140.

Part II of manuscript submitted to Sedimentology, May, 2006
58
Kostic, S. and Parker, G. (2003b) Progradational sand-mud deltas in lakes and reservoirs. Part 2. Experiment and numerical simulation. Journal of Hydraulic Research, 41(2), 141-152.
Loffler, H. (1973) Tropical high mountain lakes of New Guinea and their zoogeographical relationship compared with other tropical high mountain lakes. Arctic and Alpine Research, 5(3), Part 2, A193-A198.
Muto, T. (2001) Shoreline autoretreat substantiated in flume experiment. Journal of Sedimentary Research, 71(2), 246-254.
Muto, T. and Steel, R. J. (2001) Autostepping during the transgressive growth of deltas: Results from a flume experiment. Geology, 29(9), 771-774.
Paola, C., Heller, P.L. and Angevine, C.L., (1992) The large-scale dynamics of grain-size variation in alluvial basins, 1: Theory. Basin Research 4, 73-90.
Parker, G. (1976) On the cause and characteristic scales of meandering and braiding in rivers. Journal of Fluid Mechanics, 76, 457-480.
Parker, G., Paola, C., Whipple, K. X. and Mohrig, D. (1998) Alluvial fans formed by channelized fluvial and sheet flow. I: Theory. Journal of Hydraulic Engineering, 124(10), 985-995.
Parker, G. and Toro-Escobar, C. M. (2002) Equal mobility of gravel in streams: The remains of the day. Water Resources Research, 38(11), 1264, doi: 10.1029/2001WR000669.
Parker, G. and Muto, T. (2003) 1D numerical model of delta response to rising sea level, Proceedings, 3rd IAHR Symposium, River, Coastal and Estuarine Morphodynamics, Barcelona, Spain, September 1-5., 10 p.
Parker, G., Akamatsu, Y., Muto, T. and Dietrich, W. (2004) Modeling the effect of rising sea level on river deltas and long profiles of rivers. Proceedings, International Conference on Civil and Environmental Engineering ICCEE-2004, Hiroshima University, Higashi-Hiroshima, Japan, July 27-28, 1-11.
Parker, G., Muto, T., Akamatsu, Y., Dietrich, W. E. (submitted) Unraveling the conundrum of river response to rising sea level from laboratory to field. Part I. Laboratory experiments. Sedimentology.
Peterson, J., Hope, G., Prentice, M. and Hantoro, W. (2002) Mountain environments in New Guinea and the late Glacial Maximum 'warm seas/cold mountains' enigma in the West Pacific Warm Pool region. Advances in Geoecology, 34, 173-188.
Pickup, G. (1984) Geomorphology of tropical rivers, I. Landforms, hydrology and sedimentation in the Fly and lower Purari, Papua New Guinea, Catena Suppl. 5, pp. 1-17.
Richards, K. (1982) Rivers: form and process in alluvial channels. Methuen, London and New York, ISBN 0-416-74900-3, 358 p.
Sun, T., Paola, C., Parker, G. And Meakin, P. (2002) Fluvial fan-deltas: Linking channel processes with large-scale morphodynamics. Water Resources Research, 38(2), doi:10.1029/2001WR000284.
Swenson, J. B., Voller, V. R., Paola, C., Parker, G. and Marr, J. (2000) Fluvio-deltaic sedimentation: A generalized Stefan problem. European Journal of Applied Math., 11, 433-452.

Part II of manuscript submitted to Sedimentology, May, 2006
59
Swenson, J. B., Paola, C., Pratson, L., Voller, V. R. and Murray, A. B. (2005) Fluvial and marine controls on combined subaerial and subaqueous delta progradation: Morphodynamic modeling of compound clinoform development. Journal of Geophysical Research, 110, F02013, doi:10.1029/2004JF000265, 16 p.
Törnqvist, T. (1993) Fluvial sedimentary geology and chronology of the holocene Rhine-Meuse Delta, the Netherlands. Ph.D. thesis, Utrecht University, the Netherlands.
Törnqvist, T. (2003) Personal communication concerning the fraction of sand, mud and organics in the floodplain deposits of the Rhine River, the Netherlands.
Webster, J. M. Clague, D. A. Riker-Coleman, K., Gallup, C., Braga, J. C., Potts, D., Moore, J. G., Winterer, E. L. and Paull, C. L. (2004) Drowning of the – 150 m reef off Hawaii: A casualty of global meltwater pulse 1A? Geology, 32(3), 249-252.
Wright, S. and Parker, G. (2004a) Density stratification effects in sand-bed rivers. Journal of Hydraulic Engineering, 130(8), 783-795..
Wright, S. and Parker, G. (2004b) Flow resistance and suspended load in sand-bed rivers: simplified stratification model. Journal of Hydraulic Engineering, 130(8), 796-805.
Wright, S. and Parker, G. (2005a) Modeling downstream fining in sand-bed rivers. I: Formulation. Journal of Hydraulic Research, 43(6), 612-619.
Wright, S. and Parker, G. (2005b) Modeling downstream fining in sand-bed rivers. II: Application. Journal of Hydraulic Research, 43(6), 620-630.
NOMENCLATURE Symbol Meaning Dimensions (L length, M mass, T time, (1 dimensionless) Bbf Bankfull channel width L B Dimensionless bankfull width given by (8c) 1 Bf Width of floodplain (valley) L Cf Dimensionless bed friction coefficient 1 defined by (2c) Cmbf Bankfull sediment concentration in mg/l ML-3 Cz = fC/1 , dimensionless Chezy friction 1 coefficient Czbf Value of Cz at bankfull flow 1 D Characteristic (median or geometric mean) L sediment grain size Frbf Dimensionless Froude number at bankfull 1 flow, defined by (20) g Gravitational acceleration LT-2 H River depth L Hbf Bankfull value of H L H Dimensionless bankfull depth given by (8b) 1

Part II of manuscript submitted to Sedimentology, May, 2006
60
If Flood intermittency L i Index denoting either the ith spatial node or 1 the initial value of a parameter Msand Mean annual mass transport rate of sand MT-1 Msandf Mean annual mass feed rate of sand MT-1 Msed Mean annual mass transport rate of sediment MT-1 (sand + mud) Msedf Mean annual mass feed rate of sediment MT-1 (sand + mud) N Number of intervals in spatial discretization 1 Qbf Bankfull water discharge L3T-1 Q Dimensionless bankfull discharge given by 1 (8a) Qmbf Volume mud transport rate excluding pores L3T-1 at bankfull flow Qmbff Volume feed rate of mud excluding pores at L3T-1 bankfull flow excluding pores Qsbf Volume sand transport rate excluding pores L3T-1 at bankfull flow
sQ Dimensionless bankfull sand discharge given 1 by (10a) Qsbff Volume sand feed rate excluding pores L3T-1 at bankfull flow Qsrat Ratio of Qsbff to the value 0.80 m3/s used in 1 Cases A and B of the calculations
∗q Dimensionless Einstein number defined 1 by (2a) qs Volume sand transport rate per unit width L2T-1 excluding pores qsbf Value of qs at bankfull flow L2T-1 qw Water discharge per unit width L2T-1 qwbf Bankfull value of qw L2T-1 R = (ρs/ρ - 1), submerged specific gravity of 1 sediment (~ 1.65 for quartz) rS critical value of the ratio Sfric/S below which 1 the valley is assumed to be drowned S = - ∂η/∂x, local alluvial bed slope 1 Saba Alluvial slope at bedrock-alluvial transition 1 Sbb Subaerial basement slope to which alluvial 1 river reach onlaps Ssb Subaqueous basement slope over which river delta progrades 1 Sfric Bankfull friction slope given by (19) or (23b) 1 Sfi Initial slope of fluvial region 1 Sfore Foreset slope (assumed constant here) 1

Part II of manuscript submitted to Sedimentology, May, 2006
61
Sttf Alluvial topset slope at topset-foreset break 1 Su Alluvial bed slope at bedrock-alluvial transition 1 Sv = ΩS, valley slope 1 sba Position of bedrock-alluvial transition L
bas& Migration speed of bedrock-alluvial transition LT-1 ssb Position of foreset-subaqueous basement L break ssbi Initial value of ssb L
sbs& Migration speed of foreset-subaqueous LT-1 break stf Position of topset-foreset break L stfi Initial value of stf
tfs& Migration speed of topset-foreset break LT-1 t Time T t Moving boundary time coordinate given by T (21b) U = qw/H, depth-averaged river flow velocity LT-1 Ubf Bankfull value of U LT-1 x Downchannel streamwise coordinate L xv Downvalley streamwise coordinate L x Dimensionless moving boundary spatial 1 coordinate given by (21a)
x∆ Interval length in discretization of x 1 t∆ Step length in time t T
∆η Elevation drop across the foreset L ∆ηi Initial value of ∆η L η Local alluvial bed elevation L ηbi Initial elevation of the foreset-subaqueous L basement break ηbase Local basement elevation L ηs Bed elevation at the shoreline L ηti Initial elevation of the topset-foreset break L Λ Volume unit of mud deposited in the channel- 1 floodplain complex per unit sand deposited λp Porosity of deposit 1 ρ Density of water ML-3 ρs Density of sediment ML-3 ∗τ Dimensionless Shields number defined by 1
(2b) ∗τbf Shields number at bankfull flow given by (10b) 1 ∗τform Channel-forming Shields number 1
τb Bed shear stress ML-1T-2

Part II of manuscript submitted to Sedimentology, May, 2006
62
τbbf Bankfull value of τb ML-1T-2 Ω Channel sinuosity 1 ξ Sea level or elevation of standing water L (base level) ξi Initial value of ξ L ξ& Rate of rise of sea level or elevation of LT-1 standing water

Part II of manuscript submitted to Sedimentology, May, 2006
63
TABLE 1 PARAMETERS USED TO MODEL THE FLY-STRICKLAND RIVER SYSTEM
Parameter Value Units Description Notes Qbf 5700 m3/s Bankfull discharge Estimated from gaging stations on Strickland
and Fly Rivers (Obo and SG4). If 0.175 Flood intermittency Estimate based on the Fly River near
D’Albertis Junction, a reach with similar characteristics.
Qsbff 0.80 m3/s Sand feed rate during floods
Back-calculated from data and equations for channel geometry: used for Cases A and B. For Case C the value is increased by a factor of 2.92 to 2.336 m3/s.
Msandf 11.7 Mt/a Mean annual sand feed rate
Value for Cases A and B based on comments immediately above.
Msedf 78.1 Mt/a Mean annual sediment (sand + mud) feed rate
Based on above value of Msandf and the assumption that 15% of the sediment feed is sand.
Λ 1.0 Mud/sand deposition ratio
Reasonable guess motivated by personal communication from T. Törnqvist.
Ω 2.0 Channel sinuosity Average based on estimates from satellite photographs.
Czbf 25 Chezy bed resistance coefficient
Back-calculated from data and equations for channel geometry.
D 0.25 mm Characteristic sand grain size
Sediment survey of Strickland River at Ogwa.
Bf 12000 m Floodplain width Average based on estimates from aerial and satellite photographs.
sfi 970000 m Initial downchannel length of alluvial topset reach
Chosen to yield a final distance from the bedrock-sand transition to the shelf edge of 113000 m based on aerial and satellite photographs.
Sfi 0.0001 Initial downchannel slope of fluvial topset reach
Reasonable inference based on available data on Strickland river below gravel-sand transition. This value is used for Cases A and B; in case C the value is increased to 0.000292.
Sbb 0.00046 Slope of subaerial bedrock reach
From SRTM data for gravel-bed reach near gravel-sand transition.
Ssb 0.00075 Slope of subaqueous basement
From available bathymetric data.
Sfore 0.0016 Slope of foreset From available bathymetric data. ξi -120 m Initial sea level From available bathymetric data; datum is
present-day sea level. ηti -130 m Initial elevation of
topset-foreset break Value chosen to yield an initial depth of 10 m at topset-foreset break.
ηbi -170 m Initial elevation of foreset-subaqueous basement break
From available bathymetric data.
λp 0.35 Porosity of channel/floodplain complex
Reasonable estimate for a deposit consisting of half sand and half mud that has compacted over thousands of years.
R 1.65 Submerged specific gravity of sediment
Value for quartz.
∗τform 1.82 Channel-forming Shields number
Back-calculated from data and equations for channel geometry.

Part II of manuscript submitted to Sedimentology, May, 2006
64
TABLE 2 CALCULATED PARAMETERS FOR GRADED CHANNEL
Parameter Description Case B Case C Case C’ Ubf (m/s) Bankfull flow velocity 2.15 2.15 2.15
Bbf (m) Bankfull width 360 1052 1052
Hbf (m) Bankfull depth 7.38 2.52 2.52
Frbf Bankfull Froude number 0.252 0.431 0.431
Cmbf (mg/l) Sediment concentration 2477 7221 7221
Bbf/Hbf Bankfull width-depth ratio 48.8 416 416
S Downchannel bed slope 0.000102 0.000297 0.000297
Ω Channel sinuosity 2.0 2.0 1.2
Sv Valley slope 0.000204 0.000594 0.000357

Part II of manuscript submitted to Sedimentology, May, 2006
65
Figure 1. Annotated satellite image of the Fly-Strickland River System, Papua New Guinea. The abbreviations GST, EFR, BEF and OEE denote “gravel-sand transition,” “end of fluvial reach,” “beginning of estuary flare,” and “outer edge of estuary,” respectively. The image is from the NASA web site, https://zulu.ssc.nasa.gov/mrsid/.

Part II of manuscript submitted to Sedimentology, May, 2006
66
Figure 2. Sketch of part of the Fly-Strickland River System showing numerous blocked-valley lakes. From Dietrich et al. (1999).
Figure 3. SRTM (Shuttle Radar Topographic Mission) image of the Fly-Strickland River system. The lighter shading denotes the river floodplain. The approximate position of the gravel-sand transition on the Strickland River is shown.
Gravel-sand transition
North
Strickland River
Fly River
Everill Junction
100 km

Part II of manuscript submitted to Sedimentology, May, 2006
67
Figure 4. Long profiles of the Strickland and Fly River bank elevations upstream of Everill Junction. Elevations were obtained from SRTM (Shuttle Radar Topographic Mission) data.

Part II of manuscript submitted to Sedimentology, May, 2006
68
Figure 5. Plot of bankfull Chezy friction coefficient Czbf as a function of bed slope S for selected sand-bed and gravel-bed streams.
Figure 6. Plot of bankfull Shields number ∗τbf as a function of dimensionless
bankfull discharge Q for selected sand-bed and gravel-bed streams.
0.001
0.01
0.1
1
10
1.E+02 1.E+04 1.E+06 1.E+08 1.E+10 1.E+12 1.E+14
Gravel-bedSand-bedStrickland (est.)
1
10
100
0.00001 0.0001 0.001 0.01 0.1
S
Cz b
f
Gravel-bedSand-bedStrickland (est.)
∗τbf
Q
86.1bf =τ∗

Part II of manuscript submitted to Sedimentology, May, 2006
69
Figure 7. Plot of bankfull Froude number Frbf as a function of bed slope S for selected sand-bed and gravel-bed streams.
Figure 8. Diagram illustrating the decoupling of the shoreline from the topset-foreset break for the case of a self-formed channel subject to sediment-starved autoretreat.
Bf
embayment
drowned channelactive channel
shoreline
plan view
rising sea level ξ
embayment
abandoned foreset
η
η+Hbf
Sf = rSS
active channel present channel drowned
shoreline
topset-foreset break
plan view
0.1
1
10
0.00001 0.0001 0.001 0.01 0.1
S
Frbf
Gravel-bedSand-bedStrickland (est.)

Part II of manuscript submitted to Sedimentology, May, 2006
70
Figure 9. Definition diagram for the derivation of the Exner equation of sediment continuity for a co-evolving channel-floodplain complex.
Figure 10. Illustration of the use of two basement slopes, one subaerial and one subaqueous, in describing the evolution of a river flowing into the sea.
Fig. 11a. Profiles of bed elevation every 3000 years and final water surface elevation for Case A. The abbreviations “GST,” “EFR,” “BEF” and “OEE” are explained in the caption of Fig. 14.
-350
-300
-250
-200
-150
-100
-50
0
-200 0 200 400 600 800 1000 1200 1400
Downchannel distance from initial position of gravel-sand transition (km)
Elev
atio
n (m
) -21000 yr-18000 yr-15000 yr-12000 yr-9000 yr-6000 yr-3000 yr0 yrfinal w.s.
Everill Junction
Present EFR
Present BEF
PresentOEE
Presentshelf edge
Present GST
-21000 yr
0 yr
Sbb
Sbs
topset-foreset breaksubaerial bedrock-
alluvium break
foreset-subaqueous basement break
xB
Bf
xv
xv
xv+∆xv
Bbf
xB
Bf
xv
xv
xv+∆xv
Bbf

Part II of manuscript submitted to Sedimentology, May, 2006
71
Fig. 11b. Profiles of bankfull width Bbf every 3000 years for Case A.
Fig. 11c. Profiles of volume sand transport rate at bankfull Qsbf flow every 3000 years for Case A.
Fig. 11d. Profiles of bankfull depth Hbf every 3000 years for Case A.
0
2
4
6
8
10
12
-200 0 200 400 600 800 1000 1200
Downchannel distance from initial position of gravel-sand transition (km)
Ban
kful
l dep
th H
bf (m
)
-21000 yr-18000 yr-15000 yr-12000 yr-9000 yr-6000 yr-3000 yr0 yr
0 yr
-21000 yr
0
0.1
0.2
0.3
0.4
0.5
0.6
0.7
0.8
0.9
-200 0 200 400 600 800 1000 1200
Downchannel distance from initial position of gravel-sand transition (km)
Volu
me
sand
load
at b
ankf
ull f
low
Q
sbf (
m3 /s
)
-21000 yr-18000 yr-15000 yr-12000 yr-9000 yr-6000 yr-3000 yr0 yr
-21000 yr
0 yr
10
100
1000
10000
100000
-200 0 200 400 600 800 1000 1200
Downchannel distance from initial position of gravel-sand transition (km)
Ban
kful
l wid
th B
bf (m
)
-21000 yr
-18000 yr
-15000 yr
-12000 yr
-9000 yr
-6000 yr
-3000 yr
0 yr
-21000 yr
0 yr

Part II of manuscript submitted to Sedimentology, May, 2006
72
Fig. 11e. Plot of downchannel distance from the initial position of the gravel-sand transition to a) the delta topset-foreset break (stf) and b) the shoreline (sss) for Case A. The delta is never abandoned because sea level is constant in Case A.
Fig. 12a. Profiles of bed elevation every 3000 years and final water surface elevation for Case B. The abbreviations “GST,” “EFR,” “BEF” and “OEE” are explained in the caption of Fig. 14.
-250
-200
-150
-100
-50
0
50
-200 0 200 400 600 800 1000 1200 1400
Downchannel distance from initial position of gravel-sand transition (km)
Elev
atio
n (m
) -21000 yr-18000 yr-15000 yr-12000 yr-9000 yr-6000 yr-3000 yr0 yrfinal w.s.
-21000 yr
0 yr
-9000 yr
-3000 yr
-6000 yr
-18000 yr
Everill Junction
Present EFR
Present BEF
PresentOEE
Presentshelf edge
Present GST
900
950
1000
1050
1100
-25000 -20000 -15000 -10000 -5000 0
Time in years before present
Dis
tanc
e fr
om in
itial
pos
ition
of g
rave
l-sa
nd tr
ansi
tion
(km
)
stfsss
Delta progrades outward: distance to shoreline always coincides with distance to topset-foreset break

Part II of manuscript submitted to Sedimentology, May, 2006
73
Fig. 12b. Profiles of bankfull width Bbf every 3000 years for Case B.
Fig. 12c. Profiles of volume sand transport rate at bankfull Qsbf flow every 3000 years for Case B.
Fig. 12d. Profiles of bankfull depth Hbf every 3000 years for Case B.
0
20
40
60
80
100
120
140
-200 0 200 400 600 800 1000 1200
Downchannel distance from initial position of gravel-sand transition (km)
Ban
kful
l dep
th H
bf (m
)
-21000 yr-18000 yr-15000 yr-12000 yr-9000 yr-6000 yr-3000 yr0 yr
-15000 yr
-12000 yr
-9000 yr
-21000 yr
-18000 yr
-6000 yr
-3000 yr
0 yr
0
0.1
0.2
0.3
0.4
0.5
0.6
0.7
0.8
0.9
-200 0 200 400 600 800 1000 1200
Downchannel distance from initial position of gravel-sand transition (km)
Volu
me
sand
load
at b
ankf
ull f
low
Q
sbf (
m3 /s
)
-21000 yr-18000 yr-15000 yr-12000 yr-9000 yr-6000 yr-3000 yr0 yr
-15000 yr
-12000 yr-9000 yr
-21000 yr
-18000 yr
-6000 yr
-3000 yr 0 yr
10
100
1000
10000
100000
-200 0 200 400 600 800 1000 1200
Downchannel distance from initial position of gravel-sand transition (km)
Ban
kful
l wid
th B
bf (m
)
-21000 yr
-18000 yr
-15000 yr
-12000 yr
-9000 yr
-6000 yr
-3000 yr
0 yr-15000 yr-12000 yr-9000 yr
-21000 yr
-18000 yr
-6000 yr
-3000 yr
0 yr

Part II of manuscript submitted to Sedimentology, May, 2006
74
Fig. 12e. Plot of downchannel distance from the initial position of the gravel-sand transition to a) the delta topset-foreset break (stf) and b) the shoreline (sss) for Case B. The original delta is abandoned by – 15000 years; a new delta progrades outward after – 6000 years. By 0 years (present) the new delta has not yet merged with the abandoned delta.
Fig. 12f. Expanded view of Fig. 25e showing the autobreak point for Case B.
Fig. 12g. Plot showing the final computed bankfull water surface profile ( 0 years = present) of Case B from Everill Junction to the gravel-sand transition with SRTM data on bank elevation.
0
20
40
60
80
100
120
0 100 200 300 400
Distance upchannel of Everill Junction (km)
Top-
bank
ele
vatio
n (m
)
measuredcomputed
Gravel-sand transition
890
940
990
-22000 -20000 -18000 -16000 -14000 -12000
Time in years before present
Dis
tanc
e fr
om in
itial
pos
ition
of g
rave
l-sa
nd tr
ansi
tion
(km
)
stfsss
Delta progrades
Delta goes into autoretreat
without sediment starvation
Delta goes into sediment-starved
autoretreat
Autobreak
0
200
400
600
800
1000
-25000 -20000 -15000 -10000 -5000 0
Time in years before present
Dis
tanc
e fr
om in
itial
pos
ition
of g
rave
l-sa
nd tr
ansi
tion
(km
)
stfsss
Delta progrades
Delta goes into sediment-starved
autoretreat
New delta forms and progrades

Part II of manuscript submitted to Sedimentology, May, 2006
75
Fig. 13a. Profiles of bed elevation every 3000 years and final water surface elevation for Case C. The abbreviations “GST,” “EFR,” “BEF” and “OEE” are explained in the caption of Fig. 14.
Fig. 13b. Profiles of bankfull width Bbf every 3000 years for Case C.
10
100
1000
10000
100000
-200 0 200 400 600 800 1000 1200
Downchannel distance from initial position of gravel-sand transition (km)
Ban
kful
l wid
th B
bf (m
)
-21000 yr
-18000 yr
-15000 yr
-12000 yr
-9000 yr
-6000 yr
-3000 yr
0 yr-15000 yr-12000 yr
-9000 yr
-21000 yr
-18000 yr
-6000 yr
-3000 yr 0 yr
-400
-300
-200
-100
0
100
200
300
-200 0 200 400 600 800 1000 1200 1400
Downchannel distance from initial position of gravel-sand transition (km)
Elev
atio
n (m
) -21000 yr-18000 yr-15000 yr-12000 yr-9000 yr-6000 yr-3000 yr0 yrfinal w.s.
Everill Junction
Present EFR
Present BEF
PresentOEE
Presentshelf edge
Present GST
-21000 yr
0 yr

Part II of manuscript submitted to Sedimentology, May, 2006
76
Fig. 13c. Profiles of volume sand transport rate at bankfull Qsbf flow every 3000 years for Case C.
Fig. 13d. Profiles of bankfull depth Hbf every 3000 years for Case C.
Fig. 13e. Plot of downchannel distance from the initial position of the gravel-sand transition to a) the delta topset-foreset break (stf) and b) the shoreline (sss) for Case C. The original delta is never abandoned by the shoreline in spite of 120 of sea level rise.
900
950
1000
1050
1100
-25000 -20000 -15000 -10000 -5000 0
Time in years before present
Dis
tanc
e fr
om in
itial
pos
ition
of g
rave
l-san
d tr
ansi
tion
(km
)
stfsss
Delta goes into autoretreat without sediment starvation
Delta resumes progradation
Delta progrades
0
5
10
15
20
25
-200 0 200 400 600 800 1000 1200
Downchannel distance from initial position of gravel-sand transition (km)
Ban
kful
l dep
th H
bf (m
)
-21000 yr-18000 yr-15000 yr-12000 yr-9000 yr-6000 yr-3000 yr0 yr
-15000 yr
-12000 yr
-9000 yr
-21000 yr
-18000 yr
-6000 yr
-3000 yr
0 yr
0
0.5
1
1.5
2
2.5
-200 0 200 400 600 800 1000 1200
Downchannel distance from initial position of gravel-sand transition (km)
Volu
me
sand
load
at b
ankf
ull f
low
Q
sbf (
m3 /s
)-21000 yr-18000 yr-15000 yr-12000 yr-9000 yr-6000 yr-3000 yr0 yr
-15000 yr
-12000 yr
-9000 yr
-21000 yr
-18000 yr
-6000 yr
-3000 yr
0 yr

Part II of manuscript submitted to Sedimentology, May, 2006
77
Fig. 14. Plot of downchannel distance from the initial position of the gravel-sand transition to the shoreline for seven cases. The parameters are the same as in Case B except that a) the sediment feed rate Qsbff and initial fluvial slope Sfi of case B are both incremented by the seven factors Qsrat =0.8, 1 (Case B), 1.4, 1,8, 2,4, 2,65 and 2.92 (Case C).
0
200
400
600
800
1000
1200
-25000 -20000 -15000 -10000 -5000 0Time in years before present
Dow
ncha
nnel
dis
tanc
e (k
m)
1
Qsrat = 1(Case B)
New delta merges with abandoned delta
(Qsrat = 2.65 only)
1. Delta progradation2. Autoretreat without starvation3. Sediment-starved autoretreat4. Progradation of new delta
2 3 4
Qsrat = 1.4
Qsrat = 1.8
Qsrat = 2.4
Qsrat = 2.65
Qsrat = 2.92(Case C)
Autobreak
Formation of new delta Qsrat = 0.8