unlocking it investment for innovation - dell world 2011
TRANSCRIPT

Idea Exchanges
Experience the solutions
Discuss the possibilities
Solutions Showcase
KeynotesHear the vision

2
Dell on Dell: Unlocking IT Investment for Innovation

33
The line between the business and IT continues to disappear
Increased Enablement
Deliver services and applications anywhere through the cloud.
Regulation Reality
Ensure compliance with an increasing number of complex regulatory bodies.
Increased Threat
Secure the network AND the data.
Data Tsunami
Analyze and monetize the massive growth in business data.
True 24/7
Deliver access anywhere, at any time. On any device.

4
Demands on IT continue to expand
Budgets are flat to down
Strategic investments limited to running the business
?Outcomes and ROI are not adequate or predictable
The Status Quo is not sustainable

55
On innovation On innovation
20%
Keeping the Lights OnTechnology ChangeRegulatory ComplianceSecurityBusiness Up & Running
Value CreationCustomer ConnectionStrategic AlignmentBusiness ResultsEnd-User Productivity50
%Start Goal
The first step to IT efficiency ischallenging the cost of running IT today
66
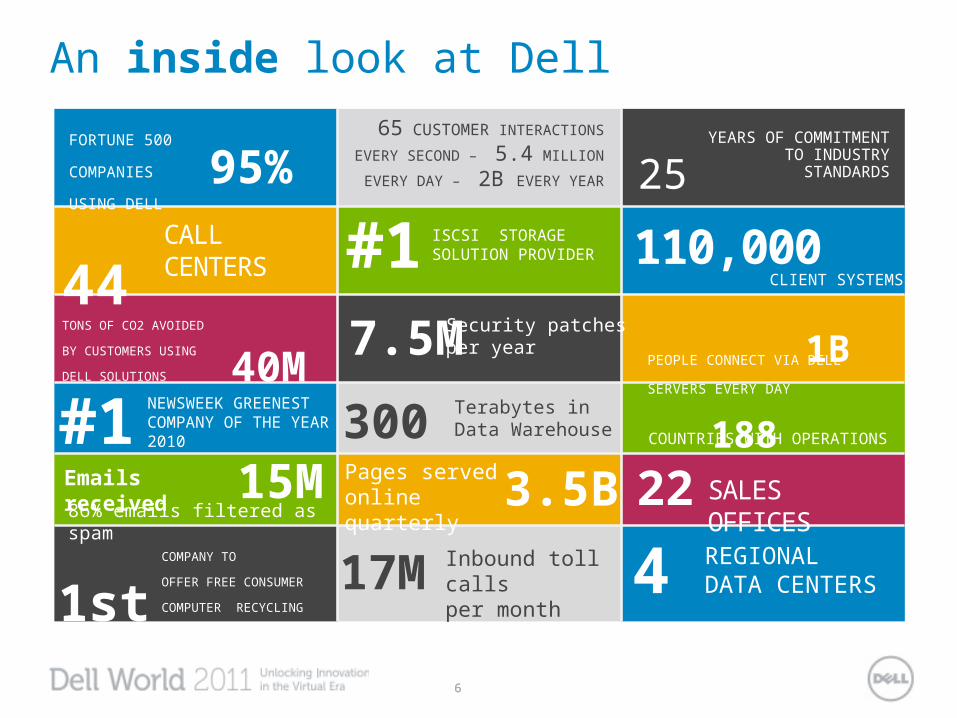
1stCOMPANY TO
OFFER FREE CONSUMER
COMPUTER RECYCLING
WORLDWIDE
40MTONS OF CO2 AVOIDED
BY CUSTOMERS USING
DELL SOLUTIONS
65 CUSTOMER INTERACTIONS
EVERY SECOND – 5.4 MILLION
EVERY DAY – 2B EVERY YEAR
COUNTRIES WITH OPERATIONS188
YEARS OF COMMITMENT TO INDUSTRY STANDARDS2595%
FORTUNE 500
COMPANIES
USING DELL
CALL CENTERS44
ISCSI STORAGE SOLUTION PROVIDER#1
An inside look at Dell
4 REGIONAL DATA CENTERS
300 Terabytes in Data Warehouse
Pages served online quarterly3.5B
7.5M
Security patches per year
15MEmails received86% emails filtered as spam
17M
Inbound toll calls per month
#1NEWSWEEK GREENEST COMPANY OF THE YEAR 2010
1BPEOPLE CONNECT VIA DELL
SERVERS EVERY DAY
110,000CLIENT SYSTEMS
22SALES OFFICES

77
Panama
Twin Falls
OKC
Austin/RR
Puerto Rico
Mexico City
Columbia
WS1
NashvilleReno
Toronto
Argentina
São PauloPorto AlegreChile
Bangalore
Chandigarh
Sydney
Mohali
Beijing
Shenzhen
Guangzhou
Chengdu
Hang Zhou
Hyderabad
Delhi
Penang
Philippines 1 & 2Hong Kong
Taiwan
Dalian
Xiamen
Kawasaki
Singapore
Miyazaki
ShanghaiOtemachi
AthensItalyGeneva
Montpellier
Madrid
Morocco
South Africa
LimerickDublinScotland
BracknellParis
BelgiumAmsterdam
Norway
Denmark
SwedenFrankfurt
Halle
Prague
Finland
Poland
EMFP
Bratislava
Cyberjaya
Everdream, CA
ZING, CA
ASAP
Everdream, NCSilverback
Dell Call Centers (44)
Regional DC (4)Manufacturing & Merge DC (11)Sales Offices (22)
Total = 95
Chennai
Acquisitions (12)
Equalogic
Current global facilities
Perot Systems, Plano
Florence
Hosting DC (2)
Boomi
Scalent, CA
Ocarina, CA
KACE, CA
InSite One, CT

88
Dell IT challenges
Global footprint, regional deployment
Inconsistent spend
100K CIOs!

99
ApplicationsIT GovernancePortfolio RationalizationStandardization
Transformation Of Dell IT
2002 2008
IT Simplification 1.0The drive to reduced TCO
IT Simplification 2.0The drive to agility and innovationInfrastructure
Data Center ConsolidationDell-on-Dell x86 ArchitectureVirtualization
2010
<2% of Revenu
e
<1.5% of
Revenue
InfrastructureGlobal Processes (ITIL-based)Further Consolidation & VirtualizationGreen Data Center
ApplicationsBusiness Architecture LedEnterprise Architecture FoundationShadow IT Elimination and Rationalization
1010
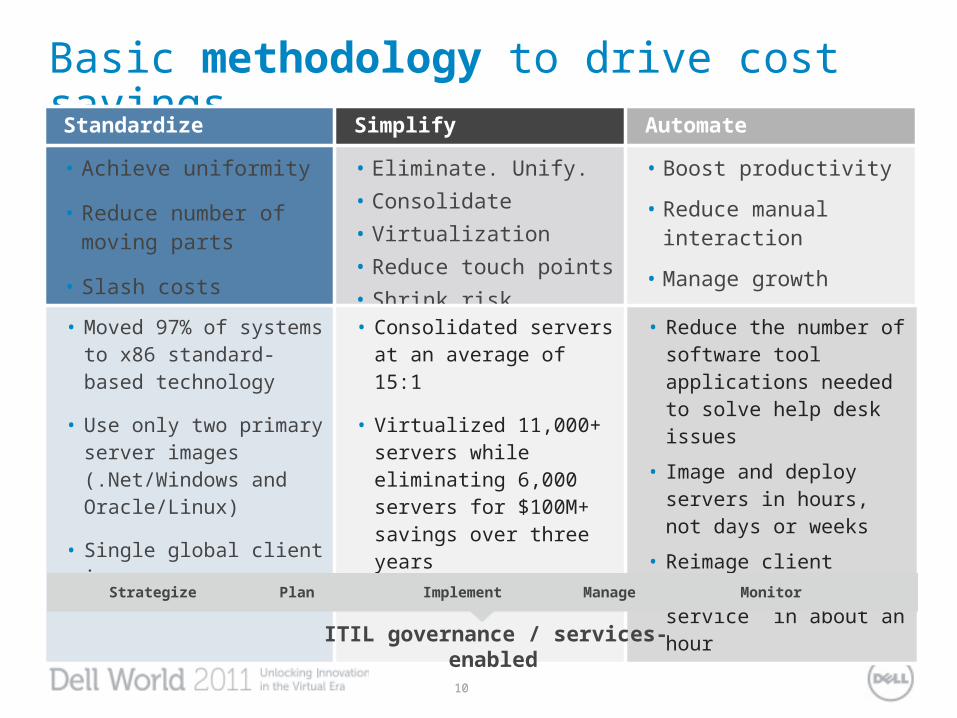
Basic methodology to drive cost savings
Standardize Simplify Automate
• Achieve uniformity
• Reduce number of moving parts
• Slash costs
• Eliminate. Unify. • Consolidate• Virtualization• Reduce touch points• Shrink risk
• Boost productivity
• Reduce manual interaction
• Manage growth
• Moved 97% of systems to x86 standard-based technology
• Use only two primary server images (.Net/Windows and Oracle/Linux)
• Single global client image
• Consolidated servers at an average of 15:1
• Virtualized 11,000+ servers while eliminating 6,000 servers for $100M+ savings over three years
• Reduce the number of software tool applications needed to solve help desk issues
• Image and deploy servers in hours, not days or weeks
• Reimage client systems “self service” in about an hour
Strategize Plan Implement Manage Monitor
ITIL governance / services-enabled

1111
Application reduction efforts
Jan-08 Jan-09 Jan-10 Jan-110
1000
2000
3000
4000
5000
6000
7000
25512008
1524 1401
3929
2863
13521004
Total Applications
IT Apps Non-IT Apps
Unknown cost of “shadow IT” can be as much as 2X the “known” IT budget
Duplicate reporting between org structures
Each application means more complexity, more interfaces required, more points of failure
Simplifying the application space enables infrastructure simplification
1212
EMEA
AP
JP
AI
US
Glo
bal P
orta
lB
2BP
rem
ier
Par
tner
Dire
ctD
ell.c
om
Online SalesS
ymph
ony
SM
AR
TS
EMEA
AP
JP
AI
US
Offline Sales
GE
DIS
EMEA
AP
JP
AI
US
OM
EG
A
SM
AR
TS
Order Processing
Services
EMEA
AP
JP
AI
US
DP
S
nVIS
ION
DC
SS
DE
LLS
ER
VE
EMEA
AP
JP
AI
US
NO
VO
RA
Accounting
EMEA
Design
AP
JP
AI
US
???
Plan & Procure
EMEA
AP
JP
AI
US
EMEA
AP
JP
AI
US
Dell Manufacturing/ODM/Re-manufacturing/Warranty
WT
CS
RE
MA
P
P2M
/WIP
S/C
IMP
LIC
ITY
OF
S
ION
Spe
edw
ayD
RA
GO
N /
FIM
S/
RE
MA
P
Epi
tom
e/ M
SS
/ IR
IS
FD
L
O2
(OD
M)
SC
PD
ISC
p
Glo
via
SC
DH
I-D
rive
Agi
le
Win
dchi
ll
CP
TK
eReq
DO
MS
DO
MS
Common Services & Integration Platform
Mas
ter
Dat
a M
anag
emen
t
En
terp
rise
B
usi
nes
s In
telli
gen
ce
Product
EMEA
AP
JP
AI
US
Pub
lish
Par
t
Par
t C
reat
ion
SK
U C
reat
ion
Con
fig P
rodu
ct
Mer
chan
disi
ng
Asset
EMEA
AP
JP
AI
US
BIL
SD
R
Customer
EMEA
AP
JP
AI
US
Cus
t R
egis
try
Acc
t H
iera
rchy
Pro
file/
Pre
fsTeradata
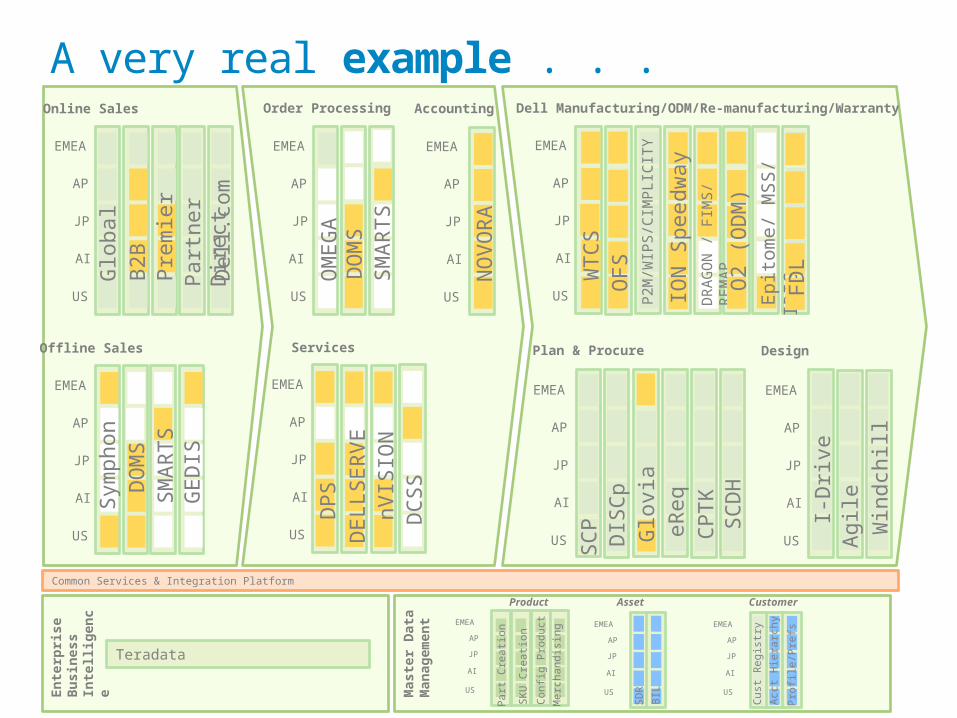
A very real example . . .

1313
EMEA
AP
JP
AI
US
Glo
bal P
orta
lB
2BP
rem
ier
Par
tner
Dire
ctD
ell.c
om
Online SalesS
ymph
ony
DO
MS
SM
AR
TS
EMEA
AP
JP
AI
US
Offline Sales
GE
DIS
EMEA
AP
JP
AI
US
OM
EG
A
SM
AR
TS
Order Processing
Services
EMEA
AP
JP
AI
US
DP
S
nVIS
ION
DC
SS
DE
LLS
ER
VE
EMEA
AP
JP
AI
US
Accounting
EMEA
Design
AP
JP
AI
US
???
Plan & Procure
EMEA
AP
JP
AI
US
EMEA
AP
JP
AI
US
Dell Manufacturing/ODM/Re-manufacturing/Warranty
WT
CS
RE
MA
P
P2M
/WIP
S/C
IMP
LIC
ITY
OF
S
ION
Spe
edw
ayD
RA
GO
N /
FIM
S/
RE
MA
P
Epi
tom
e/ M
SS
/ IR
IS
FD
L
O2
(OD
M)
SC
PD
ISC
p
Glo
via
SC
DH
I-D
rive
Agi
le
Win
dchi
ll
CP
TK
eReq
NO
VO
RA
DO
MS
Common Services & Integration Platform
Mas
ter
Dat
a M
anag
emen
t
En
terp
rise
B
usi
nes
s In
telli
gen
ce
Product
EMEA
AP
JP
AI
US
Pub
lish
Par
t
Par
t C
reat
ion
SK
U C
reat
ion
Con
fig P
rodu
ct
Mer
chan
disi
ng
Asset
EMEA
AP
JP
AI
US
BIL
SD
R
Customer
EMEA
AP
JP
AI
US
Cus
t R
egis
try
Acc
t H
iera
rchy
Pro
file/
Pre
fsTeradata
Why “rationalize the core”?

1414
2007 2008 2009 2010 20110
2000
4000
6000
8000
10000
12000
0%
10%
20%
30%
40%
50%
60%
70%
80%
543
5509
75009500
1100074%
62%
55% 50%
40%Oct 2009
APJ11%
USA64%
EMEA25%
Server Virtualization by Region (% of total VMs)
Test- Dev56%
Prod44%
Server Virtualization by Deployment (% of total VMs)
Overcoming Under-Utilization
Q4 CY2010
CY2011
% U
nd
er-
Uti
lized
S
erv
ers
Tota
l S
erv
er
Pla
tform
# V
irtu
al
Serv
ers
Dep
loyed
Case study – virtualization
9,500+ Virtual Servers on650 VMware ESX Servers
11,000 Virtual Servers on700+ VMware ESX Servers

1515
2007 2008 2009 2010 20110
2,000
4,000
6,000
8,000
10,000
12,000
$0
$10,000,000
$20,000,000
$30,000,000
$40,000,000
$50,000,000
$60,000,000
$70,000,000
$80,000,000
$90,000,000
$100,000,000
543
5509
7500
9500
11000
$3M
$38M
$64M
$77M
$90M
Virtualize More and Save More
Esti
mate
d C
ost
Avoid
an
ce
(M
illi
on
s)
# V
irtu
al
Serv
ers
Dep
loyed
Virtualization – cost savingsEstimated ROI Savings OverThree Years
• > 60% savings over traditional
Comparison of Only Tangible Costs
• Dell IT standard physical 2u server vs. Dell IT standard VM
• One-time startup costs including infrastructure, provisioning, and logistics
• 4-years of yearly costs including DC space, power/cooling, maintenance and support
What’s Missing?• Quantifying the intangibles
like speeding up the application development lifecycle
• Understanding impact of any future architectural changes on ROI
*Based on forecast, we anticipate the 11,000 virtual servers will be in a approximate ratio of 60/40, Test-Dev/Prod.

1616
White Space
768 sq ft
594 sq ft
-23%
# of Physical Servers
480
640
+33%
# of OS
585
4,960
+747%
Max Power/Rack
3.5kW
17.2kW
+390%
Utility $ per OS ($.07/kWh)
$338
$58
-80%
Data center densification:Optimized Containment Solution (OCS)
iSCSI
iSCSI
In R
ow
Co
olin
g
In R
ow
Co
olin
g
In R
ow
Co
olin
g
In R
ow
Co
olin
g
In R
ow
Co
olin
g
In R
ow
Co
olin
g
In R
ow
Co
olin
g
In R
ow
Co
olin
g
In R
ow
Co
olin
g
In R
ow
Co
olin
g
In R
ow
Co
olin
g
In R
ow
Co
olin
g
In R
ow
Co
olin
g
In R
ow
Co
olin
g
In R
ow
Co
olin
g
In R
ow
Co
olin
g
UHDVMR01
UHDVMR01
UHDDBR02
UHDDBR02
UHDSAR03
UHDDBR03
UHDSAR04
UHDSAR04
UHDVMR05
UHDVMR06
UHDVMR07
UHDVMR08
UHDSAR09
UHDSAR10
UHDSAR10
UHDSAR09
UHDVMR08
UHDVMR07
UHDVMR06
UHDVMR05
Cluster A
R1R2R3
Cluster B
R1R2R3
Cluster C
R1R2R3
Cluster D
R1R2R3
Cluster E
R1R2R3
Cluster F
R1R2R3
Cluster G
R1R2R3
Cluster H
R1R2R3
Cluster A
R1R2R3
Cluster B
R1R2R3
Cluster C
R1R2R3
Cluster D
R1R2R3
Cluster E
R1R2R3
Cluster F
R1R2R3
Cluster G
R1R2R3
Cluster H
R1R2R3
2nd Gen OCS RowsLegacy Rows
Benefits from Densification
Legacy
OCS
Hot Aisle
Cold Aisle
Hot Aisle
Hot or Cold Aisle Containment

1717
IT cost allocation exampleFY10 Large Enterprise Public Consumer SMB COGS - Services COGS-
OperationsTOTALS
Dell HostingDatabase Services 3.4$ 3.5$ 2.2$ 2.5$ 3.4$ 9.2$ 24.1$
Server & Storage Services 24.8$ 23.4$ 15.3$ 15.8$ 21.9$ 53.5$ 154.6$ Tandem Services 1.3$ 1.3$ 1.3$ 1.3$ 3.3$ 3.9$ 12.2$
Software Depreciation & Maintenance 15.2$ 13.9$ 8.9$ 11.0$ 18.5$ 4.3$ 71.9$ AIMS Hosting Strategies -$ -$ -$ -$ 12.7$ -$ 12.7$
Total - Hosting 44.6$ 42.0$ 27.7$ 30.6$ 59.8$ 70.9$ 275.6$
Dell Connect Mobile 18.7$ 11.9$ 2.7$ 2.2$ 9.2$ 4.7$ 49.3$
Voice / Data Ports 19.8$ 18.2$ 11.6$ 14.4$ 24.2$ 28.2$ 116.4$ Conferencing 9.9$ 6.9$ 3.0$ 2.0$ 7.6$ 2.6$ 32.1$
Inbound 2.4$ 0.2$ 40.0$ 5.8$ 10.0$ -$ 58.5$ Outbound 1.7$ 3.5$ 16.1$ 8.9$ 5.3$ -$ 35.5$
Total - Connect 52.6$ 40.8$ 73.4$ 33.2$ 56.3$ 35.5$ 291.8$
Managed Client Managed Client 4.8$ 4.4$ 2.8$ 3.5$ 5.9$ 1.4$ 22.9$ Managed Print 1.3$ 1.2$ 0.8$ 0.9$ 1.6$ 0.4$ 6.2$
Service Desk 0.3$ 0.3$ 0.2$ 0.3$ 0.4$ 0.2$ 1.7$ Total - Managed Client 6.5$ 6.0$ 3.8$ 4.7$ 7.9$ 1.9$ 30.8$
Applications Development Development 79.2$ 71.3$ 72.3$ 67.6$ 66.0$ 113.9$ 470.4$
Total - Applications Development 79.2$ 71.3$ 72.3$ 67.6$ 66.0$ 113.9$ 470.4$
Applications Support Support 3.8$ 3.4$ 3.1$ 3.3$ 4.3$ 6.1$ $ 24.0
Total - Applications Support 3.8$ 3.4$ 3.1$ 3.3$ 4.3$ 6.1$ 24.0$
Total By Segment - Adjusted 189.2$ 165.7$ 181.8$ 141.2$ 190.1$ 224.6$ 1,092.6$
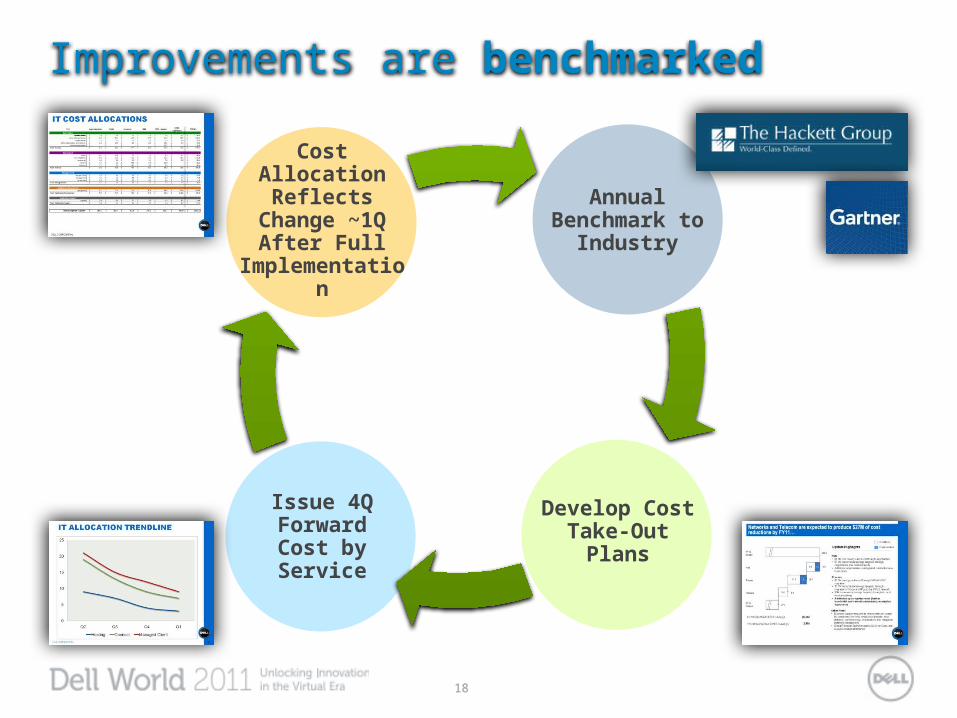
1818
Annual Benchmark to
Industry
Develop Cost Take-Out
Plans
Issue 4Q Forward Cost by Service
Cost Allocation Reflects
Change ~1Q After Full
Implementation
Improvements are benchmarked

1919
Results of Dell’s transformation
OF 2004 BUDGET SPENT ON INNOVATION
28%543
SPENDING
2.1%
8,000+APPLICATIONS IN 2007
VIRTUAL MACHINES DEPLOYED IN 2007
OF REVENUE ON IT IN 2008
OF BUDGET SPENT ON INNOVATION
52%11,000
VIRTUAL MACHINES DEPLOYED
SPENDING
1.4%OF REVENUE ON IT IN 2011
IT SAVINGS DELIVERED:
$300M PER YEAR
Then . . . Today . . .
2,200APPLICATIONS IN 2011
INVESTED ININNOVATIONTO TRANSFORM THE BUSINESS
20
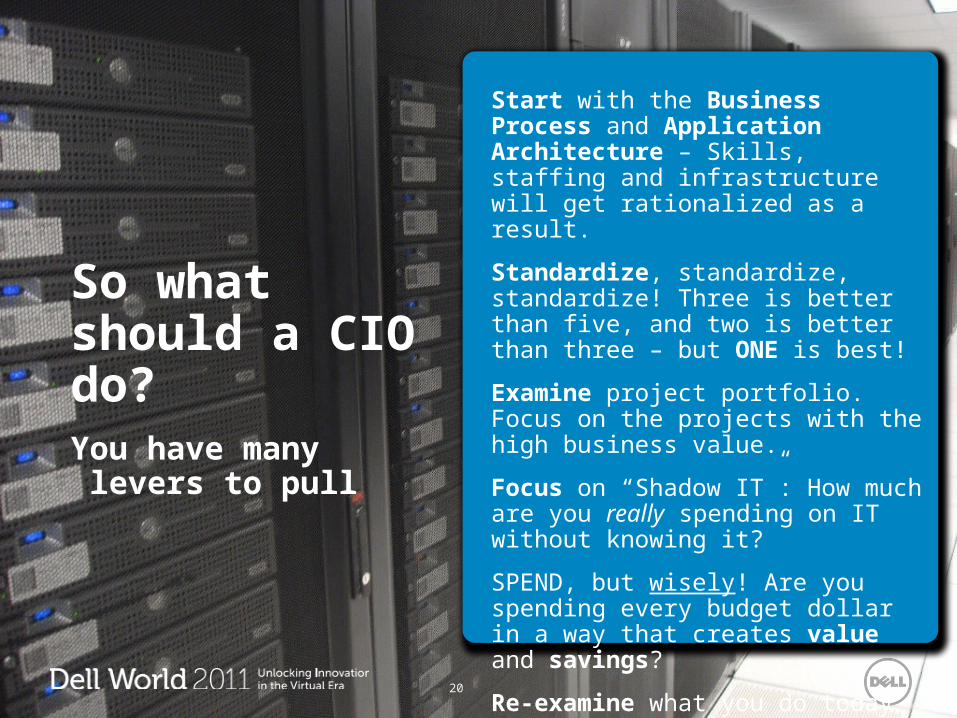
So what should a CIO do?You have many levers to pull
Start with the Business Process and Application Architecture – Skills, staffing and infrastructure will get rationalized as a result.
Standardize, standardize, standardize! Three is better than five, and two is better than three – but ONE is best!
Examine project portfolio. Focus on the projects with the high business value.
Focus on “Shadow IT”: How much are you really spending on IT without knowing it?
SPEND, but wisely! Are you spending every budget dollar in a way that creates value and savings?
Re-examine what you do today
Idea Exchange Session
Please take a moment and provide feedback on this session. www.dellworld.com/feedback
Thank you for attending.

Prepare for your guided tour of the Dell World Solutions Experience• Refer to the back of your
badge for your specific tour number
• Meet your guide and tour group in the area outside of the expo hall
• Enjoy your tour!
Backup

25
Global IT organization design
Robin JohnsonCIO
Office of the CIO
Strategy, Technology & Governance Office
Information Management(Business Intelligence, Master Data)
Application TestingSales, Marketing & Operations Delivery
Global Services and Corporate Delivery
Database Administration
Global Operations & Technology(Design, Manufacturing, Supply Chain)
Dell Services & Corporate Technology(Services Business, HR, Legal, Marketing)
Global Consumer and Commercial Sales Systems
Global Financial Systems / Dell Financial Services
Infrastructure Services
Application Management Services
DES
IGN
GO
VER
NB
UIL
DR
UN = Dell Global Services