university ridge student housing - city of bellingham
TRANSCRIPT

Transportation Impact Analysis
UNIVERSITY RIDGE STUDENT HOUSING
Prepared for: Ronald T. Jepson & Associates, PS
April 2013
Prepared by:
11730 118th Avenue NE, Suite 600 Kirkland, WA 98034-7120
Phone: 425-821-3665 Fax: 425-825-8434
www.transpogroup.com
11167.00
© 2013 Transpo Group
Transportation Impact Analysis University Ridge Student Housing April 2013
i
Table of Contents Executive Summary ................................................................................................................. ii
Chapter 1. Introduction ............................................................................................................ 1 Project Description ................................................................................................................. 1 Study Area and Approach ...................................................................................................... 1
Chapter 2. Existing and Baseline Conditions ....................................................................... 4 Roadway Network .................................................................................................................. 4 Planned Roadway Improvements .......................................................................................... 4 Non-Motorized Facilities ........................................................................................................ 5 Transit Service ....................................................................................................................... 5 Traffic Volumes ...................................................................................................................... 7 Traffic Operations ................................................................................................................ 10 Traffic Safety ........................................................................................................................ 11
Chapter 3. Project Impacts .................................................................................................... 12 Trip Generation .................................................................................................................... 12 Trip Distribution and Assignment ......................................................................................... 13 Traffic Operations ................................................................................................................ 13 Site Access Evaluation ........................................................................................................ 16
Chapter 4. Summary and Mitigation ..................................................................................... 17
Appendix Appendix A: Traffic Counts Appendix B: LOS Definitions Appendix C: LOS Worksheets
Figures Figure 1. Site Vicinity .......................................................................................................... 2 Figure 2. Preliminary Site Plan ........................................................................................... 3 Figure 3. Existing Weekday PM Peak Hour Traffic Volumes ............................................. 8 Figure 4. 2014 Without-Project PM Peak Hour Traffic Volumes ........................................ 9 Figure 5. Project Trip Distribution and Assignment .......................................................... 14 Figure 6. 2014 With-Project Weekday PM Peak Hour Traffic Volumes ........................... 15
Tables Table 1. Study Area Existing Roadway Network Summary .............................................. 4 Table 2. Existing Transit Service ....................................................................................... 6 Table 3. Existing and Future Weekday PM Peak Hour Intersection Operations ........... 10 Table 4. Study Intersection Collision Data Summary ...................................................... 11 Table 5. Estimated Project Trip Generation .................................................................... 12

Transportation Impact Analysis University Ridge Student Housing April 2013
ii
Executive Summary
This section provides an executive summary of the Final Transportation Impact Analysis through a set of frequently asked questions (FAQs).
Where is the project located and what would be developed?
The proposed project is located north of Consolidation Avenue between Nevada Street and Puget Street. The development would construct 164 residential units, which would be marketed as student housing primarily for students attending Western Washington University (WWU). Access to the site would be located on Consolidation Avenue. Lincoln Street and Nevada Street are the primary north-south roadways that connect the site to the surrounding area.
Is the site currently served by public transit?
Whatcom Transit Authority (WTA) provides transit service in the study area. The nearest transit routes are accessed at the Lincoln Creek Park-and-Ride, which is less than a half mile from the site. Routes 80X, 90A&B, 196, and 197 serve the Park-and-Ride and connect to WWU, Downtown Bellingham, and the surrounding Cities.
How many daily vehicular trips would the project generate and when would peak traffic volumes occur?
The residential units will be marketed as student housing primarily for students attending WWU. To provide for conservative analysis this study evaluated conditions as if this were a standard mid-rise apartment complex and only assuming a reduction of 7 percent to account for transit being in close proximity. This equates to the project generating approximately 640 daily trips with 59 trips occurring during the PM peak hour. Peak traffic volumes would occur during the weekday PM peak hour (one- hour period between 4:00 p.m. and 6:00 p.m.). It is anticipated that the actual project will generate fewer vehicular trips than typical apartments and what is accounted for in this analysis because the student population is more likely to utilize transit, bike, or other non-vehicular modes of travel during the PM peak period. This is driven by class schedules often end prior to the PM peak commute period, all WWU students are provided Whatcom Transportation Authority (WTA) bus passes and parking fees on the WWU campus are high. In addition, trip generation during summer months is anticipated to be lower given that school will not be in session, which is not accounted for in this analysis.
What transportation impacts are anticipated, if any?
The project would increase traffic volumes in the study area and contribute to increases in intersection delay; however, all study intersections would continue to operate at acceptable LOS D or better.
What measures are proposed to reduce or control traffic impacts?
The project would be required to pay the City’s Traffic Impact Fee. The current fee is $1,925 per PM peak hour trip and reductions are allowed for the project site being located in close proximity to high frequency transit and primarily marketing to WWU students who are provided WTA bus passes.

Transportation Impact Analysis University Ridge Student Housing April 2013
Page 1
Chapter 1. Introduction
The purpose of this transportation impact analysis (TIA) is to identify potential traffic-related impacts associated with the proposed University Ridge development in Bellingham, Washington. As necessary, mitigation measures are identified that would offset or reduce significant transportation impacts.
Project Description The proposed project would develop 164 apartment units along Consolidation Avenue between Nevada Street and Puget Street. Figure 1 illustrates the site vicinity. The residential units would be marketed as student housing primarily for students attending Western Washington University (WWU). Access to the site would be via one driveway along Consolidation Avenue. Figure 2 shows the preliminary site plan.
Study Area and Approach The study area and approach are based on coordination with City staff. The analysis focuses on weekday PM peak period (4:00 to 6:00 p.m.) operations at nine study intersections. The study intersections include (see also Figure 1):
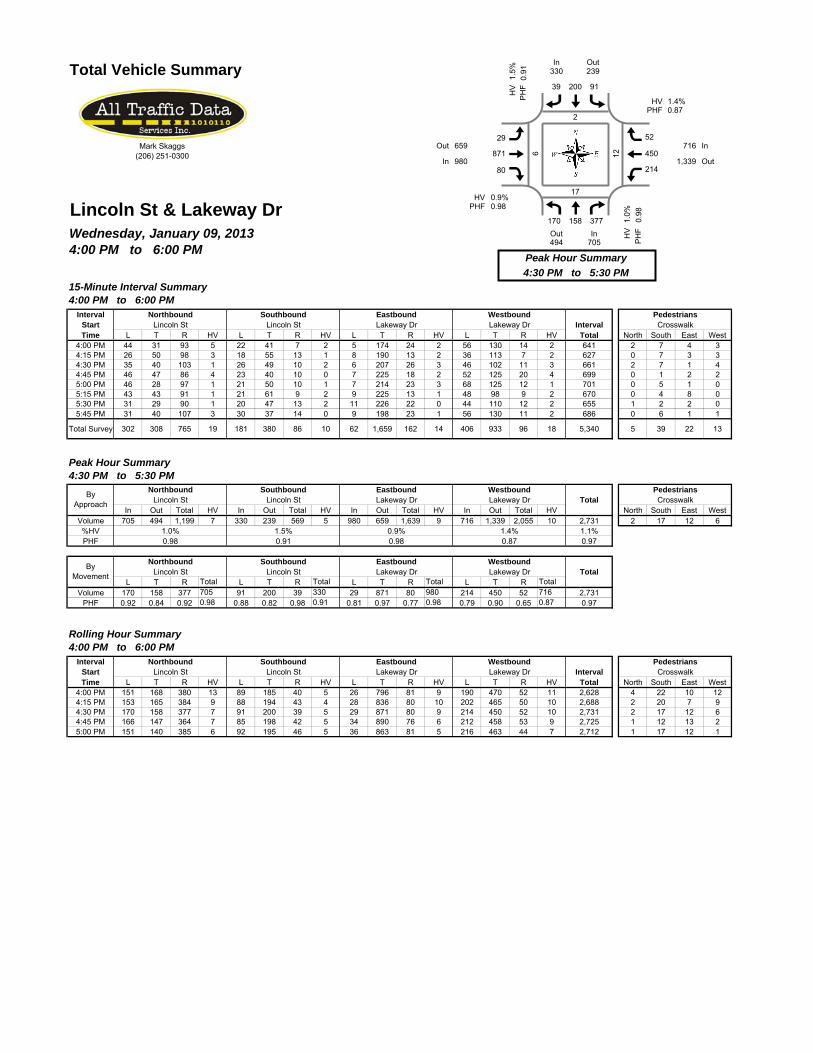
1. Lakeway Drive/Lincoln Street
2. Nevada Street/Lakeway Drive
3. East Maple Street/Lincoln Street
4. Ashley Avenue/Consolidation Avenue
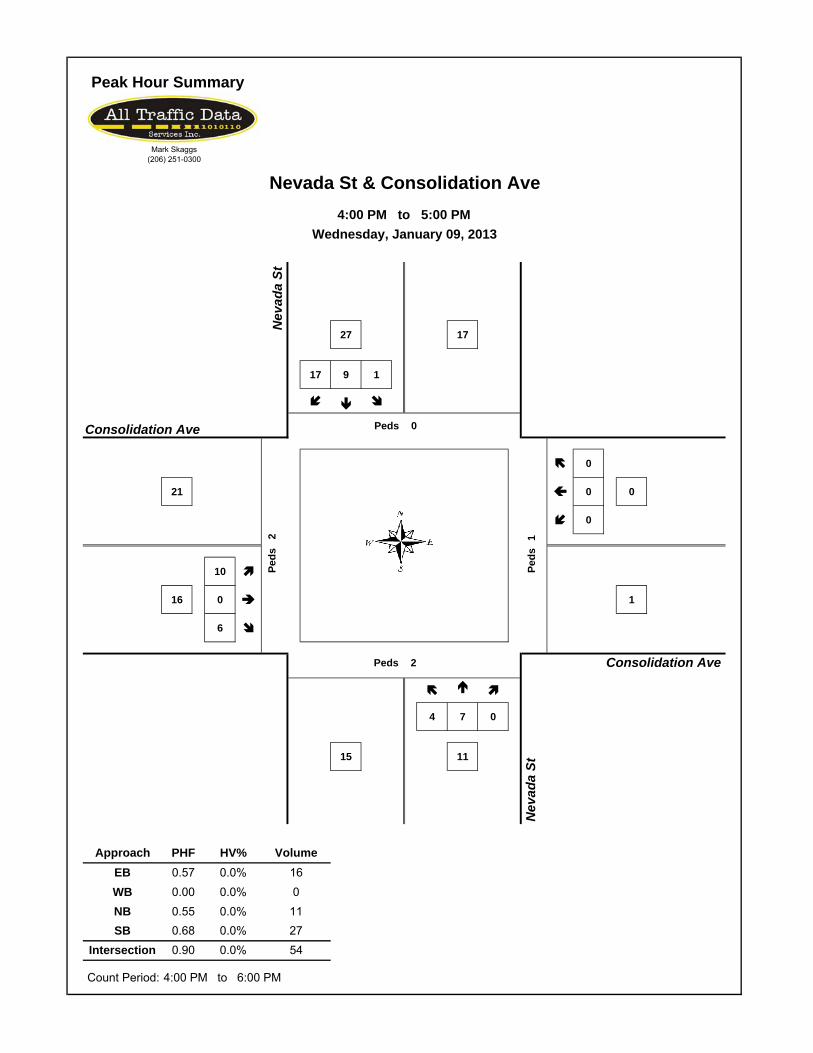
5. Nevada Street/Consolidation Avenue
6. I-5 Northbound (NB) On-Ramp/Lincoln Street
7. Samish Way/Bill McDonald Parkway/Byron Avenue
8. South Samish Way/36th Street/I-5 Southbound (SB) Off-Ramp
9. South Samish Way/Lincoln Street/Elwood Avenue The TIA describes conditions in the site vicinity including roadway network, existing and future (2014) weekday PM peak hour traffic volumes, traffic operations, traffic safety, non-motorized facilities, and transit. The future conditions with the project are evaluated by adding site-generated traffic to future baseline traffic volumes. Analysis of future conditions addresses cumulative impacts of the proposed project and traffic growth in the study area. Site-generated impacts are identified based on differences in transportation conditions between with and without the project.

I-en Cl z "' ('t)
UJ ....J ....J w
~ s: :r: en ~ <( en z
I-en :r: lo ..q-
m
I-en <( Cl
~ w z
.. N
NOTTO SCALE
I-en I-w (!) => Q.
AVE
Project Site Vicinity and Study Intersections FIGURE
University Ridge student Housing 1:3r. 1 Q:\J>rojects\11111167 Consolidation Ave Student Housing\Graphics\11167 _graphie02 <Sile Vicinity> stephanieg 04/09/1315:50 Ml transpOGROUP

• N NOTTO SCALE
ll
I , I s:i'
I I 211
I ._ UJ w ft U) --I-lU C> 18
::> . ~,
I
r Ill
Site Plan FIGURE
University Ridge Student Housing t:;Jr. 2 Q:'Aojedl\11\11161eond5donAveS\ldeltHoueln~hlcl\111e1~<SlleP1111>*Phari11C1GW911315:48 Ml transpoGROUP

Transportation Impact Analysis University Ridge Student Housing April 2013
Page 4
Chapter 2. Existing and Baseline Conditions
This section describes existing and future baseline (without-project) conditions within the study area. Characteristics are provided for the roadway network, non-motorized facilities, transit service, traffic volumes, traffic operations, and traffic safety.
Roadway Network The existing roadway characteristics in the proposed project vicinity are described in Table 1. The site is situated on the east end of Consolidation Avenue. As shown on Figures 1 and 2, Consolidation Avenue via Nevada Street or East Maple Street/Ashley Avenue provides primary access to the site and connects to the greater street system along Lincoln Street and Lakeway Drive. Sidewalk exists along Nevada Street from the site to north of Thimbleberry Pl. Traffic calming features such as traffic circles are installed along the roadway at Edwards Street and Orleans Street to reduce vehicle speeds and improve safety. Table 1. Study Area Existing Roadway Network Summary
Roadway Roadway ClassificationPosted
Speed LimitNumber of
Travel Lanes Parking? Sidewalks? Bicycle
Facilities?
I-5 State Highway 60 mph 4 No No No Lincoln Street Secondary Arterial 35 mph 5 No Yes Yes Lakeway Drive Principle Arterial 25 mph 5 No Yes No E Maple Street Local Access Road 25 mph 2 Yes Yes No Samish Way Secondary Arterial 35 mph 4 No Yes Yes Nevada Street Local Access Road 25 mph 2 Yes Yes No Ashley Avenue Local Access Road 25 mph 2 Yes Yes No Consolidation Avenue Local Access Road 25 mph 2 Yes Yes No Bill McDonald Parkway Secondary Arterial 25 mph 2 No Yes Yes 36th Street Secondary Arterial 25 mph 2 No No No Note: mph = miles per hour
Planned Roadway Improvements Based on a review of the City of Bellingham adopted Six-Year (2013-2018) Transportation Improvement Program, there are no planned improvements within the study area that would be completed by the 2014 horizon year. The Washington State Department of Transportation (WSDOT) projects were also reviewed. The I-5 Fairhaven to Slater Master Plan, November 2008 analyzes current and future traffic conditions on I-5 and recommends improvements to the interstate, interchanges, and connected local roads from Fairhaven Parkway (exit 250) to Slater Road (exit 260). This project recommends the following at the Samish Way interchange:
Relocate the Samish Way interchange north of existing location
Construct a collector/distributor road east and west of I-5 from Samish Way to Iowa Street
There is no funding for these improvements; therefore, the projects were not assumed in this transportation analysis. Completion of the I-5 improvements are anticipated to improve traffic operations and safety at the interchange.

Transportation Impact Analysis University Ridge Student Housing April 2013
Page 5
Non-Motorized Facilities The site is east of WWU and southeast of the central business district. Pedestrian facilities near the site include sidewalks along both sides of Lincoln Street and the north side of Consolidation Avenue and E Maple Street. The pedestrian pathway to the Lincoln Creek Park-and-Ride is well served by sidewalks and includes a cut-through from East Maple Street into the Park-and-Ride lot. Pedestrians would be better served at this location with a signed crosswalk. Crosswalks are provided at the signalized study intersections. Lincoln Street, Samish Parkway, and Bill McDonald Parkway have bicycle lanes on both sides of the road. These facilities allow for bicycle travel between the site and WWU.
Transit Service The project site is located is close proximity to the Lincoln Creek Park-and-Ride, which is served by Whatcom Transportation Authority (WTA) routes 80X, 90A&B, 190, and 196/197. These routes serve WWU, Downtown Bellingham, and Mt. Vernon. Route characteristics are summarized in Table 2. The Lincoln Creek Park-and-Ride is approximately a seven to eight minute1 walk from the project site; see the pedestrian path on the map below.
Ridership to WWU is primarily concentrated on Routes 190, 90 and 197, respectively. Route 190 and 90 have the highest number of boardings per revenue hour according to the 2012 WTA Performance Report.2
1 Travel time based on 4-feet per second from Manual on Uniform Traffic Control Devices. 2 Service Performance Report 2012, Whatcom Transit Authority.

Transportation Impact Analysis University Ridge Student Housing April 2013
Page 6
Table 2. Existing Transit Service
Approximate Weekday Operating
Hours
PM Peak Vehicle Trips
PM Peak Headways (minutes)
Routes Area Served
80X Mt. Vernon – Bellingham 6:45 AM – 7:00 PM 2 60
90 A&B Lincoln Creek Park-and-Ride – WWU 7:10 AM – 4:52 PM 5 30
190 Lincoln Creek Park-and-Ride - Downtown Bellingham (via WWU) – (BLUE Go Line)1
6:40 AM – 6:40 PM 9 30
196 WWU/Lincoln Creek Park-and-Ride – Lincoln Creek Park-and-Ride/Downtown Bellingham2
6:40 PM - 11:05 PM 0 30
197 Lincoln Creek Park-and-Ride/WWU – Downtown Bellingham2 7:40 PM – 10:05 PM 0 60
Total Trips 16 Source: Whatcom Transit Authority (January 2013). 1. The WTA GO Lines are corridors along which a bus will arrive every 15 minutes 2. These routes do not operate during the PM Peak Hour and facilitate evening travel
Route 80X functions as a weekday commuter route between Bellingham and Mount Vernon with 60 minute headways. There are two morning runs and two evening runs between WWU and the Lincoln Creek Park-and-Ride with a timed transfer to Route 80X. The morning trips leave Lincoln Creek Park-and-Ride at 7:23 a.m. and 8:23 a.m. and the evening trips leave WWU at 3:08 p.m. and 5:08 p.m. This route does not operate during the summer quarter or other times when WWU is not in session. Routes 90A&B provide service on weekdays with approximately 30-minute headways between the Lincoln Creek Park-and-Ride and WWU. The route follows Lincoln Street, Bill McDonald Parkway, Highland Drive, Indian Street, Potter Street, and Lakeway Drive. Route 90A travels counter-clockwise and does not stop at the Potter Street/Humboldt Street intersection, but stops at the WWU Recreation Center. Route 90B travels clockwise and stops at the Potter Street/Humboldt Street intersection and skips the WWU Recreation Center. Route 90A runs from 7:41 a.m. to 4:41 p.m. and 90B runs from 7:12 a.m. to 4:39 p.m. This route does not operate during the summer quarter or other times when WWU is not in session. Route 190 provides weekday service with 15 minute headways between Lincoln Creek Park-and-Ride and Downtown Bellingham via WWU. Route 190 is along the WTA Blue GO Line. The GO Line is WTA’s bus rapid transit service that provides 15-minute headways on weekdays along designated corridors. An additional eight bus trips are provided to and from Lincoln Creek Park-and-Ride during the PM peak hour to achieve 15-minute headways. Route 190 also provides Saturday service from 9:10 a.m. to 5:50 p.m. with 60-minute headways. Routes 196 and 197 provide weekday evening service. Route 196 travels counter-clockwise and provides 30-minute headways. Route 197 travels clockwise and provides 60-minute headways. Both routes travel from Downtown Bellingham Station to the Lincoln Creek Park-and-Ride via WWU. Route 196 provides Saturday service from 6:10 p.m. to 11:05 p.m. with 30-minute headways and Sunday service from 9:10 a.m. to 8:35 p.m. with 60-minute headways. Route 197 provides Saturday service from 6:40 p.m. to 10:05 p.m. with 60-minute headways and Sunday service from 8:40 a.m. to 8:05 p.m. with 60-minute headways.

Transportation Impact Analysis University Ridge Student Housing April 2013
Page 7
Traffic Volumes This transportation analysis focuses on the weekday PM peak hour when traffic volumes on the surrounding street system would be highest to capture a relative worst case condition. Existing weekday PM peak period (4:00 to 6:00 p.m.) turning movement counts at the study intersections were conducted in January 2013. The intersection traffic count worksheets are provided in Appendix A. Existing weekday PM peak hour traffic volumes are summarized on Figure 3 and were used to establish existing traffic conditions. The traffic counts show that intersections within the study area peak at different times during the 4:00 to 6:00 p.m. peak period. The analysis is based on the one hour peak of each individual intersection. A comparison of 2008 and 2013 traffic counts for study intersections shows that traffic volume growth has ranged from less than one to two percent per year. Future (2014) without-project traffic volumes were conservatively estimated by multiplying existing traffic volumes by two percent per year. In addition to the annual growth in traffic volumes, traffic from “pipeline” development or already approved projects in the study area was added to the background traffic volumes. The only pipeline project in the study area identified by the City is the 7-11 Convenience Market located on the northeast corner of the Samish Way/Bill McDonald Parkway intersection. This project would redevelop an old Blockbuster Video store into a 2,800 square-foot convenience market. Trip generation for the 7-11 Convenience Market was based on the currency application with no credit given for the Blockbuster Video since this building is vacant. The pipeline project trips were assigned to the study intersections based on existing travel patterns. Figure 4 illustrates 2014 without-project PM peak hour traffic volumes at the study intersections.

f7'\ LINCOLN ST \_V LAKEWAY DR
200
j!r 30) l_50
870- -450 80") (215
Jl~ ~NEVADAST \::!.)CONSOLIDATION AVE
10
10JJ ! ll 0 o- -o
5'1lrr0
5 0 5
(;;\ LINCOLN ST \.::!..) 1-6 ON-RAMP
405
J!
Jl 550
'7\ SAMISH WAY \.!...) BILL MCDONALD PKWY/BYRON ST
450
j!l: 260) l 10 15- -15
365") (20
Jf C 330
fa\ S SAMISH WAY \!!.) 36TH STn-O SB OFF-RAMP
630
:J! 100)
395")
Jl 330
l.210 -215
(175
(';:;\ NEVADA ST \=.;LAKEWAY DR
1,256- -155 60") (35 Ir 25 55
® LINCOLN ST S SAMISH WAY/ELWOOD AVE
115
:J!l 820) l 10 75- -30
305'11 r(5
240 5 260
(;;\ LINCOLN ST \VEMAPLEST
355
5)j ! ll5o 5- -5 5") (40
llC
LEGEND
- =ROADWAY
- = FUTURE ROADWAY
f7\ ASHLEY AVE ~CONSOLIDATION AVE
30
! ll.35
(15
f ( 20
NOTTO SCALE
Existing (2013) Weekday PM Peak Hour Traffic Volumes FIGURE
University Ridge Student Housing i:;"lr. 3 Q:\Projects\11\11167 Consdidation Ave student Housing\Graphics\ 11167 _graphic02 <Existing Vol> staphanieg 04/09113 15:29 Ill transpOGROUP

f7'\ LINCOLN ST \_V LAKEWAY DR
205
j!r 30) l_50 ees- -460 80") (220
:JlC ~NEVADAST \::!.)CONSOLIDATION AVE 10
(';:;\ NEVADA ST \=.;LAKEWAY DR
1,200- -no 60") (35 Ir 25 55
(;;\ LINCOLN ST \VEMAPLEST
360
5)j ! ll5o s- -5 5") (45
llC
f7\ ASHLEY AVE ~CONSOLIDATION AVE
30
! ll.35
(15
f ( 20
10JJ!llo NOTTO SCALE
o- -o
5")lf r(O 5 0
5
(;;\ LINCOLN ST \.::!..) 1-6 ON-RAMP
415
J!
Jl 565
'7\ SAMISH WAY \.!...) BILL MCDONALD PKWY/BYRON ST
460
j!l: 270) l 10 20- -20
370") (35
Jf C 350
fa\ S SAMISH WAY \!!.) 36TH STn-O SB OFF-RAMP
650
J! 110) l.215
-220 (180
® LINCOLN ST S SAMISH WAY/ELWOOD AVE
115
:J!l 840) l 10 eo- -35
315") (5
Jtr 265
LEGEND
- =ROADWAY
- = FUTURE ROADWAY
Future (2014) Without-Project PM Peak Hour Traffic Volumes University Ridge Student Housing
Q:\Projects\11\11167 Consolidation Ave Student Housing\Graphics\11167 ~raphic02 <Baseline Vol> stephanieg 04/09/1315:28 'jftranspOGROUP
FIGURE
4

Transportation Impact Analysis University Ridge Student Housing April 2013
Page 10
Traffic Operations The operational characteristics of an intersection are evaluated by determining the intersection’s level of service (LOS). The intersection as a whole, and its individual turning movements, can be described alphabetically with a range of levels of service (LOS A to F). LOS A indicates free-flow traffic and LOS F indicates extreme congestion and long vehicle delays. LOS is measured in average control delay per vehicle and is typically reported for the intersection as a whole at signalized intersections. Control delay is defined as the combination of initial deceleration delay, queue move-up time, stopped delay, and final acceleration delay. At two-way stop-controlled intersections, LOS is measured in average stopped delay per vehicles for the worst movement of the intersection. A more detailed explanation of LOS is provided in Appendix B. Existing and future without-project LOS and delays were calculated at study intersections based on the methods contained in the 2000 Highway Capacity Manual (HCM). The software program Synchro 8 was used to evaluate intersection operations. Table 3 shows the weekday PM peak hour existing and without project operations. Detailed intersection LOS worksheets are contained in Appendix C. The City of Bellingham’s has a LOS E standard. WSDOT’s has a LOS D standard for the I-5 ramp intersections. As shown in the table, all study intersections operate at LOS D or better. With growth in traffic volumes by 2014, all study intersections would continue to operate at LOS D or better. Table 3. Existing and Future Weekday PM Peak Hour Intersection Operations
Traffic 2013 Existing 2014 Without-Project
Intersection Control LOS1 Delay2V/C3 or
WM4 LOS Delay V/C or
WM
1. Lincoln Street/Lakeway Drive Signal C 31 0.73 C 34 0.74
2. Nevada Street/Lakeway Drive Side-Street Stop B 13 NBL B 14 NBL
3. Lincoln Street/E Maple Street Side-Street Stop C 15 WB C 16 WB
4. Ashley Avenue/Consolidation Avenue Side-Street Stop A 9 WB A 9 WB
5. Nevada Street/Consolidation Avenue All-Way Stop A 7 NA A 7 NA
6. I-5 NB On-Ramp/Lincoln Street Free B 13 NBL B 13 NBL
7. Samish Way/Bill McDonald Parkway Signal B 19 0.62 C 20 0.64
8. South Samish Way/I-5 SB Off-Ramp Signal D 36 0.67 D 37 0.69
9. South Samish Way/Lincoln Street Signal D 49 0.82 D 52 0.85
1. LOS as defined by the HCM (TRB, 2000) 2. Average delay per vehicle in seconds. 3. Volume-to-capacity (V/C) ratio reported for signalized intersections. 4. Worst movement (WM) reported for side-street stop controlled intersections. NB = northbound approach; WB = westbound
approach; NBL = northbound left-turn movement. This is not applicable (NA) for all-stop controlled intersections.
The 95th-percentile vehicle queues were reviewed to determine if any queues currently are longer than available storage space. The review shows that the existing storage is sufficient at all intersections except the South Samish Way/Lincoln Street intersection. The 95th-percentile queue for the southbound right-turn movement at this location is approximately 520-feet, which exceeds the 200-foot turn pocket. With anticipated future growth in the study area, the South Samish Way/Lincoln Street southbound right-turn queue is anticipated to increase to 550-feet, which approaches the I-5 northbound on-ramp along Lincoln Street.

Transportation Impact Analysis University Ridge Student Housing April 2013
Page 11
Traffic Safety Collision records at the study intersections were reviewed to help identify existing traffic safety issues. The most recent three-year period of collision data provided by the WSDOT is for January 1, 2009 to December 31, 2011. Table 4 provides a summary of the total and average annual number of reported collisions as well as the collision rate for each study intersection. The annual average of collisions is generally low and does not pose significant safety issues. Table 4. Study Intersection Collision Data Summary
Total by Year Annual
Average Intersection 2009 2010 2011
1. Lincoln Street/Lakeway Drive 1 1 2 1.00
2. Nevada Street/Lakeway Drive 0 0 1 0.25
3. Lincoln Street/E Maple Street 1 0 0 0.25
4. Ashley Avenue/Consolidation Avenue 1 2 0 0.75
5. Nevada Street/Consolidation Avenue 0 0 0 0.00
6. I-5 NB On-Ramp/Lincoln Street 2 2 5 2.50
7. Samish Way/Bill McDonald Parkway 8 4 4 5.33
8. South Samish Way/I-5 SB Off-ramp 4 5 5 4.50
9. South Samish Way/Lincoln Street 0 4 2 1.50
1. MEV = Million entering vehicles.

Transportation Impact Analysis University Ridge Student Housing April 2013
Page 12
Chapter 3. Project Impacts
This section of the report documents potential transportation impacts generated by the proposed project on the surrounding street network and at study intersections. First, estimated traffic volumes generated by the proposed site are distributed and assigned to adjacent streets system. Next, project trips are added to future without-project traffic volumes and any potential impacts to traffic operations, safety, non-motorized facilities, and transit are identified. Site access operations are also discussed.
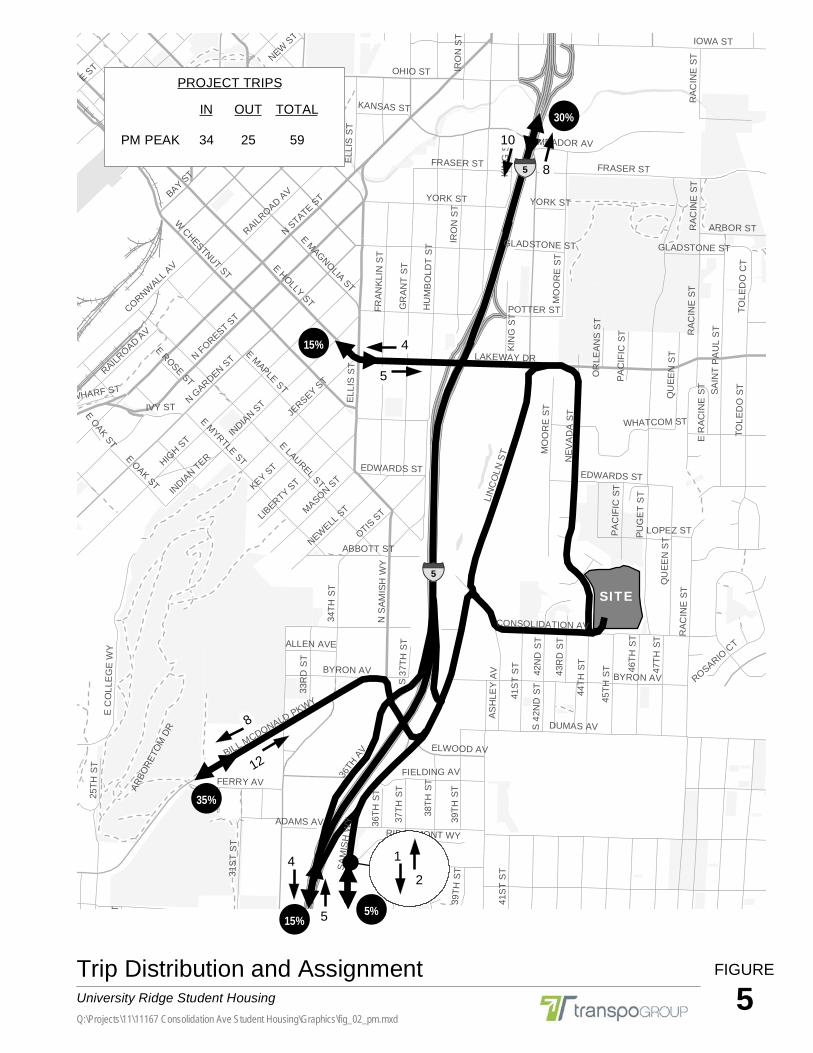
Trip Generation Trip generation was calculated based on the average trip rate for a standard mid-rise apartment (LU #223) from the Institute of Transportation Engineers (ITE) Trip Generation, 9th Edition. The trip generation was also reduced by 7 percent to account for the site being in close proximity to the Lincoln Creek Park-and-Ride. This is a conservative approach as the residential units will be marketed as student housing primarily for students attending WWU. It is anticipated that the actual project will generate fewer vehicular trips than typical apartments and what is accounted for in this analysis because the student population is more likely to utilize transit, bike, or other non-vehicular modes of travel during the PM peak period. This is driven by class schedules often end prior to the PM peak commute period, all WWU students are provided Whatcom Transportation Authority (WTA) bus passes and parking fees on the WWU campus are high. In addition, trip generation during summer months is anticipated to be lower given that school will not be in session, which is not accounted for in this analysis. The Lincoln Creek Park-and-Ride is within a 10-minute walk from the proposed student apartments. The WTA’s bus rapid transit (Go Line) provides service between the Lincoln Creek Park-and-Ride and WWU. Table 5 summarizes the trip generation estimates for the proposed project. The proposed project would generate 640 daily trips with 59 auto trips during the weekday PM peak hour. Table 5. Estimated Project Trip Generation
Project Trips
Apartment (LU #223) Size Rate1 In Out Total
Daily3 Total Trips 164 units 4.18 345 345 690 7% Reduction for Proximity to Frequent Transit2 -25 -25 -50 Total Net New Trips 320 320 640 Weekday PM Peak hour Total Trips 164 units 0.39 37 27 64 7% Reduction for Proximity to Frequent Transit2 -3 -2 -5
Total Net New Trips 34 25 59
1. Trips rates from ITE Trip Generation, 9th Edition. 2. Consistent with the City of Bellingham Multimodal Transportation Concurrency, a 7 percent reduction in trip generation was taken
to account for proximity to the WTA GO (high frequency route). 3. The daily rate for LU223 was calculated using the PM peak hour ratio of LU223, mid-rise apartment to LU220, apartment.

Transportation Impact Analysis University Ridge Student Housing April 2013
Page 13
Trip Distribution and Assignment Vehicular trip distribution for this project is based on existing travel patterns in the study area, previous traffic studies in the area, and routes to and from WWU. Figure 5 illustrates the project trip distribution during the PM peak period. As shown on the figure, 35 percent of weekday PM peak hour site vehicular traffic is anticipated to travel to and from WWU via Bill McDonald Parkway, 45 percent to and from I-5, 15 percent to and from Downtown, and 5 percent south of the site along Samish Way. Net new project trips for the study period were assigned to the study intersections based on the travel patterns. The resulting trip assignment is shown on Figure 5. The project trips were added to the Future 2014 without project traffic volumes to form the basis of the traffic impact analysis. Figure 6 shows the 2014 with-project traffic volumes at the study intersections.
Traffic Operations Future 2014 with-project study intersection operations were evaluated for the weekday PM peak hour. Intersection LOS was calculated using the method described previously. The without-project conditions are compared to the with-project conditions to understand the proposal traffic impacts. Table 6 summarizes the 2014 without- and with-project intersection operations. LOS worksheets are included in Appendix C. Table 6. Future Weekday PM Peak Hour Intersection Operations
Traffic 2014 Without-Project 2014 With-Project
Intersection Control LOS1 Delay2V/C3 or
WM4 LOS Delay V/C or
WM
1. Lincoln Street/Lakeway Drive Signal C 34 0.74 C 32 0.74
2. Nevada Street/Lakeway Drive Side-Street Stop B 14 NBL B 14 NBL
3. Lincoln Street/E Maple Street Side-Street Stop C 16 WB C 17 WB
4. Ashley Avenue/Consolidation Avenue Side-Street Stop A 9 WB A 9 WB
5. Nevada Street/Consolidation Avenue All-Way Stop A 7 NA A 7 NA
6. I-5 NB On-Ramp/Lincoln Street Free B 13 NBL B 13 NBL
7. Samish Way/Bill McDonald Parkway Signal C 20 0.64 C 20 0.64
8. South Samish Way/I-5 SB Off-Ramp Signal D 37 0.69 D 38 0..70
9. South Samish Way/Lincoln Street Signal D 52 0.85 D 55 0.86
1. LOS as defined by the HCM (TRB, 2000) 2. Average delay per vehicle in seconds. 3. Volume-to-capacity (V/C) ratio reported for signalized intersections. 4. Worst movement (WM) reported for side-street stop controlled intersections. NB = northbound approach; WB = westbound
approach; NBL = northbound left-turn movement.
With the proposed project, all of the study intersections will continue to operate at LOS D or better and operate at a similar LOS as without project conditions. The 95th-percentile vehicle queues were reviewed to determine if the project would result in queues longer than available storage space. Similar to the existing and future without-project conditions, the South Samish Way/Lincoln Street southbound right-turn queue would exceed storage. The 95th-percentile queue would be approximately 570-feet for the southbound right-turn movement. Like the without-project conditions, this means that there is a five percent chance that during the weekday PM peak hour the southbound right-turning traffic from the South Samish Way/Lincoln Street intersection would block the northbound I-5 on-ramp along Lincoln Street. The average or 50th percentile queue is approximately 340-feet; therefore, on average queues are not anticipated to block the northbound on-ramp. As discussed previously, this is an existing condition and the City is aware of this congestion.
SITE
LAKEWAY DR
C ST
N STATE S
T
CORNWALL A
V
HIGH S
T
IOWA ST
LIN
CO
LN S
T
PUG
ET
ST
N GARDEN S
T
E MAPLE ST
GR
ANT
ST
HU
MB
OLD
T ST
FRASER ST
E LAUREL ST
OHIO ST
W HOLLY ST
INDIA
N ST
IRO
N S
T
NEV
AD
A ST
MEADOR AV
HALLECK ST
DUMAS AV
FRAN
KLIN
ST
N FOREST ST
KEY ST
BILL MCDONALD PKWY
31S
T S
T
41S
T S
T
CENTRAL AV
SAIN
T P
AU
L S
T
MO
OR
E ST
DUPONT ST
E HOLLY ST
TOLE
DO
ST
E MYRTLE ST
ARBO
RETO
M D
R
JERSEY S
T
QU
EEN
STOTIS
ST
ASH
LEY
AV
RAC
INE
ST
E C
OLL
EG
E W
Y
GR
AND
AV
BYRON AV
NEWELL
ST
LIBERTY S
T
ELLI
S S
T
MASON ST
FLORA ST
38TH
ST
36TH
AV
IVY ST
ABBOTT ST
CLINTON ST
E MAGNOLIA ST
BAY ST
FERRY AV
WHATCOM ST
W C
AMPU
S W
Y
ELLSWORTH ST
N S
AMIS
H W
Y
POTTER ST
E OAK ST
RAILROAD A
V
WHARF ST
LOTTIE ST
RIDGEMONT WY
PRO
SPE
CT
ST
W CHAMPION ST
INDIA
N TER
PAC
IFIC
ST
W CHESTNUT ST
25TH
ST
TOLE
DO
CT
UN
ITY S
T
ELWOOD AV
FIELDING AV
CONSOLIDATION AV
S 42
ND
ST
KANSAS ST
NEW S
T
ALLEN AVE
GLADSTONE ST
E R
ACIN
E ST
ADAMS AV
S 37
TH S
T
E ROSE ST
ROSARIO C
T
31S
T P
L
WILDFLO
WER
CT
39TH
PL
26TH
ST
39TH
ST
VER
ON
A S
T
36TH
ST
39TH
ST
TAYLOR AV
PAC
IFIC
ST
YORK ST
43R
D S
T
EDWARDS STIR
ON
ST
KIN
G S
T
44TH
ST
FRASER ST
OR
LEAN
S S
T
YORK ST
UN
DIN
E S
T
34TH
ST
DEA
N A
V
TAYLOR AV
RAILROAD A
V
RAC
INE
ST
QU
EEN
ST
BYRON AV
E ST
42N
D S
T
ARBOR ST
E OAK ST
37TH
ST
LOPEZ ST
45TH
ST 46
TH S
T
RAC
INE
ST
KIN
G S
T
ELLI
S S
T
EDWARDS ST
47TH
ST
SAM
ISH
WY
N FOREST ST
41S
T S
T
RAC
INE
ST
GLADSTONE ST
33R
D S
T
MO
OR
E ST
B ST
Trip Distribution and AssignmentUniversity Ridge Student HousingQ:\Projects\11\11167 Consolidation Ave Student Housing\Graphics\fig_02_pm.mxd
FIGURE
5
§̈¦5
§̈¦5
¬·30%
¬·15%
¬·35%
¬·15% ¬·5%
PROJECT TRIPS
PM PEAK 34
4
5
5
4
12
8
1
2
10
8
!
IN
25
OUT
59
TOTAL

f7'\ LINCOLN ST \_V LAKEWAY DR
205
j!r 30) lso eee- -464 82") (220
:JlC ~NEVADAST \::!.)CONSOLIDATION AVE
10 10JJ!ll_4 31- -21
5'1trr0 5 0
5
(;;\ LINCOLN ST \.::!..) 1-6 ON-RAMP
428
j!
Jf 594
'7\ SAMISH WAY \.!...) BILL MCDONALD PKWY/BYRON ST
460
j!l: 210) l 10 20- -20
382") (35
:He 350
fa\ S SAMISH WAY \!!.) 36TH STn-O SB OFF-RAMP
662
J! 110) l.215
-220 (190
(';:;\ NEVADA ST \=.;LAKEWAY DR
1,2&0- -no 63") (35
Ir 29 55
(;;\ LINCOLN ST \VEMAPLEST
360
s)j ! cl.so s- -s 5") (66
llC
® LINCOLN ST ~SITE ACCESS S SAMISH WAY/ELWOOD AVE ~CONSOLIDATION AVE
f7\ ASHLEY AVE ~CONSOLIDATION AVE
30
! ll.56
(15
f ( 20
LEGEND
- =ROADWAY
• N NOTTO SCALE
- = FlffiJRE ROADWAY
Future (2014) With-Project PM Peak Hour Traffic Volumes FIGURE
University Ridge Student Housing i:;"lr. Q:\Projects\11111167 Consolidation Ave Student Housing\Graphics\11167 ~raphic02 <With-Project Vol> stsphanieg 04/0911315:28 Ill transpOGROUP
6

Transportation Impact Analysis University Ridge Student Housing April 2013
Page 16
Site Access Evaluation Access is proposed along Consolidation Avenue on the southern property line. The driveway is approximately 20-feet east of the Nevada Street/Consolidation Avenue intersection. The site driveway will operate at LOS A during the PM peak hour, with eight seconds of delay. With minimal queues, no conflicts are anticipated between the proposed driveway and the Consolidation Avenue/Nevada Street intersection, and the proposed spacing would be adequate.

Transportation Impact Analysis University Ridge Student Housing April 2013
Page 17
Chapter 4. Summary and Mitigation
As shown in the previous sections, all study intersections would meet the operational standards defined by both the City of Bellingham and WSDOT. Based on this, no adverse transportation impacts are anticipated. The project would be required to pay the City’s Traffic Impact Fee. The current fee is $1,925 per PM peak hour trip, which results in a preliminary estimate of $113,575. Additional reductions in traffic impact fees are considered by the City based on proximity to transit and other transportation demand management elements that typically reduce the amount of traffic generated by a development. Given that the project will be marketed as student housing with all WWU students having bus passes, reductions up to 50 percent are anticipated to account for the close proximity to high frequency transit. The final impact fee will be calculated and approved by the City.

Appendix A: Traffic Counts

Peak Hour Summary
4:30 PM to 5:30 PM
Wednesday, January 09, 2013
421 1071
299 115 7
8
0 567 29 40 0
3
803
0 1177 76 85 0
298
239 260 2
416 501
Count Period: 4:00 PM to 6:00 PM
South Samish Way
South Samish Way
Approach HV%PHF Volume
Lin
co
ln S
t
0
SB 0.90 1.7%Intersection 0.94 1.0%
4212,139
NB 0.91 0.6% 501
EB 0.92 0.9%
0
0 0
Lincoln St & South Samish Way
Lin
co
ln S
t
1,17740WB 0.67 2.5%
2Peds
Ped
s1
Mark Skaggs(206) 251-0300
3Peds
Ped
s5

Total Vehicle Summary
Lincoln St & South Samish Way
4:00 PM to 6:00 PM
15-Minute Interval Summary4:00 PM to 6:00 PM
Interval Northbound Southbound Eastbound Westbound PedestriansStart Lincoln St Lincoln St South Samish Way South Samish Way Interval CrosswalkTime L T R HV L T R HV L T R HV L T R HV Total North South East West
4:00 PM 44 51 0 0 0 21 63 1 214 16 72 5 0 5 1 0 487 2 0 0 14:15 PM 46 60 0 1 3 23 52 1 199 9 70 3 0 4 3 0 469 0 1 1 14:30 PM 55 65 1 0 1 28 79 4 216 15 62 2 1 4 0 0 527 1 0 1 14:45 PM 63 54 1 2 3 26 67 1 169 21 70 4 1 6 2 1 483 0 1 1 05:00 PM 56 82 0 1 2 37 78 1 211 19 74 3 0 8 3 0 570 0 0 1 05:15 PM 65 59 0 0 1 24 75 1 207 21 92 2 1 11 3 0 559 1 2 2 05:30 PM 51 42 0 0 3 19 66 3 203 20 71 2 0 9 4 0 488 0 0 0 05:45 PM 56 52 2 1 2 11 71 0 158 16 60 2 0 10 5 0 443 4 1 0 3
Total Survey 436 465 4 5 15 189 551 12 1,577 137 571 23 3 57 21 1 4,026 8 5 6 6
Peak Hour Summary4:30 PM to 5:30 PM
Northbound Southbound Eastbound Westbound PedestriansLincoln St Lincoln St South Samish Way South Samish Way Total Crosswalk
In Out Total HV In Out Total HV In Out Total HV In Out Total HV North South East WestVolume 501 416 917 3 421 1,071 1,492 7 1,177 567 1,744 11 40 85 125 1 2,139 2 3 5 1%HV 0.6% 1.7% 0.9% 2.5% 1.0%PHF 0.91 0.90 0.92 0.67 0.94
Northbound Southbound Eastbound WestboundLincoln St Lincoln St South Samish Way South Samish Way Total
L T R L T R L T R L T RVolume 239 260 2 7 115 299 803 76 298 3 29 8 2,139
PHF 0.92 0.79 0.50 0.58 0.78 0.95 0.93 0.90 0.81 0.75 0.66 0.67 0.94
Rolling Hour Summary4:00 PM to 6:00 PM
Interval Northbound Southbound Eastbound Westbound PedestriansStart Lincoln St Lincoln St South Samish Way South Samish Way Interval CrosswalkTime L T R HV L T R HV L T R HV L T R HV Total North South East West
4:00 PM 208 230 2 3 7 98 261 7 798 61 274 14 2 19 6 1 1,966 3 2 3 34:15 PM 220 261 2 4 9 114 276 7 795 64 276 12 2 22 8 1 2,049 1 2 4 24:30 PM 239 260 2 3 7 115 299 7 803 76 298 11 3 29 8 1 2,139 2 3 5 14:45 PM 235 237 1 3 9 106 286 6 790 81 307 11 2 34 12 1 2,100 1 3 4 05:00 PM 228 235 2 2 8 91 290 5 779 76 297 9 1 38 15 0 2,060 5 3 3 3
5010.91 0.67
400.921,177
0.90421
Wednesday, January 09, 2013
By Movement
By Approach
Total TotalTotalTotal
Mark Skaggs(206) 251-0300
803
76
298
8
29
3
2239
115 7299
2
3
1 5
260
501416InOut
1,071421OutIn
1,177In
567Out
Out85
In40
0.91
PH
F 0.
6%H
V
0.67PHF 2.5%HV
0.92PHF 0.9%HV
0.90
PH
F 1.
7%H
V
Peak Hour Summary
4:30 PM to 5:30 PM

Peak Hour Summary
4:30 PM to 5:30 PM
Wednesday, January 09, 2013
837 633
205 632 0
211
0 662 217 602 0
174
97
0 494 0 0 0
397
240 325 0
1203 565
Count Period: 4:00 PM to 6:00 PM
36th St
36th St
Approach HV%PHF Volume
So
uth
Sa
mis
h
Wa
y
0
SB 0.91 1.7%Intersection 0.93 0.9%
8372,498
NB 0.91 0.7% 565
EB 0.92 0.8%
0
0 0
South Samish Way & 36th St
So
uth
Sa
mis
h W
ay
494602WB 0.92 0.2%
0Peds
Ped
s5
Mark Skaggs(206) 251-0300
1Peds
Ped
s0

Total Vehicle Summary
South Samish Way & 36th St
4:00 PM to 6:00 PM
15-Minute Interval Summary4:00 PM to 6:00 PM
Interval Northbound Southbound Eastbound Westbound PedestriansStart South Samish Way South Samish Way 36th St 36th St Interval CrosswalkTime L T R HV L T R HV L T R HV L T R HV Total North South East West
4:00 PM 49 65 0 1 0 178 53 4 23 0 83 2 39 55 56 1 601 0 0 0 44:15 PM 44 57 0 2 0 135 48 1 19 0 89 2 44 38 59 3 533 0 1 1 34:30 PM 46 84 0 2 0 165 62 3 26 0 108 2 38 41 51 0 621 0 0 0 14:45 PM 63 73 0 0 0 139 35 3 29 0 80 0 45 59 53 1 576 0 1 0 15:00 PM 59 84 0 1 0 150 56 4 18 0 112 1 44 53 55 0 631 0 0 0 15:15 PM 72 84 0 1 0 178 52 4 24 0 97 1 47 64 52 0 670 0 0 0 25:30 PM 45 77 0 2 0 148 56 2 25 0 83 1 50 39 53 2 576 0 0 0 05:45 PM 50 96 0 0 0 132 46 2 21 0 71 0 29 49 44 0 538 0 0 0 0
Total Survey 428 620 0 9 0 1,225 408 23 185 0 723 9 336 398 423 7 4,746 0 2 1 12
Peak Hour Summary4:30 PM to 5:30 PM
Northbound Southbound Eastbound Westbound PedestriansSouth Samish Way South Samish Way 36th St 36th St Total Crosswalk
In Out Total HV In Out Total HV In Out Total HV In Out Total HV North South East WestVolume 565 1,203 1,768 4 837 633 1,470 14 494 662 1,156 4 602 0 602 1 2,498 0 1 0 5%HV 0.7% 1.7% 0.8% 0.2% 0.9%PHF 0.91 0.91 0.92 0.92 0.93
Northbound Southbound Eastbound WestboundSouth Samish Way South Samish Way 36th St 36th St Total
L T R L T R L T R L T RVolume 240 325 0 0 632 205 97 0 397 174 217 211 2,498
PHF 0.83 0.97 0.00 0.00 0.89 0.83 0.84 0.00 0.89 0.93 0.85 0.96 0.93
Rolling Hour Summary4:00 PM to 6:00 PM
Interval Northbound Southbound Eastbound Westbound PedestriansStart South Samish Way South Samish Way 36th St 36th St Interval CrosswalkTime L T R HV L T R HV L T R HV L T R HV Total North South East West
4:00 PM 202 279 0 5 0 617 198 11 97 0 360 6 166 193 219 5 2,331 0 2 1 94:15 PM 212 298 0 5 0 589 201 11 92 0 389 5 171 191 218 4 2,361 0 2 1 64:30 PM 240 325 0 4 0 632 205 14 97 0 397 4 174 217 211 1 2,498 0 1 0 54:45 PM 239 318 0 4 0 615 199 13 96 0 372 3 186 215 213 3 2,453 0 1 0 45:00 PM 226 341 0 4 0 608 210 12 88 0 363 3 170 205 204 2 2,415 0 0 0 3
5650.91 0.92
6020.92494
0.91837
Wednesday, January 09, 2013
By Movement
By Approach
Total TotalTotalTotal
Mark Skaggs(206) 251-0300
97
0
397
211
217
174
0240
632 0205
0
1
5 0
325
5651,203InOut
633837OutIn
494In
662Out
Out0
In602
0.91
PH
F 0.
7%H
V
0.92PHF 0.2%HV
0.92PHF 0.8%HV
0.91
PH
F 1.
7%H
V
Peak Hour Summary
4:30 PM to 5:30 PM

Peak Hour Summary
4:30 PM to 5:30 PM
Wednesday, January 09, 2013
759 598
298 446 15
8
0 593 15 41 0
18
260
0 634 13 57 0
361
280 330 29
825 639
Count Period: 4:00 PM to 6:00 PM
Bill Mcdonald Pkwy
Bill Mcdonald Pkwy
Approach HV%PHF Volume
So
uth
Sa
mis
h
Wa
y
0
SB 0.90 1.1%Intersection 0.97 1.5%
7592,073
NB 0.99 1.1% 639
EB 0.93 2.1%
0
0 0
South Samish Way & Bill Mcdonald Pkwy
So
uth
Sa
mis
h W
ay
63441WB 0.73 7.3%
12Peds
Ped
s36
Mark Skaggs(206) 251-0300
0Peds
Ped
s5

Total Vehicle Summary
South Samish Way & Bill Mcdonald Pkwy
4:00 PM to 6:00 PM
15-Minute Interval Summary4:00 PM to 6:00 PM
Interval Northbound Southbound Eastbound Westbound PedestriansStart South Samish Way South Samish Way Bill Mcdonald Pkwy Bill Mcdonald Pkwy Interval CrosswalkTime L T R HV L T R HV L T R HV L T R HV Total North South East West
4:00 PM 68 85 3 2 4 112 65 1 60 2 124 4 0 3 3 0 529 0 0 0 134:15 PM 59 66 3 3 4 86 62 1 63 1 111 2 3 1 5 0 464 11 0 5 174:30 PM 81 71 10 3 3 99 83 1 66 6 98 4 6 3 2 1 528 6 0 4 154:45 PM 62 92 5 1 1 88 72 3 66 3 85 3 6 6 2 1 488 3 0 0 75:00 PM 74 79 4 3 7 128 68 1 61 1 94 4 3 4 2 1 525 3 0 0 95:15 PM 63 88 10 0 4 131 75 3 67 3 84 2 3 2 2 0 532 0 0 1 55:30 PM 70 83 8 2 3 111 76 0 66 0 86 2 3 2 5 0 513 1 0 0 75:45 PM 70 82 11 0 2 80 68 0 58 3 86 2 5 4 5 0 474 1 0 0 5
Total Survey 547 646 54 14 28 835 569 10 507 19 768 23 29 25 26 3 4,053 25 0 10 78
Peak Hour Summary4:30 PM to 5:30 PM
Northbound Southbound Eastbound Westbound PedestriansSouth Samish Way South Samish Way Bill Mcdonald Pkwy Bill Mcdonald Pkwy Total Crosswalk
In Out Total HV In Out Total HV In Out Total HV In Out Total HV North South East WestVolume 639 825 1,464 7 759 598 1,357 8 634 593 1,227 13 41 57 98 3 2,073 12 0 5 36%HV 1.1% 1.1% 2.1% 7.3% 1.5%PHF 0.99 0.90 0.93 0.73 0.97
Northbound Southbound Eastbound WestboundSouth Samish Way South Samish Way Bill Mcdonald Pkwy Bill Mcdonald Pkwy Total
L T R L T R L T R L T RVolume 280 330 29 15 446 298 260 13 361 18 15 8 2,073
PHF 0.86 0.90 0.73 0.54 0.85 0.90 0.97 0.54 0.92 0.75 0.63 1.00 0.97
Rolling Hour Summary4:00 PM to 6:00 PM
Interval Northbound Southbound Eastbound Westbound PedestriansStart South Samish Way South Samish Way Bill Mcdonald Pkwy Bill Mcdonald Pkwy Interval CrosswalkTime L T R HV L T R HV L T R HV L T R HV Total North South East West
4:00 PM 270 314 21 9 12 385 282 6 255 12 418 13 15 13 12 2 2,009 20 0 9 524:15 PM 276 308 22 10 15 401 285 6 256 11 388 13 18 14 11 3 2,005 23 0 9 484:30 PM 280 330 29 7 15 446 298 8 260 13 361 13 18 15 8 3 2,073 12 0 5 364:45 PM 269 342 27 6 15 458 291 7 260 7 349 11 15 14 11 2 2,058 7 0 1 285:00 PM 277 332 33 5 16 450 287 4 252 7 350 10 14 12 14 1 2,044 5 0 1 26
6390.99 0.73
410.93634
0.90759
Wednesday, January 09, 2013
By Movement
By Approach
Total TotalTotalTotal
Mark Skaggs(206) 251-0300
260
13
361
8
15
18
29280
446 15298
12
0
36 5
330
639825InOut
598759OutIn
634In
593Out
Out57
In41
0.99
PH
F 1.
1%H
V
0.73PHF 7.3%HV
0.93PHF 2.1%HV
0.90
PH
F 1.
1%H
V
Peak Hour Summary
4:30 PM to 5:30 PM

Peak Hour Summary
4:30 PM to 5:30 PM
Wednesday, January 09, 2013
473 551
70 403
0 600 0
0
0 0 0
0
530 551
403 1081
Count Period: 4:00 PM to 6:00 PM
I-5 NB On Ramp
Approach HV%PHF Volume
Lin
co
ln S
t
0
SB 0.93 1.7%Intersection 0.92 1.4%
4731,554
NB 0.91 1.2% 1,081
EB 0.00 0.0%
0
0 0
Lincoln St & I-5 NB On Ramp
Lin
co
ln S
t
00WB 0.00 0.0%
0Peds
Ped
s2
Mark Skaggs(206) 251-0300
0Peds
Ped
s0

Total Vehicle Summary
Lincoln St & I-5 NB On Ramp
4:00 PM to 6:00 PM
15-Minute Interval Summary4:00 PM to 6:00 PM
Interval Northbound Southbound Eastbound Westbound PedestriansStart Lincoln St Lincoln St I-5 NB On Ramp I-5 NB On Ramp Interval CrosswalkTime L T HV T R HV L R HV Total North South East West
4:00 PM 122 138 5 89 11 1 0 0 0 360 0 0 0 14:15 PM 115 145 4 87 15 1 0 0 0 362 0 0 0 14:30 PM 134 147 3 83 22 3 0 0 0 386 0 0 0 14:45 PM 136 117 3 102 19 1 0 0 0 374 0 0 0 15:00 PM 115 136 3 109 11 1 0 0 0 371 0 0 0 05:15 PM 145 151 4 109 18 3 0 0 0 423 0 0 0 05:30 PM 133 145 2 93 13 4 0 0 0 384 0 0 0 05:45 PM 94 115 1 84 15 0 0 0 0 308 0 0 0 0
Total Survey 994 1,094 25 756 124 14 0 0 0 2,968 0 0 0 4
Peak Hour Summary4:30 PM to 5:30 PM
Northbound Southbound Eastbound Westbound PedestriansLincoln St Lincoln St I-5 NB On Ramp I-5 NB On Ramp Total Crosswalk
In Out Total HV In Out Total HV In Out Total HV In Out Total North South East WestVolume 1,081 403 1,484 13 473 551 1,024 8 0 600 600 0 0 0 0 1,554 0 0 0 2%HV 1.2% 1.7% 0.0% 0.0% 1.4%PHF 0.91 0.93 0.00 0.00 0.92
Northbound Southbound Eastbound WestboundLincoln St Lincoln St I-5 NB On Ramp I-5 NB On Ramp Total
L T T R L RVolume 530 551 403 70 0 0 1,554
PHF 0.91 0.91 0.92 0.80 0.00 0.00 0.92
Rolling Hour Summary4:00 PM to 6:00 PM
Interval Northbound Southbound Eastbound Westbound PedestriansStart Lincoln St Lincoln St I-5 NB On Ramp I-5 NB On Ramp Interval CrosswalkTime L T HV T R HV L R HV Total North South East West
4:00 PM 507 547 15 361 67 6 0 0 0 1,482 0 0 0 44:15 PM 500 545 13 381 67 6 0 0 0 1,493 0 0 0 34:30 PM 530 551 13 403 70 8 0 0 0 1,554 0 0 0 24:45 PM 529 549 12 413 61 9 0 0 0 1,552 0 0 0 15:00 PM 487 547 10 395 57 8 0 0 0 1,486 0 0 0 0
1,0810.91 0.00
00.000
0.93473
Wednesday, January 09, 2013
By Movement
By Approach
Total TotalTotalTotal
Mark Skaggs(206) 251-0300
0
0
530
40370
0
0
2 0
551
1,081403InOut
551473OutIn
0In
600Out
Out0
In0
0.91
PH
F 1.
2%H
V
0.00PHF 0.0%HV
0.00PHF 0.0%HV
0.93
PH
F 1.
7%H
V
Peak Hour Summary
4:30 PM to 5:30 PM
Peak Hour Summary
4:00 PM to 5:00 PM
Wednesday, January 09, 2013
27 17
17 9 1
0
0 21 0 0 0
0
10
0 16 0 1 0
6
4 7 0
15 11
Count Period: 4:00 PM to 6:00 PM
Consolidation Ave
Consolidation Ave
Approach HV%PHF Volume
Ne
va
da
St
0
SB 0.68 0.0%Intersection 0.90 0.0%
2754
NB 0.55 0.0% 11
EB 0.57 0.0%
0
0 0
Nevada St & Consolidation Ave
Ne
va
da
St
160WB 0.00 0.0%
0Peds
Ped
s2
Mark Skaggs(206) 251-0300
2Peds
Ped
s1

Total Vehicle Summary
Nevada St & Consolidation Ave
4:00 PM to 6:00 PM
15-Minute Interval Summary4:00 PM to 6:00 PM
Interval Northbound Southbound Eastbound Westbound PedestriansStart Nevada St Nevada St Consolidation Ave Consolidation Ave Interval CrosswalkTime L T R HV L T R HV L T R HV L T R HV Total North South East West
4:00 PM 2 2 0 0 0 1 3 0 4 0 3 0 0 0 0 0 15 0 0 1 24:15 PM 0 1 0 0 0 4 6 0 2 0 1 0 0 0 0 0 14 0 0 0 04:30 PM 0 1 0 0 0 1 6 0 3 0 2 0 0 0 0 0 13 0 0 0 04:45 PM 2 3 0 0 1 3 2 0 1 0 0 0 0 0 0 0 12 0 2 0 05:00 PM 1 3 0 0 0 3 6 0 1 0 0 0 0 0 0 0 14 0 0 0 05:15 PM 0 3 1 0 0 3 2 0 3 0 1 0 0 0 0 0 13 0 0 0 05:30 PM 0 0 0 0 0 6 4 0 5 0 0 0 0 0 0 0 15 0 0 0 05:45 PM 0 0 0 0 0 4 2 0 2 0 0 0 0 0 0 0 8 0 0 1 0
Total Survey 5 13 1 0 1 25 31 0 21 0 7 0 0 0 0 0 104 0 2 2 2
Peak Hour Summary4:00 PM to 5:00 PM
Northbound Southbound Eastbound Westbound PedestriansNevada St Nevada St Consolidation Ave Consolidation Ave Total Crosswalk
In Out Total HV In Out Total HV In Out Total HV In Out Total HV North South East WestVolume 11 15 26 0 27 17 44 0 16 21 37 0 0 1 1 0 54 0 2 1 2%HV 0.0% 0.0% 0.0% 0.0% 0.0%PHF 0.55 0.68 0.57 0.00 0.90
Northbound Southbound Eastbound WestboundNevada St Nevada St Consolidation Ave Consolidation Ave Total
L T R L T R L T R L T RVolume 4 7 0 1 9 17 10 0 6 0 0 0 54
PHF 0.50 0.58 0.00 0.25 0.56 0.71 0.63 0.00 0.50 0.00 0.00 0.00 0.90
Rolling Hour Summary4:00 PM to 6:00 PM
Interval Northbound Southbound Eastbound Westbound PedestriansStart Nevada St Nevada St Consolidation Ave Consolidation Ave Interval CrosswalkTime L T R HV L T R HV L T R HV L T R HV Total North South East West
4:00 PM 4 7 0 0 1 9 17 0 10 0 6 0 0 0 0 0 54 0 2 1 24:15 PM 3 8 0 0 1 11 20 0 7 0 3 0 0 0 0 0 53 0 2 0 04:30 PM 3 10 1 0 1 10 16 0 8 0 3 0 0 0 0 0 52 0 2 0 04:45 PM 3 9 1 0 1 15 14 0 10 0 1 0 0 0 0 0 54 0 2 0 05:00 PM 1 6 1 0 0 16 14 0 11 0 1 0 0 0 0 0 50 0 0 1 0
110.55 0.00
00.5716
0.6827
Wednesday, January 09, 2013
By Movement
By Approach
Total TotalTotalTotal
Mark Skaggs(206) 251-0300
10
0
6
0
0
0
04
9 117
0
2
2 1
7
1115InOut
1727OutIn
16In
21Out
Out1
In0
0.55
PH
F 0.
0%H
V
0.00PHF 0.0%HV
0.57PHF 0.0%HV
0.68
PH
F 0.
0%H
V
Peak Hour Summary
4:00 PM to 5:00 PM

Peak Hour Summary
5:00 PM to 6:00 PM
Wednesday, January 09, 2013
78 56
31 47
34
0 49 0
15
0 61 0
22 14
46 36
Count Period: 4:00 PM to 6:00 PM
Consolidation Ave
Approach HV%PHF Volume
As
hle
y A
ve
0
SB 0.72 0.0%Intersection 0.80 0.0%
78163
NB 0.69 0.0% 36
EB 0.00 0.0%
0
0 0
Ashley Ave & Consolidation Ave
As
hle
y A
ve
049WB 0.82 0.0%
0Peds
Ped
s0
Mark Skaggs(206) 251-0300
0Peds
Ped
s1

Total Vehicle Summary
Ashley Ave & Consolidation Ave
4:00 PM to 6:00 PM
15-Minute Interval Summary4:00 PM to 6:00 PM
Interval Northbound Southbound Eastbound Westbound PedestriansStart Ashley Ave Ashley Ave Consolidation Ave Consolidation Ave Interval CrosswalkTime T R HV L T HV L R HV Total North South East West
4:00 PM 6 5 0 13 5 0 0 8 1 37 0 0 1 04:15 PM 3 4 0 8 7 0 1 6 0 29 0 0 0 04:30 PM 3 1 0 10 13 0 2 6 0 35 0 0 2 04:45 PM 9 1 0 5 7 1 1 9 0 32 0 0 0 05:00 PM 3 4 0 5 8 0 2 9 0 31 0 0 1 05:15 PM 9 4 0 17 10 0 3 8 0 51 0 0 0 05:30 PM 6 3 0 15 6 0 3 9 0 42 0 0 0 05:45 PM 4 3 0 10 7 0 7 8 0 39 0 0 0 0
Total Survey 43 25 0 83 63 1 19 63 1 296 0 0 4 0
Peak Hour Summary5:00 PM to 6:00 PM
Northbound Southbound Eastbound Westbound PedestriansAshley Ave Ashley Ave Consolidation Ave Consolidation Ave Total Crosswalk
In Out Total HV In Out Total HV In Out Total In Out Total HV North South East WestVolume 36 46 82 0 78 56 134 0 0 0 0 49 61 110 0 163 0 0 1 0%HV 0.0% 0.0% 0.0% 0.0% 0.0%PHF 0.69 0.72 0.00 0.82 0.80
Northbound Southbound Eastbound WestboundAshley Ave Ashley Ave Consolidation Ave Consolidation Ave TotalT R L T L R
Volume 22 14 47 31 15 34 163PHF 0.61 0.88 0.69 0.78 0.54 0.94 0.80
Rolling Hour Summary4:00 PM to 6:00 PM
Interval Northbound Southbound Eastbound Westbound PedestriansStart Ashley Ave Ashley Ave Consolidation Ave Consolidation Ave Interval CrosswalkTime T R HV L T HV L R HV Total North South East West
4:00 PM 21 11 0 36 32 1 4 29 1 133 0 0 3 04:15 PM 18 10 0 28 35 1 6 30 0 127 0 0 3 04:30 PM 24 10 0 37 38 1 8 32 0 149 0 0 3 04:45 PM 27 12 0 42 31 1 9 35 0 156 0 0 1 05:00 PM 22 14 0 47 31 0 15 34 0 163 0 0 1 0
360.69 0.82
490.000
0.7278
Wednesday, January 09, 2013
By Movement
By Approach
Total TotalTotalTotal
Mark Skaggs(206) 251-0300
34
15
14
31 47
0
0
0 1
22
3646InOut
5678OutIn
0In
0Out
Out61
In49
0.69
PH
F 0.
0%H
V
0.82PHF 0.0%HV
0.00PHF 0.0%HV
0.72
PH
F 0.
0%H
V
Peak Hour Summary
5:00 PM to 6:00 PM

Peak Hour Summary
4:30 PM to 5:30 PM
Wednesday, January 09, 2013
434 549
5 353 76
52
0 9 2 95 0
41
3
0 6 1 117 0
2
2 494 40
396 536
Count Period: 4:00 PM to 6:00 PM
Maple St
Maple St
Approach HV%PHF Volume
Lin
co
ln S
t
0
SB 0.92 1.6%Intersection 0.96 1.2%
4341,071
NB 0.94 1.1% 536
EB 0.30 0.0%
0
0 0
Lincoln St & Maple St
Lin
co
ln S
t
695WB 0.82 0.0%
0Peds
Ped
s0
Mark Skaggs(206) 251-0300
0Peds
Ped
s11

Total Vehicle Summary
Lincoln St & Maple St
4:00 PM to 6:00 PM
15-Minute Interval Summary4:00 PM to 6:00 PM
Interval Northbound Southbound Eastbound Westbound PedestriansStart Lincoln St Lincoln St Maple St Maple St Interval CrosswalkTime L T R HV L T R HV L T R HV L T R HV Total North South East West
4:00 PM 1 122 15 3 14 82 0 1 3 0 0 0 5 0 18 1 260 0 0 4 04:15 PM 0 134 8 1 15 61 3 0 2 0 0 0 5 0 7 0 235 0 0 0 04:30 PM 1 128 13 1 21 90 2 3 0 0 0 0 12 0 6 0 273 0 0 4 04:45 PM 1 114 7 3 14 79 0 0 2 1 2 0 9 1 18 0 248 0 0 1 05:00 PM 0 125 8 1 14 101 3 1 1 0 0 0 9 1 10 0 272 0 0 3 05:15 PM 0 127 12 1 27 83 0 3 0 0 0 0 11 0 18 0 278 0 0 3 05:30 PM 1 100 14 1 28 79 0 1 0 0 0 0 10 0 18 0 250 0 0 1 05:45 PM 1 110 10 2 20 74 1 0 0 0 0 0 9 0 14 1 239 0 0 1 0
Total Survey 5 960 87 13 153 649 9 9 8 1 2 0 70 2 109 2 2,055 0 0 17 0
Peak Hour Summary4:30 PM to 5:30 PM
Northbound Southbound Eastbound Westbound PedestriansLincoln St Lincoln St Maple St Maple St Total Crosswalk
In Out Total HV In Out Total HV In Out Total HV In Out Total HV North South East WestVolume 536 396 932 6 434 549 983 7 6 9 15 0 95 117 212 0 1,071 0 0 11 0%HV 1.1% 1.6% 0.0% 0.0% 1.2%PHF 0.94 0.92 0.30 0.82 0.96
Northbound Southbound Eastbound WestboundLincoln St Lincoln St Maple St Maple St Total
L T R L T R L T R L T RVolume 2 494 40 76 353 5 3 1 2 41 2 52 1,071
PHF 0.50 0.96 0.77 0.70 0.87 0.42 0.38 0.25 0.25 0.85 0.50 0.72 0.96
Rolling Hour Summary4:00 PM to 6:00 PM
Interval Northbound Southbound Eastbound Westbound PedestriansStart Lincoln St Lincoln St Maple St Maple St Interval CrosswalkTime L T R HV L T R HV L T R HV L T R HV Total North South East West
4:00 PM 3 498 43 8 64 312 5 4 7 1 2 0 31 1 49 1 1,016 0 0 9 04:15 PM 2 501 36 6 64 331 8 4 5 1 2 0 35 2 41 0 1,028 0 0 8 04:30 PM 2 494 40 6 76 353 5 7 3 1 2 0 41 2 52 0 1,071 0 0 11 04:45 PM 2 466 41 6 83 342 3 5 3 1 2 0 39 2 64 0 1,048 0 0 8 05:00 PM 2 462 44 5 89 337 4 5 1 0 0 0 39 1 60 1 1,039 0 0 8 0
5360.94 0.82
950.306
0.92434
Wednesday, January 09, 2013
By Movement
By Approach
Total TotalTotalTotal
Mark Skaggs(206) 251-0300
3
1
2
52
2
41
402
353 765
0
0
0 11
494
536396InOut
549434OutIn
6In
9Out
Out117
In95
0.94
PH
F 1.
1%H
V
0.82PHF 0.0%HV
0.30PHF 0.0%HV
0.92
PH
F 1.
6%H
V
Peak Hour Summary
4:30 PM to 5:30 PM

Peak Hour Summary
5:00 PM to 6:00 PM
Wednesday, January 09, 2013
0 778 753 790 0
37
0 1314 1254 1311 0
60
25 57
97 82
Count Period: 4:00 PM to 6:00 PM
Lakeway Dr
Lakeway Dr
Approach HV%PHF Volume
Ne
va
da
St
0
SB 0.00 0.0%Intersection 0.94 0.6%
02,186
NB 0.85 0.0% 82
EB 0.97 0.4%
0
0 0
Nevada St & Lakeway Dr
1,314790WB 0.84 1.1%
0Peds
Ped
s0
Mark Skaggs(206) 251-0300
4Peds
Ped
s0

Total Vehicle Summary
Nevada St & Lakeway Dr
4:00 PM to 6:00 PM
15-Minute Interval Summary4:00 PM to 6:00 PM
Interval Northbound Southbound Eastbound Westbound PedestriansStart Nevada St Nevada St Lakeway Dr Lakeway Dr Interval CrosswalkTime L R HV T R HV L T HV Total North South East West
4:00 PM 5 13 0 270 24 2 10 195 2 517 0 6 0 04:15 PM 8 10 0 275 13 2 5 168 2 479 0 3 0 04:30 PM 4 12 0 323 13 1 11 158 3 521 0 6 0 04:45 PM 7 19 1 301 20 3 5 197 4 549 0 1 0 05:00 PM 5 19 0 306 16 1 16 218 3 580 0 0 0 05:15 PM 7 15 0 325 12 1 5 156 1 520 0 2 0 05:30 PM 8 9 0 315 13 2 12 160 2 517 0 2 0 05:45 PM 5 14 0 308 19 1 4 219 3 569 0 0 0 0
Total Survey 49 111 1 2,423 130 13 68 1,471 20 4,252 0 20 0 0
Peak Hour Summary5:00 PM to 6:00 PM
Northbound Southbound Eastbound Westbound PedestriansNevada St Nevada St Lakeway Dr Lakeway Dr Total Crosswalk
In Out Total HV In Out Total In Out Total HV In Out Total HV North South East WestVolume 82 97 179 0 0 0 0 1,314 778 2,092 5 790 1,311 2,101 9 2,186 0 4 0 0%HV 0.0% 0.0% 0.4% 1.1% 0.6%PHF 0.85 0.00 0.97 0.84 0.94
Northbound Southbound Eastbound WestboundNevada St Nevada St Lakeway Dr Lakeway Dr Total
L R T R L TVolume 25 57 1,254 60 37 753 2,186
PHF 0.78 0.75 0.96 0.79 0.58 0.86 0.94
Rolling Hour Summary4:00 PM to 6:00 PM
Interval Northbound Southbound Eastbound Westbound PedestriansStart Nevada St Nevada St Lakeway Dr Lakeway Dr Interval CrosswalkTime L R HV T R HV L T HV Total North South East West
4:00 PM 24 54 1 1,169 70 8 31 718 11 2,066 0 16 0 04:15 PM 24 60 1 1,205 62 7 37 741 12 2,129 0 10 0 04:30 PM 23 65 1 1,255 61 6 37 729 11 2,170 0 9 0 04:45 PM 27 62 1 1,247 61 7 38 731 10 2,166 0 5 0 05:00 PM 25 57 0 1,254 60 5 37 753 9 2,186 0 4 0 0
820.85 0.84
7900.971,314
0.000
Wednesday, January 09, 2013
By Movement
By Approach
Total TotalTotalTotal
Mark Skaggs(206) 251-0300 1,254
60
753
37
5725
0
4
0 0
8297InOut
00OutIn
1,314In
778Out
Out1,311
In790
0.85
PH
F 0.
0%H
V
0.84PHF 1.1%HV
0.97PHF 0.4%HV
0.00
PH
F 0.
0%H
V
Peak Hour Summary
5:00 PM to 6:00 PM

Peak Hour Summary
4:30 PM to 5:30 PM
Wednesday, January 09, 2013
330 239
39 200 91
52
0 659 450 716 0
214
29
0 980 871 1339 0
80
170 158 377
494 705
Count Period: 4:00 PM to 6:00 PM
Lakeway Dr
Lakeway Dr
Approach HV%PHF Volume
Lin
co
ln S
t
0
SB 0.91 1.5%Intersection 0.97 1.1%
3302,731
NB 0.98 1.0% 705
EB 0.98 0.9%
0
0 0
Lincoln St & Lakeway Dr
Lin
co
ln S
t
980716WB 0.87 1.4%
2Peds
Ped
s6
Mark Skaggs(206) 251-0300
17Peds
Ped
s12
Total Vehicle Summary
Lincoln St & Lakeway Dr
4:00 PM to 6:00 PM
15-Minute Interval Summary4:00 PM to 6:00 PM
Interval Northbound Southbound Eastbound Westbound PedestriansStart Lincoln St Lincoln St Lakeway Dr Lakeway Dr Interval CrosswalkTime L T R HV L T R HV L T R HV L T R HV Total North South East West
4:00 PM 44 31 93 5 22 41 7 2 5 174 24 2 56 130 14 2 641 2 7 4 34:15 PM 26 50 98 3 18 55 13 1 8 190 13 2 36 113 7 2 627 0 7 3 34:30 PM 35 40 103 1 26 49 10 2 6 207 26 3 46 102 11 3 661 2 7 1 44:45 PM 46 47 86 4 23 40 10 0 7 225 18 2 52 125 20 4 699 0 1 2 25:00 PM 46 28 97 1 21 50 10 1 7 214 23 3 68 125 12 1 701 0 5 1 05:15 PM 43 43 91 1 21 61 9 2 9 225 13 1 48 98 9 2 670 0 4 8 05:30 PM 31 29 90 1 20 47 13 2 11 226 22 0 44 110 12 2 655 1 2 2 05:45 PM 31 40 107 3 30 37 14 0 9 198 23 1 56 130 11 2 686 0 6 1 1
Total Survey 302 308 765 19 181 380 86 10 62 1,659 162 14 406 933 96 18 5,340 5 39 22 13
Peak Hour Summary4:30 PM to 5:30 PM
Northbound Southbound Eastbound Westbound PedestriansLincoln St Lincoln St Lakeway Dr Lakeway Dr Total Crosswalk
In Out Total HV In Out Total HV In Out Total HV In Out Total HV North South East WestVolume 705 494 1,199 7 330 239 569 5 980 659 1,639 9 716 1,339 2,055 10 2,731 2 17 12 6%HV 1.0% 1.5% 0.9% 1.4% 1.1%PHF 0.98 0.91 0.98 0.87 0.97
Northbound Southbound Eastbound WestboundLincoln St Lincoln St Lakeway Dr Lakeway Dr Total
L T R L T R L T R L T RVolume 170 158 377 91 200 39 29 871 80 214 450 52 2,731
PHF 0.92 0.84 0.92 0.88 0.82 0.98 0.81 0.97 0.77 0.79 0.90 0.65 0.97
Rolling Hour Summary4:00 PM to 6:00 PM
Interval Northbound Southbound Eastbound Westbound PedestriansStart Lincoln St Lincoln St Lakeway Dr Lakeway Dr Interval CrosswalkTime L T R HV L T R HV L T R HV L T R HV Total North South East West
4:00 PM 151 168 380 13 89 185 40 5 26 796 81 9 190 470 52 11 2,628 4 22 10 124:15 PM 153 165 384 9 88 194 43 4 28 836 80 10 202 465 50 10 2,688 2 20 7 94:30 PM 170 158 377 7 91 200 39 5 29 871 80 9 214 450 52 10 2,731 2 17 12 64:45 PM 166 147 364 7 85 198 42 5 34 890 76 6 212 458 53 9 2,725 1 12 13 25:00 PM 151 140 385 6 92 195 46 5 36 863 81 5 216 463 44 7 2,712 1 17 12 1
7050.98 0.87
7160.98980
0.91330
Wednesday, January 09, 2013
By Movement
By Approach
Total TotalTotalTotal
Mark Skaggs(206) 251-0300
29
871
80
52
450
214
377170
200 9139
2
17
6 12
158
705494InOut
239330OutIn
980In
659Out
Out1,339
In716
0.98
PH
F 1.
0%H
V
0.87PHF 1.4%HV
0.98PHF 0.9%HV
0.91
PH
F 1.
5%H
V
Peak Hour Summary
4:30 PM to 5:30 PM

Appendix B: LOS Definitions

Highway Capacity Manual, 2000 Signalized intersection level of service (LOS) is defined in terms of the average total vehicle delay of all movements through an intersection. Vehicle delay is a method of quantifying several intangible factors, including driver discomfort, frustration, and lost travel time. Specifically, LOS criteria are stated in terms of average delay per vehicle during a specified time period (for example, the PM peak hour). Vehicle delay is a complex measure based on many variables, including signal phasing (i.e., progression of movements through the intersection), signal cycle length, and traffic volumes with respect to intersection capacity. Table 1 shows LOS criteria for signalized intersections, as described in the Highway Capacity Manual (Transportation Research Board, Special Report 209, 2000). Table 1. Level of Service Criteria for Signalized Intersections
Level of Service
Average Control Delay (sec/veh)
General Description (Signalized Intersections)
A 10 Free Flow
B >10 - 20 Stable Flow (slight delays)
C >20 - 35 Stable flow (acceptable delays)
D >35 - 55 Approaching unstable flow (tolerable delay, occasionally wait through more than one signal cycle before proceeding)
E >55 - 80 Unstable flow (intolerable delay)
F >80 Forced flow (jammed) Source: Highway Capacity Manual, Transportation Research Board, Special Report 209, 2000.
Unsignalized intersection LOS criteria can be further reduced into two intersection types: all-way stop-controlled and two-way stop-controlled. All-way, stop-controlled intersection LOS is expressed in terms of the average vehicle delay of all of the movements, much like that of a signalized intersection. Two-way, stop-controlled intersection LOS is defined in terms of the average vehicle delay of an individual movement(s). This is because the performance of a two-way, stop-controlled intersection is more closely reflected in terms of its individual movements, rather than its performance overall. For this reason, LOS for a two-way, stop-controlled intersection is defined in terms of its individual movements. With this in mind, total average vehicle delay (i.e., average delay of all movements) for a two-way, stop-controlled intersection should be viewed with discretion. Table 2 shows LOS criteria for unsignalized intersections (both all-way and two-way, stop-controlled).
Table 2. Level of Service Criteria for Unsignalized Intersections
Level of Service Average Control Delay (sec/veh)
A 0 - 10
B 10 - 15
C 15 - 25
D 25 - 35
E 35 - 50
F 50 Source: Highway Capacity Manual, Transportation Research Board, Special Report 209, 2000.

Appendix C: LOS Worksheets

HCM Signalized Intersection Capacity Analysis University Ridge Housing Development1: Lincoln St. & Lakeway Dr Existing (2013) PM Peak Hour
Q:\Projects\11\11167 Consolidation Ave Student Housing\Analysis\Traffic Operations\Synchro_SimTraffic\Existing\Existing.synSynchro 8 Report Page 1
Movement EBL EBT EBR WBL WBT WBR NBL NBT NBR SBL SBT SBRLane ConfigurationsVolume (vph) 30 870 80 215 450 50 170 160 375 90 200 40Ideal Flow (vphpl) 1900 1900 1900 1900 1900 1900 1900 1900 1900 1900 1900 1900Total Lost time (s) 5.0 5.0 5.0 5.0 5.0 5.0 5.0 5.0 5.0 5.0Lane Util. Factor 1.00 0.95 1.00 0.95 1.00 1.00 1.00 1.00 1.00 1.00Frpb, ped/bikes 1.00 1.00 1.00 1.00 0.97 1.00 1.00 0.97 1.00 1.00Flpb, ped/bikes 1.00 1.00 1.00 1.00 1.00 1.00 1.00 1.00 1.00 1.00Frt 1.00 0.99 1.00 1.00 0.85 1.00 1.00 0.85 1.00 0.98Flt Protected 0.95 1.00 0.95 1.00 1.00 0.95 1.00 1.00 0.95 1.00Satd. Flow (prot) 1726 3400 1727 3455 1506 1728 1818 1499 1711 1750Flt Permitted 0.36 1.00 0.17 1.00 1.00 0.95 1.00 1.00 0.95 1.00Satd. Flow (perm) 657 3400 315 3455 1506 1728 1818 1499 1711 1750Peak-hour factor, PHF 0.97 0.97 0.97 0.97 0.97 0.97 0.97 0.97 0.97 0.97 0.97 0.97Adj. Flow (vph) 31 897 82 222 464 52 175 165 387 93 206 41RTOR Reduction (vph) 0 5 0 0 0 34 0 0 300 0 5 0Lane Group Flow (vph) 31 974 0 222 464 18 175 165 87 93 242 0Confl. Peds. (#/hr) 2 17 17 2 6 12 12 6Heavy Vehicles (%) 1% 1% 1% 1% 1% 1% 1% 1% 1% 2% 2% 2%Turn Type pm+pt NA pm+pt NA Perm Prot NA Perm Prot NAProtected Phases 5 2 1 6 3 4 3 4Permitted Phases 2 6 6 4Actuated Green, G (s) 68.2 49.1 57.0 42.9 42.9 17.1 20.3 20.3 17.1 20.3Effective Green, g (s) 68.2 49.1 57.0 42.9 42.9 17.1 20.3 20.3 17.1 20.3Actuated g/C Ratio 0.57 0.41 0.47 0.36 0.36 0.14 0.17 0.17 0.14 0.17Clearance Time (s) 5.0 5.0 5.0 5.0 5.0 5.0 5.0 5.0 5.0 5.0Vehicle Extension (s) 4.0 3.0 3.0 3.0 3.0 4.0 4.0 4.0 4.0 4.0Lane Grp Cap (vph) 551 1384 313 1229 535 245 306 252 242 294v/s Ratio Prot 0.01 c0.29 c0.08 0.13 c0.10 0.09 0.05 c0.14v/s Ratio Perm 0.02 0.25 0.01 0.06v/c Ratio 0.06 0.70 0.71 0.38 0.03 0.71 0.54 0.34 0.38 0.82Uniform Delay, d1 12.2 29.7 21.4 28.9 25.3 49.4 45.9 44.3 47.0 48.4Progression Factor 0.51 0.30 1.00 1.00 1.00 1.00 1.00 1.00 1.00 1.00Incremental Delay, d2 0.0 1.2 7.2 0.2 0.0 10.1 2.3 1.1 1.4 17.5Delay (s) 6.3 10.2 28.6 29.1 25.4 59.5 48.2 45.4 48.4 65.9Level of Service A B C C C E D D D EApproach Delay (s) 10.1 28.7 49.4 61.1Approach LOS B C D EIntersection SummaryHCM 2000 Control Delay 31.3 HCM 2000 Level of Service CHCM 2000 Volume to Capacity ratio 0.73Actuated Cycle Length (s) 120.6 Sum of lost time (s) 20.0Intersection Capacity Utilization 78.9% ICU Level of Service DAnalysis Period (min) 15c Critical Lane Group

HCM Unsignalized Intersection Capacity Analysis University Ridge Housing Development2: Nevada St & Lakeway Dr Existing (2013) PM Peak Hour
Q:\Projects\11\11167 Consolidation Ave Student Housing\Analysis\Traffic Operations\Synchro_SimTraffic\Existing\Existing.synSynchro 8 Report Page 2
Movement EBT EBR WBL WBT NBL NBRLane ConfigurationsVolume (veh/h) 1255 60 35 755 25 55Sign Control Free Free StopGrade 0% 0% 0%Peak Hour Factor 0.94 0.94 0.94 0.94 0.94 0.94Hourly flow rate (vph) 1335 64 37 803 27 59Pedestrians 4Lane Width (ft) 11.0Walking Speed (ft/s) 4.0Percent Blockage 0Right turn flare (veh) 8Median type TWLTL TWLTLMedian storage veh) 2 2Upstream signal (ft) 642pX, platoon unblocked 0.77 0.77 0.77vC, conflicting volume 1403 1847 703vC1, stage 1 conf vol 1371vC2, stage 2 conf vol 476vCu, unblocked vol 926 1503 18tC, single (s) 4.1 6.8 6.9tC, 2 stage (s) 5.8tF (s) 2.2 3.5 3.3p0 queue free % 93 90 93cM capacity (veh/h) 568 254 816Direction, Lane # EB 1 EB 2 WB 1 WB 2 WB 3 NB 1Volume Total 890 509 37 402 402 85Volume Left 0 0 37 0 0 27Volume Right 0 64 0 0 0 59cSH 1700 1700 568 1700 1700 814Volume to Capacity 0.52 0.30 0.07 0.24 0.24 0.10Queue Length 95th (ft) 0 0 5 0 0 9Control Delay (s) 0.0 0.0 11.8 0.0 0.0 13.2Lane LOS B BApproach Delay (s) 0.0 0.5 13.2Approach LOS BIntersection SummaryAverage Delay 0.7Intersection Capacity Utilization 46.7% ICU Level of Service AAnalysis Period (min) 15

HCM Unsignalized Intersection Capacity Analysis University Ridge Housing Development3: Lincoln St. & E Maple St. Existing (2013) PM Peak Hour
Q:\Projects\11\11167 Consolidation Ave Student Housing\Analysis\Traffic Operations\Synchro_SimTraffic\Existing\Existing.synSynchro 8 Report Page 3
Movement EBL EBT EBR WBL WBT WBR NBL NBT NBR SBL SBT SBRLane ConfigurationsVolume (veh/h) 5 5 5 40 5 50 5 495 40 75 355 5Sign Control Stop Stop Free FreeGrade 0% 0% 0% 0%Peak Hour Factor 0.96 0.96 0.96 0.96 0.96 0.96 0.96 0.96 0.96 0.96 0.96 0.96Hourly flow rate (vph) 5 5 5 42 5 52 5 516 42 78 370 5Pedestrians 11Lane Width (ft) 11.0Walking Speed (ft/s) 4.0Percent Blockage 1Right turn flare (veh)Median type None TWLTLMedian storage veh) 2Upstream signal (ft)pX, platoon unblockedvC, conflicting volume 1109 1107 372 1092 1089 547 375 568vC1, stage 1 conf vol 529 529 558 558vC2, stage 2 conf vol 581 579 534 531vCu, unblocked vol 1109 1107 372 1092 1089 547 375 568tC, single (s) 7.1 6.5 6.2 7.1 6.5 6.2 4.1 4.1tC, 2 stage (s) 6.1 5.5 6.1 5.5tF (s) 3.5 4.0 3.3 3.5 4.0 3.3 2.2 2.2p0 queue free % 98 99 99 89 99 90 100 92cM capacity (veh/h) 320 354 678 378 386 536 1189 995Direction, Lane # EB 1 WB 1 NB 1 NB 2 SB 1 SB 2Volume Total 16 99 5 557 78 375Volume Left 5 42 5 0 78 0Volume Right 5 52 0 42 0 5cSH 404 448 1189 1700 995 1700Volume to Capacity 0.04 0.22 0.00 0.33 0.08 0.22Queue Length 95th (ft) 3 21 0 0 6 0Control Delay (s) 14.3 15.3 8.0 0.0 8.9 0.0Lane LOS B C A AApproach Delay (s) 14.3 15.3 0.1 1.5Approach LOS B CIntersection SummaryAverage Delay 2.2Intersection Capacity Utilization 50.7% ICU Level of Service AAnalysis Period (min) 15

HCM Unsignalized Intersection Capacity Analysis University Ridge Housing Development4: Ashley Ave & Consolidation Ave Existing (2013) PM Peak Hour
Q:\Projects\11\11167 Consolidation Ave Student Housing\Analysis\Traffic Operations\Synchro_SimTraffic\Existing\Existing.synSynchro 8 Report Page 4
Movement WBL WBR NBT NBR SBL SBTLane ConfigurationsVolume (veh/h) 15 35 20 15 45 30Sign Control Stop Free FreeGrade 0% 0% 0%Peak Hour Factor 0.80 0.80 0.80 0.80 0.80 0.80Hourly flow rate (vph) 19 44 25 19 56 38Pedestrians 1Lane Width (ft) 11.0Walking Speed (ft/s) 4.0Percent Blockage 0Right turn flare (veh)Median type None NoneMedian storage veh)Upstream signal (ft)pX, platoon unblockedvC, conflicting volume 185 35 45vC1, stage 1 conf volvC2, stage 2 conf volvCu, unblocked vol 185 35 45tC, single (s) 6.4 6.2 4.1tC, 2 stage (s)tF (s) 3.5 3.3 2.2p0 queue free % 98 96 96cM capacity (veh/h) 779 1042 1575Direction, Lane # WB 1 NB 1 SB 1Volume Total 62 44 94Volume Left 19 0 56Volume Right 44 19 0cSH 946 1700 1575Volume to Capacity 0.07 0.03 0.04Queue Length 95th (ft) 5 0 3Control Delay (s) 9.1 0.0 4.5Lane LOS A AApproach Delay (s) 9.1 0.0 4.5Approach LOS AIntersection SummaryAverage Delay 5.0Intersection Capacity Utilization 20.7% ICU Level of Service AAnalysis Period (min) 15

HCM Unsignalized Intersection Capacity Analysis University Ridge Housing Development5: Consolidation Ave & Nevada St Existing (2013) PM Peak Hour
Q:\Projects\11\11167 Consolidation Ave Student Housing\Analysis\Traffic Operations\Synchro_SimTraffic\Existing\Existing.synSynchro 8 Report Page 5
Movement EBL EBT EBR WBL WBT WBR NBL NBT NBR SBL SBT SBRLane ConfigurationsSign Control Stop Stop Stop StopVolume (vph) 10 0 5 0 0 0 5 5 0 5 10 15Peak Hour Factor 0.90 0.90 0.90 0.90 0.90 0.90 0.90 0.90 0.90 0.90 0.90 0.90Hourly flow rate (vph) 11 0 6 0 0 0 6 6 0 6 11 17Direction, Lane # EB 1 WB 1 NB 1 SB 1Volume Total (vph) 17 0 11 33Volume Left (vph) 11 0 6 6Volume Right (vph) 6 0 0 17Hadj (s) -0.07 0.00 0.10 -0.27Departure Headway (s) 3.9 4.0 4.1 3.7Degree Utilization, x 0.02 0.00 0.01 0.03Capacity (veh/h) 901 900 868 968Control Delay (s) 7.0 7.0 7.1 6.8Approach Delay (s) 7.0 0.0 7.1 6.8Approach LOS A A A AIntersection SummaryDelay 6.9Level of Service AIntersection Capacity Utilization 14.6% ICU Level of Service AAnalysis Period (min) 15
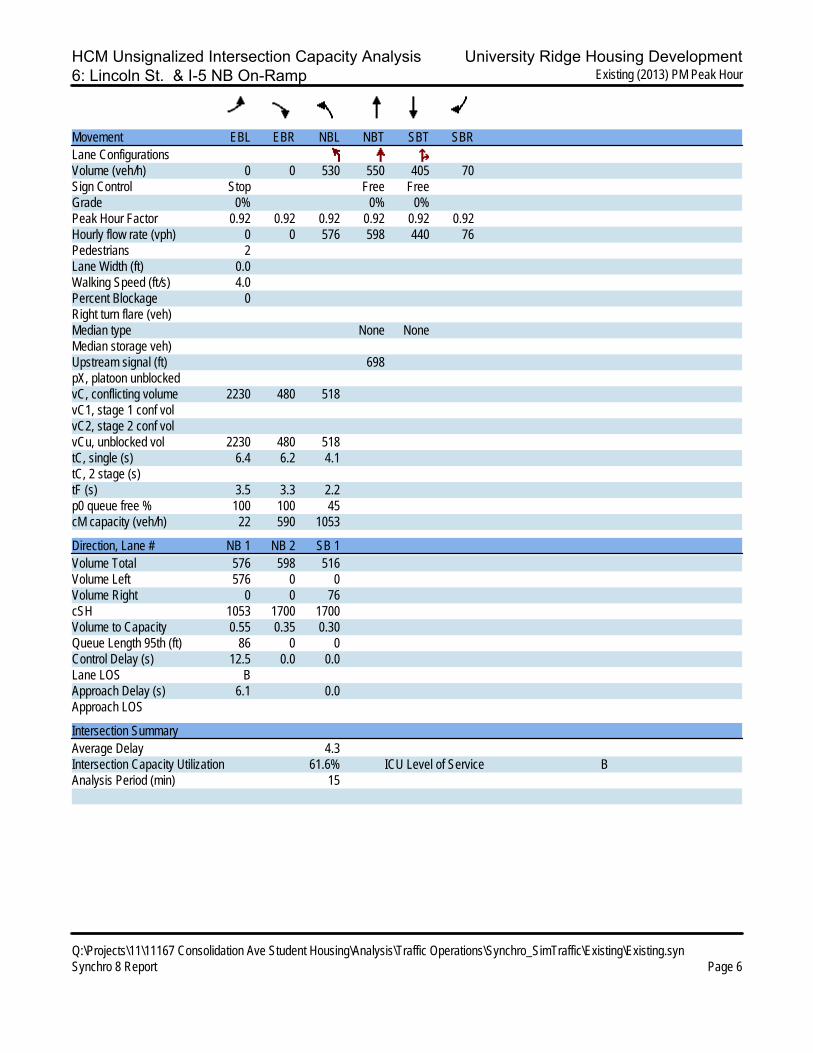
HCM Unsignalized Intersection Capacity Analysis University Ridge Housing Development6: Lincoln St. & I-5 NB On-Ramp Existing (2013) PM Peak Hour
Q:\Projects\11\11167 Consolidation Ave Student Housing\Analysis\Traffic Operations\Synchro_SimTraffic\Existing\Existing.synSynchro 8 Report Page 6
Movement EBL EBR NBL NBT SBT SBRLane ConfigurationsVolume (veh/h) 0 0 530 550 405 70Sign Control Stop Free FreeGrade 0% 0% 0%Peak Hour Factor 0.92 0.92 0.92 0.92 0.92 0.92Hourly flow rate (vph) 0 0 576 598 440 76Pedestrians 2Lane Width (ft) 0.0Walking Speed (ft/s) 4.0Percent Blockage 0Right turn flare (veh)Median type None NoneMedian storage veh)Upstream signal (ft) 698pX, platoon unblockedvC, conflicting volume 2230 480 518vC1, stage 1 conf volvC2, stage 2 conf volvCu, unblocked vol 2230 480 518tC, single (s) 6.4 6.2 4.1tC, 2 stage (s)tF (s) 3.5 3.3 2.2p0 queue free % 100 100 45cM capacity (veh/h) 22 590 1053Direction, Lane # NB 1 NB 2 SB 1Volume Total 576 598 516Volume Left 576 0 0Volume Right 0 0 76cSH 1053 1700 1700Volume to Capacity 0.55 0.35 0.30Queue Length 95th (ft) 86 0 0Control Delay (s) 12.5 0.0 0.0Lane LOS BApproach Delay (s) 6.1 0.0Approach LOSIntersection SummaryAverage Delay 4.3Intersection Capacity Utilization 61.6% ICU Level of Service BAnalysis Period (min) 15

HCM Signalized Intersection Capacity Analysis University Ridge Housing Development7: Samish Way/N Samish Way & Bill McDonald Parkway/Byron St Existing (2013) PM Peak Hour
Q:\Projects\11\11167 Consolidation Ave Student Housing\Analysis\Traffic Operations\Synchro_SimTraffic\Existing\Existing.synSynchro 8 Report Page 7
Movement EBL EBT EBR WBL WBT WBR NBL NBT NBR SBL SBT SBRLane ConfigurationsVolume (vph) 260 15 365 20 15 10 280 330 30 15 450 300Ideal Flow (vphpl) 1900 1900 1900 1900 1900 1900 1900 1900 1900 1900 1900 1900Total Lost time (s) 5.0 5.0 5.0 5.0 5.0 5.0 5.0 5.0Lane Util. Factor 1.00 1.00 0.95 1.00 0.95 1.00 0.95 1.00Frpb, ped/bikes 1.00 1.00 1.00 1.00 1.00 1.00 1.00 0.95Flpb, ped/bikes 0.99 1.00 1.00 0.99 1.00 1.00 1.00 1.00Frt 1.00 0.86 0.97 1.00 0.99 1.00 1.00 0.85Flt Protected 0.95 1.00 0.98 0.95 1.00 0.95 1.00 1.00Satd. Flow (prot) 1694 1541 3070 1719 3403 1722 3455 1463Flt Permitted 0.73 1.00 0.73 0.33 1.00 0.53 1.00 1.00Satd. Flow (perm) 1294 1541 2278 605 3403 963 3455 1463Peak-hour factor, PHF 0.97 0.97 0.97 0.97 0.97 0.97 0.97 0.97 0.97 0.97 0.97 0.97Adj. Flow (vph) 268 15 376 21 15 10 289 340 31 15 464 309RTOR Reduction (vph) 0 285 0 0 8 0 0 9 0 0 0 222Lane Group Flow (vph) 268 106 0 0 38 0 289 362 0 15 464 87Confl. Peds. (#/hr) 12 12 36 5 5 36Heavy Vehicles (%) 2% 2% 2% 7% 7% 7% 1% 1% 1% 1% 1% 1%Turn Type Perm NA Perm NA pm+pt NA pm+pt NA PermProtected Phases 4 8 5 2 1 6Permitted Phases 4 8 2 6 6Actuated Green, G (s) 15.2 15.2 15.2 37.8 31.9 18.7 17.8 17.8Effective Green, g (s) 15.2 15.2 15.2 37.8 31.9 18.7 17.8 17.8Actuated g/C Ratio 0.24 0.24 0.24 0.60 0.51 0.30 0.28 0.28Clearance Time (s) 5.0 5.0 5.0 5.0 5.0 5.0 5.0 5.0Vehicle Extension (s) 3.0 3.0 3.0 3.0 3.0 3.0 3.0 3.0Lane Grp Cap (vph) 312 371 549 628 1723 296 976 413v/s Ratio Prot 0.07 c0.11 0.11 0.00 0.13v/s Ratio Perm c0.21 0.02 c0.17 0.01 0.06v/c Ratio 0.86 0.28 0.07 0.46 0.21 0.05 0.48 0.21Uniform Delay, d1 22.9 19.5 18.4 6.7 8.6 15.7 18.7 17.2Progression Factor 1.00 1.00 1.00 1.00 1.00 1.00 1.00 1.00Incremental Delay, d2 20.2 0.4 0.1 0.5 0.1 0.1 0.4 0.3Delay (s) 43.1 19.9 18.5 7.2 8.7 15.8 19.1 17.5Level of Service D B B A A B B BApproach Delay (s) 29.3 18.5 8.0 18.4Approach LOS C B A BIntersection SummaryHCM 2000 Control Delay 18.6 HCM 2000 Level of Service BHCM 2000 Volume to Capacity ratio 0.62Actuated Cycle Length (s) 63.0 Sum of lost time (s) 15.0Intersection Capacity Utilization 64.4% ICU Level of Service CAnalysis Period (min) 15c Critical Lane Group

HCM Signalized Intersection Capacity Analysis University Ridge Housing Development8: S Samish Way/Samish Way & 36th Street/I-5 SB Off-Ramp Existing (2013) PM Peak Hour
Q:\Projects\11\11167 Consolidation Ave Student Housing\Analysis\Traffic Operations\Synchro_SimTraffic\Existing\Existing.synSynchro 8 Report Page 8
Movement EBL EBT EBR WBL WBT WBR NBL NBT NBR SBL SBT SBRLane ConfigurationsVolume (vph) 100 0 395 175 215 210 240 330 0 0 630 205Ideal Flow (vphpl) 1900 1900 1900 1900 1900 1900 1900 1900 1900 1900 1900 1900Total Lost time (s) 6.0 6.0 6.0 6.0 6.0 5.0 6.0 6.0 6.0Lane Util. Factor 1.00 1.00 1.00 1.00 1.00 1.00 0.95 0.95 1.00Frpb, ped/bikes 1.00 0.99 1.00 1.00 1.00 1.00 1.00 1.00 0.97Flpb, ped/bikes 1.00 1.00 1.00 1.00 1.00 1.00 1.00 1.00 1.00Frt 1.00 0.85 1.00 1.00 0.85 1.00 1.00 1.00 0.85Flt Protected 0.95 1.00 0.95 1.00 1.00 0.95 1.00 1.00 1.00Satd. Flow (prot) 1728 1523 1745 1837 1561 1727 3455 3421 1480Flt Permitted 0.95 1.00 0.95 1.00 1.00 0.20 1.00 1.00 1.00Satd. Flow (perm) 1728 1523 1745 1837 1561 372 3455 3421 1480Peak-hour factor, PHF 0.93 0.93 0.93 0.93 0.93 0.93 0.93 0.93 0.93 0.93 0.93 0.93Adj. Flow (vph) 108 0 425 188 231 226 258 355 0 0 677 220RTOR Reduction (vph) 0 0 376 0 0 185 0 0 0 0 0 109Lane Group Flow (vph) 108 0 49 188 231 41 258 355 0 0 677 111Confl. Peds. (#/hr) 1 1 5 5Heavy Vehicles (%) 1% 1% 1% 0% 0% 0% 1% 1% 1% 2% 2% 2%Turn Type Prot custom Split NA Perm pm+pt NA NA PermProtected Phases 4 3 3 5 2 6Permitted Phases 4 3 2 6Actuated Green, G (s) 13.6 13.6 21.3 21.3 21.3 63.9 63.9 34.9 34.9Effective Green, g (s) 13.6 13.6 21.3 21.3 21.3 63.9 63.9 34.9 34.9Actuated g/C Ratio 0.12 0.12 0.18 0.18 0.18 0.55 0.55 0.30 0.30Clearance Time (s) 6.0 6.0 6.0 6.0 6.0 5.0 6.0 6.0 6.0Vehicle Extension (s) 3.0 3.0 3.0 3.0 3.0 3.0 4.0 4.0 4.0Lane Grp Cap (vph) 201 177 318 335 284 481 1890 1022 442v/s Ratio Prot c0.06 0.11 c0.13 c0.11 0.10 c0.20v/s Ratio Perm 0.03 0.03 0.18 0.08v/c Ratio 0.54 0.28 0.59 0.69 0.15 0.54 0.19 0.66 0.25Uniform Delay, d1 48.6 47.1 43.8 44.7 40.1 16.6 13.4 35.8 31.1Progression Factor 1.00 1.00 1.00 1.00 1.00 1.00 1.00 1.00 1.00Incremental Delay, d2 2.8 0.9 2.9 5.8 0.2 1.2 0.1 1.8 0.4Delay (s) 51.4 48.0 46.7 50.5 40.3 17.7 13.4 37.6 31.5Level of Service D D D D D B B D CApproach Delay (s) 48.7 45.8 15.2 36.1Approach LOS D D B DIntersection SummaryHCM 2000 Control Delay 36.2 HCM 2000 Level of Service DHCM 2000 Volume to Capacity ratio 0.67Actuated Cycle Length (s) 116.8 Sum of lost time (s) 30.0Intersection Capacity Utilization 66.8% ICU Level of Service CAnalysis Period (min) 15c Critical Lane Group

HCM Signalized Intersection Capacity Analysis University Ridge Housing Development9: Lincoln St. & S Samish Way/Elwood Ave Existing (2013) PM Peak Hour
Q:\Projects\11\11167 Consolidation Ave Student Housing\Analysis\Traffic Operations\Synchro_SimTraffic\Existing\Existing.synSynchro 8 Report Page 9
Movement EBL EBT EBR WBL WBT WBR NBL NBT NBR SBL SBT SBRLane ConfigurationsVolume (vph) 820 75 305 5 30 10 240 260 5 5 115 300Ideal Flow (vphpl) 1900 1900 1900 1900 1900 1900 1900 1900 1900 1900 1900 1900Total Lost time (s) 5.0 5.0 5.0 5.0 5.0 4.0 5.0 5.0 5.0 5.0Lane Util. Factor 0.95 0.95 1.00 1.00 1.00 1.00 1.00 1.00 1.00 1.00Frpb, ped/bikes 1.00 1.00 0.97 1.00 0.99 1.00 1.00 1.00 1.00 0.99Flpb, ped/bikes 0.99 1.00 1.00 0.99 1.00 1.00 1.00 0.99 1.00 1.00Frt 1.00 1.00 0.85 1.00 0.96 1.00 1.00 1.00 1.00 0.85Flt Protected 0.95 0.96 1.00 0.95 1.00 0.95 1.00 0.95 1.00 1.00Satd. Flow (prot) 1633 1651 1497 1686 1704 1726 1812 1700 1801 1510Flt Permitted 0.73 0.73 1.00 0.68 1.00 0.56 1.00 0.59 1.00 1.00Satd. Flow (perm) 1253 1259 1497 1203 1704 1009 1812 1049 1801 1510Peak-hour factor, PHF 0.94 0.94 0.94 0.94 0.94 0.94 0.94 0.94 0.94 0.94 0.94 0.94Adj. Flow (vph) 872 80 324 5 32 11 255 277 5 5 122 319RTOR Reduction (vph) 0 0 0 0 10 0 0 1 0 0 0 0Lane Group Flow (vph) 471 481 324 5 33 0 255 281 0 5 122 319Confl. Peds. (#/hr) 2 3 3 2 1 5 5 1Heavy Vehicles (%) 1% 1% 1% 3% 3% 3% 1% 1% 1% 2% 2% 2%Turn Type Perm NA Perm Perm NA pm+pt NA pm+pt NA PermProtected Phases 4 3 5 2 1 6Permitted Phases 4 4 3 2 6 6Actuated Green, G (s) 52.4 52.4 52.4 5.9 5.9 54.6 48.5 30.8 29.7 29.7Effective Green, g (s) 52.4 52.4 52.4 5.9 5.9 54.6 48.5 30.8 29.7 29.7Actuated g/C Ratio 0.41 0.41 0.41 0.05 0.05 0.43 0.38 0.24 0.23 0.23Clearance Time (s) 5.0 5.0 5.0 5.0 5.0 4.0 5.0 5.0 5.0 5.0Vehicle Extension (s) 3.0 3.0 3.0 2.0 2.0 2.0 2.0 2.0 3.6 3.6Lane Grp Cap (vph) 513 515 613 55 78 547 687 258 418 350v/s Ratio Prot c0.02 c0.08 0.16 0.00 0.07v/s Ratio Perm 0.38 c0.38 0.22 0.00 0.12 0.00 c0.21v/c Ratio 0.92 0.93 0.53 0.09 0.43 0.47 0.41 0.02 0.29 0.91Uniform Delay, d1 35.7 36.1 28.4 58.4 59.4 24.8 29.2 37.0 40.4 47.8Progression Factor 1.00 1.00 1.00 1.00 1.00 1.00 1.00 1.00 1.00 1.00Incremental Delay, d2 21.3 24.2 0.8 0.3 1.4 0.2 0.1 0.0 0.5 27.4Delay (s) 57.1 60.3 29.3 58.7 60.7 25.1 29.3 37.0 40.9 75.2Level of Service E E C E E C C D D EApproach Delay (s) 51.2 60.5 27.3 65.4Approach LOS D E C EIntersection SummaryHCM 2000 Control Delay 48.6 HCM 2000 Level of Service DHCM 2000 Volume to Capacity ratio 0.82Actuated Cycle Length (s) 127.9 Sum of lost time (s) 20.0Intersection Capacity Utilization 59.6% ICU Level of Service BAnalysis Period (min) 15c Critical Lane Group

HCM Signalized Intersection Capacity Analysis University Ridge Housing Development1: Lincoln St. & Lakeway Dr Baseline (2014) PM Peak Hour
Q:\Projects\11\11167 Consolidation Ave Student Housing\Analysis\Traffic Operations\Synchro_SimTraffic\Baseline\Baseline - Revised.synSynchro 8 Report Page 1
Movement EBL EBT EBR WBL WBT WBR NBL NBT NBR SBL SBT SBRLane ConfigurationsVolume (vph) 30 885 80 220 460 50 175 165 385 90 205 40Ideal Flow (vphpl) 1900 1900 1900 1900 1900 1900 1900 1900 1900 1900 1900 1900Total Lost time (s) 5.0 5.0 5.0 5.0 5.0 5.0 5.0 5.0 5.0 5.0Lane Util. Factor 1.00 0.95 1.00 0.95 1.00 1.00 1.00 1.00 1.00 1.00Frpb, ped/bikes 1.00 1.00 1.00 1.00 0.97 1.00 1.00 0.97 1.00 1.00Flpb, ped/bikes 1.00 1.00 1.00 1.00 1.00 1.00 1.00 1.00 1.00 1.00Frt 1.00 0.99 1.00 1.00 0.85 1.00 1.00 0.85 1.00 0.98Flt Protected 0.95 1.00 0.95 1.00 1.00 0.95 1.00 1.00 0.95 1.00Satd. Flow (prot) 1726 3400 1727 3455 1505 1728 1818 1497 1711 1751Flt Permitted 0.36 1.00 0.17 1.00 1.00 0.95 1.00 1.00 0.95 1.00Satd. Flow (perm) 663 3400 313 3455 1505 1728 1818 1497 1711 1751Peak-hour factor, PHF 0.97 0.97 0.97 0.97 0.97 0.97 0.97 0.97 0.97 0.97 0.97 0.97Adj. Flow (vph) 31 912 82 227 474 52 180 170 397 93 211 41RTOR Reduction (vph) 0 5 0 0 0 32 0 0 302 0 5 0Lane Group Flow (vph) 31 989 0 227 474 20 180 170 95 93 247 0Confl. Peds. (#/hr) 2 17 17 2 6 12 12 6Heavy Vehicles (%) 1% 1% 1% 1% 1% 1% 1% 1% 1% 2% 2% 2%Turn Type pm+pt NA pm+pt NA Perm Prot NA Perm Prot NAProtected Phases 5 2 1 6 3 4 3 4Permitted Phases 2 6 6 4Actuated Green, G (s) 72.4 52.9 61.7 47.2 47.2 17.7 20.2 20.2 17.7 20.2Effective Green, g (s) 72.4 52.9 61.7 47.2 47.2 17.7 20.2 20.2 17.7 20.2Actuated g/C Ratio 0.58 0.42 0.49 0.38 0.38 0.14 0.16 0.16 0.14 0.16Clearance Time (s) 5.0 5.0 5.0 5.0 5.0 5.0 5.0 5.0 5.0 5.0Vehicle Extension (s) 4.0 3.0 3.0 3.0 3.0 4.0 4.0 4.0 4.0 4.0Lane Grp Cap (vph) 554 1435 317 1301 566 244 293 241 241 282v/s Ratio Prot 0.01 c0.29 c0.08 0.14 c0.10 0.09 0.05 c0.14v/s Ratio Perm 0.02 0.27 0.01 0.06v/c Ratio 0.06 0.69 0.72 0.36 0.03 0.74 0.58 0.39 0.39 0.88Uniform Delay, d1 12.0 29.5 21.1 28.2 24.7 51.6 48.6 47.1 48.9 51.3Progression Factor 0.58 0.35 1.00 1.00 1.00 1.00 1.00 1.00 1.00 1.00Incremental Delay, d2 0.0 0.8 7.5 0.2 0.0 11.7 3.4 1.5 1.4 25.3Delay (s) 7.0 11.1 28.6 28.4 24.7 63.3 52.1 48.5 50.3 76.7Level of Service A B C C C E D D D EApproach Delay (s) 11.0 28.2 52.9 69.5Approach LOS B C D EIntersection SummaryHCM 2000 Control Delay 33.5 HCM 2000 Level of Service CHCM 2000 Volume to Capacity ratio 0.74Actuated Cycle Length (s) 125.3 Sum of lost time (s) 20.0Intersection Capacity Utilization 80.1% ICU Level of Service DAnalysis Period (min) 15c Critical Lane Group

HCM Unsignalized Intersection Capacity Analysis University Ridge Housing Development2: Nevada St & Lakeway Dr Baseline (2014) PM Peak Hour
Q:\Projects\11\11167 Consolidation Ave Student Housing\Analysis\Traffic Operations\Synchro_SimTraffic\Baseline\Baseline - Revised.synSynchro 8 Report Page 2
Movement EBT EBR WBL WBT NBL NBRLane ConfigurationsVolume (veh/h) 1280 60 35 770 25 55Sign Control Free Free StopGrade 0% 0% 0%Peak Hour Factor 0.94 0.94 0.94 0.94 0.94 0.94Hourly flow rate (vph) 1362 64 37 819 27 59Pedestrians 4Lane Width (ft) 11.0Walking Speed (ft/s) 4.0Percent Blockage 0Right turn flare (veh) 8Median type TWLTL TWLTLMedian storage veh) 2 2Upstream signal (ft) 642pX, platoon unblocked 0.77 0.77 0.77vC, conflicting volume 1430 1882 717vC1, stage 1 conf vol 1398vC2, stage 2 conf vol 484vCu, unblocked vol 962 1549 38tC, single (s) 4.1 6.8 6.9tC, 2 stage (s) 5.8tF (s) 2.2 3.5 3.3p0 queue free % 93 89 93cM capacity (veh/h) 551 245 793Direction, Lane # EB 1 EB 2 WB 1 WB 2 WB 3 NB 1Volume Total 908 518 37 410 410 85Volume Left 0 0 37 0 0 27Volume Right 0 64 0 0 0 59cSH 1700 1700 551 1700 1700 783Volume to Capacity 0.53 0.30 0.07 0.24 0.24 0.11Queue Length 95th (ft) 0 0 5 0 0 9Control Delay (s) 0.0 0.0 12.0 0.0 0.0 13.5Lane LOS B BApproach Delay (s) 0.0 0.5 13.5Approach LOS BIntersection SummaryAverage Delay 0.7Intersection Capacity Utilization 47.4% ICU Level of Service AAnalysis Period (min) 15

HCM Unsignalized Intersection Capacity Analysis University Ridge Housing Development3: Lincoln St. & E Maple St. Baseline (2014) PM Peak Hour
Q:\Projects\11\11167 Consolidation Ave Student Housing\Analysis\Traffic Operations\Synchro_SimTraffic\Baseline\Baseline - Revised.synSynchro 8 Report Page 3
Movement EBL EBT EBR WBL WBT WBR NBL NBT NBR SBL SBT SBRLane ConfigurationsVolume (veh/h) 5 5 5 45 5 50 5 505 45 75 360 5Sign Control Stop Stop Free FreeGrade 0% 0% 0% 0%Peak Hour Factor 0.96 0.96 0.96 0.96 0.96 0.96 0.96 0.96 0.96 0.96 0.96 0.96Hourly flow rate (vph) 5 5 5 47 5 52 5 526 47 78 375 5Pedestrians 11Lane Width (ft) 11.0Walking Speed (ft/s) 4.0Percent Blockage 1Right turn flare (veh)Median type None TWLTLMedian storage veh) 2Upstream signal (ft)pX, platoon unblockedvC, conflicting volume 1125 1128 378 1110 1107 560 380 584vC1, stage 1 conf vol 534 534 571 571vC2, stage 2 conf vol 591 594 539 536vCu, unblocked vol 1125 1128 378 1110 1107 560 380 584tC, single (s) 7.1 6.5 6.2 7.1 6.5 6.2 4.1 4.1tC, 2 stage (s) 6.1 5.5 6.1 5.5tF (s) 3.5 4.0 3.3 3.5 4.0 3.3 2.2 2.2p0 queue free % 98 99 99 87 99 90 100 92cM capacity (veh/h) 315 348 674 373 381 527 1184 982Direction, Lane # EB 1 WB 1 NB 1 NB 2 SB 1 SB 2Volume Total 16 104 5 573 78 380Volume Left 5 47 5 0 78 0Volume Right 5 52 0 47 0 5cSH 398 437 1184 1700 982 1700Volume to Capacity 0.04 0.24 0.00 0.34 0.08 0.22Queue Length 95th (ft) 3 23 0 0 6 0Control Delay (s) 14.4 15.8 8.1 0.0 9.0 0.0Lane LOS B C A AApproach Delay (s) 14.4 15.8 0.1 1.5Approach LOS B CIntersection SummaryAverage Delay 2.3Intersection Capacity Utilization 52.2% ICU Level of Service AAnalysis Period (min) 15

HCM Unsignalized Intersection Capacity Analysis University Ridge Housing Development4: Ashley Ave & Consolidation Ave Baseline (2014) PM Peak Hour
Q:\Projects\11\11167 Consolidation Ave Student Housing\Analysis\Traffic Operations\Synchro_SimTraffic\Baseline\Baseline - Revised.synSynchro 8 Report Page 4
Movement WBL WBR NBT NBR SBL SBTLane ConfigurationsVolume (veh/h) 15 35 20 15 45 30Sign Control Stop Free FreeGrade 0% 0% 0%Peak Hour Factor 0.80 0.80 0.80 0.80 0.80 0.80Hourly flow rate (vph) 19 44 25 19 56 38Pedestrians 1Lane Width (ft) 11.0Walking Speed (ft/s) 4.0Percent Blockage 0Right turn flare (veh)Median type None NoneMedian storage veh)Upstream signal (ft)pX, platoon unblockedvC, conflicting volume 185 35 45vC1, stage 1 conf volvC2, stage 2 conf volvCu, unblocked vol 185 35 45tC, single (s) 6.4 6.2 4.1tC, 2 stage (s)tF (s) 3.5 3.3 2.2p0 queue free % 98 96 96cM capacity (veh/h) 779 1042 1575Direction, Lane # WB 1 NB 1 SB 1Volume Total 62 44 94Volume Left 19 0 56Volume Right 44 19 0cSH 946 1700 1575Volume to Capacity 0.07 0.03 0.04Queue Length 95th (ft) 5 0 3Control Delay (s) 9.1 0.0 4.5Lane LOS A AApproach Delay (s) 9.1 0.0 4.5Approach LOS AIntersection SummaryAverage Delay 5.0Intersection Capacity Utilization 20.7% ICU Level of Service AAnalysis Period (min) 15

HCM Unsignalized Intersection Capacity Analysis University Ridge Housing Development5: Consolidation Ave & Nevada St Baseline (2014) PM Peak Hour
Q:\Projects\11\11167 Consolidation Ave Student Housing\Analysis\Traffic Operations\Synchro_SimTraffic\Baseline\Baseline - Revised.synSynchro 8 Report Page 5
Movement EBL EBT EBR WBL WBT WBR NBL NBT NBR SBL SBT SBRLane ConfigurationsSign Control Stop Stop Stop StopVolume (vph) 10 0 5 0 0 0 5 5 0 5 10 15Peak Hour Factor 0.90 0.90 0.90 0.90 0.90 0.90 0.90 0.90 0.90 0.90 0.90 0.90Hourly flow rate (vph) 11 0 6 0 0 0 6 6 0 6 11 17Direction, Lane # EB 1 WB 1 NB 1 SB 1Volume Total (vph) 17 0 11 33Volume Left (vph) 11 0 6 6Volume Right (vph) 6 0 0 17Hadj (s) -0.07 0.00 0.10 -0.27Departure Headway (s) 3.9 4.0 4.1 3.7Degree Utilization, x 0.02 0.00 0.01 0.03Capacity (veh/h) 901 900 868 968Control Delay (s) 7.0 7.0 7.1 6.8Approach Delay (s) 7.0 0.0 7.1 6.8Approach LOS A A A AIntersection SummaryDelay 6.9Level of Service AIntersection Capacity Utilization 14.6% ICU Level of Service AAnalysis Period (min) 15

HCM Unsignalized Intersection Capacity Analysis University Ridge Housing Development6: Lincoln St. & I-5 NB On-Ramp Baseline (2014) PM Peak Hour
Q:\Projects\11\11167 Consolidation Ave Student Housing\Analysis\Traffic Operations\Synchro_SimTraffic\Baseline\Baseline - Revised.synSynchro 8 Report Page 6
Movement EBL EBR NBL NBT SBT SBRLane ConfigurationsVolume (veh/h) 0 0 540 565 415 70Sign Control Stop Free FreeGrade 0% 0% 0%Peak Hour Factor 0.92 0.92 0.92 0.92 0.92 0.92Hourly flow rate (vph) 0 0 587 614 451 76Pedestrians 2Lane Width (ft) 0.0Walking Speed (ft/s) 4.0Percent Blockage 0Right turn flare (veh)Median type None NoneMedian storage veh)Upstream signal (ft) 698pX, platoon unblockedvC, conflicting volume 2279 491 529vC1, stage 1 conf volvC2, stage 2 conf volvCu, unblocked vol 2279 491 529tC, single (s) 6.4 6.2 4.1tC, 2 stage (s)tF (s) 3.5 3.3 2.2p0 queue free % 100 100 44cM capacity (veh/h) 19 581 1043Direction, Lane # NB 1 NB 2 SB 1Volume Total 587 614 527Volume Left 587 0 0Volume Right 0 0 76cSH 1043 1700 1700Volume to Capacity 0.56 0.36 0.31Queue Length 95th (ft) 91 0 0Control Delay (s) 12.8 0.0 0.0Lane LOS BApproach Delay (s) 6.3 0.0Approach LOSIntersection SummaryAverage Delay 4.3Intersection Capacity Utilization 62.7% ICU Level of Service BAnalysis Period (min) 15

HCM Signalized Intersection Capacity Analysis University Ridge Housing Development7: Samish Way/N Samish Way & Bill McDonald Parkway/Byron St Baseline (2014) PM Peak Hour
Q:\Projects\11\11167 Consolidation Ave Student Housing\Analysis\Traffic Operations\Synchro_SimTraffic\Baseline\Baseline - Revised.synSynchro 8 Report Page 7
Movement EBL EBT EBR WBL WBT WBR NBL NBT NBR SBL SBT SBRLane ConfigurationsVolume (vph) 270 20 370 35 20 10 285 350 30 15 460 305Ideal Flow (vphpl) 1900 1900 1900 1900 1900 1900 1900 1900 1900 1900 1900 1900Total Lost time (s) 5.0 5.0 5.0 5.0 5.0 5.0 5.0 5.0Lane Util. Factor 1.00 1.00 0.95 1.00 0.95 1.00 0.95 1.00Frpb, ped/bikes 1.00 1.00 1.00 1.00 1.00 1.00 1.00 0.95Flpb, ped/bikes 0.99 1.00 1.00 0.99 1.00 1.00 1.00 1.00Frt 1.00 0.86 0.98 1.00 0.99 1.00 1.00 0.85Flt Protected 0.95 1.00 0.97 0.95 1.00 0.95 1.00 1.00Satd. Flow (prot) 1694 1545 3095 1719 3406 1722 3455 1462Flt Permitted 0.71 1.00 0.64 0.33 1.00 0.52 1.00 1.00Satd. Flow (perm) 1268 1545 2036 593 3406 943 3455 1462Peak-hour factor, PHF 0.97 0.97 0.97 0.97 0.97 0.97 0.97 0.97 0.97 0.97 0.97 0.97Adj. Flow (vph) 278 21 381 36 21 10 294 361 31 15 474 314RTOR Reduction (vph) 0 290 0 0 8 0 0 9 0 0 0 225Lane Group Flow (vph) 278 112 0 0 59 0 294 383 0 15 474 89Confl. Peds. (#/hr) 12 12 36 5 5 36Heavy Vehicles (%) 2% 2% 2% 7% 7% 7% 1% 1% 1% 1% 1% 1%Turn Type Perm NA Perm NA pm+pt NA pm+pt NA PermProtected Phases 4 8 5 2 1 6Permitted Phases 4 8 2 6 6Actuated Green, G (s) 15.2 15.2 15.2 38.2 32.3 18.9 18.0 18.0Effective Green, g (s) 15.2 15.2 15.2 38.2 32.3 18.9 18.0 18.0Actuated g/C Ratio 0.24 0.24 0.24 0.60 0.51 0.30 0.28 0.28Clearance Time (s) 5.0 5.0 5.0 5.0 5.0 5.0 5.0 5.0Vehicle Extension (s) 3.0 3.0 3.0 3.0 3.0 3.0 3.0 3.0Lane Grp Cap (vph) 304 370 488 627 1735 292 980 415v/s Ratio Prot 0.07 c0.11 0.11 0.00 0.14v/s Ratio Perm c0.22 0.03 c0.17 0.01 0.06v/c Ratio 0.91 0.30 0.12 0.47 0.22 0.05 0.48 0.21Uniform Delay, d1 23.5 19.8 18.9 6.7 8.6 15.8 18.8 17.3Progression Factor 1.00 1.00 1.00 1.00 1.00 1.00 1.00 1.00Incremental Delay, d2 30.3 0.5 0.1 0.6 0.1 0.1 0.4 0.3Delay (s) 53.8 20.2 19.0 7.2 8.7 15.8 19.2 17.6Level of Service D C B A A B B BApproach Delay (s) 33.9 19.0 8.0 18.5Approach LOS C B A BIntersection SummaryHCM 2000 Control Delay 20.0 HCM 2000 Level of Service CHCM 2000 Volume to Capacity ratio 0.64Actuated Cycle Length (s) 63.4 Sum of lost time (s) 15.0Intersection Capacity Utilization 72.2% ICU Level of Service CAnalysis Period (min) 15c Critical Lane Group

HCM Signalized Intersection Capacity Analysis University Ridge Housing Development8: S Samish Way/Samish Way & 36th Street/I-5 SB Off-Ramp Baseline (2014) PM Peak Hour
Q:\Projects\11\11167 Consolidation Ave Student Housing\Analysis\Traffic Operations\Synchro_SimTraffic\Baseline\Baseline - Revised.synSynchro 8 Report Page 8
Movement EBL EBT EBR WBL WBT WBR NBL NBT NBR SBL SBT SBRLane ConfigurationsVolume (vph) 110 0 405 180 220 215 245 345 0 0 650 215Ideal Flow (vphpl) 1900 1900 1900 1900 1900 1900 1900 1900 1900 1900 1900 1900Total Lost time (s) 6.0 6.0 6.0 6.0 6.0 5.0 6.0 6.0 6.0Lane Util. Factor 1.00 1.00 1.00 1.00 1.00 1.00 0.95 0.95 1.00Frpb, ped/bikes 1.00 0.99 1.00 1.00 1.00 1.00 1.00 1.00 0.97Flpb, ped/bikes 1.00 1.00 1.00 1.00 1.00 1.00 1.00 1.00 1.00Frt 1.00 0.85 1.00 1.00 0.85 1.00 1.00 1.00 0.85Flt Protected 0.95 1.00 0.95 1.00 1.00 0.95 1.00 1.00 1.00Satd. Flow (prot) 1728 1523 1745 1837 1561 1727 3455 3421 1480Flt Permitted 0.95 1.00 0.95 1.00 1.00 0.19 1.00 1.00 1.00Satd. Flow (perm) 1728 1523 1745 1837 1561 340 3455 3421 1480Peak-hour factor, PHF 0.93 0.93 0.93 0.93 0.93 0.93 0.93 0.93 0.93 0.93 0.93 0.93Adj. Flow (vph) 118 0 435 194 237 231 263 371 0 0 699 231RTOR Reduction (vph) 0 0 382 0 0 188 0 0 0 0 0 111Lane Group Flow (vph) 118 0 53 194 237 43 263 371 0 0 699 120Confl. Peds. (#/hr) 1 1 5 5Heavy Vehicles (%) 1% 1% 1% 0% 0% 0% 1% 1% 1% 2% 2% 2%Turn Type Prot custom Split NA Perm pm+pt NA NA PermProtected Phases 4 3 3 5 2 6Permitted Phases 4 3 2 6Actuated Green, G (s) 14.5 14.5 22.0 22.0 22.0 64.4 64.4 34.9 34.9Effective Green, g (s) 14.5 14.5 22.0 22.0 22.0 64.4 64.4 34.9 34.9Actuated g/C Ratio 0.12 0.12 0.19 0.19 0.19 0.54 0.54 0.29 0.29Clearance Time (s) 6.0 6.0 6.0 6.0 6.0 5.0 6.0 6.0 6.0Vehicle Extension (s) 3.0 3.0 3.0 3.0 3.0 3.0 4.0 4.0 4.0Lane Grp Cap (vph) 210 185 322 339 288 469 1871 1004 434v/s Ratio Prot c0.07 0.11 c0.13 c0.12 0.11 c0.20v/s Ratio Perm 0.03 0.03 0.19 0.08v/c Ratio 0.56 0.29 0.60 0.70 0.15 0.56 0.20 0.70 0.28Uniform Delay, d1 49.2 47.5 44.4 45.4 40.6 17.6 14.0 37.3 32.3Progression Factor 1.00 1.00 1.00 1.00 1.00 1.00 1.00 1.00 1.00Incremental Delay, d2 3.4 0.9 3.2 6.2 0.2 1.5 0.1 2.3 0.5Delay (s) 52.6 48.4 47.6 51.5 40.8 19.1 14.1 39.6 32.8Level of Service D D D D D B B D CApproach Delay (s) 49.3 46.7 16.2 37.9Approach LOS D D B DIntersection SummaryHCM 2000 Control Delay 37.3 HCM 2000 Level of Service DHCM 2000 Volume to Capacity ratio 0.69Actuated Cycle Length (s) 118.9 Sum of lost time (s) 30.0Intersection Capacity Utilization 68.2% ICU Level of Service CAnalysis Period (min) 15c Critical Lane Group
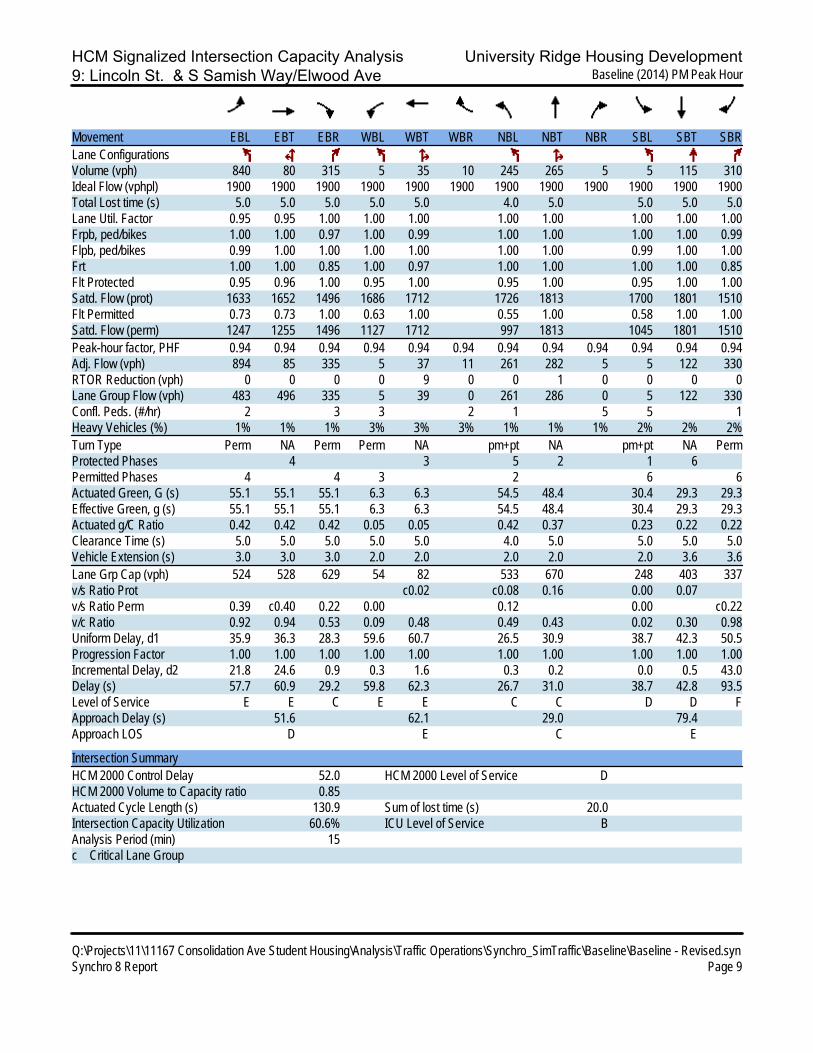
HCM Signalized Intersection Capacity Analysis University Ridge Housing Development9: Lincoln St. & S Samish Way/Elwood Ave Baseline (2014) PM Peak Hour
Q:\Projects\11\11167 Consolidation Ave Student Housing\Analysis\Traffic Operations\Synchro_SimTraffic\Baseline\Baseline - Revised.synSynchro 8 Report Page 9
Movement EBL EBT EBR WBL WBT WBR NBL NBT NBR SBL SBT SBRLane ConfigurationsVolume (vph) 840 80 315 5 35 10 245 265 5 5 115 310Ideal Flow (vphpl) 1900 1900 1900 1900 1900 1900 1900 1900 1900 1900 1900 1900Total Lost time (s) 5.0 5.0 5.0 5.0 5.0 4.0 5.0 5.0 5.0 5.0Lane Util. Factor 0.95 0.95 1.00 1.00 1.00 1.00 1.00 1.00 1.00 1.00Frpb, ped/bikes 1.00 1.00 0.97 1.00 0.99 1.00 1.00 1.00 1.00 0.99Flpb, ped/bikes 0.99 1.00 1.00 1.00 1.00 1.00 1.00 0.99 1.00 1.00Frt 1.00 1.00 0.85 1.00 0.97 1.00 1.00 1.00 1.00 0.85Flt Protected 0.95 0.96 1.00 0.95 1.00 0.95 1.00 0.95 1.00 1.00Satd. Flow (prot) 1633 1652 1496 1686 1712 1726 1813 1700 1801 1510Flt Permitted 0.73 0.73 1.00 0.63 1.00 0.55 1.00 0.58 1.00 1.00Satd. Flow (perm) 1247 1255 1496 1127 1712 997 1813 1045 1801 1510Peak-hour factor, PHF 0.94 0.94 0.94 0.94 0.94 0.94 0.94 0.94 0.94 0.94 0.94 0.94Adj. Flow (vph) 894 85 335 5 37 11 261 282 5 5 122 330RTOR Reduction (vph) 0 0 0 0 9 0 0 1 0 0 0 0Lane Group Flow (vph) 483 496 335 5 39 0 261 286 0 5 122 330Confl. Peds. (#/hr) 2 3 3 2 1 5 5 1Heavy Vehicles (%) 1% 1% 1% 3% 3% 3% 1% 1% 1% 2% 2% 2%Turn Type Perm NA Perm Perm NA pm+pt NA pm+pt NA PermProtected Phases 4 3 5 2 1 6Permitted Phases 4 4 3 2 6 6Actuated Green, G (s) 55.1 55.1 55.1 6.3 6.3 54.5 48.4 30.4 29.3 29.3Effective Green, g (s) 55.1 55.1 55.1 6.3 6.3 54.5 48.4 30.4 29.3 29.3Actuated g/C Ratio 0.42 0.42 0.42 0.05 0.05 0.42 0.37 0.23 0.22 0.22Clearance Time (s) 5.0 5.0 5.0 5.0 5.0 4.0 5.0 5.0 5.0 5.0Vehicle Extension (s) 3.0 3.0 3.0 2.0 2.0 2.0 2.0 2.0 3.6 3.6Lane Grp Cap (vph) 524 528 629 54 82 533 670 248 403 337v/s Ratio Prot c0.02 c0.08 0.16 0.00 0.07v/s Ratio Perm 0.39 c0.40 0.22 0.00 0.12 0.00 c0.22v/c Ratio 0.92 0.94 0.53 0.09 0.48 0.49 0.43 0.02 0.30 0.98Uniform Delay, d1 35.9 36.3 28.3 59.6 60.7 26.5 30.9 38.7 42.3 50.5Progression Factor 1.00 1.00 1.00 1.00 1.00 1.00 1.00 1.00 1.00 1.00Incremental Delay, d2 21.8 24.6 0.9 0.3 1.6 0.3 0.2 0.0 0.5 43.0Delay (s) 57.7 60.9 29.2 59.8 62.3 26.7 31.0 38.7 42.8 93.5Level of Service E E C E E C C D D FApproach Delay (s) 51.6 62.1 29.0 79.4Approach LOS D E C EIntersection SummaryHCM 2000 Control Delay 52.0 HCM 2000 Level of Service DHCM 2000 Volume to Capacity ratio 0.85Actuated Cycle Length (s) 130.9 Sum of lost time (s) 20.0Intersection Capacity Utilization 60.6% ICU Level of Service BAnalysis Period (min) 15c Critical Lane Group

HCM Signalized Intersection Capacity Analysis University Ridge Student Housing1: Lincoln St. & Lakeway Dr With-Project (2014) PM Peak Hour
Q:\Projects\11\11167 Consolidation Ave Student Housing\Analysis\Traffic Operations\Synchro_SimTraffic\With_Project\2014 With-project - LU223 with traSynchro 8 Report Page 1
Movement EBL EBT EBR WBL WBT WBR NBL NBT NBR SBL SBT SBRLane ConfigurationsVolume (vph) 30 888 82 220 464 50 175 165 385 90 205 40Ideal Flow (vphpl) 1900 1900 1900 1900 1900 1900 1900 1900 1900 1900 1900 1900Total Lost time (s) 5.0 5.0 5.0 5.0 5.0 5.0 5.0 5.0 5.0 5.0Lane Util. Factor 1.00 0.95 1.00 0.95 1.00 1.00 1.00 1.00 1.00 1.00Frt 1.00 0.99 1.00 1.00 0.85 1.00 1.00 0.85 1.00 0.98Flt Protected 0.95 1.00 0.95 1.00 1.00 0.95 1.00 1.00 0.95 1.00Satd. Flow (prot) 1728 3411 1728 3455 1546 1728 1818 1546 1711 1757Flt Permitted 0.35 1.00 0.16 1.00 1.00 0.95 1.00 1.00 0.95 1.00Satd. Flow (perm) 645 3411 295 3455 1546 1728 1818 1546 1711 1757Peak-hour factor, PHF 0.97 0.97 0.97 0.97 0.97 0.97 0.97 0.97 0.97 0.97 0.97 0.97Adj. Flow (vph) 31 915 85 227 478 52 180 170 397 93 211 41RTOR Reduction (vph) 0 5 0 0 0 33 0 0 303 0 5 0Lane Group Flow (vph) 31 995 0 227 478 19 180 170 94 93 247 0Heavy Vehicles (%) 1% 1% 1% 1% 1% 1% 1% 1% 1% 2% 2% 2%Turn Type pm+pt NA pm+pt NA Perm Prot NA Perm Prot NAProtected Phases 5 2 1 6 3 4 3 4Permitted Phases 2 6 6 4Actuated Green, G (s) 69.3 49.8 58.5 44.0 44.0 17.5 20.3 20.3 17.5 20.3Effective Green, g (s) 69.3 49.8 58.5 44.0 44.0 17.5 20.3 20.3 17.5 20.3Actuated g/C Ratio 0.57 0.41 0.48 0.36 0.36 0.14 0.17 0.17 0.14 0.17Clearance Time (s) 5.0 5.0 5.0 5.0 5.0 5.0 5.0 5.0 5.0 5.0Vehicle Extension (s) 4.0 3.0 3.0 3.0 3.0 4.0 4.0 4.0 4.0 4.0Lane Grp Cap (vph) 546 1391 311 1245 557 247 302 257 245 292v/s Ratio Prot 0.01 c0.29 c0.09 0.14 c0.10 0.09 0.05 c0.14v/s Ratio Perm 0.02 0.26 0.01 0.06v/c Ratio 0.06 0.72 0.73 0.38 0.03 0.73 0.56 0.37 0.38 0.85Uniform Delay, d1 12.3 30.2 21.7 29.0 25.3 50.0 46.8 45.2 47.4 49.4Progression Factor 0.54 0.31 1.00 1.00 1.00 1.00 1.00 1.00 1.00 1.00Incremental Delay, d2 0.0 1.2 8.3 0.2 0.0 10.9 2.9 1.2 1.3 20.3Delay (s) 6.7 10.7 30.0 29.2 25.3 61.0 49.7 46.4 48.7 69.7Level of Service A B C C C E D D D EApproach Delay (s) 10.6 29.2 50.7 64.0Approach LOS B C D EIntersection SummaryHCM 2000 Control Delay 32.3 HCM 2000 Level of Service CHCM 2000 Volume to Capacity ratio 0.74Actuated Cycle Length (s) 122.1 Sum of lost time (s) 20.0Intersection Capacity Utilization 78.9% ICU Level of Service DAnalysis Period (min) 15c Critical Lane Group

HCM Unsignalized Intersection Capacity Analysis University Ridge Student Housing2: Nevada St & Lakeway Dr With-Project (2014) PM Peak Hour
Q:\Projects\11\11167 Consolidation Ave Student Housing\Analysis\Traffic Operations\Synchro_SimTraffic\With_Project\2014 With-project - LU223 with traSynchro 8 Report Page 2
Movement EBT EBR WBL WBT NBL NBRLane ConfigurationsVolume (veh/h) 1280 63 35 770 29 55Sign Control Free Free StopGrade 0% 0% 0%Peak Hour Factor 0.94 0.94 0.94 0.94 0.94 0.94Hourly flow rate (vph) 1362 67 37 819 31 59PedestriansLane Width (ft)Walking Speed (ft/s)Percent BlockageRight turn flare (veh) 8Median type TWLTL TWLTLMedian storage veh) 2 2Upstream signal (ft) 642pX, platoon unblocked 0.76 0.76 0.76vC, conflicting volume 1429 1879 714vC1, stage 1 conf vol 1395vC2, stage 2 conf vol 484vCu, unblocked vol 943 1533 8tC, single (s) 4.1 6.8 6.9tC, 2 stage (s) 5.8tF (s) 2.2 3.5 3.3p0 queue free % 93 88 93cM capacity (veh/h) 557 249 824Direction, Lane # EB 1 EB 2 WB 1 WB 2 WB 3 NB 1Volume Total 908 521 37 410 410 89Volume Left 0 0 37 0 0 31Volume Right 0 67 0 0 0 59cSH 1700 1700 557 1700 1700 721Volume to Capacity 0.53 0.31 0.07 0.24 0.24 0.12Queue Length 95th (ft) 0 0 5 0 0 11Control Delay (s) 0.0 0.0 11.9 0.0 0.0 13.8Lane LOS B BApproach Delay (s) 0.0 0.5 13.8Approach LOS BIntersection SummaryAverage Delay 0.7Intersection Capacity Utilization 47.5% ICU Level of Service AAnalysis Period (min) 15

HCM Unsignalized Intersection Capacity Analysis University Ridge Student Housing3: Lincoln St. & E Maple St With-Project (2014) PM Peak Hour
Q:\Projects\11\11167 Consolidation Ave Student Housing\Analysis\Traffic Operations\Synchro_SimTraffic\With_Project\2014 With-project - LU223 with traSynchro 8 Report Page 3
Movement EBL EBT EBR WBL WBT WBR NBL NBT NBR SBL SBT SBRLane ConfigurationsVolume (veh/h) 5 5 5 66 5 50 5 505 74 77 360 5Sign Control Stop Stop Free FreeGrade 0% 0% 0% 0%Peak Hour Factor 0.96 0.96 0.96 0.96 0.96 0.96 0.96 0.96 0.96 0.96 0.96 0.96Hourly flow rate (vph) 5 5 5 69 5 52 5 526 77 80 375 5PedestriansLane Width (ft)Walking Speed (ft/s)Percent BlockageRight turn flare (veh)Median type None TWLTLMedian storage veh) 2Upstream signal (ft)pX, platoon unblockedvC, conflicting volume 1129 1152 378 1118 1116 565 380 603vC1, stage 1 conf vol 538 538 575 575vC2, stage 2 conf vol 591 614 543 541vCu, unblocked vol 1129 1152 378 1118 1116 565 380 603tC, single (s) 7.1 6.5 6.2 7.1 6.5 6.2 4.1 4.1tC, 2 stage (s) 6.1 5.5 6.1 5.5tF (s) 3.5 4.0 3.3 3.5 4.0 3.3 2.2 2.2p0 queue free % 98 98 99 82 99 90 100 92cM capacity (veh/h) 313 343 674 372 380 529 1184 974Direction, Lane # EB 1 WB 1 NB 1 NB 2 SB 1 SB 2Volume Total 16 126 5 603 80 380Volume Left 5 69 5 0 80 0Volume Right 5 52 0 77 0 5cSH 395 424 1184 1700 974 1700Volume to Capacity 0.04 0.30 0.00 0.35 0.08 0.22Queue Length 95th (ft) 3 31 0 0 7 0Control Delay (s) 14.5 17.0 8.1 0.0 9.0 0.0Lane LOS B C A AApproach Delay (s) 14.5 17.0 0.1 1.6Approach LOS B CIntersection SummaryAverage Delay 2.6Intersection Capacity Utilization 56.9% ICU Level of Service BAnalysis Period (min) 15

HCM Unsignalized Intersection Capacity Analysis University Ridge Student Housing4: Ashley Ave/E Maple St & Consolidation Ave With-Project (2014) PM Peak Hour
Q:\Projects\11\11167 Consolidation Ave Student Housing\Analysis\Traffic Operations\Synchro_SimTraffic\With_Project\2014 With-project - LU223 with traSynchro 8 Report Page 4
Movement WBL WBR NBT NBR SBL SBTLane ConfigurationsVolume (veh/h) 15 56 20 15 76 30Sign Control Stop Free FreeGrade 0% 0% 0%Peak Hour Factor 0.80 0.80 0.80 0.80 0.80 0.80Hourly flow rate (vph) 19 70 25 19 95 38PedestriansLane Width (ft)Walking Speed (ft/s)Percent BlockageRight turn flare (veh)Median type None NoneMedian storage veh)Upstream signal (ft)pX, platoon unblockedvC, conflicting volume 262 34 44vC1, stage 1 conf volvC2, stage 2 conf volvCu, unblocked vol 262 34 44tC, single (s) 6.4 6.2 4.1tC, 2 stage (s)tF (s) 3.5 3.3 2.2p0 queue free % 97 93 94cM capacity (veh/h) 687 1044 1578Direction, Lane # WB 1 NB 1 SB 1Volume Total 89 44 132Volume Left 19 0 95Volume Right 70 19 0cSH 941 1700 1578Volume to Capacity 0.09 0.03 0.06Queue Length 95th (ft) 8 0 5Control Delay (s) 9.2 0.0 5.5Lane LOS A AApproach Delay (s) 9.2 0.0 5.5Approach LOS AIntersection SummaryAverage Delay 5.8Intersection Capacity Utilization 23.4% ICU Level of Service AAnalysis Period (min) 15

HCM Unsignalized Intersection Capacity Analysis University Ridge Student Housing5: Consolidation Ave & Nevada St With-Project (2014) PM Peak Hour
Q:\Projects\11\11167 Consolidation Ave Student Housing\Analysis\Traffic Operations\Synchro_SimTraffic\With_Project\2014 With-project - LU223 with traSynchro 8 Report Page 5
Movement EBL EBT EBR WBL WBT WBR NBL NBT NBR SBL SBT SBRLane ConfigurationsSign Control Stop Stop Stop StopVolume (vph) 10 31 5 0 21 4 5 5 0 8 10 15Peak Hour Factor 0.90 0.90 0.90 0.90 0.90 0.90 0.90 0.90 0.90 0.90 0.90 0.90Hourly flow rate (vph) 11 34 6 0 23 4 6 6 0 9 11 17Direction, Lane # EB 1 WB 1 NB 1 SB 1Volume Total (vph) 51 28 11 37Volume Left (vph) 11 0 6 9Volume Right (vph) 6 4 0 17Hadj (s) -0.02 -0.10 0.10 -0.22Departure Headway (s) 4.0 4.0 4.2 3.9Degree Utilization, x 0.06 0.03 0.01 0.04Capacity (veh/h) 882 893 829 911Control Delay (s) 7.2 7.1 7.3 7.0Approach Delay (s) 7.2 7.1 7.3 7.0Approach LOS A A A AIntersection SummaryDelay 7.1Level of Service AIntersection Capacity Utilization 19.2% ICU Level of Service AAnalysis Period (min) 15

HCM Unsignalized Intersection Capacity Analysis University Ridge Student Housing6: Lincoln St. & I-5 NB Ramp With-Project (2014) PM Peak Hour
Q:\Projects\11\11167 Consolidation Ave Student Housing\Analysis\Traffic Operations\Synchro_SimTraffic\With_Project\2014 With-project - LU223 with traSynchro 8 Report Page 6
Movement EBL EBR NBL NBT SBT SBRLane ConfigurationsVolume (veh/h) 0 0 540 594 428 78Sign Control Stop Free FreeGrade 0% 0% 0%Peak Hour Factor 0.92 0.92 0.92 0.92 0.92 0.92Hourly flow rate (vph) 0 0 587 646 465 85PedestriansLane Width (ft)Walking Speed (ft/s)Percent BlockageRight turn flare (veh)Median type None NoneMedian storage veh)Upstream signal (ft) 698pX, platoon unblockedvC, conflicting volume 2327 508 550vC1, stage 1 conf volvC2, stage 2 conf volvCu, unblocked vol 2327 508 550tC, single (s) 6.4 6.2 4.1tC, 2 stage (s)tF (s) 3.5 3.3 2.2p0 queue free % 100 100 43cM capacity (veh/h) 18 569 1025Direction, Lane # NB 1 NB 2 SB 1Volume Total 587 646 550Volume Left 587 0 0Volume Right 0 0 85cSH 1025 1700 1700Volume to Capacity 0.57 0.38 0.32Queue Length 95th (ft) 94 0 0Control Delay (s) 13.1 0.0 0.0Lane LOS BApproach Delay (s) 6.2 0.0Approach LOSIntersection SummaryAverage Delay 4.3Intersection Capacity Utilization 63.8% ICU Level of Service BAnalysis Period (min) 15

HCM Signalized Intersection Capacity Analysis University Ridge Student Housing7: Bill McDonald Parkway/Byron St & N Samish Way With-Project (2014) PM Peak Hour
Q:\Projects\11\11167 Consolidation Ave Student Housing\Analysis\Traffic Operations\Synchro_SimTraffic\With_Project\2014 With-project - LU223 with traSynchro 8 Report Page 7
Movement EBL EBT EBR WBL WBT WBR NBL NBT NBR SBL SBT SBRLane ConfigurationsVolume (vph) 270 20 382 35 20 10 293 350 30 15 460 305Ideal Flow (vphpl) 1900 1900 1900 1900 1900 1900 1900 1900 1900 1900 1900 1900Total Lost time (s) 5.0 5.0 5.0 5.0 5.0 5.0 5.0 5.0Lane Util. Factor 1.00 1.00 0.95 1.00 0.95 1.00 0.95 1.00Frt 1.00 0.86 0.98 1.00 0.99 1.00 1.00 0.85Flt Protected 0.95 1.00 0.97 0.95 1.00 0.95 1.00 1.00Satd. Flow (prot) 1711 1544 3105 1728 3414 1728 3455 1546Flt Permitted 0.71 1.00 0.63 0.33 1.00 0.52 1.00 1.00Satd. Flow (perm) 1280 1544 2005 593 3414 946 3455 1546Peak-hour factor, PHF 0.97 0.97 0.97 0.97 0.97 0.97 0.97 0.97 0.97 0.97 0.97 0.97Adj. Flow (vph) 278 21 394 36 21 10 302 361 31 15 474 314RTOR Reduction (vph) 0 300 0 0 8 0 0 9 0 0 0 226Lane Group Flow (vph) 278 115 0 0 59 0 302 383 0 15 474 88Heavy Vehicles (%) 2% 2% 2% 7% 7% 7% 1% 1% 1% 1% 1% 1%Turn Type Perm NA Perm NA pm+pt NA pm+pt NA PermProtected Phases 4 8 5 2 1 6Permitted Phases 4 8 2 6 6Actuated Green, G (s) 15.2 15.2 15.2 38.5 32.7 18.7 17.9 17.9Effective Green, g (s) 15.2 15.2 15.2 38.5 32.7 18.7 17.9 17.9Actuated g/C Ratio 0.24 0.24 0.24 0.60 0.51 0.29 0.28 0.28Clearance Time (s) 5.0 5.0 5.0 5.0 5.0 5.0 5.0 5.0Vehicle Extension (s) 3.0 3.0 3.0 3.0 3.0 3.0 3.0 3.0Lane Grp Cap (vph) 305 368 478 636 1752 287 970 434v/s Ratio Prot 0.07 c0.12 0.11 0.00 0.14v/s Ratio Perm c0.22 0.03 c0.17 0.01 0.06v/c Ratio 0.91 0.31 0.12 0.47 0.22 0.05 0.49 0.20Uniform Delay, d1 23.6 20.0 19.0 6.7 8.5 16.0 19.1 17.5Progression Factor 1.00 1.00 1.00 1.00 1.00 1.00 1.00 1.00Incremental Delay, d2 29.8 0.5 0.1 0.6 0.1 0.1 0.4 0.2Delay (s) 53.4 20.4 19.1 7.3 8.6 16.1 19.5 17.7Level of Service D C B A A B B BApproach Delay (s) 33.6 19.1 8.0 18.7Approach LOS C B A BIntersection SummaryHCM 2000 Control Delay 20.0 HCM 2000 Level of Service CHCM 2000 Volume to Capacity ratio 0.64Actuated Cycle Length (s) 63.7 Sum of lost time (s) 15.0Intersection Capacity Utilization 72.0% ICU Level of Service CAnalysis Period (min) 15c Critical Lane Group
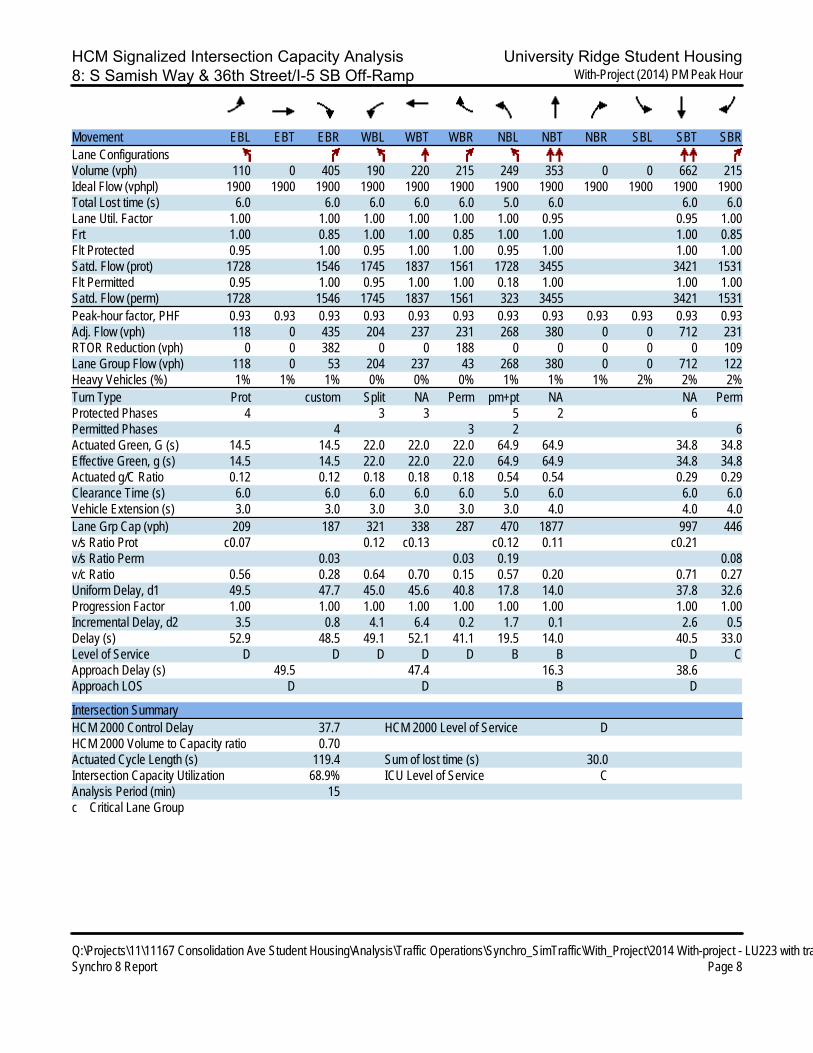
HCM Signalized Intersection Capacity Analysis University Ridge Student Housing8: S Samish Way & 36th Street/I-5 SB Off-Ramp With-Project (2014) PM Peak Hour
Q:\Projects\11\11167 Consolidation Ave Student Housing\Analysis\Traffic Operations\Synchro_SimTraffic\With_Project\2014 With-project - LU223 with traSynchro 8 Report Page 8
Movement EBL EBT EBR WBL WBT WBR NBL NBT NBR SBL SBT SBRLane ConfigurationsVolume (vph) 110 0 405 190 220 215 249 353 0 0 662 215Ideal Flow (vphpl) 1900 1900 1900 1900 1900 1900 1900 1900 1900 1900 1900 1900Total Lost time (s) 6.0 6.0 6.0 6.0 6.0 5.0 6.0 6.0 6.0Lane Util. Factor 1.00 1.00 1.00 1.00 1.00 1.00 0.95 0.95 1.00Frt 1.00 0.85 1.00 1.00 0.85 1.00 1.00 1.00 0.85Flt Protected 0.95 1.00 0.95 1.00 1.00 0.95 1.00 1.00 1.00Satd. Flow (prot) 1728 1546 1745 1837 1561 1728 3455 3421 1531Flt Permitted 0.95 1.00 0.95 1.00 1.00 0.18 1.00 1.00 1.00Satd. Flow (perm) 1728 1546 1745 1837 1561 323 3455 3421 1531Peak-hour factor, PHF 0.93 0.93 0.93 0.93 0.93 0.93 0.93 0.93 0.93 0.93 0.93 0.93Adj. Flow (vph) 118 0 435 204 237 231 268 380 0 0 712 231RTOR Reduction (vph) 0 0 382 0 0 188 0 0 0 0 0 109Lane Group Flow (vph) 118 0 53 204 237 43 268 380 0 0 712 122Heavy Vehicles (%) 1% 1% 1% 0% 0% 0% 1% 1% 1% 2% 2% 2%Turn Type Prot custom Split NA Perm pm+pt NA NA PermProtected Phases 4 3 3 5 2 6Permitted Phases 4 3 2 6Actuated Green, G (s) 14.5 14.5 22.0 22.0 22.0 64.9 64.9 34.8 34.8Effective Green, g (s) 14.5 14.5 22.0 22.0 22.0 64.9 64.9 34.8 34.8Actuated g/C Ratio 0.12 0.12 0.18 0.18 0.18 0.54 0.54 0.29 0.29Clearance Time (s) 6.0 6.0 6.0 6.0 6.0 5.0 6.0 6.0 6.0Vehicle Extension (s) 3.0 3.0 3.0 3.0 3.0 3.0 4.0 4.0 4.0Lane Grp Cap (vph) 209 187 321 338 287 470 1877 997 446v/s Ratio Prot c0.07 0.12 c0.13 c0.12 0.11 c0.21v/s Ratio Perm 0.03 0.03 0.19 0.08v/c Ratio 0.56 0.28 0.64 0.70 0.15 0.57 0.20 0.71 0.27Uniform Delay, d1 49.5 47.7 45.0 45.6 40.8 17.8 14.0 37.8 32.6Progression Factor 1.00 1.00 1.00 1.00 1.00 1.00 1.00 1.00 1.00Incremental Delay, d2 3.5 0.8 4.1 6.4 0.2 1.7 0.1 2.6 0.5Delay (s) 52.9 48.5 49.1 52.1 41.1 19.5 14.0 40.5 33.0Level of Service D D D D D B B D CApproach Delay (s) 49.5 47.4 16.3 38.6Approach LOS D D B DIntersection SummaryHCM 2000 Control Delay 37.7 HCM 2000 Level of Service DHCM 2000 Volume to Capacity ratio 0.70Actuated Cycle Length (s) 119.4 Sum of lost time (s) 30.0Intersection Capacity Utilization 68.9% ICU Level of Service CAnalysis Period (min) 15c Critical Lane Group

HCM Signalized Intersection Capacity Analysis University Ridge Student Housing9: Lincoln St. & S Samish Way/Elwood Ave With-Project (2014) PM Peak Hour
Q:\Projects\11\11167 Consolidation Ave Student Housing\Analysis\Traffic Operations\Synchro_SimTraffic\With_Project\2014 With-project - LU223 with traSynchro 8 Report Page 9
Movement EBL EBT EBR WBL WBT WBR NBL NBT NBR SBL SBT SBRLane ConfigurationsVolume (vph) 862 80 315 5 35 10 245 272 5 5 116 322Ideal Flow (vphpl) 1900 1900 1900 1900 1900 1900 1900 1900 1900 1900 1900 1900Total Lost time (s) 5.0 5.0 5.0 5.0 5.0 4.0 5.0 5.0 5.0 5.0Lane Util. Factor 0.95 0.95 1.00 1.00 1.00 1.00 1.00 1.00 1.00 1.00Frt 1.00 1.00 0.85 1.00 0.97 1.00 1.00 1.00 1.00 0.85Flt Protected 0.95 0.96 1.00 0.95 1.00 0.95 1.00 0.95 1.00 1.00Satd. Flow (prot) 1641 1659 1546 1694 1722 1728 1814 1711 1801 1531Flt Permitted 0.73 0.73 1.00 0.63 1.00 0.55 1.00 0.58 1.00 1.00Satd. Flow (perm) 1254 1259 1546 1132 1722 993 1814 1045 1801 1531Peak-hour factor, PHF 0.94 0.94 0.94 0.94 0.94 0.94 0.94 0.94 0.94 0.94 0.94 0.94Adj. Flow (vph) 917 85 335 5 37 11 261 289 5 5 123 343RTOR Reduction (vph) 0 0 0 0 9 0 0 1 0 0 0 0Lane Group Flow (vph) 495 507 335 5 39 0 261 293 0 5 123 343Heavy Vehicles (%) 1% 1% 1% 3% 3% 3% 1% 1% 1% 2% 2% 2%Turn Type Perm NA Perm Perm NA pm+pt NA pm+pt NA PermProtected Phases 4 3 5 2 1 6Permitted Phases 4 4 3 2 6 6Actuated Green, G (s) 55.4 55.4 55.4 6.3 6.3 54.4 48.3 30.3 29.2 29.2Effective Green, g (s) 55.4 55.4 55.4 6.3 6.3 54.4 48.3 30.3 29.2 29.2Actuated g/C Ratio 0.42 0.42 0.42 0.05 0.05 0.41 0.37 0.23 0.22 0.22Clearance Time (s) 5.0 5.0 5.0 5.0 5.0 4.0 5.0 5.0 5.0 5.0Vehicle Extension (s) 3.0 3.0 3.0 2.0 2.0 2.0 2.0 2.0 3.6 3.6Lane Grp Cap (vph) 529 532 653 54 82 530 668 247 401 341v/s Ratio Prot c0.02 c0.08 0.16 0.00 0.07v/s Ratio Perm 0.39 c0.40 0.22 0.00 0.12 0.00 c0.22v/c Ratio 0.94 0.95 0.51 0.09 0.48 0.49 0.44 0.02 0.31 1.01Uniform Delay, d1 36.1 36.6 27.9 59.7 60.8 26.6 31.2 38.9 42.5 50.9Progression Factor 1.00 1.00 1.00 1.00 1.00 1.00 1.00 1.00 1.00 1.00Incremental Delay, d2 24.0 27.5 0.7 0.3 1.6 0.3 0.2 0.0 0.5 50.2Delay (s) 60.2 64.1 28.6 59.9 62.4 26.9 31.4 38.9 43.0 101.2Level of Service E E C E E C C D D FApproach Delay (s) 53.7 62.2 29.3 85.3Approach LOS D E C FIntersection SummaryHCM 2000 Control Delay 54.5 HCM 2000 Level of Service DHCM 2000 Volume to Capacity ratio 0.86Actuated Cycle Length (s) 131.1 Sum of lost time (s) 20.0Intersection Capacity Utilization 61.2% ICU Level of Service BAnalysis Period (min) 15c Critical Lane Group

HCM Unsignalized Intersection Capacity Analysis University Ridge Student Housing10: Consolidation Ave & Site Access With-Project (2014) PM Peak Hour
Q:\Projects\11\11167 Consolidation Ave Student Housing\Analysis\Traffic Operations\Synchro_SimTraffic\With_Project\2014 With-project - LU223 with traSynchro 8 Report Page 10
Movement EBL EBT WBT WBR SBL SBRLane ConfigurationsVolume (veh/h) 34 5 0 0 0 25Sign Control Free Free StopGrade 0% 0% 0%Peak Hour Factor 0.93 0.93 0.93 0.93 0.93 0.93Hourly flow rate (vph) 37 5 0 0 0 27PedestriansLane Width (ft)Walking Speed (ft/s)Percent BlockageRight turn flare (veh)Median type None NoneMedian storage veh)Upstream signal (ft)pX, platoon unblockedvC, conflicting volume 0 78 0vC1, stage 1 conf volvC2, stage 2 conf volvCu, unblocked vol 0 78 0tC, single (s) 4.1 6.4 6.2tC, 2 stage (s)tF (s) 2.2 3.5 3.3p0 queue free % 98 100 98cM capacity (veh/h) 1623 903 1085Direction, Lane # EB 1 WB 1 SB 1Volume Total 42 0 27Volume Left 37 0 0Volume Right 0 0 27cSH 1623 1700 1085Volume to Capacity 0.02 0.00 0.02Queue Length 95th (ft) 2 0 2Control Delay (s) 6.4 0.0 8.4Lane LOS A AApproach Delay (s) 6.4 0.0 8.4Approach LOS AIntersection SummaryAverage Delay 7.2Intersection Capacity Utilization 13.3% ICU Level of Service AAnalysis Period (min) 15