university of nairobicivil.uonbi.ac.ke/sites/default/files/cae/engineering/civil/musilu... ·...
TRANSCRIPT

UNIVERSITY OF NAIROBI
AN INVESTIGATION OF THE PROPERTIES OF CONCRETE CONTAINING GRANULATED PLASTIC BOTTLE
WASTE AS A PARTIAL REPLACEMENT OF FINE AGGREGATES
BY
MUSILU JUDITH MALI
F16/2292/2009
SUPERVISOR: DR. (ENG) JOHN MWERO
A project submitted as a partial fulfillment of the requirement for the award of the degree of
BACHELOR OF SCIENCE IN CIVIL ENGINEERING
2014

1
ABSTRACT
Solid waste is one of the major environmental issues facing our country today. This study is
focused on the use of granulated plastics as a partial replacement of fine aggregates in concrete.
The aim was to investigate the characteristics of concrete with the addition of plastic and
comparing it with the control, thereby determining the advantages and disadvantages of doing
so.
In the lab concrete was mixed, cast, cured and tested. The fresh concrete was tested for slump
test and the compaction factor test, while the hardened concrete for compressive, tensile and
flexural strength. There were four batches, the control and 10%, 30% and 50% weight
replacement of sand with granulated plastic.
It was found that addition of plastic in concrete resulted in the formation of lightweight concrete.
The compressive, tensile, flexural strength of concrete reduced with the addition of plastic.

2
DEDICATION
I dedicate this research work to the Almighty God who has brought me this far. To my parents
who continually gave to me love, moral and financial support to undertake my studies. You have
indeed helped me come this far. God bless you.

3
ACKNOWLEDGEMENT
To the Almighty God for His strength, provision and protection during this project period. Special
thanks to my supervisor Dr. (Eng.) John Mwero, for the guidance, support and advice. His
comments and suggestions during the preparation of this project are gratefully acknowledged.
Further appreciation goes to the concrete laboratory technicians, Mr. Muchina and Mr. Martin
among others for guidance and assistance during the laboratory work period of this project.
To my good friends among them Sunday, Mwangi, Mevys and Bush for their encouragement.
Lastly, I would like to appreciate my family for their continuous prayers during the whole period
of my study.
To all I say thank you and may God bless you.

4
Table of Contents
ABSTRACT……………………………………………………………………………………………………………………………………………….1
DEDICATION……………………………………………………………………………………………………………………………………………2
ACKNOWLEGMENT…………………………………………………………………………………………………………………………………3
TABLE OF CONTENTS…………………………………………………………………...............................................................4
LIST OF FIGURES……………………………………………………………………………………………………………………………………..7
LIST OF TABLES……………………………………………………………………………………………………………………………………….8
LIST OF PLATES……………………………………………………………………………………………………………………………………….9
CHAPTER 1 .............................................................................................................................................. 10
1.0 INTRODUCTION ................................................................................................................................ 10
1.1 Background ....................................................................................................................................... 10
1.2 Problem statement .......................................................................................................................... 11
1.3 Objectives ......................................................................................................................................... 11
1.3.1 Main objective. .............................................................................................................................. 11
1.3.2 Specific objectives ......................................................................................................................... 11
2.0. LITERATURE REVIEW ....................................................................................................................... 12
2.1 Introduction ...................................................................................................................................... 12
2.2 Plastic ................................................................................................................................................ 12
2.2.1 Types of plasic ........................................................................................................................ 12
2.2.3. Properties of plastic ............................................................................................................... 14
2.2.4. Waste plastic and its sources ................................................................................................. 15
2.2.5 Recycling of plastic ................................................................................................................. 15
2.2.6. Recycling methods and construction applications ................................................................ 16
2.3 Advantanges and disadvantages of using plastics .......................................................................... 17
2.4 Concrete ............................................................................................... Error! Bookmark not defined.
2.4.1 Constituents of concrete ............................................................................................................... 18
2.4.2 Curing ............................................................................................................................................. 19
2.4.3 Testing ........................................................................................................................................... 19
2.5 Previous research ............................................................................................................................. 20
2.5.1 Fresh concrete properties ............................................................................................................. 20
2.5.1.1 Workability ................................................................................................................................. 20
5
2.5.1.2 Density of concrete .................................................................................................................... 22
2.5.2 Hardened concrete properties ...................................................................................................... 22
2.5.2.1 Dry density ................................................................................................................................. 22
2.5.2.2 Compressive strength ................................................................................................................ 22
2.5.2.3 Tensile strength .......................................................................................................................... 25
2.5.2.4 Flexural strength ........................................................................................................................ 25
2.6 Information gap ................................................................................................................................ 26
3.0 METHODOLOGY ................................................................................................................................ 27
3.1 Material collection and preparations .............................................................................................. 27
3.1.1 Plastic ............................................................................................................................................. 27
3.1.2 Laboratory test of Particle Size Distribution of aggregates – (BS 812) ........................................ 28
3.1.3 Fine aggregates ............................................................................................................................. 29
3.1.3.1 Sieve Analysis and Grading of fine aggregates ......................................................................... 29
3.1.4 Coarse aggregates - (BS 882: 1992) ............................................................................................... 29
3.1.5 Determination of specific gravity and water absorption of plastic aggregates (BS 812: PART 107)
................................................................................................................................................................ 30
3.2 Concrete test equipment ........................................................................................................... ……30
3.2.1 Moulds ......................................................................................................................................... 300
3.2.2 Slump test equipment ................................................................................................................. 300
3.2.3 Compacting factor apparatus ....................................................................................................... 31
3.2.4 Compression Test Machine .......................................................................................................... 31
3.3 Batching ............................................................................................................................................ 32
3.3.1 Preparations of test samples ........................................................................................................ 32
3.3.2 Casting - (BS 1881 – 108:1983) ...................................................................................................... 32
3.3.3 Curing - (BS 1881 – 111:1983) ....................................................................................................... 33
3.4 Fresh concrete .................................................................................................................................. 33
3.4.1 Slump test ...................................................................................................................................... 33
3.4.2 Compacting factor test - (BS 1881 - 103:1983) ............................................................................. 34
3.5 Hardened concrete ........................................................................................................................... 35
3.5.1 Density - (BS 1881 - 107:1983) ...................................................................................................... 35
3.5.2 Compressive strength test - (BS 1881 - 116: 1983) ...................................................................... 36
3.3.4 Flexural strength test (BS 1881 - 107:1983) ................................................................................. 38
4.0 RESULTS AND DISCUSSION............................................................................................................... 40

6
4.1 sieve analysis .................................................................................................................................... 40
4.1.2 Sieve analysis results of plastic particles ...................................................................................... 41
4.1.3 Sieve analysis results for coarse aggregates ................................................................................ 44
4.2 Specific gravity results...................................................................................................................... 46
4.3 Workability ....................................................................................................................................... 46
4.3.1 Slump test (BS 1881: Part 102) ..................................................................................................... 46
4.3.2 Compaction factor test……………………………………………………………..……………………………………………..47
4.4 Dry Density ....................................................................................................................................... 48
4.5 Compressive strength ...................................................................................................................... 50
4.6 Tensile strength……………………………………………………………………………………………………………………………53
4.7 Flexural strength .............................................................................................................................. 55
5.0 CONCLUSION AND RECOMMENDATION ......................................................................................... 57
5.1General .............................................................................................................................................. 57
5.2 Conclusion ........................................................................................................................................ 57
5.3 Recommendation ............................................................................................................................. 57
REFERENCES ............................................................................................................................................ 58
7
LIST OF FIGURES
Fig. 4.1.1 particle distribution for sand ……………………………………………………………………………………41
Fig 4.1.2 Particle distribution for plastic particles…………………………………………………………………….43
Fig 4.1.3 particle distribution for coarse aggregates…………………………………………………………………45
Fig. 4.2 slump in (mm) against percentage replacement of sand with plastic particles in
concrete……………….………………………………………………………………………………………………………………….47
Fig 4.3.1 cube dry density against percentage replacement of sand with plastic particles in
concrete…………………………………………………………………………………………………………………………………..48
Fig 4.3.2 cylinder dry density against percentage replacement of sand with plastic particles in
concrete…………………………………………………………………………………………………………………………………..49
Fig 4.4.1 7days compressive strength vs percentage replacement of sand with plastic particles in
concrete…………………………………………………………………………………………………………………………………..51
Fig 4.4.2 28days compressive strength vs percentage replacement of sand with plastic particles
in
concrete…………………………………………………………………………………………………………………………………..51
Fig 4.4.3 compressive strength ratio depending on age of concrete, age 1 and 2 represent 7days
and 28days respectively…………………..………………………………………………………………………………….…..52
Fig 4.5.1 7days tensile split strength vs percentage replacement of sand with plastic particles in
concrete…………………………………………………………………………………………………………………………………..53
Fig 4.5.2 28days tensile split strength vs percentage replacement of sand with plastic particles in
concrete…………………………………………………………………………………………………………………………………..54
Fig 4.5.3 split tensile strength ratio depending on the age of concrete, age 1 and 2 represent
7days and 28days respectively…………………..…………………………………………………………………………….54
Fig 4.6 flexural strength vs percentage replacement of sand with plastic particles in
concrete…………………………………………………………………………………………………………………………………..56

8
LIST OF TABLES
Table 2.1 Cone Slump test results(Al-manaseer and Dalal 1997)………………………………………………20
Table 2.2 Mixture proportions and slump test results (Batayneh et al, 2007)…………………………..21
Table 2.3 Compressive strength of hardened concrete results (Choi et at 2005)………………………23
Table 2.4 Percentage reduction in compressive strength vs percentage plastics for different water
content (Ghaly et al 2004)………………………………………………………………………………………………………..24
Table 3.3.1 Batch mix proportions…………………………………………………………………………………………….32
Table 4.1.1 Sieve analysis results for sand…………………………………………………………………………………40
Table 4.1.2 Particle distribution for plastic particles………………………………………………………………….42
Table 4.1.3 particle size distribution for coarse aggregates……………………………………………………….44
Table 4.1.4 Determined specific gravity and water absorption………………………………………………….46
Table 4.2.1 Slump test results……………………………………………………………………………………………………46
Table 4.2.2 Compaction factor test results………………………………………………………………………………..47
Table 4.3 Determined dry density…………………………………………………………………………………………….48
Table 4.4 Determined compressive strength…………………………………………………………………………….50
Table 4.5 Variation of split tensile strength due to replacement of sand with plastic particles……53
Table 4.6 Flexural strength……………………………………………………………………………………………………….55

9
LIST OF PLATES
Plate 3.1 Granulated plastic particles used for testing……………………………………………………………..27
Plate 3.2 compaction factor apparatus and the Determination of the slump respectively………..35
Plate 3.3 Cube crushing for the determination of compressive strength………………………………….36
Plate 3.4 Cylinder for the determination of the tensile split strength……………………………………….37
Plate 3.5 Cylinder for the determination of the tensile split strength……………………………………….38
Plate 3.6 Dial gauge reading for the flexural Load…………………………………………………………………….39
Plate 3.7 sieves…………………………………………………………………………………………………………………….…..40
Plate 4.1 Hourglass failure mode concrete cube…………………………………..……………………………………50
10
CHAPTER 1
1.0 INTRODUCTION
1.1 Background
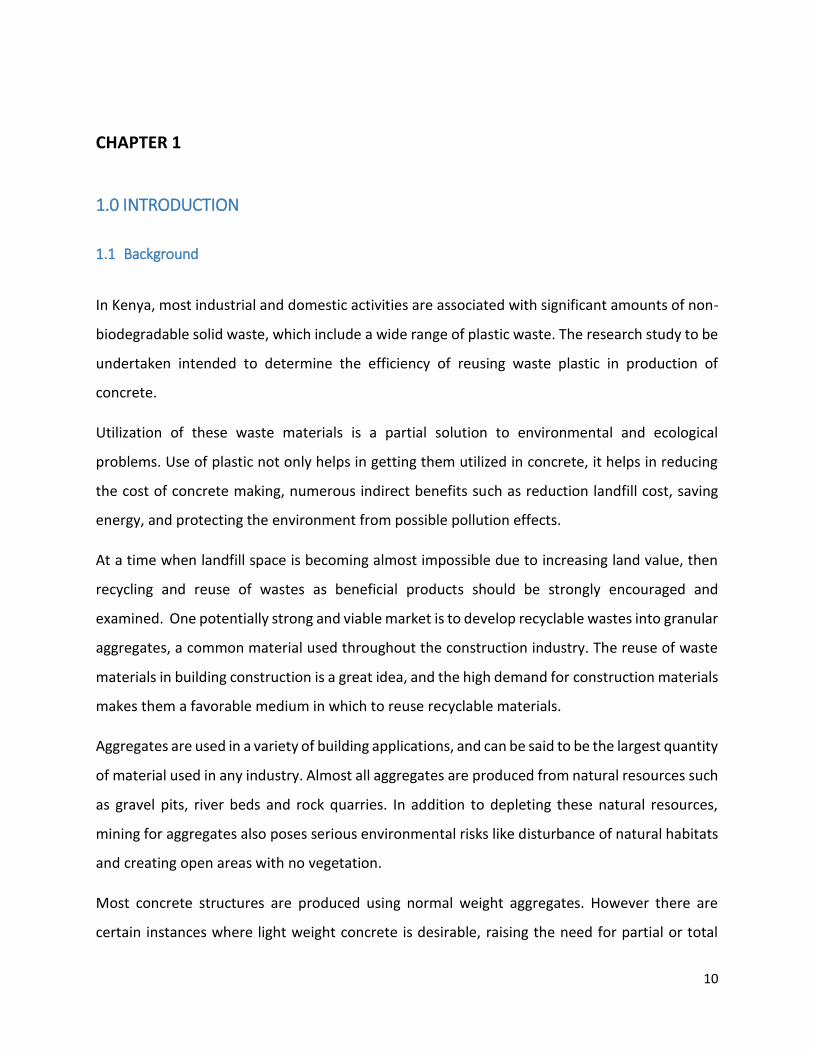
In Kenya, most industrial and domestic activities are associated with significant amounts of non-
biodegradable solid waste, which include a wide range of plastic waste. The research study to be
undertaken intended to determine the efficiency of reusing waste plastic in production of
concrete.
Utilization of these waste materials is a partial solution to environmental and ecological
problems. Use of plastic not only helps in getting them utilized in concrete, it helps in reducing
the cost of concrete making, numerous indirect benefits such as reduction landfill cost, saving
energy, and protecting the environment from possible pollution effects.
At a time when landfill space is becoming almost impossible due to increasing land value, then
recycling and reuse of wastes as beneficial products should be strongly encouraged and
examined. One potentially strong and viable market is to develop recyclable wastes into granular
aggregates, a common material used throughout the construction industry. The reuse of waste
materials in building construction is a great idea, and the high demand for construction materials
makes them a favorable medium in which to reuse recyclable materials.
Aggregates are used in a variety of building applications, and can be said to be the largest quantity
of material used in any industry. Almost all aggregates are produced from natural resources such
as gravel pits, river beds and rock quarries. In addition to depleting these natural resources,
mining for aggregates also poses serious environmental risks like disturbance of natural habitats
and creating open areas with no vegetation.
Most concrete structures are produced using normal weight aggregates. However there are
certain instances where light weight concrete is desirable, raising the need for partial or total
11
replacement of the aggregate with a lighter substitute. Plastic recycling efforts have increased
but are still insufficient. The preferred plastic material for use as an aggregate should be available
in large quantities such as post-consumer wastes which has little or no resale value.
In Kenya, there is a great strain placed on the environment at the moment, specifically by waste
plastic. A very small percentage of it is recycled, probably due to lack of investment or a low
demand for recycled plastic waste. As a result, most of it usually ends up dumped in landfills, or
just burned. The effect of such actions on the environment is degrading, at a time when the world
is focusing its efforts on tackling pollution and environmental issues such as global warming.
The evolution of concrete mix production has taken massive steps over the years. During this
period, various types of aggregates have been used. The major role of aggregates in concrete is
to provide strength. In instances where light weight concrete are required, a lighter aggregate
made from plastic can be adopted.
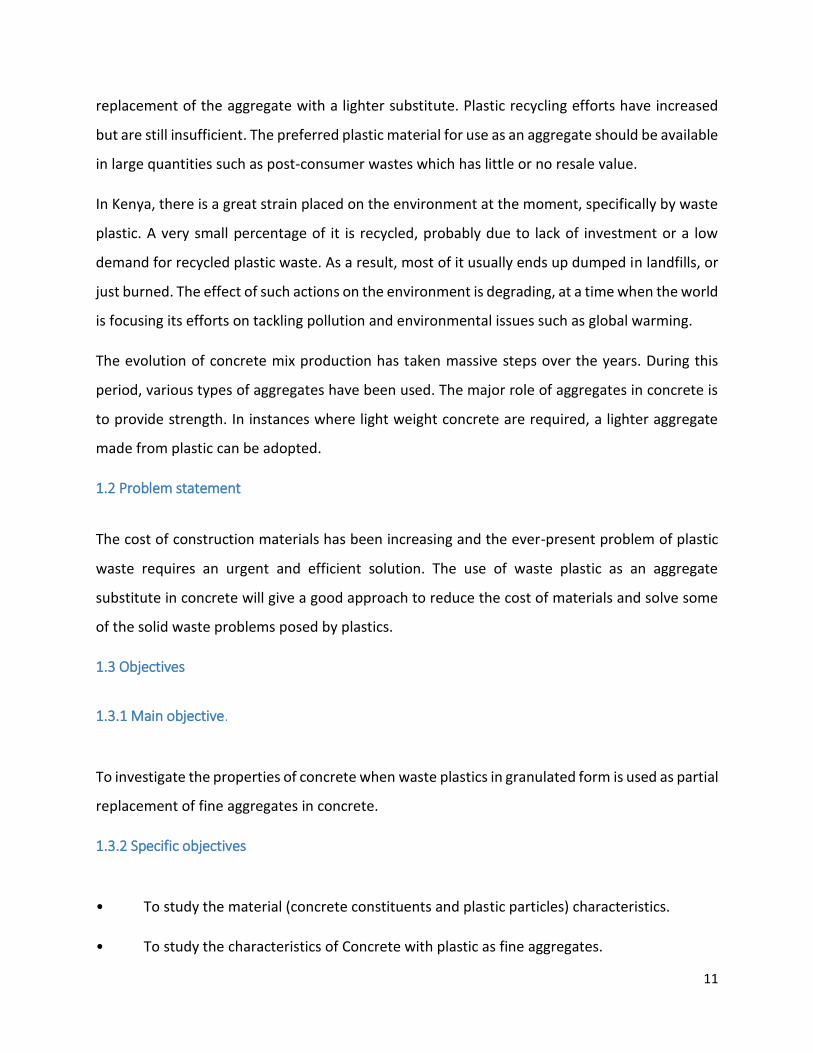
1.2 Problem statement
The cost of construction materials has been increasing and the ever-present problem of plastic
waste requires an urgent and efficient solution. The use of waste plastic as an aggregate
substitute in concrete will give a good approach to reduce the cost of materials and solve some
of the solid waste problems posed by plastics.
1.3 Objectives
1.3.1 Main objective.
To investigate the properties of concrete when waste plastics in granulated form is used as partial
replacement of fine aggregates in concrete.
1.3.2 Specific objectives
• To study the material (concrete constituents and plastic particles) characteristics.
• To study the characteristics of Concrete with plastic as fine aggregates.
12
CHAPTER 2
2.0 LITERATURE REVIEW
2.1 Introduction
Concrete is defined as a mixture of cement, water and aggregates in which the cement and water
combine to act as a binder to hold the aggregate particles together into a plastic mixture. The
mixture of water and cement results in a chemical exothermic reaction called hydration as
concrete changes from plastic to a solid state, in a process called curing. It has been observed
that concrete continues to gain strength as it cures.
2.2 Plastic
Plastic entails of substances that have plasticity, and also those formed in a soft state and used
in a solid state. The origin of plastic is traced back to the processing methods of natural polymers
such as horns, tusks and amber as well as substances like clay, glass and metals. The natural
polymers are not uniform in quality and lack adequate productivity due to their scarcity. Hence
the need to process plastics easily, faster and in better quality, artificial materials are used to
replace the natural polymers. These artificial materials are celluloid, synthetic rubber, rayon, and
ebonite.
2.2.1 Types of plastic
Plastics can be classified in many ways, but most commonly by their physical properties. Plastics
may be classified also according to their chemical sources. There are twenty or more known basic
types which fall into six general groups:-
1. Cellulose Plastics
2. Synthetic Resin Plastics
3. Protein Plastics
4. Natural Resins

13
5. Elastomers
6. Fibers
They can also be classified depending on their physical properties, as thermoplastic and
thermosetting materials. Thermoplastic materials can be formed into desired shapes under heat
and pressure and become solids on cooling. If they are subjected to the same conditions of heat
and pressure, they can be remolded. They include; polyethylene, polyamide, polyoxymethylene,
polypropylene, polyethylene terephthalate, and polytetrafluorethylene.
Thermosetting materials those that once shaped cannot be softened or remolded by the
application of heat. This is because their molecular chains are bonded together by firm meshed
crosslinks. This type include; phenolic, melamine, unsaturated polyester, epoxy resin, silicone
and polyurethane. It is disposed off by either burning or burying, which are quite costly processes.
To save the environment from pollution especially the one caused by the burning process and
also to reduce the cost of waste management efforts the reuse of thermosetting plastics is put.
To achieve this, they are being applied as construction materials where light weight concrete is
produced. They are used for interior and exterior walls of buildings, and for walls not designed
for lateral loads.
The types of plastics which are mostly used are:-
1. Polyethylene Terephthalate (PET)
2. High Density Polyethylene (HDPE)
3. Polyvinyl chloride (PVC)
4. Low density Polyethylene (LDPE)
5. Polypropylene (PP), Polystyrene (PS)
Among them, HDPE and LDPE produces major share of volume in post-consumer plastic waste.
14
2.2.3. Properties of plastic
Plastic is a non-biodegradable material and researchers found that the material can remain on
earth for 4500 years without degradation.
Plastic characteristics that make it a good material in concrete production and other building
activities include:-
a) Not easily biodegradable/ durability - This property shows that plastic can be used as an
inert matter in cement matrix.
b) Versatility - Plastic can be used in many areas in the industry. It is capable of being used
in many different situations. This makes it an economically attractive choice.
c) Lightness - Plastic is very light in terms of weight.
d) Hardness - Plastic is made up of strongly bond together particles that make it hard to
break.
e) Low linear dilation coefficient
f) Good chemical resistance
g) High heat resistance
15
2.2.4. Waste plastic and its sources
Low Density Polyethylene (LDPE)
Carry bags, sacks, milk pouches, bin lining, cosmetic and detergent bottles.
High Density Polyethylene (HDPE)
Carry bags, bottle caps, house hold articles etc.
Polyethylene Teryphthalate (PET)
Drinking water bottles etc.,
Polypropylene (PP)
Bottle caps and closures, wrappers of detergent, biscuit, vapors packets, microwave trays
for readymade meal etc.,
Polystyrene (PS)
Yoghurt pots, clear egg packs, bottle caps. Foamed
Polystyrene
Food trays, egg boxes, disposable cups, protective packaging
Polyvinyl Chloride (PVC)
Mineral water bottles, credit cards, toys, pipes and gutters; electrical fittings, furniture,
folders and pens, medical disposables.
2.2.5 Recycling of plastic
Recycling is the process of recovering used materials from waste and incorporating them into the
manufacturing process.
Recycling is a critical issue in this environmental conscious times.
It aims to:-
• Preserve natural resources
• Minimize transportation and its associated cost
• Reduce the environmental load caused by waste material especially land requirement
16
Since plastic products do not decompose in landfill and are difficult to reduce in size, the need to
recycle plastic is clear even though the whole process is faced with technological and economic
constraints that limit its efficiency to convert plastic waste into useful products.
2.2.6. Recycling methods and construction application
Prior to using plastics in concrete it is recycled through some modification and process techniques
which includes:-
a. Mechanical technique
This refers to the processes which involve melting, shredding or granulation of the plastics. The
plastics are sorted out before mechanical recycling. This can be done manually by hand picking
or by sorting out automatically by a technology being introduced such as the use of x-ray
fluorescence, infrared, electrostatics and flotation.
After the sorting out, the plastic is either melted, moulded or shredded into flakes and then
processed into granules which can be used to replace natural aggregates in concrete.
b. Chemical technique
Plastic can be recycled by depolymerization, which is done in two ways:-
• Hydrolysis – which involves chemical decomposition.
• Pyrolysis – which is thermal decomposition.
It is a relatively easy technique especially when the plastic contains single condensed polymers
for example urethanes, polyethylene terephthalate, nylon and many others. It is however
complicated when it comes to mixed plastics hence it becomes more difficult to recycle such
plastics to produce useful and economical product.
17
c. Thermal reprocessing
This is a recycling process that involves heating the thermoplastic at very high temperatures until
it flows. Then it is converted to new products as it cools.
This method does not change the chemical composition of the plastics e.g thermoplastic
polyester can be heated and reprocessed into fence posts, building panels, fibres for carpeting.
It however cannot be repeated since a repetitive of heating could affect the properties of plastic.
It is easy when applied to pure thermoplastics but cannot be applied to thermosets which cannot
melt at high temperatures without degrading.
In the case of mixed thermoplastics thermal reprocessing becomes more involving because it will
need either separation of the various plastics depending on the source of the waste or by use of
a special machine that takes into account the different thermal properties.
d. Fillers
Plastic waste can be used as filler in concrete and in road construction. When used in this case
chemical composition of the plastics is generally not very significant.
It is therefore an easy way to recycle thermosets or contaminated plastics. Plastic wastes can
hence be used as partial replacement of inorganic aggregates in concrete applications to reduce
the dead weight of structures. Recycled rubber can also be used in asphalt concrete mixes.
2.3 Advantages and disadvantages of using plastics
Advantages
Plastic has many beneficial properties, these include:-
• Extreme versatility and ability to be modified to meet specific technical needs.
• Lighter weight than other materials.
• Durability and not easy to fail.
• Resistance to chemicals, water and impact.

18
• Excellent thermal and electrical insulation properties.
• Lesser production cost compared to other materials.
• Superior aesthetic appeal.
• Ability to combine with other materials like adhesives.
• Reduction in solid wastes hence better use of land than landfills.
Disadvantages
The following are the main disadvantages of using plastic in concrete:-
• Plastic have low bonding properties so that the strength of concrete gets reduced such as
compressive, tensile and flexural strength.
• In high temperatures plastic gets melted because it has low melting point.
2.4 Concrete
2.4.1 Constituents of concrete
Cement
Cement is a material with adhesive and cohesive properties, which make it capable of bonding
mineral particles into a compact whole.
It is produced by mixing ground limestone, iron ore, alumina and silica. The mixture is heated in
a rotary kiln to temperatures of about 1600o C, which cause the material to break down and
recombine into new compound is called clinker. After cooling clinker is ground to a fine powder
now the cement.
Aggregates
Aggregate is granular material such as sand, gravel, crushed stone, and blast furnace slag that
usually occupies approximately 60-70% of the volume of concrete. It reduces volume changes
due to drying shrinkage of the cement-water paste.
19
Aggregate properties affect workability of plastic concrete and the durability, strength, thermal
properties and density of hardened concrete. Aggregates can be classified as fine and coarse
aggregates depending on size and also as natural or artificial, with respect to source and method
of preparation.
2.4.2 Curing
Curing is a process that involves the maintenance of a suitable moisture content and temperature
in concrete for a suitable period of time immediately after placing and finishing so that desired
properties of concrete are achieved.
Since concrete produces a lot of heat due to the reaction of water and cement (hydration) curing
should be properly done to avoid cracking because of excess expansion of the particles. Hence
curing involves pouring of water to cool the surfaces of concrete and also covering to minimize
loss of the water through evaporation and effects of hydration.
2.4.3 Testing
During the preparation of concrete the amount of water used compared to the amount of cement
(water/cement ratio) should be carefully mixed. This ratio majorly indicates the strength of
concrete in that the lower it is the higher the final concrete strength. Although a minimum
water/cement ratio of 0.3 by weight is necessary so that all the cement particles are in contact
with water for complete hydration.

20
2.5 Previous research
2.5.1 Fresh concrete properties
2.5.1.1 Workability
Effects of plastic as a partial replacement of sand on the workability of concrete
(Koehler and Fowler, 2003) The main property to check for in fresh concrete is its workability.
Workability is the ease with which concrete can be mixed, placed and finished easily without
segregation. Workability has a broad range from very low, having a slump of 0-25mm applied for
vibrated concrete in large sections to high workability of slump 100-180mm for sections with
congested reinforcement.
(Al-manaseer and Dalal 1997) determined the slump of concrete mixes made with plastic
aggregates. Their report showed that there was increase in slump when plastic aggregates were
added to concrete. Concrete with 50% plastic replacement of aggregates had a higher cone slump
than that without plastic aggregates. Their conclusion was that plastic aggregates did not absorb
or add any water to the concrete mix. Due to the not absorbing water characteristic of plastic
concrete containing plastic aggregates had more free water in the mix hence the increasing
slump.
Table 2.1 Cone Slump test results(Al-manaseer and Dalal 1997)
Plastic aggregates % Workability of w/c 0.5
0 55
10 45
30 50
50 50
(Choi et al 2005) researched on the influence of polyethylene terephthalate (PET) waste bottles
as lightweight aggregate (WPLA) on the workability of concrete. Water-cement ratios were in the

21
proportions 45%, 49% and 53% and the replacement ratios of WPLA were 0%, 25%, 50% and 75%
by volume of fine aggregate. Their report showed that waste PET bottles lightweight aggregate
concrete (WPLAC) slump value increased with increase in water-cement ratio and the
replacement ratio. The increase in workability represent 52%, 104%, and 123% comparing to that
of normal concrete at water-cement ratio of 45%, 49%, and 53% respectively. They therefore
concluded that this was because of the spherical and smooth shape and the non-absorption
characteristic of the waste PET bottles lightweight aggregate (WPLA).
(Batayneh et al, 2007) investigated the effect of ground plastic on the slump of concrete.
Concrete mixes of up to 20% of plastic particles are proportioned to partially replace the fine
aggregates. It was observed that there was a decrease in the slump with the increase in the plastic
content. In fact at the 20% replacement the slump decreased by 25% of the original slump value
with 0% plastic replacement. The decrease in slump value was attributed to the shape of the
plastic particles which had sharper edges than the fine aggregate. Besides plastic, glass and
crushed concrete was also used as replacement of aggregate.
Table 2.2 Mixture proportions and slump test results (Batayneh et al, 2007)
Plastic
replacement
%
Mix proportions (Kg/M3 ) Slump
(mm) Water Cement Coarse
aggregate
Fine
aggregate
Plastic Water
cement
0 252 446 961 585 0 0.56 78
5 252 446 961 555.7 17.8 0.56 73
10 252 446 961 526.5 35.5 0.56 69
15 252 446 961 497.2 53.2 0.56 63
20 252 446 961 468 71 0.56 57

22
2.5.1.2 Density of concrete
For concrete the density is measured in three types, as bulk, fresh and dry densities.
Effects of plastic as a partial replacement of sand on the bulk density of concrete
The effect of plastic aggregates on the bulk density of concrete is that the bulk density reduces
with the increase in plastic aggregate content. This reduction is directly proportional to the plastic
aggregates content. The density reduced by 2.5%, 6%, and 13% for concrete having 10%, 30%
and 50% plastic aggregate respectively. It was concluded that this was due to the lower unit
weight of the plastics compared to natural aggregates.(Al- Manaseer and Dalal 1997).
2.5.2 Hardened concrete properties
2.5.2.1 Dry density
Effects of plastic as a partial replacement of sand on the dry density of concrete
Ismail and Hashmai (2007) studied that the dry density of each curing age tend to decrease with
increasing the waste plastic ratio in each concrete mixture, but the dry densities tend to increase
with age for each concrete mixture at all curing ages. The use of waste plastic for each curing age
reduces the dry densities of all mixtures with increasing the waste plastic ratio, because the
density of plastic is lower than that of sand by 69.7%.
2.5.2.2 Compressive strength
Effects of plastic as a partial replacement of sand on the compressive strength
(Choi et at 2005) Effects of polyethylene terephthalene PET bottles lightweight aggregate (WPLA)
on the compressive strength of concrete. The mixture proportions were as mentioned earlier
that water-cement ratios were in the proportions 45%, 49% and 53% and the replacement ratios

23
of WPLA were 0%, 25%, 50% and 75% by volume of fine aggregate. It was found out that the
compressive strength of concrete decreased with the increase in the amount of PET aggregates
and also that for a certain particular amount of PET aggregate the compressive strength increase
with a reduction in the water- cement ratio.
Table 2.3 Compressive strength of hardened concrete results (Choi et at 2005)
Water-cement ratio PET aggregate % Compressive strength (Mpa)
7days 28days
53 0 24 3.27
25 23.4 2.65
50 21.5 2.25
75 19.2 2.04
49 0 27.8 3.27
25 26.7 2.76
50 24.3 2.35
75 21.6 1.98
45 0 31.3 3.32
25 27.4 2.80
50 26.5 2.55
75 24.8 2.04
(Marzouk 2007) Did an experiment on the use of consumed plastic bottle waste as sand-
substituting aggregate within composite materials for building application. (PET) polyethylene
terephthalate were used as partial and complete replacement of sand in concrete composites.
Several volume percentages of sand from 2% to 100% were replaced by the same volume of
granulated plastic. The conclusion was that replacing sand at a level below 50% by volume with
granulated PET, whose upper granular limit equals 5mm, affected the compressive strength of
composites and plastic bottles shredded into small PET particles may be used successfully to
24
replace sand. The advantage of the composites was low cost material with consistent properties,
and also resolved solid waste problems created by plastics.
Batayneh et at (2007) He studied the reduction of strength in the addition of plastic particles. For
a 20% replacement, the compressive strength showed a sharp reduction up to 72% of the control
strength. For a 5% replacement the compressive strength reduces by 23%.(insert graph)
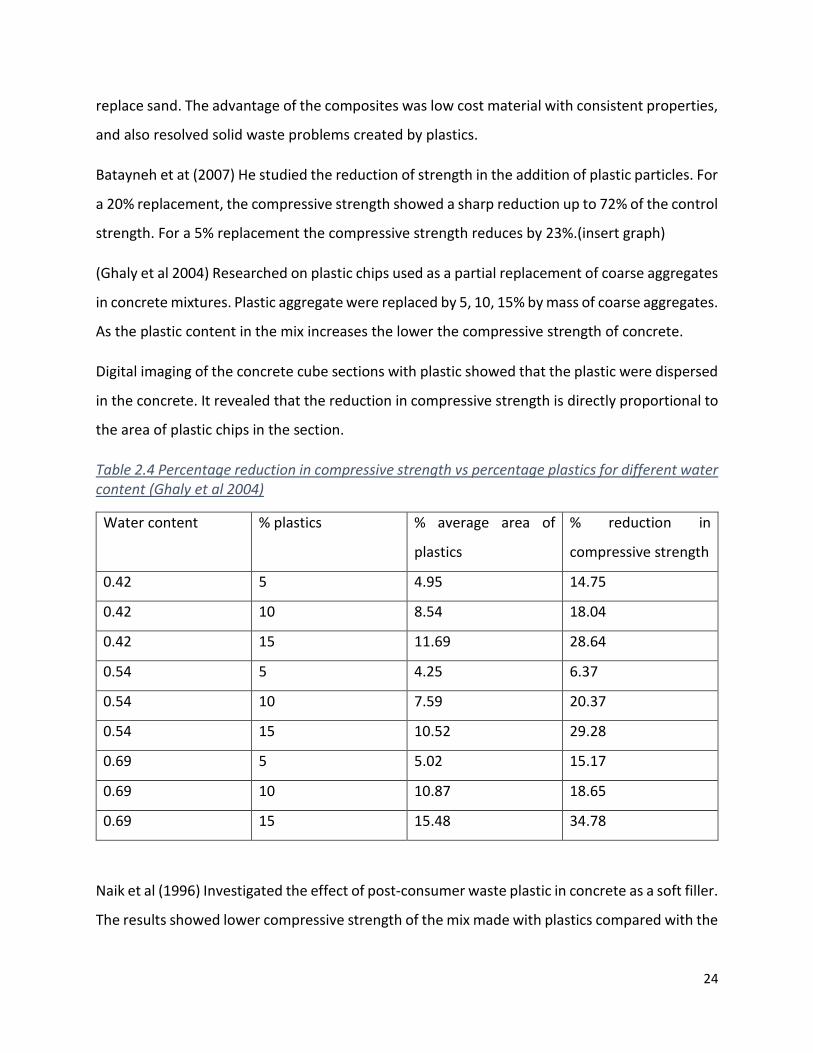
(Ghaly et al 2004) Researched on plastic chips used as a partial replacement of coarse aggregates
in concrete mixtures. Plastic aggregate were replaced by 5, 10, 15% by mass of coarse aggregates.
As the plastic content in the mix increases the lower the compressive strength of concrete.
Digital imaging of the concrete cube sections with plastic showed that the plastic were dispersed
in the concrete. It revealed that the reduction in compressive strength is directly proportional to
the area of plastic chips in the section.
Table 2.4 Percentage reduction in compressive strength vs percentage plastics for different water content (Ghaly et al 2004)
Water content % plastics % average area of
plastics
% reduction in
compressive strength
0.42 5 4.95 14.75
0.42 10 8.54 18.04
0.42 15 11.69 28.64
0.54 5 4.25 6.37
0.54 10 7.59 20.37
0.54 15 10.52 29.28
0.69 5 5.02 15.17
0.69 10 10.87 18.65
0.69 15 15.48 34.78
Naik et al (1996) Investigated the effect of post-consumer waste plastic in concrete as a soft filler.
The results showed lower compressive strength of the mix made with plastics compared with the
25
control. This was attributed to lower compressive strength of the plastic particles compared to
cementitious matrix as well as fine and coarse aggregates. It was also concluded that alkaline
bleach treatment of plastics is the best for compressive strength of concrete containing plastics.
2.5.2.3 Tensile strength
Effects of plastic as a partial replacement of sand on the split tensile strength
Al-Manaseer and Dalal(1997) researched on the effects of plastic aggregates on the splitting
tensile strength of concrete. They measured the strength of concrete at different water content
ratios and for various percentages of plastic aggregates. They concluded that the splitting tensile
strength decreased with the increase in plastic aggregates percentages, while for a given plastic
aggregate content, the splitting tensile strength was found to decrease when the water ratio was
increased. It was also found that concrete with plastic had a gradual failure and not the typical
brittle failure observed in conventional concrete. It was hence concluded that specimens
containing plastic aggregates are more capable of resisting the splitting load after failure without
full disintegration because the plastic content made them more ductile.
Batayneh et al (2007) observed that the splitting and flexural strength reduced due to the fact
that the strength of plastic particles is lower than that of the natural aggregates. Hence the use
of plastic particles and its percentage of replacement should be controlled to the allowable
strength of the structure under construction.
2.5.2.4 Flexural strength
Marzouk et al (2007) studied that the flexural strength of new composites decreased as the
volume of PET was increased.
Choi et al (2005) observed that the flexural strength of new composites decreases regularly with
the increase in percentage of plastics in concrete. For 50% replacement of aggregate by plastics,
the flexural strength is 32.8% of the control concrete.

26
2.6 Information gap
Previous studies have shown that plastic can only be used as a sand replacement in concrete only
in small percentage replacement. Research has shown that waste plastic particles when used as
a partial replacement of sand in concrete causes a decrease in dry density, compressive, tensile
split and flexural strengths. This research project presents a study on workability, compressive
strength and density variation, tensile split strength and flexural strength for increasing
percentage replacement of sand with plastic particles. More research on the same is required for
other concrete properties such as bleeding and segregation.
27
CHAPTER 3
3.0 METHODOLOGY
3.1 Material collection and preparations
3.1.1 Plastic
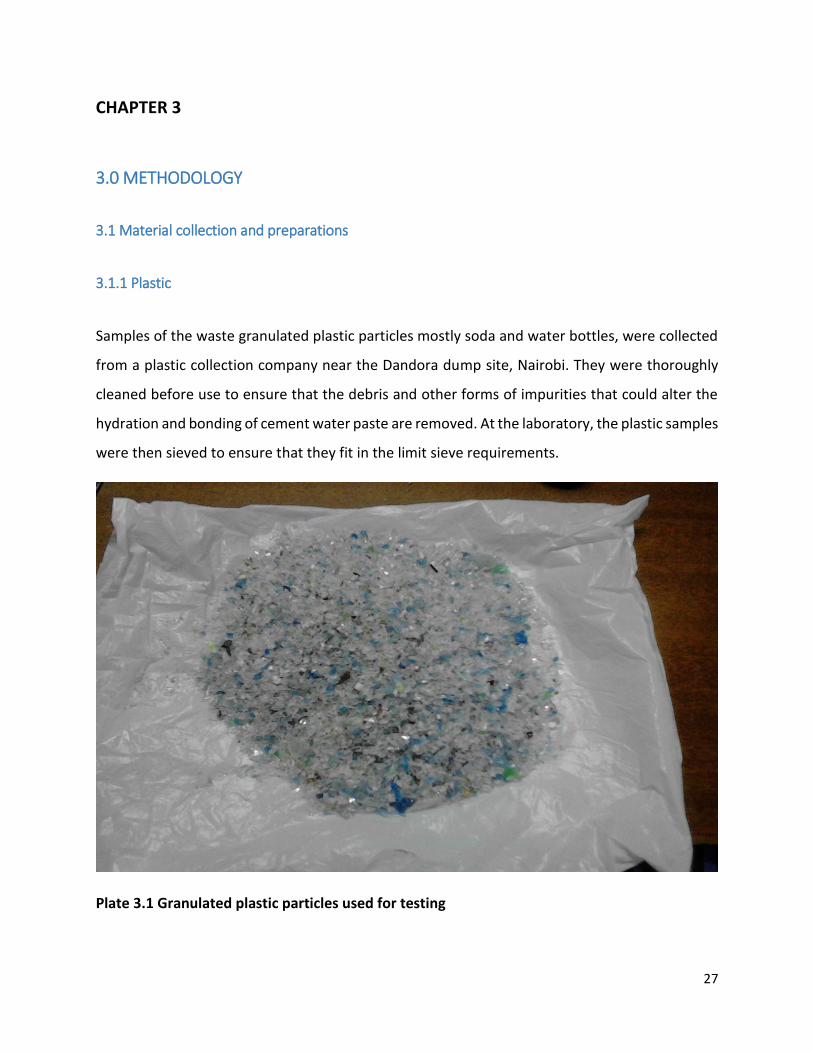
Samples of the waste granulated plastic particles mostly soda and water bottles, were collected
from a plastic collection company near the Dandora dump site, Nairobi. They were thoroughly
cleaned before use to ensure that the debris and other forms of impurities that could alter the
hydration and bonding of cement water paste are removed. At the laboratory, the plastic samples
were then sieved to ensure that they fit in the limit sieve requirements.
Plate 3.1 Granulated plastic particles used for testing
28
3.1.2 Laboratory test of Particle Size Distribution of aggregates – (BS 812)
The sieves used for making a sieve analysis conformed to BS 410. The tests were carried out in
accordance with the procedure given in BS 812. The objective of the test was;
(i) To determine the particle size distribution of plastic particle aggregates.
(ii) To draw grading curves for the aggregates specified.
The procedure involved arranging the test sieves from top to bottom in order of decreasing
aperture sizes with pan and lid to form a sieving column. The aggregate sample of 1kg by mass
was then poured into the sieving column and shaken thoroughly manually. The sieves were
removed one by one starting with the largest aperture sizes (top most), and each sieve shaken
manually ensuring no material is lost. All the material which passed each sieve was returned into
the column before continuing with the operation with that sieve.
The retained material was weighed for the sieve with the largest aperture size and its weight
recorded. The same operation was carried out for all the sieves in the column and their weights
recorded. The screened material that remained in the pan was weighed and its weight recorded.
Various masses were recorded on a test data sheet. The cumulative mass retained and passing
on each sieve is calculated as a percentage of the original dry mass.
The results of sieve analysis are represented graphically in charts known as grading curves/charts.
By using these charts, it is possible to see at a glance if the grading of a given sample conforms
to that specified or it is too fine or coarse or deficient on a particular size. In the curves, the
ordinates represent cumulative percentages passing and the abscissa the sieve sizes plotted in a
logarithm scale.
Grading is of importance as it affects the workability of concrete. The development of strength
corresponding to a given water/cement ratio requires full compaction and this can only be
achieved with a sufficiently workable mix. It is necessary to produce a mix that can be compacted
to a maximum density with a reasonable amount of work. The main factors governing the desired
aggregate grading are;
29
a) Surface area of aggregate. This determines the amount of water necessary to wet all the
solids/particles.
b) The relative volume occupied by the aggregate.
c) The workability of the mix. The aggregate must contain a sufficient amount of material
passing 300𝛍m sieve to improve workability.
d) The tendency to segregation. It is essential for the voids in the combined aggregate to be
sufficiently small to prevent the cement paste from passing through and separating out.
3.1.3 Fine aggregates
3.1.3.1 Sieve Analysis and Grading of fine aggregates
The sieve sizes in general used for particle size distribution of fine aggregates were 10, 5, 2.36,
1.18 mm and 600, 300,150 and 75μm. This test consisted of dividing up and separating by means
of a series of test sieves named here above, a material into several particle size classifications of
decreasing sizes. The mass of the particles retained on the various sieves was related to the initial
mass of the material. The cumulative percentages passing each sieve were reported in numerical
and graphical form.
3.1.4 Coarse aggregates - (BS 882: 1992)
Well graded natural coarse aggregates obtained from Ndarugu quarry near Juja. Aggregates
passing 19 mm sieve but retained in 10 mm sieve were used. The natural coarse aggregates were
further sieved in order to remove traces of quarry dust and other small particles.
The sieve sizes in general used for particle size distribution of coarse aggregates were 50, 37.5,
25, 19, 10, and 4.75 for coarse aggregate. The aggregates were collected approximately 2kg by
mass. The proportions of the different sizes of particles making up the aggregates are found by
sieving and are known as the 'grading' of the aggregates, the grading is given in terms of the
percentage by mass passing the various sieves. Continuously graded aggregates for concrete
contain particles ranging in size from the largest to the smallest.

30
3.1.5 Determination of specific gravity and water absorption of plastic aggregates (BS 812: PART
107)
The objective of the test was to determine the specific gravity of plastic aggregates. The test was
done using a pycnometer, funnel and the weighing balance machine.
The weight of a clean pycnometer was determined and recorded as WP.
10g of dry sample was placed in the pycnometer and the weight recorded as WPS.
Distilled water was added to fill the pycnometer to the mark, while making sure no air was being
trapped. The sample was allowed to soak for 10 minutes. The surface of the pycnometer was
wiped dry using a cloth and weighed. The weight was then recorded as WB.
The pycnometer was then emptied and cleaned. After which it was filled with distilled water only
upto the mark. It was the wiped dry and weighed. This weight was recorded as WA.
Specific Gravity = 𝑊𝑃𝑆−𝑊𝑃
(𝑊𝑃𝑆−𝑊𝑃)+(𝑊𝐴−𝑊𝐵) …equation 3.1
3.2 Concrete test equipment
3.2.1 Moulds
Iron moulds of 100mm x 100mm x 100mm were prepared where the concrete would be cast. Oil
was applied to the moulds before casting was done to act as a release agent. Demoulding was
done after 48 hours.
3.2.2 Slump test equipment
Slump test apparatus consisted of a metallic frustum of a cone 305 mm high and a base of 205
mm diameter placed on a smooth surface with the smaller opening of 102 mm diameter at the
top. The concrete was filled inside and each layer was tamped 25 times with a standard 16 mm
diameter steel rod. The inside surface was oiled to reduce friction.

31
3.2.3 Compacting factor apparatus
The apparatus consisted essentially of two hoppers, each in the shape of a frustum of a cone, and
one cylinder, the three being above one another. The inside surface was oiled to reduce friction.
3.2.4 Compression Test Machine
Compression test machine consisted of load platens where the compression load is applied.
There were dial gauges that recorded the compression load upon failure of the cube that depends
on the compressive strength of the cube to be tested.

32
3.3 Batching
3.3.1 Preparations of test samples
Weight batching method was used and four batches were obtained. Mass substitution of sand
with plastic particles was made at percentages of 0%, 10%, 30% and 50% for the four batches
respectively. The water content was kept constant for all the batches. Mix ratio adopted was
class 25 of (1:1.5:3).The following table outlines the mix proportions by mass of each batch.
Table 3.1.1 Batch mix proportions
%
Replacement
Sand ( kg ) Cement (kg) Coarse
aggregates (kg)
Plastic
particles(kg)
0 14 9 28 0
10 12.6 9 28 1.4
30 9.8 9 28 4.2
50 7 9 28 7
3.3.2 Casting - (BS 1881 – 108:1983)
The specimens were cast in iron moulds of 100mm cubes, 150mm diameter by 300mm height
cylinders and timber beams of 100mm by 100mm by 500mm. This conforms to the specifications
of BS 1881:1983. The moulds were cleaned and oiled on their inside surfaces first in order to
prevent sticking of concrete on the surfaces. The moulds were then assembled and bolts and nuts
tightened to prevent leakage of the plastic concrete mix.
After preparing trial mixes, the moulds were filled with concrete in three layers, each layer being
compacted using a vibrating table to remove as much entrapped air as possible and to produce

33
full compaction of concrete without segregation. The moulds were filled until the concrete
overflowed and excess concrete removed by cutting across the surface of the mould. Surface
finishing was then done using a trowel. The test specimens were then left in the moulds
undisturbed for 48 hours and protected against shock, vibration and dehydration at a
temperature of about 20°C.
3.3.3 Curing - (BS 1881 – 111:1983)
The specimens were removed from the moulds and marked with details of; type of mix, date of
casting, duration for curing and the determined crushing date, using a water proof marker then
placed in water of temperature about 200C such that they were completely submerged. Some
samples were cured for 7days and others 28days so as to determine how the duration of curing
would affect strength of concrete. Curing took place by hardening of the concrete. The
temperature controlled the rate of progress of the reactions of hydration and consequently
affected the development of strength of concrete.
3.4 Fresh concrete
3.4.1 Slump test
The slump test is used to determine variations in the uniformity of mix of given proportions. The
objective of the test was to determine slump of fresh concrete mix.
The apparatus used were;
A standard mould which is a frustum of a cone complying with BS 1881 – 102: 1983
A standard flat base plate preferably steel.
A standard tamping rod.
Standard graduated steel rule from 0 to 300mm at 5mm intervals.
A scoop approximately 100mm wide.
The procedure of the test involved cleaning and oiling the inside surfaces of the mould to prevent
sticking of fresh concrete on the surfaces of the mould. The mould was placed on the base plate
34
and held. It was then filled with fresh concrete in three layer with each layer compacted with 25
strokes of the tamping rod. When filled, the top surface was struck off using a straight blade.
The cone was then slowly lifted and removed leaving the moulded concrete unsupported. Then
its height was measured. The difference between that height and that of the cone was recorded
as the slump.
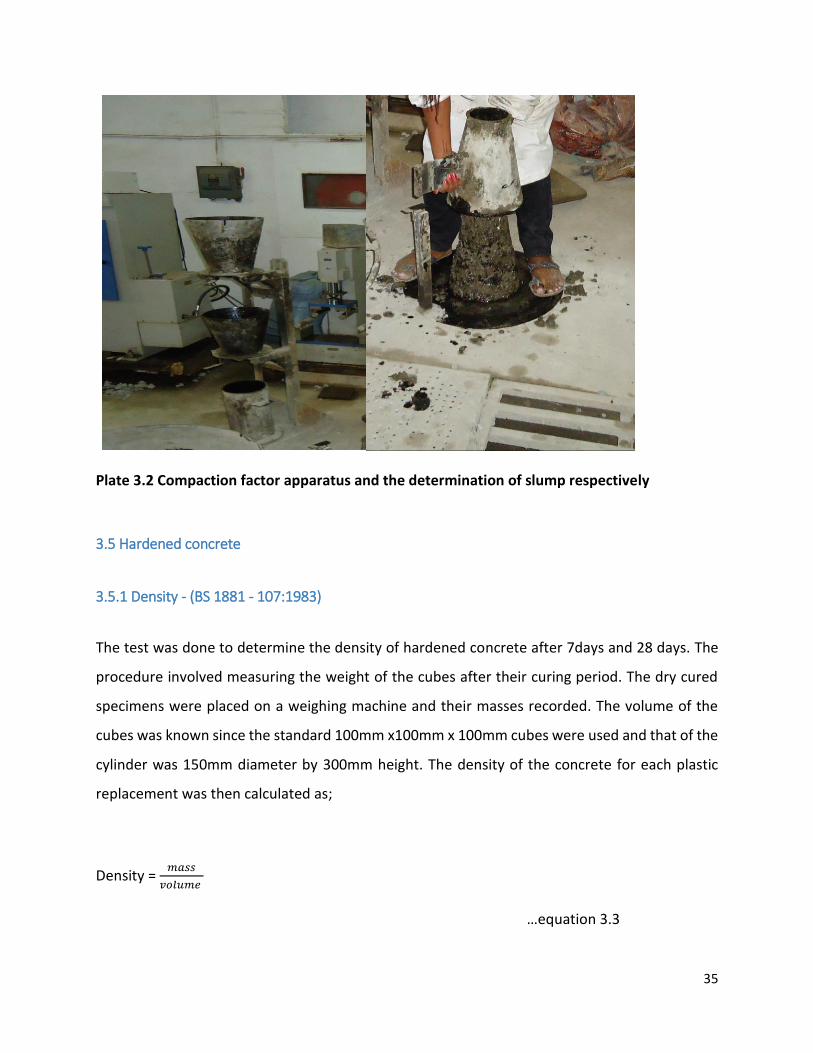
3.4.2 Compacting factor test - (BS 1881 - 103:1983)
The objective of the test was to measure the compacting factor of the concrete.
The apparatus used were;
Compacting factor apparatus
Tamping rod
Weighing balance
The upper hopper of the compacting apparatus was filled with fresh concrete and the bottom of
the hopper released open to allow the concrete fall down to the lower hopper. The bottom
hopper was released opened to allow concrete to fall into the cylinder.
The excess concrete was cut across the top of the cylinder and the net mass of the concrete in
the cylinder was determined. The cylinder was emptied and then refilled and placed in a vibrating
table so as to compact it and then the weight of the compacted concrete measured. The
compacting factor is then calculated as follows;
Compacting factor = 𝑀𝑎𝑠𝑠 𝑜𝑓 𝑝𝑎𝑟𝑡𝑖𝑎𝑙𝑙𝑦 𝑐𝑜𝑚𝑝𝑎𝑐𝑡𝑒𝑑 𝑐𝑜𝑛𝑐𝑟𝑒𝑡𝑒
𝑀𝑎𝑠𝑠 𝑜𝑓 𝑓𝑢𝑙𝑙𝑦 𝑐𝑜𝑚𝑝𝑎𝑐𝑡𝑒𝑑 𝑐𝑜𝑛𝑐𝑟𝑒𝑡𝑒
…equation 3.2
35
Plate 3.2 Compaction factor apparatus and the determination of slump respectively
3.5 Hardened concrete
3.5.1 Density - (BS 1881 - 107:1983)
The test was done to determine the density of hardened concrete after 7days and 28 days. The
procedure involved measuring the weight of the cubes after their curing period. The dry cured
specimens were placed on a weighing machine and their masses recorded. The volume of the
cubes was known since the standard 100mm x100mm x 100mm cubes were used and that of the
cylinder was 150mm diameter by 300mm height. The density of the concrete for each plastic
replacement was then calculated as;
Density = 𝑚𝑎𝑠𝑠
𝑣𝑜𝑙𝑢𝑚𝑒
…equation 3.3
36
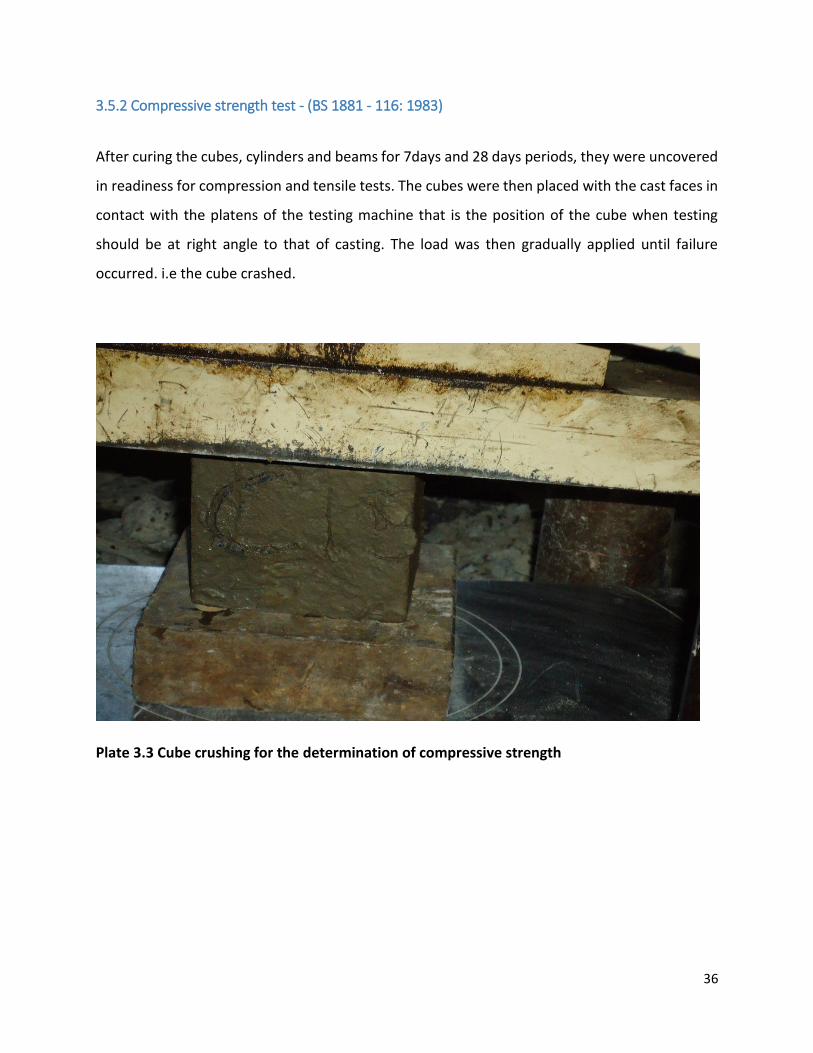
3.5.2 Compressive strength test - (BS 1881 - 116: 1983)
After curing the cubes, cylinders and beams for 7days and 28 days periods, they were uncovered
in readiness for compression and tensile tests. The cubes were then placed with the cast faces in
contact with the platens of the testing machine that is the position of the cube when testing
should be at right angle to that of casting. The load was then gradually applied until failure
occurred. i.e the cube crashed.
Plate 3.3 Cube crushing for the determination of compressive strength
37
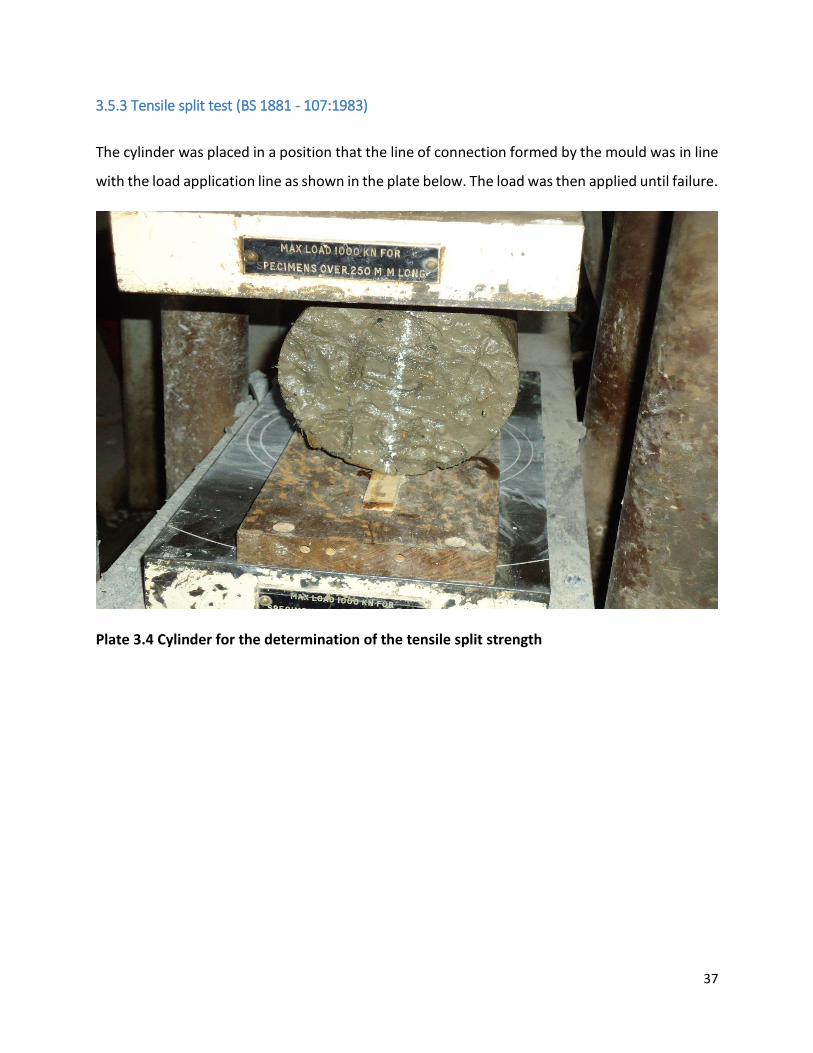
3.5.3 Tensile split test (BS 1881 - 107:1983)
The cylinder was placed in a position that the line of connection formed by the mould was in line
with the load application line as shown in the plate below. The load was then applied until failure.
Plate 3.4 Cylinder for the determination of the tensile split strength
38
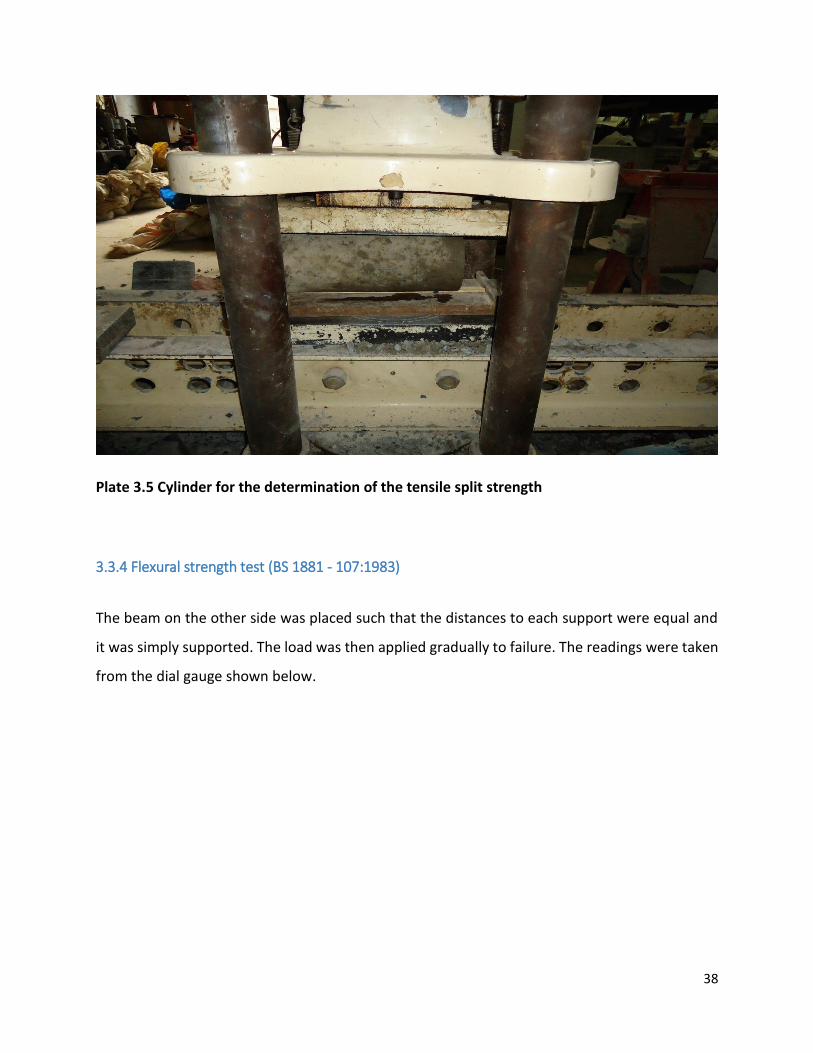
Plate 3.5 Cylinder for the determination of the tensile split strength
3.3.4 Flexural strength test (BS 1881 - 107:1983)
The beam on the other side was placed such that the distances to each support were equal and
it was simply supported. The load was then applied gradually to failure. The readings were taken
from the dial gauge shown below.

39
Plate 3.6 Dial gauge reading for the flexural Load
40
CHAPTER 4
4.0 RESULTS AND DISCUSSION
4.1 sieve analysis
4.1.1 Sieve analysis for sand
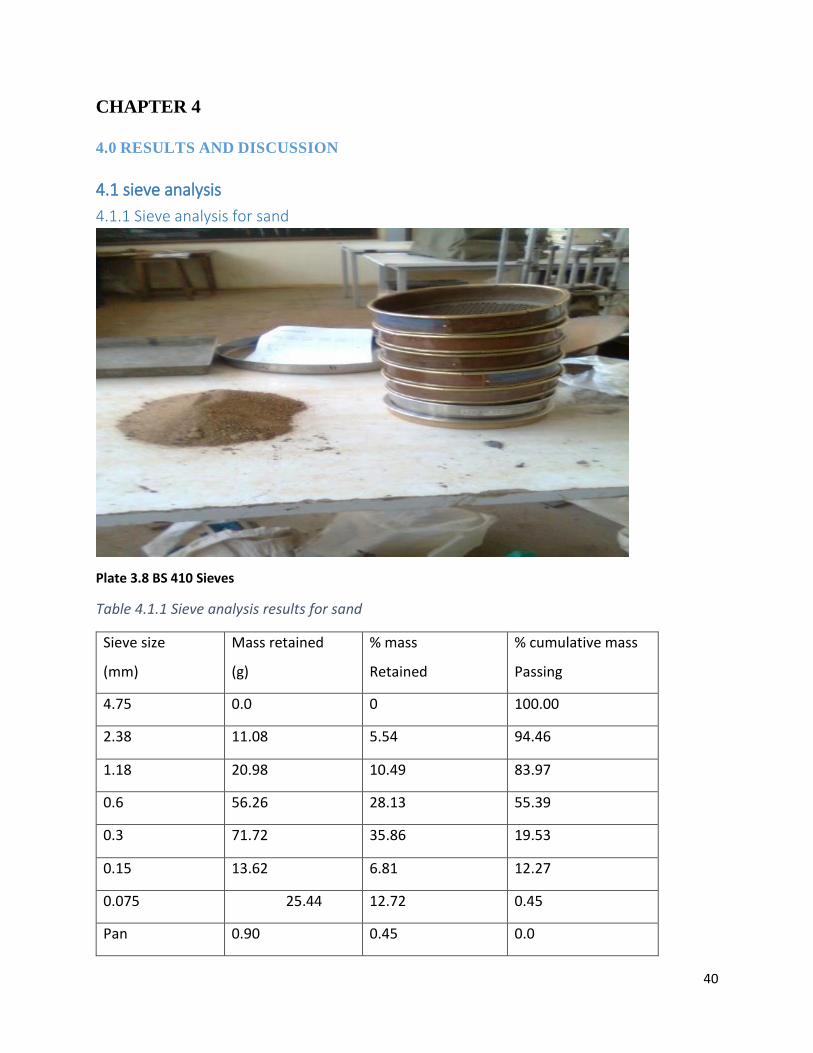
Plate 3.8 BS 410 Sieves
Table 4.1.1 Sieve analysis results for sand
Sieve size
(mm)
Mass retained
(g)
% mass
Retained
% cumulative mass
Passing
4.75 0.0 0 100.00
2.38 11.08 5.54 94.46
1.18 20.98 10.49 83.97
0.6 56.26 28.13 55.39
0.3 71.72 35.86 19.53
0.15 13.62 6.81 12.27
0.075 25.44 12.72 0.45
Pan 0.90 0.45 0.0

41
Fig. 4.1.1 particle distribution for sand
Sand used for the study is within the limits of BS 882-1992. Its grading curve is in the envelope of
maximum and minimum curves as shown in Fig 4.1.1 above.

42
4.1.2 Sieve analysis results of plastic particles
Table 4.1.2 Particle distribution for plastic particles
Sieve size (mm) Retained mass
(gm)
% Retained (%) Cumulative passed
percentage (%)
10 0 0 100
4.75 17.00 8.5 91.5
2.38 58.80 29.4 62.1
1.18 57.60 28.8 33.3
0.6 28.98 14.49 18.81
0.3 28.56 14.28 4.53
0.15 3.24 1.62 2.91
0.075 2.93 1.46 1.45
Pan 2.72 1.40 0

43
Fig 4.1.2 Particle distribution for plastic particles
The granulated plastic particles used for this study conform to the requirements BS 882-1992.
Their grading curve is within the grading envelop of good fine aggregates although they were
coarser than sand as the curve is more to the right of the envelope as shown in Fig4.1.2above.
44
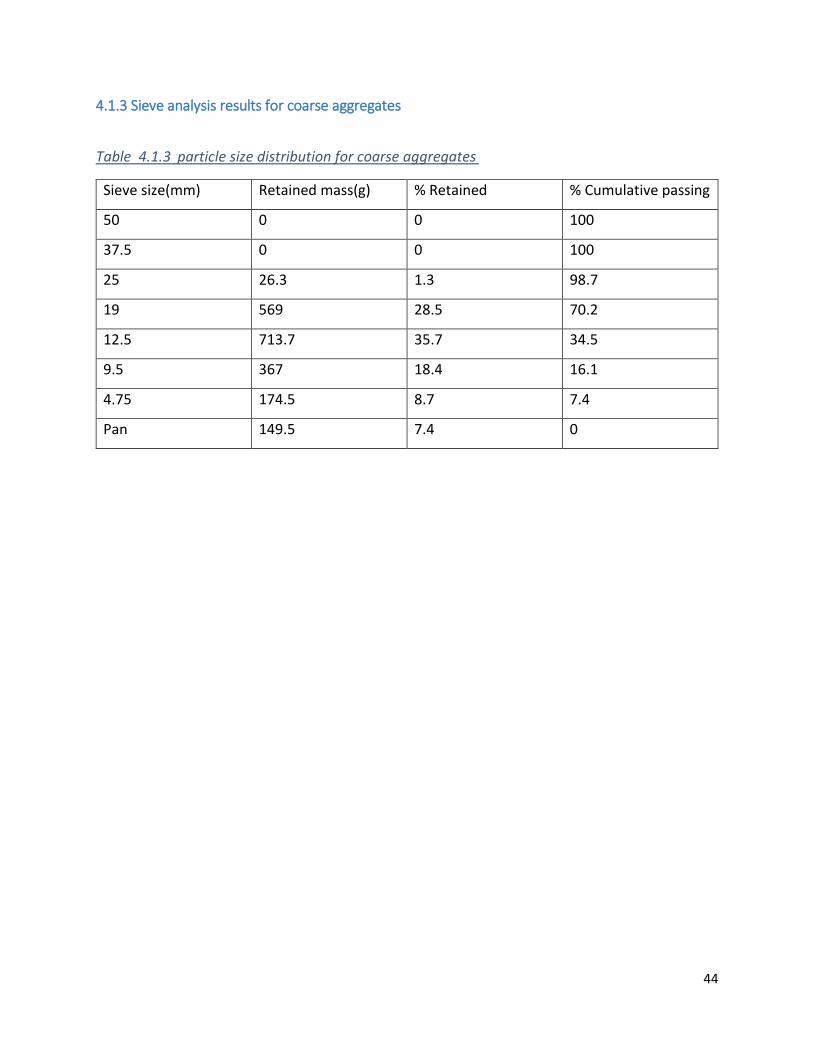
4.1.3 Sieve analysis results for coarse aggregates
Table 4.1.3 particle size distribution for coarse aggregates
Sieve size(mm) Retained mass(g) % Retained % Cumulative passing
50 0 0 100
37.5 0 0 100
25 26.3 1.3 98.7
19 569 28.5 70.2
12.5 713.7 35.7 34.5
9.5 367 18.4 16.1
4.75 174.5 8.7 7.4
Pan 149.5 7.4 0
45
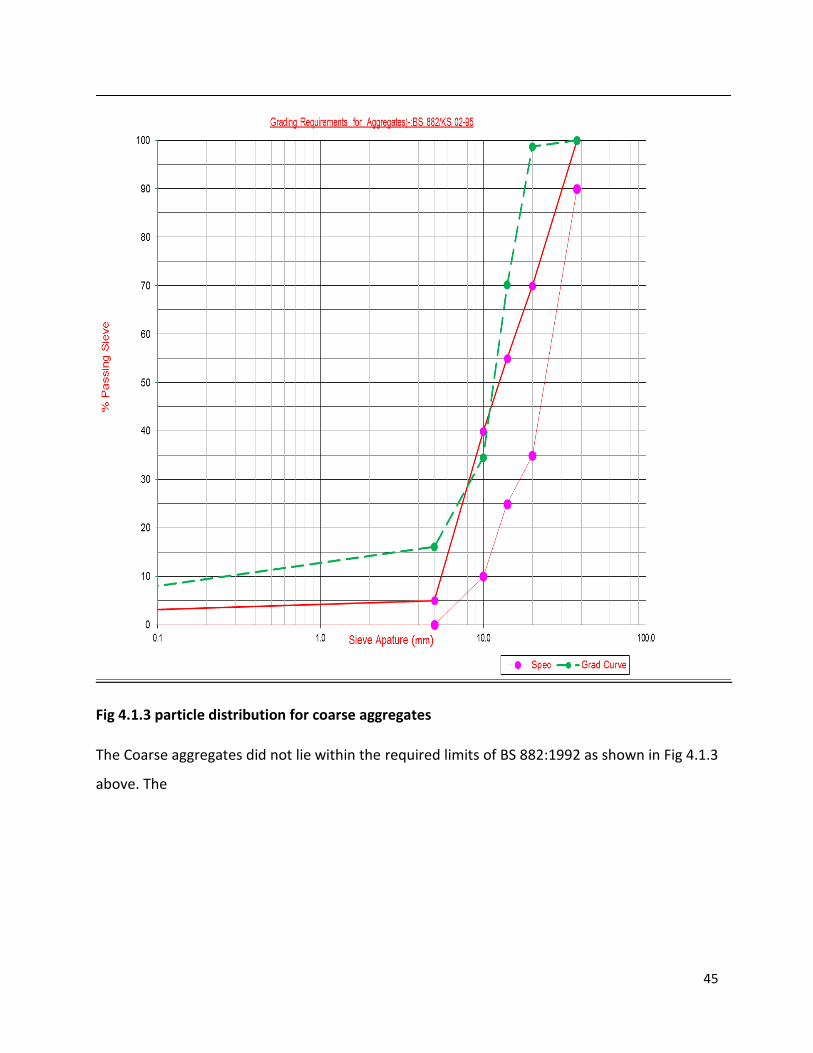
Fig 4.1.3 particle distribution for coarse aggregates
The Coarse aggregates did not lie within the required limits of BS 882:1992 as shown in Fig 4.1.3
above. The
46
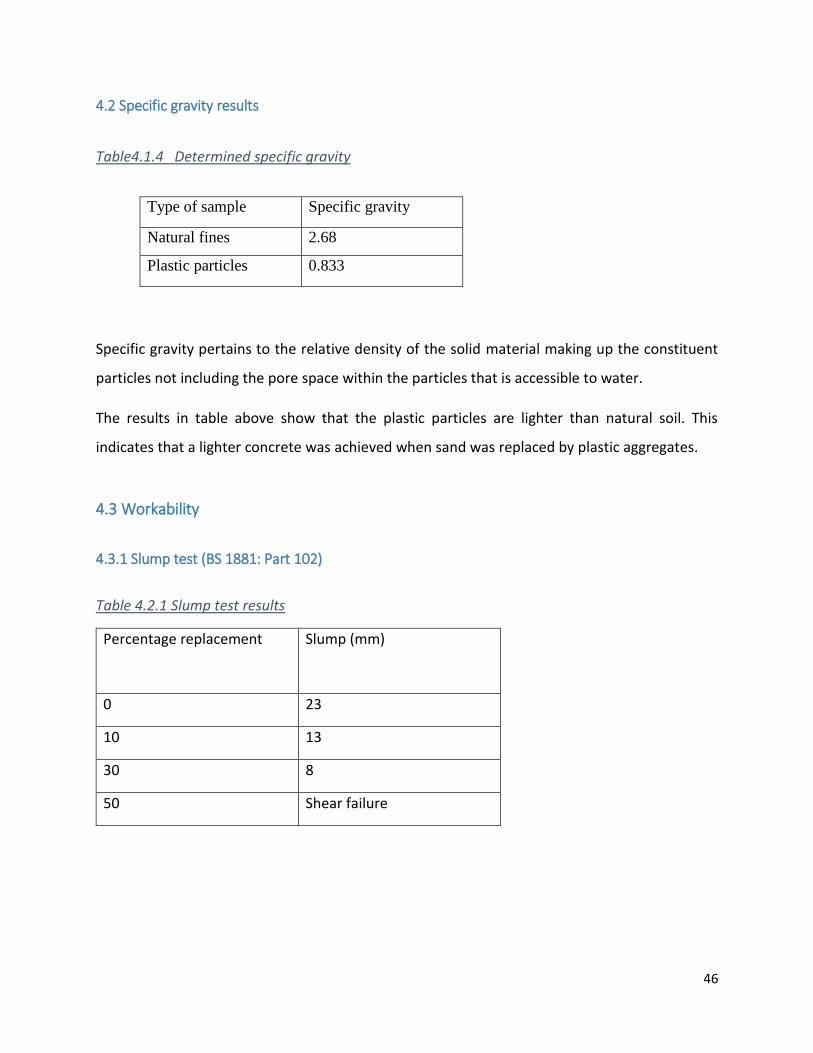
4.2 Specific gravity results
Table4.1.4 Determined specific gravity
Specific gravity pertains to the relative density of the solid material making up the constituent
particles not including the pore space within the particles that is accessible to water.
The results in table above show that the plastic particles are lighter than natural soil. This
indicates that a lighter concrete was achieved when sand was replaced by plastic aggregates.
4.3 Workability
4.3.1 Slump test (BS 1881: Part 102)
Table 4.2.1 Slump test results
Percentage replacement Slump (mm)
0 23
10 13
30 8
50 Shear failure
Type of sample Specific gravity
Natural fines 2.68
Plastic particles 0.833

47
Fig. 4.2 slump in (mm) against percentage replacement of sand with plastic particles in concrete
Fig 4.2 above shows that there is a reduction of slump with increasing amount of plastic in the
concrete. This indicates that the concrete becomes less workable with an increase in the
percentage replacement of sand with plastic particles as fine aggregates, which is attributed to
the plastic not mixing well with the other concrete constituents. At 10% replacement the mix was
workable enough at the same water content as the control, it was fairly workable at 30%, while
the concrete failed the slump test at 50% replacement. The results show that the concrete mixes
with higher plastic content required higher water content to achieve a reasonable workability
and flow characteristics.
4.3.2 Compaction factor test Table 4.2.2 compaction factor results
Percentage replacement Compaction factor
0 2.3
10 3.6
30 6.9
50 2.5
0
5
10
15
20
25
0 10 20 30 40 50 60
slu
mp
(m
m)
percentage replacement
slump vs %replacement of sand with plastic in concrete

48
4.4 Dry Density
Table 4.3 Determined dry density
Percentage
replacement
Cube
Average weight and density
Cylinder
Average weight and density
Weight(Kg) Density (KG/M3)
Weight (Kg) Density (KG/M3)
0 3.0 3000 12.65 2386.15
10 2.7 2700 12.45 2348.42
30 2.375 2375 12.35 2329.56
50 2.075 2075 10.5 1980.60
Fig 4.3.1 cube dry density against percentage replacement of sand with plastic particles in
concrete
0
500
1000
1500
2000
2500
3000
3500
0 10 20 30 40 50 60
Dry
Den
sity
(Kg/
Mᶟ)
percentage replacement
cube dry density

49
Fig 4.3.2 cylinder dry density against percentage replacement of sand with plastic particles in
concrete
From the Fig 4.3.1 and Fig 4.3.2 above it is evident that the density reduce with increase in the
plastic content in concrete. For the cubes there is a 10% decrease in density as compared to the
control for the 10% replacement of sand with plastic, a 20.83% decrease for the 30% replacement
and 30.83% for the 50% replacement. For the cylinders there is a 1.6% decrease in density as
compared to the control for the 10% replacement of sand with plastic, a 2.4% decrease for the
30% replacement and 17% for the 50% replacement. It shows that the rate of reduction of the
density of concrete also increases with every increase in the plastic content, although this rate is
more significant for cubes where there is a drastic reduction in density for every percentage
increase of plastic. This reduction in density is advantageous in that it will lead to reduced dead
load of the structure hence less complicated foundations can be use, which means a reduction in
the general cost of construction.
0
500
1000
1500
2000
2500
3000
0 10 20 30 40 50 60
Dry
dD
ensi
ty (
Kg/
Mᶟ)
percentage replacement
Cylinders densities
50
4.5 Compressive strength
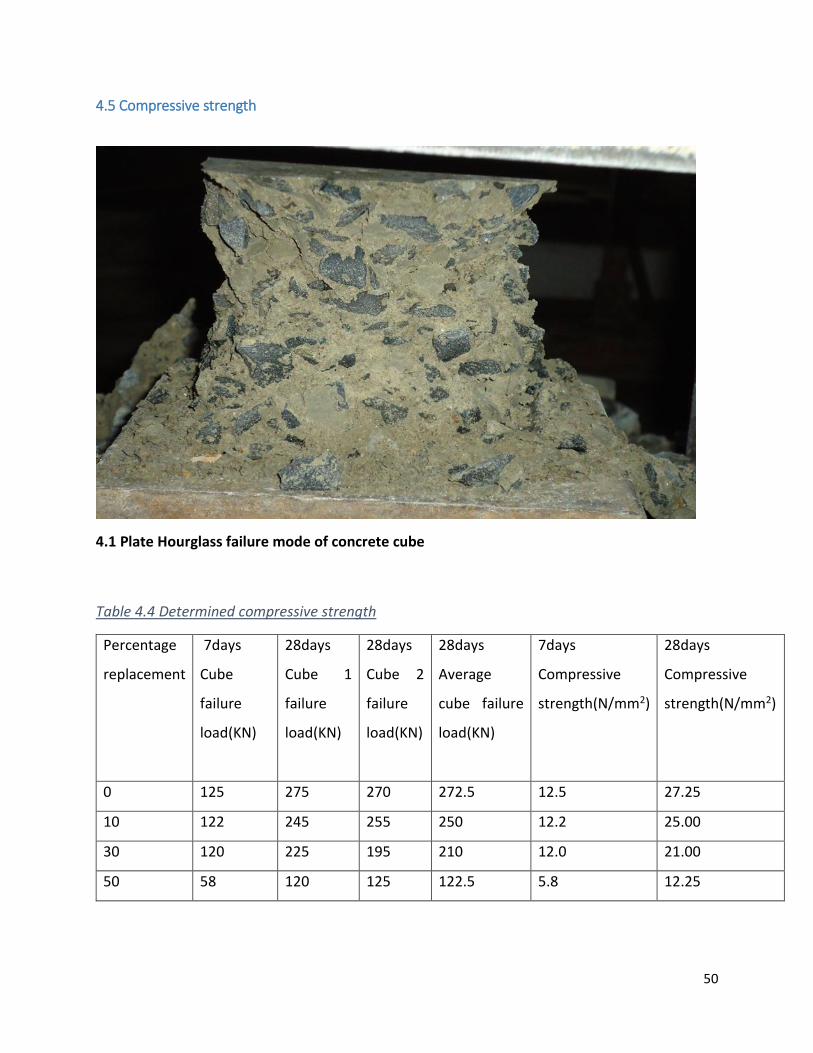
4.1 Plate Hourglass failure mode of concrete cube
Table 4.4 Determined compressive strength
Percentage
replacement
7days
Cube
failure
load(KN)
28days
Cube 1
failure
load(KN)
28days
Cube 2
failure
load(KN)
28days
Average
cube failure
load(KN)
7days
Compressive
strength(N/mm2)
28days
Compressive
strength(N/mm2)
0 125 275 270 272.5 12.5 27.25
10 122 245 255 250 12.2 25.00
30 120 225 195 210 12.0 21.00
50 58 120 125 122.5 5.8 12.25
51
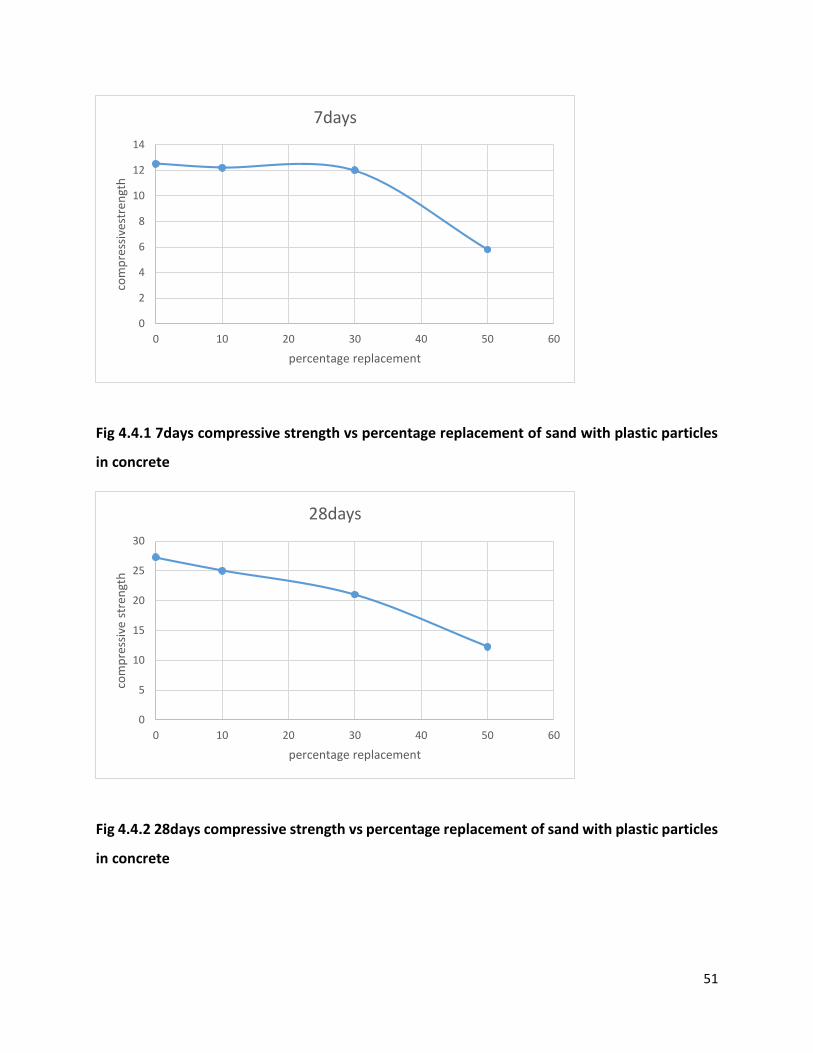
Fig 4.4.1 7days compressive strength vs percentage replacement of sand with plastic particles
in concrete
Fig 4.4.2 28days compressive strength vs percentage replacement of sand with plastic particles
in concrete
0
2
4
6
8
10
12
14
0 10 20 30 40 50 60
com
pre
ssiv
estr
engt
h
percentage replacement
7days
0
5
10
15
20
25
30
0 10 20 30 40 50 60
com
pre
ssiv
e st
ren
gth
percentage replacement
28days

52
Fig 4.4.3 compressive strength ratio depending on age, age 1 and 2 represent 7days and 28days
respectively
In this research the values of compressive strength for different replacement of plastic contents
(0%, 10%, 30% and 50%) at the end of different curing periods ( 7days, and 28 days) as given in
Table 4.4 above. The Fig.4.4.1 and Figs.4.4.2 graphs above represents varying strength of
concrete cubes in each of various percentages of sand replacement with plastic particles for 7
days. From the Fig 4.4.1 graph above, there is gradual decrease in compressive strength from 0%
– 10% sand replacement with a decrease of about 0.3N/mm2.Between 10% - 30% sand
replacement the slope becomes less steep with an decrease of 0.2N/mm2.Above 30% the
compressive strength has the steepest slope with a decrease of 6.2N/mm2 from 30% to 50%. Fig
4.4.2 shows that the compressive strength at 28 days decreases by 8.3 %, 23 %, and 55% compared
to ordinary mix. Therefore the compressive strength decreases with every addition of plastic
content replacing sand at all ages although the strength of all mixtures continued to increase with
the age. Fig.4.4.3 Show the compressive strength ratio (at 7 and 28 days) with respect to
percentage replacement of sand by plastic.
0
5
10
15
20
25
30
1 2
com
pre
ssiv
e st
ren
gth
Age
Compressive strength ratio for 7days and 28days respectively
control
10% sand replacement
30% sand replacement
50% sand replacement
53
4.6 Tensile split strength
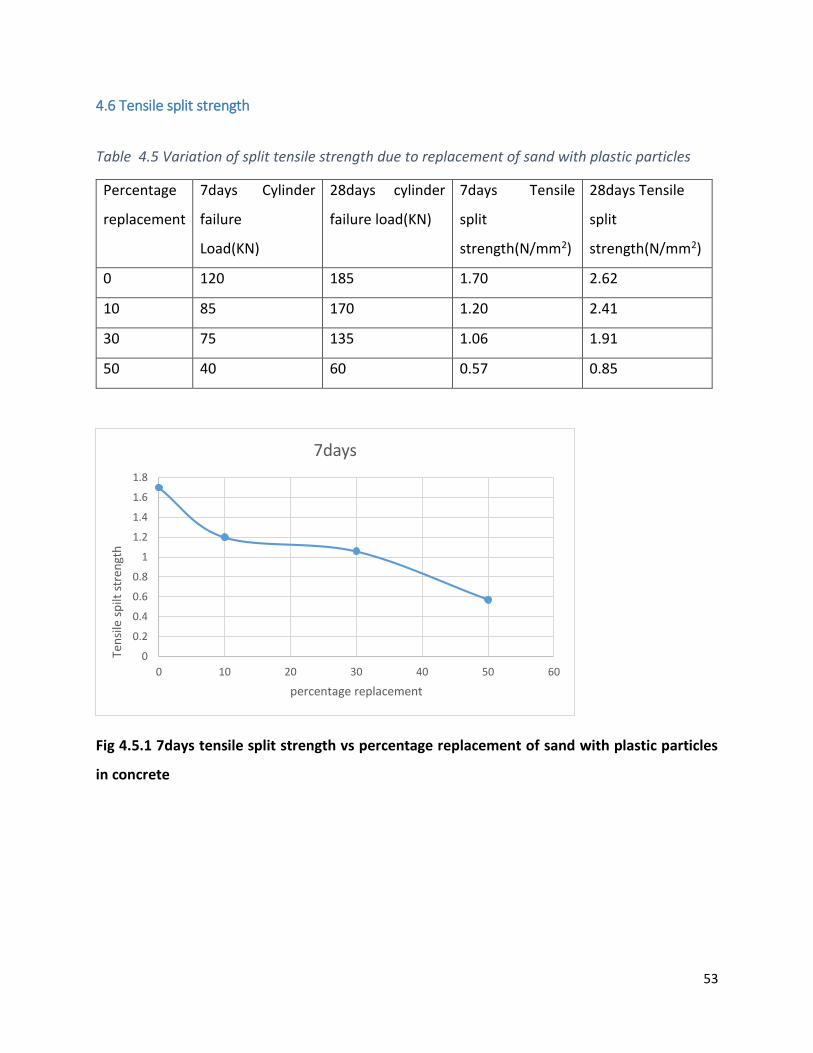
Table 4.5 Variation of split tensile strength due to replacement of sand with plastic particles
Percentage
replacement
7days Cylinder
failure
Load(KN)
28days cylinder
failure load(KN)
7days Tensile
split
strength(N/mm2)
28days Tensile
split
strength(N/mm2)
0 120 185 1.70 2.62
10 85 170 1.20 2.41
30 75 135 1.06 1.91
50 40 60 0.57 0.85
Fig 4.5.1 7days tensile split strength vs percentage replacement of sand with plastic particles
in concrete
0
0.2
0.4
0.6
0.8
1
1.2
1.4
1.6
1.8
0 10 20 30 40 50 60
Ten
sile
sp
ilt s
tren
gth
percentage replacement
7days
54
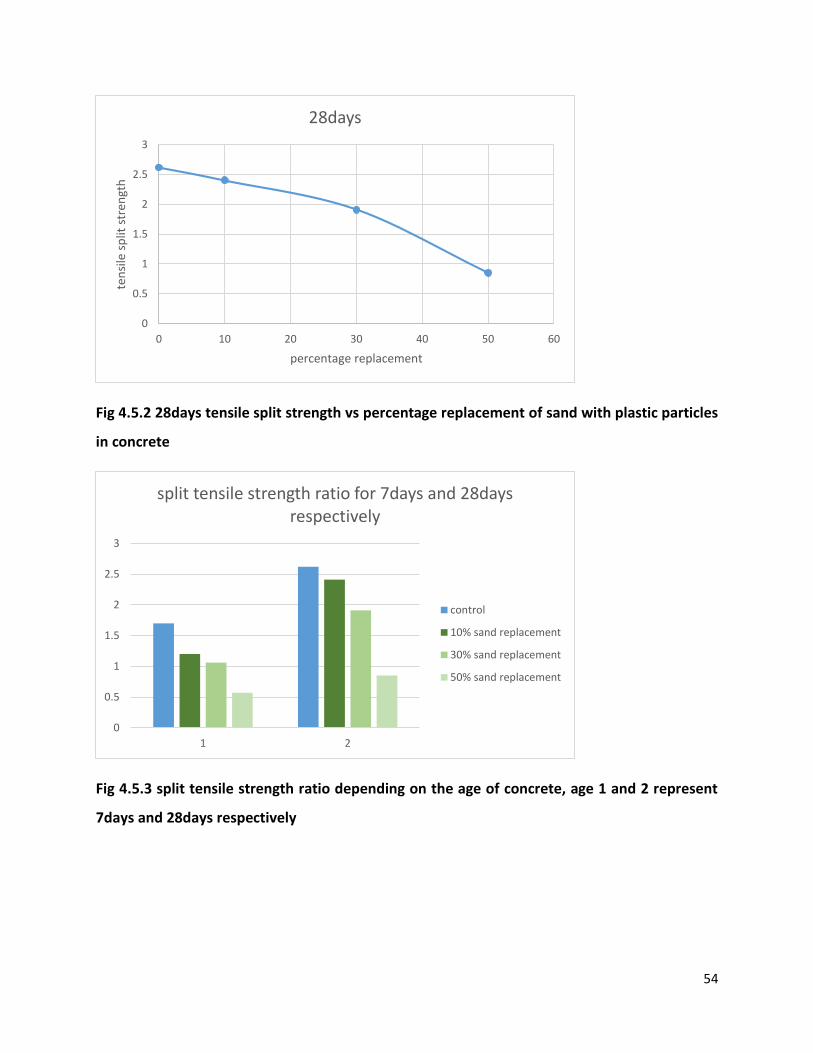
Fig 4.5.2 28days tensile split strength vs percentage replacement of sand with plastic particles
in concrete
Fig 4.5.3 split tensile strength ratio depending on the age of concrete, age 1 and 2 represent
7days and 28days respectively
0
0.5
1
1.5
2
2.5
3
0 10 20 30 40 50 60
ten
sile
sp
lit s
tren
gth
percentage replacement
28days
0
0.5
1
1.5
2
2.5
3
1 2
split tensile strength ratio for 7days and 28days respectively
control
10% sand replacement
30% sand replacement
50% sand replacement

55
It was found that split tensile strength of concrete containing plastic (using 10 %, 20 % and 30 %
replacement percentages with fine aggregate and a w/c of 0.5) depended on the percentage
plastic used. The variation of split tensile strength was shown in the table 4.5 above.
Fig.4.5.1 shows the variation of split tensile strength with replacements of sand with various
percentages of fine aggregate at 7days. Fig. 4.5.2 shows that split tensile strength decreases with
the increase in replacement of percentage of sand with plastic at 28days. Comparing with the
control mix, split tensile strength reduced by 29%, 38%, and 66% with respect to different
replacement levels of sand with foundry sand at 7days. At 28days the split tensile strength
reduces by 8%, 27% and 68% from control mix without plastic to the various replacement of sand
with plastic.
In Fig.4.5.3 the bar chart shows the split tensile strength ratio (at 7 and 28 days) with respect to
age at various replacement percentages of fine aggregates by plastic particles.
4.7 Flexural strength
Table 4.6 Flexural strength
percentage replacement
Beam load (KN) Flexural strength
0 1360 0.68
10 1220 0.61
30 780 0.39
50 480 0.24

56
Fig 4.6 flexural strength vs percentage replacement of sand with plastic particles in concrete
The results in table 4.6 above are for the concrete age of 28days. The flexural strength of the
concrete decreases with every percentage increase of plastic in the mix. The Fig 4.6 is a graph
showing that the variation in strength is almost linear. For 10%, 30%, 50% replacement of sand
with plastic particles the percentage decrease in strength was 10.3%, 43%, 65% respectively
comparing with the control mix.
0
0.1
0.2
0.3
0.4
0.5
0.6
0.7
0.8
0 10 20 30 40 50 60
flex
ura
l str
engt
h
percentage replacement
Chart Title

57
CHAPTER 5
5.0 CONCLUSION AND RECOMMENDATION
5.1General
In this research, waste granulated plastics were used as a partial replacement of sand in concrete,
and the resultant mix was studied and compared with the control mix having normal aggregates.
The conclusions are drawn based on the results obtained from this study.
5.2 Conclusion
1. For a given water content, the use of plastics in the mix lowers the density, compressive
strength and tensile strength.
2. Plastics can be used to replace some of the aggregates in a concrete mixture. This
contributes to reducing the unit weight of the concrete. This can be very applicable when
requiring lightweight concrete.
3. From observation of the mix, the cement paste and plastic aggregates did not mix as well
as the natural aggregates leading to a formation of a weak bond between the two, hence
the failure of concrete occurs under lower stresses compared to the control due to failure
of the bond.
4. Plastic aggregates can be used to cool the inside of buildings in areas of high temperatures
because it does not conduct heat.
5.3 Recommendation
The use of plastic in concrete lowered its resultant strength, therefore research should be done
to come up with methods of overcoming this drawdown before the use of plastic can actively be
adopted in concrete construction. The use of plastic in concrete is a new technology on which a
lot of research is required.

58
REFERENCES
1. United Nations environment programme 2009, “converting plastic waste in a resource”,
Industry and economics international environmental technology centre Osaka/ Shil
2. R. Siddique 2008, “Waste materials and by products in concrete”, Springer- Verlag Berlin,
Thapar University India.
3. Bahoria B.V, Parbat D.K and Naganaik P.B (2013), “Replacement of Natural sand in
Concrete by Waste products”, Journal of Environmental Research and Deveopment.
4. Batayneh, M, Marie, I, Asi I,(2007) “Use of selected waste materials in concrete mixes”.
Waste Management.
5. Choi, Y.W, Moon, D.J, Chung, J.S, Cho, S.K, (2005). “Effects of waste PET bottles
aggregates on properties of concrete”. Cement and concrete Research.
6. Al-Manaseer, A.A, T.R, Dalal, (1997) “Concrete containing plastic aggregates”, concrete
international.
7. Marzouk, O.Y Deilly R.M, (2007) “valorization of post-consumer waste plastic in
cementitious concrete composite”. Waste Management.
8. Naik, T.R, Singh, S.S, Bro dersen, B.S, (1996). “Use of post-consumer waste plastics in
cement-based composites”. Cement and concrete Research.
9. William H. Langer,Lawrence J. Drew, Janet S. Sachs (2004). “Aggregates and the
Environment”, American Geological Institute.
10. Website: www.ijetae.com (ISSN 2250-2459, Volume 2, Issue 6, June 2012) 42
“Experimental Investigation on the Properties of Concrete With Plastic PET (Bottle) Fibre
as Fine Aggregates”. Ms. K.Ramadevi1, Ms. R. Manju
11. International Conference on Chemical, Environmental and Biological Sciences
(ICCEBS'2012) Penang, Malaysia. “Recycling of Waste Polymeric Materials as a Partial
Replacement for Aggregate in Concrete”. Md. Mostafizur Rahman, Md. Akhtarul Islam
and Mainuddin Ahmed
59
12. Henry G. Russell, Henry G. Russell, Inc., Glenview, IL, (2009) “Light weight concrete—
Material properties for structural design”. LWL Bridges Workshop. St Louis, MO.
13. P. Suganthy, Dinesh. Chandrasekar, Sathish Kumar P.K (2013) @http://www.ijret.org.
“Utilization of Pulverized plastic in cement concrete as fine aggregates”. ISSN:2319-1163
International Journal of Research in Engineering and Technology.