university of stockholm
TRANSCRIPT


University of Stockholm
Institute of Linguistics
PERILUS IX
PERILUS mainly contains reports on current experimental work carried out in the Phonetics Laboratory at the University of Stockholm. Copies are available from the Institute of Linguistics, University of Stockholm, S-106 91 Stockholm, Sweden. This issue of PERIL US was edited by aile Engstrand, Mats Dufberg and Johan Stark.
ii
Institute of Linguistics University of Stockholm S-106 91 Stockholm
This issue of PERILUS contains articles on speech pathology and comprehension.
(c) 1989 The authors ISSN 0282-6690

THE PHONETICS LABORATORY GROUP
Ann-Marie Alma
Ulf Andersson Leslie Bailey 1
Robert Bannert Aina Bigestans Peter Branderud Una Cunningham-Andersson Hassan Djamshidpey Mats Dufberg Olle Engstrand
Garda Ericsson2
Anders Eriksson3
Ake Floran Eva Holmberg4
Diana Krull
Francisco Lacerda Ingrid Landberg Bjorn Lindblom5
Rolf Lindgren James Lubker6
Bertil Lyberg7
Robert McAllister Lennart Norda
Lennart Nordstrand9
Liselotte Roug-Hellichius
Richard Schulman Johan Stark Hartmut TraunmOlier Eva Oberg
iii
1 Visiting from Department of Unguistics, University of Delaware, Newark, Delaware, USA 2 Also Department of Phoniatrics, University Hospital, Unkoping 3 Also Department of Unguistics, University of Gothenburg 4 Also Research Laboratory of Electronics, MIT, Cambridge, MA, USA
5 Also Department of Unguistics, University of Texas at Austin, Austin, Texas, USA 6 Also Department of Communication Science and Disorders, University of Vermont,
Burlington, Vermont, USA
7 Also Swedish Telecom, Stockholm a Also Department of Speech Communication and Music Acoustics, Royal Institute of
Technology (KTH), Stockholm 9 Also AB Consonant, Uppsala

iv

CURRENT PROJECTS AND GRANTS
Speech transforms - an acoustic data base and computational rules for Swedish phonetics and phonology
v
Supported by: The Swedish Board for Technical Development (STU). grant 88-02192 to Olle Engstrand; The Tercentenary Foundation of the Bank of Sweden (RJ). grant 86/109:2 to Olle Engstrand
Project group: Olle Engstrand. Diana Krull, Bjorn Lindblom, Rolf Lindgren
Phonetically equivalent speech signals and paralinguistic variation in speech Supported by:
Project group:
The Swedish Council for Research in the Humanities and Social Sciences (HSFR), grant F966/88 to Hartmut TraunmOlier Aina Bigestans, Peter Branderud, Hartmut TraunmOlier
From babbling to speech I Supported by: The Swedish Council for Research in the Humanities
and Social Sciences (HSFR), grant F654/88 to Olle Engstrand and Bjorn Lindblom
Project group: Olle Engstrand, Francisco Lacerda, Ingrid Landberg, Bjorn Lindblom, Liselotte Roug-Hellichius
From babbling to speech II Supported by: The Swedish Council for Research in the Humanities
and Social Sciences (HSFR), grant F697/88 to Bjorn Lindblom; The Swedish Natural Science Research Council (NRF), grant F-TV 2983-300 to Bjorn Lindblom
Project group: Francisco Lacerda, Bjorn Lindblom
Attitudes to immigrant Swedish Supported by: The Swedish Council for Research in the Humanities
and Social Sciences (HSFR), grant F655/88 to Olle Engstrand
Project group: Una Cunningham-Andersson, Olle Engstrand

vi
Speech after glossectomy Supported by: The Swedish Cancer Society, grant 2653-B89-01X to
Olle Engstrand; The Swedish Council for Planning and Coordination of Research (FRN), grant 880252:3 to Olle Engstrand
Project group: Ann- Marie Alma, Olle Engstrand, Eva Oberg
The measurement of speech comprehension Supported by: The Swedish Council for Planning and Coordination of
Research (FRN), grant 880253:3 to Robert McAllister Project group: Mats Dufberg, Robert McAllister
Speech spectography modelling hearing and adapted to vision Supported by: The Swedish Board for Technical Development (STU),
grant 712-88-03346 to Hartmut TraunmOlier Project group: Hartmut TraunmOlier
Articulatory-acoustic correlations in coarticulatory processes: a cross-language investigation Supported by: The Swedish Board for Technical Development (STU);
ESPRIT: Basic Research Action, AI and Cognitive Science: Speech
Project group: Olle Engstrand, Robert McAllister
PROJECfS AND GRANfS

PREVIOUS ISSUES OF PERILUS
PERILUS I, 1978 -1979
1. INTRODUCTION Bjorn Lindblom and James Lubker
2. SOME ISSUES IN RESEARCH ON THE PERCEPTION OF STEADY-STATE VOWELS
Vowel identification and spectral slope Eva Age/fors and Mary Graslund
Why does [a] change to [0] when Fa is increased? Interplay between harmonic structure and formant frequency in the perception of vowel
quality Ake Floren
Analysis and prediction of difference limen data for formant frequencies Lennart Nord and Eva Sventelius
vii
Vowel identification as a function of increasing fundamental frequency Elisabeth Tenenholtz
Essentials of a psychoacoustic model of spectral matching Hartmut TraunmDller
3. ON THE PERCEPTUAL ROLE OF DYNAMIC FEATURES IN THE SPEECH SIGNAL
Interaction between spectral and durational cues in Swedish vowel contrasts Anette Bishop and Gunilla Edlund
On the distribution of [h] in the languages of the world: is the rarity of syllable final [h] due to an asymmetry of backward and forward masking? Eva Holmberg and Alan Gibson

viii
On the function of formant transitions I. Formant frequency target vs. rate of change in vowel identification II. Perception of steady vs. dynamic vowel sounds in noise Karin Holmgren
Artificially clipped syllables and the role of formant transitions in consonant perception Hartmut TraunmDller
4. PROSODY AND TOP DOWN PROCESSING
The importance of timing and fundamental frequency contour information In the perception of prosodic categories Bertil Lyberg
Speech perception in noise and the evaluation of language proficiency Alan C. Sheats
5. BLOD - A BLOCK DIAGRAM SIMULATOR Peter Branderud
PERILUS II, 1979 -1980
Introduction James Lubker
A study of anticipatory labial coarticulation in the speech of children Asa Berlin, Ingrid Landberg and Lilian Persson
Rapid reproduction of vowel-vowel sequences by children Ake Floren
Production of bite-block vowels by children Alan Gibson and Lorrane McPhearson
Laryngeal airway resistance as a function of phonation type Eva Holmberg
The declination effect in Swedish Diana Krull and Siv Wandebiick
PREVIOUS ISSUES

Compensatory articulation by deaf speakers Richard Schulman
Neural and mechanical response time in the speech of cerebral palsied subjects Elisabeth Tenenholtz
An acoustic investigation of production of plosives by cleft palate speakers Garda Ericsson
PERILUS III, 1982 -1983
Introduction Bjorn Lindblom
Elicitation and perceptual judgement of disfluency and stuttering Anne-Marie Alme
Intelligibility vs. redundancy - conditions of dependency Sheri Hunnicut
The role of vowel context on the perception of place of articulation for stops Diana Krull
Vowel categorization by the bilingual listener Richard Schulman
Comprehension of foreign accents. (A Cryptic investigation.) Richard Schulman and Maria Wingstedt
Syntetiskt tal som hjalpmedel vid korrektion av d6vas tal Anne-Marie Oster
PREVIOUS ISSUES
ix
x
PERILUS IV, 1984-1985
Introduction Bjorn Lindblom
Labial coarticulation in stutterers and normal speakers Ann-Marie Alma
Movetrack Peter Branderud
Some evidence on rhythmic patterns of spoken French Danielle Duez and Yukihoro Nishinuma
On the relation between the acoustic properties of Swedish voiced stops and their perceptual processing Diana Krull
Descriptive acoustic studies for the synthesis of spoken Swedish Francisco Lacerda
Frequency discrimination as a function of stimulus onset cHaracteristics Francisco Lacerda
Speaker-listener interaction and phonetic variation Bjorn Lindblom and Rolf Lindgren
Articulatory targeting and perceptual consistency of loud speech Richard Schulman
The role of the fundamental and the higher formants in the perception of speaker size, vocal effort, and vowel openness Hartmut Traunmilller
PREVIOUS ISSUES
PERILUS V, 1986-1987
About the computer-lab Peter Branderud
Adaptive variability and absolute constancy in speech signals: two themes In the quest for phonetic invariance Bjorn Lindblom
Articulatory dynamics of loud and normal speech Richard Schulman
An experiment on the cues to the identification of fricatives Hartmut TraunmOller and Diana Krull
Second formant locus patterns as a measure of consonant-vowel coarticulation Diana Krull
Exploring discourse intonation in Swedish Madeleine Wulffson
Why two labialization strategies in Setswana? Mats Dufberg
Phonetic development in early infancy - a study of four Swedish children during the first 18 months of life Liselotte Roug, Ingrid Landberg and Lars Johan Lundberg
A simple computerized response collection system Johan Stark and Mats Dufberg
Experiments with technical aids in pronunciation teaching Robert McAllister, Mats Dufberg and Maria Wallius
PERILUS VI, FALL 1987
Effects of peripheral auditory adaptation on the discrimination of speech sounds (Ph. D. thesis) Francisco Lacerda
PREVIOUS ISSUES
xi
xii
PERILUS VII, MAY 1988
Acoustic properties as predictors of perceptual responses: a study of Swedish voiced stops (Ph.D. thesis) Diana Krull
PERILUS VIII, 1988
Some remarks on the origin of the ICphonetic code" Bjorn Lindblom
Formant undershoot in clear and citation form speech Bjorn Lindblom and Seung-Jae Moon
On the systematicity of phonetic variation in spontaneous speech Olle Engstrand and Diana Krull
Discontinuous variation in spontaneous speech Olle Engstrand and Diana Krull
Paralinguistic variation and invariance in the characteristic frequencies of vowels Hartmut Traunmilller
Analytical expressions for the tonotopic sensory scale Hartmut Traunmilller
Attitudes to immigrant Swedish - A literature review and preparatory experiments Una Cunningham-Andersson and Olle Engstrand
Representing pitch accent in Swedish Leslie M. Bailey
PREVIOUS ISSUES

xiii
CONTENTS OF PERILUS IX
Speech after cleft palate treatment - analysis of a 10-year material ................................................................ 1
Garda Ericsson and Birgitta Ystrom
Some attempts to measure speech comprehension .............. .............. 29 Robert MeA/lister and Mats Dufberg
Speech after glossectomy: phonetic considerations and some preliminary results ....................... 53
Ann-Marie Alme and Olle Engstrand
CONTENTS

xiv
Phonetic Experimental Research, Institute of Linguistics, University of Stockholm (PERILUS), vol IX, 1989, 1-28
Abstract
Speech after cleft palate treatment - analysis of a 10-year material
Garda Ericsson and Birgitta Ystrom 1
Case histories of 364 patients aged 11 months to 74 years, with cleft palate with or without cleft lip and alveolus, investigated and treated during a 10-
year period have been studied. The degree of speech proficiency attained at the time of the survey is presented. Treatment resulting in normal speech varied from one operation without subsequent speech therapy to primary and secondary operations and sometimes further surgery, to obtain adequate velopharyngeal function and/or closure of fistulas, followed by speech therapy. The results are presented for the whole series and for different groups classified according to age and type of defect, separately and in cross tabulation. The occurrence of other defects is described. Impaired hearing, delayed speech, and stuttering are noted and discussed.
Table of contents 1 1.1 1.2 1.2.1 1.2.2 1.2.3 1.2.4
1.2.5 2 2.1 2.1.1
2.1.2
2.1.3
2.1.4 2.1.4.1
Introduction Background and purpose Methods and material
Clinical data Statistical methods The Cleft Palate Team Age at primary closure of the soft palate Speech evaluation
Results Primary surgery
Normal speech after primary operation of the palate Results of primary operation and post-operative speech therapy Normal speech after primary operation alone and after primary operation followed by speech therapy Age at palatal closure
Counselling
Department of Phoniatrics, University Hospital, Linkoping
Linguistics, Stockholm

2
2.2 2.2.1 2.2.2 2.2.3
2.3 2.3.1 2.3.2 2.3.3 2.3.3.1 2.3.3.2 2.3.3.3 3
1
Ericsson and Ystrom
Secondary surgery Normal speech after secondary palatal operation Age at secondary operation Normal speech after secondary palatal surgery plus speech therapy
Fistulas, accompaning malformations and conditions Fistulas Accompaning malformations Accompaning conditions
Hearing defect Delayed speech Stuttering
Concluding remarks
Introduction
1.1 Background and purpose
Over a lO-year period up to May 1979, 364 patients, 201 male and 163 female, with cleft palate with or without cleft lip and alveolus, were examined at the Department of Phoniatrics, University Hospital, Linkoping. All were resident in the south-east medical region of Sweden. This region has about one million inhabitants. Plastic surgery has been available at the hospital since 1967. Thus the younger patients, except those who moved to the region in recent years, were primarily operated on at this hospital, but primary operation on the older patients was done elsewhere. Secondary operations were done both here and at other teaching centres. Since 1972 the Department ofPhoniatrics at Linkoping has had a speech pathologist working mostly with cleft palate patients.
The purpose of the present investigation was to estimate the results achieved in speech proficiency in relation to the treatment given. We also investigated the extent to which normal speech was attained and what treatment was needed to reach that goal.
1.2 Methods and materials
1.2.1 Clinical data
We have examined the results for different age groups and types of defects. We also looked for a possible relation between age at primary operation of the soft palate and the speech outcome.
All clinical data used in this research were obtained from case records at the Department of Phoniatrics, University Hospital, Linkoping, and other
PERILUS IX, 1989
Speech after cleft palate treatment
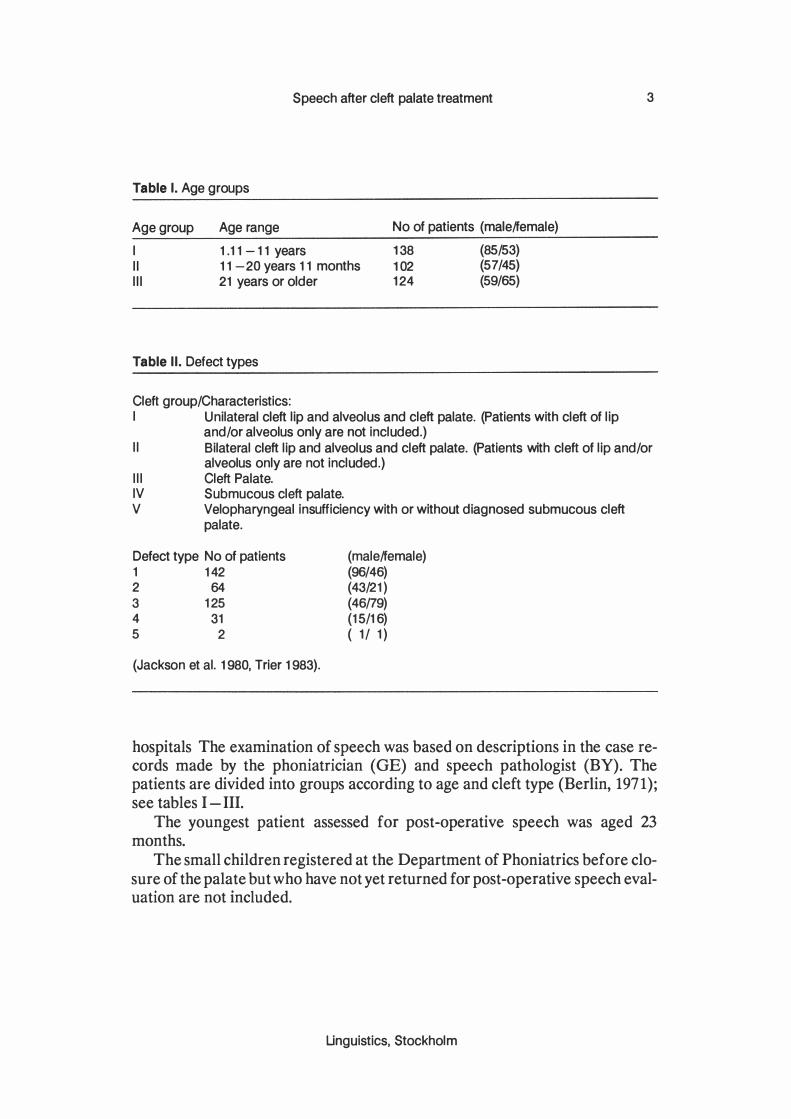
Table I. Age groups
Age group
I II III
Age range
1 .11 -11 years 11 -20 years 11 months 21 years or older
Table II. Defect types
Cleft group/Characteristics:
No of patients (male/female)
138 (85/53) 102 (57/45) 124 (59/65)
I Unilateral cleft lip and alveolus and cleft palate. (Patients with cleft of lip and/or alveolus only are not included.)
3
II Bilateral cleft lip and alveolus and cleft palate. (Patients with cleft of lip and/or alveolus only are not included.)
III Cleft Palate. IV Submucous cleft palate. V Velopharyngeal insufficiency with or without diagnosed submucous cleft
palate.
Defect type No of patients 1 142 2 64 3 125 4 31 5 2
(Jackson et al. 1980, Trier 1983).
(male/female) (96/46) (43/21) (46/79) (15/16) ( 1/ 1)
hospitals The examination of speech was based on descriptions in the case records made by the phoniatrician (GE) and speech pathologist (BY). The patients are divided into groups according to age and cleft type (Berlin, 1971) ; see tables I - III.
The youngest patient assessed for post-operative speech was aged 23 months.
The small children registered at the Department of Phoniatrics before closure of the palate but who have not yet returned for post-operative speech evaluation are not included.
Linguistics, Stockholm

4 Ericsson and Ystrom
Table III. Defect type and age: group size and sex distribution.
Defect type: 1 2 3 4 5
Age group 1 60 20 46 10 2
(41/19) (15/5) (21/25) (7/3) (1/1 )
2 34 18 34 16 0 (23/11 ) (13/5) (14/20) (7/9)
3 48 26 45 5 0 (32/16) (15/11) (11/34) (1/4)
Total 142 64 125 31 2 (96/46) (43/ 21) (46/79) (15/16) (1/1 )
Numbers in parentheses show the male/female distribution.
From 1973 all babies born in hospital are registered at the Medical Birth Register of the Social Welfare Board, and all developmental defects are noted. If the developmental defect is diagnosed later but within the first six months this is recorded. Since 1965 all live born babies with defects have been notified to the Social Welfare Board's register of malformations, when born at a hospital with paediatric consultant. It should be noted that paediatric consultants became increasingly common at such institutions during the period 1965-1973. Children born with cleft palate with or without cleft lip and alveolus are now referred directly to the Department of Plastic Surgery from the pediatrician who examines them at the Maternity Department.
The number of patients with submucous cleft palate cannot be regarded as representative of the total incidence of this defect in this region. Patients with submucous cleft were referred to us owing to hypernasal speech or the diagnosis was made fortuitously in connexion with investigations of other voice or speech trouble. Since 1973 all patients with submucous cleft palate are registered by the Social Welfare Board if the defect is diagnosed before the age of six months.
Our series accords with other, larger series and the Social Welfare Board's register in that cleft of the lip, alveolus, and palate is commoner than cleft of the palate only. Also, cleft through the lip, alveolus, and palate is commoner in boys than in girls, whereas cleft palate only is more usual among girls (Berlin, 1971 ; Fogh-Andersson, 1961 ; Henriksson, 1971).
PERILUS IX, 1989
Speech after cleft palate treatment
1.2.2 Statistical methods
5
Two-way tables with a sufficiently large number of individuals have been tested by the ordinary chi-square test (test of homogeniety) . If the tests have resulted in significant results, further analyses have been performed by pairwise comparison of observed relative frequencies with the binomial test (chi-square test of four-fold tables). Significant results have been presented at the significance level p, and this actual level is compared with the levels 0.001 , 0.01 and 0.05 (three, two and one star significance, respectively). For multiple comparisons at the same two-way table the significance level p is the simultaneous level
2.
1.2.3 The cleft palate team
From the Department of Plastic Surgery the children are referred to the Departments of Phoniatrics, Orthodontics, and Oto-Rhino-Laryngology (ENT). Patients with submucous cleft palate or velopharyngeal insufficiency first seen at the phoniatric clinic are referred to the orthodontic and ENT clinic, and also to the Department of Plastic Surgery if they have hypernasal speech. This applies to both children and adults referred to us for hypernasal speech, or who have consulted us on their own initiative, and also to patients seen by us for persistent nasalization after surgery.
Since 1967, when the Department of Plastic Surgery opened, patients operated on for cleft palate have been examined regularly by the cleft palate team. Patients moving to other parts of the country are now always referred to the corresponding team in their new area, and we assume that all of them, at least up to the age of 20, i.e. the first two age-groups, have come to our knowledge. Concerning the oldest age-group, some people with speech and other problems caused by cleft palate deformity, will have escaped the attention of the specialists of the cleft palate team. We also have seen malformations other than cleft palate in these patients, and have noted them.
We looked for hearing loss severe enough to influence speech, and also for language delay, a finding that is most reliable in the youngest age-group. Because we had a clinical impression that stuttering was more usual in patients with cleft palate than in the other diagnostic groups in our clinic, we noted this among these patients. Here stuttering does not include physiological repetitions in pre-school children.
1.2.4 Age at primary closure of the soft palate.
Of the 364 patients, 344 had been treated by primary palate surgery. 20 patients had not been operated on; 15 of them had submucous cleft palate, and all but
2 The statistical analyses were made by Stig Danielsson, University of Linkoping.
Linguistics, Stockholm
6 Ericsson and Ystrom
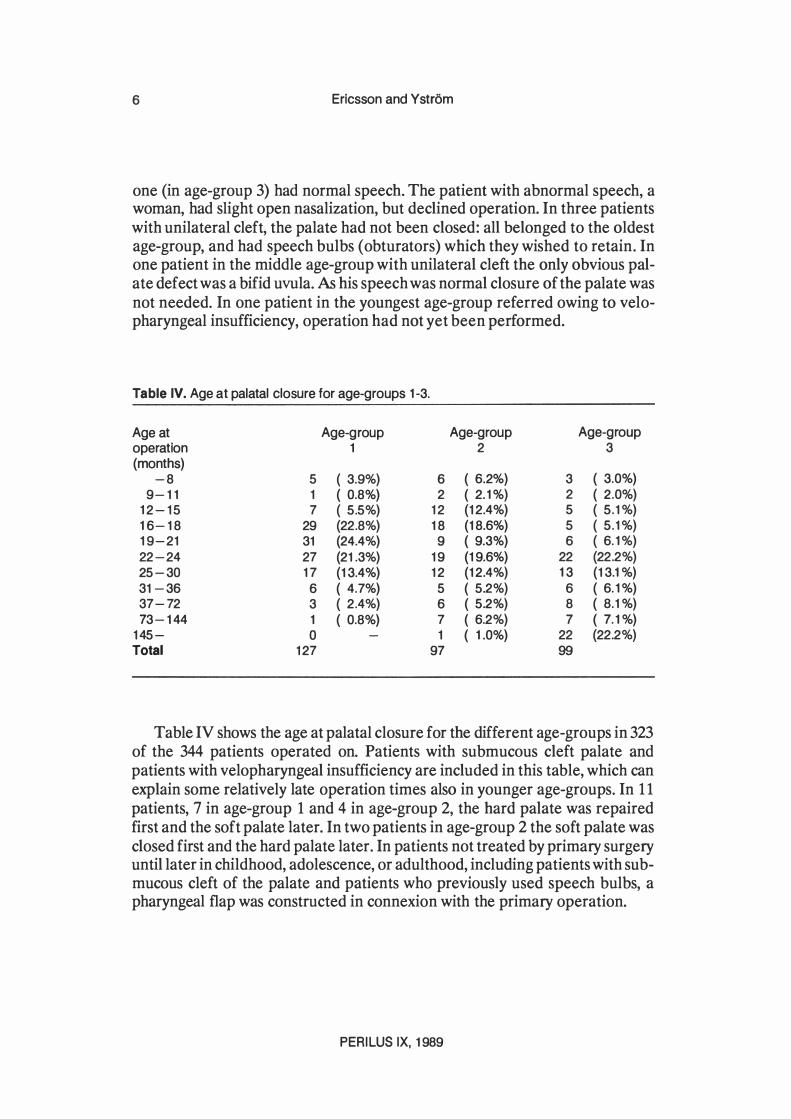
one (in age-group 3) had normal speech. The patient with abnormal speech, a woman, had slight open nasalization, but declined operation. In three patients with unilateral cleft, the palate had not been closed: all belonged to the oldest age-group, and had speech bulbs (obturators) which they wished to retain. In one patient in the middle age-group with unilateral cleft the only obvious palate defect was a bifid uvula. As his speech was normal closure of the palate was not needed. In one patient in the youngest age-group referred owing to velopharyngeal insufficiency, operation had not yet been performed.
Table IV. Age at palatal closure for age-groups 1-3.
Age at Age-group Age-group Age-group operation 1 2 3 (months)
-8 5 ( 3.9%) 6 ( 6.2%) 3 ( 3.0%) 9-11 1 ( 0.8%) 2 ( 2. 1 %) 2 ( 2.0%)
12-15 7 ( 5.5%) 12 (12.4%) 5 ( 5.1 %) 16-18 29 (22.8%) 18 (18.6%) 5 ( 5.1 %) 19-21 31 (24.4%) 9 ( 9.3%) 6 ( 6. 1 %) 22-24 27 (21.3%) 19 (19.6%) 22 (22.2%) 25-30 17 (13.4%) 12 (12.4%) 13 (13.1%) 31-36 6 ( 4.7%) 5 ( 5.2%) 6 ( 6. 1 %) 37-72 3 ( 2.4%) 6 ( 5.2%) 8 ( 8.1%) 73-144 1 ( 0.8%) 7 ( 6.2%) 7 ( 7. 1%)
145- 0 1 ( 1.0%) 22 (22.2%) Total 127 97 99
Table IV shows the age at palatal closure for the different age-groups in 323 of the 344 patients operated on. Patients with submucous cleft palate and patients with velopharyngeal insufficiency are included in this table, which can explain some relatively late operation times also in younger age-groups. In 1 1 patients, 7 in age-group 1 and 4 in age-group 2, the hard palate was repaired first and the soft palate later. In two patients in age-group 2 the soft palate was closed first and the hard palate later. In patients not treated by primary surgery until later in childhood, adolescence, or adulthood, including patients with submucous cleft of the palate and patients who previously used speech bulbs, a pharyngeal flap was constructed in connexion with the primary operation.
PERILUS IX, 1989
Speech after cleft palate treatment 7
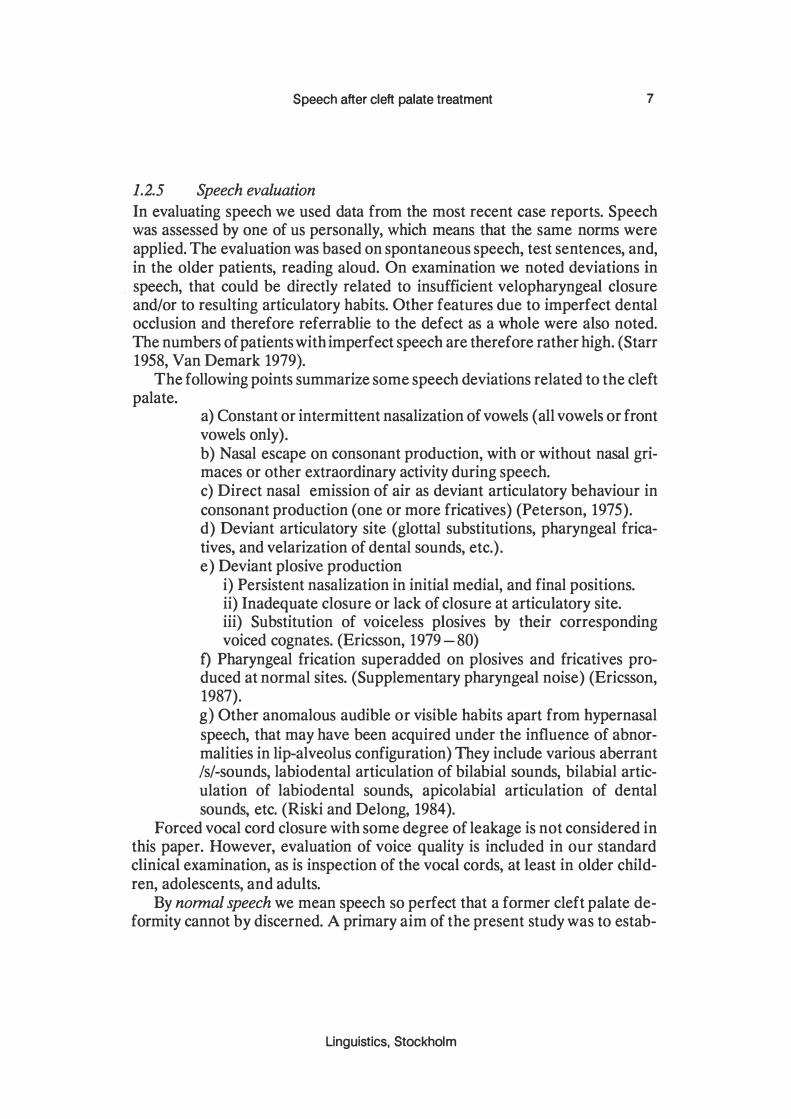
1.2.5 Speech evaluation
In evaluating speech we used data from the most recent case reports. Speech was assessed by one of us personally, which means that the same norms were applied. The evaluation was based on spontaneous speech, test sentences, and, in the older patients, reading aloud. On examination we noted deviations in speech, that could be directly related to insufficient velopharyngeal closure and/or to resulting articulatory habits. Other features due to imperfect dental occlusion and therefore referrablie to the defect as a whole were also noted. The numbers of patients with imperfect speech are therefore rather high. (Starr 1958, Van Demark 1979).
The following points summarize some speech deviations related to the cleft palate.
a) Constant or intermittent nasalization of vowels (all vowels or front vowels only) . b) Nasal escape on consonant production, with or without nasal grimaces or other extraordinary activity during speech. c) Direct nasal emission of air as deviant articulatory behaviour in consonant production (one or more fricatives) (Peterson, 1975). d) Deviant articulatory site (glottal substitutions, pharyngeal fricatives, and velarization of dental sounds, etc.) . e) Deviant plosive production
i) Persistent nasalization in initial medial, and final positions. ii) Inadequate closure or lack of closure at articulatory site. iii) Substitution of voiceless plosives by their corresponding voiced cognates. (Ericsson, 1979 -80)
f) Pharyngeal frication superadded on plosives and fricatives produced at normal sites. (Supplementary pharyngeal noise) (Ericsson, 1987). g) Other anomalous audible or visible habits apart from hypernasal speech, that may have been acquired under the influence of abnormalities in lip-alveolus configuration) They include various aberrant Is/-sounds, labiodental articulation of bilabial sounds, bilabial articulation of labiodental sounds, apicolabial articulation of dental sounds, etc. (Riski and Delong, 1984).
Forced vocal cord closure with some degree of leakage is not considered in this paper. However, evaluation of voice quality is included in our standard clinical examination, as is inspection of the vocal cords, at least in older children, adolescents, and adults.
By normal speech we mean speech so perfect that a former cleft palate deformity cannot by discerned. A primary aim of the present study was to estab-
Linguistics, Stockholm
8 Ericsson and Ystrom
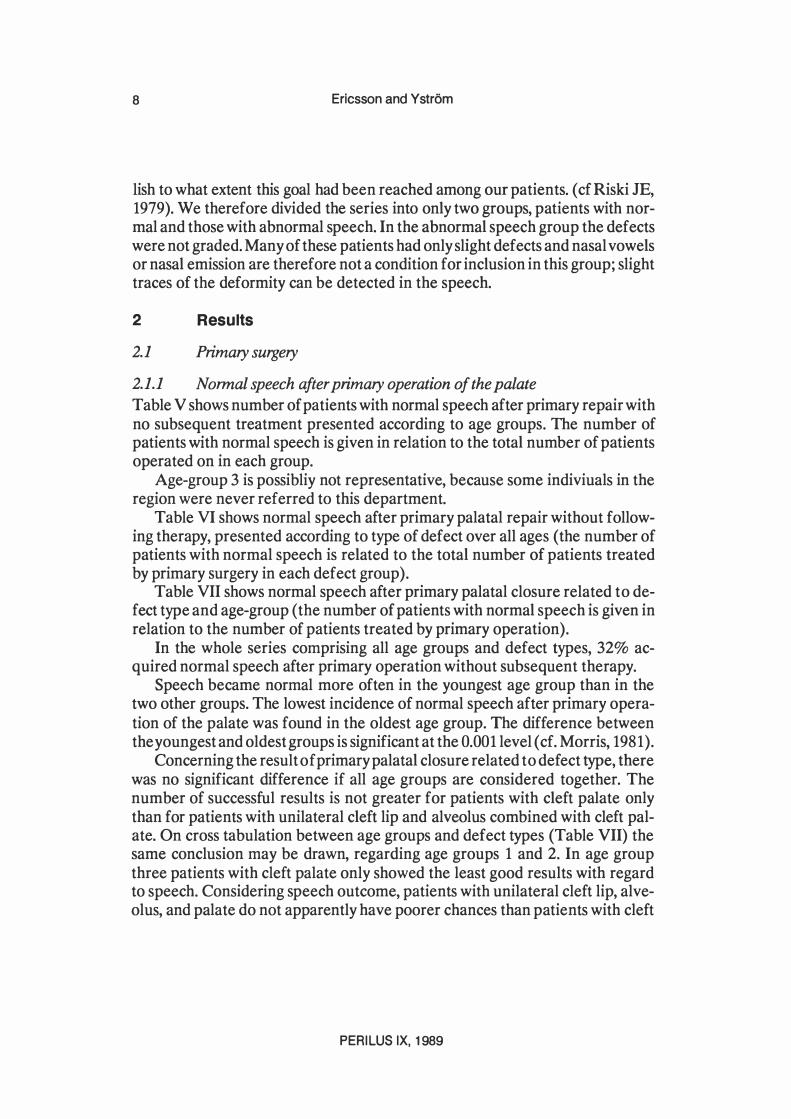
!ish to what extent this goal had been reached among our patients. (cf Riski JE, 1979). We therefore divided the series into only two groups, patients with normal and those with abnormal speech. In the abnormal speech group the defects were not graded. Many of these patients had only slight defects and nasal vowels or nasal emission are therefore not a condition for inclusion in this group; slight traces of the deformity can be detected in the speech.
2 Results
2.1 Primary surgery
2.1.1 Normal speech after primary operation of the palate
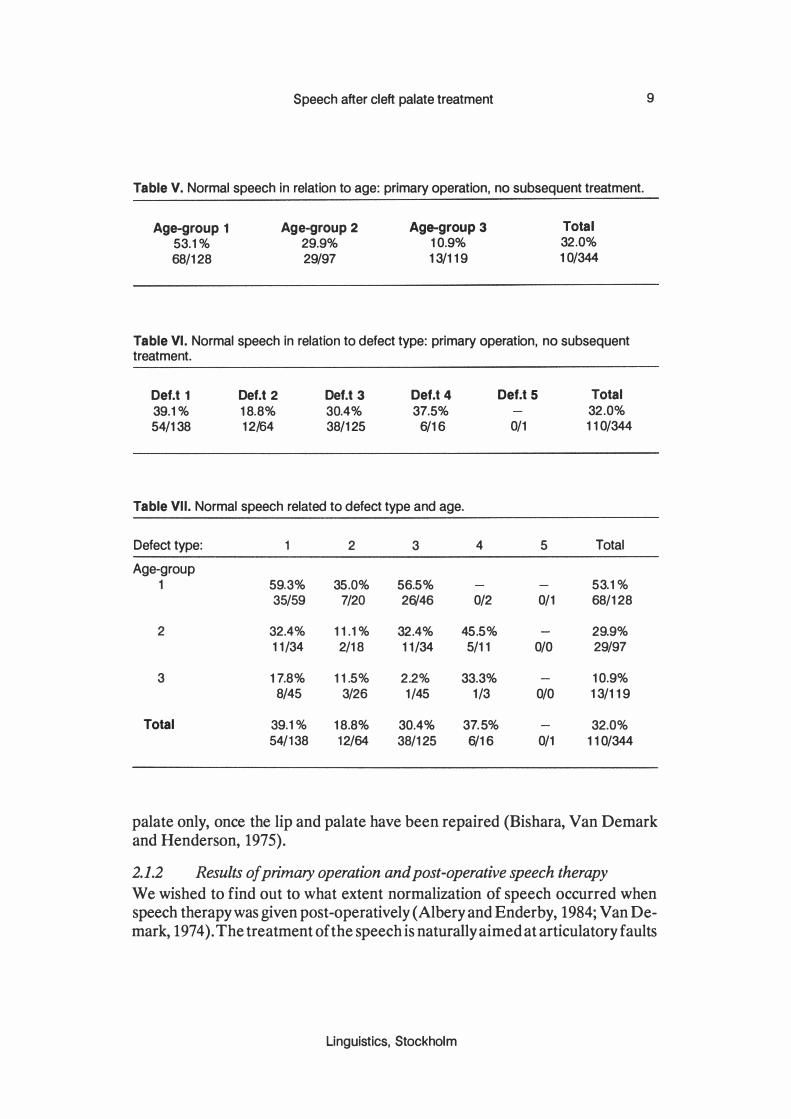
Table V shows number of patients with normal speech after primary repair with no subsequent treatment presented according to age groups. The number of patients with normal speech is given in relation to the total number of patients operated on in each group.
Age-group 3 is possibliy not representative, because some indiviuals in the region were never referred to this department.
Table VI shows normal speech after primary palatal repair without following therapy, presented according to type of defect over all ages (the number of patients with normal speech is related to the total number of patients treated by primary surgery in each defect group).
Table VII shows normal speech after primary palatal closure related to defect type and age-group (the number of patients with normal speech is given in relation to the number of patients treated by primary operation).
In the whole series comprising all age groups and defect types, 32% acquired normal speech after primary operation without subsequent therapy.
Speech became normal more often in the youngest age group than in the two other groups. The lowest incidence of normal speech after primary operation of the palate was found in the oldest age group. The difference between the youngest and oldest groups is significant at the 0.001 level (cf. Morris, 1981) .
Concerning the result of primary palatal closure related to defect type, there was no significant difference if all age groups are considered together. The number of successful results is not greater for patients with cleft palate only than for patients with unilateral cleft lip and alveolus combined with cleft palate. On cross tabulation between age groups and defect types (Table VII) the same conclusion may be drawn, regarding age groups 1 and 2. In age group three patients with cleft palate only showed the least good results with regard to speech. Considering speech outcome, patients with unilateral cleft lip, alveolus, and palate do not apparently have poorer chances than patients with cleft
PERILUS IX, 1989
Speech after cleft palate treatment
Table V. Normal speech in relation to age: primary operation, no subsequent treatment.
Age-group 1
53.1% 68/128
Age-group 2 29.9% 29/97
Age-group 3 10.9% 13/119
Total 32.0% 10/344
Table VI . Normal speech in relation to defect type: primary operation, no subsequent treatment.
DeU 1
39.1% 54/138
DeU 2
18.8% 12/64
DeU 3 30.4% 38/125
Def.t 4 37.5%
6/16
Def.t 5
0/1
Table VII. Normal speech related to defect type and age.
Defect type: 1 2 3 4 5
Age-group 1 59.3% 35.0% 56.5%
35/59 7/20 26/46 0/2 0/1
2 32.4% 11.1% 32.4% 45.5% 11/34 2/18 11/34 5/11 0/0
3 17.8% 11.5% 2.2% 33.3% 8/45 3/26 1/45 1/3 0/0
Total 39.1% 18.8% 30.4% 37.5% 54/138 12/64 38/125 6/16 0/1
Total 32.0% 110/344
Total
53.1% 68/128
29.9% 29/97
10.9% 13/119
32.0% 110/344
9
palate only, once the lip and palate have been repaired (Bishara, Van Demark and Henderson, 1975) .
2.1.2 Results of primary operation and post-operative speech therapy
We wished to find out to what extent normalization of speech occurred when speech therapy was given post-operatively (Albery and Enderby, 1984; Van Demark, 1974) . The treatment of the speech is naturally aimed at articulatory faults
Linguistics, Stockholm
10 Ericsson and Y strom
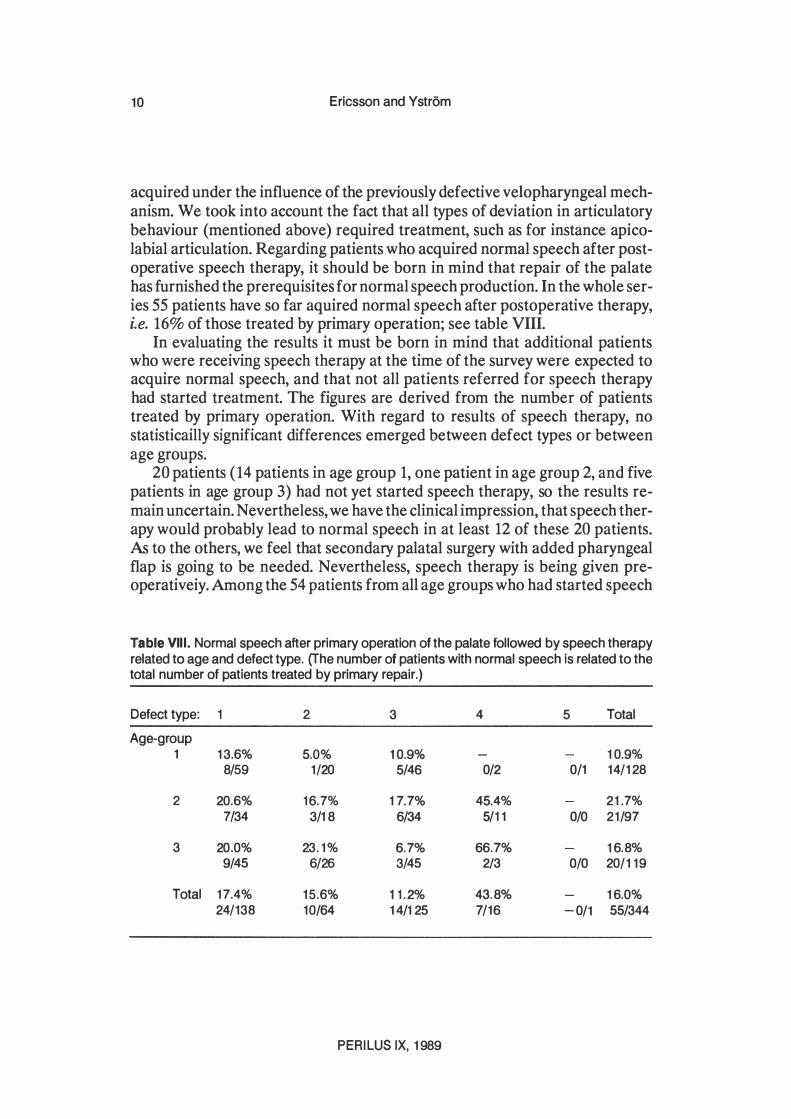
acquired under the influence of the previously defective velopharyngeal mechanism. We took into account the fact that all types of deviation in articulatory behaviour (mentioned above) required treatment, such as for instance apicolabial articulation. Regarding patients who acquired normal speech after postoperative speech therapy, it should be born in mind that repair of the palate has furnished the prerequisites for normal speech production. In the whole series 55 patients have so far aquired normal speech after postoperative therapy, i.e. 16% of those treated by primary operation; see table VIII.
In evaluating the results it must be born in mind that additional patients who were receiving speech therapy at the time of the survey were expected to acquire normal speech, and that not all patients referred for speech therapy had started treatment. The figures are derived from the number of patients treated by primary operation. With regard to results of speech therapy, no statisticailly significant differences emerged between defect types or between age groups.
20 patients ( 14 patients in age group 1, one patient in age group 2, and five patients in age group 3) had not yet started speech therapy, so the results remain uncertain. Nevertheless, we have the clinical impression, that speech therapy would probably lead to normal speech in at least 12 of these 20 patients. As to the others, we feel that secondary palatal surgery with added pharyngeal flap is going to be needed. Nevertheless, speech therapy is being given preoperativeiy. Among the 54 patients from all age groups who had started speech
Table VIII. Normal speech after primary operation of the palate followed by speech therapy related to age and defect type. (The number of patients with normal speech is related to the total number of patients treated by primary repair.)
Defect type: 2 3 4 5 Total
Age-group 1 13.6% 5.0% 10.9% 10.9%
8/59 1/20 5/46 0/2 0/1 14/128
2 20.6% 16.7% 17.7% 45.4% 21.7% 7/34 3/18 6/34 5/11 0/0 21/97
3 20.0% 23.1% 6.7% 66.7% 16.8% 9/45 6/26 3/45 2/3 0/0 20/119
Total 17.4% 15.6% 11.2% 43.8% 16.0% 24/138 10/64 14/125 7/16 -0/1 55/344
PERILUS IX, 1989
Speech after cleft palate treatment 11
therapy after primary operation but who had not attained normal speech at the end of the present investigation, we assume that about 20, most of them in age group 1, will come to speak normally through continued speech therapy. 34 of these 54 patients from all age groups and given speech therapy may in time need secondary surgery. Several of the patients mentioned in this part of the study had been referred to our cleft palate team many years after primary palatal surgery carried out in different parts of the country.
Regarding the number of the therapy sessions required to give normalization of speech, we have only been able to get information from our own clinic, i.e. for 45 of the total number of 55 patients. We found that the median is probably a more relevant measure than the mean, because some patients acquired normal speech after very few therapy sessions whereas others needed many more. The median was 24. The least number of therapy sessions needed for normalcy was three, and the greatest number of sessions given in any one case was 84.
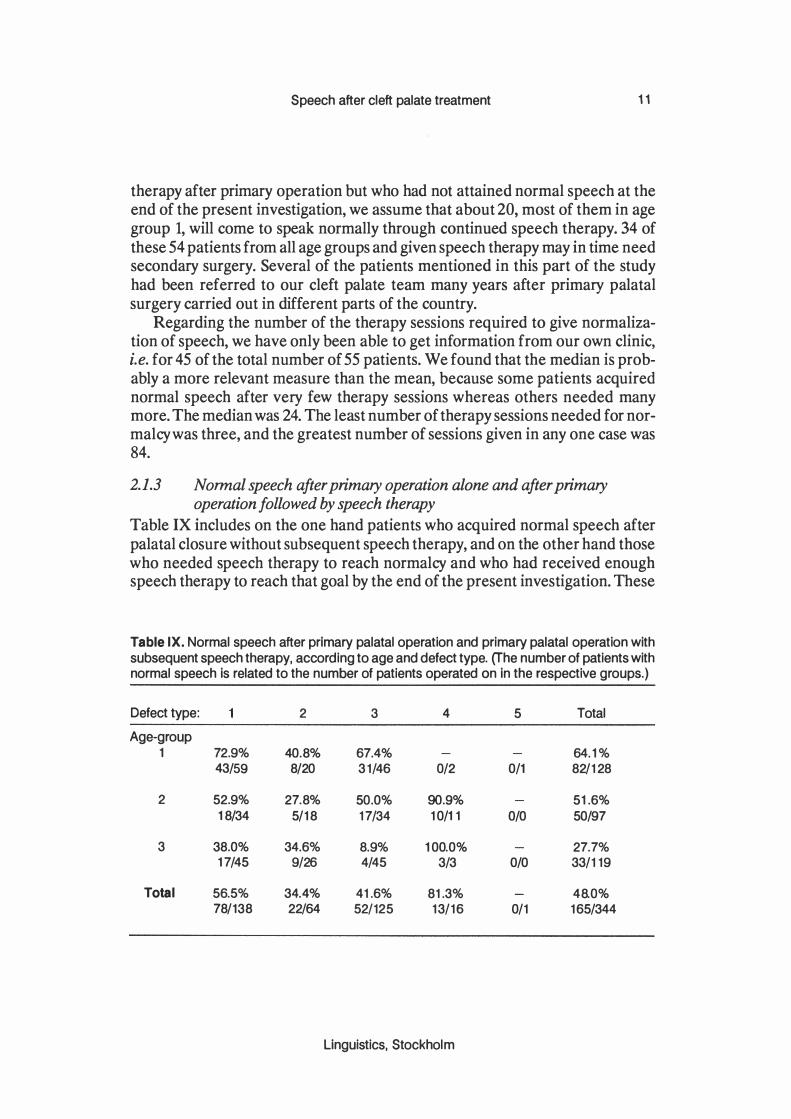
2.1.3 Normal speech after primary operation alone and after primary operation followed by speech therapy
Table IX includes on the one hand patients who acquired normal speech after palatal closure without subsequent speech therapy, and on the other hand those who needed speech therapy to reach normalcy and who had received enough speech therapy to reach that goal by the end of the present investigation. These
Table IX. Normal speech after primary palatal operation and primary palatal operation with subsequent speech therapy, according to age and defect type. (The number of patients with normal speech Is related to the number of patients operated on In the respective groups.)
Defect type: 2 3 4 5 Total
Age-group 1 72 .9% 40.8% 67.4% 64.1%
43/59 8/20 31/46 0/2 0/1 82/128
2 52 .9% 27.8% 50 .0% 90 .9% 51.6% 18/34 5/18 17/34 10/11 0/0 50/97
3 38 .0% 34.6% 8 .9% 100.0% 27.7% 17/45 9/26 4/45 3/3 0/0 33/119
Total 56.5% 34.4% 41 .6% 81 .3% 48.0% 78/138 22/64 52/125 13/16 0/1 165/344
Linguistics, Stockholm
12 Ericsson and Ystrom
numbers will of course become greater after further therapy, especially in the youngest age group.
In the youngest age group, up to 10 years 1 1 months, normal speech was attained in 64. 1 % at the end of the investigation. (Patients were still receiving therapy at the conclusion of the investigation, so the figure given does not reflect the optimum results for this age group.) In age groups 2 and 3 the corresponding figures were 51.6% and 27.7%.
The results for the different defect types after primary palatal operation and operation plus subsequent speech therapy are also given in table IX, for all age groups combined and separately. Defect type 1 carries a better prognosis in comparison with both defect types 2 and 3. No significant difference emerged concerning the speech outcome in defect types 2 and 3 or between defect types 1 and 2 taken together and compared with defect type 3 with regard to the common defect types 1, 2 and 3, the best result was attained by the patients with cleft palate concomitant with unilateral cleft lip and alveolus, whereas patients with cleft palate but not cleft lip or alveolus achieved only slightly better results than patients in whom cleft palate was combined with bilateral clefts of lip and alveolus. Considering the fact that the prognosis seems better with unilateral cleft lip and alveolus combined with cleft lip and palate than in bilateral clefts and in cleft palate alone, our series resembles other larger ones. In the group with submucous cleft palate 13 of the 16 patients treated surgically acquired normal speech after operation, although some of them profited from postoperative speech therapy. The only patient with velopharyngeal insufficiency but no submucous cleft of the palate had failed to obtain a normal speech by the end of the investigation.
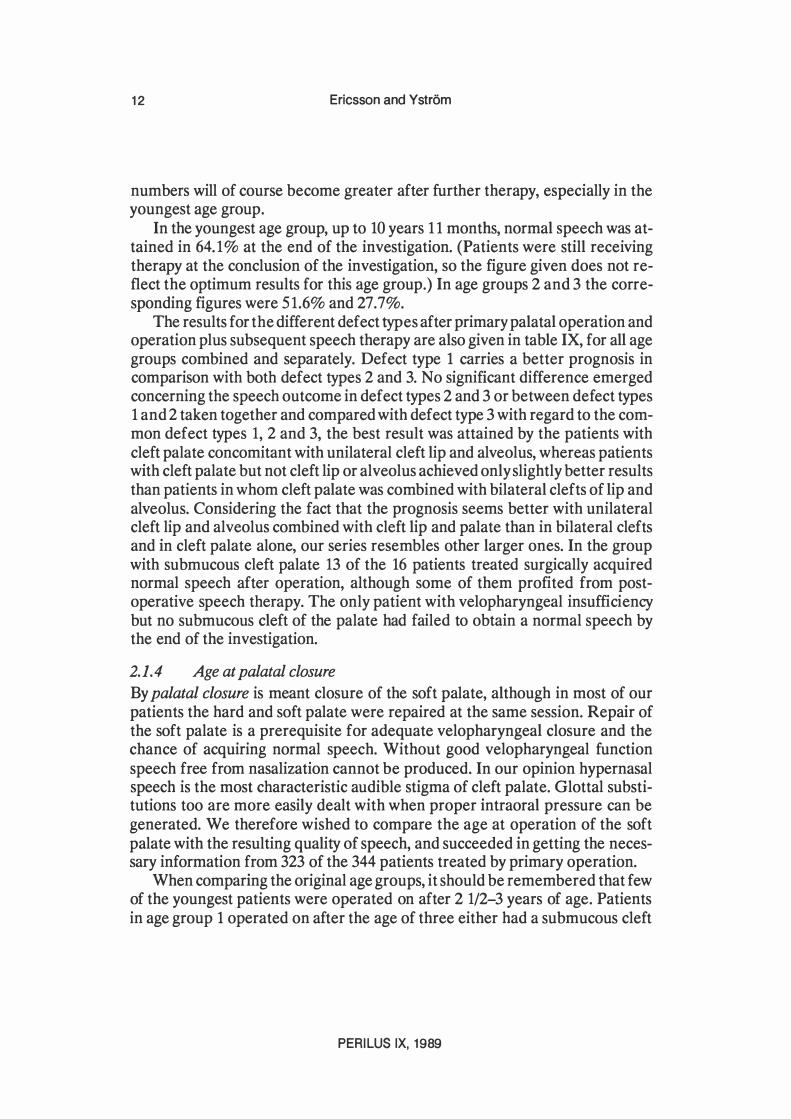
2.1.4 Age at palatal closure
By palatal closure is meant closure of the soft palate, although in most of our patients the hard and soft palate were repaired at the same session. Repair of the soft palate is a prerequisite for adequate velopharyngeal closure and the chance of acquiring normal speech. Without good velopharyngeal function speech free from nasalization cannot be produced. In our opinion hypernasal speech is the most characteristic audible stigma of cleft palate. Glottal substitutions too are more easily dealt with when proper intraoral pressure can be generated. We therefore wished to compare the age at operation of the soft palate with the resulting quality of speech, and succeeded in getting the necessary information from 323 of the 344 patients treated by primary operation.
When comparing the original age groups, it should be remembered that few of the youngest patients were operated on after 2 1/2-3 years of age. Patients in age group 1 operated on after the age of three either had a submucous cleft
PERILUS IX, 1989

Speech after cleft palate treatment 13
of the palate or some complicating handicap in addition to the cleft palate. Further, other differences including differences in operative methods must have existed, owing to the long period of time covered. We therefore give the speech outcome in relation to age at operation for each of the three age groups; table X.
The table shows the number of patients who aquired normal speech after operation, and who needed no speech therapy. To allow statistical calculations using the binomial test the three age groups were combined. Because few patients were operated on at ages 0 - 8 and 9 - 1 1 months, these two columns are combined. The bi-nomial test shows that the best results were obtained among patients operated on at age 16 -24 months: over 40% of these acquired normal speech (age 16-18 months 46.2%; age 19-21 months 52.2%; age 22-24 months 33.8%). On applying the Chi-square test to speech outcome among patients operated on at 16 -18 months of age, age group 1 showed significantly better results (p < 0.01) than age groups 2 and 3 .
Among patients who acquired normal speech after post-operative speech therapy the age at operation is given after the same principles as in Table X. When speech returns to normal after post-operative speech therapy, the operation has given the conditions necessary for this. We therefore compared these results with age at operation. No statistically significant differences emerged.
Table X. Normal speech after primary palatal repair in relation to age at operation.
Age-group : 2 3 All Abs In % Abs In % Abs In % Abs In %
Age at operation (months) 0-8,9-11 2/6 33.3 1/8 12.5 1/5 20.6 4/19 21.1
12-15 3/7 42.9 1/12 8.3 0/5 0.0 4/24 16.7 16-18 19/29 65.5 5/18 27.8 0/5 0.0 24/52 46.2 19-21 15/31 48.4 4/9 44.4 1/6 16.7 20/46 52.2 22-24 15/27 55.6 8/19 42.1 0/22 0.0 23/68 33.8 25-30 6/17 35.3 2/12 16.7 1/13 7.7 9/42 21.4 31-36 4/6 66.7 1/5 20.0 1/6 16.7 6/17 35.3 37-72 0/3 0.0 4/6 66.7 0/8 0.0 4/17 23.5 73-144 0/1 0.0 2/7 28.6 0/7 0.0 2/15 13.3 145- 0/0 0.0 1/1 100.0 8/22 36.4 9/23 39.1 Total 64/127 53.5 29/97 29.9 12/99 13.5 109/323 33.8
Linguistics, Stockholm

14 Ericsson and Ystrom
The three age-groups were combined to allow statistical analysis. The less good results after operation only in patients operated on between 2 and 2 1/2 years of age were not noted when patients acquiring normal speech after speech therapy were included (see Tables X and XII) possibly because patients not operated on until 2 -2 1/2 years of age had developed speech defects that could sometimes be corrected by speech therapy.
The age at primary palatal closure may be of importance for the speech outcome with or without post-operative speech therapy. A relationship between age at operation and speech outcome emerges in Table X. There is little difference between the age groups up to 15 months, but patients operated on between 16 and 24 months did significantly better (p < 0. 1) . Table XI shows no significantly better results for any age at operation. Concerning patients with normal speech after operative treatment only or operation followed by speech therapy (Table X and XI combined) results are significantly better at the 0. 1 level for patients operated on between 16 -24 months. It may therefore be concluded that the influence of age at operation on speech outcome is correlated to the effect of the operation itself. In the present series age at operation is thus the most important factor. In patients operated on between 25 and 30 months the results were poorer only in those who had had no speech therapy. The num-
Table XI. Normal speech after primary palatal repair plus speech therapy in relation to age at operation.
Age-group:
Age at operation (months) 0- 8 0 9- 11 0 12-15 0 16-18 2 19-21 5 22-24 4 25-30 2 31-36 0 37-72 1 73-144 0 145- 0 Total 14
2
o o 2 5 o 3 4 2 1 4 o
21
3
2 o o 1 o 5 5 1 1 o 5
20
PERILUS IX, 1989
All
2 o 2 8 5
12 11
3 3 4 5
55

Speech after cleft palate treatment 15
ber of patients operated on after 30 months of age was too small to allow definite conclusions (Randall et al 1983) .
The purpose of surgery is to provide the anatomical conditions for normal speech. At the time of operation the tissues must have reached a degree of maturity that will allow adequate velopharyngeal function, but bad articulatory habits ought preferably not to have become firmly established. Reports of very early palatal surgery have recently been presented (Dorf and Curtin, 1982; Randall and La Rossa, 1983). Further research may bring to light the optimum age for operation in order to achieve lasting, good velopharyngeal function, which is essential if the child is to be able to acquire and retain normal speech. The operative technique, the skills of the surgeon, and the extent of the defect are naturally also of importance, but we have not gone into these aspects in the present investigation.
2.1.4.1 Counselling
In connexion to the in-patient when the child is admitted for operation the parents are instructed by the phoniatrician or speech pathologist. They are told about speech defects that may occur in children with cleft palate and how treatment by operation and speech therapy can be helpful. It is also explained that further operations may be needed. Before the operation it must be explained
Table XII. Normal speech after primary operation and primary operation followed by speech therapy.
Age-group: 1 2 3 All In % Abs In % Abs In % Abs In % Abs
Age at operation (months) 0-8,9-11 33.3 2/6 12.5 1/8 60.0 3/5 31.6 6/19 12-15 42.9 3/7 25.0 3/12 0 0/5 25.0 6/24 16-18 72.4 21/29 55.0 10/18 20.0 1/5 61.5 32/52 19-21 77.4 24/31 44.4 4/9 16.7 1/6 63.0 29/46 22-24 70.4 19/27 57.9 11/19 22.7 5/22 51.5 35/68 25-30 47.1 8/17 50.0 6/12 46.2 6/13 47.6 20/42 31-36 66.7 4/6 60.0 3/5 33.3 2/6 52.9 9/17 37-72 33.3 1/3 83.3 5/6 12.5 1/8 41.2 7/17 73-144 0 0/1 85.7 6/7 0 0/7 40.0 6/15 145- 0 0/0 100 1/1 59.1 13/22 60.9 14/23 Total 64.6 82/127 51.6 50/97 32.3 32/99 50.8 164/323
Linguistics, Stockholm

16 Ericsson and Ystrom
to the parents that these children tend to develop deviant articulatory sites and deviant articulatory habits, which can be modified by speech therapy if they seem to persist.
Children referred for palatal closure (in this region they are aged about 1 1/2 years) sometimes show glottal substitutions or direct nasal emission before operation, but these faults can disappear spontaneously after operation. In such cases it could be supposed that the deviant articulatory sites and mechanisms produced allophones of the intended speech sounds, but that these never became established. After operation has provided more natural conditions for the production of speech sounds, the normal articulatory sites and mechanisms are apparently spontaneously preferred. We find that children who need speech therapy after primary palatal closure but do not require further palatal surgery do not find the speech therapy irksome provided that the sessions are properly conducted and that, from time to time, the parents receive guidance in home training.
2.2 Secondary surgery of the palate
2.2.1 Normal speech after secondary palatal operation
Here, secondary surgery means operation to improve velopharyngeal function in patients in whom closure of the soft palate has previously been done. The secondary operation involves the creation of a pharyngeal flap, but in addition the original repair is often improved at the same time (Skoog, 1974) .
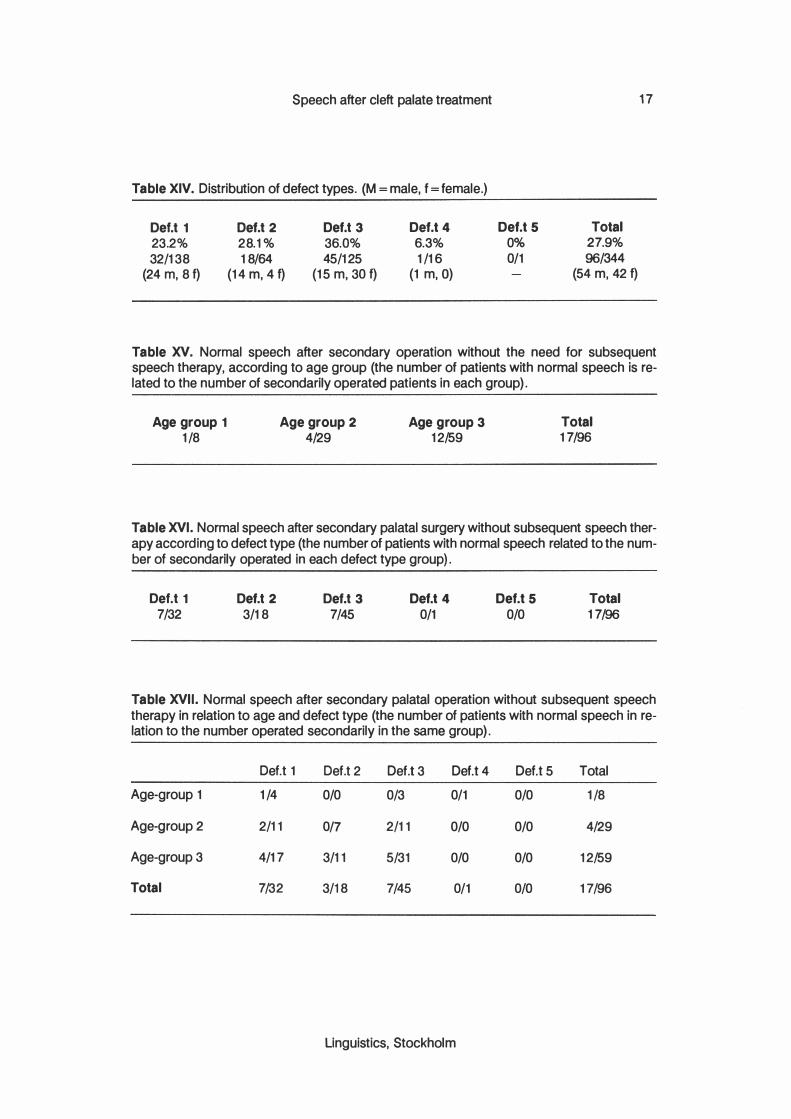
Secondary surgery was done on 96 patients, 54 male and 42 female; see tables XIII and XIV.
For an overview of results, see tables XV - XXI. 17 of the 96 patients ( 17.7%) acquired normal speech immediately after the secondary operation, and had no need for further speech therapy. Evaluation was done not earlier than 2 - 3 months after operation to avoid the influence of postoperative swelling. Several patients were evaluated considerably later, because they had been operated on elsewhere and had later moved to this region. The age at second-
Table XIII. Distribution according to age.
Age group 1
6.3% 8/128
Age group 2 29.9% 29/97
Age group 3 49.6% 59/119
PERILUS IX, 1989
Total 27.9
96/344
Speech after cleft palate treatment
Table XIV. Distribution of defect types. (M = male, f = female.)
Def.t 1
23.2% 32/138
(24 m, 8 f)
Def.t 2 28.1% 18/64
(14 m, 4 f)
Def.t 3 36.0% 45/125
(15 m, 30 f)
Def.t 4 6.3% 1/16
(1 m,O)
Def.t 5 0% 0/1
Total 27.9% 96/344
(54 m, 42 f)
17
Table XV. Normal speech after secondary operation without the need for subsequent speech therapy, according to age group (the number of patients with normal speech is related to the number of secondarily operated patients in each group).
Age group 1
1/8 Age group 2
4/29 Age group 3
12/59 Total 17/96
Table XVI. Normal speech after secondary palatal surgery without subsequent speech therapy according to defect type (the number of patients with normal speech related to the number of secondarily operated in each defect type group).
Def.t 1
7/32 Def.t 2
3/18 Def.t 3
7/45 Def.t 4
0/1 DeU 5
0/0 Total 17/96
Table XVII. Normal speech after secondary palatal operation without subsequent speech therapy in relation to age and defect type (the number of patients with normal speech in re-lation to the number operated secondarily in the same group).
Def.t 1 Def.t 2 Def.t 3 DeU 4 DeU 5 Total
Age-group 1 1/4 0/0 0/3 0/1 0/0 1/8
Age-group 2 2/11 0/7 2/11 0/0 0/0 4/29
Age-group 3 4/17 3/11 5/31 0/0 0/0 12/59
Total 7/32 3/18 7/45 0/1 0/0 17/96
linguistics, Stockholm
1 8 Ericsson and Ystrom
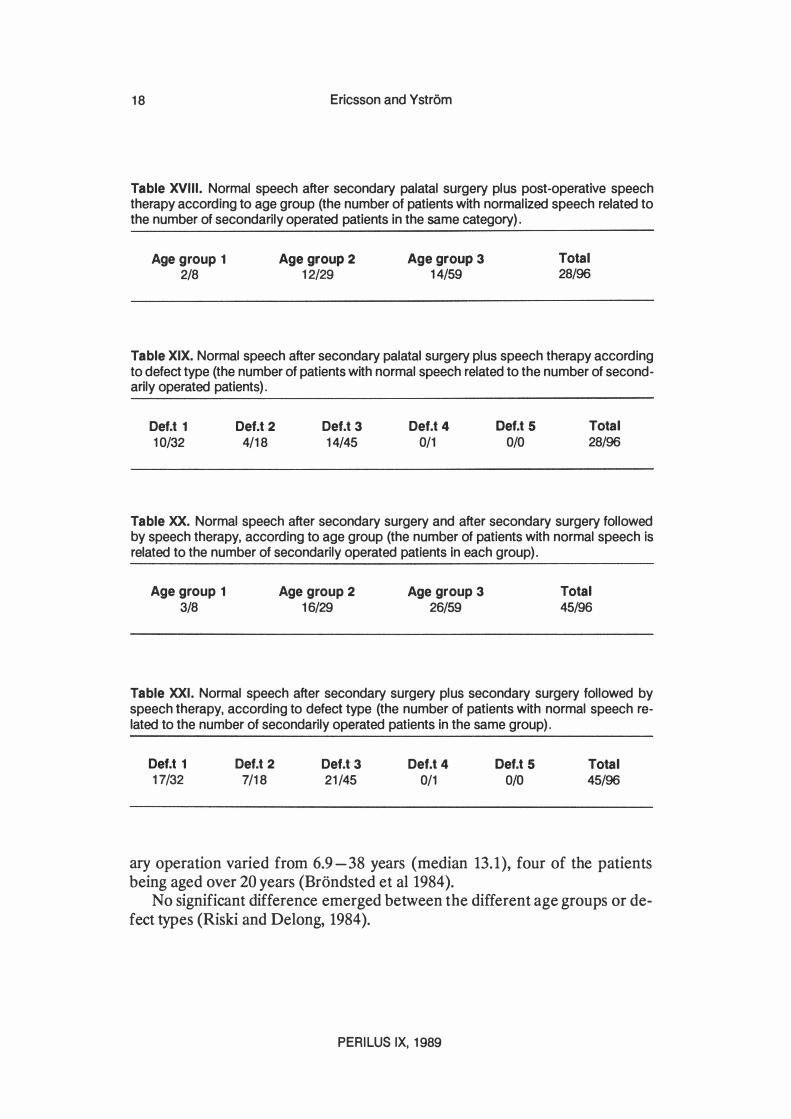
Table XVIII. Normal speech after secondary palatal surgery plus post-operative speech therapy according to age group (the number of patients with normalized speech related to the number of secondarily operated patients in the same category).
Age group 1 2/8
Age group 2 12/29
Age group 3 1 4/59
Total 28/96
Table XIX. Normal speech after secondary palatal surgery plus speech therapy according to defect type (the number of patients with normal speech related to the number of secondarily operated patients).
Oef.t 1 1 0/32
Oef.t 2 4/1 8
Oef.t 3 1 4/45
Oef.t 4 0/1
Oef.t 5 0/0
Total 28/96
Table xx. Normal speech after secondary surgery and after secondary surgery followed by speech therapy, according to age group (the number of patients with normal speech is related to the number of secondarily operated patients in each group).
Age group 1 3/8
Age group 2 16/29
Age group 3 26/59
Total 45/96
Table XXI. Normal speech after secondary surgery plus secondary surgery followed by speech therapy, according to defect type (the number of patients with normal speech related to the number of secondarily operated patients in the same group).
Oef.t 1 17/32
Oef.t 2 7/1 8
Oef.t 3 21 /45
Oef.t 4 0/1
Oef.t 5 0/0
Total 45/96
ary operation varied from 6.9 -38 years (median 13. 1), four of the patients being aged over 20 years (Brondsted et al 1984).
No significant difference emerged between the different age groups or defect types (Riski and Delong, 1984).
PERILUS IX, 1 989
Speech after cleft palate treatment 1 9
2.2.2 Age at secondary operation
The age at the time of secondary operation varied between 6 years 9 months and 38 years. As a rule patients who underwent palatal surgery for the first time in adulthood, including those who had worn a speech bulb, had been provided with a pharyngeal flap at that time, but are recorded as primary operations and are not included here.
The numbers were too small to allow statistical analysis. No defect type or age group was apparently associated with a significantly better result than any of the others. This accords with the impression held by many clinicians that the main cause of the deviant speech is the velopharyngeal insufficiency but also to some extent the speech habit that has become adapted to a former existing velopharyngeal insufficiency.
2.2.3 Normal speech after secondary palatal surgery plus speech therapy
Over and above the 17 patients who spontaneously acquired normal speech after operation, 28 achieved normal speech after postoperative speech therapy by the end of the investigation. 9 patients declined therapy or had not yet started. The age at secondary operation in patients who achieved normal speech after secondary surgery plus speech therapy was 3.3 -59.5 years (median 12.8) ; 12 patients were aged over 20 years at the time of operation.
Among patients who still require speech therapy we expect several to improve and ultimately even achieve normal speech. Concerning 9 of the patients treated by secondary operation, further surgery will clearly be needed. Of these, one belongs to age group 3. In addition, four patients have already been operated on twice after the primary procedure; two have now normal speech; in another we expect to achieve normal speech after speech therapy; the fourth still seems to lack the anatomical-physiological conditions for speech free from nasalization. Some of the patients who have undergone secondary and tertiary operation were originally treated at other centres.
With regard to the number of speech therapy sessions needed after secondary palatal surgery, we have considered only those given at our own clinic. Some patients previously received speech therapy elsewhere; we have noted this, but have not recorded the number of sessions. Patients whom we considered to need speech therapy were offered this. For practical reasons it has not always been possible to give speech therapy as frequently or for as long as would have been desirable. Some patients may therefore have needed a greater total number of therapy sessions, and a longer time to achieve normalization after the start of therapy. Also, after secondary operation we regard the median value as giving a better indication of the number of therapy sessions that will be needed than does the mean. When therapy has led to normal speech after secondary
Linguistics, Stockholm
20 Ericsson and Ystrom
palatal surgery, between 2 and 136 sessions have been required: the median value is 26.75.
By combining the results of secondary operation only and secondary operation with subsequent speech therapy, a better idea is obtained of what can be reached by secondary surgery. It should be remembered that people for years forced to speak under conditions in which it is impossible to bring about adequate velopharyngeal closure may develop compensatory articulatory mechanisms that often persist after operation. It is our opinion that such habits, often of subtle nature, can hinder the speech from becoming normal.
After secondary operation the following must be established. 1 . Whether anatomical-physiological conditions compatible with normal speech have been provided through the operation, or whether further surgery should be recommended. 2. Whether abnormal speech habits constitute an obstacle to normal speech unless corrected. If so, specific individual speech therapy should be offered, and the patient encouraged to practice every day.
When a patient decides to undergo secondary palatal surgery the ultimate goal is normal speech. This can probably more readily be reached if specific speech therapy is given in connexion with the operation. The patient should also be told before operation that one or more courses of speech therapy will probably be needed afterwards.
2.3 Fistulas, accompaning malformations and conditions
2.3.1 Fistulas
In the present work, a fistula is defined as a communication between the oral and nasal cavities through the palate, the palate being closed both in front of and behind the opening. Persistent clefts through the alveolar ridge are nor regarded as fistulas. Of the 25 patients who had fistulas affecting speech, six had unilateral cleft lip and cleft palate, 14 bilateral cleft lip and cleft palate, four cleft palate only, and 1 patient had a submucous cleft. In 12 of the 25, the fistula had been closed before evaluation. In some of them speech was probably affected by both the fistula and a velopharyngeal insufficiency, the fistula primarily because it allowed leakage of air in the production of plosives and fricatives at or anterior to the site of the fistual. A large fistula might also aggravate nasalization (Rintala, 1980). Most fistulas were located in the hard palate. At evaluation, some patients had a small fistula of the hard palate which did not transmit fluids to the nasal cavity; such fistulas would hardly give rise to nasal escape in speech. A fistula of the hard palate might also be expected to be narrower at its upper orifice, and to appear larger on inspection of the oral cavity than it actually is. A small fistula of the soft palate will probably not influence
PERILUS IX, 1 989

Speech after cleft palate treatment 21
speech to any appreciable extent, but could be a sign that the musculature of the soft palate is not functioning optimally.
2.3.2 Accompaning malformations
To our knowledge 22 patients (6%) had further malformations over and above clefts of the lip andlor palate (Cohen, 1978; Kadasi, 1980). No sure tendency emerged for cleft palate alone to be oftener associated with other malformations than cleft lip and palate, but the series might be too small. Malformations over and above cleft palate and/or cleft lip included the following.
a) Malformation of external andlor middle ear. Three patients with cleft palate alone. b) Ophthalmic malformations. Five patients. One patient with leftsided cleft lip and cleft palate has a right-sided congenital defect of the cornea. One patient with right-sided cleft lip and cleft palate has anophthalmos on the right side. Two sisters with cleft palate have severe myopia and catarrhact. One patient with bilateral cleft lip and cleft palate has bilateral stenosis of the lacrimal ducts. c) Arthrogryposis. Two patients, mother and son, the mother with a submucous cleft of the palate and the son with cleft palate, scoliosis, and heart failure. The son was regarded as having Pierre Robin's syndrome, and his tongue defect was corrected in the neonatal period. d) Congenital lack of one forearm. One patient with unilateral cleft lip and cleft palate. e) Oesophageal atresia. Two patients, one with cleft palate and malformation of external and middle ears and the other with bilateral cleft lip and cleft palate and hydrocephalus. f) Cardiac anomaly. Three patients, one with bilateral cleft lip and palate, and one with cleft palate, one with submucous cleft palate. g) Down's syndrome. One patient with cleft palate. h) Scoliosis. Three patients with cleft palate. They also have malformations of fingers or ears or arthrogryposis (see c). Two of these patients were regarded as having Pierre Robin's syndrome.
Table XXII. Distribution of other malformations according to defect type.
Def.t 1 6
DeU 2 4
Def.t 3 1 0
Linguistics. Stockholm
Oef.t 4 2
DeU 5 o

22 Ericsson and Ystrom
i) Malformations of the urinary tract. Two patients, one with bilateral cleft lip and cleft palate and malformations of the lacrimal ducts (see b), and one with bilateral cleft lip and cleft palate and horse-shoe kidney. j) "Pits", i. e. depressions in the lower lip. One patient with cleft palate. k) Malformations of fingers and/or toes were found in three patients. Two patients have bilateral cleft lip and cleft palate, and one of them has also had benign breast tumours. One patient with cleft palate and scoliosis (see h).
2.3.3 Accompaning conditions
Other anomalies not with certainity due to congenital malformation were found in two patients with unilateral cleft lip and cleft palate who have peripheral facial paresis diagnosed early in childhood. In one the lesion is on the same side as the lip defect, and in the other it is on the contralateral side.
A short-statured patient with cleft palate was investigated in adulthood for dysphagia, and the diagnosis of coeliac disease was made. She is not mentally retarded.
One patient with cleft palate and bilateral malformation of external and middle ear is slightly mentally retarded and has dysarthria and epilepsy.
2.3.3.1 Hearing defect
As the time of investigation, 14 patiens (3.8% of the whole series), had a hearing defect severe enough to influence speech. Both nerve deafness and mainly conductive deafness occurred (Drettner, 1960; Morgan et aI. , 1983). Tables XXIII and XXIV summarize the distribution according to age and defect type.
2.3.3.2 Delayed speech
No reliable information was available for the oldest group, and in age group 2 the values are uncertain. For these two groups we have noted that speech was delayed if there was a history of prolonged baby talk. In such cases we have tried to exclude cleft palate as cause of the apparent fault. With the above reservations, and having in mind the uncertainty of these second-hand observations, 45 patients, 26 male and 16 female, i.e. 12.6% of the whole series, have or had delayed speech; see tables XXV and XXVI.
2.3.3.3 Stuttering
17 patients, i.e. 4.7% of the series, stuttered. 15 of them had undergone primary repair of cleft palate. Two had not been operated on. Physiological repetitions in children of pre-school age are not included in the present series. The bino-
PERILUS IX, 1 989

Speech after cleft palate treatment
Table XXIII. Distribution of heraing defect according to age groups.
Age group 1 2
Age group 2 6
Age group 3 6
Table XXIV. Distribution of hearing defect according to defect type.
OeU 1 4
Oef.t 2 2
Oef.t 3 8
Total 14
Total 14
23
Table xxv. Distribution according to age groups (the number of patients with delayed speech related to the whole series).
Age group 1 27/1 38
Age group 2 1 4/1 02
Age group 3 4/124
Total 45/364
Table XXVI. Distribution according to defect type (the number of patients with delayed speech related to the whole series).
OeU 1 1 6/1 42
OeU 2
6/64 Oef.t 3 18/125
Oef.t 4 4/31
Oef.t 5 1/2
Total 45/364
mial test shows that the incidence of 4.7% among our patients is significantly higher at the 0.001 level than in a normal population (usual figure ca. 1 %).
The incidence of stuttering in different age groups and defect types is shown in tables xxvn and XXVIII. No stutterers had a history of delayed speech. Most patients who stuttered at the time of referral for speech evaluation also had speech defects attributable to the cleft palate. We have found that in some patients who acquire normal speech after repair of the palate, features of cleft palate speech will return or become reinforced during stuttering episodes; this is particularly true of nasal emission and nasal grimaces. The old speech be-
Linguistics, Stockholm

24 Ericsson and Ystrom
Table XXVII. Distribution according to age group (the number of patients with stuttering in relation to the total number of the respective age group).
Age group 1 2/1 38
Age group 2 7/1 02
Age group 3 8/1 24
Total 1 7/364
Table XXVIII. Distribution according to defect type (the number of patients stuttering in relation to the total number of the respective defect type).
Def.t 1 7/1 42
Def.t 2
4/64 Def.t 3 4/ 1 25
Def.t 4 2/31
Def.t 5 0/2
Total 17/364
haviour seems to prevail. Of the 15 stutterers who underwent primary operation, 13 belong to the group that did not acquire normal speech after operation alone. Both patients who refuse surgery are women in age group 3. One has a submucous cleft palate and slight hypernasality. The other with unilateral cleft lip and palate, has worn a speech bulb since 24 years of age, when speech therapy was given. At that time she showed slight nasalization, glottal substitutions and increased glottal activity, and plosive production at the ordinary site. She has declined further speech therapy.
15 of the 17 stutterers ( 13 operated and two not operated on) had thus had speech defects due to the palatal deformity. They have consequently experienced the attitude from other people that such speech disturbances apparently always arouse. This might well make matters still worse for them when they have to speak, especially under stress, and should be borne in mind with regard to the genesis of the stuttering.
As for sex distribution 1 1 of the stutterers were male and six female. Because there were so few stutterers in this series it is not possible to de
cide whether stuttering was significantly commoner with any particular age group or defect type. It is uncertain whether the slightly lower figure in age group 1 reflects lower incidence or whether these children have not yet developed the phenomenon. At their first attendance, a boy in age group 1 and another boy in age group 2 showed stuttering despite the absence of cleft palate speech. Two women with cleft palate and stuttering in age group 3 gave a history of deafness severe enough to have affected speech.
PERILUS IX, 1 989

Speech after cleft palate treatment
3 Concluding remarks
25
The treatment of the not normalized patients is continued in collaboration with the other clinics in our cleft palate team. This is the case for patients of all ages. As regards the younger patients they regularly get appointments for control until the growth has been ceased, also when they have a normal speech. In a few patients we have noticed that a hypernasal speech has been developed during augmented growth, even though the resonance has been normal in younger years. This is in agreement with experiences from other centres (Van Demark and Morris, 1983; Mc Williams, Morris and Shehon, 1984; Sinko and Hedrick, 1982). Nowadays there are very few cleft palate patients with unintelligible speech. However, before completion of treatment many have speech that even laymen experience as deviant and reminiscent of cleft palate. As a rule such patients do not hear their own speech defects but are usually highly aware of them as a consequence of other people's reactions, and they are often unsure of themselves in company. When they are told about what can be done to improve their speech, they are usually keen to try (cf Richman, 1983). It should be pointed out that information about the nature and cause of the speech deviations helps the patient to fulfil the aim of the treatment. Adequate speech therapy will reveal to the patient the effects of the changes in articulatory behaviour in both auditive and proprioceptive feed-back, and this strengthens their motivation. In this connexion it is assumed that the necessary operations have been performed. Even older patients are often eager for normalization of their defect. The patient's goal is normal speech. Even slightly hypernasal speech usually prompts comments, and the speaker becomes sensitive and tries to conceal the defect. Any persistent nasalization may thus be trying for the patient, even when clinically judged as moderate or slight. Patients with obvious malformations commonly request surgical correction and measures to correct malocclusion, whether or not speech is affected. It is our experience that older patients do very well when they actually desire speech therapy. Accurate but guarded information about the defects and the possibilities of correcting them encourages them to accept speech therapy and to work hard at it. We hope that yet more patients in the upper age group with persistent speech defects, facial disfigurement, and malocclusions will realize that specific treatment is available at the different departments making up the cleft palate team, and that they will feel as entitled to it as are younger individuals. With regard to our own field, we maintain that irrespective of the patient's age efforts should be made to create the anatomical and physiological conditions for normal speech, and then to offer competent individual counselling about articulation (Heller et aI., 1981 ; Imhoff and Starr, 1981) .
linguistics. Stockholm

26 Ericsson and Ystrom
Tord Skoog (1974) writes The patient's demand for this type of treatment will not diminish significantly with increasing age. Patients over fifty are as anxious as younger people to undergo surgery, even if they have worn a well functioning obturator and their speech, though nasal, has been quite acceptable. The magnitude of the operation at their age and the inconvenience of a lengthy post-operative treatment does not deter them, as these individuals desperately wish to be relieved of their disablility. Sometimes they request an operation so as to appear normal to their grandchildren, which vividly demonstrates the deep seated psychological consequences of a congenital defect.
PERILUS IX, 1 989

Speech after cleft palate treatment 27
REFERENCES Albery L., Enderby P. Intensive speech therapy for cleft palate children. British Journal of Dis
orders of Communication 19, 115 - 124 (1984).
Berlin A. J. Classification of cleft lip and palate. In: Cleft lip and palate. Grabb W. c., Rosenstein S. R, Bzoch K. R Boston. Little Brown 66 (1971) .
Bishara S. E., Van Demark D. R, Henderson W. C. Relation between speech production and oro-facial structures in individuals with isolated clefts of the palate. Cleft Palate Journal 12, 452- 460 (1975) .
Brondsted L., Liisberg W. B., Orsted A., Prytz S., Fogh-Andersen P. Surgical and speech results following palatopharyngoplasty. Operations in Denmark 1959 - 1977. Cleft Palate Journal 21, 170 - 179 (July 1984) .
Cohen M. Syndromes with cleft lip and cleft palate. Cleft Palate Journal 15, 306 - 328 (1978) .
Dorf D. S., Curtin J. W. Early cleft palate repair and speech outcome. Plastic and Reconstructive surgery 70, 74 - 79 (1982) .
Drettner B. The nasal airway and hearing in patients with cleft palate. Acta Oto-Laryngol 52, 131 - 142 (1960) .
Ericsson G. An acoustic investigation of production of plosives by cleft palate speakers. PERILUS II, 95 - 110 (1979-1980).
Ericsson G. Analysis and treatment of cleft palate speech: Some acoustic-phonetic observations. (Diss. Linkoping 1987)
Fogh-Andersen P. Inheritance of harelip and cleft palate. Copenhagen. Busck (1942).
Fogh-Andersen P. Incidence of cleft lip and palate. Constant or increasing? Acta Chir Scand 122, 106 (1961) .
Heller A, Tidmarsh W, Pless I. B. The psychosocial function of young adults born with cleft lip or palate. Clinical Pediatric 20, 459-465 (1981).
Henriksson T. G. Cleft lip and palate in Sweden. A genetic and clinical investigation. Uppsala 1971, Goteborgs offsettryckeri AB, Stockholm 1971.
Imhoff M., Starr P. Educational programming. A seminar for young adults with cleft lip andlor palate. Rehabilitation literature 42, 111 - 112, 351 - 352 (1981).
Jackson I. T., Mc Glynn M. J., Huskie C. F. Velopharyngeal incompetence in the absence of cleft palate. Results of treatment in 20 cases. Plastic and Reconstructive Surgery 66, 211 - 213 (1980) .
Kadasi L. CiIft lip and Cleft palate as part of the symtomatology of different syndromes. Acta Chirurgiae Plasticae 22, 185 - 190 (1980).
Mc Williams B. J., Morris H. L., Shelton R L. Cleft palate speech, BC Decker Inc. Philadelphia, Toronto (1984) .
Morgan R F., Dellon A. L., Hoopes J. E. Effects of levator retrodisplacement on conductivehearing loss in the cleft palate patient. Annuals of Plastic Surgery 10, 306 - 308 (1983).
Morris M. L. The child with cleft lip and palate 20 years of progress. Internation Journal of Pediatric Oto-rhino-laryngoI 3, 93 - 99 (1981) .
Peterson S. J . Nasal emission as a component of the misarticulation of sibilants and affricates. Journal of speech and hearing disorders XL, 106 - 114 (1975).
Randall P., La Rossa D. D., Fakhrace S. M., Cohen M. A. Cleft palate closure at 3 to 7 months of age. A preliminary report. Plastic and Reconstructive Surgery 71, 624 - 428 (1983).
lingUistics. Stockholm
28 Ericsson and Ystrom
Richmann L. C. Self-reported social, speech and facial concerns and personality adjustment of adolescents with cleft lip and palate. Cleft Palate Journal 20, 108 - 112 (1983) .
Rintala A. E. Surgical closure of palatal fIstulae. Scandinavian Journal of Plastic and Reconstructivc Surgery 14, 235 - 238 (1980) .
Riski J. E., Delong E. Articulation development in children with cleft lip/cleft palate. Cleft Palate Journal 21, 57 - 64 (1984).
Riski J. E. Articulation skills and oral-nasal reconance in children with pharyngeal flaps. Cleft Palate Journal 16, 421 - 428 (1979) .
Sinko G, Hedrick D. L. The interelationship between ratings of speech and facial acceptability in persons with cleft palate. Journal of Speech and Hearing Research 25, 402 - 407 (1982).
Skoog T. Plastic surgery. New methods and refinements.Almqvist and Wiksell International, Stockholm (1974) .
Starr C. D. The study of some characteristics of the speech mechanism of a group of cleft palate children . Ph D Thesis. Northwestern University (1956).
Trier W. C. Velopharyngeal incompetency in the absence of overt cleft palate: Anatomic and surgical considerations. Cleft Palate Journal 20, 209 - 217 (1983) .
Van Demark D. R., Morris H. L. Stability of velopharyngeal competency. Cleft palate Journal 20, 18 - 22 (1983) .
Van Demark D. R. Some results of speech therapy for children with cleft palate. Cleft Palate Journal 11, 41 - 49 (1974) .
Van Demark D. R., Morris H. L., Van de Harr C. Patterns of articulation abilities in speakers with cleft palate. Cleft Palate Journal 16, 230 - 240 (1979).
PERILUS IX, 1 989
Phonetic Experimental Research. Institute of Linguistics. University of Stockholm (PERILUS). vol IX. 1 989. 29 - 52
Some attempts to measure speech comprehension
Robert McAllister and Mats Dufberg
Abstract The research reported here is part of a project for the planning of research work on the measurement of the comprehension of spoken language. We have initiated a series of pilot studies whose aim has been to try out various test methods and to judge whether or not these methods seem promising in the future development of tests which measure spoken language comprehension. Two variants of the SRT method have been used as well as a related method we have developed. The latter makes use of simple questions instead of connected text or sentences. Our subjects were L2 speakers, hearing impaired, and elderly who have a se/f-assesed hearing impairment. These subjects were compared to native Swedes with normal hearing. The results show that at least two of the three metods we used seemed to have som promise for future research. Noise type appears to be an important factor with which we will continue to work. Perhaps the most important result in these experiments was that different test methods actually gave different results in terms of signal to noise ratio. These pilot studies have been instructive concerning the experimental use of the SRTmethod and we may be on our way towards creating a new and useful variant thereof.
Table of contents 1 Background 2 Methods 2.1 Speech material 2.2 Noise sources 2.3 Calibration of test material 2.4 Threshold method 2.5 Ramp method 2.6 Helen method 2.7 Subjects 2.7.1 Experiment groups in study 1 2.7.2 Experiment groups in study 2 2.7.3 L2 vs. hearing impaired subjects 2.7.4 Experiment groups in study 1 vs. study 2
Linguistics. Stockholm

30 McAllister and Oufberg
2.7.5 Control groups 3 Hypotheses 4 Results 4.1 Results of study 1 4.2 Results of study 2 4.2.1 Threshold vs. Helen methods in Hagerman noise 4.2.2 Threshold vs. Helen methods in Babbling noise 4.2.3 Hagerman vs. Babbling noise 5 Discussion 6 Conclusions
1 Background The purpose of the pilot research reported here is to explore methods for the explicit measurement of the comprehension of spoken language. Our point of departure is the modern view of what is often called speech perception or speech comprehension. According to this view there are at least two major sources of information used by the listener to interpret a spoken utterance. One of these is the information contained in the speech signal, represented in figure 1 (Lindblom, 1987) as signal dependent information. Often referred to as acoustic cues, this information is the raw material on which perceptual mechanisms work. The other source of information represented in the figure is called signal independent information and refers to knowledge of the language spoken, knowledge of the world, the current communication situation etc. This information creates expectations on the part of the listener as to what meanings are to be communicated and thus greatly facilitates understanding of the message. The figure emphasizes the balance between the stimulus controlled processes that utilize the signal dependent information and the hypothesis controlled processes where the signal independent information is all important [note that these two process types correspond roughly to the phenomena referred to with the terms top down and bottom up in recent perception research (Lindsay and Norman, 1977)].
There seems to be a relatively large degree of agreement among speech researchers as to this general picture of speech perception processes. There does not, however, seem to be the same degree of agreement on the specific audiological, psychoacoustic and psycholinguistic mechanisms which underlie these general processes. This incomplete understandinng of how we perceive spoken languge has some important consequences for both perception research and practical clinical applications where speech comprehension is important. One of these consequences, on which the research reported here has been based, is the fact that there seems to be a need for methods of measuring speech com-
PERILUS IX, 1 989

To measure speech comprehension 31
prehension which are better than the ones which exist at present.The question we have formulated which summarizes the direction of this research is: What are the ex plicit communicative consequences of perlurbations of the production and perception of language? We must, of course, make it clear here what is meant by perturbations. A perturbation is a reduction of either signal dependent or signal independent information caused by a deviation from the ideal production or perception of language (see fig. 1: the diagonal line marked ideal cases). It is important to note that there is no distinction made here between normal and abnormal speakers and listeners. Breakdowns in communication are part of normal language users behavior but are, of course, of special interest when dealing with language users with communicative handicaps. An inventory of research efforts in our own research enviroment has given us a clear indication that there is a need for explicit methods for the measurement of speech comprehension in a number of these projects. A few examples would be appropriate here both as an illustration of the types of perturbations to which we are refer-
I-Z W Oz Zo wt-t eLIwa 0:L za:::: t-to �LL aZ zt-t C9 t-t
(f)
Ri c h ", , ,
, "
" ',!rv
Over c 1 e o.r s p e e c h
',,"-: fJ ",�/
Un c 1 e o.r speech
", ('I ""? tJI " (OJ '
",� , , , , , ,
, , Po 0 r '----------___ -...:.1" ,
Poor Rich SIGNAL DEPENDENT
INFORMATION
Figure 1. Model of the relationship between signal dependent and Signal independent information for speech comprehension (after Lindblom, 1 987). The less signal dependent information that is available the more signal independent Information is needed for comprehension, and vice versa.
lingUistics, Stockholm
32 McAllister and Dufberg
ring and as an introduction to some of the contexts within which we will be applying our research.
At the Royal Institute of Technology's Department of Speech Communication and Music Acoustics, research work is being done in the field of language handicaps. Professor Arne Risberg, head of the hearing technology group has emphasized the need for methods of measuring speech comprehension (Risberg 1988, personal communication). The perturbation in this case is, of course, hearing loss which reduces reception of the signal dependent information and increases the demands on the handicapped listeners use of the signal independent information.
Professor Erik Borg, head of the Audiology Clinic at the Karolinska Institute, has pointed out that the standard audiometric methods used in the clinic are both outdated and on linguistic and other grounds inadequate as measures of functional language comprehension (Borg 1988, personal communication). There is, according to Professor Borg, a need for new and better tests.
The need for speech comprehension tests is also quite obvious in serveral ongoing and planned research projects in our department at the University of Stockholm. The project Speech Transforms, funded by the Swedish Board for Technical Development (STU) and the Tercentenary Foundation of the Bank of Sweden (RJ), deals with acoustic descriptions of natural variations in speech. A key part of the research in this project is the examination of the communicative consequences of these natural variations (in our terminology, perturbations). To this end methods for the explicit measurement of speech comprehension are needed.
The project entitled Speech after Glossectomy, funded by the Swedish Cancer Society and The Swedish Council for Planning and Coordination of Research (FRN), is interested in how the speech of their patients is understood after a glossectomy operation. They need, naturally, a good measure of speech comprehension in order to be able to assess the quality of post operative speech and results of therapy.
Still another research project entitled Attitudes to Immigrant Swedish, funded by The Swedish Council for Research in the Humanities and Social Sciences (HSFR), is concerned mainly with how the average Swede reacts to Swedish spoken with a foreign accent. One of the important consequences of this perturbation commonly known as foreign accent is of course difficulty in understanding accented speech. Here again an explicit measurement method would be very useful in an assessment of the communicative consequences of a foreign accent.
We have received support from FRN for the planning of a project whose aim is to develop methods for the measurement of speech comprehension. The
PERILUS IX, 1 989

To measure speech comprehension 33
planning project includes an inventory of both the need for explicit methods and existing methods. An important part of the planning will be to test various existing methods and compare their results. The work reported here is part of this effort. In these pilot studies we attempt to test two available methods and one new method that, at least partly, claim to test speech comprehension. In this context it is important to consider the questions of reliability and validity. A test method may be reliable, that is, it will give the same test results every time it is run, but this tells us nothing about whether or not the test really measures what it is supposed to measure which is, in our view, of paramount importance here. Before we can account for a test's validity in our work we need a clearer picture of that which we in this report call speech comprehension. If one assumes that speech comprehension is achieved by the use of signal dependent and signal independent information, like our model presented above indicates, any test which does not consider signal independent information cannot have high validity if its purpose is to test this speech comprehension.
In the pilot studies presented here we use three related test methods that seemed relevant to the question of the use of signal independent and signal dependent information in the understanding of spoken language. These methods are all versions of a masking paradigm where recorded running speech is played to listeners in the presence of a masker which makes the signal difficult to understand. In our case, the masker was various kinds of noise. This noise is a perturbation which reduces the amount of signal dependent information that can be used by the listener. This method was used on both normal language users and on language users who themselves introduced a perturbation. One group of listeners was composed of second language learners where Swedish was their second language, L2. The other group were hard of hearing. These two experimental groups were to be compared with the normal language users with respect to how much their speech comprehension ability was effected by the noise perturbation.
Our expectations were that the L2 learners would be more dependent on the signal since their grasp of the language and its use would be less complete than the native users. A noise perturbation, then, should reduce the L2 learners' ability to understand spoken Swedish more than it reduced the native listeners' comprehension. We expected the hard-of-hearing subjects, on the other hand, to be less able to use the signal dependent information than the normal hearing subjects, which means that for the hard-of-hearing subject the signal contains less redundancy. A noise, then, would, like for L2 learners, reduce the hard-of-hearing persons' comprehension of spoken language more than it reduces the normal hearing persons' comprehension.
Linguistics, Stockholm

34 McAllister and Dufberg
2 Methods In our two pilot studies we used three related test methods. In pilot study one we tested all three methods, in pilot study two only two of the methods. In both studies we used two different kinds of speech materials. In study one we used one noise source, in study two we used two different noise sources (see table I). All methods and noise sources were tested on three groups of subjects: subjects with Swedish as their second language, subjects with more or less impaired hearing, and finally, a control group (see table II). In this section the methods, noise sources and subject groups will be presented in detail.
Table I. Methods and noise types used in the two studies. Three methods, Threshold, Ramp, and Helen methods, and two noise sources, Hagerman (H) and Babbling (B) noise, have been used. Plus means that the combination was used, minus that it was not used. See 2.2, 2.4 - 2.6 for details.
Study 1: Study 2:
Method and noise source:
Threshold H B + + +
Ramp H B +
Helen H B + + +
Table II. Number of subjects in the different subject groups. Two different experiment groups were used, second language (l2) learners and hearing impaired speakers. Two types of hearing impaired speakers were used, hearing impaired from childhood (type I in the table) and old age spekers with a hearing problem (type II). The control group consisted of native Swedes with no (known) hearing problems. See 2.7 for details.
Subject group:
L2 Hearing Hearing Control learners impaired (I) impaired (II) group
Study 1: 4 2 6 Study 2: 4 5 4
PERILUS IX, 1989
To measure speech comprehension
2.1 Speech material
35
We used two different types of speech material, continuous speech (read text) and questions. The continuous speech was used in test methods one (2.4) and two (2.5), and the questions in test method three (2.6).
The continuous speech we used were two different children's stories. We selected the stories so that only a minimum of knowledge of the world was required. We had a male Swede with a so called central standard accent read the stories in neutral voice with a fairly stable level. The reading was recorded on magnetic tape and was edited from all re-readings.
The second type of speech material, questions, were so called Helen questions (Ludvigsen, 1975) which any speaker of Swedish would know the answer to. (E.g. What color is a lemon?) The questions were read by the same male speaker as above in a neutral tone of voice with a fairly stable level. The questions were recorded on the same magnetic tape as the the text above.
2.2 Noise sources
We used two different noise sources. The first was a colored and low frequency modulated noise. It has approximately the same long time average spectrum as male speech. It is the noise described and used by Hagerman (1984). We assume that it fairly well matched the male voice we used for our speech material. This noise will be refered to as Hagerman noise.
The inspiration behind the second noise source is the cocktail party situation where everybody is talking and the only thing you hear is a lot of voices. That is, we tried to produce a noise consisting of many voices. To produce that we took our continuous speech and copied it 24 times onto the same tape without erasing, for each copying the tape started at different positions. To eliminated the last remnants of understandable speech we played it backwards. Our judgement of the resulting noise is that it sounds like many Swedes speaking at the same time without anything being understandable. This noise will be refered to as Babbling noise.
2.3 Calibration of test material
During a test session of any of the three test methods we used two tape recorders, one for each tape. The speech material was directed from the tape recorder to a mixer box, the noise was directed to the same mixer box via an attenuator, which allowed us to set different signal-to-noise (SIN) ratios. The speech was, then, held at a constant level and the noise level was varied to obtain varying SIN ratios. The subject listened to the mixed signal via headphones at a comfortable listening level (fig. 2).
Linguistics, Stockholm
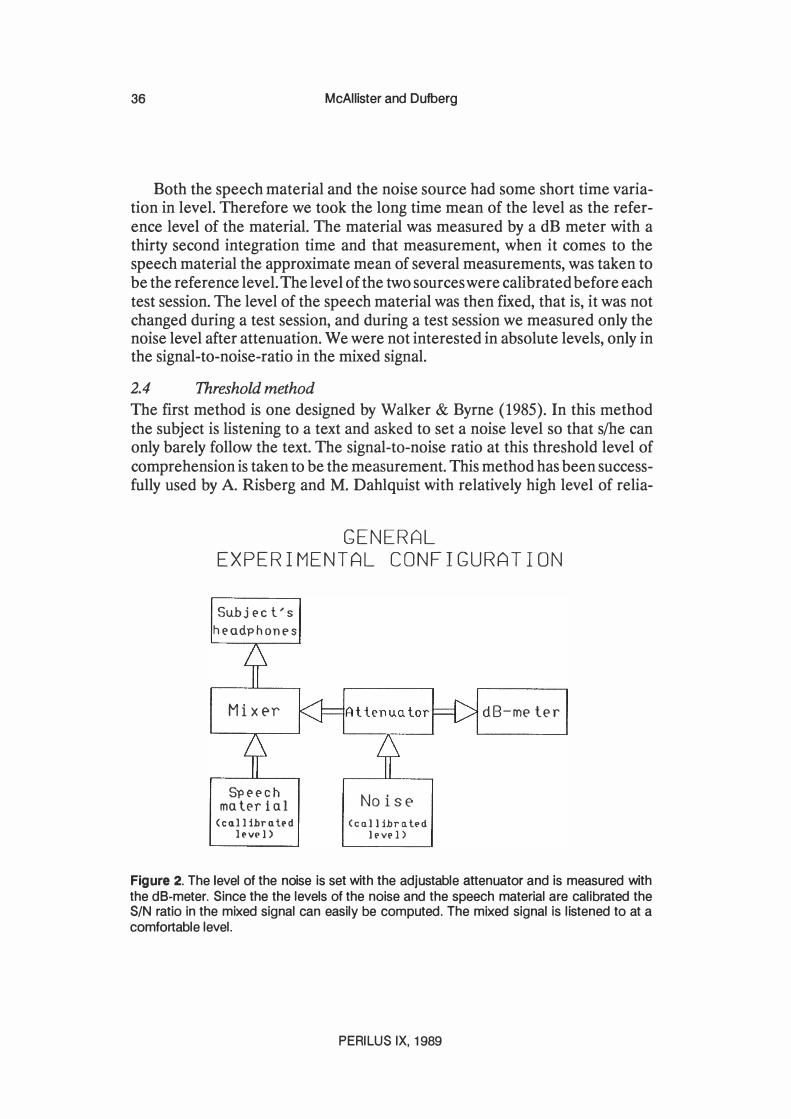
36 McAllister and Dufberg
Both the speech material and the noise source had some short time variation in level. Therefore we took the long time mean of the level as the reference level of the material. The material was measured by a dB meter with a thirty second integration time and that measurement, when it comes to the speech material the approximate mean of several measurements, was taken to be the reference level. The level of the two sources were calibrated before each test session. The level of the speech material was then fixed, that is, it was not changed during a test session, and during a test session we measured only the noise level after attenuation. We were not interested in absolute levels, only in the signal-to-noise-ratio in the mixed signal.
2.4 Threshold method
The first method is one designed by Walker & Byrne (1985). In this method the subject is listening to a text and asked to set a noise level so that slhe can only barely follow the text. The signal-to-noise ratio at this threshold level of comprehension is taken to be the measurement. This method has been successfully used by A. Risberg and M. Dahlquist with relatively high level of relia-
GENERAL EXPERIMENTAL CONFIGURATION
Subj E'C t.' s
hE'adphonE's
Mixer
SpE'E'ch ma tE'r i a 1
(co.ll ihro. bd l('v(' 1)
NoisE' (co.llihra.t('d
ll'Vl' 1)
dB-me ter
Figure 2. The level of the noise is set with the adjustable attenuator and is measured with the dB-meter. Since the the levels of the noise and the speech material are calibrated the SIN ratio in the mixed signal can easily be computed. The mixed signal is listened to at a comfortable level.
PERILUS IX, 1989

To measure speech comprehension
THRESHOLD METHOD
Subj E:'C t/s hE:'adphonE:'s
MixE'r
SpE:'E:'Ch ma tE:'r i al
(c 1111 ibr I1l� d
Ipvp })
Subj E:'C t/s choicE:'
NoisE' (co.ll ibrl1lPd
lPvPl>
dB-me ter
37
Figure 3. In the Threshold method the subject sets the level of the noise. See also fig 2.
Subj E:'C t / S
hE:'adphonE:'s
MixE'r
Sp E:'E:'C h ma tE:'r ial
(cl1llibrl1lpd
Ipv� 1)
RAMP METHOD
Ramp
g(>nE:'ra tor
NoisE' (cl111ibrl1lPd
It'vt'l>
Star t bu t ton
dB-mE'ter
Figure 4. In the Ramp method the subject increases the ramp by holding down the start button. An increased ramp means that the noise level increased at a constant rate. The ramp fell to the minimum when the button was released. See also fig 2.
Linguistics, Stockholm

38 McAllister and Dufberg
bility (personal communication). In the following we will refer to this method as the Threshold method.
We performed the Threshold method in the following way (fig. 3). The subject listened to the continuous speech described in 2.1 mixed with one of the noise sources described in 2.2 (in test one, only the Hagerman noise). The subject could communicate with the experimenter either orally via a microphone or visually through a window. We gave the subject the instruction that slhe should listen to the story and to make sure that slhe understood it. In study one we asked the subject to find the the level where slhe only barely could follow the text by asking for lower or higher level of noise. We had some problems with passive subjects, so in study two we promted the subject visually to give a response to whether or not slhe could follow the text.
2.5 Ramp method
The second method was used in study one only and with Hagerman noise only. The speech material used with it was the same as with the Threshold method and it is similar to that method. Instead of letting the subject choose the noise level slhe pressed a button which caused the noise level to increase at a constant rate (fig. 4). When the subject released the button the noise level fell to
Subj e-c t' s
he-adphon�s
Mix�r
Sp e ec h ma ler i al
(cnl libruh'd
11'VI'l>
HELEN METHOD
Subject's response
Nois� (cnllibrutl'd
11'VI'J)
dB-me ter
Figure 5. In the Helen method the speech material consists of wh-questions, described in 2.2. The subject's response determines the level of noise; at an incorrect or no answer to the question the noise level was decreased, at a correct answer it was Increased. See also fig 2.
PERILUS IX, 1989
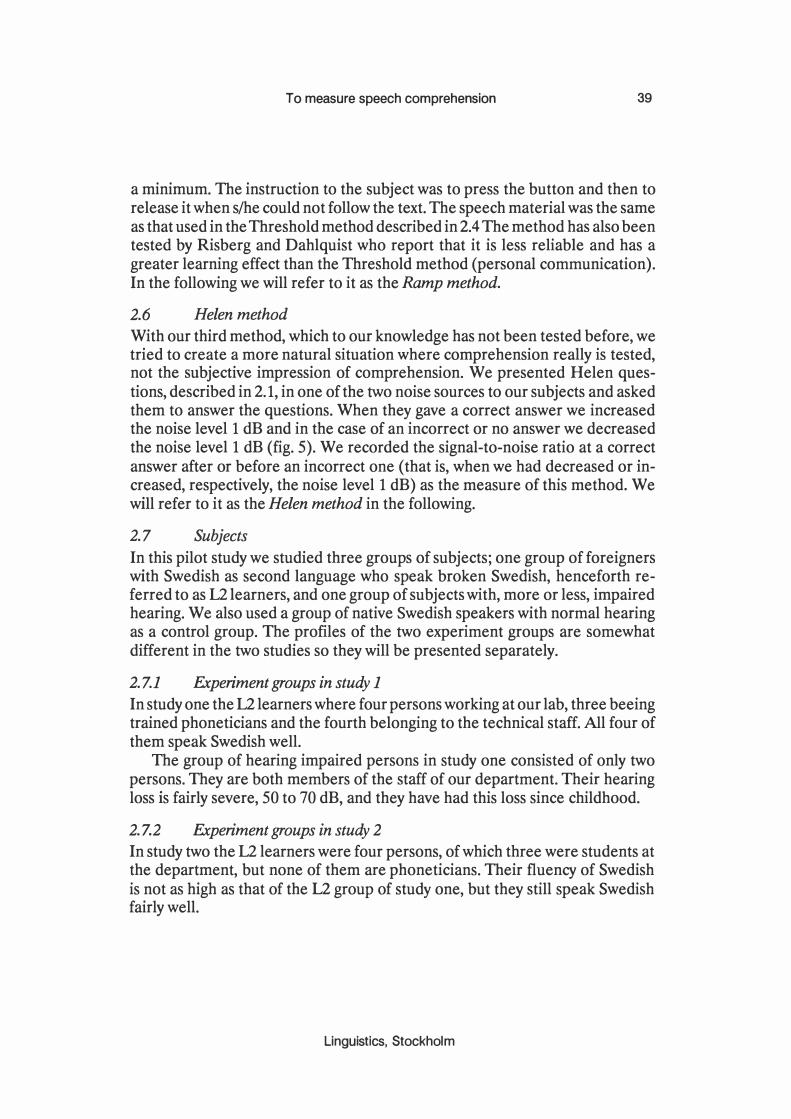
To measure speech comprehension 39
a minimum. The instruction to the subject was to press the button and then to release it when slhe could not follow the text. The speech material was the same as that used in the Threshold method described in 2.4 The method has also been tested by Risberg and Dahlquist who report that it is less reliable and has a greater learning effect than the Threshold method (personal communication). In the following we will refer to it as the Ramp method.
2.6 Helen method
With our third method, which to our knowledge has not been tested before, we tried to create a more natural situation where comprehension really is tested, not the SUbjective impression of comprehension. We presented Helen questions, described in 2.1, in one of the two noise sources to our subjects and asked them to answer the questions. When they gave a correct answer we increased the noise level 1 dB and in the case of an incorrect or no answer we decreased the noise level 1 dB (fig. 5). We recorded the signal-to-noise ratio at a correct answer after or before an incorrect one (that is, when we had decreased or increased, respectively, the noise level 1 dB) as the measure of this method. We will refer to it as the Helen method in the following.
2.7 Subjects
In this pilot study we studied three groups of subjects; one group of foreigners with Swedish as second language who speak broken Swedish, henceforth referred to as 12 learners, and one group of subjects with, more or less, impaired hearing. We also used a group of native Swedish speakers with normal hearing as a control group. The profiles of the two experiment groups are somewhat different in the two studies so they will be presented separately.
2.7.1 Experiment groups in study 1
In study one the 12 learners where four persons working at our lab, three beeing trained phoneticians and the fourth belonging to the technical staff. All four of them speak Swedish well.
The group of hearing impaired persons in study one consisted of only two persons. They are both members of the staff of our department. Their hearing loss is fairly severe, 50 to 70 dB, and they have had this loss since childhood.
2.7.2 Experiment groups in study 2
In study two the 12 learners were four persons, of which three were students at the department, but none of them are phoneticians. Their fluency of Swedish is not as high as that of the L2 group of study one, but they still speak Swedish fairly well.
Linguistics, Stockholm
40 McAllister and Dufberg
The group of hearing impaired persons in study two consisted of five elderly persons over the age of 65, with varying hearing loss. All of them have acquired their hearing loss as adults. A sixth subject was excluded from analyses on the grounds of preposterous results.
2.7.3 L2 vs. hearing impaired subjects
The two experiment groups might seem unrelated, but both groups have something in common: perturbed speech comprehension. The 12 learners on their ability to use signal independent information, and the hearing impaired persons on their ability to use signal dependent information. We regard measuring functional hearing loss and testing speech comprehension in language learning being special cases of measuring speech comprehension. And a good test should be able to capture the difficulties that both groups experience.
2.7.4 Experiment groups in study 1 vs. study 2
The 12 groups of studies one and two are fairly similar; the difference between them is, if any, a matter of degree. The 12 group of study one is probably somewhat more fluent in Swedish than the 12 group of study two, but the dispersion within each group is probably larger than the difference between the groups. With that background it does not seem unresonable to consider the two 12 groups as two samples from the same population.
A comparison of the two hearing impaired groups of studies one and two present a somewhat different picture. The two subjects of the hearing impaired group of study one are two young persons (around 30) who acquired their hearing loss, which is fairly severe, at a very early age. They have used hearing aids for many years, and today they wear hearing aids on both ears. Their speech sounds normal, but there is some minor speech defect which could be related to their hearing loss. The hearing impaired group of study two, on the other hand, are all over the age of 65, have acquired their hearing loss as adults and could be related to aging. None of them use any hearing aid. These two groups, the hearing impaired groups of studies one and two, could hardly be seen as two samples from the same population even though both groups have pertubations in their ability to use signal dependent information.
2.7.5 Control groups
As control groups in both studies we used native Swedes without any known hearing defect. In both studies we used members of the staff and students at the department. The number of subjects in the control groups of the two studies are six and four, respectively. There is no intended difference between the two control groups and they could safely be considered to be two samples from the same population.
PERllUS IX. 1989
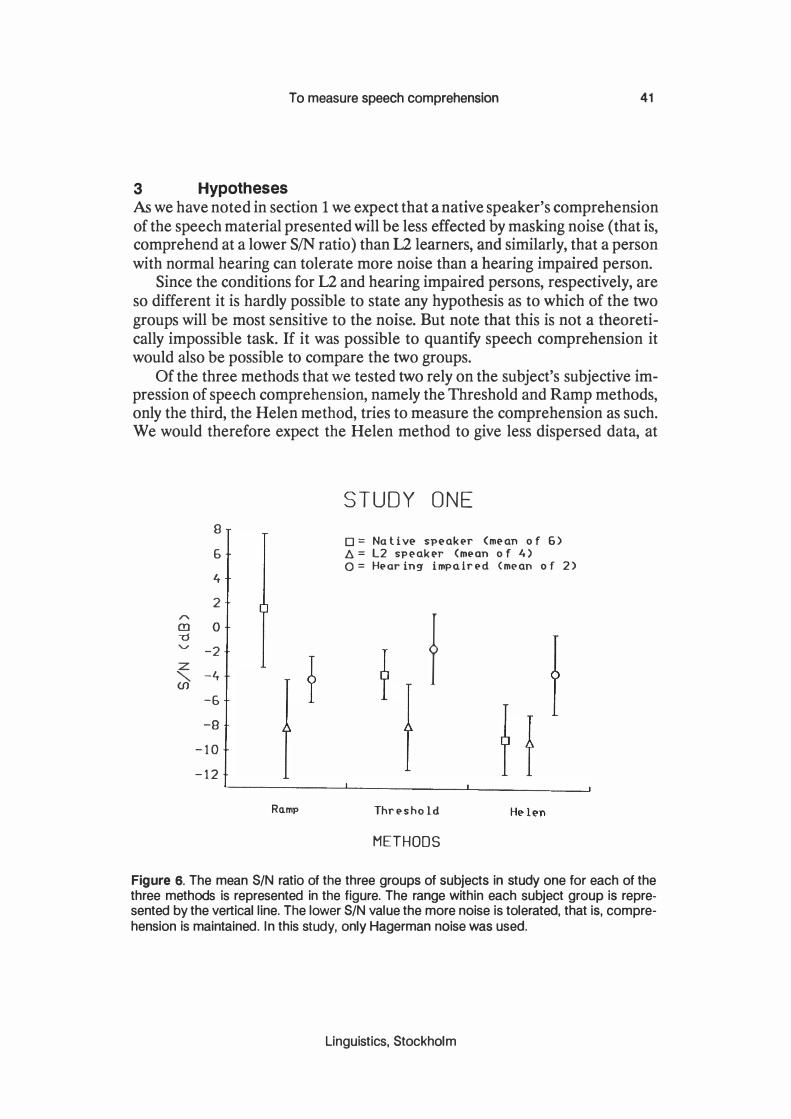
3 Hypotheses
To measure speech comprehension 41
As we have noted in section 1 we expect that a native speaker's comprehension of the speech material presented will be less effected by masking noise (that is, comprehend at a lower SIN ratio) than U learners, and similarly, that a person with normal hearing can tolerate more noise than a hearing impaired person.
Since the conditions for L2 and hearing impaired persons, respectively, are so different it is hardly possible to state any hypothesis as to which of the two groups will be most sensitive to the noise. But note that this is not a theoretically impossible task. If it was possible to quantify speech comprehension it would also be possible to compare the two groups.
Of the three methods that we tested two rely on the subject's subjective impression of speech comprehension, namely the Threshold and Ramp methods, only the third, the Helen method, tries to measure the comprehension as such. We would therefore expect the Helen method to give less dispersed data, at
B 6 4 2
'" (!) 0 -0 "V -2 z "'- -4 (f)
-6 -9
-10 - 1 2
Ro.mp
STUDY ONE
0= Na ti ve- spe-akpr (me-an 0 f 6) � = L2 spe-akpr (mpon 0 f 4) 0= Hpor ing impairpd (mpan 0 f 2)
f
Thrpsho Id
METHODS
Figure 6. The mean SIN ratio of the three groups of subjects in study one for each of the three methods is represented in the figure. The range within each subject group is represented by the vertical line. The lower SIN value the more noise is tolerated. that is. comprehension is maintained. In this study. only Hagerman noise was used.
Linguistics. Stockholm

42 McAllister and Dufberg
least for the control group which can be assumed to be reasonably homogeneous, than the other two methods.
The last varible we were testing is the difference between the two noise types, the Hagerman noise and the Babbling noise, respectively. Our own impression is that other voices are more distracting to speech understanding than random noise. We, therefore, expect the Babbling noise to be a more effective masker than the Hagerman noise.
4 Results
4.1 Results of study 1
The Ramp method was tested in study one only, and in study one only Hagerman noise was used. In figure 6 we see the results of the three methods compared for the three groups of subjects in study one. As expected the Ramp
"" 8 m ""d 6 ........
Z 4 "'- 2 (f)
0 0 0 :r: ..... -2 w L -4 0 -1 -6 0 :r: -8 (f) w fr:: -10 :r: J- -12
STUDY ONE
0= Na ti ve speaker (n=6) ll.= L2 speaker (n=4) 0= Hearing impaired (n=2)
a
II r=.75
t..
t..
-12-10 -8 -5 -4 -2 0 2 4 5 8 RAMP METHOD S/N (dB)
Figure 7. The Threshold method is plotted against the Ramp method. Each subject in study one is represented once. In study one only Hagerman noise was used.
PERILUS IX, 1989

To measure speech comprehension 43
method gives a more dispersed result than the other two methods. Surprisingly, with the Ramp and Threshold methods the native speakers seem to tolerate less noise than the L2 learners and Hearing impaired speakers. (Lower SIN value - or higher negative value - means more noise.) Also surprisingly, the L2 group and the Native speaker group has the same result with the Helen test.
We can notice that the L2 speakers have the same group mean for all three methods whereas especially the group of native speakers varies a great deal.
The data can also be studied from a different perspective. In figure 7 we have plotted the Ramp method against the Threshold method. In the figure every subject of study one is represented once, and the higher dispersion of the Ramp method compared with the Threshold method can clearly be seen. The line in the figure represents the the best linear model to the data. The correlation of the line to the data is 0.75. That is, the linear model accounts for only 56% of the distribution of the data. But one can safely say that there is a correlation between the result of the Ramp method and the Threshold method.
"
8
G
4
2 (!) 0 ""d 'U' -2
� -4 -6
-8
- 10 -12
!
STUDY TWO
o = Natlv� sp�ak�rs (m�an of 4) � = L2 sp�ak�rs (m�an of 4) o = Old ag� sp�ak�rs (m�an of 5)
Hag�r man 8abb 1 in 9' Hag�r man 8abb 1 in g
THRESHOLD METHOD HELEN METHOD
Figure 8. Results of study two. The mean SIN ratio of the three groups of subjects for each of the two methods and two noise sources is represented in the figure. The range within each subject group is represented by the vertical line. The lower SIN the more noise is tolerated.
linguistics, Stockholm
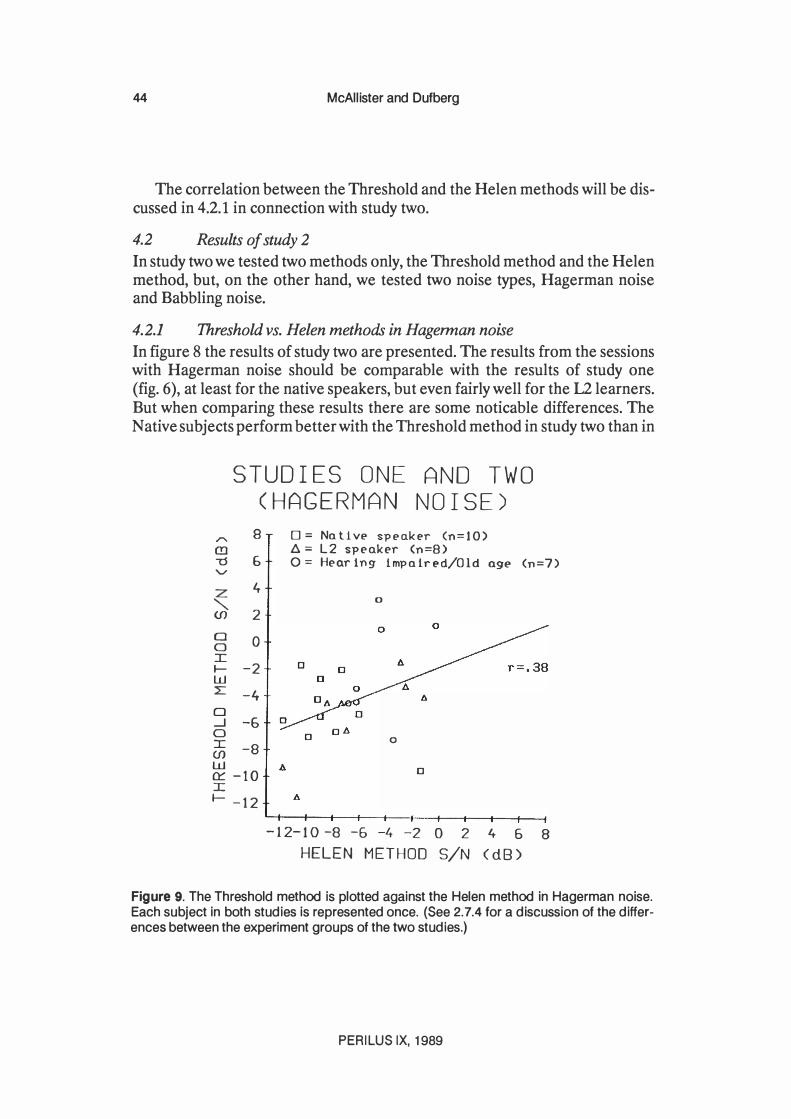
44 McAllister and Dufberg
The correlation between the Threshold and the Helen methods will be discussed in 4.2.1 in connection with study two.
4.2 Results of study 2
In study two we tested two methods only, the Threshold method and the Helen method, but, on the other hand, we tested two noise types, Hagerman noise and Babbling noise.
4.2.1 Threshold vs. Helen methods in Hagerman noise
In figure 8 the results of study two are presented. The results from the sessions with Hagerman noise should be comparable with the results of study one (fig. 6), at least for the native speakers, but even fairly well for the 12 learners. But when comparing these results there are some noticable differences. The Native subjects perform better with the Threshold method in study two than in
STUDIES ONE (HAGERMAN
AND TWO NOISE)
"..... 8 (!l -0 6 'V
Z 4 "'-(f) 2 0 0 a I I- -2 w L -4 o -.J -6 a :c -8 (f) w 0:: -10 J: I- -12
0= Native speakE'r (n=10) l:J. = L2 speaker (n=8) 0= Hear ing impa ir ed/Old age (n=7)
0
o
D
- 12-1 0 -8 -5 -4 -2 0 2 4 5 8 HELEN METHOD S/N (dB)
Figure 9. The Threshold method is plotted against the Helen method in Hagerman noise. Each subject in both studies is represented once. (See 2.7.4 for a discussion of the differences between the experiment groups of the two studies.)
PERILUS IX, 1989
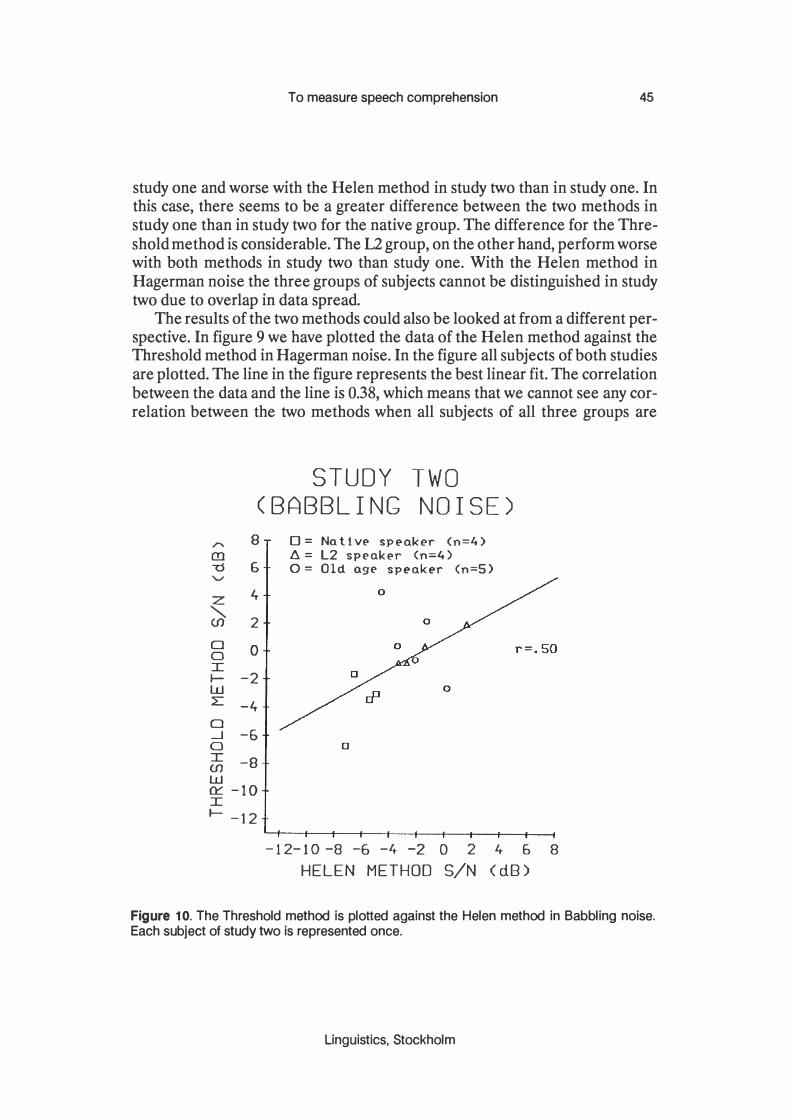
To measure speech comprehension 45
study one and worse with the Helen method in study two than in study one. In this case, there seems to be a greater difference between the two methods in study one than in study two for the native group. The difference for the Threshold method is considerable. The 12 group, on the other hand, perform worse with both methods in study two than study one. With the Helen method in Hagerman noise the three groups of subjects cannot be distinguished in study two due to overlap in data spread.
The results of the two methods could also be looked at from a different perspective. In figure 9 we have plotted the data of the Helen method against the Threshold method in Hagerman noise. In the figure all subjects of both studies are plotted. The line in the figure represents the best linear fit. The correlation between the data and the line is 0.38, which means that we cannot see any correlation between the two methods when all subjects of all three groups are
" en -0 '-" Z "-(J) 0 0 I I-w L 0 -.J 0 I (J) w
STUDY
(BABBLING TWO NOISE)
8 o = Nat1v� sp�ak�r (n=4) 6. = L2 speak�r (n=4)
G 0= Old age speaker (n=S)
4
2
0
-2
-4
-5 0
-8
n::: -10 I I- -12
- 1 2- 1 0 -8 -6 -4 -2 0 2 4- 6 8 HELEN METHOD SIN (dB)
Figure 10. The Threshold method is plotted against the Helen method in Babbling noise. Each subject of study two is represented once.
Linguistics, Stockholm

46 McAllister and Dufberg
studied. Comparison between the two methods for one group of subjects only is not meaningful because of the small number of subjects in each group.
4.2.2 Threshold vs. Helen methods in Babbling noise
In figure 8 we can also study the results of the Babbling noise on the two methods. There are two clear tendencies. Firstly, all groups of subjects seem to perform worse with Babbling noise than with Hagerman noise. Secondly, the dispersion of the data within a group of subjects for a specific method seems to be smaller for Babbling noise than for Hagerman noise. The tendency for the groups to perform better on the Helen test, in terms of SIN-ratio, persists.
In figure 10 we have plotted the two methods against each other for the Babbling noise. The correlation is only 0.50. Any correlation between the two methods cannot be found in our studies, neither with Hagerman nor with Babbling noise.
" m -0 '" z "-(J) w (J) t-t a z z ([ L a:::: w (..')
STUDY (THRESHOLD
TWO METHOD)
8
6
4
2
0
-2
-4
-6
-8
o = NQtiv� sp�Qk�r (n=4) � = L2 sp�ak�r (n=4) o = Old Q9� sp�ak�r (n=S)
r =. '36 a=1.2 b=-3.0 dB
([ -10 I
-12
-12-10 -8 -6 -4 -2 0 2 4 6 8 BABBLING NOISE S/N (dB)
Figure 11. The Hagerman noise is plotted against the Babbling noise for the Threshold method. Each subject in study two is represented once. Note the high correlation and that the slope is approximately equal to one.
PERILUS IX, 1989

To measure speech comprehension 47
4.2.3 Hagerman vs. Babbling noise
As we saw in 4.2.2 the subjects performed worse, in terms of SIN-ratio, in Babbling than in Hagerman noise (fig. 8). In figures 11 and 12 we have plotted the two noise types against each other, in figure 11 for the Threshold method and in figure 12 for the Helen method.
In figure 11 we can see that there is a fairly high correlation between the two noise types for the Threshold method. The correlation is 0.96, which means that the linear model explains 92% of the relationship between the results of the Threshold method for the two noise types. The equation for the linear model is given in (1) below, in which CH and CB stands for the treshold of comprehension (in dB) in Hagerman and Babbling noise, respectively.
STUDY TWO (HELEN METHOD)
8 0= Nativ� sp�ak�r (n=4) .r.. ll. = L2 sp�ak�r (n=4) en 6 0= Old ag� sp�ak�r (n=S) 'U '"" 4 z '" 2 (f) w 0 (f) I---< -2 a z -4 z ([ -6 L 0::: -8 w (.!) 0 ([ -10 0 I
-1 2
-1 2-10 -8 -6 -4 -2 0 2 4- 6 8 BABBLING NOISE S/N (dB)
Figure 12. The Hagerman noise is plotted against the Babbling noise for the Helen method. Each subject in study two Is represented once. Note the low correlation in comparison with the one for Threshold method (see figure 11).
Linguistics, Stockholm
48 McAllister and Dufberg
CH = 1.2 CB - 3 dB (1)
Equation (1) means that the threshold level of the (subjective) speech comprehension (when tested with the Threshold method) is 3 dB lower (in SIN-ratio) for Hagerman than Babbling noise. When the two noise types are compared for the Helen method (fig. 12) the correlation turns out to be much lower, only 0.36, which means that we here find no support for the high correlation found for the Threshold method.
5 Discussion For two of the methods, the Threshold and the Ramp methods, the relationship between test result and speech comprehension is at best indirect. Firstly, we cannot assume that all subjects have the same criterion for deciding when they can only barely follow or cannot follow the text. Secondly, the task is very different from normal situations where speech comprehension is involved.
The Helen method, on the other hand, involves no subjectivity. What is measured is the ability to do the task, i.e. answer the questions. If you have not heard the question the chance of guessing correctly is minimal, and if you have heard it you will certainly be able to answer it. (There are problems with the Helen method, as we designed it, which will be discussed below.)
As discussed above we expected the 12 and hearing impaired subjects to do worse in the tests, i.e. having a higher SIN ratio, than the normal hearing and native speakers, respectively. In study one (fig. 6) we see that is not the case. The 12 learners actually, on the average, accept lower SIN ratio for both the Ramp and the Threshold methods than the native speakers. But in study two (fig. 8) the opposite is true for the Threshold method with Hagerman noise. (Remember that we used Hagerman noise only in study one.) Furthermore, we see in both study one and two (fig. 6 and 8) that the 12 learners do not do worse than the native speakers in the Helen method with Hagerman noise. In study two this is also true for the hearing impaired subjects.
Why do we get these results? There are some facts that should be pointed out. Firstly, we can notice that the data dispersion is fairly large for most results. That means that one should avoid any premature conclusions. Secondly, we do not know how large a difference in dB we should expect. That is, it might turn out that we will get a difference of only a few dB, but a consistent difference. In these pilot studies such a small difference would be invisible in the data dispersion. Thirdly, we should be reminded that the Ramp and Threshold methods measure the subjective impression of the effect of the noise on the speech comprehension, not the effect as such.
PERILUS IX, 1989
To measure speech comprehension 49
Let us return to the (unexpected) result that the 12 learners accepted lower SIN ratio in study one with the Ramp and Threshold methods (fig. 6). These 12 learners have good fluency in Swedish. But being an 12 speaker probably also means that you are used to not understanding very well. We suggest that the (unexpected) result could, at least partly, be explained by the 12 learners' acceptance of poor comprehension, that is, we suggest that the 12 speaker has another understanding of the concept barely (see 2.4). As we have mentioned above (2.7.2) the 12 learners of study two are not as fluent in Swedish as the ones of study one. We suggest that they therefore have a much earlier breakdown in comprehension.
The second (unexpected) result we should discuss is the higher SIN ratio of the L2 group with Helen test that fails to appear with Hagerman noise (fig. 6 and 8). We think it is reasonable to assume that the difference between the 12 and native subjects, that is the higher SIN ratio for the 12 learners, is hidden by the dispersion. And for Babbling noise, there is actually the expected difference. (The Babbling noise will be discussed below.)
We have not so far discussed the hearing impaired group. In study one the number of hearing impaired subjects is only two. Their results are more according to the expectations than the results of the 12 subjects. In study two the hearing impaired group has similar results as the 12 group. The discussion about the 12 group is also applicable to the hearing impaired group. Recall that the two hearing impaired groups of the two studies are rather different (see 2.7.4).
We expected the Babbling noise to be a more effective masker than the Hagerman noise. Firstly, that was our subjective impression. Secondly, the Babbling noise is more speech-like and therefore it seems reasonable to assume it to mask more effectively. This also seems to be the case (fig. 8 and 11). One has to remember, though, that our calibration methods were quite coarse. We should therefore not rely too much on the value 3 dB (see 4.2.2). What is interesting is that the source type appears to be important, not the absolute value.
A disturbing fact is, however, that we do not get the same convincing relationship between Hagerman and Babbling noise for the Helen method (fig. 12) as for the Threshold method (fig. 11). We think this is connected to the problems of the Helen method (which will be discussed below).
Our subjective impression is also that the Babbling noise is more steep in its masking. That is, a small variation in SIN ratio will correspond to a large variation in comprehension ranging from understanding nothing to clear understanding. We would expect this to cause smaller individual dispersion. We have however not tested the individual dispersion. It is also possible that this steepness and the higher masking effect of Babbling noise are side effects of the use of the same voice for the speech material and the Babbling noise (see 2.2).
Linguistics, Stockholm
50 McAllister and Dufberg
We expected the Helen method to give smaller dispersion, especially for the normal hearing native speakers, than the other two methods. We also expected it to be a better test for measuring speech comprehension. Our data do not give any direct support for this. The clear correlation between Hagerman noise and Babbling noise which is present for the Threshold method (fig. 11) is anything but present for the Helen method (fig. 12). Superficially, it looks like the Threshold method is the best method of the two to measure speech comprehension, but we have above shown that there are even at the theoretical level arguments against the Threshold method. In spite of the confusing results of the Helen method we consider it to be a more promising method.
There are problems with the speech materials we used in the Helen method, i.e. the Helen questions. Firstly, they are very predictable in form (just wh-questions), secondly, variation of content is very limited (color-of, opposite-of etc.). These two factors make the risk of learning quite high, and then we are in trouble whether or not we consider learning to be (partly) a part of speech comprehension. Thirdly, the calibration method we used was too coarse. A question is short and the Helen method is probably more sensitive to variations between sentences than the Threshold method. This third factor has probably increased the individual dispersion and could explain why the correlation between the two noise sources is so low (fig. 12).
6 Conclusions These pilot studies were carried out as an attempt to shed light on some important questions in our ongoing research with methods for testing speech!language comprehension. It is not surprising that, while we can conclude that some light has been shed on these questions, our conclusions based on this preliminary work must be narrow in scope and tentative. Considering the data we have presented here we are also compelled to ascertain that our expectations/hypotheses stated in section 1 and 3 have not been fully realized. We assumed that the language comprehension of our normal subjects would be less sensitive to noise masking than that of our L2 and hard of hearing subjects. As we have seen, the hearing impaired subjects seem to follow our expectations in this respect somewhat more closely than the L2 learners. In study 1 these second language learners were less sensitive to the masking noise that the native speakers. In study 2 the L2 learners' performance upheld our expectations.
An interesting aspect of these results is the indication that a relatively small difference in signal to noise ratio separates the threshold for L2 and native speakers, and hearing impaired and normal hearing persons, respectively. This would seem to be an important point of departure in future research on L2 learners' and hearing impaired persons' comprehension of running speech.
PERILUS IX, 1989
To measure speech comprehension 51
Of the three test methods included in this work we have been able to eliminate one, the so called Ramp method, as a viable alternative for testing the comprehension of speech. As for the remaining two methods there seems to be slightly more support for the validity of the Helen method than for the Threshold method but it would be profitable to continue our comparison of the two methods, especially since our version of the Threshold method was quite simplified compared to other versions of this test paradigm which have been used in other research efforts. As for the two noise types, the Babbling noise may have been a slightly more effective masker in these experiments. This is also, of course, a question which should be further investigated with special reference to the enhancement of test validity relating to masking noise type.
Our inability to draw more definitive conclusions from this data was not unexpected in this preliminary work. More studies with other methods should make it possible to systematically compare methods in several respects and provide a basis for the development of some innovative techniques for the measurement of speech/language comprehension which is the ultimate goal of this research. It should, in conclusion, be mentioned that we have, at least, begun to familiarize ourselves with the problem complex of comprehension testing and to realize that in this vast area where much work has been previously done it will be critical to find a fruitful limitation of our research direction. As of now we believe that the validity criterion will be a key to discovering guidelines for future research.
Acknowledgements The work presented here has been supported by The Swedish Council for Planning and Coordination of Research (FRN).
Linguistics, Stockholm

52 McAllister and Dufberg
References Hagerman, B. (1984): Some aspects of methodology in speech audiometry (dissertation). Karolin
ska Institute, Stockholm. J akobson, R., G. Fant & M. Halle (1952) : Preliminaries to speech analysis. Cambridge, MA: MIT
Press. Lindblom, B. (1987): "Adaptive variability and absolute constancy in speech signals", Perilus V,
2 - 20. Inst of lingustics, Univ of Stockholm. Ludvigsen, C. (1975): "Construction and evaluation of an audio-visual test (the Helen test),',
Visual and audiovisual perception of speech (Sixth Danavox symposium 1974). Stockholm: Almquist & Wiksell.
Walver, G. & D. Byrne (1985) : "Reliability of speech intelligibility estimation for measuring speech reception threshold in quiet and in noise" , Australian Journal of Audiology, 7:1, 23 -31.
PERILUS IX, 1 989

Phonetic Experimental Research, Institute of Linguistics, University of Stockholm (PERILUS), vol IX, 1989, 53-74
Abstract
Speech after glossectomy: phonetic considerations
and some preliminary results
Ann-Marie Alme and aile Engstrand
We report quantitative data bearing on the production and perception of vowels and consonants in the speech of two radically glossectomized patients. Acoustic measurements of Ii a u/ show that patients have smaller vowel spaces than normal control subjects, with a particularly strong reduction along the F2 dimension. The vowel spaces are more reduced in connected speech than in citation forms suggesting that, in connected speech, subjects do not exploit their full potential for articulatory compensation in vowels. Lingual consonants are normally labial in the speech of these glossectomees. This leads to considerable perceptual confusion between places of articulation. Nevertheless, intended labials are perceived as such more often than intended dentals and velars.
1 Introduction
Glossectomy is the surgical resection of all or part of the tongue, usually performed to treat carcinoma of the tongue. If larger parts of the tongue and adjacent tissues are missing, oral functions are severely impaired. However, laboratory research and clinical experience provide clear evidence for an at least partial recovery of a functional speech capability (e.g. Brodnitz, 1960; Skelly et aI., 1971, 1972; LaRiviere et aI., 1975; Morrish 1984, 1988; Georgian et aI., 1982; Barry & Timmermann, 1985).
Such a recovery frequently appears to occur spontaneously; i.e., cinefluorographic, videofluorographic, labiographic, and electropalatographic inspection of articulatory postures and gestures show that patients develop new motor strategies to compensate for their surgically induced handicap even in the absence of post-operative speech therapy. Cases of successful therapy considerably enhancing listeners' understanding and acceptance have also been reported (Brodnitz, 1960; Leonard & Gillis, 1982), as well as cases where even intense therapy has failed to produce positive effects; the latter cases all involve total glossectomy and dysphagia combined (Skelly et al., 1971).
The possibility of recovering speech at an understandable andlor acceptable level thus varies for different post-operative conditions. Thus, Massengill et al.
Linguistics, Stockholm
54 Alma and Engstrand
(1970) report that "the speech became increasingly distorted as larger percentages of the tongue were removed". Different phonetic consequences also seem to arise from the type of surgery required and its various side-effects. Such observations involve implicit recommendations for surgical methods in cases where there is a choice. For example, mobility and flexibility of remaining tongue tissue (Brodnitz, 1960; Skelly et aI., 1971; Pruszewics & Kruk-Zagajewska, 1984; Barry & Timmermann, 1985; Morrish, 1988) have been assumed to be a critical factor even to the extent that "the speakers' degree of acceptability appears to be related more to post-operative lingual mobility than to the amount of tongue mass remaining" (Barry & Timmermann, 1985), and that "a paretic tongue is a greater problem to speech than is the absence of a tongue altogether" (LaRiviere et aI., 1975, quoted from Van ThaI, 1966). Also, for the partial glossectomee, removal of different parts of the tongue mass seems to produce different effects. It has been suggested, for example (Skelly et aI., 1971), that "excision of the right or left half of the tongue appeared to require fewer speech adaptations than did excisions including the entire tip". Further factors disturbing a desired recovery of speech functions involve the fixation of residual tongue mass to the floor of the mouth (Barry & Timmermann, 1985), stiffness in remaining scar tissue (Brodnitz, 1960; Massengill et aI., 1970), unfavourable dental status (Brodnitz, 1960; Pruszewicz & Kruk-Zagajewska, 1984), and disturbances in saliva production (Brodnitz, 1960; Leonard & Gillis, 1982). Severe cases are sometimes further complicated by partial or total mandibulectomy, pharyngectomy or laryngectomy (Brodnitz, 1960).
The effects of glossectomy have been shown to be unevenly distributed across the sound inventory of the language in question (Brodnitz, 1960; Skelly et aI., 1971; LaRiviere et aI., 1975; Bradley et aI., 1980). However, the most severe cases of glossectomy represent a speech style where most normally occurring and significant phonetic features are completely absent. The speech of the glossectomee thus offers a possibility of studying an acoustically underspecified speech signal in a natural setting. By studying the compensatory priorities made by the glossectomees, and the listener reactions elicited by the glossectomized speech, we may also learn something about how physiological and perceptual constraints interact to shape normal speech phonetically.
Intelligibility and acceptability are the aspects of glossectomized speech most studied in the literature. These studies have concentrated either on particular sounds or sound classes, such as vowels or consonants (LaRiviere et aI., 1975; Georgian et aI., 1982; Leonard & Gillis, 1982; Morrish, 1984, 1988) or on the broad functionality of the speech in more conversation-like settings (Skelly et al., 1971; Bradley et aI., 1980; Teichgraeber et al., 1985, 1986).
PERILUS IX, 1989

Speech after glossectomy 55
Within the recently initiated research project Speech after glossectomy (Engstrand & Alme, 1988), we aim to clarify the complex of phonetic consequences arising from a more or less radical glossectomy. So far, our knowledge of the phonetic effects of glossectomy is relatively slight. Several studies based on auditory and qualitative judgments have been published (e.g. Brodnitz, 1960; Pruszewicz & Kruk-Zagajewska, 1984; Teichgraeber et aI., 1985, 1986). There are a few experimental studies of acoustic parameters by means of spectrographic analysis (Skelly et aI., 1972; LaRiviere et al., 1975; Morrish, 1984, 1988) as well as visual inspection and measurement of the position and movements of articulatory structures using cinefluorography or videofluorography (Skelly et aI., 1971; LaRiviere et aI., 1975; Georgian et aI., 1982; Morrish, 1988). Combined articulatory and acoustic data have been reported by Skelly et aI. (1972) and Georgian et aI. (1982), and combined perceptual and articulatory studies using electropalatography have been carried out by Barry & Timmermann (1985) and Fletcher (1988). LaRiviere et aI. (1975), Georgian et al. (1982), and Morrish (1984, 1988) studied articulation, acoustics and intelligibility in combination.
Several of these studies have the character of pilot studies, involving relatively few subjects; for example, Barry & Timmermann (1985) is at the upper end using 7 subjects. Five studies (LaRiviere et aI., 1975; Georgian et aI., 1982; Leonard & Gillis, 1982; Morrish, 1984, 1988) use only one or two subjects.
In this first project report, we describe some phonetic aspects of speech production and speech understanding in the case of an almost completely glossectomized patient, and aspects of vowel production in a totally glossectomized patient.
The general aim of the proj ect Speech after glossectomy is to use the methods of experimental phonetics to create an empirically solid knowledge base concerning the effects of various kinds and degrees of glossectomy on speech production and understanding. Since this is a practically unexplored area, we shall attempt to shed light on it from various points of view. The basic question, however, concerns the capacity of the glossectomee to preserve functional speech by means of compensatory restructuring of hislher articulatory motor functions. The project has then a phonetic, a medicaVphoniatric, and a logopedic aspect: we expect the results to a) contribute to the debate on phonetic invariance, b) make possible pre-operative judgements/prognoses of the phonetic consequences of the planned operation, and c) provide a foundation for 1 post-operative speech rehabilitation.
We actualize the phonetic perspective in section 2. In order to concretize and illustrate the line of inquiry that we are following in the project, we report
Linguistics, Stockholm
56 Alma and Engstrand
some results from our work in progress (section 3). Finally, these results are discussed in terms of some tentative conclusions (section 4).
2 Phonetic variation and constancy It is a remarkable fact that articulatory movements and phonetic perception normally flow extremely rapidly, free from disturbance, and, seemingly, without much effort. This shows that the transmission of information is a well organized and highly automatic process. It is equally striking, however, that we are very flexible when it comes to forming, as well as perceiving, the sounds of language. This is clearly evidenced, for example, by the ease with which we immediately understand spoken linguistic statements mediated by new and physically unique sound patterns. Male and female voices are very different, for example, and we often observe, from one occasion to the other, considerable phonetic variation in one and the same speaker. We thus have a highly developed capability of categorizing physically disparate sound impressions in terms of linguistic categories (Lindblom, 1987; Engstrand & Krull, 1988; Traunmiiller, 1988). This capability can be said to be the phonetic expression of the general psychological phenomenon referred to as perceptual constancy.
The phonetic basis of this phenomenon is partly well understood. In particular, it is known that phonetic variation is fairly regular. An example of such a phonetic regularity is provided by the Swedish word naturligtvis (naturally, of course) which can be reduced to /nahlltvis/, /nat1�s/, or even /nas/. These forms are recognized and understood (in an appropriate context), which is not the case with, for example, /nulits/ or /nis/. The latter forms of the word naturligtvis are not necessarily more reduced than the former ones. They do, however, violate the phonetic reduction rules of spoken Swedish. It is reasonable to assume that we, as listeners, have an implicit knowledge of this kind of regularity. By applying such a know-ledge in the process of perception, we are able to disregard the phonetically regular variation, thus associating a variety of acoustic patterns with a given linguistic category.
It is also essential to realize that, in general, speech perception and understanding function successfully only with the support of extralinguistic context, i.e. presuppose knowledge which is completely independent of the acoustic signal. A word form such as !bsjtssk/ for budgetunderskottet (the budget deficit) is easily identified when finances are being discussed; but excized from its context, the same word form is completely unintelligible. In summary, then, we assume speech perception to be governed partly by direct access to acoustic signal properties, and partly by means of the creative use of phonetic regularities and circumstantial knowledge. The latter assumption is crucial to the approach that Lindblom (1987) has referred to as the perceptual-semantic hypothesis of
PERILUS IX, 1989

Speech after glossectomy 57
invariance, and of paramount importance to the perception of glossectomized speech. Thus, factors which improve the listeners understanding of a glossectomized speaker are an interest for the person or topic of conversation or beeing a close relative (Skelly et aI, 1971).
Even though the presence of contextual information entails a considerable tolerance of phonetic variation, there are clear limitations on the variation that listeners accept and understand. In phonetic interaction, this means that the speaker regulates his articulatory behaviour to stabilize words and sounds within perceptually given limitations. There is experimental evidence to show that our articulatory strategies are listener-oriented in this sense (Engstrand, 1988). This is demonstrated in a particularly striking way by experiments where mechanical disturbances are introduced into articulatory processes (Lindblom, Lubker & Gay, 1979; Alme, 1979; Alme & Brente, 1979). When the mandible is locked by means of a so-called bite-block, a spontaneous reorganization of lingual and labial motor patterns results. Gay et al. (1981) have shown that a change in the position of the tongue relative to the mandible preserves a roughly constant vocal tract geometry. Such a motor adjustment is generally referred to as articulatory compensation.
Articulatory compensation has usually been supposed to be immediate and efficient. Such an assumption is, however, based on experimentally created, short-lasting conditions. Even though speakers are able to compensate in this way, it should not be taken for granted that this effect is a general one. Our daily experience suggests that deviant pronunciation habits may well be preserved throughuot long-term or permanent anatomical defects. It is, for example, not unusual for a change in dental status to lead to permanent effects on speech (Bloomer, 1971). It is also reasonable to assume that a long-term optimization of speech motor control is associated with considerable psychological effort and may be achieved only by means of skilled speech therapy. As far as the glossectomized subjects are concerned, considerable physiological effort may also be involved. We shall continue this discussion after having concretized the background with some experimental data.
3 Experiment
3.1 J>uTjDose
The first purpose of this experiment was to investigate the acoustic correlates of vowels and consonants as produced by glossectomized Swedish subjects; the second purpose was to study the extent to which vowels and consonants can be identified out of context.
Linguistics, Stockholm
58 Alme and Engstrand
There are at least three good reasons for systematically quantifying the acoustic-phonetic properties of glossectomized speech: we can draw certain (indirect) conclusions about articulation, we can make hypotheses concerning deviations that are liable to affect understanding, and we can form a basis for a quantitative measurement method for evaluating possible effects of speech therapy.
For the vowels, we observe in this first report the effects of two different speaking conditions: citation forms (where the subject reads isolated words) and connected speech (where the subject reads a given text in which the previously isolated words occur in a semantically meaningful context). The reason for studying both citation forms and text is the following: For normal speech, it is well known that distinctions between vowels are less clearly marked (Le. more reduced) in connected speech than when pronounced in isolation. It might be speculated that such a variation would be less pronounced in the speech of the radically glossectomized subject. One reason for this would be that the glossectomee has a relatively narrow overall range of variation (at least along certain dimensions, see below). Another reason is that the level of intelligibility of the glossectomized speech is relatively low in the first place; thus, the speaker cannot afford, as it were, to reduce his vowel distinctions further.
The second part of this experiment is a preliminary test of this intelligibility aspect. We attempt to establish whether our subjects are able to convey some of the Swedish vowel and consonant sounds in an understandable way.
3.2 Subjects
The subjects are one 62-year-old male speaker (GLl) and one 57-year-old female speaker (GL2). Subject GLI has undergone subtotal glossectomy and partial neck dissection on the right side and lacks tongue remnants almost completely; the surgery was carried out approximately six years prior to the recording. Subject GL2 underwent a total glossectomy, partial mandibulectomy, and radical neck dissection approximately one year prior to the recording. Neither of these patients has received any speech therapy.
The study of phonetic effects of glossectomy presupposes comparisons with preoperative data from the same patients. In future work, we shall be able to make such comparisons. Presently lacking such data, however, we have compared the speech of the glossectomees with data from 7 male normal speakers (NO-N6) and one female normal speaker (N7). These speakers have recorded the same material as the patients.
PERILUS IX, 1989

3.3 Methods
3.3.1 Speech material
Speech after glossectomy 59
The speech material consists of a word list and three texts (see Appendix). The word list comprises 51 words with the structure ICW. C stands for all Swedish consonant phonemes which are possible in morpheme initial position, i.e. all phonemes except 101; V stands for one of the tense (long) vowels li:/, la:/, and lu:/. The tense vowels Ii! and lui often tend to be diphthongized in stressed position and slow speech rate. They are rather close to the cardinal vowels in the International Phonetic Alphabet (IPA). The Ia! is a back vowel [U] which is slightly rounded.
Each vowel occurs 17 times in varying consonant contexts. We document these vowels particularly carefully since they approximate three of the extreme cardinal vowel points. Combining all these sequences, we obtain a good basis for the study of CV-coarticulation and CV-transitions in the glossectomized speech.
The texts are the following: Text 1. - The north wind and the sun (Nordanvinden och solen), is a well
known text which has been recorded in several languages and dialects. Text 2. - A difficult case (Ett svart fall). This text is frequently used by
Swedish speech pathologists. The two texts thus offer rich possibilities of comparing different forms of normal and pathological speech.
Text 3. - English ceramics (Engelsk keramik). This text is rich in consonant combinations likely to cause patients serious trouble. It is thus a basis for the study of articulatory compensation in consonants.
In the texts read, we have identified all lexically stressed Ii!, la!, and lui. To accept a given vowel for measurement, we required that words containing the vowels were to be pronounced completely fluently, i.e. without a break, hesitation, or other disturbance. For subject GL1 we thus achieved the following number of acceptable vowels: 10 for Ii!, 9 for Ia! and 8 for lui; for GL2: 7 for Ii!, 6 for la!, and 6 for lui.
3.3.2 Recording procedure
The material was recorded in a sound-treated studio using a Revox PR 99 tape recorder set to run at a tape speed of 19 cm/s. A free-standing Sennheiser microphone MD 211 U was positioned approximately 25 - 30 cm from the subject's mouth. The word list was recorded five times using a new random order between words each time. The procedure was the following: The subject reads the words from numbered cards. The experimenter first says the card number and then shows the card to the subject. The subject reads the word that has been written on the card. The experimenter then moves on to the next card, reads its
Linguistics, Stockholm

60 Alma and Engstrand
number, etc. The numbers are necessary since it is not always possible to identify the word afterwards. By reading numbers in between the subject's renderings, we also attempt to avoid a possible enumerative intonation on the part of the subject.
3.3.3 Test of intelligibility
In the intelligibility test we had a panel of 14 speech pathology students listen to the word list with one reading by the male subject GL1 and one by the male normal subject NO. All listeners had verified normal hearing. The experiment took place in a sound-treated perception laboratory. The listeners heard the tape twice over headphones at a comfortable sound level. Half of the panel was asked to identify the consonants in the first round and the vowels in the second round, and vice versa for the other half of the panel. The choice was among the words described above and listed in the Appendix, i.e. all combinations of 17 possible morpheme initial consonants and the three tense vowels Ii a uf. The answers were given on a prepared answer form. The listeners were urged to give an answer to each item and to guess when uncertain.
3.3.4 Data analysis
The analyses of the vowels and consonants are based on segmentation and measurement of broad-band spectrograms. Some of the spectrograms (those for subjects NO, N1, N2 and GL1) were made with a Voice Identification, Inc., Series 700 Sound Spectrograph; the rest of the spectrograms were made with a Kay-Elemetrics Digital Sona-Graph 7800 using a Sona-Graph Printer 7900. The filter bandwidth was in all cases 300 Hz, except for the female subject N7. This subject had a relatively high voice fundamental frequency; to obtain a clear formant structure for this subject, a 600 Hz analysis filter was used.
For the vowels, the mid-frequencies of the first and second formants (Fl and F2) were measured at the first point within the voiced segment where F2 had achieved its maximum or minimum value. For subjects NO and GL1 we also identified and measured the onset values for Fl and F2. These measurement points give a relatively good indication of place of articulation (labial, dental, palatal, velar). Based on this, the mean and standard deviation were calculated for the first two formants.
3.4 Results
3.4.1 l'o�els
Mean values for F 1 and F2 for all subjects are listed in Table I and illustrated in Fig. 1. The figure, displaying the data in the FI-F2 plane, shows differences as well as similarities between speakers. Both patients distinguish formant
PERILUS IX, 1989

Speech after glossectomy 61
Table I. Mean frequencies and standard deviations (Hz) for F1 and F2 for the vowels /i:/, /a:/, and /u:/, produced by 8 normal speakers (ND-N7) , and 2 glossectomized speakers (GL 1 and GL2). The values are based on 1-4 readings of the word list.
/i:/ /a:/ /u:/ F1 F2 F1 F2 F1 F2
Sbj x s x s x s x s x s x s n
NO 265 15 1970 53 540 18 910 24 320 30 630 30 17 N1 307 53 2118 82 595 39 954 30 292 58 632 54 51 N2 223 34 2357 60 468 59 754 95 243 45 552 63 51 N3 304 29 1946 56 503 57 919 40 350 32 801 45 51 N4 318 36 1890 76 595 73 979 34 394 35 719 74 48 N5 287 34 2232 56 570 46 953 55 265 37 654 63 50 N6 283 30 2034 51 585 46 995 48 320 43 712 40 51 N7 388 49 2747 42 708 50 1243 28 447 81 933 25 14 GL1 353 27 1703 44 571 37 1134 47 321 32 1190 37 66 GL2 743 40 1699 56 772 28 1549 96 601 44 1400 112 51
frequencies for Ii!, la!, and lui, but the differences are generally smaller than in the normal speakers. Since Ii!, la!, and lui represent extreme regions in the FIF2 space, we also draw the conclusion that the patients' vowel space is smaller along these dimensions than is the case for the normal speakers.
There are, however, considerable differences between the respective FI and F2 effects. The glossectomees display a more restricted range in F2 than in Fl. This effect is expected since FI variation reflects the degree of jaw opening (Lindblom & Sundberg, 1971), and this articulatory parameter should not be greatly affected by glossectomy. F2, on the other hand, is known to relate to the horizontal movement of the tongue in normal speech. In consequence, this dimension is largely out of control in the speech of the glossectomees (cf. Morrish, 1988). The female subject G12 has considerably less distance between formant values for F I and particularly F 2 for the three vowels, which was expected since G12 lacks tongue remnants completely. For the male normal speakers (N3 and N4) who have formant values close to the values for the glossectomized speaker GLl, statistical analysis showed a significant difference for FI and F2 at the 1 % level of significance for all vowels.
For GLl, GL2 and NO, the vowels Ii a uI were compared across speaking conditions: word list vs. text. Values for F I and F2 are shown in Table II, and for GLI and NO also in Fig. 2. We observe that both subjects reduce their vowels
Linguistics, Stockholm
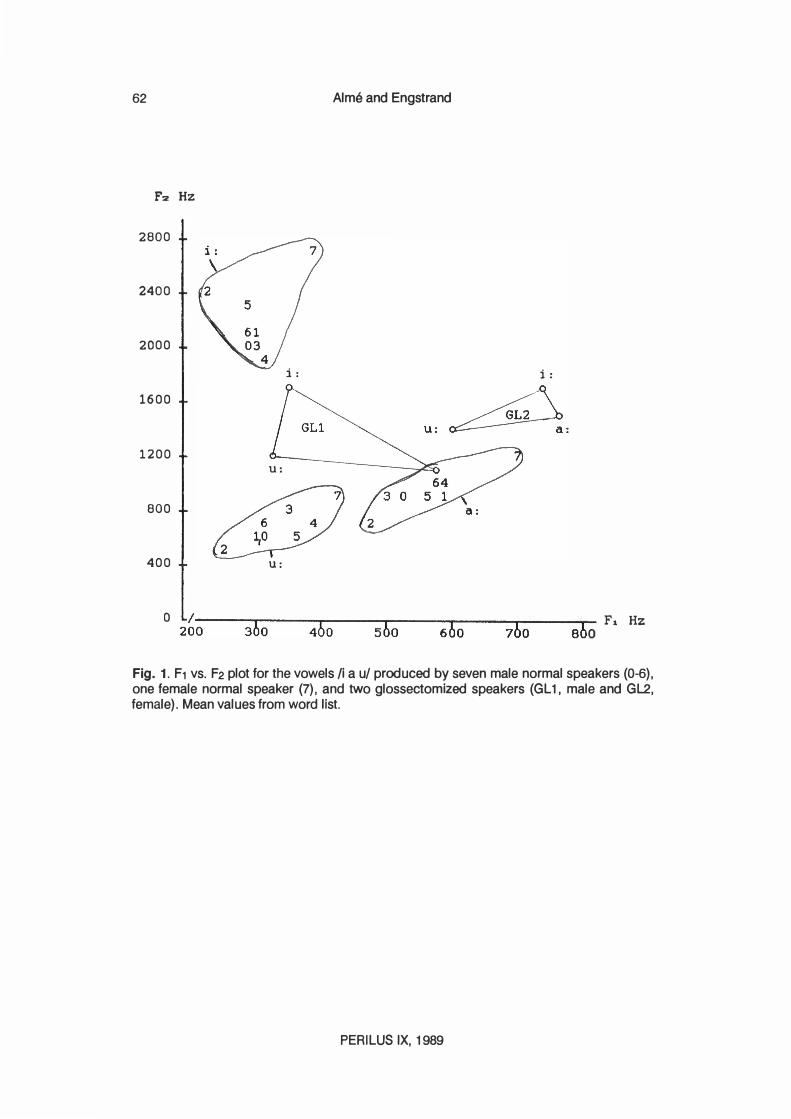
62 Alms and Engstrand
F2 Hz
2800
2400
2000
i:
1600
1200 U:
800
400 U:
o 2�-0 --3-b'o--- 4"Tb-0---5bT"o--- 6-'6-0---7"T"b-0 --8-6 ...... 0 F, Hz
Fig. 1. F1 vs. F2 plot for the vowels Ii a ul produced by seven male normal speakers (0-6), one female normal speaker (7) , and two glossectomized speakers (GL 1, male and GL2, female). Mean values from word list.
PERILUS IX, 1989
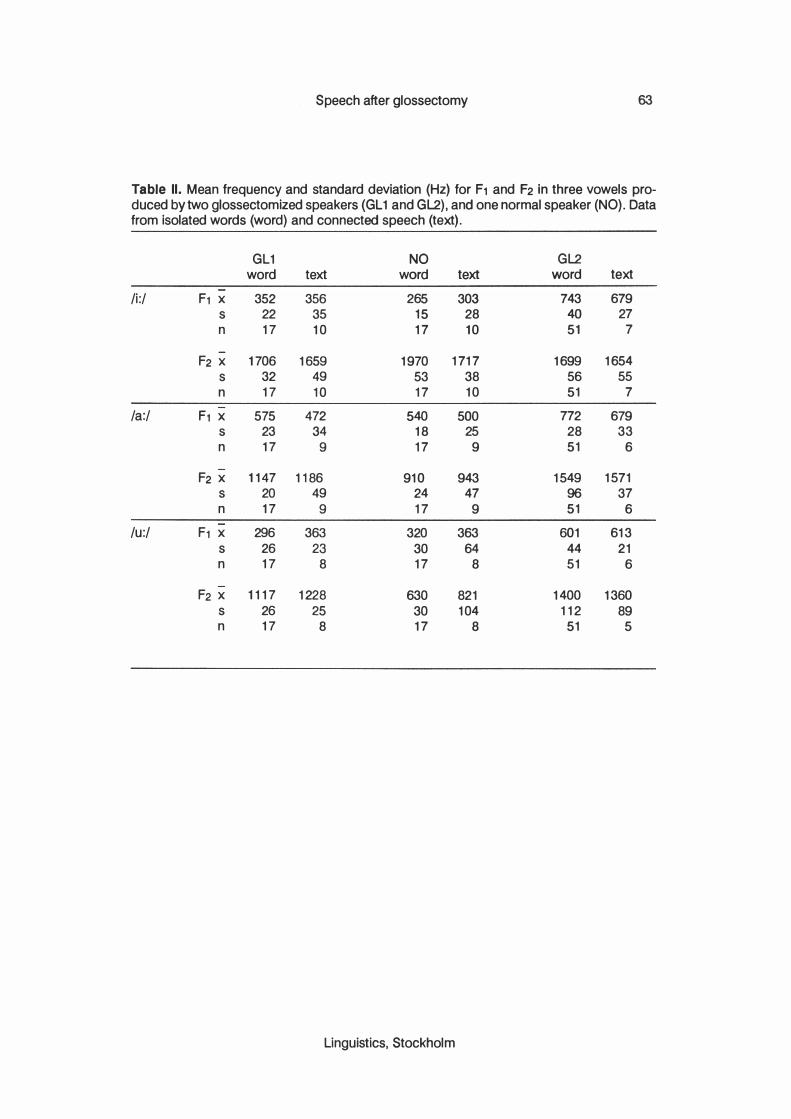
Speech after glossectomy 63
Table II. Mean frequency and standard deviation (Hz) for F1 and F2 in three vowels pro-duced by two glossectomized speakers (GL1 and GL2), and one normal speaker (NO). Data from isolated words (word) and connected speech (text).
GL1 NO GL2 word text word text word text
/i:/ F1 x 352 356 265 303 743 679 s 22 35 15 28 40 27 n 17 10 17 10 51 7
F2 x 1706 1659 1970 1717 1699 1654 s 32 49 53 38 56 55 n 17 10 17 10 51 7
/a:/ F1 x 575 472 540 500 772 679 s 23 34 18 25 28 33 n 17 9 17 9 51 6
F2 x 1147 1186 910 943 1549 1571 s 20 49 24 47 96 37 n 17 9 17 9 51 6
/u:/ F1 x 296 363 320 363 601 613 s 26 23 30 64 44 21 n 17 8 17 8 51 6
F2 x 1117 1228 630 821 1400 1360 s 26 25 30 104 112 89 n 17 8 17 8 51 5
Linguistics, Stockholm
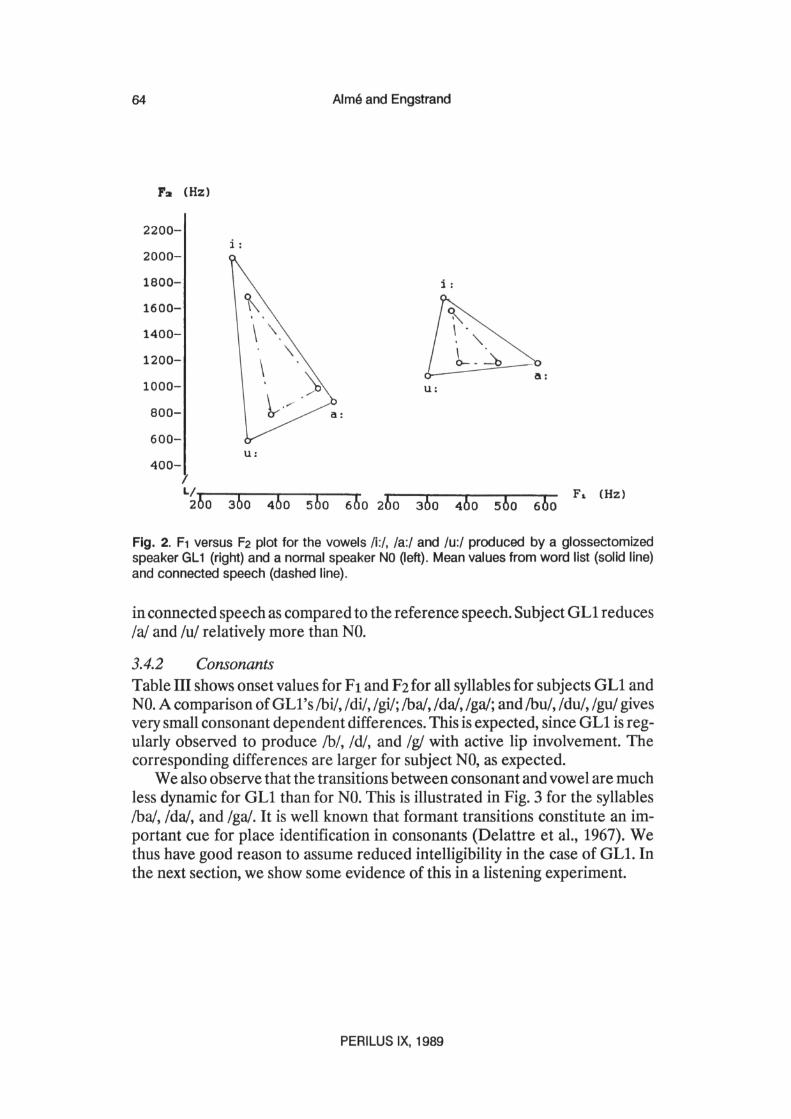

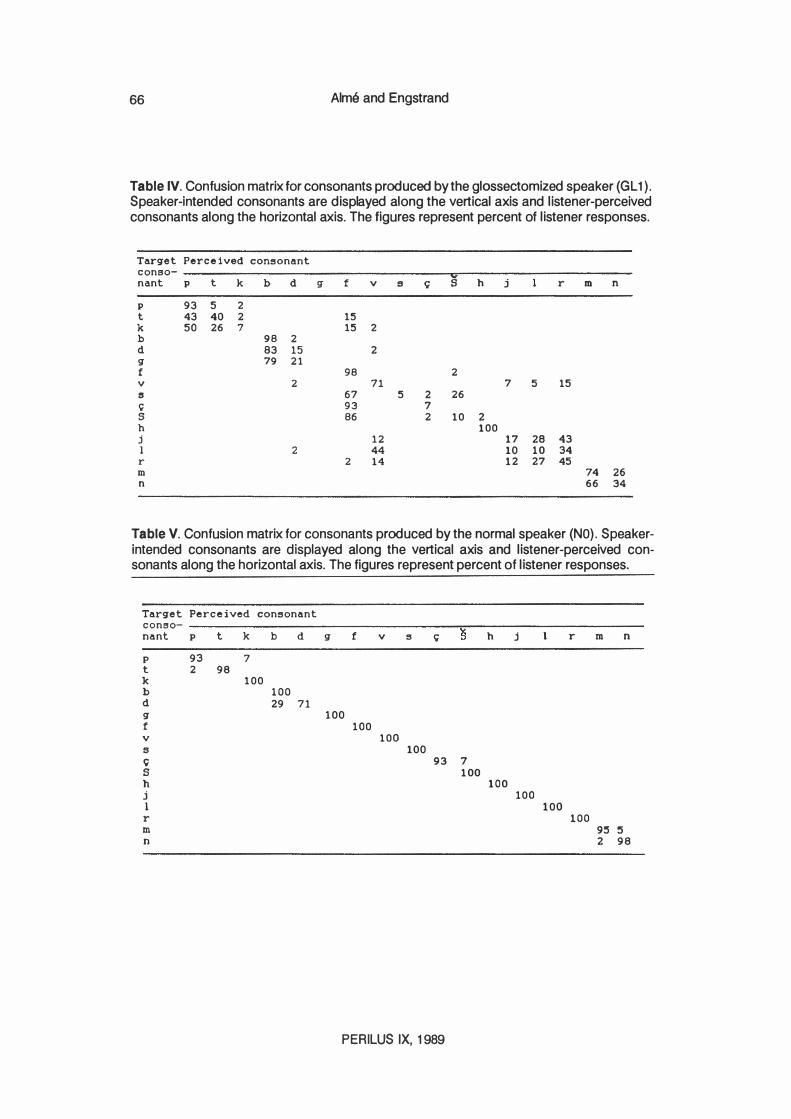
66 Alma and Engstrand
Table IV. Confusion matrix for consonants produced by the glossectomized speaker (GL 1) . Speaker-intended consonants are displayed along the vertical axis and l istener-perceived consonants along the horizontal axis. The figures represent percent of l istener responses.
Target Perceived consonant
conBO- y nant p t k b d g f v B c; S h j r m n
p 93 5 2
t 43 40 2 15
k 50 26 7 15 2
b 98 2
d 83 15 2
g 79 21
f 98 2
v 2 71 7 5 15
8 67 5 2 26
C 93 7 S 86 2 10 2
h 100
j 12 17 28 43
1 2 44 10 10 34 r 2 14 12 27 45
m 74 26 n 66 34
Table V. Confusion matrix for consonants produced by the normal speaker (NO) . Speakerintended consonants are displayed along the vertical axis and l istener-perceived consonants along the horizontal axis. The figures represent percent of l istener responses.
Target Perceived consonant
conso- ----------------------------------��---------------------
nant p t k b d g f v s C S h j
p 93 7 t 2 98
k 100
b 100 d 29 71 g
f v s C; S h j 1
r m n
100 100
100
100 93 7
100
PERILUS IX, 1989
100 100
100
r m n
100 95 5
2 98

Speech after glossectomy 67
3.4.3 Effects on intelligibility
The results of the intelligibility tests are given in terms of confusion matrices. The matrices in Tables IV (GL1) and V (NO) show the total response distribution in percent for the listener panel as a whole. Rows and columns stand for intended target phomemes and perceived sounds, respectively. By correct identification we mean identification of the target sounds.
We first consider data for the consonants. Clearly, the listener panel reacts very differently to the tasks of identifying GL1's and NO's consonants. There are two particularly clear effects in the data pertaining to GL1:
1. The non-lingual sounds, i.e. sounds which are not formed with the tongue as the active articulator, were usually correctly identified. For example, /p/ is correctly identified in 93% of cases; !hi is 100% correct.
2. The target consonants that would normally be formed with the tongue as the primary articulator tend to be heard as the corresponding labial sounds: the voiceless stops are heard as /p/ and the voiced ones as fbi; the voiceless fricatives, except !hi, are heard as If/; In! is heard as 1m! in most cases. We also note that /j/ tends to be heard as /r/, and that /r/ itself is often correctly identified (45%).
The dominating tendency thus seems to be to preserve manner of articulation but to confuse place. But it is also noticeable that target linguals are not heard as labial to the same extent as the target labials. For example, target /p/ is identified correctly in 93% of cases, whereas target /t! and!k/ are heard as /p/ in only 43% and 50% of cases, respectively. A similar pattern can be observed for fb d g! and /f s s/ and weakly for /g. There seems to be a signal difference here, that has to be specified by means of closer acoustic analysis.
When it comes to the vowels, we obtain a high proportion of correct identifications for GLl (see Table VI). This is, however, a very easy task (few vowels,
Table VI. Confusion matrix for the vowels Ii a ul produced by the glossectomized speaker GL 1, and the normal speaker NO. The figures repeat percent of listener responses.
Subj GL1 Perceived vowel Subj NO Perceived vowel
Target Target vowel a u vowel a u
i 98 100 a >99 <1 a 100 u 11 1 88 u 100
Linguistics, Stockholm
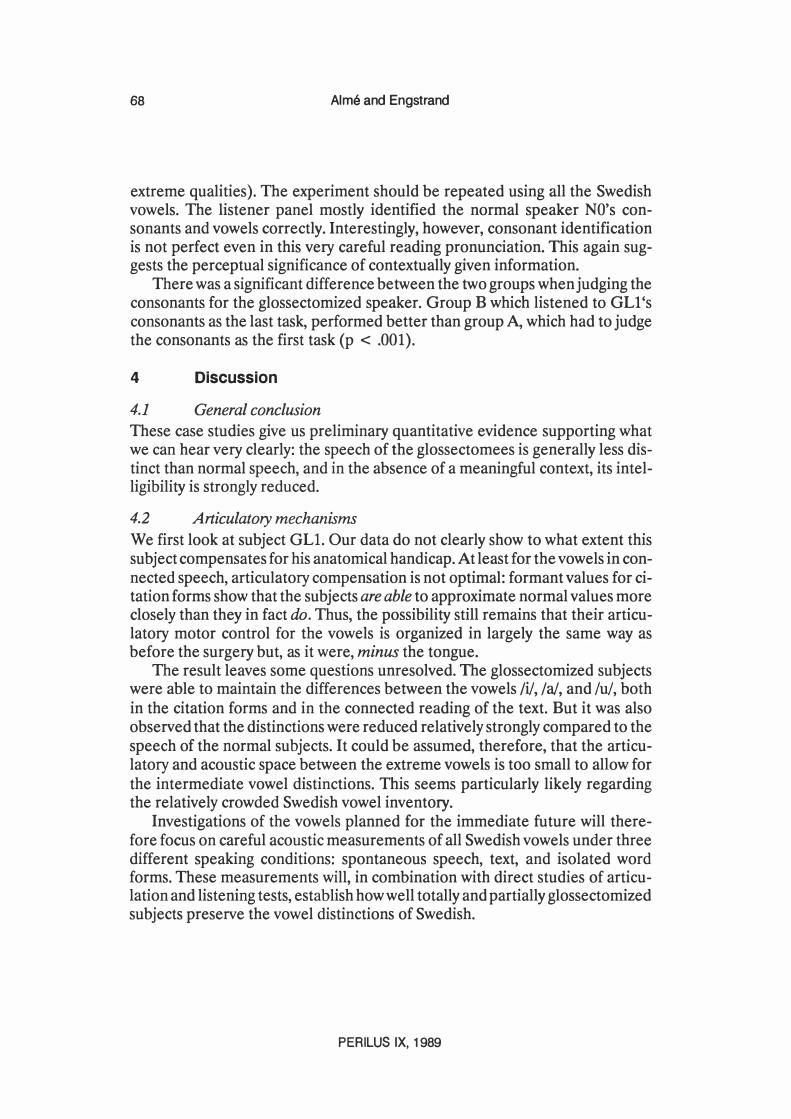
68 Alma and Engstrand
extreme qualities). The experiment should be repeated using all the Swedish vowels. The listener panel mostly identified the normal speaker NO's consonants and vowels correctly. Interestingly, however, consonant identification is not perfect even in this very careful reading pronunciation. This again suggests the perceptual significance of contextually given information.
There was a significant difference between the two groups when judging the consonants for the glossectomized speaker. Group B which listened to GLl's consonants as the last task, performed better than group A, which had to judge the consonants as the first task (p < .001).
4 Discussion
4.1 General conclusion
These case studies give us preliminary quantitative evidence supporting what we can hear very clearly: the speech of the glossectomees is generally less distinct than normal speech, and in the absence of a meaningful context, its intelligibility is strongly reduced.
4.2 Articulatory mechanisms
We first look at subject GLI. Our data do not clearly show to what extent this subject compensates for his anatomical handicap. At least for the vowels in connected speech, articulatory compensation is not optimal: formant values for citation forms show that the subjects are able to approximate normal values more closely than they in fact do. Thus, the possibility still remains that their articulatory motor control for the vowels is organized in largely the same way as before the surgery but, as it were, minus the tongue.
The result leaves some questions unresolved. The glossectomized subjects were able to maintain the differences between the vowels Iii, la!, and lui, both in the citation forms and in the connected reading of the text. But it was also observed that the distinctions were reduced relatively strongly compared to the speech of the normal subjects. It could be assumed, therefore, that the articulatory and acoustic space between the extreme vowels is too small to allow for the intermediate vowel distinctions. This seems particularly likely regarding the relatively crowded Swedish vowel inventory.
Investigations of the vowels planned for the immediate future will therefore focus on careful acoustic measurements of all Swedish vowels under three different speaking conditions: spontaneous speech, text, and isolated word forms. These measurements will, in combination with direct studies of articulation and listening tests, establish how well totally and partially glossectomized subjects preserve the vowel distinctions of Swedish.
PERILUS IX, 1989
Speech after glossectomy 69
The compensatory adjustments observed in this experiment were relatively coarse-grained ones. The only safe conclusion was that manner of articulaton tends to be preserved, and that lingual consonants are formed with the active involvement of the lips; the latter statement has been repeatedly confirmed, informally, by observing subject GL1 during conversations and recording sessions. However, in the listening test we also found perceptual evidence for a difference in GL1's target linguals and labials. To identify the acoustic and articulatory basis of this effect, careful acoustic analyses and direct articulatory measurements are necessary.
Observing speech movements and articulatory postures directly is an important part of our research program. The reason is that acoustic data give only indirect and sometimes ambiguous information on articulatory sound formation. To study in detail the way subjects solve the problem of approximating the sound patterns of normal speech, we need data from X-ray cinefilms, electropalatography, video recordings of the subject's face, electromagnetic movement recordings (Branderud, 1985; Alme & McAllister, 1987), and the corresponding articulatory motor command structure by means of electromyography.
4.3 Speech understanding
It is reasonable to assume that the intelligibility of the glossectomized speech is subject to the same general principles that have been shown for normal speech (see above, section 2). This means, among other things, that both signal and contextual variables are decisive (Skelly et aI., 1971, 1972; LaRiviere et aI., 1975). Our so-far informal observations of the two patients described in this report suggest that relatively good intelligibility can be obtained both in conversation and listening to a text read aloud. On the other hand, words without a meaningful context give rise to serious problems. It is therefore essential that investigations of speech understanding are designed in such a way that the role of the respective signal and context variables can be discerned as clearly as possible.
We do not know at present which role vowel timbres and consonant effects play in the intelligibility of glossectomized speech under various speaking and listening conditions. Studies of normal speech suggest that consonantal distinctions convey linguistic information more efficiently than vowel distinctions (Perkell, 1969). On the other hand, it is characteristic of glossectomized speech that most consonants, requiring precise and local constrictions in the vocal tract, are more problematic than vowels, which are based on more global shapings of the vocal tract. There is thus reason to assume that vowel timbres play a relatively greater role in the speech of radically glossectomized patients than in nor-
Linguistics, Stockholm

70 Alma and Engstrand
mal speech. It is our intention to apply available digital synthesis techniques to test this experimentally.
Acknowledgments We are grateful to the speech pathology students who participated in parts of the project work during the spring of 1988.
We also would like to thank our associates Magnus Lind, MD, and Jonas Karling, speech pathologist, at the Karolinska University Hospital, for fruitful and interesting discussions and collaboration.
This research was supported in part by The Swedish Cancer Society (RiksfOreningen mot cancer - Cancerfonden) under grant 2653-B89-01X, 89:358 and by The Swedish Council for Planning and Coordination of Research (Forskningsr�dsnamnden) under grant 880252:3, A 15-5/47.
PERILUS IX, 1989
Speech after glossectomy 71
References Alme, A-M. (1979), Studier av tal med gomplatta. (Studies of speech with an experimental palatal
prosthesis.) In: Karlsson, I. & Nord, L. (Eds.) : RappoTtfran fonetiksymposiet 1978, Department of Speech Communication, Royal Institute of Technology (KTH), Stockholm.
Alme, A-M. & Brente, K. (1979), Kompensatorisk artikulation vid tal med gomplatta. (Compensatory articulation in speech with an experimental palatal prosthesis.) Thesis in Logopedics, Spring 1979, Department of Logopedics and Phoniatrics, Huddinge University Hospital, Karolinska Institute, Stockholm.
Alme, A-M. & McAllister, R. (1987), Labial co-articulation in stutterers and normal speakers: a pilot study. In: H.F.M. Peters and W. Hulstijn (Eds.): Speech Motor Dynamics in Stuttering. Wien: Springer-Verlag, pp. 259-265.
Barry, W.1. & Timmermann, G. (1985), Mispronunciations and compensatory movements of tongue-operated patients. British Joumal of Disorders of Communication 20: 81-90.
Bloomer, H. (1971), Speech defects associated with dental mal-occlusions. In Travis, L.E. (ed.), Handbook of Speech Pathology and Audiology, Prentice-Hall Inc., Englewood Cliffs, New Jersey, 715-766.
Bradley, P .1., Hoover, L. & Stell, P.M. (1980), Assessment of articulation after surgery to the tongue. Folia Phoniatrica 32: 334-34l.
Branderud, P. (1985), MOVETRACK - A Movement Tracking System. Phonetic Experimental Research, Institute of Linguistics, University of Stockholm (PERIL US) IV: 20-29.
Brodnitz, F.S. (1960), Speech after glossectomy, Curro Prob. Phoniat. Logo. 1: 68-72.
Delattre, P., Lieberman, A, & Cooper, F. (1%7) Acoustic loci and transitional cues for consonants. In Lehiste, I. (ed.) : Readings in Acoustic Phonetics.
Engstrand, O. (1988), Articulatory correlates of stress and speaking rate in Swedish VCV utterances.J.Acoust. Soc. Am 83: 1863-1875.
Engstrand, O. & Alme, A-M. (1988), Talforiindringar efter glossektomi (Speech after glossectomy) . Project program, Institute of Linguistics, University of Stockholm.
Engstrand, O. & Krull, D. (1988a), On the systematicity of phonetic variation in spontaneous speech. Phonetic Experimental Research, Institute of Linguistics, University of Stockholm (PERILUS) VIII: 34-47.
Engstrand, o. & Krull, D. (1988b), Discontinuous variation in spontaneous speech. Phonetic Experimental Research, Institute of Linguistics, University of Stockholm (PERIL US) VIII: 48-53.
Fletcher, S. (1988), Speech production following partial glossectomy. J. Speech Hear. Disorders 53: 232-238.
Gay, T., Lindblom, B. & Lubker, J. (1981), Production of bite-block vowels: Acoustic equivalence by selective compensation, J. Acoust. Soc. Am. 69 (3) : 802-810.
Georgian, D.A, Logeman, J.A & Fisher, H.B. (1982). Compensatory articulation patterns of a surgically treated oral cancer patient. J. Speech Hear. Disorders 47: 154-159.
LaRiviere, C., Seilo, M.T., & Dimmick, K.C. (1975), Report on the speech intelligibility of a glossectomee: perceptual and acoustical observations, Folia Phoniatrica 27: 201-214.
Leonard, R. & Gillis, R. (1982) . Effects of a prosthetic tongue on vowel intelligibility and food management in a patient with total glossectomy. J. Speech Hear. Disorders 47: 25-30.
Lindblom, B. & Sundberg, J. (1971), Acoustical consequences of lip, tongue, jaw and larynx movement. J. Acoust. Soc. Am. 50: 1166-1179.
Linguistics, Stockholm
72 Alma and Engstrand
Lindblom, B., Lubker, J. & Gay, T. (1979), Formant frequencies of some fIXed-mandible vowels and a model of speech motor programming by predictive simulation. Journal of Phonetics 7: 147-161.
Lindblom, B. (1987) Adaptive variability and absolute constancy in speech signals: two themes in the quest for phonetic invariance. Phonetic Experimental Research, Institute of Linguistics, University of Stockholm (PERIL US) V: 2-20. (Also in: Proceedings of the XIth ICPhS, Tallinn, Estonia, Aug. 1-7, 1987, Vol. 3, pp. 9-18) .
Massengill, R, Maxwell, S. & Pickrell, K. (1970), An analysis of articulation following partial and total glossectomy, J. Speech Hear. Disorders 35: 170-173.
Morrish, L. (1984), Plosive articulations of the glossectomee and some acoustic correlates. Working Papers in Linguistics and Phonetics 2, University of Leeds.
Morrish, E. (1988), Compensatory articulation in a subject with total glossectomy. British Journal of Disorders of Communication 23: 13-22.
Perkell, J. (1969), Physiology of speech production: Results and implications of a quantitative cineradiographic study. Cambridge, Mass.: MIT Press.
Pruszewicz, A. & Kruk-Zagajewska, A. (1984), Phoniatric disturbances in patients after partial tongue resection for malignant neoplasms. Folia Phoniatrica, 36: 84-92.
Skelly, M., Spector, D., Donaldson, R., Brodeur, A. & Paletta, F. (1971), Compensatory physiologic phonetics for the glossectomee, l. Speech Hear. Disorders 36: 101-114.
Skelly, M., Donaldson, R, Fust, R & Townsend, D. (1972),Changes in phonatory aspects of glossectomee intelligibility through vocal parameter manipulation,!. Speech Hear. Disorders 37: 379-389.
Teichgraeber,J., Bowman, J.& Goepfert, H. (1985), New testseries for the functional evaluation of oral cavity cancer, Head Neck Surgery 8: 9-20.
Teichgraeber, J., Bowman, J. & Goepfert, H. (1986), Functional analysis of treatment of oral cavity cancer, Arch Otolaryngol Head Neck Surg 112: 959-965.
Traunmiiller, H. (1988), Paralinguistic variation and invariance in the characteristic frequencies of vowels. Phonetic Experimental Research, Institute of Linguistics, University of Stockholm (PERILUS) VIII: 54-92.
Van Thal, J. (1966), Speech pathology in Great Britain; in Rieber and Brubaker Speech pathology: an international study of the science, North-Holland, Amsterdam.
PERILUS IX, 1989

Speech after glossectomy .
Appendix
A. CV:C SYLLABLES
/Ci:l/ /Ca:l/ /Cu:l/ 1. pi:l 2. ti:l 3. ki:l 4. bi:l 5. di:l 6. gi:l 7. fi:l 8. vi:l 9. si:l
10. �i:l 11. si:l 12. hi:l 13. ji:l 14. li:l 15. ri:l 16. mi:l 17. ni:l
18. pa:l 19. ta:l 20. ka:l 21. ba:l 22. da:l 23. ga:l 24. fa:l 25. va:l 25. sa:l 26. �a:l 27. sa:l 28. ha:l 29. ja:1 30. la:1 31. ra:l 32. ma:l 33. na:l
35. pu:l 36. tu:l 37. ku:l 38. bu:l 39. du:l 40. gu:l 41. fu:l 42. vu:l 43. su:l 44. �:1 45. su:l 46. hu:l 47. ju:l 48. lu:1 49. ru:l 50. mu:l 51. nu:l
73
s = [�] which is a voiceless retroflex fricative or [ 6] , which is a voiceless palatal fricative, slightly rounded. There is a large variation in the pronunciation of the latter sound. This variation could be inter- and intraindividual.
B. READING PASSAGES
1. Nordanvinden och solen (The north wind and the sun)
N ordanvinden och solen tvistade en gang om vern av dem som var starkast. J list dd kom en vandrare vagen fOrbi insvept i en varm kappa. De kom dd overens om att den som fOrst kunde fd vandraren att ta av sig kappan, han skulle anses vara starkare an den andra.
Dd bldste nordanvinden sa hart han ndgonsin kunde, men ju hdrdare han bldste desto tatare svepte vandraren kappan om sig, och till sist gay nordanvinden upp forsoket.
Dd lat solen sina strIDar skina helt varmt och genast tog vandraren av sig kappan, oeh sd var nordanvinden tvungen att medge att solen var den starkaste av dem tvd.
Linguistics. Stockholm

74 Alma and Engstrand
2. Ett svart fall (A difficult case)
En pojke kom en dag inspringande pa en bondgard och undrade om han kunde fa lana en spade. Nar bonden fragade vad han skulle ha den till, svarade pojken att hans bror hade ramlat i ett trask och att han maste grava upp honom.
"Hur djupt har han ramlat i" fragade bonden. "Upp till vristema" blev svaret. "Men da kan han val ga darifran utan din hjalp. Da behover du val ingen spade?" Pojken sag fOrtvivlad ut och och sade: "Jo, men ni fOrstar, han ramlade i med huvudet fOrst".
3. Engelsk keramik (English ceramics)
Engelsk keramik gar ofta forvanansvart daligt pa auktioner. Ryskt, finskt, tyskt och danskt tycks bara stiga i pris, medan engelsk keramik inte har samma intresse.
Anda har vi i Sverige stark anknytning till just engelsk keramik: pa 1800-talet importerade manga svenska fOretag de eftertraktade engelska leroma, engelska verkmastare och gravorer anstalldes och tillverkningen vid saval Rorstrand som Gustavsberg var pafallande orienterad mot England.
PERILUS IX, 1 989