university of southern california · 13 actuarial liability for annuities payable 124,277 146,598...
TRANSCRIPT

University of Southern California Report on Audit of the Consolidated Financial
Statements and on Federal Awards Programs in
Accordance with the OMB Uniform Guidance
For the Year Ended June 30, 2017
Location EIN
University Park, Los Angeles 95-1642394

University of Southern California Table of Contents
Year Ended June 30, 2017
Page(s)
Report of Independent Auditors on the Consolidated Financial Statements and
Supplementary Schedule of Expenditures of Federal Awards ..................................................................... 1-2
Consolidated Financial Statements ............................................................................................................ 3-34
Schedule of Expenditures of Federal Awards ........................................................................................... 35-62
Notes to Schedule of Expenditures of Federal Awards ............................................................................ 63-67
Report of Independent Auditors on Internal Control
Over Financial Reporting and on Compliance and
Other Matters Based on an Audit of Financial Statements
Performed in Accordance with Government Auditing Standards .......................................................... 68-69
Report of Independent Auditors on Compliance with Requirements
That Could Have a Direct and Material Effect on Each Major Program and
on Internal Control over Compliance in Accordance with the OMB Uniform Guidance ......................... 70-71
Schedule of Findings and Questioned Costs ............................................................................................ 72-74
Summary Schedule of Prior Audit Findings .................................................................................................. 75
Management’s Views and Corrective Action Plan .......................................................................................... 76

Report of Independent Auditors
To the Board of Trustees of the
University of Southern California
Report on the Consolidated Financial Statements
We have audited the accompanying consolidated financial statements of the University of Southern
California (“The University”) and its subsidiaries, which comprise the consolidated balance sheets as of
June 30, 2017 and 2016, and the related consolidated statements of activities and cash flows for the years
then ended, and the related notes to the financial statements.
Management’s Responsibility for the Consolidated Financial Statements
Management is responsible for the preparation and fair presentation of the consolidated financial
statements in accordance with accounting principles generally accepted in the United States of America;
this includes the design, implementation, and maintenance of internal control relevant to the preparation
and fair presentation of consolidated financial statements that are free from material misstatement,
whether due to fraud or error.
Auditors' Responsibility
Our responsibility is to express an opinion on the consolidated financial statements based on our audits.
We conducted our audits in accordance with auditing standards generally accepted in the United States of
America and the standards applicable to financial audits contained in Government Auditing Standards,
issued by the Comptroller General of the United States. Those standards require that we plan and perform
the audit to obtain reasonable assurance about whether the consolidated financial statements are free
from material misstatement.
An audit involves performing procedures to obtain audit evidence about the amounts and disclosures in
the consolidated financial statements. The procedures selected depend on our judgment, including the
assessment of the risks of material misstatement of the consolidated financial statements, whether due to
fraud or error. In making those risk assessments, we consider internal control relevant to the University's
preparation and fair presentation of the consolidated financial statements in order to design audit
procedures that are appropriate in the circumstances, but not for the purpose of expressing an opinion on
the effectiveness of the University's internal control. Accordingly, we express no such opinion. An audit
also includes evaluating the appropriateness of accounting policies used and the reasonableness of
significant accounting estimates made by management, as well as evaluating the overall presentation of
the consolidated financial statements. We believe that the audit evidence we have obtained is sufficient
and appropriate to provide a basis for our audit opinion.
Opinion
In our opinion, the consolidated financial statements referred to above present fairly, in all material
respects, the financial position of the University of Southern California and its subsidiaries as of June 30,
2017 and 2016, and the changes in their net assets and their cash flows for the years then ended in
accordance with accounting principles generally accepted in the United States of America.
PricewaterhouseCoopers LLP, 601 South Figueroa, Los Angeles, CA 90017 T: (213) 356 6000, F: (813) 637 4444, www.pwc.com/us

2
Other Matters
Other Information
Our audit was conducted for the purpose of forming an opinion on the consolidated financial statements
as a whole. The accompanying schedule of expenditures of federal awards for the year ended June 30,
2017 is presented for purposes of additional analysis as required by Title 2 U.S. Code of Federal
Regulations Part 200, Uniform Administrative Requirements, Cost Principles, and Audit Requirements
for Federal Awards (Uniform Guidance) and is not a required part of the consolidated financial
statements. Such information is the responsibility of management and was derived from and relates
directly to the underlying accounting and other records used to prepare the consolidated financial
statements. The information has been subjected to the auditing procedures applied in the audit of the
consolidated financial statements and certain additional procedures, including comparing and reconciling
such information directly to the underlying accounting and other records used to prepare the consolidated
financial statements or to the consolidated financial statements themselves, and other additional
procedures in accordance with auditing standards generally accepted in the United States of America. In
our opinion, the schedule of expenditures of federal awards is fairly stated, in all material respects, in
relation to the consolidated financial statements as a whole.
Other Reporting Required by Government Auditing Standards
In accordance with Government Auditing Standards, we have also issued our report dated October 12,
2017 on our consideration of the University’s internal control over financial reporting and on our tests of
its compliance with certain provisions of laws, regulations, contracts and grant agreements and other
matters for the year ended June 30, 2017. The purpose of that report is solely to describe the scope of our
testing of internal control over financial reporting and compliance and the results of that testing and not to
provide an opinion on the effectiveness of internal control over financial reporting or on compliance. That
report is an integral part of an audit performed in accordance with Government Auditing Standards in
considering the University's internal control over financial reporting and compliance.
Emphasis of Matter
As discussed in Note 1 to the consolidated financial statements, the University has changed the manner in which it presents net assets and reports certain aspects of its financial statements as a not-for-profit entity in 2017. Our opinion is not modified with respect to this matter.
October 12, 2017

University of Southern California 3 2017 Financial Report |
Consolidated Balance Sheets in thousands
June 30, June 30,Assets 2017 2016
1 Cash and cash equivalents $783,505 $356,881 2 Accounts receivable, net 406,630 383,714 3 Notes receivable, net 72,950 75,648 4 Pledges receivable, net 628,633 663,803 5 Investments 5,770,926 5,315,745 6 Inventories, prepaid expenses and other assets 288,969 256,489 7 Property, plant and equipment, net 4,009,596 3,582,465 8 Total Assets $11,961,209 $10,634,745
Liabilities9 Accounts payable $308,480 $299,975 10 Accrued liabilities 564,341 552,844 11 Refundable advances 18,190 19,853 12 Deposits and deferred revenue 246,641 200,625 13 Actuarial liability for annuities payable 124,277 146,598 14 Federal student loan funds 65,649 68,871 15 Asset retirement obligations 121,085 115,828 16 Capital lease obligations 72,606 126,995 17 Bonds and notes payable 1,656,279 1,216,588 18 Other liabilities 3,443 4,146 19 Total Liabilities 3,180,991 2,752,323
Net Assets20 Without donor restrictions 4,151,215 3,699,268 21 With donor restrictions 4,629,003 4,183,154 22 Total Net Assets 8,780,218 7,882,422
23 Total Liabilities and Net Assets $11,961,209 $10,634,745
The accompanying notes are an integral part of this statement.
University of Southern California 4 2017 Financial Report |
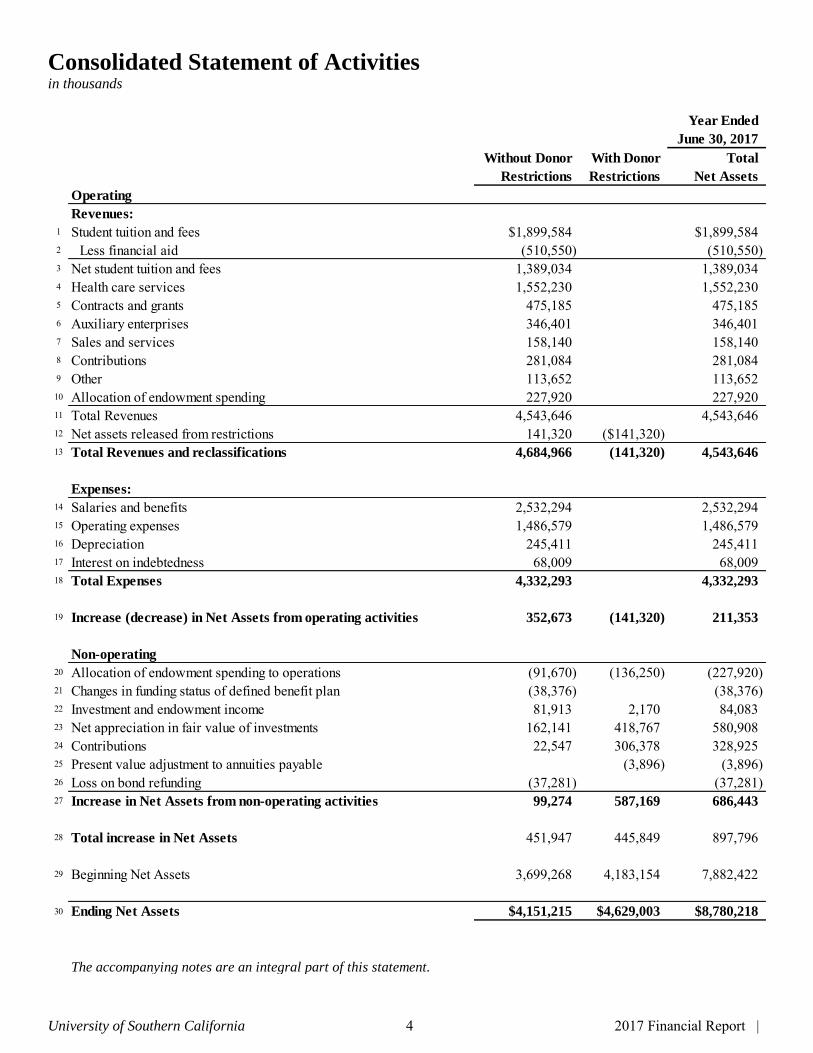
Consolidated Statement of Activities in thousands
Year Ended
June 30, 2017
Without Donor With Donor Total
Restrictions Restrictions Net Assets
Operating
Revenues:
1 Student tuition and fees $1,899,584 $1,899,5842 Less financial aid (510,550) (510,550) 3 Net student tuition and fees 1,389,034 1,389,034 4 Health care services 1,552,230 1,552,230 5 Contracts and grants 475,185 475,185 6 Auxiliary enterprises 346,401 346,401 7 Sales and services 158,140 158,140 8 Contributions 281,084 281,084 9 Other 113,652 113,652 10 Allocation of endowment spending 227,920 227,920 11 Total Revenues 4,543,646 4,543,646 12 Net assets released from restrictions 141,320 ($141,320) 13 Total Revenues and reclassifications 4,684,966 (141,320) 4,543,646
Expenses:
14 Salaries and benefits 2,532,294 2,532,294 15 Operating expenses 1,486,579 1,486,579 16 Depreciation 245,411 245,411 17 Interest on indebtedness 68,009 68,009 18 Total Expenses 4,332,293 4,332,293
19 Increase (decrease) in Net Assets from operating activities 352,673 (141,320) 211,353
Non-operating
20 Allocation of endowment spending to operations (91,670) (136,250) (227,920) 21 Changes in funding status of defined benefit plan (38,376) (38,376) 22 Investment and endowment income 81,913 2,170 84,083 23 Net appreciation in fair value of investments 162,141 418,767 580,908 24 Contributions 22,547 306,378 328,925 25 Present value adjustment to annuities payable (3,896) (3,896) 26 Loss on bond refunding (37,281) (37,281) 27 Increase in Net Assets from non-operating activities 99,274 587,169 686,443
28 Total increase in Net Assets 451,947 445,849 897,796
29 Beginning Net Assets 3,699,268 4,183,154 7,882,422
30 Ending Net Assets $4,151,215 $4,629,003 $8,780,218
The accompanying notes are an integral part of this statement.

University of Southern California 5 2017 Financial Report |
Consolidated Statement of Activities in thousands
Year Ended
June 30, 2016
Without Donor With Donor Total
Restrictions Restrictions Net Assets
Operating
Revenues:
1 Student tuition and fees $1,793,219 $1,793,2192 Less financial aid (483,068) (483,068) 3 Net student tuition and fees 1,310,151 1,310,151 4 Health care services 1,467,336 1,467,336 5 Contracts and grants 434,746 434,746 6 Auxiliary enterprises 318,525 318,525 7 Sales and services 133,901 133,901 8 Contributions 329,449 329,449 9 Other 118,368 118,368 10 Allocation of endowment spending 207,535 207,535 11 Total revenues 4,320,011 4,320,011 12 Net Assets released from restrictions 112,652 ($112,652) 13 Total Revenues and reclassifications 4,432,663 (112,652) 4,320,011
Expenses:
14 Salaries and benefits 2,465,390 2,465,390 15 Operating expenses 1,404,393 1,404,393 16 Depreciation 208,069 208,069 17 Interest on indebtedness 73,975 73,975 18 Total Expenses 4,151,827 4,151,827
19 Increase (decrease) in Net Assets from operating activities 280,836 (112,652) 168,184
Non-operating
20 Allocation of endowment spending to operations (82,372) (125,163) (207,535) 21 Changes in funding status of defined benefit plan (27,552) (27,552) 22 Investment and endowment income 63,413 917 64,330 23 Net depreciation in fair value of investments (38,206) (86,534) (124,740) 24 Contributions 20,263 255,234 275,497 25 Present value adjustment to annuities payable 9,291 9,291 26 (Decrease) increase in Net Assets from non-operating activities (64,454) 53,745 (10,709)
27 Total increase (decrease) in Net Assets 216,382 (58,907) 157,475
28 Beginning Net Assets 3,482,886 4,242,061 7,724,947
29 Ending Net Assets $3,699,268 $4,183,154 $7,882,422
The accompanying notes are an integral part of this statement.

University of Southern California 6 2017 Financial Report |
Consolidated Statements of Cash Flows in thousands
Year Ended Year Ended
Cash Flows from Operating Activities June 30, 2017 June 30, 2016
1 Change in Net Assets $897,796 $157,475
Adjustments to reconcile change in net assets to net cash provided by operating activities:2 Depreciation and amortization 245,411 208,069 3 Loss an the disposal/sale of plant assets 6,560 1,128 4 In-kind receipt of property, plant and equipment (3,205) (2,825) 5 Maturities and present value adjustment to annuities payable 3,685 (7,486) 6 Increase in accounts receivable (22,916) (20,175) 7 Increase in pledges receivable (82,942) (222,392) 8 (Decrease) increase in inventories, prepaid expenses and other assets (10,848) 18,744 9 Increase (decrease) in accounts payable 28,391 (6,775) 10 (Decrease) increase in accrued liabilities (44,529) 40,370 11 (Decrease) increase in refundable advances (1,663) 1,300 12 Increase in deposits and deferred revenue 46,016 30,361 13 (Decrease) increase in other liabilities (703) 198 14 Contributions restricted for property, plant and equipment and permanent investment (244,298) (194,947) 15 Net realized gain on sale of investments (128,978) (166,740) 16 Net unrealized (appreciation) depreciation in investments (452,088) 291,695 17 Net cash provided by operating activities 235,689 128,000
Cash Flows from Investing Activities
18 Proceeds from note collections 14,584 14,941 19 Notes issued (11,436) (8,531) 20 Proceeds from sale and maturity of investments 5,476,450 4,860,425 21 Purchase of investments (5,327,902) (4,753,532) 22 Purchase of property, plant and equipment (690,526) (660,370) 23 Net cash used in investing activities (538,830) (547,067)
Cash Flows from Financing Activities
Contributions restricted for permanent investment:24 Endowment 244,180 272,399 25 Plant 117,402 128,419 26 Trusts and other 830 1,338 27 Repayments of capital lease obligation (54,389) 28 Repayment of long-term debt (673,930) (34,932) 29 Proceeds from issuance of long-term debt 1,124,900 35,467 30 (Decrease) increase in federal student loan funds (3,222) 676 31 Investment (loss) gain on annuities payable (17,414) 10,163 32 Payment on annuities payable (11,269) (13,939) 33 Increase to annuities payable resulting from new contributions 2,677 5,397 34 Net cash provided by financing activities 729,765 404,988
35 Net increase (decrease) in cash and cash equivalents 426,624 (14,079) 36 Cash and cash equivalents at beginning of year 356,881 370,960 37 Cash and cash equivalents at end of year $783,505 $356,881
The accompanying notes are an integral part of this statement.

Notes to Consolidated Financial Statements
University of Southern California 7 2017 Financial Report |
Note 1.
Significant accounting policies followed by the University of Southern California are set forth below:
General:
The University of Southern California (the “university”) is a not-for-profit, major private research university. The university is generally exempt from federal income taxes under the provisions of Internal Revenue Code Section 501(c) (3). The university is also generally exempt from payment of California state income, gift, estate and inheritance taxes.
Basis of Presentation:
The consolidated financial statements have been prepared on the accrual basis of accounting, in accordance with accounting principles generally accepted in the United States of America and with the provisions of the Financial Accounting Standards Board (FASB) Accounting Standards Codification (ASC) 958, Not-for-Profit Entities, which requires the university to classify its net assets into two categories according to donor-imposed restrictions: net assets without donor imposed restrictions and net assets with donor imposed restrictions. All material transactions between the university and its subsidiaries have been eliminated.
Net assets without and with donor restrictions:
Net assets without donor restrictions are the part of net assets of a not-for-profit entity that are not subject to donor-imposed restrictions. A donor-imposed restriction is a donor stipulation that specifies a use for a contributed asset that is more specific than broad limits resulting from the following: a) the nature of the not-for-profit entity b) the environment in which it operates c) the purposes specified in its articles of incorporation or bylaws or comparable documents. This classification includes all revenues, gains, and expenses not restricted by donors. The university reports all expenditures in this class of net assets, since the use of restricted contributions in accordance with donors’ stipulations results in the release of the restriction. The part of net assets of a not-for-profit entity that is subject to donor-imposed restrictions includes contributions for which donor imposed restrictions have not been met (primarily future capital projects), endowment appreciation, charitable remainder unitrusts, pooled income funds, gift annuities and pledges receivable which are included in with donor restrictions net assets.
Measure of Operations:
The university's measure of operations as presented in the consolidated statements of activities includes revenue from tuition (net of certain scholarships and fellowships) and fees, grants and contracts, health care services, contributions for operating programs, the allocation of endowment spending for operations and other revenues. Operating expenses are reported on the consolidated statement of activities by natural classification.

Notes to Consolidated Financial Statements
University of Southern California 8 2017 Financial Report |
The university’s non-operating activity within the consolidated statement of activities includes, investment returns and other activities related to endowment, long-term benefit plan obligation funding changes, student loan net assets and contributions related to land, buildings and equipment that are not part of the university's operating activities.
Other accounting policies:
Cash equivalents consist of highly liquid investments with original maturities of three months or less. The university has classified all cash and cash equivalents as Level I financial instruments.
Investments are stated at fair value. Net appreciation (depreciation) in the fair value of investments, which consists of the realized gains or losses and the unrealized appreciation (depreciation) on those investments, is shown in the consolidated statements of activities. Realized gains and losses upon the sale of investments are calculated using the specific identification method and trade date.
Alternative investment holdings and certain other limited partnership interests are invested in both publicly traded and privately owned securities. The fair values of private investments are based on estimates and assumptions of the general partners or partnership valuation committees in the absence of readily determinable market values. Such valuations generally reflect discounts for illiquidity and consider variables such as financial performance of investments, recent sales prices of investments and other pertinent information. The university applies the provision of FASB ASC 820, Fair Value Measurements, which defines fair value as the exchange price that would be received for an asset or paid to transfer a liability (an exit price) in the principal or most advantageous market for the asset or liability in an orderly transaction between market participants on the measurement date. The following describes the hierarchy of inputs used to measure fair value and the primary valuation methodologies used by the university for financial instruments measured at fair value on a recurring basis. The three levels of inputs are as follows:
Level I - Quoted prices in active markets for identical assets or liabilities.
Level II - Inputs other than Level I that are observable, either directly or indirectly, such as quoted prices for similar assets or liabilities; quoted prices in markets that are not active; or other inputs that are observable or can be corroborated by observable market data for substantially the same term of the assets or liabilities.
Level III - Unobservable inputs that are supported by little or no market activity and that are significant to the fair value of the assets or liabilities. Level III investments are valued by the university based upon valuation information received from the relevant entity which may include last trade information, third-party appraisals of real estate, or valuations prepared by custodians for assets held in trusts by other trustees where the university is named as a beneficiary. The university may also utilize industry standard valuation techniques, including discounted cash flow models. Significant increases or decreases in these inputs in isolation may result in a significantly lower or higher fair value measurement, respectively.

Notes to Consolidated Financial Statements
University of Southern California 9 2017 Financial Report |
A financial instrument’s categorization within the valuation hierarchy is based upon the lowest level of input that is significant to the fair value measurement. The university applies the authoritative guidance contained in FASB ASC 820-10, Fair Value
Measurements and Disclosures, for estimating the fair value of investments in investment funds that have calculated Net Asset Value (NAV) per share in accordance with FASB ASC 946-10, Financial Services-Investment Companies (formerly the American Institute of Certified Public Accountants Audit and Accounting Guide, Investment Companies). According to this guidance, in circumstances in which NAV per share of an investment is not determinative of fair value, a reporting entity is permitted, to estimate the fair value of an investment in an investment fund using the NAV per share of the investment (or its equivalent) without further adjustment, if the NAV per share of the investment is determined in accordance with FASB ASC 946-10 as of the reporting entity’s measurement date. Accordingly, the university uses the NAV as reported by the money managers as a practical expedient, to determine the fair value of investments in investment funds which (a) do not have a readily determinable fair value and (b) either have the attributes of an investment fund or prepare their financial statements consistent with the measurement principles of an investment fund. At June 30, 2017 and 2016, the fair value of all such investments in investment funds has been determined by using NAV as a practical expedient. Inventories are valued at the lower of cost (first-in, first-out) or market.
Property, plant and equipment, including collections of works of art and historical treasures, are stated at cost or fair value at the date of contribution, plus the estimated value of any associated legal retirement obligations, less accumulated depreciation, computed on a straight-line basis over the estimated useful or component lives of the assets (equipment and library books useful lives ranging from 4 to 10 years and buildings component lives ranging from 5 to 50 years). Equipment is removed from the records at the time of disposal. The university follows the policy of recording contributions of long-lived assets directly in invested in plant assets when the purpose or time restriction is met instead of recognizing the contribution over the useful life of the asset. The university’s split interest agreements with donors consist primarily of gift annuities, unitrusts, pooled income funds and life estates. For irrevocable agreements, assets contributed are included in the university’s investments and stated at fair value. Contribution revenue is recognized at the date each trust is established after recording liabilities for the actuarially-determined present value of the estimated future payments to be made to the beneficiaries. The actuarial liability is discounted at an appropriate risk-adjusted rate at the inception of each agreement and the applicable actuarial mortality tables. Discount rates on split-interest agreements range from 2.7% to 9.5%. The liabilities are adjusted during the terms of the trusts for changes in the fair value of the assets, accretion of discounts, and other changes in the estimates of future benefits. The valuation follows generally accepted actuarial methods and is based on the requirements of FASB ASC 958. Included in the university’s assets held by other trustees are split interest agreements. The 2012 Individual Annuity Mortality Basic Table (without margin) for Males and Females with Projection Scale G2 for Males and Females were used in the valuations. For split interest agreements related to the State of Washington, the university holds a Certificate of Exemption issued by the State of Washington's Office of Insurance Commissioner to issue charitable gift annuities. The university has been in compliance with Revised Code of Washington 48.38.010(6) throughout the time period covered by the financial statements.

Notes to Consolidated Financial Statements
University of Southern California 10 2017 Financial Report |
The university has recorded conditional asset retirement obligations associated with the legally required removal and disposal of certain hazardous materials, primarily asbestos, present in its facilities. When an asset retirement obligation is identified, the university records the fair value of the obligation as a liability. The fair value of the obligation is also capitalized as property, plant and equipment and then amortized over the estimated remaining useful life of the associated asset. The fair value of the conditional asset retirement obligations is estimated using a probability weighted, discounted cash flow model. The present value of future estimated cash flows is calculated using the credit adjusted, interest rate applicable to the university in order to determine the fair value of the conditional asset retirement obligations. For the years ended June 30, 2017 and 2016, the university recognized accretion expense related to the conditional asset retirement obligations of approximately $5,973,000 and $5,745,000, respectively. For the years ended June 30, 2017 and 2016, the university settled asset retirement obligations of approximately $800,000 and $1,240,000, respectively. As of June 30, 2017 and 2016, included in the consolidated balance sheets are asset retirement obligations of $121,085,000 and $115,828,000, respectively.
Student tuition and fees are recorded as revenues during the year the related academic services are rendered. Student tuition and fees received in advance of services to be rendered are recorded as deferred revenue. Sponsored research agreements recognize contracts and grants revenue as it is earned through expenditure in accordance with the agreement. Any funding received in advance of expenditure is recorded as a refundable advance. Departmental net assets include contributions to the university and its various schools and departments. The university has determined that any donor-imposed restrictions of contributions for current or developing programs and activities are generally met within the operating cycle of the university and, therefore, the university’s policy is to record these net assets as without donor restrictions. Internally designated net assets are those which have been appropriated by the Board of Trustees or designated by management. The university receives federal reimbursement for a portion of the costs of its facilities and equipment used in organized sponsored research. The federal Office of Management and Budget establishes principles for determining such reimbursable costs and requires conformity of the lives and methods used for federal cost reimbursement accounting and financial reporting purposes. The university’s policies and procedures are in conformity with these principles. Contributions from donors, including contributions receivable (unconditional promises to give), are recorded as revenues in the year received. Non-cash contributions are valued using quoted market prices, market prices for similar assets, independent appraisals or appraisals performed by university management. Contributions receivable are reported at their discounted value using credit-adjusted borrowing rates and an allowance for amounts estimated to be uncollectible is provided. Donor-restricted contributions, which are received and either spent, or deemed spent, within the same year, are reported as revenue without donor restrictions. Contributions of long-lived assets with no donor-imposed time restrictions are reported as without donor restrictions revenue in the year received. Contributions restricted to the acquisition or construction of long-lived assets or subject to other time or purpose restrictions are reported as with donor restrictions revenue. The donor restricted net assets resulting from these contributions are released to without donor restricted net assets when the donor-imposed restrictions are fulfilled or the assets are placed in service. Contributions received for endowment investment are held in perpetuity and recorded as with donor restrictions revenue.

Notes to Consolidated Financial Statements
University of Southern California 11 2017 Financial Report |
Health care services revenues include the net patient service revenues associated with Keck Hospital of USC, USC Norris Cancer Hospital, USC Verdugo Hills Hospital and USC Care Medical Group, Inc. Net patient service revenue is reported as estimated net realizable amounts from patients, third party payors, government programs and others in the period in which services are provided. The majority of the health care services are rendered to patients with commercial or managed care insurance, or under the federal Medicare and California State Medi-Cal programs. Reimbursement from these various payors is based on a combination of prospectively determined rates, discounts from charges and historical costs. Amounts received under the Medicare program are subject to retroactive settlements based on review and final determination by program intermediaries or their agents. Provisions for contractual adjustments and retroactive settlements related to those payors are accrued on an estimated basis in the period the related services are rendered and adjusted in future periods as additional information becomes known or as final settlements are determined. Health care services revenues also include the revenues associated with the professional services agreement with the County of Los Angeles.
Allowance for doubtful accounts is based upon management’s assessment of historical and expected net collections considering historical business and economic conditions. Periodically throughout the year, management assesses the adequacy of the allowance for doubtful accounts based upon historical write-off experience. The results of this review are then used to make any modifications to the allowance for doubtful accounts. The preparation of financial statements in conformity with accounting principles generally accepted in the United States of America requires management to make estimates and assumptions that affect the reported amounts of assets and liabilities and disclosure of contingent assets and liabilities at the date of the financial statements and the reported amounts of revenues and expenses during the reporting period. Actual results could differ from these estimates. Certain reclassifications have been made to prior years’ financial statements for comparative purposes.
Recent Accounting Pronouncements:
In May 2014, the FASB issued Accounting Standards Update (ASU) 2014-09, Revenue from Contracts
with Customers. ASU 2014-09 outlines a single comprehensive standard for revenue recognition across all industries and supersedes most existing revenue recognition guidance. In addition, ASU 2014-09 will require new and enhanced disclosures. ASU 2014-09 will become effective for annual reporting periods beginning after December 15, 2017. The university is currently evaluating the effect of adoption to the financial statements. In April 2015, the FASB issued ASU 2015-05, Customer’s Accounting for Fees Paid in a Cloud
Computing Arrangement. ASU 2015-05 clarifies how customers in cloud computing arrangements should determine whether arrangements include a software license. The standard also eliminates the requirement that customers analogize to the leases standard when determining the asset acquired in a software licensing arrangement. This ASU is effective for fiscal years beginning after December 15, 2016, with early adoption permitted. The university early adopted ASU 2015-05 for fiscal 2016. In February 2016, the FASB issued ASU 2016-02, Leases. ASU 2016-02 requires recognition of rights and obligations arising from lease contracts, including existing and new arrangements, as assets and liabilities on the balance sheet. ASU 2016-02 is effective for annual reporting periods beginning after December 15, 2018. The university is currently evaluating the effect of adoption to the financial statements.

Notes to Consolidated Financial Statements
University of Southern California 12 2017 Financial Report |
In July 2016, the university adopted ASU 2014-15, Presentation of Financial Statements – Going
Concern: Disclosure of Uncertainties about an Entity’s Ability to Continue as a Going Concern. There was no material impact to the financial statements as a result of adoption. In August 2016, the FASB issued ASU 2016-14, Presentation of Financial Statements for Not-for-Profit
Entities, which revises the not-for-profit financial reporting model. ASU 2016-14 provides for additional disclosure requirements and modifies net asset reporting. The standard requires the university to reclassify its net assets (i.e. unrestricted, temporarily restricted, and permanently restricted) into two categories; net assets without donor imposed restrictions and net assets with donor imposed restrictions, among other requirements. The university early adopted ASU 2016-14 in 2017 and applied the changes retrospectively. With the adoption of ASU 2016-14 the university has updated the presentation in its statements of activities to include the reporting of operating subtotals. As a result of adopting this standard, certain prior year amounts were reclassified to conform to the presentation requirements. In August 2016, the FASB issued ASU 2016-15, Classification of Certain Cash Receipts and Cash
Payments. The standard addresses the classification of certain transactions within the statement of cash flows, including cash payments for debt repayment or debt extinguishment costs, contingent considerations payments made after a business combination, and distribution received from equity method investments. The ASU is effective for fiscal years beginning after December 15, 2018. Early adoption is permitted. The university is currently evaluating the effect of adoption to the financial statements. In January 2017, the FASB issued ASU 2017-02, Clarifying When a Not-for-Profit Entity that is a
General Partner or a Limited Partner Should Consolidate a For Profit Limited Partnership or Similar
Entity, which amends the consolidation guidance for not for profit “NFP” entities in ASC 958-810. The issued final guidance clarifies the model used by NFP entities to evaluate the consolidation of investments in limited partnerships (and limited liability companies that are similar to limited partnerships). Under the new guidance, NFP investors in a limited partnership or a similar entity will continue to apply a presumption that the general partner has control and should consolidate the investments unless substantive kick-out or participation rights held by any limited partners overcome that presumption. If the general partner does not have control, the limited partners have to evaluate whether they have control. If a limited partner has control, the consolidation is required unless the investment is part of a portfolio for which the NFP “portfolio-wide” fair value option has been elected. In that situation, the limited partner can instead report its interest at fair value, mirroring an exception that already exists for NFP general partners. The new standard also affirms the FASB’s intent to retain that NFP “portfolio-wide” fair value option under its new investment recognition and measurement rules that will take effect in fiscal years beginning after December 15, 2018. The new guidance should be adopted at the same time an NFP adopts the FASB’s other new consolidation guidance, which is required for fiscal years beginning after December 15, 2016. Early adoption is permitted. NFPs that early-adopt the consolidation guidance should apply the new guidance retrospective to earlier periods affected by that adoption. The university is evaluating the impact that the standard will have on the consolidated financial statements and related disclosures.

Notes to Consolidated Financial Statements
University of Southern California 13 2017 Financial Report |
Note 2.
Liquidity and Availability: USC’s financial assets available within one year of the balance sheet date for general expenditure are as follows (in thousands):
The university’s endowment funds consist of donor-restricted and board-designated endowment funds. Income from donor-restricted endowments is restricted for specific purposes and, therefore, is not available for general expenditure. As described in Note 7, for fiscal year 2017 and 2016 the Board of Trustees approved current distribution of 104% of the prior year’s payout, within a minimum of 4% and a maximum of 6% of the average market value for the previous 12 calendar quarters. Under the provision of the spending rule, for fiscal year 2017 and 2016 the Board of Trustees approved an endowment pool payout of $28.87 a share and $27.76 a share, for a total spending rule allocation of $225 million and $206 million. As described in Note 6, the university also has unfunded commitments on alternative investments totaling $522 million and $471 million for fiscal year 2017 and 2016. As part of the university’s liquidity management, it has a policy to structure its financial assets to be available as its general expenditures, liabilities, and other obligations come due. In addition, the university invests cash in excess of daily requirements in short-term investments. To help manage unanticipated liquidity needs, the university has committed lines of credit in the amount of $500 million, which it could draw upon. Additionally, the university has a board-designated endowment of $1.4 billion as of June 30, 2017. Although the university does not intend to spend from its board-designated endowment funds other than amounts appropriated for general expenditure as part of its annual budget approval and appropriation process, amounts from its board-designated endowment could be made available if necessary. However, both the board-designated endowment fund and donor-restricted endowments contain investments with lock-up provisions that reduce the total investments that could be made available (see Note 6 for disclosures about investments).
Year Ended Year Ended
June 30, 2017 June 30, 2016
Total assets at year end $11,961,209 $10,634,745 Less:
Notes receivable due in more than one year (14,501) (15,580) Pledges receivable due in more than one year (509,162) (501,285) Donor-restricted endowment funds (3,725,821) (3,301,292) Board-designated endowment funds (1,404,699) (1,307,422) Annuities and living trusts (149,323) (128,595) Inventories, prepaid expenses and other assets (218,417) (199,661) Property, plant, and equipment (4,009,596) (3,582,465) Financial assets available at year end for current use $1,929,690 $1,598,445

Notes to Consolidated Financial Statements
University of Southern California 14 2017 Financial Report |
Note 3.
Accounts receivable: Accounts receivable are summarized as follows at June 30 (in thousands):
Note 4.
Notes and Loans Receivable: The university is required to disclose the nature of credit risk inherent in the portfolio of financing receivables, its analysis and assessment in arriving at the allowance for credit losses (doubtful accounts), and the changes and reasons for those changes in the allowance for credit losses. Long-term financing receivables as of June 30, 2017 consist of the following (in thousands):
Long-term financing receivables as of June 30, 2016 consist of the following (in thousands):
2017 2016
U.S. Government $39,909 $35,600 Student and other, net of allowance for doubtful accounts of $12,000 (2017), $10,500 (2016) 152,193 124,708 Patient care, net allowance for doubtful accounts of $10,125 (2017), $21,429 (2016) 214,528 223,406 Total $406,630 $383,714
June 30, 2017
Financing Allowance
Receivables, for Doubtful
Gross Accounts Net
Perkins loans $47,350 $47,350 University student loans 15,761 ($4,432) 11,329 Other student loans 14,271 14,271 Total student loans 77,382 (4,432) 72,950
Faculty loans 33,182 33,182 Total $110,564 ($4,432) $106,132
June 30, 2016
Financing Allowance
Receivables, for Doubtful
Gross Accounts Net
Perkins loans $47,854 $47,854 University student loans 18,063 ($4,894) 13,169 Other student loans 14,625 14,625 Total student loans 80,542 (4,894) 75,648
Faculty loans 33,583 33,583 Total $114,125 ($4,894) $109,231

Notes to Consolidated Financial Statements
University of Southern California 15 2017 Financial Report |
Management regularly assesses the adequacy of the allowance for credit losses by performing ongoing evaluations of the student loan portfolio, including such factors as the differing economic risks associated with each loan category, the financial condition of specific borrowers, the economic environment in which the borrowers operate, the level of delinquent loans, the value of any collateral and, where applicable, the existence of any guarantees or indemnifications. The university's Perkins loans represents the amounts due from current and former students under the Federal Perkins Loan Program. Loans disbursed under the Federal Perkins Loan Program are able to be assigned to the federal government in certain non-repayment situations. In these situations the federal portion of the loan balance is guaranteed. Included in other student loans are loans related to the Federal Health Professional Student Loan Program (HPSL) and Loans for Disadvantaged Students (LDS). Factors also considered by management when performing its assessment of the adequacy of the allowance, in addition to general economic conditions and the other factors described above, include, but are not limited to, a detailed review of the aging of the student loan receivable detail and a review of the default rate by loan category in comparison to prior years. The level of the allowance is adjusted based on the results of management’s analysis. It is the university's policy to write off a loan only when it is deemed to be uncollectible. The following table illustrates the aging analysis of receivables as of June 30, 2017 (in thousands):
The following table illustrates the aging analysis of receivables as of June 30, 2016 (in thousands):
Considering the other factors already discussed herein, management considers the allowance for credit losses to be prudent and reasonable. Furthermore, the university’s allowance is general in nature and is available to absorb losses from any loan category. Management believes that the allowance for credit losses at June 30, 2017 and 2016 is adequate to absorb credit losses inherent in the portfolio as of these dates.
1-60 Days 61-90 Days > 91 Days Total Financing
Past Due Past Due Past Due Current Receivables
Perkins loans $1,174 $333 $6,719 $39,124 $47,350 University student loans 297 39 8,633 6,792 15,761 Other student loans 878 5 338 13,050 14,271 Total student loans 2,349 377 15,690 58,966 77,382
Faculty loans 33,182 33,182 Total $2,349 $377 $15,690 $92,148 $110,564
1-60 Days 61-90 Days > 91 Days Total Financing
Past Due Past Due Past Due Current Receivables
Perkins loans $1,239 $376 $7,296 $38,943 $47,854 University student loans 298 40 9,400 8,325 18,063 Other student loans 422 4 673 13,526 14,625 Total student loans 1,959 420 17,369 60,794 80,542
Faculty loans 33,583 33,583 Total $1,959 $420 $17,369 $94,377 $114,125

Notes to Consolidated Financial Statements
University of Southern California 16 2017 Financial Report |
As part of the program to attract and retain exemplary faculty and senior staff, the university provides home mortgage financing assistance. Notes receivable amounting to $33,182,000 and $33,583,000 were outstanding as of June 30, 2017 and 2016, respectively, and are collateralized by deeds of trust. No allowance for doubtful accounts has been recorded against these loans based on their collateralization and prior collection history. At June 30, 2017 there were no amounts past due under the faculty and staff loan program. Determination of the fair value of notes receivable, which are primarily federally sponsored student loans with U.S. government mandated interest rates and repayment terms, and subject to significant restrictions as to their transfer or disposition, could not be made without incurring excessive costs.
Note 5.
Pledges Receivable: Unconditional promises are included in the consolidated financial statements as pledges receivable and revenue of the appropriate net asset category. Pledges are recorded after discounting using rates ranging from 1% to 6% in order to derive the present value of the future cash flows. Unconditional promises are expected to be realized in the following periods (in thousands):
Pledges receivable at June 30 have the following restrictions (in thousands):
Conditional pledges for the university, which depend on the occurrence of specified future and uncertain events, at June 30, 2017 and 2016 was $392,958,000 and $406,925,000, respectively. The majority of these conditional pledges are related to construction of the Institute for Transformative Medicine, as well as the renovation of the Los Angeles Coliseum.
2017 2016
Less than one year $119,471 $162,518 One to five years 372,118 350,491 More than five years 279,057 293,970 Less: discount (117,951) (117,910) Less: allowance (24,062) (25,266) Total $628,633 $663,803
2017 2016
Endowment for departmental programs and activities $316,789 $330,234 Endowment for scholarship 27,487 10,550 Building construction 125,398 166,813 Departmental programs and activities 158,959 156,206 Total $628,633 $663,803

Notes to Consolidated Financial Statements
University of Southern California 17 2017 Financial Report |
Note 6.
Investments:
Investments consist of the following at June 30 (in thousands):
The following table summarized the levels of financial instruments carried at fair value as defined by ASC 820 valuation hierarchy defined previously, for the year ended June 30, 2017 (in thousands):
The following table summarized the levels of financial instruments carried at fair value as defined by ASC 820 valuation hierarchy defined previously, for the year ended June 30, 2016 (in thousands):
2017 2016
Equities $2,129,926 $1,863,520 Fixed income securities 1,014,546 1,051,915 Alternative investments: Hedge funds 1,056,032 914,369 Private capital 1,226,246 1,126,585 Real estate and other 198,056 209,638 Assets held by other trustees 146,120 149,718 Total $5,770,926 $5,315,745
Level I Level II Level III NAV Total
Investments:Equities $1,935,088 $699 $83,402 $110,737 $2,129,926 Fixed income securities 315,350 669,907 29,289 1,014,546 Hedge funds 1,056,032 1,056,032 Private capital 1,226,246 1,226,246 Real estate and other 43,600 154,456 198,056 Assets held by other trustees 146,120 146,120 Total $2,250,438 $670,606 $302,411 $2,547,471 $5,770,926
Level I Level II Level III NAV Total
Investments:Equities $1,695,867 $1,155 $73,602 $92,896 $1,863,520 Fixed income securities 260,271 782,173 9,471 1,051,915 Hedge funds 914,369 914,369 Private capital 1,126,585 1,126,585 Real estate and other 37,545 172,093 209,638 Assets held by other trustees 149,718 149,718 Total $1,956,138 $783,328 $270,336 $2,305,943 $5,315,745

Notes to Consolidated Financial Statements
University of Southern California 18 2017 Financial Report |
The following table summarized the university's Level III reconciliation of investments for the year ended June 30, 2017 (in thousands):
The following table summarized the university's Level III reconciliation of investments for the year ended June 30, 2016 (in thousands):
Beginning Sales and Realized Unrealized Transfers Transfers Ending
Balance Purchases Maturities Gain Gain/(Loss) In Out Balance
Investments:Equities $73,602 ($7) $9,807 $83,402 Fixed income securities 9,471 $49,242 (30,306) $481 99 $302 29,289 Real estate and other 37,545 8,883 (2,891) (309) (184) 660 ($104) 43,600 Assets held by other trustees 149,718 272 (4,895) (578) 2,263 (660) 146,120 Total $270,336 $58,397 ($38,099) ($406) $11,985 $962 ($764) $302,411
Beginning Sales and Realized Unrealized Transfers Transfers Ending
Balance Purchases Maturities Gain Gain/(Loss) In Out Balance
Investments:Equities $75,702 ($2,100) $73,602 Fixed income securities 8,910 $2,694 ($3,197) ($728) 1,792 9,471Real estate and other 36,936 1,543 (525) (409) 37,545Assets held by other trustees 151,285 4,426 (411) 2 (5,107) ($477) 149,718Total $272,833 $8,663 ($4,133) ($726) ($5,824) $- ($477) $270,336

Notes to Consolidated Financial Statements
University of Southern California 19 2017 Financial Report |
The university uses the NAV to determine the fair value of all the underlying investments which (a) do not have a readily determinable fair value and (b) prepare their financial statements consistent with the measurement principles of an investment company or have the attributes of an investment company. The following table lists investments by major category for the years ending June 30, 2017:
At June 30, 2017
Category of
Investment
Investment
Strategy
Fair Value
Determined Using
NAV
Unfunded
CommitmentsRemaining Life Redemption Terms
Redemption
Restrictions
and Terms
Redemption
Restrictions and
Terms in Place
at Year End
Distressed
Obligation
Partnerships
US and Non-US Distressed Debt Securities
$25,405,000 $21,601,000 Approximately 2 Years
Redemptions are not permitted during the life of the fund.
Not Applicable
Not Applicable
Hedge Funds US and Non-US Investments in Relative Value, Event Driven, Long/Short, and Directional Strategies
$1,056,032,000 $26,700,000 99.8% of NAV has an open ended life and 0.2% of NAV will be liquidated on an undetermined basis.
Ranges between bi-monthly redemption with 75 days notice, monthly redemption with 90 days notice, quarterly redemption with up to 120 days notice, semi-annual redemption with 60 to 90 days notice, annual redemption with up to 120 days notice, biannual redemption with 90 days notice, and 5-year lockup with 90 days notice.
17% of NAV is locked up for 3 months, 46% of NAV is locked-up for 1 year, 37% of NAV is locked-up for more than 1 year.
None
Natural
Resources
Partnerships
US and Non-US Investments in Upstream, Midstream, and Downstream Natural Resources Investments
$447,091,000 $228,951,000 Approximately 4 Years
Redemptions are not permitted during the life of the fund.
Not Applicable
Not Applicable
Private
Capital
Partnerships
US and Non-US Private Equity and Venture Capital Investments
$753,750,000 $159,195,000 Approximately 3 Years
Redemptions are not permitted during the life of the fund.
Not Applicable
Not Applicable
Private Real
Estate
Partnerships
US and Non-US Real Estate
$154,342,000 $85,781,000 Approximately 3 Years
Redemptions are not permitted during the life of the fund.
Not Applicable
Not Applicable
Equity Funds US and Non-US Equity Securities
$110,737,000 Not Applicable Open Ended Minimum Monthly None None
Other Funds US and Non-US Investments in Securities Other than Equity and Fixed Income
$114,000 Not Applicable Open Ended Monthly None None
Total $2,547,471,000 $522,228,000

Notes to Consolidated Financial Statements
University of Southern California 20 2017 Financial Report |
The following table lists investments by major category for the years ending June 30, 2016:
At June 30, 2016
Category of
Investment
Investment
Strategy
Fair Value
Determined Using
NAV
Unfunded
CommitmentsRemaining Life Redemption Terms
Redemption
Restrictions
and Terms
Redemption
Restrictions and
Terms in Place
at Year End
Distressed
Obligation
Partnerships
US and Non-US Distressed Debt Securities
$36,631,000 $22,773,000 Approximately 2 Years
Redemptions are not permitted during the life of the fund.
Not Applicable
Not Applicable
Hedge Funds US and Non-US Investments in Relative Value, Event Driven, Long/Short, and Directional Strategies
$914,369,000 $18,000,000 99.7% of NAV has an open ended life and 0.3% of NAV will be liquidated on an undetermined basis.
Ranges between bi-monthly redemption with 75 days notice, monthly redemption with 90 days notice, quarterly redemption with up to 90 days notice, semi-annual redemption with 60 to 90 days notice, and annual redemption with up to 180 days notice, and 5 year lockup with 90 days notice.
17% of NAV is locked up for 3 months, 53% of NAV is locked-up for 1 year, 30% of NAV is locked-up for more than 1 year.
None
Natural
Resources
Partnerships
US and Non-US Investments in Upstream, Midstream, and Downstream Natural Resources Investments
$367,040,000 $188,397,000 Approximately 5 Years
Redemptions are not permitted during the life of the fund.
Not Applicable
Not Applicable
Private
Capital
Partnerships
US and Non-US Private Equity and Venture Capital Investments
$722,914,000 $164,933,000 Approximately 3 Years
Redemptions are not permitted during the life of the fund.
Not Applicable
Not Applicable
Private Real
Estate
Partnerships
US and Non-US Real Estate
$170,932,000 $77,113,000 Approximately 3 Years
Redemptions are not permitted during the life of the fund.
Not Applicable
Not Applicable
Equity Funds US and Non-US Equity Securities
$92,896,000 Not Applicable Open Ended Minimum Monthly None None
Other Funds US and Non-US Investments in Securities Other than Equity and Fixed Income
$1,161,000 Not Applicable Open Ended Monthly None None
Total $2,305,943,000 $471,216,000

Notes to Consolidated Financial Statements
University of Southern California 21 2017 Financial Report |
Note 7.
Endowment: Endowment net assets are subject to the restrictions of gift instruments requiring that the principal be invested in perpetuity and only the income and realized gains be utilized for current and future needs. Long-term investment net assets (board-designated endowment funds) have been established from restricted contributions whose restrictions have been met and unrestricted contributions which have been designated by the Board of Trustees or management for the same purpose as endowment. The university also has a beneficial interest in the net income earned from assets which are held and managed by other trustees. Donor-restricted and board-designated endowment funds are summarized as follows for the year ended June 30, 2017 (in thousands):
Donor-restricted and board-designated endowment funds are summarized as follows for the year ended June 30, 2016 (in thousands):
Pooled investments represent donor-restricted and board-designated endowment funds which have been commingled in a unitized pool (unit market value basis) for purposes of investment. At June 30, 2017 and 2016, the pool is comprised of cash and cash equivalents (0.43%) and (2.30%), equities (53.89%) and (51.97%), fixed income securities (12.03%) and (9.87%), alternative investments (30.64%) and (32.11%) and real estate and other investments (3.01%) and (3.75%), respectively. Access to or liquidation from the pool is on the basis of the market value per unit on the preceding monthly valuation date. The unit market value at June 30, 2017 and 2016 was $647.73 and $603.87, respectively. The Board of Trustees has interpreted the “Uniform Prudent Management of Institutional Funds Act” (UPMIFA) as requiring the preservation of the original contribution as of the contribution date of the donor-restricted endowment funds absent explicit donor stipulations to the contrary. As a result of this interpretation, the university classifies as donor-restricted funds (a) the original value of contributions donated to the endowment, (b) the original value of subsequent contributions to the endowment and (c) accumulations to the endowment made in accordance with the direction of the applicable donor gift instrument at the time the accumulation is added to the fund. In accordance with UPMIFA, the university considers various factors in making a determination to appropriate or accumulate endowment funds including: duration and preservation of the fund, economic conditions, effects of inflation or deflation, expected return on the funds and other economic resources of the university.
Board-Designated Donor-Restricted
Endowment Funds Endowment Total
Pooled $1,335,689 $3,603,416 $4,939,105 Non-pooled 69,010 122,405 191,415 Total $1,404,699 $3,725,821 $5,130,520
Board-Designated Donor-Restricted
Endowment Funds Endowment Total
Pooled $1,230,571 $3,195,903 $4,426,474 Non-pooled 76,851 105,389 182,240 Total $1,307,422 $3,301,292 $4,608,714

Notes to Consolidated Financial Statements
University of Southern California 22 2017 Financial Report |
Endowment net asset composition by type of funds as of June 30, 2017 (in thousands):
Endowment net asset composition by type of funds as of June 30, 2016 (in thousands):
Changes in endowment net assets for the year ended June 30, 2017 (in thousands):
Changes in endowment net assets for the year ended June 30, 2016 (in thousands):
Without Donor With Donor Total
Restrictions Restrictions Endowment
Donor-restricted endowment funds $3,725,821 $3,725,821 Board-designated endowment funds $1,404,699 1,404,699 Total $1,404,699 $3,725,821 $5,130,520
Without Donor With Donor Total
Restrictions Restrictions Endowment
Donor-restricted endowment funds $3,301,292 $3,301,292 Board-designated endowment funds $1,307,422 1,307,422 Total $1,307,422 $3,301,292 $4,608,714
Without Donor With Donor Total
Restrictions Restrictions Endowment
Endowment net assets at July 1, 2016 $1,307,422 $3,301,292 $4,608,714
Total investment return 185,961 388,500 574,461
Contributions and transfers 2,986 172,279 175,265 Appropriation of endowment assets for expenditure (91,670) (136,250) (227,920)
Endowment net assets at June 30, 2017 $1,404,699 $3,725,821 $5,130,520
Without Donor With Donor Total
Restrictions Restrictions Endowment
Endowment net assets at July 1, 2015, $1,337,683 $3,371,828 $4,709,511
Total investment return (4,870) (102,038) (106,908)
Contributions and transfers 56,981 156,665 213,646 Appropriation of endowment assets for expenditure (82,372) (125,163) (207,535)
Endowment net assets at June 30, 2016 $1,307,422 $3,301,292 $4,608,714

Notes to Consolidated Financial Statements
University of Southern California 23 2017 Financial Report |
Endowments classified with donor restrictions are to be utilized for the following purposes: The portion of perpetual endowment funds that is required to be retained permanently either by explicit donor stipulation or by UPMIFA (in thousands):
From time to time, the fair value of assets associated with individual donor-restricted endowment funds may fall below the value of the initial and subsequent donor contribution amounts (deficit). When donor-restricted endowment fund deficits exist, they are classified as a reduction of donor-restricted net assets. Deficits of this nature exist in various donor-restricted endowment funds, which together have an original value of $53,815,000 and a current value of $52,066,000 with a deficiency of $1,749,000 and an original value of $347,348,000 and a current fair value of $332,070,000 and a deficiency of $15,278,000 as of June 30, 2017 and 2016, respectively. These deficits resulted from unfavorable market fluctuations that occurred shortly after the investment of newly established endowments, and authorized appropriation that was deemed prudent. The university has adopted endowment investment and spending policies that attempt to provide a predictable stream of funding to programs supported by its endowment while seeking to maintain the purchasing power of endowment assets. Under these policies, the return objective for the endowment assets, measured over a full market cycle, shall be to maximize the return against a blended index, based on the endowment’s target allocation applied to the appropriate individual benchmarks. The university expects its endowment funds over time to provide an average rate of return of approximately 8.0% annually. Actual returns in any given year may vary from this amount. To achieve its long-term rate of return objectives, the university relies on a total return strategy in which investment returns are achieved through both capital appreciation (realized and unrealized gains) and current yield (interest and dividends). The university targets a diversified asset allocation that places greater emphasis on equity-based investments to achieve its long-term objectives within prudent risk constraints. The university utilizes a spending rule for its pooled endowment. The spending rule determines the endowment income and realized gains to be distributed currently for spending with the provision that any amounts remaining after the distribution be transferred and reinvested in the endowment pool as board-designated as endowment. For the 2017 fiscal year, the Board of Trustees approved current distribution of 104% of the prior year’s payout, within a minimum of 4% and a maximum of 6% of the average market value for the previous 12 calendar quarters. Under the provisions of the spending rule, $28.87 was distributed to each time-weighted unit for a total spending rule allocation of $224,725,000. Investment income amounting to $3.91 per time-weighted unit was earned, totaling $30,450,000, and $194,275,000 was appropriated for current operations from cumulative gains of pooled investments. Endowment pool earnings allocated for spending in fiscal year 2017 represent 4.55% of the market value of the endowment pool at June 30, 2017.
2017 2016
Restricted for scholarship support $872,922 $779,081 Restricted for faculty support 896,990 800,488 Restricted for program support 1,955,909 1,721,723 Total endowment assets with donor restrictions $3,725,821 $3,301,292

Notes to Consolidated Financial Statements
University of Southern California 24 2017 Financial Report |
For the 2016 fiscal year, the Board of Trustees approved current distribution of 104% of the prior year’s payout, within a minimum of 4% and a maximum of 6% of the average market value for the previous 12 calendar quarters. Under the provisions of the spending rule, $27.76 was distributed to each time-weighted unit for a total spending rule allocation of $205,553,000. Investment income amounting to $3.58 per time-weighted unit was earned, totaling $26,539,000, and $179,014,000 was appropriated for current operations from cumulative gains of pooled investments. Endowment pool earnings allocated for spending in fiscal year 2016 represent 4.64 % of the market value of the endowment pool at June 30, 2016. Note 8.
Property, plant and equipment:
Property, plant and equipment consisted of the following at June 30 (in thousands):
Note 9.
Student Financial Aid:
Financial aid is awarded to students based on need and merit. Financial aid does not include payments made to students for services rendered to the university. Financial aid for the year ended June 30, 2017 consists of the following (in thousands):
2017 2016
Land and improvements $196,890 $188,139 Buildings and improvements 4,659,505 3,658,581 Buildings under capital leases 65,822 126,518 Equipment 655,391 603,301 Library books and collections 378,402 357,332 Construction-in-progress 415,925 802,841
6,371,935 5,736,712
Less: Accumulated depreciation 2,362,339 2,154,247 Total $4,009,596 $3,582,465
Undergraduate Graduate Total
Institutional scholarships $278,894 $154,894 $433,788 Endowed scholarships 24,177 13,428 37,605 External financial aid 25,176 13,981 39,157 Total $328,247 $182,303 $510,550

Notes to Consolidated Financial Statements
University of Southern California 25 2017 Financial Report |
Financial aid for the year ended June 30, 2016 consists of the following (in thousands):
Note 10.
Leases: The university is the lessee of various equipment and space under non-cancelable operating and capital leases. Operating lease rental expense for the years ended June 30, 2017 and 2016 was approximately $34,154,000 and $31,858,000 respectively. Space leases contain customary escalation clauses, which are included in annual aggregate minimum rentals. Future aggregate minimum rental payments as of June 30, 2017 under operating and capital leases are as follows (in thousands):
The university entered into a lease agreement with the Los Angeles Memorial Coliseum Commission (LAMCC) to assume the operations of the Los Angeles Memorial Coliseum and Los Angeles Memorial Sports Arena. The lease agreement with the LAMCC expires in 2033, or in 2054, if all options are exercised, at which time a second lease agreement with the California Science Center (CSC), an institution of the State of California, commences. The lease with the CSC expires in 2111, assuming all options are exercised. Under the terms of both lease agreements the university is required to make certain capital improvements. The present value of the future minimum lease payments as of June 30, 2017 and 2016 is $72,606,000 and $71,018,000, respectively.
Undergraduate Graduate Total
Institutional scholarships $262,375 $140,832 $403,207 Endowed scholarships 22,421 12,035 34,456 External financial aid 29,546 15,859 45,405 Total $314,342 $168,726 $483,068
Future minimum rental payments: Operating Capital
2018 $37,726 $1,559 2019 35,307 1,600 2020 33,859 1,642 2021 25,115 1,685 2022 23,196 1,730 Thereafter 55,916 668,069
211,119 676,285 Less: Interest on capital leases (603,679) Total $211,119 $72,606

Notes to Consolidated Financial Statements
University of Southern California 26 2017 Financial Report |
Note 11.
Bonds and notes payable (in thousands):
Principal payment requirements relating to bonds and notes payable, after giving effect to refunding, for the next five fiscal years are approximately: 2018 $1,400,000; 2019 $6,055,000; 2020 $19,040,000; 2021 $1,620,000; 2022 $1,700,000; thereafter $1,613,650,000. Interest payments for fiscal year 2017 and 2016 were $56,759,000 and $60,129,000, respectively.
Interest % Maturity 2017 2016
Series 2007A 4.50-4.75 2034-2038 $257,085 Premium 1,850 Series 2009A 5.00-5.25 2039-2040 217,605 Discount (739) Series 2009B 5.00-5.25 2039-2040 197,900 Premium 2,569 Series 2009C 5.25 2025 $82,305 82,305 Premium 4,271 4,881 Series 2012A 5.00 2024 41,595 41,595 Premium 6,415 6,968 Series 2015A 5.00 2026 42,960 42,960 Premium 8,216 9,200
University of Southern California Bonds:
Series 1998 Taxable 6.26 2019 4,585 4,585 Discount (7) (10) Series 2011 Taxable 5.25 2112 300,000 300,000 Discount (2,532) (2,559) Series 2016 Taxable 3.028 2040 722,580 Discount (3,554) Series 2017 Taxable 3.841 2048 402,320 Discount (1,799)
Series 2010 (Soto) 3.25-5.00 2017-2032 29,620 30,960 Premium 1,804 1,933
Notes Payable 5.00 2017-2020 17,500 17,500 1,656,279 1,216,588
Less: current portion of long-term debt 1,400 1,340 Total $1,654,879 $1,215,248
California Educational Facilities Authority CEFA Revenue Bonds and Notes:
California Infrastructure Revenue Bonds (USC- Soto Street Health Sciences):

Notes to Consolidated Financial Statements
University of Southern California 27 2017 Financial Report |
The university has a revolving line of credit with a bank with a maturity date of November 30, 2020. The credit agreement was amended on April 12, 2017 to increase the revolving line of credit to $500,000,000, with all other terms and conditions, including interest rate and maturity, remaining substantially the same. The line of credit accrues interest based on LIBOR and contains a fee on the unused portion of the line of credit. During the years ended June 30, 2017 and 2016, the university did not draw down on the line of credit. The line of credit contains certain restrictive covenants which include a minimum credit ratings of “A” and “A2” from Standard and Poor’s and Moody’s, respectively, as well as a minimum total net assets of $5,500,000,000. USC was in compliance with these covenants during the years ended June 30, 2017 and 2016. Note 12.
Retirement Benefits: Retirement benefits for eligible university employees are provided through the Teachers Insurance and Annuity Association, The Vanguard Group, AIG Sun America, Fidelity Investments and Prudential Financial. Under these defined contribution plans, the university and plan participants make contributions to purchase individual, fixed or variable annuities equivalent to retirement benefits earned or to participate in a variety of mutual funds or commingled funds. Under the USC Retirement Savings Program, the university makes a 5% non-elective contribution to all eligible employees and also matches dollar for dollar the first 5% of the employees’ contributions. Newly hired employees on or after January 1, 2012, will have the university non-elective contribution subject to a four year vesting schedule. Benefits commence upon termination or retirement and pre-retirement survivor death benefits are also provided. Charges to operating activities expenses for the university’s share of costs were approximately $155,398,000 and $147,287,000 during the years ended June 30, 2017 and 2016, respectively. Retirement benefits for hospital employees covered under a collective bargaining agreement with the National Union of Healthcare Workers (NUHW) and employees of USC Verdugo Hills Hospital and university Physician Associates are provided by a defined contribution 401(k) plan through Fidelity investments. Until August 2011, the hospital employees covered under a collective bargaining agreement with California Nurses Association were also covered under this 401(k) plan. Until January 2017, the NUHW employees at Keck were also covered under this 401(k) plan. Under the 401(k) defined contribution plan, participants make contributions to purchase a variety of mutual funds. The university makes its contribution following the end of the calendar year and matches 100% of the participants’ contributions up to 4% of eligible earnings, providing the participant was employed on the last day of the calendar year. In addition, the university makes a 1% retiree medical benefit contribution to all NUHW participants who were both employed on the last day of the calendar year and worked 1,500 hours in that calendar year. Effective July 2013, all employees of the USC Verdugo Hills Hospital are eligible to participate in the 401(k) plan. Employees of university Physician Associates are eligible to participate upon employment by USC. They will receive a discretionary employer match of up to 4% of eligible earnings. The university contribution is subject to a five year vesting schedule although previously credited years prior to the Tenet and Verdugo acquisitions have been carried over. Benefits commence at age 59 1/2, termination of employment, or retirement and pre-retirement survivor death benefits are also provided. Charges to operating activities expenses for the university’s share of costs were approximately $1,701,000 and $5,268,000 during the years ended June 30, 2017 and 2016, respectively.

Notes to Consolidated Financial Statements
University of Southern California 28 2017 Financial Report |
Retirement benefits for non-exempt university employees are provided through a noncontributory defined benefit pension plan, the USC Support Staff Retirement Plan (“Plan”). The following table sets forth the plan’s funded status at June 30 (in thousands):
Changes in Projected Benefit Obligation 2017 2016
Benefit obligation at end of prior year $272,262 $242,426 Interest cost 10,155 10,937 Actuarial (gain) loss (13,584) 27,704 Benefits paid (16,976) (8,805)
$251,857 $272,262
Change in Plan Assets
Fair value of plan assets at the end of prior year $173,003 $170,719 Actual return on plan assets 24,947 1,089 Employer contribution 10,000 10,000 Benefits paid (16,976) (8,805)
$190,974 $173,003
Reconciliation of Funded Status
Accumulated benefit obligation at end of year $251,857 $272,262
Projected benefit obligation at end of year (251,857) (272,262) Fair value of plan assets at end of year 190,974 173,003 Funded status ($60,883) ($99,259)
Components of Net Periodic Benefit Cost
Interest cost $10,155 $10,937 Expected return on plan assets (11,762) (11,625) Amortization of net loss 8,965 5,987 Total benefit cost $7,358 $5,299
Amounts recognized in the Statement of Financial Position
Accrued liabilities ($60,883) ($99,259)
Amounts not yet recognized as components of Net Periodic Benefit Cost
Net loss $84,818 $120,552
Changes in the net reduction to Unrestricted Net Assets
Net (gain) loss ($26,769) $38,240 Amortization of net loss (8,965) (5,987) Total benefit cost ($35,734) $32,253

Notes to Consolidated Financial Statements
University of Southern California 29 2017 Financial Report |
The estimated net loss/(gain) and prior service cost for the Plan that will be recognized as components of net periodic benefit cost over the next fiscal year are $5,898,000 and $8,965,000, respectively. The Plan was amended to freeze benefit accruals for all remaining active union participants effective December 23, 2009, and to provide full vesting for those participants. No special accounting for curtailments, settlements or termination benefits was required during the years ended June 30, 2017 and 2016. Weighted-average assumptions used to determine net periodic benefit cost for year ended June 30:
Weighted-average assumptions used to determine net year-end benefit obligations at June 30:
Plan Assets In managing the Plan assets, the university’s objective is to be a responsible fiduciary while minimizing financial risk. Plan assets include a diversified mix of fixed income securities and equity securities across a range of sectors and levels of capitalization to maximize the long−term return for a prudent level of risk. In addition to producing a reasonable return, the investment strategy seeks to minimize the volatility in the university’s expense and cash flow. The target allocation for pension benefit plan assets is 75% equity securities and 25% fixed income securities. As described in Note 1, the university uses a hierarchy to report invested assets, including the invested assets of the Plan. Following is a description of the valuation methodologies used for assets measured at fair value. Fair Value The Plan’s interest in collective trusts is valued based on the net asset value information reported by the investment advisor. The fund is valued at the normal close of trading on the New York Stock Exchange every day the exchange is open (a “Business Day”). Equity securities are valued at the official closing price of, or the last reported sales price on, the exchange or market on which such securities are traded, as of the close of business on the day the securities are being valued or at the last available bid price. In cases where equity securities are traded on more than one exchange, the securities are valued on the exchange or market determined to be the most representative market, which may be either a securities exchange or the over-the-counter market. Short term investments are carried at fair value.
2017 2016
Discount rate 3.80% 4.60%Expected return on plan assets 7.00% 7.00%Rate of compensation increase N/A N/A
2017 2016
Discount rate 4.00% 3.80%Rate of compensation increase N/A N/A

Notes to Consolidated Financial Statements
University of Southern California 30 2017 Financial Report |
The methods described above may produce a fair value calculation that may not be indicative of net realizable value or reflective of future fair values. Furthermore, while the Plan believes its valuation methods are appropriate and consistent with other market participants, the use of different methodologies or assumptions to determine the fair value of certain financial instruments could result in a different fair value measurement at the reporting date. At June 30, 2017 a summary of fair value measurements by level for Plan investments measured at fair value on a recurring basis is as follows (in thousands):
At June 30, 2016 a summary of fair value measurements by level for investments measured at fair value on a recurring basis is as follows (in thousands):
Allocation of Assets The year-end asset allocation, which approximates the weighted-average allocation for the Plan assets as of June 30 and in comparison to target percentages for each asset category, is as follows:
The portfolio is evaluated annually, or when the actual allocation percentages are plus or minus 2% of the stated target allocation percentages. Changes in policy may be indicated as a result of changing market conditions or anticipated changes in the pension plan’s needs. Prohibited transactions include investment transactions prohibited by the Employee Retirement Income Security Act of 1974 and speculative investments including commodities or unregistered stock without specific prior approval by the university’s Investment Committee.
Level I Level II Level III NAV Total
Collective Trust Funds:Short-term investment fund $2,062 $2,062 Equity securities 145,125 145,125 Fixed income securities 43,787 43,787
Total $190,974 $190,974
Level I Level II Level III NAV Total
Collective Trust Funds:Short-term investment fund $9,310 $9,310 Equity securities 121,342 121,342 Fixed income securities 42,351 42,351
Total $173,003 $173,003
Actual at Target at Actual at Target at
Asset Category June 30, 2017 June 30, 2017 June 30, 2016 June 30, 2016
Short-term investment fund 1.1% 0.0% 5.4% 0.0% Equity securities 76.0% 75.0% 70.1% 75.0% Fixed income securities 22.9% 25.0% 24.5% 25.0%Total 100.0% 100.0% 100.0% 100.0%

Notes to Consolidated Financial Statements
University of Southern California 31 2017 Financial Report |
Contributions No contribution to the Plan was required during the years ended June 30, 2017 and 2016. The university may make discretionary contributions to the Plan during the next fiscal year. This will be reassessed during fiscal year 2018. Estimated Future Benefit Payments The following benefit payments, which reflect expected future service, as appropriate, are expected to be paid (in thousands):
Note 13.
Net Assets:
The university’s net assets as of June 30, 2017 includes the following (in thousands):
2018 $10,720 2019 11,214 2020 11,769 2021 12,390 2022 12,947 2023-2027 69,660
Fiscal Year Ending June 30
Year Ended
June 30, 2017
Without Donor With Donor Total
Nature of Specific Net Assets Restrictions Restrictions Net Assets
Designated $1,223,092 $1,223,092 Donor-restricted $125,226 125,226 Pledges 628,633 628,633 Unexpended endowment income 266,144 266,144 Annuity and living trusts 149,323 149,323 Donor-restricted endowment funds 3,725,821 3,725,821 Board-designated endowment funds 1,404,699 1,404,699 Debt service funds 106,380 106,380 Invested in plant 1,150,900 1,150,900 Total $4,151,215 $4,629,003 $8,780,218

Notes to Consolidated Financial Statements
University of Southern California 32 2017 Financial Report |
The university’s net assets as of June 30, 2016 includes the following (in thousands):
Note 14.
Functional Expenses: Expenses are presented below by functional classification in accordance with the overall service mission of the university. Each functional classification displays all expenses related to the underlying operations by natural classification. Depreciation expense is allocated based on square footage occupancy. Interest expense on external debt is allocated to the functional categories which have benefited from the proceeds of the external debt. Plant operations and maintenance represents space related costs which are allocated to the functional categories directly and/or based on the square footage occupancy. For the year ended June 30, 2017 functional expense consists of the following (in thousands):
Year Ended
June 30, 2016
Without Donor With Donor Total
Nature of Specific Net Assets Restrictions Restrictions Net Assets
Designated $959,609 $959,609 Donor-restricted $89,464 89,464 Pledges 663,803 663,803 Unexpended endowment income 239,178 239,178 Annuity and living trusts 128,595 128,595 Donor-restricted endowment funds 3,301,292 3,301,292 Board-designated endowment funds 1,307,422 1,307,422 Debt service funds 111,070 111,070 Invested in plant 1,081,989 1,081,989 Total $3,699,268 $4,183,154 $7,882,422
Academic
Health Care and Support Fund Raising Year Ended
Student Services Services Activities June 30, 2017
Compensation $1,698,766 $309,213 $32,920 $2,040,899 Fringe benefits 388,758 92,508 10,129 491,395 Operating expenses 964,585 334,092 14,954 1,313,631 Cost of goods sold 63,389 49,436 112,825 Travel 47,999 11,314 810 60,123
Allocations: Depreciation 175,132 70,106 173 245,411 Interest 17,448 50,561 68,009 Plant operations and maintenance 162,641 (162,894) 253 Total $3,518,718 $754,336 $59,239 $4,332,293

Notes to Consolidated Financial Statements
University of Southern California 33 2017 Financial Report |
For the year ended June 30, 2016 functional expense consists of the following (in thousands):
Note 15.
Commitments and Contingencies At June 30, 2017 and 2016, the university had remaining commitments of approximately $522,228,000 and $471,216,000 with alternative investment managers and/or limited partnerships, respectively. Contractual commitments for educational plant amounted to approximately $142,456,000 and $428,646,000 at June 30, 2017 and 2016, respectively. It is expected that the resources to satisfy these commitments will be provided from certain unexpended plant net assets, anticipated contributions and/or debt proceeds. During the year ended June 30, 2007, the university entered into an agreement with the County of Los Angeles to provide professional services at LAC+USC Medical Center. Under the terms of the agreement the contract automatically renews on an annual basis unless either party gives four years’ notice of the termination. To date, no such notice has been provided by either party. The university is contingently liable as guarantor on certain obligations relating to equipment loans, student and parent loans, and various campus organizations. The university receives funding or reimbursement from governmental agencies for various activities, which are subject to audit. In addition, certain litigation has been filed against the university and in the opinion of university management, after consultation with legal counsel, the liability, if any, for the aforementioned matters will not have a material effect on the university’s financial position.
Academic
Health Care and Support Fund Raising Year Ended
Student Services Services Activities June 30, 2016
Compensation $1,591,071 $297,697 $31,464 $1,920,232 Fringe benefits 445,265 90,041 9,852 545,158 Operating expenses 920,278 305,875 12,622 1,238,775 Cost of goods sold 53,137 50,134 103,271 Travel 50,513 10,883 951 62,347
Allocations: Depreciation 152,988 54,897 184 208,069 Interest 15,121 58,854 73,975 Plant operations and maintenance 154,704 (154,977) 273 Total $3,383,077 $713,404 $55,346 $4,151,827
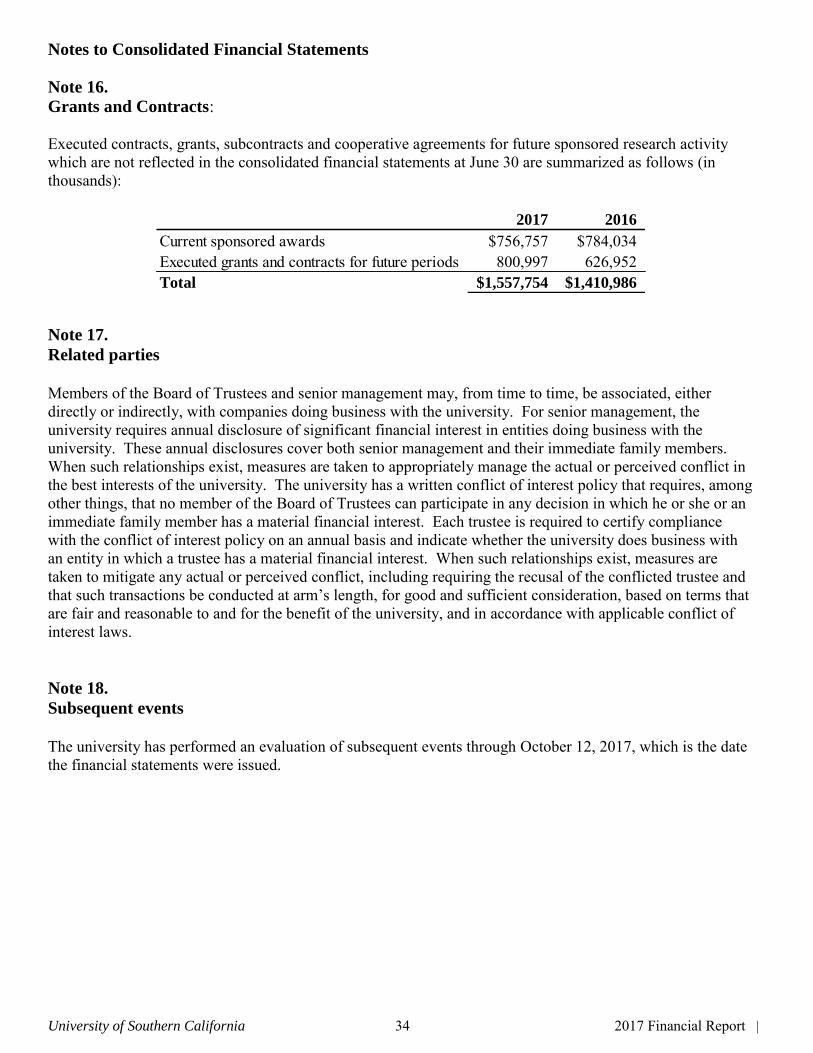
Notes to Consolidated Financial Statements
University of Southern California 34 2017 Financial Report |
Note 16.
Grants and Contracts: Executed contracts, grants, subcontracts and cooperative agreements for future sponsored research activity which are not reflected in the consolidated financial statements at June 30 are summarized as follows (in thousands):
Note 17.
Related parties
Members of the Board of Trustees and senior management may, from time to time, be associated, either directly or indirectly, with companies doing business with the university. For senior management, the university requires annual disclosure of significant financial interest in entities doing business with the university. These annual disclosures cover both senior management and their immediate family members. When such relationships exist, measures are taken to appropriately manage the actual or perceived conflict in the best interests of the university. The university has a written conflict of interest policy that requires, among other things, that no member of the Board of Trustees can participate in any decision in which he or she or an immediate family member has a material financial interest. Each trustee is required to certify compliance with the conflict of interest policy on an annual basis and indicate whether the university does business with an entity in which a trustee has a material financial interest. When such relationships exist, measures are taken to mitigate any actual or perceived conflict, including requiring the recusal of the conflicted trustee and that such transactions be conducted at arm’s length, for good and sufficient consideration, based on terms that are fair and reasonable to and for the benefit of the university, and in accordance with applicable conflict of interest laws. Note 18.
Subsequent events
The university has performed an evaluation of subsequent events through October 12, 2017, which is the date the financial statements were issued.
2017 2016
Current sponsored awards $756,757 $784,034 Executed grants and contracts for future periods 800,997 626,952 Total $1,557,754 $1,410,986

University of Southern California Schedule of Expenditures of Federal Awards
Year Ended June 30, 2017
*See footnote 2.
The accompanying notes are an integral part of this Schedule.
35
SPONSOR
RESEARCH & DEVELOPMENT CLUSTER Current Year Pass-Through Funds
DIRECT AWARDS CFDA* Expenditures to Sub recipients
Agency for International Development
Agency for International Development 98.001 86,315$ -$
Total Agency for International Development 86,315 -
Department of Agriculture
Agricultural Research Service 10.001 546,871 521,354
Economic Research Service 10.253 70,739 -
National Institute of Food and Agriculture 10.310 147,880 67,761
Total Department of Agriculture 765,490 589,115
Department of Commerce
Economic Development Administration 11.303 24,539 -
Economic Development Administration 11.312 966,933 42,734
Economic Development Administration 11.313 687,795 -
Minority Business Development Agency 11.805 304,595 -
National Institute of Standards and Technology (NIST) 11.609 236,088 -
National Institute of Standards and Technology (NIST) 11.619 239,831 129,021
National Oceanic and Atmospheric Administration (NOAA) 11.417 1,555,959 259,241
National Oceanic and Atmospheric Administration (NOAA) 11.431 170,783 -
National Oceanic and Atmospheric Administration (NOAA) 11.478 198,175 -
U.S. Census Bureau 11.001 1,200 -
Total Department of Commerce 4,385,898 430,996
Department of Defense
Advanced Research Projects Agency 12.910 4,496,574 861,362
Defense Threat Reduction Agency 12.351 86,531 -
Department Of Defense 12.RD 61,240,045 10,345,261
Department of the Air Force, Materiel Command 12.800 3,080,142 416,112
Department of the Navy, Office of the Chief of Naval Research 12.300 8,466,927 1,265,731
Department of the Navy, Office of the Chief of Naval Research 12.330 243,554 -
National Security Agency 12.900 72,284 -
National Security Agency 12.901 54,420 -
Office of the Secretary of Defense 12.630 11,095 -
U.S. Army Materiel Command 12.431 6,485,636 910,260
U.S. Army Medical Command 12.420 3,968,755 1,254,451
Total Department of Defense 88,205,963 15,053,177

University of Southern California Schedule of Expenditures of Federal Awards
Year Ended June 30, 2017
*See footnote 2.
The accompanying notes are an integral part of this Schedule.
36
SPONSOR
RESEARCH & DEVELOPMENT CLUSTER Current Year Pass-Through Funds
DIRECT AWARDS CFDA* Expenditures to Sub recipients
Department of Education
Institute of Education Sciences 84.305 415,710 252,470
Office of Elementary and Secondary Education 84.206 313,697 -
Office of Postsecondary Education 84.015 619,878 342,588
Office of Postsecondary Education 84.116 849,960 34,801
Total Department of Education 2,199,245 629,859
Department of Energy
Department of Energy 81.049 3,687,380 392,407
Department of Energy 81.089 582,181 279,113
Department of Energy 81.108 548,225 190,538
Department of Energy 81.113 3,962 -
Department of Energy 81.135 691,332 457,516
Total Department of Energy 5,513,080 1,319,574
Department of Health and Human Services
Administration for Children and Families 93.670 20,411 -
Administration for Children and Families 93.713 108 -
Administration for Community Living 93.048 921,324 85,291
Administration for Community Living 93.747 390,397 -
Agency for Healthcare Research and Quality 93.226 178,717 -
Centers for Disease Control and Prevention 93.118 189,498 -
Centers for Disease Control and Prevention 93.262 583,289 62,113
Centers for Disease Control and Prevention 93.283 320,025 -
Centers for Medicare and Medicaid Services 93.610 50,264 1,240
Department Of Health And Human Services 93.RD 3,859,323 15,668
Health Resources and Services Administration 93.124 17,600 -
Health Resources and Services Administration 93.884 32,173 -
Health Resources and Services Administration 93.924 749,607 -
Health Resources and Services Administration 93.928 243,467 -
Health Resources and Services Administration 93.964 (617) -
Health Resources and Services Administration 93.969 882,754 84,010
National Institutes of Health- ARRA 93.701 16,996 -
National Institutes of Health 93.077 4,607,296 12,118
National Institutes of Health 93.113 11,211,264 612,765
National Institutes of Health 93.121 10,257,656 695,350

University of Southern California Schedule of Expenditures of Federal Awards
Year Ended June 30, 2017
*See footnote 2.
The accompanying notes are an integral part of this Schedule.
37
SPONSOR
RESEARCH & DEVELOPMENT CLUSTER Current Year Pass-Through Funds
DIRECT AWARDS CFDA* Expenditures to Sub recipients
National Institutes of Health 93.172 2,002,926 615,567
National Institutes of Health 93.173 5,237,615 685,087
National Institutes of Health 93.213 773,562 82,431
National Institutes of Health 93.233 172,847 101,680
National Institutes of Health 93.242 7,341,012 285,402
National Institutes of Health 93.273 3,684,214 564,939
National Institutes of Health 93.279 7,653,029 1,458,781
National Institutes of Health 93.286 3,840,085 303,095
National Institutes of Health 93.307 1,757,124 195,530
National Institutes of Health 93.310 3,810,526 3,251,688
National Institutes of Health 93.350 9,574,686 983,478
National Institutes of Health 93.351 595,970 36,056
National Institutes of Health 93.361 932,632 -
National Institutes of Health 93.389 779,441 134,807
National Institutes of Health 93.393 12,792,783 1,027,942
National Institutes of Health 93.394 1,702,739 410,653
National Institutes of Health 93.395 1,833,982 70,347
National Institutes of Health 93.396 7,492,889 2,685,021
National Institutes of Health 93.397 6,570,191 397,471
National Institutes of Health 93.398 866,408 -
National Institutes of Health 93.399 319,203 -
National Institutes of Health 93.701 18,640 -
National Institutes of Health 93.837 5,850,543 2,851,976
National Institutes of Health 93.838 2,790,701 21,572
National Institutes of Health 93.839 649,184 273,029
National Institutes of Health 93.840 7,904 -
National Institutes of Health 93.846 2,423,818 50,135
National Institutes of Health 93.847 12,896,334 1,316,693
National Institutes of Health 93.853 9,361,297 866,210
National Institutes of Health 93.855 6,120,972 228,924
National Institutes of Health 93.859 9,527,414 492,976
National Institutes of Health 93.865 3,180,279 319,557
National Institutes of Health 93.866 27,614,150 12,435,231
National Institutes of Health 93.867 9,852,408 2,811,262
National Institutes of Health 93.989 557,182 109,544
Office of the Secretary 93.001 16,815 -

University of Southern California Schedule of Expenditures of Federal Awards
Year Ended June 30, 2017
*See footnote 2.
The accompanying notes are an integral part of this Schedule.
38
SPONSOR
RESEARCH & DEVELOPMENT CLUSTER Current Year Pass-Through Funds
DIRECT AWARDS CFDA* Expenditures to Sub recipients
Office of the Secretary 93.297 2,007,463 463,269
Substance Abuse and Mental Health Services Administration 93.243 2,084,507 739,554
Total Department of Health and Human Services 209,225,027 37,838,462
Department of Homeland Security
Department of Homeland Security 97.RD 4,172,397 276,297
Federal Emergency Management Agency (FEMA) 97.082 263,363 -
Science and Technology (S&T) 97.061 2,729,807 809,967
Science and Technology (S&T) 97.104 117,758 -
Total Department of Homeland Security 7,283,325 1,086,264
Department of Justice
National Institute of Justice 16.560 156,789 -
Total Department of Justice 156,789 -
Department of State
Bureau of Educational and Cultural Affairs 19.415 1,637,736 58,793
Bureau of Near Eastern Affairs 19.021 95,505 -
Bureau of Near Eastern Affairs 19.221 244,456 -
Office of the Coordinator of U.S. Assistance to Europe and Eurasia 19.900 190,135 -
Under Secretary for Public Diplomacy and Public Affairs 19.040 29,454 -
Total Department of State 2,197,286 58,793
Department of the Interior
Bureau of Land Management 15.224 3,209 -
Department Of The Interior 15.RD 68,116 59,590
U.S. Geological Survey 15.807 124,318 -
U.S. Geological Survey 15.808 1,353,662 931,036
U.S. Geological Survey 15.810 17,439 -
Total Department of the Interior 1,566,744 990,626
Department of Transportation
Federal Transit Administration (FTA) 20.514 37,738 -
Office of the Secretary (OST) Administration Secretariate 20.701 922,072 517,346
Total Department of Transportation 959,810 517,346

University of Southern California Schedule of Expenditures of Federal Awards
Year Ended June 30, 2017
*See footnote 2.
The accompanying notes are an integral part of this Schedule.
39
SPONSOR
RESEARCH & DEVELOPMENT CLUSTER Current Year Pass-Through Funds
DIRECT AWARDS CFDA* Expenditures to Sub recipients
Department of Veterans Affairs
Department Of Veterans Affairs 64.RD 137,298 -
VA Health Administration Center 64.009 123,830 -
Total Department of Veterans Affairs 261,128 -
Environmental Protection Agency
Office of Research and Development (ORD) 66.509 744,482 44,267
Office of Water 66.436 94,045 89,887
Total Environmental Protection Agency 838,527 134,154
Institute of Museum and Library Services
Institute of Museum and Library Services 45.301 21,429 -
Institute of Museum and Library Services 45.312 795 -
Institute of Museum and Library Services 45.313 72,782 63,480
Total Institute of Museum and Library Services 95,006 63,480
Military Medical Research and Development
Military Medical Research and Development 12.240 382,712 64,307
Total Military Medical Research and Development 382,712 64,307
National Aeronautics and Space Administration
National Aeronautics and Space Administration 43.001 2,438,316 828,003
National Aeronautics and Space Administration 43.002 9,000 -
National Aeronautics and Space Administration 43.003 150,695 -
National Aeronautics and Space Administration 43.008 9,000 -
National Aeronautics and Space Administration 43.012 52,676 -
Total National Aeronautics and Space Administration 2,659,687 828,003
National Archives and Records Administration
National Archives and Records Administration 89.003 6,441 -
Total National Archives and Records Administration 6,441 -
National Endowment for the Arts
National Endowment for the Arts 45.024 2,372 -
Total National Endowment for the Arts 2,372 -

University of Southern California Schedule of Expenditures of Federal Awards
Year Ended June 30, 2017
*See footnote 2.
The accompanying notes are an integral part of this Schedule.
40
SPONSOR
RESEARCH & DEVELOPMENT CLUSTER Current Year Pass-Through Funds
DIRECT AWARDS CFDA* Expenditures to Sub recipients
National Endowment for the Humanities
National Endowment for the Humanities 45.149 98,696 -
National Endowment for the Humanities 45.161 69,649 -
National Endowment for the Humanities 45.164 219,299 -
National Endowment for the Humanities 45.169 84,904 20,000
Total National Endowment for the Humanities 472,548 20,000
National Science Foundation
National Science Foundation 47.041 8,129,173 921,932
National Science Foundation 47.049 4,277,345 2,096
National Science Foundation 47.050 13,924,989 4,286,424
National Science Foundation 47.070 11,350,138 572,822
National Science Foundation 47.074 1,836,618 413,757
National Science Foundation 47.075 1,553,143 65,284
National Science Foundation 47.076 2,193,819 6,522
National Science Foundation 47.079 46,739 -
National Science Foundation 47.080 311,157 157,700
National Science Foundation 47.RD 183,833 -
Total National Science Foundation 43,806,954 6,426,537
Total Research & Development Cluster - Direct Awards 371,070,347$ 66,050,693$

University of Southern California Schedule of Expenditures of Federal Awards
Year Ended June 30, 2017
*See footnote 2.
The accompanying notes are an integral part of this Schedule.
41
SPONSOR
RESEARCH & DEVELOPMENT CLUSTER Pass-Through Entity Current Year Pass-Through Funds
PASS-THROUGH FUNDS Identifying Number CFDA* Expenditures to Sub recipients
Agency for International Development
California Institute of Technology 1001624-13S-19790 98.001 (37)$ -$
University of California Regents AID-OAA-A-14-00008 98.001 179,592 -
Total Agency for International Development 179,555 -
Department of Agriculture
Duke University 59-5000-4-0062 10.253 22,123 -
Ecology Center 2015-70018-23338 10.331 59,627 -
International Business Machines Corporation W911NF-12-C-0012 10.001 282,527 -
Johns Hopkins University 2017-67007-26154 10.310 6,641 -
Lawrence Berkeley Laboratory DE-AC02-05CH11231 10.001 54,197 -
Northrop Grumman Corporation FA8650-13-C-7312 10.RD 282,870 -
Quanterion Solutions Incorporated FA8075-12-D-0001 10.001 51,360 -
Raytheon BBN Technologies FA8750-13-C-0008 10.001 97,027 -
Raytheon BBN Technologies HR0011-08-C-0004 10.001 133,029 -
Sanford-Burnham Medical Research Institute HHSN261200800001E 10.001 3,813 -
Science Applications International Corporation N62645-12-C-4100 10.001 24,310 -
Science Applications International Corporation N66001-11-C-4159 10.001 5,089 -
Southwest Research Institute NNG05EC85C 10.001 3,780 -
Space Telescope Science Institute NAS5-26555 10.001 89,309 -
University of California Davis HHSN261201100038C 10.001 122,528 -
US-National Renewable Energy Laboratory - DOEN DE-AC36-08GO28308 10.RD 37,111 -
US-Pacific Northwest National Lab DE-AC05-76RL01830 10.001 9,649 -
Total Department of Agriculture 1,284,990 -
Department of Commerce
Catalina Sea Ranch WC-133R-16-CN-0114 11.RD 47,480 -
University of California San Diego NA11NOS0120029 11.012 239,311 -
University of California San Diego NA14OAR4170075 11.417 18,901 -
University of California San Diego NA16NOS0120022 11.012 34,031 -
Total Department of Commerce 339,723 -

University of Southern California Schedule of Expenditures of Federal Awards
Year Ended June 30, 2017
*See footnote 2.
The accompanying notes are an integral part of this Schedule.
42
SPONSOR
RESEARCH & DEVELOPMENT CLUSTER Pass-Through Entity Current Year Pass-Through Funds
PASS-THROUGH FUNDS Identifying Number CFDA* Expenditures to Sub recipients
Department of Defense
ADA Technologies, Incorporated W911NF-15-P-0013 12.431 2 -
ADA Technologies, Incorporated W911NF-16-C-0118 12.RD 63,293 -
Applied Mathematics, Incorporated W911NF-14-C-0151 12.RD 31,664 -
Aptima, Incorporated N00014-15-P-1186 12.RD (146) -
BBN Technologies W911NF-09-2-0053 12.630 301,556 -
Boeing Company NNG17PX06C 12.RD 100,224 -
CA-Department of Education CACFP 19 12.RD 234,189 -
California Institute of Technology FA9550-16-1-0510 12.800 73,181 -
Carnegie Mellon University FA8750-12-2-0342 12.800 353,827 -
Carnegie Mellon University W911NF-10-1-0533 12.431 73,945 -
Carnegie Mellon University W911NF-14-1-0436 12.431 206,378 -
Case Western Reserve University N00014-16-1-2535 12.300 163,866 -
CA-State of California ST1441-15-01 12.617 870,447 -
Charles River FA8750-16-C-0045 12.RD 369,125 -
Children's Hospital of Los Angeles W81XWH-16-1-0253 12.420 148,933 -
Chula Vista Elementary School District HE1254-13-1-0017 12.556 1,436,608 442,249
Concepts to Systems, Incorporated FA9550-16-C-0012 12.RD 38,123 -
Concepts to Systems, Incorporated N68335-16-C-0244 12.RD 24,500 -
Cornell University W81XWH-10-1-1045 12.420 50,574 -
Corporation for Public Broadcasting 007555-00001 12.RD 107,392 -
Creative Associates International AID-519-C-00002 12.RD 10,666 -
Creative Associates International AID-538-TO-16-00001 12.RD 30,853 -
Design Interactive, Incorporated W81XWH-13-1-0311 12.RD 15,339 -
ERC, Incorporated FA9300-15-C-0004 12.RD 74,718 -
General Technical Services, LLC GS07T-12-BGD-0012 12.RD 155,388 -
Geneva Foundation W911QY-15-1-0010 12.RD 14,678 -
Georgia Institute of Technology FA8075-14-D-0018-0018 12.RD 70,279 -
Georgia Institute of Technology N00014-13-1-0563 12.300 134,290 -
Georgia Institute of Technology W911NF-11-1-0046 12.800 25,179 -
Global Science & Technology, Incorporated DG-133E-13-SE-1560 12.RD 13,988 -
Global Science & Technology, Incorporated TO002 WA015 12.RD 27,658 -
Graf Research HQ0147-16-C-7004 12.RD 32,814 -
H. F. Webster Engineering Services W911NF-15-2-0034 12.431 84,022 -
Henry M. Jackson Foundation HU0001-15-2-0019 12.750 14,805 -
HRL Laboratories, LLC BAA-15-34 12.RD 9,165 -

University of Southern California Schedule of Expenditures of Federal Awards
Year Ended June 30, 2017
*See footnote 2.
The accompanying notes are an integral part of this Schedule.
43
SPONSOR
RESEARCH & DEVELOPMENT CLUSTER Pass-Through Entity Current Year Pass-Through Funds
PASS-THROUGH FUNDS Identifying Number CFDA* Expenditures to Sub recipients
HRL Laboratories, LLC W911NF-16-C-0018 12.RD 326,533 -
Indiana University W911NF-10-1-0444 12.431 825 -
Intelligent Automation Inc NNX16CG06C 12.RD 12,847 -
International Business Machines Corporation FA8750-09-C-0172 12.RD (11,961) -
Johns Hopkins University N00014-15-1-2312 12.300 29,807 -
Kessler Foundation W81XWH-14-2-0150 12.420 80,315 -
La Jolla Institute for Allergy and Immunology 007972-00001 12.RD 23,680 -
Lockheed Martin Corporation N00014-16-C-1029 12.RD 167,076 -
Mahlet Consulting MC001-2017 12.RD 52,182 -
Massachusetts Institute of Technology FA9550-15-1-0514 12.800 263,596 -
Nalas Engineering Systems, Incorporated N00014-16-P-1032 12.RD 54,873 -
NexGen Communications, LLC FA8750-14-D-0123 12.RD 204,901 -
Next Century Corporation 2016-16041100002 12.RD 4,025,311 -
Next Century Corporation FA8750-15-C-0138 12.RD 992,133 -
Next Century Corporation HR0011-15-C-0112 12.RD 213,936 -
Noetic Corporation HQ0034-10-A-0021 12.RD 862,523 -
North Carolina State University W911NF-16-1-0406 12.431 43,326 -
Northern California Institute for Research and Education W81XWH-12-2-0012 12.420 240,408 -
Northern California Institute for Research and Education W81XWH-13-1-0259 12.420 850,046 -
Northern California Institute for Research and Education W81XWH-14-1-0462 12.420 309,708 -
Northrop Grumman Corporation FA8650-16-C-6697 12.RD 344,383 -
Northrop Grumman Corporation FA8750-11-D-0001 T12 12.RD 5,465 -
Northrop Grumman Corporation HR0011-15-C-0046 12.RD 20,691 -
Northwestern University W911NF1610035 12.431 15,000 -
NTI W81XWH-15-2-0089 12.420 87,428 -
Oregon Health Science University 006751-00002 12.RD 19,968 -
Oregon State University W81XWH-16-1-0794 12.420 66,119 -
Pacific Architects and Engineers, Incorporated DJJ13-C-2442 12.RD 256,518 -
Premitec, Incorporated W81XWH-15-C-0182 12.420 71,176 -
Purdue University FA8750-16-2-0193 12.300 63,019 -
R-DEX Systems FA9550-16-C-0008 12.RD 154,183 -
Sandia National Laboratories DE-AC04-94AL85000 12.910 128,586 -
Soar Technology, Incorporated N00014-14-C-0307 12.RD 23,818 -
Soar Technology, Incorporated W56HZV-15-C-0188 12.RD (110) -
SRI International 2013-13083000007 12.RD 427 -
SRI International HR0011-15-C-0037 12.RD 19,031 -

University of Southern California Schedule of Expenditures of Federal Awards
Year Ended June 30, 2017
*See footnote 2.
The accompanying notes are an integral part of this Schedule.
44
SPONSOR
RESEARCH & DEVELOPMENT CLUSTER Pass-Through Entity Current Year Pass-Through Funds
PASS-THROUGH FUNDS Identifying Number CFDA* Expenditures to Sub recipients
Stanford University FA9550-12-1-0215 12.800 85,084 -
Stanford University FA9550-16-1-0051 12.800 116,394 -
Stevens Institute of Technology HQ0034-13-D-0004 12.RD 350,733 -
TechWerks HHSN316201200036W 12.RD 74,016 -
Tel-Aviv University W81XWH-16-C-0198 12.RD 9,057 -
Temple University W911NF-16-2-0189 12.431 394,592 -
Transient Plasma Systems, Incorporated FA9550-15-C-0051 12.RD 176,195 -
University Corporation For Atmospheric Research N00173-16-2-C903 12.300 65,032 -
University of Alabama at Birmingham 440362 12.RD 115,338 -
University of California Berkeley W911NF-12-1-0541 12.431 34,317 -
University of California San Diego W81XWH-08-2-0159 12.420 7,766 -
University of California San Francisco 14-10709 12.RD 75,000 -
University of California San Francisco W81XWH-14-2-0176 12.420 61,695 -
University of California San Francisco W911NF-14-2-0043 12.431 233,100 -
University of California Santa Barbara W911NF-15-1-0577 12.431 177,362 -
University of California Santa Barbara W911NF-16-1-0005 12.431 118,442 -
University of California, Los Angeles N00014-1-0051 12.300 37,970 -
University of California, Los Angeles N00014-15-1-0038 12.300 69,504 -
University of California, Los Angeles W81XWH-14-1-0491 12.420 27,065 -
University of California, Los Angeles W81XWWH-14-1-0602 12.420 26,595 -
University of Cincinnati FA8650-12-2-6B11 12.800 66,901 -
University of Colorado, Denver Anschutz Medical Campus W81XWH-15-1-0504 12.420 1,661 -
University of Illinois FA9550-16-1-0042 12.800 10,825 -
University of Maryland FA9550-15-1-0350 12.800 1,932 -
University of Maryland N000141310597 12.300 1,238 -
University of Memphis N00014-16-C-3027 12.300 778,406 -
University of New Mexico FA9453-15-1-0305 12.800 7,327 -
University of Pennsylvania FA8750-13-2-0045 12.910 118,827 -
University of Pittsburgh W81XWH-15-1-0663 12.420 226,779 -
University of Rochester N00014-15-1-2635 12.300 49,652 -
University of Utah W81XWH-15-1-0632 12.RD 468,077 -
US BioTest W81XWH-15-1-0057 12.420 157,998 -
Walter R. Mc Donald & Associates, Incorporated HHSP23337004T 12.RD 7,518 -
Westat, Incorporated HHSN261201200075C 12.RD 27,065 -
Weston Geophysical Corporation HDTRA1-11-1-0029 12.351 29,894 -

University of Southern California Schedule of Expenditures of Federal Awards
Year Ended June 30, 2017
*See footnote 2.
The accompanying notes are an integral part of this Schedule.
45
SPONSOR
RESEARCH & DEVELOPMENT CLUSTER Pass-Through Entity Current Year Pass-Through Funds
PASS-THROUGH FUNDS Identifying Number CFDA* Expenditures to Sub recipients
Zeta Associates 10-C-0064 12.RD 168,098 -
Total Department of Defense 19,756,745 442,249
Department of Education
East Los Angeles College P031C110092 - 15 84.031 60,821 -
McRel International U411C150011 84.411 63,299 -
University of California, Los Angeles CN150380 84.RD 88,563 -
University of North Carolina, Chapel Hill H325D130041-16 84.325 8,772 -
University of Pennsylvania R305C150007 84.305 87,962 -
Total Department of Education 309,417 -
Department Of Energy
Advanced Computing Technology DE-SC0011884 81.049 114,143 -
ARC Technology DE-SC0013921 81.049 24,545 -
Fermi National Accelerator Laboratory DE-AC02-07CH11359 81.RD (25) -
General Motors Corporation DE-EE0006826 81.086 291,807 -
Lawrence Berkeley Laboratory DE-AC02-05CH11231 81.RD 126,649 -
Los Angeles City-Department of Water and Power- ARRA DE OE0000192 81.122 89,461 9,984
Marine BioEnergy, Incorporated DE-AR0000689 81.135 19,263 -
Media and Process Technology, Incorporated DE-FE0013064 81.089 86,656 -
Oregon State University DE-EE0006789 81.087 33,628 -
Pennsylvania State University DE-FE0026825 81.089 234,344 -
Regents of the University of Michigan DE-EE0007077 81.086 175,052 -
Research Partnership to Secure Energy for America DE-AC26-07NT2677 81.RD (22,284) -
San Diego State University Foundation DE-SC0016484 81.049 22,995 -
Sandia National Laboratories DE-AC04-94AL85000 81.RD 4,083 -
University of Houston DE-NE0008438 81.121 120,981 -
University of Houston DE-NE0008529 81.121 95,193 -
University of Illinois at Urbana Champaign DE-SC0012504 81.049 203,459 -
University of Wisconsin, Madison DE-SC0008713 81.049 (958) -
URS Group, Incorporated DE-FE0004000 81.RD (1,410) -
US-Lawrence Livermore National Laboratory DE-AC52-07NA27344 81.RD 28,877 -
US-Oakridge National Laboratories DE-AC05-00OR22725 81.RD 250,715 -
Total Department Of Energy 1,897,174 9,984

University of Southern California Schedule of Expenditures of Federal Awards
Year Ended June 30, 2017
*See footnote 2.
The accompanying notes are an integral part of this Schedule.
46
SPONSOR
RESEARCH & DEVELOPMENT CLUSTER Pass-Through Entity Current Year Pass-Through Funds
PASS-THROUGH FUNDS Identifying Number CFDA* Expenditures to Sub recipients
Department of Health and Human Services
Academy Health 1U18HS022789-01 93.226 85,247 -
AgeneBio 3U01AG041140-05S1 93.866 49,970 -
AgeneBio U01AG041140 93.866 3,008 -
Aids United U90HA29237 93.928 254,796 -
Aids United U90HA29237-01-00 93.928 35,796 -
Albert Einstein College of Medicine of Yeshiva University 2U01AI035004-20 93.855 (3,228) -
Albert Einstein College of Medicine of Yeshiva University 5U01AI035004-22 93.855 (2,331) -
American College of Radiology Imaging Network CA80098 93.395 16,752 -
Arizona State University 1R21AG049216-01 93.866 38,480 -
Arizona State University 1U18DP006255-01 93.535 85,316 -
Arizona State University U01EB021980-01 93.286 13,090 -
Arlene Fink Associates 2R44AA022014-02 93.273 46,992 -
Banner Alzheimer's Institute 1UF1AG046150 93.866 1,688 -
Banner Alzheimer's Institute RF1AG041705 93.866 33,436 -
Banner Alzheimer's Institute UF1AG046150 93.866 15,256 -
Baylor College of Medicine 1R01CA175026-01A1 93.396 39,372 -
Baylor College of Medicine 5R01CA148748-04 93.395 1,139 -
Baylor College of Medicine 5R01CA164024-03 93.394 3,065 -
Beckman Research Institute of the City of Hope 1R01CA184585-01 93.393 17,120 -
Beckman Research Institute of the City of Hope 5UM1CA164917-04 93.393 13,348 -
Beckman Research Institute of the City of Hope 5UM1CA186717-03 93.395 103,796 -
Beckman Research Institute of the City of Hope R01CA196854 93.395 15,963 -
Beckman Research Institute of the City of Hope R03CA188549-01 93.393 1,359 -
Beckman Research Institute of the City of Hope U01CA199277 93.393 247,771 -
BioAIM 2R42AI06375-03 93.855 207,076 -
BioVinc LLC 1R41DE025789-01 93.121 16,752 -
Boston Rehabilitation Outcomes Center 5R24HD065688-04 93.865 43 -
Brigham and Women's Hospital 1R01HL118455-01A1 93.838 89,478 -
Brigham and Women's Hospital 2P01GM095467-06 93.859 194,400 -
Brigham and Women's Hospital 2UM1AI068636-08 93.855 18,173 -
Brigham and Women's Hospital 5U01HL101422-03 93.837 29,561 -
Brigham and Women's Hospital U19AG010483 93.866 5,421,258 -
Brigham and Women's Hospital U19AG010483-25R 93.866 521,350 -
Brigham and Women's Hospital UM1AI068636 93.855 280,757 -
CA-Department of Public Health 1U58DP000807-05 93.283 918,151 -

University of Southern California Schedule of Expenditures of Federal Awards
Year Ended June 30, 2017
*See footnote 2.
The accompanying notes are an integral part of this Schedule.
47
SPONSOR
RESEARCH & DEVELOPMENT CLUSTER Pass-Through Entity Current Year Pass-Through Funds
PASS-THROUGH FUNDS Identifying Number CFDA* Expenditures to Sub recipients
CA-Department of Public Health 5NU58DP003862-05-00 93.283 1,819 -
CA-Department of Public Health PS12-1201 93.940 539,906 -
California Institute of Technology 1U01NS098975-01 93.853 61,950 -
California Institute of Technology R01HD075605A 93.865 156,181 -
California Institute of Technology U41HG002223 93.172 242,112 -
California State University Fullerton 1R25MD010397-01 93.310 11,999 -
Cancer Prevention Institute of California 7R01CA154644-03 93.393 1,542 -
Cancer Prevention Institute of California R01ES026171 93.113 118,522 -
Case Western Reserve University 7U01CA188392-03 93.393 76,854 -
Case Western Reserve University R01CA197780 93.395 30,714 -
Case Western Reserve University R01DA036171 93.279 75,366 -
Cedars-Sinai Medical Center 1R01HS024284-01 93.226 154,845 -
Cedars-Sinai Medical Center 5R01HL117983-03 93.837 11,204 -
Cedars-Sinai Medical Center 5U01NS088312-02 93.853 10,844 -
Cedars-Sinai Medical Center 5U01NS088312-03 93.853 62,840 -
Cedars-Sinai Medical Center 7U01CA184826-02 93.393 16,093 -
Children's Hospital Corporation (DBA: Boston Children's Hospital) 4R01AI065617-16 93.855 58,403 -
Children's Hospital of Los Angeles 1R01HL130172-01A1 93.837 9,845 -
Children's Hospital of Los Angeles 5K12HD052954-05 93.865 (292) -
Children's Hospital of Los Angeles 5P50MH096972-03 93.242 (2) -
Children's Hospital of Los Angeles 5R01DK097115-03 93.847 23,755 -
Children's Hospital of Los Angeles 5R01GM068968-12 93.859 5,729 -
Children's Hospital of Los Angeles 5R21NS088965-02 93.853 35,434 -
Children's Hospital of Los Angeles 5U01HL117718-03 93.839 (439) -
Children's Hospital of Los Angeles 5U01HL117718-04 93.839 65,249 -
Children's Hospital of Los Angeles 5U01HL117718-05 93.839 16,868 -
Children's Hospital of Los Angeles H30MC24045 93.110 29,802 -
Children's Hospital of Los Angeles P50MH096972 93.242 25,250 -
Children's Hospital of Los Angeles R01HD070886 93.865 15,616 -
Children's Hospital of Los Angeles T77MC25732-04 93.110 3,984 -
Children's Hospital of Los Angeles U01DA036926 93.279 14,919 -
Children's Hospital of Los Angeles U01HL117718 93.839 165 -
Children's Hospital of Los Angeles U01HL117718-04 93.839 287,516 -
Children's Hospital of Los Angeles U01HL122681 93.838 20,019 -
Children's Institute, Incorporated 1H79SM063397-01 93.104 35,949 -
Children's Institute, Incorporated U79SM059940 93.243 41,792 -

University of Southern California Schedule of Expenditures of Federal Awards
Year Ended June 30, 2017
*See footnote 2.
The accompanying notes are an integral part of this Schedule.
48
SPONSOR
RESEARCH & DEVELOPMENT CLUSTER Pass-Through Entity Current Year Pass-Through Funds
PASS-THROUGH FUNDS Identifying Number CFDA* Expenditures to Sub recipients
City College of New York 1R01MH11896-01 93.242 95,493 -
City of Hope Research Institute R01CA077398 93.393 18,150 -
Cleveland Clinic Foundation R01NS089212 93.853 238,092 -
Cleveland Clinic Lerner College of Medicine UH2CA189883 93.396 9,672 -
Columbia University 5R01EY021529-04 93.867 6,050 -
Dana Farber Cancer Institute 7R01CA172067-04 93.395 19,350 -
DARTNet Institute 200-2015-87699 93.RD 22,126 -
Dr. Susan Love Research Foundation 1UH2EB019889-01 93.286 16,226 -
Dr. Susan Love Research Foundation 4UH3CA189966-03 93.396 12,083 -
DRVision Technologies LLC 1R44NS097094-01A1 93.853 41,245 -
Duke University 2U01DK065176-11 93.847 5,058 -
Duke University 4UM1AI104681-04 93.855 16,484 -
Duke University 5R18FD005292-02 93.103 5,678 -
Duke University R01DK098382 93.847 60,078 -
Duke University UM1AI104681 93.855 23,077 -
Emerson College 5R01 DC012774-03 93.173 4,527 -
Emerson College 5R01 DC012774-04 93.173 77,707 -
Emory University 3U01NS038455-14 93.853 12,463 -
Emory University 4U01NS038455-15 93.853 118,640 -
Emory University U01DA036233 93.279 12,194 -
Fred Hutchinson Cancer Research Center 1R01CA201407 93.393 218,001 -
Fred Hutchinson Cancer Research Center 4R01CA114563-10 93.394 31,261 -
Fred Hutchinson Cancer Research Center 4R01CA160872-05 93.394 9,905 -
Fred Hutchinson Cancer Research Center 5R01CA114563-09 93.394 5,391 -
Fred Hutchinson Cancer Research Center 5R01CA160872-02 93.394 7,647 -
Fred Hutchinson Cancer Research Center 5U01CA154967-06 93.395 20,008 -
Fred Hutchinson Cancer Research Center R01CA190661 93.395 19,825 -
George Washington University 5R01MH100028-04 93.242 8,551 -
George Washington University 5R01MH100028-05 93.242 315,369 -
Georgetown University 1-R21CA209213-01 93.395 12,315 -
Georgia State University 5P01HD070837-02 93.865 11,863 -
Harvard School of Public Health U01HD052102 93.865 695,521 -
Harvard University 1R56AG054066-01 93.866 2,122 -
Harvard University 3U19CA148065-04S1 93.393 (66) -
Haskins Laboratories P01HD001994 93.865 15,000 -
Henry M. Jackson Foundation R01MH102151 93.242 30,942 -

University of Southern California Schedule of Expenditures of Federal Awards
Year Ended June 30, 2017
*See footnote 2.
The accompanying notes are an integral part of this Schedule.
49
SPONSOR
RESEARCH & DEVELOPMENT CLUSTER Pass-Through Entity Current Year Pass-Through Funds
PASS-THROUGH FUNDS Identifying Number CFDA* Expenditures to Sub recipients
Howard University 5R01AG045058-03 93.701 19,428 -
Huntington Medical Research Institute 1R01NS088379-01A1 93.853 107,925 -
Icahn School of Medicine at Mount Sinai 5U01HL088942-08 93.837 81,382 -
Icahn School of Medicine at Mount Sinai 5U54NS081764-06 93.853 96,837 -
Icahn School of Medicine at Mount Sinai 7 R01 CA175491-03 93.394 59,635 -
ID Genomics, Incorporated R42AI116114 93.855 24,105 -
Indiana University 5R01AA021751-03 93.273 90,903 -
InnoSense LLC 2R44AG046059-02A1 93.866 15,705 -
Jackson Laboratory 5U41HG002273-14 93.172 (217) -
Jackson Laboratory 5U41HG002273-15 93.172 352,299 -
JAEB Center for Health Research 1UC4DK108520-01 93.847 98,763 -
Jewish Family Services of Los Angeles 90HS0001-01-00 93.048 6,221 -
John Snow, Incorporated 13567.2015.0001 93.226 27,687 -
Johns Hopkins University 1R01AG052510-01 93.866 21,122 -
Johns Hopkins University 3R01ES023780-03S1 93.113 (4,518) -
Johns Hopkins University 5 R01 AG031348-02 93.242 (3,322) -
Johns Hopkins University 5 UM1 AI068632-10 93.855 4,569 -
Johns Hopkins University 5R01CA140311-05 93.393 17,844 -
Johns Hopkins University 5R01ES023780-04 93.113 108,943 -
Johns Hopkins University 5U01NS062851-04 93.853 (13,056) -
Johns Hopkins University 5U54HD070725 93.865 9,891 -
Johns Hopkins University U10EY014660 93.867 2,921 -
Johns Hopkins University U10EY024527 93.867 8,573 -
Kaiser Foundation Research Institute 1R01CA181242-01A1 93.394 11,864 -
Kaiser Permanente Regional Office 1R01DK100302-02 93.847 50,990 -
Kaiser Permanente Regional Office 5R01DK100302-02 93.847 1,480 -
Kitware, Incorporated 2R44NS081792-03A1 93.853 1,715 -
Kitware, Incorporated R44NS081792 93.853 124,234 -
LA County Community and Senior Services A3-1314-19/A9-1314-19 93.052 317,557 -
Leidos Biomedical Research, Incorporated HHSN261200800001E 93.RD 1,390,076 -
L-Nutra, Incorporated HHSN271201400030C 93.RD 43,713 -
Massachusetts General Hospital 1U01NS090259-01A1 93.853 12,047 -
Massachusetts General Hospital 4R01EB009048-08 93.286 142,735 -
Massachusetts General Hospital U01HL123336 93.837 63,364 -
Mayo Clinic 4U01CA089600-13 93.393 12,025 -

University of Southern California Schedule of Expenditures of Federal Awards
Year Ended June 30, 2017
*See footnote 2.
The accompanying notes are an integral part of this Schedule.
50
SPONSOR
RESEARCH & DEVELOPMENT CLUSTER Pass-Through Entity Current Year Pass-Through Funds
PASS-THROUGH FUNDS Identifying Number CFDA* Expenditures to Sub recipients
Mayo Clinic 5U01AG045390-02 93.866 (105) -
Mayo Clinic 5U01AG045390-03 93.866 177,337 -
Mayo Clinic 5U01CA089600-12 93.393 5,859 -
Mayo Clinic U01CA089600 93.393 51,413 -
Mayo Clinic Jacksonville U01NS080168 93.853 570 -
Medical University of South Carolina 5U01NS057748-02 93.853 (1) -
Medical University of South Carolina 5U01NS057748-03 93.853 4,000 -
Menssana Research, Incorporated 5R44CA203019-01A1 93.RD 23,607 -
Methodist Hospital Research Institute 4R01HL115003-07 93.837 2,666 -
Methodist Hospital Research Institute R01HL115003 93.837 5,795 -
Metria Innovation, Incorporated 9R44AG052199-02A1 93.866 21,794 -
Mt. Sinai Medical Center 5U54NS081764-04 93.853 30,245 -
NEONC Technologies, Incorporated 1R41CA192419-01A1 93.395 179,843 -
Neumedicines, LLC HHSO100201100037C 93.RD 62,679 -
New England Research Institutes U01HL107407 93.837 3,169 -
North Carolina State University 5R01EB015508-04 93.286 13,024 -
North Carolina State University 5R21EY022174-02 93.867 32,487 -
Northern California Institute for Research and Education 2U19AG024904-11 93.866 2,959,155 -
Northern California Institute for Research and Education 5U01AG024904-10 93.866 1,511,428 -
Northwestern University 1P50CA180995-01A1 93.397 28,249 -
Northwestern University 1U01TR001806-01 93.350 25,945 -
Northwestern University 5R01DE015920-10 93.121 1,903 -
Northwestern University P30DA027828 93.279 40,744 -
Northwestern University U01MH097435 93.242 46,861 -
NRG Oncology Foundation, Incorporated 005685-00002 93.RD 1,709 -
NUVIEW Radiopharmaceuticals, Incorporated R41HL102891 93.837 302 -
Oregon Health Science University 5U10CA180888-03 93.395 20,112 -
Oregon Social Learning Center 5P50DA035763-04 93.279 30,384 -
Oryn Therapeutics, LLC 1R44AR068833-01 93.846 127,379 -
Park Nicollet Institute 1R21CA149934-01A1 93.393 170 -
Peking University 2R01AG037031-06A1 93.866 46,507 -
Peking University 5R01AG037031-07 93.866 39,115 -
Physical Optics Corporation HHSN268201600029C 93.RD 9,666 -
Population Council U54HD029990 93.865 4 -
Premitec, Incorporated 5R42EY018794-03 93.867 16,282 -
President and Fellows of Harvard College 3R01AG051144-02S1 93.866 24,633 -

University of Southern California Schedule of Expenditures of Federal Awards
Year Ended June 30, 2017
*See footnote 2.
The accompanying notes are an integral part of this Schedule.
51
SPONSOR
RESEARCH & DEVELOPMENT CLUSTER Pass-Through Entity Current Year Pass-Through Funds
PASS-THROUGH FUNDS Identifying Number CFDA* Expenditures to Sub recipients
President and Fellows of Harvard College 5P01DK056246-15 93.847 (11,871) -
President and Fellows of Harvard College R01AG042778 93.866 440,665 -
Princeton University 5P30AG024928-10 93.866 1,990 -
Princeton University P30AG024928 93.866 30,342 -
Proteogenomics Research Institute for Systems Medicine 1P01HL11965-01A1 93.838 (1,586) -
Proteogenomics Research Institute for Systems Medicine 5P01HL11965-02 93.838 147,789 -
Proteogenomics Research Institute for Systems Medicine 5P01HL11965-03 93.838 85,679 -
Proteris Biotech 1R41EY025890-01A1 93.867 50,396 -
Rand Corporation PO1AG008291 93.866 186,252 -
Rand Corporation R01AG035010 93.866 14,520 -
Rand Corporation R01HD067536 93.865 194,774 -
Regents of the University of Michigan 1R01AG049020-01A1 93.866 75,638 -
Regents of the University of Michigan 1R24AG054061-01A1 93.866 (8) -
Regents of the University of Michigan 1RF1AG051710-01 93.866 64,364 -
Regents of the University of Michigan 4P01CA163233-05 93.393 83,266 -
Regents of the University of Michigan 4U01AG009740-27 93.866 239,166 -
Regents of the University of Michigan 5P01CA163233-03 93.393 273 -
Regents of the University of Michigan 5P01CA163233-04 93.393 31,090 -
Regents of the University of Michigan 5P01CA163233-05 93.393 13,815 -
Regents of the University of Michigan 5R01AG040787-04 93.866 (450) -
Regents of the University of Michigan 5R24AG045061-02 93.866 88,091 -
Regents of the University of Michigan 5U01AG009740-28 93.866 8,719 -
Regents of the University of Michigan R01CA201198 93.393 144,841 -
Regents of the University of Michigan R01EY022931 93.867 65,851 -
Research, Evaluation, and Social Solutions, Incorporated 2R44MD008582-02 93.307 70,380 -
Roswell Park Cancer Institute P01CA151135 93.393 13,932 -
RSNA Research and Education Foundation HHSN268201500021C 93.RD 34,516 -
Rutgers, The State University of New Jersey U01HG007419 93.172 225,502 -
Rutgers, The State University of New Jersey U24MH068457 93.242 792,738 -
Sarcoma Alliance For Research Through Collaboration U54CA168512-04 93.397 18,883 -
Scripps Research Institute 1U24OD023176-01 93.310 36,346 -
Scripps Research Institute 5R01DE025167-03 93.121 162,725 -
Scripps Research Institute 5R01DE025167-04 93.121 3,725 -
Scripps Research Institute 5U01AA13517-15 93.273 6,560 -
Scripps Research Institute R01 GM103838 93.859 13,114 -
Southern California Institute for Research and Education 5U01AA021884-04 93.273 261,577 -

University of Southern California Schedule of Expenditures of Federal Awards
Year Ended June 30, 2017
*See footnote 2.
The accompanying notes are an integral part of this Schedule.
52
SPONSOR
RESEARCH & DEVELOPMENT CLUSTER Pass-Through Entity Current Year Pass-Through Funds
PASS-THROUGH FUNDS Identifying Number CFDA* Expenditures to Sub recipients
Southern California Institute for Research and Education U01AA021884 93.273 56,366 -
Southwest Oncology Group 5U10CA058882-20 93.395 379,079 -
Stanford University 1UM1CA167551-01A1 93.393 (1,087) -
Stanford University 5R01CA182514-02 93.395 16,778 -
Stanford University 5U54MD010724-02 93.307 19,862 -
Stanford University 5UM1CA167551 93.393 98,025 -
Stanford University R01GM117097 93.859 201,928 -
Stanford University U54HG006996 93.172 134,224 -
Stanford University U54MD010724-01 93.307 101,036 -
State University of New York at Buffalo 5 R01 DE003223-38 93.121 (24) -
Suny Downstate Medical Center 7R01MH104964-02 93.242 275,297 -
Therapeutic Systems Research Laboratories, Incorporated 2R44A1100401-03 93.855 83,022 -
Therapeutic Systems Research Laboratories, Incorporated R43AI112185 93.855 (142) -
Trustees of Columbia University in the City of New York 5R01HG003008-10 93.172 66,920 -
Tufts Medical Center U01 DK098245-02 93.847 (213) -
Tufts Medical Center U01DK098245 93.847 147,478 -
Tufts University R01EY012383-13 93.867 (1,960) -
University of Utah 5U02GM104604-02 93.859 (22,500) -
University of Alabama at Birmingham 1U01EY025858-01A1 93.857 12,843 -
University of Alabama at Birmingham HHSN27220 13000 121 93.RD 113,009 -
University of Alabama at Birmingham R01CA174683 93.395 5,178 -
University of Arizona 2P01AG026572-11 93.866 188,798 -
University of Arizona 5R01EB018921-02 93.286 32,934 -
University of Arizona HHSN261201200031I 93.RD 14,118 -
University of California Berkeley 15-IA-00850 93.RD 1,240,363 -
University of California Davis 1R01CA211602-01A1 93.394 21,418 -
University of California Davis 200-2016-91951 93.RD 36,150 -
University of California Davis R21CA204563 93.394 137,539 -
University of California Regents HHSN26620040074C 93.RD 3,120 -
University of California Riverside 1R21MH110814-01A1 93.242 1,932 -
University of California San Diego 1OT2OD024611-01 93.310 72,299 -
University of California San Diego 1R01AI114671-01A1 93.855 150,062 -
University of California San Diego 1R01DA037217-01 93.279 28,661 -
University of California San Diego 5R01MH092950 93.242 53,502 -
University of California San Diego 5U01AA022614-02 93.273 46 -

University of Southern California Schedule of Expenditures of Federal Awards
Year Ended June 30, 2017
*See footnote 2.
The accompanying notes are an integral part of this Schedule.
53
SPONSOR
RESEARCH & DEVELOPMENT CLUSTER Pass-Through Entity Current Year Pass-Through Funds
PASS-THROUGH FUNDS Identifying Number CFDA* Expenditures to Sub recipients
University of California San Diego 5U01AA022614-03 93.273 74,241 -
University of California San Diego 5U01AG024904-09 93.866 (3,668) -
University of California San Diego 5U19AG010483-25 93.866 32,553 -
University of California San Diego 5U24DA039832-02 93.279 60,120 -
University of California San Diego 5UM1AI069432-10 93.855 262,839 -
University of California San Diego 5UM1AI069432-11 93.855 173,258 -
University of California San Diego R01AG048650-01A1 93.866 283,144 -
University of California San Diego R21DA039782 93.361 15,705 -
University of California San Francisco 1R21 ES024844-01 93.113 77,839 -
University of California San Francisco 1TP2AH000045-01-00 93.297 186,441 -
University of California San Francisco 1UH3NS100544-01 93.853 3,315 -
University of California San Francisco 1UM1AI110498-01 93.855 279 -
University of California San Francisco 2R01AG038791-06A1 93.866 81,879 -
University of California San Francisco 4U01NS086090-04 93.853 318,191 -
University of California San Francisco 5R24AG048024-03 93.866 81,051 -
University of California San Francisco 5U01NS058634-05 93.853 (11) -
University of California San Francisco 5U01NS086090-03 93.853 49,141 -
University of California San Francisco R01CA197422-01A1 93.393 15,313 -
University of California San Francisco R01MH098062 93.242 169,432 -
University of California San Francisco U01NS058634 93.853 269 -
University of California San Francisco UM1AI110498 93.855 4,972 -
University of California, Irvine 1R01HL127271-01 93.837 117,656 -
University of California, Irvine 5R01HL125084-06 93.837 26,837 -
University of California, Irvine ES012243 93.113 6,340 -
University of California, Los Angeles 1K08DK107934-01A1 93.847 16,207 -
University of California, Los Angeles 1R01MH094360 93.242 (48) -
University of California, Los Angeles 1R01NR016463-01 93.361 14,677 -
University of California, Los Angeles 1R21AI109059-01A1 93.855 80,319 -
University of California, Los Angeles 2R01NS074980-06A1 93.853 61,484 -
University of California, Los Angeles 2U01DK082370-06 93.847 15,275 -
University of California, Los Angeles 2U01NS044364 93.853 (7,637) -
University of California, Los Angeles 5P30AG021684-14 93.866 9,670 -
University of California, Los Angeles 5P50DK064539-14 93.847 36,833 -
University of California, Los Angeles 5R01DE022045-04 93.121 223,593 -
University of California, Los Angeles 5R01HL118650-02 93.837 11,829 -
University of California, Los Angeles 5R01HL129727-02 93.837 44,675 -

University of Southern California Schedule of Expenditures of Federal Awards
Year Ended June 30, 2017
*See footnote 2.
The accompanying notes are an integral part of this Schedule.
54
SPONSOR
RESEARCH & DEVELOPMENT CLUSTER Pass-Through Entity Current Year Pass-Through Funds
PASS-THROUGH FUNDS Identifying Number CFDA* Expenditures to Sub recipients
University of California, Los Angeles 5R01MH101198-03 93.242 28,441 -
University of California, Los Angeles 5R01NR014669-03 93.361 23,494 -
University of California, Los Angeles 5R01NS074980-05 93.853 31,405 -
University of California, Los Angeles 5U01DK082370-06 93.847 110,952 -
University of California, Los Angeles 5U01DK082370-07 93.847 4,140 -
University of California, Los Angeles 5U01DK082370-08 93.847 160,881 -
University of California, Los Angeles 5U01MH106008-03 93.242 54,708 -
University of California, Los Angeles 5U01NS086497-04 93.853 193,526 -
University of California, Los Angeles 5UL1TR000124-05 93.350 10,000 -
University of California, Los Angeles R01DA041226 93.279 14,299 -
University of California, Los Angeles U01DK082370 93.847 7,982 -
University of California, Los Angeles U01MH106008 93.242 (297) -
University of California, Los Angeles U01NS086497 93.853 9,995 -
University of California, Los Angeles U1OHA29292 93.145 324,716 -
University of California, Los Angeles U54EB022002 93.266 473,036 -
University of California, Los Angeles U79TI025410 93.243 8,620 -
University of Chicago 5R01AI103342-02 93.855 71,775 -
University of Chicago R01HL121330 93.837 304,389 -
University of Cincinnati 5U01NS069763-04 93.853 527 -
University of Cincinnati 5U01NS069763-05 93.853 212,878 -
University of Cincinnati U01NS069763 93.853 122,750 -
University of Cincinnati Medical Center U01NS092076 93.853 7,172 -
University of Colorado 5U01DE024440-03 93.121 41,750 -
University of Colorado 5U01DE024440-04 93.121 12,796 -
University of Connecticut 1U01GM111849-01 93.859 108,330 -
University of Florida R01GM102227 93.859 43,157 -
University of Hawaii at Honolulu 5UM1CA164973-03 93.393 (3,009) -
University of Hawaii at Honolulu P01CA168530 93.393 219,938 -
University of Hawaii at Honolulu U01CA164973 93.393 1,857,266 -
University of Illinois at Chicago 5R01EY022651-05 93.867 61,002 -
University of Kansas 1R21HD082484-01 93.865 28,332 -
University of Kansas Center for Research Incorporated 5R01MH104603-02 93.242 (469) -
University of Maryland 5P30DK090868-06 93.847 (10) -
University of Maryland 5P50MH103222-03 93.242 47,852 -
University of Maryland 90C01121 93.652 44,271 -

University of Southern California Schedule of Expenditures of Federal Awards
Year Ended June 30, 2017
*See footnote 2.
The accompanying notes are an integral part of this Schedule.
55
SPONSOR
RESEARCH & DEVELOPMENT CLUSTER Pass-Through Entity Current Year Pass-Through Funds
PASS-THROUGH FUNDS Identifying Number CFDA* Expenditures to Sub recipients
University of Medicine and Dentistry of New Jersey 5R01NS038384-08 93.853 66,636 -
University of Miami 1R01NS096212-01A1 93.853 52,327 -
University of Minnesota 2P01CA138338-06 93.393 55,216 -
University of Minnesota P01CA138338 93.393 51,304 -
University of Nebraska Medical Center 5R01AG037120-03 93.866 80 -
University of Nebraska Medical Center R01AG037120 93.866 1,351 -
University of Nevada, Las Vegas 1R01HD087994 93.865 45,332 -
University of New South Wales R01CA172404 93.393 15,369 -
University of North Carolina, Chapel Hill 1R01DK101855-01 93.847 119,705 -
University of North Carolina, Chapel Hill 4U10HD077844-04 93.865 99,189 -
University of North Carolina, Chapel Hill 7R01EB014354-02 93.286 28,931 -
University of North Texas Fort Worth 1R56AG054073-01 93.866 107,919 -
University of Oklahoma Health Sciences Center R56AI078993 93.855 2,656 -
University of Pennsylvania 1R01DK105155-01A1 93.847 53,928 -
University of Pennsylvania 5R01EY023557-03 93.867 67,992 -
University of Pennsylvania 5R01EY023557-04 93.867 33,582 -
University of Pennsylvania 5R01MH075916-06 93.242 110,841 -
University of Pittsburgh 1R56HL128134-01A1 93.837 4,788 -
University of Pittsburgh 2R01AG034852-06 93.866 29,212 -
University of Pittsburgh 5U01AG051406-02 93.866 128,937 -
University of Pittsburgh R01NS037704 93.853 32,816 -
University of Pittsburgh U01AG051406 93.866 256,416 -
University of Pittsburgh Medical Center 1R01CA196953 93.395 21,365 -
University of Rochester Medical Center R01MH091452 93.242 26,929 -
University of South Florida R01CA164147 93.113 4 -
University of Texas 1R01MH085667-02 93.242 102,633 -
University of Texas 3U01HL077863-06S2 93.837 (12,205) -
University of Texas 5U01HL077863-11 93.837 283,039 -
University of Texas K12HD055929 93.865 269,691 -
University of Texas Health Science Center at San Antonio 1R21AI129883-01 93.855 8,220 -
University of Texas Health Science Center at San Antonio 1R21AI130668-01 93.855 8,220 -
University of Texas Medical Branch P2CHD065702 93.865 9,925 -
University of Utah 1U02GM104604-01 93.859 (2,496) -
University of Utah 4U02GM104604-05 93.859 236,528 -
University of Utah 5R01MH104964-03 93.242 219,523 -
University of Utah 5R34DA034860-03 93.279 35,179 -

University of Southern California Schedule of Expenditures of Federal Awards
Year Ended June 30, 2017
*See footnote 2.
The accompanying notes are an integral part of this Schedule.
56
SPONSOR
RESEARCH & DEVELOPMENT CLUSTER Pass-Through Entity Current Year Pass-Through Funds
PASS-THROUGH FUNDS Identifying Number CFDA* Expenditures to Sub recipients
University of Utah 5U02GM104604-04 93.859 162,189 -
University of Virginia 1R01CA207260-01A1 93.393 1,906 -
University of Virginia 7R01CA204279-02 93.393 177,100 -
University of Washington 2R01AA018673-06A1 93.273 128,088 -
University of Washington 5R01AA018673 93.273 45,682 -
University of Washington 5U01AG016976-18 93.866 7,452 -
University of Washington 7U01CA194393-02 93.393 43,901 -
University of Wisconsin, Madison 4R01MH081884-08 93.242 11,291 -
University of Wisconsin, Milwaukee 5R01CA136861-06 93.393 5,595 -
Van Andel Research Institute 1R35CA209859-01 93.393 54,592 -
Van Andel Research Institute 5R01CA082422-17 93.393 135,886 -
Vanderbilt University R01CA202981 93.393 70,799 -
Vanderbilt University Medical Center 5R01AG047992-03 93.866 862,896 -
Vanderbilt University Medical Center R01HS022640-01 93.226 109,651 -
Virtually Better, Incorporated 1R43MH104102-01 93.242 5,591 -
Virtually Better, Incorporated 2R42MH094019-03 93.242 43,533 -
Wake Forest University R01HD084606 93.865 34,632 -
Wake Forest University R21 AG051113 93.866 25,667 -
Wake Forest University Health Sciences RF1AG041845-02 93.866 7,259,146 -
Walter R. Mc Donald & Associates, Incorporated HHSP23337004T 93.RD 15,450 -
Washington University In St. Louis 1R01NS089932-01A 93.853 281,883 -
Washington University School of Medicine 1R56AG053267-01 93.866 59,414 -
Washington University School of Medicine R01CA211711 93.394 31,239 -
Westat, Incorporated HHSN261201200075C 93.RD 66,100 -
Westat, Incorporated HHSN275201300003C 93.RD 1,600,015 -
Yale University 2 U01 NS044876-07 93.853 4,441 -
Yale University UH3TR000967 93.310 3,232,243 -
Yale University 5R01MH100028-03 93.242 (3,484) -
Yale University 5U10HD055925-09 93.865 3,237 -
Total Department of Health and Human Services 53,632,461 -

University of Southern California Schedule of Expenditures of Federal Awards
Year Ended June 30, 2017
*See footnote 2.
The accompanying notes are an integral part of this Schedule.
57
SPONSOR
RESEARCH & DEVELOPMENT CLUSTER Pass-Through Entity Current Year Pass-Through Funds
PASS-THROUGH FUNDS Identifying Number CFDA* Expenditures to Sub recipients
Department of Homeland Security
Carnegie Mellon University 2009-ST-CCI002-07 97.061 (176) -
Rutgers, The State University of New Jersey 2009-ST-0061-CCI002 97.061 557 -
University of Illinois at Urbana Champaign 2015-ST-061-CIRC01 97.061 275,889 -
Wake Forest University N66001-14--C-4016 97.034 73,226 -
Total Department of Homeland Security 349,496 -
Department of State
Creative Associates International S-NEAAC-16-GR-1029 19.222 56,537 -
Total Department of State 56,537 -
Department Of The Interior
SRI International D11PC20066 15.RD 19,317 -
Total Department Of The Interior 19,317 -
Department of Transportation
California State University Long Beach Foundation DTFH61-14-H-00026 20.200 36,532 -
Michigan State University DTFH61-13-H-00009 20.200 113,352 -
University of California Regents DTRT13-G-UTC29 20.701 348,485 -
Total Department of Transportation 498,369 -
Institute of Museum and Library Services
Crystal Bridges Museum of American Art MG-30-15-0064-15 45.312 35,121 -
Total Institute of Museum and Library Services 35,121 -
National Aeronautics and Space Administration
Black Swift Technologies NNX13CG33P 43.001 1 -
Massachusetts Institute of Technology NNX15AM91A 43.002 35,972 -
Massachusetts Institute of Technology NNX16AK25A 43.002 87,896 -
Princeton University NNX17AB04G 43.001 10,395 -
University of California San Diego NNX15AP87H 43.008 3,011 -
University of Colorado NAS5-02140 43.002 216,890 -
University of Colorado NNX17AC59A 43.001 9,256 -
US-Jet Propulsion Laboratory, California Institute of Technology NMO711048 43.RD 125,301 -
US-Jet Propulsion Laboratory, California Institute of Technology NNN12AA01C 43.001 714,159 -
Total National Aeronautics and Space Administration 1,202,881 -

University of Southern California Schedule of Expenditures of Federal Awards
Year Ended June 30, 2017
*See footnote 2.
The accompanying notes are an integral part of this Schedule.
58
SPONSOR
RESEARCH & DEVELOPMENT CLUSTER Pass-Through Entity Current Year Pass-Through Funds
PASS-THROUGH FUNDS Identifying Number CFDA* Expenditures to Sub recipients
National Science Foundation
Alelo TLT, LLC 1549752 47.041 45,958 -
American Educational Research Association DRL-0941014 47.076 23,667 -
American Physical Society OMA-1649297 47.049 39,651 -
Asia-Pacific Network ICER-1348085 47.050 36,226 -
Association of American Universities DUE-1432766 47.076 114,251 -
California Institute of Technology 1240626 47.074 13,402 -
Clemson University ACI-1341935 47.070 347,319 -
Cornell University CCF-1522054 47.070 37,019 -
Corporation for Education Network Initiatives in California ACI-1451050 47.070 28,205 -
Dartmouth College GEO-1010280 47.050 1,796 -
Florida International University 1638990 47.070 10,329 -
Florida International University ACI-1451018 47.070 70,400 -
Florida International University ACI-1451024 47.070 32,803 -
Florida International University AST-1202910 47.049 79,384 -
Florida International University CNS-1724805 47.070 12,183 -
Gallaudet University 1547178 47.070 127,628 -
Galois, Incorporated H98230-15-C-0265 47.RD 2,904 -
Greater Washington Educational Telecommunications Assoc. 1516347 47.076 23,409 -
Hauptman-Woodward Institute 1231306 47.074 49,897 -
Iowa State University CNS-1528731 47.070 32,002 -
Pennsylvania State University IIS-1344272 47.070 30,051 -
Prosapia Genetics, LLC IIP-1622840 47.041 84,950 -
Raytheon BBN Technologies W911NF-09-2-0053 47.070 64,509 -
R-DEX Systems IIP-1622777 47.041 108,584 -
Reach Bionics, Incorporated IIP-1330971 47.041 6 -
Regents of the University of Michigan CCF-1111061 47.070 2,419 -
Silicon Ribbon, LLC 1622922 47.050 133,398 -
Syracuse University ACI-1443047 47.070 53,162 -
Texas A&M University BCS-1461766 47.075 11,213 -
The American Association for the Advancement of Science DUE-1548986 47.076 14,952 -
The Spirituality Network, Incorporated IIP-1431024 47.041 69,465 -
Trustees of Columbia University in the City of New York OCE 14-50528 47.050 31,524 -
University of Arizona EEC-0812072 47.041 36,202 -
University of California Berkeley CMMI-1612843 47.041 60,707 -
University of California Riverside 1135455 47.050 1,246 -

University of Southern California Schedule of Expenditures of Federal Awards
Year Ended June 30, 2017
*See footnote 2.
The accompanying notes are an integral part of this Schedule.
59
SPONSOR
RESEARCH & DEVELOPMENT CLUSTER Pass-Through Entity Current Year Pass-Through Funds
PASS-THROUGH FUNDS Identifying Number CFDA* Expenditures to Sub recipients
University of California Santa Barbara DRL-1417601 47.076 28,753 -
University of California, Los Angeles SES-1427469 47.075 43,793 -
University of Illinois at Urbana Champaign ACI-1548562 47.070 58,510 -
University of Illinois at Urbana Champaign H98230-14-C-0141 47.RD 76,799 -
University of Illinois at Urbana Champaign OCI-1053575 47.070 14,631 -
University of New Hampshire CMMI-1135026 47.041 (71) -
University of Texas at Austin CMMI-1520817 47.041 67,087 -
University of Wisconsin, Madison PHY-1148698 47.049 189,518 -
Utah State University AGS-1329544 47.050 18,419 -
Virginia Polytechnic Institute State University ACI-1547580 47.070 78,688 -
Virginia Polytechnic Institute State University CNS-1617203 47.070 6,711 -
Virginia Polytechnic Institute State University IOS-1645740 47.074 8,712 -
Yale University 1712674 47.070 13,087 -
Yale University EFMA-1542815 47.041 27,139 -
Total National Science Foundation 2,462,597 -
Social Security Administration
Regents of the University of Michigan RRC08098401 96.007 92,178 -
Total Social Security Administration 92,178 -
Total Research & Development Cluster - Pass-Through
Funds
82,116,561 452,233
Total Research & Development Cluster - Direct Awards and Pass-Through Funds 453,186,908$ 66,502,926$

University of Southern California Schedule of Expenditures of Federal Awards
Year Ended June 30, 2017
*See footnote 2.
The accompanying notes are an integral part of this Schedule.
60
SPONSOR Current Year
STUDENT FINANCIAL ASSISTANCE CLUSTER CFDA* Expenditures
Department of Education
Office of Federal Student Aid
Federal Direct Student Loans 84.268 577,576,141$
Federal Pell Grant Program 84.063 18,547,016
Federal Work-Study Program 84.033 4,755,355
Federal Perkins Loans
Federal Perkins Loans as of July 1, 2016 84.038 47,853,919
New loans issued during 2017 84.038 7,307,179
Administrative cost allowance 84.038 275,000
Federal Supplemental Educational Opportunity Grants 84.007 2,694,050
Total Department of Education 659,008,660
Department of Health and Human Services
Health Resources and Services Administration
Scholarships for Health Professions Students from Disadvantaged Backgrounds 93.925 650,000
Health Professional Student Loans
Health Professional Student Loans as of July 1, 2016 93.342 13,124,515
New loans issued during 2017 93.342 2,936,143
Loans for Disadvantaged Students
Loans for Disadvantaged Students as of July 1, 2016 93.342 1,500,217
New loans issued during 2017 93.342 225,000
Total Department of Health and Human Services 18,435,875
Total Student Financial Assistance Cluster 677,444,535$

University of Southern California Schedule of Expenditures of Federal Awards
Year Ended June 30, 2017
*See footnote 2.
The accompanying notes are an integral part of this Schedule.
61
SPONSOR
OTHER PROGRAMS Pass-Through Entity Current Year Pass-Through Funds
DIRECT AWARDS Identifying Number CFDA* Expenditures to Sub recipients
TRIO Cluster
Department of Education
TRIO- Talent Search 84.044 824,518$ -$
TRIO- Upward Bound 84.047 1,862,686 -
Total TRIO Cluster 2,687,204 -
Other Programs
Department of Health and Human Services
Coordinated Services and Access to Research for
Women, Infants, Children, and Youth
93.153 797,976 -
Grants to Provide Outpatient Early Intervention
Services with Respect to HIV Disease
93.918 146,522 -
Head Start 93.600 5,615,350 266,320
Total Department of Health and Human
Services
6,559,848 266,320
Total Other Programs - Direct Awards 9,247,052 266,320
PASS-THROUGH FUNDS
Foreign Food Aid Donation Cluster
Agency for International Development
USAID for International Development AID-OAA-I-15-00011 98.U01 91,564 -
Total Foreign Food Aid Donation Cluster 91,564 -
Health Center Program Cluster
Health Center Program
Health Center Program (Community Health Centers,
Migrant Health Centers, Health Care for the
Homeless, and Public Housing Primary Care)
H80CS00139 93.224 461,740 -
Total Health Center Program Cluster 461,740 -
Other Programs
Corporation for National and Community Service
AmeriCorps CFDA-94.006-JS-SITE #91 94.006 52,730 -
Total Corporation for National and
Community Service 52,730 -

University of Southern California Schedule of Expenditures of Federal Awards
Year Ended June 30, 2017
*See footnote 2.
The accompanying notes are an integral part of this Schedule.
62
SPONSOR
OTHER PROGRAMS Pass-Through Entity Current Year Pass-Through Funds
PASS-THROUGH FUNDS Identifying Number CFDA* Expenditures to Sub recipients
Department of Education
Teacher and School Leader Incentive Grants (formerly
the Teacher Incentive Fund)
S374A120066 84.374 93,986 -
Total Department of Education 93,986 -
Department of Health and Human Services
Foster Care_Title IV-E 14-2025 93.658 (13,833) -
HIV Care Formula Grants H89HA00016-21 93.917 525,356 -
Block Grants for Prevention and Treatment of
Substance Abuse
T1023865 93.959 (8,948) -
Total Department of Health and Human
Services
502,575 -
Total Other Programs - Pass-Through Funds 1,202,595 -
Total Other Programs - Direct Awards and
Pass-Through Funds 10,449,647 266,320
TOTAL FEDERAL PROGRAMS 1,141,081,090$ 66,769,246$

University of Southern California Notes to Schedule of Expenditures of Federal Awards
Year Ended June 30, 2017
63
1. Summary of Significant Accounting Policies
Basis of Presentation The accompanying Schedule of Expenditures of Federal Awards (the “Schedule”) includes the Federal grant transactions of the University of Southern California (“The University”) recorded on the accrual basis of accounting. The information in this Schedule is presented in accordance with the requirements of Title 2 U.S. Code of Federal Regulations Part 200, Uniform Administrative Requirements, Cost Principles, and Audit Requirements for Federal Awards (Uniform Guidance). Because the Schedule presents only a selected portion of the operations of the University, it is not intended to and does not present the financial position, changes in net assets, or cash flows of the University.
Subrecipients and Pass-through Funding Certain funds are passed through to subgrantee organizations by the University. Expenditures incurred by the subgrantees and reimbursed by the University are presented in the Schedule. The University is also the subrecipient of federal funds which are reported as expenditures and listed as federal pass-through funds.
Negative Balances Amounts reflected as negative balances represent adjustments to prior periods.
2. CFDA Numbers
Research and Development ("R&D") programs included in the Schedule are presented by federal agency. Pass-through and partial pass-through awards have been presented by pass-through entity and federal identification number or sponsor's award number, when available. When federal program identification numbers are not available, federal awards are presented by federal agency number and “RD” is utilized for the federal identification number. For programs not included within the Research and Development Cluster, if the federal program identification number is unknown, then “U” followed by an assigned number is used.

University of Southern California Notes to Schedule of Expenditures of Federal Awards
Year Ended June 30, 2017
64
2. CFDA Numbers (Continued)
The following table below provides additional identification numbers for those R&D direct award programs where CFDA information was unknown:
Sponsor
Research & Development Cluster Entity Identifying Current Year
Direct Awards Number CFDA Expenditures
Department of Defense 005492-00001 12.RD 266,000
Department of Defense 007101-00001 12.RD 20,000
Department of Defense 2014-14071600011 12.RD 2,736,973
Department of Defense 2014-14080800011 12.RD 663,759
Department of Defense 2015-15082600001 12.RD 73,080
Department of Defense 2016-16070100002 12.RD 265,260
Department of Defense 2017-17020200005 12.RD 441,049
Department of Defense CRS# 16-02 12.RD 6,310
Department of Defense D14PC00011 12.RD 3,878
Department of Defense FA8650-15-C-9102 12.RD 52,824
Department of Defense FA8650-17-C-9112 12.RD 1,669,637
Department of Defense FA8750-14-C-0240 12.RD 2,607,455
Department of Defense FA8750-15-C-0203 12.RD 379,804
Department of Defense FA8750-16-C-0112 12.RD 3,215,490
Department of Defense FA8750-17-C-0011 12.RD 224,799
Department of Defense FA8750-17-C-0106 12.RD 75,891
Department of Defense FA9453-15-C-0065 12.RD 186,028
Department of Defense G15PX01338 12.RD 5,311
Department of Defense H98230-16-C-0255 12.RD 113,846
Department of Defense H98230-16-C-0782 12.RD 99,536
Department of Defense HDTRA1-14-C-0126 12.RD 663,882
Department of Defense HHSF223201400115C 12.RD 2,066,809
Department of Defense HHSN26800001 12.RD 1,000
Department of Defense HHSN268201500017C 12.RD 33,859
Department of Defense HHSO100201600044P 12.RD 116,547
Department of Defense HHSP233201600010C 12.RD 386,657
Department of Defense HR0011-12-C-0094 12.RD 815,693
Department of Defense HR0011-15-C-0096 12.RD 2,068,547
Department of Defense HR0011-15-C-0115 12.RD 2,549,551
Department of Defense HR0011-16-C-0017 12.RD 11,335,183
Department of Defense HR0011-16-C-0039 12.RD 546,664
Department of Defense HR0011-16-C-0043 12.RD 907,137
Department of Defense HSBP1016J00813 12.RD 300,332
Department of Defense HSQDC-16-J-00467 12.RD 274,105
Department of Defense HSTS03-16-J-FLT014 12.RD 439,361
Department of Defense N00014-12-C-0130 12.RD (57)
Department of Defense N00104-12-D-Q337 12.RD 102,251
Department of Defense N00244-16-D-0056 12.RD 50,144
Department of Defense N62271-16-M-1018 12.RD 65,053

University of Southern California Notes to Schedule of Expenditures of Federal Awards
Year Ended June 30, 2017
65
2. CFDA Numbers (Continued)
Sponsor
Research & Development Cluster Entity Identifying Current Year
Direct Awards Number CFDA Expenditures
Department of Defense N62271-16-M-1150 12.RD 115,993
Department of Defense N66001-10-C-2018 12.RD (62)
Department of Defense N66001-12-C-4044 12.RD (457)
Department of Defense NRO000-14-C-0336 12.RD -
Department of Defense NRO000-16-C-0255 12.RD 392,874
Department of Defense W81XWH-16-C-0086 12.RD 473,621
Department of Defense W911NF-04-D-0005 12.RD 26,657
Department of Defense W911NF-04-D-0005-0003 12.RD (79)
Department of Defense W911NF-04-D-0005-0026 12.RD (481)
Department of Defense W911NF-04-D-0005-0028 12.RD 41
Department of Defense W911NF-04-D-0005-0036 12.RD 83,001
Department of Defense W911NF-04-D-0005-0041 12.RD 98
Department of Defense W911NF-04-D-0005-0046 12.RD 405,963
Department of Defense W911NF-14-D-0005-0001 12.RD 10,788,699
Department of Defense W911NF-14-D-0005-0002 12.RD 2,783,348
Department of Defense W911NF-14-D-0005-0003 12.RD 48,294
Department of Defense W911NF-14-D-0005-0005 12.RD 2,166,690
Department of Defense W911NF-14-D-0005-0006 12.RD 3,126,021
Department of Defense W911NF-14-D-0005-0007 12.RD 1,776,102
Department of Defense W911NF-14-D-0005-0008 12.RD 2,201,195
Department of Defense W911NF-16-C-0033 12.RD 371,056
Department of Defense W911NF-16-C-0034 12.RD 356,167
Department of Defense W912HQ-14-C-0051 12.RD 295,653 Total Department of Defense 12.RD 61,240,045
Department of Health and Human Services
Total Department of Health and Human Services 93.RD 3,859,323
Department of Homeland Security
Department of Homeland Security D15PC00184 97.RD 744,319
Department of Homeland Security EMW-2015-CA-00228-S01 97.RD 131,144
Department of Homeland Security HSFE20-15-C-0232 97.RD 233,058
Department of Homeland Security HSFE20-15-C-0234 97.RD 56,653
Department of Homeland Security HSHQDC-16-C-00024 97.RD 3,007,223 Total Department of Homeland Security 97.RD 4,172,397
93.RD
93.RD
93.RD
28,173
137,928
3,693,222
Department of Health and Human
Services
Department of Health and Human
Services
Department of Health and Human
Services
HHSN26100006
HHSN26100007
HHSN261201300004I

University of Southern California Notes to Schedule of Expenditures of Federal Awards
Year Ended June 30, 2017
66
2. CFDA Numbers (Continued)
Sponsor
Research & Development Cluster Entity Identifying Current Year
Direct Awards Number CFDA Expenditures
Department of the Interior
Department of the Interior D14PC00011 15.RD 68,116 Total Department of the Interior 15.RD 68,116
Department of Veterans Affairs
Department of Veterans Affairs VA260-16-P-0314 64.RD 137,298 Total Department of Veterans Affairs 64.RD 137,298
National Science Foundation
National Science Foundation CHE-1555387 47.RD 183,333 Total National Science Foundation 47.RD 183,333
3. Facilities and Administration Rates
The University has elected not to use the 10% de minimis indirect cost rate allowed under the Uniform
Guidance.
The predetermined Facilities & Administration fixed rates for the year ended June 30, 2017 were based
on fiscal year 2009 financial information and were reviewed by the Department of Health and Human
Services for compliance with applicable cost principles.
For the year ended June 30, 2017, the base Facilities and Administration (Indirect Cost) Rate for on
campus research was 65% of Modified Total Direct Cost (“MTDC”). Off-campus Facilities and
Administration Rates were 26% for the Information Sciences Institute ("ISI"), Institute for Creative
Technologies ("ICT") and all other off-campus projects.
4. Loans Outstanding
The following schedule represents loans outstanding as of June 30, 2017:
Loans
Outstanding
Federal Perkins Loans 47,219,059$
Health Professional Student Loans 12,879,595
Loans for Disadvantaged Students 1,291,647

University of Southern California Notes to Schedule of Expenditures of Federal Awards
Year Ended June 30, 2017
67
5. Commingled Assistance
The California Student Aid Commission (CSAC) administers the State Cal Grant A and B Programs,
selects the student recipients of these grant awards, and provides funds to participating institutions for
disbursement. Federal Temporary Assistance for Needy Families (TANF) funds, CFDA Number 93.558,
from the United States Department of Health and Human Services may comprise up to approximately
46% of the total funding for these Cal Grant awards. In fiscal year 2017, the University received Cal
Grant A and B funds in the amount of $20,966,885; however, CSAC is unable to determine the exact
amount of TANF funds, if any, represented in those awards. Therefore, the Schedule does not include
State Cal Grant A and B awards.

Report of Independent Auditors on Internal Control Over Financial Reporting and on Compliance and Other Matters Based on an Audit of Financial Statements Performed in
Accordance with Government Auditing Standards
To the Board of Trustees of the University of Southern California
We have audited, in accordance with auditing standards generally accepted in the United States of America and the standards applicable to financial audits contained in Government Auditing Standards issued by the Comptroller General of the United States, the consolidated financial statements of the University of Southern California and its subsidiaries (“The “University”), which comprise the consolidated balance sheets as of June 30, 2017, and the related consolidated statements of activities and cash flows for the year then ended, and the related notes to the financial statements, and have issued our report thereon dated October 12, 2017.
Internal Control Over Financial Reporting
In planning and performing our audit of the financial statements, we considered the University’s internal control over financial reporting (“internal control”) to determine the audit procedures that are appropriate in the circumstances for the purpose of expressing our opinion on the financial statements, but not for the purpose of expressing an opinion on the effectiveness of the University’s internal control. Accordingly, we do not express an opinion on the effectiveness of the University’s internal control.
A deficiency in internal control exists when the design or operation of a control does not allow management or employees, in the normal course of performing their assigned functions, to prevent, or detect and correct, misstatements on a timely basis. A material weakness is a deficiency, or a combination of deficiencies, in internal control such that there is a reasonable possibility that a material misstatement of the entity's financial statements will not be prevented, or detected and corrected on a timely basis. A significant deficiency is a deficiency, or a combination of deficiencies, in internal control that is less severe than a material weakness, yet important enough to merit attention by those charged with governance.
Our consideration of internal control was for the limited purpose described in the first paragraph of this section and was not designed to identify all deficiencies in internal control that might be material weaknesses or significant deficiencies. Given these limitations, during our audit we did not identify any deficiencies in internal control that we consider to be material weaknesses. However, material weaknesses may exist that have not been identified.
Compliance and Other Matters
As part of obtaining reasonable assurance about whether the University’s financial statements are free from material misstatement, we performed tests of its compliance with certain provisions of laws, regulations, contracts and grant agreements, noncompliance with which could have a direct and material effect on the determination of financial statement amounts. However, providing an opinion on compliance with those provisions was not an objective of our audit, and accordingly, we do not express such an opinion. The results of our tests disclosed no instances of noncompliance or other matters that are required to be reported under Government Auditing Standards.
PricewaterhouseCoopers LLP, 601 South Figueroa, Los Angeles, CA 90017 T: (213) 356 6000, F: (813) 637 4444, www.pwc.com/us

69
Purpose of this Report
The purpose of this report is solely to describe the scope of our testing of internal control and compliance and the results of that testing, and not to provide an opinion on the effectiveness of the University’s internal control or on compliance. This report is an integral part of an audit performed in accordance with Government Auditing Standards in considering the University’s internal control and compliance. Accordingly, this communication is not suitable for any other purpose.
October 12, 2017

Report of Independent Auditors on Compliance with Requirements That Could Have a Direct and Material Effect on Each Major Program and on Internal
Control Over Compliance in Accordance with the OMB Uniform Guidance
To the Board of Trustees of the
University of Southern California
Report on Compliance for Each Major Federal Program
We have audited the University of Southern California and its subsidiaries (“The University”) compliance
with the types of compliance requirements described in the OMB Compliance Supplement that could have
a direct and material effect on each of the University’s major federal programs for the year ended June 30,
2017. The University’s major federal programs are identified in the summary of auditor's results section
of the accompanying schedule of findings and questioned costs.
Management’s Responsibility
Management is responsible for compliance with federal statutes, regulations and the terms and conditions of its federal awards applicable to its federal programs.
Auditors’ Responsibility
Our responsibility is to express an opinion on compliance for each of the University’s major federal
programs based on our audit of the types of compliance requirements referred to above. We conducted
our audit of compliance in accordance with auditing standards generally accepted in the United States of
America; the standards applicable to financial audits contained in Government Auditing Standards,
issued by the Comptroller General of the United States; and the audit requirements of Title 2 U.S. Code of
Federal Regulations Part 200, Uniform Administrative Requirements, Cost Principles, and Audit
Requirements for Federal Awards (Uniform Guidance). Those standards and the Uniform Guidance
require that we plan and perform the audit to obtain reasonable assurance about whether noncompliance
with the types of compliance requirements referred to above that could have a direct and material effect
on a major federal program occurred. An audit includes examining, on a test basis, evidence about the
University’s compliance with those requirements and performing such other procedures as we considered
necessary in the circumstances.
We believe that our audit provides a reasonable basis for our opinion on compliance for each major federal program. However, our audit does not provide a legal determination of the University’s compliance.
Opinion on Each Major Federal Program
In our opinion, the University of Southern California and its subsidiaries complied, in all material respects, with the types of compliance requirements referred to above that could have a direct and material effect on each of its major federal programs for the year ended June 30, 2017.
PricewaterhouseCoopers LLP, 601 South Figueroa, Los Angeles, CA 90017 T: (213) 356 6000, F: (813) 637 4444, www.pwc.com/us
71
Other Matters
The results of our auditing procedures disclosed instances of noncompliance, which are required to be reported in accordance with the Uniform Guidance and which are described in the accompanying schedule of findings and questioned costs as items 2017-001 and 2017-002. Our opinion on each major federal program is not modified with respect to these matters.
The University’s response to the noncompliance findings identified in our audit is described in the accompanying Management’s Views and Corrective Action Plan. The University’s response was not subjected to the auditing procedures applied in the audit of compliance and, accordingly, we express no opinion on the response.
Report on Internal Control Over Compliance
Management of the University is responsible for establishing and maintaining effective internal control
over compliance with the types of compliance requirements referred to above. In planning and
performing our audit of compliance, we considered the University’s internal control over compliance with
the types of requirements that could have a direct and material effect on each major federal program to
determine the auditing procedures that are appropriate in the circumstances for the purpose of expressing
an opinion on compliance for each major federal program and to test and report on internal control over
compliance in accordance with the Uniform Guidance, but not for the purpose of expressing an opinion
on the effectiveness of internal control over compliance. Accordingly, we do not express an opinion on the
effectiveness of the University's internal control over compliance.
A deficiency in internal control over compliance exists when the design or operation of a control over
compliance does not allow management or employees, in the normal course of performing their assigned
functions, to prevent, or detect and correct, noncompliance with a type of compliance requirement of a
federal program on a timely basis. A material weakness in internal control over compliance is a
deficiency, or combination of deficiencies, in internal control over compliance, such that there is a
reasonable possibility that material noncompliance with a type of compliance requirement of a federal
program will not be prevented, or detected and corrected, on a timely basis. A significant deficiency in
internal control over compliance is a deficiency, or a combination of deficiencies, in internal control over
compliance with a type of compliance requirement of a federal program that is less severe than a material
weakness in internal control over compliance, yet important enough to merit attention by those charged
with governance.
Our consideration of internal control over compliance was for the limited purpose described in the first
paragraph of this section and was not designed to identify all deficiencies in internal control over
compliance that might be material weaknesses or significant deficiencies. We did not identify any
deficiencies in internal control over compliance that we consider to be material weaknesses. However,
material weaknesses may exist that have not been identified.
The purpose of this report on internal control over compliance is solely to describe the scope of our testing of internal control over compliance and the results of that testing based on the requirements of the Uniform Guidance. Accordingly, this report is not suitable for any other purpose.
March 23, 2018

University of Southern California Schedule of Findings and Questioned Costs
For the Year Ended June 30, 2017
72
Section I – Summary of Auditor’s Results
Financial Statements
Type of auditor’s report issued: Unmodified
Internal control over financial reporting:
Material weakness(es) identified? ____ yes __x _ no
Significant deficiency(ies) identified that are not
considered to be material weaknesses?
____ yes
__x _ none reported
Noncompliance material to the financial statements
noted?
____ yes
__x _ no
Federal Awards
Internal control over major programs:
Material weakness(es) identified? ____ yes __x_ no
Significant deficiency(ies) identified that are not
considered to be material weaknesses?
____yes
__x_ none reported
Type of auditor’s report issued on compliance
for major programs: Unmodified
Any audit findings disclosed that are required to be
reported in accordance with 2 CFR 200.516(a)?
__x_ yes
__ _ no
Identification of major programs:
CFDA Number(s)
Various
Various
93.600
Dollar threshold used to distinguish between type A
and type B programs:
Name of Federal Program or Cluster
Research and Development Cluster
Student Financial Assistance Cluster
Head Start
$_3,423,243_
Auditee qualified as low-risk auditee?
___x_ yes
____ no
Section II – Financial Statement Findings
None noted

University of Southern California Schedule of Findings and Questioned Costs
For the Year Ended June 30, 2017
73
Section III – Federal Award Findings and Questioned Costs
Finding 2017-001: Direct Loan Limits Exceeded
Federal Awarding Agency: Department of Education Cluster: Student Financial Assistance Program names and specific award name: Federal Direct Student Loans CFDA #: 84.268 Award #: P268K161192 Award Years: Academic Year 2016 – 2017
Criteria 34 CFR 685.203 establishes Direct Loan limits that should not be exceeded.
Condition We selected a sample of 60 students for testing from a total population of 19,351 students who were awarded Title IV assistance and tested the students for various eligibility requirements across their respective aid awards. Of the students tested, we identified one student as having been overawarded Federal Direct Unsubsidized Loans for the student’s program of study. From the population of all students within this program, it was determined 69 additional students, for a total of 70 students, were also affected. Cause The error was determined to have occurred primarily due to an incorrect “packaging type” designation
assigned to the student within the Student Information System (SIS). The Financial Aid Office assigns a
packaging type to each student who is awarded financial aid, which assists in automating financial aid
calculations depending upon factors that include the student’s academic program and year of study.
Fourth year Pharmacy students were incorrectly assigned a packaging type that corresponded to Medical
programs instead, which have higher unsubsidized loan limits.
Effect The students identified within the program of study were overawarded unsubsidized Direct Loans. Questioned Cost $606,306 in unsubsidized loans. It was noted that these 70 students would have qualified for Graduate Plus loans had they not been overawarded unsubsidized loans. Recommendation We recommend that management enhance controls to ensure that there is timely review and formal approval of modifications to packaging tables. Management’s Views and Corrective Action Plan
Management’s response is reported in “Management’s Views and Corrective Action Plan” at the end of
this report.

University of Southern California Schedule of Findings and Questioned Costs
For the Year Ended June 30, 2017
74
Finding 2017-002: Incorrect Disbursement of Funds
Federal Awarding Agency: Department of Education Cluster: Student Financial Assistance Program names and specific award name: Federal Direct Student Loans, Federal Pell Grants, Federal Supplemental Educational Opportunity Grants, Federal Perkins Loans CFDA #: 84.268, 84.063, 84.007, 84.038 Award #: P268K161192, P063P151192, P007A150654 Award Years: Academic Year 2016 – 2017
Criteria 34 CFR Section 668.164(b)(3) requires that the institution confirm student eligibility at the time a disbursement is made. 34 CFR 668.32(a)(1) states that students must be enrolled in an eligible program to receive Title IV aid. Condition We selected a sample of 60 students for testing from a total population of students who received Title IV assistance and withdrew from the University during fiscal year 2017. Of the students tested, the University disbursed Title IV funds subsequent to one student’s withdrawal and subsequent to the Financial Aid Office’s determination that the student had not received any Title IV aid and was therefore not subject to Return of Title IV (R2T4). As a result, the University disbursed aid to the student after the student had ceased to be enrolled. From the population of all students that withdrew and subsequently received aid, it was determined 4 additional students, for a total of 5 students, were also affected. Cause When a student withdraws from all classes after the add/drop period, the Student Information System
(SIS) will post a tracking code to notify the Financial Aid Office that the student needs to be reviewed for
R2T4. If a student does not have any Title IV aid and is not eligible for a post-withdrawal disbursement,
an R2T4 evaluation is not required to be performed. If a student applies for aid after they have withdrawn,
no disbursements should be made because the student is no longer enrolled in an eligible program. The
error was determined to have occurred primarily due to a failure within SIS to flag students who had
completely withdrawn from classes and prevent processing and disbursement of Title IV aid on their
accounts.
Effect Students who received Title IV aid after they ceased to be enrolled were not eligible to receive those funds. Questioned Cost $32,531 Recommendation We recommend that management enhance controls to ensure that there is appropriate monitoring of students’ Title IV disbursements for students who have already completely withdrawn from classes. Additionally, management should make appropriate modifications to SIS in order to flag students who have withdrawn, but still have a pending upcoming disbursement. Management’s Views and Corrective Action Plan
Management’s response is reported in “Management’s Views and Corrective Action Plan” at the end of
this report.

University of Southern California Summary Schedule of Prior Audit Findings For the Year Ended June 30, 2017
75
Finding 2016-001: Calculation of the Amount of Title IV Assistance Earned by the Student Condition In fiscal year 2016, PwC selected a sample of 60 students for testing from a total population of 143 students who received Title IV assistance and subsequently withdrew enrollment from the University during fiscal year 2016. Of the students tested, the University did not return the correct amount of unearned Title IV assistance on behalf of 1 student in the amount of $4. The miscalculations were inadvertent and largely the result of inadequate communication among the relevant USC departments as a session end date that was incorrectly represented within the Registrar’s system and then subsequently corrected. Current Status In response to the fiscal year 2016 finding, in fiscal year 2017, the R2T4 process transitioned from the Loan Unit to the Compliance Unit under the supervision of the Senior Assistant Director, Eligibility and the Assistant Dean, Compliance & Training. The training module entitled “Financial Aid Eligibility Considerations in Course Scheduling,” continues to be updated and assigned to session schedulers as part of a concerted effort to inform departments of the importance of reporting accurate session dates. In addition, the Senior Assistant Director, Eligibility and the Assistant Dean, Compliance & Training worked with the Registrar to create an online Non-Standard Session Request Form, which includes a workflow to obtain FAO approval before session information is entered into SIS. The form went live in May 2017. The Senior Assistant Director, Eligibility continues to review changes made after sessions have already begun to confirm that none of the students for whom an R2T4 was performed are impacted.

76
OFFICE OF THE COMPTROLLER
Management’s Views and Corrective Action Plan
Management response to finding 2017-001 Direct Loan Limits Exceeded
As described in finding 2017-001, the Financial Aid Office (“FAO”) thoroughly investigated the issue and
corrected the Pharmacy fourth year loan limits going forward. The FAO also determined the error was
limited to four academic years. It is management’s view that there is no exposure to students because they
would have borrowed more in Graduate Plus loans had they not been overawarded unsubsidized loans
and they are obligated to repay the loans per the terms of their promissory notes. In response to this
finding, the FAO updated the annual packaging setup procedures to require the Senior Assistant Director
of Aid Coordination to seek the Associate Dean of Loans’ review and approval of the annual loan limits for
each class level and program before packaging begins.
Management response to finding 2017-002 Incorrect Disbursement of Funds
As described in finding 2017-002, the FAO reviewed the five students in 2016-17 who received aid after a
Return to Title IV (R2T4) “no Title IV aid” determination had been made. For all five students, the
University returned the amounts owed to the respective Department of Education programs and used
institutional funds to hold students harmless. The FAO has implemented a short-term solution to
manually override auto-packaging and leave a comment in the packaging module that the student is no
longer eligible for the term. The R2T4 manual has been updated accordingly. A longer term project is
underway to re-program the Student Information System (SIS) to automatically prevent awarding or
disbursement of aid after a student has ceased to be enrolled in the term unless a post-withdrawal
disbursement is authorized.
Contact Person: Thomas McWhorter, Dean of Financial Aid, (213) 740-5445