university of retirement research center · insurance (ssdi) and supplemental security income...
TRANSCRIPT

Working Paper
WP 2001-009
Project #: UM99-03 M RR C
Tracking the Household Income of SSDI and SSI Applicants
John Bound, Richard Burkhauser and Austin Nichols
MichiganUniversity of
ResearchRetirementCenter
“Tracking the Household Income of SSDI and SSI Applicants”
John Bound
University of Michigan and NBER
Richard Burkhauser Cornell University
Austin Nichols
University of Michigan
May 2001
Michigan Retirement Research Center University of Michigan
P.O. Box 1248 Ann Arbor, MI 48104
Acknowledgements This work was supported by a grant from the Social Security Administration through the Michigan Retirement Research Center (Grant # 10-P-98358-5). The opinions and conclusions are solely those of the authors and should not be considered as representing the opinions or policy of the Social Security Administration or any agency of the Federal Government. Regents of the University of Michigan David A. Brandon, Ann Arbor; Laurence B. Deitch, Bingham Farms; Daniel D. Horning, Grand Haven; Olivia P. Maynard, Goodrich; Rebecca McGowan, Ann Arbor; Andrea Fischer Newman, Ann Arbor; S. Martin Taylor, Gross Pointe Farms; Katherine E. White, Ann Arbor; Mary Sue Coleman, ex officio

Tracking the Household Income of SSDI and SSI Applicants
John Bound
Richard Burkhauser Austin Nichols
Abstract
Using panel data from the Survey of Income and Program Participation linked to Social Security Administration disability determination records we trace the pattern of household income and the sources of that income from 38 months prior to 39 months following application for Social Security Disability Insurance (SSDI) and Supplemental Security Insurance (SSI). We find that the average applicant’s labor earnings declines dramatically beginning six month before application but the average applicant’s household income drops much less dramatically both in the months just before or just after application and over the next three years, and does so even for those denied benefits. However, we also found substantial heterogeneity in household income outcomes in both the SSDI and SSI applicant population. Our quantile regressions suggest that higher income households experience greater percentage declines in their post-application income. Such results are consistent with the lower replacement rate for higher earners established in the SSDI program and the low absolute level of protection provided to all SSI applicants regardless of income prior to application.
Author’s Acknowledgements This study is funded by a grant from the United States Social Security Administration (SSA) to the Michigan Retirement Research Center. We thank William G. Johnson, J.S. Butler, Howard Iams, and Mary Daly for useful comments on this paper. We thank Martha Bonney for editing and Flo Allen for word-processing various versions of this paper. The opinions and conclusions are solely those of the authors and should not be construed as representing the opinions or policy of SSA or any agency of the Federal Government. Austin Nichols was also funded from a training grant from the National Institute on Aging through the Population Studies Center at the University of Michigan.

3
The onset of disability can pose a significant threat to work and economic well-being. To
mitigate the consequences of such an event on both employment and household income, a network of
public and private programs has been established. The two most important federal transfer programs
targeted on working-age men and women who experience the onset of a severe work-limiting health
condition are Social Security Disability Insurance (SSDI) and Supplemental Security Income (SSI).
SSDI is a social insurance program for regularly employed workers that provides benefits
based on a worker’s past earnings. (For a more complete discussion of SSDI, see Bound and
Burkhauser 1999.) SSI is a mean-tested categorical welfare program that provides a federal
minimum cash benefit, which can be supplemental by state funds. (For a more complete discussion
of SSI, see Daly and Burkhauser forthcoming.) Both programs use the same strict definition of
eligibility: “the inability to engage in substantial gainful activity, by reason of a medically
determinable physical or mental impairment that is expected to result in death or last at least 12
months” (United States Social Security Administration 1999). Applicants must be unable to do any
work that exists in the national economy for which they are qualified by virtue of age, education, and
work experience. In addition, for SSDI there is a five-month waiting period before permanent
benefits are paid.
The strictness of the SSDI and SSI eligibility rules together with the imposition of a waiting
period for SSDI are consistent with a public policy that seeks to limit disability benefits to those who
are permanently and totally unable to work. However, the lack of a universal short-term disability
transfer program suggests that the onset of a severe disability could result in substantial decline in
household income before SSDI or SSI benefits become available.
In this paper we make use of a nationally representative public use household panel linked to
restricted Social Security Administration administrative records to measure changes in the sources
and amount of household income of working-age men and women who apply for SSDI and SSI
4
benefits. We show that while applicants experience substantial declines in their labor earnings in the
months around their application and subsequent admission onto the rolls, on average these declines
lead to more modest declines in their household income. However, there is considerable
heterogeneity of outcomes within the population, and a significant minority of applicants experience
substantial declines in their household incomes.
Background
There are two separate federal disability programs in the U.S.— Social Security Disability
Insurance (SSDI) and Supplemental Security Income (SSI). SSDI is part of the Old-Age, Survivor,
and Disability Insurance (OASDI) program. The goal of this social insurance program is to provide
“earnings replacement insurance” for those who exit the labor market because of disability or
retirement. Benefits for this program are based on past labor earnings and financed through a tax on
those earnings. Participation in the retirement and disability programs requires a substantial record
of employment. While OASDI has a redistribution as well as an insurance goal and, hence, provides
lower earners with higher replacement rates, the presumption is that other sources of household
income—e.g., the labor earnings of other workers in the household, returns from savings and
investments, private pensions or disability insurance, etc.—will provide substantial income to a
beneficiary’s household following his or her exit from work.1
In contrast, Supplemental Security Income is a means-tested cash transfer program aimed at
aged, blind, and disabled adults and disabled children. It is funded by general revenues. Past taxes
paid do not affect the amount of benefits received. The SSI adult disability program target
population is working-age men and women whose disabilities are as severe as those necessary for
eligibility for SSDI, but who either did not participate in the labor market sufficiently to receive
1 See Bound and Burkhauser (1999) for a detailed discussion of the SSDI program, its goals and its effect on behavior and economic well-being.
5
SSDI benefits or whose SSDI benefits and other sources of household income are below the
maximum allowable level to receive SSI benefits. In 1999, the maximum monthly federal SSI
benefit was $500 ($751 for a jointly eligible couple).2 While SSDI and SSI are both administered by
SSA and share common disability criteria for eligibility, they are meant to protect two quite different
populations.
To be eligible for SSDI benefits an individual must have had a significant recent attachment
to the workforce, while to be eligible for SSI an individual’s income and assets must be below a
social minimum. In addition, to receive benefits from either program the individual must be
determined to be disabled through a complex process, outlined below.3
As the first step in establishing eligibility, the SSA field office screens out applicants who are
currently gainfully employed.4 The field office also verifies insured status or, in the case of SSI,
does a preliminary check for financial eligibility based on income and assets. If the applicant is not
ruled ineligible at this stage, the application is sent to the one of 54 Disability Determination Service
(DDS) centers, usually in the state where the claimant resides. A DDS officer then makes a medical
determination of disability based on federal regulations (Lahiri, Vaughan, and Wixon, 1995).
Applicants denied benefits at this point can appeal, first to the same DDS center that made the
original determination, then to an Administrative Law Judge (ALJ), and then to the central Appeals
Board in Washington. Those denied benefits at this level can appeal to a federal court, although only
2 See Daly and Burkhauser (forthcoming) for a detailed discussion of the SSI program, its goals, and its effects on behavior and economic well-being. 3 To be eligible for SSDI benefits, workers must be both disability-insured and fully insured. Workers aged 31 or older are disability-insured if they have worked in Social Security covered employment during 20 of the 40 quarters prior to their date of disablement. They are fully insured if they have worked in covered employment for, on average, one out every four quarters between the year they turned 21 and the year before the year in which they reached age 62 or became disabled. 4 Gainful employment is typically defined as earning more than a substantial gainful activity (SGA) amount. During the early 1990s, the maximum SGA was $500 per month.
6
a tiny fraction of those who initially apply for SSDI or SSI benefits ever do so.5 As a result of this
appeal process the application for SSDI or SSI benefits can potentially take years. However, the vast
majority of cases are decided reasonably quickly. In our data, roughly 80% of applicants have a
decision within 6 months and over 95% within 12 months of applying for benefits. (See Appendix
Table 1) It is also the case that, applicants who are denied benefits at any or all levels of their initial
application process can and do reapply for SSDI benefits. (See United States Social Security
Administration 1999 for a fuller discussion of this entire process.)
Data
The Survey of Income and Program Participation (SIPP) is a series of United States Census
Bureau panel surveys of representative populations of the United States. New panels were fielded in
1990, 1991, 1992, and 1993.6 For each of four months beginning in February 1990, the Census
Bureau interviewed a new rotation group that was itself a random sample of the United States
population for the 1990 SIPP panel. These four rotation groups were interviewed eight times at four-
month intervals. Each interview contains monthly information for the preceding four months.
Hence, monthly panel information is available for up to 32 months on each individual in the 1990
SIPP panel over a 35-month period from October 1989 through August 1992. In 1991, a new SIPP
panel was fielded using the same panel design, and in 1992 and 1993 a similar design using an
additional ninth wave of interviews was used to provide a total of 36 months of data. Among other
things, the SIPP panel data contain detailed information on the sources and amount of income of
respondents and their households over a 32- to 36-month period. Hence, it is a useful data set for
measuring changes in short term economic well-being.
5 In recent years, roughly 0.2% of those applying for SSDI benefits end up appealing to the Federal Counts (U.S. House of Representative, 1993). 6 SIPP panels were fielded in earlier and later years but are not currently matched to Social Security Administration administrative records.

7
The data used in this project are the 1990-1993 panels of the SIPP matched to the disability
determination records from DDS and ALJ stages of the determination process of those who applied
for SSDI or SSI and whose applications were acted upon between 1986 and 1994, for the 1990 and
1991 panels, and between 1977 and 1997, for the 1992 and 1993 panels.7 This matching procedure
produced a total of 9,691 SIPP respondents who are identified as having applied for SSDI or SSI,
with the bulk of the applications occurring during the late 1980s and 1990s.
Because we are interested in separately following those who were awarded and those who
were denied benefits, we only include applicants in our sample who had reached at least the stage of
being awarded or denied benefits at the DDS level.8 Hence, from these 9,691 SIPP respondents, we
construct a sample of 7,637 applicants whose matched administrative records contain valid
information on their date of birth, filing date, decision date, and decision outcome to at least the DDS
level. Our sample respondents may have filed more than once in the years covered by the
administrative data, and may had several actions taken in their file over various stages of the
disability determination process recorded in their administrative record. We focus on the first
application we observe in the data and the last action we observe on that application. Hence, some
applicants who were denied benefits at the last stage we observe may not have completed all the
appeals and may eventually be accepted. Likewise, some may reapply and eventually be accepted.
We focus on the first application date we can observe in the administrative records data to set
the timing of employment and household income in the SIPP data to before and after application for
either SSDI and SSI benefits. Since we are interested in comparing different patterns between those
who are accepted onto the SSDI or SSI rolls and those who are denied benefits, it is necessary to
7 These data were originally compiled for Lahari, Vaughan, and Wixon (1995) and Hu, Lahari, Vaughan, and Wixon (1997) for their study of the application for SSDI and SSI benefits. 8 We focus on the first application we observe in our administrative data. Since our data do not cover the entire lifetime of our applicants, it is possible that some applicants had previously applied and were denied benefits.
8
define our measure of this outcome variable. Ideally, we would like to have full information on the
ultimate outcome of the application process for SSDI or SSI benefits. But, as we have discussed
above, for some applicants who are denied benefits the process to final appeal can be long, and in
some cases we will only have outcome information on the medical determination at the DDS level or
that information plus outcomes at one or more of the four possible appeal stages.
We define applicants as accepted or denied based on the most advanced level of the first
application process we observe in our data. The vast majority of cases in our sample contain
complete information on the first application process we observe. However, some of these cases are
incomplete. Hence, it is possible that applicants we classify as denied are accepted at a higher level
of appeal that we do not observe. However, since the applicants awarded benefits in our data are
similar to the overall fraction of social security beneficiaries awarded during this time period, it
seems unlikely that we have misclassified many cases.9 Finally, some individuals who we currently
classify as denied benefits on their first application will subsequently reapply and be accepted.
Analytic Strategy
In our analysis we merge our four SIPP panels but do not do so along a calendar time
dimension. Instead, we focus on an event—the initial application month and year for SSDI or SSI
9 There is other evidence that we have not misclassified many cases. The administrative records we receive extend from about 17 months to 41 months after the last data point we have in the SIPP, depending on the SIPP panel used. We have less information on those who apply close to the end of our administrative record information. To the extent that this is a problem, we would expect to observe systematic differences between the 1990 and 1991 SIPP-merged panels and between the 1992 and 1993 SIPP-merged panels (since both panels in each pair are matched to the same time window of administrative data, but contain earlier and later cohorts). When we separately calculated the tables produced here by panel year, we found no significant differences between cohorts from adjacent SIPP panels. Hence, we do not consider this to be a serious problem. There are, however, some differences between panels related to the growth of the SSDI and SSI populations over this time period. To the extent that we misclassify applicants, we will misclassify only those applying close to the end of the period on which we have administrative information. Hence, the income information we have on these individuals will cover the time before they apply for SSDI or SSI benefits.

9
benefits that we observe in the data—and array our data by individual from the months prior to
application (t - i) through the months following applications (t + i) where (t) is the month of
application. For those who applied for benefits prior to, or in the early waves of, our SIPP data, we
have information on their household income following application. For those who applied for
benefits in a middle wave of our SIPP data, we have information on their household income in the
months just prior to application and just following application. For those who applied for benefits in
the later waves of our SIPP data or just afterwards, we have information on their household income
in the months prior to application. Using this approach, we are able to obtain snapshots of
respondents’ average household income in the months and years prior to and following their
application for SSDI or SSI benefits that extend beyond the maximum of 36 months that any one
respondent is followed in a given SIPP panel.
A balanced panel, containing many years of household income prior to application and many
years of household income following application for every respondent, would be ideal for tracking
the consequences of the onset of a work limitation sufficient to induce an application for SSDI or SSI
benefits on the applicant’s household income. In this case, we could simply follow cohorts of
applications from several years prior to several years after the application. However, the fact that we
observed households for at most 36 months precludes us from doing this.
To better understand what we can and cannot do with our data, it is useful to consider a
simplified version of our SIPP-administrative records data. Imagine that we were working with a
survey that interviewed individuals in March 1991 and then again in March 1993. Respondents were
asked about household income for the calendar month preceding each interview (i.e., February 1991
and February 1993). The sample is limited to those who applied for disability benefits in January of
1989, 1991, 1993 or 1995. We are following the household income of the applicant from two years
prior to two years after the application. We can think of the data as composed of 4 distinct samples.
For those who apply in 1989, we can observe their household income two years after application.

10
For those who apply in 1991, we can observe their household income immediately after and two
years after application. For those who apply in 1993, we can observe their household income both
two years prior to and immediately after the application. For those who apply in 1995, we can
observe their household income two years prior to the application.
The Number of Years between the Year Income is Observed and the Application Year
Year Income Data Is Observed Application Year 1991 1993
1989 +2 - 1991 0 +2 1993 -2 0 1995 - -2
Combining the 1993 and 1995 applicant samples yields a snapshot of household income two
years prior to the application. In a similar fashion, combining 1991 and 1993 applicant samples
yields snapshots of household income immediately after application, and combining 1989 and 1991
samples yields snapshots two years after application. Furthermore, a comparison of these snapshots
provides a measure of how mean household income changes from two years prior to two years after
an application. These partially matched samples provide a valid way to infer what the mean change
in an applicant cohort’s household income was over the application period, so long as the cohorts of
applicants can be thought of as coming from a random sample of the same population.
However, if different applicant cohorts represent different populations (imagine, for example,
that the more recent cohorts tend to have higher baseline household income), then the comparison of
the mean household income of the different populations will overstate the mean change in household
income over the application event.

11
An alternative approach would be to use the 1993 applicant cohort to make inferences about
the mean change in household income from two years prior to application to just after application,
and use the 1991 applicant cohort to make inferences about the mean change in household income
from just after application to two years after the application. Since these are within-cohort
comparisons, differences across cohorts will not bias our estimates. Furthermore, by splicing these
two comparisons together we can get an estimate of the mean change in household income from two
years prior to two years after the application.10
Splicing together cohorts allows us to obtain within-cohort estimates of the mean change in
household income from before to after the application. However, we cannot use the same kind of
analysis to examine the distribution of income changes. We can use the 1993 cohort to look at the
distribution of household income changes from two years before to just after application. In the same
way, we can use the 1991 applicant cohort to examine the distribution of changes from the date of
application to two years later. However, there is no way to examine the distribution of household
income changes from two years before to two years after the application. To do so requires a longer
panel.
Returning to our actual data, we first compare three discrete time periods—36 to 38 months
prior to application, 1 to 3 months after application, and 37 to 39 months after application—to obtain
a first glimpse of how average household income and its sources change across the months prior to
and after benefits application. We do so by comparing our cross-sectional snapshots of people at
various times around application. The first period is roughly prior to the onset of a disability (our
baseline period). The second period is just following application for benefits, when it is unlikely that
10 If the household income changes are different for the 1991 and 1993 cohorts, then, while the estimates of the mean change of household income from two years prior to just after the application, and from just after to two years after are both valid, the estimate of the change of household income from two years prior to two years after the application will represent a composite of the
12
a decision with respect to eligibility and payment has been made.11 The third is long enough after the
application process began to roughly capture its outcome on average household income.
While these cross-sectional snapshots will give us a measure of the employment and
household income of individuals at various moments around the time they are applying for SSDI or
SSI benefits, they do not follow the same individuals across time and, therefore, do not give us a
direct measure of the extent to which those applying for SSDI or SSI have been able to avoid
significant drops in household incomes. To answer this question, we need to follow individuals over
time and compare their incomes prior to applying for SSDI or SSI benefits to their incomes after
doing so. Given the shortness of the SIPP panel data, we cannot cover the entire period by simply
following a single cohort of individuals through the application process. Instead we track the
household income of overlapping sets of individuals. To do this efficiently, we estimate fixed-effect
regression models where the dependent variable is total household income and explanatory variables
include individual fixed effects and calendar month fixed effects together with dummy variables
indicating the duration since application.
Finally, we use a balanced panel design to capture the heterogeneity of changes in household
income that individuals experience between 12 to 15 months prior to application and 1 to 3 months
following application. Because we require income information on each individual in our sample for
both periods, the time between the two periods we are considering is shorter and our sample sizes are
smaller than in our other analyses.
corresponding changes for the two cohorts, and will not represent a valid estimate of the change for any one cohort. 11 For most SSDI applicants these months probably fall within the waiting period. In addition, neither SSDI nor SSI applicants are likely to be receiving benefits yet, simply because of ordinary delays in the disability determination decision process and in the processing of payments.

13
Socio-Economic Characteristics of SSDI and SSI Applicants before Application
Table 1 shows the dramatic difference between the average SSDI and SSI applicant prior to
application for these programs. Column 1 reports the average socio-economic characteristics of men
and women aged 18 to 61 in the first wave of any of the four SIPP panels used in our analysis, who
did not apply for SSDI or SSI benefits over the period covered by our SSA record data. 12 Column 2
contains the mean socio-economic characteristics of the first-wave SIPP respondents who only
applied for SSDI benefits over the period covered in our SSA record data. Column 3 does the same
for those who only applied for SSI benefits and Column 4 does so for those who applied for both
SSDI and SSI benefits.
On average, SSDI and SSI applicants have dramatically different socio-economic
characteristics. The average SSDI applicant is more likely to be older, male, white, non-Hispanic,
married, have at least a high school degree, live in a smaller household, and have more financial
wealth than the average SSI applicant. The average applicant for both SSDI and SSI falls somewhere
between these two averages.
Because application for SSDI and SSI benefits is coincident with low labor earnings, in our
last comparison in Table 1 we look at the subsample of respondents on whom we have household
income information at least 12 months prior to their application in the first wave of one of our four
SIPP panels. Not surprisingly, given the social insurance nature of SSDI versus the means-tested
nature of SSI, the pre-application household income of SSDI applicants is more than twice that of
SSI applicants and is very close to that of non-applicants. When we divide household income by the
official United States Census poverty line for an appropriate size household, the resulting pre-
application income-to-needs ratio of SSDI applicants is more than twice that of SSI applicants and is
12 Here and in all subsequent analyses we restrict our sample to respondents who are aged 18 through 61. Because we are looking at the individual and not the household as our unit of analysis, some

14
almost exactly that of non-applicants. SSDI and SSI are meant to provide protection to quite
different populations. Table 1 demonstrates that this is what they do. In all subsequent analyses we
will separately consider these two distinct populations.13
Changes in Earnings and Employment before and after SSDI or SSI Application
The onset of a disability that is severe enough to induce a worker to apply for SSDI or SSI
benefits, given these programs’ strict eligibility standards, is likely to have a dramatic effect on the
worker’s labor earnings and household income. The effect on household income is likely to be even
greater if the worker is denied benefits.
In Table 2 we look at mean monthly labor earnings and the employment rates of our sample
of SSDI or SSI applicants disaggregated by whether or not they were awarded or denied benefits.14
We look across three distinct periods. The first is between 36 and 38 months before application. We
use this baseline period to approximate the average labor earnings and employment of applicants
before the onset of a disability began to affect these outcomes.15 The second period is one to three
months following application. This is roughly coincident with the waiting period for SSDI
applicants, during which employment is likely to be near its lowest level and, for most SSDI and SSI
individuals in column 1 can live in the households of those who have applied for SSDI or SSI benefits. 13 All the analyses done on these two populations were also carried out on the population that applied for both programs. These results are available from the authors. 14 As discussed above, some of those we observe as being denied benefits eventually receive them at a more advanced level of the appeal process or based on a subsequent reapplication. 15 Ideally we would like to follow our samples from the point just before their disability began to affect their labor earnings. To do so we would need greater information on their lifetime earnings profile. Burkhauser, Butler, and Weathers (2000) report that about 55 percent of men and women in their sample of SSDI applicants from the Health and Retirement Study experienced a health condition that began to interfere with their work longer than 3 years before application and 36 percent had such an experience more than 10 years before application. This suggests that tracing applicants’ household income back 36 to 38 months before applications is not sufficient to observe all of them before their disability has had some effect on the sources and amount of their household income.

15
applicants, the period before an initial disability determination has been made and benefits have
begun.16
The third period is 37 to 39 months after application. We use this period to approximate
employment and earnings levels after the full application process has been completed and either
benefits have begun (either after the first disability determination or after subsequent appeals) or the
respondent has learned that benefits will not be awarded and has had the opportunity to try to return
to work.17
Table 2 shows that prior to application for SSDI benefits, those awarded benefits are more
likely to be employed and to have higher average monthly labor earnings than those denied benefits.
But both groups experience a dramatic drop in both their average monthly labor earnings and their
employment during the period just after application. The average monthly labor earnings of those
awarded SSDI benefits in the months just after application are only 16 percent of their previous
average monthly labor earnings, and those of applicants denied SSDI benefits are only 12 percent of
16 This may not prove to be the case for two reasons. First, the waiting period for SSDI applicants is officially defined as the first five months following the time the disability first led to earnings below SGA. Workers who have disability-related earnings below SGA prior to application and who obtain a quick positive disability determination may already be receiving benefits during this period. Second, and perhaps more important, the income data in the SIPP is self-reported and the timing of income flows may not be precise. The SIPP re-surveys households every four months. There is evidence that individuals do not accurately remember the time of income receipt during the four-month window preceding an interview. Thus, income changes that occur between windows are more accurately reported than are changes that occur within windows. In our case, applications do not line up with the four-month windows, but occur randomly within them. For this reason, we expect a smearing across time of income flows. Still we expect the general patterns we find to reflect the pattern of household income during the period around the application for SSDI or SSI benefits. The finding of more transitions at the “seam” than at other points in a retrospective history pieced together from a series of interviews has been documented repeatedly (Moore and Kasprzyk 1984; Burkhead and Coder 1985; and Hill 1987). 17 The actual amount of labor earnings and program income in this period is also subject to error. While SIPP does a better job of capturing transfer income than other national data sets, our SSA matched data suggest that SSDI benefits are underreported. We find that only 90 percent of those whom we know from the SSA administrative record data were awarded SSDI benefits report positive amounts of Social Security income even 12 months after their award. It is also possible that respondents misreport the sources of their income.

16
their previous level. In our final period of observation, 37 to 39 months after application, those
awarded SSDI benefits have even lower average employment and labor earnings than they do just
after application. Those denied SSDI benefits increase their employment and average labor earnings
above their low levels just after application but still have average labor earnings and employment
rates substantially below their pre-application levels.
SSI applicants are dramatically different from SSDI applicants in their employment and labor
earnings patterns. First and most importantly, the vast majority of SSI applicants are not employed
36 to 38 months before application for SSI benefits. This in large part explains why they are not
applying for SSDI benefits. It is unlikely that they are eligible. Only 25 (28) percent of those
awarded SSI (those denied) were working before their application and their average monthly labor
earnings were only $144 ($260). Both their employment and average monthly labor earnings are a
small fraction of the employment and average monthly labor earnings of SSDI applicants over this
same period. While the percentage fall in their average monthly labor earnings is about as great as
that of SSDI applicants, the absolute drop in their average monthly labor earnings is far smaller since
their baseline level of earnings was so much lower. The average SSI awardee’s labor earnings in the
period 37 to 39 months after application remains very low, although it is somewhat higher than just
after application. Those SSI applicants denied benefits also have small increases in their average
monthly labor earnings from their low levels just after application, but their average monthly labor
earnings are still only 40 percent of their pre-SSI-application levels.
Table 2 shows that both SSDI and SSI applicants experience dramatic drops in their average
labor earnings across the period three years before to three years after application. But the absolute
amount of household income that must be replaced by other sources because of this drop is much
greater for SSDI applicants because their employment and labor earnings are much more important
prior to application.

17
Changes in Household Income and Its Sources before and after SSDI and SSI Application
In Table 3, we look at the average monthly household income of SSDI and SSI applicants
across these same three periods. Once again we see dramatic differences between our SSDI and SSI
applicant populations. Prior to application, those awarded SSDI benefits have higher average
monthly household income than those denied benefits. But in contrast to the dramatic declines in
their average monthly labor earnings shown in Table 2, they both experience only modest declines in
their average household income just after application, even in the absence, for the most part, of SSDI
benefits. Those awarded benefits still have 75 percent of their pre-application household income.
Those denied benefits still have 70 percent of their pre-application household income. Surprisingly,
three years later the average household income of SSDI awardees remains at approximately the same
level as it was just after application, while the average household income of those denied benefits
rises to 85 percent of its pre-application level despite their not receiving SSDI benefits.
Table 4 provides a possible explanation for the relatively small changes in SSDI income
levels across the three time periods, despite the dramatic and persistent decline in labor earnings
report in Table 2. In Table 4, we disaggregate mean monthly household income into its
components.18 The dramatic decline in the labor earnings of SSDI applicants (both those awarded
and denied) is offset during the application period by increases in private pensions and veterans’
benefits, which are likely to be disability related, as well as temporary disability and workers’
compensation benefits. Unemployment insurance benefits also increase.19 Finally, we report some
18 Later in the text we provide fixed-effect estimates of average monthly labor earnings and household income and its sources for our four populations. 19 The SIPP does not clearly identify employer-provided disability insurance income. Bureau of Labor Statistic surveys show that more than 50 percent of the workforce is eligible for paid sick leave. In addition, roughly 30 percent are covered by some kind of sickness or accident insurance that continues to cover worker after they have exhausted their sick leave, for typically between six and twelve months, while 25 percent are covered by some kind of long-term disability plan, often as part of their pension (Kerns 1994). Despite the fact that the SIPP does not ask explicitly about

18
increase in own Social Security benefits, which may either be misreported, or based on a swift
decision in which the waiting period was judged to occur prior to application.
These results are important because they suggest that, while the United States has no
universal temporary or short-term disability transfer system, on average, SSDI applicants are
sufficiently covered by some combination of employer-based disability programs, workers’
compensation, or other public disability or general transfer programs to offset dramatic drops in their
labor earnings in the months before SSDI benefits become available. Somewhat surprisingly, the
earnings of a spouse declined between the two periods and hence were not a source of additional
household income, although the earnings of other household members did increase over the period.
On net, however, additional labor earnings by other household members do not appear to be a source
of alternative household income during the months immediately after application for SSDI benefits.
The mean monthly household income of SSDI applicants who were awarded benefits
remained at about the same level 37 to 39 months after application as it was during the period 1 to 3
months after application, but the sources of that income substantially changed. Over the two periods,
SSDI benefits rose dramatically, but this increase was more than offset by declines in applicants’
earnings, the earnings of other household members, temporary disability benefits, unemployment
insurance, and workers’ compensation. This further suggests that on average the current patchwork
of short-term public and private programs provide sufficient benefits to smooth the transition from
full labor force participation to permanent movement onto the SSDI rolls.
For those who were denied SSDI benefits, household income rises substantially between the
period just after application and 37 to 39 months after application. In part, this is because their
Social Security income rises, although to a much lower level than for those who are awarded
employer-provided disability insurance, it is possible that respondents may report this income. Thus, for example, a person on sick leave or receiving sickness or accident insurance benefits might report

19
benefits. It is likely that most of these increases are from subsequent awards of SSDI benefits based
on reapplication after the original application process yielded a denial.20 The increase in average
household income in the period just after application for those who are denied benefits come from
increases in their own earnings and those of their spouse, as well as from increases in employer
pension income. Those increases more than offset declines in temporary disability and workers’
compensation payments.
Table 3 reveals a different pattern of household income changes for SSI applicants than for
SSDI applicants. Those denied SSI benefits actually have higher average household income before
application than do those awarded SSI benefits, although both groups have much lower average
monthly household income than do SSDI applicants. As Table 2 revealed, while the average labor
earnings of SSI applicants fell dramatically in percentage terms thereafter, in absolute terms the
decline was modest since their average labor earnings were already quite low. Hence, it is not so
surprising that the average household income of those denied SSI benefits was still 83 percent of its
pre-application level in the month just after application. Somewhat more surprising, SSI awardees
actually experienced an increase in average household income in the months just after their initial
application. The average household income of both groups grew slightly between the months just
after application and in the period 37 to 39 months after application.
Once again, Table 4 provides some insight into the pattern. For SSI awardees, the small
absolute decline in their own average labor earnings and that of their spouse was more than offset by
an increase in the labor earnings of other household members. How or why this relatively large rise
in the average labor earnings of other household members occurs is beyond the scope of this study.
this income as part of their labor earnings. On the other hand, long-term disability insurance income may show up as pension income. It is also possible that such income is simply not reported. 20 It is also possible that some of their Social Security benefits are from other components of OASDI. Because we stop observing people at the point they reach age 62, it is unlikely that these are retirement benefits, but they could come from widow’s benefits.

20
It could be an increase in the average labor earnings of household members in the house in the period
before application or it could also be that some SSI applicants move into a household with higher
labor earners in order to share their resources and to receive care.21
The average household income of SSI initial awardees increases slightly between the months
just after application and 37 to 39 months after application, but the sources of this increase change
substantially between the two periods. Average SSI income more than triples to $331 per month but
this increase is mostly offset by declines in Aid to Family with Dependent Children (AFDC) and
other welfare transfers and in spouses’ labor earnings. For those denied SSI benefits, the decline in
own earnings and in a spouse’s earnings are only slightly offset by increases in veterans’ benefits and
private transfers. The small increase in average household income between the months just after
application and 37 to 39 months after application is primarily driven by relatively small increases in
pension income, Social Security benefits, SSI benefits, and own earnings.
Estimating Month-to-Month Changes Using Fixed-Effect Regressions
In the previous sections, we used our unbalanced panel data to describe how household
income varied across points approximately three years before, immediately after, and three years
after application for SSDI and SSI benefits. In this section we describe average changes each month
in key sources of household income and in total household income for our sample of SSDI and SSI
applicants from 36 to 38 months prior to application to 39 months after application.
Since we are still restricted by our data, we are not able to follow the same population across
all time periods. We can, however, approximate what we would find if we could by using these data
to estimate a series of fixed-effect regressions that include dummy variables for the months prior to
and subsequent to application. Since the time period in the constant term represents the period 36 to
21 We follow applicants in our analysis. Because the composition of their households may change over time, we do not know how the lives of other household members are affected by the disability of

21
38 months prior to application, the regression coefficients can be interpreted as the changes in
household income relative to this pre-application baseline. The inclusion of fixed-effects in our
model allows us to interpret the observed patterns as reflecting what happens on average, to
applicants’ household income during the time before and after application for SSDI or SSI benefits.22
Labor Earnings and Employment Trends
Figure 1A is based on our estimates of the average monthly labor earnings of SSDI
applicants, as reported in Table 2, and Figure 1B is based on our estimate of their employment. The
average monthly labor earnings of SSDI applicants awarded benefits begin to decline as early as 24
months prior to application but do so more dramatically beginning about 12 months prior to
application. Average labor earnings level off about 3 months after application and remain at that low
level thereafter. Monthly employment rates show a similar pattern.
The average monthly labor earnings of SSDI applicants who were denied benefits are
uniformly below those of SSDI applicants awarded benefits prior to application, but they cross over a
few months after application and continue to be above them throughout the rest of the period of our
study. Note however that the average labor earnings of both groups are at much lower absolute
levels following their application for SSDI benefits then before. The monthly employment rates of
these SSDI applicants show a similar pattern.
Figures 2A and 2B illustrate our results for SSI applicants reported in Table 2. The
employment rates and average monthly labor earnings of SSI applicants awarded benefits are
dramatically below those of SSDI applicants in the month prior to application. On average they
experience only a small decline from their low baseline average monthly labor earnings beginning
the applicants. 22 The actual regressions used to estimate all our fixed-effect results as well as a discussion of the methods used in our analysis may be found in the technical appendix. The results we report in the
22
about six months prior to application. Employment is also low but stable until about six months prior
to application. It then falls below 10 percent and remains at approximately this level over the rest of
the period.
The month-to-month pattern for those denied SSI benefits is closer to that of those denied
SSDI benefits, but at a dramatically lower level. Average monthly labor earnings and employment
decline modestly until about three months before application. They then both drop faster until about
three months after application. Thereafter they increase slightly. The employment of those denied
SSI benefits is approximately the same as those awarded SSI benefits until just before application
(two to three months), but their employment rates are consistently above those of initial SSI
awardees thereafter.
Household Income Trends
Figures 3, 4, 5, and 6 illustrate the results we report in Table 3. In Figure 3 we trace the
percentage change in average monthly household income of SSDI awardees from baseline (36 to 38
months prior to application). The thick solid line is based on our fixed-effect regression. Average
household income starts to decline two years before application but does so more dramatically six
months to a year before application. Just after application, the trend reverses for about one year, after
which average household income is relatively stable, approximately 25 percent below average
household income at baseline.
As we saw in Table 2 and in Figure 1A, the average monthly labor earnings of SSDI
awardees decline dramatically over the same period. To show the importance of changes in all other
sources of household income in ameliorating drops in household income caused by lost labor
earnings, we simulate how much average household income would have fallen had no other income
figures in the text came from unweighted regressions. The weighted regressions yielded similar results. These results are available from the authors.
23
sources changed from their baseline levels except the labor earnings of the SSDI awardees.23 The
thin solid line in Figure 3 represents the simulated change in average household income caused solely
by the actual decline in average labor earnings, holding all other sources of household income
constant at their baseline levels. The difference between this line and the zero percentage line shows
the importance of applicants’ lost labor earnings as a share of average household income at baseline.
The time pattern in Figure 3 with respect to the average applicant’s lost labor earnings on household
income parallels Figure 1A. The simulated decline in average household income begins slowly but
rapidly increases about 12 months before application, levels off in the months immediately after
application, and remains at that reduced level thereafter, on average about 45 percent below average
household income at baseline. As can be seen by comparing the thin solid line to the actual
outcomes represented by the thick solid line, increases in other sources of household income offset
the decrease in labor earnings so that six months after initial application, household income is only
25 percent below baseline. Hence, for SSDI applicants who are awarded benefits the drop in their
average household income is not as serious in percentage terms as the drop in their labor earnings
both because labor earnings only provided about 50 percent of household income (see Table 4) and
because household income from other sources grew after application for SSDI awardees.
To get a sense of how important SSDI benefits are in the replacement of lost labor earnings,
we report the findings of a second simulation in Figure 3. The dashed line represents the simulated
change in average household income from baseline caused by the actual change in all other sources
of household income except SSDI and SSI payments, which are held at their baseline level.24 The
23 We estimate separate fixed-effect regressions for applicants’ labor earnings and applicants’ household income. We then graph the coefficients from these regressions, divided by average household income 36 to 38 months prior to application within the regression sample. Our fixed-effect regressions are presented in the technical appendix. 24 We estimate separate fixed-effect regressions for applicants’ own Social Security income and for household income. We then graph the coefficients from the household income regression and the difference of the household income and their own Social Security income regressions, divided by
24
importance of SSDI benefits begins to be seen a few months after application, when they account for
most of the increase in income from sources other than applicants’ labor earnings as represented by
the gap between the thin solid line and the dotted line. As Table 4 shows, between baseline and the
month just after initial application, increases in other sources of income—unemployment insurance,
pension income, veterans’ benefits, temporary disability income, and workers’ compensation—offset
some of the decline in lost labor earnings. But a few months after application, declines in these
benefits as well as in other household labor earnings leave SSDI as the single most important
alternative source of household income.
In Figure 4 we trace the actual percentage changes in average monthly household income
from baseline (thick solid line) and repeat our two simulations (thin solid and dash lines) for SSDI
applicants who are denied benefits. As in Figure 3, the thick solid line tracking actual changes in
household income from baseline shows a steady decline starting two years before application
increasing dramatically six months to a year before application. Just after application, household
income rises until about one year after application and then remains approximately level about 20
percent below baseline. The thin solid line representing declines in household income caused by
labor earnings alone, holding all other sources of income at their baseline levels, moves increasingly
below the thick solid line over time but hits a valley at about 40 percent below baseline just after
application and then rises as employment increases (See Figure 1). This is quite different from the
pattern discussed in Figure 3 and shows that applicants’ average lost earnings are much less of a
problem for those denied benefits than for those receiving SSDI benefits.
Likewise, the dashed line representing simulated declines in income, holding SSDI and SSI
at their baseline levels and allowing all other sources of income to vary, is now much closer to the
thick solid line. Hence, SSDI and SSI income is much less important for denied SSDI applicants
average household income 36 to 38 months prior to application within the regression sample. These
25
than for accepted applicants in Figure 3. Increases in household income (thick solid line) following
application are primarily due to increases in applicants’ labor earnings in the months following
application. The declining dashed line, however, shows increases in average SSDI and SSI benefits
begin to be an important source of household income about 18 months after application, suggesting
that some of the applicants who were denied benefits at the point we observed them eventually went
into these programs.
Figure 5 reports actual changes in average monthly household income and repeats our two
simulations for SSI applicants who are awarded benefits. The thin solid line representing declines in
household income caused by labor earnings alone, holding other sources of income constant, is now
mostly above the thick solid line representing actual changes in income. Furthermore, the thin solid
line only slightly varies from baseline. These results are expected. As we saw in Figure 2A, the
average labor earnings of SSI applicants who are awarded benefits do not begin to decline until just a
few months before application. Even then, as we saw in Table 4, applicants’ average labor earnings
only contributed a small share to their average household income. Hence, dramatic percentage
declines in applicants’ average labor earnings translate into very modest declines in average
household income from baseline even 39 months after a successful application for SSI benefits. In
contrast, as the dashed line shows, the simulated loss of average SSDI and SSI benefits, allowing
other sources of income to vary from baseline, would have had a major impact on household income
after SSI application. This last point reinforces our finding in Table 4 that much of the increase in
average SSI benefits in the months after application was offset by declines in income sources other
than applicants’ labor earnings, such as spouses’ earnings, AFDC, and other welfare transfers.
Figure 6 illustrates actual changes in average monthly household income and repeats our two
simulations for SSI applicants who are denied benefits. The thin solid line representing declines in
fixed-effect regressions are described in the technical appendix.

26
household income caused by labor earnings alone, holding other sources of income constant, drops
almost continuously until application, but even at its lowest levels, right around the time of SSI
benefit application, it never falls below 10 percent of baseline earnings and represents less than a 5
percent decline from baseline by the 39th month. Declines in other sources of income are far more
important in explaining the decline in the average household income of this population.
These figures together suggest that dramatic declines in average monthly labor earnings from
baseline for SSDI and SSI applicants translate into a much more modest decline in monthly
household income. This is especially true for SSI applicants, because their labor earnings are a
relatively unimportant source of household income. It is also true of SSDI applicants, because their
SSDI benefits quickly offset a substantial share of their lost labor earnings.
Figures 7 through 13 illustrate the results we report in Table 4. Each figure reports the
average value of a specific source of household income for each of the four groups of applicants.
Figure 7 shows that average own Social Security benefits begin to rise in the months around
application for those awarded SSDI benefits but dramatically rise 3 to 4 months after application and
continue to rise until about 15 months after application. Thereafter, they are relatively stable. Some
of those denied SSDI benefits begin to receive their own Social Security benefits around 9 months
after application and experience modest but steady increases thereafter.25 However, 39 months after
application, their own average Social Security benefits are still less than one-half those of applicants
who were awarded SSDI benefits. SSI applicants experience very small increases in their own Social
Security benefits after application for SSI benefits.
Figure 8 shows that both those who are awarded and those who are denied SSDI benefits
have about $100 in average monthly employer pension income 36 months prior to their application
25 For the most part these own Social Security benefits are based on a re-application for SSDI after an initial denial, although in some cases they could be awarded based on appeals after the last stage of the first application process we observe or from other Social Security programs or simply misreports.

27
for SSDI benefits. For those who are accepted, these benefits steadily rise over the subsequent six
years with substantial increases occurring in the month following application for SSDI benefits.
Average benefit levels reach $400 per month three years after application. Those denied SSDI
benefits have more modest increases in their employer pension income over the same period and
reach average benefit levels of about $200 per month at 39 months after application. Those who
apply for SSI benefits have much more modest employer pension benefits over the entire period of
our analysis, but they do experience small increases in the months following SSI application.
Figure 9 shows that both those who are awarded and those who are denied SSDI benefits
experience substantial increases in temporary insurance benefits, including workers’ compensation,
unemployment insurance, and temporary private insurance benefits, in the months immediately
preceding and following their SSDI application. Interestingly, the benefits of those denied SSDI
benefits are on average higher during this period. Those applying for SSI benefits experience no
such rise in temporary benefits over the period. Instead, they experience a slow decline from a low
baseline level over the entire period.
Figure 10 shows the average monthly labor earnings of the spouses of applicants for SSDI or
SSI benefits. The average labor earnings of the spouses of those who apply for SSDI benefits are
substantially above those of the spouses of those who apply for SSI benefits over the entire period,
but they decline modestly over the entire period for all four groups.
Figure 11 shows that both those who are awarded and denied SSI benefits receive much
greater average monthly government welfare transfers (except SSI) than do those who apply for
SSDI. Those denied SSI benefits receive on average $350 per month at baseline, but their benefits
begin to fall around six months prior to application and decline to around $250 per month by the end
of the time period covered by our analyses. Those accepted for SSI experience a substantial decline
in their welfare benefits following application. SSDI applicants receive a very small average amount

28
of welfare transfers at baseline and this amount remains constant over the entire period of our
analyses.
Figure 12 shows that SSI awardees experience a rapid rise in their own SSI benefits over the
first year following application, after which they remain at about $225 per month. Those denied SSI
benefits experience a much smaller increase in their own SSI benefits, beginning around one year
after initial application, which is still at a relatively low level ($75 per month) 39 months after
application. Those awarded SSDI report a small amount of their own SSI payments following
application for SSDI.26
Figure 13 shows that the labor earnings of household members other than applicants’ and the
applicants’ spouses are important. While the amounts do not differ dramatically across our four
groups, they do as share of total household income (Table 4). For SSI applicants especially, they are
very important source of income. But as was the case with spouses’ labor earnings, we find no clear
change in the size of these earnings around the time of application.27
Appendix Figures 1 through 7 report how the monthly prevalence rates of the seven sources
of household income discussed above vary over the relevant time period for our four groups of initial
applicants. The trends follow closely those in Figures 7 through 13.
Heterogeneity within the SSDI and SSI Applicant Population
Thus far, we have tracked the average monthly employment and labor earnings of SSDI and
SSI applicants as well as their average monthly household income and its sources in the three years
before and after application. We have shown that there are considerable differences in average
26 While we attempt to remove those who simultaneously apply for SSDI and SSI, it is possible that errors in the data cause this result. 27 On average, approximately 36 percent of other household members are applicants’ adult children, 10 percent are applicants’ parents, 17 percent are applicants’ other relatives, and the rest are adults who are unrelated to the applicant by blood or marriage.
29
outcomes between SSDI and SSI applicants and some differences between applicants who are
awarded and denied benefits within these programs. We now focus on the much greater
heterogeneity of outcomes obscured by these averages.
To examine how the applicants’ average household income changes around the time of
application for SSDI or SSSI benefits, it is sufficient to compare the average household income of
one set of applicants several years before they apply for benefits to the household income of another
set of applicants several years after they apply. As long as these two sets of applicants represent
random samples from the same population, the comparison is valid and should give an unbiased
estimate of the change in mean household income. However, to study the distribution in the change
of their household income around the period of time individuals apply for SSDI or SSI, we need to
follow the same set of applicants across time. In order to do this, with our SIPP-administrative data,
we need to substantially shorten our time horizon, since we must have information on the same
individual over the entire horizon we choose.
In Figure 14 we plot the distribution of percentage changes in household income between 12
to 14 months prior to SSDI application and 1 to 3 months after SSDI application. The median drop
in household income is 27 percent, but there is considerable heterogeneity around this average.
While about 40 percent of SSDI applicants experience a decline in their household income of no
more than 20 percent, about 30 percent experience declines of between 20 to 50 percent, and about
30 percent experience declines of 50 percent or more.
In Figure 15 we report the results over the same time period around application for those who
apply for SSI benefits. The median decline for SSI applicants is only 6 percent, but there is also
heterogeneity around this average. While about 30 percent of SSI applicants experience gains and
about 30 percent experience declines of no more than 20 percent, about 20 percent experience
declines of 20 to 50 percent, and 20 percent experience decline of more than 50 percent.
30
To further explore the heterogeneity of outcomes in our population of SSDI and SSI
applicants, we estimate a series of quantile regressions. We do this because we suspect that
applicants’ position in the monthly household income distribution prior to application will be related
to their percentage decline in monthly household income that we observed in Figures 14 and 15.
Results from our quantile regressions are reported in Table 5. The first three columns represent
estimates for the 25th percentile, the 50th percentile, and the 75th percentile of SSDI applicants. The
last three columns do the same for SSI applicants.
To illustrate how to interpret the reported estimates, we focus on the first row of estimates.
The estimate of -0.19 in the first row, second column, indicates that a 10 percent increase in
household income at baseline (i.e., a 0.1 ln point increase) is associated with a 0.019 percentage point
decline for the person in the median income household. The negative numbers in the first row
indicate that for both SSDI and SSI applicants, the higher their initial level of monthly household
income at baseline, 12 to 14 months prior to application, the larger is their percentage decline in
monthly household income over the period. The fact that baseline household income is associated
with a bigger change at the 75th percentile than at the 50th percentile indicates that applicants who live
in relatively higher income households at baseline are more likely to experience larger percentage
drops in their household income than are applicants who live in lower income households at baseline.
This is not surprising, since they have further to drop before they reach the social safety net related to
exit from the labor market for disabilities at either the minimum absolute household income level, in
the case of SSI, or at a disproportionately lower household income level, in the case of SSDI.
Looking at the other coefficients in the quantile regression, we see that the share of baseline
household income that comes from the applicants’ own labor earnings is also related to the size of the
drop in household income. For example, holding the baseline level of household income constant, a
25 percent shift in the share of baseline household income coming from the applicants’ own labor
earnings is associated with close to a 10 percent larger drop in the median applicant’s household

31
income. The importance of own labor earnings found here is consistent with our findings in the
previous sections. The only other variable that is significant, and then only for SSDI applicants, is
marital status at baseline. For SSDI applicants, other things equal, being married at baseline is
associated with an increase drop in household income of the person in the median income household
of 20 percentage points relative to being single.
Summary and Conclusions
Using panel data from SIPP linked to SSA disability determination records we traced the
pattern of household income and the sources of that income from 38 months prior to 39 months
following application for SSDI or SSI benefits. Despite the fact that SSDI and SSI are run by a
common agency—the Social Security Administration—and use common criteria for eligibility on
medical and vocational grounds, SSDI and SSI provide protection to quite distinct populations. We
found that the average SSDI applicant had more than twice the monthly household income of the
average SSI applicant and his or her labor earnings comprised a much larger share of that income.
This fact led us to separately evaluate the pattern of household income change for these two distinct
groups and also to divide our samples into those who were awarded benefits and those who were
denied benefits. In general we find that differences in outcomes between program populations are
greater than differences in outcomes within populations.
In all cases, the applicants’ average labor earnings declined dramatically beginning six
months before application, although in most cases these declines were evident 12 to 24 months prior
to application. Percentage declines in the average labor earnings of SSDI applicants were potentially
more serious with respect to declines in their household income than for SSI applicants, because their
labor earnings were a much more important component of their household income prior to
application.

32
Unlike most European countries, the United States has no universal short-term disability
program, and it imposes a five month waiting period before SSDI payments can be made.
Nevertheless, we found that average household income dropped much less dramatically than labor
earnings for SSDI and SSI applicants both in the months just before or just after application and over
the next three years, and did so even for those denied benefits.
For SSI applicants the primary reason for this relative modest decline in household income
was that on average their labor earnings did not play an important role in their household income
even three years prior to application. Hence, very large percentage declines in their own labor
earnings translated into much smaller percentage declines in their household’s income over the
period. There were, however, some important changes in the composition of other sources of income.
For SSI awardees, declines in AFDC and other welfare benefits as well as in spouses’ labor earnings
offset much of the gains from SSI in the months just after application for benefits.
SSDI applicants experienced a much greater potential decline in their household income
associated with a decline in their labor earnings, since their labor earnings were on average a much
greater component of their household income prior to application. In the early months following
SSDI application, a patchwork of temporary disability benefits (e.g., workers’ compensation,
unemployment insurance, veterans’ benefits, and employer pension benefits) offset declines in SSDI
applicants’ own labor earnings and their spouses’ earnings. In the longer run, most of these
temporary sources of income declined and were replaced by SSDI benefits. For those SSDI
applicants who were denied benefits, the fall in their household income was somewhat greater
immediately following application, but less so thereafter as their own labor earnings rose.
But while the average declines in household income from baseline for applicants are
relatively modest, we found substantial heterogeneity in outcomes in both the SSDI and SSI
applicant population. Almost 30 (20) percent of SSDI (SSI) applicants experienced a 50 percent or
greater decline in household income between baseline (12 to 14 months prior to initial application)
33
and a period just after initial application (1 to 3 months). Our quantile regressions suggest that it is
higher income households that experience the greater percentage declines in their post-application
income. Such results are consistent with the lower replacement rate established in the SSDI program
and the low absolute level of protection provided to all SSI applicants regardless of income prior to
application.
34
References
Benitez-Silva, Hugo, Moshe Buchinsky, Hiu-Man Chan, John Rust, and Sofia Sheivasser. 1998. “An Empirical Analysis of the Social Security Disability Application, Appeal, and Award Process,” Labour Economics, Vol. 6 (2): 147-178.
Bound, John. 1989. “The Health and Earnings of Disability Insurance Applicants.” American Economic Review, LXXIX: 482-503.
Bound, John and Richard V. Burkhauser. 1999. “Economic Analysis of Transfer Programs Targeted on People with Disabilities.” In Orley C. Ashenfelter and David Card (eds.), Handbook of Labor Economics. Volume 3C. Amsterdam: Elsevier Science, pp. 3417-3528.
Burkhauser, Richard V., Debra Dwyer, Maarten Lindeboom, Jules Theeuwes, and Isolde Woittiez. 1999. “Health, Work, and Economic Status: A Cross-National Comparison of United States and Dutch Men Nearing Retirement Age.” In James Smith and Robert Willis (eds.), Wealth, Work and Health: Innovations in Measurement in the Social Sciences: Essays in Honor of F. Thomas Juster. Ann Arbor: University of Michigan, pp 233-266.
Burkhauser, Richard V. and Mary C. Daly. 1996. “Employment and Economic Well-Being Following the Onset of a Disability: The Role for Public Policy.” In Jerry Mashaw, Virginia Reno, Richard V. Burkhauser, and Monroe Berkowitz (eds.), Disability, Work, and Cash Benefits. Kalamazoo, MI: W.E. Upjohn Institute for Employment Research, pp. 59-102.
Burkhauser, Richard V., J.S. Butler, and Robert R. Weathers II. 2000. “How Policy Variables Influence the Timing of Social Security Disability Insurance Applications.” Department of Policy Analysis and Management, Cornell University, Ithaca, NY, September.
Burkhauser, Richard V. and David C. Wittenburg. 1996. “How Current Disability Transfer Policies Discourage Work: Analysis from the 1990 SIPP,” Journal of Vocational Rehabilitation, 7(1/2) (August): 9-27.
Burkhead, D. and J. Coder. 1985. “Gross Changes in Income Recipiency from the Survey of Income and Program Participation.” Proceedings of the Section on Social Statistics, American Statistical Association, pp. 351-356.
Daly, Mary C. and Richard V. Burkhauser. Forthcoming. “The Supplemental Security Income Program.” In Robert Moffitt (ed.), Means Tested Transfer Programs in the United States. Chicago, IL. University of Chicago Press for the NBER.
Dynarski, Susan and Jonathan Gruber. 1997. “Can Families Smooth Variable Earnings?” Brookings Papers on Economic Activity, No. 1, pp. 229-84.
Hill, D. 1987. “Response Errors Around the Seam: Analysis of Change in a Panel with Overlapping Reference Periods.” Proceedings of the Section on Survey Research Methods, American Statistical Association, pp. 210-215.
Hu, Jainting, Kajal Lahari, Denton R. Vaughan and Bernard Wixon. 1997. “Structural Model of Social Security’s Disability Determination Process.” Social Security Administration, Office of Research, Evaluation and Statistics, Working Paper # 72.
Kerns, Wilmer L. 1994, “Protection Against Income Loss During the First 6 Months of Illness or Injury.” Social Security Bulletin, 57 pp,. 88-92.

35
Lahari, Kajal, Denton R. Vaughan and Bernard Wixon. 1995. “Modeling Social Security’s Sequential Disability Determination Using Matched SIPP Data.” Social Security Bulletin, 58 pp. 3-42.
Moore, J. and D. Kasprzyk. 1984. “Month-to-Month Recipiency Turnover in the ISDP.” Proceedings of the Section on Survey Research Methods, American Statistical Association, p. 2.
United States, Social Security Administration. 1999. Annual Statistical Supplement to the Social Security Bulletin. Washington, DC: Government Printing Office.
United States House of Representative, Committee on Ways and Means. 1993. Background Material on Data and Programs within the Jurisdiction of the Committee of Ways and Means. Washington, DC: Government Printing Office.

36
Technical Appendix
Fixed-Effect Regressions Figures 1A, 2A and 6 through 13 are constructed using estimated coefficients from regressions with
the format in Equation 1 below. Fixed effects are included for each individual applicant, i, and for
each calendar month, t, in the sample period. A set of indicator variables for months relative to
application month is also included. These variables (month zero, for example, representing the month
of application, or month twelve, to take another example, representing the month one year
subsequent to application) are equal to one if observation of income data is taken from the month
corresponding to the indicator variable, and zero otherwise. Thus the equations have the form:
where ity represents monthly income (in January 1990 dollars) for applicant i in time period t, the α’s
and the γ’s represent applicant and calendar month fixed effects, and the ijm ’s represent the month
relative to application month indicator variables. Months from 35 months before to 39 months after
application each have one indicator variable corresponding to that month. Data from 39 or more
months prior to application or 40 or more months subsequent to application are excluded from the
regression sample, so that the coefficients (the β’s in the equation) on application month indicator
variables are interpreted as the average change from the level observed 36 to 38 months prior to
it i t j j ij ity = + + m + α γ β ε∑ (1)

37
application. The procedure for obtaining the values reported in Figures 1B, 2B and all the appendix
figures is the same, except that, the dependent variables are indicator variables that equal one if the
income is positive in the given month.
For purposes of presentation, we report the β’s relative to average baseline incomes (technically,
relative to the average α). Thus, the values in the figures can be interpreted as the average change in
income from a particular source relative to baseline.
Figures 3, 4, 5, and 6 are based on similar regressions. However, here the coefficients for changes in
total household income are converted into percentage changes by dividing by baseline total
household income 36 to 38 months prior to application. Thus, the bold solid line in each of these
graphs represents the percentage change since baseline in average total household income. The
simulated changes are constructed using coefficients from separate fixed-effect regressions with the
same structure. The schedule marked “simulated percentage change in household income, allowing
only applicants’ labor earnings to change” is constructed using coefficients estimated from a
regression of applicants labor earnings on application months. The coefficients from the regression
of applicants labor earnings are divided by baseline total household income 36 to 38 months prior to
application. Thus, the simulations represent what would have happened to household income had all
other sources of income stayed constant at their baseline level. Similarly, the schedule marked
“simulated percentage change in household income, allowing all other sources of income to change
but holding SSDI and SSI at their baseline levels” is constructed using coefficients estimated from a
regression of total household income less own SSDI and SSI on application months. The coefficients
from this regression are then divided by baseline total household income 36 to 38 months prior to
application to covert into simulated percentage changes. Thus, these simulations represent what
38
would have happened to household income had there been no change in own SSDI and SSI benefits
relative to baseline.
Tables
The average income levels and participation rates reported for three-month periods surrounding
application for SSDI or SSI benefits in Tables 2, 3, and 4 are calculated by averaging first across
observed data for an individual, then across individuals weighted by the population weights for
individuals as of their entry into the SIPP. The unweighted results are very similar to the reported
weighted results. If only one or two months are observed for an individual, only those months are
used in constructing individual averages; these individuals are not weighted less when averaging
across individuals.
Participation rates are constructed using indicator variables for positive income in a given month.
Since an individual may or may not have positive income in any month in the relevant three-month
window, individuals enter the cross-individual averages with a value of zero, one-third, one-half,
two-thirds, or one, indicating no months of positive income, one positive out of three observed, one
positive out of two observed, two positive out of three observed, or all positive amounts of income in
observed months.
Definitions
All the information on household income comes from the SIPP data. It has been disaggregated to
provide a general sense of how the sources of household income change across the months leading
up to and following application for either SSDI or SSI benefits. The definition for the income
categories we use in Tables 4 and 5are listed below.

39
Table 4
Labor Earnings include wage and salary income, self-employment income, and incidental or casual
earnings.
Property Income includes all income from assets, including rent and dividends
Pension Income includes railroad retirement pension; company or union pension; federal civil
service, or other federal civilian employee pensions; U.S. military retirement pay;
state government pensions; local government pensions; income from paid-up life insurance policies,
or annuities; other payment for retirement, disability, or survivor.
Veterans Benefits include all veterans benefits.
Private Transfers includes income assistance from a charitable group, money from relatives or
friends, and lump sum payments.
Temporary Disability Income includes payments from an employer or union temporary sickness
policy or own sickness, accident, or disability insurance policy.
Workers’ Compensation includes Workers Compensation payments to any household member.
Unemployment Insurance includes Unemployment Insurance payments to any household member.
Social Security Income includes all household social security income, including SSDI and OASI
payments to retired, disabled, or survivor household members.
SSI includes federal SSI payments to all household members
Other Transfers except SSI includes all other government transfers, including AFDC, General
Assistance, and Noncash transfers.
AFDC includes AFDC payments to any household member.
Noncash Transfers include Food Stamps and any other noncash means-tested benefits.

40
Table 5 These are quantile regressions. The dependent variable is mean household income over the period 1
to 3 months after application minus mean household income over the period 12 to 14 months before
application in January 1990 dollars.
Log of Income at Baseline is the natural logarithm of mean household income over the period 12 to
14 months before application.
Share of Own Labor Earnings at baseline is the ratio of mean own labor earnings (over the period 12
to 14 months before application) to mean household income (over the period 12 to 14 months before
application).
Age at Baseline (x 100) is the applicant's age 14 months before application. The estimated coefficient
has been multiplied by 100 for ease of exposition.
Awarded Benefits is the final disposition of the first application observed. This variable is one if the
applicant was awarded benefits and zero otherwise.
Female equals one if the applicant is female and zero otherwise.

41
Appendix Table1: Cumulative percent of waiting time for the Last Decision Observed SSDI SSI Months All Awarded Denied All Awarded Denied
0 3.2 5.0 1.3 1.1 1.0 1.11 24.7 30.9 18.4 9.0 9.9 8.52 45.8 52.3 39.4 28.0 33.3 25.0
3 62.9 67.3 58.4 47.8 54.1 44.14 74.7 77.6 71.8 63.5 70.0 59.65 82.7 83.8 81.6 75.4 80.2 72.56 87.4 87.1 87.7 83.6 87.7 81.27 91.0 89.7 92.2 89.6 92.7 87.88 92.8 90.9 94.7 92.5 95.4 90.89 94.6 92.4 96.9 95.5 97.3 94.410 95.5 93.2 97.8 96.8 97.6 96.415 98.3 97.3 99.3 99.2 99.3 99.220 99.2 98.6 99.8 99.8 99.7 99.925 99.5 99.2 99.9 99.9 99.8 100.030 99.7 99.4 100.0 99.9 99.8 100.035 99.9 99.7 100.0 99.9 99.8 100.045 99.9 99.9 100.0 99.9 100.0 100.050 100.0 100.0 100.0 100.0 100.0 100.0
Note: Unweighted data Source: 1990-1993 SIPP data merged to Social Security Administration Disability determination records.
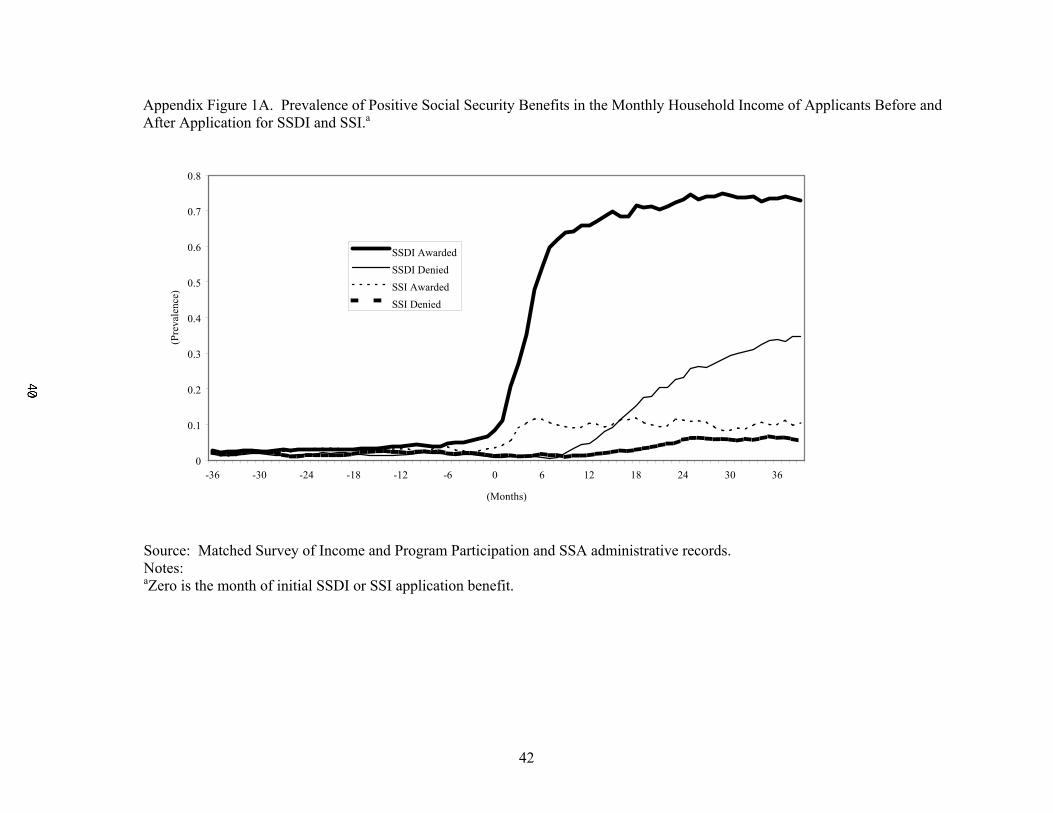
42
Appendix Figure 1A. Prevalence of Positive Social Security Benefits in the Monthly Household Income of Applicants Before and After Application for SSDI and SSI.a
0
0.1
0.2
0.3
0.4
0.5
0.6
0.7
0.8
-36 -30 -24 -18 -12 -6 0 6 12 18 24 30 36
(Months)
(Pre
vale
nce)
SSDI AwardedSSDI DeniedSSI AwardedSSI Denied
Source: Matched Survey of Income and Program Participation and SSA administrative records. Notes: aZero is the month of initial SSDI or SSI application benefit.

43
Appendix Figure 2A. Prevalence of Positive Employer Pension Benefits in the Monthly Household Income of Applicants Before and After Application for SSDI and SSI.a
0
0.05
0.1
0.15
0.2
0.25
0.3
0.35
0.4
0.45
0.5
-36 -30 -24 -18 -12 -6 0 6 12 18 24 30 36
(Months)
(Pre
vale
nce)
SSI AwardedSSDI AwardedSSI DeniedSSDI Denied
Source: Matched Survey of Income and Program Participation and SSA administrative records. Notes: aZero is the month of initial SSDI or SSI application.

44
Appendix Figure 3A. Prevalence of Positive Temporary Insurance Benefits in the Monthly Household Income of Applicants Before and After Application for SSDI and SSI.a
0
0.05
0.1
0.15
0.2
0.25
0.3
0.35
0.4
0.45
-36 -30 -24 -18 -12 -6 0 6 12 18 24 30 36
(Months)
(Pre
vale
nce)
SDDI Awarded
SDDI Denied
SSI Awarded
SSI Denied
Source: Matched Survey of Income and Program Participation and SSA administrative records. Notes: aZero is the month of initial SSDI or SSI application.

45
Appendix Figure 4A. Prevalence of Positive Spouse Labor Earnings in the Monthly Household Income of Applicants Before and After Application for SSDI and SSI.a
0
0.1
0.2
0.3
0.4
0.5
0.6
-36 -30 -24 -18 -12 -6 0 6 12 18 24 30 36(Months)
(Pre
vale
nce)
SSDI AwardedSSDI DeniedSSI AwardedSSI Denied
Source: Matched Survey of Income and Program Participation and SSA administrative records. Notes: aZero is the month of initial SSDI or SSI application.

46
Appendix Figure 5A. Prevalence of Positive Government Welfare Transfers Except SSI Benefits in the Monthly Household Income of Applicant Before and After Application for SSDI and SSI.a
0
0.1
0.2
0.3
0.4
0.5
0.6
0.7
0.8
-36 -30 -24 -18 -12 -6 0 6 12 18 24 30 36(Months)
(Pre
vale
nce)
SSDI AwardedSSDI DeniedSSI AwardedSSI Denied
Source: Matched Survey of Income and Program Participation and SSA administrative records. Notes: aZero is the month of initial SSDI or SSI application.
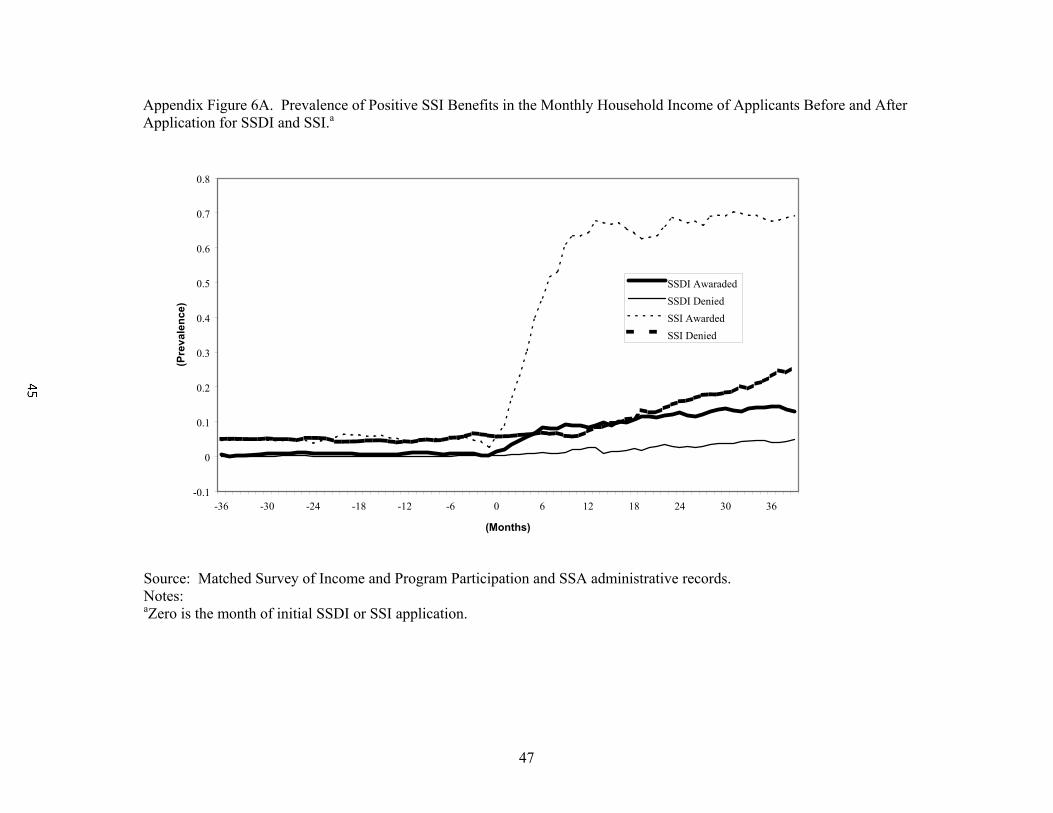
47
Appendix Figure 6A. Prevalence of Positive SSI Benefits in the Monthly Household Income of Applicants Before and After Application for SSDI and SSI.a
-0.1
0
0.1
0.2
0.3
0.4
0.5
0.6
0.7
0.8
-36 -30 -24 -18 -12 -6 0 6 12 18 24 30 36
(Months)
(Pre
vale
nce)
SSDI AwaradedSSDI DeniedSSI AwardedSSI Denied
Source: Matched Survey of Income and Program Participation and SSA administrative records. Notes: aZero is the month of initial SSDI or SSI application.

48
Appendix Figure 7A. Prevalence of Positive Earnings of Household Members Other Than Applicant or Applicant’s Spouse in the Monthly Household Income of Applicants Before and After Application for SSDI and SSI.a
0
0.05
0.1
0.15
0.2
0.25
0.3
0.35
0.4
0.45
0.5
-36 -30 -24 -18 -12 -6 0 6 12 18 24 30 36
(Months)
(Pre
vale
nce)
SSDI AwardedSSDI DeniedSSI AwardedSSI Denied
Source: Matched Survey of Income and Program Participation and SSA administrative records. Notes: aZero is the month of initial SSDI or SSI application.

49
Table 1. Socio-Economic Characteristics of SSDI and SSI Applicants
Socio-Economic Characteristic
Non-Applicantsa
Social Security
Disability Insuranceb
Supplemental
Security Incomeb
Bothc Mean Age 37 47 40 41Gender Percentage Male 49.1 58.5 31.7 56.5Race or Ethnicity Percentage White, Non-Hispanic 77.3 78.5 53.2 61.5Percentage Black, Non-Hispanic 10.0 11.7 26.5 25.1Percentage Hispanic 8.8 7.4 14.0 11.2Percentage Other 3.9 2.4 6.3 2.2 Education Percentage Less than 12 Years of Education 12.6 24.7 46.9 36.6Percentage 12 Years or More of Education 87.4 75.3 53.1 63.4 Marital Status Percentage Married, Spouse Present 58.6 64.5 33.2 38.3Percentage Widowed 1.7 4.0 6.1 4.6Percentage Divorced or Separated 12.1 17.3 27.8 30.2Percentage Never Married 26.7 13.6 31.9 25.6 Household Sized Mean number of people 2.9 2.2 2.5 2.2 Financial Wealth in dollarse 25th percentile 90 159 0 050th percentile 1,670 1,622 0 2975th percentile 11,051 11,039 572 954 Economic Well-Being Mean Household Incomee 3,727 3,458 1,530 2,023Mean Income/Needse 4.2 4.1 1.6 2.3Number of Individuals in Sample 108,004 1228 662 1052Number of Individuals in Subsamplee -- 527c 253c 425c
Source: 1990-1993 SIPP data merged to Social Security Administration disability determination records Notes: aNon-applicants include all adults aged 18 through 61 who appear in any first wave of SIPP data who are not found to apply for SSDI or SSI over the period of our social security administrative records. bApplicants based on social security administrative records. cSSI applicants who also applied for SSDI based on social security administration records. dHousehold size statistics are calculated counting each household once (i.e. not at the individual level, unlike the rest of the analysis). eIncluded in subsamples are those applicants with wealth or first wave household income observed at least 12 months prior to application. Wealth and income are reported in January 1990 dollars.

50
Table 2. Average Monthly Labor Earnings and Employment Rates And How They Changed Before and After Application for SSDI and SSI.a
Before Applicationb Application c After Applicationd
Population
Monthly Labor
Earnings e
Employment
Ratef
Monthly Labor
Earnings e
Employment
Ratef
Percent of Before
Earningsg
Monthly Labor
Earnings e
Employment
Ratef
Percent of Before
Earningsg Social Security Disability Insurance
Awarded SSDI 1,575 87 248 16 16 87 11 6Denied SSDI 1,248 81 154 17 12 434 31 35 Supplemental Security Income
Awarded SSI 144 25 17 6 12 63 12 44Denied SSI 260 28 89 15 34 105 19 40
Source: 1990-1993 SIPP data merged to Social Security Administration disability determination records. Notes: aJanuary 1990 dollars b36 to 38 months prior to application. c1 to 3 months after application. d37 to 39 months after application. eAverage includes zeros. fPositvie labor Earnings in at least one month over the period. gAverage monthly labor earnings during application period divided by average monthly labor earnings before application. hAverage monthly labor earnings during after application divided by average monthly labor earnings before application
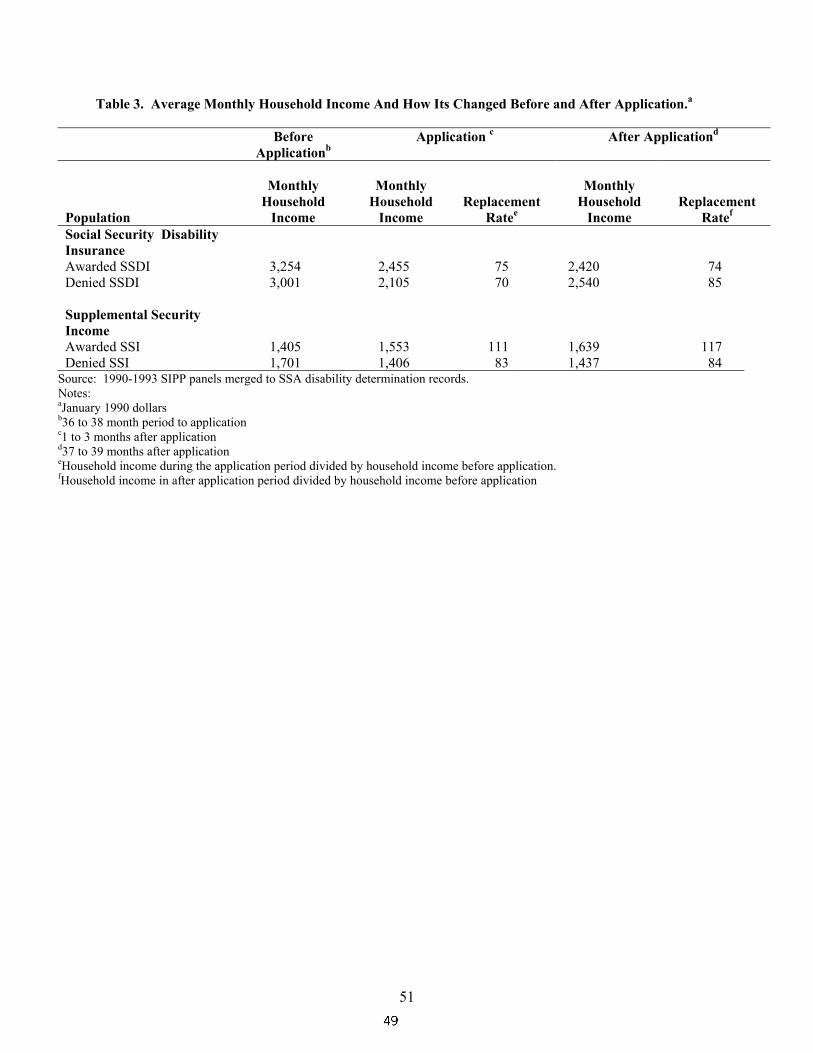
51
Table 3. Average Monthly Household Income And How Its Changed Before and After Application.a
Before Applicationb
Application c After Applicationd
Population
Monthly
Household Income
Monthly
Household Income
Replacement Ratee
Monthly
Household Income
Replacement Ratef
Social Security Disability Insurance
Awarded SSDI 3,254 2,455 75 2,420 74Denied SSDI 3,001 2,105 70 2,540 85 Supplemental Security Income
Awarded SSI 1,405 1,553 111 1,639 117Denied SSI 1,701 1,406 83 1,437 84
Source: 1990-1993 SIPP panels merged to SSA disability determination records. Notes: aJanuary 1990 dollars b36 to 38 month period to application c1 to 3 months after application d37 to 39 months after application eHousehold income during the application period divided by household income before application. fHousehold income in after application period divided by household income before application

52
. Table 4. Average Monthly Household Income by Sources and How They Changed Before and After Application.d
Household Income Before Application Application After Application SSDI SSI SSDI SSI SSDI SSI Awarded Denied Awarded Denied Awarded Denied Awarded Denied Awarded Denied Awarded Denied All 3,254 3,001 1,405 1,701 2,455 2,105 1,553 1,406 2,420 2,540 1,639 1,437 Labor Earnings 2,804 2,584 840 1,047 1,457 1,291 926 726 1,164 1,639 846 725 Own 1,575 1,248 144 260 248 154 17 89 87 434 63 105 Spouse 858 971 296 276 703 705 189 126 608 827 60 131 Others 371 366 400 512 507 432 719 511 469 378 723 489 Property 113 87 19 6 105 93 40 16 68 94 28 49 Pensions 105 72 33 49 267 185 36 32 296 256 55 100 Veterans Benefits 10 14 10 28 24 24 17 41 42 15 21 13 Private Transfers 26 27 42 12 15 8 9 56 7 30 17 13 Temporary Disability
14 2 4 2 50 78 0 1 22 7 0 0
Workers’ Compensation
36 67 16 18 147 173 5 13 43 59 3 4
Unemployment Income
31 32 23 33 52 57 42 34 6 25 13 10
Social Security 81 54 105 144 244 96 129 108 655 317 166 149 Own 10 8 12 11 116 1 30 2 539 210 59 40 SSI 6 6 56 58 20 13 98 61 60 27 331 136 Own 1 2 1 29 14 0 51 16 49 15 257 93 Other Transfers except SSI
14 27 236 274 17 31 240 278 29 43 154 223
AFDC 6 14 111 160 7 8 113 116 11 16 57 78 Noncash Transfers 7 8 96 106 5 14 95 130 11 16 56 103 All other income Source: 1990-1993 SIPP panels merged to SSA disability determination records. Notes: aJanuary 1990 dollars b36 to 38 month period to application c1 to 3 months after application d37 to 39 months after application

53
Table 5. Percentage Change in SSDI and SSI Applicants’ Mean Household Income. SSDI SSI Percentile Percentile 25 50 75 25 50 75 Log of Income -0.12* -0.19* -0.37* -0.18* -0.18* -0.30* at Baseline (0.03) (0.03) (0.05) (0.06) (0.05) (0.08) Share of Own Labor Earnings -0.33* -0.33* -0.34* -0.53* -0.62* -0.64*at Baseline (0.07) (0.077) (0.11) (0.15) (0.17) (0.23) Age at Baseline (x 100) -0. 24 -0. 24 -0. 03 -0. 34 -0. 29 -0. 67 (0.21) (0.23) (0.37) (0.35) (0.35) (0.46) Awarded Benefits 0.04 0.05 0.16* 0.05 0.09 0.19 (0.04) (0.05) (0.08) (0.09) (0.09) (0.11) Female 0.01 -0.03 -0.01 -0.03 -0.05 -0.17 (0.04) (0.05) (0.07) (0.11) (0.10) (0.12) Married at Baseline 0.30* 0.20* 0.21* -0.11 -0.01 0.01 (0.05) (0.05) (0.08) (0.09) (0.09) (0.11) Constant 0.51 1.28 2.86 1.17 1.34 2.61 (0.26) (0.27) (0.46) (0.46) (0.42) (0.62)N 394 394 394 228 228 228 Sample quartiles -0.58 -0.27 0.01 -0.39 -0.06 0.17
Source: 1990-1993 SIPP data merged to Social Security Administration disability determination records Note: The dependent variable is the difference between household income 1 to 3 months after application and 12 to 14 months before application in January 1990 dollars. *Significant at the 95 percent level.
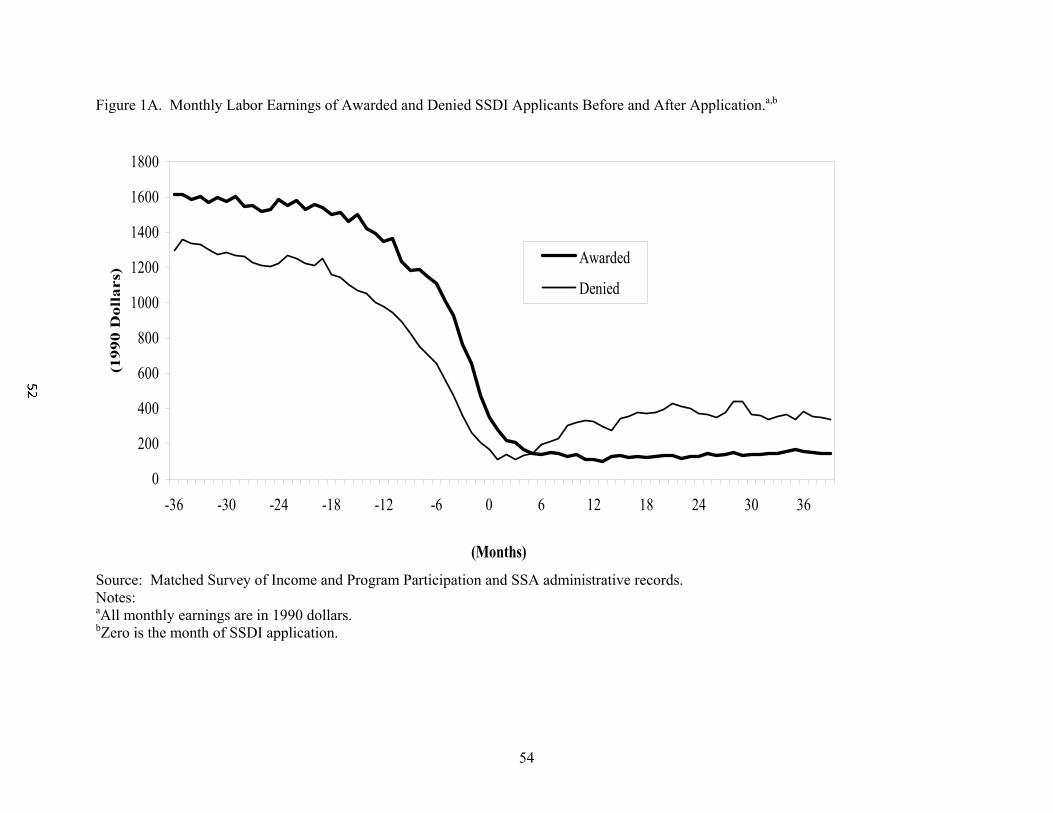
54
Figure 1A. Monthly Labor Earnings of Awarded and Denied SSDI Applicants Before and After Application.a,b
Source: Matched Survey of Income and Program Participation and SSA administrative records. Notes: aAll monthly earnings are in 1990 dollars. bZero is the month of SSDI application.
0
200
400
600
800
1000
1200
1400
1600
1800
-36 -30 -24 -18 -12 -6 0 6 12 18 24 30 36
(Months)
(199
0 D
olla
rs)
Awarded
Denied

55
Figure 1B. Monthly Employment Rates of Awarded and Denied SSDI Applicants Before and After Application.a,b
0
10
20
30
40
50
60
70
80
90
-36 -30 -24 -18 -12 -6 0 6 12 18 24 30 36
(Months)
(Em
ploy
men
t Rat
e)
AwardedDenied
Source: Matched Survey of Income and Program Participation and SSA administrative records. Notes: aAny persons who report positive labor earnings in a given month are considered to be employed in that month. bZero is the month of SSDI application.
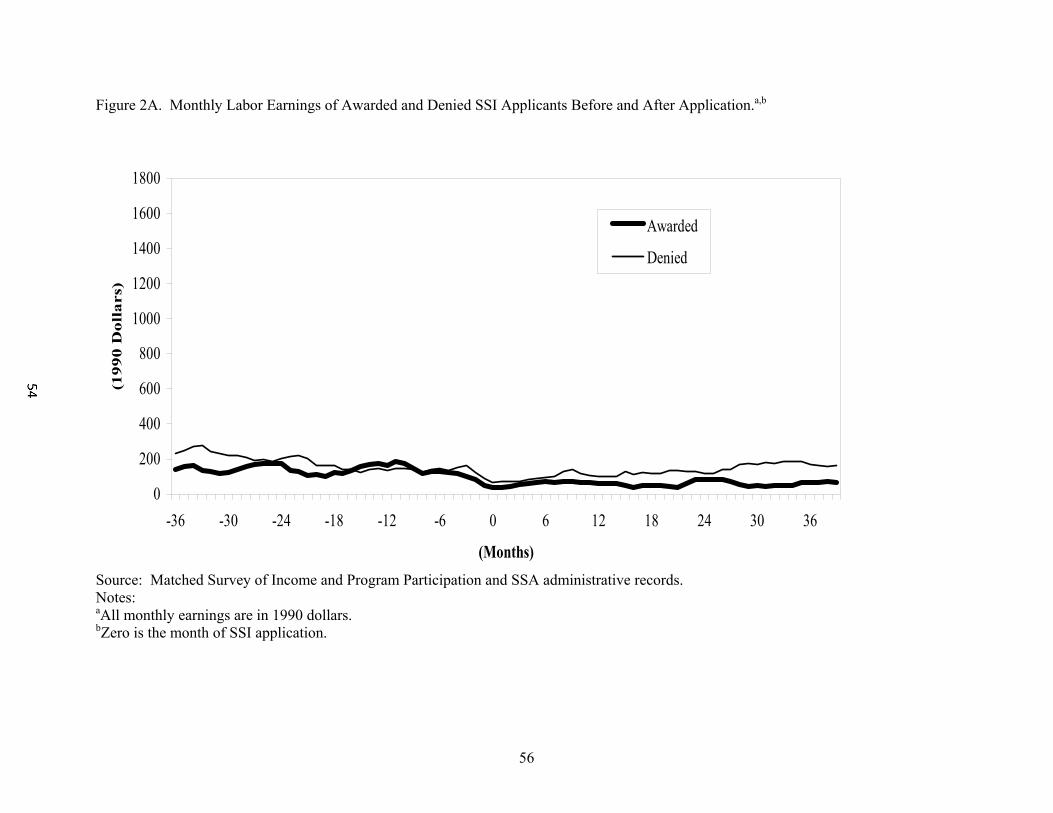
56
Figure 2A. Monthly Labor Earnings of Awarded and Denied SSI Applicants Before and After Application.a,b
Source: Matched Survey of Income and Program Participation and SSA administrative records. Notes: aAll monthly earnings are in 1990 dollars. bZero is the month of SSI application.
0
200
400
600
800
1000
1200
1400
1600
1800
-36 -30 -24 -18 -12 -6 0 6 12 18 24 30 36
(Months)
(199
0 D
olla
rs)
Awarded
Denied

57
Figure 2B. Monthly Employment of Awarded and Denied SSI Applicants Before and After Application.a,b
0
10
20
30
40
50
60
70
80
90
-36 -30 -24 -18 -12 -6 0 6 12 18 24 30 36
(Months)
(Em
ploy
men
t Rat
e)
Awarded
Denied
Source: Matched Survey of Income and Program Participation and SSA administrative records. Notes: aAll monthly earnings are in 1990 dollars. bZero is the month of SSI application.
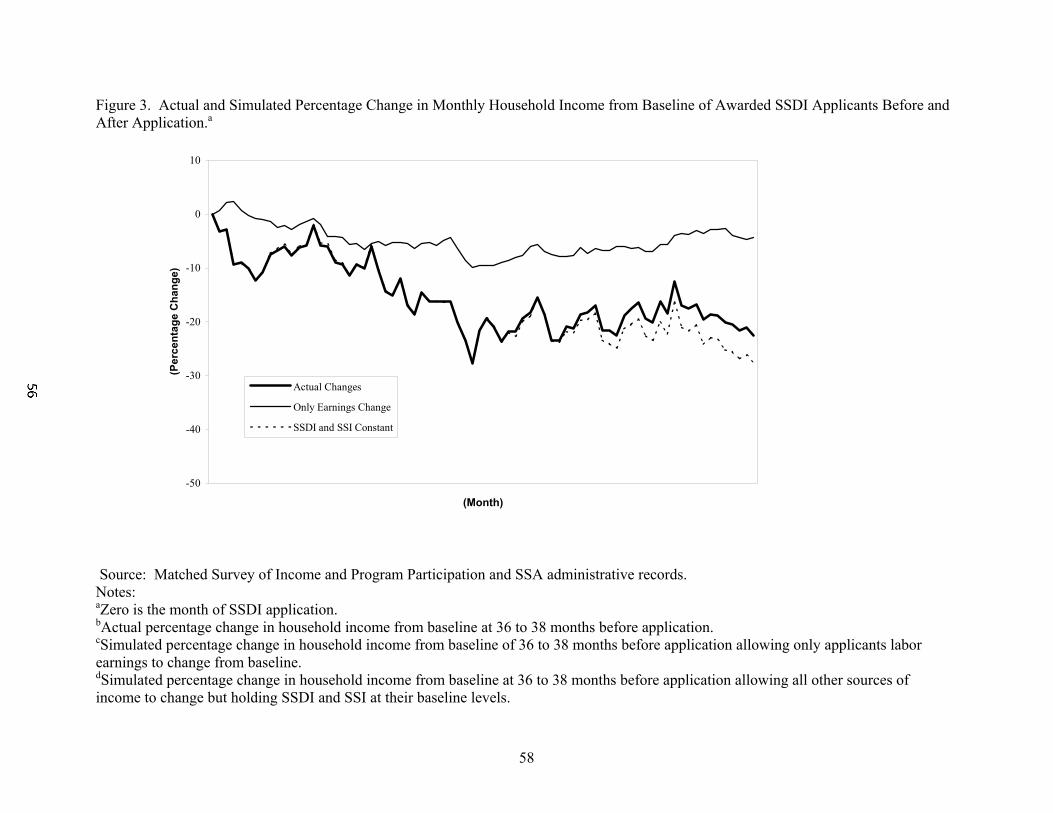
58
Figure 3. Actual and Simulated Percentage Change in Monthly Household Income from Baseline of Awarded SSDI Applicants Before and After Application.a
-50
-40
-30
-20
-10
0
10
(Month)
(Per
cent
age
Cha
nge)
Actual Changes
Only Earnings Change
SSDI and SSI Constant
Source: Matched Survey of Income and Program Participation and SSA administrative records. Notes: aZero is the month of SSDI application. bActual percentage change in household income from baseline at 36 to 38 months before application. cSimulated percentage change in household income from baseline of 36 to 38 months before application allowing only applicants labor earnings to change from baseline. dSimulated percentage change in household income from baseline at 36 to 38 months before application allowing all other sources of income to change but holding SSDI and SSI at their baseline levels.

59
Figure 4. Actual and Simulated Percentage Change in Monthly Household Income from Baseline of Denied SSDI Applicants Before and After Application.a
-0.5
-0.4
-0.3
-0.2
-0.1
0.0
0.1
-36 -30 -24 -18 -12 -6 0 6 12 18 24 30 36
(Months)
(Per
cent
age
Cha
nge)
Actual ChangesOnly Earnings ChangeSSDI and SSI Constant
Source: Matched Survey of Income and Program Participation and SSA administrative records. Notes: aZero is the month of SSDI application. bActual percentage change in household income from baseline at 36 to 38 months before application. cSimulated percentage change in household income from baseline of 36 to 38 months before application allowing only applicants labor earnings to change from baseline. dSimulated percentage change in household income from baseline at 36 to 38 months before application allowing all other sources of income to change but holding SSDI and SSI at their baseline levels.
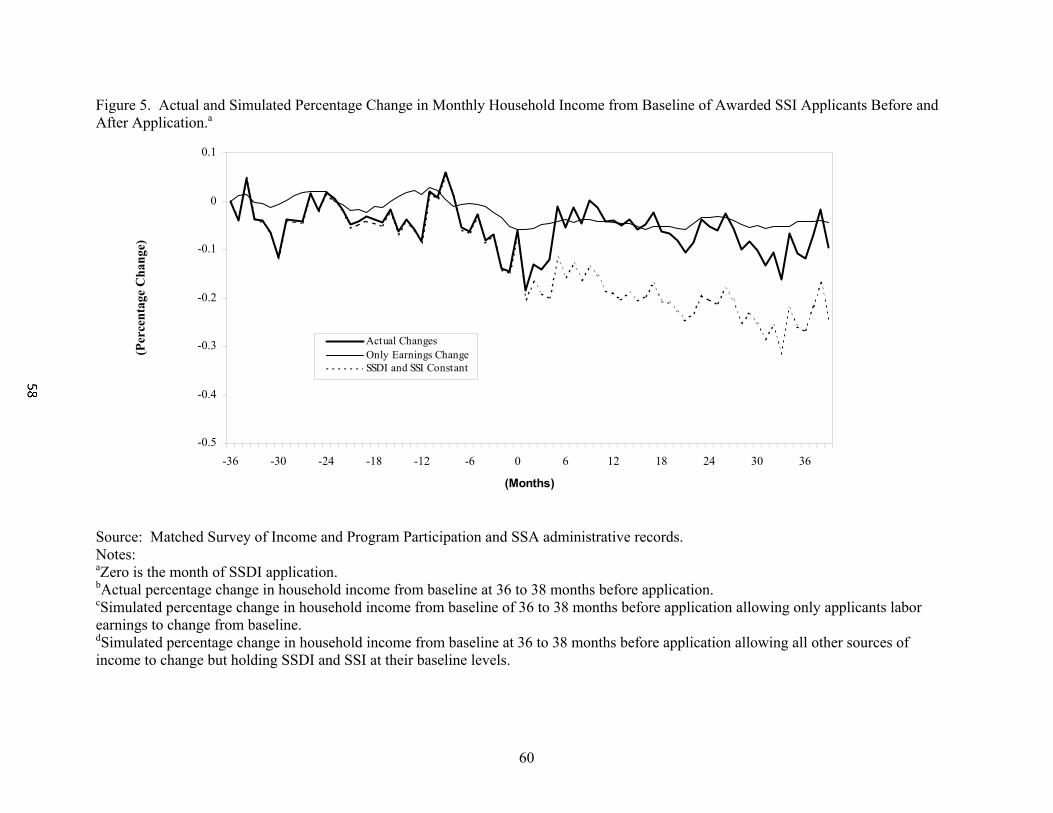
60
Figure 5. Actual and Simulated Percentage Change in Monthly Household Income from Baseline of Awarded SSI Applicants Before and After Application.a
-0.5
-0.4
-0.3
-0.2
-0.1
0
0.1
-36 -30 -24 -18 -12 -6 0 6 12 18 24 30 36
(Months)
(Per
cent
age
Cha
nge)
Actual ChangesOnly Earnings ChangeSSDI and SSI Constant
Source: Matched Survey of Income and Program Participation and SSA administrative records. Notes: aZero is the month of SSDI application. bActual percentage change in household income from baseline at 36 to 38 months before application. cSimulated percentage change in household income from baseline of 36 to 38 months before application allowing only applicants labor earnings to change from baseline. dSimulated percentage change in household income from baseline at 36 to 38 months before application allowing all other sources of income to change but holding SSDI and SSI at their baseline levels.

61
Figure 6. Actual and Simulated Percentage Change in Monthly Household Income form Baseline of Denied SSI Applicants Before and After Application.a
-0.5
-0.4
-0.3
-0.2
-0.1
0
0.1
-36 -30 -24 -18 -12 -6 0 6 12 18 24 30 36
(Months)
(Per
cent
age
Cha
nge)
Actual Changes
Only Earnings Change
SSDI and SSI Constant
Source: Matched Survey of Income and Program Participation and SSA administrative records. Notes: aZero is the month of SSDI application. bActual percentage change in household income from baseline at 36 to 38 months before application. cSimulated percentage change in household income from baseline of 36 to 38 months before application allowing only applicants labor earnings to change from baseline. dSimulated percentage change in household income from baseline at 36 to 38 months before application allowing all other sources of income to change but holding SSDI and SSI at their baseline levels.
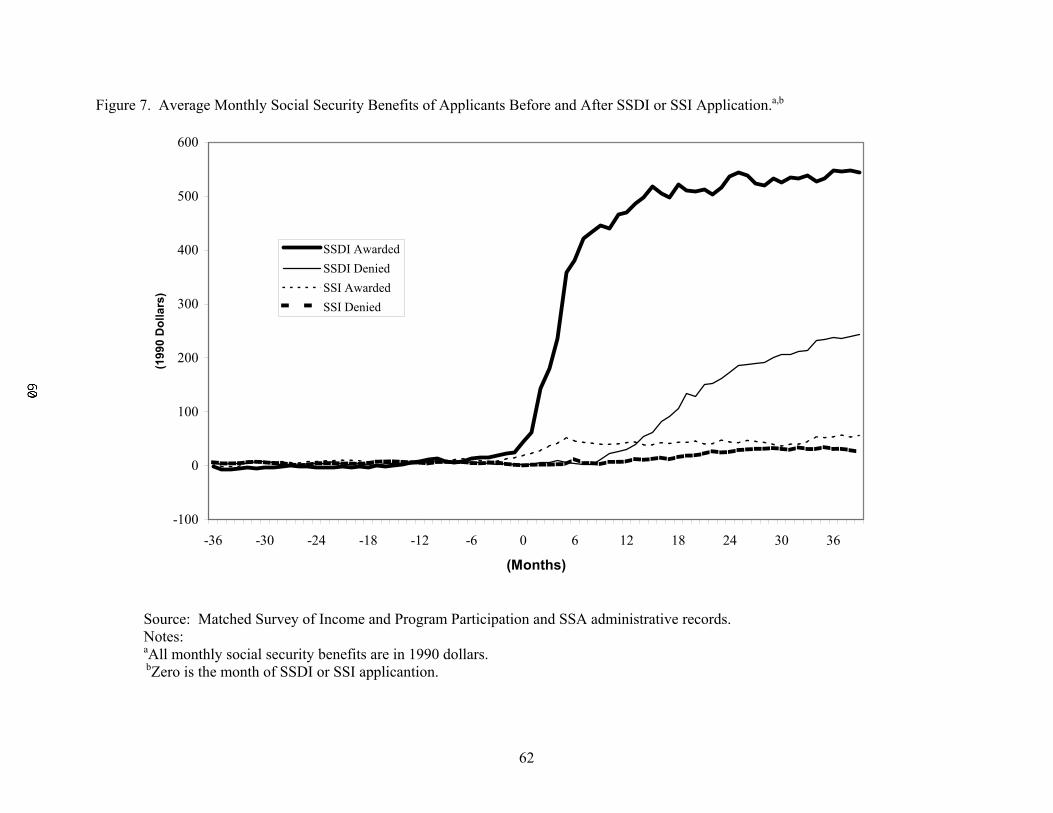
62
Figure 7. Average Monthly Social Security Benefits of Applicants Before and After SSDI or SSI Application.a,b
-100
0
100
200
300
400
500
600
-36 -30 -24 -18 -12 -6 0 6 12 18 24 30 36
(Months)
(199
0 D
olla
rs)
SSDI AwardedSSDI DeniedSSI AwardedSSI Denied
Source: Matched Survey of Income and Program Participation and SSA administrative records. Notes: aAll monthly social security benefits are in 1990 dollars. bZero is the month of SSDI or SSI applicantion.
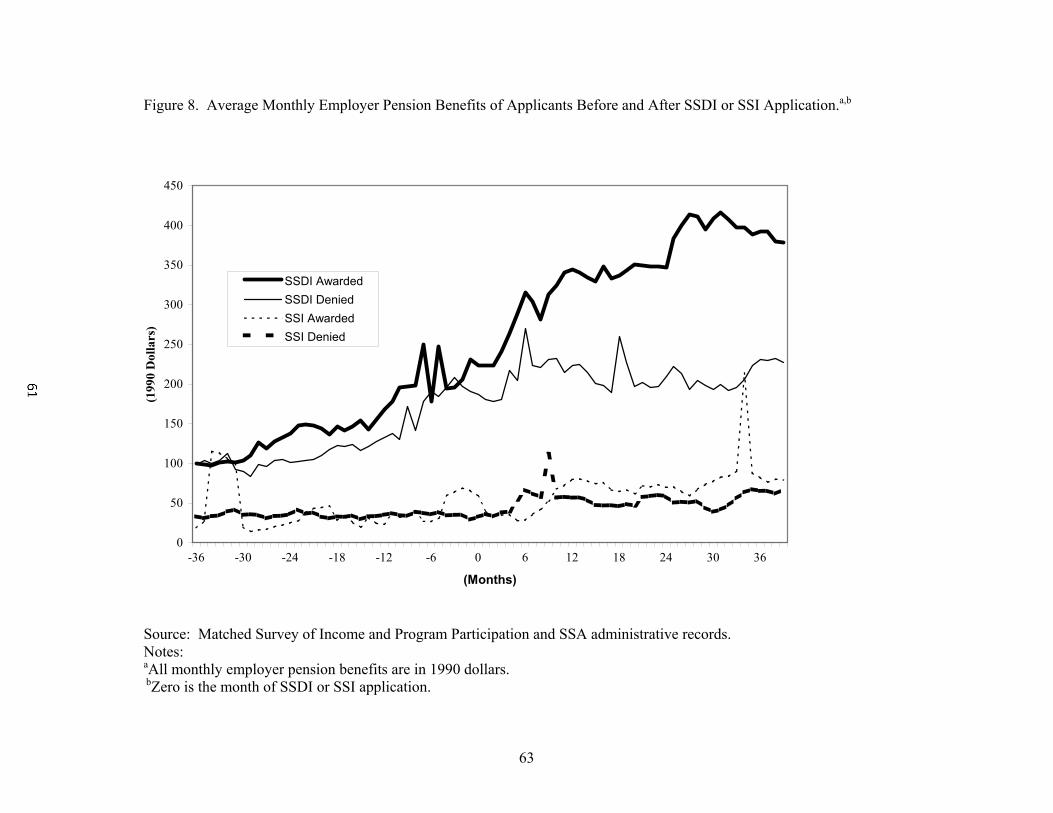
63
Figure 8. Average Monthly Employer Pension Benefits of Applicants Before and After SSDI or SSI Application.a,b
0
50
100
150
200
250
300
350
400
450
-36 -30 -24 -18 -12 -6 0 6 12 18 24 30 36
(Months)
(199
0 D
olla
rs)
SSDI AwardedSSDI DeniedSSI AwardedSSI Denied
Source: Matched Survey of Income and Program Participation and SSA administrative records. Notes: aAll monthly employer pension benefits are in 1990 dollars. bZero is the month of SSDI or SSI application.

64
Figure 9. Average Monthly Temporary Insurance Benefits Before and After SSDI or SSI Application.a,b
-50
0
50
100
150
200
250
300
350
400
-36 -30 -24 -18 -12 -6 0 6 12 18 24 30 36(Months)
(199
0 D
olla
rs)
DI AwardedDI DeniedSSI AwardedSSI Denied
Source: Matched Survey of Income and Program Participation and SSA administrative records. Notes: aAll monthly temporary insurance benefits are in 1990 dollars. bZero is the month of SSDI or SSI benefit. CTemporary Benefits include Workers’ Compensation, Unemployment Insurance, and temporary private insurance benefits.

65
Figure 10. Average Monthly Labor Earnings of Applicant’s Spouse Before and After SSDI or SSI Application.a,b,c
0
100
200
300
400
500
600
700
800
900
1000
-36 -30 -24 -18 -12 -6 0 6 12 18 24 30 36
(Months)
(199
0 D
olla
rs)
DI AwardedDI DeniedSSI AwardedSSI Denied
Source: Matched Survey of Income and Program Participation and SSA administrative records. Notes: aAll monthly spouse’s labor earnings are in 1990 dollars. bZero is the month of SSDI or SSI application.

66
Figure 11. Average Monthly Government Welfare Transfers Except SSI Before and After SSDI or SSI Application.a,b,c
0
50
100
150
200
250
300
350
400
-36 -30 -24 -18 -12 -6 0 6 12 18 24 30 36(Months)
(199
0 D
olla
rs)
SSDI Awarded
SSDI Denied
SSI Awarded
SSI Denied
Source: Matched Survey of Income and Program Participation and SSA administrative records. Notes: aAll monthly transfer except SSI amounts are in 1990 dollars. bZero is the month of benefit.
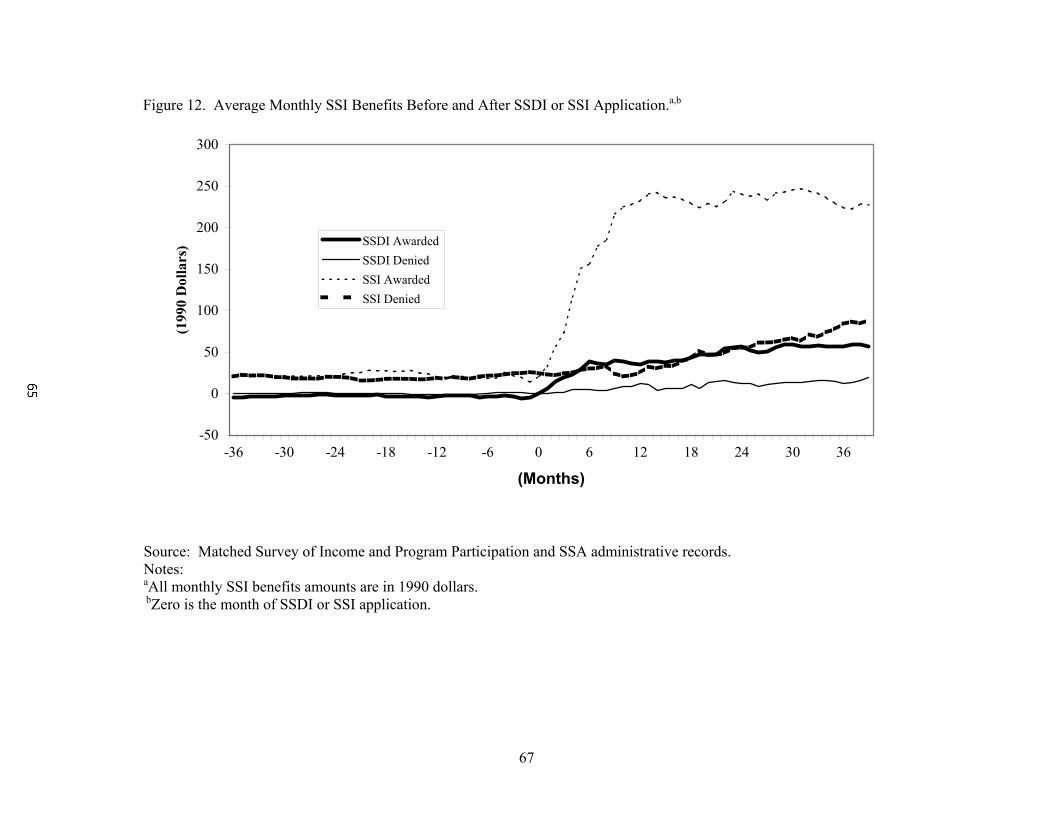
67
Figure 12. Average Monthly SSI Benefits Before and After SSDI or SSI Application.a,b
-50
0
50
100
150
200
250
300
-36 -30 -24 -18 -12 -6 0 6 12 18 24 30 36
(Months)
(199
0 D
olla
rs) SSDI Awarded
SSDI DeniedSSI AwardedSSI Denied
Source: Matched Survey of Income and Program Participation and SSA administrative records. Notes: aAll monthly SSI benefits amounts are in 1990 dollars. bZero is the month of SSDI or SSI application.

68
Figure 13. Average Monthly Labor Earnings of Household Members Other than Applicant and Applicant’s Spouse Before and After SSDI or SSI Application.a,b
0
100
200
300
400
500
600
700
800
-36 -33 -30 -27 -24 -21 -18 -15 -12 -9 -6 -3 0 3 6 9 12 15 18 21 24 27 30 33 36 39
(Months)
(199
0 D
olla
rs)
SSDI AwardedSSDI DeniedSSI AwardedSSI Denied
Source: Matched Survey of Income and Program Participation and SSA administrative records. Notes: a All monthly earnings are in 1990 dollars. b Zero is the month of SSDI or SSI application.

69
Figure 14. Distribution of Percentage Change in Household Income of Applicants Before and After Application for SSDI Benefits.
Source: Matched Survey of Income and Program Participation and SSA administrative records. Notes: A percent change between 13 to 15 months prior to SSDI application to 1 to 3 months after initial SSDI application.
0
2
4
6
8
10
12
14-1
00%
to -9
0%
-90%
to -8
0%
-80%
to -7
0%
-70%
to -6
0%
-60%
to -5
0%
-50%
to -4
0%
-40%
to -3
0%
-30%
to -2
0%
-20%
to -1
0%
-10%
to 0
%
0% to
+10
%
+10%
to +
20%
+20%
to +
30%
+30%
to +
40%
+40%
to +
50%
+50%
to +
60%
+60%
to +
70%
+70%
to +
80%
+80%
to +
90%
+90%
to +
100%
(Percentage Change)
(Per
cent
age)
Share of SSDI Applicants
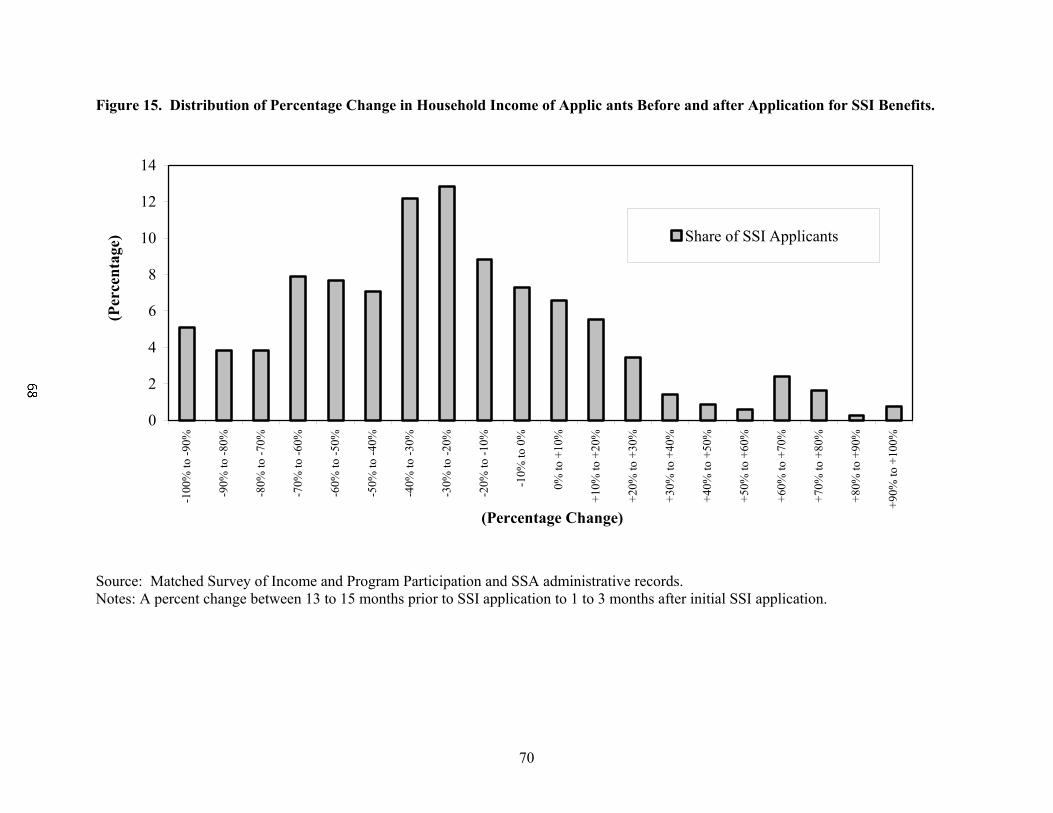
70
Figure 15. Distribution of Percentage Change in Household Income of Applic ants Before and after Application for SSI Benefits.
Source: Matched Survey of Income and Program Participation and SSA administrative records. Notes: A percent change between 13 to 15 months prior to SSI application to 1 to 3 months after initial SSI application.
0
2
4
6
8
10
12
14-1
00%
to -9
0%
-90%
to -8
0%
-80%
to -7
0%
-70%
to -6
0%
-60%
to -5
0%
-50%
to -4
0%
-40%
to -3
0%
-30%
to -2
0%
-20%
to -1
0%
-10%
to 0
%
0% to
+10
%
+10%
to +
20%
+20%
to +
30%
+30%
to +
40%
+40%
to +
50%
+50%
to +
60%
+60%
to +
70%
+70%
to +
80%
+80%
to +
90%
+90%
to +
100%
(Percentage Change)
(Per
cent
age) Share of SSI Applicants