university of twente. · quantitative validation throughout the internship. i would like to express...
TRANSCRIPT

University of Twente. Backtesting the PD model of Volkswagen Bank
2
Management summary Probability of default model A research has been carried out for Volkswagen Bank NL. The main purpose of the report is to back-test the currently used probability of default model (PD model), which estimates the chance of default. A contract is in default when the banks considers that the obligor is unlikely to pay off his debts, or is over ninety days in arrears. A default can occur in the lease portfolio. The portfolio is either that of financial lease contracts for business clients or hire purchase contracts for private clients.
Backtesting The main focus of this report lies on the backtest of the PD model. In addition, the model is calibrated and its backtest procedure is standardized, in order to simplify future testing. The purpose of back-testing is to verify whether the model accurately estimates the PD – which is in essence a logistic re-gression formula [1]. The PD is based on the variables of a contract, its weight (β) and value (x).
𝐏𝐃 = 𝟏𝟏 + 𝐞(𝛂 + 𝛄 +𝛃𝟏𝐱𝟏+ 𝛃𝟐𝐱𝟐+ 𝛃𝟑𝐱𝟑+ … ) [1]
Purpose The underlying purpose of backtesting lies in the compliance to internal and regulatory requirements of the Internal Rating Based Approach for retail exposure of Basel II. With this approach, Volks-wagen Bank can determine credit risk in a more accurate manner than the traditional approach.
Defaults The PD is dependent on the realized default rates. Unfortunately, a default increase was realized in the last year which was greatly influenced by the recession. This led to the bankruptcy of a great amount of companies. Needless to say, this leaded to an increase in the PD.
Performance The PD has increased significantly. Performance of the model was rather good, nonetheless. The PD model on financial lease contracts, as well as the model on hire purchase contracts, have great dis-criminatory power, though, their precision is lacking; meaning that the model can accurately discern ‘bad’ from ‘good’ contracts, but the occurrence of a default is underestimated. Hence, remodelling is unnecessary because the variables are solid, save for the weights given to them, these need to be ad-justed – by calibration.
Recalibration << Paragraph confidential >>
<< Figure confidential >>
University of Twente. Backtesting the PD model of Volkswagen Bank
3
CONTENTS MANAGEMENT SUMMARY ............................................................................................................................ 2
PREFACE .............................................................................................................................................................. 5
CHAPTER 1. INTRODUCTION ........................................................................................................................ 6
1.1 OVERVIEW OF VOLKSWAGEN PON FINANCIAL SERVICES ....................................................................... 61.2 PROBLEM DESCRIPTION .......................................................................................................................... 71.3 RESEARCH APPROACH ............................................................................................................................ 91.4 RESEARCH STRUCTURE ........................................................................................................................ 10
CHAPTER 2. THE PROBABILITY OF DEFAULT MODEL ...................................................................... 11
2.1 AN OVERVIEW OF CREDIT CAPITAL REQUIREMENTS ............................................................................. 112.2 THE PD MODEL .................................................................................................................................... 122.3 VALIDATION OF THE PD MODEL ........................................................................................................... 132.4 DEFAULTS IN THE PD MODEL ............................................................................................................... 142.5 CONCLUSION PD MODEL ...................................................................................................................... 16
CHAPTER 3. PD MODEL BACKTEST PERFORMANCE INDICATORS ................................................ 17
3.1 PERFORMANCE INDICATORS ................................................................................................................. 173.2 PRECISION ANALYSIS ............................................................................................................................ 183.3 DISCRIMINATORY ANALYSIS ................................................................................................................ 193.4 UNIVARIATE ANALYSIS ........................................................................................................................ 203.5 CONCLUSION PERFORMANCE INDICATORS ............................................................................................ 23
CHAPTER 4. PD MODEL BACKTEST RESULTS ....................................................................................... 24
4.1 BACKTESTING RESULTS FL : PREDICTIVE POWER ................. FOUT! BLADWIJZER NIET GEDEFINIEERD.4.2 BACKTESTING RESULTS FL : DISCRIMINATORY POWER ........ FOUT! BLADWIJZER NIET GEDEFINIEERD.4.3 BACKTESTING RESULTS FL : DATA STABILITY ..................... FOUT! BLADWIJZER NIET GEDEFINIEERD.4.4 BACKTESTING RESULTS HK : PREDICTIVE POWER ................ FOUT! BLADWIJZER NIET GEDEFINIEERD.4.5 BACKTESTING RESULTS HK : DISCRIMINATORY POWER ....... FOUT! BLADWIJZER NIET GEDEFINIEERD.4.6 BACKTESTING RESULTS HK : DATA STABILITY .................... FOUT! BLADWIJZER NIET GEDEFINIEERD.4.7 BACKTEST CONCLUSIONS ..................................................... FOUT! BLADWIJZER NIET GEDEFINIEERD.
CHAPTER 5. PD MODEL CALIBRATION AND STANDARDIZATION ................................................. 25
5.1 CALIBRATION ....................................................................... FOUT! BLADWIJZER NIET GEDEFINIEERD.5.2 FL MODEL CALIBRATION ...................................................... FOUT! BLADWIJZER NIET GEDEFINIEERD.5.3 HK MODEL CALIBRATION ..................................................... FOUT! BLADWIJZER NIET GEDEFINIEERD.5.4 STANDARDIZATION .............................................................. FOUT! BLADWIJZER NIET GEDEFINIEERD.5.5 CONCLUSIONS ...................................................................... FOUT! BLADWIJZER NIET GEDEFINIEERD.
CHAPTER 6. CONCLUSIONS AND RECOMMENDATIONS .................................................................... 26
6.1 CONCLUSIONS ...................................................................... FOUT! BLADWIJZER NIET GEDEFINIEERD.6.2 RECOMMENDATIONS ............................................................ FOUT! BLADWIJZER NIET GEDEFINIEERD.
BIBLIOGRAPHY ............................................................................................................................................... 27
APPENDICES ..................................................................................................................................................... 29

University of Twente. Backtesting the PD model of Volkswagen Bank
4
Abbreviations FL Financial Lease HK Hire purchase DK Resolving Credit (‘Duurkoop’) PL Personal Loan VW Volkswagen VWPFS Volkswagen Pon Financial Services AG German business entity ‘Aktiengesellschaft’, similar to ‘NV’ GMBH German business entity ‘Gesellschaft mit beschränkter Haftung’, similar to ‘BV’ Risk SSC Risk management, a shared service centre IRB Internal Ratings Based approach (used in determining credit risk) SME Small or Medium sized Enterprise CAP Cumulative Accuracy Profile ROC Receiver Operating Characteristic CoC Coefficient of Concordance (derived from the CAP chart) GINI, KS Gini-coefficient and Kolmogorov–Smirnov (derived from the ROC chart) SI Stability Index Risk parameters PD Probability of Default The expected probability a contract goes into default LGD Loss Given Default Expected ratio of the loss given an EAD EAD Exposure At Default Amount outstanding at the moment of default

University of Twente. Backtesting the PD model of Volkswagen Bank
5
Preface International banks must be compliant conform financial regulations, which are currently under heavy discussion. Under the latest regulations, Volkswagen Bank GmbH would like to implement an ad-vanced approach in determining credit risk. Therefore, internal models should be tested frequently and adjusted when necessary – it was my task to perform such an assessment, with regard to the PD model. The bachelor thesis is the final course of the bachelor ‘Industrial Engineering and Management’. Its assignment should be carried out from a rather practical point of view, and is commonly executed in an external company. Through the bachelor thesis administration, I came across Volkswagen Pon Fi-nancial Services. Without hesitation, I applied – motivated to work in the financial field, in order to see whether my future prospects should lie in finance. During this period, I learned about financial regulations and model validation – from which I had no experience beforehand. Nevertheless, I accepted the challenge and gained a thorough understanding of quantitative validation throughout the internship. I would like to express my gratitude to Mr. Roorda and Mr. de Bakker for providing feedback on my report. In addition, I would like to thank Mr. Stienstra for giving me the opportunity to take on this task. Furthermore, I appreciated my other colleagues who treated me like a fellow colleague in the risk management department, who undoubtedly will continue to manage the risks effectively. Harm Hoeksema Enschede, 2010
University of Twente. Backtesting the PD model of Volkswagen Bank
6
Chapter 1. Introduction In this chapter an introduction is given to the research which has been carried out for the bachelor thesis. The main purpose is explaining the structure of the report. This is done first by examining the organization (1.1), followed by the problem description (1.2). Afterwards, the research questions are elaborated (1.3). In conclusion, a conceptual research model and planning are given (1.4).
1.1 Overview of Volkswagen Pon Financial Services
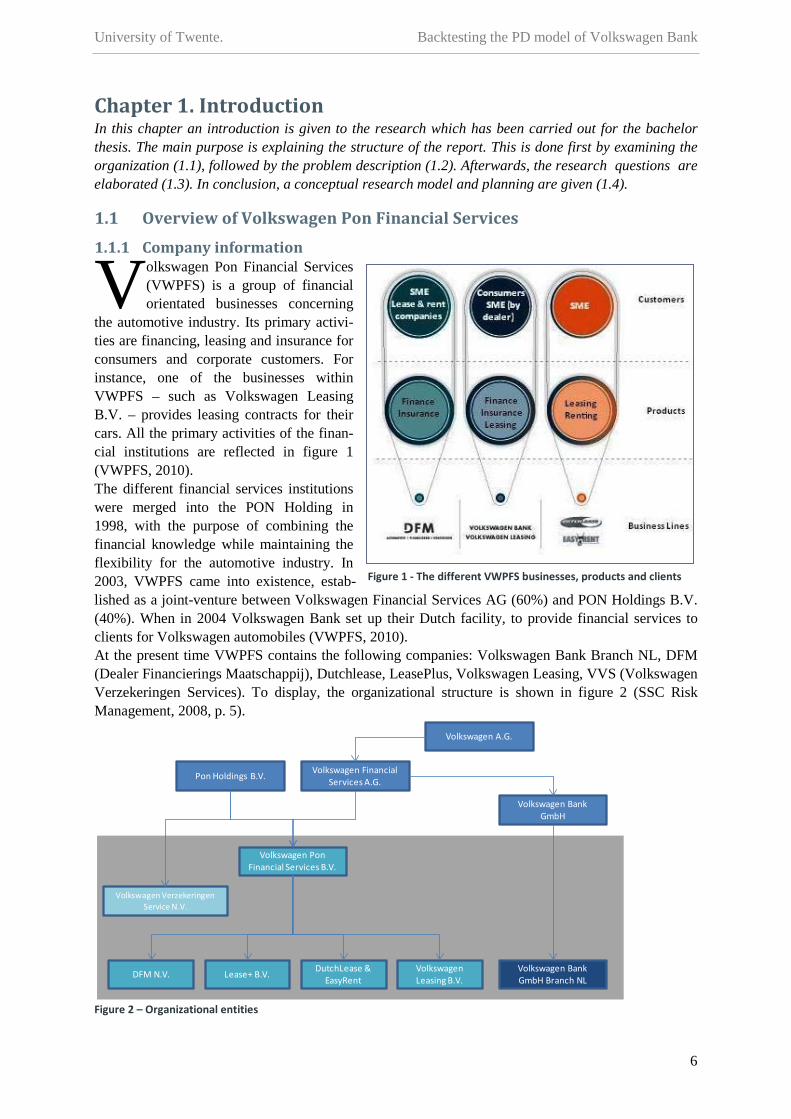
1.1.1 Company information olkswagen Pon Financial Services (VWPFS) is a group of financial orientated businesses concerning
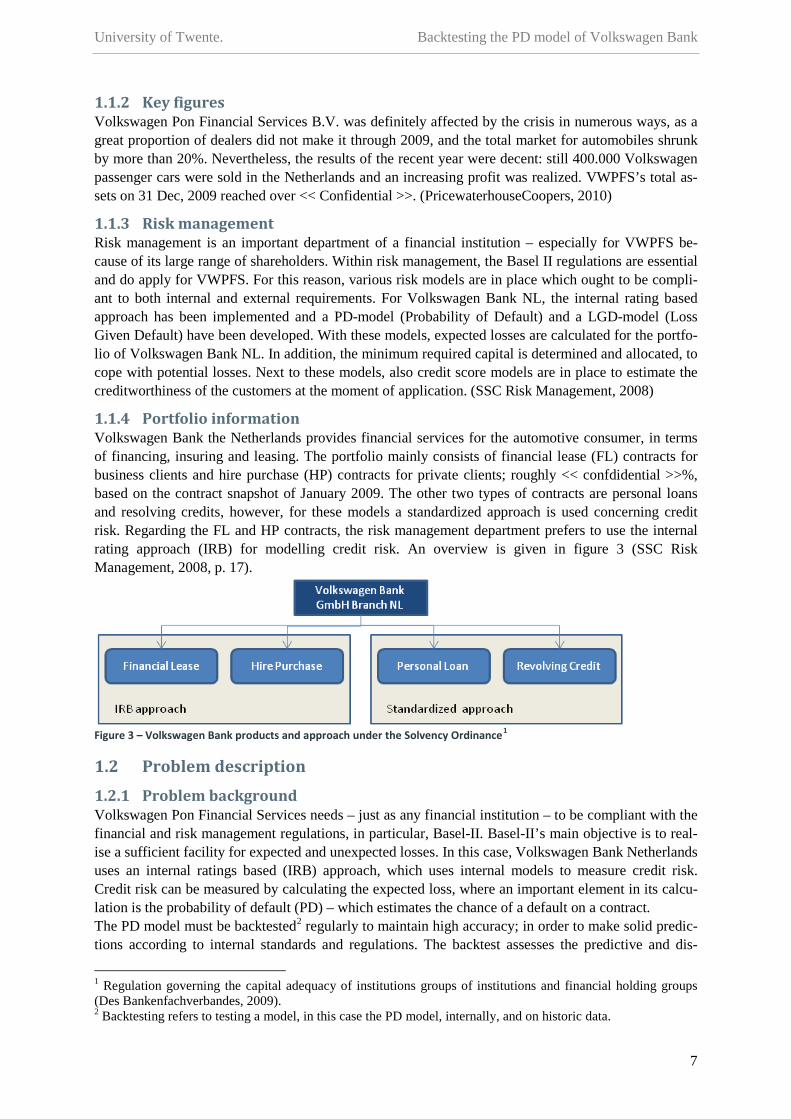
the automotive industry. Its primary activi-ties are financing, leasing and insurance for consumers and corporate customers. For instance, one of the businesses within VWPFS – such as Volkswagen Leasing B.V. – provides leasing contracts for their cars. All the primary activities of the finan-cial institutions are reflected in figure 1 (VWPFS, 2010). The different financial services institutions were merged into the PON Holding in 1998, with the purpose of combining the financial knowledge while maintaining the flexibility for the automotive industry. In 2003, VWPFS came into existence, estab-lished as a joint-venture between Volkswagen Financial Services AG (60%) and PON Holdings B.V. (40%). When in 2004 Volkswagen Bank set up their Dutch facility, to provide financial services to clients for Volkswagen automobiles (VWPFS, 2010). At the present time VWPFS contains the following companies: Volkswagen Bank Branch NL, DFM (Dealer Financierings Maatschappij), Dutchlease, LeasePlus, Volkswagen Leasing, VVS (Volkswagen Verzekeringen Services). To display, the organizational structure is shown in figure 2 (SSC Risk Management, 2008, p. 5).
Figure 2 – Organizational entities
Pon Holdings B.V.Volkswagen Financial
Services A.G.
Volkswagen A.G.
Volkswagen Bank GmbH
Volkswagen PonFinancial Services B.V.
DFM N.V. Lease+ B.V.DutchLease &
EasyRentVolkswagen Leasing B.V.
Volkswagen Bank GmbH Branch NL
Volkswagen VerzekeringenService N.V.
V
Figure 1 - The different VWPFS businesses, products and clients
University of Twente. Backtesting the PD model of Volkswagen Bank
7
1.1.2 Key figures Volkswagen Pon Financial Services B.V. was definitely affected by the crisis in numerous ways, as a great proportion of dealers did not make it through 2009, and the total market for automobiles shrunk by more than 20%. Nevertheless, the results of the recent year were decent: still 400.000 Volkswagen passenger cars were sold in the Netherlands and an increasing profit was realized. VWPFS’s total as-sets on 31 Dec, 2009 reached over << Confidential >>. (PricewaterhouseCoopers, 2010)
1.1.3 Risk management Risk management is an important department of a financial institution – especially for VWPFS be-cause of its large range of shareholders. Within risk management, the Basel II regulations are essential and do apply for VWPFS. For this reason, various risk models are in place which ought to be compli-ant to both internal and external requirements. For Volkswagen Bank NL, the internal rating based approach has been implemented and a PD-model (Probability of Default) and a LGD-model (Loss Given Default) have been developed. With these models, expected losses are calculated for the portfo-lio of Volkswagen Bank NL. In addition, the minimum required capital is determined and allocated, to cope with potential losses. Next to these models, also credit score models are in place to estimate the creditworthiness of the customers at the moment of application. (SSC Risk Management, 2008)
1.1.4 Portfolio information Volkswagen Bank the Netherlands provides financial services for the automotive consumer, in terms of financing, insuring and leasing. The portfolio mainly consists of financial lease (FL) contracts for business clients and hire purchase (HP) contracts for private clients; roughly << confdidential >>%, based on the contract snapshot of January 2009. The other two types of contracts are personal loans and resolving credits, however, for these models a standardized approach is used concerning credit risk. Regarding the FL and HP contracts, the risk management department prefers to use the internal rating approach (IRB) for modelling credit risk. An overview is given in figure 3 (SSC Risk Management, 2008, p. 17).
Figure 3 – Volkswagen Bank products and approach under the Solvency Ordinance1
1.2 Problem description
1.2.1 Problem background Volkswagen Pon Financial Services needs – just as any financial institution – to be compliant with the financial and risk management regulations, in particular, Basel-II. Basel-II’s main objective is to real-ise a sufficient facility for expected and unexpected losses. In this case, Volkswagen Bank Netherlands uses an internal ratings based (IRB) approach, which uses internal models to measure credit risk. Credit risk can be measured by calculating the expected loss, where an important element in its calcu-lation is the probability of default (PD) – which estimates the chance of a default on a contract. The PD model must be backtested2
1 Regulation governing the capital adequacy of institutions groups of institutions and financial holding groups (Des Bankenfachverbandes, 2009).
regularly to maintain high accuracy; in order to make solid predic-tions according to internal standards and regulations. The backtest assesses the predictive and dis-
2 Backtesting refers to testing a model, in this case the PD model, internally, and on historic data.
University of Twente. Backtesting the PD model of Volkswagen Bank
8
criminatory power of the model in the current situation, next to these, confirming data stability is a part of backtesting as well. Backtesting was historically done by Capgemini, however, to improve the responsiveness it is currently done internally. The external commissioner stated the assignment as follows: “A study has to be done how the risk model can be optimized (if necessary), and to develop a standard validation process. The validation process and PD model have to be compliant to the Basel II regulations and the internal requirements of Volkswagen Financial Services AG.” (Stienstra, 2010) In brief, the PD model is essential in calculating the expected losses, and thus, should be tested regu-larly. Therefore, research is necessary to determine if the current PD model is accurate – if not, changes must be made. In addition, an automated procedure for backtesting should be set up.
1.2.2 Problem statement According to the ABP3
Out of these discrepancies the problem statement results, whereas its focus lies on backtesting the PD model. The executing problem
the problem statement can be distinguished as soon as there is a difference between the reality and a desirable situation (School, TSM Business, 2005). In this case, the PD model has not been reviewed for the current year, while the regulators requires annual testing. The second discrepancy is that the current PD model is perhaps performing in an insufficient way; the norm is that the PD model is modelled in a way that it can predict defaults in an accurate manner. The third prob-lem is that the model cannot be tested quickly by the department.
4, that defines the discrepancy between the reality and the desirable situation for the risk management department, Volkswagen Bank and the regulators is as followed:
Backtesting, calibrating, and standardizing the backtest procedure
1.2.3 Research scope
regarding the PD model designed for the retail portfolio of Volkswagen Bank NL.
The research is limited to the Volkswagen Bank NL portfolio for financial lease and hire purchase contracts. The model that will be studied is the PD model, its indicators will be measured, which may lead to the conclusion to optimize the model. The model itself is subject to certain constraints, such as the Basel-II regulations and internal require-ments. How these regulations and internal requirements for the PD model are implemented is repre-sented in an internal document from Germany: ‘Business Blueprint Monitoring / Validation (Retail)’ (Volkswagen GmbH, 2010).
1.2.4 Research study The research can be defined as a descriptive study (Cooper & Schindler, 2008). The objective of such a study is to find the answers to the who, what, when, where and how questions5
Out of the executing problem, knowledge problems arise; for example, more information is needed concerning the PD model. Furthermore, the interpretation of the statistical tests used in backtesting must be explained – these tests are mentioned as performance indicators in this report. In addition, all important terms in the problem statement are treated in the research questions, such as backtesting, calibrating and standardizing.
. These studies focus on describing a specific set of variables by a detailed analysis. In this case, describing the adoption and performance of the PD model within the retail portfolio.
3 Abbreviation for ‘Algemene bedrijfskundige probleemaanpak’ 4 With an executing problem an ‘Handelingsprobleem’ is meant (Heerkens, 2010) 5 One drawback of these studies is that why questions are commonly left unanswered.
University of Twente. Backtesting the PD model of Volkswagen Bank
9
1.2.5 Research questions The research questions are the structure of the research report and are answered throughout the report at the end of a chapter. 1. What is a PD model according to literature and company information? 2. What regulatory and internal requirements are there for backtesting? 3. Which criteria can be defined for the performance indicators? 4. How does the current PD model perform in terms of predictive power? | Backtesting
a. How well does the model discriminate between contracts? b. How stable are the used model variables?
5. In what ways can the PD model be improved? | Calibrating 6. How can the process of backtesting be standardized? | Standardizing
1.3 Research approach In the following section, activities, information sources and possible choices will be explained per research question.
1.3.1 What is a PD model according to literature? Understanding the PD model concerns the knowledge needed for fulfilling the research objective. One would need to understand what PD models are, why, when and how they are used. The answers are specifically valuable for additional – possibly very important – information in performing the research, moreover, it could provide new practical information for the company. On information sources, my expectation is that there is likely plenty of research done on the IRB approach of Basel-II and the us-age of the PD model; it should therefore be relatively easy to find within the university library.
1.3.2 What regulatory and internal requirements are there for backtesting? Backtesting is needed recurrently because of regulatory and internal requirements for determining credit risk, though, the underlying questions is how the company should realise its backtest. In es-sence, on what basis is the PD model validated. It is also interesting if there are recent updates in the internal or external requirements which could improve the current model.
1.3.3 Which criteria can be defined for the performance indicators? Research should be done to which specific tests should be carried out. The testing of the performance of the PD model is split in three parts: precision, discriminatory power and data stability tests. Hence, I need sufficient knowledge on specific statistical tests (such as binomial, chi-square and Hosmer Le-meshow). Furthermore, information is needed on calculating the discriminatory power of variables (such as CoC, GINI, KS). Information on this subject can probably be found in internal documents.
1.3.4 How does the PD model perform? Out of the performance criteria, which assess the performance of the PD model, the results of the cur-rent PD model can be concluded. The realized performance of the PD model gives reason to take steps accordingly. In essence, this question focuses on how the results of the tests should be interpret.
1.3.5 In what ways can the PD model be improved? After the PD model is tested, conclusions can be made on the fact that the model might need calibra-tion or complete remodelling. In this scenario, the model should be calibrated or modelled in the best possible way. The results of the backtest might also give reason to propose other improvements.
1.3.6 How can the process of backtesting be standardized? The process of backtesting is very time-consuming, hence the commissioner asked if the procedure can be standardized; so that, when new data arrives, results can be interpret in a matter of days or even hours. The underlying reason, is that the backtest is preferably done quarterly in a consistent fashion. By standardizing the backtesting procedure, it can always be carried out – even in busy periods.
University of Twente. Backtesting the PD model of Volkswagen Bank
10
1.4 Research structure
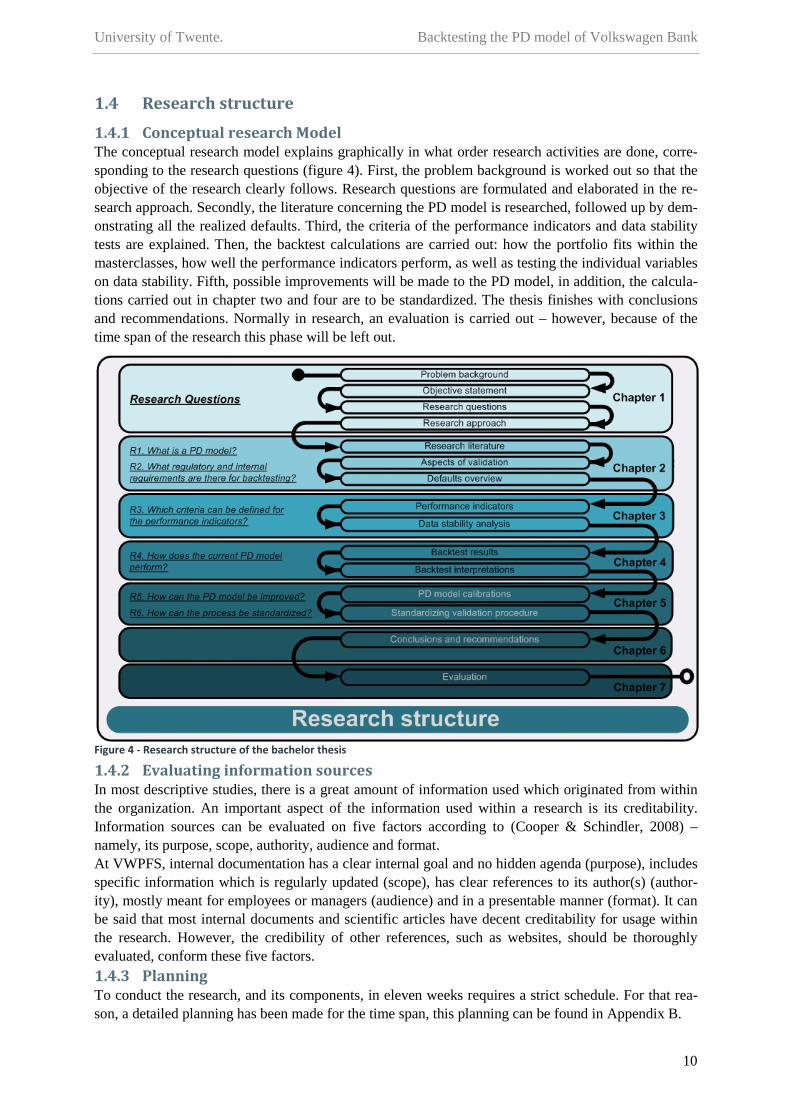
1.4.1 Conceptual research Model The conceptual research model explains graphically in what order research activities are done, corre-sponding to the research questions (figure 4). First, the problem background is worked out so that the objective of the research clearly follows. Research questions are formulated and elaborated in the re-search approach. Secondly, the literature concerning the PD model is researched, followed up by dem-onstrating all the realized defaults. Third, the criteria of the performance indicators and data stability tests are explained. Then, the backtest calculations are carried out: how the portfolio fits within the masterclasses, how well the performance indicators perform, as well as testing the individual variables on data stability. Fifth, possible improvements will be made to the PD model, in addition, the calcula-tions carried out in chapter two and four are to be standardized. The thesis finishes with conclusions and recommendations. Normally in research, an evaluation is carried out – however, because of the time span of the research this phase will be left out.
1.4.2 Evaluating information sources In most descriptive studies, there is a great amount of information used which originated from within the organization. An important aspect of the information used within a research is its creditability. Information sources can be evaluated on five factors according to (Cooper & Schindler, 2008) – namely, its purpose, scope, authority, audience and format. At VWPFS, internal documentation has a clear internal goal and no hidden agenda (purpose), includes specific information which is regularly updated (scope), has clear references to its author(s) (author-ity), mostly meant for employees or managers (audience) and in a presentable manner (format). It can be said that most internal documents and scientific articles have decent creditability for usage within the research. However, the credibility of other references, such as websites, should be thoroughly evaluated, conform these five factors. 1.4.3 Planning To conduct the research, and its components, in eleven weeks requires a strict schedule. For that rea-son, a detailed planning has been made for the time span, this planning can be found in Appendix B.
Figure 4 - Research structure of the bachelor thesis
University of Twente. Backtesting the PD model of Volkswagen Bank
11
Chapter 2. The Probability of Default model In this chapter a detailed outlook will be given of the PD model. First, the Basel capital requirements will be globally explained (2.1). Within Basel the PD formula is used (2.2). The PD model must be validated regularly (2.3). An default overview is essential in PD backtesting (2.4). Finally, the conclu-sion of this chapter will be given (2.5).
2.1 An overview of credit capital requirements
2.1.1 Modern risk management isk, the effect of uncertainty on one’s objectives6
Traditionally, companies that issued bonds have been graded in their riskiness, to assist investors in their decision-making process. This grading was done by both hard and soft facts. On the other hand, credit institutions have been scoring their borrowers to assist their decisions in lending money. Which was most of the time done by statistically based score variables. (Tasche, 2006)
, have to be identified, assessed and priori-tized; so that the impact of unfortunate events is minimized, monitored and controlled – as is done by risk management.
In traditional risk management, rating and scoring was a completely separate occurrence. Conversely, modern risk management focuses more on a unified view on rating and scoring alike – combining both in regulatory capital requirements.
2.1.2 A Basel-II overview Since 1988, the Basel Accord is in existence, which improved the way on which capital requirements were determined. Since then, a great number of revisions were made to the Basel Accord. Nowadays, the latest version of ‘Basel II’ consists of over three hundred pages of regulations, applying to all “in-ternationally active” banks. Hence, all European banks, large or small, are regulated under Basel II. The regulation is separated unto three ‘pillars’: minimum capital requirements, supervisory review and market discipline. In the first pillar, credit risk is calculated in a new approach which takes into ac-count the credit rating of counterparties. In the second pillar, risks, that are not covered in pillar one, must be evaluated by the regulator. In the third pillar, additional information must be given about the manner on which capital is allocated. (Hull, 2007)
2.1.3 Basel-II capital requirements Banks are obliged to fulfil their capital charge on the risks they are taking. In the latest international capital standards for credit institutions – Basel II – it is permitted to use internal rating systems for calculating the weighted risk, so that banks are allowed to reserve less money for certain portfolios7
2.1.4 Basel-II credit rating approaches
under the condition that it is supported by solid quantitative and qualitative validation. Formerly, credit ratings had no impact in regulatory standards, which provides a framework to ensure ongoing monitoring of the internal ratings models used. (Deutsche Bundesbank, September 2003)
The Basel II credit rating approaches are supported by the following quote:“The Committee proposes to permit banks a choice between two broad methodologies for calculating their capital requirements for credit risk. One alternative will be to measure credit risk in a standardised manner, supported by external credit assessments. The alternative methodology, which is subject to the explicit approval of the bank’s supervisor, would allow banks to use their internal rating systems for credit risk.” (Basel Committee on Banking Supervision, 2010, 50 & 51) With credit risk, the standardized approach uses external ratings determined by credit rating agencies8
6 Definition according to the ISO 31000 standard on the implementation of risk management.
. Formerly, in Basel I, credit risk was always set at a uniform 8% – in spite of the ratings. At present, in
7 The bank must, however, implement the IRB approach throughout the whole organization on every portfolio. 8 Within Europe, only a small amount of businesses actually have external ratings.
R

University of Twente. Backtesting the PD model of Volkswagen Bank
12
Basel II, companies can additionally apply for the foundation IRB approach and the advanced IRB approach, which uses internal ratings, such as the PD, LGD and EAD, derived by the company itself. However, in the case of retail exposure, the choice is limited to the standardized approach and the IRB approach – which is similar to the advanced IRB approach in the case of corporate exposure. (Hull, 2007)
2.1.5 Regulatory background Regulation is an important factor in PD modelling, as the regulators need to approve the model used in determining capital requirements. Nevertheless, Basel II has no direct legal consequences on German banks; in contrast to the national policy which do have legal consequences. Basel II is a basis for fu-ture regulation, and is therefore a set of practises, instead of a direct legal force. The best practices of Basel II are implemented in the European Union (EU) directive documents, which is legally binding to EU members. The directives are adopted per country in the so-called Solvency Ordinance. Specifically for VW Bank, the German Solvency Ordinance report – the Solvabilätsverordnung – is the legally binding document. To illustrate how Basel II influences the legal consequences for banks, refer to figure 5. (Des Bankenfachverbandes, 2009)
Figure 5 – Legal documents and their effect on Volkswagen Bank (Heeres, 2009)
2.2 The PD model “For retail exposures, banks must provide their own estimates of PD, LGD and EAD. There is no distinction between a foundation and advanced approach for this asset class.” (Basel Committee on Banking Supervision, 2010, §252)
2.2.1 Retail exposure portfolio The retail portfolio of VW Bank branch NL is subject to the Solvabilätsverordnung and internal re-quirements. To be included in the regulatory retail portfolio, it must satisfy the retail definition of Basel II, simply put it the contract has been made with a person, persons or a SME9. At the moment, there is no IRB accreditation, so the capital requirement is at a regular eight percent. In order to apply for a IRB accreditation in the near future, records are needed of internal implantation in the organiza-tion for five years10
2.2.2 Rating grades
. For that reason, annual PD backtesting is essential for the company.
A number of rating grades must be composed in advance, to facilitate the assignments of grades ac-cording to qualitative descriptions. In order to comply to Basel II, paragraph 410th: “The grade de-scriptions and criteria must be sufficiently detailed to allow those charged with assigning ratings to consistently assign the same grade to borrowers or facilities posing similar risk. This consistency should exist across lines of business, departments and geographic locations. If rating criteria and procedures differ for different types of borrowers or facilities, the bank must monitor for possible in-consistency, and must alter rating criteria to improve consistency when appropriate”.
9 Additional criteria for contracts in order to be considered in the retail portfolio can be found in §70 of Basel II 10 The transition period is three years, but at least five years of data is needed to implement the IRB approach for retail exposure. (Basel Committee on Banking Supervision, 2010, §264)

University of Twente. Backtesting the PD model of Volkswagen Bank
13
Specifically for PD model backtesting, it mentions in paragraph 501th: “Banks must regularly compare realised default rates with estimated PDs for each grade.” (Basel Committee on Banking Supervision, 2005).
2.2.3 Masterclasses According to Basel II, paragraph 464th contracts must be assigned to certain pools, and in the case of retail exposure, internal data is the primary source of information for estimating loss characteristics. The method of VW Bank is the distribution of contracts in a ‘masterclass’ based on the PD percentage (which is calculated on internal data). These classes are represented later on, for the specific portfolios of FL and HK alike, in the default overview. The estimated and realized default rates will be distrib-uted among the masterclasses.
2.2.4 Risk parameters The IRB approach is composed out of the risk parameters ‘probability of default’ (PD), ‘loss given default’ (LGD) and ‘exposure at default’ (EAD)11
Expected Loss = PD × LGD × EAD [1]
. These risk parameters play an important role in determining the minimal required capital for banks, their estimation needs to be done with care. The minimal required capital is in essence needed for expected losses, in Basel II terms, so that the capital can cope with 99% confidence. The expected loss formula is used in the IRB approach [1]. It also contains the LGD and EAD, which are not validated in this report.
Risk drivers are the factors that influence risk parameters (i.e. influences the PD). These risk drivers are presumed to have a causal effect on the risk parameter value.
2.2.5 PD formula The PD is a crucial determinant in calculating credit risk, which is clearly noticeable in the expected loss formula [1]. As a result, it has a great impact in the allocation of the required capital in the IRB approach. Logically, the PD stands for the probability a default occurs within the next twelve months. This probability must be determined per contract, which the PD model computes on the basis of cer-tain variables (risk drivers). In essence, the PD model calculates the estimated PD of a contract, which in turn can be checked against realised defaults. The PD formula is given below (Capgemini, 2008).
PD = 11+ e−z
[2]
Where z, consists of a constant, plus the different variables multiplied by their weights [3]. The exact values are given in appendix D for both the FL and HK model.
z = α + β1x1 + β2x2 + β3x3 + β4x4 + ⋯ [3]
2.3 Validation of the PD model “Banks must have a robust system in place to validate the accuracy and consistency of ratings systems, processes and the estimation of all relevant risk components. A bank must demonstrate to its supervisor that the inter-nal validation process enables it to assess the performance of internal risk estimation systems consistently and meaningfully” (Basel Committee on Banking Supervision, 2010, §501)
2.3.1 Overview Basel II paragraph §501th states that banks using an IRB approach must at least have an annual valida-tion of its models – in order to determine their usefulness, and to demonstrate this to the supervisor.
11 Additional information on risk parameters can be found in Appendix A.

University of Twente. Backtesting the PD model of Volkswagen Bank
14
The term “validation” constitutes the following: (Basel Committee on Banking Supervision, 2005)
o Range of processes that contribute to the assessment of the ratings adequately differentiating risk
o Whether the estimates of PD appropriately characterise the relevant aspects of risk. Validation maintains to be a major challenge for financial institutions. The statistical models used in the quantitative validation can give insight in undesirable developments. However, qualitative valida-tion is needed to assess the suitability of the rating system. (Deutsche Bundesbank, September 2003) A rating system serves to determine the credit risk of individual borrowers – in this case, a PD estima-tion. This is done by using a variety of discriminatory indicators which in turn can put them in a cer-tain ‘risk class’12
2.3.2 Validation principles
. On a side note, the refinement of the credit rating models is ongoing.
In the fourth newsletter of Basel in 2005 the principles of the validating process under IRB approach are clarified. First of all, validation is fundamentally about assessing the predictive ability and the use of ratings. Meaning that, it should discriminate and calibrate risk effectively. When the outcomes di-verge, the weighting of the IRB parameters must be renewed, as long as the variables still discriminate in a sufficient way. Second, the bank has primary responsibility for the validation. Third, validation is an iterative process. Fourth, there is no single validation method. Fifth, validation should encompass both quantitative and qualitative elements. Last, validation processes and outcomes should be subject to independent review. (Basel Committee on Banking Supervision, 2005)
2.3.3 Quantitative aspects The validation process greatly depends on the character of the rating system in use. A line is drawn between model-based systems and expert judgement based systems. Whereas, model-based systems uses statistical models to capture a number of risk factors, an expert judgements based systems relies on the view of an expert (which most of the time means a standardized procedure). Either models can be quantitatively tested when there are enough defaults. Typically, this can be done in the case of retail business or to individuals. The principal criteria for the quantitative validation are its discriminatory power, data stability and calibration which are explained later in detail. (Deutsche Bundesbank, September 2003)
2.3.4 Backtesting The testing of the PD formula, in order to determine if the model estimates the PD accurately, is called ‘backtesting’, because it is based on historic data. The PD model calculates the estimated PD of a con-tract, which in turn can be checked against realised defaults – to determine if the formula holds a ground on the true estimation. Elaboration on this subject will given in chapter three.
2.3.5 Requirements There are several requirements to the PD modelling and backtesting: (Section 128, Solvabilitäts-verordnung)
• Incorporate all relevant data, information and methods • Empirical evidence, not only on judgmental considerations • Plausible and intuitive, based on material drivers of risk.
2.4 Defaults in the PD model “Banks must regularly compare realised default rates with estimated PDs for each grade.” (Basel Committee on Banking Supervision, 2010, §501).
12 Also known as masterclasses
University of Twente. Backtesting the PD model of Volkswagen Bank
15
2.4.1 Definition The PD substitutes for ‘probability of default’ (within twelve months), therefore it must be specified when a contract is officially in default, in order to arrange a consisting PD report. The definition of a default is given within company information (SSC Risk Management, 2008):
• Automatic default when a obligor is more than ninety days in arrears • Manually in default when the bank considers the obligor will be unlikely to pay the total
amount (as a result of an unlikeliness to pay: E.g. death of client, total loss, bankruptcy cli-ent13
2.4.2 Defaulted contracts
)
The purpose of backtesting the PD model is to check if the PD model accurately calculates the number of defaults. The PD formula of the previous year, 2009, is given within the company data. The formula differs per contract type – one for financial lease and one for hire purchase contracts. With these con-tracts, the average estimated probability of default is calculated per contract type; to realize this, the following data is needed: All healthy contracts14
All realized defaults within the period of 31/1/2009 to 31/1/2010 with relevant variables on snapshot date 31/1/2009
All realized counter-entries15
2.4.3 Types of contracts
within the period of 31/1/2009 to 31/1/2010
Volkswagen Bank offers four types of contracts to its customers (SSC Risk Management, 2008): 1. Financial lease
2.
is the only available credit facility for business clients. This type of contract is primarily for financing a car. A contract between the bank and the client is made based on the value of the car, its expected trade-in value at the end of the contract and the duration of the con-tract. Usually, a final instalment has to be paid at the end of the contract, because the contract does not fully compensate the cars price. To minimize risk, the resale value of the car should cover the final instalment in value. During the life of the contract the car acts as collateral. In case the customer stops making the required payments, the car can be impounded and sold. Hire purchase
3.
is only for consumers and is technically similar to financial lease in terms of the product offered. There is one important legal difference for Volkswagen Bank; hire purchase con-tracts with a credit amount up to 40.000 euro are subject to the ‘Wet op het consumentenkrediet’. This law aims to protect consumers and restricts the possibility of the lender to seize the collateral in case the client stops paying. In case 75% of the credit amount has been repaid it is not allowed to impound the car (stated in article 41th of the ‘Wet op het consumentenkrediet’). The lender still has a claim on the collateral, but to seize it requires costly legal procedures. Personal loan
4.
is a credit facility for consumers in the form of a regular loan where the financed amount will be fully paid off by monthly instalments. Possibly a car is used as collateral. Revolving credit
2.4.4 Portfolio size and default developments
is also for consumers, and most of the time a car is used as collateral. When the client uses the credit facility, the client has to pay at least one monthly payment to pay off the borrowed amount before making use of the credit facility again. This re-usage of the credit is sub-ject to the manual acceptance of the credit acceptation department.
A detailed overview of the portfolio of Volkswagen Bank is given in table 1, note that the amount of contracts consists of healthy contracts on the snapshot date. The amounts of defaults occurred on that portfolio is set in percentages (exclusive of repeating defaults in the same year). The size of the portfo-lios has remained relatively stable, in exception for the financial lease portfolio which shows a steady increase in the amount of contracts. In defaults, a clear negative trend can be distinguished in the rela- 13 Default reasons are given in appendix A 14 Contracts which are not defaulted on the snapshot date 15 In Dutch: ‘Storneringen’
University of Twente. Backtesting the PD model of Volkswagen Bank
16
tive amount of defaults. For additional information, a historic representation of the total amount of defaults is given in Appendix C. << Table confidential >> Table 1 – Overview of contract set and occurred defaults
2.4.5 Realized amount of defaults The PD model will be backtested by the estimated PDs versus the default rate from the recent year. Figure 6 represents these defaults, which occurred in 31-01-09 to 31-01-10 on the backtest set (healthy and existing contracts). Financial lease contracts have a higher probability on default, which is ra-tional, because businesses have a higher chance of going in default than individual persons.
<< Figure confidential >> Figure 6 – Amount of defaults of Volkswagen Bank branch Netherlands (healthy contracts on snapshot date 31/1/09)
2.4.6 Young contract defaults It was advised in the previous backtest report to further investigate the effect of young contracts16
on PD (figure 7). (Capgemini, 2009). It is quite exceptional that in November over half of the defaults consisted of young contracts, this is however a particular event, which does not give reason to further investigate. As stated in the previous backtest report, one should keep a close eye on the effects of young contracts on the PD in the future.
<< Figure confidential >> Figure 7 - Backtest set defaults, divided in normal and young contracts
2.5 Conclusion PD model Besides the default overviews, two research questions have been handled throughout this chapter.
The PD model is part of the IRB approach for calculating the estimated credit risk in a specific portfo-lio. To calculate these expected losses, one has to multiply the PD with the LGD and exposure. With the PD model, the estimated probability of default can be calculated per contract on a specific portfo-lio. The current formulas of VW Bank for the portfolio of financial lease and hire purchase can be found in Appendix D.
Q1. What is a PD model?
The PD model is utilized in calculating expected losses. However, the PD model might be inaccurate, hence, financial institutions who use the IRB approach are obliged to backtest the model regularly. This is done by using realized default data in quantitative validation. Contracts are positioned into different risk classes and tested if they discriminate correctly, along with testing its precision and data stability.
Q2. What regulatory and internal requirements are there for backtesting?
16 A young contract is a contract non-existent on the snapshot date
University of Twente. Backtesting the PD model of Volkswagen Bank
17
Chapter 3. PD model backtest performance indicators In this chapter the PD backtest performance indicators (processes and activities used in backtesting) are explained. First, the framework of tests is given (3.1). Second, precision analysis is treated (3.2). Third, the discriminatory tests are explained (3.3). Fourth, the used model variables and data stability tests are elaborated upon (3.4). Finally, an overview is given (3.5).
3.1 Performance indicators
3.1.1 Framework erformance indicators are tools on which one can measure the quality of the PD model. Hence, the goal of this chapter is to provide a statistical background, a unifying framework, for most of the technical considerations in validation techniques. As mentioned in the paragraph on the
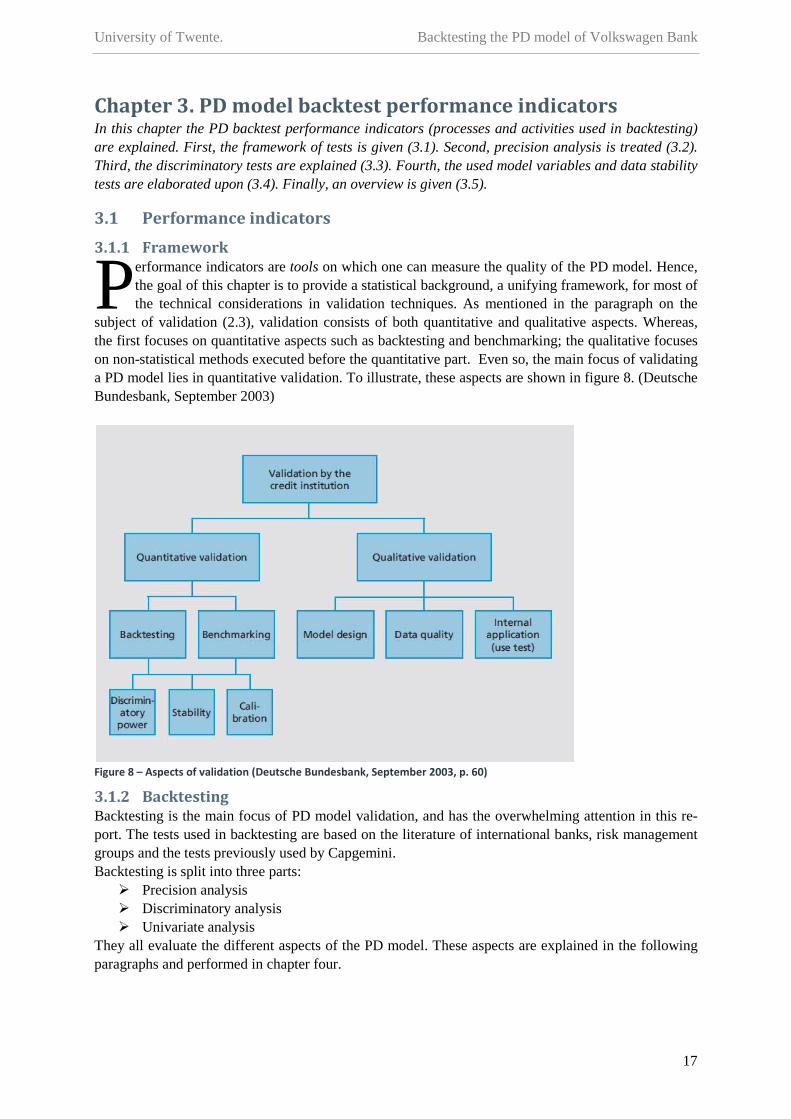
subject of validation (2.3), validation consists of both quantitative and qualitative aspects. Whereas, the first focuses on quantitative aspects such as backtesting and benchmarking; the qualitative focuses on non-statistical methods executed before the quantitative part. Even so, the main focus of validating a PD model lies in quantitative validation. To illustrate, these aspects are shown in figure 8. (Deutsche Bundesbank, September 2003)
Figure 8 – Aspects of validation (Deutsche Bundesbank, September 2003, p. 60)
3.1.2 Backtesting Backtesting is the main focus of PD model validation, and has the overwhelming attention in this re-port. The tests used in backtesting are based on the literature of international banks, risk management groups and the tests previously used by Capgemini. Backtesting is split into three parts: Precision analysis Discriminatory analysis Univariate analysis
They all evaluate the different aspects of the PD model. These aspects are explained in the following paragraphs and performed in chapter four.
P

University of Twente. Backtesting the PD model of Volkswagen Bank
18
3.2 Precision analysis “The burden is on the bank to satisfy its supervisor that a model or procedure has good predictive power and that regulatory capital requirements will not be distorted as a result of its use...” (Basel Committee on Banking Supervision, 2010, §536).
3.2.1 Overview Precision analysis (also called calibration analysis) is used in the determining if the estimate PDs devi-ates only marginally from the actual default rates. By using statistical tests it can be determined if the PD model is accurate in calculating the estimated PDs. If not accurate, the model has to be calibrated, meaning that only the weights – not the whole model – are adjusted.
3.2.2 Binomial test The binomial test contrasts the forecasted defaults of rating; i.e. predicted PD versus observed default rate. For a specific risk class, it specifies if the realized defaults are within reasonable limits. Accord-ing to Castermans et al., the test is carried out under the following hypothesis:
• Null-hypothesis: The observed PD is equal to the predicted PD • Alternative hypothesis: The observed PD is larger than the predicted PD
The hypothesis is distributed under a normal distribution [4], because of the large amounts of contracts involved; n. This distribution is accurate under two assumptions: that defaults occur independently and H0 is true. It tests the probability that the actual number of defaults occurred under the assumption that the PD is correct. When P(Z = z) < 0.05, then a significant difference is discerned.
PD ~ �PD� , PD� (1−PD� )
n� [4]
To test the hypothesis, one then arrives at the following test statistic [5].
𝑍 = 𝐸(𝐷)− 𝐷𝐹𝑜𝑏𝑠�𝑉𝑎𝑟(𝐷)
[5]
Where, E(D) = n*p (predicted mean of defaults) Var(D) = n * p * (1-p) (predicted variance of defaults)
3.2.3 Hosmer-Lemeshow test The previous test is appropriate for checking a single PD forecast, however, when fifteen classes are used, the likelihood is great that at least one of these PD forecast will be erroneously rejected. These tests are stand-alone, in order to control these arbitrary deviations one must use a joint test for multiple risk classes. The Hosmer-Lemeshow test can determine if the hypothesis is accurate for all classes.
𝐻 = ∑ (𝑛𝑖𝑝𝑖−𝑑𝑖)2
𝑛𝑖𝑝𝑖(1−𝑝𝑖)𝑘𝑖=1 [6]
Where, p1,...,pk is the estimated probability of default for rating grades 1,....k. Let ni denote the number of contracts with grade i, and di denote the number of defaulted borrowers with grade i. The formula is the sum of the squared differences of forecasted and realized defaults, divided by the theoretical vari-ances of default amounts. This results in the Hosmer-Lemeshow statistic H. (Tasche, 2006) The Hosmer-Lemeshow statistic has a chi square distribution with k freedom grades under the hy-pothesis that all the PD forecasts match the true PDs. The test is under the assumption of normal ap-proximation (independence and large enough sample size). The assumption of independence is crucial, because a bad approximation may be the case when a rating grade consists of a small numbers of bor-rowers, where a small change in rating grade distribution can have a large impact on the Hosmer-Lemeshow statistic.

University of Twente. Backtesting the PD model of Volkswagen Bank
19
3.3 Discriminatory analysis “...The variables that are input to the model must form a reasonable set of predictors.” (Basel Committee on Banking Supervision, 2010, §536).
3.3.1 Discriminatory power The second part of backtesting consists of researching the so-called discriminatory power of a model, meaning the essence of the model to discriminate in ‘bad’ and ‘good’ contracts in terms of realised defaults – so that, its tested if the ‘bad contracts’ actually consist of the bad contracts and vice versa. (Tasche, 2006)
3.3.2 Cumulative Accuracy Profile The Cumulative Accuracy Profile (CAP) is a graphical tool for investigating the discriminatory power. Its horizontal axis consist of the fraction of the contracts; the vertical axis determines the so-called ‘hit rate’ – the fraction of defaulters in-cluded in the current set of contracts. Figure 9 shows an example CAP curve, the rating model line illustrates a model which could occur in practice. The other lines demonstrate a perfect random model based on a set with zero discrimi-natory power, whereas the perfect model has per-fect discriminatory power.
3.3.3 Accuracy Ratio From the illustration in figure 9 it is intuitively clear that the area between the random model and the rating model is a measure for discriminatory power. This area can be calculated by taking the integral below the curve minus 1/2. However, in estimating its discriminatory power, one must compare it with the perfect model. The result is the so-called accuracy ratio.
The accuracy ratio (also called Gini-coefficient) is defined as the area between the rating and random model divided by the area between the perfect model and rating model. Where p denotes the total probability of defaults [7].
Accuracy Ratio = 2 ∫ CAP(u)du − 11
01 − p
[7]
3.3.4 Receiver Operating Characteristic The Receiver Operating Characteristic (ROC) is essentially a CAP curve without the fraction of de-faulted contracted in the horizontal axis. As such, a perfect model would move through the coordinates (0,1) as all default are occurred in the fraction before the non-defaulted contracts.
The Coefficient of Concordance (CoC) is the area under the curve in the ROC chart. Logically, the Gini-coefficient and COC have a relation with each other, given by [8],
Accuracy Ratio = 2 × (CoC − 0,5) [8]
In addition, the Kolmogorov–Smirnov (KS) statistic gives us the maximum difference between the curve and random model. A very steep line would result in a good KS statistic and thus good discrimi-natory performance. In company data critical bounds are given for these statistics17
17 (Business Blueprint Monitoring / Validation (Retail).doc, p. 34)
.
Figure 9 – Example CAP curve (Satchell & Xia, 2008)
University of Twente. Backtesting the PD model of Volkswagen Bank
20
3.3.5 Discriminatory interpretation In the previous backtest report by Capgemini, a set of rule-of-thumb conclusions has been set. These is no reason to doubt this perception, and are thus reused (table 2).
<< Table confidential >>
Table 2 – Rule of thumb conclusions based on the performance indicators (Capgemini, 2009)
3.4 Univariate analysis “Banks must demonstrate that quantitative validation methods and data are consistent through time. Changes in estimation methods and data (both data sources and periods covered) must be clearly and thoroughly documented.” (Basel Committee on Banking Supervision, 2010, §533).
3.4.1 Model variables overview
The univariate analysis describes the variables used in the modelling process – either used by FL, HK or both. Any changes in the individual variables used in the PD model must be noticed in order to discover the cause of changes within the PD model. It is important that the aspects of variable, such as its distribution remain reasonable consistent. The following risk drivers18
are used (table 3). The im-plementation of these variables is examined in appendix D.
<< Figure confidential >>
Table 3 – Overview of variables in the PD model
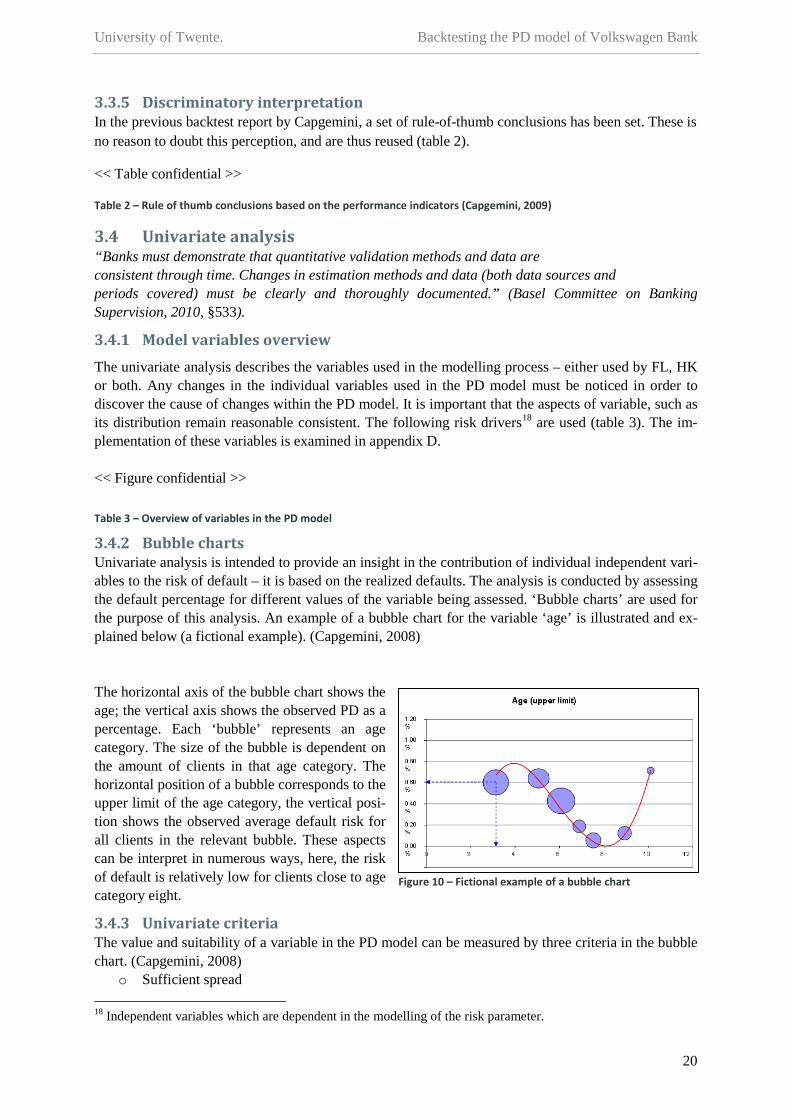
3.4.2 Bubble charts Univariate analysis is intended to provide an insight in the contribution of individual independent vari-ables to the risk of default – it is based on the realized defaults. The analysis is conducted by assessing the default percentage for different values of the variable being assessed. ‘Bubble charts’ are used for the purpose of this analysis. An example of a bubble chart for the variable ‘age’ is illustrated and ex-plained below (a fictional example). (Capgemini, 2008) The horizontal axis of the bubble chart shows the age; the vertical axis shows the observed PD as a percentage. Each ‘bubble’ represents an age category. The size of the bubble is dependent on the amount of clients in that age category. The horizontal position of a bubble corresponds to the upper limit of the age category, the vertical posi-tion shows the observed average default risk for all clients in the relevant bubble. These aspects can be interpret in numerous ways, here, the risk of default is relatively low for clients close to age category eight.
3.4.3 Univariate criteria The value and suitability of a variable in the PD model can be measured by three criteria in the bubble chart. (Capgemini, 2008)
o Sufficient spread 18 Independent variables which are dependent in the modelling of the risk parameter.
Figure 10 – Fictional example of a bubble chart
University of Twente. Backtesting the PD model of Volkswagen Bank
21
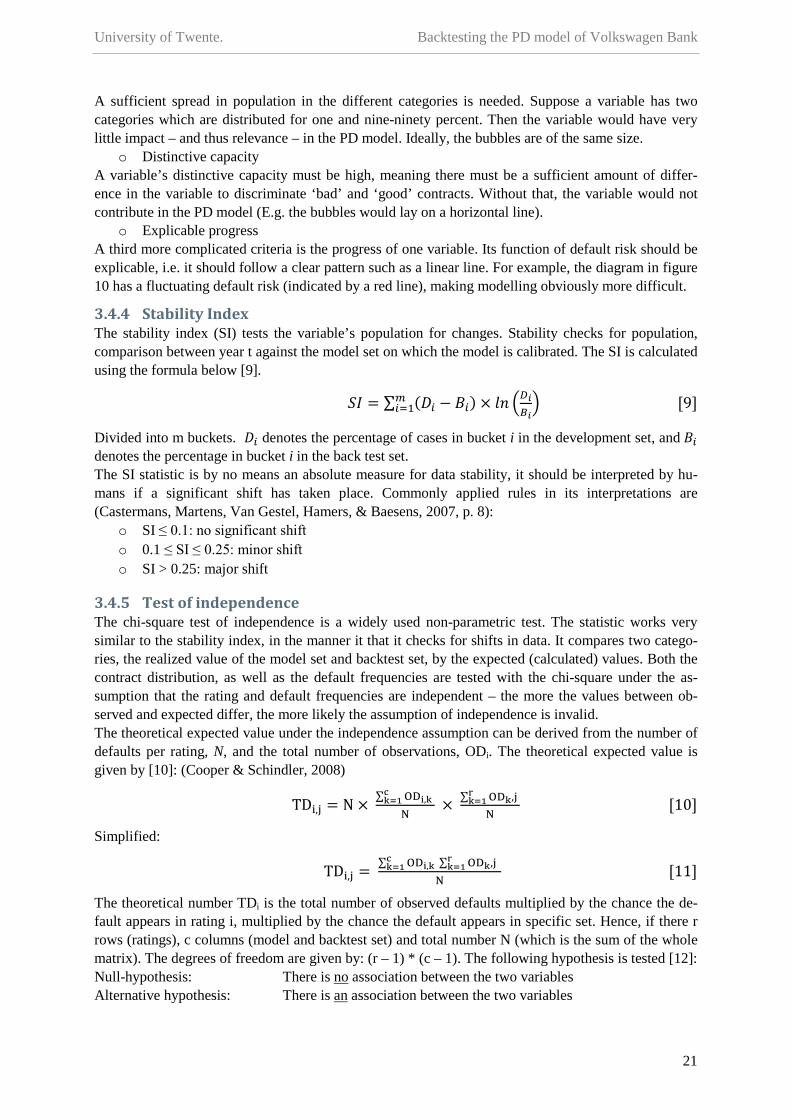
A sufficient spread in population in the different categories is needed. Suppose a variable has two categories which are distributed for one and nine-ninety percent. Then the variable would have very little impact – and thus relevance – in the PD model. Ideally, the bubbles are of the same size.
o Distinctive capacity A variable’s distinctive capacity must be high, meaning there must be a sufficient amount of differ-ence in the variable to discriminate ‘bad’ and ‘good’ contracts. Without that, the variable would not contribute in the PD model (E.g. the bubbles would lay on a horizontal line).
o Explicable progress A third more complicated criteria is the progress of one variable. Its function of default risk should be explicable, i.e. it should follow a clear pattern such as a linear line. For example, the diagram in figure 10 has a fluctuating default risk (indicated by a red line), making modelling obviously more difficult.
3.4.4 Stability Index The stability index (SI) tests the variable’s population for changes. Stability checks for population, comparison between year t against the model set on which the model is calibrated. The SI is calculated using the formula below [9].
𝑆𝐼 = ∑ (𝐷𝑖 − 𝐵𝑖) × 𝑙𝑛 �𝐷𝑖𝐵𝑖�𝑚
𝑖=1 [9]
Divided into m buckets. 𝐷𝑖 denotes the percentage of cases in bucket i in the development set, and 𝐵𝑖 denotes the percentage in bucket i in the back test set. The SI statistic is by no means an absolute measure for data stability, it should be interpreted by hu-mans if a significant shift has taken place. Commonly applied rules in its interpretations are (Castermans, Martens, Van Gestel, Hamers, & Baesens, 2007, p. 8):
o SI ≤ 0.1: no significant shift o 0.1 ≤ SI ≤ 0.25: minor shift o SI > 0.25: major shift
3.4.5 Test of independence The chi-square test of independence is a widely used non-parametric test. The statistic works very similar to the stability index, in the manner it that it checks for shifts in data. It compares two catego-ries, the realized value of the model set and backtest set, by the expected (calculated) values. Both the contract distribution, as well as the default frequencies are tested with the chi-square under the as-sumption that the rating and default frequencies are independent – the more the values between ob-served and expected differ, the more likely the assumption of independence is invalid. The theoretical expected value under the independence assumption can be derived from the number of defaults per rating, N, and the total number of observations, ODi. The theoretical expected value is given by [10]: (Cooper & Schindler, 2008)
TDi,j = N × ∑ ODi,k ck=1
N × ∑ ODk,j r
k=1N
[10]
Simplified:
TDi,j = ∑ ODi,k ∑ ODk,j rk=1 c
k=1N
[11]
The theoretical number TDi is the total number of observed defaults multiplied by the chance the de-fault appears in rating i, multiplied by the chance the default appears in specific set. Hence, if there r rows (ratings), c columns (model and backtest set) and total number N (which is the sum of the whole matrix). The degrees of freedom are given by: (r – 1) * (c – 1). The following hypothesis is tested [12]: Null-hypothesis: There is noAlternative hypothesis: There is
association between the two variables an association between the two variables

University of Twente. Backtesting the PD model of Volkswagen Bank
22
𝜒2 = ∑ (𝑂𝐷𝑖−𝑇𝐷𝑖)2
𝑇𝐷𝑚𝑖=1 [12]
The 𝜒2 gives an indication to which the extent the observed and expected frequency deviate from each other. When the chi square is smaller than α, the test is rejected – stating that the relation is significant. (Castermans, Martens, Van Gestel, Hamers, & Baesens, 2007) The advantage of this test is that the value of the statistic is clearly statistically defined, because criti-cal values are determined by the chi-square distribution. However, the chi-square could depend on the number of buckets used – leading to a different conclusion altogether. (Castermans, Martens, Van Gestel, Hamers, & Baesens, 2007, p. 4) In essence, the chi-square test is very strict in its acceptance when it comes to very large groups, whereas the SI is based on percentages, and is very loose in its acceptance.

University of Twente. Backtesting the PD model of Volkswagen Bank
23
3.5 Conclusion performance indicators In this chapter, one research question has been dealt with: explaining the performance indicators which are used in the backtest of the PD model.
The performance indicators are the criteria which assess the different aspects of the PD model. The tests take a view on the following aspects of the PD model: prediction, discriminatory power and data stability. When the model is lacking in precision and other aspects it gives reason to remodel the PD, it is however important, that all that the statistics are interpreted by human judgement, as the automatic results are not absolute.
Q3. Which criteria can be defined for the performance indicators?
An overview of the performance indicators, used in backtesting the PD model, is given in table 2. Tested element Performance indicator Statistic Predictive Binomial test
𝑍 = 𝐸(𝐷)− 𝐷𝐹𝑜𝑏𝑠�𝑉𝑎𝑟(𝐷)
Hosmer-Lemeshow test 𝐻 = �
(𝑛𝑖𝑝𝑖 − 𝑑𝑖)2
𝑛𝑖𝑝𝑖(1 − 𝑝𝑖)
𝑘
𝑖=1
Discriminatory power
Cumulative Accuracy Profile (CAP) – Gini-coefficient AR =
2 ∫ CAP(u)du − 110
1 − p
Receiver Operating Characteristic (ROC) – COC, KS
AR = 2 × (COC − 0,5)
Data stability Stability Index (SI) 𝑆𝐼 = � (𝐷𝑖 − 𝐵𝑖) × 𝑙𝑛 �𝐷𝑖𝐵𝑖�
𝑚
𝑖=1
Chi-square (test of independence) 𝜒2 = �
(𝑂𝐷𝑖 − 𝑇𝐷𝑖)2
𝑇𝐷
𝑚
𝑖=1
Table 4 – Overview of performance indicators

University of Twente. Backtesting the PD model of Volkswagen Bank
24
Chapter 4. PD model backtest results In this chapter the results of the backtest are presented, based on the tests explained in chapter three. The analysis is done separately for the FL and HK portfolio. First the precision is tested (4.1 & 4.4), followed by discriminatory tests (4.2 & 4.5), and concluded with the potential causes of change, by testing data instability (4.3 & 4.6). Finally, a summary of the results will be given (4.7). << Chapter confidential >>

University of Twente. Backtesting the PD model of Volkswagen Bank
25
Chapter 5. PD model calibration and standardization In this chapter the PD model is calibrated for the FL and HK portfolio. First, an overview will be given about calibration and logistic regression (5.1). Second, the FL model, as well the HK model, needs calibration (5.2 & 5.3). Third, an outline of the performed standardization (5.4). Fourth, the used data files will be shown (5.5), and the conclusion on the research question will be given (5.6). << Chapter confidential >>

University of Twente. Backtesting the PD model of Volkswagen Bank
26
Chapter 6. Conclusions and recommendations In this chapter the conclusions (6.1) and recommendations (6.2) are presented. << Chapter confidential >>
University of Twente. Backtesting the PD model of Volkswagen Bank
27
Bibliography Basel Committee on Banking Supervision. (2010). Consultative Document: International framework
for liquidity risk measurement, standards and monitoring. Basel, Switserland: Bank for international
settlements.
Basel Committee on Banking Supervision. (2005). Newsletter 4: Update on work of the Accord
Implementation Group related to validation under the Basel II Framework. Basel: Bank for
International Settlements.
Basel Committee on Banking Supervision. (2005). Working Paper 14: Studies on the validation of
internal rating systems. Basel: Bank for International Settlements.
Brandt, A. (2010). Email May 10th: Tests concerning PD model validation.
Capgemini. (2009). Backtest report PD rating model Volkswagen Bank GmbH. Amersfoort:
Volkswagen Pon Financial Services.
Capgemini. (2008). PD rating model Volkswagen Bank GmbH. Amersfoort: Volkswagen Pon
Financial Services.
Castermans, G., Martens, D., Van Gestel, T., Hamers, B., & Baesens, B. (2007). An overview and
framework for PD backtesting and benchmarking. Credit Scoring and Credit Control Conference.
Edinburg.
Christodoulakis, G., & Satchell, S. (2008). The validity of credit risk model validation methods. In G.
Christodoulakis, & S. Satchell, The analytics of risk model validation (pp. 27-43). London: Elsevier
Finance.
Cooper, D. R., & Schindler, P. S. (2008). Business Research Methods. New York: McGraw Hill.
Des Bankenfachverbandes. (2009). Solvabilitätsverordnung. German Federal Ministry of Finance.
Deutsche Bundesbank. (September 2003). Monthly Report: Approaches to the validation of internal
rating systems.
Heeres, P. E. (2009). An improved LGD model for the hire purchase and financial lease portfolio of
Volkswagen Bank GmbH Branch NL. Enschede: Universiteit Twente.
Heerkens, H. (2010). Methodologische checklist. TSM Business School.

University of Twente. Backtesting the PD model of Volkswagen Bank
28
Hull, J. C. (2007). Risk Management and Financial Institutions. Upper Saddle River: Pearson
Education.
PricewaterhouseCoopers. (2010). Financial Statements Volkswagen Financial Services.
Satchell, S., & Xia, W. (2008). Analytic models of the ROC curve: Apllication to credit rating model
validation. In G. Christodoulakis, & S. Satchell, The analytics of risk model validation (pp. 113-134).
London: Elsevier Finance.
School, TSM Business. (2005, - -). Syllabus. De algemene Bedrijfskundige Probleemaanpak , pp. 1-
23.
SSC Risk Management. (2008). Basel II Retail Business Blueprint version 1.1. VW Bank. Amersfoort:
VWFPS.
Stienstra, D. (2010, april 26). Opdracht omschrijving. (H. G. Hoeksema, Interviewer)
Tasche, D. (2006). Validation of internal ratings systems and PD estimates. Frankfurt am Main,
Germany: Deutsche Bundesbank.
Verschuren, P., & Doorewaard, H. (2003). Het ontwerpen van een onderzoek. Utrecht: Lemma BV.
Volkswagen GmbH. (2010). Business Blueprint Monitoring / Validation (Retail). Volkswagen GmbH.
VWPFS. (2010). Retrieved April 27, 2010, from Volkswagen Pon Financial Services: www.vwpfs.nl
University of Twente. Backtesting the PD model of Volkswagen Bank
29
Appendices
APPENDIX A : DEFINITIONS AND DEFAULT REASONS ........................................................................... 30
APPENDIX B : PLANNING ................................................................................................................................ 31
APPENDIX C : TOTAL DEFAULTS .................................................................................................................. 32
APPENDIX D : PD FORMULA OF 2009 ........................................................................................................... 33
APPENDIX E : FL PD ESTIMATES ................................................................................................................... 33
APPENDIX F : FL DATA STABILITY .............................................................................................................. 35
APPENDIX G : HK PD ESTIMATES ................................................................................................................. 36
APPENDIX H : HK DATA STABILITY ............................................................................................................. 37
APPENDIX I : CORRELATION MATRICES .................................................................................................... 38
APPENDIX J : NEW FL PD MODEL BACKTEST ............................................................................................ 39
APPENDIX K : NEW HK PD MODEL BACKTEST ......................................................................................... 40
APPENDIX L : FILES OVERVIEW ................................................................................................................... 41
University of Twente. Backtesting the PD model of Volkswagen Bank
30
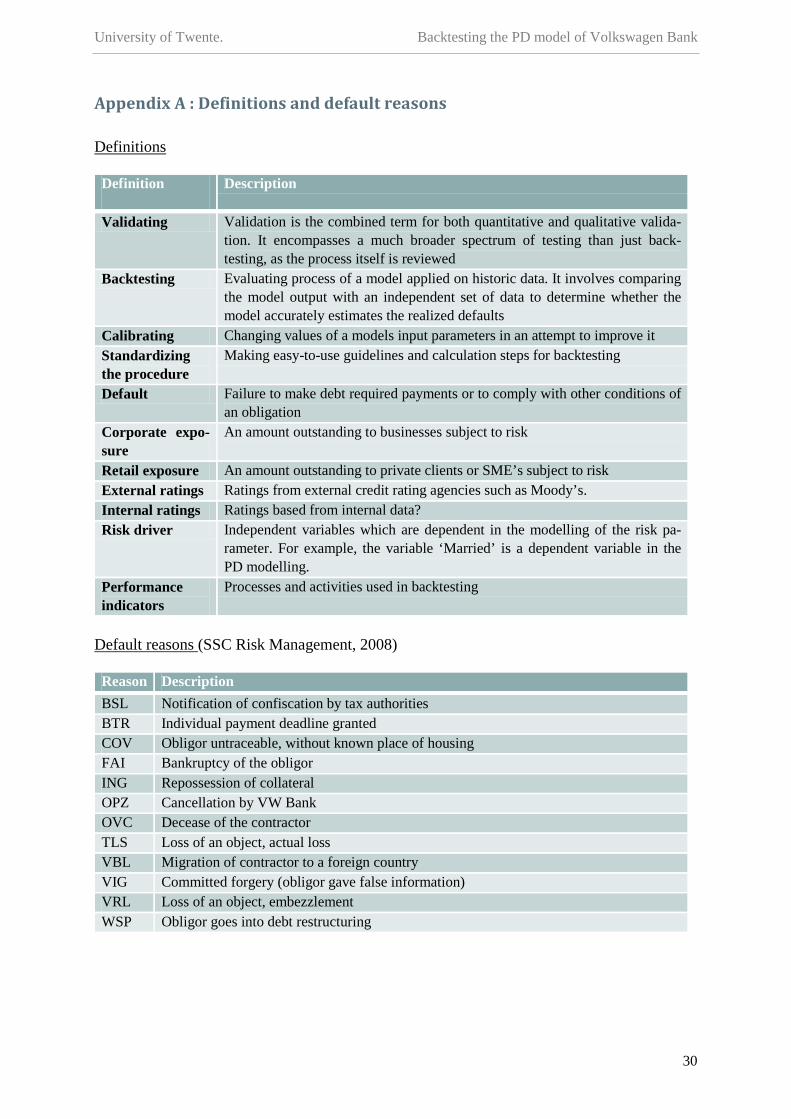
Appendix A : Definitions and default reasons
Definition
Definitions
Description
Validating Validation is the combined term for both quantitative and qualitative valida-tion. It encompasses a much broader spectrum of testing than just back-testing, as the process itself is reviewed
Backtesting Evaluating process of a model applied on historic data. It involves comparing the model output with an independent set of data to determine whether the model accurately estimates the realized defaults
Calibrating Changing values of a models input parameters in an attempt to improve it Standardizing the procedure
Making easy-to-use guidelines and calculation steps for backtesting
Default Failure to make debt required payments or to comply with other conditions of an obligation
Corporate expo-sure
An amount outstanding to businesses subject to risk
Retail exposure An amount outstanding to private clients or SME’s subject to risk External ratings Ratings from external credit rating agencies such as Moody’s. Internal ratings Ratings based from internal data? Risk driver Independent variables which are dependent in the modelling of the risk pa-
rameter. For example, the variable ‘Married’ is a dependent variable in the PD modelling.
Performance indicators
Processes and activities used in backtesting
Reason
Default reasons (SSC Risk Management, 2008)
Description BSL Notification of confiscation by tax authorities BTR Individual payment deadline granted COV Obligor untraceable, without known place of housing FAI Bankruptcy of the obligor ING Repossession of collateral OPZ Cancellation by VW Bank OVC Decease of the contractor TLS Loss of an object, actual loss VBL Migration of contractor to a foreign country VIG Committed forgery (obligor gave false information) VRL Loss of an object, embezzlement WSP Obligor goes into debt restructuring
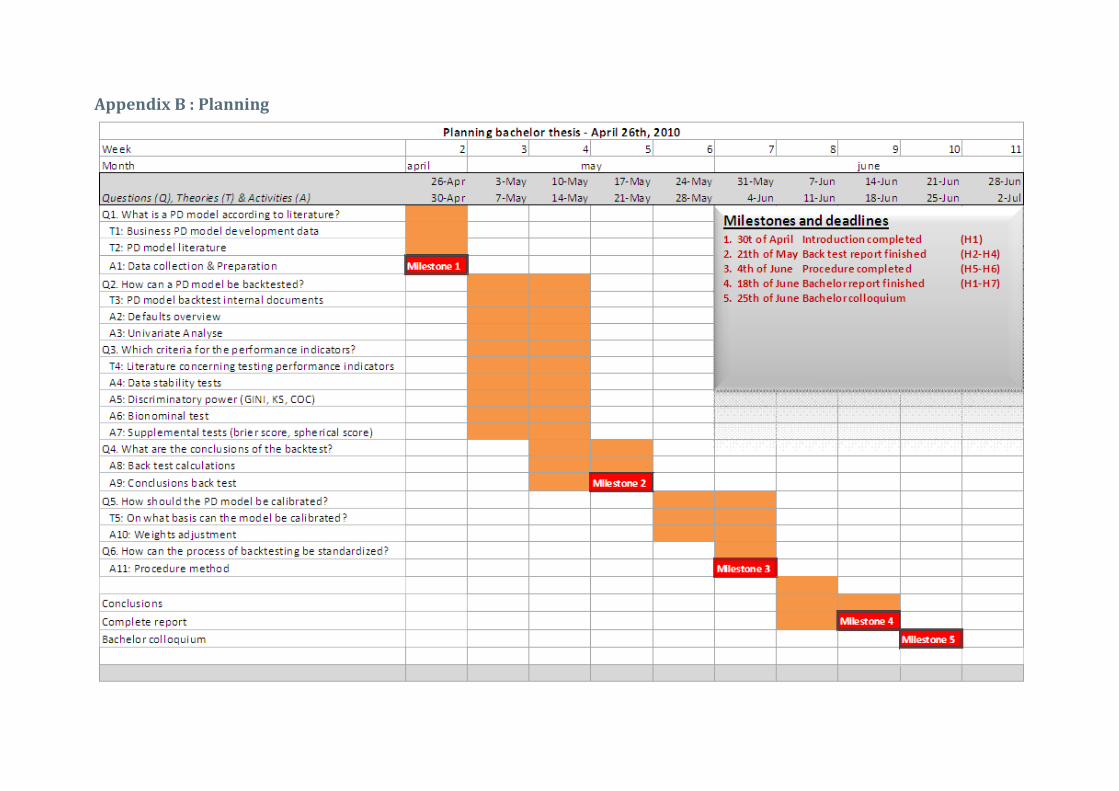
Appendix B : Planning

32
Appendix C : Total defaults << Confidential >>

33
Appendix D : PD formula of 2009 The estimated probability of default is calculated by entering the sum of PD in the PD formula [2].
𝐏𝐃 = 𝟏
𝟏 + 𝐞−(𝛂 + 𝛄 + 𝛃𝟏𝐱𝟏+ 𝛃𝟐𝐱𝟐+ 𝛃𝟑𝐱𝟑+ … )
<< Table confidential >>

34
Appendix E : FL PD estimates In the figure below an overview of the masterclasses is given.
<< Table confidential >>

Appendix F : FL Data stability A graphical representation of the different variables used in the FL modelling is given below. << Figures confidential >>

36
Appendix G : HK PD estimates In the figure below an overview of the masterclasses is given.
<< Figure confidential >>

37
Appendix H : HK Data stability A graphical representation of the different variables used in HK modelling is given below.
<< Figures confidential >>

38
Appendix I : Correlation matrices The matrices correspond to the correlation of the variables for the chosen model set, calculated by SPSS with logistic regression.
Financial lease, three-year weighted model
<< Table confidential >>
:
Hire purchase, three-year weighted model
<< Table confidential >>
:

39
Appendix J : New FL PD model backtest << Appendix confidential >>

40
Appendix K : New HK PD model backtest << Appendix confidential >>

41
Appendix L : Files overview << Appendix confidential >>