university of puerto ricoredsismica.uprm.edu/english/tsunami/research/abs_rpt2002_final... ·...
TRANSCRIPT


University of Puerto Rico Disclaimer
UPR 1089024 August 2002 ABS Consulting III
Disclaimer by ABS Consulting
Geologic, seismic, environmental, structural, and geotechnical conditions can vary from
those encountered when and where ABS Consulting, (EQE) has obtained its data. The
nature of the data also necessarily causes a level of uncertainty. A significant amount of
uncertainty exists in key analysis parameters that can only be estimated. Accordingly,
ABSC shall not be responsible for and hereby disclaims any warranty, expressed or
implied, related to the accuracy of any information or data provided to ABSC by or on
behalf of the client, and any warrant of fitness for a particular purpose. ABSC shall not
have any liability relating to or resulting from any inaccuracy of any information or data
used in the performance of its services.

University of Puerto Rico Table of Contents
UPR 1089024 August 2002 ABS Consulting IV
Table Of Contents
DISCLAIMER…………………… ............................................................................ III
1.0 INTRODUCTION…….. .............................................................................. 1
2.0 REGIONAL MOMENT-TENSOR ANALYSIS………................................... 2
3.0 APPLICATION TO 2001 EVENTS ............................................................. 4
3.1 Earthquakes Examined .................................................................. 4
3.2 Inversion Results............................................................................ 5
4.0 GENERAL EVALUATION .......................................................................... 6
5.0 CONCLUSIONS AND RECOMMENDATIONS........................................... 7
6.0 REFERENCES…………. ........................................................................... 9
TABLES
1. Earthquakes Examined in this Study.......................................................... 10
2. Source Parameters Estimated in this Study .............................................. 11
FIGURES
1. Geographic Map of the Eastern Caribbean Region…………...................... 12
2. Regional Moment-Tensor Mechanism for Event A………… ....................... 13
3. Regional Moment-Tensor Mechanism for Event B ..................................... 13
4. Regional Moment-Tensor Mechanism for Event C ..................................... 14
5. Regional Moment-Tensor Mechanism for Event D ..................................... 14

University of Puerto Rico Table of Contents
UPR 1089024 August 2002 ABS Consulting V
APPENDICES
A. Preliminary Report: Puerto Rico Tsunami Mitigation and Warning Program, Task 3
B. Regional Waveform Inversion Procedure
University of Puerto Rico 1. Introduction
UPR 1089024 August 2002 ABS Consulting 1
1.0 Introduction
This report summarizes the second and final portion of the work on Caribbean
Earthquake Source Parameters performed under Task 3 of the project entitled "Puerto
Rico Tsunami Mitigation and Warning Program", sponsored by the Federal Emergency
Management Agency (FEMA). The objective of this work was to examine the feasibility
of developing a tsunami warning system in Puerto Rico based on the monitoring of
earthquake sources throughout the Caribbean. Project activities involved the evaluation
of available seismic waveform data recorded at regional distances and the subsequent
application of waveform-analysis methodologies to examine their usefulness for tsunami
warning purposes.
In the initial portion of the work, the waveform-inversion technique developed by Randall
et al. (1995) was applied to regional seismic waveforms recorded during the year 2000
at the single station SJG located in Cayey, Puerto Rico, to identify the source
mechanism and magnitude of Caribbean earthquakes. The results of that study
(Appendix A) indicate that the methodology provides a timely and reliable measure of
both the faulting mechanism and the earthquake size. The subsequent work
summarized in this project report extends the initial analysis to include an application of
the methodology to Caribbean earthquakes recorded in the year 2001 and additionally
evaluates the overall performance of the inversion procedure. The report also includes
detailed instructions (Appendix B) on the implementation of the regional waveform-
inversion methodology.

University of Puerto Rico 2. Regional Moment-Tensor Analysis
UPR 1089024 August 2002 ABS Consulting 2
2.0 Regional Moment-Tensor Analysis
The moment-tensor inversion method developed by Randall et al. (1995) is used to
estimate the source parameters of Caribbean earthquakes using seismic waveforms
recorded at regional distances (between 1 and 12 degrees from the source). Computer
programs used in the moment-tensor inversion are available from Dr. Charles Ammon
(http://www.essc.psu.edu/~ammon/HTML/MTinvDocs/mtinv01.html). As described in the
initial Task 3 report (Appendix A), the inversion programs have been incorporated into a
general Regional Moment Tensor (RMT) analysis procedure where the focal depth is
held fixed at 10 km and the inversion scheme is used to identify the source mechanism
and moment magnitude that best fit the seismic waveforms recorded for the earthquake.
A general velocity structure appropriate for the Caribbean region is used to generate the
synthetic waveforms.
In the RMT procedure, observed and synthetic records are aligned at the P-wave arrival
and the waveform inversion is performed over a fixed time interval of 200 seconds. In
particular, three-component (vertical, radial, and transverse) broadband waveforms
recorded at the single station SJG located in Cayey, Puerto Rico, are used in the
analysis. Station SJG consists of a Streckeisen STS-1 three-component seismometer
and a Quanterra Q-680 digitizer. The broadband channel records continuously at 20
samples per second and has a flat response to velocity in the range of 0.1 to 600
seconds. The broadband records are integrated to displacement prior to the inversion
and filtered using a Butterworth passband filter with corners at 20 and 50 seconds. In
this study, SJG data were obtained from the Data Management Center operated by the
Incorporated Research Institutions for Seismology (IRIS).
The computer programs developed by Randall et el. (1995) use the Seismic Analysis
Code (SAC) processing package (Goldstein et al., 1999) to manipulate the data files.
The SAC processing package is available from Lawrence Livermore National Laboratory
(http://www.llnl.gov/sac). SAC commands are used to mark the P-wave arrival in the
observed records, remove the instrument response, rotate the horizontal records into

University of Puerto Rico 2. Regional Moment-Tensor Analysis
UPR 1089024 August 2002 ABS Consulting 3
radial and transverse components, filter both observed and synthetic records, integrate
records to ground displacement, and cut records to the desired time window. The SAC
commands are embedded in a series of Unix-based shell-script files that perform the
data preparation, the synthetic generation, and the actual inversion. These shell scripts
have been modified to conduct the waveform inversion for Caribbean earthquakes and
are incorporated into the general RMT analysis procedure presented in this report.
Detailed instructions on the execution of these shell scripts and associated programs are
given in Appendix B.
University of Puerto Rico 3. Application to 2001 Events
UPR 1089024 August 2002 ABS Consulting 4
3.0 Application to 2001 Events
The current analysis involves the application of the RMT procedure to Caribbean
earthquakes occurring in the year 2001 and a subsequent comparison of the results with
source parameters computed by Harvard University (HRV) and/or by the USGS National
Earthquake Information Center (NEIC). Source mechanisms computed by HRV
correspond to a Centroid Moment Tensor (CMT) solution obtained from an analysis of
globally-recorded body-wave and surface-wave data. The NEIC mechanism is derived
from a moment-tensor inversion of P waves recorded worldwide at teleseismic distances
(between 30 and 90 degrees from the source).
3.1 Earthquakes Examined
Caribbean earthquakes analyzed using the RMT procedure in this study were selected
based on the following characteristics:
• Occurring in the year 2001
• Located within 12 degrees of station SJG
• Body-wave magnitude (mb) of 4.8 or greater
• Source mechanism available from HRV and/or NEIC
• Three-component broadband SJG waveforms available from IRIS Four earthquakes were identified in the earthquake listings produced by the NEIC that
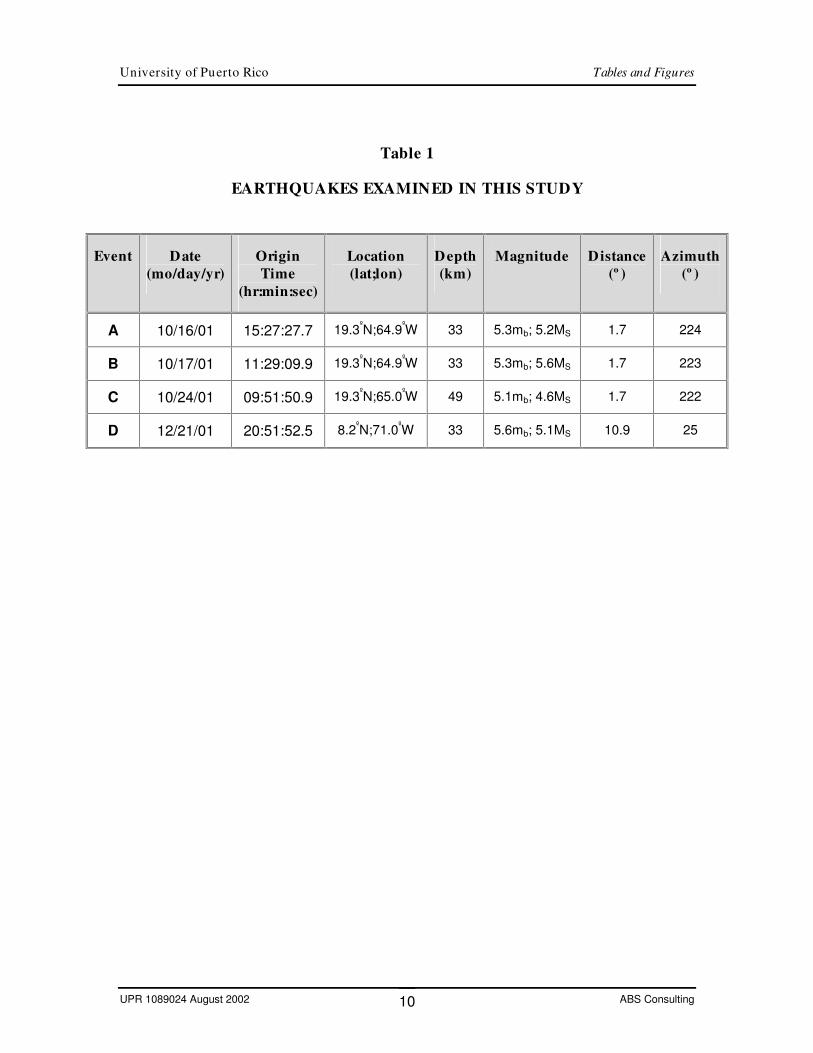
met these criteria. The earthquakes are listed in Table 1 and shown in Figure 1 relative
to the location of station SJG. Earthquake information in Table 1 is from the NEIC.
Events A, B, and C occurred very close to each other and are the largest earthquakes in
the sequence of strong seismic activity observed north of the Virgin Islands in October
2001. Event D occurred in the interior of Venezuela near the city of Merida and was
widely felt in northern South America. An earthquake at this location would not generate
a tsunami since the source is not underwater; however, the event is analyzed here to
test the performance of the RMT inversion procedure for sources located at distances

University of Puerto Rico 3. Application to 2001 Events
UPR 1089024 August 2002 ABS Consulting 5
greater than 10 degrees from the recording site. The greatest source-to-station distance
examined previously for the year 2000 (Appendix A) was about 8 degrees.
3.2 Inversion Results
Table 2 lists the source mechanisms and moment magnitudes (MW) estimated in this
study for earthquakes occurring in 2001 together with the source parameters available
from the NEIC and/or HRV. RMT solutions correspond to a fixed depth of 10 km.
Comparisons of the RMT mechanisms with HRV and/or NEIC solutions are shown in
Figures 2 to 5.
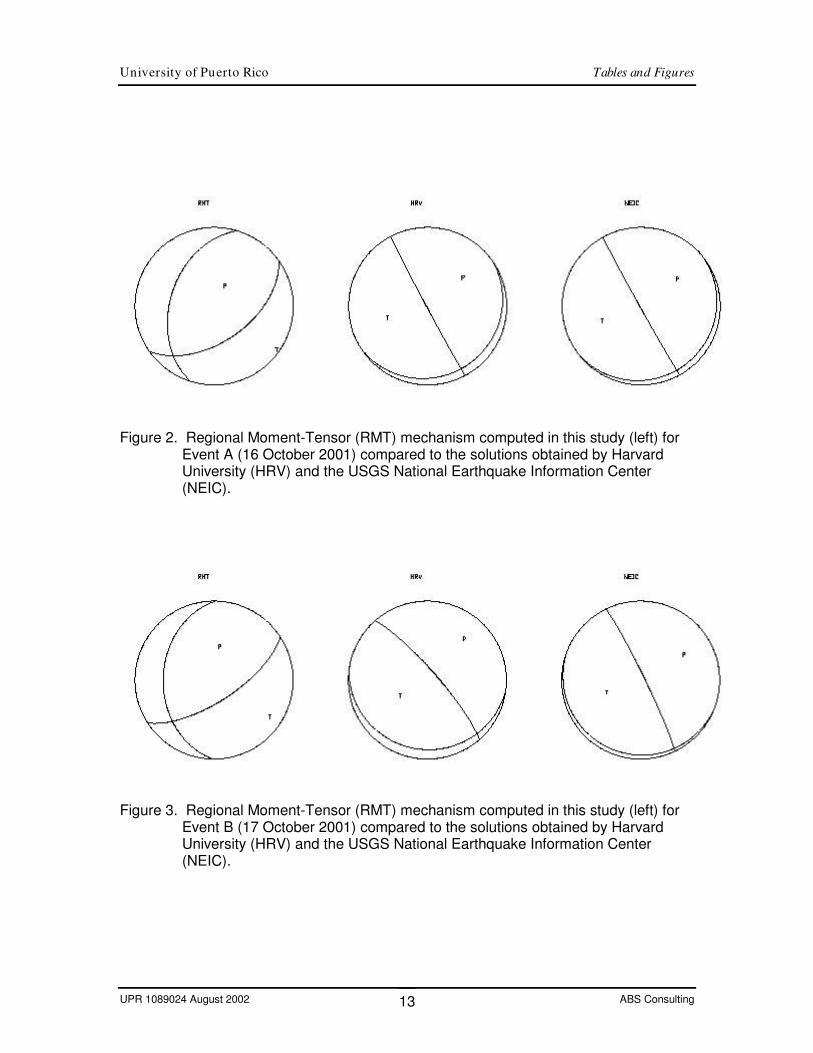
For Events A and B (Figures 2 and 3), the RMT solutions appear to be rotated to the
northeast compared to the HRV and NEIC solutions, and the RMT nodal planes have
shallower dips. A similar northeast rotation was observed in the analysis of earthquakes
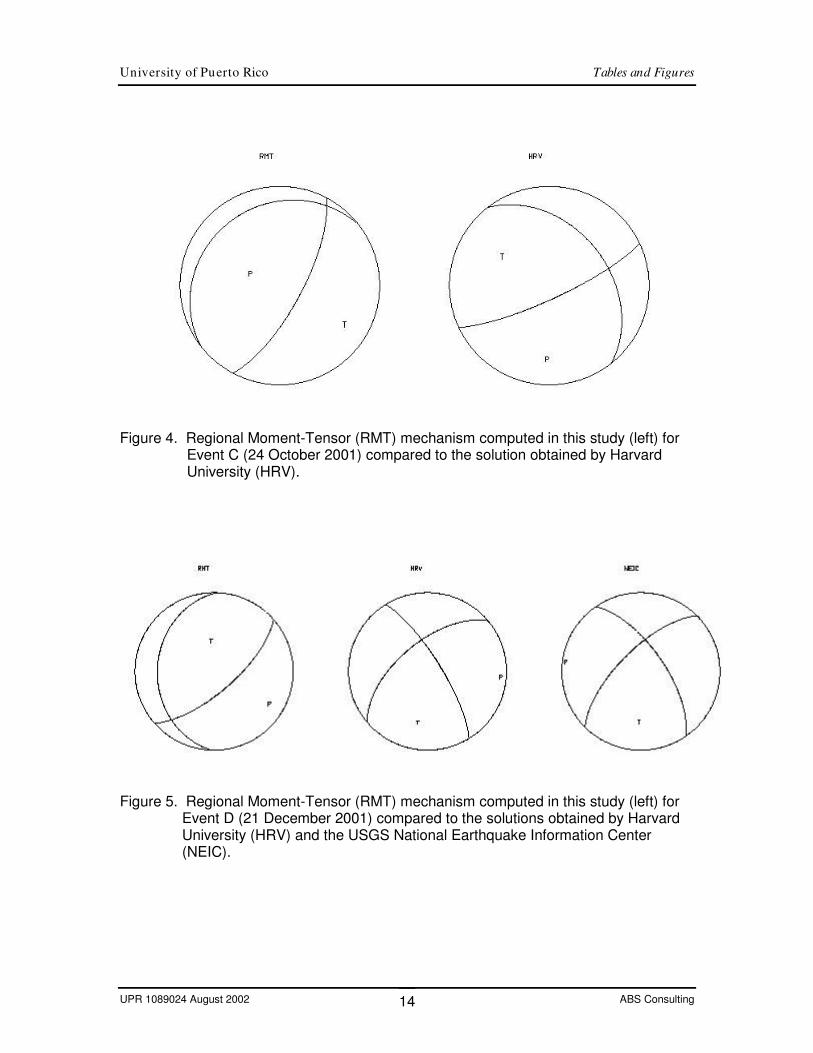
occurring in the year 2000 (Appendix A). For Event C (Figure 4), only the HRV solution
was available and this indicates thrust faulting with a strike-slip component. The HRV
mechanism would indicate a different tectonic origin for all three clustered events (A, B,
and C). The mechanism obtained for Event C using the RMT procedure, however,
indicates normal faulting similar to that obtained for Events A and B.
For Event D (Figure 5), the HRV and NEIC mechanisms indicate strike-slip faulting,
whereas the RMT solution corresponds to northeast-trending thrust faulting. A review of
the waveform fits obtained for this event, however, indicates that the 200-second time
window chosen for inversion is not long enough to accommodate the entire surface-
wave train for an earthquake located at this distance (11 degrees) from station SJG.
This may account for the lower moment magnitude obtained using the RMT procedure
compared to the globally-determined values. It is also possible that for earthquakes not
located in the Caribbean Basin, the crustal velocity model used in the inversion does not
adequately account for the dispersive properties along the propagation path and results
in synthetic surface waves whose timing does not match that of the observed records.
The RMT solution thus obtained here for Event D should not be considered reliable.
University of Puerto Rico 4. General Evaluation
UPR 1089024 August 2002 ABS Consulting 6
4.0 General Evaluation
The application of the RMT inversion procedure to Caribbean earthquakes recorded at
the digital seismograph station SJG during the years 2000 and 2001 indicates that the
method provides a reliable measure of the faulting mechanism and seismic moment of
regional earthquakes located within about 10 degrees from the recording station, as
determined from a comparison with fault parameters available from worldwide
earthquake-information agencies. Source information is generally not available from
these agencies immediately following a seismic event, and the RMT procedure provides
a more timely estimate of the earthquake source parameters. Source information
obtained using the single-station RMT regional-waveform analysis can be obtained
within minutes of the occurrence of an earthquake, with the recovery time depending on
the source-to-station distance. For an earthquake located at a distance of 8 degrees, for
example, a fault-plane solution and magnitude can be obtained within 7 minutes of the
earthquake origin time. For earthquakes located at closer distances to the recording
site, the time interval is even smaller. An earthquake located at a distance of 1 degree,
for example, requires less than 2 minutes to analyze. This time interval accounts for
both the propagation of the seismic waves to the station and the time required to perform
the analysis. Thus, the use of the RMT procedure would be very useful in the
development of a tsunami-warning system for the Caribbean Basin. Rapid, online-
analysis procedures, for instance, could provide timely assessments of the potential for
tsunami generation.
University of Puerto Rico 5. Conclusions and Recommendations
UPR 1089024 August 2002 ABS Consulting 7
5.0 Conclusions and Recommendations
Based on the results of our application of the Regional Moment Tensor (RMT)
waveform-inversion method to moderate-magnitude Caribbean earthquakes, we
conclude that the RMT analysis procedure can be used to develop a program of tsunami
alerting in the Caribbean region. We would thus recommend that the RMT procedure be
adapted for general use in routine real-time earthquake monitoring to identify potential
tsunamigenic sources in the Caribbean region based on both the size and mechanism of
the earthquake.
Earthquake-generated tsunamis result from the sudden vertical movement of seawater
produced by coseismic seafloor deformation. Thus, large shallow submarine
earthquakes that produce a large vertical displacement of the seafloor generate
significant tsunamis that can pose a threat to coastal areas at both local and distant
locations from the source. Generally, only earthquakes of magnitude 7 or greater have
the potential for generating destructive tsunamis, and a timely estimate of the
earthquake size is important for identifying potentially-tsunamigenic sources. The fault
geometry and depth of the earthquake source are also important, since shallow thrust-
faulting events result in the greatest vertical component of seafloor displacement. The
RMT procedure developed here uses a "fixed-depth" approach to allow a rapid
determination of the size and focal mechanism of the earthquake. Independently-
derived depth information such as that obtained from the routine computation of the
earthquake location, however, would be useful in the identification of possible
tsunamigenic events.
The monitoring of potential tsunamigenic sources in the Caribbean using the RMT
analysis procedure developed in this study requires that both previously-determined
earthquake locations and regionally-recorded seismic waveforms be available in real or
near-real time. A general monitoring program could be designed by first identifying
earthquakes located in the Caribbean Basin having depths shallower than 50 km. The
RMT analysis could then be performed on events recorded within 10 degrees of the
recording site to identify both the mechanism and magnitude. Tsunami advisories or

University of Puerto Rico 5. Conclusions and Recommendations
UPR 1089024 August 2002 ABS Consulting 8
warnings could then be issued using pre-established guidelines based both on the
computed earthquake source parameters and independent post-earthquake monitoring
of pre-existing tide gauges within the Caribbean Basin.

University of Puerto Rico 6. References
UPR 1089024 August 2002 ABS Consulting 9
6.0 References
Goldstein, P., D. Dodge, and M. Firpo (1999). SAC2000: Signal processing and analysis tools for seismologists and engineers, UCRL-JC-135963, Invited contribution to the IASPEI International Handbook of Earthquake and Engineering Seismology.
Randall, G.E., C.J. Ammon, and T.J. Owens (1995). Moment tensor estimation using regional seismograms from a Tibetan Plateau portable network deployment, Geophys. Res. Lett., 22, p. 1665-1668.
University of Puerto Rico Tables and Figures
UPR 1089024 August 2002 ABS Consulting 10
Table 1
EARTHQUAKES EXAMINED IN THIS STUDY
Event Date (mo/day/yr)
Origin Time
(hr:min:sec)
Location (lat;lon)
Depth (km)
Magnitude Distance (º )
Azimuth (º )
A 10/16/01 15:27:27.7 19.3ºN;64.9ºW 33 5.3mb; 5.2MS 1.7 224
B 10/17/01 11:29:09.9 19.3ºN;64.9ºW 33 5.3mb; 5.6MS 1.7 223
C 10/24/01 09:51:50.9 19.3ºN;65.0ºW 49 5.1mb; 4.6MS 1.7 222
D 12/21/01 20:51:52.5 8.2ºN;71.0ºW 33 5.6mb; 5.1MS 10.9 25

University of Puerto Rico Tables and Figures
UPR 1089024 August 2002 ABS Consulting 11
Table 2
SOURCE PARAMETERS ESTIMATED USING THE RMT ANALYSIS PROCEDURE COMPARED TO THE HRV AND NEIC SOLUTIONS
RMT HRV NEIC
Event Strike
(º) Dip (º)
Rake (º)
MW Strike (º)
Dip (º)
Rake (º)
MW Depth (km)
Strike (º)
Dip (º)
Rake (º)
MW Depth (km)
A 55 53 -65 5.8 40 18 -24 5.6 15 51 8 -10 5.7 5
B 57 68 -61 6.1 88 24 41 5.8 15 110 6 46 6.0 5
C 28 72 -98 5.3 65 79 51 5.0 15 - - - - -
D 182 29 47 5.3 230 75 150 5.6 28 225 68 154 5.6 13

University of Puerto Rico Tables and Figures
UPR 1089024 August 2002 ABS Consulting 12
Figure 1. Geographic map of the eastern Caribbean region showing epicenters (solid circles) of the four earthquakes examined in this study using broadband waveforms recorded at the seismograph station SJG located in Cayey, Puerto Rico (star). Earthquakes labeled A, B, C, and D are keyed to the listing in Table 1.
University of Puerto Rico Tables and Figures
UPR 1089024 August 2002 ABS Consulting 13
Figure 2. Regional Moment-Tensor (RMT) mechanism computed in this study (left) for Event A (16 October 2001) compared to the solutions obtained by Harvard University (HRV) and the USGS National Earthquake Information Center (NEIC).
Figure 3. Regional Moment-Tensor (RMT) mechanism computed in this study (left) for Event B (17 October 2001) compared to the solutions obtained by Harvard University (HRV) and the USGS National Earthquake Information Center (NEIC).
University of Puerto Rico Tables and Figures
UPR 1089024 August 2002 ABS Consulting 14
Figure 4. Regional Moment-Tensor (RMT) mechanism computed in this study (left) for Event C (24 October 2001) compared to the solution obtained by Harvard University (HRV).
Figure 5. Regional Moment-Tensor (RMT) mechanism computed in this study (left) for Event D (21 December 2001) compared to the solutions obtained by Harvard University (HRV) and the USGS National Earthquake Information Center (NEIC).

APPENDIX A
APPENDIX A
1
Earthquake Sources in the Circum-Caribbean Region Puerto Rico Tsunami Mitigation and Warning Program
Federal Emergency Management Agency Preliminary Report: Task 3
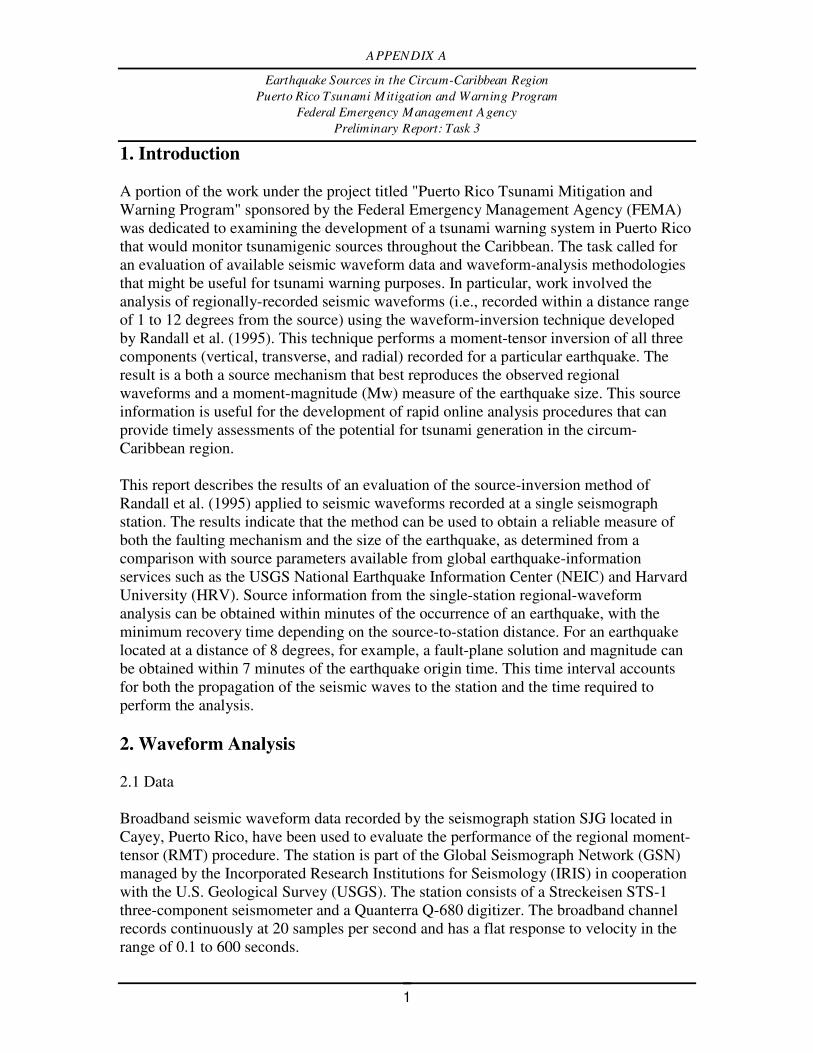
1. Introduction A portion of the work under the project titled "Puerto Rico Tsunami Mitigation and Warning Program" sponsored by the Federal Emergency Management Agency (FEMA) was dedicated to examining the development of a tsunami warning system in Puerto Rico that would monitor tsunamigenic sources throughout the Caribbean. The task called for an evaluation of available seismic waveform data and waveform-analysis methodologies that might be useful for tsunami warning purposes. In particular, work involved the analysis of regionally-recorded seismic waveforms (i.e., recorded within a distance range of 1 to 12 degrees from the source) using the waveform-inversion technique developed by Randall et al. (1995). This technique performs a moment-tensor inversion of all three components (vertical, transverse, and radial) recorded for a particular earthquake. The result is a both a source mechanism that best reproduces the observed regional waveforms and a moment-magnitude (Mw) measure of the earthquake size. This source information is useful for the development of rapid online analysis procedures that can provide timely assessments of the potential for tsunami generation in the circum-Caribbean region. This report describes the results of an evaluation of the source-inversion method of Randall et al. (1995) applied to seismic waveforms recorded at a single seismograph station. The results indicate that the method can be used to obtain a reliable measure of both the faulting mechanism and the size of the earthquake, as determined from a comparison with source parameters available from global earthquake-information services such as the USGS National Earthquake Information Center (NEIC) and Harvard University (HRV). Source information from the single-station regional-waveform analysis can be obtained within minutes of the occurrence of an earthquake, with the minimum recovery time depending on the source-to-station distance. For an earthquake located at a distance of 8 degrees, for example, a fault-plane solution and magnitude can be obtained within 7 minutes of the earthquake origin time. This time interval accounts for both the propagation of the seismic waves to the station and the time required to perform the analysis. 2. Waveform Analysis 2.1 Data Broadband seismic waveform data recorded by the seismograph station SJG located in Cayey, Puerto Rico, have been used to evaluate the performance of the regional moment-tensor (RMT) procedure. The station is part of the Global Seismograph Network (GSN) managed by the Incorporated Research Institutions for Seismology (IRIS) in cooperation with the U.S. Geological Survey (USGS). The station consists of a Streckeisen STS-1 three-component seismometer and a Quanterra Q-680 digitizer. The broadband channel records continuously at 20 samples per second and has a flat response to velocity in the range of 0.1 to 600 seconds.
APPENDIX A
2
Broadband data recorded at SJG were obtained from the IRIS Data Management Center in the Seismic Analysis Code (SAC) format (Goldstein et al., 1999) used by Randall et al. (1995) to manipulate data and synthetics. Prior to the actual inversion, the data are processed with SAC to remove the instrument response, rotate the horizontal components, apply a Butterworth passband filter with corners at 20 and 50 sec, and integrate the velocity records to ground displacement. Data records are also cut to a 200-sec interval beginning at the observed P-wave arrival. Table 1 lists the events examined in this study. This includes all earthquakes recorded within a distance of 1 to 12 degrees from station SJG in the year 2000 and that were large enough to have a focal mechanism computed by HRV or the NEIC. The epicentral locations of these events relative to station SJG are shown in Figure 1. 2.2 Inversion Method The procedure presented by Randall et al. (1995) is used to estimate the source mechanism and moment magnitude of the earthquake using the seismic waveforms recorded at SJG. In this method, the time-domain inversion scheme described by Langston (1981) is used to compute the deviatoric moment tensor. Three-component displacement waveforms are modeled beginning at the P-wave arrival and including the recorded surface waves. Complete synthetic waveforms are thus required, and these are computed using the reflection-matrix method of Kennett (1983) with a step source-time function and a prescribed laterally-homogeneous crustal-velocity structure. For the Caribbean region, we use a general velocity model (Table 2) based on the crustal velocities suggested by seismic refraction studies across the Caribbean plate, as presented by Mann and Burke (1984). These measurements indicate that except for the southeastern corner where the crustal thickness is about 6 km, much of the Caribbean basin consists of a thickened 12- to 15-km crust (Mann and Burke, 1984). Once computed, Green’s functions are additionally processed by applying the same bandpass filter used on the observed records. In the inversion, observed and synthetic records are aligned at the P-wave arrival. This reduces the dependence of the inversion on the crustal-velocity model and the earthquake origin time and location. Randall et al. (1995) perform a grid search to estimate the depth of the event. In this study, however, we are mostly interested in identifying the mechanism and size of shallow, possibly-tsunamigenic sources, and we adopt a "fixed-depth" approach where the Green’s functions are computed for a depth of 10 km. This allows a much more rapid determination of the source parameters for possible tsunami warning. Clearly, this could lead to a potential false alarm in the case where the depth of a large event is actually too deep to be tsunamigenic. The implementation of any tsunami-warning program for the Caribbean, however, would require an independent monitoring system that would identify the actual generation of a tsunami, as is currently done for the Pacific and Alaska regions. Also, the regional waveform modeling procedure of Randall et al. (1995) does not allow source depths below the base of the crust, and any iterations over source depth for the Caribbean would be limited to maximum values of 15 km using the velocity model of Table 2. 2.3 Results
APPENDIX A
3
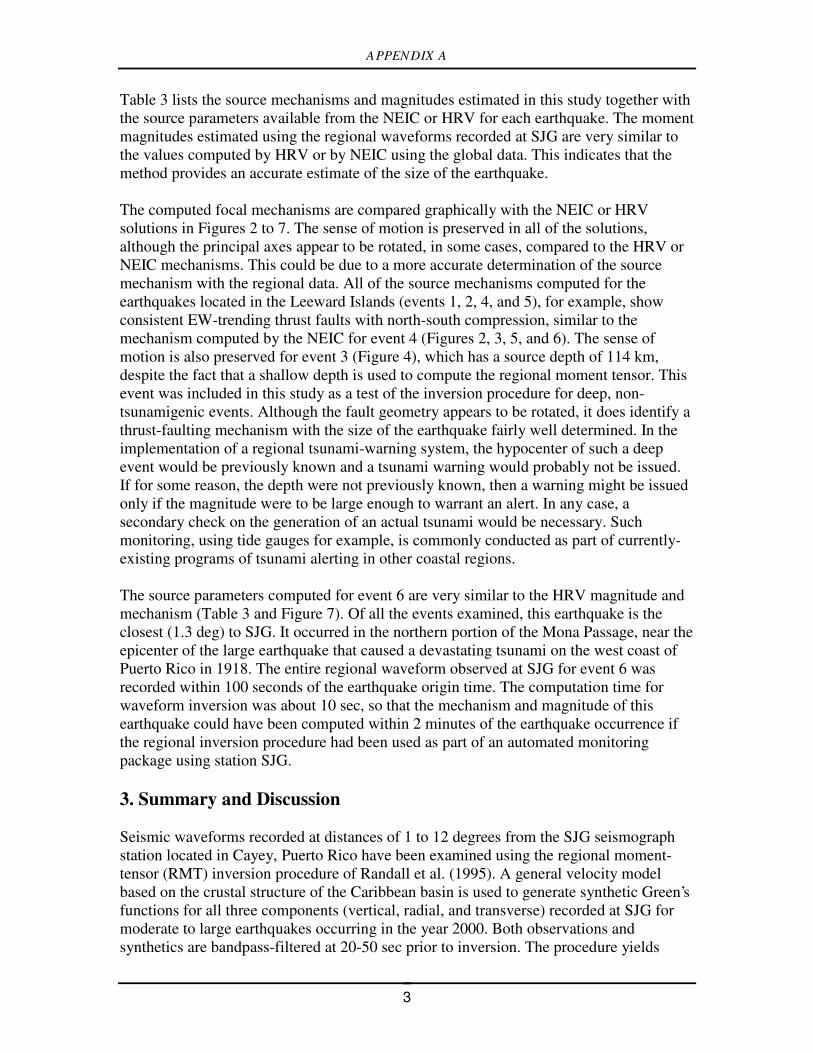
Table 3 lists the source mechanisms and magnitudes estimated in this study together with the source parameters available from the NEIC or HRV for each earthquake. The moment magnitudes estimated using the regional waveforms recorded at SJG are very similar to the values computed by HRV or by NEIC using the global data. This indicates that the method provides an accurate estimate of the size of the earthquake. The computed focal mechanisms are compared graphically with the NEIC or HRV solutions in Figures 2 to 7. The sense of motion is preserved in all of the solutions, although the principal axes appear to be rotated, in some cases, compared to the HRV or NEIC mechanisms. This could be due to a more accurate determination of the source mechanism with the regional data. All of the source mechanisms computed for the earthquakes located in the Leeward Islands (events 1, 2, 4, and 5), for example, show consistent EW-trending thrust faults with north-south compression, similar to the mechanism computed by the NEIC for event 4 (Figures 2, 3, 5, and 6). The sense of motion is also preserved for event 3 (Figure 4), which has a source depth of 114 km, despite the fact that a shallow depth is used to compute the regional moment tensor. This event was included in this study as a test of the inversion procedure for deep, non-tsunamigenic events. Although the fault geometry appears to be rotated, it does identify a thrust-faulting mechanism with the size of the earthquake fairly well determined. In the implementation of a regional tsunami-warning system, the hypocenter of such a deep event would be previously known and a tsunami warning would probably not be issued. If for some reason, the depth were not previously known, then a warning might be issued only if the magnitude were to be large enough to warrant an alert. In any case, a secondary check on the generation of an actual tsunami would be necessary. Such monitoring, using tide gauges for example, is commonly conducted as part of currently-existing programs of tsunami alerting in other coastal regions. The source parameters computed for event 6 are very similar to the HRV magnitude and mechanism (Table 3 and Figure 7). Of all the events examined, this earthquake is the closest (1.3 deg) to SJG. It occurred in the northern portion of the Mona Passage, near the epicenter of the large earthquake that caused a devastating tsunami on the west coast of Puerto Rico in 1918. The entire regional waveform observed at SJG for event 6 was recorded within 100 seconds of the earthquake origin time. The computation time for waveform inversion was about 10 sec, so that the mechanism and magnitude of this earthquake could have been computed within 2 minutes of the earthquake occurrence if the regional inversion procedure had been used as part of an automated monitoring package using station SJG. 3. Summary and Discussion Seismic waveforms recorded at distances of 1 to 12 degrees from the SJG seismograph station located in Cayey, Puerto Rico have been examined using the regional moment-tensor (RMT) inversion procedure of Randall et al. (1995). A general velocity model based on the crustal structure of the Caribbean basin is used to generate synthetic Green’s functions for all three components (vertical, radial, and transverse) recorded at SJG for moderate to large earthquakes occurring in the year 2000. Both observations and synthetics are bandpass-filtered at 20-50 sec prior to inversion. The procedure yields
APPENDIX A
4
moment magnitudes and mechanisms consistent with moment-tensor solutions computed independently by either the National Earthquake Information Center (NEIC) or Harvard University (HRV). The results of this study indicate that a single three-component broadband seismograph station can be used to monitor earthquake size and fault geometry in the circum-Caribbean region. This information would be very useful for the development of a tsunami-warning system for the Caribbean basin. The magnitude is the single most important parameter in the implementation of any tsunami-alerting program since generally only earthquakes with magnitudes greater than 7 have the potential for generating destructive tsunamis. The methodology employed here, using regional waveforms recorded at the single station SJG, provides a timely estimate of the earthquake size. The inversion computation time for the Caribbean events varies between about 10 sec for the closest source (event 6) to about 75 sec for the source farthest away (event 4). Taking into account the time required for propagation of the seismic waves to the station, this translates to a total time interval of about 110 sec and 400 sec, respectively, for the derivation of source parameters for the nearest and farthest event. This suggests that a magnitude and mechanism could be obtained within minutes of the occurrence of an earthquake, if the procedure were implemented in an automated manner. 4. References Cited Goldstein, P., D. Dodge, and M. Firpo (1999). SAC2000: Signal processing and analysis tools for
seismologists and engineers, UCRL-JC-135963, Invited contribution to the IASPEI
International Handbook of Earthquake and Engineering Seismology.
Langston, C.A. (1981). Source inversion of seismic waveforms: The Koyna, India, earthquakes of 13 September 1967, Bull. Seism. Soc. Am., 71, p. 1-24.
Kennett, B.L.N. (1983). Seismic Wave Propagation in Stratified Media, Cambridge Univ. Press, Cambridge, England, 342 pp. Mann, P. and K. Burke (1984). Neotectonics of the Caribbean, Rev. Geophys. Space Phys., 22,
p. 309-362. Randall, G.E., C.J. Ammon, and T.J. Owens (1995). Moment tensor estimation using regional
seismograms from a Tibetan Plateau portable network deployment, Geophys. Res. Lett., 22,
p. 1665-1668.
APPENDIX A
5
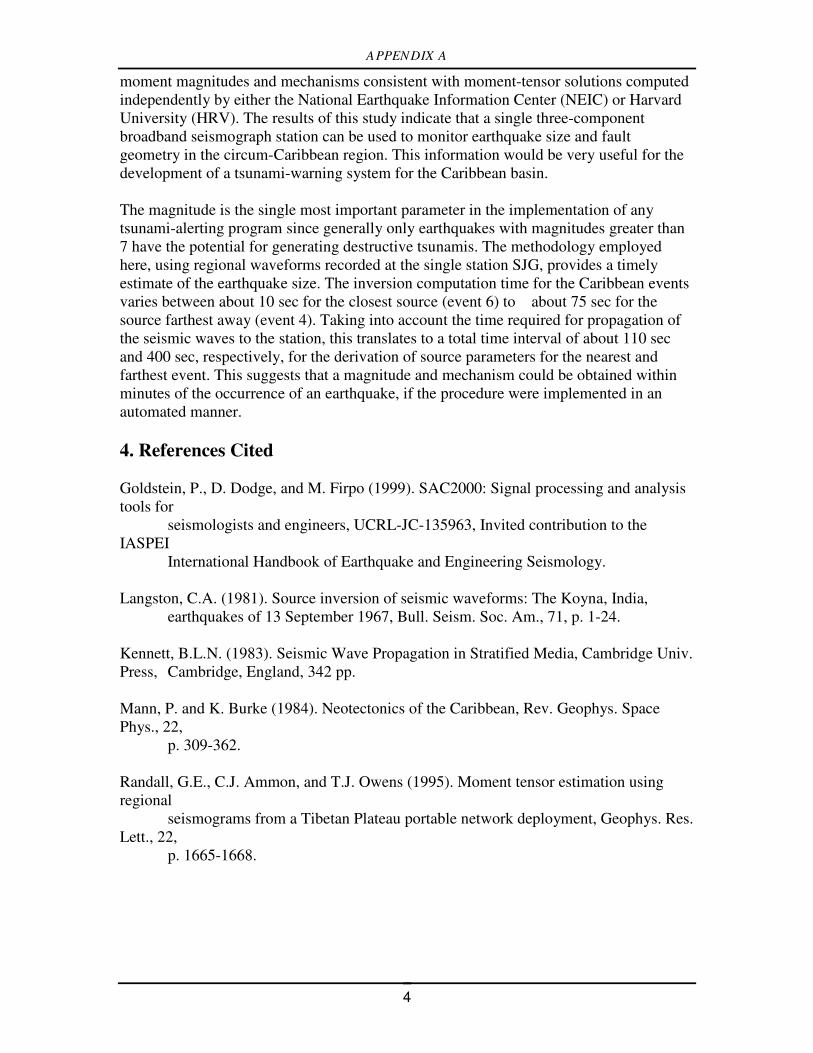
Table 1. Earthquakes examined in this study. Origin times, locations, depths, and magnitudes are from the USGS National Earthquake Information Center (NEIC). Distances and azimuths are to station SJG. Event Date Origin Time Location Depth Magnitude Dist Az (hr:min:sec) (lat;lon) (km) (deg) (deg) 1 021600 07:03:09.9 17.9N; 61.0W 33 5.1mb 5.0 277 2 022300 19:20:26.3 17.4N; 60.4W 33 4.8mb, 5.1Ms 5.1 280 3 100400 14:37:44.7 11.1N; 62.5W 114 5.8mb 7.8 334 4 102700 19:02:53.3 17.6N; 61.2W 41 5.4mb 4.7 277 5 103000 03:07:10.2 17.6N; 61.3W 33 5.5mb, 5.6Ms 4.7 277 6 121100 13:54:07.4 19.1N; 67.1W 53 5.1mb, 4.8Ms 1.3 138 Table 2. Crustal structure used in the regional waveform inversion. Thickness P Velocity S Velocity Density P Quality S Quality (km) (km/sec) (km/sec) (g/cm3) Factor Factor 5 6.0 3.4 2.6 1000 500 10 7.0 4.0 3.0 1000 500 -- 8.1 4.5 3.4 5000 2500 Table 3. Source parameters estimated in this study using the regional moment-tensor (RMT) inversion procedure. Solutions available from either HRV or the NEIC are also listed. Event RMT Solution Other Solution strk dip rake Mw strk dip rake Mw Source 1 106 65 102 5.3 139 11 73 5.3 HRV 2 96 45 87 5.5 167 14 117 5.4 HRV 3 159 48 91 6.2 230 20 114 6.1 NEIC 4 268 37 78 5.8 298 60 120 5.6 NEIC 5 266 34 76 6.0 325 80 108 5.8 NEIC 6 318 88 78 5.6 338 81 106 5.5 HRV
APPENDIX A
6
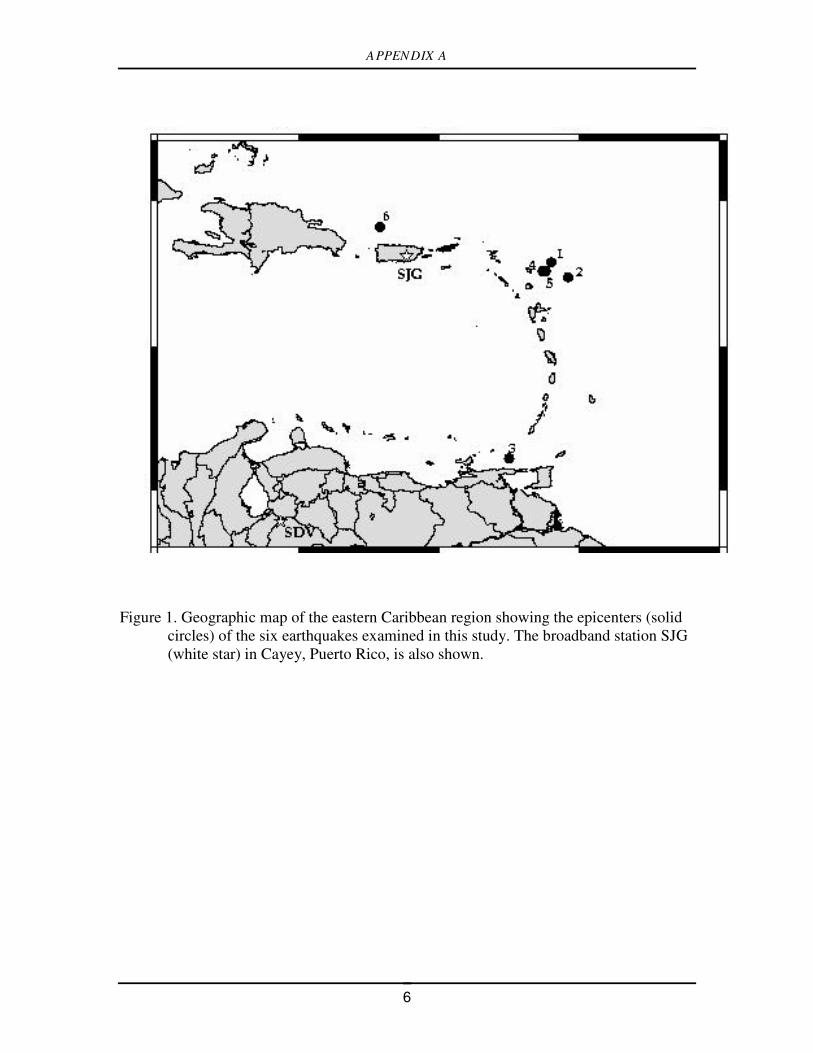
Figure 1. Geographic map of the eastern Caribbean region showing the epicenters (solid
circles) of the six earthquakes examined in this study. The broadband station SJG (white star) in Cayey, Puerto Rico, is also shown.
APPENDIX A
7
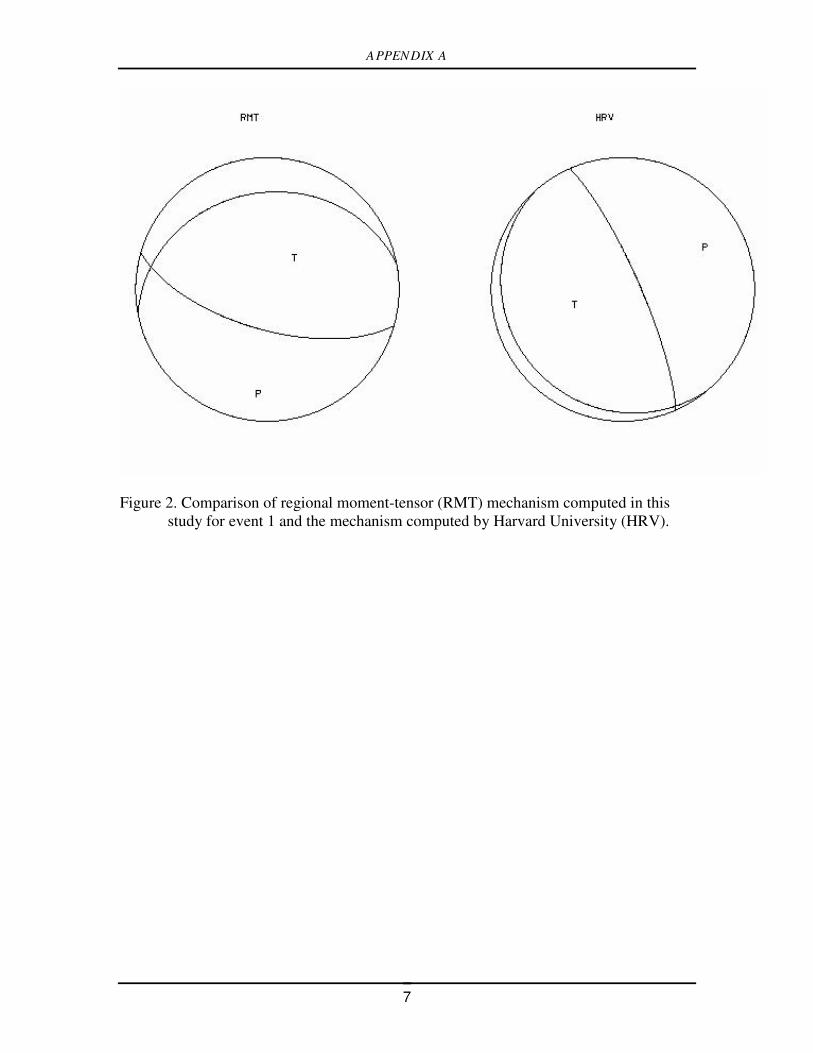
Figure 2. Comparison of regional moment-tensor (RMT) mechanism computed in this
study for event 1 and the mechanism computed by Harvard University (HRV).

APPENDIX A
8
Figure 3. Comparison of regional moment-tensor (RMT) mechanism computed in this
study for event 2 and the mechanism computed by Harvard University (HRV).
APPENDIX A
9
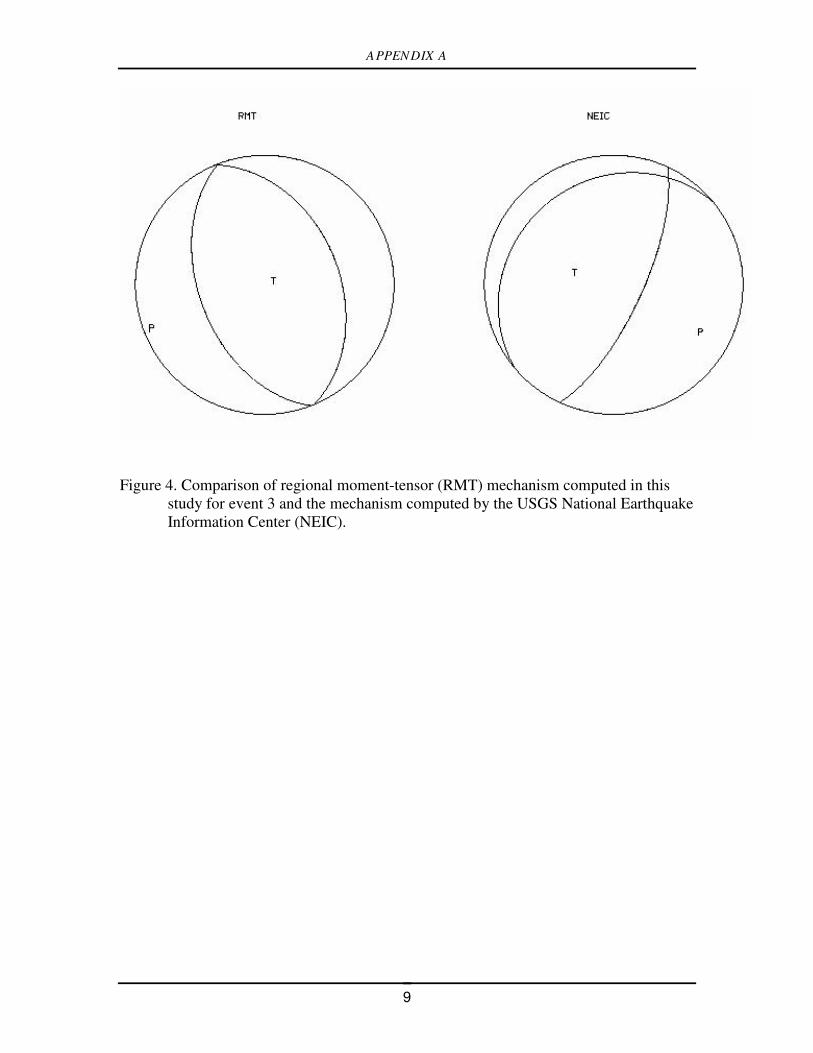
Figure 4. Comparison of regional moment-tensor (RMT) mechanism computed in this
study for event 3 and the mechanism computed by the USGS National Earthquake Information Center (NEIC).
APPENDIX A
10
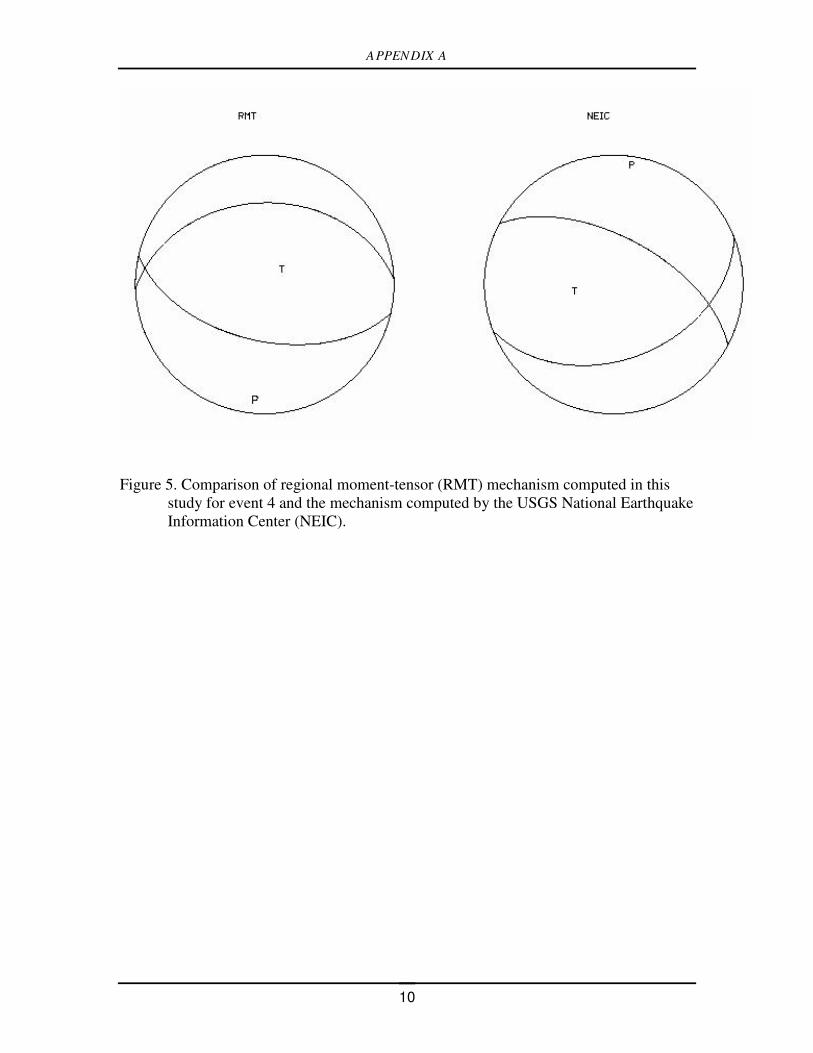
Figure 5. Comparison of regional moment-tensor (RMT) mechanism computed in this
study for event 4 and the mechanism computed by the USGS National Earthquake Information Center (NEIC).
APPENDIX A
11
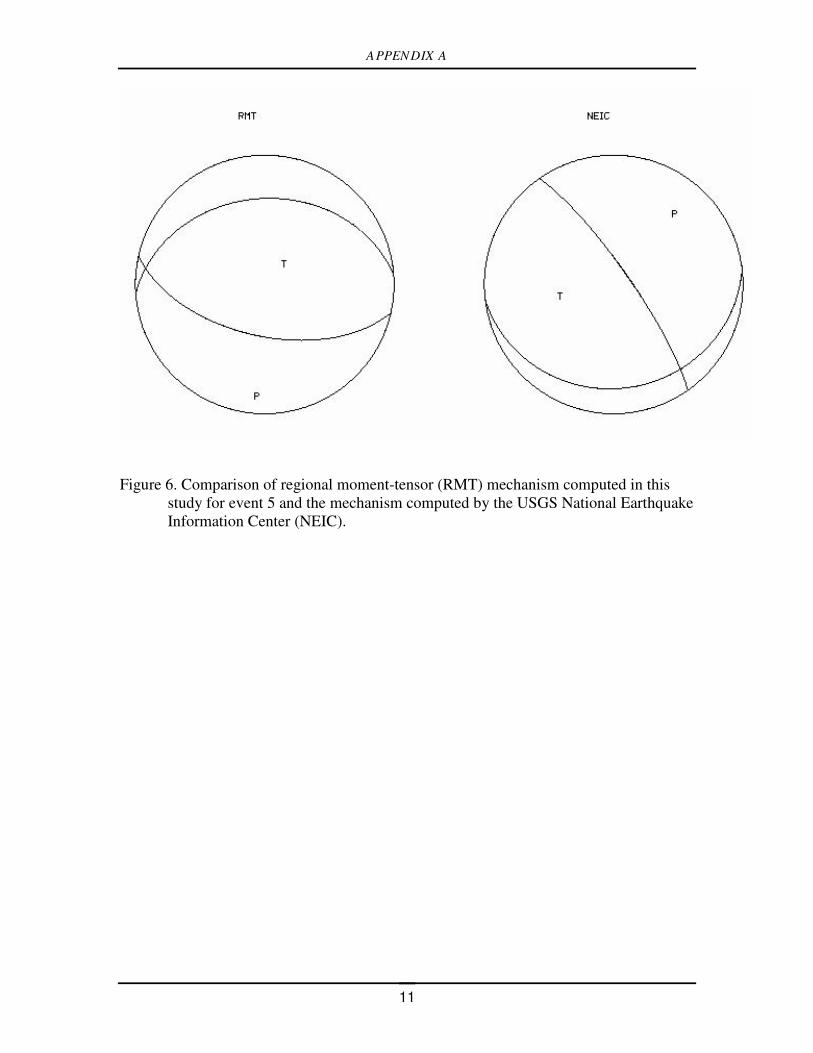
Figure 6. Comparison of regional moment-tensor (RMT) mechanism computed in this
study for event 5 and the mechanism computed by the USGS National Earthquake Information Center (NEIC).
APPENDIX A
12
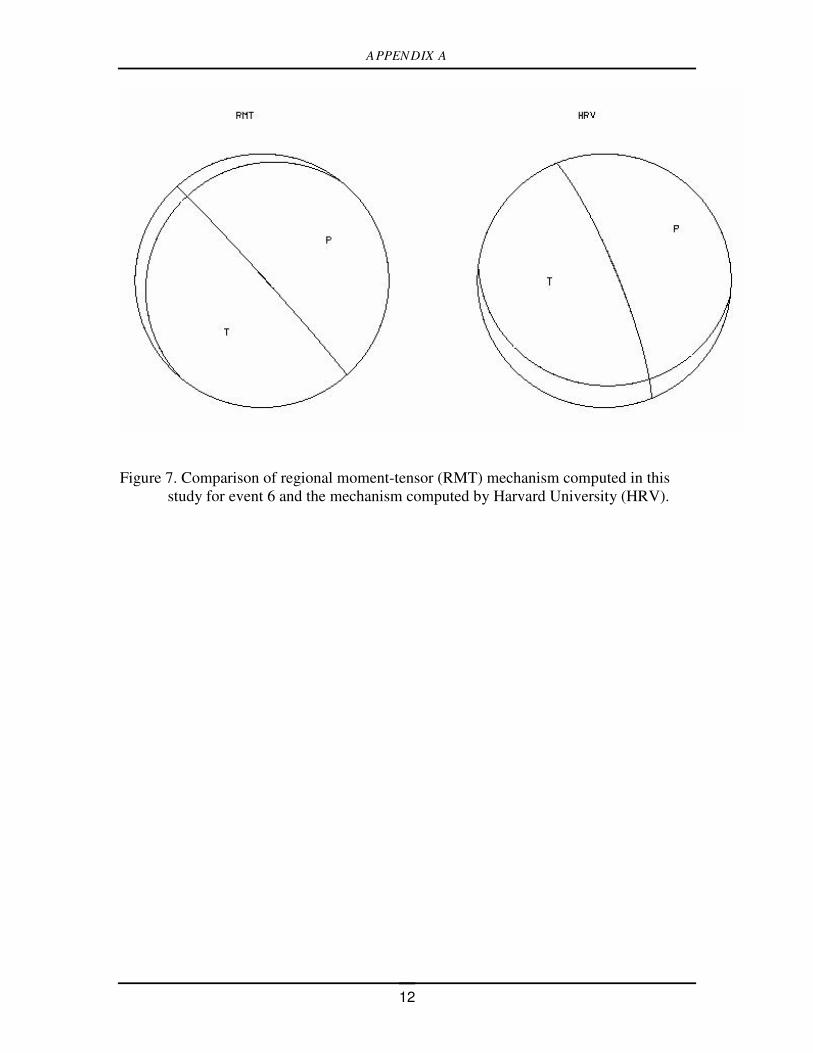
Figure 7. Comparison of regional moment-tensor (RMT) mechanism computed in this
study for event 6 and the mechanism computed by Harvard University (HRV).

APPENDIX B
APPENDIX B
1
Regional Waveform Inversion Procedure
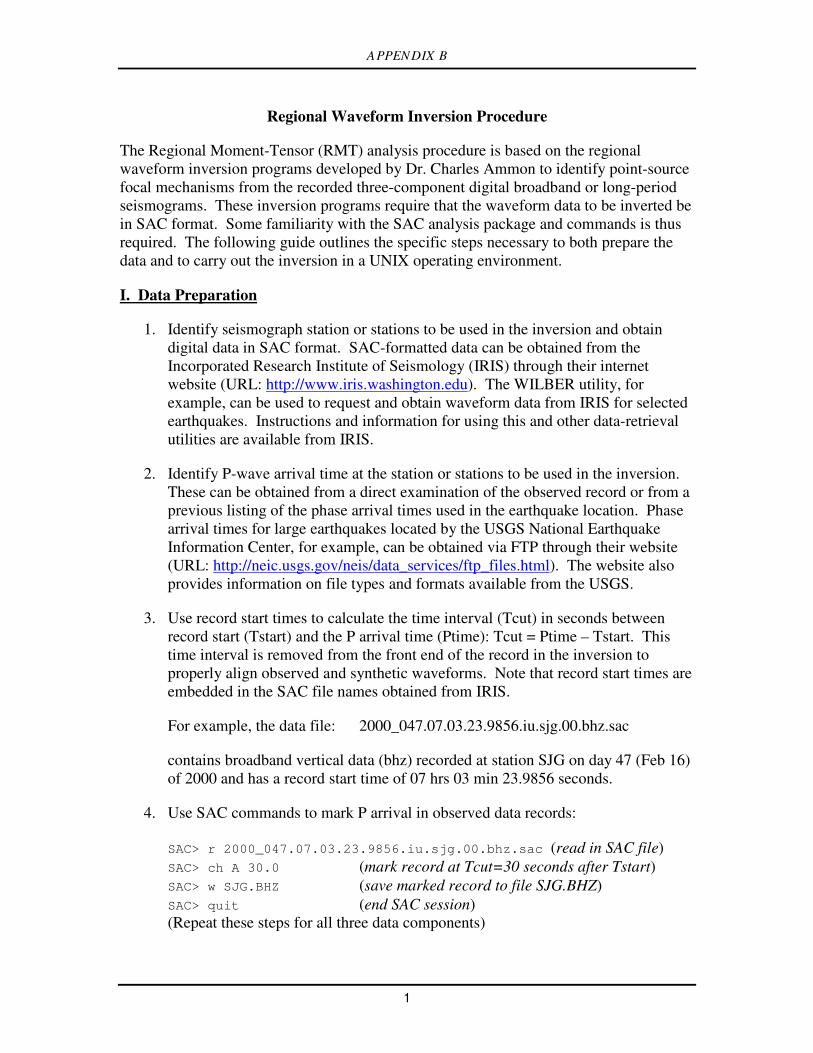
The Regional Moment-Tensor (RMT) analysis procedure is based on the regional waveform inversion programs developed by Dr. Charles Ammon to identify point-source focal mechanisms from the recorded three-component digital broadband or long-period seismograms. These inversion programs require that the waveform data to be inverted be in SAC format. Some familiarity with the SAC analysis package and commands is thus required. The following guide outlines the specific steps necessary to both prepare the data and to carry out the inversion in a UNIX operating environment.
I. Data Preparation
1. Identify seismograph station or stations to be used in the inversion and obtain digital data in SAC format. SAC-formatted data can be obtained from the Incorporated Research Institute of Seismology (IRIS) through their internet website (URL: http://www.iris.washington.edu). The WILBER utility, for example, can be used to request and obtain waveform data from IRIS for selected earthquakes. Instructions and information for using this and other data-retrieval utilities are available from IRIS.
2. Identify P-wave arrival time at the station or stations to be used in the inversion. These can be obtained from a direct examination of the observed record or from a previous listing of the phase arrival times used in the earthquake location. Phase arrival times for large earthquakes located by the USGS National Earthquake Information Center, for example, can be obtained via FTP through their website (URL: http://neic.usgs.gov/neis/data_services/ftp_files.html). The website also provides information on file types and formats available from the USGS.
3. Use record start times to calculate the time interval (Tcut) in seconds between record start (Tstart) and the P arrival time (Ptime): Tcut = Ptime – Tstart. This time interval is removed from the front end of the record in the inversion to properly align observed and synthetic waveforms. Note that record start times are embedded in the SAC file names obtained from IRIS.
For example, the data file: 2000_047.07.03.23.9856.iu.sjg.00.bhz.sac
contains broadband vertical data (bhz) recorded at station SJG on day 47 (Feb 16) of 2000 and has a record start time of 07 hrs 03 min 23.9856 seconds.
4. Use SAC commands to mark P arrival in observed data records:
SAC> r 2000_047.07.03.23.9856.iu.sjg.00.bhz.sac (read in SAC file) SAC> ch A 30.0 (mark record at Tcut=30 seconds after Tstart) SAC> w SJG.BHZ (save marked record to file SJG.BHZ) SAC> quit (end SAC session) (Repeat these steps for all three data components)
APPENDIX B
2
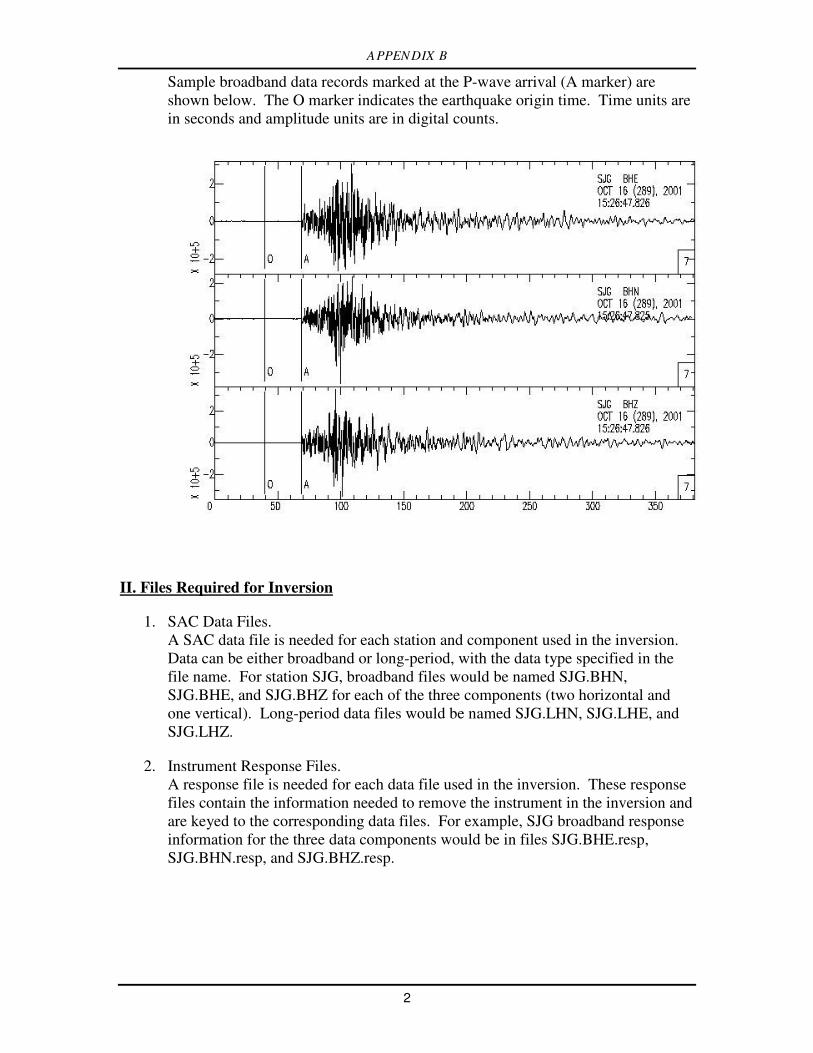
Sample broadband data records marked at the P-wave arrival (A marker) are shown below. The O marker indicates the earthquake origin time. Time units are in seconds and amplitude units are in digital counts.
II. Files Required for Inversion
1. SAC Data Files. A SAC data file is needed for each station and component used in the inversion. Data can be either broadband or long-period, with the data type specified in the file name. For station SJG, broadband files would be named SJG.BHN, SJG.BHE, and SJG.BHZ for each of the three components (two horizontal and one vertical). Long-period data files would be named SJG.LHN, SJG.LHE, and SJG.LHZ.
2. Instrument Response Files. A response file is needed for each data file used in the inversion. These response files contain the information needed to remove the instrument in the inversion and are keyed to the corresponding data files. For example, SJG broadband response information for the three data components would be in files SJG.BHE.resp, SJG.BHN.resp, and SJG.BHZ.resp.
APPENDIX B
3
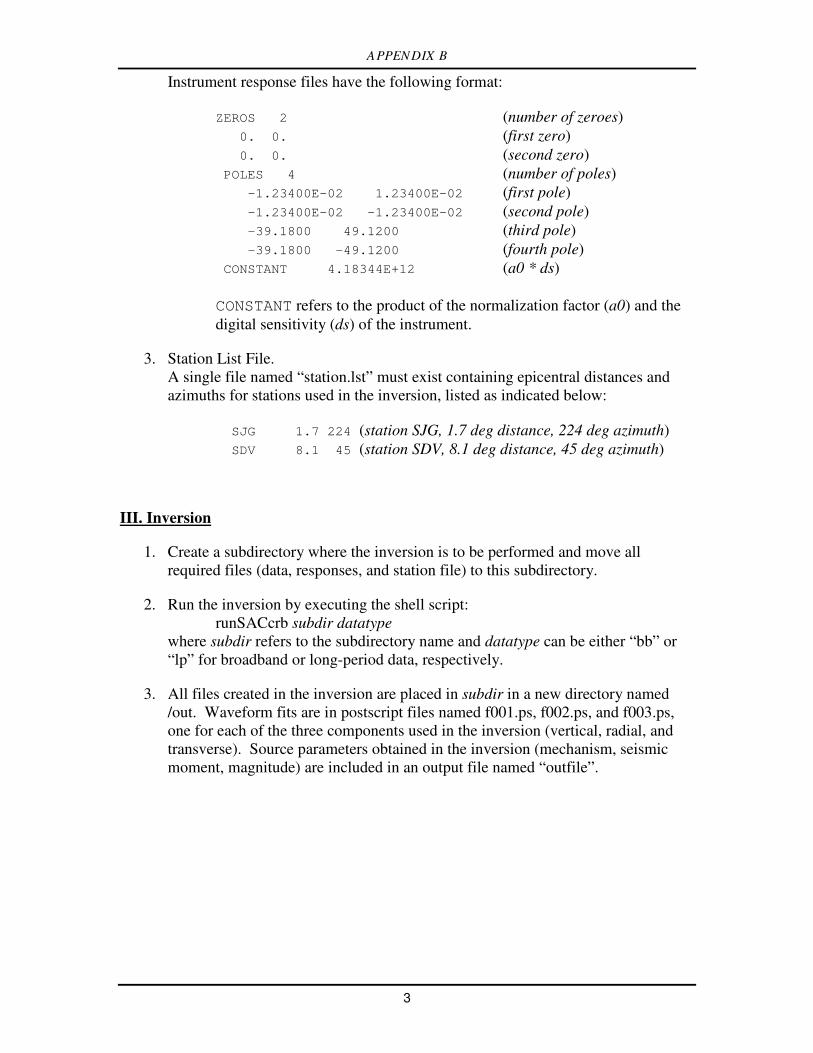
Instrument response files have the following format:
ZEROS 2 (number of zeroes) 0. 0. (first zero) 0. 0. (second zero) POLES 4 (number of poles) -1.23400E-02 1.23400E-02 (first pole) -1.23400E-02 -1.23400E-02 (second pole) -39.1800 49.1200 (third pole) -39.1800 -49.1200 (fourth pole) CONSTANT 4.18344E+12 (a0 * ds) CONSTANT refers to the product of the normalization factor (a0) and the digital sensitivity (ds) of the instrument.
3. Station List File. A single file named “station.lst” must exist containing epicentral distances and azimuths for stations used in the inversion, listed as indicated below:
SJG 1.7 224 (station SJG, 1.7 deg distance, 224 deg azimuth) SDV 8.1 45 (station SDV, 8.1 deg distance, 45 deg azimuth)
III. Inversion
1. Create a subdirectory where the inversion is to be performed and move all required files (data, responses, and station file) to this subdirectory.
2. Run the inversion by executing the shell script: runSACcrb subdir datatype where subdir refers to the subdirectory name and datatype can be either “bb” or “lp” for broadband or long-period data, respectively.
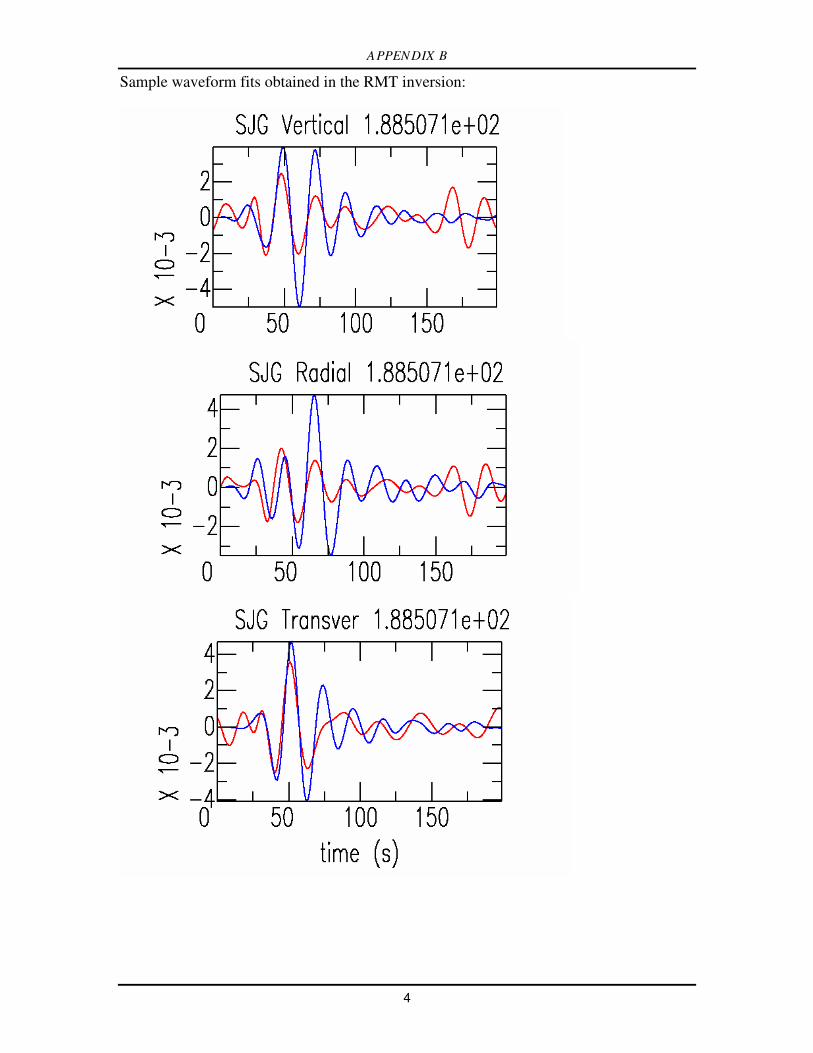
3. All files created in the inversion are placed in subdir in a new directory named /out. Waveform fits are in postscript files named f001.ps, f002.ps, and f003.ps, one for each of the three components used in the inversion (vertical, radial, and transverse). Source parameters obtained in the inversion (mechanism, seismic moment, magnitude) are included in an output file named “outfile”.
APPENDIX B
4
Sample waveform fits obtained in the RMT inversion:
APPENDIX B
5
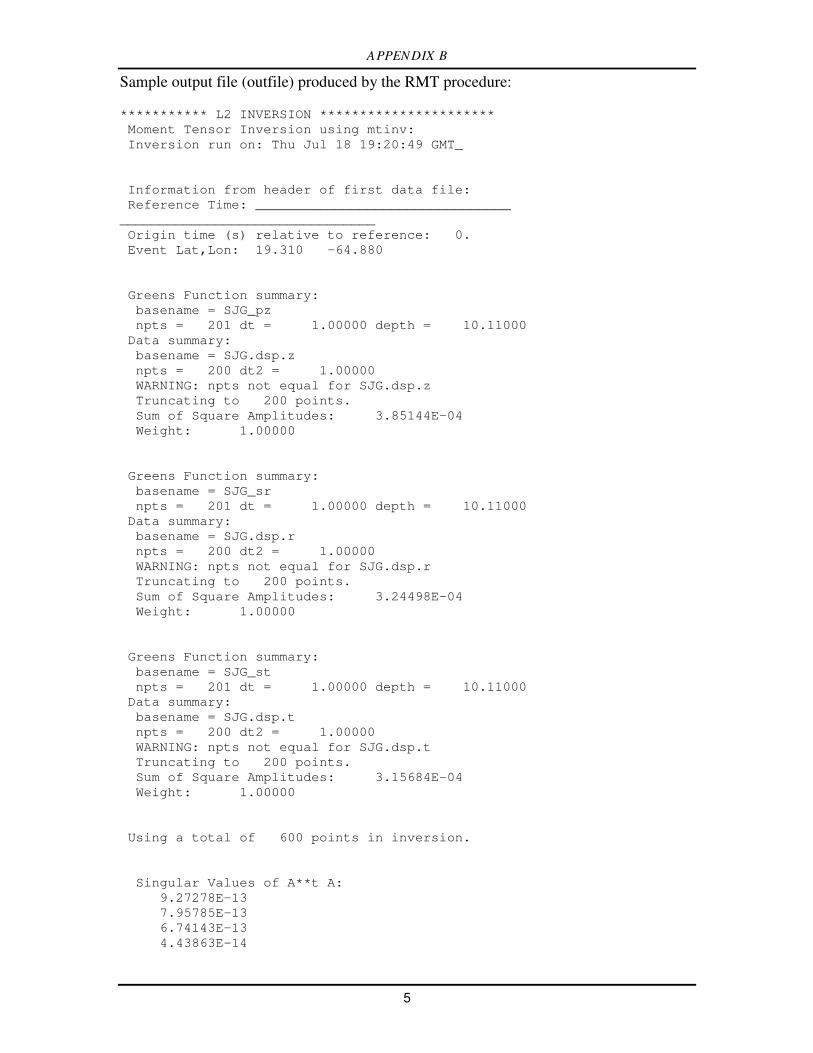
Sample output file (outfile) produced by the RMT procedure:
*********** L2 INVERSION ********************** Moment Tensor Inversion using mtinv: Inversion run on: Thu Jul 18 19:20:49 GMT_ Information from header of first data file: Reference Time: ________________________________ ________________________________ Origin time (s) relative to reference: 0. Event Lat,Lon: 19.310 -64.880 Greens Function summary: basename = SJG_pz npts = 201 dt = 1.00000 depth = 10.11000 Data summary: basename = SJG.dsp.z npts = 200 dt2 = 1.00000 WARNING: npts not equal for SJG.dsp.z Truncating to 200 points. Sum of Square Amplitudes: 3.85144E-04 Weight: 1.00000 Greens Function summary: basename = SJG_sr npts = 201 dt = 1.00000 depth = 10.11000 Data summary: basename = SJG.dsp.r npts = 200 dt2 = 1.00000 WARNING: npts not equal for SJG.dsp.r Truncating to 200 points. Sum of Square Amplitudes: 3.24498E-04 Weight: 1.00000 Greens Function summary: basename = SJG_st npts = 201 dt = 1.00000 depth = 10.11000 Data summary: basename = SJG.dsp.t npts = 200 dt2 = 1.00000 WARNING: npts not equal for SJG.dsp.t Truncating to 200 points. Sum of Square Amplitudes: 3.15684E-04 Weight: 1.00000 Using a total of 600 points in inversion. Singular Values of A**t A: 9.27278E-13 7.95785E-13 6.74143E-13 4.43863E-14

APPENDIX B
6
7.20755E-14 Singular Values of A: 9.62953E-07 8.92068E-07 8.21062E-07 2.10680E-07 2.68469E-07 --------- From Subroutine Moment --------------- Input moment tensor: -0.103E+05 0.401E+05 0.144E+05 0.401E+05 -0.339E+05 -0.154E+04 0.144E+05 -0.154E+04 0.442E+05 m0 = 1.00000E+20 Isotropic Component: 0. Subtracted out the isotropic component. The Deviatoric Moment Tensor: -0.103E+05 0.401E+05 0.144E+05 0.401E+05 -0.339E+05 -0.154E+04 0.144E+05 -0.154E+04 0.442E+05 eigenvalues of the moment tensor 0.489E+05 0.159E+05 -0.649E+05 and associated eigenvectors (in the columns) 0.321E+00 -0.728E+00 0.606E+00 0.138E+00 -0.597E+00 -0.790E+00 0.937E+00 0.337E+00 -0.910E-01 Eigenvector 1: Az = 23.2853 Plunge = 69.5452 Eigenvector 2: Az = 219.346 Plunge = 19.7191 Eigenvector 3: Az = 127.469 Plunge = 5.22186 The Total Scalar Moment (Silver&Jordan,1982) is 0.586E+25 The Total Moment Magnitude (Kanamori(1979)) is 5.8 The Deviatoric Scalar Moment (Silver&Jordan,1982) is 0.586E+25 The Deviatoric Moment Magnitude (Kanamori(1979)) is 5.8 double couple eigenvalues= 0.569E+05 -0.569E+05 error (clvd/dc)*100= 49.074 moment tensor for the major dislocation -0.2640 -0.6056 0.5232 0.3559 0.0575

APPENDIX B
7
pole vectors p1 and p2 -0.201E+00 0.657E+00 0.727E+00 0.655E+00 -0.461E+00 0.598E+00 azimuth and plunge of pole #1; az1= 107.05 pl1= 46.63 azimuth and plunge of pole #2; az2= 324.86 pl2= 36.74 fault angle parameters strike dip rake 197.05 43.37 240.57 54.86 53.26 -65.10 -------------------------------------------------- Covariance Matrix xx yy xy xz yz 0.690E+13 0.612E+13 0.793E+13 -0.709E+13 -0.775E+13 0.102E+14 -0.521E+12 -0.202E+12 0.261E+12 0.740E+13 -0.167E+12 -0.532E+12 0.240E+12 -0.624E+13 0.784E+13 file,weight,sum_square_error,fractional_error,ls_scale_factor SJG.dsp.z 0.100000000E+01 0.210980506E-03 0.547795713E+00 0.104450214E+01 SJG.dsp.r 0.100000000E+01 0.230943348E-03 0.711694837E+00 0.933969617E+00 SJG.dsp.t 0.100000000E+01 0.128780244E-03 0.407940567E+00 0.100000060E+01 Misfit Summary: Fractional Misfit: 0 1 | | | | | SJG.dsp.z 0.55 |xxxxxxxxxxxxxxxxxxxxxxxxxxx | SJG.dsp.r 0.71 |xxxxxxxxxxxxxxxxxxxxxxxxxxxxxxxxxxx | SJG.dsp.t 0.41 |xxxxxxxxxxxxxxxxxxxx | | | | | | | Unweighted SSE,Weighted SSE,Unweighted RMS,Weighted RMS 9.60781E-07 9.60781E-07 9.80195E-04 9.80195E-04 Total Error divided by sum of all seismogram amplitudes Unweighted, weighted 0.556607 0.556607 Covariance Matrix xx yy xy xz yz 0.663E+07 0.588E+07 0.762E+07 -0.681E+07 -0.745E+07 0.976E+07 -0.501E+06 -0.195E+06 0.251E+06 0.711E+07 -0.160E+06 -0.511E+06 0.231E+06 -0.600E+07 0.753E+07