university of pretoria etd, smith c c (2006) chapter 3
TRANSCRIPT

Chapter 3. Research methodology
3.1 Introduction
Chapter 2 made it clear that the research in this study has significant implications for a
variety of current issues in higher education. I deliberately selected a user-centred
approach so that I could achieve a thorough understanding of the real needs of
postgraduate students. If one hopes to design and implement products and services that
will meet the needs of a specific user group, it is advisable to involve the specific user
group concerned and to find out from them exactly what it is that they want. In this
study I therefore focused on the actual users and their tasks so that I might acquire a
deep understanding of their requirements and so that their genuine needs and wants
could be taken into account in the future designs and plans of the support services of the
Academic Information Service (Coleman and Sumner 2004).
This chapter explains the research methodology that was used and includes a discussion
of the conceptual framework by means of which the study was conducted and the data
collection plan applied. Issues of validity, reliability, ethical considerations and the
limitations of this research are also addressed.
3.2 Conceptual framework for this study
Stone and Harris (quoted by Van Lill 2001, p. 40) distinguish between two fundamentally
different kinds of user studies. “On the one hand, the starting point is the existing service
and on the other, the starting point is the assessment of people’s needs” (Van Lill 2001,
p. 40). Hewins (quoted by Van Lill 2001, p. 40) distinguishes between information need
studies and information use studies. An analysis of the research needs of postgraduate
students at higher education institutions may be regarded as an information need study.
In such studies one investigates the users of the sample and their specific needs, their
information-related behaviour, the tasks they perform, the information-need situations in
which they find themselves and their general and specific information requirements. “The
focus is on the interaction between user and information system, and touches on related
aspects such as information habits, preferences, perceptions and information seeking
behavior” (Van Lill 2001, p. 40).
UUnniivveerrssiittyy ooff PPrreettoorriiaa eettdd,, SSmmiitthh CC CC ((22000066))

Chapter 3 Research methodology
54
Electronic research needs represent only one of the many categories of needs that
postgraduate research students experience. Since most postgraduate students are adult
learners, they also have careers and many other matters to attend to that are rather
different from those experienced by the average undergraduate who has recently left
school. Postgraduate research students have different needs with regard to career
development, educational planning, intellectual skills development, life skills
development, personal development, resources and research information, study facilities,
personal needs, health needs, financial needs, social needs and so on. It is against this
background that the conceptual framework (see Figure 9 on the next page) should be
understood. I used these categories of needs from the conceptual framework to identify
the specific needs that postgraduate students experience. Once I had categorised their
needs, I engaged in a thorough needs analysis that led in turn to a clear understanding of
the kinds of tools and applications that would support the work habits, routines and
processes of postgraduate research students who work in the kind of virtual research
environment conceptualised by Page-Shipp et al. (2005). The needs analysis that I
undertake in this study addresses the eScience component of eResearch in the model by
Page-Shipp et al. (2005). It enabled me to identify the specific tools and applications that
postgraduate research students need when conducting electronic research (see Figure 3,
p. 17).
UUnniivveerrssiittyy ooff PPrreettoorriiaa eettdd,, SSmmiitthh CC CC ((22000066))

Chapter 3 Research methodology
55
E-Publishing
E-Training
E- Communication
E-Access e.g. AIS Web, WWW, Databases, books, articles
Transfer of data & computation
e-Client
Primary data
sharing
Figure 9. Conceptual framework within which e-research needs were studied
The figure above shows that e-science tools and applications refer to the tools and
applications that are needed for conducting research, publishing, sharing data, transfer of
data and computation, access, communication and training – all the constituent activities
that make for a more effective and efficient global virtual research environment. The e-
client occupies a central position in this virtual global research environment model
because it is the client who is supported by all these activities as he or she strives to
achieve excellence in research and an optimal workflow.
The conceptual model shown in Figure 9 is, as has already been noted above, an
adaptation of the original model by Page-Shipp et al. (2005). It supports the proposed e-
Global virtual research environment
E-Science tools & applications in support of:
UUnniivveerrssiittyy ooff PPrreettoorriiaa eettdd,, SSmmiitthh CC CC ((22000066))

Chapter 3 Research methodology
56
research paradigm and identifies the e-research needs of postgraduate students by
offering a service that comprises the following elements:
The willingness of researchers to share primary data and datasets and make them
available through an open access repository (Page-Shipp et al. 2005).
The kind of IT infrastructure that is able to transfer and share large data-streams
or datasets and to share models and even computing capacity (Page-Shipp et al.
2005).
Commercial and open access to high quality research. “Open access is relatively
new, and for it to achieve maturity, researchers will have to be both willing and
able to use this mode” (Page-Shipp et al. 2005).
Promoting collaborative research by making research tools, models and
applications that are held in geographically remote institutions accessible (Page-
Shipp et al. 2005).
The digital curation and preservation of scientific data and datasets “for their
scientific and scholarly useful lifetimes, including the promotion of effective and
widespread use” (Page-Shipp et al. 2005).
Making provision for innovation in technologies and applications that would
support all of the processes mentioned above (Page-Shipp et al. 2005).
The application of the conceptual model for the analysis of e-research needs shown in
Figure 9 of this study is an attempt to refine the “tools and applications” component of
the model by Page-Shipp et al. (2005). This model categorises the needs and tools that
support the e-research needs of postgraduate students. Its purpose is to show in graphic
form what such postgraduate research students need by way of e-infrastructure if they
are to pursue their research unhampered in an environment that is completely supportive
because it answers to all their needs. Once these needs have been properly identified, the
institution will be in a position to address them.
By using the main conceptual framework, one can illustrate the impact created by
sufficient or insufficient service delivery from the library (see Figure 10).
UUnniivveerrssiittyy ooff PPrreettoorriiaa eettdd,, SSmmiitthh CC CC ((22000066))

Chapter 3 Research methodology
57
Figure 10. Satisfied e-client within a continuous cycle
Figure 10 shows how a satisfied e-client fits into a continuous cycle. Because such a client
will have had his or her needs addressed in a satisfying and affirmative way by the
library, he or she will have no reservations about returning to the library in the future to
have his or her needs addressed.
That the opposite is also true is seen in the client model adopted by contemporary
libraries. Once a client has had an unsatisfactory experience in a library or once client
needs have not been satisfactorily addressed by the library, the library is in danger of
losing such a client. The process as depicted diagrammatically (see Figure 11) therefore
becomes linear when it illustrates the opposite of what we see in Figure 10 and when it
shows how a negative experience impacts on the research environment.
Needs
Library (online/ physical) Needs addressed
Satisfied e-client
UUnniivveerrssiittyy ooff PPrreettoorriiaa eettdd,, SSmmiitthh CC CC ((22000066))

Chapter 3 Research methodology
58
Figure 11. Unsatisfied e-client within a linear process
In the following section I will discuss the methodology that I used to identify specific
needs that need to be addressed.
Needs
Needs not addressed
Client uses GoogleTM
Library
e-Client
UUnniivveerrssiittyy ooff PPrreettoorriiaa eettdd,, SSmmiitthh CC CC ((22000066))

Chapter 3 Research methodology
59
3.3 Research design and methodology (data collection plan)
3.3.1 Research paradigm
According to Blaxter, Hughes and Tight (2002, p. 59), “methodology” usually refers to
“the approach or paradigm that underpins the research”. In conducting this research I
used a positivist approach or paradigm. This means that I as researcher tried to remain
objective and detached from the respondents who participated in the research for the
duration of the research. I thereafter tried to elucidate the research issues by means of a
quantitative research instrument (in this case, the questionnaire).
I mainly used a quantitative research instrument (i.e. a questionnaire), together with the
results from a user survey (a qualitative research instrument). Schwandt (2001, p. 215)
writes that “qualitative studies can and often do make use of quantitative data”. Because
of the exploratory nature of the research, I used the data from the qualitative
instruments (i.e. the survey) to complement the results of the quantitative instrument
(i.e. the questionnaire) and to verify the data that had been collected by means of the
questionnaire. The method whereby a combination of research methods is used to cross-
check findings (as is the case in this study) is referred to as “triangulation” (Blaxter,
Hughes and Tight 2002, p. 84; Rowland and Rubbert 2001, p. 747).
3.3.2 General methodological structure
3.3.2.1 Research problem
The issue that I will address is that although continuous advances in technology are
making a radical impact on the way in which postgraduate students conduct their studies,
this new technology (that is used throughout the world) is not being utilized to its fullest
possible extent by the library and by other academic support services that have to meet
the research and study needs of postgraduate students. Libraries specifically are not
exploiting the advantages and potential of this range of developing technologies – usually
because of limited resources and because of a lack of skills and training among librarians.
Page-Shipp et al. (2005) propose that libraries could compensate for deficits in resources
if between libraries were to collaborate and share resources through an e-research portal.
My observations of the specific needs of postgraduate students have shown me that they
mostly attend to their studies after hours, during weekends and when they take leave for
UUnniivveerrssiittyy ooff PPrreettoorriiaa eettdd,, SSmmiitthh CC CC ((22000066))

Chapter 3 Research methodology
60
study purposes – and not (mainly) during the library’s opening hours. Because they are
so busy and committed to their schedules, they do not have the leisure to wait for the
library to open on the following day. They need information to be available at a time
when they are ready to receive it and process it. This may be at two o’ clock in the
morning.
The research problem that arises out of this was tested by the following research
questions:
How does the literature define the specific electronic research needs of
postgraduate students at higher education institutions experienced internationally?
What specific electronic research needs are experienced by postgraduate students
at the University of Pretoria, Faculty of Education?
Do any of the research needs identified by the literature exist among postgraduate
students at the Faculty of Education, University of Pretoria?
How can the needs thus identified be prioritised in terms of frequency and
urgency?
3.3.2.2 Research matrix
The following research matrix (see Table 2) illustrates how the research instruments
mentioned above were used to answer the research questions. This matrix not only
indicates the effectiveness of the research, since more than one instrument were used to
arrive to an answer, but it also shows that the research was efficient because each
instrument was used for more than one purpose.
UUnniivveerrssiittyy ooff PPrreettoorriiaa eettdd,, SSmmiitthh CC CC ((22000066))

Chapter 3 Research methodology
61
Table 2. Research matrix
Questions Met
hods
Lite
ratu
re
Rev
iew
Ques
tionnai
re
Surv
ey
How does the literature define the specific electronic research needs of
postgraduate students at higher education institutions experienced
internationally?
What specific electronic research needs are experienced by
postgraduate students at the University of Pretoria, Faculty of
Education?
Do any of the research needs identified by the literature exist among
postgraduate students at the Faculty of Education, University of
Pretoria?
How can the needs thus identified be prioritised in terms of frequency
and urgency?
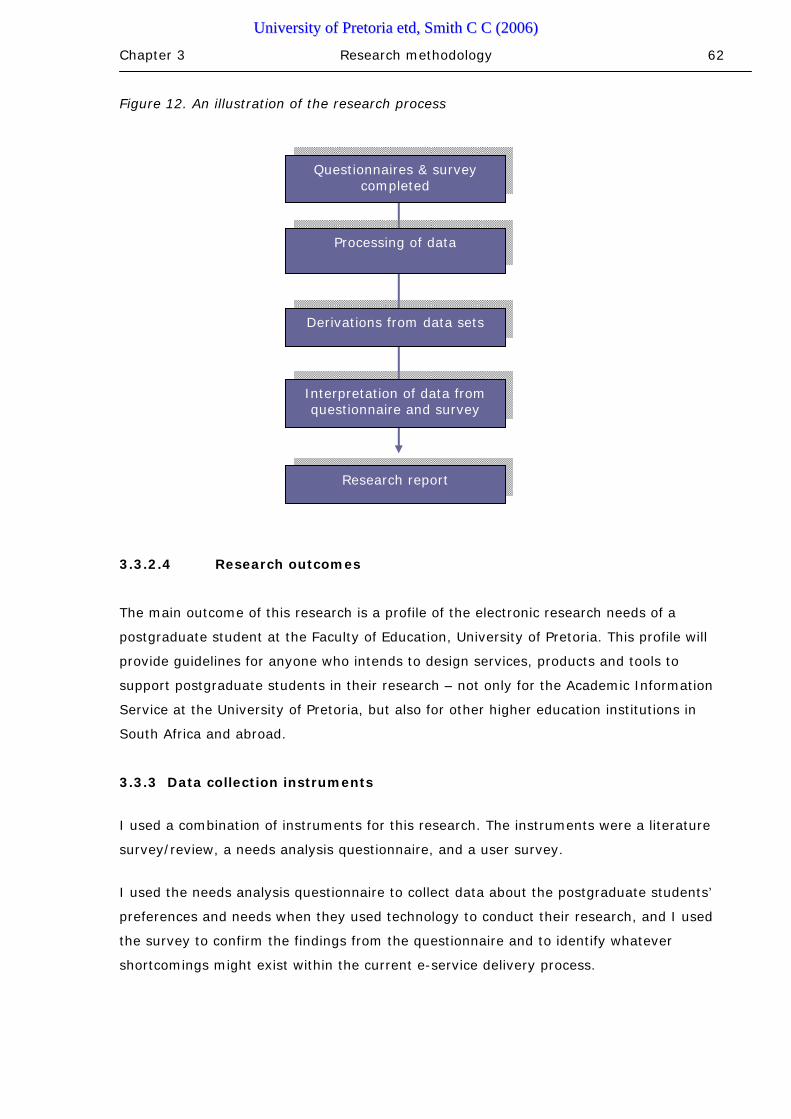
3.3.2.3 Research report
The process that was followed to compile the research report can be illustrated as follows
(see Figure 12):
UUnniivveerrssiittyy ooff PPrreettoorriiaa eettdd,, SSmmiitthh CC CC ((22000066))
Chapter 3 Research methodology
62
Figure 12. An illustration of the research process
3.3.2.4 Research outcomes
The main outcome of this research is a profile of the electronic research needs of a
postgraduate student at the Faculty of Education, University of Pretoria. This profile will
provide guidelines for anyone who intends to design services, products and tools to
support postgraduate students in their research – not only for the Academic Information
Service at the University of Pretoria, but also for other higher education institutions in
South Africa and abroad.
3.3.3 Data collection instruments
I used a combination of instruments for this research. The instruments were a literature
survey/review, a needs analysis questionnaire, and a user survey.
I used the needs analysis questionnaire to collect data about the postgraduate students’
preferences and needs when they used technology to conduct their research, and I used
the survey to confirm the findings from the questionnaire and to identify whatever
shortcomings might exist within the current e-service delivery process.
Questionnaires & survey completed
Processing of data
Derivations from data sets
Research report
Interpretation of data from questionnaire and survey
UUnniivveerrssiittyy ooff PPrreettoorriiaa eettdd,, SSmmiitthh CC CC ((22000066))
Chapter 3 Research methodology
63
3.3.3.1 Literature survey/review
I approached the research in the customary way: by first undertaking an in-depth
analysis of the literature and research already conducted in this field.
Although one can find a large amount of research material on the World Wide Web, I
analysed mainly articles from authoritative research databases such as EbscoHost
(Academic Search Premier).
Among the main search terms or keywords that I used were the following: “postgraduate
students”, “higher education”, “research needs”, “electronic research needs”, “information
needs”, “needs analysis”, “needs assessment”, “virtual research environment” and “user
study”. These searches were executed by using the Boolean operators: AND, OR and
NOT.
3.3.3.2 Questionnaire
3.3.3.2.1 Rationale for using a questionnaire
Questionnaires are one of the most widely used social research instruments (Blaxter,
Hughes and Tight 2002, p. 179), especially when they are used to clarify the needs and
reactions of a defined user group to the design and implementation of specific services or
products to which that user group is exposed. This is what Reeves (n.d.) is referring to
when he writes: “The audiences for the program must be carefully analyzed to assure
that all their needs are met and all their preferred modes of learning or accessing
information are considered.”
In this study, the questionnaire proved to have a few advantages when compared to the
advantages listed by Reeves (n.d.):
The respondents within this study remained anonymous.
The questionnaire was brief. The respondents needed a maximum of only ten
minutes to complete it.
It was possible to include different types of questions (namely open-ended and
multiple-choice questions) within this specific questionnaire format.
When compared to disadvantages listed by Reeves (n.d.), some disadvantages
inherent in this questionnaire were the following:
UUnniivveerrssiittyy ooff PPrreettoorriiaa eettdd,, SSmmiitthh CC CC ((22000066))

Chapter 3 Research methodology
64
It was not possible to design a flawless questionnaire.
The answered questionnaire took a considerable time to process and analyse.
The way in which the questionnaire was used did not allow for much flexibility
during the data collection process.
3.3.3.2.2 Design of the questionnaire
The literature survey and conceptual framework together guided the design of questions
that were included in the closed questionnaire. During the design stage, I sent the first
draft of the questionnaire to the Department of Statistics (Statomet) of the University of
Pretoria, who recommended some modifications. It was particularly difficult to decide how
to formulate questions that would elicit data that was both rich and sufficient enough to
provide me with information on which to work. Because of the carefully demarcated
nature of this study, the questions about the respondents’ use of electronic e-services
and their electronic needs were of central importance, and I had to take great care not to
confuse electronic research needs with research or information needs in general.
As I mentioned above, I employed a qualitative approach by using quantitative data.
Sixteen of the questions required respondents to “select the appropriate box” or “all
which apply” (i.e. all the boxes that were applicable). These were multiple choice
questions. Two further questions were open ended. I provided clear instructions on how
to complete each question by making the instructions very clear, as with, for example,
“Choose one only”. I included a total of 18 questions in the questionnaire (see Addendum
C). I avoided library or information technology jargon where possible, and took care to
use what terminology there was consistently throughout the questionnaire. I also avoided
leading questions. The questionnaire was available in English only.
I printed the questionnaire in black and white. The questions were ordered in a logical
way. The first two questions addressed the current study year for which the respondent
was enrolled and asked what the respondent’s mother tongue was. I followed these by
broad and more detailed questions about the kind of electronic services, support and
products postgraduate students expected from their library. These questions were
obviously pertinent to the core of the research.
My final version of the questionnaire therefore addressed the following information and
issues:
UUnniivveerrssiittyy ooff PPrreettoorriiaa eettdd,, SSmmiitthh CC CC ((22000066))

Chapter 3 Research methodology
65
Characteristics of respondents (study year for which the respondent was enrolled
and the mother tongue)
The preferences of the postgraduate respondents with regard to:
Electronic tools used to conduct research, e.g. Internet search engines and library
databases
Means of communicating with the library
Electronic searches
Training
Sharing scholarly research/publications electronically (This would include
networking and electronic publishing)
Online access
The relation between the conceptual model/framework and the questions included in the
questionnaire is illustrated by the table (Table 3) below:
Table 3. Demonstrating how the questionnaire has been based on the conceptual
model/framework for this study
Category according
to conceptual
model
Questions derived from category
E-access needs Q4 Which of the following do you prefer when
conducting your research?
Q12 When using the library web page, which of the
following do you prefer?
Q14 How often do you plan to use the online library
services/facilities?
Q15 When conducting research using the electronic
databases and electronic journals, which of the
following do you prefer?
UUnniivveerrssiittyy ooff PPrreettoorriiaa eettdd,, SSmmiitthh CC CC ((22000066))

Chapter 3 Research methodology
66
Transfer of data and
computation
Q 10 Which of the following software would you like to
be made available on computers inside the library
to support your research? You may choose more
than one.
Q 9 How willing are you to make your assignments and
research projects available on an institutional
database in order to share them with the rest of
the research community at UP and worldwide?
Communication
needs
Q3 What is your mother tongue?
Q5 When requiring help from an information
specialist, I prefer to communicate …
Q7 When receiving news and updates from the library,
which of the following do you prefer?
Q8 I prefer library training to be conducted …
Q13 When requesting online assistance from an
information specialist, I expect online feedback
within …
Q16 When provided with information on electronic
journal articles relating to your research topic,
which of the following do you prefer?
Training and support
needs
Q 5 When requiring help from an information specialist,
I prefer to communicate …
Q 6 When searching for information on my research
topic, I prefer to …
Q 8 I prefer library training to be conducted …
Q 11 Would you like to receive training from the library
on how to use the Internet?
Q 13 When requesting online assistance from an
information specialist, I expect online feedback
within …
Q 16 When provided with information on electronic
journal articles relating to your research topic,
which of the following do you prefer?
Publishing needs,
including primary
data sharing needs
Q 9 How willing are you to make your assignments and
research projects available on an institutional
database, in order to share it with the rest of the
research community at UP and worldwide?
UUnniivveerrssiittyy ooff PPrreettoorriiaa eettdd,, SSmmiitthh CC CC ((22000066))

Chapter 3 Research methodology
67
Since no questionnaire is ever perfect, it was only once I had started the analysis of the
data that I noticed the following:
Some questions didn’t really provide enough data to establish significance in the
statistical relationships between data.
There were certain omissions or lacunae in the questionnaire. I should have, for
example, included a question about the age of the respondents so that I could
have linked their responses to the generations from which they came. Perhaps this
could be addressed in future studies.
3.3.3.2.3 Pilot questionnaire
I initially compiled sample questions by means of open-ended questions convenience
sampling. I approached postgraduate students from the Academic Information Service
(Groenkloof) on an ad hoc basis to collect suitable questions.
From the questions that I collected by means of convenience sampling, I compiled a pilot
questionnaire. In order to test whether the questions in the initial questionnaire were
unambiguous and straightforward, I undertook a pilot survey with 136 students during
the general orientation session for postgraduate students on 22 January 2005. Of the
questionnaires I handed out, only 45 were completed and returned. This gave a return
rate of 33%. After studying the pilot questionnaire and thinking about the responses, I
introduced some minor amendments that had the effect of removing ambiguity and
formulating the instructions more clearly. I also discarded a few questions from the
questionnaire. This pilot survey contributed towards maximizing the response rate of the
final questionnaire and minimizing the error rate in the answers.
3.3.3.2.4 Sampling technique
I used a non-probability sampling technique (and specifically non-probability
“convenience” sampling) to identify possible respondents from the population. With this
method of sampling “there is an assumption that there is an even distribution of
characteristics within the population” (Statistics: power from data!, n.d.). I did not devise
a systematic sampling frame to select a target group of students (elements) who might
be fully representative of all the faculties at the university. I simply chose elements in an
arbitrary way and had no way of estimating the probability that any one element would
be included in the sample. There was therefore no assurance that each item had a chance
UUnniivveerrssiittyy ooff PPrreettoorriiaa eettdd,, SSmmiitthh CC CC ((22000066))

Chapter 3 Research methodology
68
of being included. This made it impossible either to estimate sampling variability or to
identify possible bias (Statistics: power from data!, n.d.). This kind of sampling is also
often referred to as “haphazard” or “accidental” sampling because it is not representative
of the target population. It is not representative because sample units are only selected if
they can be easily and conveniently accessed (Statistics: power from data!, n.d.).
3.3.3.2.5 Distribution
I collected data by means of the questionnaire from among postgraduate students in the
Faculty of Education at the University of Pretoria. The Faculty of Education is divided into
four departments:
Department of Curriculum Studies
Department of Educational Psychology
School for Teacher Training
Department of Education Management and Policy Studies
Although the medium of instruction at the university is Afrikaans, instruction is also given
in English when required.
I personally handed out the individually numbered questionnaires during the first
scheduled meeting of the participants in the NME 810 module (Research and
methodology module, 2005). I also handed them out at two library orientation sessions
which were coordinated by an information specialist from the Academic Information
Service (Service Unit Groenkloof). I distributed these questionnaires by hand to
respondents during the sessions and asked them to complete them during the sessions
listed below (10 minutes were allowed for completion). Although response rates to
questionnaires are notoriously low, I obtained a very good response rate for this
questionnaire because the questionnaire was distributed in precisely structured
circumstances (scheduled meetings) and then collected again after ten minutes.
UUnniivveerrssiittyy ooff PPrreettoorriiaa eettdd,, SSmmiitthh CC CC ((22000066))

Chapter 3 Research methodology
69
Table 4. Research population and the sample which completed the questionnaire
Session Number of
Questionnaires
Return rate
10 Feb 2005 Library Orientation
(PhD Educational
Management Group)
20 handed out; 20 returned 100% return rate
18 Feb 2005 NME 810 Group
(which included MEd & PhD
students)
112 handed out; 82
returned
73% return rate
22 Feb 2005 Library Orientation
(PhD students)
36 handed out; 20 returned 55% return rate
The questionnaire was completed by 122 postgraduate students in total. This represented
28% of the postgraduate students enrolled at the Faculty of Education on 14 March 2005
(Jeannie Beukes, personal communication, March 14, 2005). The response or return rate
for the questionnaires that were handed out was satisfactory (72%). The students who
participated varied in progression with regard to their studies. They were not pre-
selected, and participated on a voluntary basis in the sessions described above. One may
therefore say that there was a good participant coverage. Although a total of 431
postgraduate students were enrolled at the Faculty of Education at the date of this study,
the sessions mentioned above were only attended by 168 students. Attendance at these
sessions are not compulsory.
3.3.3.3 Survey
3.3.3.3.1 About the LIBQUAL+TM Survey
The LibQUAL+TM Survey (see Addendum F for the questions in survey) evolved from a
conceptual model based on the SERVQUAL instrument which is a popular tool for
assessing service quality in the private sector (Association of Research Libraries 2005). It
is a suite of services offered by the Association of Research Libraries “that libraries [can]
use to solicit, track, understand and act upon users’ opinions of service quality”
(Association of Research Libraries 2005). This instrument may be used to solicit the
minimum and maximum expectations, the perceptions and experiences that clients
entertain with regard to their home libraries. The data thus assembled is then be
processed and a report of the findings may then be made for the library.
According to the Association of Research Libraries (2005), the goals of LibQUAL+TM are
to:
UUnniivveerrssiittyy ooff PPrreettoorriiaa eettdd,, SSmmiitthh CC CC ((22000066))

Chapter 3 Research methodology
70
Foster a culture of excellence in providing library service
Help libraries better to understand user perceptions of library service quality
Collect and interpret library user feedback systematically over time
Provide libraries with comparable assessment information from peer institutions
Identify best practices in library service
Improve the analytical skills of library staff members so that they find it easier to
interpret and act on data
More than 600 libraries participated in the LibQUAL+TM 2005 survey between August and
September 2005. Participant libraries included colleges and universities, community
colleges, health sciences and hospital/medical libraries, law libraries and public libraries.
Some participated because they were members of some or other group. Others
participated as independents. In the purposes of this research I used only the section
that was relevant to postgraduate students. I incorporated only data obtained from that
section in my final analysis.
3.3.3.3.2 Design of the survey
The survey was available online. Links to the online survey were provided via the
Academic Information Service web page at http://www.ais.up.ac.za. The AIS Libqual+™
team sent an invitation to participate in the survey to all registered clients of the
Academic Information Service by means of e-mail. Access to the survey was available
both on-campus and off-campus. Each library was given a unique URL by means of which
it was possible to access customized questionnaires for that individual library that
addressed the specific needs and conditions of the library. The Academic Information
Service Quality Management Team, under leadership of Monica Hammes, took
responsibility for translating the questionnaire into Afrikaans so that an Afrikaans version
would be available in all South African libraries.
Twenty-two items were developed through several iterations of quantitative studies
involving a larger pool of 56 items. The items were identified in qualitative research
interviews with student and faculty library users at several different universities
(Association of Research Libraries 2005). The expected time to complete the survey was
10 minutes.
UUnniivveerrssiittyy ooff PPrreettoorriiaa eettdd,, SSmmiitthh CC CC ((22000066))

Chapter 3 Research methodology
71
In the final version of the survey, the following issues were addressed:
Physical library facilities (5 questions)
Library staff competence and attitude (9 questions)
Availability and accessibility of information resources (6 questions)
The responses of postgraduate clients to questions about the availability and accessibility
of specific online resources are of particular interest to this study and I shall address
them in chapter 4.
3.3.3.3.3 Sampling technique
All clients of the Academic Information Service were invited to participate in the survey. A
non-probability “volunteer” sampling technique was used to reach respondents in the
population. To encourage clients to participate, the Libqual+™ organisers offered a
“prize” of an iPOD as an incentive to one lucky participant whose name was selected by
means of an independent drawing process.
One disadvantage of volunteer sampling is that voluntary participants (as opposed to the
general population) may introduce strong biases (Statistics: power from data! n.d.). It
stands to reason that it is usually only people who care strongly enough about a subject
who will tend to respond. And if no limit is imposed on the number of calls that one
respondent can make, any person might, for example, be able to vote repeatedly if there
is no way of recognizing the respondent and limiting repeat calls. Repeat voting is also
more likely to happen if there is a prize to be won.
3.3.3.3.4 Distribution
Clients from the Academic Information Service were requested to complete the online
survey over a given period (August to September 2005). The survey was administered by
Monica Hammes and Gerda Beukes from the Academic Information Quality Management
Team.
The LibQUAL+TM survey was completed by 716 postgraduate students across faculties.
This figure (716) represents 25.06% of all postgraduate students enrolled at the
University of Pretoria at the time of the survey. As I mentioned above, an URL gave
potential respondents access to the survey through the library web page of the University
UUnniivveerrssiittyy ooff PPrreettoorriiaa eettdd,, SSmmiitthh CC CC ((22000066))

Chapter 3 Research methodology
72
of Pretoria. The same URL was e-mailed to all registered clients of the Academic
Information Service.
3.3.4 Processing and analysis of data
The data collected through the research instruments was analysed according to the
procedure proposed by Vithal and Jansen (2003, p. 27). This involved the following steps:
1. Scanning and cleaning
The data was read
Incomplete, inaccurate, inconsistent or irrelevant data was checked
Preliminary trends were identified “to facilitate the organization of the
data into meaningful ‘chunks’” (Vithal and Jansen 2003, p. 27)
2. Organizing
The data was then:
Counted
Coded
Entered
Checked
Compared
Categorized
3. Re-presenting
The results were re-presented as:
Tables
Graphs
Statistical summaries
The data from the questionnaires was processed by Statomet (Department of Statistics,
University of Pretoria). Data was manually entered by a data typist from the Department
of Statistics (Statomet). It was then coded, entered and checked according to a statistical
analysis package called SAS. Charts were extracted from SAS, and the data was cross-
tabulated to see if there were any statistically significant relationships between the
different variables.
Respondents’ answers from the LibQUAL+TM survey were electronically forwarded to a
central database. There it was analysed by the SPSS statistical software of the
UUnniivveerrssiittyy ooff PPrreettoorriiaa eettdd,, SSmmiitthh CC CC ((22000066))

Chapter 3 Research methodology
73
Association of Research Libraries. A report in which users’ desired, perceived and
minimum expectations of the service were reported was then made available to the
Academic Information Service. Feedback on this survey was given to staff members and
clients of the Academic Information Service by means of an electronic newsletter. The
winner of the iPOD was also announced electronically.
3.4 Validity and reliability issues
3.4.1 Validity
Validity refers to how well (if at all) the methods, approaches and techniques used
actually relate to, or measure, the issues that have been explored (Blaxter, Hughes and
Tight 2002, p. 221). The validity of these research findings were checked by:
Comparing findings of the pilot questionnaire with findings from the final
questionnaire
Comparing findings from the questionnaire with findings from the literature survey
and user survey (triangulation)
Observing the validity of statistical relationships between variables within the
questionnaire by means of the Chi-Square (see Addendum G) (Vithal and Jansen
2003, p. 33).
3.4.2 Reliability
Reliability refers to how well the research project has been carried out, and whether it
has been carried out in such a way that, if another researcher were to look into the same
questions, he/she would arrive at essentially the same results even though the actual
circumstances of such an iteration would obviously be very different (Blaxter, Hughes and
Tight 2002, p. 221).
According to Statistics: Power from data! (n.d.), reliability cannot be measured in non-
probability sampling. The only way to ensure data quality is by comparing some of the
survey results with available information about the population. Since the sampling
techniques used for both the questionnaire and the survey were non-probability sampling
techniques, it was not possible to measure reliability. The quality of the data was tested
against what was found in the literature, and by comparing the results of the
questionnaire and the survey with each other (triangulation). This comparison proved
UUnniivveerrssiittyy ooff PPrreettoorriiaa eettdd,, SSmmiitthh CC CC ((22000066))

Chapter 3 Research methodology
74
that the study is reliable since major similarities were observed in the data results. I shall
discuss this further in chapter 5.
3.5 Ethical issues
Prior to the launch of both the pilot questionnaire and the final questionnaire, the
informed consent of both Dr Jan Nieuwenhuizen, Co-coordinator of Postgraduate Students
of the Faculty of Education, and Professor Jonathan Jansen, Dean of the Faculty of
Education, University of Pretoria, were obtained (see Addendum B). I also obtained the
informed consent of the Academic Information Service to use the data from the
LibQUAL+TM survey for this study (see Addendum E).
Other ethical issues in administering and processing the questionnaire and survey were
dealt with in the following ways.
There were no participation criteria for age, gender, or race.
Participation in the survey was completely voluntary for students.
Respondents were fully briefed about the purpose of the research.
Sensitive or controversial issues were treated with the necessary discretion and
without sacrificing the validity or reliability of data obtained during the study. No
question that could possibly offend students was asked, and anonymity was
completely guaranteed. All responses were treated with confidence. Throughout
the report, data were presented in such a way that no meaningful connection
could possibly be made between the identity of respondents and the published
data.
Data generated through this research becomes the property of the University of
Pretoria.
3.6 Limitations of the research
Any examination of this study needs to be understood in the context of the results and
analysis of the data. Since the data represented in this study is from a survey conducted
among postgraduate students at the Faculty of Education alone, the danger exists that
the data may be one-sided. I shall therefore claim no generalisability for these research
results. The limited scope of this study made it impossible for me to conduct this study
among all postgraduate students enrolled at the University of Pretoria.
UUnniivveerrssiittyy ooff PPrreettoorriiaa eettdd,, SSmmiitthh CC CC ((22000066))

Chapter 3 Research methodology
75
And since a large proportion of the sample who participated in the questionnaire were
first year postgraduate students, their needs were perhaps not yet necessarily very
clearly established.
Another limitation of this study is that it was not possible to involve all postgraduate
students enrolled in the Faculty of Education at the time of this study. The alternative
was to use those who were available. This was a smaller group who represented 28% of
all the postgraduate students in the Faculty of Education. The respondents who did
participate represented only 25% of all postgraduate students in the field of Education
and 6.16% of all postgraduate students across disciplines enrolled at the University of
Pretoria. This response rate falls within the expected response rate of 25 to 33% as
indicated in the LibQUAL+TM 2005 Survey report.
Because students’ needs change rapidly, not only from one generation to another, but
nowadays from one intake to another, each group of postgraduate researchers begins to
study with a different set of needs and expectations. It is highly likely that the results of
this same survey would produce rather different results even one or two years from now.
This kind of survey should therefore be conducted frequently by the Academic
Information Service so that they can keep in touch from year to year with the changing
needs of its dynamically changing client base.
In future surveys, however, the questions will have to be expanded and made specific to
each possible need that the students might have because it only became clear to me
afterwards that students are not always aware of what they need until they are
specifically asked about the need in question. Many students are also not aware of what
tools, support and forms of technology are available in the rest of the world but they are
yet catered for in their own library. It is therefore impossible for them in most cases to be
aware of a need to which they have never before been exposed. It would also be illogical
to expect them to be able to make comparisons between what they have access to and
what other tools and services might address their needs in a more effective and efficient
way – if the latter are as yet unknown to them.
3.7 Summary
In this chapter the study was contextualized. A conceptual framework was provided
within which the research problems were addressed, and the data collection instruments
and procedures were discussed. Data obtained from both the survey and the
UUnniivveerrssiittyy ooff PPrreettoorriiaa eettdd,, SSmmiitthh CC CC ((22000066))

Chapter 3 Research methodology
76
questionnaire proved to be valid. Ethical issues were discussed and the limitations of this
research were analysed.
Various categories of needs were identified by means of a conceptual model for this study
that provided a framework for the identification of specific eScience tools and applications
that support:
Primary data sharing
Transfer of data and computation
E-Access
E-Communication
E-Training
E-Publishing by research/postgraduate students
UUnniivveerrssiittyy ooff PPrreettoorriiaa eettdd,, SSmmiitthh CC CC ((22000066))