university of nigeria pauline_ uche _n_1998... · university of nigeria research publications ......
TRANSCRIPT

University of Nigeria Research Publications
UZOBUIKE, Pauline Uche .N.
Aut
hor
PG/MBA/93/18144
Title
The Incidence of Brand Loyalty among
Consumers of Cocoa Food Drink in Enugu Metropolis
Facu
lty
Business Administration
Dep
artm
ent
Marketing
Dat
e May, 1998
Sign
atur
e

DEPARTMENT OF MARKETING FACULTY OF BUSINESS ADMINISTRATION
UNIVERSITY OF NIGERIA 1
ENUGU CAMPUS
. . :$ :>5 ...,. ::i ::$ i:! 3 T> .. ,. ij< $' . $ i:i( i'if ;$ .;::: ... ? ;:$ :,::: ::::; :I:!: ..... :fi ..A :*a ;$ .:.>
:i ;;$ 3 .:? .... ... (

THE INCIDENCE OF BRAND LOYALR AMONG CONSUMERS OF COCOA FOOD DRINK IN ENUGU METROPOLIS
P
UZOBUIKE PAULINE UCHE NONYE (PUN)
PG - MBA- 93-18144
DEPARTMENT OF MARKETING FACULTY OF BUSINESS ADMINISTRATION
UNIVERSITY OF NIGERIA ENUGU CAMPUS

THE INCIDENCE OF BRAND LOYALTY AMONG CONSIYMERS OF COCOA FOOD DRINK IN ENUGU METROPOLIS
UZOBUIKE PAULINE UCHE NONYE (PUN)
PG - MBA - 93 - 18144
A DISSERTATION SUBMITTED IN PARTIAL FULFILLMENT OF THE REQUIREMENT FOR THE DEGREE OF MASTER OF BUSINESS
ADM INlSTRATlON (MBA)
FACULTY OF BUSINESS~ADMINISTRATION UNIVERSITY OF NIGERIA
ENUGU CAMPUS
MAY 1998

CERTIFICATION
We certify that this dissertation: THE INCIDENCE OF BRAND LOYALTY AMONG CONSUMERS OF COCOA FOOD DRINK IN ENUGU METROPOLIS is an original work written by Uzobuike Pauline Uche Nonye (Reg. No: PG/MBA/93/18 144) and was carried out under our supervision.
I /
- - / ' 8'
D.A. NNOLIM (MRS.) PROJECT SUPERVISOR HEAD OF DEPARTMENT

w
. ,
D E D I C A T I O N
TO M Y MOTHER MRS. G. UZOBUIKE
AND
M Y BROTHERS KEN AND ANTHONY
AND
M Y SISTERS EKWY, COMFORT & EBELE
FOR ALL YOUR LOVE AND PATIENCE.

ABSTRACT kr
This study is concerned with the incidence of Band Loyalty, the . .
basis and extent of such loyalty in the food drink market.
Given the background of the problems, the stud
1. To determine the existence and extent of brand
consumers of cocoa food drinks.
y sought to:-
loyalty among
2 . To determine the influence of prices of the products on brand
loyalty.
3. To determine the extent consumer perception of the attributes
of the food drinks 'influence brand loyalty, for particular brands
(Attributes includes such things as taste, milk content, sugar .
content, dissolvability, nutritional value).
4. To ascertain the extent company image and brand name
inliuence brand loyalty. I
5. To establish whether consumers can identify their most
preferred brands, that is to say, to know if consumers
perceived difference are real or a mere psychological
phenomenon.

To achieve the above goals, the following f ivf jworking
hypotheses were formulated. . P
Cocoa food drink consumers are loyal t o particular brands.
Price is an important influence in the choice and loyalty for
cocoa food drinks.
Consumers perception of the quality of food drinks have
significant impact on brand loyalty.
Company image and Brand Name contribute significantly t o
consumer's loyalty t o particular brand.
Consumer's can identify their favourite brand in a Blind Taste .
Test.
Following an exploratory survey in the markets and
superstores, the study was restricted t o six popular brands. These
include Bournvita, Ovaltine, Milo, Nescoa, Vitalo and Pronto. With ,
the aid of a computer, t w o classes of data was analysed to attain the
research objectives.
' 1. Consumer survey: This comprised of 270 respondents
randomly selected for testing of Hypotheses I - IV.

3. A laboratory Experiment (Blind Taste Test) corpiucted on 150
selected group of consumers.
In both cases, responses to most of the questions were ordered
on a five points rating scale. The weighting system was employed to
convert the qualitative responses to quantitative variables amenable 3
to statistical tests.
The T-test for testing the equality of proportions as well as the
use of Analysis of variance (wi th F-Ratio as the test statistics) was
employed in testing hypothesis I - II. Hypothesis Ill was tested using
the Analysis o f variance and pairwise comparison while Hypothesis IV
was tested using the multiple regression analysis. The Blind Taste
Test data for testing of Hypothesis V was analysed using the
chi-square statistics.
Accordingly the major findings were as follows. f
1. The consumers of cocoa food drinks are to a reasonable extent,
loyal to particular brands. .In every ten consumers of cocoa
food drinks, six o f them are loyal to particular brands.
2. Price o f the various brands exerts significant influence on the
loyalty of.consuniers. The study did not establish any

vi
relationship between the income of consumers and the extent
of influence extorted by price. , .
Consumers have basic expectations in their favourite brands
and are no t naive as advertisers would want us believe.
The order of importance of the attributes to consumers is as
follows:-
Nutritional value
Milk content
Taste
Sugar level
Dissolvability
j Name is an important influence on consumers loyalty to
particular brands however company image is not considered
important. *
The claim to be loyal is real as consumers can identify their
most preferred brand when disguised. ,
Consequently, the study poses the following implicators for
decision makes.
vii
Hard times await new entrants into the food dri& market because
of the existence of brand loyalty.
Brand managers should further ascertain what encourages and
sustains loyalty so as to exploit such attributes.
Since even loyal consumers are sensitive to price differences, the
excessive hiking of brand prices may not be a sound marketing
decision by brand managers.
Most consumers consider the nutritional value of brands very
important and as such it should be emphasized seriously in
advertising. NAFDAC and other decision makers should ensure
hiy h Nutritional standards. I
Brand Name is very important in maintaining loyalty. Brands with
known high performance in quality should be consistent in
maintaining such quality to maintain loyalty.
Since company image is not considered important, even
established and well known companies may not find it easy
introducing new brands successfully.
It is the sincere hope and belief of the researcher that this study I
provides the honest view of consumers in the food drink market and such

. . . Vlll
provides the participants the guidelines for increasingand sustaining their
market share through improved brand patronage and loyalty.

PREFACE
As competit ion heightens in the food drink industry, managers
are faced wi th the great .challenge of not just expanding their market
share but retaining their market share. The stringent economic
programmes of the country leaves the consumer w i th little or no
disposable income, which is spent where it has the maximum util i ty
The antidote for survival is for companies t o assess the level of
loyalty that their product has and what consumers actually want in
products t o keep them buying it. A good manager actually
understands that a 20% loyal ' market share is better than 35%
non-loyal market share. Thus such companies wil l invest heavily in
keeping the loyal customers.
This study is 'a practical investigation of the level of consumers
existing loyalty t o some Brands of food drinks. I t is also interested in
the various attributes on which loyalty is predicated. ' .
The study opens w i th chapter one which expounds the core
problem of the study, the objectives of the study, the working C
I
hypothesis and the significance of the study.

Chapter t w o deals wi th review of relate$ literature. The
working hypothesis listed in chapter one were given both theoretical
and conceptual framework.
Chapters three and four deals wi th the research methodology
and design, presentation and analysis of data respectively. The
section on discussion of results seeks to relate the findings of the
result to other empirical evidences where applicable as well as
tlieoretically conceptualising them.
The concluding chapter five summarises the 'f indings noting
their implication and suggestion of areas for further research.
The obvious limitations of this project should be considered as
the reader appraises the project. . .
1. The study is limited to Enugu metropolis only
2. The study is also ,a measure of attitude which is rather diff icult
to measure.
UZOBUIKE P.U.N DEPT. OF MARKETING FACULTY OF BUSINESS ADMINISTRATION r
UNIVERSITY OF NIGERIA ENUGU CAMPUS.

ACKNOWLEDGEMENT
I wish t o express m y sincere appreciation t o all whose efforts,
comments and pieces of advice were of tremendous help in
completing this project.
I am highly indebted t o my Supervisor Mrs. Nnolim who
painstakingly read through every piece, made useful suggestions and
insisted on high professional and ethical standards. Thanks so much.
I also appreciate greatly the input made ,by my lecturer Mr. 0.
Akabuogu of O'Kris Management Consultants who provided a guide
on the appropriate analytical methods employed in data analysis. Mr.
Nwaizuybe's (of Marketing Dept. UNEC) contribution to the sucessful
completion of this work is invaluable. When morale was down and I
almost gave up, he gave the necessary encouragement and guidance
needed to go on.
Worthy of note also is the important role played by some of m y
colleagues at Queen's School
Mrs. Omeh etc and some
successful carrying out of the
Enugu - Miss Udeozor, Mrs. Ndunagu,
of m y students
Blind Taste test.
who helped in the
I

xii
I cannot forget all manner o f encouragement ,and prayer
support given by m y most worthy friends, Dr. & Mrs. Sam Ikeh. God
bless you.
Finally 1 want t o appreciate the love and support given t o me
by my sisters Ekwy, Comfort and Ebele and my ever l ov i ng brother
Kenneth. I love you all.
Now unto the King enternal, immortal invisible, be all the glory
for ever and ever for indeed, I owe it all to Jesus.
UZOBUIKE P. U. N.
DEPARTMENT OF MARKETING
FACULTY OF BUSINESS ADMINISTRATION
UNIVERSITY OF NIGERIA ENUGU CAMPUS

TABLE OF CONTENTS
CERTIFICATION
DEDICATION
ABSTRACT
PREFACE
ACKNOWLEDGEMENT
TABLE OF CONTENTS
LIST OF TABLES
APPENDICES
Chapter I INTRODUCTION
1.1 Definition of Problem
1.2 Objectives of the Study
1.3 Hypotheses
1.4 Si,jnificance of the Study *
1.5 Limitations of the Study
Chapter II REVIEW OF RELATED LITERATURE b
2.1 Purchase Decision'Making, A Choice, Not a Chance
2.2 Habit Purchase and Brand Loyalty
2.3 Models of Consumer Behaviour
PAGE
I
I I
... I l l
ix
xi
xii
xvi
xvii
1
4
8
9
10
11
1 4
14 I

xiv
and Consumer Learning,
2.3.1 Marshallian (Economic) Model *r
2.3.2 The Pavlovian (Learning) Model
2.3.3 Freudian (Psychoanalytic) Model
2.3.4 A Contingency Approach
2.4 Theoi-etical Framework
Chapter Ill RESEARCH DESIGN AND METHODOLOGY
3.1 Scope of the study
3.1.1 Area Covered
3.1 .2 Rationale
3.1.3 Brands Covered
3.2 Sources of Data
3.2.1 Secondary Sources of Data
3.2 .2 Primary Sources of Data
Chapter IV PRESENTATION AND ANALYSIS OF DATA
4.1 Introduction
4.2 Consumer Survey Resul-ts
4.3 Blind Taste Test (Experiment) Results
4.4 Discussion of Results

4.4.1 Existence of Brand Loyalty
4.4.2 Price and Brand Loyalty
4.4.3 Consumers Perception of Attributes
influence on Loyalty
4.4.4 Brand Name, Company Image
and Brand Loyalty
4.4.5 Reality of Consumers Preferences.
Chapter V SUMMARY, IMPLICATIONS, RECOMMENDATIONS
CONCLUSIONS AND AREAS FOR FURTHER RESEARCH
5.1 Surnrnary of findings
5.2 Implications of the study
and Recommendations
5.3 Areas for further Research
5.4 Conclusion ,
Bibliography
Appendix

xvi
LIST OF TABLES w
Table 4.1 Response Ratio of Survey Questionnaires
4.2 Usage Ratio of Returned Questionnaire
4.3 Blind Taste Test Questionnaire Usage Ratio
4.4 Consistency of Consumers Purchase
Pattern Classified into two .
4.5 Consumers Preference Ranking
of Brands of food drinks
4.6 Consumers Responses on
degree of price Influence.
4.7 Consumers Responses on Price
influence classified into t w o proportions.
4.8 Degree of price influence on consumers in their
choice of Brands according t o income groups. 6 1
4.9a Consumers Perception of attributes - means
of attributes.
4.9b Anova Table for means of attributes
4.1 0 Pairwise comparison of means of attributes
4.1 1 Relationship Between Brand Loyalty and Brand

xvii
Name and Company Image Multiple
Regression Table.
4.1 2 ldentification of most preferred brand.
4.1 3 Consumers Preference Ranking of
Brands before and after the Blind taste Test. 69
4.1 4 Weighted ~on&mers Preference Ranking
of'Brands before and after the Blind Taste Test. 71
A . l Overall Preference Ranking of brands of food drinks. 1 0 4
A.2 Degree of Price influence on Consumers. 1 0 6
A.3 Frequency distribution of degree of importance 1 0 8
attributes in choice and preference of brands. ,
Table A.4 Identification of most preferred brand. 1 1 0

LIST OF APPENDICES Y
Appendix IA Consumer Surrey Questionnaire' 95
IB Blind Taste Test Questionnaire 101
Appendix I 1 Testing of Hypotheses 103
IIA Testing of Hypothesis I 103
IIB Testing of Hypothesis II
IIC Testing of hypothesis Ill
1ID Testing of hypothesis V ,

CHAPTER ONE M
INTRODUCTION
Hurnan behaviour is enormously varied and very complex and is
predicated on attitude, learning and habit. Consumers learn from past
experience and future behaviour is conditioned by such learning.
Marketers, the world over differ considerably in their prediction of
human behaviour.
The whole marketing effort is generally centred on the
consumers. This is implied in the marketing concept echoed by most
rliarketers which is consumer satisfaction at a profit as the basis for
s~~ccessful marketing. In their varied description of consumers as
Levitt puts it, some people describe consumers as 'unpredictable,
varied, fickle, stupid, shortsighted, stubborn and generally
bothersome". This does 'not however in any way make the
consumers less important. Therefore the consumer is still of utmost
consideration in the planning of the marketing mix or any other ( maiketing effort. Product branding is one of such marketing effort!

Products are branded for many reasons one of which is
identification of the products. Today most of the products are
purchased under some particular brand. This contrasts with what
obtained when products were once considered simply as commodities 3.
in the early days of marketing. Commodities or goods are
differentiated only by their uses and not by their suppliers. Todays
marketers recognize that the total product is greater than simply the
physical good itself and believe that all goods and services can be
distinguished by their own unique qualities.
A products brand carries good deal of information, reducing or
eliminating the need to find out about a product before buying it.
Corisilmers confronted with a familiar brand have information about
the products image, as promoted by the company. Even products that
are very similar are now considered distinguishable by brand.
Consumers perception of different brands of various product
categories determine to a large extent their buying pattern. Ehrenberg i
and Goodhart claim on the basis of their evidence 'that buyers choose \
I
from a repertoire of brandsf2 . However O'shaughnessy comments on

the above claim that "different brands bought at different times could
reflect different occasions, temporary changes in taste or family or
wants rather than picking from a repertoire of brands with
indifference as to which brand is b ~ u g h t ' ~ , . Compete acceptance of
what Ehrenberg and Goodhart advanced is accepting that their is no
brand loyalty. If indeed, there is no brand loyalty, in the buying
pattern of consumers, then one of the main purpose of branding is &
defeated.
Other researchers are of the view that consumers gain
experience in purchasing and consuming products, they learn what
brands they like and do not like and the features they like most in
particular brands. The consumers adjust purchase behaviours based
on past experience. The existence of brand loyalty among consumers
of a product or non-existence of it thereof could depend on the extent
of consumers covered, the product under consideration and the
approach employed in the search for this important consideration in
product marketing. I

This study seeks to find out the existencesr non existence of
brand loyalty among the coca food drinking industry. The researcher
is not oblivious of the fact that brand loyalty is an exhibition of
corlsumers attitude to products which is somewhat difficult to
rncasure. However it is believed that just as David Reibstein puts its,
the buying pattern of the product, and the proportion of purchase a
particular brand bought are indications of brand loyalty4.
1 .1 DEFINITION OF PROBLEM
The coca food drink industry in the country is experiencing a
continuous increase in the number of brands competing for
corwmers income. From the story of importation of Ovaltine in the
early thirties as the only food drink in the country, there has been a
continual increase in 'the number of cocoa food drinks in the country.
Today there are no less than eight different brands of cocoa food
drinks available in the market.
In those early days, the beverage market was the seller's I
market. Initially it was only ovaltine, unit 1937 when Cadbury Fry

Export Limited, a British company imported into Mgeria the first cans
of Bournvita competitively on a commercial scale. Ovaltine was then
the leading brand. But because it was imported as a wholly finished
product, it lost its position to Bournvita following the ban placed on
the inlportation of beverages at the beginning of the Nigerian civil
War in 1967.
Bournvita and Pronto, both products of Cadbury Nigeria
Limited, dominated the market for a long time. Consumers were
multiplying, buying more of the brands. However new firms have
continued to enter to the extent there are at least seven firms (with
local plants) each producing different one or more brands of instant
food drink. The entire dominations of the market is now more of
history. It is therefore unrealistic for any company t o rest on a mere
assumption of market leadership without considering the changing I
market share.
In todays factored market place, things likebranding products,
and market share for instance no longer quarantee loyal customer. Iq
one case after another, the old established brands have been

supplanted by the rise of other brands. No singlefiompany can claim
largest share of any product market in a competitive environment.
These days, the idea of market share is a trap that can lull business
people into a false sense of security. Managers should wake up every
morning uncertain about the market place because it is invariably
changing.
Companies should however not be caught in the excitement of
selling things just to increase their market share. As Regis Mckenna
(1991) puts its, the real goal of marketing is to own the market, not
just to make or sell products6. Smart marketing means defining what
of the whole pie is yours. This is not just an issue of defining your
market share. The company should rather be sure what share of the
market are loyal to. their product(s). Stopping at the idea of market
share "turns marketing into an expensive fight over crumbs rather
than a smart effort tb own the whole pien6.
Owning the market demands some responsibilities such as
bringing into your camp third parties who want to develop their own I
products, or offer new features or add-ons to augument your product.

ilu
You get the first look at new ideas that others are testing in that
market, you attract the most lalented people because of your
acknowledged leadership position. This is why it has become
necessary to investigate the existence or otherwise of brand loyalty
among the consumers of cocoa food drinks in Enugu Metropolis.
Accordingly therefore, the major research questions are:
Are the consumers of cocoa food drinks in Enugu loyal to
particular brands and to what extent does such loyalty exist?
To what extent does price of the brands influence loyalty to a
particular brand?
Does consumer perception of attributes or quality of the brands
influence loyalty?
What role does company image and brand Name play in the I
promotion of loyalty t o particular brands.
the minor problem addressed by the study is;
Can the consumers really identify their preferred brands in a .
blind taste situation I

P
1.2 OBJECTIVES OF THE STUDY
The research is basically directed towards the investigation of
an existence of brand loyalty or not among consumers of cocoa food
drinks. To this end, therefore, the objectives of the study is to seek
and possibly find solutions to the problems identified above; the
extent and basis of consumer loyalty.
Specifically, the objectives are
To determine the existence and extent of brand loyalty among
consumers cocoa food drinks.
To determine the influence of price of the products on brand
loyalty.
To determine the extent consumer perception of the attributes
of the food drinks influence brand loyalty for particular brands.
(Attributes includes such things are
(i) Taste
(ii) Milk Content
(iii) Sugar Content
(iv) Dissolvability

(v) Nutritional value *r
To ascertain the extent company image and brand name
influence brand loyalty.
To establish whether consumers can identify their most
preferred brands.
HYPOTHESES
The following hypotheses will be tested to determine the
existence of brand loyalty among consumers.
Cocoa food drink consumers are loyal to particular brands.
Price is an important influence in the choice and loyalty for
cocoa beverage P.
Consumers perception of the quality of the food drinks have I
significant impact on brand loyalty.
Company image and brand name contribute significantly to
consumers loyalty to particular brands.
I Consumers can identify their favourite brands in a Blind Taste
Test.

1.4 SIGNIFICANCE
10
OF THE STUDY
The percentage of consumers of cocoa food drinks continues t o
drop as the economy becomes tougher and general inflationary trehds
continue to increase the poor performance of companies. Brand
loyalty therefore becomes important in the managerial areas of
marketing mix and market research. This study will therefore be of
immense significance t o firms in the industry in the area of
manipulation of their market share, price changes of products,
investment in Research and Development and improvement on the
quality of the products.
The various positions of the brands in the perception of the
consumers will emerge and enable them to assess their relative
position as leaders, followers and nichers in the industry.
The study will also be of great benefit to the advertising
agencies, the print and electronic media whose input in the promotion + ' .
of those products depends so much on the market position of the
product.

Also to benefit from this study are coppanies seeking to
introduce new products. With the identification of existence of brand
loyalty or not among consumers and the factors contributing t o it, the
company can now find out a suitable unique selling proposition (USP)
to use and appeal to their desired target market. This will also enable
them decide whether to enter the market competing with the leaders,
or be a follower or even nichers in the industry.
Finally the study will also be of great benefit to distributors and
retailers who will be opportuned t o know the popular brands by the
consumers assessment and take advantage of it in stocking their ,.
inventory.
1.5 LIMITATIONS OF THE STUDY
This study is. restricted to Enugu Metropolis and since brand
loyalty is an attitude and behavioural measurement, the findings .
cannot be generalised t o other environments which might be I
influenced by other factors in their environment.

The researcher also will choose the samplp for the survey on
the assumption that the brand choice of the cocoa food drinks
purchased were made by such respondent.
The blind brand identification test will also be carried out Qqsed
on the questionnaires returned and the participants will be qqwn
form only those who are willing and within the environrnenr ~f the
researcher.

NOTES TO CHAPTER ONE
1 . Theodore Levitt, 'Marketing Myopia', Harvard Business Review
(July - August) p 60
2 . John O'Shaurghnessy, Competitive Marketing 2nd ed,
(London: Briddles Ltd, Guildford and King's Lyn 1988) P. 109.
3. l b i d p 1 0 9
4 . David J. Reibstein, Marketing Concepts, Strategies and
Decisions, (Englewood Cliffs, Preentice Hall Inc 1985)
~ ~ 2 8 4 - 2 8 5 .
5 . Regis Mckenna, Marketing is Everything Harvard Business
Review (Pagerback No. 900087) p8.
6. Ibid p 8
CHAPTER W O tr
REVIEW OF RELATED LITERATURE
2.1 PURCHASE DECISION MAKING: A CHOICE NOT CHANGE
A lot of marketing efforts over the years are channelled A
towards unravelling of what goes on in the buyers black box.
Researchers have explored factors that determine the choice of a
particular information processing strategy. Prominent among them,
Oshvalsky and Richards proposed that the eventual strategy
employed is contingent upon characteristics of the consumer, the
market place, the social environment and the physical environment'.
Several models of the traditional decision making perspective
have been developed by marketing .scholars, the most prominent
being proposed by Seth2, Nicosia3 and Enge14 et al. Though they
vary in details, there are five stages which consistently occur;
problem recognition, information search, evaluation of
alternativeslbrand evaluation, purchase decision and post purchase
behaviour. en;^ Assael outlined the details of the processes thk . .
consumer passes through at each stage5. The first stage of the
traditional decision model is the need arousal stagsand this describes
the consumers state of mind which is his 'psychological set' toward
the prospective purchase. Consumer's psychological set is based on
the product benefit and his attitude towards the various brands.
The hierachy of effects model of decision making shows that
the consumer goes through sequential stages involving 'thinking'
(belief) 'feelings' (evaluation) and 'action' (the intention to buy the
brand). Also important in the buyers psychological set is the benefit r
criteria. This is important in deciding which brand to buy. Depending
on he product class, there are various attributes which consumers
consider important. For example in
Beer - Taste, alcohol content and price
Tooth paste - Taste, foaming, price, dental protection, (fluoride
content) and colour. . Powdered milk - Dissolvability, taste, price, congealability
Cocoa food drink - Milk and sugar content, dissolvability, nutritive
value, taste and price.
Non-alcoholic soft drinks
I
- Taste, price, brand name.

Need recognition prods the consumer to e m a r k on information
search and this involves exposure, organisation and search for
information. Consumers information search varies directly with the
extentof consumer involvement and daces the consumers attention to
[he marketing stimuli - which has to receive attention, be
comprehended and retained in memory t o be able t o affect consumers
psychological set. The consumer first recognizes the whole
information and clooses the one related to his particular need. The
message having been understood is interpreted t o agree with their
beliefs. However the consumer choose t o retain only those things that
are considered important to him in the need satisfaction. There may
or may not be any need for further information kearch.
Brand evaluation is a direct consequence of information search.
Various brands are associ&ed with different benefit critieria and
consumers will choose brands considered to offer those benefits. The
consumer evaluates the brands based on histher priority of desired
I)c~lefits and relates the brand characteristics to these benefits. Thy
outcome of brand evaluation is the intention to buy. The final

sequence in the complex decision making mod* is purchasing the
intended brand, evaluating the brand during consumption and storing
this informations in the psychological set.
The above sequence and details were corroborated by Lutz and
Bettman who summarily said that t o reach a purchase decision, the
consumer actively weighs alternatives and expends a great amount of
cognitive efforte,
The extent of cognitive effort expended in the decision making
process depends on the level of involvement of the product.
According to Assael, high involvement products are those that are
>
important to the consumers, products that,are "closely tied to the
consumers ego and self image" and involve some reasonable amount
of risk to the consumber7. Low involvement purchase is one where
the consumer does not co'nsider the product sufficiently important to
Ilislher belief system and does not strongly identify with the pq~duct
most purchase decision are low in consumer involvement and a$ such
does not involve much cognitive effort in making a choice a( the \
brands.

The low involvement theorists partic~larly~argue against an
across the board generalizaton of the models of decision making. To
them the purchase decision making can best be approached using
models of passive learning. The basis of their argument explains
Solomon is that consumers 'conserve cognitive effort' when choosing
form among products not central to their belief system or having little
risks or valueg. The phenomenon of impulse purchase lends credence
to this view.
One cannot say yet if food drink is a low involvement or high #.
involvement product. But because only a small, portion of income is
expended on them and because there seem to be little functional
differences in the brands the indication is that it may not be a high
irwolvement product. The study by Kapferer and Laurent reveal that
consumers level of involvemeht with a product depends not j p t on
risk of wrong choice, amount of income spent or even un~ertainly ,
about the product but also on product imq~ r t an~e to the particular
consumer, interest, badge value and emotjor\'P, 1

The above line of thought therefore implie$that if may not only
be the proportion of income or risk that classifies a product as low or
high involvement one but other things such as interest and emotion
could play vital roles. Some other researchers bring in the idea that
product involvement could be situational or enduring depending on
the emotional attachment of the consumer t o the product. Both
si:uational and enduring involvement are likely to result in complex
decision making .This is why Celis and Oslon angues that emphasis
should be on the product itself and the inherent satisfaction its usage
provides rather than on some situational goals". Thus food drink can
by all implications be a high involvement product for some families,
but whether it is low or high in level of involvement; emotional >
attachment and interest can still lead t o a.complex decision making
process. This is true for mos! product categories.
From yet another dimension Vroom identified .three conditions
in choice behaviour12. First the consumer must have high
'expectancy' that the brapd will achieve the desired objectives., In
other words the product pharacteristics as perceived by the consumer

must be seen as sufficient to facilitate the attainment of the objective.
Secondly the objective must be perceived to have instrumentality,
that is, must be seen as'resulting in the attainment of desired end 1
goals.
Finally, the 'valence' referes to the preference for attaining one
outcome over another. Thus valence implies that there exist for the
individual consumer, a meaningful preference hieraly. The argument
though is that this may not apply to low involvement products earlier
discussed.
The controversy of involvement not withstanding, there is no
doubt that before making a choice of a particular brand from
alternatives brands, the aroused consumer becomes alert to or
sometimes actively searches for information bearing on his need and ,
its gratification.
2.2 HABIT PURCHASE AND BRAND LOYALTI'
Habit plirchase is repeat purcha~e of a product due to,
consumer learning. According to As-l, habit purchase is the

opposite of complex purchase decision makingG3. In his opinion a
consumer finds little need for evaluating brand alternatives and prior
satisfaction with a brand leads to repeat purchases.
Oslon however believes the contrary about the level of
decision making involved in habit purchases.14 He opened that even
when little consideration is given to other brands, cognitive activity
must occur; decisions has to be made about where and when'to
purchase the product, some knowledge of the product and its
availability must be activated from memory. The implication of this
therefore is that no purchase decision is really a chance.
Several authors differ in their opinion of consumers exhibition
of habit purchases. These authors describe the habit purchase
patterns as brand loyalty, inertia or brand committment. Assael
defines brand loyalty 'as repeat purchaselbuying because of
committment to a certain brand and inertia as repeat purchase
without committment to the brandl5' There hqs to be a level of
comittment. for a consumer to be brand loyal. Inertia on the other
hand is developed habit purchase due to consumer passive learning

especially for low involvement products as develcped by Krugman. In
a simple illustration using morton salt, the author describes a
consumers response to the salt advertisement. Initially, as the
consumer is exposed to the advertisement, there is no evaluation of
the advertisement since the consumer is not highly involved.
However, overtime, due to repeated exposure, the consumer begins
to associate some pieces of information picked up casually and stored
in the information set with the salt. The consumer may therefore
repeatedly buy Morton salt not because of commitment to be brand
but mere familiarity and acceptance. - - . . _ _
Another author, described "Brand loyalty as the biaqed (ie non
random) behavioural response ie purchase expressed over time by
some decision making unit with respect to one or more alternative
brands out of a set, of sudh brand and includes a stFong positive
attitude toward the brand"16. Brand commitment on the other hand is
defined "as emotional/psychological attachmeqf to a brand within a
product class"!'. The author considqp Brand loyalty more of repeat
purchase behaviour and different frqp brand commitment. This

contrasts with Assael's approach of considering b r p d commitment as
a basic ingredient of brand loyalty. In thish study however, the
researcher is focusing on brand loyalty as a combination of brand
commitment and/or inertia. leading to repeat purchase behaviour.
Another important consideration is the question of whether
brand loyalty is a behavioural and/or attitudinal concept. The
behavioural theorists believe that brand loyalty is a repeat purchase
behaviour with or without commitment. At this extreme, Tucker takes
a strong behavioural position' "No consideration should be given to
what the subject thinks or what goes in his central nervous system; 4
his behaviour is the full statement of what brand loyalty is ''. ,
)A e Some other authors like Loudon etallg, Peter OslonZO and Leon
L I .
Schiffman eta12' agree with Tucker that brand loyalty is summarily
described by repeat purchase behaviour. Repeat purchase behaviour
is assumed to reflect reinforcement and a strong stimulus - to -
response link. These researchers take the approach that uses
probabilistic models of consumer learning to estimate thepg&@ility I
of a consumer buying the same brand again given a nlynber of past

purchases of that brand. However what peoplg do, does not say
anything about why they do it.
This is why the cognitive learning theorists believe that repeat
purchase and frequency of purchase or even proportion of total
purchases lack precision since they do not distinguish between real L
brand loyal buyer who is intentionally faithful and the spurious buyer
who repeats a brand purchase because it is the only one available or
affordable. Jacoby strongly posits; "to exhibit brand loyalty implies
repeat purchasing behaviour based on cognitive, affective, evaluation
and predisposition factors - the psychological (decision making
evaluative) process" 22.
The argument of the cognitive approach to brand loyalty is that i
mere repeat purchase can not be synonymous with consumers who
are emotionally committed to a product. Day recognizes that
consumers might continue to buy the same brand because other
brands are not readily available, or a brand offers a long series of
price deals, or the consumer wants to minimize decisions making23 '
I
In a study where beha"ioura1 measures alone were used in predicting

brand loyalty, over 70% of the sample would h p e been defined as
brand loyal, but adding the attitudinal component reduced the
proportion of brand .loyal consumers t o less than 50%. In other
words, defining loyalty based on repeat purchases overstates the
degree of loyalty24
Tucker defined loyalty as three purchases in a row while
Lawrence defined loyalty t o a new brand as four purchases in a rowz5.
*,
The cognitive school of thought would not agree with the above
definitions completely. Assael still argues that the measurement of
1
brand loyalty based on past behaviour may be misleadingz6 In his
example, the consumer may buy one brand of coffee for personal
consumption, another brand for the spouse and occasionally a third
higher priced brand t o haQe around the house for guests. This
consumer may be highly loyal t o the preferred brand but this is not
obvious in the purchase pattern. Brand. lo;alty therefore is a
rnultidimensio~al concept that , must incorporate the consumer
i
commitment to the brand. The very term loyalty implies commitment
rather than just repetitive behaviour which suggest that there is need

for a cognitive as well as a behavioural concepts Even behavioural
theorists of brand loyalty concedes that there is a need for attitudinal
measure. This is clearly seen in O'shaughnessy's arguement on
measuring brand loyalty. The appropriate description includes both
behavioural and attitudinal views. This is therefore the line of thought
and basis of this study.
2.3 MODELS OF CONSUMER BEHAVIOUR & CONSUMER
LEARNING.
Consumer behaviour can be defined as those acts of individuals
directly involved in obtaining and using economic goods and services
including the decision process that precede i n d determined these
act2', or as the buying habits or patterns of behaviour of consuming
public either in general or in specific groups28 . Brand loyalty an
aspect linked to some behavioural models and learning theories. A
closer look at the concepts and marketing' implications of these
consumer behavioural models and learning theories will shade some I
light of understanding on developing and sustaining brand loyalty.

Kotter has identified five behavioural plodels for analysing
buyers namely:-
The Marshallian (Economic) model, the Pavldan (Learning) model) the
Freudian (Psycho-analytic) model, the Veblenian (Social -
psychological) model and the Hobbessian (organisational factor)
Only the models considered relevant to the concept of brand
loyalty will be discussed.
2.3.1 THE MARSHALLIAN (ECONOMIC) MODEL
This model proposes that purchasing decisions are the results
of largely rational. and conscious economic calculations. The
consumer seeks to spend his income on those goods and services
that will deliver the greatest utility according to his taste and relative
prices. This he does by carefully calculating and weighting the
expected pains and pleasures of every contemplated action. Thus he I
always trying to maximize satisfaction with his limited resources. The &
factors that influence the consumer therefore are likely to be price,
income and durability.
I

An obvious deduction from this model is that a man faced with
two brands of instant food drink which area identical in all respect
would definitely buy the cheaper brand. This consumer can only buy
the brand that costs more if and only if the later has any attribute or
quantity which justifies the extra expenditure on it. This is purely an
economic consideration and does not take into recognition any other
psychological variable which may motivate the consumer to buy the
more costly brand even when their perceived attributes are the same.
Suggested hypothesis from this model include.
1. The lower the price, the higher the sales and vice versa.
2. The lower the price of a substitute A, the lower the sales of B
and vice versa.
Many other studies have corroborated the marshallian
hypothesis. Number reports fhat demand equations based on price
have been fitted to a wide variety of products such as beer, chemical
and fertilizers3'. Massey also concluded that economic variables have
significant influence on brands such as coffee, orange juice and L
rnargatine3'. +

However economic considerations alonq, cannot explain the
behaviour of the consumer. The first hypothesis from this model
implies that an increable in price will lead to a fall in sales. This is not
always the case and this is why the model is criticised for ignoring
the fundamental questions of how product preferences are formed.
The other mysteries involved in consumer choice and not taken into
consideration rather, it becomes ambiguous ,,when it says that the
consumer acts in his ,own best interest. This is rather too wide a
saying and as such neither true nor false.
2.3.2 THE PAVLOVIAN (LEARNING) MODEL
This model which comprises of classical and instrumental
conditioning was pioneered by Pavlov, a Russian Psychologist who
performed experiments on' dogs. The model is based on the
conditioned reactions of dogs to bells rang before they were fed. A . variant of classical conditioning was instrumental conditioning by B.F.
Skinner who introduced an aversive stimuli of electric shocks to the i
food-bell response of the dog.

Both Parlov and Skinner concluded that leqqing is an 3.
associative process based on four learning concepts.
a. Drives: Motives or Needs: These refer to strong internal stimuli
or dissatisfaction to the individual which impels action.
b. Cues: These are weaker stimuli in the environment and/or in
the individual which determine when, where and how the
subject reacts. For example, a food drink advertisement can
serve as a cue because it stimulates the thirst drive in a
housewife. But her response will depend on this cue and other
cues - time of day and cues intensity;
c. Response: This is the persons reaction to the configuration of
cues. It depends on the degree to which the experience is
rewarding that is drive reducing.
d. Reinforcement: If the experience is rewarding, a particular ' . response is reinforced or strengthened, and there is a tendency .
for it to be repeated when the same configuration of cues appear
again. Otherwise, the response is not reinforced and the strength of
the habit diminished and may be extinguished eventually.

He therefore hypothesized that the consumer does not have to
be rational in all his purchase decisions. There is rather a greater
tendency for the consumer to purchase by habit. This is a direct
contrast of the Marshallian model of the economic rational man. ?
There are many marketing implications of this model. There is a
need for strong cues (such as free samples, advertisement) in the
food drink market and other such products where competition is
keen. However, sufficient product quality is necessary to serve as
reinforcement and to build up habit in the consumers. Firms
introducing new brands can as well identify those cues have helped in
building up such brand preferences since consumers are likely to
transfer allegiance to similar brands.
Again the model provides justification for repeat advertising to
generate repeat purchase and-fight forgetting and dissonance. It also
provides useful guidelines to advertising practitioners and copy
writers by helping to identify product drives that must be emphasiz'ed.
In food drinks for instance, drives like vitality and 'thirst' may be I
suggested as strong product related drives.

2.3.3 THE FREUDIAN (PSYCHOANALYTIC) MOQEL
Sigmund Freud, based on his study on child behaviour,
hydpothesized that a child enters the world with instructrial needs
that cannot be satisfied by the immediate environment. According to
him, the mind consists of three parts namely:
The Id - houses the basic instructural drives, most of them,
anti-social.
The Ego - a conscious, rational control centre that maintains a
balance between the uninhibited instincts of the Id and social
oriented super-ego.
The super-Ego - The conscience, accepts moral standards and
directs instinctive drives into acceptable channels.
The basic implications of the above model to marketing is that
the real motive of a consumer for buying a specific product or brand . may well be hiden. Manufacturers should provide enough social
*
rationalizations for product purchase and present brand appeals
directed to the sub conscious, to the consumers dreams, hopes and
fears.

2.3.4 A CONTINGENCY APPROACH P
The above models, clearly show that there is no single
explanation for certain consumer behaviour. In buying a product, the
consumer seeks to satisfy a variety of needs, psychological, social,
physiological and even spiritual needs. In any case the development
of brand loyalty as a pattern of consumer behaviour could arise from
rational or irrational purchase decisions.
It is possible that in one case a consumer purchases out of
habit those products perceived to posses the highest utility value
based on his limited resources. It is also possible that the consumers
preference is a complex function of the Lewinian dictum B = F (P, El, ,
meaning that behaviour is a function of the interruption of the person
B with the environment E. The expectancy model's implicit
assumption of a value structure as a description of P and a belief
structure as. an environmental measure of E can no longer be
accepted as adequate in explaining consume; behaviour3'.
Other evidences now abound that there are significant L
influence of psychological variables in the behavioural pattern of the
consumers. Therefore a cheaper understarlding of consumer
behaviour requires a combination of both conscious rational
hypothesis and the psychological related hypothesis.
2.4 THEORETICAL FRAMEWORK
Consumers will repeatedly buy what satisfies them. The
satisfaction thus obtained is a reinforcement and increases the I
b
probability of repurchasing. Thus habit burchasing pattern is
developed. Most brands in different product - categories enjoy a
degree of loyalty. This is not just buying due to resignation. But could
rather be associated with commitment and prior satisfaction with the
In the study by Blatterg and Sen they identified four types of
loyalty segment using proportion of purchase.
1) High National Brand Loyal: This group of consumers are loyal to
one brand. Over 90% of all purchases are developed to this
brand.
2 . National brand loyal: This segment also are devoted to one
brand but degree of loyalty is not as high as 90%.

3. Private Label Loyal: Consumers in this g row are loyal to a
private label and most likely purchased from a particular store.
Hence private label loyal customers are also store loyal
consumers.
4. Last Purchase Loyal: These consumers buy one brand on
successive occasions and switches to another after which
he switches to yet another brand 33.
On the other hand Brown classified brand loyal consumers into
four viz.
1. Hard Core Loyals: This group will buy one brand all the time
showing individual loyalty.
2. Soft Core Loyals: Consumers who are loyal to two or three
brands. They are satisfied with the alternative brand in he
absence of the other brand'.
3. Shifting Loyals: consumers who shift from favouring one brand
to another. Preference has shifted from one brand to another.
4. Switchers: Consumers who show no loyalty to any brand. Such I
consumers are 'variety prone'34.

Both Blatterg -& Sen and Browns gassification reflect
behavioural measures of loyalty. Such classifications as a matter of
fact could leave us with the conclusion that most consumers are loyal
to a particular brand even in this study of food drinks which is more
appropriately classified as a low involvement product.
The extent o f cbmmitment to a brand is however very
important given the fact that some consumers who are considered
loyal are merely exporting the opportunity of low price or other
economic considerations. This is why spurious loyalty exhibited in
some repeat purchases may be an acceptance and not commitment.
Day would further argue that in order to be truly loyal, the consumer
must hold a favourable attitude toward the brand in addition to
purchasing re~ea ted ly~~ . When- such consumers- who are deemed loyal
are subjected to attitudinal and behavioural measures, the extent of
loyalty certainly decreased as .stated earlier.';This is why the first
hypothesis of the study is posed to ascertain the existence or not of
brand loyalty. Thus, the first hypothesis is
i

H I Cocoa food drink consumers Y
are brand loyal consumers.
From the Marshallian economic model, it can be noted as a
limitation that economic factors alone cannot explain consumer brand
choice. This limitation does not totally deny that a utility maximizer
would give consideration to the relative prices of brands when
deciding on what brand to buy. Price consideration may be of more
importance to people with lower income. Brand loyal consumers many
well be loyal because of the price consideration of the brands.
Arnold Mitchel distinguished the different groups of consumer
values . He identified a set of consumers who are need driven or
money restricted consumers. These are usually people in the low
income bracket who do not have economic options. In USA, this
group is thought to cokti tute less than 20% of the entire
population3' In Nigeria however, it is an obvious fact that given the
present harsh economic realities, more than '60% of Nigerians are in
this category.. Price consciousness can as a matter of fact affect the

purchasing pattern of consumers. It is thereforaalong this reasoning
that the second hypothesis was posed and tested.
H,, Price is an important influence in brand choice and loyalty
for food drinks.
As regards the company image and brand name, the consumers
according to Kotler has a set of brand beliefs' - beliefs about where
such brand stands on each attribute. Thus consumers beliefs and
contents of what is referred to as the evoked set can be known by
asking the consumer to list five or more brands of product class and
rank them based on a particular attribute3'- Though a consumer
brand image could vary with the true attributes, but from experience
the consumers own ideas of the product go a long way to determine
what he buys or does not buy. Oslon believes that a positive image
about a brand may be developed from childhood, carried along as the
consumer grows and invariably believes that such a brand depicts
quality. Such brand image built up over the years encourages the
consumer to be loyal to the brand3'. In Nigeria for example, even I
when there are no 'functional differences in some of the brands of
food drinks, it is an established fact that somGmanufacturing firms
b.
especially those with expatriate background are perceived to present
products of better quality - than indigenous firms. Positive beliefs
about the company image and brand name therefore are likely to
influence the extent of loyalty of consumers to a particular brand.
This is the line of thought expressed in the fourth hypothesis.
HIv Company image and brand name contribute significantly
to consumers loyalty to any brand.
Consumers perception of qualities of food drinks or any other product
also determine the choice and loyalty to a brand. Consumers do not
make chemical or physical analysis of the products they buy. In
reality they have little knowledge of or concern for the technical
standards established by chemists, physicist and engineers in- its
manufacture. In the final analqsis the quality of a product depends on
the situation in the market place, vis - a - vis consumer perception.
However, though consumers do not really analyse in any
details the content of the products, their perceived attributes as. I
contained in the consumers evoked set determine the loyalty status of

the brand. It is the necessity to ascertain thedmpact of consumer
perception of quality of the various brands, that the third hypothesis
was formulated.
HI,, Consumers perception of the qualities of food
drinks have significant impact on brand loyalty.
Consumers judgements of product attributes may be based on ,
grounds that differ from those of laboratory'tests. For example, many
consumers cannot discriminate between the taste and smell of
various brands. When the brand is seen, strong taste and quality
preferences are voiced3'. Their perception is based on brand name
associations derived from advertising and social stimuli. lnfact
contributes like Kotler, Levitt, Keuhn and Day have recognised that
consumers are not perfectly consistent in their choice beha~iour.~'
It is on the basis of this allegation that the fifth hypothesis was
advanced.
H, Consumers can identity their favourite brand in a blind taste
test.

NOTES TO CHAPTER TWO
Solomon Osvalsky, Richard W, "Perceived Quality in Consumers Decision
Making; An Integrated Theoritical Perspective", in Perceived Qualify:
Ifow Corlsumers View Stores and Merchandise, eds Jacob Jacoby and C.
Oslon (Lexington, M. A: Lexington Books 1985), pp 3-29.
J. A. Howard and J. N. Seth, The Theory of Buyer Hehaviuur, (John
Wiley and Sons NY 1969)
I;. M. Nicosia, Corrsumer Decisiorr Processes (Prentice Hall, Englewood
Cliff's, NJ 1966).
J. F. Engel, R. D. Blackwell and P. M. Kollat Co:wmer Behaviour, 3rd ed
(Holt Rinechard and Winston, New York, NY 1978).
Henry Assael, Cunstrmer Behaviour atrd Markeling Aclion 41h ed (Boston,
Kent 1993) pp 25 - 42.
Richard J. Lutz and James R. Bettman "Multi Attribute Models in
Maketing. A Bicen tingial Review" in Coiisumer arrd Irrduslrial Buyirig I
Behaviour, Arch G Woodide, Jegdish N Seth and Benneth eds
(New York: North Holland Publishing Coy 1977) pp 137 - 149
Assael op-cit

8 Harold 1-1. Kassarjian and Waltrand M. Kassarjian, sttributes Under Low
Commitment conditions" in John C. Maloney and Bernard Silverman eds
A ffifude Research Plays for High Stakes (Chicago American Marketing
Associations 1979), p8.
9 Michael R. Solomon, "The Missing Link. Surrogate Consumers in
Marketing Chains", Journal ofMarkefing, Vol 50 (October 1980) p 209.
10. Jean - Noel Kapterer and Ciles Laurent, "Consumer Involvement Profiles:
A New Practical Approach To Consumer Involvement", Journal of
Advertising I(esearch, (December 1985 - Jan 86) pp 48 - 56.
1 I. Richard Celsi and Jerry C Oslon, "The Role of Involvement in Attention
and Comprehension Processes", Jourt~al of Cotlsurner Research 15
(September 1988) pp 210 - 224.
12. Victor 1-1. Vroom, Work and Motivation New York; John Wiley Inc and
Sons, 1964).
I 3. Assail op-cit p 65 t
14. Peter Oslon, Consumer Behaviour and Markefing Strategy (Richard Irwin
Inc, Boston 1993) pp 582 - 586.
1 5. Assael op-cit pp 65, 81 i

1 6. Jacob Jacoby and Robert Chestnut, Brand Loyalt~easurement and
Ma~magemerit (New York; John Wiley Inc and Sons 1978).
17. Sharon and Beathy Lynn, R Kable and Pamela Homer, "The Involvement -
Commitment Model: Theory and Implications", Journal of Business .
&search I b (2) pp 149-1 67.
18. W. T. Tucker, "The Development of Brand loyalty, Journal of Marketi~tg
Research I (August 1964) p 32.
1 9. D. L. Loudon and Albert J. Della Bitta, Co~aumer Behaviours, Cormceps
a~tdApplicatiorts (NY Mc Grow Hill Inc 1993) pp 564 - 567.
20. Peter Oslon, Op -cut pp 282-286
2 1. Leon Schifinan, Leslie Lazar Kanak, Consumer Behaviour (Englewood
Cliffs N. J: Prentice Hall 1993) pp 2 16-2 19.
22. . Jacob Jacoby and David B Kyner, "Brand Loyalty VS Repeat Purchasing
Behaviour" Journal of Marketing Researcit 10 (Fedruary 1973) p2
23. George S. Day, "A Two Dimensional Concept of Brand Loyalty", Journal
of Advertising Research 9 (~d~ternber 1969) pp 29 -36. , .
24. lbid pp 29-36 8
25. W. T. Tucker: "Development of Brand Loyalty" op-cit.
26. Assael Op-cit p 73.

27. Ellgel Blackwell and Kollat, Consumer BehaviourQrd ed (The Dryden
Press, 1978) as in Michael J. Baker, Marketing An Introductory Tex,
(London and Basing Stoke: The Macrnillan Press Ltd, 1981) p 65.
28. N. A. Hart and John Stapleton Glossary of Marketing Terms 2rtd ed
(London; William Heinemam Ltd, 1981) p 42.
29. Philip Kolter, Marketing Management, Analysis, Planning,
Implementation and Control 6 th ed (Englewood Cliffs N. J., Prentice Hall
3 0. Edwin E. Nemmers, Managerial Economics (N.Y, John Wiley and Sons
Inc 1962) part 11.
3 1 . William Massey and Ronald Frank, "Short Term Price and Dealing Effects
in sclccted Markets", Jolir71ul qfMcrr-kdilrg 1~esc.ur.ch Vol 2 (May 1985) pp
32. The expectancy theory posits that motivational effoits of an individual to
select one behaviour from a large set is some hnction of the perceived . likehood that the behaviour will ~esult in the attainment of the various
outcomes weighted by the desirability (valence) of these outcomes to the
person
3 3 . Robert C. Blatterg and Subrats K. Sen "Market Segments and Stochastic B
Brand Choice Models" Journal of Markding (Feb 1976) pp 34 - 45.
34. George Brown Brand Loyalty - Fact or Fiction? Adverlising Age (June 19,
1952) 53-55, (June 30, 1952) 45-47, (August 11, 1952) 56-58, (September
1 1952) 80-82, (October 6, 1952) 82-86, (December 1, 1952) 76-79,
(January 25 1953) 32-35.
35. George S. Day - "A Two Dimensional Concept of Brand Loyalty" op cit.
36. As reported in Paul Day, "The New Consumer Values", Adverlising
Quarlerly 56 (Summer 1978) pp 15-17)
37. Kolter Op Cit
I
38. Oslon Op Cit
40. See for instance Kotler Op Cit, Alfred Kuehn and Raph Day, "Strategy of
Product Quality" Harvard Business I<eview Vol40, No 6, (December
1982) pp 10 1 - 1 10 Theodore Levilt, "Marketing Myopia" Harvard
Busit~ess Review (July - August, 1960).

RESEARCH DESIGN AND METHODOLOGY
3.1 SCOPE OF THE STUDY
3.1.1 Area Covered: This study is restricted to Enugu Metropolis in Enugu
state of Nigeria.
3.1.2 Rationale: Enugu was the capital of the dehnct Eastern Region which
accounted for a substaritial population of the food drink market in Nigeria. Now
the capital of Enugu State, it is still very populous because of its cosmopolition
nature which has become a point of political controversy in recent past. With the
presence of Federal Ministries and a campus of a Federal university, the population
i is made up of people with diverse ethnic background and different social,
educational and income classes.
This strategic position of Enugu Metropolis in Eastern Nigeria is a fair
basis for moderate generalizaions of the findings of this study for the Nigerian food
drink market.
3.1.3 Brands Covered: The challenges of the structural Adjustment programme
and the harsh economic realities has made a serious impact in the food drink
industry in the country. While some old regional brands like Cocovite and Grovita i

and almost extinct, some new brands like Bonita, Bevicvnd Kollevita are finding
their way into the market.
However an exploratory consumer survey carried out at various retail
outlets and supermarkets shows that most of the new brands mentioned above are
still regional phenomenon. The brands that have been found to exist and sale on a
significant scale nationally were therefore closen for the study.
These include
1 . Ovaltine
2. Nescao #.
3. Bournvita
4. Milo
5. Pronto
3.2 Sources of Data
3.2.1 The sources of data consists of both primary and secondary sources of
data. The secondary sources of data consists of the following: Pamphlets from the
Public Relations and Marketing Departments of the various brands manufacturers,
Annual Report of firms, Annual reports of the Association of Food, Beverages and

Tobacco Employers (AFBTE), Manufacturers Associa$ion of Nigeria (MAN)
Rccords, Journals, Textbooks, Magazines, weekly and Daily Newspapers.
3.2.2 Prilnary Sources of Data
The nature of the hyp~thesis requires the use of both consumer survey
Data and laboratory experiment. (Blind Taste Test).
a) Consumer Survey
Population and Sample Determination
The population is defined to include all adults who take food drinks. This
ir~cludes liousewives, students, bachelors, and spinsters who play a definite role in
h e purchase of the food drinks consumed in their homes. The population size
cannot be estimated precisely and hence its standard deviation and other
cl~aracteristics are as well difficult to ascertain. An appropriate technique is 1.
therefore used to determine within a limit of error and level of confidence.
At n confitlcncc Icvcl of 95% and tolcrablc limit of crror of 5% thc snrnplc
size is determined as shown below.
Using n - - z2lplpa) '
e2
Where 11 - - sample size
z - - value of standard deviation

therefore
n
Questionnaire was
of the desired confidence leyel
(in this case 1.96).
assumed percentage of the
population who take food drink
(25% or .25)
1-P = .75
limit of tolerable error
i.e 5% (0.05).
employed to collect data for testing hypothesis I-IV. The
sa~riyle questionnaire is as shown in Appendix 1A.
'The questionnaire consistsr of structured multiple choice questions and
open ended questions. The questions covered attitudinal and behavioural
components of brand loyalty. The questions aimed ~,t'finding out consumers
attitude towards the various brands of food drinks under study were rated on a five I
point scale which varied from "definitely will buy" to "definitely will not buy".

The behavioural measures of loyalty were t akenpne of by open ended
questions and includes writing down the purchase paltern of the respondents (by
himselflherself of the various brands of food drinks.
The sample population was selected by random sampling. The sampling
was a combination of cluster and random sampling. The various wards or clusters
was assigned a number of.questionnaires and distributed to residential buildings.
The choice of respondents in each house was based on the willingness of the
respondents
b. Blind Taste Expcrinrent
The sample for the experiment is made up of 150 respondents. The I t pa~ticipants were invited to the chemistry laboratory of Queens School Enugu.
The experiment consists of a pre-practical session where the first set of
questionnaires (ie. the consumer survey questionnaires) were distributed. The
subjects were required to f i H the questionnaires before the food drinks were
served. Each subject was required $0 write hisher name on the questionnaire for
identification.
The second questionnaire was shared just before the food drinks were
served. Four brands which were considered most populars were used. These
include Bournvita, Milo, Ovaltine and Nescao. i
Procedure b'
I . Participants were required to first complete the Quali@ing questionnaire.
'I'hc subjects were required to indicate his name on the questionnaire before
returning it.
2. The subjects were served a cup of hot food drink. The drink is prepared
with 50mls of water and two table spoons of the brand being prepared. Brands
A,B,C,D are served one after the other. The subjects were asked to rinse their
mouths aiter drinking each brand. Sugar and milk were not added at all.
3 . The subjects were asked to identifjl each food drink in turn . Brand A = Bournvita, B = Mile,] C= Nescao, D = Ovaltine
The questionnaires used for the Blind Taste Test is shown in Appendix
CHAPTER FOUR
PRESENTATION AND ANALYSIS OF DATA
4.1 INTRODUCTION:
T w o classes of primary data were used for this study; one
obtained through consumers' survey and the other through the
laboratory (Blind) Taste Experiment. )i
A total of 270 consumer survey questionnaires were
administered in the field survey, out of which 242 were returned
representing a response rate of 89.6%. However 23 questionnaires
out of the number which represent 9.5% could not pass the validity
test after editing. This is either because of non-completion or
contradictory information. Thus w e were left wi th 219 valid
questionnaires representing a usage'rate of 81 .I % of the total survey
questionnaires or 90.5% of,the returned questionnaires.
The overall response ratio is as presented in tables 4.1 and 4.2
below.
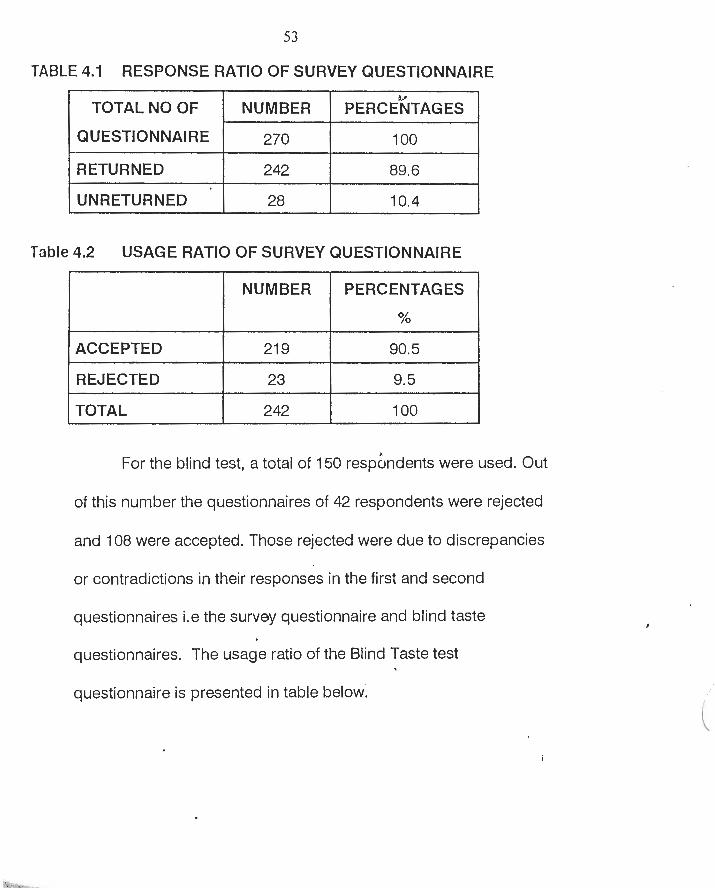
TABLE 4.1 RESPONSE RATIO OF SURVEY QUESTIONNAIRE
( QUESTIONNAIRE 1 270 1 1 00 I 1 RETURNED 1 242 1 89.6 1
Table 4.2 USAGE RATIO OF SURVEY QUESTIONNAIRE I I I I
UNRETURNED
1 ACCEPTED 1 2 1 9 I 90.5 I
28
NUMBER
10.4
PERCENTAGES
%
I TOTAL 1 2 4 2 I l o o I REJECTED
For the blind test, a total of 150 resp&ndents were used. Out
of this number the questionnaires of 42 respondents were rejected
-- --
23
and 108 were accepted. Those rejected were due to discrepancies
- -- - - -
9.5
or contradictions in their responses in the first and second
questionnaires i.e the survey questionnaire and blind taste
questionnaires. The usage ratio of the Blind Taste test
questionnaire is presented in table below;

5 4
TABLE 4.3 USAGE RATIO OF THE BLIND TASTE TEST
QUESTIONNAIRE 3,
NUMBER
1 TOTAL I 1 50 I 100.0 I
PERCENTAGE
ACCEPTED
REJECTED
CONSUMER SURVEY RESULTS
One of the major objectives of this study is to ascertain whether
cocoa food drink consumers are loyal to any of the brands of food
drinks. Based on this, consumers were asked to mention their most
preferred brand and indicate how often they buy the same brand on a
five point rating scale that ranges from "Not at all" (one point) to
"always" (five point), The ratings of four and above are considered
108
42
brand loyal while ratings below four are considered non-loyal. Table 4.4 t
72.0
28.0
shows the percentage scores of consumers responses.
TABLE 4.4 CONSISTENCY OF CONSUMER PURCHASE PATTERN
CLASSIFIED INTO TWO
1 BRAND LOYAL
NUMBER
PERCENTAGE
NON-LOYAL
131
60%
TOTAL
88
40%
21 9
100%

This result shows that 60% of the respond&its claim to be
loyal to a particular brand.
HYPOTHESIS I: Cocoa food drink consumers are loyal to particular
brands.
Notwithstanding that more than half (60%) of the respondents
claim to be brand loyal to their favourite brands of food drinks, for the
hypothesis to be accepted or rejected, it has to be shown that the
two values (percentages for loyal and non-loyal consumers) are not
comparable.
To establish this, the results of table 4.4 are subjected to a
T-test for mutually exclusive proportions. The unequal percentages
were found to be significantly different at both 5% and 1 % levels of
significance (Appendix 1 1 A).
Therefore having found the two proportions to be significantly
different, thus satisfying the 'condition for the hypothesis to be
accepted, hypothesis 1 was accordingly accepted.
It is not just enough to establish the exi7tence of brand loyalty I
i of consumers to their favourite brands. This study is also interested

in the extent of loyalty and how this l~ya l t y~ re la tes to individual
brands. To achieve this, the consumers ranking of the brands
according to their preferences were subjected to analysis of variance.
TABLE 4.5
CONSUMERS PREFERENCE RANKING OF BRANDS OF FOOD DRINKS.
TOTAL SCOREI MEAN SCOW I R-E I
ANOVA TABLE
8 18
1,414
968
680
1,865
1,652
SOURCE SUM OF 1 DECREES OF - 7 1 SQUARES FREEDOM
2.33714286
4.04
2.76
1. 94285714
5. 32857143
4.72
POSITION 5TH
3RD
4TH
6TH
1 ST
2ND

5 7
Bournvita has the highest mean of 5.3 followed by Ovaltine
(4.72), Milo (4.04) Nescao (2.76) Pronto (2.34) q ~ d Vitalo has the lowest
value of 1.94.
These means subjected to analysis of variance show a
significant difference in using the F-Ratio for comparison of means of
consumer preference ranking for various brands at both 5% and 1%
levels of significance. Thus were choice to be considered synonymous
with loyalty, Bournvita would be enjoying the strongest loyalty and
Vitalo the least loyalty having ranked 1" and 6Ih respectively. .
Hypothesis I I : Price is an important influence in the choice and
brand loyalty for cocoa beverages.
In a depressed economy like ours, price of goods and services
likely exerts a strong influence in the choice and loyalty of not just food
drinks but also for most of the household essentials. This speculation
was corroborated by the result of the consumer survey.
In the investigation of price influence on the choice and loyalty
to brands, the result shows most of the consumers claiming only a
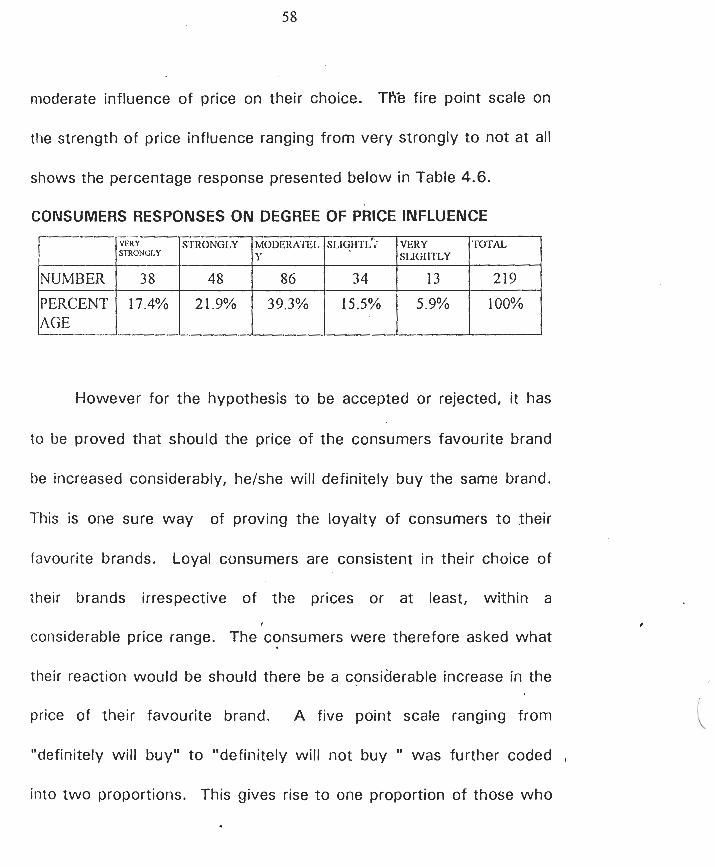
moderate influence of price on their choice. TH'e fire point scale on
the strength of price influence ranging from very strongly to not at all
shows the percentage response presented below in Table 4.6.
CONSUMERS RESPONSES ON DEGREE OF PRICE INFLUENCE
However for the hypothesis to be accepted or rejected, it has
to be proved that should the price of the consumers favourite brand
be increased considerably, helshe will definitely buy the same brand.
This is one sure way of proving the loyalty of consumers to .their
favourite brands. Loyal consumers are consistent in their choice of
their brands irrespective of the prices or at least, within a
1
considerable price range. The consumers were therefore asked what
their reaction would be should there be a considerable increase in the
price of their favourite brand. A five point scale ranging from
"definitely will buy" to "definitely will not buy " was further coded
into two proportions. This gives rise to one proportion of those who

remain loyal inspite of the price increase in theirfavourite brands and
the other proportion of those who will no longer buy their preferred
brand because of a price increase. The survey results show that 51%
remained loyal while 49% would not be loyal in event of a price
increase. This gives a direction t o Table 4.6 above ie this now
implies that quite a good number of consumers are influenced by
price.
I
#.
TABLE 4.7 1 I i CONSUMERS RESPONSES ON PRICE CLASSIFIED INTO TWO
I LOYAL ( NON-LOYAL 1 TOTAL 1
t
The proportion of loyal consumers and that of non-loyal #
!
consumers were subjected t o tests of comparability. The hypothesis
NUMBER - - PERCENTAGE
will be accepted if the t w o proportions (ie for loyal and non-loyal
consumers) are comparable. That is t o say that with an increase in i
112
5 1%
107
49%
219
100%

price of the consumer?^ favourite brand, the Pproportion of loyal
consumers were no longer significantly differ'ent due to the influence
b.
of price on loyalty of consumers. Thus t he ' two proportions were
subjected to a two tail T-test and found not to be significantly
different at both 5% and 1 % levels of significance (see Appendix 110).
The condition is thus fulfilled to accept hypothesis II which is
accepted accordingly. .A further investigation of the influence of price
on brand loyalty across income groups reveals that degree of
influence does not depend on the income group. There is very little
difference in the degree of price influence on the consumers of 'the
various income groups. These little variations do not show any
consisterit direction.
The F-Ratio of the ANOVA table below shows that there is no
significant difference in the degree of price influence across the ,
various income groups. This therefore implies that price is an
important consideration irrespective of the income group.

TABLE 4.8 w
DEGREE OF PRICE INFLUENCE ON CONSUMERS IN THEIR CHOICE OF
BRANDS ACCORDING TO INCOME GROUPS.
INCOME TOTAL GROUP 1 SCORE
MEAN N' I GROUPS
LOW INCOME
1-1 I G 1-1 INCOME
Hypothesis Ill: Consumers perception of the quality of the food. . drinks have significant impact on brand loyalty.
The perceived quality or attribu-tes o f , the various brands
A = UE'I'W EEN
E=WI'THIN
rcE
deFinitely differ from one consumer :.:I another. This hypothesis seeks
489
2 16
142
t o find out the extent the need satisfying attributes namely:-
SUM OF SQUARES
SA = .328945 16
SBz359.788194
Nutritional value, taste, sugar level, milk content and dissolvability of I
113
59 "
h
47 .
the brands attract and sustain loyalty of consumers t o particular
3. 25414365
3. 32631579
3. 2702027
DEGREES OF FREEDOM
A-1 = 2
N-A = 216
MEAN SQUARE
0. 16 447258
1. 03685358

brands. Therefore for the hypothesis t o be true, the proportion of
consumers who consider the attributes important influence on their
loyalty t o brands must be significantly different f rom those who do
not. Secondly the consumers perceived level' of importance of the
various attributes (represented by the mean scores values) has t o be
significantly different for all the attributes.
The T-Test for comparability of the proportions shows a
significant difference between the proportions of those who consider
the attributes an important influence on loyalty and those who do not
at both 5 % and 1 % levels of significance (see Appendix IIC).
Furthermore, the consumers ranking of" the levei of importance 1 i
of each attributes shows a s igni f icmt d i f f e reke in the means of the
attributes as indicated by the F-Ratio.
This is presented in table 4.9 below
TABLE 4.9a: CONSUMERS PERCEPTION OF ATTRIBUTES
[ A T T R ~ B U T E S E SIZE MEAN

ANOVA TABLE + I -?J?
Thus the t w o conditions having been satisfied hypothesis 111 . .
was therefore accepted.
A quick pairwise comparison of the attributes as shown in table
4.1 0 below made possible another generalisation. The conclusion that
can be drawn from .this table is that the order of decreasing
importance of the attributes influence on loyalty is as follows:-
GROUPS
Mr I'I'I-11 N GliOlJI'S
TOTAL ---
Nutritional value, milk content, taste, dissolvability and sugar content.
F-RATIO
57. 0922
s I
Thus I ~ ) ~ a l t y is mostly influenced i i y nutritiopal value and least by c
PROB.
< .0001
SUM OF SQUARE
-- S
532. 686
2542. 502
- 3075. 180
sugar content. . .
DF
4
1,090
1,094 .. -
MEAN SQUARE
S
133. 1715
2. 33257

TABLE .& ' ( 2
b'
PAIRWISE COMPARISON OF MEANS OF ATTRIBUTES
IMILK L'ONTEN - - - - - I ' A'fSE
SUGAR C'ON'I'ENT
-- MILK
CONTENT
0
1.84
10.1678***
-- 3.0973***
-
TASTE SUGAR CONTENT
10.1678**
-- DISSOLV- ABILITY
3.0973**
- 1.25
-7 .O7O6**
0
NUTRITION AL VALUE
-4.5051**
Significant at 5 % level of significance
* * - Significant at 1 % level of significance
Another purpose of the study was t o investigate the influence
of brand name and company image on the loyalty of consumers to
their brands of choice.
Hypothesis IV: Company image and brand name contribute
significantly t o ,consumers loyalty to particular
brands. I
The import of this hypothesis is based on the fact that company
and brand images .vary significantly for 'different brands and

companies of cocoa food drinks. The perception 8f consumers as to
h e popularity of brands and pursuit of excellence in quality differ from
one brand to another and from company to company.
A multiple regression analysis wi th brand loyalty as the
dependent variable and brand name and company image as
independent variable is as presented below.
TABLE 4.1 1
RELATIONSHIP BETWEEN BRAND LOYALTY AND (COMPANY IMAGE
& BRAND NAME)
MULTIPLE REGRESSION SUMMARY TABLE
DEPENDENT VARIABLE: BRAND LOYALTY
MULTIPLE REGRESSION COEFFICIENT: 1816
STANDARD ERROR OF ESTIMATE: 1.3209
PROB. I BRAND NAME
COMPANY . IMAGE L-
0. 51 3997
0. 03681 1
0. 082953
0. 082439
2. 577326
0. 44651 8

This shows that 51.4% of brand loyaity .can be explained by
popularity of brand name while only about ,3.7,% of the same can be
explained by company image.
This implies that there is a strong correlation between brand
loyalty and brand name while the same could not be sa ido f company +
image.
The T-value f rom table 4.1 1 confirms that the correlation
between brand loyalty and brand name is significant at both 5% and
1 % levels of significance, w h ~ l e the correlation between brand loyalty
and company image is not significant both at 5% and 1 % levels of
significance. Thus whereas consumers consider brand name a strong
influence on loyalty, t l iey do not consider. company image as an *
important influence.
Consequently, hypothesis IV was accepted w i th a slight
modification. That brand name exerts a strong influence on loyalty
while company image is not such as important chsiderat ion.

4.3 BLIND TASTE TEST (EXPERIMENT) RESULTS
To determine if consumers brand preference is a real or mere
psychological phenomenon, after indicating their most preferred
brands to which they are loyal, consumers ,who responded to the
survey questionnaires were again asked to identify their most
preferred brand from four brands now disguised.
Table 4.12 shows a the outcome of the experiment conducted
with 108 valid responses of consumers of food drinks, out of which
65 (60.19%) correctly identified their most preferred brands while 43
(39.81 %) failed the test.
TABLE 4.1 2
IDENTIFICATION OF MOST PREFERRED BRAND %
CORRECT INDENTIFICATION
INCORRECT INDENTIFICATION
'TOTAL
NUMBER 6 5
4 3
108
PERCENTAGES 60.19%
39.81%
100%

Source: Blind taste test (Experiment) Data fa
Is this result significant?
Hypothesis V: Consumers can identify their favourite brands in a
blind taste test.
Since the number of brand used' for the. experiment was four
the probability that a consumer identified his most preferred brand
correctly by chance even though in reality he could not discriminate
correctly is 114. Our task therefore was to show that the
experimental result of 60.1 9% was significantly more than that which t
could be attributed to chance. The test was found to be significant
and it was accordingly concluded that consumers could identify their
most preferred brands when disguised with other brands (Details of
the statistical test can be found in Appendix 11D).
It has only been shown that consumers could correctly ,
discriminate against non-favourite brands when the task is to identify
most preferred brand. But how skilled is the consumer when he is
expected to indicate his order of preference of all four brands. The
I
degree of consistency the consumer exhibited in ordering the brands

69
according to his preference before (when h e f i a d not tasted the
brands) and after the experiment (when he had tasted the brands
would provide further evidence to the consumers ability to distinguish
between brands.
Table 4.1 3 shows the consumer preferences rankings of brands
before and after the experiment. (Blind Taste test).
TABLE 4.13
CONSUMER PREFERENCE RANKING OF BRANDS AND AFTER THE
BLIND TASTE TEST.
RANK
NESCAO
Source: Blind taste test (Experiment) Date. .
Figures in the matrix correspond to frequencies of mention of
brands for the ranks ie (Ist, 2nd, 3rd and 4th). Entries in parenthesis I

correspond to before the experiment frequencies' values as
calculated by the computer
* * - Not significant at 5%
* * * - Not significant at both 5% and 1 %.
In the final analysis, the cummulative effect of the chi-square
was found to be significant. This means that on the overall
consumers ranking before and after the experiment were inconsistent
with their rankings after the experiment.
However, when the individual ranks of a brand was isolated
and considered as such it was found that consumers were consistent
in their rankings. Bournvita at both 5% and 1 % levels of significance.
Furthermore table 4.13 above was weighted to produce table 4.14
below.
TABLE 4.14

TABLE 4.14 w
WEIGHTED CONSUMERS PREFERENCE RANKING OF BRANDS
BEFORE AND AFTER
p v
MILO 23 (1)
HE BLIND TASTE TEST.
Note: Entries in parenthesis correspond t o
BEFORE THE EXPERIMENT
Source: Blind taste test (Experiment) 'Data.
The idea was t o compar,e the derived rank order befo w i th that
obtained after the experiment.' Based o,n, the spearmans rank
correlation theory, a measure of the.degree of association between the
t w o sets of response could be taken. The correlation coefficient rs
was found to be 0.400 which indicated that generally, the ranking

after the experiment weakly reflects the rOdnkings before the
experiment.
However
h I
having proved that consumers ability t o identify their
favourite brands was more than could be attributed to chance,
Hypothesis V was accordingly accepted. Notwithstanding consumers
ability to be consistent in their ranking of brands is lacking. It is
noteworthy however, that those consumers who claim loyalty to
particular brands were able to discriminate their favourite brands
among others when disguised.
4.4 DISCUSSION OF RESULTS:
In the presentation and analysis ,of data the objectives was
mainly to subject the raw data derived from both the consumer . survey and laboratory blind taste experiment to statistical tests.
Consequently, it was possible to draw statistical inferences from such
tests.
In this section however, the objective is to provide logical and r
theoretical constructs for some of the findings in a very clear manner.

4.4.1 EXISTENCE OF BRAND LOYALTY:
The most important focus of the study was to determine the
existence or otherwise of consumers loyalty to existing brands of
food drinks. The result shows that a sizeable qumber of consumers
are brand loyal to their favourite brands. This result therefore led to
the accepting of the following hypothesis:
Cocoa food drink consumers are loyal to particular brands.
This result is not surprising. Habitual purchasing behaviour is
the result of consumer learning from reinforcement. Consumers will
repeatedly buy what brand satisfies them best. . This behaviour leads
to brand loyalty. A number of scholars such as Ehrenberg and
Goodhart however are of the opinion that consumers actually do buy
from a set of brand portfolio for different product classes. It is
noteworthy that they also arrived at the conclusion that repetitive
purchase of brand leads to favourite attitude and loyalty to the brand.
In the case of this study,'consumers loyalty to the particular brands is , supported by strong industrial practices. This is why many managers

are not thrown into panic by introduction of Kew brands into the
industry and Nigerian markets. Rather they concentrate on
advertising to sustain loyalty. Creating brand loyalty is a major
concern to marketers more than just increasing the market share.
4.42 PRICE AND BRAND LOYALTY
Introducing the Marshallian (Economic) model we noted that
the individual buyer seeks to spend his inccme on those goods and
services that will deliver the most utility (satisYaction) according to his
taste and relative prices. This argument readily suggests that price
has a great influence on consumers.
The result of the study shows that despite claims of loyalty t o
brands by consumers, price is a major influence on loyalty of 9
I
consumers. Thus the hypothesis; Price is an important influence in
the choice and loyalty for cocoa beverages was accepted. This is not
surprising given the serious distress in the world economy .and
especially in Nigeria. i

b' In a recent research session a brand loyalty a panelist noted, "I
used to use just Betty crocker mixes but now I think of either Betty
Crocker or Duncan Hines depending on which is on sale" Another
participant said, pennies count now, I read the ingredients. I don't
really understand but I can tell if its exactly the same. So now I use
the cheaper brand and honesty, it works just as well.
This simply leads weight to the findings of this work. The
economic hardship has in no small measure reduced the loyalty of
consumers to not just food drinks but many other product classes by
pushing them to buy cheaper alternatives.
Many managers pay more attention t o non-price factors than to
price. This result should sound as a warning to brand managers in !.
the food drink industry especially as it is 'yet doubtful whether food
drinks belong to the high involvement product class and differences
between existing brands may not be so distinc!. Therefore arbitrary
increases in price is likely to endanger sales due to possible brand
switching. i

4.4.3 CONSUMERS PERCEPTION OF ATTRIBUTE% INFLUENCE ON
LOYALTY
Consumers are generally reputed to have is set of brand beliefs
- beliefs about where each brand stands on each attribute. It wa's in
a bid to find out the implication of this assertion that hypothesis Ill
was postulated.
Hypothesis Ill: Consumers perception of the quality (attributes)
of the food drinks have significant impact on brand loyalty.
This hypothesis was found to be true. An important implication
of this finding is that consumers are knowledgeable and not as
gullible and manipulatable as critics of advertising would suggest.
When Peryam and Pilgrim argued that the acceptance of
products involves psychographic reactions to the various attributes of
that product, the meaning they were trying to convey is not that such
attributes have equal weights. Nutritional value was found to be the .. .I
most important attribute considered in loyalty fo particular brands.

DEGREE OF ATTRIBUTE INFLUENCE ON eONSUMERS
Important
Very Important 5.00
4.75
4.50
4.25
4.00
3.75
3.50
3.25
aoo
' 2.75
2.50
225
Somewhat Important
1.75
150
125
Not Important at all 100
NUTRITION VALUE
MILK CONTENT - TASTE
-4 DlSSMVABlUN
- SUGAR CONTENT
Thus it is a sound marketing practice to emphasise heavily on
Nutritional value in the adverfising of the brands. Presently most of
the established popular brands make claims of high nutritional values
as their unique selling proposition. The extent the consumers
perceive the presence of these attributes in the various brands i
therefore go a long way to sustain brand loyalty.

4.4.4 BRAND NAME, COMPANY IMAGE AND BR#ND LOYALTY
This study also, examined the relationship between brand
loyalty and brand name and company image.
Hypothesis IV: Company image and brand name contribute
significantly to consumers loyalty to
particular brands.
The result shows that brand name exerts a strong influence on
&"
consumers loyalty while company image is not an important
consideration. This explains why some of the food drinks companies
with more than one brand have the popular brands showing a good
market performance while the unpopular brands make little or no
impact in the food drink market. For instance in the ranking of the six
brands covered by this study, Bournvita and Pronto ranked 1st and
5th respectively though both, belong to Cadburys product portfolio.
The importance of,brand name as a factor influencing choice . .
and loyalty does not contradict any plausible marketing theory. As an
attribute, brand name rnay be seen as a condensation of many other i
product sub-features. Its more than a mere alphabetical arrangement.

'r it con
79
:s of the brand's typography, co'fou ckage, d esi
promotional slogans and the general image of the owner of the brand.
Theoretical support can also be derived from the Freudian hypothesis
that choice behaviour is largely a symbolic process. When purchases
cease to be influenced by economic variables consumers given their
experiences and personalities become vulnerable to making purchases
without any substantial degree of deliberation. This is perhaps why
such companies as Cadbury and Nestle who acquired the names of
foreign brands are not in any hurry to drop such names.
The implication for marketers therefore is the challenge of
L c
choosing suitable and captive brand' names which are
commensuratively supported by good quality of the product.
4.4.5 REALITY OF CONSUMERS PREFERENCES
Consumers of food drinks are knowledge people. They may
not be as gullible and manipulatable as some people would assume.
Some consumers are really loyal to particular brands. i

It was necessary to find out whether thiS' loyalty was a mere
empty claim or not. Brand loyal consumers who through familiarity
with the brand can identify their favourite brand when disguised.
This claim was substantiated in this study as consumers were
able to identify their preferred brands though they failed to make a
ranking of the overall preference of the brands under the laboratory
conditions that was consistent with rankings under control b.
i
conditions.
This therefore confirms the result of hypothesis one that
consumers are loyal to particular brands of cocoa food drinks.

NOTES ON CHAPTER FOUR'
1 . Henry Assael, Consumer Behaviour and Marketing Action 4th
ed. (Boston, Kent. 1993) p.89.
2. Robert East, Changing Consumer Behaviour (Cassel Educational
Limited 19931, pp. 47 - 57.
3. LW lamb and J. F. Har Jnr. Princl;oles of Marketing (South
Western Publishing Coy. Cincinnati Ohio USA 1994) pp. 44
4. D:R Peryam and F.J. Pilgrin, The Hedonic Scale Method of
Measuring Food Preferences", Food te'chnology Vol. /I, No. 9
5. This Phenomenonjs discussed in Philip Kotler, Behavioural
Models, for Analysing Buyer's Behaviour, Journal of Marketing,
Vol. 29 (Octob&, l965) , pp. 181 - 184.

CHAPTER FIVE P
SUMMARY, IMPLICATIONS AND RECOMMENDATIONS
CONCLUSIONS
AND AREAS FOR FURTHER RESEARCH
5.1 SUMMARY OF FINDINGS
1. This study established that the consumers of cocoa food drinks
are, to a reasonable extent loyal to particular brands. In every
ten consumers of food drinks, six of them are loyal to particular
Brands.
2. Price of the various brands exerts a significant influence on the
loyalty of consumers though there was no relationship between
the income of consumers and the extent of influence exerted
by price. a.
3. Consumers have basic expectations in their favorite brands.
consumers consider the attribute 'important in the following
order I
Nutritional value

Milk Content
Taste
Sugar level
Dissolvability
4. Brand name is an important influence on consumers loyalty t o
particular Brands. However, company image is not considered
important.
5. The claim of loyalty t o particular brands is true and real since
they were able t o identify their most preferred Bands
disguised.
5.2 IMPLICATIONS OF THE STUDY AND RECOMMENDATIONS
This study established the existence of brand loyalty amongst
cocoa food drink consumers. A n important implication of this result is I
that new entrants into the market will have a difficult task penetrating
the market. Such companies will relatively make little impact in the
food drink market. Existing Brands also will neZd t o exert a more than
I
average effort t o increase their market share.

It is obvious from the result that the extent of loyalty (six in
every ten) is nothing for any manager to rest on his oars. Brand
loyalty is a result of combination of many marketing variables.
Therefore the companies should further ascertain what about their
brands islare of utmost importance to consumers and exploit i t to
build and/or improve the loyalty of consumers to their brands.
Another important deduction from the study is that price is an
important influence on bra'nd loyalty. The economic hardship in the
country is biting hard across all the income groups. Most consumers
will switch to cheaper brands as their favourite brands become more
expensive. This may be explains why there are so many new and ,
cheap brands in the market now. Though these new brands may not
constitute such a threat, it is not a good development when your
loyal consumers have an easy opportunity to try other brands. Many
of the big names in the industry like Cadburg have sensed the danger
and resorted to product differentiation or even outright introduction of
cheaper brands.
t

Efforts should be increased on the l op1 sourcing of raw
materials so that price of these products can be kept at affordable
level and thereby encourage brand loyalty.
Equally important is that consumers perception of quality
(measured by the attributes) that influence loyalty hinges very much
on the Nutritional value.
However, it is not likely that firms if left alone in seeking their
own goal of profit maximization will offer brands with high nutritional
value which contributes to the grooming of a healthy community. One
way of formalizing responsibility in this regard is with industry code of
conduct of ethical conduct that prescribes and enforces minimum
nutrient requirements in food drinks. But it is doubtful i f industry's
self regulation through the instrumentality of codes of conduct can
be as genuinely effective as some other measures with externalities. I
For this reason the National Agency for Food and Drug Administration
and Control (NAFDAC) should prescribe a'nd enforce to the letter the
basic nutrient requirements in food drinks especially in the new i
brands being introduced into the Nigerian market.

Another interesting conclusion drawn frqg-n the study is that
company image does not influence loyalty why brand name exerts a i b.
great influence on loyalty. Companies that are keen on introducing
new brands should therefore bear in mind that the big name of the
company may not attract patronage and loyalty to the new brands.
Rather they should focus on good quality of the product and
heavy advertising on the popular brand names already existing in the
market. This will help sustain loyalty of consumers.
5.3 AREAS FOR FURTHER RESEARCH
The issue of brand loyalty is a covert consumer behaviour.
There certainly has to be many underlying variables.
There is a need t o really find out the influence of Advertising
and Commercial Sponsorship in building of loyalty to brands. In the
case of Commercial Sponsorship, empirical evidence is needed to %
validate its theoretically and conceptually advanced benefits. i

Secondly, it is also an important issue to dieterrnine when brand
loyalty is actually developed. Is it as a child or an adult and what role
does each member of the family play in loyalty to particular brands.
Finally the issue of store loyalty and shopping habits of
consumers as major determinants of brand loyalty is worthy of C.
investigation.
5.4 CONCLUSION
This study has been a painstaking effort geared towards
ensuring authentic results which have practical applications in the
food drink industry.
This study has vindicated the claim of brand loyalty to
particular brands, an obvious indication of the conservatism and
inertia of consumers. This did not however give any company the
opportunity to glory in its past marketing successes. Such a mentality
is capable of enslaving them to their own history, corporate culture
and management psychology, making sales growth and general
growth impossible. i
This study also demonstrates that Marbting Experiment as a
means of discovery is a powerful method of obtaining experience and
information. It is quite possible, though painstaking, it should be
encouraged.

)r
BIBLIOGRAPHY
JOURNALS
1. Blatterg, Robert C. and Sen, Subrats K. "Market Segments and
Stochastic Brand Choice Models", Journal of Marketinq (February,
1 996).
2. Brown, George Brand Loyalty; Fact or Fiction ", Advertising Aqe
(January, 1953).
3. ' Celsi Richard and Oslon Jerry C. "The Role of lnvolvement in
Attention and Comprehension Process", Journal of Consumer
Research Vol. 15 September, 1998.
4. Day, George S. "A Two Dimensional C,oncept of Brand Loyalty",
Journal of Advertisinq Research Vol. 9 (September, 1969).
5. Day, Paul. "The New Consumer Values", Advertising Quarterly No. 56
(Summer 1 978). I
6. Jacoby Jacob and Kyner B. David, "Brand Loyalty Vs Repeat
Purchasing Behaviour Journal of Marketing Research Vol. 10
(February, 1 973).

9 0 kr
Kapferer, Jean-Noel and Laurent, Gilles, "Consumer Involvement
Profiles: A New Practical Approach to Consumer Involvement".
Journal of Advertising Research. (December 1985 - January, 1986).
Keun, Alfred, and Ralph. "Strategy of Product Quality", Harvard
Business Review, Vo1.49 No. 6 (Nov.-December, 1962).
Levitt TheodoreInMarketing Myopia", Harvard Business Review
(August 1960).
Lynn Sharon and Beatty, Kahle R. Homer Pamela "The involvement-
Commitment Model: Theory and Implications", Journal of Business
Research Vol. 16 (June 1978).
Massey William and Frank Ronald .Short Term Price and Dealing
Effects in Selected Markets, Journal of Marketing Research Vol 2
(May 1 987).
Mckenna Regis. "Marketing is Everything" Harvard Business Review
Vol. 87 No. 9, May, 1987. #
Peryam D. R and Pilgrim F. J. "The ,Hedonic Scale Method of
Measuring Food Preference". Food Technology Vol. I1 No. 9, (1 957).
Solomon Michale R. "The Missing Link: Surrogate Consumers in

ts Marketing Chains. Journal of Marketing, Vol. 50 (October, 1980).
15. Tucker W, T. "The Development of Brand Loyalty". Journal of
Marketing Research 1 (August, 1964).

92
W BOOKS
Assael, Henry Consumer Behaviour and Marketinq Actions 4'h ed.
(Boston: Kent, 1993).
East, Robert. Changing Consumer Behaviour (Cassel Educational
Limited 1993).
Ekechi T. 0. E. "Critical Factors Influencing Brand Choice of Food
Drinks in Enugu Metropolis (MBA Thesis University of Nigeria 1986).
Engel, J. F., Blackwell R. D. and Kollat P. M. Consumer Behaviour 3rd
ed. (I-lolt Rinehard and Wiston, New York 1978). -
Hart N. A. and Stapleton John. Glossary of Marketing Terms 2nd ed.
(London: William Heinemann Ltd, 1981).
Howard J. A and Seth J. N., The Theory of Buyer Behaviour, (John
Wiley and Sons, New York, 1969).
Jacoby Jacob and Chestnut Robert. "Brand Loyaltv: Measurement I
and Management. (New York: John Wiley Inc. ans Sons, 1978).
Kassarijan, Harold H. and Kassarijan Waltrand M. Attitudes Under
Low Commitment Conditions in John C. Maloney and Bernard i
silverman eds. Attitude Research Plays for High Stakes (Chicago:

t; American Marketing Association 1979);
Kotler, Philip. Marketinq Manaqement: Analysis, Planning and Control
6Ih ed. (Englewood, New Jersey: Prentice Hall Inc., 1994)
Lamb C. W and Hair J. F. Principles of Marketing (South Western
Publishing Coy. Cincinnati, Ohio USA 1994).
London D. L. and Bitta, Albert J. Della. "Consumer Behaviour,
Concepts and Applications (NY McGraw Hill inc. 1993).
Lutz Richard J and Bettman James R. Multi Attributes Models in
Marketing: A Bicentennial Review as in Consumer and Industrial
Buying Behaviour, Arch. G. Woodide, Jegdish N. Sheth and Bennet
eds. (New York: North Holland Publishing Coy.: 1977).
Nemmers Erwin E. Managerial Economics (NY: John Wiley and Sons
I nc. 1 962).
Nicosia F. M. Consumer Decision Processes (Englewood Cliff. New
Jersey Prentice Hall, 1966)..
0' Shaughnessy, John. Competitive ' ~ a r k e t i n ~ znd ed. (London:
Briddles Ltd., Guilford and King'slyn, 1998).
Osion Peter. Consumer Del~nviour and Marketing Strategy, (richard \
. 94
Y Irwin Inc. Boston, 1993).
17. Osvalsky Solomon and Richard W. Perceived Quality Consumers
Decision Making: an Integrated Theoretical Perspective in Perceived
Qualitv: How Consumers View Stores and .Merchandise, eds. Jacob
Jacoby and C. Oslon (Lexington, M. A. Lexington Books, 1985).
18. Reibstein David J, Marketing Concepts, Strategies and Decisions
(Englewood Cliffs, Prentice Hall Inc. l985),
19. Schifman Leon and Kanuk Leslie Kaza. Consumer Behaviour
(Englewood Cliffs New Jersey Prentice Hall Inc. 1993.
20. Vroom H. Victor. Work and Motivation (New York: John Wiley Inc. and
Sons 1964).

APPENDIX IA
SCHOOL OF POSTGRADUATE STUDIES
(MBA UNIT - MARKETING)
UNIVERSITY OF NIGERIA ENUGU CAMPUS
Dear Respondent,
Questionnaire on Food Drinks. This..questionnaire is intended
for use in research work. Please answer eacf'~ question sincerely. Your 4
answers will be used only for research and nothing else and we
promise on our honour to treat the information given with the strictest
confidence.
Indicate your responses by ticking ( ) where applicable. (Food
drinks refer to such drinks as Bournvita, Pronto, Milo, Ovaltine,
Nescao, etc).
1. Do you take food drinks in your home?
Yes ............................ No. ..................................
.................................................. 2. If no please indicate why i

3. What is your status in the family? Y
................................ .................... Husband.. DaughterISon..
Wife.. ...........................
4. Do you go to buy any particular brand of food drink?
....................... Yes ............................ N o. .. ......
5a. Mention the brand you will preferably buy .............,,.... .......
5b. Please rank the following brands according t o the order of your
preference (with the most preferred as 1 and least preferred as
Bournvita Nescao
Milo Pronto ?.
Ovaltine Vitalo
6. How often do you buy the same brand anytime you buy
Always
Very often
Occasionally
Very rarely
Not at 'all

lir
7. To what extent does the brand market price influence your
choice of food drinks
Very Strongly
Strongly
Moderately
Slightly
Very slightly
8. If the price of your favourite food drink is increased
considerably, more than the price(s) of others, you;
Definitely buy it
May buy it
Somehow may buy
May not buy it ,
Definitely will not buy. . 9. Which of the following brands will ;ou buy if the prices are the
same?
Milo

Bournvita
Ovaltine
Nescao
Pronto
Vitalo (Tick just one).
10. Does your choice of food drink depend on perceived attribute
of the brand?
Yes.. . . . . . . . . . . . . . . . . . . . . . . . . . . N o. . . . . . . . . . . . . . . . . . . . . . . . . . . . . . . . . . 11. Which of these attributes determines most importantly your
choice of food drink (choose one only).
(a) Milk content
(b) Taste
(c) Sugar contentllevel
(d) Dissolvability
(e) Nutritional value. 3
12. Rank the following attributes on the'level of importance in the
choice of food drink.
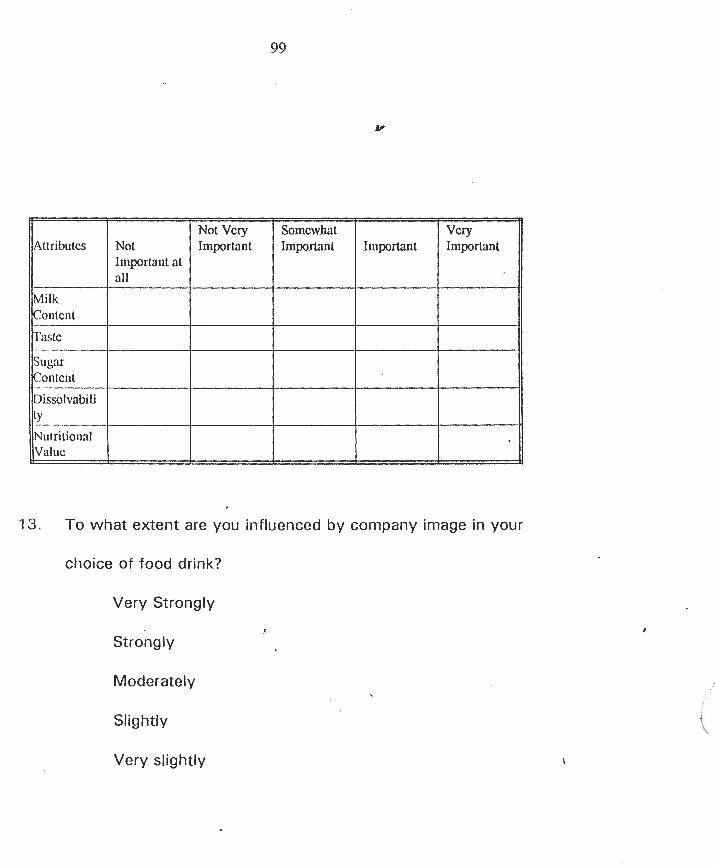
Inlporlatlt at all
ask
Dissolvabili
Itnportant Important LT
13. To what extent are you influenced by company image in your
choice of food drink?
Very Strongly
Strongly
Moderately
Slightly
Very slightly

100
14. To what extent are you influenced by bra@ popularity in your
choice of food drink.
Very Strongly
Strongly
Moderately
Slightly
Very slightly
15. Please state the level of your income
(a) Low income (b) Middle income (c) Upper income
16. What is the level of your education?
(a) B.Sc and.above (b) NCEIOND
(c) GCEISSCE (d) Primary Six.

101
APPENDIX IB rv
SCHOOL OF POSTGRADUATE STUDIES
(MBA UNIT - MARKETING)
UNIVERSITY OF NIGERIA ENUGU CAMPUS h
BLIND TASTE TEST QUESTIONNAIRE
This questionnaire is part of the instrument designed to collect
information for the investigation of consumer loyalty t o brands of
cocoa ,food drinks.
Procedure:
1. You will be served a cup of hot food drinks disguised as A, B,
C, D in turn.
2. Your are required to identify the brands.
3. After each brand is served, use the cup of water provided
rinse your rnouth and wipe your mouth dry.
4. The whole process is repeated until the four brands are
covered.
1. Rank the following Brands according to your preference.

Milo
Bournvita
Nescao
Ovaltine
The name of Brand A is
The name of Brand B is
The name of Brand C is
)i
The name of Brand D is
Please rank the following brands according t o your
preference
Brand A
Brand B
Brand C
Brand D

APPENDIX IIA p;r
TESTING OF HYPOTHESES
HYPOTHESIS I
Consistency in ~ u y i n g the Preferred Brand
To test the hypothesis, the responses were further categorized
P 3
into two: scores of 4 and 5 points were assigned to "very often" and
ALWAYS
63
"always" respectively and were classified as loyal while score from 3
to 1 points ranging from "occasionally" to "not at all" were classified
VERY OFTEN
68
as non loyal.
This gives rise t o two proportions of 60% for loyal consumers
and 40% for non-loyal consumers.
OCCASlO N ALLY
74
Ho = The two proportions aremot significantly different
Ha = The proportions are significantly different.
VERY RAWLY '.
10
Decision rule: eject Ho if To > Te ," . p'
NOT AT ALL
4

To = 3.03 Te = 1.533 (CL = 0.05) Since to > Te at both 5%
and 10Y0 levels of signaficance, H, is rejected.
Hence hypothesis 1 is accepted.
Note To is calculated T value, while Te is theoretical T value
from statistical tables.
OVERALL PREFERENCE RANKING OF FOOD DRINK BRANDS
TEST OF SIGNIFICANCE: PREFERENCE RANKING OF BRANDS
TABLE A 1
i
Table 4.5 is Table A1 analysed with mean scores and F-Ratio.
Ho = Mean scores are equal
PllONTO
VI'TALO
Ha = Mean scores are not all equal.
Decision rule is to reject Ho i f Fo > Fe
P
I 1
0
22
5
3 1
22
45
47
80
55
30
90

Hence Ho is rejected.
Thus mean scores of the consumers preference rankings are
significantly unequal.

APPENDIX 116 A"
HYPOTHESES l l
Price is an important influence on t h e loyalty of consumers to
particular brands.
TABLE A2
DEGREE OF PRICE INFLUENCE ON CONSUMERS
PRICE DIFFERENCE)
I( DEFINITEL I MAY BUY 1 OCCASION 1 VERY 1 NOT AT 11 1 Y,":,"" 1 j ALLY RARELY 1 ALL It
T o t e s t t h e hypothesis, t he response were further categorized
into two: scores of 4 and 5 points for "may buy" and "definitely will
buy" respectively classified a s resilient loyal consumers while those 1
with scores from 3 points t o 1 point for "somehow may buy" and
"definitely will not buy", classified a s non loyal consumers.
This gives rise to proportions of 51 % for loyal consumers and
49% of non loyal consumers.
Ho = The t w o proportions are equal
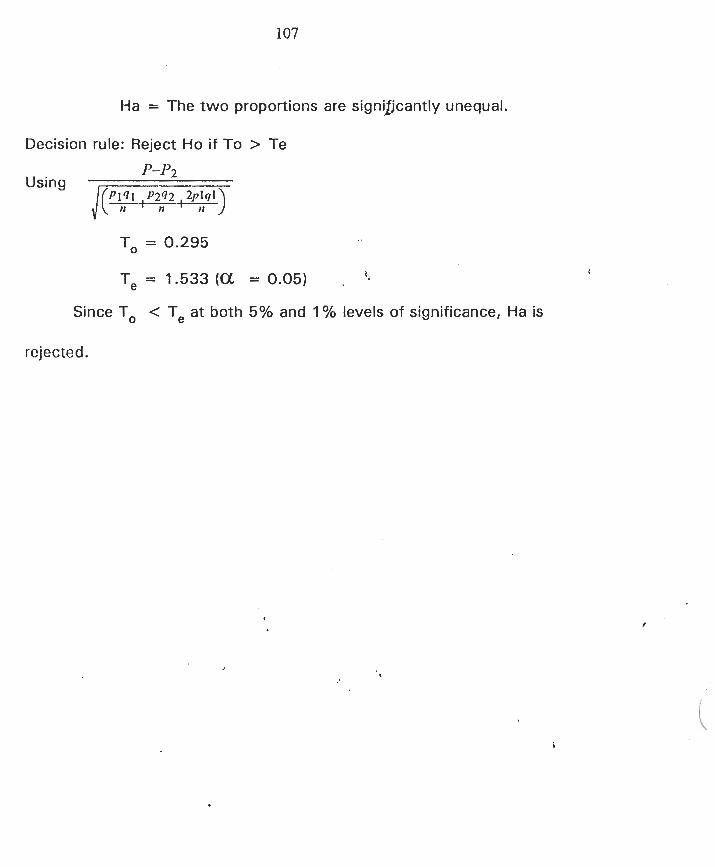
Ha = The two proportionsare signidjcantly unequal.
Decision rule: Reject Ho if To > Te
To = 0.295
T, = 1 ,533 (a = 0.05) . 5
Since To < T, at both 5% and 1 % levels of significance, Ha is
rejected.

APPENDIX IIC w
HYPOTHESES Ill
FREQUENCY DISTRIBUTION OF DEGREE OF IMPORTANCE OF
ATTRIBUTES IN CHOICE
AND PREFERENCE OF BRANDS
TABLE A 3
Test of Hypothesis
Ho = Means scores of all attributes are equal
1
D
Ha = Mean scores of all attributes are not all equal
Decision Rule: Accept Ha if Fo, (the calculated F - Ratio is greater than
the theoretical F - Ratio Fe).
#
h
Levels of significance (a ) = 5%, 1 % ie Degree of freedom = 4,
1094.
Milk Content
Tastc
S u g r Conlc~il
Dissolvability
Nutritional Value
Not Important at all
13
12
112
52
3
V W lniportant
-.
45
30
8
4
157
Not Vcry I~nprtant
16
38
58
47
6
Somcwllat Ilnprtant
38
-43
36
106 -----. I0
Important
107
96
16
10
43

F, = 2.09 ( a = 0.05) 2.80 (a = o.01) Y
Thus F, = 57.0922 > Fe (0.05, 0.01) 2.09, 2.80
Hence Ho is rejected. The mean scores are therefore not all equal.
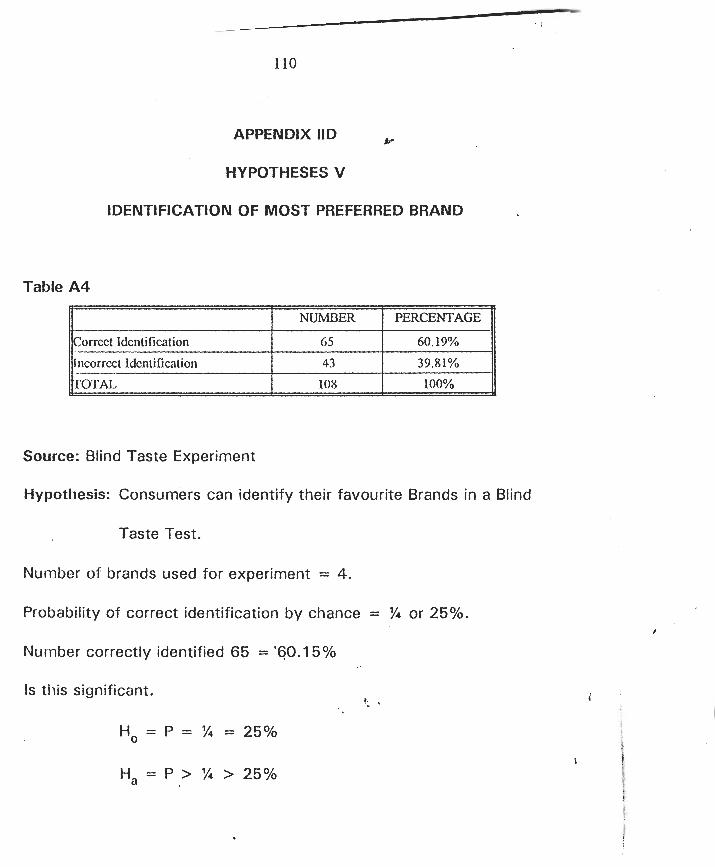
110
APPENDIX IID w
HYPOTHESES V
IDENTIFICATION OF MOST PREFERRED BRAND
Table A 4
I- Correct Idcnti fication
Source: Blind Taste Experiment
H lncorrccl Identification TOTAL
Hypothesis: Consumers can identify their favourite Brands in a Blind
NUMBER
65
Taste Test.
60.19%
43
108
Number of brands used for experiment = 4.
39.81%
100%
Probability of correct identification by chance = % or 25%.
Number correctly identified 65 = '60.1 5%
Is this significant. '; .

F, = calculated F - Ratio =
K = Number of successive ie number of consumers who iden.
their most preferred brands - correctly
N = Number of trials = 108
P = Theoretical proportion = '%
Fe = Theoretical F - Ratio with degrees of freedom 1, 2.
Decision Rule = Reject Ho if Fo > Fe
Substituting 1 = 2(108 - 65 + 1)
Thus F, = 130(1 - %) = 97.5'
88( % ) 2 2
4.43
8 .

Fe (88, 130) degrees of freedom at 5%, 1 % lev* of significance =
1.37, 1.56 respectively.
Fo = 4.43, > Fe 1.37, 1.56
Hence Ho is rejected
Thus we conclude that the proportion 60.1 9% who identified
their brands correctly is more than which could be attributed to
chance.