university of oklahoma graduate college...
TRANSCRIPT

UNIVERSITY OF OKLAHOMA
GRADUATE COLLEGE
PRODUCTION-INDUCED CHANGES IN RESERVOIR
GEOMECHANICS
A DISSERTATION
SUBMITTED TO THE GRADUATE FACULTY
in partial fulfillment of the requirements for the
Degree of
DOCTOR OF PHILOSOPHY
By
SUNDAY O. AMOYEDO Norman, Oklahoma
2011

PRODUCTION-INDUCED CHANGES IN RESERVOIR GEOMECHANICS
A DISSERTATION APPROVED FOR THE CONOCOPHILLIPS SCHOOL OF GEOLOGY & GEOPHYSICS
BY
___________________________ Dr. Roger M. Slatt, Chair
___________________________ Dr. Kurt J. Marfurt
___________________________ Dr. Shankar Mitra
___________________________ Dr. Deepak Devegowda
___________________________ Ms Martha Barnes

© Copyright by SUNDAY O. AMOYEDO 2011 All Rights Reserved.

DEDICATION
This dissertation is dedicated to my wife Ms. Olamide O. Falade and my late brother
Mr. Funsho M. Amoyedo.

iv
ACKNOWLEDGMENTS
I wish to tender my profound gratitude to the authorities of the University of Oklahoma,
ConocoPhillips School of Geology & Geophysics and the Graduate College for the
opportunity given me to pass through this great institution. It's an opportunity of a life
time and I am most grateful.
I am highly indebted to Dr. Roger M. Slatt and Dr. Kurt J. Marfurt for their unwavering
support, supervision and guidance while this program lasted. Despite their very tight
schedules, they still make time to meet students one on one. I wonder how they manage
their schedules. I couldn't have asked for more from these two great supervisors. I am
eternally grateful to them.
My profound appreciation also goes to other committee members- Dr. Mitra Shankar
(ConocoPhillips School of Geology and Geophysics), Dr. Deepak Devegowda
(Mewbourne School of Petroleum Engineering) and Ms. Martha Barnes (Marathon Oil
Corporation, Houston) for their support, opinion and advice on this thesis. I am very
grateful for all their contributions.
Posterity will not hold me innocent if I fail to acknowledge the effort of other faculty
members of ConocoPhillips School of Geology & Geophysics and Mewbourne School
of Petroleum Engineering, from whom I have received instructions towards this degree.
I have learned a lot from all of them and I am grateful.
I am also grateful to my family members both immediate and extended, who have
contributed in one way or the other towards my academic success. My wife, Ms.

v
Olamide O. Falade, has been very supportive and understanding while this program
lasted. I could not have asked for more from her. I appreciate your love and care. You
are indeed my world!
I wish to thank the management of Apache North Sea Ltd. for releasing their dataset for
this thesis. I am particularly grateful to Klaas Koster, Gregg Barker, Phil Rose, and Jack
Orman, all of Apache North Sea for their tremendous support.
All the administrative staff of ConocoPhillips School of Geology and Geophysics have
been wonderful. They were always there and ready to listen and advise. I am grateful to
Adrianne Fox, Teresa Hackney, Nancy Leonard and Donna Mullins. You all are great!
You made life a lot easier through your friendly smile and support. God bless you real
good.
My academic counselor, Mr. Donald Rodgers, was very helpful and supportive as well.
He always made time to meet me even when I failed to make a prior appointment as
required. I am grateful Mr. Don!
I am eternally grateful to all my friends, who have contributed in one way or the other
towards this program. I appreciate your support and friendship. To AASPI members
(present and alumni) and sponsors I say thank you all. I also want to say thank you to all
friends and colleagues at the Reservoir Characterization Institution, University of
Oklahoma.
Finally, I am full of praise to my Maker and Sustainer- the Source of life and the
ultimate Consciousness for His grace.

vi
TABLE OF CONTENTS
ACKNOWLEDGEMENT..............................................................................................IV
LIST OF TABLES..........................................................................................................X
LIST OF FIGURES.........................................................................................................XI
ABSTRACT.................................................................................................................XXI
1.0 INTRODUCTION.............................................................................................1
1.1 TIME LAPSE (4D) SEISMIC: LITERATURE REVIEW AND STATE
OF THE ART............................................................................................1
1.2 SCOPE OF WORK AND PROBLEM DEFINITION ...........................10
1.3 AIMS AND OBJECTIVES ....................................................................13
1.4 EXPECTED CONTRIBUTION ...........................................................15
1.5 LOCATION AND BASIC STRATIGRAPHY OF STUDY AREA......16
REFERENCES........................................................................................22
2.0 TIME LAPSE EFFECT AND PATTERN OF SAND PRODUCTION..... 27
2.1 INTRODUCTION...................................................................................27
ABSTRACT............................................................................................28
INTRODUCTION...................................................................................29
PRODUCTION/PRESSURE HISTORY AND WELL FAILURES... 32

vii
FORTIES TIME LAPSE (4D) SURVEYS: DATA BALANCING AND
QUALITY CONTROL.......................................................................... 34
TIME LAPSE EFFECTS AND RESERVOIR GEOMECHANICS...... 35
SAND PRODUCTION PATTERN....................................................... 37
CONCLUSION...................................................................................... 40
REFERENCES....................................................................................... 55
3.0 TIME-LAPSE (4D) SEISMIC EFFECTS: RESERVOIR SENSITIVITY
TO STRESS AND WATER SATURATION VARIATIONS...................58
3.1 INTRODUCTION................................................................................ .58
ABSTRACT......................................................................................... 59
INTRODUCTION ................................................................................. 60
TIME-LAPSE EFFECTS: ROCK SENSITIVITY TO STRESS AND
WATER SATURATION CHANGES................................................... 62
TIME LAPSE EFFECTS AND RESERVOIR GEOMECHANICS.... 67
DEPLETION AND SAND PRODUCTION PATTERN ..................... 68
AVO SENSITIVITY TO CHANGES IN WATER SATURATION AND
STRESS...................................................................................................70
TIME LAPSE DIFFERENCE: DECOUPLING SATURATION AND
PRESSURE CHANGES....................................................................... 71

viii
CONCLUSION...................................................................................... 76
REFERENCES....................................................................................... 89
4.0 SEISMIC DERIVED GEOMECHANICAL PROPERTIES OF
OVERBURDEN SHALE, FORTIES FIELD, UK NORTH SEA ............92
4.1 INTRODUCTION.................................................................................. 92
ABSTRACT........................................................................................... 93
INTRODUCTION.................................................................................. 94
RESERVOIR PROPERTIES OF FORTIES FIELD ROCKS .............. 96
OVERBURDEN INSTABILITY AND WELL FAILURES..................98
PRE-STACK SEISMIC INVERSION FOR OVERBURDEN
GEOMECHANICAL PROPERTIES................................................. 100
DISCUSSION OF INVERSION RESULT...........................................102
CONCLUSION.................................................................................... 104
REFERENCES .................................................................................... 118
5.0 APPLICATION OF TIME LAPSE (4D) GRAVIMETRIC SURVEY TO
RESERVOIR MONITORING: MODELING APPROACH......................121
5.1 INTRODUCTION ................................................................................121
ABSTRACT .......................................................................................122

ix
INTRODUCTION ............................................................................... 123
FORWARD MODELING ................................................................... 126
FIELD STRATIGRAPHY .................................................................. 128
MODEL LAYOUT AND COST CONSIDERATION..........................130
RESULTS AND DISCUSSION ......................................................... 132
CONCLUSION.................................................................................... 134
REFERENCES................................................................................ .....145
6.0 CONCLUSIONS AND RECOMMENDATIONS ...................................... 147
6.1 GENERAL CONCLUSION ............................................................... 147
6.2 RECOMMENDATIONS..................................................................... 150

x
LIST OF TABLES
Table 1: Rock and fluid properties .................................................................................66

xi
LIST OF FIGURES
CHAPTER ONE
Figure 1. Location map of Forties Field. The field, which is approximately 120 miles
NE of Aberdeen, Scotland, lies in the vicinity of other giant fields in the Central
graben. Image is modified from an internal document of Apache North Sea
Ltd........................................................................................................................18
Figure 2. Schematic diagram of the various architectural elements comprising the
Forties Field reservoir. Reservoir thickness varies between 200 and 300 m gross.
While the other elements are inter-connected to various degrees, the Charlie
complex is isolated. The cross section AA-BB on the map is shown on the litho-
cube in Figure 3. Image is modified from an internal document of Apache North
Sea Ltd.................................................................................................................19
Figure 3. Forties Field cross section on a lithology-indicator volume. See Figure 2 for
location. Image is modified from an internal document of Apache North Sea
Ltd....................................................................................................................... 20
Figure 4. Time structure of the regional seal, Sele Formation, with the five production
platforms, Alpha, Bravo, Charlie, Delta and Echo. In purple are the exploration
wells.....................................................................................................................21

xii
CHAPTER TWO
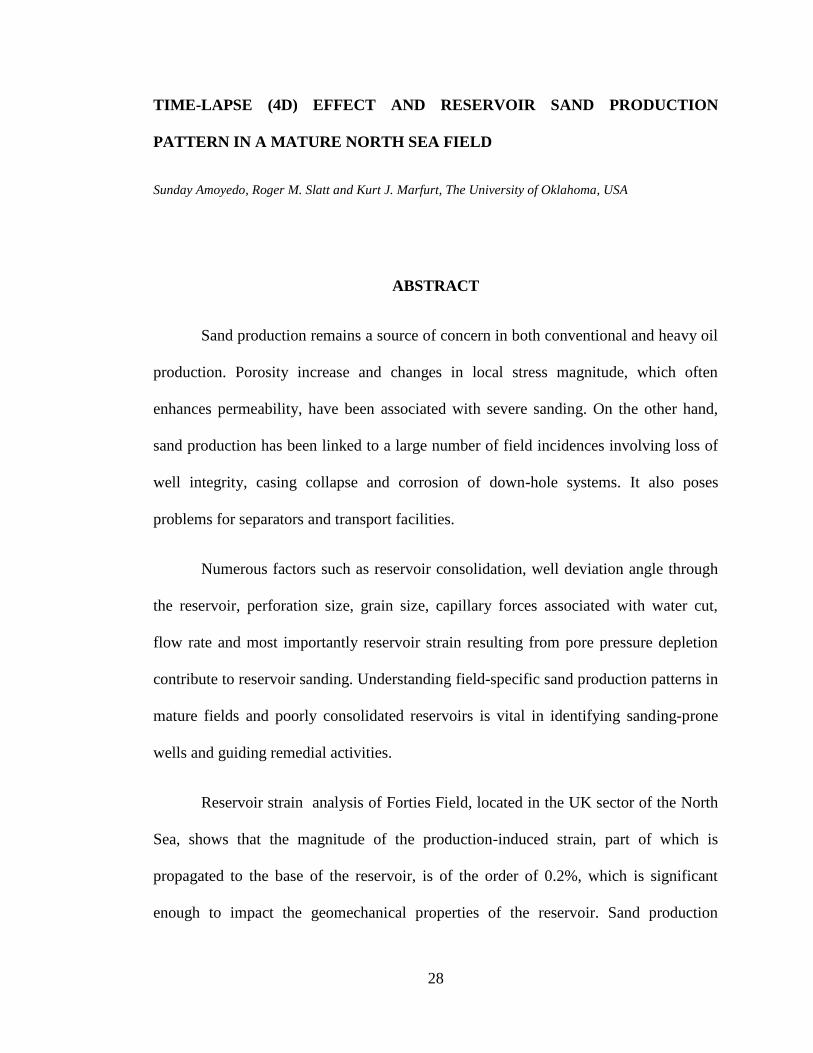
Figure 1. Examples of casing failure due to excessive sanding in the unconsolidated
Gudao reservoir of the Shengli field in China using ultrasonic televiewer. (a)
Three-dimensional view of shear failure and (b) Casing enlargement. Red
patches in (b) shows enlarged wellbore. (After Peng et al.,
2007)................................................................................................................... 41
Figure 2. Historical pressure profile of (a) Charlie and (b) non Charlie wells. Interval of
interpretation in this paper is marked by the red rectangle. Observe that within
the interval of study, reservoir pore pressure has been fairly steady in non
Charlie wells as opposed to a steady decrease of pressure in the Charlie wells,
producing the observed higher strain around the Charlie complex. A significant
increase in water injection accounts for the increase in pore pressure between
1985 and 1988.................................................................................................... 42
Figure 3. Profiles of average daily oil production and water injection for all wells in
Forties Field ....................................................................................................... 43
Figure 4. Shaping filter design. The above filter was used to balance the Forties Field
1988 and 2000 vintages. The frequency spectrum of the filter is the ratio of the
input spectra, while the phase are subtracted from each other........................... 44
Figure 5. Spectrum balancing: Comparing Forties Field 1988 survey before (upper
section) and after (lower section) the application of a shaping filter. Observe the
change in amplitude scale.......................................................................................... 45
xiii
Figure 6. Comparing a section of Forties Field 1988 (upper section) and 2000 (lower
section) surveys after spectrum balancing.......................................................... 46
Figure 7. Frequency spectra. (a) before, and (b) after 4D balancing of 1988 and 2000
vintages............................................................................................................... 47
Figure 8. Normalized Root Mean square (NRMS). Index of repeatability 200ms above
reservoir top........................................................................................................ 48
Figure 9. Time lag, ∆t, at the top of regional Sele seal. The high travel time lag around
the Charlie complex, due to a steady decrease in reservoir pore pressure, is an
indication of compaction in the Charlie complex. Production platforms are in
black squares...................................................................................................... 49
Figure 10. Computed strain, εzz, at the (a) top of the Sele regional seal, (b) base of the
reservoir. The significant pore pressure decline in Charlie wells accounts for the
high strain (> 0.2%) seen around the complex. Production platforms are in black
squares............................................................................................................... 50
Figure 11. Sand production per unit flow as a function of well deviation angle through
the reservoir. Colors represent wells from different complexes.
........................................................................................................................... 51
Figure 12. Crossplots showing average sand production increases with decrease in pore
pressure. Colors represent wells from different complexes............................... 52
Figure 13. Logs from a high-sand producing well in Forties field. Multiple and repeated
perforation coupled with high fluid flow rate contributed significantly to the

xiv
high sand production and the subsequent failure of the well. The red rectangle
marks the sand producing interval. KHL refers to horizontal permeability while
BVW is bulk volume of water ........................................................................... 53
Figure 14. An example of high well sanding not attributable to only one factor but a
combined effects of strain development, high flow rate and steep deviation angle
through the reservoir. The red rectangle marks the sand producing interval.
BVW refers to bulk volume of water, while Perf. refers to perforation .......... 54
CHAPTER THREE
Figure 1. Forties Field channel sands- Alpha, Bravo, Charlie, Delta and Echo. Profile
A-A’ on the acoustic impedance difference cube is shown in Figure 3.
Underlying the channel complexes are the Upper and Lower Main sheet sands.
Total thickness varies between 200 and 250 m.................................................. 77
Figure 2. Forties Field pore pressure history: (a) Charlie and (b) Non-Charlie wells. The
interval of interest between the two seismic surveys is marked by the red
rectangle. Pressure support in the field is through water injection.
............................................................................................................................ 78
Figure 3. Difference in Acoustic impedance, ∆Zp (b) The corresponding litho-cube
section. The Delta complex is observed to have significant depletion in this
section of the reservoir ...................................................................................... 79

xv
Figure 4. Images of core samples showing different overburden shale fabrics varying
from competent, fractured and layered to incompetent shale. Core photos from
McIntyre et al; 2009) ......................................................................................... 80
Figure 5. Overburden shale sensitivity to an increasing axial stress difference, σ, while
keeping the confining pressure constant. Increase in (a) compressional and (b)
shear wave velocities.......................................................................................... 81
Figure 6: Decrease in velocity at the top of Sele shale (Left) and increase in velocity
within the reservoir (right)...................................................................................82
Figure 7. Computed strain, εzz, at the (a) top of the Sele regional seal, (b) base of the
reservoir. The significant pore pressure decline in Charlie wells accounts for the
high strain (> 0.2%) seen around the complex. Production platforms are in black
squares................................................................................................................ 83
Figure 8. a) Sand production per unit flow as a function of well deviation angle through
the reservoir, b) average sand production increases with decrease in pore
pressure. Colors represent wells from different complexes........................... ... 84
Figure 9. Logs from two high-sand producing well in Forties Field. Multiple and
repeated perforation coupled with high fluid flow rate contributed significantly
to the high sand production in well A, while a combination of high strain, high
flow-rate and steep well deviation led to the failure of well B. The red rectangle
marks the sand producing interval. KHL and BVW refer to horizontal
permeability and bulk volume of water ............................................................. 85

xvi
Figure 10. AVO responses to changing (a) water saturation, Sw, and (b) stress.
Overburden shale velocity has been kept constant. The observed sentivities
provides the bases for pressure and saturation inversion from AVO attribute
difference volumes............................................................................................. 86
Figure 11. Sandstone sensitivity to changes in vertical effective stress, σv and water
saturation, Sw. The shear wave velocity sensitivity to change in water saturation
is assumed to be insignificant ........................................................................... 87
Figure 12. Time-lapse difference (1988-2005) inverted for changes in (a) pressure and
(b) water saturation at the top of the reservoir using differences in AVO
intercept and gradient. An edge detection attribute, Sobel filter, is shown in the
background. Injector wells are shown in blue squares...................................... 88
CHAPTER FOUR
Figure 1. (a) Unconfined compressional strength (UCS) versus Total porosity (b)
Young’s Modulus versus compressional strength. After Dewhurst et al., 2011
and Carmichael R.P. (2009)..............................................................................105
Figure 2. A plot of slowness (sonic transit time) versus density for both reservoir and
non reservoir. Forties field reservoir properties are controlled largely by the
volume of shale (VSH)......................................................................................106
Figure 3. Primary signature of anisotropy in Forties Field overburden: Variation of
slowness (sonic transit time) with dip. SV and SH refer to vertically and
horizontally polarized shear wave. After McIntyre et al., (2009).....................107

xvii
Figure 4. Cross plot of shear and compressional slowness for (a) overburden and
(b)reservoir sand. The correlation was used for the estimation of shear
velocity in wells with no or poor well data.......................................................108
Figure 5. Typical log responses in Forties field. Two blind wells were used to validate
the modeled shear wave velocity. The actual shear velocity (DTS) and model
DTS are shown in track 3 in both wells. The Sele Formation is marked with
green shades.......................................................................................................109
Figure 6. Images of core samples showing different overburden shale fabrics varying
from competent, fractured and layered to incompetent shale. Core photos from
McIntyre et al., (2009)..................................................................................... 110
Figure 7. (a) Cross plot of compressive strength (CS) at 200, 400 and 600 psi and
Young’s modulus, b) plot of unconfined compressive strength (UCS) at various
angles to the bedding plane. The variation of UCS with angle will severely
degrade the reliability of rock strength from elastic moduli. Colors in
the lower diagram represent measurements from rock samples
.......................................................................................................................... 111
Figure 8. Elastic moduli (Young’s and Shear moduli) in two wells showing competent
and weak overburden Sele Formation (marked by red rectangle). The weak
overburden in well B is indicated by low values of Young's and shear moduli.
This pattern of deviation from normal trend has been observed in other wells
that have experienced some instability in the
overburden........................................................................................................ 112

xviii
Figure 9. (a) Input CDP gather for simultaneous inversion. (b) Inversion result,
comparing synthetic data with the input volume. The regional Sele Formation is
highlighted by the green shading in both sections. Observe the gradual
decrease of amplitude with offset in the marked zone..................................... 113
Figure 10. (a) Acoustic Impedance and (b) Computed Young’s modulus. Sele
Formation is indicated by the purple pick, corresponding to low values of
impedance and Young's modulus. Gamma ray log is shown along the trajectory
of a well............................................................................................................ 114
Figure 11. Comparing seismic derived elastic moduli with computed moduli from well logs.
The zone of interest is marked the marked Sele Formation. Inversion parameters were
optimized for the overburden and less than optimum for the reservoir........................115
Figure 12. Young’s modulus of the Sele Formation. Zones of extreme weakness are marked by
white polygons. The fault network is shown in the background by an edge detection
attribute, the Sobel filter............................................................................................... 116
Figure 13. Shear modulus of the Sele Formation. Zones of extreme weakness are marked by
white polygons. The fault network is shown in the background by an edge detection
attribute, the Sobel filter .............................................................................................. 117
CHAPTER FIVE
Figure 1. a) Schematic diagram of the Remotely Operated Vehicle deployed Deep
Ocean Gravimeter (ROVDOG). (b) Sketch of the ROVDOG deployed at the
seafloor. (c) image of the system during recovery. (Images from Sasagawa et
al., 2002 ) and Zumberge et al., 2008).............................................................. 135

xix
Figure 2. Typical well log responses in Forties field (well AA and AA’). Observe the
contrast of density between the reservoir and overlying Forties shale. The
observed contrast in density between the reservoir and the surrounding shale
enhances the gravity anomaly when saturation changes within the
reservoir............................................................................................................ 136
Figure 3. The vertical gravitational attraction experienced by a body is governed by
Newton’s gravitational second law . For reservoir monitoring purpose, we
integrate the attractive force over the all point masses making up the
object................................................................................................................ 137
Figure 4. Bulk density increase as a function of water saturation. High porosity
reservoirs produce higher changes in bulk density, which enhances gravity
anomalies over the reservoir as water replaces oil.......................................... 138
Figure 5 . Basic stratigraphy of Forties field. The upper image shows the individual
units of the reservoir on a lithology indicator. Location of the section is shown
on the lower image.......................................................................................... 139
Figure 6 . Forties field pressure history, (a) for the Charlie complex and (b) the non –
Charlie complex. Observe the stronger depletion of pressure in Charlie as
opposed to the near-constant pressure in non-Charlie. ( c) Porosity change as a
function of confining pressure. Change in porosity is assumed to be negligible in
the forward modeling. Image from Apache North Sea Ltd. internal
document.......................................................................................................... 140

xx
Figure 7. 2D modeling of the reservoir. Overburden density was obtained from
extrapolated density logs. Lower image is a section from lithology indicator
volume that was used for the 2D modeling of the reservoir............................141
Figure 8. Gravity anomaly responses over the modeled reservoir at different water
saturations, assuming uniform drainage......................................................... 142
Figure 9. Gravity anomaly response over a by-passed unit of the reservoir (in red) lying
below the Charlie complex. Observed that the detection threshold in the
gravity anomaly lies between 10 and 20 % water saturation in adjacent reservoir
units.................................................................................................................. 143
Figure 10. Gravity anomaly (Net) response over a compacting reservoir unit (Charlie
complex) at various values water saturation. We varied subsidence between 5 m
and 22 m. Observe that a compaction threshold of 5m is required for detection.
The water saturation in the compacting zone is the same as other units in the
field................................................................................................................... 144

xxi
ABSTRACT
Sand production remains a source of concern in both conventional and heavy oil
production. Porosity increase and changes in local stress magnitude, which often
enhance permeability, have been associated with severe sanding. On the other hand,
sand production has been linked to a large number of field incidences involving loss of
well integrity, casing collapse and corrosion of down-hole systems. It also poses
problems for separators and transport facilities. Numerous factors such as reservoir
consolidation, well deviation angle through the reservoir, perforation size, grain size,
capillary forces associated with water cut, flow rate and most importantly reservoir
strain resulting from pore pressure depletion contribute to reservoir sanding.
Understanding field-specific sand production patterns in mature fields and poorly
consolidated reservoirs is vital in identifying sand-prone wells and guiding remedial
activities. Reservoir strain analysis of Forties Field, located in the UK sector of the
North Sea, shows that the magnitude of the production-induced strain, part of which is
propagated to the base of the reservoir, is of the order of 0.2 %, which is significant
enough to impact the geomechanical properties of the reservoir. Sand production
analysis in the field shows that in addition to poor reservoir consolidation, a combined
effect of repeated perforation, high well deviation, reservoir strain and high fluid flow
rate have contributed significantly to reservoir sanding.
Knowledge of reservoir saturation variation is vital for in-fill well drilling, while
information on reservoir stress variation provides a useful guide for sand production
management, casing design, injector placement and production management.
Interpreting time-lapse difference is enhanced by decomposing time-lapse difference
xxii
into saturation, pressure effects and changes in rock properties (e.g. porosity)
especially in highly compacting reservoirs. Analyzing the stress and saturation
sensitivity of the reservoir and overburden shale of Forties Field, I observe that while
pore pressure variations have not been significant in most parts of the field, a relatively
higher decrease in pore pressure in a region of the reservoir has affected the
geomechanical properties of both reservoir and overlying rock strata . I found that strain
development in the field accounts, in part, for increased reservoir sand production and a
negative velocity change in the overburden, which provides an indication of dilation. I
use changes in the AVO intercept and gradient calibrated with laboratory measurements
to decouple the time-lapse (4D) difference into saturation and pressure changes.
Furthermore, I propose a new modification to time-lapse AVO inversion workflows to
account for the effect of porosity change in measurements of time-lapse difference. This
is particularly crucial in highly-compacting chalk and poorly consolidated clastic
reservoirs.
Rock-physics-driven inversion of 3D pre-stack seismic data plays a prominent
role in the characterization of both reservoir and overburden rocks. Understanding the
rock physics of the overburden rock is required for efficient production of the reservoir
and to safeguard wellbore, down-hole assembly and supporting surface facilities.
Taking Forties Field as a case study, I observe that while instability and subsequent
failure of the overburden in the field can be linked to the rapid decrease of the
unconfined compressive strength (UCS) at inclinations close to 45 degrees to the
bedding plan, some zones in the overburden are characterized by extreme weakness
regardless of the well angle through the rock. I use the correlation between unconfined

xxiii
compressive strength and elastic moduli (Young's and Bulk moduli), coupled with the
results of simultaneous inversion to derive 3D elastic moduli, calibrated to laboratory
measurements, to characterize the zones of extreme weakness.
Time-lapse gravimetry continues to find increasing application in reservoir
monitoring, typically in gas reservoirs and reservoirs used for CO2 sequestration. There
is little or no application yet in oil-bearing reservoir monitoring, due in part to the low
density contrast between oil and brine and the high acquisition cost associated with the
required survey grid closely spaced. In this study, I model the 4D gravity anomaly over
Forties Field. Forties Field 4D gravity model results show that a significant increase in
water saturation (10-15%) is required to produce a resolvable 4D gravity anomaly. I
observe that time-lapse gravity anomalies can provide vital clues to reservoir
compartmentalization and by-passed oil when the saturation change is on the order of
10% or more. Reservoir subsidence can also give rise to a significant 4D gravimetric
anomaly. I observe a decreasing resolution of such compaction anomalies as water
saturation increases.

1
CHAPTER ONE
1.0 INTRODUCTION
1.1 TIME-LAPSE (4D) SEISMIC: LITERATURE REVIEW AND STATE OF
THE ART
The need to optimize production and recover as much oil as possible from producing
reservoirs has given rise to time-lapse (4D) seismic, one of several techniques for
reservoir monitoring. Other commonly adopted reservoir monitoring technologies
include: borehole surveillance, micro-seismicity, vertical seismic profiling (VSP),
natural fields (gravimetry and electromagnetic) and wired fields (permanent sensors).
Field economics, geology and suitability are some of the deciding factors in the
selection of the monitoring technique (s). First used in the late 1990s, time-lapse
seismic has quickly become the technique of choice.
The general working principle of time-lapse seismic has been known for quite some
time with a number of projects being carried out each year and reported in the literature.
The importance and relevance of 4D seismic varies from identifying by-passed oil to
gaining a better understanding of the reservoir (as well as the surrounding non-
reservoir) properties and responses to depletion (Anderson et al., 1998; Meadows, 2008;
Tura and Etuk, 2006; Hawkins et al., 2007; Robinson, et al., 2005; Weisenborn and
Hague 2005, etc).

2
Various methodologies and workflows have been implemented in different 4D seismic
studies with varying degrees of success. Such procedures emphasize feasibility and
repeatability in acquisition and processing for effective monitoring and interpretation.
The normalized root mean square, (NRMS), which serves an index of repeatability
between any two traces b(t) and a(t) within a time interval t1 and t2, is defined as :
.
]))(([]))(([
])}()({([*2
2
1
2
1
22
2
1
2
t
t
t
t
t
t
tatb
tatb
NRMS (1)
Repeatability in seismic acquisition and processing and the management of the
associated cost remain the sticking points in many repeat surveys, hampering successful
implementation and interpretation of 4D data.
Amplitude and impedance differences between two consecutive surveys are the most
commonly used attributes for 4D seismic interpretation, though several authors have
reported successful use of other subtle attributes such as time-lapse (∆t), AVO attributes
and self organizing waveforms. A critical component of any time-lapse study is rock
physics. Detailed analysis of reservoir rock behavior is crucial to the feasibility and
interpretation of time-lapse seismic.
Over the years, various authors have published the results of time-lapse seismic studies
conducted in producing reservoirs around the world.
In one of the earliest time-lapse seismic case studies which was carried out over the
South Timbalier 295 Field in the Gulf of Mexico, Anderson et al., (1998) used temporal
changes in amplitude to identify by-passed oil and to establish sand connectivity in the

3
reservoir. Their workflow emphasized the importance of coupled time-lapse studies and
calibrated reservoir simulation. In the same year, Johnston et al., (1998) discussed the
use of time-lapse changes in acoustic impedance between 1977 and 1992 as an
indication of fluid substitution in Fulmar Field, which is located in the central North
Sea. The authors concluded that time-lapse seismic plays a pivotal role in guiding
reservoir management decisions.
Koster et al., (2000) highlighted the importance of repeatability, modeling, history
matching, uncertainty handling and the impact of reservoir depletion methods on 4D
studies. Koster et al., (2000) further discussed the business impact of time-lapse and the
decision-making process involved. In another publication, Fanchi (2001) showed that an
integrated flow model in forward modeling of time-lapse differences helps greatly in
feasibility study for reservoir monitoring and measuring sweep efficiency. Huang
(2001) emphasized the role of production data coupled with time-lapse seismic in
making reservoir engineering decisions.
Lumley (2001) undertook a comprehensive analysis of 4D seismic, providing a general
overview of the concept as well as laying out the current workflow and predicting the
road ahead. The paper gave a summary description of the 4D effect observed in the
reservoir and also evaluated the potential of time-lapse seismic technology for
monitoring fluid and pressure changes in Fulmar Field reservoir, located in the North
Sea. Lumley (2001) further holds that with the current pace of development of
permanent reservoir monitoring, time-lapse may eventually give way to micro-seismic.
While micro-seismic studies continue to play a vital role in reservoir monitoring, its
deployment is still limited to conventional offshore terrains and shale plays as technical

4
difficulties and the associated cost remain unmanageable for ultra-deep offshore
reservoirs.
Olden et al., (2001) used modeling and synthetic datasets to understand the combined
effect of stress and fluid changes in a producing reservoir. The paper concluded that
extending modeling to a full-field 3D reservoir simulation model would lead to the
possibility of directly comparing the stress sensitive simulator response with an actual
time-lapse seismic survey. In the same year, Landro (2001) put forward a quantitative
workflow to decouple time-lapse difference in pressure and saturation effects by
combining amplitude variation with offset (AVO) attributes with laboratory
measurements. The paper also demonstrated the workflow using the Magnus 4D
datasets. This workflow was adopted for pore pressure detection sensitivities in
Gullfaks Field by Kvam and Landro (2001).
In one of the classic papers on production-induced reservoir strain, Hatchel and Bourne
(2005) implemented a workflow for seismic-derived reservoir strain. This methodology
involves the use of the time shift (Δt) and the rate of change of velocity with porosity.
The authors introduced the concept of the‘R’ factor, which relates the time strain (Δt/t)
to reservoir uniaxial strain (εzz). For poorly consolidated rocks, the factor, R is expected
to be less than 1.0 both in the reservoir and overburden. It must be emphasized that the
formulations in their paper assumed that porosity does not change significantly during
depletion, which might not hold for highly compacting reservoirs like chalks or over-
pressured sands.

5
Several other authors have focused on predicting time-lapse stress effects using coupled
geomechanical modeling (Herwangler and Horne, 2005; Sen and Settary, 2005;
Dusseault et al., 2007; Staples et al., 2007; Minkoff et al., 2006).
Hodgson et al., (2007) presented another method for inverting reservoir pressure change
using time strain (∆t/t) based on linear elasticity theory. The authors showed that the
vertical component of the strain tensor can be written as:
, (2)
where is the unknown reservoir pressure and G is the Green's function computed to
form a matrix of coefficients and M denotes the strain observation point.
Florich et al., (2005) provided another workflow to invert for both saturation and
pressure changes, which involves the use of statistical analysis of depletion-sensitive
seismic multi-attribute and training samples at well locations. The authors showed that
the relative amplitude change of depletion-sensitive attributes is a combination of
changes in saturation and pressure factors. They showed that for attributes 1....N, the
coefficients Cs and Cp can be computed and used for inverting pressure and saturation
changes at each training cell. This can be represented as:
For attribute 1:
i
p
oi
os
b P
yxPC
S
yxSC
A
yxA ),(),(),(
, (3a)
attribute 2:

6
i
p
oi
o
s
b P
yxPC
S
yxSC
A
yxA ),('
),('
'
),('
, (3b)
and attribute N:
i
pn
oi
os
n
bn
n
P
yxPC
S
yxSC
A
yxA ),(),(),(
, (3c)
where ∆A/A is relative amplitude change, while ∆S/S and ∆P/P are relative changes in
saturation and pore pressure relatively. The coefficients Cs and Cp are estimated at the
training cells. This workflow is strata-based and cannot be used for volumetric analysis.
The procedure also assumes that time-lapse difference is induced by saturation and
pressure changes only, without any changes in porosity.
Guilbot and Smith (2002) derived a 4D constrained depth method that uses time-lapse
seismic measurements with a mode of reservoir compaction. The methodology accounts
for velocity changes so that depth-converted seismic data and horizons give good
estimates of reservoir subsidence and compaction.
Accompanying reservoir production is a decrease in pore pressure often leading
to compaction in the reservoir. A significant amount of hydrocarbon production may be
associated with compaction. However, instability in overburden, subsidence and local
changes in stress state, which have negative effects on production, also accompany
compaction. Highlighting production-induced compaction in Valhall Field, located in
the Norwegian sector of the North Sea, Barkved and Kristiansen (2005), using multi-
component seismic coupled with geomechanical modeling, showed that after more than
20 years of production, subsidence at the sea floor exceeded 5.4-m and increased by

7
about 0.25 m/yr. Landro and Stammeijer (2004) proposed workflows (near and far
offset travel-time shifts and impedance changes) to estimate compaction and relative
velocity change associated with increased reservoir stress. The authors showed that for
NMO-corrected gathers relative change of velocity can be written as:
, (4)
where represent the near and far stack travel time lags and θN and θF
denote the incident angles for near far stacks.
Other authors that have focused on specific time-lapse effects in various fields include,
but are not limited to, Robinson et al., (2005)- Chirac Field, Weisenborn and Hague
(2005)- Gannet Field; Isaac and Lawton, (2006)- Cold Lake Canada; Tura et al., (2005)-
Mars and Europa Fields. Weisenborn and Hague (2005) provided a general working
principle as well as application of time-lapse seismic to well intervention programs.
Robinson and Ford (2005) gave a review of the time-lapse studies conducted over
Chirag Field in Apsheron Peninsula, Azerbaijan emphasizing the role of seismic
acquisition and processing in effective time-lapse monitoring. They went further to
report the elastic response to pressure change and fluid-front mapping from 4D seismic
surveys. Rickett et al., (2007) reported some excellent 4D effects at Genesis Field. They
described the concept of time strain in terms of reservoir compaction and how such a
concept could be used to describe the geomechanical properties of the reservoir as well
as predicting the effect of pressure changes from time strain.

8
Coupled simulation involving static field as well as geomechanical modeling is
gradually becoming the standard petroleum industry procedure as the industry continues
to deepen the knowledge of rock physics and geomechanics. Such simulations are
usually focused on the reservoir section and less attention is paid to understanding the
associated changes in geomechanical properties of the surrounding shale. This is
especially true in the deep and ultra-deep reservoirs where available information is
limited to the reservoir zone.
Time-lapse seismic continues to play a prominent role in reservoir monitoring while
other technologies (such as 4D gravimetry, 4D electromagnetic, time-lapse refraction,
borehole surveillance) continue to evolve. However, their application is still constrained
by field economics, resolution and repeatability.
A recent innovative procedure developed by collaboration between Scripps Institute of
Oceanography and Statoil Research Center has further advanced the use of gravimetric
survey as a reservoir monitoring tool in the marine environment. The collaboration
produced the world's first remotely operated marine gravimeter, which has been
successfully deployed in Troll and Sleipner Fields, North Sea (Havard et al., 2008;
Eiken et al., 2008; Zumberge et al., 2008).
A few other papers exist on the use of gravity anomalies for reservoir studies.
Krahenbuhl et al., (2010) presented a multi-component feasibility study of the
application of time-lapse gravity for CO2 monitoring in Delhi Field. Model results show
a strong likelihood of imaging bulk fluid movement though expected success may
decrease significantly in the thinner, up-dip regions of the reservoir. Tempone and

9
Landro (2009) described a method for modeling 4D gravity anomaly changes for a
reservoir undergoing compaction embedded in a homogenous half space with and
without a rigid basement. They observed that compaction can account for as much as
30-40 µGal for a pressure depletion of 10 MPa. Stenvold et al., (2008) and Gettings et
al., (2008), have also cited successes in the application of time-lapse gravimetry for
reservoir monitoring.

10
1.2 SCOPE OF WORK AND PROBLEM DEFINITION
While all the authors mentioned above and many more have carried out a number of
studies on providing the general working principle of 4D seismic, the role of rock
physics and understanding the reservoir response to saturation and pressure changes,
very little has been done to properly understand the response of the surrounding non-
reservoir rocks (overburden and underburden) to pressure depletion and saturation
change within the reservoir.
Few authors have recognized the need to understand the 4D effect on associated non-
reservoir rocks. Sayers (2007) has called for a coupled understanding of both reservoir
and non-reservoir responses in order to guarantee well stability and the safety of
supporting surface facilities. Many of the unexpected problems encountered in the latter
part of field development (sand production, overburden and well bore instability) could
be traced back to a lack of proper understanding of the responses of the reservoir and
overlying sediments to production effects. This knowledge gap is particularly
pronounced in the ultra deep offshore environment.
This study is designed to better understand the dynamics of interaction between the
reservoir and the surrounding shale. Overburden instability, occasioned by strongly
varying shale fabrics, continues to account for a large number of drilling and well
completion failures, especially in deepwater and poorly consolidated environments.
This study will attempt to characterize overburden elastic properties and identify
potentially unstable overburden using simultaneous inversion results.
11
There are varying degrees of in-fill well drilling problems in a depleting reservoir due to
a change in reservoir stress state associated with pressure depletion and saturation
change. Such difficulties are in some ways related to changes in geomechanical
properties. This study investigates the link between the changing stress regime and
observed drilling problems, and more importantly show how such difficulties could be
predicted before selecting the location of in-fill wells. Most reservoir compaction
analyses are carried out only when instability is seen to endanger the producing wells
and/or the supporting surface facility. The Ekofisk, Willmington, Dan and Valhall
Fields readily come to mind as typical examples. For example, remedial activities cost
over $1b in the case of Ekofisk apart from lost time. As such, early detection and
monitoring using time-lapse seismic coupled with well information is crucial to forestall
such occurrences.
Repeatability and data balancing are crucial to successful 4D seismic reservoir
monitoring. The questions remain- How repeatable are seismic surveys and what degree
of repeatability is acceptable? The challenge is not only technical, with field size and
production economics playing equally vital roles. Can we afford to embark on special
processing and balancing of surveys when the field is barely economical? How do we
handle physical structures like platforms and storage facilities already installed when
embarking on a repeat survey? All these and many more issues make repeatability an
eternal challenge. This study will implement a workflow to address the repeatability
challenge.
Sand production remains a source of concern in both conventional and heavy oil
production. Porosity increase and changes in local stress magnitude, which often

12
enhance permeability, have been associated with severe sanding. On the other hand,
sand production has been linked to a large number of field incidences involving loss of
well integrity, casing collapse and corrosion of down-hole systems. It also poses
problems for separators and transport facilities. Numerous factors such as reservoir
consolidation, well deviation angle through the reservoir, perforation size, grain size,
capillary forces associated with water cut, flow rate and most importantly reservoir
strain resulting from pore pressure depletion contribute to reservoir sanding.
Understanding field-specific sand production patterns in mature fields and poorly
consolidated reservoirs is vital in identifying sand-prone wells and guiding remedial
activities.
Knowledge of reservoir saturation variation is vital for in-fill well drilling, while
information on reservoir stress variation provides a useful guide for sand production
management, casing design and injector placement. Understanding reservoir response to
increase in stress and our ability to effectively use time-lapse seismic as a reservoir
pressure monitoring tool derive from rock sensitivity to water saturation and pressure
changes. Interpreting time-lapse differences is enhanced by discriminating between
saturation and pressure effects. Decoupling time-lapse (4D) measurements into
saturation and pressure effects, calibrated by well and production data, provides an
additional reservoir monitoring tool. This thesis will decouples pressure and saturation
changes in time-lapse differences, using changes in AVO attributes (intercept and
gradient) coupled with laboratory measurements of stress sensitivity and fluid
substitution models.

13
1.3 AIMS AND OBJECTIVES
Principal objectives of this dissertation include:
Investigating sand production patterns in high-sand producing wells with the
aim of identifying contributing factors as well as a possible link between time-lapse
effects and reservoir sand production. This objective involved the computation of
reservoir uniaxial strain and a detailed analysis of sand production pattern to identify
other factors, in addition to more well documented factors such as grain size and
perforation damage. The Forties Field, located in the UK sector of the North Sea was
used as a case study.
Simultaneously inverting for reservoir pressure and saturation changes using the
Forties Field 2000 and 2005 seismic surveys. The inversion workflow involved the use
of the Landro (2001) AVO attributes method coupled with laboratory measurements on
core samples. The formulations were modified to account for the effect of porosity
change, which could be dominant in some highly compacting reservoirs such as the
Ekofisk chalk reservoir.
Predicting overburden strength/weakness using 3D simultaneous inversion
results. A case study from the Forties Field was done, where over 65% of recent wells
have experienced some form of instability in the overburden associated with strongly
varying and unpredictable fabrics of shale. Characterizing the overburden fabrics helped
identify the zones of extreme weakness and provided a better guide for in-fill well
drilling through weak zones. The workflow involved the simultaneous inversion of

14
reservoir and overburden elastic properties calibrated with well log and laboratory
measurements.
Forward modeling of time-lapse gravimetry signatures of an oil bearing
reservoir undergoing compaction and fluid substitution. Modeling sensitivity include
compaction, porosity and saturation changes.

15
1.4 EXPECTED CONTRIBUTION
The study will:
Guide the understanding of field-specific sand production pattern, to help
identify high-sand prone wells, thus reducing production cost (new well, clean up) and
sustained production in the field and reduction in well shut-in incidences
The study amends Landro's (2001) pressure and saturation inversion workflow
to account for the effect of porosity, which could be significant in highly compacting
reservoirs (chalks and other carbonates).
Demonstrates the use of seismic-derived reservoir and non-reservoir
geomechanical properties to characterize weak zones, which often account for
instability and drilling failures in poorly consolidated environments.
The study promotes the use of time-lapse gravimetry in reservoir monitoring.
Forward modeling of 4D gravity anomaly provided a feasibility study for deployment of
gravimetry for monitoring oil bearing reservoirs as well as possible deployment for
monitoring compaction and subsidence in reservoirs.
16
1.5 LOCATION AND BASIC STRATIGRAPHY OF STUDY AREA
Forties Field, which is one of the early mega-fields discovered in the UK sector of the
North Sea, lies approximately 120 miles north-east of Aberdeen, Scotland (Figure 1).
The field was discovered in 1970 by BP with stock tank original oil in place (STOOIP)
estimated at over 5 billion barrels according to recent updates. Daily production, which
peaked at about 500 M barrel of oil per day (bopd) before decreasing to less than 100 M
bopd, is supported mainly by water injection. About 2.6 billion barrels have been
produced to date and daily production is expected to increase significantly over the next
couple of years from in-fill drilling campaigns.
Forties Field reservoir comprises Late Paleocene submarine fan sands, muds and shale.
The 100 to 200 m thick Forties sandstone can be divided into three units of roughly
equal thickness. The initial fan advance is represented by the lowest unit, the Lower
Main Sand, with the overlying Upper Main Sand being deposited as a fairly broad
channel complex. Both units extend across the whole field and they have not been
further subdivided. The topmost unit, the Channel Complex, consists of three major
sandy channel systems, the Delta/Echo, Bravo and Alpha in order of decreasing age,
together with areas of inter-channel mudstone (Thomas et al., 1974). The Charlie sand
is considered a distinct unit separated from the older sands by the Charlie Shale (Figure
2 and Figure 3).
The Forties fans and channel complexes are generally very friable and characterized by
excellent reservoir properties. Porosity runs as high as 35% while permeability is in the
range of a few Darcys. The high recovery factor, in excess of 45%, recorded in the field

17
bears testimony to the excellent reservoir properties. Over 340 wells have been drilled
(Figure 4), comprising 240 producers and 100 injectors since the commencement of
field development. While a good number of these wells have been abandoned, some
have continued to produce.

18
Figure 1. Location
map of Forties
Field. The field,
which is
approximately 120 miles NE of Aberdeen, Scotland, lies in the vicinity of other giant
fields in the Central graben. Image is modified from an internal document of Apache
North Sea Ltd.

19
Figure 2. Schematic diagram of the various architectural elements comprising the
Forties Field reservoir. Reservoir thickness varies between 200 and 300 m gross. While
the other elements are inter-connected to various degrees, the Charlie complex is
isolated. The cross section AA-BB on the map is shown on the litho-cube in Figure 3.
Image is modified from an internal document of Apache North Sea Ltd.

20
Figure 3. Forties Field cross section on a lithology-indicator volume. See Figure 2 for location. Image is modified from an internal
document of Apache North Sea Ltd.

21
Figure 4. Time structure of the regional seal, Sele Formation, with the five production
platforms, Alpha, Bravo, Charlie, Delta and Echo. In purple are the exploration wells.

22
REFERENCES
Anderson, N. R., G. Guerin, W. He, A. Boulanger, U. Mello, 1998, 4-D seismic
reservoir simulation in a South Timbalier 295 tubidite reservoir: The Leading Edge, 17,
1416-1417.
Barkved, O.I. and T. Kristiansen, 2005, Seismic time-lapse effects and stress changes:
Examples from a compacting reservoir: The Leading Edge, 24, 1244-1248.
Dusseault, M.B., S. Yin, L. Rothenburg, and H. Han, 2007, Seismic monitoring and
geomechanics simulation: The Leading Edge, 26, 610-620.
Eiken, O., T. Stenvold, M. Zumberge, H. Alnes, and G. Sasagawa, 2008, Gravimetric
monitoring of gas production from the Troll Field: Geophysics, 73, WA 149- 154.
Fanchi, J.R.; 2001, Time-lapse Seismic Monitoring in Reservoir Management: The
Leading Edge, 20, 1140 - 1147.
Gettings, P., D.S. Chapman, and R. Allis, 2008, Techniques, analysis and noise in a Salt
Lake Valley 4D gravity experiment: Geophysics, 73, WA 71-81.
Guilbot, J. and B. Smith, 2002, 4D constrained depth conversion for reservoir
compaction estimation: Application to Ekofisk Field: The Leading Edge, 21, 302-308.
Hatchel, P. and S. Bourne, 2005, Rocks under strain: Strain-induced time-lapse time
shifts are observed from depleting reservoirs: The Leading Edge, 24, 1222-1225.

23
Havard, A., O. Eiken and T. Stenvold, 2008, Monitoring gas production and CO2
injection at the Sleipner Field using time-lapse gravimetry: Geophysics, 73, WA 155-
161.
Hawkins, K., S Howe, S. Hollingworth, G. Conroy, L. Ben-Brahim, C. Tindle, N.
Taylor, G. Joffroy and A. Onaisi, 2007, Production-Induced Stresses from time-lapse
time shifts: A Geomechanics Case study from Franklin and Elgin Fields: The Leading
Edge, 26, 655-662.
Herwangler, J., S. Horne, 2005, Predicting time-lapse stress effects in seismic data: The
Leading Edge, 24, 1234-1242.
Huang, X., 2001, Integrating time-lapse seismic with production data: A tool for
reservoir engineering: The Leading Edge, 20, 1148-1153.
Hodgson, N., C. Macbeth, L. Ducanti, J. Rickett and K. Nihei, 2007, Inverting for
reservoir pressure change using time-lapse time strain: Application to Genesis Field,
Gulf of Mexico: The Leading Edge, 26, 649- 652.
Isaac, J.H and D.C. Lawton, 2006, A case history of time-lapse 3D seismic surveys at
Cold lake, Alberta, Canada: Geophysics, 71, B93-B99.
Johnston, D. H., R.S. McKenny, J. Verbeek and J. Almond, 1998, Time-lapse seismic
analysis of Fulmar Field: The Leading Edge, 17, 1420-1428.
Koster, K, P. Gabriels, M. Hartung, J. Verbeek, G. Deinum and R. Staples, 2000, Time-
lapse seismic surveys in the North Sea and their business impact: The Leading Edge,
20, 283-293.

24
Krahenbuhl, R. A., Y. Li, and T. Davis, 2010, 4D gravity monitoring of fluid movement
at Delhi Field, LA; A feasibility study with seismic and well data: Annual International
Meeting, SEG Expanded Abstract, 30, 4210-4214.
Kvam, O. and M. Landro, 2005, Pore-pressure detection sensitivities tested with time-
lapse seismic data: Geophysics, 70, O39-O50.
Landro, M. 2001, Discrimination between pressure and fluid saturation changes from
time-lapse seismic data: Geophysics, 66, 836-844.
Landro, M. and J. Stammeijer, 2004, Quantitative estimation of compaction and
velocity changes using 4D impedance and travel-time changes: Geophysics, 69, 949-
957.
Lumley, D. 2001, Time-lapse seismic reservoir monitoring: Geophysics, 66, 50-53.
Florich, M., C. Macbeth and R. Staples, 2005, An engineering-driven approach for
separating pressure and saturation using 4D seismic: Application to a Jurassic reservoir
in the UK North Sea: Annual International Meeting, SEG Expanded Abstracts, 24,
2464-2467.
Meadows, M., 2008, Time-Lapse Seismic Modeling and Inversion of Co2 saturation for
storage & Enhanced oil recovery: The Leading Edge, 27, 506-516.
Minkoff, S. E., C.M. Stone, S. Bryant and M. Peszynska, 2006, Coupled geomechanics
and flow simulation for time-lapse seismic modeling: Geophysics, 26, 200-2011.

25
Olden, P., P. Corbett, R. Wetserman, J. Somerville, B. Smart and N. Koutsabeloulis,
2001, Modeling combined fluid and stress change effects in the seismic response of a
producing hydrocarbon reservoir: The Leading Edge, 20, 1154-1163.
Rickett, J., L. Duranti, T. Hudson, B. Regel, N. Hodgson, 2007, 4D Time strain and the
seismic signature of Geomechanical Compaction at Genesis: The Leading Edge, 26,
644-647.
Robinson, N., A. Ford, D. Manley, M. Riviere, S. Stewart and R. Thomas, 2005, 4D
time-lapse monitoring of Chirac Field: The Leading Edge, 24, 928-932.
Sayers, C. M. and S. Chopra, 2007: Introduction to The Leading Edge Special Edition -
Rock Physics, 27, 15-16.
Sen, V., and A. Settari, 2005, Coupled geomechanical and flow modeling of
compacting reservoirs: The Leading Edge, 24, 1284-1286.
Staples, R., J. Ita, R. Burrell and R. Nash, 2007. Monitoring pressure depletion and
improving geomechanical models of the Shearwater Field using 4D seismic: The
Leading Edge, 26, 636- 642.
Stenvold, T., O. Eiken and M. Landro, 2008, Gravimetric monitoring of gas-reservoir
water influx- A combined flow- and gravity-modeling approach: Geophysics, 73, WA
123-WA 131.
Tempone, P., and M. Landro, 2009, Estimation of changes in gravity anomaly due to a
compacting reservoir: Annual International Meeting, SEG Expanded Abstract, 28,
3790-3794.

26
Thomas, A.N., P.J. Walmsley, and D.A.L. Jenkins, 1974, Forties Field, North Sea: The
American Association of Petroleum Geologists Bulletin, 58, No. 3, 396-406.
Tura, A., T. Barker, P. Cattiermole, C. Collins, J. Davis, P. Hatchel, K. Koster, P.
Schutjens and P. Wills, 2005, Monitoring primary depletion reservoirs using amplitudes
and time shifts from high-repeat seismic surveys; The Leading Edge, 24, 1214- 1221.
Tura, A. and U. Etuk, 2006, Time-Lapse Seismic for field development at Nembe creek,
Nigeria: The Leading Edge, 26, 1142-1149.
Weisenborn, T. and P. Hague, 2005, Time-lapse Seismic in Gannet A: One more lead
firmly integrated, The Leading Edge, 24, 80-85.
Zumberge, M., H. Aines, O. Eiken G. Sasagawa and T. Stenvold, 2008, Precision of
seafloor gravity and pressure measurements for monitoring: Geophysics, 73, WA 133-
141.

27
CHAPTER TWO
2.0 TIME LAPSE EFFECT AND PATTERN OF SAND PRODUCTION
2.1 INTRODUCTION
Sand production remains a major challenge in reservoir production , especially in poorly
-consolidated reservoirs and mature fields characterized by fine grains. The domain of
investigation and analysis of sand production has been in production engineering and
geomechanics, however, I have looked into the problem from a geophysical perspective.
In this chapter, I investigated reservoir strain (arising from changes in reservoir stress
state) and wellbore deviation angle as major factors in sand production, in addition to
well known causes. A case study is taken from the Forties Field, located in the UK
sector of the North Sea.
This chapter has been published in the Leading Edge September, 2011 special edition
on Time Lapse Seismic.
28
TIME-LAPSE (4D) EFFECT AND RESERVOIR SAND PRODUCTION
PATTERN IN A MATURE NORTH SEA FIELD
Sunday Amoyedo, Roger M. Slatt and Kurt J. Marfurt, The University of Oklahoma, USA
ABSTRACT
Sand production remains a source of concern in both conventional and heavy oil
production. Porosity increase and changes in local stress magnitude, which often
enhances permeability, have been associated with severe sanding. On the other hand,
sand production has been linked to a large number of field incidences involving loss of
well integrity, casing collapse and corrosion of down-hole systems. It also poses
problems for separators and transport facilities.
Numerous factors such as reservoir consolidation, well deviation angle through
the reservoir, perforation size, grain size, capillary forces associated with water cut,
flow rate and most importantly reservoir strain resulting from pore pressure depletion
contribute to reservoir sanding. Understanding field-specific sand production patterns in
mature fields and poorly consolidated reservoirs is vital in identifying sanding-prone
wells and guiding remedial activities.
Reservoir strain analysis of Forties Field, located in the UK sector of the North
Sea, shows that the magnitude of the production-induced strain, part of which is
propagated to the base of the reservoir, is of the order of 0.2%, which is significant
enough to impact the geomechanical properties of the reservoir. Sand production

29
analysis in the field shows that in addition to poor reservoir consolidation, a combined
effect of repeated perforation, high well deviation, reservoir strain and high fluid flow
rate have contributed significantly to reservoir sanding.
INTRODUCTION
Sand production is not uncommon in producing fields. Its severity, however,
remains a growing concern in many mature fields and in deep-water reservoirs often
characterized by poor consolidation. Reservoir sand production is simultaneously a
source of concern and benefit in conventional and heavy oil production. Porosity
increase and changes in local stress magnitude, which often enhances permeability,
have been associated with severe sanding. On the other hand, sand production has been
linked to a large number of field incidences involving loss of well integrity, casing
collapse and corrosion of down-hole systems. It also poses problems for separators and
transport facilities. The poorly consolidated Gudao reservoir in Shengli Oilfield, China
provides a typical example of casing failure (Figure 1), resulting from severe reservoir
sanding (Peng et al., 2007). Sand production-induced casing problems can vary from
complete shearing to contortion of well casing depending on the severity of the sand
flow.
Prominent among the causes of reservoir sanding include, among others;
reservoir consolidation, well deviation through the reservoir, perforation size, depth of
penetration, grain size, perforation-induced damages, capillary forces associated with
water cut, flow rate and most importantly in Forties Field, (UK North Sea) reservoir

30
time-lapse strain resulting from pore pressure depletion. Substantial strains (> 0.2%)
can be induced by the effective and shear stress changes on the reservoir rock. This
strain is sufficient to severely degrade the reservoir grain cohesion by breaking the
small amount of brittle grain-grain mineral cements, thereby reducing the sand strength
(Zhang and Dusseault, 2004).
Papamichos et al., (2001) demonstrated, using a hollow cylindrical specimen,
that cumulative sand production increases linearly with fluid flow rate and effective
stress. Observing the mechanism and accounting for all possible factors of sand
production in a producing reservoir is difficult in practice. The task becomes harder
with poor availability of field records; most sand production records are typically
incomplete, when they exist.
Reservoir monitoring for pressure, temperature and fluid production has long
been a critical element of field exploitation to optimize hydrocarbon recovery. Time-
lapse (also called 4D) seismic has joined borehole and production-based techniques in
providing a measure of changes in the reservoir between the producer and injector
wells. The importance and relevance of 4D seismic varies from identifying reservoir
compartmentalization, monitoring fluid fronts and identifying by-passed oil (Anderson
et al., 1998; Meadows, 2008; Tura and Etuk, 2006; Robinson et al., 2005; Weisenborn
and Hague, 2005). Other applications include pressure monitoring, strain analysis and
perturbation of local stress in the vicinity of the well (Sayers and Schutjens, 2007;
Hatchell and Bourne, 2005). Time-lapse seismic requires consecutive seismic volumes
to be conformable in data acquisition and processing. Most recent 3D seismic
campaigns have repeatability inconsideration, right from the acquisition design stage for
(b)

31
use as a base survey for later acquisition. However, such foresight has not always been
the case, such that the challenge remains how best to compare two seismic volumes that
are not conformable in acquisition or processing in order to compute changes in
reservoir properties induced by depletion.
In this paper, we investigate sand production patterns in several high-sand
producing wells in Forties Field, UK. We search for contributing factors as well as a
possible link between time-lapse effect and sand production/well failures. Forties Field,
which lies in the UK sector of the North Sea, is located approximately 180 km NE of
Aberdeen, Scotland. We observe that the magnitude of the production-induced strain,
part of which is propagated to the base of the reservoir, is of the order on 0.2%, which is
significant enough to induce the weakening of grain cohesion, thereby impacting the
geomechanical properties of the reservoir (Zhang and Dusseault, 2004). Our analysis of
sand production in the field shows that in addition to the well-known causes of sanding
(e.g. poor reservoir consolidation, high well angle of deviation through the reservoir and
high flow rate), reservoir strain resulting from pore pressure depletion, also contributes
significantly to reservoir sand production in Forties Field.

32
PRODUCTION/PRESSURE HISTORY AND WELL FAILURES
The reservoir of the Forties Field comprises Late Paleocene submarine fan sands
as well as mud and channel complexes. The 100 to 200 m thick Forties Sandstone can
be divided into three units of roughly equal thickness. The initial fan advance is
represented by the lowest unit, the Lower Main Sand, with the overlying Upper Main
Sand being deposited as a fairly broad channel complex. Both units extend across the
entire field and have not been further subdivided. The topmost unit, the Channel
complex, which lies beneath a thick, monotonous section of gray to brown variably
calcareous and carbonaceous upper Paleocene to Holocene mudstones (Thomas et al.,
1974), consists of three major sandy channel systems- the Delta/Echo, Bravo and Alpha
in order of decreasing age, together with areas of inter-channel mudstone. The youngest
Charlie Sand is considered a distinct unit separated from the older sands by the Charlie
Shale.
The Forties fans and channel complexes are generally very friable. Porosity runs
as high as 35% and permeability is in the range of a few Darcys. The high recovery
factor, which is in excess of 45%, bears testimony to the excellent reservoir porosity
and permeability of the Forties Field reservoir. A more comprehensive description of
field geology and stratigraphy is given by Thomas et al., (1974) and Hill and Wood
(1980).
Significant targets in the deeper section of the field have been identified and are
currently being evaluated. The field remains very productive and still commands a
significant investment from the operator. Over 350 wells have been drilled in the field

33
since the commencement of exploration and field development in the 1970s. While a
number of these wells have been abandoned, some have continued to produce for more
than 15 years.
Forties Field cumulative production, which is supported by water injection, is in
excess of 2.5 billion barrels. Reservoir pressure has been generally well-maintained
field-wide, though steep decreases have been recorded in the Charlie sands causing a
depletion-induced stress in the production zone, especially within the time interval
being studied in this paper. Figure 2 shows pressure measurements for the Charlie
reservoir from 1975 to 2009. The marked interval (1988-2000) represents the time
interval between the seismic surveys.
Forties Field continues to produce through a comprehensive reservoir
monitoring program. This concerted effort to keep the 'giant' alive has been faced with a
series of difficult drilling, well-completion and severe sand production problems. These
problems result in lost production and corrosion of materials. Where possible, remedial
activities cost millions of dollars per annum and often lead to the loss of wells. These
losses ultimately add to production cost. The unpredictable and strongly varying fabrics
of shale types in the overburden also pose a major challenge during drilling in Forties
Field, where over 65% of wells drilled between 2002 and 2007 have experienced some
form of instability problem (McIntyre et al., 2009).

34
FORTIES TIME-LAPSE (4D) SURVEYS: DATA BALANCING AND QUALITY
CONTROL
Various reservoir monitoring studies on Forties Field have been published by
different authors targeted at identifying and developing by-passed potentials. Ribeiro et
al., (2007) reported the time-lapse (4D) effect observed between 2000 and 2005
surveys. No previous studies however, have been reported on production-induced
changes in reservoir geomechanics and how such changes, when coupled with well
parameters, have contributed to sanding and multiple well failures in the field. This lack
of comparison is in part due to the non-conformable seismic volumes available for that
period. The first 3D seismic survey was acquired in 1988, using 25 x 25 m bins, after a
production of about 1.8 billion barrels of oil (Figure 3). A further 600 million barrels of
oil production separates the 1988 survey and the next 3D survey in 2000, which was
acquired on a smaller 12.5 x 12.5 m bins, rotated 220 from the initial 1988 grid.
To achieve conformity between the 1988 survey and 2000 surveys we employ a
workflow that included re-gridding, de-noising, and frequency/amplitude spectral
balancing (Figures 4-6). Extensive quality control is necessary to avoid signal
distortion from the use of shaping filters. A comparison of the spectra before and after
the application of a shaping filter is shown in Figure 7.
The normalized root mean square (NRMS), serves an index of repeatability between
any two traces b(t) and a(t) within a time interval t1 and t2, is defined as

35
2
1
2
1
22
2
1
2
]))(([]))(([
])}()({([*2
t
t
t
t
t
t
tatb
tatb
NRMS (1)
Although lower values of NRMS are desirable, the NRMS at 200 ms above the regional
seal (the Sele Formation), was of the order of 0.30 (Figure 8), well within the typical
threshold for more modern 4D surveys (Helgerud et al., 2009). A perfectly repeated
survey should have a NRMS value of 0.0 for regions devoid of production effects.
Factors including weather and other random noise, differences in processing artifacts
due to differences in spatial sampling, acquisition footprint and physical obstructions
such as drilling rigs and production platforms contribute to higher values of NRMS.
TIME-LAPSE EFFECTS AND RESERVOIR GEOMECHANICS
Not only does time-lapse seismic have applications in fluid front monitoring,
delineating reservoir compartments, analyzing fluid migration pathways in CO2
sequestration and heavy oil development, it has also become an important tool for
monitoring reservoir stress changes and the accompanying strain. Time-lapse effects
include changes in amplitude (reflectivity) as well as time lags between two surveys
(t), which in turn can be due to changes in velocity (due to pressure, saturation and
porosity changes), and reservoir strain, zz, (due to stress increase and compaction).
We cross correlated the 1988 and 2000 surveys (after estimating and removing
the background time shift) to compute the time lag between them. The background time

36
lag was estimated at a region immediately above the regional Sele shale, which we
assumed to be the seal, devoid of production effects.
The time lag, ∆t = T2000 - T1988, at the top of the regional Sele seal ranges from
about +7.0 ms above the Charlie sandstone to near 0.0 ms above other complexes,
conforming to the production and pressure depletion profiles. The field pressure history
shows that pressure depletion is higher in the Charlie sandstone, giving rise to the
observed high time lag shown in Figure 9. A decrease in pore pressure leads to an
increase in stress carried by the load-bearing rock frame of the reservoir, inducing
compaction within the reservoir. This compaction may be accompanied by micro-scale
deformation mechanisms such as cement breakage at grain contacts, grain sliding and
rotation (Sayers and Schutjens, 2007). While the reservoir compacts and subsides, the
overburden shale dilates in order to maintain stability. This compaction in the reservoir
and dilation in the overburden, when significant, can give rise to geomechanical
problems such as wellbore instability, severe sanding, subsidence, roof cracks, and
ultimately the failure of the overburden.
Hatchell and Bourne (2005) showed that fractional changes in velocity occur
in proportion to fractional changes in path length, T. Thus, the time strain for normal
incidence P-waves can be written as:
zzRTT )1(/ (2)
where R defines the ratio of 4D fractional velocity changes to fractional thickness
changes and zz is the uniaxial strain. Hatchell and Bourne (2005 ) found that R lies in
the range 4 < R < 8 for rocks undergoing extension, whereas R lies in the range 0 < R <

37
2 for rocks undergoing compaction (Sayers, 2010) . In Forties Field, R = 0.75 within the
reservoir while R = 0.70 in the overburden. This range of values lies outside most
reported figures. Such anomalous values could be due to the high porosity and the
extremely weak frame characterizing the Forties reservoir and overburden shale,
suggesting a good potential for grain-on-grain contact squeezing and dilation within the
reservoir and overburden, respectively. Sayers (2010) suggested that sandstone
sensitivity to stress cannot be explained solely by porosity reduction but also requires
grain to grain squeeze, thereby altering the grain aspect ratio. The Charlie sands and
Southern inter-channel area are observed to have high strain associated with increased
stress, while the other areas have experienced minimal strain, conformable with field
pressure history. The analysis also shows that stress increase is not confined to the top
and within the reservoir, but is also propagated to the reservoir base inducing significant
velocity change and potential instability (Figure 10).
SAND PRODUCTION PATTERN
Forties Field has been plagued by severe sand production and an array of
drilling and completion problems. Severe sanding in this mature UK North Sea field
often leads to loss of wells, reduced production, increased cost of production (associated
with clean up, drilling of side-track wells and corrosion prevention). Understanding the
field-specific sand production mechanism(s) and sanding pattern in Forties Field will go
a long way in identifying vulnerable wells and guiding remedial actions. Incomplete
sand production records and difficulty in eliminating transitional sanding due to

38
extraneous factors, such as work-overs, limit the amount of available data and reliability
of sand production analysis.
While poor consolidation has contributed largely to sand production in the field,
we observe that other factors such as multiple completion, high well deviation angle,
flow rate and increase in effective stress have contributed significantly to sanding.
Specifically, we observe a gradual increase in sanding as the well deviation angle
through the reservoir increases (Figure 11). The observed correlation is not unexpected.
This is because of the higher perturbation of particle cohesion as deviation angle
increases coupled with a potential for higher exposure areas. Furthermore, a good
correlation is observed between pore pressure decrease and sand production (Figure 12).
The increase in the matrix-supported load resulting from a decrease in pore pressure can
lead to a displacement of grain particles within the sand matrix and thus trigger a re-
alignment of grains with more sand being produced in the process. While these
observations and correlation may be true, each element cannot fully account for the
pattern of sanding individually. In other words, sand production is a combined effect of
the afore-mentioned factors, with some factors playing more prominent roles than
others.
Figure 13 shows a typical failed well due to excessive sanding from Forties
Field. While increase in effective stress around the well and well deviation are less
significant, the well failure can be linked directly to high fluid flow rate and the
weakening of grain cohesion resulting from multiple and repeated perforations over the
years. In some cases, the failures are not due primarily to fluid flow rate and repeated
perforations, but to significant reservoir strain arising from pore pressure depletion. In

39
other cases, severe sanding have been recorded due to all these factors combined.
Figure 14 is a typical case of high deviation angle, significant strain development
around the well and high flow rate.

40
CONCLUSION
Sand production remains a source of concern in both conventional and heavy oil
production. Factors such as reservoir consolidation, well deviation angle through the
reservoir, perforation size, depth of penetration of perforation, grain size, capillary
forces associated with water cut and flow rate and, more importantly, reservoir strain
resulting from pore pressure depletion contribute to reservoir sanding. Understanding
field-specific sand production patterns in mature fields and poorly consolidated
reservoirs is vital in guiding remedial activities and identifying sanding-prone wells.
The Forties Field time-lapse seismic study using the 1988 and 2000 seismic
surveys reveals an increased stress associated with pore pressure changes in the Charlie
complex. The high time lag in the overburden shale above the Charlie sandstone
suggests a significant increase in the reservoir stress. Reservoir strain analysis shows
that the magnitude of the production-induced strain, part of which is propagated to the
base of the reservoir, is of the order on 0.2%, which is significant enough to impact the
geomechanical properties of the reservoir. We observe a correlation between sand
production and time-lapse effect. Results of sand production analysis in Forties Field
shows that in addition to poor reservoir consolidation, high well angle of deviation
through the reservoir and high flow-rate, which are the well known factors, reservoir
strain, due to pore pressure depletion, is observed to contribute significantly to sand
production. For poorly-consolidated reservoirs, maintaining reservoir pressure at or
close to initial condition does not only help sustain hydrocarbon production, it also
serves as a sand production management tool.
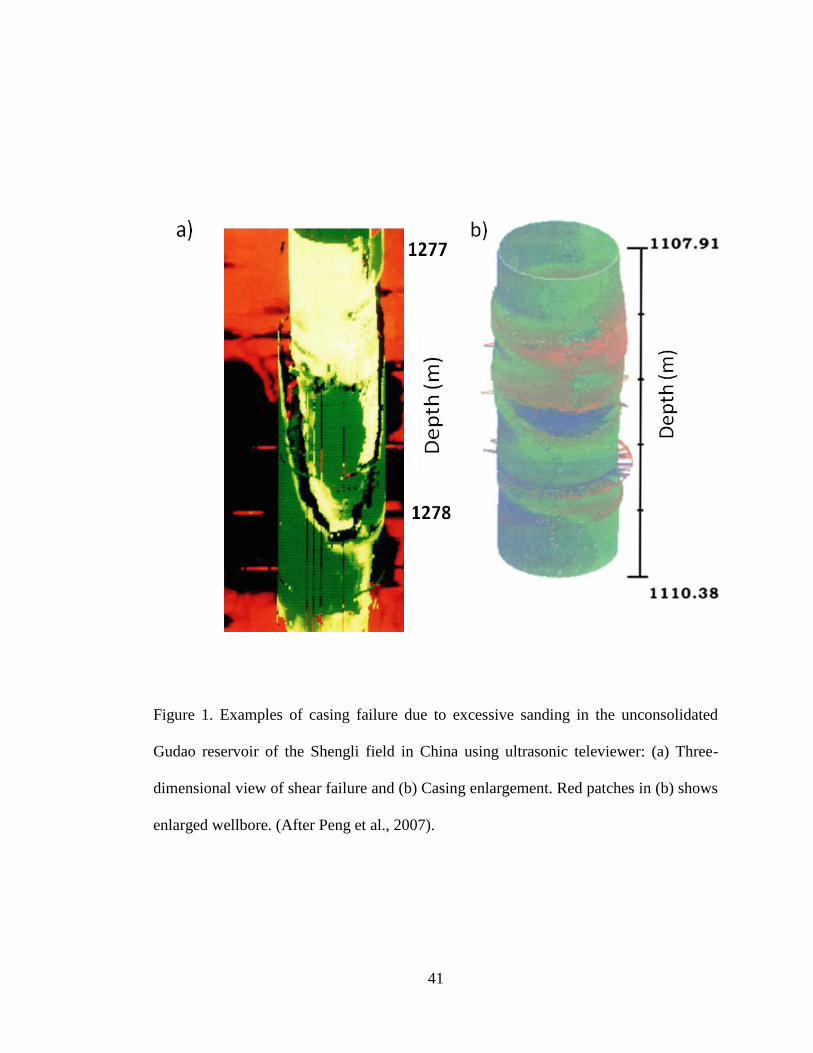
41
Figure 1. Examples of casing failure due to excessive sanding in the unconsolidated
Gudao reservoir of the Shengli field in China using ultrasonic televiewer: (a) Three-
dimensional view of shear failure and (b) Casing enlargement. Red patches in (b) shows
enlarged wellbore. (After Peng et al., 2007).

42
Figure 2. Historical pressure profile of (a) Charlie and (b) non-Charlie wells. Interval of
interpretation in this paper is marked by the red rectangle. Observe that within the
interval of study, reservoir pore pressure has been fairly steady in non-Charlie wells as
opposed to a steady decrease of pressure in the Charlie wells, producing the observed
higher strain around the Charlie complex. A significant increase in water injection
accounts for the increase in pore pressure between 1985 and 1988.

43
Figure 3. Profiles of average daily oil production and water injection for all wells in
Forties Field.
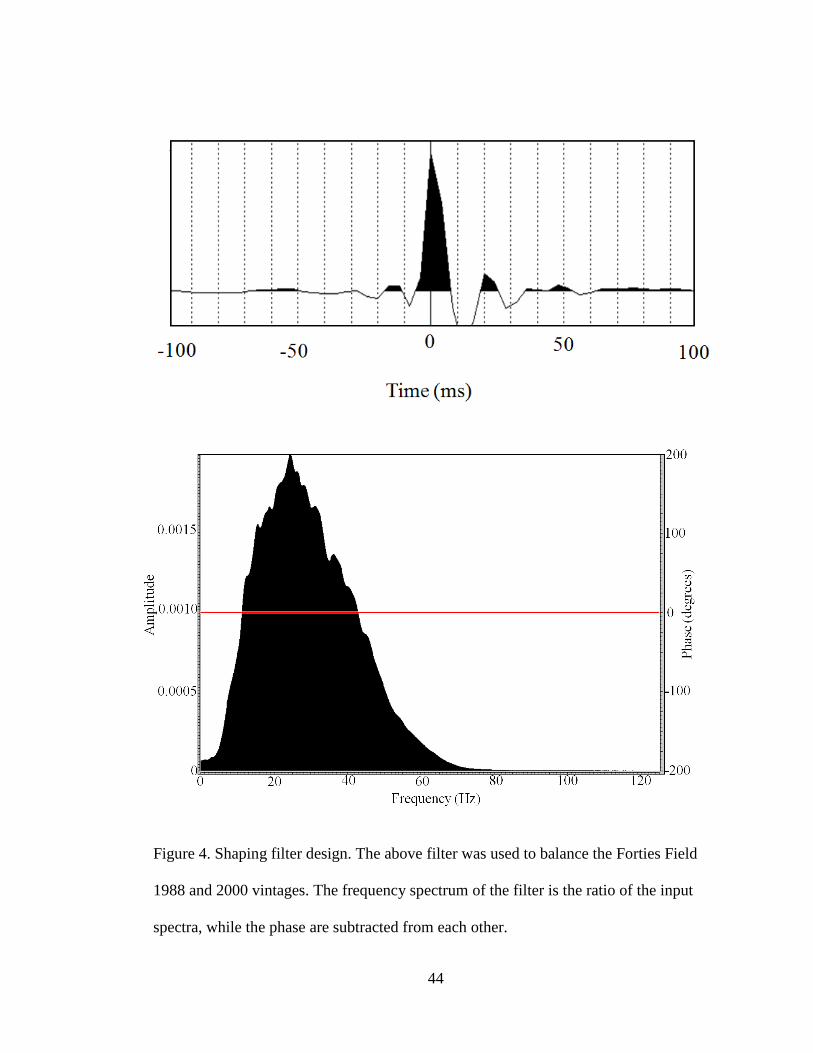
44
Figure 4. Shaping filter design. The above filter was used to balance the Forties Field
1988 and 2000 vintages. The frequency spectrum of the filter is the ratio of the input
spectra, while the phase are subtracted from each other.
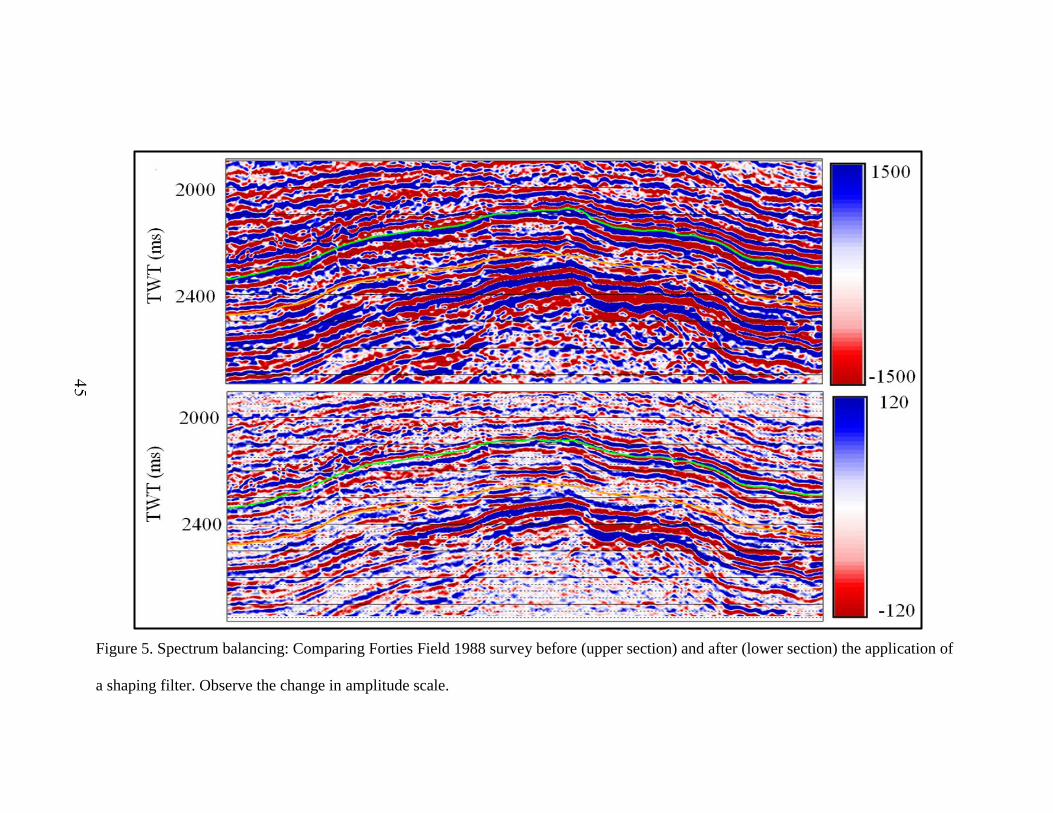
45
Figure 5. Spectrum balancing: Comparing Forties Field 1988 survey before (upper section) and after (lower section) the application of
a shaping filter. Observe the change in amplitude scale.

46
Figure 6. Comparing a section of Forties Field 1988 (upper section) and 2000 (lower section) surveys after spectrum balancing.

47
Figure 7. Frequency spectra: (a) before, and (b) after 4D balancing of 1988 and 2000
vintages.

48
Figure 8. Normalized Root Mean square (NRMS): Index of repeatability 200ms above
reservoir top.
3 km

49
Figure 9. Time lag, ∆t, at the top of regional Sele seal. The high travel time lag around
the Charlie complex, due to a steady decrease in reservoir pore pressure, is an indication
of compaction in the Charlie complex. Production platforms are in black squares.

50
Figure 10. Computed strain, εzz, at the (a) top of the Sele regional seal, (b) base of the
reservoir. The significant pore pressure decline in Charlie wells accounts for the high
strain (> 0.2%) seen around the complex. Production platforms are in black squares.

51
Figure 11. Sand production per unit flow as a function of well deviation angle through
the reservoir. Colors represent wells from different complexes; Black triangles, green
circles and red squares represent Alpha, Echo and Delta wells respectively.

52
Figure 12. Crossplots showing average sand production increases with decreasing pore
pressure. Colors represent wells from different complexes; Green triangles are Alpha
wells while Delta wells are represented by the red squares.

53
Figure 13. Logs from a high-sand producing well in Forties Field. Multiple and repeated
perforation coupled with high fluid flow rate contributed significantly to the high sand
production and the subsequent failure of the well. The red rectangle marks the sand
producing interval. KHL refers to horizontal permeability while BVW is bulk volume of
water.

54
Figure 14. An example of high well sanding not attributable to only one factor but a
combined effects of strain development, high flow rate and steep deviation angle
through the reservoir. The red rectangle marks the sand producing interval. BVW refers
to bulk volume of water, while Perf. refers to perforation.

55
REFERENCES
Anderson, N. R., G. Guerin, W. He, A. Boulanger and U. Mello, 1998, 4-D seismic
reservoir simulation in a South Timbalier 295 tubidite reservoir: The Leading Edge, 17,
1416-1417
Hatchell, P., and S. Bourne, 2005, Rocks under strain: Strain-induced time-lapse time
shifts are observed for depleting reservoir: The Leading Edge, 24, 1222-1225.
Helgerud, M.B., D.H. Johnston, B.G. Jardine, M.S. Udoh, N. Aubuchon, and C.Harris,
2009, 4D Case study in the Deep Water Gulf of Mexico: Hoover, Madison and
Marshall, Annual international Meeting, SEG Expanded Abstract, 28, 3949.
Hill, P.J., and G.V. Wood, 1980, Geology of the Forties Field, U.K. Continental Shelf,
North Sea, in Giant oil and gas fields of the decade 1968-1978: AAPG Memoir 30, 81-
93.
Meadows, M., 2008, Time-lapse seismic modeling and inversion of C02 saturation for
storage and enhanced oil recovery, The Leading Edge, 27, 506-516.
McIntyre, B., T. Hibbert, D. Keir, R. Dixon, T. ORourke, F. Mohammed, A. Donald, L.
Chang, A. Syed and V. Biran, 2009, Managing drilling risk in a mature North Sea Field;
Society of Petroleum Engineers Offshore Europe Oil & Gas Conference & Exhibition,
124666.
Strain : Reservoir Top

56
Papamichos, E., I. Vardoulakis, J. Tronvoll, and A. Skjaerstein, 2001, Volumetric sand
production model and experiment: International Journal for Numerical and Analytical
methods in Geomechanics, 25, 789-808.
Peng, S., J. Fu, and J. Zhang, 2007, Borehole casing failure analysis in unconsolidated
formations: A case study: Journal of Petroleum Science and Engineering, 59, 226-238.
Ribeiro C., C. Reiser, P. Doyen, A. Lau and S. Adiletta, 2007, Time-lapse simulator-to-seismic
study- Forties Field, North Sea: Annual international Meeting, SEG Expanded Abstract,
26, 2944-2948.
Robinson, N., A. Ford, J. Howie, D. Manley, M. Riviere, S. Stewart, and R. Thomas, 2005,
Time-lapse Monitoring of Chirag Field: The Leading Edge, 24, 928-932.
Sayers, C.M., 2010, Geophysics under stress: Geomechanical applications of seismic
and Borehole acoustic waves: 2010 Distinguished Instructor Series, No. 13, 50.
Sayers, C.M, and M.T.M. Schutjens, 2007, An introduction to reservoir geomechanics:
The Leading Edge, 26, 597-601.
Thomas, A.N., P.J. Walmsley, and D.A.L. Jenkins, 1974, Forties Field, North Sea: The
American Association of Petroleum Geologists Bulletin, 58, No. 3, 396-406.
Tura, A. and U. Etuk, 2006, Time-Lapse Seismic for field development at Nembe creek,
Nigeria, The Leading Edge, 25, 1142-1149.
Weisenborn, T. and P. Hague, 2005, Time-lapse Seismic in Gannet A; One more lead firmly
integrated: The Leading Edge, 24, 80-85.

57
Zhang, L., and M.B. Dusseault, 2004, Sand-production simulation in heavy-oil
reservoirs: Society of Petroleum Engineers, No. 89037.
Acknowledgement: The authors will like to thank Apache North Sea Ltd for providing
the data for this study and granting the permission to publish the results. We also thank
Schlumberger and Hampson Russell for the use of their software for educational and
research purposes. We are particularly grateful to Gregg Barker, Phil Rose, Klaas
Koster and Jack Orman of Apache North Sea Ltd for their tremendous support. Funding
was provided by the University of Oklahoma Attributes Assisted Seismic Processing
and Interpretation (AASPI) consortium members.

58
CHAPTER THREE
3.0 TIME-LAPSE (4D) SEISMIC EFFECTS: RESERVOIR SENSITIVITY
TO STRESS AND WATER SATURATION VARIATIONS
3.1 INTRODUCTION
The application of time-lapse seismic as a reservoir monitoring technique is not
limited to fluid-front monitoring, compartmentalization studies and identifying by-
passed hydrocarbons. The technique is responsive to stress changes in the reservoir.
This sensitivity makes time lapse difference useful in the monitoring of pore pressure
changes.
In this chapter, I studied the sensitivity of seismic velocities to changes in stress and
saturation. This involved the use of laboratory measurements on rock samples and fluid
substitution model. I investigated the effects of pore pressure change and the responses
of horizontal and vertical components of stress to pore pressure changes.
Furthermore, I propose an amendment to the Landro (2001) time-lapse inversion
method to accommodate the effect of porosity change. A case study was drawn from the
Forties Field.
The chapter will be submitted to Geophysics for publication as a time-lapse inversion
case study.

59
TIME-LAPSE (4D) SEISMIC EFFECTS: RESERVOIR SENSITIVITY TO
STRESS AND WATER SATURATION VARIATIONS
Sunday Amoyedo, Kurt J. Marfurt and Roger M. Slatt, The University of Oklahoma,
USA
ABSTRACT
Knowledge of reservoir saturation variation is vital for in-fill well drilling, while
information on reservoir stress variation provides a useful guide for sand production
management, casing design, injector placement and production management.
Interpreting time-lapse difference is enhanced by decomposing time-lapse difference
into saturation, pressure effects and changes in rock properties (e.g. porosity)
especially in highly-compacting reservoirs.
We analyze the stress and saturation sensitivity of the reservoir and overburden
shale of Forties Field, located in the UK sector of the North Sea. While pore pressure
variations have not been significant in most parts of the field, a slightly high decrease in
pore pressure in a region of the reservoir has had a profound effect on both reservoir
and overlying rock. We find that strain development in the field accounts, in part, for
increased reservoir sand production. Other effects include a negative velocity change in
the overburden, which provides an indication of dilation. We use changes in the AVO
intercept and gradient calibrated with laboratory measurements to invert the time-lapse
(4D) difference for saturation and pressure changes.
60
INTRODUCTION
The need for effective reservoir monitoring is increasing in the face of
diminishing reserves and a growing desire for optimized recovery. Reservoir depletion
gives rise to changes in seismic amplitude, time lag between events, t, strain, zz, and
compaction. Knowledge of reservoir saturation variation is vital for in-fill well drilling
by targeting by-passed hydrocarbons, while analysis of reservoir stress variation
provides a useful guide for sand production management, casing design and injector
placement. Reservoir depletion is characterized by fluid substitution and changes in
effective stress resulting from variations in pore pressure. Seismic velocities in
sandstone vary strongly with changes in both water saturation and stress because of
differences in fluid and elastic properties as well as changes in grain boundaries, micro-
cracks and fractures (Sayers, 2010).
Not only does time-lapse (4D) seismic have applications in monitoring fluid
fronts, delineating reservoir compartments, and analyzing fluid migration pathways in
conventional reservoirs, CO2 sequestration and heavy oil development, it has also
become an important tool for monitoring reservoir stress changes and the resulting
strain.
Forties Field, composed of Late Paleocene sheet sands overlain by channel
(Alpha, Bravo, Charlie, Delta, and Echo- Figure 1) complexes (Thomas et al., 1974),
started production in 1977 based on a 2D seismic survey. Over 1.6 billion barrels of oil
had been produced before the first 3D seismic survey was shot in 1988. Water
saturation had increased by about 25-28% field-wide, while pore pressure decrease was

61
of the order of 5 MPa in Charlie complex between 1988 and 2005 (Figure 2). Seismic
time lag, ∆t, provides a direct indication of a change in seismic propagation velocity,
induced by stress and saturation changes. The magnitude of the lag is related to the
degree of change in stress and saturation.
Sand production, which constitutes a major source of well failure, can be linked
to a number of factors including well deviation through the reservoir, grain size, poor
reservoir consolidation, perforation-induced damages, capillary forces associated with
water cut, flow rate, and most importantly reservoir stress resulting from pore pressure
depletion. Substantial strains (> 0.2%), which can be induced by the effective stress and
shear stress changes on the reservoir rock, are sufficient to severely degrade cohesion
by breaking the small amounts of brittle grain-to-grain mineral cements as the pore
pressure decreases. (Zhang and Dusseault, 2004).
Primary objectives of this study include: understanding the impact of changes in
pore pressure on reservoir stress state in a poorly consolidated reservoir, AVO
sensitivity analysis to production effect, establishing a link, if any, between reservoir
sand production and time-lapse effects and to invert for saturation and pressure
variations using changes in AVO volumes.
We begin by estimating and removing the background (non-production related)
time shift between the 1988 and 2005 seismic surveys. The background time lag was
estimated at a region above the producing interval devoid of production effects. We
compute the production-induced time lag by the cross correlation of the two surveys
(1988 and 2000). We observe a velocity slowdown (negative velocity change) in the

62
overburden directly above the Charlie complex, where there has been a significant
variation in pore pressure. Elsewhere, the time lag was insignificant.
Our workflow involves a combination of laboratory measurements, fluid
substitution models, AVO analysis and modifying an earlier published workflow
(Landro, 2001; Landro, et al; 1999) for pressure and saturation inversion. We observe
that the pore pressure-induced change in the reservoir stress state impacts mainly the
total horizontal stress while the vertical stress remains largely unchanged as pore
pressure decreases. This is because the vertical stress greatly exceeds the horizontal
stress. Our laboratory measurements and fluid substitution model show strong
amplitude variation with offset (AVO) attributes to changes in reservoir stress and water
saturation. Extending the workflow described by Landro, (2001) to account for porosity
change, we decouple the seismic time-lapse difference into pressure and saturation
effects.
TIME-LAPSE EFFECTS: ROCK SENSITIVITY TO STRESS AND WATER
SATURATION CHANGES
Time-lapse seismic difference (amplitude, impedance difference and time lag) is
a combined effect of fluid substitution and stress increase accompanying a decrease in
pore pressure. Figure 3 shows a vertical slice through acoustic impedance difference
section across part of the reservoir after a production period of over 12 years. The
associated linear relation between effective and pore pressure is expressed as
Pe = Po - αPp, (1)

63
where Pe, Po, α and Pp represent effective pressure, overburden pressure, Biot’s constant
and pore pressure respectively. While fluid substitution is effectively handled by
Gassmann's model, understanding sandstone sensitivity to stress is far more complex
and requires a good knowledge of the geomechanical behavior of the reservoir rock.
Forties Field, which is composed of sheet sands overlain by channel complexes
(Thomas et al; 1974; Hill and Wood, 1980), is broadly divided into the “Charlie” and
the “non-Charlie” sandstone complexes. Reservoir pressure has been fairly stable in the
non-Charlie complexes, with a steeper decrease in formation pressure recorded in
Charlie wells within the 1988-2005 interval of study. For consolidated rocks, a
formation pressure decline of 5 MPa may not have a significant impact on the reservoir
geomechanical properties; however, the effects could be more pronounced on weak and
unconsolidated sediments such as the Forties Field reservoir. Not only is the reservoir
unconsolidated, the overburden is equally weak in many parts of the field making the
Forties sediments particularly sensitive to stress changes. Figure 4 shows images of core
samples of both weak and competent shales belonging to the Sele formation, which
forms the seal. The unpredictable and strongly varying fabrics of shale types in the
overburden pose a major drilling challenge in Forties Field, where over 65% of wells
drilled between 2002 and 2007 have experienced some form of instability problem
(McIntyre et al; 2009).
Velocities vary considerably in sandstones as stress increases because of stress-
sensitive discontinuities within the rock, such as grain boundaries, micro-cracks, and
fractures (Sayers, 2010). Laboratory measurements on dry samples of Forties Field
sandstone from depths ranging between 2229 and 2256 m show remarkable sensitivity

64
of p-wave and s-wave velocities to an increase in confining stress (Figure 5a).
Specifically, compressional velocity increases from 2560 to over 3400 m/s while shear
velocity increases from under 1600 to 2180 m/s corresponding to an increase in
confining stress approaching 30 MPa. A similar velocity sensitivity is observed in the
Forties shale when a slow tri-axial compressional stress is applied. Both compressional
and shear velocities increase almost linearly until rock failure occurs. (Figure 5b). This
velocity sensitivity can be explained by grain-to-grain squeezing, closure of micro-
cracks, and a slight porosity loss. Sensitivity to stress cannot be explained solely by
porosity reduction but also requires grain-to-grain squeeze, and the altering of the grain
aspect ratio (Sayers, 2010).
A direct effect of reservoir production is compaction and sometimes subsidence
in the production area. These effects are due to changes in both total vertical and
horizontal components of stress, which produces an increase in velocity within the
reservoir in addition to any changes due to fluid substitution. In order to maintain
stability, the overburden is stretched (dilated), resulting in a velocity slow down (or a
negative change in velocity).
Landro and Jansen (2002) and Landro and Stammeijer (2004) showed that for
NMO-corrected traces, keeping leading orders only, the relative change in velocity is
given by
, (2)
65
where represent the near and far stack travel time lags respectively,
represents the seismic ray angle through the layer and t the two-way travel time after
NMO correction.
We balance Forties Field sub-stacks and extract travel time lags for both near
and far stacks between the base (1988) and monitor (2005) surveys. The observed
residual spectra difference in the far stack is due largely to anisotropy, resulting from
the different acquisition geometries. The computed relative velocity change over the
Charlie sandstone shows an expected velocity increase with a corresponding velocity
decrease in the overburden shale, indicating stretching (Figure 6). Reservoir pore
pressure depletion can alter the minimum and maximum horizontal stress as well as the
vertical effective stress. Micro-seismic events inside or close to the reservoir zone
provide direct evidence of the changing stress regime induced by production (Hettema
et al., 1998). The geomechanical response of rocks to increasing stress can vary
significantly depending on the stress path. The stress path is defined in terms of the ratio
of changes in stress values as they deviate from their initial reservoir values (Sayers,
2010 and Hettema et al., 1998).
For a laterally extensive reservoir, we define the parameter as the change of the total
vertical stress, , over the change in pore pressure, , expressed as:
, (3)
where G is the shear modulus, Cu is the compaction coefficient, h is the reservoir
average thickness, R is the average lateral extent of the reservoir, while the function
depends on the ratio of reservoir depth to its radius (Hettema et al., 1998).

66
The change in total horizontal stress, , gives rise to a parameter (for an isotropic
state) as pore pressure changes is
(4)
The change in total horizontal stress, , is defined as
(5)
where is the Poisson's ratio.
With these definitions, equation 6 can therefore be written as:
. (6)
Using the values in Table 1 in equations 3 and 6, we observe that is on the order of
6.58 x10⁻³
, which is insignificant when compared with which is on the order of 0.72.
This observation allows us to link the velocity changes within the reservoir and
overburden directly to changes in the total horizontal stress and saturation. The decrease
in total horizontal stress, which in this case is of the order of the pore pressure change,
might be significant enough to induce fault slippage in the overburden.
Table 1:Rock and fluid properties
Porosity Depth Thickness
Compaction
Coefficient
Shear
Modulus
Bulk
Modulus
Poisson's
ratio
Oil
density
28 2480 300 0.001 7555 9667 0.2119 0.7465
% m m MPa-1
MPa MPa - g/cm3
67
TIME-LAPSE EFFECTS AND RESERVOIR GEOMECHANICS
Time-lapse effects include changes in amplitude (reflectivity) as well as time
lags between two events, t, which can be due to changes in velocity and rock strain.
We cross correlated the 1988 and 2000 surveys (after estimating and removing
the background time shift) to compute the time lag between them. The background time
lag was estimated at a region immediately above the regional Sele shale, which is
devoid of production effects. A decrease in pore pressure leads to an increase in stress
carried by the load-bearing rock frame of the reservoir, inducing compaction within the
reservoir and dilation in the overburden. These changes may be accompanied by micro-
scale deformation mechanisms such as cement breakage at grain contacts, grain sliding,
rotation and significant alteration of reservoir geomechanical properties (Sayers and
Schutjens, 2007).
Hatchell and Bourne (2005) showed that fractional changes in velocity occur in
proportion to fractional changes in path length, T. Thus, the time strain for normal
incidence P-waves can be written as:
τ =T/T = (1+R)zz , (7)
where R defines the ratio of 4D fractional velocity changes to fractional thickness
changes and zz is the uniaxial strain. Hatchell and Bourne (2005 ) found that R lies in
the range 4 < R < 8 for rocks undergoing extension, whereas R lies in the range 0 < R <
2 for rocks undergoing compaction (Sayers, 2010) . In Forties Field, we found R = 0.75
within the reservoir while R = 0.70 in the overburden. This range of values lies outside
most reported figures. Such anomalous values could be due to the high porosity and the

68
extremely weak frame characterizing the Forties reservoir and overburden shale,
suggesting a good potential for grain-on-grain contact squeezing within the reservoir
and dilation in the overburden. The Charlie sands and southern inter-channel area of
Forties Field are observed to have high strain associated with increased stress, while the
other areas have experienced minimal strain. The analysis also shows that stress
increase is not confined to the top and within the reservoir, but is also propagated to the
reservoir base inducing significant velocity change and potential instability (Figure 7).
DEPLETION AND SAND PRODUCTION PATTERN
Forties Field has been plagued by severe sand production and an array of
drilling and completion problems. Severe sanding in this mature UK North Sea field has
led to the loss of wells, reduced production and consequently increased cost of
production (associated with well clean up operations, drilling of side-track wells and
corrosion prevention). Understanding the field-specific sand production mechanism(s)
and sanding pattern in Forties Field can significantly aid in identifying vulnerable wells
and guiding the remedial actions. Incomplete sand production records and difficulty in
eliminating transitional sanding due to extraneous factors such as workovers limit the
amount of available data and reliability of sand production analysis.
While poor consolidation has contributed largely to sand production in the field,
we observe that other factors such as multiple completions, high well deviation angle,
flow rate and increase in effective stress have contributed significantly to sanding.
Specifically, we observe a gradual increase in sanding as the well deviation angle
through the reservoir increases (Figure 8a). The observed correlation is not unexpected.

69
This is because of the higher perturbation of particle cohesion as deviation angle
increases coupled with a potential for higher exposure areas. Furthermore, a correlation
is observed between pore pressure decrease and sand production (Figure 8b). The
increase in the matrix-supported load resulting from a decrease in pore pressure can
lead to a displacement of grain particles within the sand matrix and thus trigger a re-
alignment of grains with more sand being produced in the process. While these
observations and correlations may be true, each element cannot fully account for the
pattern of sanding individually. In other words, sand production is a combined effect of
the afore-mentioned factors, with some factors playing more prominent roles than
others.
Figure 9 shows typical failed wells due to excessive sanding from Forties Field.
While increase in effective stress around the well and well deviation are less significant,
the well failure can be linked directly to high fluid flow rate and the weakening of grain
cohesion resulting from multiple and repeated perforations over the years. In some
cases, the failures are not due primarily to fluid flow rate and repeated perforations, but
to significant reservoir strain arising from pore pressure depletion. In other cases, severe
sanding have been recorded on the account of all these factors combined.

70
AVO SENSITIVITY TO CHANGES IN WATER SATURATION AND STRESS
Reservoir production gives rise not only to changes in travel time but also
changes in amplitude variation with offset (AVO) response within the producing
interval. Changes in stress state and fluid replacement result in changes in velocity,
which in turn gives rise to changes in the compressional and shear wave reflectivities.
Following Shuey (1985), the linearized reflection coefficient for PP reflections , , is
, (8a)
the AVO intercept , gradient , and curvature are
, (8b)
, (8c)
, (8d)
where indicate changes in P-wave velocity, S wave velocity and density,
and indicate average compressional velocity, shear velocity and density.
Examining equations 8b-d and Figure 10, we observe the sensitivity of AVO intercept
to fluid replacement and stress variation. The gradient and curvature, while being
sensitive to stress changes, are less sensitive to fluid substitution. This is because the s-
wave velocity does not respond to fluid types. The gradual decrease in the variation of
amplitude with offset as water saturation and stress increase is attributable to the loss of
velocity sensitivity at high values of stress and water saturation changes. The sensitivity

71
curves shows that AVO gradient and curvature do not contribute significantly to time-
lapse effect, while the intercept changes account for the observed variation. This
observation is also confirmed by the results of simultaneous inversion of the 4D-
processed seismic cubes for the interval of study. The observed sensitivity of AVO
intercept and gradient to changes in water saturation and reservoir pore pressure
provides a useful strategy to decouple the two effects.
TIME-LAPSE DIFFERENCE: DECOUPLING SATURATION AND PRESSURE
CHANGES
Reservoir monitoring is a vital tool in field development as a source of
information on changes in reservoir fluid saturation, drainage pattern and stress
changes. Time-lapse seismic experiments measure the combined effect of saturation and
pressure changes. Our ability to interpret time-lapse differences effectively is enhanced
by decoupling them into their components saturation and pressure effects. Knowledge
of reservoir saturation variation is vital for in-fill well drilling and fluid front
movement, while reservoir stress variation provides useful information for sand
production management, casing design, carbon storage management and injector well
placement.
Time-lapse seismic effects are sometimes pressure dominated, such as Magnus
Field, (Watts et al., 1996), or saturation dominated, such as Gullfaks Field, (Landro et
al., 1999), and the Draugen Field, (Gabriels et al., 1999, Veire et al., 2007). In other
cases, time-lapse differences are a combined effect of both pressure and saturation

72
changes. In such cases it is necessary to decouple production related differences (Tura
and Lumley, 1999; Landro, 2001; Lumley et al., 2003).
Recalling the linearized PP reflectivity as a function of angle in equation 8, Landro
(2001) assumed that the shear modulus remains unchanged and found that the change in
reflectivity associated with fluid substitution can be written as :
, (9a)
while the change in reflectivity attributable to pressure change, assuming that density
remains the same, can be written as
, (9b)
where the P-velocity, S-velocity, change in P-velocity (due to pressure, ∆P, and
saturation change, ∆S), and change in S-velocity (due to pressure change) are denoted
as , , , and . Modifying Landro's (2001) equation, we can write that the
relative changes in compressional, shear velocities and density as:
(10a)
and (10b)
, (10c)
where represents the change in porosity as the reservoir stress state changes.

73
Substituting equations 10 a - c into equations 8 a-d, we can write that the changes in
AVO intercept, gradient and curvature as :
, (11a)
, and (11b)
. (11c)
Solving equations 11 a- c by recursive substitution, we can show that for a highly
compacting reservoir,
(12a)
Given a change in pressure, , computed from the quadratic solution of equation
(12a), we can further show that the change in water saturation
, (12b)
while the change in porosity can be written as:
(12c)
where:
, (12d)
, (12e)

74
, (12f)
, (12g)
, (12h)
, (12i)
, (12j)
, (12k)
, (12l)
, and (12m)
. (12n)
The scalar quantities nα, nβ, nρ, mα jα, jβ, jρ, and mβ are determined from laboratory
measurements and the fluid substitution model (Figure 11), while , and can be
determined from coupled reservoir simulation and geomechanical model.
For highly compacting reservoirs (e.g. chalk reservoirs where saline water interaction
with carbonate weakens the reservoir matrix) the 4D difference could be dominated
principally by changes in porosity, . Therefore, accounting for this effect in reservoir
elastic properties becomes necessary in the interpretation of time-lapse difference.

75
We adopted the above methodology to invert for pressure and saturation changes in
Forties Field between 1988 and 2005. However, we assumed that the quantities ,
and are negligible i.e. stress-porosity sensitivity is low within the range of pore
pressure changes in the interval of study). This assumption, however, will fail when
pore pressure variation is much stronger or in chalk reservoirs.
Figure 12 shows the pressure and saturation change maps at the top of the reservoir.
Significant variation in saturation is observed at the various well locations across the
field. Production records show that over 600 million barrels of oil were produced across
the field during this interval of investigation, which accounts for the observed variation.
On the other hand, the pressure map reveals little or no change in reservoir pressure in
the non-Charlie complexes but a higher variation of pressure in the Charlie complex.
This result is validated by the reservoir pressure measurements, which indicates a 5
MPa decrease in pore pressure in the Charlie complex.

76
CONCLUSION
Knowledge of reservoir saturation variation is vital for in-fill well drilling, while
reservoir stress variation provides a useful guide for sand production management,
casing design, injector placement and production management. We show that the
reservoir response to increase in stress and our ability to effectively use time-lapse
seismic as a reservoir pressure monitoring tool derive from rock sensitivity to water
saturation and pressure changes.
Forties Field reservoir rock and overburden shale are stress and water saturation
sensitive. The weak rock frame characterizing the field provides room for grain-grain
contact squeezing. A velocity decrease in the overburden, which is associated with
stretching (dilation), is a direct consequence of increasing reservoir stress. Results of
sand production analysis in Forties Field shows that in addition to the well-known
factors, poor reservoir consolidation, high well angle of deviation through the reservoir
and high flow rate, reservoir strain due to pore pressure depletion also contributes
significantly to sand production. The AVO intercept provides an indication of reservoir
sensitivity to changing stress and water saturation. For these reasons, time-lapse (4D)
differences inverted for saturation and pressure effects and calibrated by well and
production data, provide an additional tool for reservoir pressure monitoring.

77
Figure 1. Forties Field channel sands- Alpha, Bravo, Charlie, Delta and Echo. Profile A-
A’ on the acoustic impedance difference cube is shown in Figure 3. Underlying the
channel complexes are the Upper and Lower Main sheet sands. Total thickness varies
between 200 and 250 m.
3 km

78
Figure 2. Forties Field pore pressure history: (a) Charlie and (b) Non-Charlie wells. The
interval of interest between the two seismic surveys is marked by the red rectangle.
Pressure support in the field is through water injection.

79
Figure 3. (a) Difference in Acoustic impedance, ∆Zp. (b) The corresponding litho-cube section. The Delta complex is observed to have
significant depletion in this section of the reservoir. The location of the line is shown in Figure 1.

80
Figure 4. Images of core samples showing different overburden shale fabrics varying from competent, fractured and layered to
incompetent shale. Core photos from McIntyre et al., (2009).
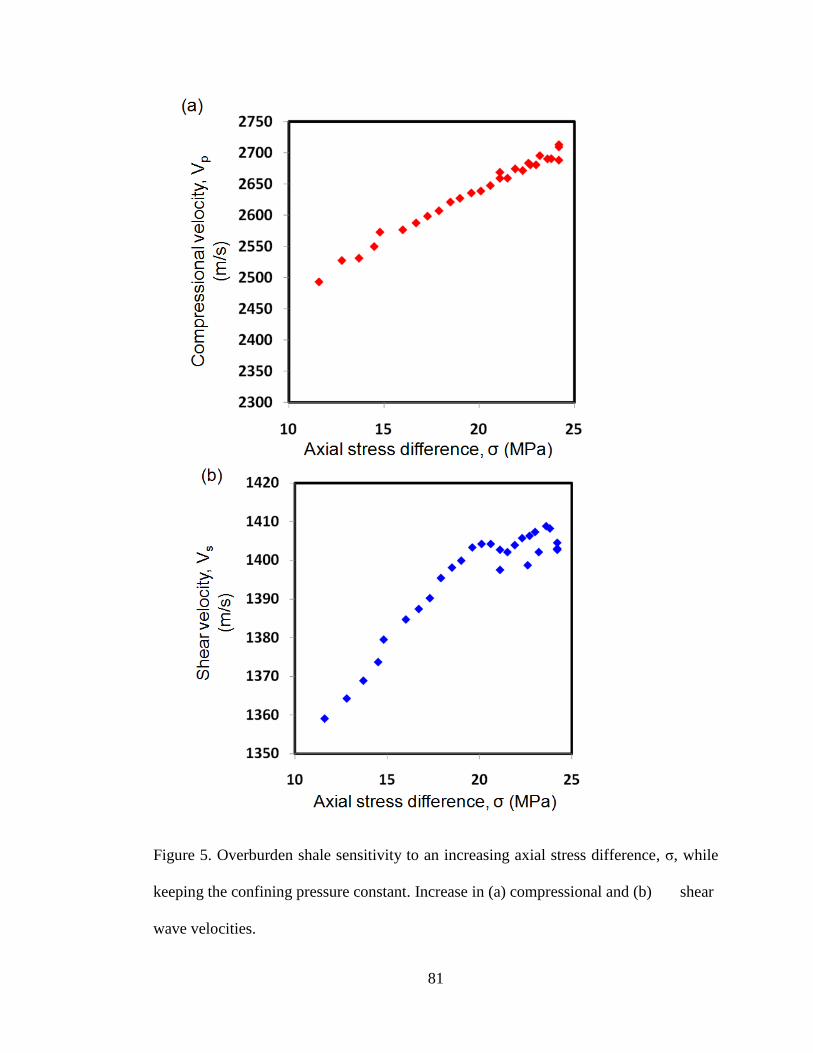
81
Figure 5. Overburden shale sensitivity to an increasing axial stress difference, σ, while
keeping the confining pressure constant. Increase in (a) compressional and (b) shear
wave velocities.

82
Figure 6: Decrease in velocity at the top of Sele shale (Left) and increase in velocity
within the reservoir (right)
3 km
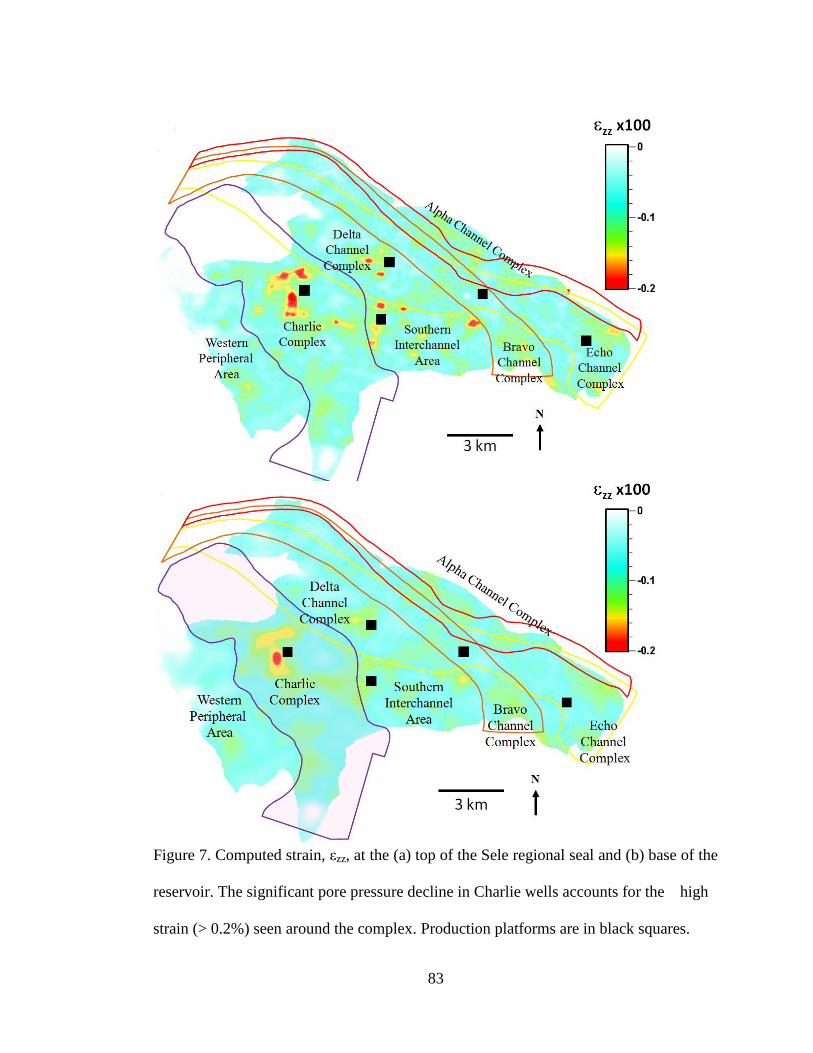
83
Figure 7. Computed strain, εzz, at the (a) top of the Sele regional seal and (b) base of the
reservoir. The significant pore pressure decline in Charlie wells accounts for the high
strain (> 0.2%) seen around the complex. Production platforms are in black squares.

84
Figure 8. (a) Sand production per unit flow as a function of well deviation angle through
the reservoir. (b) Average sand production increases with increase in reservoir stress.
Colors in (a) represent wells from different complexes.
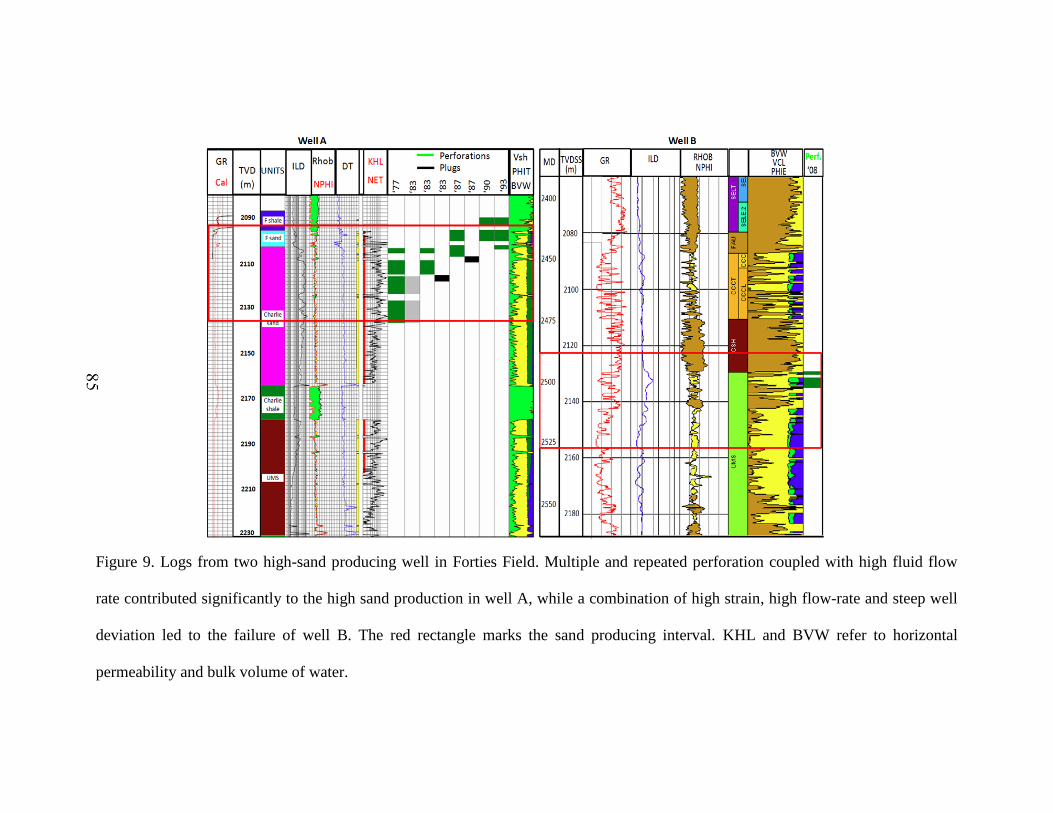
85
Figure 9. Logs from two high-sand producing well in Forties Field. Multiple and repeated perforation coupled with high fluid flow
rate contributed significantly to the high sand production in well A, while a combination of high strain, high flow-rate and steep well
deviation led to the failure of well B. The red rectangle marks the sand producing interval. KHL and BVW refer to horizontal
permeability and bulk volume of water.

86
Figure 10. AVO responses to changing (a) water saturation, Sw, and (b) stress.
Overburden shale velocity has been kept constant. The observed sentivities provides the
bases for pressure and saturation inversion from AVO attribute difference volumes.

87
Figure 11. Sandstone sensitivity to changes in vertical effective stress,
σv, and water saturation, Sw. The shear wave velocity sensitivity to
change in water saturation is insignificant.

88
Figure 12. Time-lapse difference (1988-2005) inverted for changes in (a) pressure and
(b) water saturation at the top of the reservoir using differences in AVO intercept and
gradient. An edge detection attribute, Sobel filter, is shown in the background. Injector
wells are shown in blue squares.

89
REFERENCES
Gabriels, P. W., N.A. Horvei, J. K. Koster, A. Onstein and R. Staples, 1999, Time-lapse
seismic monitoring of the Draugen field: Annual International Meeting, SEG Expanded
Abstracts, 18, 2035- 2037.
Hatchell, P., and S. Bourne, 2005, Rocks under strain: Strain-induced time-lapse time
shifts are observed for depleting reservoir: The Leading Edge, 24, 1222-1225.
Hettema, M.H.H., P.M.T.M. Schutjens, B. J. M. Verboom and H.J. Gussinklo, 1998,
Production-induced compaction of sandstone reservoirs: The strong influence of field
stress: SPE European Petroleum Conference, SPE 50630.
Hill, P. J., and G. V. Wood, 1980, Geology of the Forties Field, U.K. Continental Shelf,
North Sea, in Giant oil and gas fields of the decade 1968-1978: AAPG Memoir 30, 81-
93.
Landro, M., O. A., Solheim, E. Hilde, B. O. Ekren, and L.K. Strønen, 1999, The
Gullfaks 4D seismic study: Petroleum Geoscience, 5, 213–226.
Landro, M., 2001, Discrimination between pressure and fluid saturation changes from
time-lapse seismic data: Geophysics, 66, 836–844.
Landro, M., and R. Janssen, 2002, Estimating compaction and velocity changes from
time-lapse near and far offset stacks: Annual International Meeting, European
association of geoscientists and Engineers Expanded Abstracts, 036.

90
Landro, M., H. H. Veire, K. Duffault and N. Najjar, 2003, Discrimination between
pressure and fluid saturation changes from marine multicomponent time-lapse seismic
data: Geophysics, 68, 1592-1599.
Landro, M., and J. Stammeijer, 2004, Quantitative estimation of compaction and
velocity changes using 4D impedance and traveltime changes: Geophysics, Vol. 69,
949-957.
Lumley, D., D. Adams, M. Meadows., S. Cole and R. Ergas, 2003, 4D seismic pressure-
saturation inversion at Gullfaks field, Norway: First Break, 21, 49–58.
McIntyre, B., T. Hibbert, D. Keir, R. Dixon, T. ORourke, F. Mohammed, A. Donald, L.
Change, A. Syed and V. Biran, 2009, Managing drilling risk in a mature North Sea
field: SPE Offshore Europe Oil & Gas Conference & Exhibition, SPE 124666.
Sayers, C. M., and P. M. T. M. Schutjens, 2007, An introduction to reservoir
geomechanics: The Leading Edge, 26, 597-601
Sayers, C. M., 2010, Geophysics under stress: Geomechanical applications of seismic
and borehole acoustic waves: Distinguished Instructor Short Course, No 13, 45.
Shuey, R. T; 1985: A simplification of the Zoeppritz equations: Geophysics, 50, 609-
614
Thomas, A. N., P. J. Walmsley, and D. A. L. Jenkins, 1974, Forties Field, North Sea:
The American Association of Petroleum Geologists Bulletin, 58, No. 3, 396-406.

91
Tura, A. and D. E. Lumley, 1999, Estimating pressure and saturation changes from
time-lapse AVO data: Annual International Meeting, SEG Expanded Abstracts, 18,
1655–1658.
Veire, H. H., H. G. Borgos and M. Landro, 2007, Stochastic inversion of pressure and
saturation changes from time-lapse multi component data: Geophysical Prospecting, 55,
805-818.
Watts, G. F. T., D. Jizba, D. E. Gawith and P. Gutteridge, 1996, Reservoir monitoring
of the Magnus field through 4D time-lapse seismic analysis: Petroleum Geoscience 2,
361–372.
Zhang, L., and M. B. Dusseault, 2004, Sand-production simulation in heavy-oil
reservoirs: Society of Petroleum Engineers, No. 89037.
Acknowledgement: The authors will like to thank Apache North Sea Ltd for providing
the data for this study and granting the permission to publish the results. We also thank
Schlumberger and Hampson Russell for the use of their software for educational and
research purposes. We are particularly grateful to Klaas Koster, Gregg Barker, Phil
Rose, and Jack Orman of Apache North Sea Ltd for their tremendous support. Funding
was provided by the OU AASPI consortium members.
Corresponding author: [email protected]

92
CHAPTER FOUR
4.0 SEISMIC-DERIVED GEOMECHANICAL PROPERTIES OF
OVERBURDEN SHALE, FORTIES FIELD, UK NORTH SEA.
4.1 INTRODUCTION
Safe and efficient reservoir production requires understanding the
geomechanical properties of not only the reservoir, but also the surrounding non-
reservoir rocks (overburden and underlying strata). Drilling and well completion
problems, arising from instability in the overburden, are not uncommon in deep- and
ultra-deep water environment. This is due largely to rapid sedimentation and poor
consolidation.
This chapter investigated overburden instability and the use of seismic-derived elastic
properties to characterize zones of extreme weakness in the overburden rock of Forties
Field. Adopted workflow involved laboratory measurements of rock strength and
model-based inversion of rock properties.
The chapter will be submitted for the forthcoming special edition of the Leading Edge
on Seismic inversion of rock properties.

93
SEISMIC-DERIVED GEOMECHANICAL PROPERTIES OF OVERBURDEN
SHALE, FORTIES FIELD, UK NORTH SEA.
Sunday Amoyedo, Roger M. Slatt and Kurt J. Marfurt, The University of Oklahoma,
USA
ABSTRACT
Rock physics-driven inversion of 3D pre-stack seismic data plays a prominent
role in the characterization of both reservoir and overburden rocks. Understanding the
physics of the overburden rock is required to optimize production of the reservoir and to
safely guide wellbore, down-hole assembly and supporting surface facilities.
The Forties Field in-fill well drilling program is faced with severe drilling and well
completion challenges. The unpredictable and highly variable shale fabrics in the
overburden poses a major drilling and completion challenge in the field, where over
65% of recent wells have experienced some form of instability. While instability and
subsequent failure of the overburden can be linked to the rapid decrease of the
unconfined compressive strength (UCS) at inclination close to 450 to the bedding plane,
some zones are characterized by extreme weakness regardless of the well angle through
the rock. It becomes imperative to identify such zones to guide location and drilling
parameters for in-fill wells in the field. In this paper, we explore the correlation between
unconfined compressive strength and elastic moduli, Young's modulus and Bulk
modulus, coupled with the results of simultaneous inversion to derive 3D elastic moduli
calibrated to laboratory measurements to characterize the zones of extreme weakness.

94
INTRODUCTION
Rock physics-driven inversion of 3D pre-stack seismic plays a prominent role in
the characterization of reservoir and non-reservoir rocks. Traditionally, pre-stack
seismic inversion coupled with amplitude variation with offset (AVO) has been used
for fluid identification and lithology discrimination (Singleton and Keirstead, 2011;
Bailey et al., 2010; Hilterman et al., 2010; Zhou and Hilterman, 2010), where
impedance contrast between hydrocarbon and water, sand and shale and offset-
dependent seismic amplitude in hydrocarbon-bearing rocks make such identification
and characterization possible. Geomechanical properties of reservoir and non-reservoir
rocks (such as velocities, moduli, strength, and anisotropic parameters) are typically
measured in the laboratory and consequently calibrated with well log measurements and
seismic attributes for formation characterization. While laboratory measurements
provide vital reservoir properties, spatial sampling is extremely limited when compared
to the size of the reservoir. To overcome this shortfall in reservoir spatial sampling, vital
rock properties are often inverted from 3D pre-stack seismic data. Schmid and Schmidt
(2011), Gray et al., (2010) and Gray (2002) demonstrated the reliability of calibrated
seismic-derived geomechanical properties of both reservoir and non-reservoir rocks.
Gray et al., (2010) showed that the derivatives of simultaneous inversion coupled with
estimate of seismic anisotropy can be used, with an acceptable degree of reliability, to
compute the minimum, maximum and differential horizontal stresses.
Rock strength is defined by confined/unconfined compressional strength (UCS), also
called the peak strength. The UCS is affected by a number of petrophysical properties
including: porosity, velocity and density. Dewhurst et al., (2011) in a series of

95
laboratory measurements obtained a strong correlation between unconfined
compressional stress (UCS) and compressional velocity, though not without some
scatter . Their laboratory measurements also show a strong control of total porosity on
the UCS (Figure 1a). This correlation may not be applicable to all shales. This is
because of the near-uniform high total porosity (but low effective porosity) in most
shales. Colwell and Frith (2006) and Carmichael (2009) further demonstrated that for
poorly consolidated sediments, the Young's modulus is a good indication of the
compressional stress (Figure 1b).
Forties Field, which is located in the UK sector of the North Sea, is composed of
Late Paleocene sheet sands overlain by channel (Alpha, Bravo, Charlie, Delta, and
Echo) complexes (Thomas et al., 1974). Porosity in the field ranges between 23 and
29% while permeability averages several hundred mD. The Forties Field in-fill well
drilling program is faced with severe drilling and well completion challenges. The
unpredictable and strongly varying fabrics of shale in the overburden pose a major
drilling and completion challenge in the field, where over 65% of recent wells have
experienced some form of instability.
Characterizing the overburden fabric will help identify the zones of extreme
weakness and better guide well drilling through such zones. We use model-based
simultaneous inversion of 3D seismic to characterize the overburden and identify the
various fabrics of the overburden shale. We use laboratory measurement of the
unconfined compressive strength (UCS) of a few competent rock samples coupled with
log responses of failed wells to establish a competency threshold. We compute elastic

96
moduli from the results of simultaneous inversion and validate the results with well-log
derived moduli.
RESERVOIR PROPERTIES OF FORTIES FIELD ROCKS
Forties Field is composed of Late Paleocene sheet sands overlain by channel (Alpha,
Bravo, Charlie, Delta, and Echo) sands (Thomas et al., 1974). The reservoir, which has
a cumulative thickness of about 300 m, is characterized by high porosity (23-30%) and
permeability. Laboratory measurements on dry samples of Forties Field sandstone from
depths ranging between 2229 and 2256 m show remarkable sensitivity of acoustic and
elastic wave velocities to an increase in confining stress. Specifically, compressional
velocities increase from 2560 to over 3400 m/s while shear velocities increase from
under 1600 to 2180 m/s, corresponding to an increase in confining stress approaching
30 MPa. A similar velocity sensitivity is observed in the Forties cap-rock (Sele shale)
when a slow tri-axial compressional stress is applied. Both compressional and shear
velocities increase almost linearly with increasing stress. This velocity sensitivity can be
explained by grain-to-grain squeezing, closure of micro-cracks, and a slight porosity
loss. The relatively high sensitivities to stress changes recorded on Forties samples is
due, in addition to the aforementioned factors, to the weak rock frame providing room
for easy squeezing along grain-grain contacts. This sensitivity is further seen in the
amplitude variation with offset (AVO) as both water saturation and pore pressure
change.

97
Analysis of the impact of reservoir shaliness (volume of clay) shows a strong
control of the volume of shale on both the petrophysical and geomechanical properties
of the reservoir. Shale densities vary between 2.2 and 2.45 g/cm3, while sand densities
range between 2.13 and 2.3 g/cm3
in clean water-bearing intervals. However, the
compressional wave velocity is observed to be faster in the sandstone. Figure 2 is a
crossplot of slowness and density from 17 wells. We observe an increase in
compressional wave slowness with increasing volume of clay. This pattern can also be
seen in the crossplot of the bulk modulus and neutron porosity, where incompressibility
is observed to decrease as the volume of shale increases.
The Forties Field overburden Sele shale is characterized by strong anisotropy related to
its layered and fractured nature. The anisotropic signature is highlighted by the
variation of compressional slowness at different angles relative to the bedding plane
(Figure 3). The anisotropy in the overburden causes the strength of the Sele Formation
to be highly variable (McIntyre et al., 2009).
Up to date, a large number of wells have been drilled in Forties Field, only a few have
dipole sonic logs in either producer or injector wells. In those wells with dipole sonic
logs, the reliability of shear wave velocity measurement in the field vary considerably.
A strong correlation between compressional and shear wave velocities (Figure 4)
enables the modeling of shear wave velocities in wells with no or unreliable
measurements. Figure 5 shows the comparison of the model prediction with actual well
log measurements. The regional Sele formation is marked by a light green shading.

98
The inter-dependence of petrophysical and geomechanical properties of both reservoir
and overburden rock provides a means to model several geomechanical properties (bulk
modulus, Young's modulus, Poisson's ratio, lambda-rho and mu-rhob).
In general, we observe a strong correlation between the elastic moduli and acoustic
impedance in most formations. This correlation may also be used for the direct
computation of elastic modulus from acoustic impedance (Banik et al., 2010). In this
field of study however, the correlation is tends to be poor in the overburden shale.
OVERBURDEN INSTABILITY AND WELL FAILURES
Forties Field, which began production in the 1970s, is characterized by a poorly-
consolidated reservoir as well as by a weak overburden. The field has continued to
produce through a comprehensive reservoir monitoring program. This concerted effort
to keep the 'giant' alive is faced with a series of difficult drilling, well completion and
severe sand production problems leading to lost production and corrosion of materials.
Where possible, remedial activities cost millions of dollars per annum and often lead to
total loss of wells. These losses ultimately add to production cost.
The unpredictable and strongly varying fabrics of shale in the overburden also pose a
major challenge during drilling in Forties Field, where over 65% of wells drilled
between 2002 and 2007 have experienced some form of instability problem (McIntyre
et al, 2009). The irregular distribution of competent and weak shale across the field
partly explains why one well will fail and the next will not. Figure 6 shows various

99
fabrics of the overburden shale ranging from competent to extremely weak rock
typically encountered in the field.
Laboratory measurement of the unconfined compressive strength (UCS) of rock
samples provides a means to identify different fabrics of shale based on their rock
strength. Competent samples are characterized by high strength while weak fabrics have
low values of UCS. For practical reasons, only a few measurements of the UCS can be
made from which correlation with other petrophysical/geomechanical properties can be
established. This correlation can in turn be used to compute rock strength-related
parameters (elastic moduli). To obtain the compressive strength of Forties Field rock
samples, some samples were subjected to a gradual increase in stress until failure. This
procedure was carried out at different confining pressure (200, 400 and 600 psi). The
compressive strength was calculated using
, (1)
where CSA is the cross sectional area in cm2. The multiplying factor, 1450, is added to
convert to psi.
The result of the above laboratory measurement shows a good correlation between static
Young's modulus and compressive strength (Figure 7).
Apart from the unpredictable occurrence of weak overburden, Keir et al., (2009), using
a series of laboratory measurements, show that the unconfined compressive strength of
the Forties Field overburden also varies strongly with the angle to the bedding plane.
The authors observed that the UCS decreases by almost 85% when the angle of

100
deviation approaches 450 to the bedding plane (Figure 7b). This observation suggests
that wells drilled at or close to this angle through the overburden are more susceptible to
collapse. The authors further showed that as the inclination angle approaches 45 degrees
the correlation between the static Young's modulus and rock strength decreases
significantly.
Analysis of logs in failed wells further shows that, in addition to Young's modulus,
shear modulus or mu-rho can also be used to identify the weak overburden (Figure 8).
The above observations form the basis for the use of elastic moduli (mainly Young's,
shear moduli and mu-rho) computed using simultaneous inversion in order to map weak
overburden facies in Forties Field.
PRE-STACK SEISMIC INVERSION FOR OVERBURDEN
GEOMECHANICAL PROPERTIES
Seismic wave reflectivity is impacted by the geomechanical properties of the medium
through which the wave propagates. The properties include compressibility, rigidity and
bulk density. Goodway et al., (1997), using amplitude variation with offset (AVO),
derived Lamé's parameters lambda (λ), mu (µ) and density (ρ), from which other
moduli can be computed. Other products of simultaneous inversion of long offset
gathers, such as Zp, Zs, Vp, Vs and density, provide a means to compute reservoir
petrophysical properties and geomechanical properties.

101
The different fabrics of shale characterizing the Forties Field overburden exhibit
different strength/rigidity, which in turn makes their characterization possible on
seismic-derived moduli volumes.
We used a model-based simultaneous inversion to compute the elastic moduli of
the Forties Field Sele Formation overburden. Maximum offset of the pre-stack gather is
3112 m or about 38 degrees for a depth of investigation between 2200 and 2800 m,
which is sufficient for a reliable inversion for rock properties (Figure 9). The inversion
result shows a relatively high error in the estimation of density. This margin of error is
attributable to rock physics constraints i.e. weak correlation between density and
velocity especially in sandstone and sandy shale intervals. Assuming an isotropic
medium, we compute the Young's modulus as
, (2)
where ρ, Vp and Vs are density compressional velocity and shear velocity. is the shear
modulus, (and equivalent to Lame's parameter, µ):
(3)

102
DISCUSSION OF INVERSION RESULT
The Sele Formation, which forms the regional cap rock in most North Sea fields, is
composed of non-calcareous silty claystones with some thin ash layers. The Formation
is characterized by lower impedance and relatively low elastic moduli compared to the
Forties shale and the underlying sandstone (Figures 10a and b). Figure 11 shows the
comparison between seismic-derived elastic moduli and computed moduli from well
logs. The relatively lower rock strength in the overburden also varies considerably with
the different shale fabrics present in the overburden. The Young's modulus extracted at
the Sele Formation (Figure 12) shows a wide variation between 1.5 and 18 GPa,
corresponding to very weak and competent shale fabric, respectively. Slow tri-axial
compressional test at a confining effective pressure of 12.9 MPa on three samples of
competent Sele Formation shows that the Young's modulus of the cap rock ranges
between 11 and 19 GPa, which falls within the range of seismic-derived values.
We have defined a 6 GPa Young's modulus threshold for stability in the overburden.
The threshold is based on laboratory measurements on a few samples of competent
shale compared with the log responses in wells that have encountered some form of
instability in the overburden. The Young's modulus map of the overburden (shown in
Figure 12) indicates that the distribution of the shale fabrics is not random as initially
assumed. Extreme weakness (Young's modulus less than 4 GPa and shear modulus less
than 1.3 GPa-Figure 13) are observed in two zones of the overburden. These areas are
marked by white polygon. Fairly weak areas are appear as cyan on the map (4.0 GPa <
E < 6.0 GPa and 1.3 < G < 2.0 GPa). Stable and competent areas of the overburden are
in red and yellow colors.

103
Our inversion results and subsequent classification of the degree of competency do not
take into account the 450 plane of weakness. This suggests that the areas exhibiting high
moduli values (Young's and Shear moduli) on the inversion results are also susceptible
to instability when penetrated at an angle close to the plane of weakness.

104
CONCLUSION
The Forties Field in-fill well drilling program is faced with steep drilling and well
completion challenges. The widely varying fabrics of shale in the overburden, which
might be related to the depositional process, poses a major challenge in the field, where
over 65% of wells drilled between 2002 and 2007 have experienced some form of
instability. Overburden shale fabrics vary from weak layered to competent shale. While
instability and subsequent failure of the overburden can be linked to the rapid decrease
of the (unconfined compressive strength) UCS at inclination close to 45 degrees to the
bedding plane, some zones are characterized by extreme weakness irrespective of the
inclination of the wellbore. Except at the plane of weakness, there exists a good
correlation between laboratory-measured UCS and incompressibility (Young's
Modulus). Elastic moduli (Young's and Shear moduli) from model based simultaneous
inversion, calibrated to laboratory measurements, help characterize zones of extreme
weakness. These zones are susceptible to collapse during drilling irrespective of the
well deviation angle through the overburden.

105
Figure 1. (a) Unconfined compressional strength (UCS) versus Total porosity (b)
Young’s Modulus versus compressional strength. After Dewhurst et al., (2011) and
Carmichael R.P. (2009).

106
Figure 2. A plot of slowness (sonic transit time) versus density for both reservoir and
non reservoir. Forties Field reservoir properties are controlled largely by the volume of
shale (VSH).

107
Figure 3. Primary signature of anisotropy in Forties Field overburden: Variation of
slowness (sonic transit time) with dip. SV and SH refer to vertically and horizontally
polarized shear wave. After McIntyre et al., (2009).

108
Figure 4. Cross plot of shear against compressional slowness for (a) the overburden Sele
shale and (b) the reservoir sandstone. The correlation was used for the estimation of
shear velocity in wells with no or poor well data.

99
Figure 5. Typical log responses in Forties Field. Two blind wells are used to validate the modeled shear wave velocity. The actual
shear velocity (DTS ) and model DTS are shown in track 3 in both wells. The Sele Formation is marked with green shades.

100
Figure 6. Images of core samples showing different overburden shale fabrics varying from competent, fractured and layered to
incompetent shale. Core photos from McIntyre et al., (2009).

111
Figure 7. (a) Cross plot of compressive strength (CS) at 200, 400 and 600 psi
and Young’s modulus, b) plot of unconfined compressive strength (UCS) at
various angles to the bedding plane. The variation of UCS with angle will
severely degrade the reliability of rock strength from elastic moduli. Colors in
lower diagram represent measurements from different rock samples.

112
Figure 8. Elastic moduli (Young’s and Shear moduli) in two wells showing
competent and weak overburden Sele Formation (marked by red rectangle).
The weak overburden in well B is indicated by low values of Young's and
shear moduli. This pattern of deviation from normal trend has been observed in
other wells that have experienced some instability in the overburden.

113
Figure 9. (a) Input CDP gather for simultaneous inversion. (b) Inversion result: comparing synthetic data with the input volume. The
regional Sele Formation is highlighted by the green shading in both sections. Observe the gradual decrease of amplitude with offset in
the marked zone.

114
Figure 10. (a) Acoustic Impedance and (b) Computed Young’s modulus. The Sele Formation is indicated by the purple pick,
corresponding to low values of impedance and Young's modulus. Gamma ray log is shown along the trajectory of a well.

115
Figure 11. Comparing seismic derived elastic moduli with computed moduli from
well logs. The zone of interest is marked the marked Sele Formation. Inversion
parameters were optimized for the overburden and less than optimum for the
reservoir.

116
Figure 12. Young’s modulus of the Sele Formation. Zones of extreme weakness are marked by white polygons. The fault network is shown in the
background by an edge detection attribute, the Sobel filter.
3 km

117
Figure 13. Shear modulus of the Sele Formation. Zones of extreme weakness are marked by white polygons. The fault network is shown in the
background by an edge detection attribute, the Sobel filter.
3 km

118
REFERENCES
Bailey, B., F. Barclay, R. Nesbit and A. Paxton, 2010, Prospect identification using
AVO inversion and lithology prediction: Petroleum Exploration Society of Australia
March News letter, 22-24
Banik, N., A. Koesoemadinata and K. G. El-Kaseeh, 2010, Young's modulus from
point-receiver surface seismic data: Annual internal Meeting, SEG Expanded Abstract,
29, 2794-2798.
Carmichael, R. P., 2009, Relations between Young's modulus, compressive strength,
Poisson's ratio, and time for early age concrete: Swarthmore College Department of
Engineering internal report.
Colwell, M., and R. Frith, 2006, Why uniaxial compressive strength and Young's
modulus are commonly poorly indicators of road roof stability-Except in the Tailgate:
Underground Coal Operators' Conference, 33.
Dewhurst, D., J. Sarout, C.D. Piane, T. Siggins, M. Raven and U. Kuila, 2011, Strength
Prediction and Rock Physics response in shales: 21st Annual Conference and
Exhibition, Australian Society of Exploration Geophysicists.
Goodway, W., T. Chen, and J. Downton, 1997, Improved AVO fluid detection and
lithology discrimination using Lamé parameters; lr, mr and l/m fluid stack from P and S
inversions: Annual Meeting and Convention, CSEG Expanded Abstracts, 148-151.

119
Gray, F.D., 2002, Stable extraction of fundamental rock properties from seismic data:
Annual International Meeting: European Association of Geologists and Engineers
Conference and Exhibition, 2002.
Gray, F.D., D.P. Schmidt, and F. Delbecq, 2010, Optimize shale gas field development
using stress and rock strength derived from 3D seismic data: Annual Meeting, Canadian
Society for Unconventional Gas/Society of Petroleum Engineer Conference, 137316.
Hilterman, F., J.W.C. Sherwood, R. Schellhorn , B. Bankhead and B. DeVault, 1998,
Identification of lithology in the Gulf of Mexico: The Leading Edge, 17, 215-222.
McIntyre, B., T. Hibbert, D. Keir, R. Dixon, T. ORourke, F. Mohammed, A. Donald, L.
Chang, A. Syed and V. Biran, 2009, Managing drilling risk in a mature North Sea Field;
Annual International Meeting, Society of Petroleum Engineers Offshore Europe,
124666.
Schmid, R. and D. Schmidt, 2011, Seismic derived geomechanical properties for shale
gas exploration: Annual Convention and Symposium, CSPG CSEG CWLS Expanded
Abstract.
Singleton, S. and R. Keirstead, 2011, Calibration of pre-stack simultaneous impedance
inversion using rock physics: The Leading Edge, 30, 70-78.
Thomas, A.N., P.J. Walmsley, and D.A.L. Jenkins, 1974, Forties Field, North Sea: The
American Association of Petroleum Geologists Bulletin, 58, No. 3, 396-406.
Zhou, Z., F. J. Hilterman, 2010, A comparison between methods that discriminate fluid
content in unconsolidated sandstone reservoirs: Geophysics, 75, B47-58.

120
Acknowledgement: The authors will like to thank Apache North Sea Ltd for providing
the data for this study and granting the permission to publish the results. We also thank
Schlumberger and Hampson Russell for the use of their software for educational and
research purposes. We are particularly grateful to Klaas Koster, Gregg Barker, Phil
Rose, and Jack Orman of Apache North Sea Ltd for their tremendous support. Funding
was provided by the OU Attribute Assisted Seismic Processing and Interpretation
(AASPI) consortium members.
Corresponding author: [email protected]

121
CHAPTER FIVE
5.0 TIME-LAPSE (4D) GRAVIMETRY AS A RESERVOIR MONITORING
TOOL: A MODELING FEASIBILITY STUDY
5.1 INTRODUCTION
Reservoir monitoring relies majorly on seismic methods and borehole
measurements, there is increasing use of less-traditional techniques such as gravimetry
and electromagnetics.
In this chapter I focus on the use of time lapse gravimetry as a reservoir monitoring
technique. The chapter focuses on modeling gravimetry anomaly over a compacting
reservoir. Furthermore, I investigate the feasibility of deployment of time-lapse
gravimetry when reservoir water saturation change is significant (> 10 %).
The chapter has not been submitted yet for publication.

122
TIME-LAPSE (4D) GRAVIMETRY AS A RESERVOIR MONITORING TOOL:
A MODELING FEASIBILITY STUDY
Sunday Amoyedo, Kurt J. Marfurt and Roger M. Slatt, The University of Oklahoma,
USA
ABSTRACT
Time-lapse gravimetry continues to find increasing application in reservoir monitoring,
typically in gas reservoirs and CO2 sequestration. Little or no application to oil bearing
reservoir monitoring has been reported. This is due in part to the low density contrast
between oil and brine and the high acquisition cost associated with the required high
density marine survey grid.
In this paper, we model the 4D gravity anomaly over Forties Field, located in the
UK sector of the North Sea. The field is characterized by high porosity, poorly
consolidated reservoirs, with a significant density contrast between the reservoir and the
encasing shale. The Forties Field 4D gravity model results show that a significant
increase in water saturation (10-15%) is required to produce a resolvable 4D gravity
anomaly. We predict that time-lapse gravity anomalies can provide vital clues on
reservoir compartmentalization and by-passed oil when saturation change is of the order
of 10% or more. Reservoir subsidence is also observed to have a significant impact on
4D gravimetric anomaly. The models also show a decreasing resolution of compaction
effects as water saturation (Sw) increases.

123
INTRODUCTION
The need for effective reservoir monitoring has driven the development of various
techniques and tools for optimum reservoir production. Commonly adopted techniques
include surface time-lapse seismic, borehole surveillance and more recently, time-lapse
(4D) gravimetry. While reservoir monitoring still relies heavily on surface seismic and
VSP analysis, there is an increasing use of other geophysical techniques such as
gravimetry and electromagnetics, especially in the last few years. This trend is
attributable to project economics, operational difficulties and project turnaround time.
Relatively small gas fields are, at best, marginally economical at the current gas
market, while repeatability hurdle in surface seismic also remains an eternal challenge.
While certain areas of application of reservoir monitoring have no immediate economic
reward, they however, still require significant investment. Such areas of application
include CO2 sequestration, monitoring subsurface breathing of volcanoes and upwelling
of hot plumes, etc.). As such, techniques that are operationally less expensive and easier
to implement are more attractive for such tasks. Gravimetric surveys are considered to
have a wide range of applicability and relatively good cost-benefit ratio.
Recent innovations developed through collaboration between Scripps Institute of
Oceanography and Statoil Research center have further advanced the use of gravimetric
surveys as a reservoir monitoring tool in the marine environment. The collaboration
produced the world's first remotely operated marine gravimeter (Figure 1), which has
been successfully deployed in Troll and Sleipner fields, North Sea (Havard et al., 2008,
Eiken et al., 2008, Zumberge et al., 2008).

124
Few other papers have been published on the use of a gravity anomalies for reservoir
studies. Krahenbuhl et al., (2010) presented a multi-component feasibility study of the
application of time-lapse gravity for CO2 monitoring in Delhi field. Model results show
a strong likelihood of imaging bulk fluid movement though expected success may
decrease significantly in the thinner up-dip regions of the reservoir. Tempone and
Landro (2009) describe a method for modeling 4D gravity anomaly changes for a
reservoir undergoing compaction embedded in a homogenous half space with and
without a rigid basement. The authors observed that compaction can account for as
much as a 30-40 µGal change for a pressure depletion of 10 MPa.
Other authors have cited success in the application of time-lapse gravimetry for material
balance in a depleting Troll gas field (Stenvold et al., 2008) and groundwater
withdrawal in Salt Lake valley (Gettings et al., 2008).
Significant density contrast between saline water and gas (such as methane and
CO2) produces a high gravity anomaly, making gravity monitoring applicable and
attractive for fluid front monitoring in gas reservoirs and CO2 sequestration. Recent
advances in marine gravimeter sensitivity and improvement in repeatability to about 5
µGal (Tempone and Landro 2009; Zumberge et al., 2008) suggest that when thickness
and burial are favorable, 4D gravity monitoring may be suitable for oil-water reservoir
systems characterized by high porosity and a strong density contrast between the
reservoir rock and the encasing shale.
In this study, we conduct a gravity monitoring feasibility study over Forties Field. The
field, located in the UK sector of the North Sea, is characterized by poorly-consolidated,
125
high porosity reservoir rock. The density of the high-porosity, 100-200 m thick
reservoir rock is significantly different than the encasing shale, which in most cases is >
150 kg/m3 (Figure 2). Such parameters suggest 4D gravimetry may be a viable
reservoir monitoring tool.
We use a cross section from a lithology indicator volume, which is derived from
seismic inversion and facies classification, to model the reservoir stratigraphy in 2-D for
the gravity anomaly forward modeling. We model the anomaly at constant porosity for
compartmentalized and non compartmentalized reservoir units and partial drainage at
different water saturation. Furthermore, we model gravity anomaly responses for a
compacting reservoir while simultaneously varying the water saturation.
We observe that when water saturation change is of the order of 10% or higher, a time-
lapse gravity anomaly is sufficiently large to be used in reservoir compartmentalization
studies. Below this threshold, the anomaly is irresolvable at the current instrument
sensitivity. Reservoir subsidence is also observed to have a significant impact on 4D
gravimetric anomaly. We observe a decreasing resolution of compaction anomaly as
water saturation increases.

126
FORWARD MODELING
A point mass of density ρ, defined by dimensions δx', δy', δz' at location x' y' z' at a
distance r from measurement point x, y, z, will experience a vertical gravitational
attraction defined by δgz (Figure 3). Newton's gravitational law shows that:
, (1)
G =6.67 x 10⁻¹¹
m3.kg
-1.s
-2, defined as the gravitational constant of the earth.
Assuming that reservoir pressure has been fairly steady and no significant compaction
has been recorded in the reservoir within the period of observation, we can write the
observed change in gravitational attraction as
, (2)
where is the change in density while is volume of the object.
For reservoir monitoring applications, we obtain the gravitational attraction by
integrating over individual point masses to arrive at;
. (3)
Bulk density change, associated with fluid substitution can be written as
, (4)
where is the porosity, is the density of initial fluid while is the density of the
substituting fluid. Figure 4 shows a gradual increase in bulk density as water saturation
increases for various values of porosity ( .
127
This set of equations forms the basis for the forward modeling of gravimetric data, and
assuming a perfect repeatability. While the development of remotely operated seafloor
gravimeter has increased repeatability and enhanced marine gravimetry as a reservoir
monitoring tool, offshore gravimetric acquisition still faces the traditional challenges
encountered in a conventional gravity survey. Tidal effect, temperature variation,
instrument drift etc limit the detection threshold and applicability of 4D gravimetry.
With improving instrumentation and deployment, the threshold of detectability
(repeatability) has improved considerably in the last few years. Fergusson et al.,
(2008), Zumberge et al., (2008), Tempone, et al., (2009), suggest a repeatability
threshold of about 5µGal. For typical gas reservoir monitoring and CO2 sequestration,
gravity anomaly is typically well above the repeatability threshold thereby making
gravimetry viable. For oil bearing reservoirs however, production induced gravity
anomaly is much smaller, which makes gravity monitoring less attractive. However, a
combination of poorly consolidated reservoir encased in shale with a significant density
contrast between them and high porosity favor the deployment of gravimetry for
production monitoring in oil bearing formations.

128
FIELD STRATIGRAPHY
The reservoir of the Forties Field comprises Late Paleocene submarine fan sands, mud
and channel complexes. The 100 to 200 m thick Forties Sandstone can be divided into
three units of roughly equal thickness. The initial fan advance is represented by the
lowest unit, the Lower Main Sand, with the overlying Upper Main Sand being deposited
as a fairly broad channel complex. Both units extend across the entire field and have not
been further subdivided. The topmost unit, the Channel complex, which lies beneath a
thick, monotonous section of gray to brown, variably calcareous and carbonaceous
mudstones ranging from upper Paleocene to Holocene (Thomas et al.,1974 ), consists of
three major sandy channel systems, the Delta/Echo, Bravo and Alpha in order of
decreasing age, together with areas of inter-channel mudstone. The youngest Charlie
Sand is considered a distinct unit separated from the older sands by the Charlie Shale. It
lies in a different pressure compartment.
The Forties fans and channel complexes are generally very friable and characterized by
excellent reservoir properties. Porosity runs as high as 35% while permeability is in the
range of a few Darcys. The high recovery factor, which is in excess of 45%, bears
testimony to the excellent reservoir properties of the Forties Field reservoir. A more
comprehensive description of field geology and stratigraphy is given by Thomas et al.,
(1974) and Hill and Wood (1980). Figure 5 is a typical lithology cross section across the
architectural elements of Forties Field.

129
Over 300 wells have been drilled in the field since the commencement of exploration
and field development. While a good number of these wells have been abandoned, some
have continued to produce over several years.
Forties Field cumulative production, which is supported by water injection, is in excess
of 2.5 billion barrels. Reservoir pressure has been generally well maintained field-wide,
though steep decreases have been recorded in the Charlie sands (Figure 6 a-b)
Reservoir production is typically associated with increase in effective stress, though the
increase in stress does not necessarily lead to a significant change in porosity (Sayers,
2010). A detailed stress-porosity sensitivity analysis has been carried out in Forties
Field using 8 wells. Porosity sensitivity of less than 2% is observed for a 1000 psi
decrease in confining pressure (Figure 6 c ). Density change due to changes in reservoir
pressure is therefore considered to be minimal.

130
MODEL LAYOUT AND COST CONSIDERATION
Forties Field reservoir, which is oil bearing, is characterized by thickness variation
ranging between 100 and 200 m. While a thicker reservoir would be preferred, the
reservoir is considered to be of sufficient thickness for gravimetric monitoring of
production and production effects.
A geologic cross section based on the lithology indicator cube and flattened at Sele
shale representing the maximum flooding surface (MFS) was used for the gravity
modeling (Figure 7). The overburden thickness of about 2128 m, is characterized by
density variation from 2010 kg/m3 just below the seafloor to 2290 kg/m
3 at the Sele
Formation. The bulk density of the surrounding Forties shale is about 2330 kg/m3 based
on laboratory measurements and borehole density log readings. Saturated bulk density
of the reservoir was varied between 5% and 98% water saturation.
Land-based time-lapse gravimetric survey is cost effective when compared with surface
seismic and borehole surveillance. This comparative cost advantage can be diminished
considerably in the offshore environment when the acquisition grid is tight, which could
result in a long and expensive acquisition campaign. To enhance resolution (at the
expense of acquisition cost), which is needed to detect the expected subtle anomalies
due to the low contrast of density between oil and brine, we have employed a station
interval of 20m. This sampling interval is significantly finer than the typical interval
used in gas monitoring and CO2 storage, which can range between 500 m and over 2000
m (Eiken et al., 2008, Zumberge et al., 2008), where the high density contrast between
gas and brine gives rise to a high gravity anomaly, making a high-density acquisition

131
grids unnecessary. We also allow a significant aperture at the margins of the model.
While being sufficiently far from the real reservoir conditions, our model has assumed a
uniform porosity and by extension density and uniform drainage.

132
RESULTS AND DISCUSSION
In this study, we have carried out a time-lapse forward modeling of gravimetric survey
of Forties Field. Figure 8 shows the sensitivity of gravity anomaly to increasing water
saturation in an oil bearing reservoir. The model results show that for a 200 m thick
high porosity reservoir buried at 2128 m, a water saturation increase of 15-20% is
required to produce a resolvable gravity anomaly at the current instrumentation
threshold of 5 µGal.
Reservoir compartmentalization, which leads to differential drainage patterns and by-
passed hydrocarbons, remain the primary areas of application of reservoir monitoring.
A scenario of no production from body AA (marked in Figure 9) was modeled. At low
water saturation change (< 10%) in the other parts of the reservoir, the 4D gravity
anomaly falls below the resolution threshold. As water saturation continues to
increase(≥ 20%), we observe a relatively low gravity anomaly over the by-passed
section as the anomaly grows in other sections of the reservoir. The high change in
water saturation required for detection is related primarily to the small size of the body
and its burial below another reservoir unit (the Charlie complex).
One of the challenges that face reservoir production is compaction. Accompanying a
decrease in formation pressure is an increase in the effective stress, which could in turn
lead to the onset of compaction in the reservoir and subsidence as grain to grain contact
squeezing increases. We have modeled a gradual increase in reservoir subsidence and
increase in water saturation in the Charlie complex, where we have a relatively higher
increase in effective stress. Subsidence has been varied between 5 m and 22 m while

133
simultaneously increasing water saturation from 20 to 80%. Model results show a high
sensitivity of 4D gravimetric anomaly to compaction and subsidence. This observation
is also supported by Tempone and Landro (2009) in a model of a compacting reservoir
with rigid and non-rigid basement. Our model results show that for an oil bearing
reservoir, time-lapse gravity anomaly can resolve reservoir subsidence when it is greater
than or equal to 5 m. This threshold is expected to reduce as overburden thickness
reduces. We also observe that time-lapse gravity anomaly associated with reservoir
subsidence reduces slightly as water saturation increases. Figure 10 shows a progressive
decrease and flattening of the compaction anomaly with increasing water saturation.

134
CONCLUSION
Time-lapse (4D) gravimetry has continued to find increasing application in reservoir
monitoring, typically in gas fields and CO2 storage with little or no application yet in oil
monitoring. This is due in part to the low contrast of density between oil and brine and
the high acquisition cost associated with the required high density acquisition grid. This
study has modeled the 4D gravity anomaly of Forties Field, located in the UK sector of
the North Sea. The field is characterized by high porosity, poorly consolidated
reservoirs, with a significant density contrast between the reservoir rock and encasing
shale. High porosity, weakly-consolidated, homogenous and thick reservoirs
characterized by shallow burial depth are considered ideal for gravimetric monitoring in
oil bearing formations. Our Forties Field 4D gravity model results show that a
significant increase in water saturation (10-15%) is required to produce a resolvable 4D
gravity anomaly. Our model results suggest that time-lapse gravity anomaly can provide
clues on reservoir compartmentalization and by-passed oil when saturation change is of
the order of 10%. Reservoir subsidence is also observed to have a significant impact on
4D gravimetric anomaly. We observed a decreasing resolution of compaction anomaly
as water saturation increases.

135
Figure 1. a) Schematic diagram of the Remotely Operated Vehicle deployed Deep
Ocean Gravimeter (ROVDOG). (b) Sketch of the ROVDOG deployed at the seafloor.
(c) Image of the system during recovery. (Images from: Sasagawa et al., 2003 and
Zumberge et al., 2008).

136
Figure 2. Typical well log responses in
Forties Field (well AA and AA’). Observe
the contrast of density between the reservoir
and overlying Forties shale. The observed
contrast in density between the reservoir and
the surrounding shale enhances the gravity
anomaly when saturation changes within the
reservoir.

137
Figure 3. The vertical gravitational attraction experienced by a body is governed by
Newton’s gravitational second law . For reservoir monitoring purpose, we integrate the
attractive force over the all point masses making up the object.

138
Figure 4. Bulk density increase as a function of water saturation. High porosity
reservoirs produce higher changes in bulk density, which enhances gravity anomalies
over the reservoir as water replaces oil.

139
Figure 5. Basic stratigraphy of Forties Field. The upper image shows
the individual units of the reservoir on a lithology indicator.
Location of the section is shown on the lower image.

140
Figure 6. Forties Field pressure history, (a) for the Charlie
complex and (b) the non –Charlie complexes. Observe the
stronger depletion of pressure in Charlie as opposed to the near-
constant pressure in non-Charlie. (c) Porosity change as a
function of confining pressure. Change in porosity is assumed to
be negligible in the forward modeling. Image courtesy: Apache
North Sea Ltd. internal document.

141
Figure 7. 2D modeling of the reservoir. Overburden density was obtained from
extrapolated density logs. Lower image is a section from the lithology indicator volume
that was used for the 2D modeling of the reservoir.

142
Figure 8. Gravity anomaly response over the modeled reservoir at different water saturations assuming uniform drainage.

143
Figure 9. Gravity anomaly response over a by-passed unit of the reservoir (in red) lying
below the Charlie complex. Observed that detection threshold in the gravity anomaly
lies between 10 and 20 % water saturation in adjacent reservoir units.

144
Figure 10. Gravity anomaly (Net) response over a compacting reservoir unit (Charlie complex) at various values of water saturation.
We varied subsidence between 5 m and 22 m. Observe that a compaction threshold of 5m is required for detection. The water
saturation in the compacting zone is the same as other units in the field.

145
REFERENCES
Eiken, O., T. Stenvold, M. Zumberge, H. Alnes, and G. Sasagawa, 2008, Gravimetric
monitoring of gas production from the Troll field: Geophysics, 73, WA 149- 154.
Ferguson, J. F., F. J. Klopping, T. Chen, J. E. Seibert, J. L. Hare, and J. L. Brady, 2008,
The 4D microgravity method for waterflood surveillance: Part 3—4D absolute
microgravity surveys at Prudhoe Bay, Alaska: Geophysics, 73, WA163-171.
Gettings, P., D.S. Chapman, and R. Allis, 2008, Techniques, analysis and noise in a Salt
Lake Valley 4D gravity experiment: Geophysics, 73, WA 71-81.
Havard, A., O. Eiken and T. Stenvold, 2008, Monitoring gas production and CO2
injection at the Sleipner field using time-lapse gravimetry: Geophysics, 73, WA 155-
161.
Krahenbuhl, R. A, Y. Li, and T. Davis, 2010, 4D gravity monitoring of fluid movement
at Delhi Field, LA: A feasibility study with seismic and well data: Annual International
Meeting, SEG Expanded Abstract, 29, 4210-4214.
Sayers, C.M., 2010, Geophysics under stress: Geomechanical applications of seismic
and Borehole acoustic waves: 2010 Distinguished Instructor Series, No. 13, 50-51.
Tempone, P. and M. Landro, 2009, Estimation of changes in gravity anomaly due to a
compacting reservoir: Annual International Meeting, SEG Expanded Abstract, 28,
3790-3794.
Sasagawa, G. S, W. Crawford, O. Eiken, S. Nooner, T. Stenvold and M. A. Zumberge,
2003, A new sea-floor gravimeter: Geophysics, 68, 544-553.

146
Stenvold, T., O. Eiken and M. Landro, 2008, Gravimetric monitoring of gas-reservoir
water influx- A combined flow- and gravity-modeling approach: Geophysics, 73, WA
123-WA 131.
Zumberge, M., H. Aines, O. Eiken G. Sasagawa and T. Stenvold, 2008, Precision of
seafloor gravity and pressure measurements for monitoring: Geophysics, 73, WA 133-
141.

147
CHAPTER SIX
6.0 CONCLUSIONS AND RECOMMENDATIONS
6.1 GENERAL CONCLUSION
Sand production remains a source of concern in both conventional and heavy oil
production. Factors such as reservoir consolidation, well deviation angle through the
reservoir, perforation size, depth of penetration of perforation, grain size, capillary
forces associated with water-cut, flow rate and more importantly reservoir strain
resulting from pore pressure depletion contribute to reservoir sanding. Understanding
field-specific sand production patterns in mature fields and poorly consolidated
reservoirs is vital in guiding remedial activities and identifying sand-prone wells.
The Forties Field, located in the UK sector of the North Sea, seismic study using
1988 and 2000 seismic surveys reveals an increased stress associated with pore pressure
changes in the Charlie complex. The high time lag in the overburden shale above the
Charlie sandstone suggests a significant increase in the reservoir stress. Reservoir strain
analysis shows that the magnitude of the production-induced strain, part of which is
propagated to the base of the reservoir, is of the order of 0.2%, which is significant
enough to impact the geomechanical properties of the reservoir. We observe a
correlation between sand production and time-lapse effect. Results of sand production
analysis in Forties Field shows that in addition to poor reservoir consolidation, high
well angle of deviation through the reservoir and high flow rate (which are the well
known factors) reservoir strain due to pore pressure depletion, contributes significantly
to sand production. For poorly consolidated reservoirs, maintaining reservoir pressure at
148
or close to initial condition does not only help sustain hydrocarbon production, it also
serves as a sand production management tool.
Knowledge of reservoir saturation variation is vital for in-fill well drilling, while
reservoir stress variation provides a useful guide for sand production management,
casing design, injector placement and production management. We show that the
reservoir response to increase in stress and our ability to effectively use time-lapse
seismic as a reservoir pressure monitoring tool derive from rock sensitivity to water
saturation and pressure changes. Time-lapse (4D) differences inverted for saturation and
pressure effects, and calibrated by well and production data, provides an additional tool
for reservoir pressure monitoring. We propose an amendment to the use of AVO
attributes to account for the effect of porosity change. This is particularly important in
highly compacting carbonate reservoirs.
While instability and subsequent failure of the overburden in many mature fields can be
linked to the rapid decrease of the (unconfined compressive strength) UCS at certain
inclination angle to the bedding plane, however, some zones might be characterized by
extreme weakness irrespective of the inclination of the wellbore. Good correlation
between laboratory-measured UCS and incompressibility (Young's Modulus). Elastic
moduli (Young's and Shear moduli) from model-based simultaneous inversion,
calibrated to laboratory measurements, help characterize zones of extreme weakness.
These zones are susceptible to collapse during drilling irrespective of the well deviation
angle through the overburden.

149
Time-lapse (4D) gravimetry has continued to find increasing application in
reservoir monitoring, typically in gas fields and CO2 storage with little or no
application yet in oil monitoring. High porosity, weakly-consolidated, homogenous and
thick reservoirs characterized by shallow burial depth are considered ideal for
gravimetric monitoring in oil bearing formations. Taking a field example from Forties
Field 4D gravity model results, we show that a significant increase in water saturation
(10-15%) is required to produce a resolvable 4D gravity anomaly. Our model results
suggest that time-lapse gravity anomaly can provide clues on reservoir
compartmentalization and by-passed oil when saturation change is of the order of 10%.
Reservoir subsidence is also observed to have a significant impact on 4D gravimetric
anomaly. We observed a decreasing resolution of compaction anomaly as water
saturation increases.

150
6.2 RECOMMENDATIONS
Insufficient field record of sand production is a major setback for an effective sand
analysis. Records of sand produced are at best insufficient, where they even exist.
Understanding field-specific sand production patterns will require a good record of sand
production for each well, which most operators don't keep at the moment. Putting in
place a robust and up-to-date database of weekly or monthly sand production will be of
great benefit. This will guide sand management efforts, especially in mature reservoirs.
Inverting for pressure and saturation from seismic is still an evolving science. Most
currently adopted algorithms and workflows cannot account for the effect of porosity
change in time-lapse difference, which could be dominant in carbonate and poorly
consolidated reservoirs. Active study to further enhance existing tools for inverting
changes in saturation and pressure as well as porosity is required.
Most geomechanical studies have focused principally on the reservoir zone(s) with very
little known about the physics of the overburden rock. This lack of attention to the
overburden has resulted in a knowledge gap between the reservoir and non-reservoir.
While rock physics driven- simultaneous inversion of long offset seismic data will
provide some measure of elastic geomechanical properties of overburden rock, there
still exists the need for calibration through laboratory measurements. Reducing the
knowledge gap between the reservoir and overburden is vital to efficient reservoir
development.