university of mohammed premier … · fpa98 is unique, food-grade acrylic macroporous strong base...
TRANSCRIPT

Akazdam et al., JMES, 2017, 8 (8), pp. 2993-3012 2993
JMES, 2017 Volume 8, Issue 8, Page 2993-3012
1. Introduction
Textile industry is very greedy in water and thus, [1] generates an important quantity of effluents highly charged
with pollutants which constitute a serious threat for the environment. Consequently, these effluents require a
preliminary treatment in order to decrease their polluting load before being rejected into the natural environment. It is
considered that the textile industry is responsible for 15% to 20% of the global water pollution [2]. Among the
discharged pollutants, organic dyes that are not only responsible for an esthetic pollution of water, but also count
among the most toxic compounds, even at low concentration [3]. Today, about 10,000 different dyes are produced
worldwide, for a global production of 7.105 tons per year [4]. Dye effluents discharged from the dyestuff
manufacturing, dyeing, printing and textile industries represent a serious problem all over the world. They contain
Journal of Materials and Environmental Sciences ISSN : 2028-2508
Copyright © 2017,
University of Mohammed Premier
Oujda Morocco http://www.jmaterenvironsci.com/
Removal of Acid Orange 7 Dye from Aqueous Solution Using the Exchange
Resin Amberlite FPA-98 as an Efficient Adsorbent: Kinetics, Isotherms, and
Thermodynamics Study
S. Akazdam
1*, M. Chafi1, W. Yassine
1, B. Gourich1
1. Laboratory of Engineering, Processes and Environment (LEPE) , High School of Technology University Hassan II
Casablanca Morocco.
Abstract
In this study, the removal of Acid Orange 7 dye from wastewater using the macroporous
strongly basic anion exchange resin Amberlite FPA-98 was investigated using the batch
method. The adsorbent was characterized by Fourier Transform-Infrared Spectroscopy (FTIR)
and X Ray Diffraction (XRD). FTIR results showed complexation and ion exchange appear to
be the principle mechanism for AO7 adsorption. Batch adsorption studies were carried out
under various parameters such as contact time, pH, initial dye concentration, adsorbent
dosage, agitation speed, and solution temperature on the removal of AO7. Experimental
isotherm data were analyzed using Langmuir, Freundlich and Temkin isotherm equations and
the isotherm constants were calculated using linear regression analysis for the determination
of the isotherm parameters which describe the adsorption process. The best fit was obtained
by Langmuir model with a Langmuir maximum monolayer adsorption capacity of 200 mg/g at
303°K. A comparison of kinetic models applied to the adsorption of AO7 onto Amberlite
FPA-98 was evaluated for the pseudo-first-order, the pseudo-second-order, Elovich,
intraparticle diffusion and Bangham's kinetics models. The adsorption kinetic data were
properly fitted very well with the pseudo-second-order kinetic model. The results obtained
show that the concentrated solution gives better removal efficiencies. The thermodynamic
parameters were evaluated. The negative values of H° =-118,34 kJ/mol and S° = -396.8272
J/K.mol indicated respectively that the adsorption of AO7 onto Amberlite FPA-98 was
exothermic, spontaneous process. The Gibbs energy (G°) increased when the temperature
was increased from 298 to 323°K indicating a decrease in feasibility of adsorption at higher
temperatures. The results have established good potentiality for the Amberlite FPA-98 to be
used as a sorbent for the removal of AO7 from wastewater.
Received 20 Jun 2016,
Revised 17 Oct 2016,
Accepted 23 Oct 2016
Keywords
Wastewater,
Adosorption,
Acide orange 7,
Removal,
Amberlite,
Dyes;
Kinetics;
Equilibrium;
Thermodynamics.
S. Akazdam
+212658103434
http://www.jmaterenvironsci.com/
Akazdam et al., JMES, 2017, 8 (8), pp. 2993-3012 2994
different types of synthetic dyes which are known to be a major source of environmental pollution in terms of both
the volume of dye discharged and the effluent composition [5]. Most of these dyes are toxic, mutagenic and
carcinogenic [6]. From an environmental point of view, the removal of synthetic dyes is of great concern. The annual
worldwide production of dyes is approximated at 800,000 tonnes and about 50% of these are azo dyes [7]. Anionic
azo dyes contain many compounds from the most varied classes of dyes . A long known, inexpensive, but only
moderately fast dye is C.I Acid Orange 7 (Orange II). As a wool dye it is now of secondary importance, however, it
is used in special areas such as leather dyeing and paper coloration. Like most other azo dyes, it tends to be disposed
in industrial wastewater and poses a severe health threat to humans. It is highly toxic, and its ingestion can cause eye,
skin, mucous membrane, and upper respiratory tract irritation; severe headaches; nausea; water-borne diseases.
In general, chemical and physical discoloration methods have been used for dye removal from wastewaters [8] such
as coagulation and flocculation processes which are largely used for wastewater treatment in the textile industries.
However application of these methods is somewhat restricted due to some limitations such as operational costs,
formation of hazardous by-products, intensive energy requirement and limited adaptability to a wide range of
effluents and these processes are not always effective for dye removal. Moreover, they can sometimes generate
secondary pollution due to the excessive use of chemical reagents. However, the adsorption of this dye on efficient
solid supports is considered as a simple and economical method for its removal from water and wastewater providing
sludge-free cleaning operations and many studies have been conducted to find suitable adsorbents to reduce Acid
Orange 7 concentration [9]. If a physico-chemical treatment based on adsorption using activated carbon is a possible
alternative, this process remains expensive because of the cost of this adsorbent and the difficulty of its regeneration.
As a result, the applicability of adsorption process strongly needs low cost natural adsorbents, which are also
effective. Among these they have included spent brewery grains [10], guava seed carbon [11], de-oiled soya [12],
bottom ash [13], sludge [14], activated carbon fibers [15] chitosan [16] starch [17] bentonites [18], titania aerogels
[19], titaniumdioxide [20] zeolites [21], soil [22], and Sahara desert sand [23] clays.
A number of exchange resins have been used quite efficiently for the removal of specific organic compounds [24],
this study investigates the adsorption characteristics of Acid Orange 7 dye on the strongly basic polyacrylic anion
exchanger Amberlite FPA-98 of macroporous structure. The present work deals with the estimation of the adsorption
properties of Amberlite FPA-98 that constitutes a possible source of adsorbent that could be used for the removal of
dyes from textile wastewater and, more generally, in industrial wastewater .
The focus of the present study was to assess the potentiality of Amberlite FPA-98 as an adsorbent for the dye
AO7 from aqueous solution as an ideal alternative to the current expensive methods of removing dyes from
wastewater using the treatment of a synthetic textile effluent containing an acide dye, Acide Orange 7 (AO7), as the
adsorbate. The Amberlite FPA-98 will be, first, characterized in terms of chemical composition, structure and
texture. Adsorption studies were carried out under various parameters such as average agitation, pH, mass of
adsorbent, contact time, initial dye concentration and temperature. The adsorption kinetic data of the Amberlite
FPA-98 was tested by pseudo-first-order, pseudo-second-order kinetic and Elovich models in order to estimate
quantitatively their influence on dye removal and to determine the rate limiting step of dye adsorption. The
equilibrium data were analyzed using Langmuir, Freundlich and Temkin isotherm models. Moreover, a
thermodynamic study of the adsorption isotherms will be carried out and the results will be confronted to
conventional models, so that the thermodynamic properties could be used to determine the mechanism of dye
removal.
2. Material and Methods
Porous Polymers (Resin Adsorbent): Amberlite FPA 98
There are two main criteria for the choice of adsorbent: The maximum adsorption capacity (qm): solute concentration
transmitted in the solid phase, must be maximized. The adsorption kinetics: the adsorption must take place rapidly.
Exchange resins, strongly basic anionic ion, the principle is to exchange certain ions, or all with active groups on the
resins. Resins, which are in the form of beads or powder form are thus able to exchange mobile ions with ions of the
same sign, contained in a solution with which they are contacted. Strongly basic anionic resins bind the strong and
weak acid anions in a pH range between 1 and 12. This type of resin is regenerated with sodium hydroxide solution

Akazdam et al., JMES, 2017, 8 (8), pp. 2993-3012 2995
and in the form of spherical grains 0.5 1.5 mm in diameter, with specific surface areas of up to 750 m2/g. Amberlite
FPA98 is unique, food-grade acrylic macroporous strong base anion resin. This use of ion exchange technology
based discoloration was more effective and more economical.
The application of these adsorbents Amberlite FPA98 Cl mainly develop in water treatment in the domain refining of
sugar as adsorbents dyes capturing and purification of pharmaceuticals and the guard beds for precious
chromatography media.
FTIR analysis was applied to determine the surface functional groups, using FTIR spectrophotometer (SCO TECH
SP-FTIR-1). The FTIR spectral analyses were recorded from 4000 to 400 cm-1 and the samples were prepared as
KBr pellets under high pressure [25].
B. Adsorbate Preparation
The dye chosen in this study is the Acide Orange 7, also called Acide Orange II (Sigma-Aldrich), belonging to the
family of the anionic dyes. It is representative of a textile type of pollution. Its main features are represented in Table
1; its structural formula is shown in Figure 1. Stock solutions were prepared by dissolving requisite quantity of dye
without further purification in distilled water, and the concentrations used were obtained by dilution of the stock
solution. The pH was adjusted to a given value by addition of HCl (1N) or NaOH (1N) [26].
Figure 1: Molecular structure of Acide Orange 7
TABLE I : Main Characteristics of the Basic Dye Acide Orange II
Synonyme Acide orange 7
Molecular formula C16H11N2NaO4S
Molecular weight [g/mol] 350.33
Molecular volume (Å/molecule) 231.95
Molecular surface area (Å/molecule) 279.02
Width (Å) 7.3
Length (Å) 13.6
Depth (Å) 2.3
λ (nm) 485
pKa pK1 11.4; pK2 1.0
C. Experimental Protocol
Adsorption Experiments and study of physico-chemical parameters
The process of the dye adsorption on the Amb.FPA98 necessarily generates a distribution of the adsorbate between
the solid and liquid phases as a function of operating conditions. After study of the kinetics, isotherms and

Akazdam et al., JMES, 2017, 8 (8), pp. 2993-3012 2996
thermodynamic parameters we’re studding the influence of physico-chemical parameters such as initial dye
concentration, T, pH, mass and agitation.
Adsorption Isotherms
The batch adsorption experiments were conducted in a set of 250 ml Erlenmeyer flask containing adsorbent and 200
ml of AO7 solution at various initial concentrations. The flasks were agitated in an isothermal water-bath shaker at
200 rpm and solution temperature was varied in the range (20–50°C) and all mixtures were studied until the
equilibrium is reached. The filtration of the biphasic samples was carried out using disposable syringe filters with a
pore size 0.45 µm that were shown first to exhibit no interaction with the dye during the sampling and to separate the
solid phase from the liquid phase, the equilibrium concentrations of dye in the solution were measured at 485 nm.
The pH of solutions was adjusted with 1N HCl or 1N NaOH solutions[27].
Adsorption kinetics
Adsorption kinetics were carried out to establish the influence of several parameters (contact time, temperature,
initial dye concentration) using a mechanic stirrer. In the biosorption experiments, The TES was tested for the
adsorption of AO7 dye from aqueous solutions at room temperature using the batch reactor technique. Adsorption
kinetic experiments were performed by contacting 3L of AO7 solution at different initial concentrations ranging from
40 to 240 mg/L with 3g of Amberlite FPA98 in reactor at room temperature. At fixed time intervals, the samples
were taken from the solution and were separated from the sorbent through a filter and the residual concentration was
determined. Experiments were repeated for different initial AO7 concentration (40-240mg/L), agitation speed (50–
250rpm) and temperature (20 - 50°C) values. PH was measured using a combination pH associated with pH-meter
calibrated beforehand. The respective affects of agitation speed, pH, temperature (T), adsorbent mass (m0) and initial
dye concentration (C0) have been investigated.
All the experiments were carried out in duplicate and mean values are presented. The dye removal percentage using
Amberlite FPA98 adsorbent was calculated [28] from:
0e0 )/CC-(C x 100=Re(%) (1)
Where C0 is the initial concentration of dye in solution (mg/L), and Ce is the final dye concentration in aqueous
solution after phase separation (mg/L). The amount of adsorption per gram of Amberlite FPA98 at any time t, qe
(mg/g), was evaluated from the change in solution concentration using[29]:
m
v)xC-(C=q e0e
(2)
Where qe is the uptake capacity (mg/g), C0 and Ce (mg/L) are the liquid-phase concentrations of AO7 at initial and
any time t, respectively, v is the volume of the solution (L) and m is the mass of the adsorbent (g).The analysis of the
instantaneous concentration Ct in the filtered liquid phase was carried out using a double beam UV-visible absorption
spectrophotometer using the wavelength of maximum absorbance of the AO7 λmax=485 nm. The linearity of Beer-
Lambert law was checked for concentration ranging from 1 to 50 mg/L with a correlation coefficientR² = 0.9997.
Isotherm Modeling
All adsorption phenomena are often addressed by their isothermal behavior. The analysis of the isotherm data is
important to develop an equation which accurately represents the results and which could be used for design
purposes. The isothermal curves describe the relationship at the adsorption equilibrium between adsorbed specie and
an adsorbent amount in a given solvent at a constant temperature. The adsorption isotherm is important from both a
theoretical and a practical point of view. The adsorption isotherms were performed with different initial
concentrations in order to determine the sorption mechanisms, the surface properties and affinities of the sorbent and
the adsorption saturation capacity and we have to find accurately a suitable model. By plotting solid phase
concentration against liquid phase concentration graphically it is possible to depict the equilibrium adsorption
isotherm [30].

Akazdam et al., JMES, 2017, 8 (8), pp. 2993-3012 2997
In order to investigate the effect of temperature on the equilibrium capacity of Amberlite FPA98 adsorbent for the
removal of AO7 from aqueous solution, the equilibrium of adsorption data was analyzed using Langmuir,
Freundlich, and Temkin isotherms models. Linear regression is frequently used to determine the best-fitting
isotherm, and the applicability of isotherm equations is compared by judging the correlation coefficients[31].
The theoretical Langmuir sorption isotherm is valid for adsorption of a solute from a liquid solution as monolayer
adsorption on a surface containing a finite number of identical sites. The model is based on several basic assumptions
[32]:
(1) Adsorption is assumed to take place at specific homogenous sites with the adsorbent;
(2) Once a dye molecule occupies a site, no further adsorption can take place at that site;
(3) The adsorbent has a finite capacity for the adsorbate (at equilibrium);
(4) All sites are identical and energetically equivalent.
Therefore, the Langmuir isotherm model was chosen for estimation of the maximum adsorption capacity
corresponding to complete monolayer coverage on the sorbent surface. A mathematical expression of the generalized
non-linear form of the Langmuir isotherm is given by :
eL
eLmaxe
1 CK
CKqq
(3)
Where Ce (mg/L) is the equilibrium dye concentration; qe (mg/g) is the adsorbed amount at equilibrium; qmax is the
maximum adsorption capacity (mg/g); KL is Langmuir equilibrium constant (L/mg). The linear equation of Langmuir
isotherm model can be written as followed:
maxLmax qK
1
q
c
e
e q
ce (4)
The essential characteristic of the Langmuir isotherm can be expressed by the dimensionless constant called
equilibrium parameter, RL, defined by [33]:
0
1
1L
L
RK C
(5)
where KL is the Langmuir constant and C0 is the initial dye concentration. The separation factor RL values indicate the
type of isotherm to be irreversible (RL = 0), favorable (0< RL<1), linear (RL =1) or unfavorable (RL>1).
The Freundlich isotherm model is the earliest known relationship describing the sorption process. The model applies
to adsorption on heterogeneous surfaces with interaction between adsorbed molecules and the application of the
Freundlich equation also suggests that sorption energy exponentially decreases on completion of the sorptional
centers of an adsorbent. This isotherm is an empirical equation that can be employed to describe heterogeneous
systems and is expressed by the following equation [34]:
n
e
/1
Fe CKq (6)
Where Kf is the Freundlich constant related to the adsorption capacity. It can be defined as the adsorption or
distribution coefficient and represents the quantity of dye adsorbed onto adsorbent for unit equilibrium concentration.
1/n is the heterogeneity factor is related to the adsorption intensity and n parameter is a measure of the deviation from
linearity of adsorption. Its value indicates the degree of non-linearity between solution concentration and adsorption
as follows: if n=1, the adsorption is linear; if the value n< 1, this implies that adsorption process is chemical; if the
value n>1, adsorption is a favorable as physical process. Conversely, the values of (1/n<1) and (1/n>1) indicate a

Akazdam et al., JMES, 2017, 8 (8), pp. 2993-3012 2998
normal Langmuir and cooperative adsorption, respectively. Equation (6) can be linearized in the logarithmic form (7)
so that the Freundlich constants can be determined:
n
ckq e
fe
)ln()ln()ln( (7)
Temkin isotherm model contains a factor that explicitly takes into account adsorbing adsorbate/adsorbate
interactions. This model suggests that because of these interactions the heat of adsorption of all the molecules in the
layer decreases linearly with coverage. Adsorption is characterized by a uniform distribution of binding energies, up
to some maximum binding energy. The Temkin isotherm has commonly been applied in the following form [35]:
)ln( ee
RTCk
bq 1
1
(8)
The Temkin isotherm can be expressed in its linear form as:
)ln()ln( 111 ee cBkBq (9
1bB
RT1
(10)
Where qe is the adsorbed amount at equilibrium (mg/g), Ce the equilibrium concentration of the adsorbate (mg/L), k1
and b1 are Temkin parameters. The constant b1 is related to the heat of adsorption. T is the absolute temperature in °K
and R is the universal gas constant 8.314 (J/mol°K). The adsorption data were analyzed according to the linear form
of the Temkin isotherm.
Kinetic Models
There are several kinetic equations available for analyzing experimental sorption. The studies of adsorption
equilibrium are important in determining the effectiveness of adsorption; however, it is also necessary to identify the
types of adsorption mechanism in a given system.
the most famous experimental models obtained in the present work was tested with Pseudo-first, Pseudo-second,
intraparticle diffusion, Elovich and Bangham's models to predict the adsorption kinetic of AO7 onto Amberlite
FPA98 and the kinetic data were analyzed based on the regression coefficient (R2)and the amount of dye adsorbed
per unit weight of the adsorbent.
Pseudo-First-Order Model
The adsorption kinetic data were described by the Lagergren pseudo-first-order model, which is the earliest known
equation describing the adsorption rate based on the solid capacity. The Lagergren equation is generally expresses as
follows:
)(d
de1 t
t qqkt
q (16)
Where qe and qt are the adsorption capacity at equilibrium and at time t respectively (mg/g), k1is the rate constant of
pseudo-first order adsorption (l/min). By integration, it is found that[36]:
tkqqq ete .)ln()ln( 1 (17)
Akazdam et al., JMES, 2017, 8 (8), pp. 2993-3012 2999
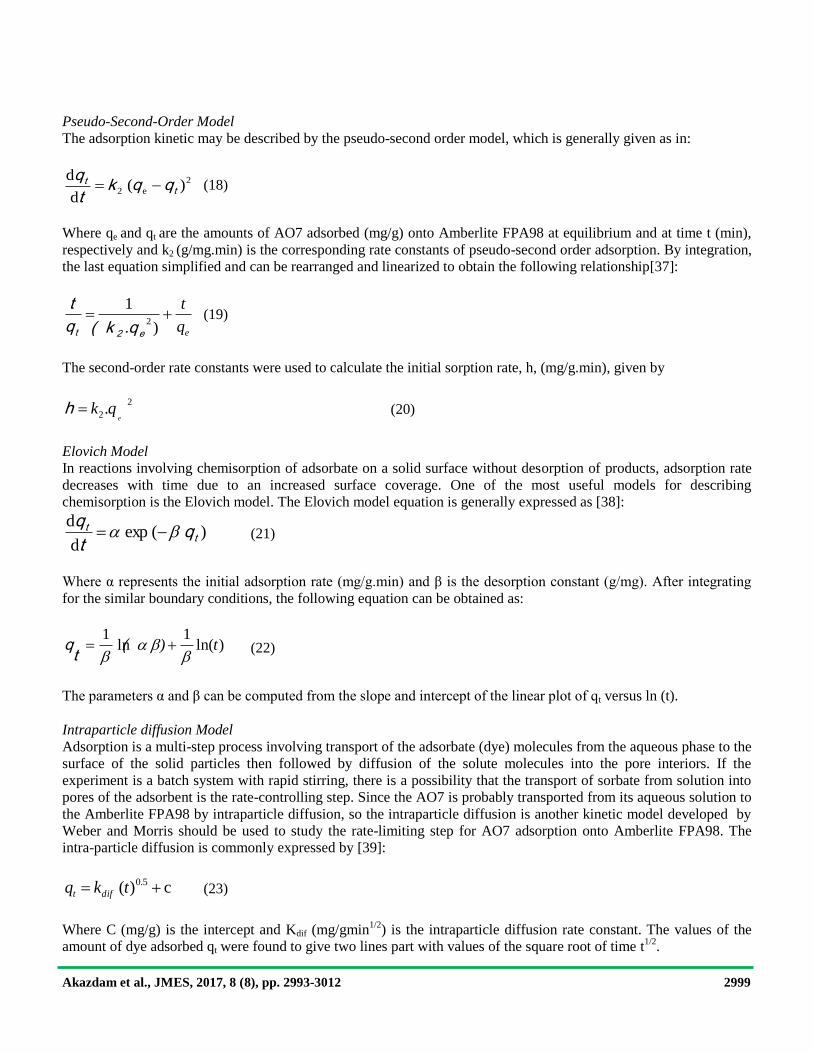
Pseudo-Second-Order Model
The adsorption kinetic may be described by the pseudo-second order model, which is generally given as in:
2
e2 )(d
dt
t qqkt
q (18)
Where qe and qt are the amounts of AO7 adsorbed (mg/g) onto Amberlite FPA98 at equilibrium and at time t (min),
respectively and k2 (g/mg.min) is the corresponding rate constants of pseudo-second order adsorption. By integration,
the last equation simplified and can be rearranged and linearized to obtain the following relationship[37]:
eq
t
)
12
e2t .q(kq
t (19)
The second-order rate constants were used to calculate the initial sorption rate, h, (mg/g.min), given by
2
2.e
qkh (20)
Elovich Model
In reactions involving chemisorption of adsorbate on a solid surface without desorption of products, adsorption rate
decreases with time due to an increased surface coverage. One of the most useful models for describing
chemisorption is the Elovich model. The Elovich model equation is generally expressed as [38]:
)(expd
dt
t qt
q (21)
Where α represents the initial adsorption rate (mg/g.min) and β is the desorption constant (g/mg). After integrating
for the similar boundary conditions, the following equation can be obtained as:
)ln(1
ln1
t)
(tq (22)
The parameters α and β can be computed from the slope and intercept of the linear plot of qt versus ln (t).
Intraparticle diffusion Model
Adsorption is a multi-step process involving transport of the adsorbate (dye) molecules from the aqueous phase to the
surface of the solid particles then followed by diffusion of the solute molecules into the pore interiors. If the
experiment is a batch system with rapid stirring, there is a possibility that the transport of sorbate from solution into
pores of the adsorbent is the rate-controlling step. Since the AO7 is probably transported from its aqueous solution to
the Amberlite FPA98 by intraparticle diffusion, so the intraparticle diffusion is another kinetic model developed by
Weber and Morris should be used to study the rate-limiting step for AO7 adsorption onto Amberlite FPA98. The
intra-particle diffusion is commonly expressed by [39]:
c)( 5.0 tkq dift (23)
Where C (mg/g) is the intercept and Kdif (mg/gmin1/2
) is the intraparticle diffusion rate constant. The values of the
amount of dye adsorbed qt were found to give two lines part with values of the square root of time t1/2
.

Akazdam et al., JMES, 2017, 8 (8), pp. 2993-3012 3000
Bangham's Model
It is generally expressed as[40]:
)log()303.2
log())
log( 0
0
0 tV
mk
mqc
c
t
(24)
where C0 is the initial concentration of the adsorbate in solution (mg/L), V the volume of the solution (l), m the
weight of adsorbent used per liter of solution (g/L),qt (mg/g) the amount of adsorbate retained at time t, α<1 and k0
are constants determined from the plot of Log[C0/C0−mqt] versus log(t).
Thermodynamic study
To investigate the adsorption processes, thermodynamic parameters such as ΔS°, ΔH° and ΔG° are calculated for the
system AO7/Amberlite FPA98 at different temperatures. The evaluation of these parameters is estimated using the
following relations (25-26) from the plot of ln (KL) versus 1/T.
)ln( LkRTG (25)
R
ΔS
RT
ΔH
RT
ΔGK L
Ln
(26)
Where T (°K) is the absolute temperature, R (8.314 J/ mol.K) is the universal gas constant and KL(L/mg) is the
constant of Lagmuir [41].
The activation energy of adsorption Ea must be determined;
The second order rate constant (k2) is expressed as a function of temperature by the Arrhenius equation. The linear
form between k2and temperature can be applied to calculate the activation energy (Ea) of the adsorption using (28):
RT
Ekk a )ln()ln( 02
(28)
Where Ea is the activation energy of sorption (kJ/mol), k0 is the temperature-independent factor (g/mg.min), R is the
gas constant (8.314 J/mol.K) and T is the solution temperature (°K). The physisorption processes usually have
activation energies in the range of 0–50 kJ/mol, while higher activation energies (50–800 kJ/mol) suggest
chemisorption[42].
Studies on Point of Zero Charge (pHpzc)
In pHpzc determination, 0.1M NaCl was prepared and its pH was adjusted in the range of 2–11 by adding 0.1M
NaOH or HCl. Then, 50mL of 0.1M NaCl each was put in conical flask and then 0.1g of the TES was added to these
solutions. These flasks were kept for 48h and final pH of the solution was measured by using pH meter. Graphs were
then plotted for final pH vs initial pH [43].
3. Results and Discussion
3.1.FTIR and DRX Spectral Analysis
Analysis of FT-IR spectrum of Amberlite FPA98 adsorbent in the range of 400–4000 cm-1
as shown in Fig.2 shows
some bands at 3450 cm-1
that are assigned to –OH stretching mode vibrations due to inter-and intra-molecular
hydrogen bonding of polymeric compounds [44]. The peak at 2820 cm-1
is due to asymmetric stretching vibrations of
C-H and the peak observed at1648 cm-1
can be assigned to C=O and COOH has been assigned to peaks at 1250 cm-1
.

Akazdam et al., JMES, 2017, 8 (8), pp. 2993-3012 3001
The X-ray diffraction of our biosorbent is shown in Fig.3; The figure shows two main peak appeared at 2Theta =8
and 2Theta =22. In addition, this spectrum shows several other small peaks at 2Theta = 10,30 and 40 .
Figure 2: FTIR spectra of Amberlite FPA98 Figure 3: X-ray diffraction pattern of Amberlite FPA98
3.2. Effect of Initial AO7 Concentration and Contact Time on AO7 Adsorption
The effect of initial dye concentration, at 25°C, was carried out in the range of 40 and 240 mg/L at pH 7 with 3g of
Amberlite FPA98 added in each 3 liters of AO7 solution. The experimental results showed that the adsorbed quantity
increase when C0 increases. The results obtained are shown in Fig. 4 and indicate that the uptake rate of AO7 dye
adsorbed per gram of Amberlite FPA98 increase gradually as the increase in the concentration of AO7 at the
beginning and, thereafter, the adsorption of AO7 reached equilibrium at 90 min. We can say that the equilibrium time
is independent of the concentration and the amount adsorbed at equilibrium increases with concentration. The
equilibrium adsorption increases from 80 to 180 mg/g, with increase in the initial AO7 concentration from 40 to 240
mg/L. This variation of the initial concentration generates an increase in the initial rate of adsorption. This is because
the diffusion of dye molecules from the solution to the adsorbent surface is accelerated by increasing the dye
concentration. The increase in uptake capacity of the sorbent with increasing AO7 concentration may be due to the
increase of sorbate quantity [45].. However, the experimental data were measured at 120 min to be sure that full
equilibrium was attained.
The amount of the dye adsorbed at equilibrium on Amberlite FPA98 increased with an increase in the initial dye
concentration of solution to a plateau value which corresponds to the maximum capacity of adsorption. This can be
explained by the fact that adsorbent had a limited number of active sites, which would have become saturated above
a certain concentration.
Figure 4: kinetics adsorption of AO7 by Amberlite FPA98 Figure 5: Effect of temperature on the adsorption of AO7

Akazdam et al., JMES, 2017, 8 (8), pp. 2993-3012 3002
3.3. Effect of Temperature
To determine the effect of temperature on the adsorption of the AO7 dye, experiments were conducted at 10, 20,
30,40 and 50°C. The experiments were performed by adding 1 g/L of Amberlite FPA98 to the AO7 solution at a
fixed concentration (80 ppm) and constant pH. The equilibrium uptake percentage of dye ions using Amberlite
FPA98 was affected by temperature. So, the increase in temperature decreases the physical forces responsible for
sorption. Fig.5 shows that the adsorption of AO7 by Amberlite FPA98 decreased with an increase in temperature.
This behavior indicates that the AO7 dye adsorption is an exothermic process. Furthermore, the decrease uptake of
the anionic AO7 dye removal at higher temperatures (above 20°C) may be attributed to the destruction of some
polymeric active sites on the adsorbent surface due to bond rupture, as well as the deformation of surfaces at higher
temperatures. Consequently, the study found that the dye adsorption process was affected by temperature and that the
optimum working range was 20°C.
3.4. Effect of Solution pH and the Point of Zero Charge (pHpzc) on AO7 Adsorption
The pH is an important factor in the adsorption study, because it can influence at the same time the structure of
adsorbent, adsorbed molecules as well as the mechanism of adsorption. This factor depends on the origin of water to
be treated and the process of their treatments. The pH affects both the degree of ionization of the dye as well as the
surface properties of the adsorbent. Since hydrogen ions affect the surface charge of the adsorbents and the adsorbate
species, the sorption is greatly affected by the variation of solution pH. We have thus studied the efficiency of the
adsorption when the pH is varied in the range of 1-12 as shown in Fig. 6. The figure indicates that, as the pH
increase, the adsorption capacity for AO7 increases. Fig. 6 shows the variations of the adsorbed quantity of dye
according to the initial pH of dye aqueous solutions. The figure indicates that the favorable adsorption of the dye at
relatively pH ranged between 7 and 9. The adsorption capacity of the sorbent was screened over a wide pH range of
the dye solution, i.e. from 1.0 to 12.0. The pH value of 7 was selected as the optimum for performing the adsorption
studies. The point of zero charge (pHpzc) is an important factor that determines the linear range of pH sensitivity and
then indicates the type of surface active centers and the adsorption ability of the surface [46]. Cationic dye adsorption
is favored at pH >pHpzc, due to presence of functional groups such as OH, COO- groups. Anionic dye adsorption is
favored at pH<pHpzc where the surface becomes positively charged. The graph of final pH vs initial pH was plotted as
shown in Fig.7.
Figure 6: Effect of solution pH on the adsorption of AO7 Figure 7: Determination of point of zero charge of Amberlite
The intersection of the curves with the straight linear known as the end points of the pHpzc, and this value is 9 for
Amberlite FPA98. As shown in Fig.6, the quantity adsorbed of dye was minimum at pH = 2, this increased up to 9
and remained nearly constant over the initial pH ranges of 9–12. This phenomenon occurred due to the presence of
H+
ions excess in the adsorbate and the negatively charged surface of the adsorbent. Lower adsorption of AO7 at
acidic pH (pH <pHpzc) is due to the presence of H+ ions excess competing with the cation groups on the dye for
adsorption sites. At higher solution pH (pH>pHpzc), the Amberlite FPA98 possibly negatively charged and enhance

Akazdam et al., JMES, 2017, 8 (8), pp. 2993-3012 3003
the positively charged dye cations through electrostatic forces of attraction. We selected pH=9 for adsorption and
kinetic experiments.
3.5.Effect of the Mass of Adsorbent
The influence of mass was tested in the interval 0-1,4g. Adsorbent dosage is an important parameter because it
determines the capacity of adsorbent for a given initial concentration of dye molecules. Data obtained from the
experiments with varying adsorbent dosage are presented in Fig. 4. The adsorption removal of AO7 increased from
40 to 60 % when the adsorbent dosage was increased from 0,2 to 1 g. The effect of Amberlite FPA98 amount on the
percentage of dye removal was shown in Fig.8. It can be seen that the AO7 removal increases up to a certain limit
and then it remains almost constant. Optimum Amberlite FPA98 dosage was found to be 1 g; this is due to the
availability of an increase in the number of possible binding sites as the dose of adsorbent increased. Consequently, 1
g was used as optimal amount for further experiments. Increase in adsorption with adsorbent dosage can be attributed
to increased adsorbent surface area.
Figure 8: Effect of adsorbent dosage Figure 9: Effect of agitation on the adsorption of AO7 onto Amberlite
3.6. Effect of Agitation
The results of the adsorption (fig.9.) run as a function of rotation speed on the performance of adsorption, in the
range studied, 50-250 rpm, show that optimal rate of agitation (200 rpm) corresponds to an adsorbed quantity
associated with a maximum intra-particulate transfer coefficient. This optimal rotation speed (200 rpm) was, thus,
taken as the working stirring velocity for further experiments.
3.7.Isotherm Modeling of the Sorption Equilibrium Depending on Temperature
For analyzing experimental data and for describing the equilibrium of biosorption, Langmuir, Freundlich and Temkin
isotherms were simulated. Table II shows the fitting parameters for the measured isotherm data for AO7 adsorption
onto Amberlite FPA98 on the linear forms of isotherms. It can be observed that the adsorption isotherm of AO7 onto
Amberlite FPA98 fits Langmuir isotherm well with higher correlation coefficients (R2) in comparison with other
isotherms, reflecting that the adsorption sites on the surface of Amberlite FPA98 are evenly distributed. According to
Langmuir adsorption isotherm, the qmax for AO7 are calculated to be 142.85, 200, 166.66, 125 and 100 mg.g-1
at 298,
303, 313, 318 and 323 °K respectively. The maximum adsorption of AO7 on Amberlite decreases with increasing the
temperature, exhibiting the exothermic nature of the adsorption process. The Fig.10 shows that the top has a growth
adsorbed amount qe of the dye in equilibrium when the concentration of AO7 grows, then becomes constant which
reflects the saturation of the adsorption active sites. Also, the increase in temperature leads to a decrease in the
adsorbed amount, it can be said that the low temperatures are of most interest and the maximum monolayer capacity
qm adsorbed at 30°C is 200 mg/g obtained from Langmuir model.

Akazdam et al., JMES, 2017, 8 (8), pp. 2993-3012 3004
TABLE II: Comparison of the Coefficients Isotherms Parameters for AO7 Adsorption onto Amberlite FPA98
Models T (°C)
25°C 30°C 40°C 45°C 50°C
Langmuir
qm(mg/g) 142.857143 200 166.666667 125 100
K1(l/mg) 0.10144928 0.0297619 0.02521008 0.05633803 0.02369668
R2 0.996 0.987 0.988 0.994 0.912
Freundlich
Kf 5.98346601 6.38530975 5.40865258 4.13298539 1.46228459
N 6.4516129 6.66666667 5.58659218 3.32225914 1.55279503
R2 0.615 0.766 0.918 0.684 0.864
Temkin
k1 4.67936295 7.16591949 1.93101018 0.17987572 0.02759246
B1 20.62 21.85 21.26 36.8 43.73
b1 8.06401552 9.51258581 11.7318909 7.90733696 6,65424194
R2 0.594 0.755 0.899 0.6 0.85
Figure 10: Variation of the adsorbed amount in terms of Ce Figure 11: The plot of ln(qe) versus ln(Ce) obtained from different temperatures
The separation factor RL values for the sorption of AO7 dye on the Amberlite FPA98 adsorbent at different initial dye
concentrations have been studied at different solution temperatures. All RL values fall between zero and one; This fact
supports the previous observation where the Langmuir isotherm was favorable for dye sorption for all studied
temperatures. Freundlich constants can be determined from the plot of ln(qe) versus ln(Ce) (fig.11.). Thus we can
generate the value of KF from the intercept and 1/n from the slope and coefficients of determination are presented in

Akazdam et al., JMES, 2017, 8 (8), pp. 2993-3012 3005
Table II. Freundlich model is not comparable to that obtained from Langmuir model linear form. This result
indicates that the experimental data were not fitted well Freundlich model (low correlation coefficient). The values of
nf are higher than unity, indicating that adsorption of AO7 onto Amberlite FPA98 is a favorable physical process
(obtained in Table II).
The Temkin constants k1 and B1 are calculated from the slope and the intercept of qe versus lnCe. The linear isotherm
constants and coefficients of determination are presented in Table II. Examination of the data shows that the Temkin
isotherm is not applicable to the AO7 adsorption onto Amberlite FPA98 judged by low correlation coefficient (R2).
3.8. Thermodynamic Parameters of Adsorption
Thermodynamics experiments were carried out at a temperature range of 25-50°C. Fig.13 shows the plot of ln Kl
versus 1/T and the values of estimated thermodynamic parameters are given in Table III.
Figure 13: Plot of the adsorption of AO7 species onto Amberlite Figure 14: Arrhenius plots for the adsorption of AO7 onto Amberlite .
As can be observed, the negative value of ΔH° (-118.341 kJ/mol) shows that the adsorption is exothermic as process.
The negative value of ΔS° (-396,8272 J/mol.°K) can be used to describe the randomness at the solid/solution
interface during the adsorption process. The Gibbs energy(G°) increased from -0,08696 kJ/mol to 9,83371606
kJ/mol with an increase in temperature from 298 to 323 °K indicate a decrease in feasibility of adsorption at higher
temperatures and the spontaneous nature of the adsorption.
TABLE III: Thermodynamic Parameters Obtained from Isotherm Adsorption of AO7 onto Amb.
T (°C) KL(L/mg) T (°K) 103/T(°K
-1) Ln(K) ΔG (KJ/mol) ΔH (J/mol) ΔS (J/mol*°K)
25 1.01449275 298 3.3557 0.0143887 -0.08696444
-118341.476 -396.8272
30 2.98E-02 303 3.30033 1.89717166
40 2.52E-02 313 3.19489 5.86544386
45 5.63E-02 318 3.14465 -2.876386 7.84957996
50 2.37E-02 323 3.09598 -3.74242 9.83371606

Akazdam et al., JMES, 2017, 8 (8), pp. 2993-3012 3006
Concerning the evaluation of the activation energy (Ea) of the adsorption, the Fig. 14 shows a linear relationship
between the logarithm of rate constant and the inverse temperature and gives an estimation value Ea =-13.194 kJ/mol
and k0=0.55266679 (g/mg.min). The negative values of Ea indicate the presence of an energy barrier in the adsorption
and confirming the nature of physisorption processes of AO7 on the surface of Amberlite FPA 98.
Kinetic Models
The most famous experimental models obtained in the present work was tested with Pseudo-first, Pseudo-second,
intraparticle diffusion, Elovich and Bangham models to predict the adsorption kinetic of AO7 on Amberlite FPA98.
The adsorption data were analyzed according to the pseudo first-order kinetic model at various effects (agitation.
concentration and temperature). The plots of ln (qe −qt) versus t obtained are presented in Fig.15. We can see that the
first order kinetic model is not checked for all effects because the curves are not perfectly linear with lower values of
R2. It is therefore imperative to check the second order model.
Figure 15: Pseudo-first-order kinetics for AO7 adsorption onto Amberlite FPA98 at various effects (a-agitation, b-
concentration and c-temperature)
Fig.16 shows the applicability of the pseudo-second-order equation for all effects (agitation, concentration and
temperature), with a coefficient of correlation R2 greater than 0.99.Values of the rate constant k2 and equilibrium
adsorption capacity qe were calculated from the intercept and slope of the plots of t/qt versus t respectively.
In the table IV presents all of the results concerning the characteristics of the pseudo-first-order model and the
pseudo-second-order kinetic models. This indicates that the AO7- Amberlite adsorption system obeys the pseudo-
second-order kinetic model for the entire sorption period. The value of initial sorption h (mg/g.min) decreases
practically with the increasing of temperature from 10 to 50°C. It was observed that the pseudo-second-order rate
constant (k2) increased with increasing of temperature from 10 to 50°C respectively. However, the results obtained
using the pseudo-second-order model are not enough to predict the diffusion mechanism.
The Elovich parameters α and β and Bangham’s model constant can be computed from the slope and intercept of the
linear plots of q t versus Ln (t), and Log[C0/C0−mqt] versus log(t) respectively at various effects (agitation.
concentration and temperature) as shown in Fig. 17 and Fig.18.

Akazdam et al., JMES, 2017, 8 (8), pp. 2993-3012 3007
Figure 16: Plot of the pseudo-second-order model at various effects (a-agitation, b- concentration and c-temperature) of AO7
onto Amberlite
TABLE IV : Comparison of the First- and Second-Order Adsorption Rate Constants and qe Values for various effects
(agitation, concentration and temperature) AO7 onto Amberlite
Effect agitation C reel T(°C)
Pseudo 1st order Pseudo second order
k1
(l/min)
qe
(mg/g) R1
2
10-3
.k2
(g/mg
min)
qe
(mg/g)
h
(mg/g.min) R2
2
agitation (tr/min)
50 119.67 30 0.041 32.75 0.852 6 166.66 166.66 0.999
100 83.73 30 0.054 56.26 0.934 2 166.66 166.66 0.998
150 111.30 30 0.033 49.30 0.805 0,6 200 26.31 0.993
200 107.11 30 0.03 40.16 0.883 1,4 142.857 28.57 0.994
250 109.44 30 0.029 38.82 0.898 1,48 142.857 30.30 0.992
Temperature (°C)
200 108.51 10 0.047 61.68 0.93 2 200 83.33 0.998
200 108.04 20 0.05 65.10 0.83 2 200 83.33 0.998
200 111.65 30 0.057 44.92 0.895 3 166.66 90.90 0.997
200 110.95 40 0.054 50.04 0.874 3 166.66 83.33 0.998
200 118.16 50 0.042 33.85 0.669 4 166.66 125 0.999
Concentration(ppm)
200 40 30 0.054 38.86 0.932 4 90.90 33.33 0.998
200 80 30 0.037 39.05 0.88 3 111.11 45.45 0.998
200 100 30 0.055 44.74 0.895 4,4 142.85 90.90 0.999
200 200 30 0.037 37.07 0.765 4,5 166.66 125 0.999
200 240 30 0.064 79.83 0.92 1,9 200 76.92 0.998

Akazdam et al., JMES, 2017, 8 (8), pp. 2993-3012 3008
Figure 17: Elovich model plot for the adsorption of AO7 onto Amberlite FPA98 at various effects (a-agitation, b-concentration
and c-temperature)
Figure 18: Bangham model plot for the adsorption of AO7 onto Amberlite FPA98 at various effects (a-agitation , b-
concentration and c-temperature)

Akazdam et al., JMES, 2017, 8 (8), pp. 2993-3012 3009
The Table V lists the kinetic constants α and k0 obtained from the Bangham's equation. Thus, when temperature
passed from 10 to 50 ◦C, the value of α decreased from 0.816 to 0.365 and the value of k0 decreased from 5109.93 to
2886.79(mL/g/L). The experimental data did not give a good correlation. In addition, it was found that the correlation
coefficients for the Elovich model are higher than those obtained for Bangham's model (Table V). This result
confirmed that the pore diffusion is not the only rate-controlling step.
TABLE V : Comparison of Elovich and Bagham models parameters for various effects (agitation. concentration and
temperature)
Effect agitation Creel T(°C)
Elovich Bangham
(g/mg) α (mg/g
min) R
2 k0(mL/g/L) α R
2
T(°C) 200 108.510998 10 0.06640106 20.534 0.995 5.109 0.816 0.868
200 108.045685 20 0.06591958 26.582 0.983 4.471 0.854 0.829
200 111.651861 30 0.0890472 18.602 0.982 2.974 0.402 0.952
200 110.953892 40 0.08244023 55.788 0.988 4.260 0.525 0.898
200 118.166244 50 0.10598834 23.414 0.946 2.886 0.365 0.931
C(ppm) 200 40 30 0.11313497 18.915 0.995
200 80 30 0.09823183 55.41 0.992
200 100 30 0.09416196 71.687 0.967
200 200 30 0.09910803 10.960 0.964
200 240 30 0.05813953 78.85 0.939
agitation 50 119.678511 30 0.10307153 64.250 0.927 5.450 0.025 0.932
100 83.7330795 30 0.07199424 51.65 0.945 5.500 0.05 0.944
150 111.302876 30 0.0792393 94.620 0.985 5.387 0.034 0.986
200 107.115059 30 0.06447453 69.73 0.954 5.450 0.038 0.989
250 109.441624 30 0.06671114 35.807 0.887 5.228 0.036 0.969
The intraparticle diffusion is another kinetic model developed by Weber and Morris that should be used to study the
rate-limiting step for AO7 adsorption onto Amberlite. The intraparticle diffusion is the sole rate-limiting step only if
the plots of qt versus t1/2
pass through the origin, which is not the case in Fig.1Erreur ! Signet non défini.9.
The intraparticle diffusion rate constant Kdif were in the range of 0.358 –1.181 mg/g.min1/2
and it increases with an
increase of temperature. For intraparticle diffusion plots, the first sharper region is the instantaneous adsorption or
external surface adsorption that can be attributed to the film diffusion.
The second region is the gradual adsorption stage where intraparticle diffusion is the rate limiting. It confirms that
intraparticle diffusion was not the only rate limiting mechanism in the sorption process.
The values of kdiff1and kdiff2 as obtained from the slopes of the two straight lines are listed in Table VI. The values of
the intraparticle diffusion rates kdiff1 are smaller than the film diffusion rates kdiff2 .That gives prediction that the dye
sorption process may be controlled by the intraparticle diffusion.

Akazdam et al., JMES, 2017, 8 (8), pp. 2993-3012 3010
Figure 19: Intraparticle diffusion model plot for the adsorption of AO7 onto Amberlite FPA98 at various effects (a-agitation ,
b-concentration and c-temperature)
TABLE VI: Parameters Obtained from Intraparticle Diffusion Model for various effects (agitation. concentration and
temperature)
Effect agitation Creel T(°C) intraparticle diffusion
R2
Extraparticle diffusion R
2
Kdif C Kdif C
T(°C) 200 108.510998 10 10.95 107.2 0.971 4.312 136.3 0.951
200 108.045685 20 10.37 113.1 0.967 3.475 148.1 0.873
200 111.651861 30 10.03 102.7 0.896 3.191 130.1 0.869
200 110.953892 40 10.36 97.63 0.96 3.283 126.4 0.956
200 118.166244 50 7.746 113.6 0.953 2.176 137.7 0.648
C(ppm) 200 40 30 8.526 40.8 0.953 2.596 62.95 0.958
200 80 30 8.327 60.66 0.942 2.866 82.93 0.999
200 100 30 9.405 87.04 0.973 2.577 116.3 0.948
200 200 30 8.64 111.7 0.889 3.007 133.3 0.964
200 240 30 11.65 104.6 0.934 3.117 151.1 0.626
Agitation (tr/min) 50 119.678511 30 12.64 82.07 0.991 3.966 122.2 0.745
100 83.7330795 30 12.09 74.21 0.9 3.279 112.7 0.608
150 111.302876 30 11.53 104.5 0.944 4.007 132.2 0.96
200 107.115059 30 11.58 97.11 0.959 2.788 136.8 0.82
250 109.441624 30 13.36 113.8 0.873 3.565 150.1 0.965
The plot of constant of Weber and Morris equation depending on the concentration (Fig.20) shows that the diffusion
constant(C) increases with increasing of the concentration in a linear fashion. This confirms that the limitante step is
the intra-granular distribution.

Akazdam et al., JMES, 2017, 8 (8), pp. 2993-3012 3011
Figure 20: The variation of the constant of Weber and Morris equation depending on the concentration.
Conclusion The efficiency of Amberlite FPA98 in removing the anionic dye AO7 dye from aqueous solution has been
investigated. Amberlite FPA98 could almost remove over 75% of AO7 within 100 min contact time; the
solution pH has important bearing on the extent of this process. This indicates that the pH is more important in
the controlling of adsorption rather than the nature of the surface sites. This work confirms that the Amberlite
FPA98 could be used for the removal of dyes from aqueous solutions.
The equilibrium time is independent of the concentration and the amount adsorbed at equilibrium increases with
concentration. This is because the diffusion of dye molecules from the solution to the surface of the adsorbent is
accelerated by increasing the dye concentration. The adsorbed amount decreases with increasing temperature.
Results indicate that the adsorption isotherm data were fitted good agreement with the Langmuir isotherm
model by comparing the values of the linear correlation coefficient R². The adsorption capacity was found to be
200mg.g-1
at 293°K. The adsorption process followed pseudo-second order kinetics and was spontaneous and
exothermic. This study shows that Amberlite FPA98 is an effective adsorbent for removal of organic pollutants
from aqueous solutions.
References 1. Iqbal M.J., Ashiq M.N., J. Hazard. Mater.139 (2007) 57–66.
2. Santos A.B., Cervantes F.J., Lier J.B., Biores. Technol.98 (2007) 2369–2385.
3. Vandevivere P.C., Bianchi R., Verstraete W., J. Chem. Technol. Biotechnol. 72 (1998) 289–302.
4. Qureshi K., Ahmad M.Z., Bhatti I.A., Iqbal M., Khan A., Chemistry International 1 (2015) 53-59.
5. Barka N., Assabbane A., Nounah A., Ait-Ichou Y., J Hazard Mater 152 (2008) 1054–1059.
6. Itoh K., Kitade Y., Yatote C., Bull Environ Contam. Toxicol. 56 (1996) 413–418.
7. Pinherio H.M., Touraud E., Tomas O., Dyes Pigments 61(2004) 121–139.
8. Liou Y.B., Tsay R.-Y., J. Tai. Inst. Chem. Eng. 45 (2014) 533-540.
9. Zollinger H., Dyes and Pigments 12 (2003) 52-68.
10. Szyguła H., Guibal E., Ruiz M., Sastre A.M., Colloids Surf. 330 (2008) 219–226.
11. Özcan F., Oturan M.A., Oturan N., Şahin Y., J. Hazard. Mater. 163 (2009) 1213–1220.
12. Elizalde-González M.P., Hernández-Montoya V., J. Hazard. Mater. 168 (2009) 515–522.
13. Hunger K., Industrial Dyes Chemistry 26 (2003) 18-26.
14. Gupta V.K., Mittal A., Gajbe V., Mittal J., Ind. Eng. Chem. Res. 45 (2006) 1446–1453.
15. Hsiu M., Ting-Chien C., San-De P., Hung-Lung C., J. Hazard. Mater. 161 (2009) 1384–1390.
16. El Haddad M., Slimani R., Mamouni R. , ElAntri S., Lazar S. J. Assoc. Arab Univ. Bas. Appl. Sc.14 (2013)
51–59.
17. Wang Z., Xiang B., Cheng R., Li Y., J. Hazard. Mater. 183 (2010) 224–232.
18. Cheng R., Ou S., Xiang B., Li Y., Liao X., Dyes Pigments 26 (2010) 752–758.
19. Abramian L., El-Rassy H., Chem. Eng. J. 150 (2009) 403–410.
20. Bourikas K., Stylidi M., Kondarides D.I., Verykios X.E., Colloids Surf. 20 (2005) 9222–9230.
21. Jin X., Jiang M.q., Shan X.q., Pei Z.g., Chen Z., J. Colloid Interface Sci. 328 (2008) 243–247.
22. Smaranda D., Bulgariu M., Gavrilescu R., EEMJ 8 (2009) 1391–1402.
Akazdam et al., JMES, 2017, 8 (8), pp. 2993-3012 3012
23. Varlikli V., Bekiari M., Kus N., Boduroglu I., Oner P., Lianos G., Lyberatos S., Isli K., J. Hazard. Mater.
170 (2009) 27–34.
24. Gupta V.K., Carrott P.J.M., Ribeiro Carott M.M.L., Suhas K., Rev. Environ. Sci. Tech. 39 (2009) 783–842.
25. Guo J.Z., Li B., Liu L., Lv K., Chemosphere 111 (2014) 225–231.
26. Lim L.B.L., Priyantha N., Tennakoon D.T.B., Chieng H., Dahri M.K., Suklueng M., Arab J. Chem. 12
(2014) 32-42 .
27. El Boujaady A. , El Rhilassi A., Ziatni M.B., El Hamri R., Taitai A., Lacout J.L., Desalin. 275 (2011) 10–
16.
28. Tsai W.T., Hsienb K.J., Hsu H.C., Lin C.M., Lin K.Y., Chiu C.H., Bioresour. Technol. 99 (2008) 1623–
1629.
29. Seid L., Chouder D., Maouche N., Bakas I., Barka N., J. Taiwan Inst. Chem. Eng. 45 (2014) 2969–2974.
30. Slimani R., Anouzla A., Abrouki Y., Ramli Y., El Antri S., Mamouni R., Lazar S., El Haddad M., J. Mater.
Environ. Sci. 2 (1) (2011) 77-87
31. Arami M., Limaee N.Y., Mahmoodi N.M., Chem. Eng. J. 139 (2008) 2–10.
32. Barka N., Assabbane A., Nounah A., Laanab L., Ichou Y.A., Desalin. 235 (2009) 264–275.
33. Gurses A., Hassani M., Kıransan O., Açıs l., Karaca S., J. Water Process Eng. 2 (2014) 10–21.
34. Zheng W., Li X., Wang F., Yang Q., Deng P., Zeng G., J. Hazard. Mater. 157 (2008) 490–495.
35. Gonte R., Balasubramanian K., J. of Saudi Chem. Soc. (2013).
36. Slimani R., El Ouahabi I., Abidi F., El Haddad M., Regti A., Laamari R., El Antri S., Lazar S., J. Tai. Inst.
Chem. Eng. 45 (2014) 1578-1587.
37. Aarfane A., Salhi M., El Krati S., Tahiri M., Monkade E.K., Lhadi M., Bensitel L., J. Mater. Environ. Sci. 5
(2014) 1927-1939.
38. Khaled J., El Nemr A., El-Sikaily A., Abdelwahab O., J. Hazard. Mater. 165 (2009) 100–110.
39. Kose T.E., Kıvanç B., Chem. Eng. J. 178 (2011) 34– 39.
40. Mezitia F., Boukerrouib A., Procedia Eng. 33 (2012) 303 – 312.
41. Tan N., Li M., Lin Y.M. , Lu X.Q., Chen Z., Desalin. 266 (2011) 56–62.
42. Zewail T.M., Yousef N.S., Alex. Eng. J. 54 (2015) 83–90.
43. Suzuki T., Timofei S., Kurunczi L., Dietze U., Schuurmann G., Chemosphere 45 (2001) 1–9.
44. Zhou L., Jin J., Liu Z., Liang X., Shang C., J. Hazard. Mater. 16 (2010) 10-15.
45. Pathani H., Sharm S., Singh P., Arab. J. Chem. (2013) .
46. Silva J.P., Sousa S., Rodrigues J., Antunes H., Porter J.J., Gonçalves I., Dias S.F., Sep. Purif. Technol. 40
(2004) 309–315.
(2017) ; http://www.jmaterenvironsci.com