university of louisville hospital emergency...
TRANSCRIPT
University of Louisville
Masters Internship
University of Louisville HospitalEmergency Department Simulation
How to improve patient satisfaction and increase ED’s revenue
Author:Eddy de Haas
Supervisor:Dr. Sunderesh S. Heragu
December 15, 2010
Contents
Management Summary 2
1 Introduction of the problem 3
2 Literature Review 4
3 System Description 7
4 Data Analysis 9
5 Experimental Design 21
6 Analysis of Results 25
Conclusions 33
Future Work 34
References 35
A Model Description 37
B Flowcharts 53
1

Management Summary
The University of Louisville Hospital Emergency Department (UofL Hospital ED) is expe-riencing problems with the large (and increasing) number of patients coming in. Due tohospital space limit, it is almost impossible to expand the number of ED beds. So other so-lutions need to be found to cope with these extra patients. In order to find solutions withoutactually affecting the daily operations of the Emergency Department, a simulation model isdeveloped and different ED options are investigated.
The following options are investigated:
1. a physician and a nurse see the patient together when both a nurse and a physician areavailable
2. hire a nurse that is dedicated to discharging and admitting patients
3. make extra beds available in the hospital where patients can be held to wait when thedecision is made that they are going to be admitted to the hospital
4. hire some nurses until 8pm instead of 7pm
5. the following combinations of the above stated options; 1 + 2, 1 + 3, 2 + 3 and 1 + 2+ 3.
All options shown above are also investigated with one more nurse than what is the caseat the moment. In order to find out what the impact of all options can be, all options aresimulated with arrival rates varying from the current arrival rate to a 20% higher arrival ratethan the current one, in steps of 2.5%.
The results, shown in tables 6.1 and 6.2, indicate that the best option to implement is thecombination of 1 + 2 + 3 and the extra nurse. This will make it possible to have more revenuewithout having to invest significant amounts of money. This combination also is the safestchoice to implement, because when one of the options turns out not to work as expected, theother changes will probably make sure that extra revenue can made after.
A problem that is not investigated using the simulation model but that may have itsinfluence on the process and throughput times at the ED is the fact that around the nurseshift changes in the hospital, the number of people that are put in their assigned bed (whenthey are going to be admitted to the hospital) drastically decreases. This cannot be explainedby anything other than human behaviour not wanting to have extra work at the end of a shift.This causes patients to stay longer at ED than necessary and makes it impossible for newpatients to enter the ED faster. A solution for this problem may be to spread the momentsthat nurses start working at the hospital.
2

Chapter 1
Introduction of the problem
The University of Louisville Hospital (UofL Hospital) is having problems with the increasingnumber of people coming to their Emergency Department (ED). Until 2008, about 37,000patients visited the ED every year. Since 2008 the number of patients increased rapidly,40,000 patients are expected in 2010. It is to be expected that this number will increase evenmore in the future. The main problem is that the capacity of the ED cannot be increasedbecause of the lack of space in the building, so other solutions have to be found in order toprovide the patients with the care they need. The focus of the research is on the number ofbeds available during the day and the patient satisfaction.
According to the staff, the main problem is the time the patient has to wait at ED aftertreatment is finished to the moment that the patient is admitted or sent home. Anotherproblem seems to be the fact that when a patient needs to be admitted and has to get a bedassigned, no inpatient beds are available. The next problem is that even when an inpatientbed is available, it is not clean in a significant number of times.
It is impossible to eliminate all of the problems stated above, but it might be possible toimprove the total process by making some minor adjustments to the system. The best wayto find how a system responds to changes without affecting the real system is a simulationmodel. That is what will be done for this case as well.
In order to find the best solution to this problem, a literature review is conducted in orderfind possible solutions. Real time data is analysed in order to be able to make a realisticsimulation model and several solutions in different compositions are analysed in order todetermine the best option.
3

Chapter 2
Literature Review
A lot of papers have been written on the increasing number of people visiting ED’s aroundthe world. Some focus on how to prevent people from coming to ED, while other focus onhow to get patients through ED as fast as possible. In order to identify solutions that maybe applicable to the UofL Hospital ED, the main cause has to be identified first; why do thatmany people go to an ED? After that the problems at the ED have to be identified and thenpossible solutions can be identified.
Why do people go to an Emergency Department?
The main reasons for people to go to an Emergency Department seem to be the difficultyof getting an appointment at a general practitioner, the feeling of pain or the availability ofresources such as X-ray or the possibility of getting prescription drugs (Gentile et al., 2010).For the UofL Hosptial the difficulty of getting an appointment at a general practitioner canbe considered to be the major reason for people to attend the ED, because a large portionof patients is uninsured. This can not be changed as the United States ED’s act as a safetynet for all uninsured Americans (Schull et al., 2007), (Paul et al., 2010). A lot of thesepatients actually don’t necessarily need emergency care (Weinick et al., 2010), (Vartak et al.,2009), (McGuigan and Watson, 2010), but as the Emergency Medical Treatment and LaborAct states that ED patients can not be turned away, they will have to be taken care of andwill use resources at the ED. Another reason for the increasing number of patients is the factthat older patients need more emergency care. And so, because the population is growingolder more people will attend an ED (McCaig and Nawar, 2006).
Why does an Emergency Department get overcrowded and what does it cause?
Overcrowding of the ED can be defined as a situation in which more patients are at theED than beds are available. In the case of the UofL Hospital, this happens quite frequently,especially at the end of the afternoon. The patients that usually cause overcrowding are (Kolbet al., 2008):
• patients that are waiting to be admitted at ED
• patients that are monitored in non-treatment areas
• patients waiting for transfer to an inpatient unit in the hospital
4

The main reasons for overcrowding are (Derlet and Richards, 2000):
• increased complexity and acuity of patients presenting to the ED
• overall increase in patient volume
• lack of beds for patients admitted to the hospital
• delays in service provided by radiology, laboratory, and ancillary services
An overcrowded ED does not only increase waiting times for patients, prolonged pain andsuffering and patient dissatisfaction. It also leads to ambulances being diverted to hospitalsfurther away, decreased productivity, frustration among staff and patients and even vio-lence (Derlet and Richards, 2000).
What are possible solutions?
What catches the eye is that especially the last two types of patients stated above causingovercrowding do not really need the care provided at an ED, they can be taken care of in forinstance a dedicated holding room (van der Vaart et al., 2010). This not only makes extrabeds available at the ED, it also prevents the nurses at the ED from doing work that’s notstrictly necessary.
Another solution may be to use a team approach when a patient arrives (Medeiros et al.,2008). At this time a patients first goes through triage, where he has to tell what happened.After he is admitted at the ED a nurse comes to see the patient, and he has to tell his storyagain. After a while, the physician will see him and he will have to tell the story again. Whenusing a team approach, the goal is to eliminate the extra time that is needed because a storyhas to be told to several persons over and over again.
A solution in order to prevent patients from waiting before they can be transported totheir inpatient bed, can be to hire an extra nurse or technician that’s dedicated to taking careof these people (or dedicate an already hired nurse or technician) (Han et al., 2009). This willhelp the other nurses and technicians to speed up their actual job; to take care of patientsthat really need care and not worry about people that have to moved somewhere in betweenjobs.
Other ways the speed up the process a bit, may be to place resources at other places, sothat nurse and technicians do not have to walk or search too much. Or relocating for instancethe X-ray machines so that they can be accessed more easily.
In order to reduce the amount of people not needing urgent care going to ED, a FastTrack (van der Vaart et al., 2010) can be used. This track must take care of the peoplehaving just a cold, or the flu.
Different ways of staffing may also be a solution, for instance when you know that mostMondays are significantly busier than the other weekdays, it may be useful to hire extrapeople on Monday only. At the moment, most hospitals have the same staffing every day ofthe week.
Which solutions are applicable to the UofL Hospital ED?
The problems of why people go to an ED are kind of ”system problems” that can not besolved easily, so the focus of the research will not be on this. The UofL Hospital tries to
5

cope with most people not needing emergency care by letting them go through the FirstCareTrack, this is a Fast Track taking care of the less urgent people. No research is needed forthat. Relocations of resources such as X-ray or bandages is also not a good, first because it’snot easy to model and secondly because the space at the ED is limited, so changes would beminor.
What might be possible in the UofL Hospital, is to make a holding room for patients notneeding immediate care any more, or waiting to be moved to an inpatient bed or to go home.Another possibility is to hire a nurse dedicated to taking care of these patients, so withouthaving a holding area. Another option to consider is the team approach, although physiciansare usually busy, it can be worth the try to save much needed time.
Different staffing options can also be considered. When a good analysis is made of thebusy and quiet hours at the ED, the staffing can be adjusted to these findings.
6
Chapter 3
System Description
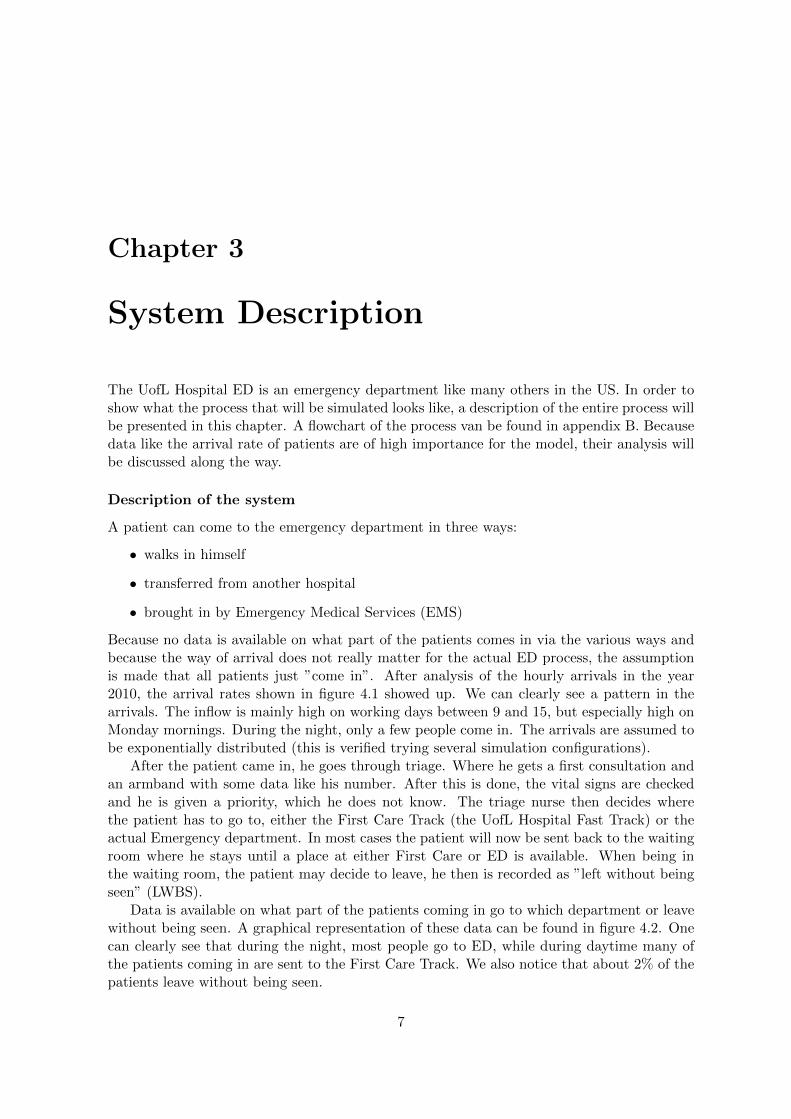
The UofL Hospital ED is an emergency department like many others in the US. In order toshow what the process that will be simulated looks like, a description of the entire process willbe presented in this chapter. A flowchart of the process van be found in appendix B. Becausedata like the arrival rate of patients are of high importance for the model, their analysis willbe discussed along the way.
Description of the system
A patient can come to the emergency department in three ways:
• walks in himself
• transferred from another hospital
• brought in by Emergency Medical Services (EMS)
Because no data is available on what part of the patients comes in via the various ways andbecause the way of arrival does not really matter for the actual ED process, the assumptionis made that all patients just ”come in”. After analysis of the hourly arrivals in the year2010, the arrival rates shown in figure 4.1 showed up. We can clearly see a pattern in thearrivals. The inflow is mainly high on working days between 9 and 15, but especially high onMonday mornings. During the night, only a few people come in. The arrivals are assumed tobe exponentially distributed (this is verified trying several simulation configurations).
After the patient came in, he goes through triage. Where he gets a first consultation andan armband with some data like his number. After this is done, the vital signs are checkedand he is given a priority, which he does not know. The triage nurse then decides wherethe patient has to go to, either the First Care Track (the UofL Hospital Fast Track) or theactual Emergency department. In most cases the patient will now be sent back to the waitingroom where he stays until a place at either First Care or ED is available. When being inthe waiting room, the patient may decide to leave, he then is recorded as ”left without beingseen” (LWBS).
Data is available on what part of the patients coming in go to which department or leavewithout being seen. A graphical representation of these data can be found in figure 4.2. Onecan clearly see that during the night, most people go to ED, while during daytime many ofthe patients coming in are sent to the First Care Track. We also notice that about 2% of thepatients leave without being seen.
7
When the patient is taken out of the waiting room he either goes to ED or First Care.When the patient goes to First Care he actually leaves the Emergency Department process,that’s why, for modelling purposes, this patient is removed from the system. When the patientgoes to ED, he is placed in an ED bed and waits to be seen by an ED nurse for the first time.After the nurse has finished her job the patient waits to be seen by a physician. After beingseen by the physician he waits for treatments, tests are conducted, waits for test results andhe may have to be helped by a nurse a few times. This goes on until the decision is madewhether he will be admitted or discharged. From triage to this decision usually takes aboutfour to five hours.
After that decision is made, the patients either waits to go home (wait for a nurse to beavailable to discharge him, this can take up to 1.5 hours), or waits for an inpatient bed to beassigned. Data is available on the time it takes for a bed to be assigned; in 2010 it took onaverage one hour and 53 minutes for a bed to be assigned (see figure 4.4).
After the inpatient bed is assigned two things can happen; the bed is either clean or not.The chances of having no clean inpatient bed at the time the bed is assigned can be found infigure 4.6. As we can see, the chance of having no clean inpatient bed varies heavily over theday and throughout the week. When the bed is not clean, it needs to be cleaned, which takesabout eighteen minutes according to the available data (see figure 4.4). When the bed is cleanthough, a nurse has to be available to move the patient to his bed, as with the dischargedpatients, this can take up to 1.5 hours (see figure 4.4). The same goes for patients that canbe put into their bed after it is cleaned.
When the patient is in his bed, a new patient can enter the Emergency Department. Andthe entire process starts over again.
Resources
The resources in the model are as follows:
• three physicians at all time
• at least eleven nurses at all time
– two more nurses starting at 11am
– two more nurses starting at 1pm
– back to eleven nurses at 7pm
• 29 ED beds
In chapter 5 explanation is giving on resources that will be varied in the simulation model.
8
Chapter 4
Data Analysis
In order to make a good simulation model, a lot of data is needed. Preferably real time data.The UofL Hospital provided us with about one and a half year of data on the amount ofarrivals every hour and about 8 months of data on the process times for admitted patients.Furthermore they provide us with a lot of summarized data in order to be able to validatethe model.
Analysis of the available data
Data are available on two parts of the process;
• the number of arrivals and to which department (ED or First Care) the patient is sent
• the times in between the steps that are made when a patient is admitted
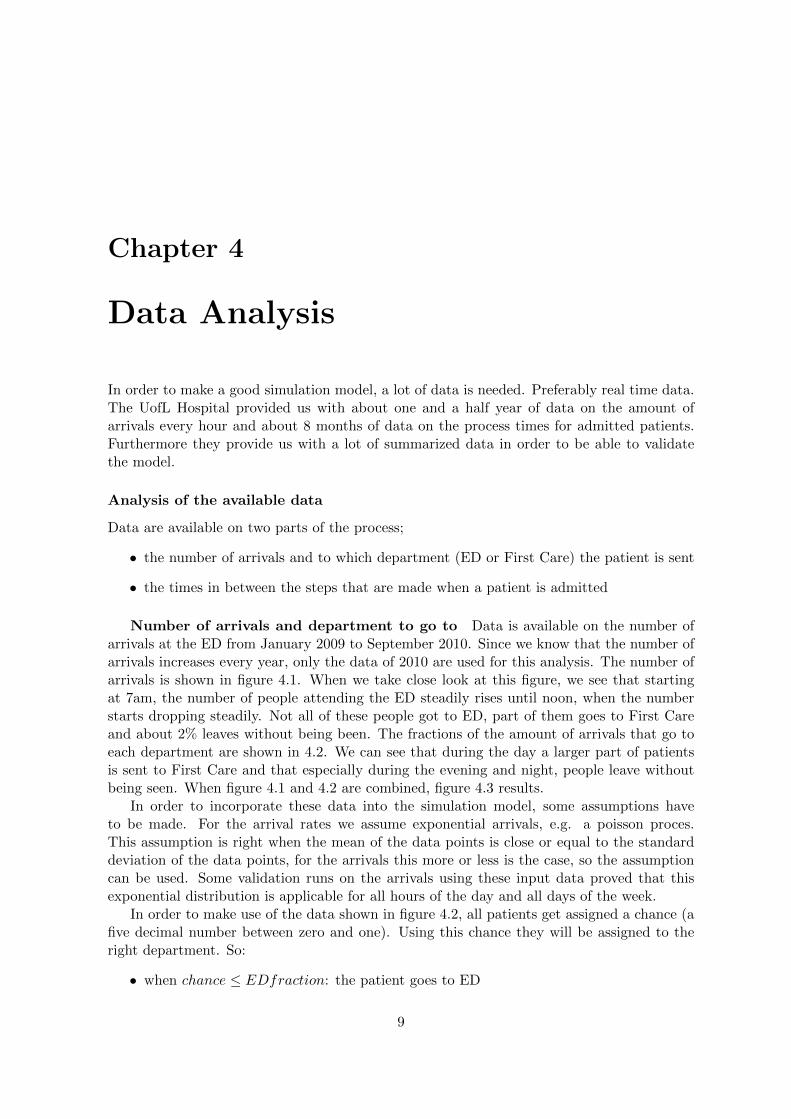
Number of arrivals and department to go to Data is available on the number ofarrivals at the ED from January 2009 to September 2010. Since we know that the number ofarrivals increases every year, only the data of 2010 are used for this analysis. The number ofarrivals is shown in figure 4.1. When we take close look at this figure, we see that startingat 7am, the number of people attending the ED steadily rises until noon, when the numberstarts dropping steadily. Not all of these people got to ED, part of them goes to First Careand about 2% leaves without being been. The fractions of the amount of arrivals that go toeach department are shown in 4.2. We can see that during the day a larger part of patientsis sent to First Care and that especially during the evening and night, people leave withoutbeing seen. When figure 4.1 and 4.2 are combined, figure 4.3 results.
In order to incorporate these data into the simulation model, some assumptions haveto be made. For the arrival rates we assume exponential arrivals, e.g. a poisson proces.This assumption is right when the mean of the data points is close or equal to the standarddeviation of the data points, for the arrivals this more or less is the case, so the assumptioncan be used. Some validation runs on the arrivals using these input data proved that thisexponential distribution is applicable for all hours of the day and all days of the week.
In order to make use of the data shown in figure 4.2, all patients get assigned a chance (afive decimal number between zero and one). Using this chance they will be assigned to theright department. So:
• when chance ≤ EDfraction: the patient goes to ED
9

day of the week
Sunday
Monday
Tuesday
Wednesday
Thursday
Friday
Saturday
hour of the day
0 5.0 5.4 5.5 4.9 4.9 4.5 5.51 4.5 4.2 4.4 3.4 4.0 4.3 5.62 4.3 3.7 3.2 3.1 2.9 3.5 4.33 4.8 2.7 3.3 2.7 3.1 3.2 4.44 3.8 2.7 2.3 2.3 3.1 2.4 3.75 3.3 2.6 2.0 2.3 2.8 2.2 3.56 2.8 3.1 3.0 2.8 3.0 2.9 3.07 3.6 4.9 3.9 4.3 4.7 4.5 3.58 5.3 7.8 6.6 7.1 6.9 7.1 5.49 5.9 11.1 9.8 9.4 9.7 9.3 6.1
10 7.1 12.4 11.6 10.7 9.3 9.5 7.311 7.0 12.2 10.5 10.8 10.4 11.1 8.312 7.1 12.3 11.7 10.8 9.3 10.8 7.813 7.7 11.1 11.2 10.8 11.4 10.6 7.814 6.9 11.9 10.0 9.9 9.7 10.1 7.815 7.8 10.1 9.2 9.3 8.8 8.5 7.916 7.8 9.8 9.4 9.2 8.6 9.3 7.417 7.9 9.2 7.9 8.3 8.5 8.1 8.018 7.6 9.2 8.7 9.0 8.3 8.8 7.019 8.0 9.1 8.4 8.2 8.4 8.1 7.020 6.3 8.3 7.5 7.8 6.6 8.4 7.021 6.3 8.0 7.3 7.4 7.8 7.1 7.622 6.3 6.3 5.8 6.2 6.3 7.2 6.323 5.7 6.0 5.1 5.8 5.6 7.2 5.1
hour of the day
Figure 4.1: Average number of arrivals per hour (hour of the day/day of the week)
• when EDfraction < chance ≤ EDfraction + FTfraction: the patient goes to theFast Track
• when chance ≥ 1 − LWBSfraction: the patient leaves without being seen
When the patient leaves without being seen, no data will be recorded any more, the samegoes for patients that go to First Care. When the patient goes to ED, he undergoes histreatment. For the treatment itself no actual data are available, so assumptions are made onthe processing times in this part of the simulation. These assumptions are approved by theHospital staff and are thought to be realistic.
Admission times After the decision is made that a patient is going to be admitted, abed slip is passed. This will make that sure a bed will be assigned to the patient. In figure4.4, the most left column, we can see the time it takes on average for a bed to be assigned.Unfortunately, not enough data was available to make different probability distributions foreach hour of the day, especially not for the hours during the night. The number of data
10

EDFi
rst C
are
LWB
S
Sunday
Monday
TuesdayWednesday
Thursday
Friday
Saturday
Sunday
Monday
TuesdayWednesday
Thursday
Friday
Saturday
Sunday
Monday
TuesdayWednesday
Thursday
Friday
Saturday
h o u r o f t h e d a y
00.
980.
970.
930.
960.
960.
980.
870.
010.
010.
010.
010.
020.
010.
040.
020.
020.
070.
030.
020.
010.
091
0.99
0.98
0.94
0.97
0.93
0.99
0.94
0.00
0.01
0.00
0.00
0.01
0.00
0.02
0.01
0.01
0.06
0.03
0.06
0.01
0.04
20.
980.
980.
990.
980.
980.
990.
920.
010.
000.
000.
000.
000.
000.
030.
010.
020.
010.
020.
020.
010.
053
0.97
0.98
0.99
0.98
0.96
0.97
0.94
0.01
0.00
0.00
0.00
0.02
0.00
0.04
0.02
0.02
0.01
0.02
0.02
0.03
0.03
40.
970.
960.
971.
000.
960.
950.
940.
010.
000.
000.
000.
010.
010.
020.
030.
040.
030.
000.
030.
040.
045
0.97
0.99
1.00
0.99
1.00
0.99
0.95
0.02
0.01
0.00
0.00
0.00
0.01
0.05
0.01
0.00
0.00
0.01
0.00
0.00
0.00
60.
940.
870.
930.
950.
870.
910.
930.
040.
120.
070.
050.
130.
090.
070.
010.
010.
000.
000.
000.
000.
007
0.65
0.62
0.61
0.56
0.68
0.70
0.64
0.34
0.37
0.39
0.44
0.31
0.30
0.34
0.01
0.01
0.00
0.00
0.01
0.00
0.02
80.
620.
560.
620.
540.
570.
520.
580.
370.
440.
380.
460.
420.
480.
410.
010.
000.
000.
000.
000.
000.
019
0.58
0.50
0.56
0.53
0.56
0.50
0.62
0.42
0.49
0.43
0.46
0.43
0.50
0.38
0.00
0.01
0.01
0.01
0.01
0.00
0.01
100.
560.
480.
550.
550.
530.
510.
590.
430.
510.
440.
450.
460.
470.
410.
000.
020.
010.
010.
010.
020.
0011
0.57
0.52
0.56
0.59
0.58
0.55
0.55
0.42
0.47
0.42
0.40
0.41
0.45
0.45
0.01
0.01
0.01
0.01
0.00
0.00
0.00
120.
640.
550.
560.
560.
610.
600.
620.
360.
440.
420.
430.
380.
400.
370.
000.
010.
020.
010.
010.
000.
0013
0.62
0.54
0.53
0.55
0.54
0.56
0.62
0.38
0.43
0.46
0.44
0.45
0.42
0.38
0.00
0.02
0.01
0.01
0.01
0.02
0.00
140.
560.
530.
590.
570.
550.
570.
610.
440.
460.
410.
420.
450.
410.
380.
000.
010.
010.
010.
000.
020.
0115
0.59
0.57
0.63
0.57
0.55
0.57
0.60
0.40
0.42
0.36
0.41
0.44
0.42
0.40
0.01
0.01
0.01
0.01
0.01
0.01
0.01
160.
700.
600.
570.
590.
620.
650.
690.
290.
380.
410.
400.
370.
350.
300.
000.
020.
010.
010.
010.
010.
0017
0.65
0.54
0.65
0.60
0.65
0.67
0.65
0.35
0.44
0.33
0.40
0.33
0.32
0.35
0.01
0.02
0.02
0.00
0.01
0.00
0.00
180.
690.
590.
560.
570.
620.
620.
700.
300.
390.
430.
390.
370.
370.
280.
010.
020.
010.
030.
010.
010.
0219
0.68
0.60
0.63
0.65
0.59
0.67
0.69
0.30
0.39
0.35
0.32
0.40
0.31
0.29
0.02
0.02
0.02
0.03
0.01
0.01
0.01
200.
660.
690.
660.
600.
640.
730.
780.
330.
280.
300.
350.
340.
250.
210.
010.
040.
030.
040.
020.
020.
0021
0.69
0.61
0.68
0.73
0.72
0.74
0.74
0.28
0.35
0.29
0.25
0.25
0.23
0.25
0.03
0.04
0.03
0.02
0.04
0.03
0.01
220.
790.
780.
700.
730.
730.
790.
800.
180.
180.
290.
260.
260.
170.
180.
030.
040.
010.
020.
010.
040.
0123
0.93
0.83
0.82
0.84
0.87
0.86
0.87
0.06
0.14
0.14
0.12
0.11
0.11
0.13
0.01
0.03
0.04
0.03
0.02
0.03
0.00
h o u r o f t h e d a y
Figure 4.2: Fraction of patients going to department shown (hour of the day/day of the week)
11

EDFi
rst C
are
LWB
S
Sunday
Monday
TuesdayWednesday
Thursday
Friday
Saturday
Sunday
Monday
TuesdayWednesday
Thursday
Friday
Saturday
Sunday
Monday
TuesdayWednesday
Thursday
Friday
Saturday
h o u r o f t h e d a y
04.91
5.12
4.91
4.55
4.55
4.24
4.64
0.03
0.03
0.03
0.06
0.09
0.03
0.21
0.09
0.12
0.36
0.12
0.09
0.06
0.48
14.50
3.97
4.03
3.21
3.61
4.06
5.09
0.00
0.03
0.00
0.00
0.03
0.00
0.12
0.03
0.03
0.24
0.09
0.24
0.06
0.21
24.25
3.52
3.09
2.91
2.79
3.39
3.82
0.03
0.00
0.00
0.00
0.00
0.00
0.12
0.06
0.06
0.03
0.06
0.06
0.03
0.21
34.63
2.58
3.18
2.58
2.91
2.97
4.00
0.03
0.00
0.00
0.00
0.06
0.00
0.15
0.09
0.06
0.03
0.06
0.06
0.09
0.12
43.63
2.48
2.12
2.18
2.88
2.18
3.33
0.03
0.00
0.00
0.00
0.03
0.03
0.06
0.09
0.09
0.06
0.00
0.09
0.09
0.15
53.19
2.52
1.97
2.15
2.70
2.06
3.21
0.06
0.03
0.00
0.00
0.00
0.03
0.15
0.03
0.00
0.00
0.03
0.00
0.00
0.00
62.66
2.58
2.67
2.61
2.55
2.55
2.73
0.13
0.36
0.21
0.15
0.39
0.24
0.21
0.03
0.03
0.00
0.00
0.00
0.00
0.00
72.31
2.94
2.30
2.30
3.09
3.09
2.18
1.22
1.76
1.48
1.82
1.39
1.30
1.15
0.03
0.06
0.00
0.00
0.03
0.00
0.06
83.25
4.24
3.94
3.70
3.85
3.58
3.06
1.94
3.33
2.45
3.18
2.82
3.27
2.15
0.06
0.00
0.00
0.03
0.03
0.00
0.06
93.41
5.36
5.30
4.85
5.21
4.48
3.67
2.47
5.30
4.12
4.24
4.06
4.52
2.24
0.00
0.12
0.09
0.06
0.09
0.03
0.03
104.00
5.79
6.18
5.67
4.76
4.73
4.12
3.06
6.09
4.94
4.61
4.18
4.36
2.91
0.03
0.18
0.09
0.06
0.12
0.15
0.00
114.00
6.21
5.73
6.18
5.88
5.91
4.42
2.91
5.55
4.30
4.21
4.15
4.82
3.58
0.06
0.09
0.15
0.06
0.03
0.03
0.03
124.50
6.61
6.33
5.85
5.55
6.30
4.70
2.56
5.18
4.79
4.52
3.42
4.18
2.82
0.00
0.12
0.18
0.15
0.06
0.00
0.03
134.72
5.85
5.70
5.73
6.00
5.76
4.70
2.94
4.67
4.97
4.61
4.94
4.30
2.91
0.00
0.24
0.15
0.12
0.09
0.18
0.00
143.84
6.15
5.67
5.52
5.18
5.58
4.61
3.00
5.27
3.94
4.03
4.18
4.06
2.82
0.03
0.12
0.06
0.09
0.00
0.15
0.09
154.63
5.58
5.61
5.18
4.73
4.70
4.55
3.09
4.12
3.18
3.76
3.76
3.42
3.03
0.06
0.09
0.09
0.12
0.09
0.12
0.06
165.50
5.70
5.24
5.27
5.18
5.79
5.00
2.31
3.58
3.76
3.55
3.09
3.12
2.18
0.03
0.18
0.12
0.06
0.06
0.06
0.03
175.13
4.79
4.97
4.82
5.39
5.30
5.03
2.75
3.97
2.55
3.18
2.73
2.55
2.73
0.06
0.18
0.15
0.03
0.12
0.03
0.03
185.25
5.21
4.70
5.00
4.97
5.30
4.76
2.25
3.52
3.67
3.42
3.00
3.15
1.88
0.06
0.18
0.09
0.27
0.06
0.06
0.12
195.44
5.24
5.12
5.21
4.82
5.27
4.73
2.44
3.39
2.82
2.55
3.24
2.45
2.00
0.16
0.15
0.18
0.21
0.12
0.09
0.09
204.16
5.55
4.85
4.55
4.06
5.94
5.30
2.09
2.24
2.21
2.64
2.18
2.03
1.45
0.09
0.30
0.24
0.33
0.12
0.18
0.03
214.41
4.79
4.85
5.21
5.42
5.09
5.42
1.75
2.73
2.06
1.82
1.88
1.58
1.82
0.19
0.27
0.18
0.15
0.27
0.21
0.09
225.00
4.79
3.94
4.36
4.52
5.55
4.88
1.16
1.09
1.61
1.55
1.58
1.18
1.12
0.19
0.24
0.06
0.09
0.06
0.27
0.09
235.34
4.82
4.06
4.76
4.70
6.00
4.30
0.34
0.82
0.69
0.70
0.61
0.76
0.64
0.03
0.18
0.21
0.18
0.12
0.18
0.00
h o u r o f t h e d a y
Figure 4.3: Number of patients going to department shown (hour of the day/day of the week)
12

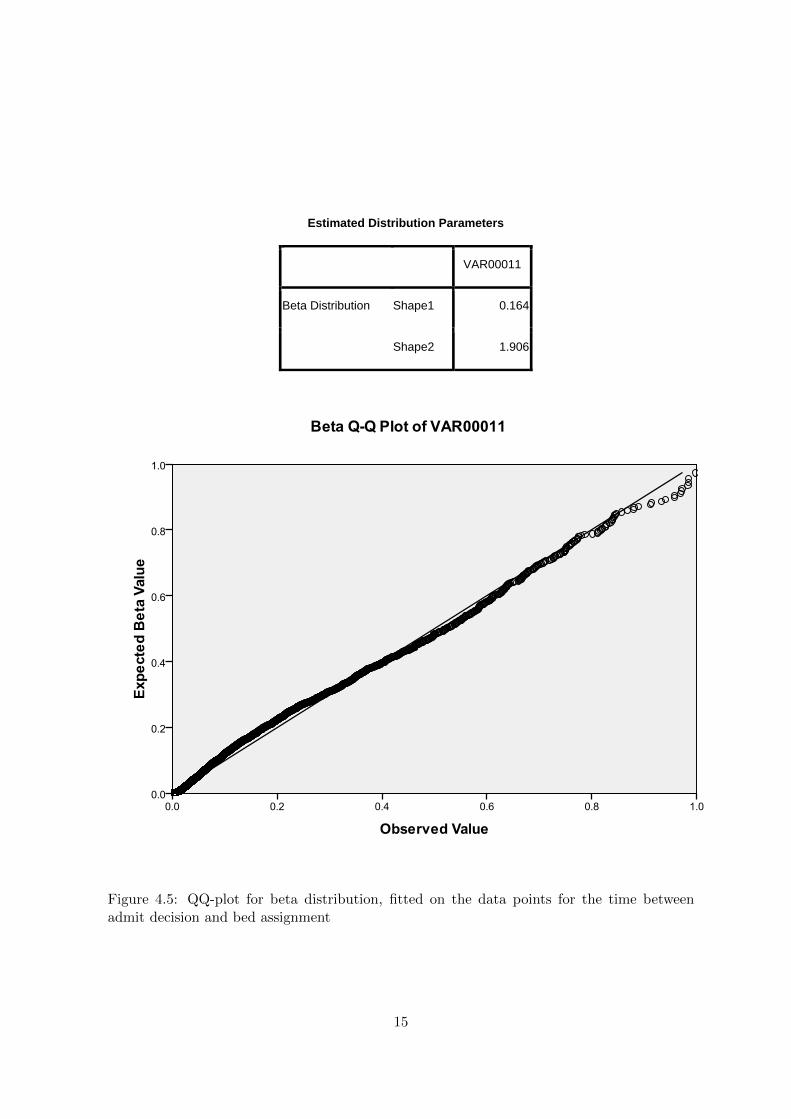
points was enough though to determine a fitting distribution for the entire day. Analysis withSPSS 17.0 showed that a beta distribution represents that data points sufficiently when usingα1 = 0.164 and α2 = 1.906. A QQ-plot of the distribution with these parameters is shownin figure 4.5. We can see that the fit is good (except for the extremely high values), so thisdistribution can be used.
After a bed is assigned, it may happen that the assigned bed is not clean yet. The chancesof a bed not being clean after assignment are shown in figure 4.6. We can clearly see that thisvaries highly over time. These numbers are based on the 2010 data. The data is used in themodel by comparing a chance (a five decimal number between zero and one) that is given tothe patient (another one than the one stated before in order to prevent correlation effects) tothe chances shown in figure 4.6. So:
• when chance < CleanBedChance, the bed is not clean
• when chance ≥ CleanBedChance, the bed is clean
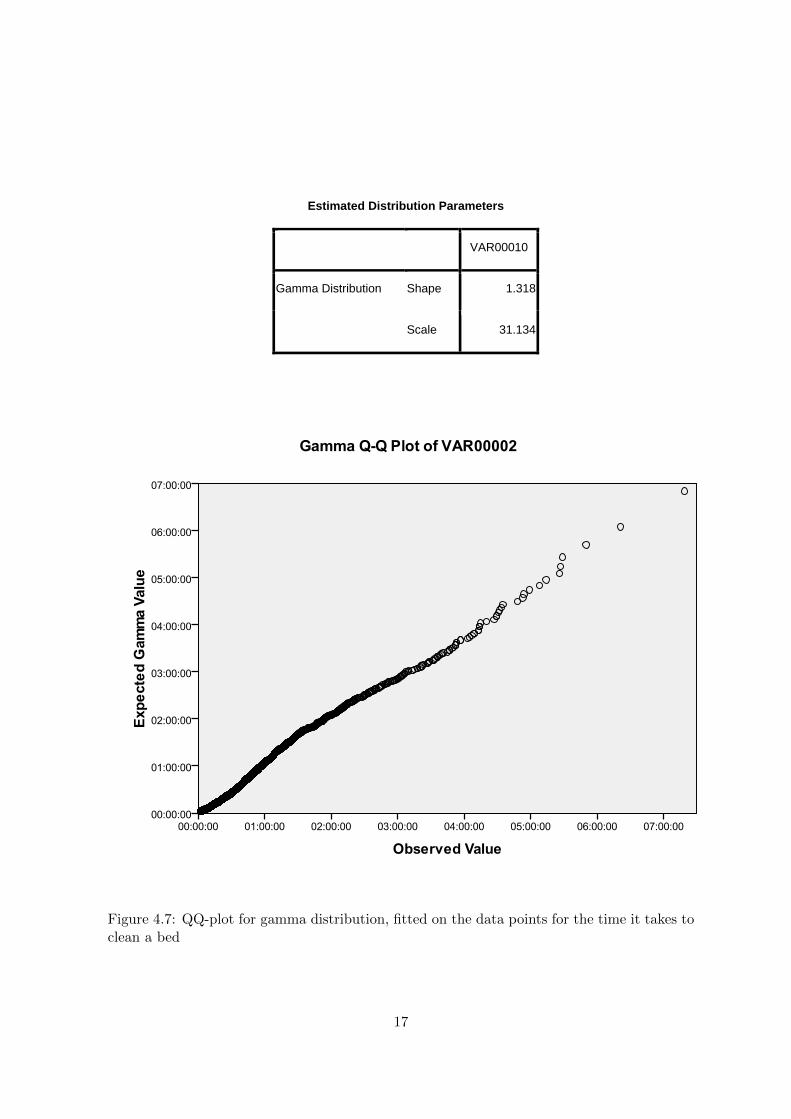
The time it takes for a bed to be cleaned is shown in figure 4.4, in the middle column. Wesee that the variation over the day is pretty low compared to the total time patients are on theED, so we assumed a single distribution would represent the data well enough (also havingin mind that not enough data points are available for single hour of the day distributions).An appropriate distribution is chosen using SPSS 17.0, a gamma distribution with κ = 1.318and θ = 31.134 showed up to be the best fit. A QQ-plot is shown in figure 4.7. We can seethat this is an appropriate representation of the data points, so it can be used in the model.
When the bed is clean and the patient is ready to be discharged from the ED, a nursewill need to make sure that the patient actually is discharged. In figure 4.4, the rightmostcolumn, we can see that it takes one hour and 26 minutes on average for a patient to be inthe bed and discharged. These times are based on 2010 data. It would be nice to have thishold up as an output of the model, but since it is not totally reliant on the availability ofnurses and possible paperwork or eventualities it has to modelled as an input in order to geta valid model. Analysing the data with SPSS 17.0 resulted in a lognormal distribution withµ = 0.05 and σ2 = 0.644. A QQ-plot of the data points and this distribution can be found infigure 4.8. As can be seen, this distribution represents the data sufficiently.
Staffing influences on the process
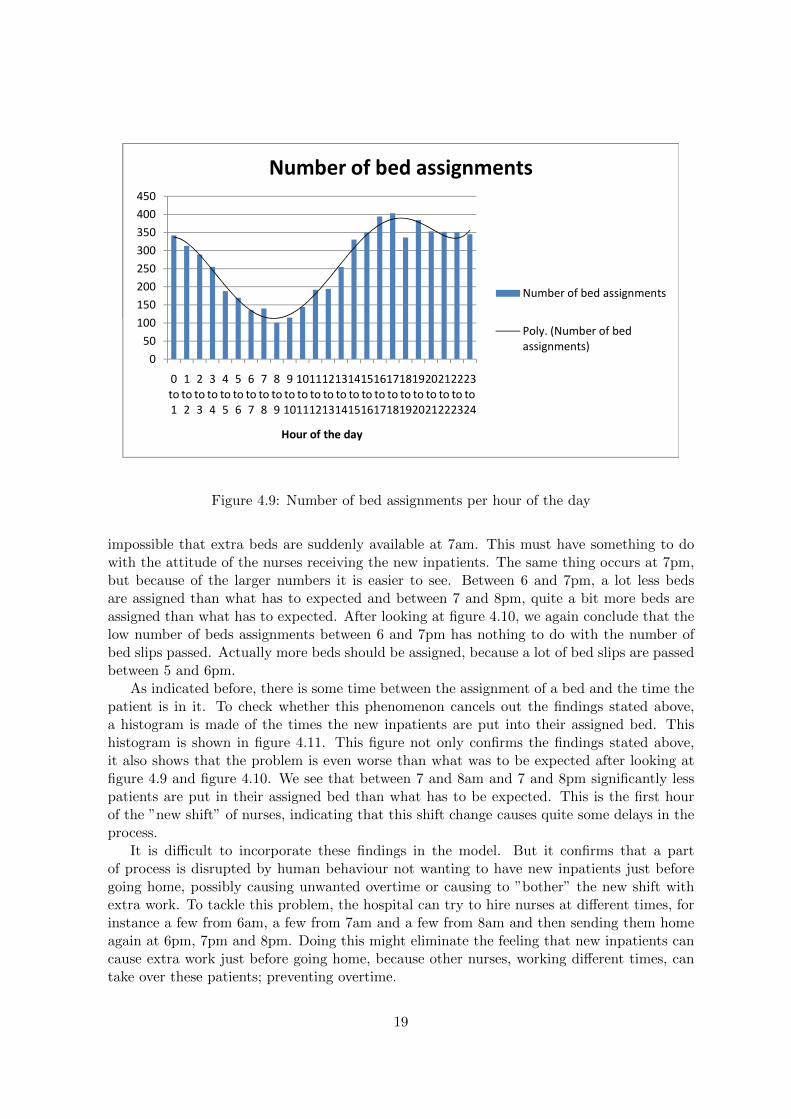
While talking to the hospital staff, we noticed that a positive or negative spike might occurin the amount of bed assignments around the time the nurses come to work or go home,because they want to avoid having new inpatients just before leaving and thus moving thesebed assignments forward in time. This spike should be occurring around 7am and/or 7pm,the times most nurses come to work and go home. Fortunately, data was available (January2010 to August 2010) on the times that the bed assignments occurred. A histogram with apolynomial trend-line is shown in figure 4.9. A close look at the histogram shows that almostall values are on, or pretty close to, the trend-line, except for the values around 7am and 7pm.Between 7 and 8am, significantly more bed are assigned than expected. In order to check ifthese spikes occur because of the amount of bed slips passed just before, another histogramis made of the amount of bed slips that are passed per hour of the day. This histogram isshown in figure 4.10. We can see that nothing can explain the differences from the trend wejust noticed, also having in mind that no inpatients will be discharged during the night, it is
13

Time fro
m disp
ostio
n decisio
n to
bed
assignment
Time fro
m bed
assignment to
the b
ed
bein
g clean, w
hen
the b
ed is n
ot clean
Time fro
m th
e bed
bein
g ready to
the tim
e the p
atient is in
it
hour of the day
0 02:04 00:10 01:25
1 02:39 00:12 01:21
2 02:09 00:11 01:27
3 02:34 00:11 01:26
4 02:42 00:13 01:18
5 02:59 00:18 01:20
6 03:02 00:20 01:33
7 02:48 00:21 01:34
8 03:07 00:20 01:30
9 02:16 00:24 01:24
10 02:23 00:29 01:38
11 01:23 00:15 01:21
12 01:58 00:27 01:25
13 01:34 00:30 01:26
14 01:14 00:27 01:26
15 01:21 00:30 01:32
16 01:08 00:28 01:32
17 01:07 00:21 01:32
18 01:17 00:21 01:31
19 00:59 00:17 01:25
20 01:34 00:14 01:28
21 01:44 00:13 01:22
22 01:49 00:12 01:17
23 01:44 00:08 01:24
avg 01:53 00:18 01:26
hour of the day
Figure 4.4: Times for different processes in the Emergency Department, per hour of the day
14
Estimated Distribution Parameters
VAR00011
Beta Distribution Shape1 0.164
Shape2 1.906
Figure 4.5: QQ-plot for beta distribution, fitted on the data points for the time betweenadmit decision and bed assignment
15

day of the week
Sunday
Monday
Tuesday
Wednesday
Thursday
Friday
Saturday
0 0.20 0.21 0.19 0.24 0.20 0.13 0.14
1 0.23 0.25 0.23 0.24 0.32 0.10 0.201 0.23 0.25 0.23 0.24 0.32 0.10 0.20
2 0.16 0.24 0.34 0.17 0.15 0.12 0.22
3 0.08 0.25 0.26 0.15 0.20 0.15 0.12
4 0.26 0.33 0.22 0.23 0.25 0.13 0.08
5 0.22 0.35 0.41 0.39 0.14 0.21 0.27
6 0.40 0.26 0.33 0.35 0.42 0.32 0.21
7 0.33 0.52 0.42 0.64 0.40 0.29 0.17
8 0 36 0 48 0 42 0 29 0 40 0 54 0 24
hour 8 0.36 0.48 0.42 0.29 0.40 0.54 0.24
9 0.30 0.50 0.25 0.41 0.39 0.32 0.21
10 0.44 0.21 0.42 0.71 0.50 0.47 0.29
11 0.31 0.25 0.55 0.47 0.46 0.35 0.15
12 0.52 0.53 0.58 0.42 0.46 0.47 0.39
13 0.43 0.40 0.63 0.55 0.53 0.48 0.36
14 0.52 0.44 0.52 0.58 0.39 0.39 0.38
r of the
15 0.38 0.34 0.55 0.69 0.61 0.39 0.29
16 0.18 0.40 0.60 0.59 0.62 0.45 0.27
17 0.19 0.37 0.70 0.41 0.48 0.22 0.13
18 0.26 0.47 0.54 0.32 0.38 0.14 0.19
19 0.23 0.41 0.36 0.27 0.26 0.20 0.15
20 0.10 0.31 0.32 0.36 0.31 0.09 0.20
21 0.22 0.22 0.31 0.30 0.29 0.13 0.04
day
21 0.22 0.22 0.31 0.30 0.29 0.13 0.04
22 0.23 0.24 0.25 0.25 0.20 0.17 0.18
23 0.19 0.12 0.33 0.14 0.17 0.04 0.10
Figure 4.6: Chance of having no clean bed after a bed is assigned (hour of the day/day of theweek)
16
Estimated Distribution Parameters
VAR00010
Gamma Distribution Shape 1.318
Scale 31.134
Figure 4.7: QQ-plot for gamma distribution, fitted on the data points for the time it takes toclean a bed
17

Estimated Distribution Parameters
VAR00007
Lognormal Distribution Scale 0.050
Shape 0.644
Figure 4.8: QQ-plot for lognormal distribution, fitted on the data points for the time it takesfor a patient to be discharged after a bed is ready and clean
18
150
200
250
300
350
400
450
Number of bed assignments
Number of bed assignments
0
50
100
150
200
250
300
350
400
450
0 to 1
1 to 2
2 to 3
3 to 4
4 to 5
5 to 6
6 to 7
7 to 8
8 to 9
9 to 10
10 to 11
11 to 12
12 to 13
13 to 14
14 to 15
15 to 16
16 to 17
17 to 18
18 to 19
19 to 20
20 to 21
21 to 22
22 to 23
23 to 24
Hour of the day
Number of bed assignments
Number of bed assignments
Poly. (Number of bed assignments)
Figure 4.9: Number of bed assignments per hour of the day
impossible that extra beds are suddenly available at 7am. This must have something to dowith the attitude of the nurses receiving the new inpatients. The same thing occurs at 7pm,but because of the larger numbers it is easier to see. Between 6 and 7pm, a lot less bedsare assigned than what has to expected and between 7 and 8pm, quite a bit more beds areassigned than what has to expected. After looking at figure 4.10, we again conclude that thelow number of beds assignments between 6 and 7pm has nothing to do with the number ofbed slips passed. Actually more beds should be assigned, because a lot of bed slips are passedbetween 5 and 6pm.
As indicated before, there is some time between the assignment of a bed and the time thepatient is in it. To check whether this phenomenon cancels out the findings stated above,a histogram is made of the times the new inpatients are put into their assigned bed. Thishistogram is shown in figure 4.11. This figure not only confirms the findings stated above,it also shows that the problem is even worse than what was to be expected after looking atfigure 4.9 and figure 4.10. We see that between 7 and 8am and 7 and 8pm significantly lesspatients are put in their assigned bed than what has to be expected. This is the first hourof the ”new shift” of nurses, indicating that this shift change causes quite some delays in theprocess.
It is difficult to incorporate these findings in the model. But it confirms that a partof process is disrupted by human behaviour not wanting to have new inpatients just beforegoing home, possibly causing unwanted overtime or causing to ”bother” the new shift withextra work. To tackle this problem, the hospital can try to hire nurses at different times, forinstance a few from 6am, a few from 7am and a few from 8am and then sending them homeagain at 6pm, 7pm and 8pm. Doing this might eliminate the feeling that new inpatients cancause extra work just before going home, because other nurses, working different times, cantake over these patients; preventing overtime.
19

100
150
200
250
300
350
400
450
Number of bed slips
Number of bed slips
0
50
100
150
200
250
300
350
400
450
0 to 1
1 to 2
2 to 3
3 to 4
4 to 5
5 to 6
6 to 7
7 to 8
8 to 9
9 to 10
10 to 11
11 to 12
12 to 13
13 to 14
14 to 15
15 to 16
16 to 17
17 to 18
18 to 19
19 to 20
20 to 21
21 to 22
22 to 23
23 to 24
Hour of the day
Number of bed slips
Number of bed slips
Figure 4.10: Number of bed slips per hour of the day
Number of patients in bed
400
450
500
Number of patients in bed
300
350
400
450
500
Number of patients in bed
100
150
200
250
300
350
400
450
500
Number of patients in bed
Number of patients in bed
P l (N b f ti t i
0
50
100
150
200
250
300
350
400
450
500
0 1 2 3 4 5 6 7 8 9 10 11 12 13 14 15 16 17 18 19 20 21 22 23
Number of patients in bed
Number of patients in bed
Poly. (Number of patients in bed)
0
50
100
150
200
250
300
350
400
450
500
0 to 1
1 to 2
2 to 3
3 to 4
4 to 5
5 to 6
6 to 7
7 to 8
8 to 9
9 to 10
10 to 11
11 to 12
12 to 13
13 to 14
14 to 15
15 to 16
16 to 17
17 to 18
18 to 19
19 to 20
20 to 21
21 to 22
22 to 23
23 to 24
Number of patients in bed
Number of patients in bed
Poly. (Number of patients in bed)
0
50
100
150
200
250
300
350
400
450
500
0 to 1
1 to 2
2 to 3
3 to 4
4 to 5
5 to 6
6 to 7
7 to 8
8 to 9
9 to 10
10 to 11
11 to 12
12 to 13
13 to 14
14 to 15
15 to 16
16 to 17
17 to 18
18 to 19
19 to 20
20 to 21
21 to 22
22 to 23
23 to 24
Hour of the day
Number of patients in bed
Number of patients in bed
Poly. (Number of patients in bed)
Figure 4.11: Number of patients in bed per hour of the day
20
Chapter 5
Experimental Design
As mentioned in chapter 2, three main changes are applicable to the UofL Hospital ED andso will be investigated using the simulation model. The three changes are:
1. Let the physician and nurse see the patient together when the patient enters the ED, dothis only when both a nurse and a physician are available. This will save time becausethe patient will not have to tell his story several times and test can be conducted fasterafter the arrival of the patient. This solution will save approximately twenty minutesper patient treated like this
2. Hire a nurse that is dedicated to discharging patients. At the moment a nurse willdischarge patients only when she has nothing else to do. Because of this it takes onaverage one and a half hours for patients to be discharged. With a nurse dedicated todoing this, this can be reduced to about twenty to thirty minutes
3. Make space available in the hospital where patients can be put to wait when the decisionis made that they are going to be admitted. By doing this, patients no longer will haveto wait and use resources at the ED while they do not necessarily have to be there. EDBeds will be available earlier than they currently are, and patients can leave the ED upto two and a half hours faster than they do now. This will be done by a newly hirednurse
4. All combinations of the above stated options, so 1 + 2, 1 + 3, 2 + 3 and 1 + 2 + 3.In case of combination 2 + 3 and combination 1 + 2 + 3, only one extra nurse willperform all new tasks
In order to check if the problem is not just a staffing problem, also the following changesare investigated:
• hire the nurses that are added to the default number of nurses during the day until 8pminstead of 7pm
• all scenarios with a base number of nurses of eleven (current number) and twelve, soall combinations shown above are also simulated with a base number of twelve insteadeleven nurses
Trying to change the staffing for particular days or hours of the day is not performed, thiswould make the analysis too complicated and too extensive. After a solution is found, a newstudy could investigate the best way of staffing for various days or parts of the year.
21
To monitor the effect of these changes, several performance measures need to monitored.In this case the following performance measures are monitored:
• the time from entering the hospital to the moment the discharge/admission decisionis made, time from entering to leaving is not comparable for all options because thechanges may affect the process times after the discharge/admission decision
• the average number of beds available
• the fraction of the time zero beds are available
• the average number of nurses available
To check what amount of extra patients can be handled after each alteration of the process,all options are also investigated with eleven different arrival rates; ranging from the currentnumber of arrivals to 25% more arrivals than at the moment in steps of 2.5%.
Run length, number of replications and warm up time
The length of each run is set to eighty days, which means about eleven consecutive weeks.This length is chosen because it is thought to be short enough to allow fast computation yetlong enough to account for the variations in number of arrivals.
To be sure the calculated values don’t differ because of the variation caused by the na-ture of simulation, the number of necessary replications has to determined. The number ofreplications needed is based on a 95% confidence interval and a relative allowed error of 5%.Calculations showed that at least four replications per attempt are needed to stay within theallowed 5% relative error. In order to be sure the relative error stays below 5% for all options,a number of ten replications is chosen to perform all experiments with (the running time ofthe model is sufficiently low to allow this).
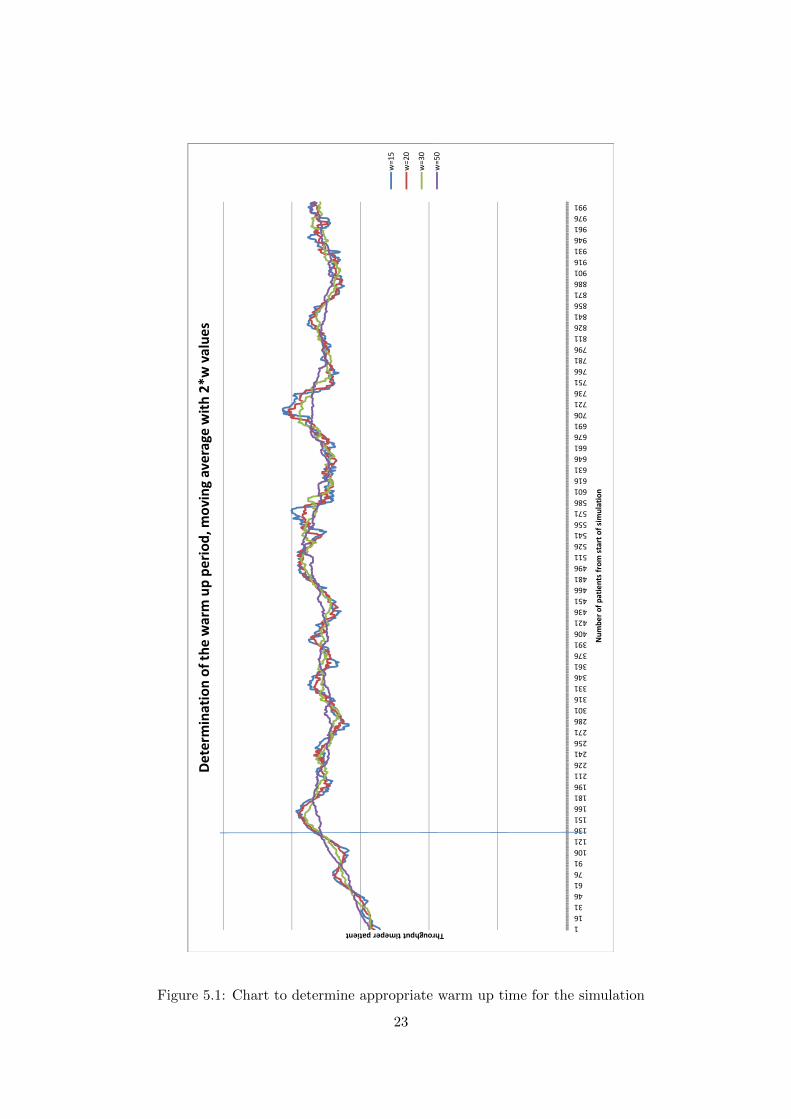
A warm up time also has to be determined. Because this process is continuous and themodel starts being empty, the point at which the model can be considered ”working normally”has be determined. In figure 5.1 we can see the moving average of the throughput times forall patients from the the beginning of the simulation to about the 1000th patient leavingthe system (averages of twenty replications). In order to determine when the process beginsshowing steady state results, the moving averages need to be more or less steady. We can seethat especially the moving average with w=50 starts being reasonably steady after about 130patients. A good guess for the warm up period would be 130 patients, but to be sure that nowarm up effects are included in the data (and because the run length is long enough) a warmup period of 200 patients is chosen, which means about two days.
Number of upstairs beds
To reduce computation time (eliminating the need to compute all scenarios with all possiblenumbers of upstairs beds) and to maximize the possibility to implement the scenario, anappropriate yet low number of upstairs has to be determined to make sure the analysis thatis done is realistic. We briefly investigated the influence of having one to six upstairs beds onthe throughput time. All other parameters for this case are as they currently are. In table5.1 we can see that the influence of having more beds gradually decreases. When havingmore than four upstairs beds, the marginal influence of an extra bed is close to zero. Because
22
roughput timeper patient
Determination of th
e warm up pe
riod
, mov
ing average with 2*w value
s
w=15
w=20
w=30
1163146617691
106121136151166181196211226241256271286301316331346361376391406421436451466481496511526541556571586601616631646661676691706721736751766781796811826841856871886901916931946961976991
Throughput timeper patient
Num
ber of patients from
start of sim
ulation
Determination of th
e warm up pe
riod
, mov
ing average with 2*w value
s
w=15
w=20
w=30
w=50
Figure 5.1: Chart to determine appropriate warm up time for the simulation
23

we want the number of upstairs beds to be as low as possible in order to be able to easilyimplement it, yet as high as possible to maximize impact, four upstairs beds seems to be thebest choice.
Table 5.1: Influence of having different numbers of upstairs beds on the throughput timeNumber of upstairs beds Change in throughput time
1 -2.3%
2 -3.3%
3 -3.9%
4 -4.1%
5 -4.2%
6 -4.2%
24

Chapter 6
Analysis of Results
After performing a full factorial simulation run, the results of the simulation can be analysed.In order to calculate the extra costs and revenue coming with each of the solutions, someassumptions have to be made. The following assumptions are made:
• a nurses’ salary is $60,000 a year (payscale.com)
• a nurse gets $30,- per hour, works 40 hours a week (payscale.com)
• to add one nurse to the base amount of nurses, 4 extra nurses need to be hired (168hours per week need to be hired extra)
• an outpatient brings in $174,- in revenue for the hospital (Mahajan et al., 2005)
• an inpatient brings in $1,480,- in revenue for the hospital (Bayley et al., 2005)
• all extra capacity will be used, so when more patients can be treated, more will cometo the ED
• 38,000 patients are expected for 2010
• 24% of the patients coming to ED will be admitted
Before looking at the financial results, we first look at the performance measures mentionedin chapter 5. All measures are taken with an arrival rate as it is in 2010.
In figure 6.1 the throughput times (in seconds) for the patients are shown. We can seethat the best scenario’s save up to 1000 seconds per patient, meaning that on average about15 minutes are saved. This seems to be not impressive, but since we know through Little’sLaw that we can handle more patients when the throughput time is lower, every improvementin throughput time must be valued. Knowing that most improvement come from patientshaving to wait less or not needing to tell their story several time, most improvements (exceptfor hiring the nurses one hour extra) can be considered significant. We see that the havingan extra nurse does not cause a lot of difference in throughput time.
In figure 6.2 the average number of beds available per scenario is shown. We can see thatespecially the upstairs beds and the admit nurse solution cause huge improvements. Hiringextra nurses, hiring them longer or letting the nurse and physician see the patient together donot really improve the performance measure. Having more beds available means less pressurefor the staff and faster service for patients.
25

13,200
13,400
13,600
13,800
14,000
14,200
14,400
14,600
Throughput time in seconds
Throughput time per scenario, arrival rate is as it is currently
12,600
12,800
13,000
13,200
13,400
13,600
13,800
14,000
14,200
14,400
14,600
11
12
Throughput time in seconds
Base number of nurses
Throughput time per scenario, arrival rate is as it is currently
Base scen
ario
Hire nurses untill 8pm instead of 7pm
Upstairs beds
Nurse an
d physician together
Admit nurse
Nurse/physician + upstairs bed
s
Admit nurse + nurse/physician
Admit nurse + upstairs bed
sAdmit nurse + upstairs bed
s + nurse/physician
Figure 6.1: Throughput times per scenario, for both a base number of 11 and 12 nurses
26

4.00
6.00
8.00
10.00
12.00
14.00
Average number of ED beds available
Average number of ED
beds available, arrival rate for all scenarios is as it currently is
0.00
2.00
4.00
6.00
8.00
10.00
12.00
14.00
11
12
Average number of ED beds available
Base number of nurses
Average number of ED
beds available, arrival rate for all scenarios is as it currently is
Base scen
ario
Hire nurses untill 8pm instead of 7pm
Upstairs beds
Nurse an
d physician together
Admit nurse
Nurse/physician + upstairs bed
s
Admit nurse + nurse/physician
Admit nurse + upstairs bed
sAdmit nurse + upstairs bed
s + nurse/physician
Figure 6.2: Average number of ED beds available per scenario, for both a base number of 11and 12 nurses
27

Figure 6.3 shows the chance per scenario of having zero ED beds available. These measuresare inversely related to the measures shown in figure 6.2. The main difference is that we nowsee that having an extra nurse improves the process a bit.
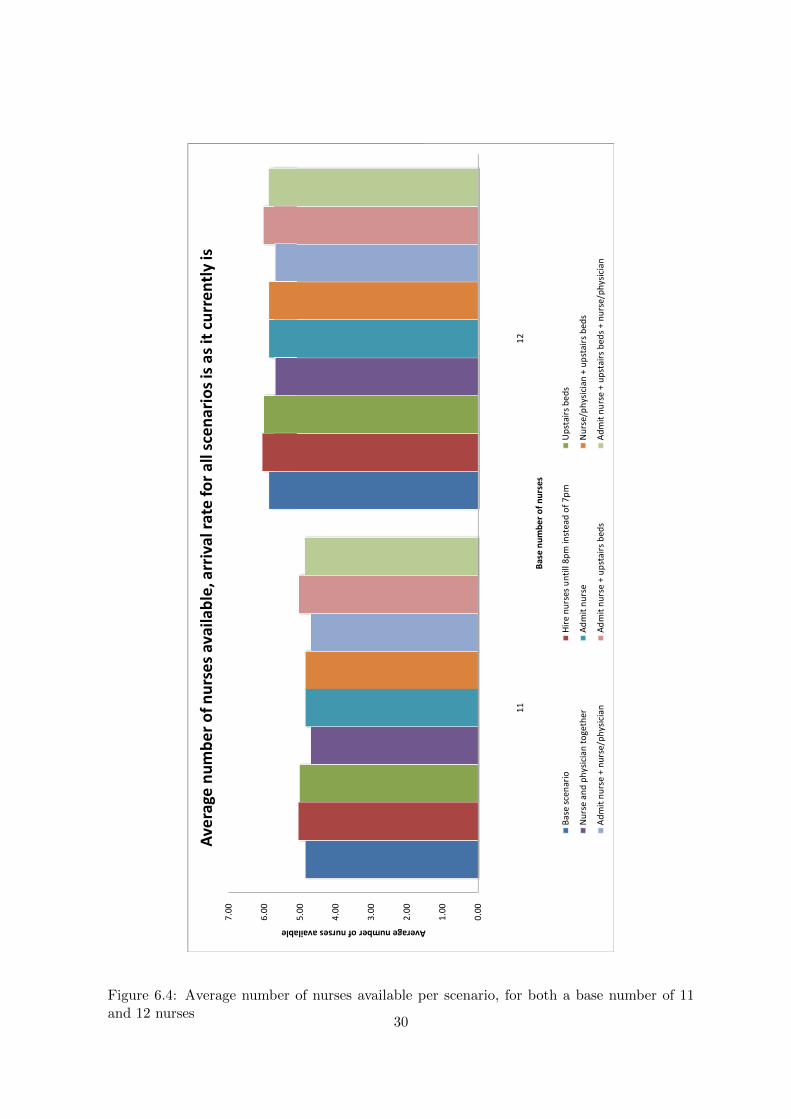
In figure 6.4 we find the average number of nurses available. We can see that some ofthe scenarios do not let the number improve, but let it deteriorate. The cause probably isthat because patients waiting for discharge or admission need less care than patients thatare undergoing treatment at the ED. So more people will be undergoing treatment since lesspeople will be waiting for admission or discharge. Meaning that less nurses will be availablebecause they have more to do.
After looking at figures 6.1, 6.2, 6.3 and 6.4 we may conclude that the options and combi-nations all have advantages and disadvantages. Letting the nurse and physician see a patientat the same for instance leads to lower throughput times, but does not really improve thenumber of beds that are available. When looking at the upstairs bed alternative, we see thatis improves the throughput time less than the previous option, but improves the amount ofbeds available during the day drastically.
In the previously shown figures, we could not see to what extent extra patients can bedealt with. To determine what extra amount of patients can be handled, we assume that themost important measure is the throughput time. Comparing the initial throughput time withthe throughput times of all options with varying arrival rates (from 1.0 tot 1.25 times thecurrent arrival rate) resulted in the maximum extra amount of patients. These extra amountsare shown in table 6.1, the second column, for having 11 nurses and in table 6.2, the secondcolumn, for having 12 nurses.
The tables show that the scenarios where patients are being moved out the ED faster,are the scenarios where most extra patients can be taken care of. When the scenarios arecombined, even more extra patients will be able to come to ED. When comparing the 11nurse table and the 12 nurse table, we can see that having an extra nurse makes it possibleto handle an extra 2.5% of patients.
When we now look at the other columns in table 6.1 and 6.2, we see the costs and benefitsof the options we’ve investigated. The costs are based on the extra resources that need to behired, so for instance an extra nurse for the admit nurse option (meaning that in total fourextra nurses to be hired, all getting $60,000), or four nurses one hour extra each day for the8pm in stead of 7pm option (so four times one hour per day, 365 days per year). The benefitsare based on the extra amount of patients that can be taken care of with each of the options.So for example, for the upstairs beds scenario, 5% extra patients can come to the ED. So0.05*38,000 = 1,900 extra patients, of which approximately 24% will be admitted, bringingin $1,480,- in revenue per patient and the other 76% will be bringing in $174,- per patient.
We can see that all options can be profitable, except for hiring the nurses until 8pm insteadof 7pm. Combining the options seems to be the best alternative. When looking at the 12 nursetable, we see that having an extra nurse will be profitable as well. For the admit nurse andthe upstairs bed scenario, we see that the profit will be less with eleven nurses, the cause ofthis may be that the extra amount of patients that can be handled is just within the marginsof the investigated extra amounts of patients and so don’t show up in the calculations. Inorder to be sure, some extra simulation run should be done with different arrival rates.
A graphical representation of the profits per scenario from table 6.1 and 6.2 is shown infigure 6.5. One can see that it is best to implement all options. When one of the option turnsout no to work as well as expected, the other options though will probably take care of theextra patients that need to be taken care of.
28

0.10
0.15
0.20
0.25
0.30
hance of no having zero beds available
Chan
ce of having zero beds available, arrival rate for all scenarios is as it currently is
0.00
0.05
0.10
0.15
0.20
0.25
0.30
11
12
Chance of no having zero beds available
Base number of nurses
Chan
ce of having zero beds available, arrival rate for all scenarios is as it currently is
Base scen
ario
Hire nurses untill 8p
m instead
of 7pm
Upstairs bed
s
Nurse an
d physician together
Admit nurse
Nurse/physician + upstairs beds
Admit nurse + nurse/physician
Admit nurse + upstairs beds
Admit nurse + upstairs bed
s + nurse/physician
Figure 6.3: Chance of having zero beds available per scenario, for both a base number of 11and 12 nurses
29
2.00
3.00
4.00
5.00
6.00
7.00
Average number of nurses available
Average number of nurses available, arrival rate for all scenarios is as it currently is
0.00
1.00
2.00
3.00
4.00
5.00
6.00
7.00
11
12
Average number of nurses available
Base number of nurses
Average number of nurses available, arrival rate for all scenarios is as it currently is
Base scen
ario
Hire nurses untill 8pm instead of 7pm
Upstairs beds
Nurse an
d physician together
Admit nurse
Nurse/physician + upstairs bed
s
Admit nurse + nurse/physician
Admit nurse + upstairs bed
sAdmit nurse + upstairs bed
s + nurse/physician
Figure 6.4: Average number of nurses available per scenario, for both a base number of 11and 12 nurses
30
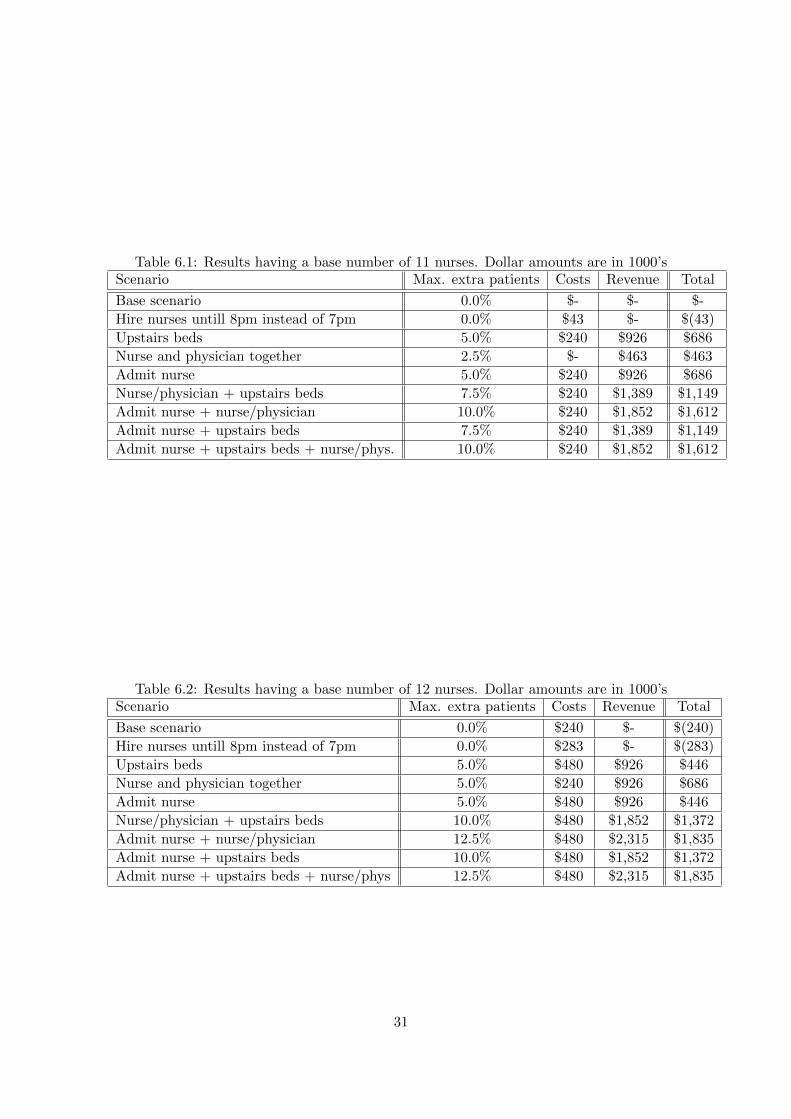
Table 6.1: Results having a base number of 11 nurses. Dollar amounts are in 1000’sScenario Max. extra patients Costs Revenue Total
Base scenario 0.0% $- $- $-
Hire nurses untill 8pm instead of 7pm 0.0% $43 $- $(43)
Upstairs beds 5.0% $240 $926 $686
Nurse and physician together 2.5% $- $463 $463
Admit nurse 5.0% $240 $926 $686
Nurse/physician + upstairs beds 7.5% $240 $1,389 $1,149
Admit nurse + nurse/physician 10.0% $240 $1,852 $1,612
Admit nurse + upstairs beds 7.5% $240 $1,389 $1,149
Admit nurse + upstairs beds + nurse/phys. 10.0% $240 $1,852 $1,612
Table 6.2: Results having a base number of 12 nurses. Dollar amounts are in 1000’sScenario Max. extra patients Costs Revenue Total
Base scenario 0.0% $240 $- $(240)
Hire nurses untill 8pm instead of 7pm 0.0% $283 $- $(283)
Upstairs beds 5.0% $480 $926 $446
Nurse and physician together 5.0% $240 $926 $686
Admit nurse 5.0% $480 $926 $446
Nurse/physician + upstairs beds 10.0% $480 $1,852 $1,372
Admit nurse + nurse/physician 12.5% $480 $2,315 $1,835
Admit nurse + upstairs beds 10.0% $480 $1,852 $1,372
Admit nurse + upstairs beds + nurse/phys 12.5% $480 $2,315 $1,835
31

$500,000.00
$1,000,000.00
$1,500,000.00
$2,000,000.00
Extra revenue
Extra profit per scenario
$(500,000.00)
$‐
$500,000.00
$1,000,000.00
$1,500,000.00
$2,000,000.00
11
12
Extra revenue
Base number of nurses
Extra profit per scenario
Base scen
ario
Hire nurses untill 8pm instead
of 7pm
Upstairs bed
s
Nurse and physician together
Admit nurse
Nurse/physician + upstairs bed
s
Admit nurse + nurse/physician
Admit nurse + upstairs bed
sAdmit nurse + upstairs bed
s + nurse/physician
Figure 6.5: Extra profit per scenario, for both a base number of 11 and 12 nurses
32
Conclusions
In order to take care of the problem of high numbers of patients coming to the ED and longwaiting times at the UofL Hospital ED waiting room, it is best to try to implement the admitnurse option, the upstairs beds option and to let the nurse and physician see the patient atthe same time. As we can see in table 6.1 and 6.2, it will not work to hire the nurses one hourextra per day, so this option has to dropped. When changing the process like this, the EDshould be able to cope with an extra 10% of patients coming in while having only a minorincrease in costs.
When implementing the upstairs bed option and the admit nurse option, attention needsto paid to the fact that the extra nurse, hired to care of patients that are ready to admitted ordischarged, is doing only what her tasks are. So this new nurse should not be doing anythingelse than making sure that the patients are moved out of the ED as fast as possible. Whenother tasks are performed, the impact of the new way of working may decrease to impact ofjust having an extra nurse to the eleven base nurses, which impact is fairly small as can beseen in table 6.2.
Regarding the scenario where the nurse and physician consult the patient at the sametime we should emphasize that this can only happen when both a nurse and a physician areavailable. When one of the two ”resources” is not available the patient will have to follow thestandard procedure in order to keep the total process going, it may take a little longer, butwhen people are waiting for another, the whole process may come to a standstill.
As can be seen in chapter 4, a part of the problem may also be caused by the nurses inthe hospital itself not wanting to receive new inpatients around the times of shift changes.No solution can be found for this problem using the simulation model, but this problem maybe solved by spreading the times the nurses are scheduled. This eliminates sudden changesto the staffing and should make the shift change more fluently, possibly preventing the nursesfrom trying to keep out the new inpatients until the next shift or until the new shift is totallyup and running.
After implementation of all shown above, the throughput time of patients will drasticallydecrease when having the number of patients coming in at the moment, but even when upto 10% more patients come to the ED, the throughput time and thus the patient satisfactionwill improve. Shorter throughput time also means less work in progress (in case the samenumber of people come in), so more beds available during the day, another objective of thisresearch.
33

Future Work
In order to get an even better representation of reality it is recommended to extend the modelwith the following things:
• resources such X-ray, CT-scans or MRI’s
• different priorities for patients, based on their acuities
• medical technicians tasks
• more detailed work schedules
In order to be able to introduce these things, the most important thing is to have moredata available on all steps in the process, for instance on the following processing steps:
• how long it takes to perform specific tests
• how long it takes for test results to be available
• what is patient acuity level distribution
• which treatment(s)/test(s) patients having a certain acuity undergo
• how long a nurse is working with a patient
• how long a physician is working with a patient
• which tasks nurses, physicians and technicians perform and how long the tasks take
It may be good to monitor everything that happens at the ED for a week by just beingthere. After doing this, all data can be summarized, analysed and used in the model. Itwould be even better to let the hospital keep track of everything happening. This is mainlyimportant because patients with differing acuities may follow different routes at the ED,meaning that the processing times may differ more than they currently do.
Besides data on the times of the steps in the process it is just as important to have moredata on which treatments patients undergo. When this is available, the routing in de modelcan be improved and the model will represent reality even more.
Another option that may be good to investigate is different staffing schedules. Usinganother schedules than the current might improve and optimize the number of nurses availableduring the day. Because a huge number of options will be possible, this will take quite sometime to simulate, but the advantages can be huge financially as well as in system performance.
As mentioned before, some of the problems are caused by the people that need to takecare of the new inpatients. An inventory should be made on what the possibilities are tochange this. It may be possible to hire people on differing times or let the work be done byother people than it is been done by at the moment.
34
Bibliography
[Bayley et al., 2005] Bayley, M. D., Schwartz, J. S., Shofer, F. S., Weiner, M., Sites, F. D.,Traber, K. B., and Hollander, J. E. (2005). The financial burden of emergency departmentcongestion and hospital crowding for chest pain patients awaiting admission. Annals ofEmergency Medicine, 45(2):110 – 117.
[Derlet and Richards, 2000] Derlet, R. and Richards, J. (2000). Overcrowding in the nation’semergency departments: Complex causes and disturbing effects. Annals of EmergencyMedicine, 35(1):63 – 68.
[Gentile et al., 2010] Gentile, S., Vignally, P., Durand, A., Gainotti, S., Sambuc, R., andGerbeaux, P. (2010). Nonurgent patients in the emergency department? a french formulato prevent misuse. BMC Health Services Research, 10(1):66.
[Han et al., 2009] Han, C., Barnard, A., and Chapman, H. (2009). Emergency departmentnurses’ understanding and experiences of implementing discharge planning. Journal ofAdvanced Nursing, 65(6):1129 – 1353.
[Kolb et al., 2008] Kolb, E., Schoening, S., Peck, J., and Lee, T. (2008). Reducing emergencydepartment overcrowding: five patient buffer concepts in comparison. In Proceedings of the40th Conference on Winter Simulation, WSC ’08, pages 1516–1525. Winter SimulationConference.
[Mahajan et al., 2005] Mahajan, P., Stanley, R., Ross, K. W., Clark, L., Sandberg, K., andLichtenstein, R. (2005). Evaluation of an emergency department-based enrollment programfor uninsured children. Annals of Emergency Medicine, 45(3):245 – 250.
[McCaig and Nawar, 2006] McCaig, L. and Nawar, E. (2006). National hospital ambulatorymedical care survey: 2004 emergency department summary. Advance Data, (372).
[McGuigan and Watson, 2010] McGuigan, T. and Watson, P. (2010). Non-urgent attendanceat emergency departments. Emergency Nurse, 18(6).
[Medeiros et al., 2008] Medeiros, D., Swenson, E., and DeFlitch, C. (2008). Improving patientflow in a hospital emergency department. In Simulation Conference, 2008. WSC 2008.Winter, pages 1526 –1531.
[Paul et al., 2010] Paul, S., Reddy, M., and Deflitch, C. (2010). A systematic review ofsimulation studies investigating emergency department overcrowding. Simulation, 86:559–571.
35
[Schull et al., 2007] Schull, M. J., Kiss, A., and Szalai, J.-P. (2007). The effect of low-complexity patients on emergency department waiting times. Annals of EmergencyMedicine, 49(3):257 – 264.e1.
[van der Vaart et al., 2010] van der Vaart, T., Vastag, G., and Wijngaard, J. (2010). Facetsof operational performance in an emergency room (er). International Journal of ProductionEconomics, In Press, Corrected Proof:–.
[Vartak et al., 2009] Vartak, S., Crandall, D., Brokel, J., Wakefield, D., and Ward, M. (2009).Professional practice and innovation: transformation of emergency department processesof care with ehr, cpoe, and er event tracking systems. Health Information ManagementJournal, 38(2):27 – 32.
[Weinick et al., 2010] Weinick, R., Burns, R., and Mehrotra, A. (2010). Many emergencydepartment visits could be managed at urgent care centers and retail clinics. Health Affairs,29(9):1630.
36

Appendix A
Model Description
In this appendix, a detailed description will be given about how the simulation model works.Most of it can also be found in the comments of the model code. An overview of the modelcan be found on page 38
As we can see on page 38, the model consists of three main blocks:
• the Entry
• the Emergency Department
• the Fast Track
In the Emergency Department block, two sub-blocks can be found
• the No Admission Block
• the Admission Block
Next to the Emergency Department Block we see the Upstairs bed block. This block isonly used when the Upstairs Bed option is switched on.
Below the Emergency Department Block, a block with all controls is situated. In thisdescription, all controls will be discussed. Especially important is the Data icon, in thisframe (see page 39), all data is collected, all variables are stored and all parameters can bechanged.
In order to understand what is stored, tracked and calculated we first look at the Dataframe, where all of this happens. Then we go through the model like a patient would do (alsosee Appendix B), explaining every Method as we encounter him.
37


Data Frame
The data frame is shown on page 39. We explain what every variable, parameter, table andgenerator do in the model.
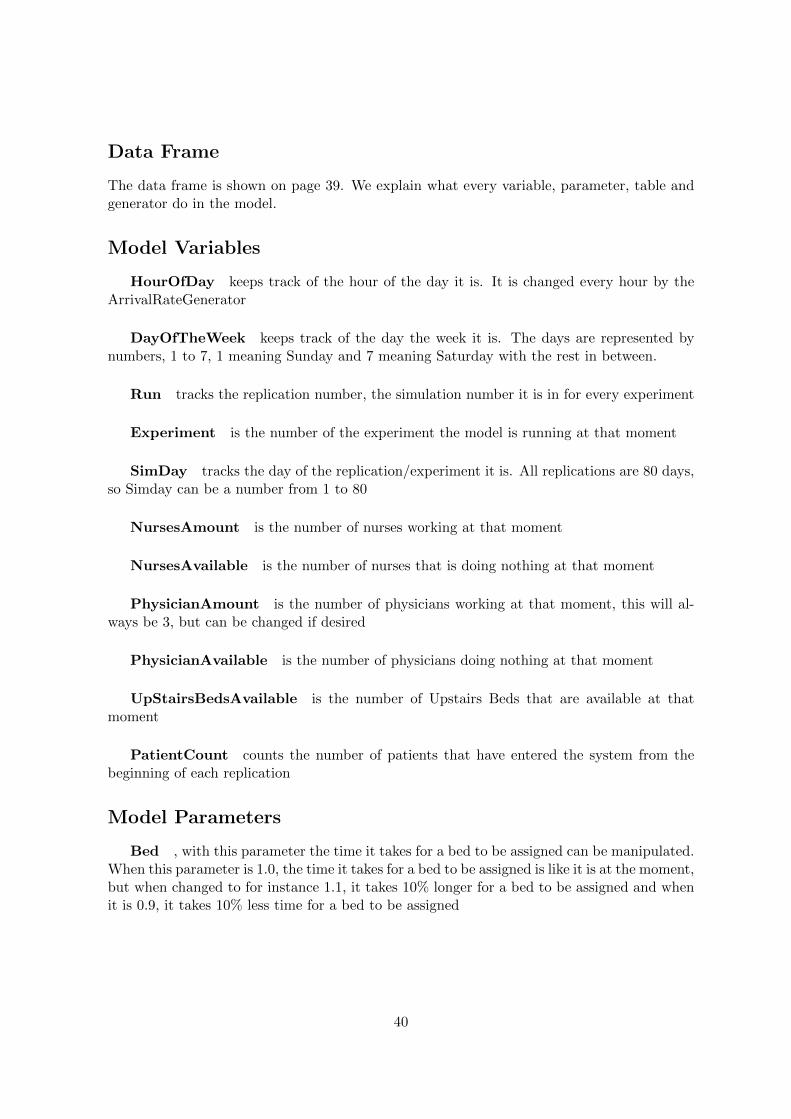
Model Variables
HourOfDay keeps track of the hour of the day it is. It is changed every hour by theArrivalRateGenerator
DayOfTheWeek keeps track of the day the week it is. The days are represented bynumbers, 1 to 7, 1 meaning Sunday and 7 meaning Saturday with the rest in between.
Run tracks the replication number, the simulation number it is in for every experiment
Experiment is the number of the experiment the model is running at that moment
SimDay tracks the day of the replication/experiment it is. All replications are 80 days,so Simday can be a number from 1 to 80
NursesAmount is the number of nurses working at that moment
NursesAvailable is the number of nurses that is doing nothing at that moment
PhysicianAmount is the number of physicians working at that moment, this will al-ways be 3, but can be changed if desired
PhysicianAvailable is the number of physicians doing nothing at that moment
UpStairsBedsAvailable is the number of Upstairs Beds that are available at thatmoment
PatientCount counts the number of patients that have entered the system from thebeginning of each replication
Model Parameters
Bed , with this parameter the time it takes for a bed to be assigned can be manipulated.When this parameter is 1.0, the time it takes for a bed to be assigned is like it is at the moment,but when changed to for instance 1.1, it takes 10% longer for a bed to be assigned and whenit is 0.9, it takes 10% less time for a bed to be assigned
40

Clean , with this parameter the time it takes for a bed to be cleaned can be manipulated.When this parameter is 1.0, the time it takes for a to be cleaned is like it is at the moment,but when changed to for instance 1.1, it takes 10% longer for a bed to be cleaned and whenit is 0.9, it takes 10% less time for a bed to be cleaned
HoldUp , with this parameter the time it takes for a patient to be admitted after thebed is ready can be manipulated. When this parameter is 1.0, the time it takes for a patientto be admitted after the bed is ready is like it is at the moment, but when changed to forinstance 1.1, it takes 10% longer for a patient to be admitted after the bed is ready and whenit is 0.9, it takes 10% less time for a patient to be admitted after the bed is ready
ArrivalRate , with this parameter the arrival rate of patients can be modified. Whenthis parameter is 1.0, the arrival rate is default, when changed to for instance 1.05, 5% morepatients will come in
Both , the parameter can be true of false. When it is true, the nurse and physician willsee the patient together when both are available. when it is false the patient always see anurse first and then go to a physician
UpStairs , with this parameter the upstairs beds option can be switched on or off.When it is true, the option is on. When it is false, the option is turned off
AdmitNurse , using this parameter, the admit nurse option can be triggered. Bydefault this parameter is 1000, but when changed to 333 the admit nurse option is turned on
WarmupPatients , the parameter determines the number of patients that are consid-ered ”warm up patients”, so no data about these patients is stored in the output tables
ERBedsAmount is the number of beds available on the ED, by default this is 29, butit can be changed to other values in order to figure what the impact is of having more or lessbeds
InitNurse is base number of nurses, by default eleven nurses are available at all times,supplemented with extra nurses during the day. By changing this parameter, the number ofeleven can be changed
UpStairsBedsAmount is the number of upstairs beds that are available when theupstairs beds option is switched on, by default this number is four, but when desired, it canbe changed
Input Data
ChanceOfNoCleanBed , shows per hour of the day, per day of the week, the chance ofhaving no clean bed when an inpatient bed is assigned to a patient. Is used in the Admissionmethod to check whether a patient will have a clean bed or not.
41

PatientStatusChance , contains the chances per hour of the day, per day of the weekthat a patient will go to one of the blocks (ED, FastTrack or LWBS). The first seven columnsshow the chances that a patient goes to ED, the second seven columns show the chances thatpatient goes to FastTrack and the last seven columns show the chance that a patient leaveswithout being seen. The chances of the three options added together are 1. Is used in theWalkInGen Method to determine where a patient will go.
NurseSchedule contains the schedule when extra nurses come in and leave (the rownumbers are ”hour of the day + 1”). Is used in the ArrivalRateControl method to determinethe number of nurses at each moment of the day
NurseQueue contains the queue of patients waiting to be taken care of by a nurse. Isused in the PersonAvailable method to check where a nurse needs to go and is used by theInQueue method to write a patient into that needs care
ArrivalsPerHour contains the total average number of patients coming in every hourof the day and every day of the week. Is used in ArrivalRateControl to set the number ofarrivals per hour
HomeQueue contains the queue of patients waiting to be admitted or discharged. Isused in MoveHomeNurse.
DoctorQueue contains the queue of patients waiting for a physcian. Is actually notused at the moment because the queue is FCFS and only at one buffer, but can be used whenpriorities for patients are introduced
OutputData
AvgPhyAva , contains the average number of physicians available per simulation run.Is used by DataWriter.
AvgBedAva , contains the average number of beds available per simulation run. Isused by DataWriter.
AvgNurseAva , contains the average number of nurses available per simulation run.Is used by DataWriter.
AvgUpBedAva , contains the average number of upstairs beds available per simulationrun, only when the upstairs beds option is switched on. Is used by DataWriter.
ZeroPhyAva , contains the part of the time zero physicians are available per simulationrun. Is used by DataWriter.
ZeroBedAva , contains the part of the time zero beds are available per simulation run.Is used by DataWriter.
42

ZeroNurseAva , contains the part of the time zero nurses are available per simulationrun. Is used by DataWriter.
ZeroUpBedAva , contains the part of the time zero upstairs beds are available persimulation run when the upstairs beds option is switched on. Is used by DataWriter.
PhyStats , at the end of each simulation run, statistics about the physicians are writtento this file so that the DataWriter method can calculate the values that are put in the earliermentioned tables
Stats , at the end of each simulation run, statistics about the ED beds are written tothis file so that the DataWriter method can calculate the values that are put in the earliermentioned tables
NurseStats , at the end of each simulation run, statistics about the nurses are writtento this file so that the DataWriter method can calculate the values that are put in the earliermentioned tables
UpBedStats , at the end of each simulation run, statistics about the upstairs beds arewritten to this file, when the upstairs beds option is switched on, so that the DataWritermethod can calculate the values that are put in the earlier mentioned tables
ToDecision , this table contains the times it took for patients to get to the point thatthe discharge/admit decision was made. Used in the Admission method
BSSToBed , this table contains the time it took for patients that are going to beadmitted from the moment the bed slip was passed to the moment they are put in to theirbed. Used in the BedAvaible method
Waiting , this table contains average parts of time a patients is waiting for a nurse orphysician. Is used by the BedAvaible method
Admitted , this table contains the time it took for patients that are going to be admittedto get to the moment they are put in to their bed. Used in the DataWriter method
Total , this table contains the times it took for patients to get through the entire system.Is used by the BedAvaible method.
WaitingEmpty , this table contains part of the time the waiting room was empty persimulation run. Is used by the DataWriter
TPTTimes , this table contains the average throughput times of all experiments andreplications performed. Is used by Datawriter
43
DataGenerator , triggers the DataWriter method one second before the end of thesimulation
DataWriter , this method writes data to the table files discussed before and does someother things:
• it write the portion of the time that no one is in the waitingroom to the WaitingEmptytable
• it computes the percentage of the time zero beds are available and writes it to theZeroBedAva table
• it computes the average number of beds available and writes it to the AvgBedAva table
• it computes the percentage of the time zero nurses are available and writes it to theZeroNurseAva table
• it computes the average number of nurses available and writes it to the AvgNurseAvatable
• it computes the percentage of the time zero upstairs beds are available and writes it tothe ZeroUpBedAva table
• it computes the average number of upstairs beds available and writes it to the AvgUpBe-dAva table
• it computes the percentage of the time zero physicians are available and writes it to theZeroPhyAva table
• it computes the averags number of physicians available and writes it to the AvgPhyAvatable
• it writes the average total throughput time in to the TPTtimes table
• it makes sure the simulation stops after the method is triggered
The Entry Block
Now we know where all data is stored and manipulated we can run through the main process.We start at the entry block, found most left on page. 38
Transfer, WalkIn and EMS A patient enter via either one of these sources (Trans-ferred from another hospital, walk in himself, or brought by an ambulance (EMS)). The arrivalrates are changed every hour of the day by the ArrivalRateGenerator. After the patient hasarrived, a lot of attributes are assigned. This is done by the WalkInGen method
44

WalkInGen This method takes care of the following things:
• determines to which department the patient goes using a uniformly distributed numberbetween 0 and 1 and comparing that number to the chances given in the PatientSta-tusChance table
• determines if a patient will be admitted or not (when going to ED), using a uniformlydistributed number between 0 and 1 and comparing that number with 0.24 (the per-centage of ED patients that will be admitted).
• give the patient a uniformly distributed number between 0 and 1 representing the chanceof having no clean inpatient bed, this will be used later on in the process
• give the patient the time it will take him to get through the hold up part of the process,based on a lognormal distribution (HoldUp attribute)
• give the patient the time it will take him to get his inpatient bed cleaned (when notclean), based on a gamma distribution (BedCleanTime attribute)
• give the patient the time it will take him to get an inpatient assigned, based on a betadistribution (BedASSN attribute)
• give the patient his Patient ID
• adjusts the PatientCount variable
Register After the patient has entered and has gotten all his attributes, the patientmoves to the Register object. Multiple patient can be registered at the same time, theprocessing time is exponentially distributed with µ = 15 minutes
QuickRegister After the patient is registered, some data is collected. This can onlybe done one patient at a time. The processing time is exponentially distributed with µ = 3minutes
ArmBand Now the patient will get an armband with his data on it, like urgency andpatient number. This will take 45 seconds per patient.
VitalSigns Now the vital signs of the patient will be checked, the processing time isexponentially distributed with µ = 10 minutes. When the patient leaves this object, theVitalSignsToED method is triggered
VitalSignsToED This method does the following things:
• check where to patient needs to go to:
– if LWBS, the patients will be deleted
– if FastTrack, the patient moves to the FastTrack object
– if ED, the number of available beds will be checked. If no available the patient ismoved to the waiting room, else he will be moved to the WaitForNurse1 object
45

The FastTrack Block
When patient is sent to the FastTrack, it will be staying in the FastTrack object for oneminute and will then leave the system via the drain object.
The Emergency Department Block
WaitForNurse1 When the patient enters the Emergency Department Block at theWaitForNurse1 object, the InQueue method is triggered. The patient stays here until he isnext in line to be seen
InQueue The InQueue method is triggered at several objects in the model:
• when the patient arrives at WaitForNurse1:
– when the nurse/physician option is switched on:
∗ check if a nurse and a physician are available:
· if yes, send the patient to the NurseAndPhysician object and make a nurseand a physician unavailable
· if no, check if a nurse is available
· if only a nurse is available, send patient to the Nursing1 object and makea nurse unavailable
· if no nurse is available, stay in the WaitForNurse1 object and write thepatient data into the NurseQueue table
– when nurse/physician is switched off:
∗ check if a nurse is available
· when available the patient can be sent to the Nursing1 object and a nurseis made unavailable
· when no nurse is available, stay in the WaitForNursing1 object and writepatient data into the NurseQueue table
• when the patient arrives at WaitForPhysician:
– check if a physician is available:
∗ if yes, move to the PhysicianCheck object and make a physician unavailable
∗ if no, write patient data into the DoctorQueue table (this table is not actuallyused, but can be used with an extended version of the model)
• when the patient arrives at WaitForNurse2, WaitForNurse3 or WaitForNurse4:
– check if a nurse is available:
∗ if yes, move to the corresponding successor (Nursing2, Nursing3 or Nursing4)and make one nurse unavailable
∗ if no, stay at the entered object and write the patient data into the NurseQueuetable
• when the patient arrives at WaitForHome or WaitForHome1:
46

– check if a nurse is available and if no one else is waiting for a nurse
∗ if yes, move the patient to the corresponding successor (NurseHome or Nurse-Home1) and make one nurse unavailable
∗ if no, write patient data into the HomeQueue table and stay in the object thatwas just entered
Nursing1 In this object, the patient is treated by a nurse. The processing time isexponentially distributed with µ = 30 minutes. When the patient is ready at this object, thePersonAvailable method is triggered
PersonAvailable When the patient leaves an object where a person is used, this methodis triggered. It does different for the different objects that can be left
• when Nursing1, Nursing2, Nursing3, Nursing4, NurseHome or NurseHome1 are leftthen:
– check if some one is waiting to be seen by a nurse
∗ if yes, get the patient data from the NurseQueue table and go see that patient
∗ if no, make an extra nurse available and trigger the MoveHomeNurse method
• when PhyscianCheck is left:
– check is some one is waiting to be seen by a physician
∗ if yes, go see that patient
∗ if no, make an extra physician available
• when NurseAndPhysician is left:
– first check if some one is waiting for a physician
∗ if yes, go see that person and check if the nurse can also see some one:
· if yes, go see that patient
· if no, make an extra nurse available and trigger the MoveHomeNursemethod
∗ if no one is waiting to be seen by a physician, check if some one is waiting inthe WaitForNurse1 object:
· if yes, move that person the NurseAndPhyscian object
· if no, make an extra physician available and check if the nurse can go seea patient in the yet known fashion
MoveHomeNurse The MoveHomeNurse method is triggered when an extra nurse be-comes available, this means that that nurse has nothing else to do and can send some onehome:
• check if a patient is waiting to be sent home or to be admitted
– if yes, get the patient data from the HomeQueue table and take care of the firstpatient in line
– if no, do nothing
47

NurseAndPhysician In this object, the patient is treated by a nurse and a physician.The processing time is exponentially distributed with µ = 35 minutes. When the patient isready at this object, the PersonAvailable method is triggered
WaitForPhyscian When the patient enters this object, the InQueue object is triggered.The patient waits here until a physician becomes available and he is next in line
Ready This is a dummy object, to make sure that right methods can be triggered afterleaving the NurseAndPhysician object. No processing time is involved
PhysicianCheck In this object, the patient is treated by a physician. The processingtime is exponentially distributed with µ = 25 minutes. When the patient is ready at thisobject, the PersonAvailable method is triggered
WaitForTest This object is made to represent the time it takes to wait for tests. Theprocessing time is exponentially distributed with µ = 10 minutes
PerformTest This object is made to represent the time it takes to perform tests. Theprocessing time is exponentially distributed with µ = 5 minutes
WaitForTestResults This object is made to represent the time it takes to wait for testresults. The processing time is exponentially distributed with µ = 10 minutes
WaitForNurse2 When the patient enters this object, the InQueue object is triggered.The patient waits here until a nurse becomes available and he is next in line
Nursing2 In this object, the patient is treated by a nurse. The processing time isexponentially distributed with µ = 30 minutes. When the patient is ready at this object, thePersonAvailable method is triggered
MoreTreatmentAndTests This object is made to represent the time it takes to per-form more tests and treatment. The processing time is exponentially distributed with µ =10 minutes
WaitForNurse2 When the patient enters this object, the InQueue object is triggered.The patient waits here until a nurse becomes available and he is next in line
Nursing2 In this object, the patient is treated by a nurse. The processing time isexponentially distributed with µ = 30 minutes. When the patient is ready at this object, thePersonAvailable method is triggered
EvenMoreTreatmentAndTests This object is made to represent the time it takes toperform more tests and treatment. The processing time is exponentially distributed with µ= 30 minutes. When the patient leaves this object the Admission method is triggered
48

Admission This method checks if a patient will be admitted or not and send him toright place in the system. This method also writes data about the patient to the data frame(ToDecision table)
• It first checks if the patient will be admitted or not:
– if no, send him to HomeHoldUp in the No Admission Block
– if yes first check if the upstairs beds option is switched on
∗ if no, send the patient to the BedGetAssgined object in the Admission blockand check if the bed that will be assigned is clean or not by comparing theBedChance attribute of the patient with the ChanceOfNoCleanBed table
∗ if yes, checks if upstairs beds are available
· if yes, send the patient to the ToUpstairs object next to the Upstairs Bedblock and check if the bed that will be assigned is clean or not by comparingthe BedChance attribute of the patient with the ChanceOfNoCleanBedtable
· if no, send the patient to the BedGetsAssigned object in the Admissionblock and check if the bed that will be assigned is clean or not by comparingthe BedChance attribute of the patient with the ChanceOfNoCleanBedtable
The No Admission Block
HomeHoldUp In this object the patient waits to be discharged. The time this takesis given to the patient by the HoldUpTime attribute by the WalkInGen method
WaitForNurseHome When the patient enters this object, the InQueue object is trig-gered. The patient waits here until a nurse becomes available and he is next in line to be senthome
NurseHome In this object, the patient is seen by a nurse. The processing time isexponentially distributed with µ = 5 minutes. When the patient is ready at this object, thePersonAvailable method is triggered
SendHome When the patient leaves this object, the BedAvaible method is triggered.No processing time is involved
BedAvaible When a bed becomes available, this method is triggered. It first checks ifsome one waiting in the WaitingRoom object
• if yes, move the first patient in line to WaitForNurse1
• if no, make an extra bed available
This method also writes data to the Data frame (tables: Admitted (if admitted), BSSToBed(if admitted), Total and Waiting)
49
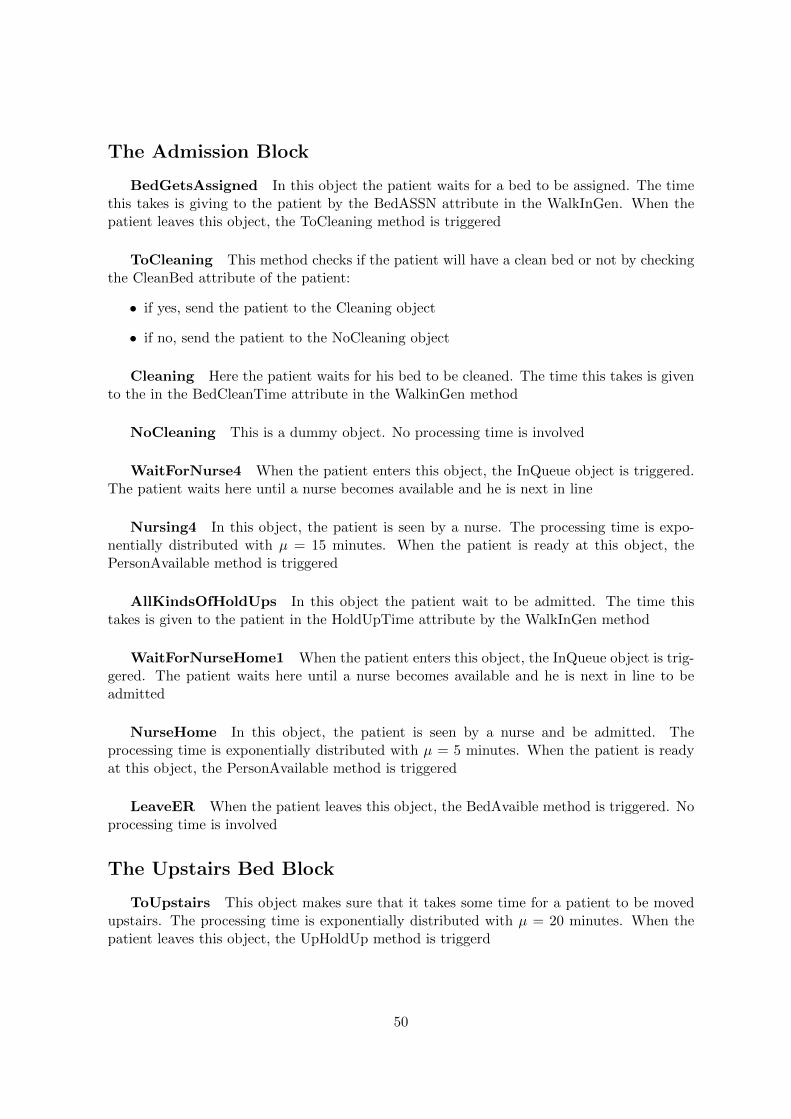
The Admission Block
BedGetsAssigned In this object the patient waits for a bed to be assigned. The timethis takes is giving to the patient by the BedASSN attribute in the WalkInGen. When thepatient leaves this object, the ToCleaning method is triggered
ToCleaning This method checks if the patient will have a clean bed or not by checkingthe CleanBed attribute of the patient:
• if yes, send the patient to the Cleaning object
• if no, send the patient to the NoCleaning object
Cleaning Here the patient waits for his bed to be cleaned. The time this takes is givento the in the BedCleanTime attribute in the WalkinGen method
NoCleaning This is a dummy object. No processing time is involved
WaitForNurse4 When the patient enters this object, the InQueue object is triggered.The patient waits here until a nurse becomes available and he is next in line
Nursing4 In this object, the patient is seen by a nurse. The processing time is expo-nentially distributed with µ = 15 minutes. When the patient is ready at this object, thePersonAvailable method is triggered
AllKindsOfHoldUps In this object the patient wait to be admitted. The time thistakes is given to the patient in the HoldUpTime attribute by the WalkInGen method
WaitForNurseHome1 When the patient enters this object, the InQueue object is trig-gered. The patient waits here until a nurse becomes available and he is next in line to beadmitted
NurseHome In this object, the patient is seen by a nurse and be admitted. Theprocessing time is exponentially distributed with µ = 5 minutes. When the patient is readyat this object, the PersonAvailable method is triggered
LeaveER When the patient leaves this object, the BedAvaible method is triggered. Noprocessing time is involved
The Upstairs Bed Block
ToUpstairs This object makes sure that it takes some time for a patient to be movedupstairs. The processing time is exponentially distributed with µ = 20 minutes. When thepatient leaves this object, the UpHoldUp method is triggerd
50

UpHoldUp This method moves the patient to the UpBedGetsAssigned object andchecks if some one is waiting for an ED bed
• if yes, move the first person in the waiting room to the WaitForNurse1 object
• if no, make an extra ED bed available
UpBedGetsAssigned In this object the patient waits for a bed to be assigned. Thetime this takes is giving to the patient by the BedASSN attribute in the WalkInGen. Whenthe patient leaves this object, the ToCleaningUp method is triggered
ToCleaningUp This method checks if the patient will have a clean bed or not bychecking the CleanBed attribute of the patient:
• if yes, send the patient to the UpCleaning object
• if no, send the patient to the UpNoCleaning object
UpCleaning Here the patient waits for his bed to be cleaned. The time this takes isgiven to the in the BedCleanTime attribute in the WalkinGen method
UpNoCleaning This is a dummy object. No processing time is involved
UpHoldUps In this object the patient wait to be admitted. The time this takes isgiven to the patient in the HoldUpTime attribute by the WalkInGen method
UpBedAvailable When the patient leaves this object, the UpBedAva method is trig-gered. No processing time is involved
UpBedAva This method makes an extra upstairs bed available
Not yet mentioned objects
EventController This object takes care of starting and terminating the simulationruns. It is configured to start tracking statistics after two days and to end the simulationafter eighty days
ExperimentManager Using the experiment manager all experiments are performed.It is now set to do ten replications per experiment with a confidence interval for the resultsof 95%
Init This method initializes all settings after each replication of an experiment
Reset This method resets the whole model after an experiment (not used at the mo-ment)
51

ArrivalRateGenerator This generator is triggered every hour of the day, it triggersthe ArrivalRateControl method
ArrivalRateControl This method keeps track of several things:
• the hour of the day
• the day of the week
• the day of the simulation
It also sets some parameters for the model:
• the arrival rate of the patient in the WalkIn object
• the number of nurses working at that moment in the NurseAmount variable
52

Appendix B
Flowcharts
The flowchart can be found on the next three pages. It is divided in three, pieces:
• the overall view
• the Emergency Room
• the part where patients wait to be admitted
53

Pat
ient
Arr
ives
Whe
re to
go?
ED
Fast
Trac
k
LWB
S
ED
FT
Go
Hom
e
Go
to F
T
Reg
istra
tion
and
Che
cks
LWB
S
Adm
it pa
tient
?Y
es
Wai
t to
go h
ome
No
Go
hom
e
Vita
l Sig
ns C
heck
See
pag
e 2
of fl
owch
arts
See
page
3
of fl
owch
arts
Bac
k fro
m
page
2
Page 1 of flowcharts

Wai
t for
nur
seIs
nur
se
avai
labl
e?N
ursi
ngY
es
No
Nur
sing
read
y
Is n
urse
/ph
ysci
an
optio
n tu
rned
on
?
From
pa
ge 1
Yes
Are
bot
h a
nurs
e an
d ph
ysic
ian
avai
labl
e?
See
phy
sici
anW
ait f
or p
hysi
cian
Is p
hysi
cian
av
aila
ble?
Rea
dy a
t phy
scia
n
Is s
ome
one
wai
ting
for
pysi
cian
?
Ext
ra p
hysi
cian
av
aila
ble
No
Wai
t for
nur
se
Is n
urse
av
aila
ble?
Nur
sing
Yes
No
Nur
sing
read
y
Trea
tmen
ts a
nd
Test
s
Is s
ome
one
wai
ting
for
nurs
e?
Ext
ra n
urse
av
aila
ble
Loop
unt
il de
cisi
on
is m
ade
Go
nurs
e fir
st in
lin
e
No
Yes
Go
see
first
pa
tient
in li
neY
es
No
See
phy
sici
an a
nd
nurs
e
Rea
dy a
t phy
scia
n an
d nu
rse
Is s
ome
one
wai
ting
for
pysi
cian
and
/or
nurs
e?
Yes
Go
see
first
pa
tient
in li
neYe
s
No
No
Extra
nur
se a
nd/o
r ph
ysic
ian
avai
labl
e
Adm
it or
dis
char
ge
deci
sion
is m
ade
Bac
k to
pa
ge 1
Page 2 of flowcharts
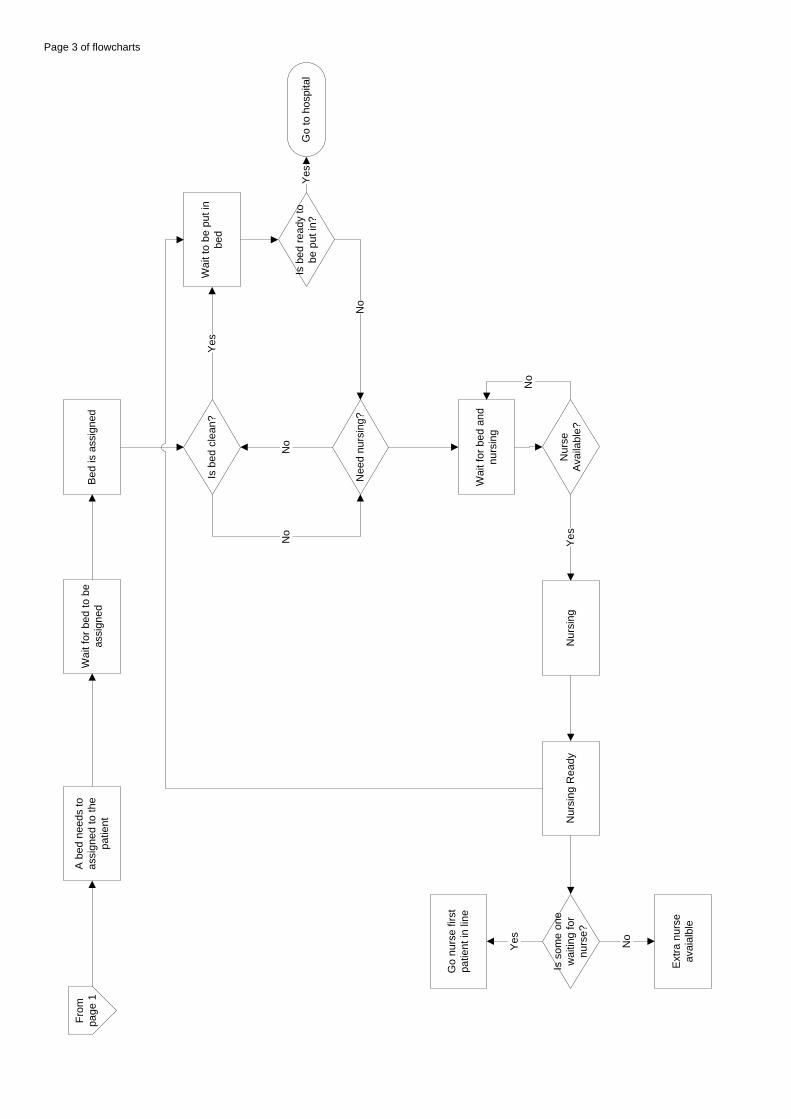
A b
ed n
eeds
to
assi
gned
to th
e pa
tient
Wai
t for
bed
to b
e as
sign
ed
Is b
ed c
lean
?W
ait t
o be
put
in
bed
Yes
Wai
t for
bed
and
nu
rsin
g
No
Go
to h
ospi
tal
Nur
se
Avai
labl
e?N
ursi
ngY
es
Bed
is a
ssig
ned
Nee
d nu
rsin
g?
Is b
ed re
ady
to
be p
ut in
?
Nur
sing
Rea
dyIs
som
e on
e w
aitin
g fo
r nu
rse?
Go
nurs
e fir
st
patie
nt in
line
Yes
Ext
ra n
urse
av
aial
ble
No
From
pa
ge 1
No
No
Yes
No
Page 3 of flowcharts