university of groningen tracer development for … · this patient illustrates the intra-individual...
TRANSCRIPT
University of Groningen
Tracer development for detection and characterization of neuroendocrine tumors with PETNeels, Olivier Christiaan
IMPORTANT NOTE: You are advised to consult the publisher's version (publisher's PDF) if you wish to cite fromit. Please check the document version below.
Document VersionPublisher's PDF, also known as Version of record
Publication date:2008
Link to publication in University of Groningen/UMCG research database
Citation for published version (APA):Neels, O. C. (2008). Tracer development for detection and characterization of neuroendocrine tumors withPET s.n.
CopyrightOther than for strictly personal use, it is not permitted to download or to forward/distribute the text or part of it without the consent of theauthor(s) and/or copyright holder(s), unless the work is under an open content license (like Creative Commons).
Take-down policyIf you believe that this document breaches copyright please contact us providing details, and we will remove access to the work immediatelyand investigate your claim.
Downloaded from the University of Groningen/UMCG research database (Pure): http://www.rug.nl/research/portal. For technical reasons thenumber of authors shown on this cover page is limited to 10 maximum.
Download date: 17-09-2018

119
Appendix
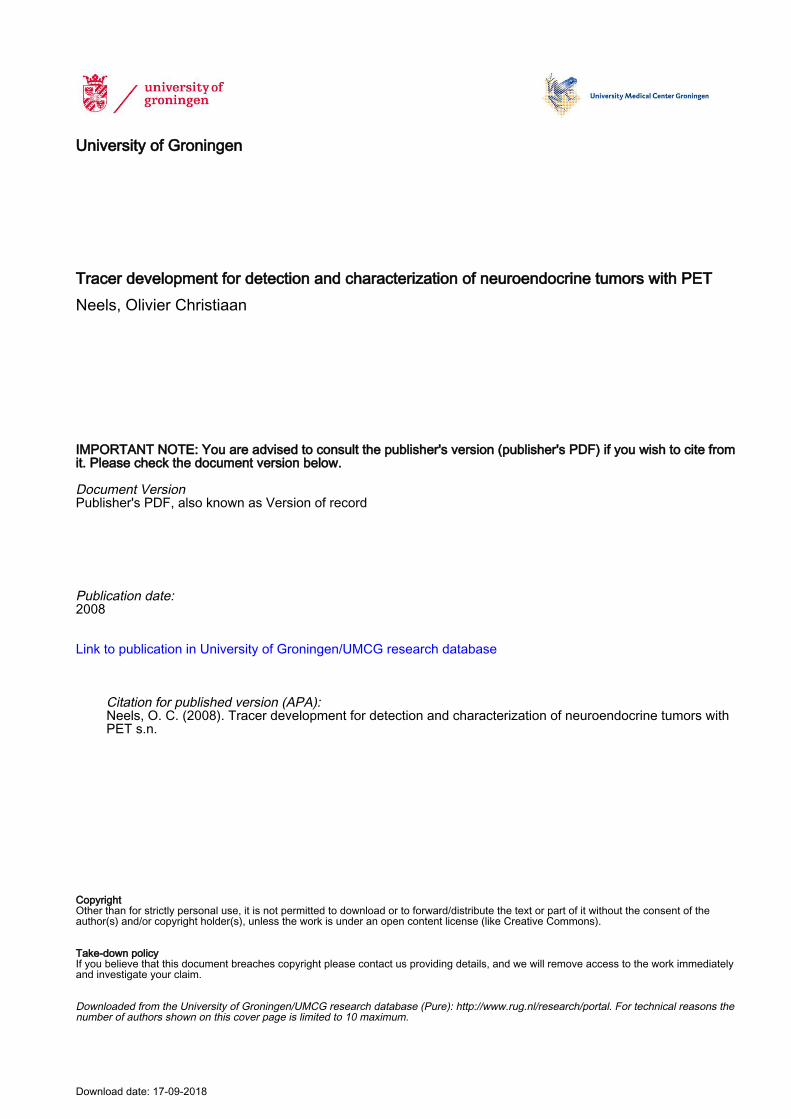
Chapter 1. Figure 1. Metastasized carcinoid. 18F-DOPA PET scan (A), Octreotide scan (B) and 18F-DOPA PET-CT fusion image (C) of a female patient presenting with a metastasized carcinoid. This patient illustrates the intra-individual heterogeneity in the uptake of different tracers by tumor metastases.
120

Appendix
Chapter 1. Figure 2. Metabolic pathways. In this figure the different metabolic pathways by which neuroendocrine tumors can be visualized using nuclear medicine imaging techniques are schematically depicted. Three major routes can be identified: receptor based techniques, techniques which use the metabolic properties of these tumors and labeled antibody based techniques
11C-5-HTP Serotonin
Catecholamine pathway
Glucose metabolism
Nucleus
L-3-[123I]-iodo-alpha-methyltyrosine (IMT)
IMT
Lysosome Phosphate metabolism
Passive diffusion Active transport Internalisation of receptor- ligand complex LAT 1 – 4F2HC complex transporter (family of LAT) Noradrenalin transporter NaPi co-transporter Glucose transporter VMAT transporter, located on secretory vesicle Somatostatin receptor with (labelled) ligand Bombesin receptor with (labelled ligand) CCK receptor with (labelled) ligand VIP receptor with (labelled) ligand Antigen with (labelled) antibody
99m
18F-DOPA
Tc-V-DMSA
Secretory vesicle
18F-Dopamine 18FDG MIBG
121

122

Appendix
123

Chapter 3. Figure 6. A - [11C]HTP PET after IV injection, coronal view. Left: control 22.6 g, 9.9 MBq, tumor weight 23.5 mg. Right: carbidopa treated 21.6 g, 6.2 MBq, tumor weight 61.1 mg. B - [18F]FDOPA PET after IV injection, coronal view. Left: control 20.5 g, 8.4 MBq, tumor weight 109 mg. Right: carbidopa treated 23.6 g, 8.4 MBq, tumor weight 57.9 mg. Summed frames. Hot spots in abdominal region were cleaned up using ASIPro’s clipping tool. Arrows point at tumors located in the right shoulder.
124
Appendix
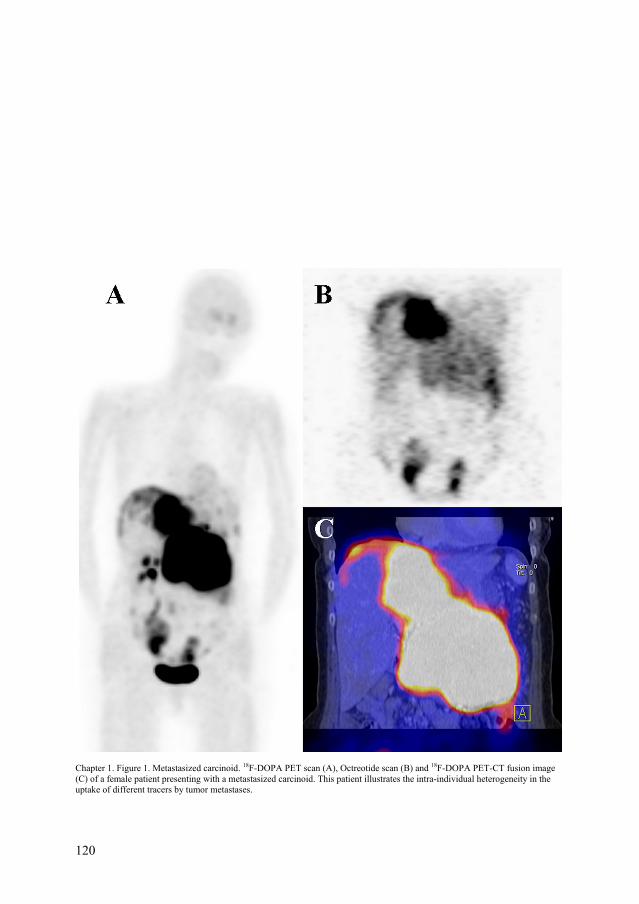
Chapter 4. Figure 2. Imaging of a patient with carcinoid disease and metastases in the bone, mediastinum, liver, and abdomen. (A) 18F-DOPA PET imaging. Red arrows indicate areas with physiological 18F-DOPA uptake (striatum, kidneys, ureter, bladder), whereas all other black spots are tumour lesions. (B) Planar SRS imaging. Arrows indicate mediastinal tumour lesions. (C) CT–PET fusion imaging. Coloured areas indicate tumour lesions. In this patient, both planar and SPECT SRS missed most lesions found with 18F-DOPA PET imaging. Abdominal and femoral lesions were not recorded on CT.
125

126

Appendix
127

128
Chapter 5. Figure 2. Fused 18F-DOPA – PET CT scan (A), SRS (B), 18F-DOPA PET (C) and 11C-5-HTP PET (D) of a 80 year old male patient with metastatic carcinoid tumor. The CT scan shows a mesenterial mass and two smaller lesions in the upper mediastinum. On SRS (both planar and SPECT, not shown here) only the larger mediastinal mass, the large mesenterial mass and a small lesion on the left cranial side of the urinary bladder could be found. Both 18F-DOPA PET and 11C-5-HTP PET showed a number of smaller lesions in the upper mediastinum and upper lobes of both right and left lung, with 18F-DOPA yielding the best contrast. Note that the small lung lesions show less 11C-5-HTP uptake than 18F -DOPA uptake.
A DB C

Appendix
129
A B C D Chapter 5. Figure 3. CT scan (A), SRS (B), 18F-DOPA PET (C) and 11C-5-HTP PET (D) of a 54 year old male patient with metastatic islet cell tumor. The CT scan shows a large mass in the pancreatic head region (arrow), SRS shows equivocal (arrow) and 18F-DOPA PET shows low uptake in the pancreatic region and minor uptake in the upper chest and in two thoracic vertebrae. 11C-5-HTP PET, however, shows numerous bone, liver and abdominal lesions, including the pancreatic region with much higher contrast.
