university of groningen radial distribution of ions in ... distribution of ions in pores with a...
TRANSCRIPT

University of Groningen
Radial distribution of ions in pores with a surface chargeStegen, J.H.G. van der; Görtzen, J.; Kuipers, J.A.M.; Hogendoorn, J.A.; Versteeg, Geert
Published in:Journal of Membrane Science
IMPORTANT NOTE: You are advised to consult the publisher's version (publisher's PDF) if you wish to cite fromit. Please check the document version below.
Document VersionPublisher's PDF, also known as Version of record
Publication date:2001
Link to publication in University of Groningen/UMCG research database
Citation for published version (APA):Stegen, J. H. G. V. D., Görtzen, J., Kuipers, J. A. M., Hogendoorn, J. A., & Versteeg, G. F. (2001). Radialdistribution of ions in pores with a surface charge. Journal of Membrane Science, 183(1), 61-74.
CopyrightOther than for strictly personal use, it is not permitted to download or to forward/distribute the text or part of it without the consent of theauthor(s) and/or copyright holder(s), unless the work is under an open content license (like Creative Commons).
Take-down policyIf you believe that this document breaches copyright please contact us providing details, and we will remove access to the work immediatelyand investigate your claim.
Downloaded from the University of Groningen/UMCG research database (Pure): http://www.rug.nl/research/portal. For technical reasons thenumber of authors shown on this cover page is limited to 10 maximum.
Download date: 29-05-2018
Journal of Membrane Science 183 (2001) 61–74
Radial distribution of ions in pores with a surface charge
J.H.G. van der Stegena, J. Görtzenb, J.A.M. Kuipersc,J.A. Hogendoornc,∗, G.F. Versteegc
a AKZO-Nobel Central Research B.V., RTB Department, P.O. Box 9300, 6800 SB Arnhem, The Netherlandsb TNO, Apeldoom, The Netherlands
c Department of Chemical Engineering, University of Twente, OOIP, P.O. Box 217,7500 AE Enschede, The Netherlands
Received 6 April 2000; received in revised form 22 August 2000; accepted 23 August 2000
Abstract
A sorption model applicable to calculate the radial equilibrium concentrations of ions in the pores of ion-selective membraneswith a pore structure is developed. The model is called the radial uptake model. Because the model is applied to a Nafionsulfonic layer with very small pores and the radial uptake model is based on the assumption that continuum equations areapplicable, the model is used near its limits of fundamental validity. However, the results indicate that the calculated profileswith the radial uptake model are realistic and similar to literature results (e.g. [J.R. Bontha, P.N. Pintauro, J. Phys. Chem.96 (1992) 7778; J.R. Bontha, P.N. Pintauro, Chem. Eng. Sci. 49 (1994) 3835]). The membrane microstructure parameters(surface charge density and pore diameter) have been determined by fitting the sorption of sodium as predicted by the radialuptake model to the sorption of sodium as predicted by the so-called modified Pitzer model [J.H.G. Van der Stegen, A.J. vander Veen, H. Weerdenburg, J.A. Hogendoorn, G.F. Versteeg, Fluid Phase Equilibria 157 (1999a) 181]. This modified Pitzermodel has proven to be able to predict volume averaged sorption of ions in a sulfonic membrane layer. Via the introductionof a component dependent correction factor in the radial uptake model, the sorption of ions other than sodium could alsobe fitted to the volume averaged sorption data as predicted by the modified Pitzer model. The correction factors were in theorder of magnitude of 0.05–10, and dependent on the concentration of sodium. The necessity of the application of correctionfactors for the ions other than sodium may have been induced by the assumption that:
• the applicability of continuum equations in the model is justified and/or;
• the activity coefficients in the radial uptake model are equal to unity.
It was observed that due to the preferential sorption of iron near the pore wall, the pore surface charge could be shielded,resulting in a decrease of the preferential selectivity of the membrane for sodium. However, such a phenomenon does notoccur in the operating range of the chloralkali process, where the sorption of iron inside the membrane is proportional to itsexternal concentration. © 2001 Elsevier Science B.V. All rights reserved.
Keywords:Pitzer model; Radial distribution; Surface charge; Nafion membrane
∗ Corresponding author. Tel.:+31-53-4893027; fax:+31-53-4894774.E-mail address:[email protected] (J.A. Hogendoorn).
0376-7388/01/$ – see front matter © 2001 Elsevier Science B.V. All rights reserved.PII: S0376-7388(00)00558-5

62 J.H.G. van der Stegen et al. / Journal of Membrane Science 183 (2001) 61–74
Nomenclature
A hydration constant (J mol−1)C concentration (mol m−3)CE current efficiency (%)D diffusion coefficient (m2 s−1)ew water uptake (m3 m−3)EW equivalent weight (kg eq−1)F Faraday’s constant (mol eq−1)1vacG hydration Gibbs free
energy (J mol−1)L length of pore (m)m molality (kg kg−1)n refractive indexNc number of componentsNp number of poresr radial coordinate (m)rp pore radius (m)R universal gas constant
(J mol−1 K−1)T temperature (K)X fixed charge concentration
(mol m−3)zi ionic charge of componenti
Greek lettersα water dipole moment (C m−1)β constant in relation for electric
permittivityε dielectric permittivity (F m−1)ε∗ dielectric permittivity of
vacuum (F m−1)γ activity coefficientΓ sorption correction factorϕ potential (V)κ Boltzmann constant (J K−1)µ electrochemical potential (J mol−1)µ0 standard electrochemical
potential (J mol−1)ρ density (kg m−3)ρe charge density (C m−3)σ surface charge density (C m−2)
Superscriptsb bulkm membrane phase
Subscriptsi component indexp porer radialw water
1. Introduction
Ion exchange membranes are used in a number ofelectrochemical devices including batteries, fuel cellsand electrochemical reactors. They have also foundapplications in the desalination of brackish water andin heavy metal removal from wastewater. Despitetheir widespread use, only very little is known aboutthe molecular-level processes that control ion uptakeand transport in these membranes. In a previous paper[3] the uptake of ions in a sulfonic membrane layer(which is present in the Nafion membranes as used inthe chloralkali electrolysis process) was described byapplying a modified Pitzer model which is an exten-sion of a traditional liquid phase equilibrium model.Although the model was able to describe the sorptiondata satisfactorily, one of the basic assumptions is thatthe ions are homogeneously distributed in the mem-brane. However, it has been shown that for the sulfoniclayer of the Nafion membrane such a homogeneousdistribution of ions in the membrane is an oversimpli-fication. For the sulfonic layer the presence of whatis called a cluster-network configuration has success-fully been demonstrated to exist [4,5]. This means thatthe uptake of ionic species is governed by inhomoge-neous molecular level interactions in the pore betweenthe solute, the solvent and the membrane polymermatrix.
In order to create better understanding about thesetopics, this paper will describe a model that is able topredict the radial distribution of ions in a pore with asurface charge.
2. The membrane
The most frequently used membrane types in thechloralkali electrolysis process are perfluorinatedionomer membranes with sulfonic and carboxylic
J.H.G. van der Stegen et al. / Journal of Membrane Science 183 (2001) 61–74 63
base polymers. These names are derived from the typeof charged groups inside the membrane, that is –SO3
−(sulfonic) or –COO− (carboxylic), respectively. Dueto the negative charge of the fixed groups the mem-branes will be cation selective, which is the main goalof the application of such a membrane in the chlo-ralkali electrolysis process [6,7]. The perfluorinatedionomer membranes with sulfonic groups or car-boxylic groups (e.g. the Flemion membranes of AsahiGlass Company or the Nafion membranes of Du Pontde Nemours) expose these properties and thereforeare used in many electrochemical applications suchas the chloralkali electrolysis.
In case of a carboxylic base membrane, the mem-brane is supposed to be a (pseudo)-homogeneousphase and the description of the equilibrium at theinterfaces and the mass transfer process is mainlymodeled on a macroscopic basis [8]. This impliesthat uniform properties are assumed and that aone-dimensional transport model can be applied.
In case of a sulfonic type membrane layer, Gierkeet al. [4,5] have shown that the membrane structure isheterogeneous. This structure was derived from inves-tigations on ion-exchange membranes with the helpof X-ray scattering and neutron scattering techniques.In Fig. 1a the experimentally found structure accord-ing to Koh and Silverman [9] is shown schematicallyfor the sulfonic base polymer. With this apparent mi-crostructure both the equilibrium model applicable tothe phase transitions and the transport model shouldaccount for the radial direction. As the exact porestructure is unknown assumptions and simplificationshave to be made. According to Verbrugge and Pintauro[10], the experimentally found membrane structurecan be represented by an array of parallel cylindricalcapillaries, with a uniform charge density on the porewall of the ion-exchange membrane (see Fig. 1b). Kohand Silverman [9] support this view because they re-port that ionic transport is mainly controlled by the di-mensions of the channels connecting the clusters andsurface charge densities, and that the role played byother structural characteristics, such as, e.g. the clus-ter dimensions, are less important. Therefore, in thepresent study, the sulfonic membrane was regarded asa matrix composed of straight parallel cylinders witha radius in the order of the channel radius (±1 nm)and a pore length of about the thickness of themembrane [10].
In the present study attention will be paid to thethermodynamic equilibrium at the anolyte-sulfonicphase transition. The choice for this phase transitionis obvious, as the sulfonic layer is always contactedwith the anolyte. The equilibrium model should beable to predict the radial concentrations of the variouscomponents inside the pore. A model suitable for thisis the so-called one-dimensional submodel, developedby Bontha and Pintauro [2]. Because parameters likethe pore radius and the surface charge density are un-known these have to be determined from experimentalvolume averaged sorption data and/or from the theo-retical volume averaged sorption data as predicted bythe modified Pitzer model [3].
3. The radial uptake model
3.1. Introduction
A model will be presented, which can describeequilibrium sorption of ions in an ion-selective mem-brane with a pore structure. This can be applied to amembrane like the sulfonic membrane, which is sup-posed to have such a pore structure (see e.g. Fig. 1aand b). This model cannot only be used to predictmembrane microstructure parameters and radial con-centration profiles in the sulfonic layer at a phasetransition, but also contribute to an improved under-standing of the sorption process. Pintauro and Yang[11] first presented the complete model for the de-scription of the sorption of ions in membranes witha pore structure. They combined the multicomponentpartition coefficient theory described by Bontha andPintauro [2] and the single-component transport the-ory developed by Guzman-Garcia et al. [12]. Themodel considers pore-water orientation by the strongradial electric field generated by the ion-exchange sitesat the pore wall and variations in ion hydration forcesdue to the low water dielectric constant near the porewall. One of the major assumptions in the applicationof the model is that equations for continuum models(such as the Poisson and Booth equation) are alsoapplicable to the description of the interaction of thepore wall with the solutes. This, however, may not betrue in the present situation, as the dimensions of thepores usually are in the same order of magnitude asthe ions.

64 J.H.G. van der Stegen et al. / Journal of Membrane Science 183 (2001) 61–74
Fig. 1. (a) Experimentally found structure of an ion-exchange membrane with an sulfonic base polymer according to Koh and Silverman[9]; (b) schematic representation of simplified membrane structure as used in the present contribution. The gray area represents the pores.
3.2. Model description
When equilibrium is achieved between a membraneand its surroundings the electrochemical potential ofeach species inside the liquid in the membrane is equal
to its electrochemical potential in the external solution[13]
µmi,0 + RTln(γ m
i cmi (r)) + 1m
vacGi(r) + ziFϕ
= µbi,0 + RTln(γ b
i cbi ) + 1b
vacGi + ziFϕb (1)

J.H.G. van der Stegen et al. / Journal of Membrane Science 183 (2001) 61–74 65
in which m, b andi refer to membrane fluid, bulk fluidand componenti, respectively. The1vacG terms definethe hydration (solvation) Gibbs free energy changeassociated with the transfer of an ion from vacuumto the given phase. These free energy terms accountfor the ion-solvent interaction energy contribution tothe electrochemical potential because of the solventdipole alignment in a pore. This interaction occurs dueto the strong radially directed electric field generatedby fixed-charge sites along the pore wall.
Bontha and Pintauro [1] have developed a model forthe prediction of free energies of ionic solvation. Theyproposed a function that describes a hydration constantAi , which is dependent on the free Gibbs solvationenergies and the dielectric constant of the solvent (ε)
Ai = 1vacGi |ε=n2 − 1vacGi |ε=εb
1/ε|ε=n2 − (1/ε)|ε=εb
(2)
with n the refractive index of the solvent. The termAi
is called the hydration constant for speciesi and theexpression was derived by using a two-point boundaryapproximation, because, according to the authors, thefree Gibbs energy change seems to be a linear func-tion of the reciprocal dielectric constant of the solvent.The minimum value of the dielectric constant isn2
at infinite large potential gradients, while the otherasymptote is given for zero potential gradient,εb.
The hydration constant for a species, as defined byEq. (2), is a function of the charge of the ion and thehard sphere radius of the ion. The free Gibbs energies,pore radii and hydration constants for several compo-nents are tabulated in the Appendix A. For hydroxideit is in fact erroneous to define a hydration constant,because it is not an ordinary ion and has specialproperties in water. However, in order to implementhydroxide into the model, in this study the hydroxideis assumed to be similar to an ordinary ion. To realizethis, the unknown hydration constant for hydroxidewas taken equal to the value for Cl−. Although themodel in this study is applied to both catholyte andanolyte, the model only has practical significance forsituations in which the sulfonic layer is contacted withthe anolyte (as in the chloralkali electrolysis process).This means that the aforementioned simplificationseems to be acceptable because of the fact that theconcentration of hydroxide in the anolyte is very low(pH ∼ 2–5). This means that even if the radial distribu-tion of hydroxide in the pore is unreliable, this only has
minor consequences with respect to the behaviour ofother components in the pore for practical conditions.
If the standard state chemical potentials arepresumed to be equal in both fluid phases and assum-ing the ion activity coefficients to be unity the fol-lowing modified Boltzmann equation can be derivedby rewriting Eqs. (1) and (2).
cmi (r) = cb
i exp
{ziF
RT(ϕb − ϕ(r))
+ Ai
RT
(1
εb− 1
ε(r)
)}(3)
In order to use Eqs. (1) and (3) to compute theradial dependent equilibrium concentration of one ormore ions inside a membrane pore, the dependency ofthe electrostatic potential and solvent dielectric con-stant on the radial pore position must be determined.This is accomplished by solving Poisson’s equationwith a nonuniform dielectric constant forn mobile ionspecies.
∇[ε(r)∇ϕ(r)] = − F
ε∗
Ns∑i=1
zicmi (r) (4)
in which ε∗ is the permittivity of vacuum. An expres-sion to relate the dielectric constant to the electricfield strength in a membrane pore is given by Booth’sequation [17].
ε(r) = n2 + 3(εb − n2)
β∇ϕ(r)
×[
1
tanh{β∇ϕ(r)} − 1
β∇ϕ(r)
](5)
with
β =(
5α
2κT
)(n2 + 2) (6)
In Eq. (6) κ is the Boltzmann constant andα thedipole moment of the bulk solvent. The model is com-pleted with the definition of boundary conditions forEq. (4). On the centerline of the membrane (r = 0)symmetry of the potential field is assumed and at thepore wall (r = rp) Gauss’s law is applied.
r = 0,∂ϕ(r)
∂r= 0,
r = rp,∂ϕ(r)
∂r= − σ
ε∗ε(rp)(7)

66 J.H.G. van der Stegen et al. / Journal of Membrane Science 183 (2001) 61–74
whereσ is the surface charge density of ion exchangesites on the pore wall. The resulting concentrationsfrom Eq. (3) can be transformed to volume averagedconcentrations by
Ci, average, pore=∫ rp
0 2π rCi (r)dr
πr2p
= Ci, average, membrane
ew(8)
in which ew is the volume averaged water uptake ofthe membrane.
In order to calculate radial ion distributions acrossthe pore, membrane microstructure parameters mustbe known. On the other hand, if the pore radius andthe surface charge density are unknown they can beestimated by fitting the calculated volume-averagedconcentrations (Eq. (8)) to experimental data or re-sults derived from an appropriate theoretical equilib-rium model, like the modified Pitzer model [3]. Thelatter approach was followed in the present study. Thismeans that there is only one degree of freedom remainsbecause the surface charge density and the pore radiusare also correlated to each other as shown below.
Total charge inside the membrane per cubicmeter of membrane
total charge= ((1 − ew)ρmembraneF)/EW
Total amount of pore surface per cubic meterof membrane
total surface= 2NpπrpLp
Total pore volume per cubic meter of membrane ew = πr2pLpNp
Surface charge density σ = total charge/total surface area= (ew/(1 − ew))(ρmF)/(2EW)rp
ew
(1 − ew)= 1000
ρpolymerF
2EW
rp
σ(9)
The water uptake in Eq. (9) can be calculated by,e.g. the empirical relations of Van der Stegen [18] (seeAppendix A).
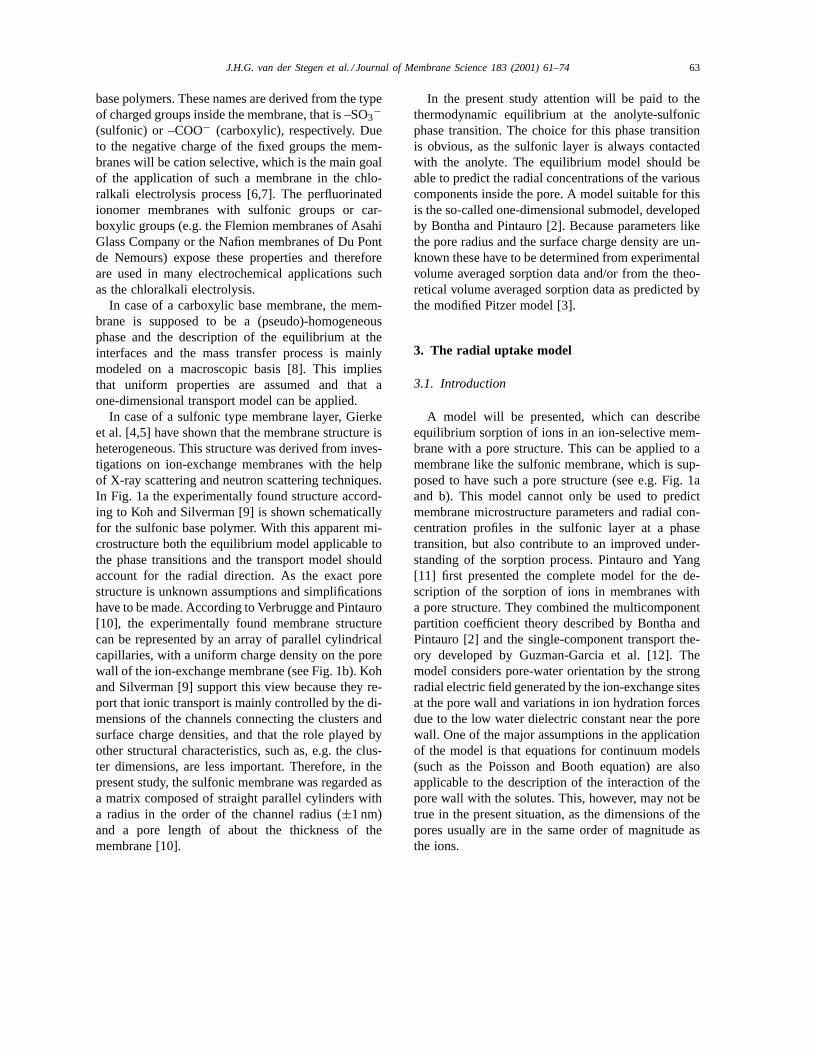
In this report the pore radius was fitted to the sodiumvolume averaged concentration as predicted by themodified Pitzer model which has shown to be ableto reliably predict volume averaged sorption data [3].The modified Pitzer model was used to generate theo-retical sorption data, however, it was used in the sameconcentration range as the Pitzer model parameterswere derived from experiments. This means that the
predictions of the modified Pitzer model can be re-garded as smoothed experimental data (see Fig. 2 fora schematic representation). Sodium was chosen askey component, because this is the main componentpresent in the negatively charged membranes as usedin the chloralkali electrolysis process. In the optimiza-tion procedure for the determination of the pore radiusthe counter ions chloride and/or hydroxide also playa role via Eq. (4). Because for a given surface chargedensity (see relation 9) there is only one degree of free-dom (i.e. pore radius) to fit the sodium sorption data,two extra degrees of freedom are required to be able tofit the measured or predicted chloride and hydroxidesorption data. Therefore, a correction or fit parameterΓ i is introduced in Eq. (3) to obtain the correct aver-aged sorption data of components other than Na+ (ofcourse for Na+ the introduction of a correction factoris not necessary, effectively this means that there isone degree of freedom per component).
cmi (r) = cb
i Γi exp
{ziF
RT(ϕb − ϕ(r))
+ Ai
RT
(1
εb− 1
ε(r)
)}(10)
The model equations were solved simultaneously,using a standard finite difference numerical algorithmwith variable mesh point spacing. Numerical integra-tion of the resulting radial ion concentration profilesacross the membrane pore (Eq. (8)) was performed toobtain the average ion concentration in the solvent inthe membrane. Of course, the sorption data of all com-ponents obtained in this way should equal the sorptiondata as predicted by the modified Pitzer model of vander Stegen et al. [3].
The optimization (or minimization of the differ-ence) was performed by a downhill simplex methoddescribed by Nelder and Mead [19]. The method isdescribed more extensively by Press et al. [20].
J.H.G. van der Stegen et al. / Journal of Membrane Science 183 (2001) 61–74 67
Fig. 2. Schematic representation of how the modified Pitzer model predictions [3] can be regarded as smoothed experimental points whichwere used to fit several parameters (rp, σ , Γ i ) for the current model.
3.3. Results of the equilibrium sorption calculationsfor the main components with the radial uptake model
The model was applied to two sulfonic membraneswhich are also present in the sulfonic layer of twoNafion membranes: the Nafion 117 (with an equiv-alent weight of 1100 g mol−1) and Nafion 152 (withan equivalent weight of 1500 g mol−1). In the calcu-lations the bulk electrolyte strength was varied from
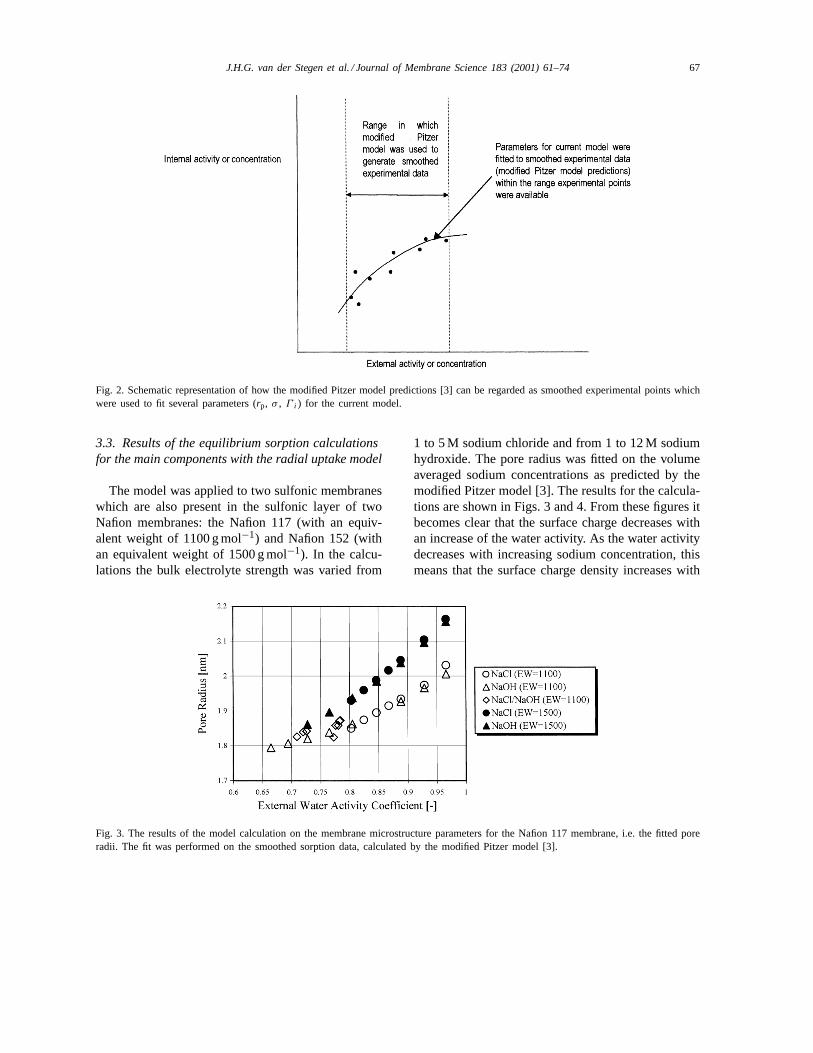
Fig. 3. The results of the model calculation on the membrane microstructure parameters for the Nafion 117 membrane, i.e. the fitted poreradii. The fit was performed on the smoothed sorption data, calculated by the modified Pitzer model [3].
1 to 5 M sodium chloride and from 1 to 12 M sodiumhydroxide. The pore radius was fitted on the volumeaveraged sodium concentrations as predicted by themodified Pitzer model [3]. The results for the calcula-tions are shown in Figs. 3 and 4. From these figures itbecomes clear that the surface charge decreases withan increase of the water activity. As the water activitydecreases with increasing sodium concentration, thismeans that the surface charge density increases with

68 J.H.G. van der Stegen et al. / Journal of Membrane Science 183 (2001) 61–74
Fig. 4. The results of the model calculation on the membrane microstructure parameters for the Nafion 117 membrane, i.e. the calculatedsurface charges. The fit was performed on the smoothed sorption data, calculated by the modified Pitzer model [3].
an increase in the sodium concentration. This meansthat according to the model the pore radius decreaseswith an increase in the salt concentration, which is alsofound experimentally [4,5]. The reason for a shrink-ing membrane pore with an increasing salt concentra-tion is a higher shielding effect provided by the moreconcentrated electrolyte solution. It can be seen thatNafion 152 shows smaller surface charge densities andlarger pore radii than Nafion 117. This is because ofthe larger equivalent weights for this membrane type.
From Van der Stegen [18] it is clear that themembrane pores are smaller for a caustic soda bulksolution than for a NaCl bulk solution. However, inFig. 3 the calculated pore radii for caustic soda andsodium chloride seem to be identical. The reason forthis is simple. Because no data for the hydration co-efficient of hydroxide were available in literature (seeAppendix A) the hydration coefficient for hydroxidewas assumed to be equal to the hydration coefficientof chloride. Therefore, the radial uptake model is notable to discriminate between hydroxide and chlorideand thus no differences in pore radii and surfacecharge densities were found between a caustic andsodium chloride solution contrary to the experimentalresults of van der Stegen [18].
3.4. Correction factors for trace components
In the electrolysis process the exact role of tracecomponents like iron is unknown, but from industrial
experience it can be concluded that it is very impor-tant, because of the possibility of precipitation insidethe membrane. Therefore the sorption and transportof these trace components has to be predicted accu-rately. The radial uptake model was extended to theapplication of aqueous solutions that contain morecomponents than sodium, chloride and hydroxide. Inthe radial uptake model correction factors for othercomponents than sodium had to be introduced to fitthe sorption data, obtained from the modified Pitzermodel [3]. Again the concentration range in which thecurrent model was used was identical to the range inwhich the modified Pitzer model predicts reliable andverifiable results (also see Fig. 2). In order to fit the the-oretical results of the present model to the smoothedexperimental data (as represented by the predictionsof the modified Pitzer model), Eq. (3) was modifiedagain with a component specific correction factorΓ i
like was previously done for Cl− and OH− in Eq. (10)(this means that there is one degree of freedomper component).
cmi (r) = cb
i Γi exp
{ziF
RT(ϕb − ϕ(r))
+ Ai
RT
(1
εb− 1
ε(r)
)}(10)
Again for sodium a correction factor is superflu-ous as this component fits the sorption data predictedby the modified Pitzer model via the optimized

J.H.G. van der Stegen et al. / Journal of Membrane Science 183 (2001) 61–74 69
Table 1Typical brine composition [18] and properties of the membrane type (Nafion 117)
Brine composition
Component Concentration Concentration (mol l−1)
Sodium chloride 180 g l−1 3.08Sulfate 6 g l−1 0.063Chlorate 2.3 g l−1 0.028Borate 1.5 g l−1 0.026Calcium 43mg l−1 1.07 × 10⁻⁶
Magnesium 7mg l−1 2.88 × 10⁻⁷
Iron 47mg l−1 8.4 × 10⁻⁷
Potassium 11 g l−1 0.281Aluminum 180mg l−1 6.67 × 10⁻⁶
Property Membrane properties Nafion 117Equivalent weight 1100 (g mol−1)ρpolymer 1640 (kg m−3)
membrane microstructure parameters (pore radiusand accompanying surface charge density) and thusΓi = 1. In order to determine the correction factorsfor components other than sodium, simulations withthe radial uptake model were performed for severalanolyte strengths. The typical anolyte concentrationsfor the trace components are shown in Table 1. InFig. 5 the resulting correction factors (Γ i) for variouscomponents are shown as a function of the externalsodium chloride concentration. A correction factor
Fig. 5. Correction factors in Eq. (10) in the radial uptake model. The correction factor for sodium is at unity, because it fits the modifiedPitzer model [3] via the membrane microstructure parameters. The simulations were performed for the sulfonic layer of the Nafion 117sulfonic membrane.
larger than unity means that in case of absence of thecorrection factor the sorption predicted by the radialuptake model would be lower than indicated by themodified Pitzer model.
Fig. 5 shows that the correction factor for all com-ponents differs from one. From these results it can beconcluded that the radial uptake model is not capableof predicting the sorption of ions other than sodium(which implicitly fits the sorption data usingΓi = 1because the surface charge density and pore diameter

70 J.H.G. van der Stegen et al. / Journal of Membrane Science 183 (2001) 61–74
were previously fitted to the sorption data of sodium)without the use of a correction factor. These correctionfactors have to be calibrated from either theoretical orexperimental sorption data. With the implementationof correction factors it is possible to reliably predictthe sorption of all components.
Bontha and Pintauro [1] obtained a similar result ina system of sodium and lead chloride. These authorsalso introduced a correction factor to fit experimentalsorption data to the predictions of their radial uptakemodel, but they defined a correction factor actingon the effective surface charge. For higher valentcation (in their case lead) this resulted in a lowereffective surface charge which was explained by theformation of bonds of these ions with the membranesulfonic groups. With this procedure good agreementwas achieved between experiments and calculations.Analysis with 207 Pb nuclear magnetic resonancespectroscopy of lead containing Nafion membraneswas performed in an attempt to verify the formationof Pb(II)-sulfonate bonds. An amount of 50–90% ofthe sorped lead was bound to the membrane chargedgroups. This means that a large number of the sulfonicion-exchange sites in Nafion membrane were therebyneutralized by Pb(II). The extent of binding increasedwith the surface charge density of the coabsorbedmonovalent cation and decreased with increasing totalexternal salt concentration. Remarkably, they did notalter the surface charge for sodium because otherwiseincorrect sodium sorption data would be predicted.This means that with the method of Bontha and Pin-tauro [1], the radial uptake model must be fed withcomponent and concentration dependent correctionfactors for the surface charge. This seems incorrectfrom a physical point of view. Therefore, the methodwith the correction factorsΓ i as shown in Eq. (10)was used in this study. The necessity of introduc-ing the factorΓ i may then be caused by neglectingnon-ideality effects from Eq. (1) or Eq. (10). However,it seems very impractical to introduce non-idealitiesin relation (10), as this would certainly require radi-ally dependent activity coefficients. Therefore, in thisstudy we restricted ourselves to the use of an averagedcorrection factor.
The bonding of higher charged cat-ions to mem-brane charged groups is discussed in detail in the nextsection, because of its large influence on the decreaseof the membrane selectivity and performance.
3.5. Calculated radial concentration profiles
In this section the radial concentration and poten-tial profiles obtained with the radial uptake model aregiven for a base case. The input data for this base caseare tabulated in Table 1. The data in Table 1 are basedon the typical brine composition of the experimentalset-up in Hengelo (the Netherlands) as described byHoetjer [21]. The choice for a brine composition isobvious, because the sulfonic part of a commerciallyused membrane is always situated at the anode com-partment (which contains the brine solution).
3.5.1. Concentration profilesFor the base case a calculation with the radial uptake
model was performed. The resulting radial concentra-tion profiles were transformed to dimensionless onesby dividing the local radial concentrations by theircorresponding external bulk concentration. By doingthis, radial partition coefficients are obtained, definedsimilar to Bontha and Pintauro [2]. The resulting pro-files for several components are shown in Fig. 6. FromFig. 6 it can be seen that each species behaves ina different manner. This is the result of the differ-ent bulk concentrations and hydration coefficients (seeAppendix A). Because of the negative surface chargein the membrane pore, a competition between cationstakes place for occupying the desirable positions nearthe wall. The anions show the opposite behavior, sincethey are repelled from the pore wall and preferably aresituated in the center of the pore. For both sodium andmagnesium a local maximum is observed, which phe-nomenon was also reported by Bontha and Pintauro[2] and Guzman-Garcia et al. [12]. It is the result ofthe local domination of hydration forces over electro-static forces and vice versa. These phenomena are nei-ther observed for the other cations, nor for the anions.The first group has a (bulk) concentration too low toobserve the phenomena, the latter group has inducedforces in the same direction, i.e. towards the center-line. With increasing hydration constant the chance ofshowing the maximum as observed for sodium andmagnesium decreases, because the hydration force isa reciprocal function of this hydration constant. Forpositively charged species with small hydration con-stants the partition near the wall will be at its maxi-mum. This trend is shown for sodium, potassium andiron. Potassium and sodium have bulk concentrations

J.H.G. van der Stegen et al. / Journal of Membrane Science 183 (2001) 61–74 71
Fig. 6. Dimensionless concentration profiles as a function of the dimensionless radial position for some selected components. Theresulting radial concentration profiles are transformed to dimensionless local partition coefficients by dividing the local dimensionless radialconcentrations by their corresponding bulk concentration. Calculations are performed for the base case with a sodium ion concentrationof 3.08 M (see Table 1). Components that are represented by closed symbols use the right axis. The dimensionless radial position of 0represents the pore center while a position of 1 represents the pore wall.
in the same order of magnitude, but since potassiumhas the smallest hydration constant, its partition nearthe pore wall is larger than for sodium. Although ironhas a larger hydration constant than potassium the par-tition coefficient of iron near the pore wall is evenlarger than the partition of potassium, because of itssmaller bulk concentration and higher charge. Fromthis it can be seen that only the iron cations are mainlylocated at the pore wall. Bontha and Pintauro [1] ob-served a similar phenomenon for lead. It is thereforelikely that iron also forms bondings to the chargedgroups of the membrane phase, as lead does [1]. Theeffect of this possible bonding on the surface chargemay be of importance in the transport process throughthe membrane.
The anions show an increasing partition coefficienton the pore centerline with increasing ion charge anddecreasing hydration constant. The partition of anionsnear the pore wall is near zero for all anions. Thepotential profile for the base case calculation is shownin Fig. 7.
3.5.2. Selective uptake of ironIn industrial operation the precipitation of ironhy-
droxide just inside the sulfonic layer is a major prob-lem leading to deterioration of the membrane. Not
only the precipitation of iron but also the very selec-tive bonding of iron with the sulfonic groups couldhave dramatic effects on the performance and selec-tivity of the membrane by shielding off the chargedgroups of the membrane. This can reduce the effec-tiveness in repelling anions, resulting in an increasein transport of unfavorable anions and thus a decreasein current efficiency. To prevent or minimize this aminimum sorption of iron is desired. In the previous
Fig. 7. Potential distribution in a pore as a function of the radialposition for the base case. The dimensionless radial position of0 represents the pore center while a position of 1 represents thepore wall.
72 J.H.G. van der Stegen et al. / Journal of Membrane Science 183 (2001) 61–74
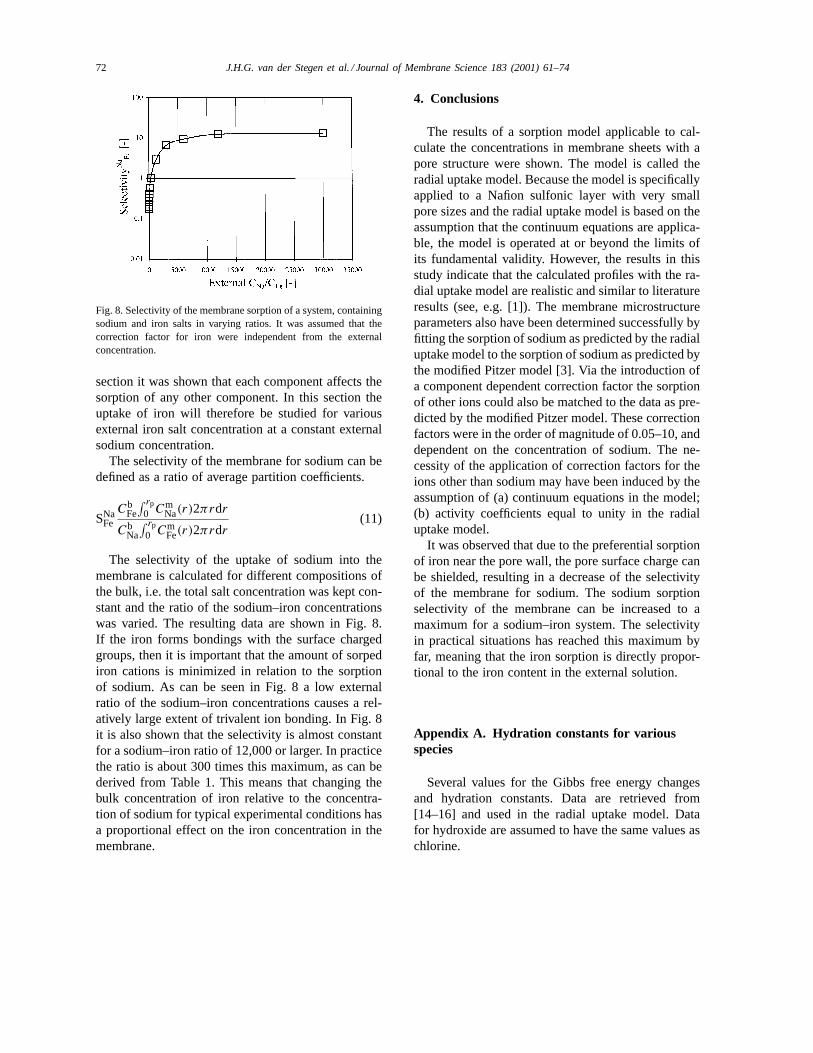
Fig. 8. Selectivity of the membrane sorption of a system, containingsodium and iron salts in varying ratios. It was assumed that thecorrection factor for iron were independent from the externalconcentration.
section it was shown that each component affects thesorption of any other component. In this section theuptake of iron will therefore be studied for variousexternal iron salt concentration at a constant externalsodium concentration.
The selectivity of the membrane for sodium can bedefined as a ratio of average partition coefficients.
SNaFe
CbFe
∫ rp0 Cm
Na(r)2πrdr
CbNa
∫ rp0 Cm
Fe(r)2πrdr(11)
The selectivity of the uptake of sodium into themembrane is calculated for different compositions ofthe bulk, i.e. the total salt concentration was kept con-stant and the ratio of the sodium–iron concentrationswas varied. The resulting data are shown in Fig. 8.If the iron forms bondings with the surface chargedgroups, then it is important that the amount of sorpediron cations is minimized in relation to the sorptionof sodium. As can be seen in Fig. 8 a low externalratio of the sodium–iron concentrations causes a rel-atively large extent of trivalent ion bonding. In Fig. 8it is also shown that the selectivity is almost constantfor a sodium–iron ratio of 12,000 or larger. In practicethe ratio is about 300 times this maximum, as can bederived from Table 1. This means that changing thebulk concentration of iron relative to the concentra-tion of sodium for typical experimental conditions hasa proportional effect on the iron concentration in themembrane.
4. Conclusions
The results of a sorption model applicable to cal-culate the concentrations in membrane sheets with apore structure were shown. The model is called theradial uptake model. Because the model is specificallyapplied to a Nafion sulfonic layer with very smallpore sizes and the radial uptake model is based on theassumption that the continuum equations are applica-ble, the model is operated at or beyond the limits ofits fundamental validity. However, the results in thisstudy indicate that the calculated profiles with the ra-dial uptake model are realistic and similar to literatureresults (see, e.g. [1]). The membrane microstructureparameters also have been determined successfully byfitting the sorption of sodium as predicted by the radialuptake model to the sorption of sodium as predicted bythe modified Pitzer model [3]. Via the introduction ofa component dependent correction factor the sorptionof other ions could also be matched to the data as pre-dicted by the modified Pitzer model. These correctionfactors were in the order of magnitude of 0.05–10, anddependent on the concentration of sodium. The ne-cessity of the application of correction factors for theions other than sodium may have been induced by theassumption of (a) continuum equations in the model;(b) activity coefficients equal to unity in the radialuptake model.
It was observed that due to the preferential sorptionof iron near the pore wall, the pore surface charge canbe shielded, resulting in a decrease of the selectivityof the membrane for sodium. The sodium sorptionselectivity of the membrane can be increased to amaximum for a sodium–iron system. The selectivityin practical situations has reached this maximum byfar, meaning that the iron sorption is directly propor-tional to the iron content in the external solution.
Appendix A. Hydration constants for variousspecies
Several values for the Gibbs free energy changesand hydration constants. Data are retrieved from[14–16] and used in the radial uptake model. Datafor hydroxide are assumed to have the same values aschlorine.

J.H.G. van der Stegen et al. / Journal of Membrane Science 183 (2001) 61–74 73
Ion Hard sphereradius (Å)
1vacGi at ε= εb (J mol−1)
1vacGi at ε= n2 (J mol−1)
Ai (J mol−1)
Sodium 1.05 −4.11× 10⁵ −2.87× 10⁵ 223839Hydroxide 1.81 −3.18× 10⁵ −1.67× 10⁵ 273902Chloride 1.81 −3.18× 10⁵ −1.67× 10⁵ 273902Sulfate 2.30 −7.79× 10⁵ −5.25× 10⁵ 460468Chlorate 2.45 −1.96× 10⁵ −1.23× 10⁵ 132592Potassium 1.33 −3.37× 10⁵ −2.27× 10⁵ 198862Iron 0.76 −1.89× 10⁵ −1.59× 10⁵ 542723Magnesium 0.82 −1.90× 10⁵ −1.47× 10⁵ 771275Aluminum 0.50 −5.49× 10⁵ −5.43× 10⁵ 919220Calcium 0.99 −1.59× 10⁵ −1.22× 10⁵ 663452Borate 1.52 −4.53× 10⁵ −7.94× 10⁵ 460153
A.1. Empirical water uptake functions
With the water activity of the external liquid andthe equivalent weight of the used membrane the fol-lowing empirical expression for the water uptake isdetermined on the basis of experiments by Van derStegen [18]
ew,s = 0.6455+ 0.6044γw + 0.112γ 2w − 0.935EW
+0.36EW2 − 0.44151EWγw (A.1)
in which γ w is the water activity coefficient and EWthe equivalent weight of the membrane, defined asthe reciprocal of the number of charged sites perkilogram of dry membrane. Note that in this equationwater activity coefficients are used instead of wateractivities as in [18]. The relation holds for sulfonicbased polymers. If carboxylic base polymers are usedEq. (10) changes to
ew,c = 1.045+ 0.3272γw + 0.1343γ 2w − 1.496EW
+0.55EW2 − 0.28922EWγw
References
[1] J.R. Bontha, P.N. Pintauro, Prediction of ion solvation freeenergies in a polarizable dielectric continuum, J. Phys. Chem.96 (1992) 7778–7782.
[2] J.R. Bontha, P.N. Pintauro, Water orientation and ion solvationeffects during multicomponent salt partitioning in a Nafioncation exchange membrane, Chem. Eng. Sci. 49 (1994) 3835–3851.
[3] J.H.G. Van der Stegen, A.J. van der Veen, H. Weerdenburg,J.A. Hogendoorn, G.F. Versteeg, Application of the Pitzermodel for the estimation of activity coefficients of electrolytesin ion selective membranes, Fluid Phase Equilibria 157(1999a) 181–196.
[4] T.D. Gierke, G.E. Munn, F.C. Wilson, The morphology inNafion perfluorinated membrane products as determined bywide- and small-angle X-ray studies, J. Polym. Sci. 19 (1981)1687–1704.
[5] T.D. Gierke, W.Y. Hsu, The cluster network model of ionclustering in perfluorosulfonated membranes, ACS Symp. Ser.180 (1982) 283–311.
[6] J.H.G. van der Stegen, A.J. van der Veen, H. Weerdenburg,J.A. Hogendoorn, G.F. Versteeg, Application of the Maxwell–Stefan theory to the transport in ion-selective membranesused in the chloralkali electrolysis process, Chem. Eng. Sci.54 (1999b) 2501–2511.
[7] J.H.G. van der Stegen, A.J. van der Veen, H. Weerdenburg,J.A. Hogendoorn, G.F. Versteeg, Application of the Maxwell–Stefan theory to the membrane electrolysis process: modeldevelopment and simulations, 2000, submitted for publication.
[8] E.H. Cwirko, R.G. Carbonell, Interpretation of transportcoefficients in Nafion using a parallel pore model, J. Membr.Sci. 67 (1992) 227–247.
[9] W.H. Koh, H.P. Silverman, Anion transport in thin-channelcation exchange membranes, J. Membr. Sci. 13 (1982) 279–290.
[10] M.W. Verbrugge, P.N. Pintauro, Transport models forion-exchange membranes, Mod. Asp. Electr. (1989) 1–67.
[11] P.N. Pintauro, Y. Yang, Structure/function modeling: a rationalapproach to ion-exchange membrane design, 1996, submittedfor publication.
[12] A. Guzman-Garcia, P.N. Pintauro, M.W. Verbrugge, R.F.Hill, Development of a space charge transport model for ionexchange membranes, AIChE J. 36 (1990) 1061–1074.
[13] J.S. Newman, Electrochemical Systems, Prentice-Hall,Englewoods Cliffs, NJ, 1963.
74 J.H.G. van der Stegen et al. / Journal of Membrane Science 183 (2001) 61–74
[14] M.H. Abraham, J. Lisli, Calculations on ionic solvation: part1. Free energies of solvation of gaseous univalent ions usinga one-layer continuum model, Chem. Soc. Faraday Trans. 74(1978) 1604–1614.
[15] R.M. Noyes, Thermodynamics of ion hydration as a measureof effective dielectric properties of water, J. Am. Chem. Soc.84 (1962) 513–522.
[16] R.M. Noyes, Assignment of individual ionic contributions toproperties of aqueous ions, J. Am. Chem. Soc. 86 (1964)971–979.
[17] Y. Gur, I. Ravina, A.J. Babchin, On the electric double-layertheory II. The Poisson–Boltzmann equation including
hydration forces, J. Coll. Interface Sci. 64 (1978) 333–341.
[18] J.H.G. van der Stegen, Internal Akzo–Nobel report No.89.00.440, 1989.
[19] J.A. Nelder, R. Mead, Comp. J. 7 (1965) 308.[20] W.H. Press, B.P. Flannery, S.A. Teukolsky, W.T. Vetterling,
Numerical Recipes in Pascal — The Art of ScientificComputing, Cambridge University Press, Cambridge, 1994.
[21] J.J. Hoetjer, Samenbundeling van 4 notities t.b.v. centraalarchief en TACA van enige experimenten 136, 158, 159 en160 aan het ACF 2202 membraan, Report 95.80.051, AkzoNobel, 1995.