university of groningen nature and nurture effects of
TRANSCRIPT

University of Groningen
Nature and nurture effects of voluntary activity and nutrition on energy balance and nutritionJónás, Izabella
IMPORTANT NOTE: You are advised to consult the publisher's version (publisher's PDF) if you wish to cite fromit. Please check the document version below.
Document VersionPublisher's PDF, also known as Version of record
Publication date:2009
Link to publication in University of Groningen/UMCG research database
Citation for published version (APA):Jónás, I. (2009). Nature and nurture effects of voluntary activity and nutrition on energy balance andnutrition: A study in mice. [s.n.].
CopyrightOther than for strictly personal use, it is not permitted to download or to forward/distribute the text or part of it without the consent of theauthor(s) and/or copyright holder(s), unless the work is under an open content license (like Creative Commons).
The publication may also be distributed here under the terms of Article 25fa of the Dutch Copyright Act, indicated by the “Taverne” license.More information can be found on the University of Groningen website: https://www.rug.nl/library/open-access/self-archiving-pure/taverne-amendment.
Take-down policyIf you believe that this document breaches copyright please contact us providing details, and we will remove access to the work immediatelyand investigate your claim.
Downloaded from the University of Groningen/UMCG research database (Pure): http://www.rug.nl/research/portal. For technical reasons thenumber of authors shown on this cover page is limited to 10 maximum.
Download date: 28-10-2021

Izabella Jónás
Nature and nurture effects of voluntary activity and
nutrition on energy balance and emotionality; a study in mice

Lay-out and cover design: F. Xavier Trias & Izabella Jónás

RIJKSUNIVERSITEIT GRONINGEN
Nature and nurture effects of voluntary activity and
nutrition on energy balance and emotionality; a study in mice
Proefschrift
ter verkrijging van het doctoraat in de Wiskunde en Natuurwetenschappen aan de Rijksuniversiteit Groningen
op gezag van de Rector Magnificus, dr. F. Zwarts, in het openbaar te verdedigen op maandag 21 december 2009
om 14.45 uur
door
Izabella Jónás
geboren op 23 juli 1981 te Budapest, Hongarije

Promotores: Prof. dr. G. van Dijk Prof. dr. C. Nyakas Beoordelingscommissie: Prof. dr. M. Hofker Prof. dr. E.A. van der Zee Prof. dr. S. Verhulst

Chapter 1: General Introduction Chapter 2: Personality traits are affected by selective breeding for increased wheel-running behavior in mice Chapter 3: Effects of selective breeding for increased wheel running behavior on circadian timing of substrate oxidation and ingestive behavior Chapter 4: Effect of diet on the energetic and behavioural characteristics of mouse lines selected for high activity Chapter 5: Mice selectively bred for high wheel running activity have increased growth efficiency during lactation Chapter 6: Mice selectively bred for high voluntary running are resistant to perinatal programming of weight gain by a high fat diet Chapter 7: Postnatal versus prenatal effects on offspring energy balance regulation in control mice and mice selectively bred for high voluntary wheel running Chapter 8: General Discussion: Effects of “nature” and “nurture” in voluntary activity and nutrition on energy balance and emotionality Nederlandse Samenvatting – Dutch Summary Magyar Összefoglalás – Hungarian Summary Acknowledgements
5
17
33
49
67
87
105
141
155
163
169
Table of contents


11
CCHH
AAPPTTEE
RR
GENERAL INTRODUCTION

Chapter 1
6
Most animal species can move across the environment. This is usually brought about by
muscular activity at the expense of metabolic fuels, and is general referred to as “physical
activity”. The level of physical activity can vary tremendously between animal species and even
between animals belonging to the same species. This may, for example, depend on the
environmental challenges which animals sometimes face, or the goals that animals have set out to
achieve (e.g. for certain needs or rewards). Besides the level of planned or goal-oriented physical
activity, the level of unplanned or “voluntary” activity can also differ largely between individuals.
In human beings, for example, this may be related to the degree of fidgeting, non-specific
ambulation, or other spontaneous every-day-life behavior (Levine et al. 2005; Ravussin 2005).
Within individuals, levels of planned and unplanned behavior can be inversely related over some
time, for example, when periodical heavy exercise is interspaced by increased resting and
recovery. Besides this interdependency, it is clear that some individuals are more active than
others under any condition. Evidence exists that the display of increased physical activity is a
complex trait composed of several subordinate traits (John G. Swallow and Theodore Garland Jr
2005). These subordinate traits may be represented by several aspects of neurobiology,
physiology, morphology, and performance, and is probably regulated by numerous genes
(Garland, Jr. and Kelly 2006; Lightfoot et al. 2008; Simonen et al. 2003; Benjamin et al. 2002). In
nature, the array of subordinate traits may have evolved because the cumulated trait of increased
physical activity had advantageous effects on animal fitness under certain environmental
conditions (Garland, Jr. and Kelly 2006). A major aim of the current thesis is to investigate
differences in the subordinate traits in mice which display high and normal physical activity. A
second major aim was to investigate whether and how mice with these presumed differences in
subordinate traits are resistant to metabolic derangements when provided with “Western-type”
unhealthy diets. This issue is extremely relevant in light of the consensus that obesity and
associated metabolic derangements are the result of ingesting an unhealthy diet consisting of too
much saturated fat and unrefined sugars combined with a sedentary life-style (Phelan 2009;
Manfredini et al. 2009; Blair and Morris 2009).
1. Complex diseases
According to evolutionary biologists, the human genome was inherited from the paleolithic time
when human life was programmed for daily physical activity and ingestion of a high-fibered diet
(Eaton and Eaton, III 2000). Since then, our genome changed little, but environmental factors
transformed to a large extent into the one that we are living today (i.e., lower physical activity,
changes in dietary patterns but also other factors like psychosocial stress, smoking, alcohol
consumption and hazardous environmental compounds). At the basis of this theory is the thrifty

General introduction
7
genotype hypothesis which explains that genetic factors only predispose individuals to diseases
but environmental factors determine phenotypic expression whether the disease becomes
manifest (Neel 1999). Perhaps one of the most important factors is the increase in sedentary
lifestyle, mostly caused by prolonged sitting (Rosenberg et al. 2008) Levine and colleagues found
that this is associated with a reduction in non-exercise activity thermogenesis (NEAT), and might
propel weight gain in a situation of overfeeding (Levine et al. 2005; Ravussin 2005). This global
trend is likely to continue, given the increasing availability of personal computers, TV and
transportation trends (Robinson et al. 2003; Sturm 2004). One of its detrimental effects is the loss
of activity of large skeletal muscles which are known to utilize a large amount of bodily fuels
(Hamilton, Hamilton, and Zderic 2007). Moreover, changes in the world food economy
increased consumption of energy-dense diets high in saturated fat and high in refined
carbohydrates and together with a sedentary lifestyle this obviously favors weight gain.
Particularly, visceral obesity is a strong risk factor in attracting cardiometabolic disturbances such
as hypertension, hypertrigliceridemia, arteriosclerosis, hyperglycemia and hyperinsulinemia
(collectively called “the metabolic syndrome”) that all predispose to the development of type 2
diabetes and cardiovascular diseases (Despres et al. 2008). It has been suggested that an
insufficient increase in the storage capacity of white adipose tissue leading to overflow of fats in
metabolic tissues and organs is responsible for the occurrence of above-mentioned diseases
(Frayn 2005). Consuming a diet rich in saturated fat and/or refined sugars calls forth an excess in
body fat. This further leads to elevated insulin and leptin levels, and usually is accompanied by
insulin- and leptin resistance (two of the hallmark in obesity, type-2 diabetes and metabolic
syndrome) in the periphery and the central nervous system. A protective factor that is down-
regulated in the state of progression towards cardiometabolic disease is adiponectin (Arita et al.
1999), an adipose tissue secreted product, and its low levels are correlated with visceral obesity
(Okamoto et al. 2006) and insulin resistance (Weyer et al. 2001).
2. Possible mechanism through which physical activity can help in the
treatment of complex diseases
Evidence over the past decades, including epidemiological, prospective- and intervention studies
has documented that physical activity, combined activity and diet interventions can relieve
progression of chronic diseases or even reverse existing diseases (Donnelly et al. 2009). The
degree of physical activity is positively related to improvement of cardiometabolic functions
(training effect), while physical inactivity causes degeneration in many bodily functions. In the
cardiovascular system, physical activity causes an increase in oxygen consumption and blood flow
to meet the increased energy demands of muscular work. On the long term, physical activity
increases cardiac volume, decreases heart rate and blood pressure through the mechanism of

Chapter 1
8
influencing the flexibility and elasticity of blood vessels. In contrast, when these functions start to
decline, cardiovascular diseases could take place, which mostly track the degree of obesity
(Richardson et al. 2000). Furthermore, the increased oxygen consumption may cause a shift in
substrate utilization from carbohydrates to fat oxidation, which has been highlighted to give
protection against obesity and diabetes type 2 (Metz et al. 2005; Wasserman and Vranic 1986). In
the same time, changes occur in the musculoskeletal system shifting muscle fiber type from fast
to slow twitches which has also been shown to provide protection against obesity and type 2
diabetes (Tanner et al. 2002). Moreover, the increased aerobic metabolism, increasing plasma
clearance of glucose, free fatty acids, triglycerides and sensitivity to insulin and leptin provides
protection against obesity (Goodpaster and Kelley 2002). The nervous system is also stimulated
since physical activity increases the numbers and intensities of connections between neurons
increasing memory and learning (Dishman et al. 2006; Rhodes et al. 2003) which all provide
protection against neurological disorders that has also been associated with the development of
diabetes type 2 and obesity (Ristow 2004).
3. Animal studies
Numerous animal studies have focused on energy balance regulation under conditions of feeding
diets differing in fat/sugar content, but much less attention has been paid to the role of physical
activity. Although one can study individual difference in the display of physical activity in animals
of outbred populations or in inbred strains which display large variations in it, we took the
advantage of mouse lines that were selectively bred for high and normal running wheel behavior.
Selective breeding uses a largely heterogeneous animal population from which lines of animals are
then selectively inbred for a given character or trait of interest. Each generation of inbreeding
increases the probability of attaining homozygosity at specific genetic loci resulting in a clear
divergence in the phenotypic expression of the given trait (Britton and Koch 2001). Through this
technique, Garland and colleagues have made selection lines of mice for high running wheel
activity in four replicate lines, and four control bred lines which were not selected, in order to
ascertain that observed differences are attributed to the effects of selection rather than random
genetic drift (Swallow, Carter, and Garland, Jr. 1998b; T.Garland 2003). Animals selectively bred
for the trait of high voluntary wheel running activity ran 2.7 times more than mice from the
randomly bred control lines already in generation 16, and this difference was sustained
throughout the following generations (T.Garland 2003). In addition, they ran with higher
velocities (Swallow, Carter, and Garland, Jr. 1998a) and more intermittently in shorter bouts
(Girard et al. 2001). The running-wheel selected mice were also more active in their homecages
when deprived from wheels (Rhodes et al. 2001) relative to controls. In this thesis, I used two of
the replicate lines selectively bred for high wheel running activity (lab designated line 7 and line 8)
that showed the most phenotypic characteristics and one of their randomly bred control lines

General introduction
9
(line 2). Animals were obtained from generation 31 in chapter 3, generation 49 in chapter 2,5,6,7
and generation 52 in chapter 4.
Artificial selection is thus a tool to investigate in the laboratory line differences in a
specific characteristic which originated from certain individuals in the population (Landgraf and
Wigger 2002). As expected, differences in the trait of running wheel activity results in alterations
of subordinate traits, as has mentioned in previous studies revealing several specific differences in
physiology and morphology between selected and control lines differing in the level of wheel
running activity. Active lines have smaller body masses, lower body fat percentage, increased food
intake, low plasma levels of leptin and elevated plasma levels of adiponectin (Vaanholt et al. 2008;
Vaanholt et al. 2007) relative to control lines, and the differences become particularly striking
when they are subjected to a high fat diet (Vaanholt et al. 2008). Furthermore, their hind limb
muscles have reduced mass, have an increase in oxidative fibers, in mitochondrial enzyme
activity, in mass-specific capillarization, in glycogen storage and in muscle glucose transporter
(GLUT-4) number (Gomes et al. 2009; Wong et al. 2009; Guderley et al. 2008). These
physiological/morphological changes may be viewed as “adaptive” to sustain high physical
activity levels.
The occurrence of trait-differences may appear not only in physiology and morphology,
but may also be expressed in emotionality/personality (Heinrichs and Domes 2008; Wolf et al.
2007). In general, animals can cope actively in psychological stressful situations with low
emotional reactivity characterized by impulsiveness, or they cope passively with high emotional
reactivity characterized by anxiety. These two emotional and behavioral characteristics have been
shown to be associated with specific neuroendocrine and physiological profiles (Steimer, la Fleur,
and Schulz 1997). The inter-individual differences in these profiles and emotional behaviors in
any animal and human population could be critical in regard of adaptive responses and capacity
to challenging situations and also in resistance or susceptibility to certain stress-related
pathologies (McEwen and Stellar 1993). Furthermore, this could depend on the type of diet
which is eaten. For example, a palatable high fat/high sugar diet is known to have “psychological
stress”-relieving properties compared to the situation when a healthy, but less palatable diet is
eaten (la Fleur et al. 2007; van Dijk and Buwalda 2008). In turn, the expression of these
psychological stress relieving actions of certain diets might depend on the subordinate traits for
emotionality/personality which animals occupy. In the present thesis, differences in these
emotionality/personality styles were studied in addition to the physiological/metabolic profiles in
order to better understand and characterize mice with high activity levels versus those with
normal activity levels.

Chapter 1
10
4. Early life experience
Not only adult life-style factors, but nutritional factors during the perinatal stage could predispose
an individual towards obesity and other associated diseases such as type 2 diabetes, metabolic
syndrome (Levin 2006; Parente, Aguila, and Mandarim-de-Lacerda 2008). This could particularly
occur when the availability of energy dense foods are high during perinatal stage, resulting a
programming effect on neuroendocrine system and hypothalamic feeding circuits later in life.
These are stated in the theory of “Developmental Origins of Adult Disease” or “developmental
programming” and in the “thrifty phenotype” hypothesis (Hales and Barker 2001; Barker 2004).
This can be studied in laboratory animals either by changing the quantity of energy availability to
offspring with altering litter size or by changing the quality of maternal diet through supplying
pregnant and lactating mothers with a high energy dense diet, rich in saturated fats and sugars
(Plagemann 2005; Plagemann 2005; Armitage, Taylor, and Poston 2005). In both ways,
susceptibility to metabolic diseases can be affected in adult offspring due to early programming.
Since the perinatal environment is a strong determining factor in the development of
offspring energy balance and behavior later in life, a third major aim of the current thesis was to
investigate the influence of the perinatal environment on development of the trait of high
physical activity. For this reason, pregnant mice from control and selection lines were submitted
to a healthy fibered low-fat diet, or to a “western type” high fat diet. Furthermore, the relevance
of the post-natal period was investigated by cross-fostered pups between mothers from control
and active lines to follow up their energy homeostasis and behavior later in life. The procedure of
“cross-fostering” needs to be performed right after birth when the biological offspring is
removed from their mother and placed with a surrogate mother (McGowan, Meaney, and Szyf
2008). In general, cross-fostering is used to study the impact of the postnatal environment on
gene expression as well as on behavioral patterns. When cross-fostered offspring show similar
traits as their biological parents but different than their foster parents, the trait is considered to
have a mixed genetic and prenatal basis. Contrary, when the offspring develops a trait different
than their biological parents and similar to their foster parents, the environmental factors are
considered to be dominant. However, in most of the cases, there is a blend of the two, which
shows both genetic and environmental influences at play.
5. Aim and outline of this thesis
Since selective breeding for a complex trait causes several associated physiological, morphological
and psychological changes, it may also be regarded as an appropriate tool to study complex
diseases. With respect to obesity and the associated metabolic syndrome, the trait of high

General introduction
11
physical activity clearly causes resistance to these phenomena. The use of mice selectively bred
for increased physical activity can therefore facilitate a better understanding of aetiology and
prevention of obesity and associated metabolic derangements at adulthood, as well as during
perinatal development.
Chapter 2 is aimed at studying behavioral consequences of selective breeding for high
voluntary wheel running activity for anxiety, exploration and learning. Circadian patterns of
energy balance-related factors such as food intake, carbohydrate-, fat oxidation, energy
expenditure and also running wheel activity were studied in relation to food preference in
presence of normal or 60% high fat diet feeding in chapter 3. Chapter 4 is aimed to study
effects of high fat-high sugar diet feeding on energy balance, stress related behavior and
corticosterone levels. Chapter 5 focuses more on perinatal implications, where perinatal effects
of high fat-high sugar diet feeding is described on maternal energy regulation and litter
characteristics in relation litter size at pre-weaning stage. Chapter 6 presents the consequences of
the perinatal high-fat-high sugar diet feeding on the offspring energy balance later in life. The last
experimental chapter (chapter 7) is aimed to study effects of litter size equalization to 10
pups/litter and effects of cross-fostering on maternal energy regulation and offspring energy
balance at pre- and post-weaning periods. Finally, general conclusions and implications of the
results presented in this thesis are discussed in chapter 8.
References
Arita, Y., S. Kihara, N. Ouchi, M. Takahashi, K. Maeda, J. Miyagawa, K. Hotta, I. Shimomura, T. Nakamura,
K. Miyaoka, H. Kuriyama, M. Nishida, S. Yamashita, K. Okubo, K. Matsubara, M. Muraguchi, Y.
Ohmoto, T. Funahashi, and Y. Matsuzawa. 1999. Paradoxical decrease of an adipose-specific protein,
adiponectin, in obesity. Biochem. Biophys. Res. Commun. 257:79-83.
Armitage, J. A., P. D. Taylor, and L. Poston. 2005. Experimental models of developmental programming:
consequences of exposure to an energy rich diet during development. J. Physiol 565:3-8.
Barker, D. J. 2004. The developmental origins of adult disease. J. Am. Coll. Nutr. 23:588S-595S.
Benjamin, J., R. P. Ebstein and R. H. Belmaker. 2002. Molecular Genetics and the Human Personality.
American Psychiatric Publishing, Inc., Washington, D.C.
Blair, S. N. and J. N. Morris. 2009. Healthy hearts--and the universal benefits of being physically active:
physical activity and health. Ann. Epidemiol. 19:253-256.
Britton, S. L. and L. G. Koch. 2001. Animal genetic models for complex traits of physical capacity. Exerc.
Sport Sci. Rev. 29:7-14.

Chapter 1
12
Despres, J. P., I. Lemieux, J. Bergeron, P. Pibarot, P. Mathieu, E. Larose, J. Rodes-Cabau, O. F. Bertrand,
and P. Poirier. 2008. Abdominal obesity and the metabolic syndrome: contribution to global
cardiometabolic risk. Arterioscler. Thromb. Vasc. Biol. 28:1039-1049.
Dishman, R. K., H. R. Berthoud, F. W. Booth, C. W. Cotman, V. R. Edgerton, M. R. Fleshner, S. C.
Gandevia, F. Gomez-Pinilla, B. N. Greenwood, C. H. Hillman, A. F. Kramer, B. E. Levin, T. H.
Moran, A. A. Russo-Neustadt, J. D. Salamone, J. D. Van Hoomissen, C. E. Wade, D. A. York, and
M. J. Zigmond. 2006. Neurobiology of exercise. Obesity. (Silver. Spring) 14:345-356.
Donnelly, J. E., S. N. Blair, J. M. Jakicic, M. M. Manore, J. W. Rankin, and B. K. Smith. 2009. American
College of Sports Medicine Position Stand. Appropriate physical activity intervention strategies for
weight loss and prevention of weight regain for adults. Med. Sci. Sports Exerc. 41:459-471.
Eaton, S. B. and S. B. Eaton, III. 2000. Paleolithic vs. modern diets--selected pathophysiological
implications. Eur. J. Nutr. 39:67-70.
Frayn, K. N. 2005. Obesity and metabolic disease: is adipose tissue the culprit? Proc. Nutr. Soc. 64:7-13.
Garland, T., Jr. and S. A. Kelly. 2006. Phenotypic plasticity and experimental evolution. J. Exp. Biol.
209:2344-2361.
Girard, I., M. W. McAleer, J. S. Rhodes, and T. Garland, Jr. 2001. Selection for high voluntary wheel-running
increases speed and intermittency in house mice (Mus domesticus). J. Exp. Biol. 204:4311-4320.
Gomes, F. R., E. L. Rezende, J. L. Malisch, S. K. Lee, D. A. Rivas, S. A. Kelly, C. Lytle, B. B. Yaspelkis, III,
and T. Garland, Jr. 2009. Glycogen storage and muscle glucose transporters (GLUT-4) of mice
selectively bred for high voluntary wheel running. J. Exp. Biol. 212:238-248.
Goodpaster, B. H. and D. E. Kelley. 2002. Skeletal muscle triglyceride: marker or mediator of obesity-
induced insulin resistance in type 2 diabetes mellitus? Curr. Diab. Rep. 2:216-222.
Guderley, H., D. R. Joanisse, S. Mokas, G. M. Bilodeau, and T. Garland, Jr. 2008. Altered fibre types in
gastrocnemius muscle of high wheel-running selected mice with mini-muscle phenotypes. Comp
Biochem. Physiol B Biochem. Mol. Biol. 149:490-500.
Hales, C. N. and D. J. Barker. 2001. The thrifty phenotype hypothesis. Br. Med. Bull. 60:5-20.
Hamilton, M. T., D. G. Hamilton, and T. W. Zderic. 2007. Role of low energy expenditure and sitting in
obesity, metabolic syndrome, type 2 diabetes, and cardiovascular disease. Diabetes 56:2655-2667.
Heinrichs, M. and G. Domes. 2008. Neuropeptides and social behaviour: effects of oxytocin and
vasopressin in humans. Prog. Brain Res. 170:337-350.
John G.Swallow and Theodore Garland Jr. 2005. Selection experiments as a tool in evolutionary and
comparative physiology: Insights into complex traits - an introduction to the symphosium. Integrative
and Comparative Biology 45:387-390.
la Fleur, S. E., L. J. Vanderschuren, M. C. Luijendijk, B. M. Kloeze, B. Tiesjema, and R. A. Adan. 2007. A
reciprocal interaction between food-motivated behavior and diet-induced obesity. Int. J. Obes. (Lond)
31:1286-1294.

General introduction
13
Landgraf, R. and A. Wigger. 2002. High vs low anxiety-related behavior rats: an animal model of extremes in
trait anxiety. Behav. Genet. 32:301-314.
Levin, B. E. 2006. Metabolic imprinting: critical impact of the perinatal environment on the regulation of
energy homeostasis. Philos. Trans. R. Soc. Lond B Biol. Sci. 361:1107-1121.
Levine, J. A., L. M. Lanningham-Foster, S. K. McCrady, A. C. Krizan, L. R. Olson, P. H. Kane, M. D.
Jensen, and M. M. Clark. 2005. Interindividual variation in posture allocation: possible role in human
obesity. Science 307:584-586.
Lightfoot, J. T., M. J. Turner, D. Pomp, S. R. Kleeberger, and L. J. Leamy. 2008. Quantitative trait loci for
physical activity traits in mice. Physiol Genomics 32:401-408.
Manfredini, F., S. D'Addato, L. Laghi, A. M. Malagoni, S. Mandini, B. Boari, C. Borghi, and R. Manfredini.
2009. Influence of lifestyle measures on hypertriglyceridaemia. Curr. Drug Targets. 10:344-355.
McEwen, B. S. and E. Stellar. 1993. Stress and the individual. Mechanisms leading to disease. Arch. Intern.
Med. 153:2093-2101.
McGowan, P. O., M. J. Meaney, and M. Szyf. 2008. Diet and the epigenetic (re)programming of phenotypic
differences in behavior. Brain Res. 1237:12-24.
Metz, L., P. Sirvent, G. Py, J. F. Brun, C. Fedou, E. Raynaud, and J. Mercier. 2005. Relationship between
blood lactate concentration and substrate utilization during exercise in type 2 diabetic postmenopausal
women. Metabolism 54:1102-1107.
Neel, J. V. 1999. The "thrifty genotype" in 1998. Nutr. Rev. 57:S2-S9.
Okamoto, Y., S. Kihara, T. Funahashi, Y. Matsuzawa, and P. Libby. 2006. Adiponectin: a key adipocytokine
in metabolic syndrome. Clin. Sci. (Lond) 110:267-278.
Parente, L. B., M. B. Aguila, and C. A. Mandarim-de-Lacerda. 2008. Deleterious effects of high-fat diet on
perinatal and postweaning periods in adult rat offspring. Clin. Nutr. 27:623-634.
Phelan, S. T. 2009. Obesity in minority women: calories, commerce, and culture. Obstet. Gynecol. Clin.
North Am. 36:379-92, x.
Plagemann, A. 2005. Perinatal programming and functional teratogenesis: impact on body weight regulation
and obesity. Physiol Behav. 86:661-668.
Ravussin, E. 2005. Physiology. A NEAT way to control weight? Science 307:530-531.
Rhodes, J. S., G. R. Hosack, I. Girard, A. E. Kelley, G. S. Mitchell, and T. Garland, Jr. 2001. Differential
sensitivity to acute administration of cocaine, GBR 12909, and fluoxetine in mice selectively bred for
hyperactive wheel-running behavior. Psychopharmacology (Berl) 158:120-131.
Rhodes, J. S., H. van Praag, S. Jeffrey, I. Girard, G. S. Mitchell, T. Garland, Jr., and F. H. Gage. 2003.
Exercise increases hippocampal neurogenesis to high levels but does not improve spatial learning in
mice bred for increased voluntary wheel running. Behav. Neurosci. 117:1006-1016.
Richardson, R. S., C. A. Harms, B. Grassi, and R. T. Hepple. 2000. Skeletal muscle: master or slave of the
cardiovascular system? Med. Sci. Sports Exerc. 32:89-93.

Chapter 1
14
Ristow, M. 2004. Neurodegenerative disorders associated with diabetes mellitus. J. Mol. Med. 82:510-529.
Robinson, T. N., J. D. Killen, H. C. Kraemer, D. M. Wilson, D. M. Matheson, W. L. Haskell, L. A. Pruitt, T.
M. Powell, A. S. Owens, N. S. Thompson, N. M. Flint-Moore, G. J. Davis, K. A. Emig, R. T. Brown,
J. Rochon, S. Green, and A. Varady. 2003. Dance and reducing television viewing to prevent weight
gain in African-American girls: the Stanford GEMS pilot study. Ethn. Dis. 13:S65-S77.
Rosenberg, D. E., F. C. Bull, A. L. Marshall, J. F. Sallis, and A. E. Bauman. 2008. Assessment of sedentary
behavior with the International Physical Activity Questionnaire. J. Phys. Act. Health 5 Suppl 1:S30-
S44.
Simonen, R. L., T. Rankinen, L. Perusse, T. Rice, D. C. Rao, Y. Chagnon, and C. Bouchard. 2003. Genome-
wide linkage scan for physical activity levels in the Quebec Family study. Med. Sci. Sports Exerc.
35:1355-1359.
Steimer, T., S. la Fleur, and P. E. Schulz. 1997. Neuroendocrine correlates of emotional reactivity and coping
in male rats from the Roman high (RHA/Verh)- and low (RLA/Verh)-avoidance lines. Behav. Genet.
27:503-512.
Sturm, R. 2004. The economics of physical activity: societal trends and rationales for interventions. Am. J.
Prev. Med. 27:126-135.
Swallow, J. G., P. A. Carter, and T. Garland, Jr. 1998b. Artificial selection for increased wheel-running
behavior in house mice. Behav. Genet. 28:227-237.
Swallow, J. G., P. A. Carter, and T. Garland, Jr. 1998a. Artificial selection for increased wheel-running
behavior in house mice. Behav. Genet. 28:227-237.
T.Garland, Jr. 2003. Selection experiments: an under-utilized tool in biomechanics and organismal biology.
In: J.-P. G. a. A. C. V.L.Bels (Ed.) Vertebrate Biomechanics and Evolution. pp. 23-56. BIOS Scientific
Publishers, Oxford, U.K.
Tanner, C. J., H. A. Barakat, G. L. Dohm, W. J. Pories, K. G. MacDonald, P. R. Cunningham, M. S.
Swanson, and J. A. Houmard. 2002. Muscle fiber type is associated with obesity and weight loss. Am.
J. Physiol Endocrinol. Metab 282:E1191-E1196.
Vaanholt, L. M., I. Jonas, M. Doornbos, K. A. Schubert, C. Nyakas, T. Garland, Jr., G. H. Visser, and D. G.
van. 2008. Metabolic and behavioral responses to high-fat feeding in mice selectively bred for high
wheel-running activity. Int. J. Obes. (Lond) 32:1566-1575.
Vaanholt, L. M., P. Meerlo, T. Garland, Jr., G. H. Visser, and G. van Dijk. 2007. Plasma adiponectin is
increased in mice selectively bred for high wheel-running activity, but not by wheel running per se.
Horm. Metab Res. 39:377-383.
van Dijk, G. and B. Buwalda. 2008. Neurobiology of the metabolic syndrome: an allostatic perspective. Eur.
J. Pharmacol. 585:137-146.
Wasserman, D. H. and M. Vranic. 1986. Interaction between insulin and counterregulatory hormones in
control of substrate utilization in health and diabetes during exercise. Diabetes Metab Rev. 1:359-384.

General introduction
15
Weyer, C., T. Funahashi, S. Tanaka, K. Hotta, Y. Matsuzawa, R. E. Pratley, and P. A. Tataranni. 2001.
Hypoadiponectinemia in obesity and type 2 diabetes: close association with insulin resistance and
hyperinsulinemia. J. Clin. Endocrinol. Metab 86:1930-1935.
Wolf, M., G. S. van Doorn, O. Leimar, and F. J. Weissing. 2007. Life-history trade-offs favour the evolution
of animal personalities. Nature 447:581-584.
Wong, L. E., T. Garland, Jr., S. L. Rowan, and R. T. Hepple. 2009. Anatomic capillarization is elevated in the
medial gastrocnemius muscle of mighty mini mice. J. Appl. Physiol 106:1660-1667.


22
CCHHAAPPTTEERR
PERSONALITY TRAITS ARE AFFECTED BY SELECTIVE BREEDING
FOR INCREASED WHEEL-RUNNING BEHAVIOR IN MICE
I. Jónás, K. A. Schubert, F. Reijne, J.Scholte, T. Garland, Jr, M. P. Gerkema, A.
J. W. Scheurink, C. Nyakas and G. van Dijk
Summary
Voluntary physical activity may be related to personality traits. Here, we investigated these
relationships in two mouse lines selectively bred for high voluntary wheel-running behavior and
in one non-selected control line. Selection lines were more explorative and “information
gathering” in the open-field test, either with increased upright positions or horizontal locomotion
toward the middle ring. Furthermore, one of the selection lines had an increased risk-taking
behavior relative to the control line in approaching a novel object placed in the center of the
open field. However, anxiety behavior was increased in selection lines during the plus-maze test.
Maze learning was not statistically different among lines, but routine behavior was increased in
both selection lines when the maze exit after two days of testing was displaced. Specifically, in
the displaced maze, selected mice traveled more frequently to the old, habituated exit, bypassing
the new exit attached to their home cage. The increased routine and exploratory behavior may be
adaptive to sustain high activity levels.

Chapter 2
18
1. Introduction
Much attention has been paid to the mechanisms by which physical activity helps to avoid or
ameliorate obesity and associated metabolic derangements (Brock, King et al. 2005;Hayes &
Kriska 2008;Levin & Dunn-Meynell 2004;Patterson & Levin 2008). In addition, evidence is
increasing that physical activity improves mental health (Dey 1994;Dietrich & McDaniel
2004;Hillman, Erickson et al. 2008). For example, frequent daily performance of exercise, such as
endurance running, is able to reduce levels of anxiety and depression (Antunes, Stella et al.
2005;Kligman & Pepin 1992), and to augment learning capability in human beings (Hillman,
Erickson et al. 2008). Homologous beneficial effects of physical activity have been demonstrated
in rodents on energy balance regulation (Bi, Scott et al. 2005;Bell, Spencer et al. 1995), but also on
emotionality, stress coping, and learning (Greenwood, Strong et al. 2007;Pietropaolo, Sun et al.
2008;van Praag, Christie et al. 1999;Rhodes, Van et al. 2003).
In a meta-analysis of Rhodes and Smith, it was found that the amount of voluntary or
spontaneous physical activity in humans was positively related to such major personality traits as
increased extraversion and conscientiousness, and negatively to neuroticism (Rhodes & Smith
2006). A venue not thoroughly explored is the possibility that the display of voluntary physical
activity and certain personality traits have common neurobiological or endocrine mechanisms.
One approach to investigate whether and how personality traits are associated with the level of
spontaneous physical activity is to study these in mice from lines that have been selectively bred
for high voluntary wheel-running behavior (Swallow, Carter et al. 1998;Garland, Jr. 2001) and
compare these to non-selected control mice. If certain personality traits are related to voluntary
physical activity, then one might hypothesize that the expression of these personality traits is
amplified or diminished in mouse lines selected for high voluntary physical activity.
After selective breeding for 16 generations, the four replicate activity-selected lines of
mice ran approximately 2.7 times more revolutions in their running wheels per day compared to
four non-selected control lines (Swallow, Carter et al. 1998), mainly by running at higher speeds
rather than for more time per day. They also ran more intermittently, with shorter and more-
frequent bouts (Koteja, Garland, Jr. et al. 1999;Girard, McAleer et al. 2001). After locking the
wheels, the high-runners spent more time climbing the locked wheels, apparently trying to run
(Koteja, Garland, Jr. et al. 1999). When housed in cages without wheels, high-runner mice
exhibited elevated home-cage activity (Rhodes, Hosack et al. 2001;Malisch, Breuner et al.
2008;Rhodes, Hosack et al. 2001).
Despite a large difference in the level of chronic wheel running between selected and
control mice, Rhodes et al. only found increased learning capabilities (following chronic wheel
access), in the control lines (Rhodes, Van et al. 2003), and this despite differences in hippocampal
neurogenesis. Furthermore, Bronikowski et al. did not observe differences in exploratory
behavior between selected and control lines in a standard open-field test (Bronikowski, Carter et
al. 2001). Although these data could be interpreted as evidence against a “personality traits

Personality of physically active mice
19
hypothesis of voluntary behavioral arousal”, they did, however, find that selected mice displayed
fewer turns in their travel paths, which could be indicative of increased motivated behavior in
these animals. Finally, selected and control mice differ with respect to stress coping behavior,
with the latter showing more behavioral despair during forced swimming (Malisch, Breuner et al.
2009), and less predatory aggression towards crickets (Gammie, Hasen et al. 2003).
In the present study, we re-evaluated the hypothesis that mice selectively bred for high
voluntary wheel running activity have certain personality traits that differ from controls. We
tested this hypothesis by analysing a broad spectrum of behaviors, including those that reflect
anxiety, exploration, learning, and routine behavior in two activity-selected lines and one control
line.
2. Materials and methods
2.1. Animals
In July-August 2006, mice from generation 45 of the selection experiment for high voluntary
wheel running (Swallow et al., 1998) were shipped from The University of California (Riverside,
CA) to the University of Groningen (Haren, the Netherlands). Mice used in the present study
were offspring of these individuals. For a detailed description of the selection experiment, see
(Swallow, Carter et al. 1998). In brief, the base population was Hsd:ICR mice, an outbred stock
with relatively high levels of genetic variation. In the original selection protocol, eight lines of
mice were created (4 selected and 4 controls). From this we used male and female mice from two
selection lines (lab designations line 7 and line 8) and one control line (line 2). Thus, for
simplicity, we did not study selection lines 3 and 6, both of which exhibit the “mini-muscle”
phenotype, caused by a Mendelian recessive allele with many pleiotropic effects (Garland, Jr.,
Morgan et al. 2002;Hartmann, Garland, Jr. et al. 2008). Because we studied only two selection
lines and one control line, the generality of our results would need to be confirmed in future
studies of all eight lines in the selection experiment.
For the present study, mice were housed in same-sex groups of two or three per cage,
with ad libitum food (Standard lab chow RMH-B 2181, HopeFarms BV, Woerden, NL) and
water, at an ambient temperature of 22±1 °C, and maintained on a 12:12 light-dark cycle with
lights on (100 Lux) at 8am. Wood shavings and EnviroDry® were used as bedding material.
Weaning occurred at 21 days of age. All methods were approved by, and are in agreement with
the regulations of the Institutional Animal Use and Care Committee of the University of
Groningen. These regulations are consistent with the guidelines for the care and use of
laboratory animals as described by the U.S. National Institutes of Health.
2.2. Experimental design
After a habituation phase, two-month-old male (6-8 per line) and female mice (6-8 per line) were
subjected to an open-field test, elevated plus-maze test, and complex maze learning tests on
Chapter 2
20
different days in the order as mentioned. Each experiment was performed during the beginning
of the light phase, at a time when the general behavioral activity is rather low (Malisch, Breuner et
al. 2008), and effects may not be dampened by the noise of general behavioral arousal towards
the end the light phase or dark phase (van Dijk & Strubbe 2003). Before each behavioral test,
animals were brought in their own cage to a dimly illuminated room (10 Lux) adjacent to the
experimental room 30 min. prior to the behavioral test to reduce the level of psychological stress
associated with the transport. The light intensity in the experimental room ranged between 70
and 80 Lux. Each time before testing, the open field, plus maze, and complex maze were
rigorously cleaned with soap and water, and investigators always left the room during the test.
Behavior was recorded (Sony Handycam), and later analyzed using Eline software (dr F. Maes,
University of Groningen).
2.2.1. Open-field behavior
Explorative and spontaneous locomotor activity were observed in a circular horizontal arena. In
this arena (ø 1.0 m, height of vertical surrounding wall: 0.4 m), concentric circles were depicted at
one-third and at two-third of the arena’s diameter, dividing the surface into a center, a middle
ring and an outer ring (adapted from (Walsh & Cummins 1976)). At the beginning of each trial,
the mouse was placed in the center of the arena.
Mice were tested for 5 min, including 1 min at the end when a 1-kilogram brass weight
was introduced into the center of the open field to test the animals’ exploratory behavior for a
novel object. Behavior was recorded and the following traits were determined: percentage of
time spent in outer ring, middle ring and center, number of visits into each ring (visit frequency),
total number crossings from one ring to the next (crossing frequency), and number of rearings.
2.2.2. Elevated plus-maze
Anxiety was evaluated using the elevated plus-maze test, which is based on the aversion for open,
well-illuminated spaces (Treit, Menard et al. 1993). The elevated plus-maze consisted of two open
arms and two closed arms facing each other, 40 cm above the floor. Each arm was 29 cm long
and 5 cm wide. The closed arms had 15 cm high walls with a closed top. At the beginning of
each trial, the mouse was placed on the central area (5 x 5 cm) facing an open arm and allowed to
explore the maze for 5 min. The following traits were determined: time spent in open arms and
closed arms, time spent in central area, number of visits to open arms and closed arms, and
number of total arm entries. An arm entry was counted when the front paws were placed on the
arm.
2.2.3. Complex maze
Spatial learning performance was assessed with a complex maze that was based on the
configuration originally developed by Rabinovitch and Rosvold (Rabinovitch & Rosvold 1951),
and adapted for mice. The maze was constructed of a horizontal surface (25 x 19 cm), with

21
vertical barriers (7 cm high) arranged to form a maze (see figure 1). To prevent the mouse from
jumping out, the maze was enclosed in a transparent Plexiglas box (which allowed observation of
the mouse’s behavior).
Figure 1. The complex maze adapted from Rabinovitch and Rosvold (1951), with the entry on
the left hand side and the exit on the right.
From the habituation room, a mouse inside its home cage was brought into the
experimental room, and the cage was connected via a Plexiglas tube (ø 5 cm, length 17 cm) to the
maze entry (left hand side in figure 1). After the mouse entered the tube towards the maze, a
sliding door inside the tube was closed, and the home cage was disconnected and reattached to
the exit tube on the opposite corner at the right hand side of the maze (see figure 1). Then the
investigator left the room, and followed the mouse’s behavior via a monitor outside the
experimental room. Once the mouse found its home cage again, the investigator entered the
room and returned the mouse, inside its cage, to the adjacent room. On the day prior to the test,
mice were once allowed to explore the maze. On two successive experimental days, mice were
subjected to the maze four times a day with sessions 30 min apart. In all trials, the latency of
reaching the exit and the number of errors were scored. On the third day, mice were once tested
in the maze, but with the entrance and exit laterally inverted (figure 2b). It was assessed whether
and how long it took for the mice to reach the “new” displaced exit, and whether they exited the
maze directly through the “new” exit, or searched the corner of the old exit first.
2.3. Statistical analysis
Data for open-field and elevated plus maze were analysed with GLM models in SPSS (version
12). Line and sex were added as fixed factors. Further individual comparisons were performed
using Tukey’s post-hoc tests. In the complex maze analysis, the GLM models for repeated
measures were applied. When the entrance and exit of the maze were inverted laterally on the
third day, data were further analyzed by two-tailed t-tests and Chi-squared test for nominal data.
In the latter, we compared the number of mice going directly to the inverted exit and the ones
that were still looking at the old position. Results are given as means ± SEM and are considered
significantly different when p<0.05.
Personality of physically active mice

Chapter 2
22
Figure 2. Configuration of the complex maze during the first two days (a), and during the last
trial on the third day (b), where the entrance and exit were laterally inverted. Note that the on the
third day the mouse bypasses the “new” displaced exit (configuration b) when searching for the
“old” exit (configuration a).
3. Results
3.1. Open field
During the first four minutes, multivariate analysis including all test variables revealed effects of
line (F(14,116)=3.89; p<0.001), but not of sex or of the interaction between line and sex.
Specifically, the percentage of time spent in different compartments was significantly influenced
by line (F(2,53)=6.20; p=0.004); post-hoc analysis revealed that line 8 mice spent significantly
more time in the middle ring than line 7 (p=0.004) and line 2 mice (p=0.05) (figure 3, top panel).
Furthermore, a line effect was also found in the number of visits in the outer (F(2,53)=4.89;
p=0.01) and middle rings (F(2,53)=5.34; p=0.008). Line 8 had a higher frequency of middle-ring
visits than line 2 (p=0.01), and line 8 had higher frequency of outer- (p=0.01) as well and middle-
ring (p=0.04) visits than line 7 (figure 2, middle panel). The number of rearings also revealed an
effect of line (F(2;53)=14.21; p<0.001); line 7 had a higher number of rearings than line 2
(p<0.001) and line 8 (p<0.001) (figure 3, lower panel).
Upon introduction of the novel object in the center of the open field (during the last
minute), multivariate analysis did not show any significant effects. However, univariate analysis
revealed effects of line on the time spent in the center ring (F(2,53)=4.87; p=0.01). Line 8 mice
spent more time in the center than line 2 (p<0.05) and line 7 mice (p=0.01). The time spent in
the outer ring tended to be influenced by line (F(2,53)=3.14; p=0.05); specifically line 8 spent
significantly less time in the outer ring than line 7 (p=0.05).
3.2. Plus-maze
Plus-maze behavior of mice from the different breeding lines is shown in figure 4. Multivariate
analysis revealed a significant effect of line (F(12,118)=4.07; p<0.001). Univariate analysis
revealed the following. Firstly, an effect of line was found in the percentage of time spent in the

23
Figure 3. Open-field behavior of mouse lines 2 (control), 7 (selectively bred for high voluntary
wheel running), and 8 (also selected) during the first 4 minutes (left panels) and during the last
minute after which a novel object was introduced in the center of the open field (right panels).
The top panels show the percentage of time the animals spent in the different areas, the middle
panels show the number of visits to the different areas, and the lower panels show the total
number of rearings. * indicate significant difference between means at p<0.05.
open arms (F(2,54)=6.12; p=0.004) and in the closed arms (F(2,54)=6.46; p=0.003). Specifically,
line 8 mice spent less time in the open arms (p=0.003) and more time in the closed arms than line
2 mice (p=0.003) (figure 3, top panel). Secondly, an effect of line was also detected in the
number of open arm entries (F(2,54)=4.25; p=0.02), closed arm entries (F(2,54)=10.57; p<0.001)
and central area entries (F(2,54)=7.23; p=0.002). Specifically, line 8 mice made fewer entries into
the open arms than line 2 (p=0.04) and line 7 mice (p=0.04); line 7 mice had higher number of
outer ring middle ring center
perc
enta
ge o
f tim
e s
pent
0
20
40
60
80
100
line 2
line 7
line 8
outer ring middle ring center
num
ber
of vis
ited r
ings
0
5
10
15
20
line 2 line 7 line 8
num
ber
of
rearin
gs
0
10
20
30
40
50
60
*
**
*
* *
outer ring middle ring center
pe
rce
nta
ge
of
tim
e s
pe
nt
0
20
40
60
80
100
line 2
line 7
line 8
outer ring middle ring center
nu
mb
er
of
vis
ite
d r
ing
s
0
2
4
6
8
10
line 2 line 7 line 8
nu
mb
er
of
rea
rin
gs
0
5
10
15
20
**
Personality of physically active mice

Chapter 2
24
entries into closed arms relative to line 2 (p<0.001) and line 8 (p=0.008) and into the central area
relative to line 2 (p=0.01) and line 8 (p=0.002). A line effect was also found in the percentage of
open-arms entries (F(2,54)=6.92; p=0.002) and the percentage of closed-arms entries
(F(2,54)=6.92; p=0.002); i.e., line 8 had smaller percentage of open arms entries than line 2
(p=0.002), and line 2 had smaller percentage of closed arms entries than line 7 (p=0.04) and line
8 (p=0.002) (figure 3, bottom panel). The total number of arm entries was also influenced by line
(F(2,54)=6.02; p=0.005); i.e., line 7 had significantly more total arm entries than line 8 (p=0.004)
and line 2 (p=0.06). Finally, a sex effect, but no interaction effect, was found in the percentage of
time spent in the open (F(1,43)=4.21; p=0.046) and closed arms (F(1,43)=6.30; p=0.015).
Specifically, females spent more time in open arms and less time in closed arms than males
(individual data for females and males not shown).
open arms closed arms centre
perc
en
tag
e o
f tim
e s
pe
nt
0
20
40
60
80
100
line2
line7
line8
**
**
open arms closed arms
perc
enta
ge
of a
rm e
ntr
ies
0
20
40
60
80
100
**
***
line 2 line 7 line 8
tota
l a
rm e
ntr
ies
0
10
20
30
40
* **
Figure 4. Plus-maze behavior of mouse lines 2 (control), 7 (selectively bred for high voluntary
wheel running), and 8 (also selected). Top panel shows the percentage of time spent in the open
arms, closed arms and in the center. Middle panel shows the percentage of arm entries into the
open and closed arms. Lower panel shows total arm entries. Asterisks indicate significant
difference between means at p<0.05 (*), and p<0.01 (**).

25
3.3. Complex maze
With GLM repeated-measures analysis, the performance of animals in all groups improved upon
training in our complex maze. Repeated task exposure resulted in a decrease of the time spent in
the maze to find the exit when observed 4 trials per day for 2 days (F(7,43)=8.59; p<0.001) (see
figure 5). A significant line effect was also found (F(2,49)=4.15, p=0.02), but no sex or line*sex
interaction was observed. Post-hoc analysis revealed that line 8 mice took significantly more time
in the maze, particularly on day two, to reach the exit than line 2 did (p=0.02).
Figure 5. Complex maze behavior of mouse lines 2 (control), 7 (selected), and 8 (selected) on
first day (left panels), and on the second day (right panels). Top panels show the duration in the
maze to find the exit, and the lower panels show the number of mistakes the mice made. *
indicate significant difference between means at p<0.05.
When the exit and entrance of the maze were displaced laterally, repeated measures
within subject analysis revealed that mice needed significantly more time to find the new and
correct exit (F(1,55)=22.53; p<0.001). Furthermore, interaction effects of time*line
(F(2,55)=3.69; p=0.03) and time*sex (F(1,55)=6.09; p=0.02), but no interaction of time*line*sex
were revealed, meaning that line 7 needed significantly more time to find the new exit, particularly
females. This is consistent with the time spent in the maze in this last trial when the maze was
1st 2nd 3rd 4th
tim
e s
pe
nt
in t
he
ma
ze
0
10
20
30
40
50
60
70
line 2
line 7
line 8
1st 2nd 3rd 4th
nu
mb
er
of
mis
takes
0
2
4
6
8
101st 2nd 3rd 4th
tim
e s
pe
nt in
th
e m
aze
0
10
20
30
40
50
60
70
line 2
line 7
line 8
1st 2nd 3rd 4th
num
ber
of
mis
take
s
0
2
4
6
8
10
* *
Personality of physically active mice

Chapter 2
26
displayed laterally, showing an effect of line (F(2,54)=4.22; p=0.02); line 7 spent significantly
more time to find the correct displaced exit relative to line 2 (p=0.02) (Figure 6, upper panel).
The number of mistakes did not differ between groups (Figure 6, middle panel). Furthermore,
logistic analysis revealed an effect of line (χ2 (2)=7.61, p<0.05), but no effect of sex or line*sex
interaction in the number of animals for which the first attempt led to the correct exit.
Specifically, line 2 animals more frequently chose the new inverted exit than line 7 (χ2 (1)=7.51,
p<0.01) and line 8 mice (χ2 (1)=7.51, p<0.01) for their first attempt.
line 2 line 7 line 8
tim
e s
pent in
the m
aze (s)
0
10
20
30
40
50
line 2 line 7 line 8
num
ber of m
ista
kes
0
2
4
6
8
10
line 2 line 7 line 8
perc
enta
ge o
f anim
als
for 1st attem
pt to
the c
orr
ect exit
0
20
40
60
80
100
*
*
Figure 6. Complex maze behavior of mouse lines 2 (control), 7 (selected), and 8 (selected) during
the final trial on the third day during which the entrance and exit were inverted laterally. Top
panel shows the time spent in the maze. The middle panel shows the number of mistakes the
mice make in the maze, and the lower panel shows the percentage of mice going directly at the
first attempt to the new inverted exit. * indicate significant difference between means at p<0.05.

27
4. Discussion
Long-term selective breeding for high voluntary physical activity in animals may alter personality
traits from certain behavioral domains that are adaptive for sustaining a high activity level. In the
present study, we investigated potential differences in personality traits of two lines of mice
selectively bred for high voluntary wheel-running activity and a non-selected control line.
Outcomes of an open-field test (to asses explorative behavior), a plus-maze test (to assess anxiety
levels), and a complex maze (to assess learning and routine behavior) indeed showed profound
differences between mice of the high-activity lines and the control line. However, the magnitude
and direction in the shifts of behavior in the high-activity mice relative to controls were not
always uniform.
Important for consideration of the results of the present study is the fact that mice were
tested in their "sedentary" state and in fact were never given access to running wheels. The
reason for this was that previous exposure to wheel running may influence outcomes of
behavioral tests (e.g., (Rhodes, Van et al. 2003;Malisch, Breuner et al. 2009)). Thus, here we deal
with animals which normally show different amounts of locomotor behavior in running wheels,
but have no possibility to express this behavior. From offspring of this generation used for other
purposes, however, we know that the average wheel-running behavior in line 7 and line 8 mice
was, respectively, 2 times and 2.1 times more than that of controls (unpublished results). Even
without running wheels, Malisch et al. found that the selected mice have increased spontaneous
locomotor behavior assessed with passive infrared detection (Malisch, Breuner et al. 2008;Malisch,
Breuner et al. 2009). Increased spontaneous activity in mice might manifest itself as increased
locomotion in the open field, which we scored as “exploratory behavior”. There were, however,
differences between the activity-selected lines. Line 7 mice showed more rearing or upright
behavior, whereas line 8 mice showed more exploratory behavior by locomotion towards the
middle ring (figure 3) compared to control mice. In addition, line 8 showed more exploration in
the center when the novel object was placed in the center of the open field. Thus, the two
selection lines expressed different “information gathering” behavior in the empty open field, and
also differed with respect to “approach” and “risk-assessment” behavior (Augustsson &
Meyerson 2004) when the novel object was introduced.
In the plus-maze test, selected lines and in particular line 8 (with line 7 as the
intermediary phenotype) spent less time in the open arms than the control line, which is
indicative of higher anxiety levels in selected than control mice. In the complex maze test, all
mice showed learning performance over time. Over the course of several trials, we did not
observe that activity-selected mice learned faster or slower than controls. This seems consistent
with the findings by Rhodes et al, showing no differences in learning capabilities of selected mice
in a Morris water maze (Rhodes, Van et al. 2003) compared to controls when they did not have
access to running wheels. However, the selected mice from line 8, needed slightly more time to
find the exit, but without making more mistakes than controls. Perhaps line 8 mice are more
cautious and slower in their travel paths in “non-surveyable” environments, which may fit the
Personality of physically active mice

Chapter 2
28
higher anxiety levels of these animals in the plus-maze test. In the “surveyable” open field,
however, line 8 mice displayed more exploratory behavior and risk-assessment towards the novel
object placed in the center. When the exit of the maze was displaced on day three, selected mice
- and especially the females - spent longer time in the maze searching for the new exit, and they
more frequently visited the original exit relative to controls. Assuming that there are no
differences in visual or odor detection among lines (i.e., they all bypass the tube directly
connected to their home cage on their way to the old exit), this points to a more routine-like
behavior in both selected lines of mice compared to controls, irrespective of sex.
Based on the present results, it may be concluded that selection for increased wheel-
running behavior has caused changes in a number of personality traits. Perhaps the increased
routine-like behavior of selected mice may help to sustain increased "monotonous" physical
activity, such as wheel running behavior. But what about the other behaviors, such as
cautiousness, anxiety, and exploratory behavior? From an evolutionary standpoint, it may be
speculated that individuals that display a high level of physical activity have an advantage in
habitats that require relatively large home ranges or territories (for example, for food and/or
partner seeking), provided that they are cautious, exploratory, and stick to routines at the same
time. In other words, individuals ranging over relatively large areas have an elevated risk of
predation, which could be compensated by appropriate behaviors (Clobert, Opplige et al. 2000).
Correlated responses to selection can also occur because of pleiotropic gene action, which may be
especially common for behavioral traits. In this event, one needs to differentiate between
selection that may act to favor particular combinations of traits (i.e., caution with wide ranging,
but also potentially neuroendocrine control pathways that allow increased fuel oxidation
(Vaanholt, Jonas et al. 2008) and secondly, the response to selection, which may "drag along" any
genetically correlated trait in the population at that time (see for example (Bult & Lynch 2000)),
whether that genetic correlation is caused by linkage or pleiotropy. In the latter case, these
interactions could be adaptive or even maladaptive (Malisch, Breuner et al. 2008;Malisch, Breuner
et al. 2009). It would be of interest to test these interactions in mice living in natural habitats
(Benus, Bohus et al. 1991).
It may seem difficult to combine the aforementioned antagonistic behaviors from a
neurobiological standpoint. In their transient hypofrontality hypothesis (Dietrich 2003), Dietrich
et al. suggested that there is a temporary inhibition of neural activity in the prefrontal lobe during
monotonous, automated movements, such as running (Dietrich & Sparling 2004). At the same
time, when neuronal activity in the prefrontal lobes become reduced, the basal ganglia are being
activated, which control routine behavior (Dietrich & Sparling 2004;Graybiel 2008). It may be
speculated that mice from the selected lines have a higher capacity of re-allocating neuronal
activity from prefrontal cortical regions to the basal ganglia during exercise, which may help them
to sustain this behavior. This may provide a neurobiological explanation for the observation that
selected animals, after extensive maze-learning, visited the former “habituated” exit in the
complex maze. In a novel environment, however, where the selected mice are faced with

29
uncertainty (such as in the open field), this switch between neuronal activity from prefrontal
cortex to basal ganglia probably does not occur. If anything, the selected animals show increased
curiosity and exploration in a novel environment, which reduces uncertainty and vigilance
(Berlyne 1966;Dember & Earl 1957). It may be speculated that in the natural habitat, where
natural resources sometimes become transiently smaller and/or predation pressure is increased,
the behavioral characteristics of increased voluntary activity associated with - or perhaps causal to
- curiosity and exploration may be adaptive and may increase the chances of survival.
References
Antunes, H. K., S. G. Stella, R. F. Santos, O. F. Bueno, and M. T. de Mello. 2005. Depression, anxiety and
quality of life scores in seniors after an endurance exercise program. Rev. Bras. Psiquiatr. 27:266-271.
Augustsson, H. and B. J. Meyerson. 2004. Exploration and risk assessment: a comparative study of male
house mice (Mus musculus musculus) and two laboratory strains. Physiol Behav. 81:685-698.
Bell, R. R., M. J. Spencer, and J. L. Sherriff. 1995. Diet-induced obesity in mice can be treated without energy
restriction using exercise and/or a low fat diet. J. Nutr. 125:2356-2363.
Benus, R. F., B. Bohus, J. M. Koolhaas, and G. A. van Oortmerssen. 1991. Heritable variation for aggression
as a reflection of individual coping strategies. Experientia 47:1008-1019.
Berlyne, D. E. 1966. Curiosity and exploration. Science 153:25-33.
Bi, S., K. A. Scott, J. Hyun, E. E. Ladenheim, and T. H. Moran. 2005. Running wheel activity prevents
hyperphagia and obesity in Otsuka long-evans Tokushima Fatty rats: role of hypothalamic signaling.
Endocrinology 146:1676-1685.
Brock, C. M., D. S. King, M. R. Wofford, and T. K. Harrell. 2005. Exercise, insulin resistance, and
hypertension: a complex relationship. Metab Syndr. Relat Disord. 3:60-65.
Bronikowski, A. M., P. A. Carter, J. G. Swallow, I. A. Girard, J. S. Rhodes, and T. Garland, Jr. 2001. Open-
field behavior of house mice selectively bred for high voluntary wheel-running. Behav. Genet. 31:309-
316.
Bult, A. and C. B. Lynch. 2000. Breaking through artificial selection limits of an adaptive behavior in mice
and the consequences for correlated responses. Behav. Genet. 30:193-206.
Clobert, J., A. Opplige, G. Sorci, B. Ernande, J. G. Swallow, and T. Garland Jr. 2000. Trade-offs in
phenotypic traits: endurance at birth, growth, survival, perdation, and susceptibility to parasitism in a
lizard, Lacerta vivipara. Functional Ecology 4:675-684.
Dember, W. N. and R. W. Earl. 1957. Analysis of exploratory, manipulatory, and curiosity behaviors.
Psychol. Rev. 64:91-96.
Dey, S. 1994. Physical exercise as a novel antidepressant agent: possible role of serotonin receptor subtypes.
Physiol Behav. 55:323-329.
Personality of physically active mice

Chapter 2
30
Dietrich, A. 2003. Functional neuroanatomy of altered states of consciousness: the transient hypofrontality
hypothesis. Conscious. Cogn 12:231-256.
Dietrich, A. and W. F. McDaniel. 2004. Endocannabinoids and exercise. Br. J. Sports Med. 38:536-541.
Dietrich, A. and P. B. Sparling. 2004. Endurance exercise selectively impairs prefrontal-dependent cognition.
Brain Cogn 55:516-524.
Gammie, S. C., N. S. Hasen, J. S. Rhodes, I. Girard, and T. Garland, Jr. 2003. Predatory aggression, but not
maternal or intermale aggression, is associated with high voluntary wheel-running behavior in mice.
Horm. Behav. 44:209-221.
Garland, T., Jr. 2001. Phylogenetic comparison and artificial selection. Two approaches in evolutionary
physiology. Adv. Exp. Med. Biol. 502:107-132.
Garland, T., Jr., M. T. Morgan, J. G. Swallow, J. S. Rhodes, I. Girard, J. G. Belter, and P. A. Carter. 2002.
Evolution of a small-muscle polymorphism in lines of house mice selected for high activity levels.
Evolution 56:1267-1275.
Girard, I., M. W. McAleer, J. S. Rhodes, and T. Garland, Jr. 2001. Selection for high voluntary wheel-running
increases speed and intermittency in house mice (Mus domesticus). J. Exp. Biol. 204:4311-4320.
Graybiel, A. M. 2008. Habits, rituals, and the evaluative brain. Annu. Rev. Neurosci. 31:359-387.
Greenwood, B. N., P. V. Strong, A. A. Dorey, and M. Fleshner. 2007. Therapeutic effects of exercise: wheel
running reverses stress-induced interference with shuttle box escape. Behav. Neurosci. 121:992-1000.
Hartmann, J., T. Garland, Jr., R. M. Hannon, S. A. Kelly, G. Munoz, and D. Pomp. 2008. Fine mapping of
"mini-muscle," a recessive mutation causing reduced hindlimb muscle mass in mice. J. Hered. 99:679-
687.
Hayes, C. and A. Kriska. 2008. Role of physical activity in diabetes management and prevention. J. Am. Diet.
Assoc. 108:S19-S23.
Hillman, C. H., K. I. Erickson, and A. F. Kramer. 2008. Be smart, exercise your heart: exercise effects on
brain and cognition. Nat. Rev. Neurosci. 9:58-65.
Kligman, E. W. and E. Pepin. 1992. Prescribing physical activity for older patients. Geriatrics 47:33-44, 47.
Koteja, P., T. Garland, Jr., J. K. Sax, J. G. Swallow, and P. A. Carter. 1999. Behaviour of house mice
artificially selected for high levels of voluntary wheel running. Anim Behav. 58:1307-1318.
Levin, B. E. and A. A. Dunn-Meynell. 2004. Chronic exercise lowers the defended body weight gain and
adiposity in diet-induced obese rats. Am. J. Physiol Regul. Integr. Comp Physiol 286:R771-R778.
Malisch, J. L., C. W. Breuner, F. R. Gomes, M. A. Chappell, and T. Garland, Jr. 2008. Circadian pattern of
total and free corticosterone concentrations, corticosteroid-binding globulin, and physical activity in
mice selectively bred for high voluntary wheel-running behavior. Gen. Comp Endocrinol. 156:210-
217.
Malisch, J. L., C. W. Breuner, E. M. Kolb, H. Wada, R. M. Hannon, M. A. Chappell, K. M. Middleton, and
T. Garland, Jr. 2009. Behavioral despair and home-cage activity in mice with chronically elevated
baseline corticosterone concentrations. Behav. Genet. 39:192-201.

31
Patterson, C. M. and B. E. Levin. 2008. Role of exercise in the central regulation of energy homeostasis and
in the prevention of obesity. Neuroendocrinology 87:65-70.
Pietropaolo, S., Y. Sun, R. Li, C. Brana, J. Feldon, and B. K. Yee. 2008. The impact of voluntary exercise on
mental health in rodents: a neuroplasticity perspective. Behav. Brain Res. 192:42-60.
Rabinovitch, M. S. and H. E. Rosvold. 1951. A closed-field intelligence test for rats. Can. J. Psychol. 5:122-
128.
Rhodes, J. S., G. R. Hosack, I. Girard, A. E. Kelley, G. S. Mitchell, and T. Garland, Jr. 2001. Differential
sensitivity to acute administration of cocaine, GBR 12909, and fluoxetine in mice selectively bred for
hyperactive wheel-running behavior. Psychopharmacology (Berl) 158:120-131.
Rhodes, J. S., P. H. Van, S. Jeffrey, I. Girard, G. S. Mitchell, T. Garland, Jr., and F. H. Gage. 2003. Exercise
increases hippocampal neurogenesis to high levels but does not improve spatial learning in mice bred
for increased voluntary wheel running. Behav. Neurosci. 117:1006-1016.
Rhodes, R. E. and N. E. Smith. 2006. Personality correlates of physical activity: a review and meta-analysis.
Br. J. Sports Med. 40:958-965.
Swallow, J. G., P. A. Carter, and T. Garland, Jr. 1998. Artificial selection for increased wheel-running
behavior in house mice. Behav. Genet. 28:227-237.
Treit, D., J. Menard, and C. Royan. 1993. Anxiogenic stimuli in the elevated plus-maze. Pharmacol.
Biochem. Behav. 44:463-469.
Vaanholt, L. M., I. Jonas, M. Doornbos, K. A. Schubert, C. Nyakas, T. Garland, Jr., G. H. Visser, and D. G.
van. 2008. Metabolic and behavioral responses to high-fat feeding in mice selectively bred for high
wheel-running activity. Int. J. Obes. (Lond) 32:1566-1575.
van Dijk, G. and J. H. Strubbe. 2003. Time-dependent effects of neuropeptide Y infusion in the
paraventricular hypothalamus on ingestive and associated behaviors in rats. Physiol Behav. 79:575-
580.
van Praag, H., B. R. Christie, T. J. Sejnowski, and F. H. Gage. 1999. Running enhances neurogenesis,
learning, and long-term potentiation in mice. Proc. Natl. Acad. Sci. U. S. A 96:13427-13431.
Walsh, R. N. and R. A. Cummins. 1976. The Open-Field Test: a critical review. Psychol. Bull. 83:482-504.
Personality of physically active mice


33
CCHH
AAPP TT
EERR
EFFECTS OF SELECTIVE BREEDING FOR INCREASED WHEEL
RUNNING BEHAVIOR ON CIRCADIAN TIMING OF SUBSTRATE
OXIDATION AND INGESTIVE BEHAVIOR
I. Jónás, L. Vaanholt, T. Garland Jr, A.J.W. Scheurink, C. Nyakas, and G. van
Dijk
Summary
Fluctuations in substrate preference and utilization across the circadian cycle may be influenced by the degree of physical activity and nutritional status. In the present study, we assessed these relationships in control mice and in mice from a line selectively bred for high voluntary wheel-running behavior, either when feeding a carbohydrate-rich/low-fat (LF) or a high-fat (HF) diet. Housed without wheels, selected mice, and in particular the females, exhibited higher cage activity than their non-selected controls during the dark phase and at the onset of the light phase, irrespective of diet. This was associated with increases in energy expenditure in both sexes of the selection line. In selected males, carbohydrate oxidation appeared to be increased compared to controls. In contrast, selected females had profound increases in fat oxidation above the levels in control females to cover the increased energy expenditure during the dark phase. This is remarkable in light of the finding that the selected mice, and in particular the females showed higher preference for the LF diet relative to controls. It is likely that hormonal and/or metabolic signals increase carbohydrate preference in the selected females, which may serve optimal maintenance of cellular metabolism in the presence of augmented fat oxidation.

Chapter 3
34
1. Introduction
Food intake of animals is regulated to match the energetic demands on the long-term, but the regulatory mechanisms exert their influences on a daily basis, and even within each meal (Li & Anderson 1982;Shor-Posner, Brennan et al. 1994). Since life evolved on a planet with an approximately 24h rotation, most animal species have a circadian rhythm in activity and resting, with specific metabolic and nutritional demands integral to the regulation of energy balance. As such, most species, including human beings and rodents, eat the majority of their food during the active phase, with peaks occurring at the beginning and at the end of the activity phase (Strubbe & van Dijk 2002). Besides total amount of food eaten, macronutrient preference also fluctuates across the daily cycle. The beginning of the circadian phase is usually associated with an increased appetite for carbohydrates, whereas at the end of the active phase particular fats are preferred (Shor-Posner, Brennan et al. 1994;Tempel, Shor-Posner et al. 1989).
It may be proposed that these respective macronutrient preferences exist to serve metabolic needs across the diurnal cycle. At the onset of the active phase, for example, carbohydrates may be needed because they can rapidly deliver energy for behavioral arousal (Strubbe & van Dijk 2002). Fats, on the other hand, are metabolized slowly and would not be a preferred fuel at the onset of the active phase. Instead, they could be more appropriate at the end of the active phase, as they can be stored more easily and subsequently yield fuels during the inactive phase (Strubbe & van Dijk 2002). In the present study, we investigated relations between circadian timing of ingestive behavior, metabolism (relative oxidation of carbohydrates and fats), and macronutrient preference at the beginning and at the end of the active phase. This was done in mice selectively bred for high voluntary wheel-running behavior, and in their non-selected controls. In previous studies, we noticed that these selectively bred, highly active mice have increased energy intake with a relatively low body weight compared to controls (Vaanholt, Jonas et al. 2008;Swallow, Koteja et al. 2001). The high energy intake is probably necessary to match the increased energy utilization associated with increased physical activity. Furthermore, when physical activity-selected mice were switched to feeding a high-fat diet, they - particularly the females - were obesity-resistant despite the fact that the selected female mice further increased their food intake relative to when they were feeding a carbohydrate-rich, low-fat diet (Vaanholt, Jonas et al. 2008). It may be suggested that it is either a response to the high energy demand of the high spontaneous activity or they simply prefer the high-fat diet. Because the activity-selected mice have an increased level of spontaneous activity even without the presence of running wheels, particularly in their active phase (Rhodes, Hosack et al. 2001;Malisch, Breuner et al. 2009), we hypothesized that these selected mice would have increased food intake at the onset of the dark phase, with a stronger preference for carbohydrates than control mice to serve their metabolic requirements. We predicted that these preferences would be augmented when animals were switched to feeding a high-fat diet.

Substrate oxidation and ingestive behavior
35
2. Materials and methods
2.1. Animals
Mice used in this study were selected for voluntary wheel-running behavior (the base population was the Hsd:ICR strain) over 31 generations and were obtained from T. Garland Jr, Riverside, CA. Breeding lines were maintained at our facilities in Haren without further selection for wheel-running activity. In the original selection protocol, eight lines of mice were created (4 selected and 4 control) (Swallow, Carter et al. 1998), and here we used male and female mice at the age of 5 months from one selection line (lab designation line 7) and one control line (line 2). All mice were individually housed in Plexiglas cages (20x20x30) in the same room with ad libitum food and water at an ambient temperature of 22±1 °C, and maintained on a 12:12 light-dark cycle with lights on at 8 am. This was designated circadian time (CT) 0, and light off was CT 12. Pine shavings and EnviroDry® were used as bedding material. Half of the animals were either on a pelleted standard low-fat (LF) carbohydrate rich rodent chow (RMH-B 2181, HopeFarms BV, Woerden, NL) or on a pelleted 60 % high fat (HF) diet, which was equicaloric to the standard lab chow (see (Vaanholt, Jonas et al. 2008) for diet description). Long-term energy balance parameters in these same mice were published previously (Vaanholt, Jonas et al. 2008). All methods were approved by, and are in agreement with the regulations of the Institutional Animal Use and Care Committee of the University of Groningen. These regulations are consistent with the guidelines for the care and use of laboratory animals as described by the U.S. National Institutes of Health.
2.2. Indirect calorimetry
Animals in their homecages were taken to the respirometry room where respirometric chambers were set up to determine oxygen consumption (VO2, l/h) and carbon dioxide production (VCO2, l/h). Eight mice could be measured simultaneously. Oxygen and carbon dioxide concentration of dried inlet and outlet air (drier: molecular sieve 3 Ǻ, Merck) from each chamber were measured with a paramagnetic oxygen analyzer (Servomex Xentra 4100) and cardon dioxide by an infrared gas analyzer (Servomex 1440). The system recorded the differentials in oxygen and carbon dioxide between dried reference air and dried air from the metabolic chambers. Flow rate of inlet air (60 l/hour) was measured with a mass-flow controller (Type 5850 Brooks). Ambient temperature in the room and chambers, as well as behavioral activity (with passive infrared detectors, Optex Wonderex FX-35) were measured simultaneously. Samples were collected every 10 minutes (allowing optimal air mixing) for each animal and automatically stored on a computer. To reduce novel cage stress, the respirometric chambers (45x25x30 cm) were adapted to accommodate the home cage of the animal. Animals therefore did not need to be handled and stayed in their home cage during the entire measurements. Animals were measured at an ambient temperature of 22°C and food and water were provided ad libitum over a period of 48 hrs. Energy expenditure (kJ/h) was calculated using the following equation of Ferrannini (Ferrannini 1988):

Chapter 3
36
EE= {[(RQ - 0.7) / 0.3] x 473 + [(1.0 - RQ) / 0.3] x 439} x VO2
where oxidation (by one mol O2) of carbohydrates and fats yields respectively 473 and 439 kJ. The relative contributions of carbohydrate and fat oxydation to EE were estimated by comparing the assessed Respiratory Quotient (RQ; i.e. VCO2/VO2) to the levels when carbohydrate oxidation (RQ = 1.0) or fat oxidation (RQ=0.7) predominate. Furthermore, the assessed oxygen consumption and carbon dioxide production were used to calculate carbohydrate and fat oxidation according to the equations of Lusk (Lusk G 1976):
Lipid oxidation (g/hr): 38.461 x {(VO2(mol/hr) – VCO2(mol/hr)}
Carbohydrate oxidation (g/hr): {94.017 x VCO2(mol/hr)} – {66.239 x VO2(mol/hr)} These formulas are derived from the notion that 0.036 mol and 0.088 mol of O2 are
necessary to oxidize unit masses of carbohydrates and fats, respectively, and 0.036 mol and 0.062 mol of CO2 are produced upon oxidation of unit masses of carbohydrates and fats, respectively (Lusk G 1976).
2.3. Circadian rhythm of food intake
The circadian rhythm of food intake was obtained by two separate sessions interspaced by 3 days (first session: from CT 0 to CT 12, second session: from CT 12 to CT 0). This was done by manually weighing food hoppers every two hours, and determining the food missing from the hoppers.
2.4. Food preference
All animals that had been adapted to feeding the LF or the HF diet, were given access to an equal amount (approx 10 gr.) of both HF and LF diets for two hours to determine their food preference. This was done once immediately before the dark phase (CT 10 to CT 12), and a week later the measurement was done immediately before the light phase (from CT 22 am to CT 0). These time periods were chosen because at these two distinct phases of the activity period control and selected mice had roughly similar food intakes (see circadian feeding patterns, Fig. 5).
2.5. Statistical analysis
Data were analyzed using GLM repeated measures and between-subjects effects using Statistica 7 program for spontaneous activity, RQ, carbohydrate-, fat oxidation, food intake behavior and energy expenditure. Except for spontaneous activity (to compare gender effects on spontaneous activity), males and females were tested separately due to their difference in energy regulation. Differences in food preferences (indicated by the percentage intake of LF over total intake

Substrate oxidation and ingestive behavior
37
assessed over two hours) were tested using GLM Multivariate Analysis. In all tests, a level of p<0.05 was considered significant.
3. Results
3.1. Circadian rhythm of spontaneous activity
GLM repeated measures revealed that females were generally more active in the dark phase than males (sex effect, F(1,45)=7.82; p<0.01) (see Figure 1). Selected mice were more active at the onset of the light phase and throughout the whole dark phase than control mice (line effect, F(1,45)=17.53; p<0.001), irrespective of sex. These effects were particularly evident in females of the selection line, which were highly active in the dark phase (sex*line effect, F(1,45)=7.02; p<0.05). No statistically significant effects of diet or a diet*line interaction effects of diet were observed in either sex.
0 2 4 6 8 10 12 14 16 18 20 22 24
0
200
400
600
800
1000
Con - LF
Con - HF
Sel - LF
Sel - HF
time (h)
0 2 4 6 8 10 12 14 16 18 20 22 24
0
200
400
600
800
1000
Lo
co
mo
tor
activity (
cou
nts
/h)
Lo
co
mo
tor
activity (
co
unts
/h)
♂
♀
0 2 4 6 8 10 12 14 16 18 20 22 24
0
200
400
600
800
1000
Con - LF
Con - HF
Sel - LF
Sel - HF
time (h)
0 2 4 6 8 10 12 14 16 18 20 22 24
0
200
400
600
800
1000
Lo
co
mo
tor
activity (
cou
nts
/h)
Lo
co
mo
tor
activity (
co
unts
/h)
♂
♀
Figure 1. Locomotor activity during indirect calorimetry in control (Con) and selected (Sel) male (upper panel) and female (bottom panel) mice feeding a low-fat (LF) or high-fat (HF) diet. Dark phase is indicated by the black horizontal bar at the bottom of the graph.

Chapter 3
38
3.2. Circadian rhythm of energy expenditure
Over the daily cycle, GLM repeated measures revealed an effect of line in both males (F(1,18)=7.59; p<0.05) and females (F(1,18)=16.30; p<0.01), meaning that selected mice had a higher energy expenditure than control mice irrespective of diet (see Figure 2). Univariate analysis of individual time points revealed that energy expenditure was increased in selected males at CT 3-4, 6-14 and in selected females at CT 4, 7, and 12-20 compared to control animals. No statistically significant effects of diet or a diet*line interaction effects of diet were observed in either sex.
time (h)
0 2 4 6 8 10 12 14 16 18 20 22 24
Energ
y e
xpenditure
(kJ/h
)
1
2
3
4
5
6
0 2 4 6 8 10 12 14 16 18 20 22 24
Energ
y e
xpenditure
(kJ/h
)
1
2
3
4
5
6
Con - LF
Con - HF
Sel - LF
Sel - HF
♂
♀
time (h)
0 2 4 6 8 10 12 14 16 18 20 22 24
Energ
y e
xpenditure
(kJ/h
)
1
2
3
4
5
6
0 2 4 6 8 10 12 14 16 18 20 22 24
Energ
y e
xpenditure
(kJ/h
)
1
2
3
4
5
6
Con - LF
Con - HF
Sel - LF
Sel - HF
♂
♀
Figure 2. Energy expenditure in control (Con) and selected (Sel) male (upper panel) and female (bottom panel) mice feeding a low-fat (LF) or high-fat (HF) diet. Dark phase is indicated by the black horizontal bar at the bottom of the graph.

Substrate oxidation and ingestive behavior
39
3.3. Respiratory Quotient
Over the daily cycle, GLM repeated measures revealed that both male (F(1,23)=116.76: p<0.001) and female (F(1,21)=266.08; p<0.001) mice on the HF diet had a lower RQ than mice on the LF diet (see Figure 3). Furthermore, univariate analysis in males pointed out that selected mice had higher RQ values at CT 10 – 14 than controls. Using GLM repeated measures, females of the selection line had decreased RQ levels compared to mice of the control line (line effect, F(1,21)=11.51; p<0.01) irrespective of diet. This was particularly the case between CT 12 – 15.
0 2 4 6 8 10 12 14 16 18 20 22 24
Re
sp
ira
tory
qu
otie
nt
0,7
0,8
0,9
1,0
1,1
Con - LF
Con - HF
Sel - LF
Sel - HF
time (h)
0 2 4 6 8 10 12 14 16 18 20 22 24
Re
spir
ato
ry q
uo
tie
nt
0,7
0,8
0,9
1,0
1,1
♂
♀
0 2 4 6 8 10 12 14 16 18 20 22 24
Re
sp
ira
tory
qu
otie
nt
0,7
0,8
0,9
1,0
1,1
Con - LF
Con - HF
Sel - LF
Sel - HF
time (h)
0 2 4 6 8 10 12 14 16 18 20 22 24
Re
spir
ato
ry q
uo
tie
nt
0,7
0,8
0,9
1,0
1,1
♂
♀
Figure 3. Respiratory Quotient (RQ) values during indirect calorimetry in control (Con) and selected (Sel) male (upper panel) and female (bottom panel) mice feeding a low-fat (LF) or high-fat (HF) diet. Dark phase is indicated by the black horizontal bar at the bottom of the graph.

Chapter 3
40
3.4. Carbohydrate and fat oxidation
Over the daily cyle, GLM repeated measures demonstrated that, compared to the LF condition, feeding the HF diet caused a decreased carbohydrate oxidation in males (F(1,18)=4.96; p<0.05) and in females (F(1,18)=95.08; p<0.001) and increased fat oxidation in males (F(1,18)=7.69; p<0.05) and in females (F(1,18)=82.22; p<0.001) (see Figure 4). Furthermore, males of the selection line showed increased carbohydrate oxidation (F(1,18)=6.33; p<0.05) irrespective of diet, and selected females showed an increase in fat oxidation (F(1,18)=21.04; p<0.001) irrespective of diet compared to mice of the control line. No interaction effects were observed.
time (h)
0 2 4 6 8 10 12 14 16 18 20 22 24
CH
O-o
x (
mg
/h)
0
50
100
150
200
250
0 2 4 6 8 10 12 14 16 18 20 22 24
CH
O-o
x (
mg/h
)
0
50
100
150
200
250Con - LF
Con - HF
Sel - LF
Sel - HF
time (h)
0 2 4 6 8 10 12 14 16 18 20 22 24
fat-
ox (
mg/h
)
0
20
40
60
80
100
1200 2 4 6 8 10 12 14 16 18 20 22 24
fat-
ox (
mg/h
)
0
20
40
60
80
100
120
Con - LF
Con - HF
Sel - LF
Sel - HF ♂ ♂
♀ ♀
time (h)
0 2 4 6 8 10 12 14 16 18 20 22 24
CH
O-o
x (
mg
/h)
0
50
100
150
200
250
0 2 4 6 8 10 12 14 16 18 20 22 24
CH
O-o
x (
mg/h
)
0
50
100
150
200
250Con - LF
Con - HF
Sel - LF
Sel - HF
time (h)
0 2 4 6 8 10 12 14 16 18 20 22 24
fat-
ox (
mg/h
)
0
20
40
60
80
100
1200 2 4 6 8 10 12 14 16 18 20 22 24
fat-
ox (
mg/h
)
0
20
40
60
80
100
120
Con - LF
Con - HF
Sel - LF
Sel - HF ♂ ♂
♀ ♀
Figure 4. Calculated carbohydrate (CHO; left graphs) and fat (right graphs) oxidation in control (Con) and selected (Sel) male (upper panel) and female (bottom panel) mice feeding a low-fat (LF) or high-fat (HF) diet. Dark phase is indicated by the black horizontal bar at the bottom of the graph.
3.5. Circadian rhythm of food intake
Over the daily cycle, GLM repeated measures revealed in both sexes that selected mice had significantly different intake over time (males: F(1,24)=14.66; p<0.001; females: F(1,21)=8.87; p<0.01) relative to control mice (see Figure 5). Univariate analysis showed that selected males

Substrate oxidation and ingestive behavior
41
consumed more food than control males at CT 12 and 14, whereas selected females consumed more at CT 6 and 8 than control females, irrespective of diet.
X Data
2 4 6 8 10 12 14 16 18 20 22 24
foo
d inta
ke
(gr/
2hr)
-0,2
0,0
0,2
0,4
0,6
0,8
1,0
1,2
1,4
times (h)
2 4 6 8 10 12 14 16 18 20 22 24
food inta
ke (
gr/
2hr)
-0,2
0,0
0,2
0,4
0,6
0,8
1,0
1,2
1,4
Con - LF
Con - HF
Sel - LF
Sel - HF
♂
♀
X Data
2 4 6 8 10 12 14 16 18 20 22 24
foo
d inta
ke
(gr/
2hr)
-0,2
0,0
0,2
0,4
0,6
0,8
1,0
1,2
1,4
times (h)
2 4 6 8 10 12 14 16 18 20 22 24
food inta
ke (
gr/
2hr)
-0,2
0,0
0,2
0,4
0,6
0,8
1,0
1,2
1,4
Con - LF
Con - HF
Sel - LF
Sel - HF
♂
♀
Figure 5. Food intake in control (Con) and selected (Sel) male (upper panel) and female (bottom panel) mice feeding a low-fat (LF) or high-fat (HF) diet. Dark phase is indicated by the black horizontal bar at the bottom of the graph.
3.6. Food selection
In the food selection experiment (calculated as percentual intake of LF diet over intake of LF and HF diet) at two time points of the daily cycle, mice feeding the HF diet ate less than mice feeding the LF diet, both in males (F(1,69)=14.92; p<0.001) and in females (F(1,45)=11.32; p=0.01) (see Figure 6). Furthermore, males of the selection line consumed more than those of the control line at the onset of the dark phase (line*time effect: F(1,69)=4.77; p<0.05), but not at the onset of the light phase. No differences were observed in total intake during the two-choice test between control and selected females.

Chapter 3
42
Mice feeding the HF diet as their “normal” diet generally preferred the LF diet more than mice that had the LF diet as their “normal” diet (males: F(1,69)=32.97; p<0.0001; females F(1,45)=15.47; p<0.001). Furthermore, selected females preferred the LF diet more than control females (F(1,45)=6.76; p<0.05), particularly at the onset of the dark phase, irrespective of diet condition.
Ing
este
d fo
od (
g)
0,0
0,2
0,4
0,6
0,8
1,0
1,2
1,4
1,6LF
HF
Inge
ste
d f
ood
(g)
0,0
0,2
0,4
0,6
0,8
1,0
1,2
1,4
1,6
CT 22 - 24 CT 10 - 12
Males
Females
♂
♀
Con Sel Con Sel Con Sel Con Sel
LF LF HF HF LF LF HF HF
3.52.9
82.5
34.2
16.1
42.8
35.9
9.6
0.9
12.7
67.4 81.5
39.8
19.4
75.8
3.0
Ing
este
d fo
od (
g)
0,0
0,2
0,4
0,6
0,8
1,0
1,2
1,4
1,6LF
HF
Inge
ste
d f
ood
(g)
0,0
0,2
0,4
0,6
0,8
1,0
1,2
1,4
1,6
CT 22 - 24 CT 10 - 12
Males
Females
♂
♀
Con Sel Con Sel Con Sel Con Sel
LF LF HF HF LF LF HF HF
Ing
este
d fo
od (
g)
0,0
0,2
0,4
0,6
0,8
1,0
1,2
1,4
1,6LF
HF
Inge
ste
d f
ood
(g)
0,0
0,2
0,4
0,6
0,8
1,0
1,2
1,4
1,6
CT 22 - 24 CT 10 - 12
Males
Females
♂
♀
Con Sel Con Sel Con Sel Con Sel
LF LF HF HF LF LF HF HF
3.52.9
82.5
34.2
16.1
42.8
35.9
9.6
0.9
12.7
67.4 81.5
39.8
19.4
75.8
3.0
Figure 6. Food selection test in control (Con) and selected (Sel) male (upper panel) and female (bottom panel) mice at CT 22-24 (at the late dark phase, left panels) and at CT 10-12 (at the late light phase, right panels) either habituated to a low-fat (LF) or high-fat (HF) diet. Grey and dark fields of bars indicate respectively HF and LF intake when given two-hour access to these two diets. Numbers above the bars indicate the percentage intake of the LF diet of total.

Substrate oxidation and ingestive behavior
43
4. Discussion
The present study was designed to investigate the hypothesis that mice selectively-bred for high voluntary wheel-running behavior exhibit increased food intake at the onset of the dark phase, with a stronger preference for carbohydrates than control mice. We predicted that these behaviors would reflect differences in utilization profiles of carbohydrates and fats.
Relative to controls, the selected mice displayed increased spontaneous activity. This increase was most striking in the dark phase, and the selected females showed a more dramatic increase than the selected males (Fig. 1). Thus, the increased voluntary locomotion by the selected animals is not restricted to wheel-running behavior, and this is consistent with earlier findings (Rhodes, Hosack et al. 2001;Malisch, Breuner et al. 2009). Furthermore, these data imply that the normal circadian distribution of voluntary activity, with low-level activity in the light phase and high-level activity in the dark phase, is maintained in the wheel-running selected mice (see also (Koteja, Swallow et al. 2003). We did not find differences in locomotor activity by HF feeding per hour in the activity-selected mice relative to when they were feeding a LF diet. However, the direction of change by HF feeding relative to LF feeding in the selected females was positive (+22.7%), whereas it was negative (-8.2%) in the control females. This caused differences in locomotor activity between selected and control females to be more significant in the HF diet condition than in the LF diet condition (Vaanholt, Jonas et al. 2008).
Both sexes of the activity-selected line showed increased energy expenditure relative to the control mice, particularly in selected females feeding the HF diet in the dark phase (Fig. 2). Calculation of the rates of fuel oxidation (Lusk G 1976) revealed that the increase in energy expenditure in the selected males was mainly due to increased oxidation of carbohydrates. In the selected females, however, the increased energy expenditure was mainly attributed to an exaggerated oxidation of fat, particularly when these selected females were feeding a HF diet (Fig. 4). A few points can be raised about this phenomenon. In our previous report on these mice, we observed total resistance to HF diet-induced obesity in the selected females, but not in the selected males (Vaanholt, Jonas et al. 2008). The resistance in the females was observed despite an increase in ingestion of the HF diet. It is likely that the resistance to dietary fat-induced obesity is caused by increased expenditure of fat. Selected males did show weight gain on the HF diet (Vaanholt, Jonas et al. 2008), which appears to be consistent with the fact that they spared fats by increasing carbohydrate oxidation instead. Thus, the elevated cage activity (in the absence of wheels) is fueled differently in the selected males and females by either oxidation of carbohydrates or fats respectively, and this might reflect differences in metabolic enzymatic machinery between male and female selected mice (Houle-Leroy, Garland, Jr. et al. 2000). Also other studies have reported sex differences in metabolic profiles with respect to physical activity in rodents (Tate & Holtz 1998) and human beings (Hackney, Muoio et al. 2000;Aulin 1995). The difference in fuel oxidation intuitively fits the observation that the selected males increased their

Chapter 3
44
nocturnal food intake earlier than the control males did, which might have sparked carbohydrate oxidation as a result of absorbed nutrients. Female mice, both activity-selected and controls, delayed their intake during the dark phase compared to the males. Thus, to cover energetic expenses for increased voluntary activity at the beginning of the dark phase, particularly the selected females had to free-up and utilize their stored fat. This might imply that they developed an energetic deficit at the beginning of the dark phase, and that elevated food intake of the selected females relative to the controls during the ensuing light phase might be viewed as a compensation for this deficit. Similar results have been seen in humans following exercise (Finlayson, Bryant et al. 2009). Such deficits may have been even greater if the mice had been housed with access to running wheels, which substantially increases energy expenditure (e.g., (Swallow, Koteja et al. 2001;Vaanholt, Garland, Jr. et al. 2007).
In the present study, we performed a two-choice diet preference test just before the start of the dark phase and just before the start of the light phase. The results (Fig. 6) showed that mice feeding the LF food as their regular diet had a strong preference for the HF diet, whereas this preference was much lower when the regular food was the HF diet. The latter was particularly obvious right before the start of the dark phase, when indeed carbohydrates are generally preferred over fats, at least in rats (Shor-Posner, Brennan et al. 1994;Tempel, Shor-Posner et al. 1989). In the selected males feeding the HF diet, the relative preference for the LF diet during the late night phase over the HF diet was weaker than in the control males feeding the HF food as their regular diet, indicating that preference for carbohydrates in the selected males is lower than in the control males. In the females, however, the opposite response was observed. Instead of lowering the preference for the LF diet, there was a tendency for increased LF selection from the choice of the two diets, and this LF selection was markedly enhanced at the end of the light phase. One explanation for the increased selection of the LF diet may be that peripheral metabolic sensors inform them to do so (see (Ritter, Ritter et al. 1999;Singer, York et al. 1998)). Hence, a supply of glucose from carbohydrates is beneficial to sustain elevated physical activity. Once the animals are depleted of carbohydrates (blood glucose, stored glycogen), any intensity of physical activity will become difficult. Even though typical 'fat-burning exercise' is generally of lower intensity (i.e., fats are metabolized greatly at lower to moderate intensities of exercise), animals still need glucose to keep active without fatigue (Gomes, Rezende et al. 2009). So in other words, without glucose, animals run the risk of utilizing less fats as “fat burns in the flame of carbohydrate” (after Sir H. Krebs, Nobel Speech, 1953). This problem may be less severe in the activity-selected males than in their female counterparts, because their intensity of physical activity is much lower than in the females. Another, or perhaps complementary mechanism explaining this increased carbohydrate preference may be that when selected females do not sufficiently increase fat stores during the active phase, this renders plasma leptin levels lower than in controls (Vaanholt, Jonas et al. 2008). A relatively low plasma leptin level may increase hypothalamic levels of neuropeptide Y (Schwartz, Erickson et al. 1998), which in turn would stimulate consumption of carbohydrates and hence selection of the LF diet (Jhanwar-

Substrate oxidation and ingestive behavior
45
Uniyal, Beck et al. 1993;Stanley, Daniel et al. 1985). Finally, it cannot be excluded that differences in diet selection among groups is the result of differences in reward pathways (Keeney, Raichlen et al. 2008).
Taken together, selected males and females have different temporal couplings of ingestive behavior and fuel oxidation, with selected females presumably more relying on fuel reserves at the onset of the dark phase, and selected males showing more anticipatory intake to cover their expenses. The stronger preference for carbohydrates in the selected females, particularly when they are adapted to feeding HF food as the normal diet, may indicate that they have difficulties providing sufficient intermediary metabolites from carbohydrate metabolism in order to utilize fats. One of the implications in the females may be that they have the risk of “missing” compensatory intake when food is suddenly not available on the next day, which might spiral the selected females sooner towards emaciation when the exaggerated spontaneous activity is not prevented. It might be speculated that some of these mechanisms are homologous to those that serve the biological underpinnings of anorexia nervosa (Sodersten, Nergardh et al. 2008).
References
Aulin, K. P. 1995. Gender-specific issues. J. Sports Sci. 13 Spec No:S35-S39.
Ferrannini, E. 1988. The theoretical bases of indirect calorimetry: a review. Metabolism 37:287-301.
Finlayson, G., E. Bryant, J. E. Blundell, and N. A. King. 2009. Acute compensatory eating following exercise is associated with implicit hedonic wanting for food. Physiol Behav. 97:62-67.
Gomes, F. R., E. L. Rezende, J. L. Malisch, S. K. Lee, D. A. Rivas, S. A. Kelly, C. Lytle, B. B. Yaspelkis, III, and T. Garland, Jr. 2009. Glycogen storage and muscle glucose transporters (GLUT-4) of mice selectively bred for high voluntary wheel running. J. Exp. Biol. 212:238-248.
Hackney, A. C., D. Muoio, and W. R. Meyer. 2000. The Effect of sex steroid hormones on substrate oxidation during prolonged submaximal exercise in women. Jpn. J. Physiol 50:489-494.
Houle-Leroy, P., T. Garland, Jr., J. G. Swallow, and H. Guderley. 2000. Effects of voluntary activity and genetic selection on muscle metabolic capacities in house mice Mus domesticus. J. Appl. Physiol 89:1608-1616.
Jhanwar-Uniyal, M., B. Beck, Y. S. Jhanwar, C. Burlet, and S. F. Leibowitz. 1993. Neuropeptide Y projection from arcuate nucleus to parvocellular division of paraventricular nucleus: specific relation to the ingestion of carbohydrate. Brain Res. 631:97-106.
Keeney, B. K., D. A. Raichlen, T. H. Meek, R. S. Wijeratne, K. M. Middleton, G. L. Gerdeman, and T. Garland, Jr. 2008. Differential response to a selective cannabinoid receptor antagonist (SR141716: rimonabant) in female mice from lines selectively bred for high voluntary wheel-running behaviour. Behav. Pharmacol. 19:812-820.

Chapter 3
46
Koteja, P., J. G. Swallow, P. A. Carter, and T. Garland, Jr. 2003. Different effects of intensity and duration of locomotor activity on circadian period. J. Biol. Rhythms 18:491-501.
Li, E. T. and G. H. Anderson. 1982. Meal composition influences subsequent food selection in the young rat. Physiol Behav. 29:779-783.
Lusk G. 1976. The elements of the science of nutrition. Johnson Reprint Corporation, New Yorkp40.
Malisch, J. L., C. W. Breuner, E. M. Kolb, H. Wada, R. M. Hannon, M. A. Chappell, K. M. Middleton, and T. Garland, Jr. 2009. Behavioral despair and home-cage activity in mice with chronically elevated baseline corticosterone concentrations. Behav. Genet. 39:192-201.
Rhodes, J. S., G. R. Hosack, I. Girard, A. E. Kelley, G. S. Mitchell, and T. Garland, Jr. 2001. Differential sensitivity to acute administration of cocaine, GBR 12909, and fluoxetine in mice selectively bred for hyperactive wheel-running behavior. Psychopharmacology (Berl) 158:120-131.
Ritter, S., J. B. Ritter, and L. Cromer. 1999. 2-Deoxy-D-glucose and mercaptoacetate induce different patterns of macronutrient ingestion. Physiol Behav. 66:709-715.
Schwartz, M. W., J. C. Erickson, D. G. Baskin, and R. D. Palmiter. 1998. Effect of fasting and leptin deficiency on hypothalamic neuropeptide Y gene transcription in vivo revealed by expression of a lacZ reporter gene. Endocrinology 139:2629-2635.
Shor-Posner, G., G. Brennan, C. Ian, R. Jasaitis, K. Madhu, and S. F. Leibowitz. 1994. Meal patterns of macronutrient intake in rats with particular dietary preferences. Am. J. Physiol 266:R1395-R1402.
Singer, L. K., D. A. York, and G. A. Bray. 1998. Macronutrient selection following 2-deoxy-D-glucose and mercaptoacetate administration in rats. Physiol Behav. 65:115-121.
Sodersten, P., R. Nergardh, C. Bergh, M. Zandian, and A. Scheurink. 2008. Behavioral neuroendocrinology and treatment of anorexia nervosa. Front Neuroendocrinol. 29:445-462.
Stanley, B. G., D. R. Daniel, A. S. Chin, and S. F. Leibowitz. 1985. Paraventricular nucleus injections of peptide YY and neuropeptide Y preferentially enhance carbohydrate ingestion. Peptides 6:1205-1211.
Strubbe, J. H. and G. van Dijk. 2002a. The temporal organization of ingestive behaviour and its interaction with regulation of energy balance. Neurosci. Biobehav. Rev. 26:485-498.
Strubbe, J. H. and G. van Dijk. 2002b. The temporal organization of ingestive behaviour and its interaction with regulation of energy balance. Neurosci. Biobehav. Rev. 26:485-498.
Strubbe, J. H. and G. van Dijk. 2002c. The temporal organization of ingestive behaviour and its interaction with regulation of energy balance. Neurosci. Biobehav. Rev. 26:485-498.
Swallow, J. G., P. A. Carter, and T. Garland, Jr. 1998. Artificial selection for increased wheel-running behavior in house mice. Behav. Genet. 28:227-237.
Swallow, J. G., P. Koteja, P. A. Carter, and T. Garland, Jr. 2001. Food consumption and body composition in mice selected for high wheel-running activity. J. Comp Physiol B 171:651-659.
Tate, C. A. and R. W. Holtz. 1998. Gender and fat metabolism during exercise: a review. Can. J. Appl. Physiol 23:570-582.
Tempel, D. L., G. Shor-Posner, D. Dwyer, and S. F. Leibowitz. 1989. Nocturnal patterns of macronutrient intake in freely feeding and food-deprived rats. Am. J. Physiol 256:R541-R548.

Substrate oxidation and ingestive behavior
47
Vaanholt, L. M., T. Garland, Jr., S. Daan, and G. H. Visser. 2007. Wheel-running activity and energy metabolism in relation to ambient temperature in mice selected for high wheel-running activity. J. Comp Physiol B 177:109-118.
Vaanholt, L. M., I. Jonas, M. Doornbos, K. A. Schubert, C. Nyakas, T. Garland, Jr., G. H. Visser, and D. G. van. 2008. Metabolic and behavioral responses to high-fat feeding in mice selectively bred for high wheel-running activity. Int. J. Obes. (Lond) 32:1566-1575.


CCHH
AAPP TT
EERR
44
EFFECT OF DIET ON THE ENERGETIC AND BEHAVIOURAL
CHARACTERISTICS OF MOUSE LINES SELECTED FOR HIGH ACTIVITY
G. van Dijk, I. Jónás, C. Vries, T. Garland Jr, A. J.W. Scheurink, C. Nyakas,
K. A. Schubert
Summary
Rodents subjected to forced physical activity are resistant to diet-induced obesity, but the procedure often involves emotional stress. For this reason, we studied interactions between voluntary activity and parameters related to energy balance and emotional stress in control mice, and in mice with a trait for increased wheel running behaviour. These latter animals show more voluntary behaviour even in the absence of running wheels. When subjected to a 40% high fat (HF) diet with added refined sugars, the activity selected lines were HF diet obesity resistant, with increased food intake, similar absorption rates and higher non-exercise thermogenesis (NEAT) relative to their randomly bred controls. While activity selected females had a higher anxiety level at baseline than control, this effect reversed on a HF diet, without concomitant changes in plasma levels of corticosterone. Since activity selected lines had a lower HF preference than controls in a two choice test of HF food vs. high-carbohydrate food, these data may be viewed such that the activity lines, and in particular the females improve their mood on a HF diet, without necessarily liking the HF diet more than control mice.

Chapter 4
50
1. Introduction
In an attempt to unravel underpinnings of mammalian energy balance regulation and its derangements, numerous studies have been performed using rodents with traits for obesity proneness and resistance. Through experiments with these animals many candidate genes have been discovered involved in energy balance regulation (Brockmann and Bevova 2002). Selective breeding of rodents lines for diet-induced obesity refined these investigations by using diet as a default trigger, and allowed tracking the aetiology of obesity proneness-and resistance (Levin et al. 1997). It is currently believed that traits for obesity or resistance to it are not caused by single gene differences but is the result of multiple genes that interact at different levels. Indeed, in the seminal work of Singer and colleagues using chromosome substitution strains of mice, they identified that the trait for obesity involves genes almost on every chromosome. Secondly, they observed that high-fat diets differing in the level of refined sugars distort energy balance regulation probably via different mechanisms (Singer et al. 2004).
Another determinant of energy balance regulation is energy expenditure, but has been investigated not as extensively. In general, studies in rats and mice showed a decrease in body fat content in these animals when they had access to a running wheel even though their food intake increased (Tokuyama, Saito, and Okuda 1982; Looy and Eikelboom 1989; Bell, Spencer, and Sherriff 1997; Bell and McGill 1991). One approach to examine the effects of a high level of physical activity on energy balance regulation is to study this in animals that have been selectively bred for increased running wheel activity. Swallow et al consistently observed that selection lines ate more food compared to the controls (Swallow, Carter, and Garland, Jr. 1998b), but remained at a lower body weight during the entire period of the experiment compared to the controls. The activity-selected animals also showed lower fat accumulation which can explain the lower body weight (Swallow et al. 2001). A more recent study by Vaanholt et al showed that selected females, when fed a 60% high fat diet without refined sugars, had higher food intake than the controls but unlike the controls they showed remarkable resistance to weight gain on this high fat diet, even in the absence of running wheels. The activity-selected animals showed a higher mass corrected daily energy expenditure and had a higher resting metabolic rate compared to controls, and this was particularly evident in the females (Vaanholt et al. 2008). Thus, besides increased energy turn-over due to increases in spontaneous activity (Dauncey 1990), activity selected mice display increased metabolic rate independent of differences in activity levels. Together, these mechanisms contribute to resistance to high-fat diet-induced obesity.
As mentioned above, high fat diets differing in the level of refined sugars (i.e., sucrose) may cause distorted energy balance regulation via different mechanisms (Singer et al. 2004). For this reason, we aimed at reconciling the diet-obesity resistance of activity selected mice in the condition when these animals are feeding a high fat diet with an increased level of the refined sugar sucrose. Since it was shown in previous Chapters of this thesis and a number of published

Diet and energetic, behavioral characters
51
reports (Girard et al. 2001; Swallow et al. 2001; Koteja et al. 1999; Gammie et al. 2003; Carter et al. 2000; Garland, Jr. et al. 1995; Vaanholt et al. 2007a; Belke and Garland, Jr. 2007; Malisch et al. 2009) that selective breeding for physical activity causes co-selection of several personality traits (including exploratory behavior, anxiety, stress sensitivity, and stereotypic behavior), we aimed at exploring these in control and activity selected mice in the face of feeding the high-fat high sucrose diet. The main hypothesis which we tested was that activity selected animals would be equally resistant to obesity on this high fat – high sugar diet as on the previously applied high fat alone diet, and that this obesity resistance would parallel outcomes of the behavioral tests.
2. Materials and Methods
2.1. Animals and housing
Thirty-six breeding pairs of Hsd:ICR mice (Mus domesticus) selected on high wheel-running activity (lines 7 and 8) for 50 generations and their random bred controls (lin 2) were obtained from T. Garland Jr, Riverside, CA (For a detailed description of the selection procedure see (Swallow, Carter, and Garland, Jr. 1998a). From these founder mice, separate breeding lines were continued at our facilities in Haren and further selected according to the same criteria. In the current experiments, 93 mice of the 52nd generation were used. From the age of 7 weeks onward, they were individually housed in standard cages (Macrolon Type II, UNO Roest Vast Staal B.V., Soest, NL) in the same room with an ambient temperature of 22±1°C. At the start of the experiment all animals had ad libitum food either a healthy fibered low-fat diet (LF) (3.8 kcal/g; 58 % carbohydrate, 6 % fat, 22 % protein; Standard lab chow RMH-B 2181, HopeFarms BV, Woerden, NL) or a 40 % fat diet, additionally containing sucrose (HFS) (4.7 kcal/g; 30 % carbohydrate, 45 % fat, 18 % protein; AB Animal Diets, Woerden, NL). and water; they were on a 12:12 light-dark cycle (lights on at 8:00). Wood shavings and EnviroDry® were used as bedding material.
2.2. Body mass and food intake
Four weeks before the start of the experiments, male and female mice of the different lines were assigned to cohorts either receiving a low-fat unrefined carbohydrate rich diet (LF), or a 40% high-fat diet with 25% added sucrose (HFS). Body mass and food intake of the LF and HFS feeding mice were measured weekly between 12:00 and 14:00 over the course of the entire diet manipulation. Intake was corrected for spillage.
2.3. Diet preference test
Diet preference of all animals was tested by allowing animals access to the LF and the HFS diet during a two-hour interval 1) in the evening at 20:00 at the beginning of their active phase or 2) at
Chapter 4
52
8:00 in the morning at the beginning of their inactive phase. The active phase diet choice was done at the age of 12 weeks and the inactive phase diet choice was done at the age of 14 weeks. The food was provided in the lid of the cage, separated by the water bottle. Over the two-hour period, mice were allowed to eat from the food without the experimenter being in the room. Thereafter, the food was removed and intake was assessed, and animals were readjusted to their ‘normal’ diet.
2.4. Elevated plus maze
To determine the anxiety levels of mice, they were tested on an elevated plus maze over the period of week 11 to week 13. Plus maze tests separated from diet choice tests for more than two days. The maze consisted of two open arms and two closed arms facing each other, 40 cm above the floor. Each arm was 29 cm long and 5 cm wide. The closed arms had 15 cm high walls with a closed top. At the beginning of an experiment, the mice were placed at the center (5 x 5 cm) of the elevated plus maze after which the experimenter left the room. The animal was then videotaped during 5 minutes and the behavior on the plus maze was scored using Eline software. This way the time spent on each arm and the crossings from one arm to another was recorded. After finishing testing an animal the maze got cleaned with water and dried, before placing a new animal on the plus maze. The time spent on each of the different arms was analyzed, it represents the animal’s anxiety level, the more time spent on the open arms the less anxious the mouse is and vice versa.
2.5. Stress test
At the age of 14-15 weeks a novel cage stress test was performed on all groups. At the start of the experiment, a blood sample was taken in their home cage by tail clip and 30-40µl of blood was collected in a heparinized tube. After 5 minutes, the animals were moved to a brightly lit room adjacent to their habituated room, and placed in a clean empty cage (identical to their home cage but without bedding). They were left in this cage for 15 minutes and then another blood sample was collected. After the experiment the blood was centrifuged and the blood plasma was collected and stored at -80°C. Later the amount of corticosterone in the plasma was measured by RIA (Linco Research, Nucli lab, The Netherlands).
2.6. Respirometry measurements
In week 21-23, animals were moved into respirometric chambers to determine oxygen consumption (VO2, l/h) and carbon dioxide production (VCO2, l/h) by indirect calorimetry for 24 hours. Eight animals could be measured simultaneously. Oxygen and carbon dioxide concentration of dried inlet and outlet air (drier: molecular sieve 3 Ǻ, Merck) from each chamber was measured with a paramagnetic oxygen analyzer (Servomex Xentra 4100) and cardon dioxide by an infrared gas analyzer (Servomex 1440). The system recorded the differentials in oxygen and

Diet and energetic, behavioral characters
53
carbon dioxide between dried reference air and dried air from the metabolic chambers. Flow rate of inlet air was measured with a mass-flow controller (Type 5850 Brooks). Ambient temperature in the chamber and cage, as well as activity (with passive infra-red detectors) were measured simultaneously. Samples were collected every 10 minutes for each animal and automatically stored on a computer. To reduce novel cage stress, the respirometric chambers (45x25x30 cm) were adapted to accommodate the home cage of the animal. Animals therefore did not need to be handled and stayed in their home cage during the entire measurements. Animals were measured at an ambient temperature of 22°C and food (standard chow or fat) and water were provided ad libitum.
Heat production (HP, kJ/h) was calculated using the following equation: HP= (16.18 x VO2) + (5.02 x VCO2 ) (Romijn and Lokhorst 1964). Resting metabolic rate (RMR, kJ/h) was defined as the lowest value of heat production calculated as the running mean over half an hour and was calculated for the first and second day in the respirometer separately. Maximal heat production was also calculated as the running mean over half an hour. In addition, the average heat production (daily energy expenditure: DEE, kJ/d), respiratory quotient (RQ= VCO2/VO2) and PIR (passive infrared) activity were calculated for both consecutive days.
2.7. Bom calorimeter measurements
Directly after respirometry, feces of animals were collected from the saw-dust bedding and were weighed. Then the caloric content of the feces was measured by bom calorimeter. First a known amount of benzoic acid (known energy content of 6320 cal/g) was combusted in the bom calorimeter. This was done three times and the average of those three measurements was used as the reference point for the samples of the feces. Then samples of the feces were combusted and the heat production was compared to the references to determine the energy content of the samples. With these data combined with the assessed food intake during the 24 hours in the respirometer, this enabled us to estimate metabolizable energy intake (MEI).
2.8. Data analysis
All of the data were analyzed using Statistica 7. The body mass and food intake data that were measured during 12 weeks were analyzed with repeated measures ANOVA. For the analysis of the other data general linear models were applied. To test the effect of diet within each line, the data from each line was analyzed separately with a general linear model. To test all subgroups a contrast test was performed.

Chapter 4
54
3. Results
3.1. Body mass and food intake
Figure 1 shows changes in body weight of the mice over time when they were feeding a HFS or LF diet. Mice from the selection lines have a significantly lower body mass compared to the control animals (♂: F(2,44)=25.53; p<0.001 and ♀: F(2,40)=39.95; p<0.001). This is in agreement with the other studies that were done with the activity selected lines compared to the controls (Swallow et al. 2001; Vaanholt et al. 2008; Vaanholt et al. 2007b). Body weight gain over time was higher in line 2 (F(11,44)=8.16; p<0.001) and line 7 (F(11,44)=2.69; p<0.001) males on the HFS diet than on the LF diet. This pattern is not seen in the females.
Figure 1. The average body mass over time for all groups in male (top panels) and female mice (bottom panels). The arrows depicts the age at which the HFS diet was provided.
8 10 12 14 16 18 20 22 24
Bo
dy m
ass (
g)
25
30
35
40
45
50Chow
Fat
Age (weeks)
8 10 12 14 16 18 20 22 24 8 10 12 14 16 18 20 22 24
Line 2 Line 7 Line 8
♂
8 10 12 14 16 18 20 22 24
Bo
dy m
ass
(g
)
20
25
30
35
40Chow
Fat
Age (weeks)
8 10 12 14 16 18 20 22 24 8 10 12 14 16 18 20 22 24
♀
Line 2 Line 7 Line 8

Diet and energetic, behavioral characters
55
The average daily food intake (per week) of the mice is shown in figure 2. In males food intake of line 8 (p=0.004), but not line 7 mice was generally increased above the levels found in line 2. In females, both line 7 and line 8 showed increased food intake above the levels observed in line 2 females (F(2,40)=19.31; p<0.001). Line 2 (♂: F(1,44)=26.40; p<0.001 and ♀: F(1,40)=50.32; p<0.001) and line 7 (♂: F(1,44)=33.10; p<0.001 and ♀: F(1,40)=5.12; p<0.047) males and females showed clearly reduced food intake on the HFS diet compared to respective groups on the LF diet, except for line 8.
Figure 2. The average daily food intake over time for all the different groups in male (top panels) and female (bottom panels) mice. The arrows depicts the age at which the HFS diet was provided.
Age (weeks)
8 10 12 14 16 18 20 22 24 8 10 12 14 16 18 20 22 248 10 12 14 16 18 20 22 24
Dail
y f
oo
d i
nta
ke (
g)
3
4
5
6
7
Chow
Fat
Line 2 Line 7 Line 8
♀
Age (weeks)
8 10 12 14 16 18 20 22 248 10 12 14 16 18 20 22 24
Da
ily f
oo
d i
nta
ke
(g
)
3
4
5
6
7
Chow
Fat
8 10 12 14 16 18 20 22 24
Line 2 Line 7 Line 8
♂

Chapter 4
56
3.2. Absorption and growth efficiency
During the 24 hours in the respirometer, the amount of food eaten was assessed and the feces that were excreted were collected. The total calories of the food intake and the feces was determined (males only), and with this data the percentage of absorption of the food was calculated (figure 3). The high absorption rates of about 80-90% are comparable to data collected in other studies done with mice or rats (Carvajal et al. 2000; Chen et al. 2003; Lo et al. 2008; Santos, Coelho, and Coelho 2008). The animals that were on HFS diet show a significantly higher percentage of absorption compared to the chow fed animals (F(1,37)=14.82; p<0.001) irrespective of line.
Figure 3. The percentage of food that was absorbed from the total food that the male mice consumed during their time in the respirometer.
Growth efficiency was calculated by dividing the weekly food intake by the weekly change in body mass. The HFS-fed animals had a significantly higher growth efficiency than the LF-fed animals (♂: F(1,44)=26.30; p<0.001 and ♀: F(1,40)=11.12; p=0.002). Line 2 males on the LF diet had a significantly higher growth efficiency compared to line 8 (F(2,44)=4.64; p=0.025) and for the females on the HFS diet the growth efficiency of line 2 was significantly higher than that of line 7 and 8 females (F(2,40)=4.98; p=0.012).
3.3. Respirometer measurements
From the data output of the respirometer the daily energy expenditure (DEE) could be determined, which is shown in figure 5. Overall females had a higher DEE when feeding the
Line
2 7 8
% A
bso
rpti
on
0
20
40
60
80
100
Chow
Fat ♂

Diet and energetic, behavioral characters
57
Figure 4. The average growth efficiency over a period of 12 weeks in male (left panel) and female (right panel) mice.
Figure 5. The daily energy expenditure (DEE) measured over 24 hours in the respirometer in male (left panel) and female (right panel) mice. HFS diet than when they were feeding a LF diet (F(2,39)=6.35; p=0.016). In males a similar pattern can be seen but the difference was not significant.
Resting metabolic rate (RMR) is significantly influenced by body mass. Therefore, RMR is depicted as the lean mass-specific RMR in figure 6. The males show a significant line*diet interaction (F(2,44)=3.52; p=0.040) and line 2 animals appeared to have slightly lower RMR on the HFS diet compared to when they were feeding a LF diet. Lines 7 and 8 males, on the other hand, showed a slightly higher RMR when feeding the HFS diet (table 6). None of the groups, however, showed a significantly higher or lower RMR compared to the other groups in the post-hoc analysis, but there appears to be a trend of a higher RMR in the selection animals.
Line
2 7 8
DE
E (
kJ/d
)
40
50
60
70
80
Chow
Fat ♂
Line
2 7 8
DE
E (
kJ/d
)
40
50
60
70
80
Chow
Fat ♀
Line
2 7 8
Ch
an
ge
ma
ss
g/f
oo
d i
nta
ke g
/we
ek
0.000
0.005
0.010
0.015
0.020
0.025
0.030
0.035
Chow
Fat ♂
Line
2 7 8
Ch
an
ge m
ass g
/fo
od
in
tak
e g
/we
ek
0.000
0.005
0.010
0.015
0.020
0.025
0.030
Chow
Fat ♀

Chapter 4
58
Figure 6. The resting metabolic rate calculated from the measurements in the respirometer in male (left panel) and female (right panel) mice.
By subtracting RMR (i.e., non corrected for body mass) from DEE in each animal, this reveals energy allotted to thermogenesis by spontaneous activity and diet; the so-called non-exercise activity thermogenesis (NEAT), and the averages of energy expenditure by RMR and NEAT are depicted in figure 7. The effects of line and diet on the RMR have already been discussed in the previous section. Line 8 males have a significantly higher NEAT compared to the line 2 males (F(2,44)=4.36; p=0.020), irrespective of diet. In the females, both line 7 and 8 show a significantly higher NEAT than the control line (F(2,44)=3.65; p=0.036), irrespective of diet.
Figure 7. Energy spent during the time in the respirometer, consisting of the RMR and NEAT in male (left panel) and female (right panel) mice.
Chow-fed
2 7 8 2 7 8
0
10
20
30
40
50
60
70
RMR
NEAT
Fat-fed
En
erg
y (
kJ/d
ay)
♀
Line
2 7 8
Ma
ss-s
pec
ific
RM
R (
kJ/d
/g)
0.8
0.9
1.0
1.1
1.2
1.3
1.4
1.5
Chow
Fat ♂
Line
2 7 8
Ma
ss-s
pec
ific
RM
R (
kJ/d
/g)
0.8
1.0
1.2
1.4
1.6
1.8
Chow
Fat ♀
Chow-fed
2 7 8 2 7 8
En
erg
y (
kJ
/day)
0
10
20
30
40
50
60
70
RMR
NEAT
Fat-fed
♂

Diet and energetic, behavioral characters
59
3.4. Diet choice
The results of the diet choice test are presented in figure 8. The two diet groups had markedly different effects on diet selection; i.e., mice feeding LF-fed diet as their regular food almost exclusively ate HFS-diet during when given the choice between HFS and LF food, at both the inactive and active phase. Mice feeding the HFS diet as their regular food ate both LF as well as HFS diet during the choice test. This pattern is most clearly seen for the test in the morning, when all lines of HFS-fed animals ate considerable amount of LF diet (♂: F(1,43)=47.23; p<0.001 and ♀: F(1,40)=12.69; p<0.001). In the males, lines 7 and 8 eat significantly more LF diet than the line 2 males during the inactive morning phase (F(2,43)=6.10; p=0.005). In the females, only line 8 mice select more LF diet compared to line 2 mice (F(2,40)=5.66; p=0.035), and this was predominantly seen in the active phase (see table 6).
Figure 8. Diet choice test showing the food preference for both the inactive and active phase in male (left panel) and female (right panel) mice. Total intake is set at 100% for each animal, and the subsequent intake from HFS and LF diets are presented as grey and black bars.
3.5. Elevated plus maze
The results of the elevated plus maze test are shown in figure 9. Diet did not affect anxiety levels (expressed by time in open versus closed arm) in males. The females on the other hand, showed a significant line*diet interaction (F(2,40)=5.76; p=0.007). The three lines all showed a different response to the test. The LF-fed line 2 females spent significant less time in the closed arms F(2,40)=6.45; p=0.004) (indicating reduced levels of anxiety relative to selected lines), and line 8 females on the LF diet showed the lowest presence in the open arms (F(2,40)=5.76; p=0.007) (with line 7 as the intermediate). On the HFS diet, however, this picture in the females completely reversed. In males feeding the LF diet, a pattern with some similarity was found with the females on the LF diet, but these effects did not attain significance. On the HFS diet, males of the different showed exactly similar responses on the plus maze.
2 7 8 2 7 8 2 7 8 2 7 8
Fo
od
typ
e e
ate
n (
%)
0
20
40
60
80
100
Chow
Fat
Chow-fed Chow-fedFat-fed Fat-fed
Active phaseInactive phase♂
2 7 8 2 7 8 2 7 8 2 7 8
Fo
od
typ
e e
ate
n (
%)
0
20
40
60
80
100
Chow
Fat
Chow-fed Chow-fedFat-fed Fat-fed
Active phaseInactive phase♀

Chapter 4
60
Figure 9. Elevated plus maze test showing the percentage of time spend on both the open arm and the closed arm in male (left panel) and female (right panel) mice.
3.6. Stress test
The results of the novel cage test on plasma corticosterone levels are shown in figure 10. At baseline, no differences were observed plasma corticosterone levels in males and females between lines and diets. During the stress, however, male mice showed a line effect (F(2,41)=3.55; p=0.038), and post-hoc analysis revealed that line 7 had lower plasma corticosterone levels than line 2 males irrespective of diet. Effects in the females pointed in the opposite direction (i.e., with plasma corticosterone levels higher in line 7 mice compared to line 2 mice), but this effect failed to reach significance.
Figure 10. Stress test showing the amount of corticosterone measured in plasma for the baseline levels measured before the test and the stress levels measured after the test.
Pla
sm
a c
orti
co
ste
ro
ne (
ng
/ml)
0
100
200
300
400
500Line 2
Line 7
Line 8
Chow-fed Fat-fed
Baseline Stressed Baseline Stressed
♀
2 7 8 2 7 8
Tim
e in
maze a
rm
(%
)
0
20
40
60
80
100
Open
Closed
Chow-fed Fat-fed
♀
2 7 8 2 7 8
Tim
e i
n m
aze a
rm
(%
)
0
20
40
60
80
100
Open
Closed
Chow-fed Fat-fed
♂
Pla
sm
a c
orti
co
ste
ron
e (
ng
/ml)
0
100
200
300
400
500Line 2
Line 7
Line 8
Chow-fed Fat-fed
Baseline Stressed Baseline Stressed
♂

Diet and energetic, behavioral characters
61
4. Discussion
The present study investigated the effects of feeding a diet consisting of 40% saturated fat and 25% refined sugars on energy balance regulation and an array of behaviors in control mice as well as in mice selectively bred for increased wheel running behavior. It was hypothesized that the high activity lines, and in particular the females would be resistant to the obesogenic actions of the HFS diet, and the control line would be obesity prone. Since selection for wheel running behavior has been shown to cause co-selection of various traits (i.e., which may be helpful to sustain endurance behavior), these co-adaptations may also be hypothesized to be resistant to change.
Consistent with our hypothesis and previous observations was the finding in the present study that the line 7 and line 8 activity-selected males and female mice did not respond with weight gain on the HFS diet compared to those feeding the LF diet. Mechanisms underlying this effect included increased mass specific-resting metabolic rate (RMR) and a higher level of non-exercise activity thermogenesis (NEAT) (Donahoo, Levine, and Melanson 2004). Although not assessed in the present study, the latter effect is obviously associated with increased levels of spontaneous activity in the activity selected animals which has been shown to be displayed by these animals even without running wheels (Rhodes et al. 2001). The effects on RMR were significantly increased in activity selected males compared to the control males (and with a strong trend in the females), but depended on diet. Thus, while RMR decreased slightly in the control males in the HFS condition relative to the LF condition, RMR increased in line 7 and line 8 males in the HFS condition. In contrast, the level of NEAT was significantly increased in the activity selected mice irrespective of diet in males, but in females this effect was strongest in the HFS condition. Together, this rendered the highly active mice less growth efficient than the control mice. Differences in food absorption (at least in the males) could not account for this effect since we did not find differences in the energy content of feces by bom calorimetry among lines.
The diet resistance in the line 7 and line 8 females is remarkable in light of the findings that they ingested between 15~20% more food than the control females did, and hardly responded with a reduction in food intake when subjected to the HFS diet. The latter would be a “normal” response when animals are subjected to high amounts of dietary fat (van Heek et al. 1997). Opposite to our previous observation was the finding in the present study that not the control females, but the control males were prone to weight gain on the HFS diet. We have no data on the body composition analysis, but since diet manipulations were started at 11 weeks of age, it is unlikely that the effects are not attributed to differences in adiposity. Furthermore, we do not know whether the increased weight gain is due to the differences in dietary fat percentage (i.e., 60% fat in our previous studies vs. 40% fat in the present) or the addition of the sucrose in the present study. Harris et al (Harris, Bowen, and Mitchell 2003) demonstrated previously that female, but not male mice retain leptin sensitivity on a 45% HF diet. Since blunting of leptin signalling is a major cause underlying weight gain in rodents (Ruffin et al. 2004), and might

Chapter 4
62
underlie differences in resistance and proneness to diet-induced obesity (Levin and Dunn-Meynell 2002), this might very well explain differences in weight gain in the control and activity selected animals in the present study.
Despite resistance to weight gain in the selectively bred females, striking line differences were obtained in the female mice subjected to the elevated plus maze test. When feeding the LF diet, the line 2 females were the least anxious (indicated by the highest percentage of time present on the open arms) on the plus maze and the line 8 were most anxious. Line 7 LF feeding females showed an intermediate response. This confirms the findings of Chapter 2. On the HF diet, however, this pattern completely reversed, now the line 2 females were most anxious and line 8 ones the least. Thus, in control females, feeding the HFS diet increased anxiety levels whereas it reduced it in activity selected ones. Differential effects of dietary fat and sugars have been observed before on stress sensitivity and anxiety levels (Torres and Nowson 2007), and the direction of change may depend on the previous experience of animals (van Dijk and Buwalda 2008). One idea might be that the HFS diet enhances mood (Dallman et al. 2003) particularly in the highly activity females mice when they are not allowed to run in wheels, and through this mechanism could dampen anxiety and/or could replace diminished reward from abstinence of wheel running. In control females on the other hand, the HFS diet may have adverse effects on its own, which would be consistent with the study of Souza et al. (Souza et al. 2007).
If a diet is mood-enhancing, it would be of interest to test whether they also select more of it when given a choice of diets (la Fleur et al. 2007). We observed that the high-activity mice given a choice between the LF and HFS diet generally selected more of the LF diet than the line 2 mice did. The relative higher LF diet preference in the highly active mice was evident in males, and in females only in line 8. This differs slightly with the findings in Chapter 3, where particularly the line 7 females selected more the LF diet (although line 8 was not tested under those circumstances). Thus, if the HFS diet lightens up line 7 and line 8 animals (i.e., resulting in less anxiety in the plus maze test), this apparently does not correspond with the direct appreciation of the diet. While it is difficult to dissociate “wanting” and “liking” effects (Berridge, Robinson, and Aldridge 2009) of the diets in a two-hour diet choice test, one might speculate that the HFS diet gives less immediate reward in the high activity mice than the LF diet, but may enhance mood and dampens anxiety on the long-term. Another reason for selecting a certain diet could be that its macronutrient content is metabolically more appropriate (see Chapter 3). The present study does not confirm nor reject the latter possibility.
The differences in anxiety behavior and food selection were not reflected by differences in plasma corticosterone responses in the novel cage test in the present study. Line 7 males appeared to have significantly lower levels of plasma corticosterone than line 2 males irrespective of diet, but no differences were observed in the females between lines and diets. Thus, although Girard et al. found evidence for suppressed stress sensitivity in the selection mice compared to the controls (Malisch et al. 2008; Girard and Garland, Jr. 2002) - an effect which would be in line

Diet and energetic, behavioral characters
63
with reports showing stress relief as a result of physical activity (Salmon 2001) - we did not unequivocally confirm these ideas in the present study.
In summary, activity selected mice were resistant to weight gain when chronically subjected to a HFS diet, and changes in RMR and NEAT contributed to this effect. Male control mice, on the other hand, increased body weight on this HFS diet. The resistance to weight gain in the activity selected mice did not parallel resistance to the effects of the HFS diet on affective traits. On the contrary, the levels of anxiety and appreciation of the diet were different between control and selected mice in the LF condition, but moreover differentially regulated in the HFS diet condition. Furthermore, if animals in the present study would have been housed in cages with access to running wheels, it is quite possible that anxiety levels in the LF diet condition would have been lower in the activity selected animals (Salmon 2001). In the present study, the highly active mice seem to recover by feeding a HFS instead, without necessarily appreciating this diet more than control mice do. As such, physical activity and nutrition may be regarded as default systems that determine mental and physical health.
References
Belke, T. W. and T. Garland, Jr. 2007. A brief opportunity to run does not function as a reinforcer for mice selected for high daily wheel-running rates. J. Exp. Anal. Behav. 88:199-213.
Bell, R. R. and T. J. McGill. 1991. Body composition and brown adipose tissue in sedentary and active mice. Nutrition Research 11:633-642.
Bell, R. R., M. J. Spencer, and J. L. Sherriff. 1997. Voluntary exercise and monounsaturated canola oil reduce fat gain in mice fed diets high in fat. J. Nutr. 127:2006-2010.
Berridge, K. C., T. E. Robinson, and J. W. Aldridge. 2009. Dissecting components of reward: 'liking', 'wanting', and learning. Curr. Opin. Pharmacol. 9:65-73.
Brockmann, G. A. and M. R. Bevova. 2002. Using mouse models to dissect the genetics of obesity. Trends Genet. 18:367-376.
Carter, P. A., J. G. Swallow, S. J. Davis, and T. Garland, Jr. 2000. Nesting behavior of house mice (Mus domesticus) selected for increased wheel-running activity. Behav. Genet. 30:85-94.
Carvajal, O., M. Sakono, H. Sonoki, M. Nakayama, T. Kishi, M. Sato, I. Ikeda, M. Sugano, and K. Imaizumi. 2000. Structured triacylglycerol containing medium-chain fatty acids in sn-1(3) facilitates the absorption of dietary long-chain fatty acids in rats. Biosci. Biotechnol. Biochem. 64:793-798.
Chen, H., C. Wang, C. T. Chang, and T. Wang. 2003. Effects of Taiwanese yam (Dioscorea japonica Thunb var. pseudojaponica Yamamoto) on upper gut function and lipid metabolism in Balb/c mice. Nutrition 19:646-651.
Dallman, M. F., N. Pecoraro, S. F. Akana, S. E. la Fleur, F. Gomez, H. Houshyar, M. E. Bell, S. Bhatnagar, K. D. Laugero, and S. Manalo. 2003. Chronic stress and obesity: a new view of "comfort food". Proc. Natl. Acad. Sci. U. S. A 100:11696-11701.

Chapter 4
64
Dauncey, M. J. 1990. Activity and energy expenditure. Can. J. Physiol Pharmacol. 68:17-27.
Donahoo, W. T., J. A. Levine, and E. L. Melanson. 2004. Variability in energy expenditure and its components. Curr. Opin. Clin. Nutr. Metab Care 7:599-605.
Gammie, S. C., N. S. Hasen, J. S. Rhodes, I. Girard, and T. Garland, Jr. 2003. Predatory aggression, but not maternal or intermale aggression, is associated with high voluntary wheel-running behavior in mice. Horm. Behav. 44:209-221.
Garland, T., Jr., T. T. Gleeson, B. A. Aronovitz, C. S. Richardson, and M. R. Dohm. 1995. Maximal sprint speeds and muscle fiber composition of wild and laboratory house mice. Physiol Behav. 58:869-876.
Girard, I. and T. Garland, Jr. 2002. Plasma corticosterone response to acute and chronic voluntary exercise in female house mice. J. Appl. Physiol 92:1553-1561.
Girard, I., M. W. McAleer, J. S. Rhodes, and T. Garland, Jr. 2001. Selection for high voluntary wheel-running increases speed and intermittency in house mice (Mus domesticus). J. Exp. Biol. 204:4311-4320.
Harris, R. B., H. M. Bowen, and T. D. Mitchell. 2003. Leptin resistance in mice is determined by gender and duration of exposure to high-fat diet. Physiol Behav. 78:543-555.
Koteja, P., T. Garland, Jr., J. K. Sax, J. G. Swallow, and P. A. Carter. 1999. Behaviour of house mice artificially selected for high levels of voluntary wheel running. Anim Behav. 58:1307-1318.
la Fleur, S. E., L. J. Vanderschuren, M. C. Luijendijk, B. M. Kloeze, B. Tiesjema, and R. A. Adan. 2007. A reciprocal interaction between food-motivated behavior and diet-induced obesity. Int. J. Obes. (Lond) 31:1286-1294.
Levin, B. E. and A. A. Dunn-Meynell. 2002. Reduced central leptin sensitivity in rats with diet-induced obesity. Am. J. Physiol Regul. Integr. Comp Physiol 283:R941-R948.
Levin, B. E., A. A. Dunn-Meynell, B. Balkan, and R. E. Keesey. 1997. Selective breeding for diet-induced obesity and resistance in Sprague-Dawley rats. Am. J. Physiol 273:R725-R730.
Lo, C. M., L. C. Samuelson, J. B. Chambers, A. King, J. Heiman, R. J. Jandacek, R. R. Sakai, S. C. Benoit, H. E. Raybould, S. C. Woods, and P. Tso. 2008. Characterization of mice lacking the gene for cholecystokinin. Am. J. Physiol Regul. Integr. Comp Physiol 294:R803-R810.
Looy, H. and R. Eikelboom. 1989. Wheel running, food intake, and body weight in male rats. Physiol Behav. 45:403-405.
Malisch, J. L., C. W. Breuner, F. R. Gomes, M. A. Chappell, and T. Garland, Jr. 2008. Circadian pattern of total and free corticosterone concentrations, corticosteroid-binding globulin, and physical activity in mice selectively bred for high voluntary wheel-running behavior. Gen. Comp Endocrinol. 156:210-217.
Malisch, J. L., C. W. Breuner, E. M. Kolb, H. Wada, R. M. Hannon, M. A. Chappell, K. M. Middleton, and T. Garland, Jr. 2009. Behavioral despair and home-cage activity in mice with chronically elevated baseline corticosterone concentrations. Behav. Genet. 39:192-201.
Rhodes, J. S., G. R. Hosack, I. Girard, A. E. Kelley, G. S. Mitchell, and T. Garland, Jr. 2001. Differential sensitivity to acute administration of cocaine, GBR 12909, and fluoxetine in mice selectively bred for hyperactive wheel-running behavior. Psychopharmacology (Berl) 158:120-131.

Diet and energetic, behavioral characters
65
Romijn, C. and W. Lokhorst. 1964. Some aspects of poultry Metabolism. Zentralbl. Veterinarmed. A 11:297-314.
Ruffin, M. P., T. Adage, F. Kuipers, J. H. Strubbe, A. J. Scheurink, and G. van Dijk. 2004. Feeding and temperature responses to intravenous leptin infusion are differential predictors of obesity in rats. Am. J. Physiol Regul. Integr. Comp Physiol 286:R756-R763.
Salmon, P. 2001. Effects of physical exercise on anxiety, depression, and sensitivity to stress: a unifying theory. Clin. Psychol. Rev. 21:33-61.
Santos, A. R., K. L. Coelho, and C. A. Coelho. 2008. Effects of low fat and babassu fat diets on nutritional status in obstructive cholestasis in young rats. Acta Cir. Bras. 23:4-10.
Singer, J. B., A. E. Hill, L. C. Burrage, K. R. Olszens, J. Song, M. Justice, W. E. O'Brien, D. V. Conti, J. S. Witte, E. S. Lander, and J. H. Nadeau. 2004. Genetic dissection of complex traits with chromosome substitution strains of mice. Science 304:445-448.
Souza, C. G., J. D. Moreira, I. R. Siqueira, A. G. Pereira, D. K. Rieger, D. O. Souza, T. M. Souza, L. V. Portela, and M. L. Perry. 2007. Highly palatable diet consumption increases protein oxidation in rat frontal cortex and anxiety-like behavior. Life Sci. 81:198-203.
Swallow, J. G., P. A. Carter, and T. Garland, Jr. 1998a. Artificial selection for increased wheel-running behavior in house mice. Behav. Genet. 28:227-237.
Swallow, J. G., P. A. Carter, and T. Garland, Jr. 1998b. Artificial selection for increased wheel-running behavior in house mice. Behav. Genet. 28:227-237.
Swallow, J. G., P. Koteja, P. A. Carter, and T. Garland, Jr. 2001. Food consumption and body composition in mice selected for high wheel-running activity. J. Comp Physiol B 171:651-659.
Tokuyama, K., M. Saito, and H. Okuda. 1982. Effects of wheel running on food intake and weight gain of male and female rats. Physiol Behav. 28:899-903.
Torres, S. J. and C. A. Nowson. 2007. Relationship between stress, eating behavior, and obesity. Nutrition 23:887-894.
Vaanholt, L. M., B. De Jong, T. Garland, Jr., S. Daan, and G. H. Visser. 2007a. Behavioural and physiological responses to increased foraging effort in male mice. J. Exp. Biol. 210:2013-2024.
Vaanholt, L. M., T. Garland, Jr., S. Daan, and G. H. Visser. 2007b. Wheel-running activity and energy metabolism in relation to ambient temperature in mice selected for high wheel-running activity. J. Comp Physiol B 177:109-118.
Vaanholt, L. M., I. Jonas, M. Doornbos, K. A. Schubert, C. Nyakas, T. Garland, Jr., G. H. Visser, and D. G. van. 2008. Metabolic and behavioral responses to high-fat feeding in mice selectively bred for high wheel-running activity. Int. J. Obes. (Lond) 32:1566-1575.
van Dijk, G. and B. Buwalda. 2008. Neurobiology of the metabolic syndrome: an allostatic perspective. Eur. J. Pharmacol. 585:137-146.
van Heek, M., D. S. Compton, C. F. France, R. P. Tedesco, A. B. Fawzi, M. P. Graziano, E. J. Sybertz, C. D. Strader, and H. R. Davis, Jr. 1997. Diet-induced obese mice develop peripheral, but not central, resistance to leptin. J. Clin. Invest 99:385-390.


55
CCHHAAPPTTEERR
MICE SELECTIVELY BRED FOR HIGH WHEEL RUNNING ACTIVITY
HAVE INCREASED GROWTH EFFICIENCY DURING LACTATION
I. Jónás, K. A. Schubert, T. Garland Jr, A. J.W. Scheurink, C. Nyakas, and G.
van Dijk
Summary
We hypothesized that high voluntary physical activity would negatively affect growth efficiency
(GE) during lactation in mice. We assessed mother and litter characteristics during lactation
under low fat (LF) and high fat (HF) dietary feeding conditions in mice selectively bred for high
wheel-running behavior (lab-designated lines 7 and 8) and in a non-selected control line (line 2).
At birth, litter weights were lower in HF feeding mothers irrespective of line, and litter sizes were
larger in line 7 and 8 relative to line 2, irrespective of diet. Over the course of lactation, all
females lost pups, but HF feeding line 7 females lost significantly more than others. At peak
lactation (post-gestational days 13-16), litter weights but not maternal body masses of HF feeding
mothers became increased above LF ones. GE (calculated as weight gain of mothers and litters
divided by absorbed energy of mothers) during peak-lactation was higher in HF feeding than LF
feeding mothers, and statistically interacted with line, with both line 7 and 8 higher than line 2 in
the HF diet condition. Regression analysis revealed that this HF-diet effect to increase GE was
particularly the case at large litter sizes. It is concluded that a trait for increased physical activity
augments GE during HF diet feeding, but may have disadvantageous effects on pup survival.

Chapter 5
68
1. Introduction
Lactation is an energetically demanding occupation for mammals. In human beings, the
incremental energy cost of lactation adds approximately 25% to the normal energy requirements,
and this is met by an increase in food intake, mobilization of body fat reserves, and an increase in
metabolic efficiency (reviewed by (Butte and King 2005). In rodents, the energy cost of lactation
is estimated to increase even four-fold above normal energy requirements (Johnson, Thomson,
and Speakman 2001a). The maximum energy consumption and expenditure - termed sustainable
energy intake (SusEI) and sustainable metabolic rate (SusMR), respectively - during this period
have been suggested to be limited intrinsically by aspects of physiology, and this concept has been
outlined in a number of mouse studies by Krol and Speakman (Krol and Speakman 2003;
Speakman and Krol 2005; Krol, Murphy, and Speakman 2007) and earlier workers.
Over the course of lactation, laboratory house mice first show a linear increase in energy
intake and then it stabilizes to a maximum intake between days 13 and 16. This period has been
termed “peak lactation” (Thompson and Nicoll 1986). At peak lactation, Johnson et al observed
that the amount of ingested food correlates positively with litter size as well as litter mass
((Johnson, Thomson, and Speakman 2001a). Furthermore, resting metabolic rate (RMR) and
daily energy expenditure (DEE) of lactating dams also increase with increasing litter size
(Johnson, Thomson, and Speakman 2001a; Johnson, Thomson, and Speakman 2001b). Thus,
litter size may be important to determine the mother’s energy procurement to her pups, as
variation in litter mass was observed to be linearly related with litter size, without affecting
individual pup mass (Johnson, Thomson, and Speakman 2001a). However, when litter size
increases above a certain number, SusEI becomes limited, which subsequently causes a reduction
in average pup mass. One hypothesis by which SusEI is maximized states that a lactating animal
has the risk of lethal overheating when it is feeding litters that are too large (Krol and Speakman
2003). Thus, the maximum capacity to dissipate heat would then limit individual pup growth
above a certain litter size.
In the current study, the relation between maternal body weight, SusEI and resting
metabolic rate, litter size, litter weight, and individual pup growth was investigated during
lactation of female mice that were selectively bred for high wheel-running activity and in non-
selected controls. Female mice from the breeding line for increased running wheel activity have
low body masses together with a high level of energy turn-over (Vaanholt et al. 2008). On a high-
fat/high-sucrose "Western"-type diet they are markedly hyperphagic, but resistant to becoming
obese due to increased spontaneous activity and elevated heat production. In contrast, control
mice on this diet suppress their food intake, but have dramatically increased growth efficiency
(van Dijk et al. in preparation), and thus become obese (Vaanholt et al. 2008).
The major aim of the present study was to investigate whether the increased level of
performance (see also (Meek et al. 2009))of highly active mice alters afore-mentioned
relationships between SusEI and litter characteristics during lactation when feeding a standard
low-fat laboratory (LF) diet or a high fat/high sucrose (HF) diet. The one study reporting on

Growth efficiency during lactation
69
reproductive success and litter characteristics of these highly-active female mice from an earlier
generation showed that they do not differ in reproductive output, litter size, and litter mass from
control lines (Girard et al. 2002). When body masses of lactating females were taken into
account, selected mice tended to wean relative heavier litters than control females. Therefore, it
may be predicted that energy procurement to offspring of highly-active mice would be higher
and/or more efficient, particularly on a HF diet. Alternatively, it may be predicted that individual
pup growth becomes limited by activity of muscular tissue of highly-active mice feeding a HF
diet, which drains energy away from milk production, thus leading to a trade-off. This has been
mentioned by Krol et al. as a “peripheral” limiting factor to offspring development (Krol,
Johnson, and Speakman 2003). The likelihood of such a trade-off is supported by the
observation that, in a previous study, males from one of the selected lines did not exhibit an
increased maximum workload when mice were forced to work (via wheel running) for food
(Vaanholt et al. 2007).
2. Materials and methods
2.1. Animals and housing
Mice used in this study were selectively bred for voluntary wheel-running behavior (the base
population was the Hsd:ICR strain) over 49 generations and were obtained from T. Garland Jr,
Riverside, CA. In the original selection protocol, eight lines of mice were created (4 selected and 4
control) (Swallow, Carter, and Garland, Jr. 1998). Breeding lines were maintained at our facilities
in Haren without further selection for wheel-running activity. Mice were typically housed in
standard cages (Macrolon Type II, UNO Roestvaststaal BV, Zevenaar, NL) in the same room
with ad libitum access to water and a low-fat (LF) standard laboratory mouse chow (3.8 kcal/g;
58 % carbohydrate, 6 % fat, 22 % protein; RMH-B 2181, HopeFarms BV, Woerden, NL) at an
ambient temperature of 22±1 °C, and maintained on a 12:12 light-dark cycle with lights on at 8
am. Pine shavings and EnviroDry® were used as bedding material. All methods were approved
by, and are in agreement with the regulations of the Institutional Animal Use and Care
Committee of the University of Groningen. These regulations are consistent with the guidelines
for the care and use of laboratory animals as described by the U.S. National Institutes of Health.
From two selection lines (lab designation line 7, n=26; and line 8, n=26) and one control
line (line 2, n=24), virgin female mice at the age of 4.5 months were paired with males of equal
line. Two weeks before pairing, about half of the mice from each selection/control group were
switched from the LF diet to a high-fat (HF) diet, additionally containing sucrose (4.7 kcal/g; 30
% carbohydrate, 45 % fat, 18 % protein; AB Animal Diets, Woerden, NL). The others of each
group were left on the LF diet. After three weeks of pairing, males were removed and females
were left to deliver and raise their litters until weaning (see Table 1).

Chapter 5
70
Table 1. The number of paired females per line either feeding a low-fat (LF) or high-fat (HF)
diet, successful deliveries/weanings and the total pup counts at these time points.
Line
Diet LF HF LF HF LF HF
Females (n)
paired 13 11 12 14 12 14
successful deliveries 13 9 10 13 11 11 successfully weaned nests 13 9 9 10 10 11
Pups alive (n)
at birth 117 65 116 123 116 121 at weaning 114 62 77 73 95 119
2 Control 7 Selected 8 Selected
2.2. Mother and offspring characteristics from parturition to weaning
Maternal body mass was assessed once prior to breeding and after parturition, and daily
throughout the period of lactation. Food intake was also measured daily throughout lactation.
Bedding was also daily checked for spilled or crumbled food (Koteja et al. 2003). At peak
lactation (between day 13-16), besides assessing food intake, feces produced by the female and
her offspring over these 3 days were collected. The energy content in dried, homogenized feces
and food was determined using a bomb calorimeter (CBB 330, standard benzoic acid 6320 cal/g,
BCS-CRM No.90N). After day 16 (before offspring started to eat from food hoppers), mice
feeding the HF diet were switched back to feeding the LF diet.
The absorbed energy of the mothers at peak lactation was calculated from the difference
between energy intake and energy content of the feces, and subsequently used to calculate
efficiency of body weight gain of mother and pups (i.e., expressed as mg body weight gain/kJ
food absorbed). On the last day of peak lactation (day 16), animals were subjected to indirect
calorimetry to assess resting metabolic rate (RMR, kJ h-1) (Johnson, Thomson, and Speakman
2001b). Each animal was placed in a 2 L Plexiglas metabolic chamber at thermoneutrality
(30±1°C) for 4 hours. Home cage bedding was provided to reduce stress of novelty. During this
period, females were separated from their litters (which remained in their home cage) and did not
have access to food. Specifically, measurements included O2 consumption (VO2, ml h-1) and CO2
production (VCO2, ml h-1) with an open air flow system (Oklejewicz et al. 1997) with inlet airflow
set at 20 l hr-1 (Brooks Type 5850 mass flow controller, Rijswijk, NL). Channels were sampled in
sequence, with each measurement lasting one minute, and a reference channel measured at least
once every five minutes. Inlet and outlet air were dried (3 Å molecular sieve drying beads, Merck,
Darmstadt, Germany) and analyzed for gas concentrations with a paramagnetic oxygen analyzer
(Servomex Xentra 4100, Crowborough, UK) and infrared gas analyzer for CO2 (Servomex 1440).
The system recorded the differentials in oxygen and carbon dioxide between dried reference air
and dried air from the metabolic cages. Oxygen consumption was calculated using equation 2 of

Growth efficiency during lactation
71
Hill (Hill 1972) and expressed at standard temperature and pressure. We calculated the respiratory
quotient (RQ) as VCO2/VO2. Heat production (HP, kJ h-1) was calculated from the equation
formulated by (Romijn and Lokhorst 1961):
HP = 16.18 * VO2 + 5.02 * VCO2
We defined the RMR at peak lactation as the lowest value of a 20-minute running mean
of HP, typically the average of three consecutive measurement points which corresponded when
the animals were fully resting, as detected with Passive InfraRed sensors (PIRs). Metabolic rate
tended to decrease over time and reach a stable low level. Animals usually reached RMR after 3
hours in the measurement chamber. Following parturition, the number of pups and the total
mass of the litters were assessed and mean pup mass was calculated. Measurements were done at
birth (day 0-1), 13, 16 and 21 (weaning).
2.3. Statistical analysis
GLM Repeated Measures was used to analyze differences in body mass and food intake of
females through lactation. GLM Univariate Analysis was used to analyze differences in energetic
measures taken at peak lactation (food intake, RMR, PIR, energy content of feces, calculated
absorbed energy and growth efficiency) and for differences in litter characteristics. Multiple
regression analysis was performed to assess correlations between litter characteristics, as well as
between litter size and mother characteristics at peak lactation to reveal line and diet effects. A
value of p<0.05 (for 2-tailed tests) was considered significant for all tests.
3. Results
3.1. Mother characteristics
Before pregnancy, body weight of line 2 females was 22 % higher than that of line 7 and line 8
females (F(2,55)=24.2; p<0.001), irrespective of diet (Fig. 1). On the last day of pregnancy, a
doubling was observed in body weights of females relative to the day of conception
(F(2,55)=15.01; p<0.001), without any significant difference in body weight gain among lines or
between diets. After delivery, body weight of line 2 females was approximately 15 % higher
compared to line 7 and 8 females (F(2,56)=15.09; p<0.001), irrespective of diet. Within-subject
repeated measures analysis over days 1 through 16 revealed that body weight of line 8 females
increased significantly more (5.2±0.5 g) than that of line 2 females (1.4±0.8 g), while that of line 7
females gained intermediate weight (3.4±0.5 g) (line*time interaction: F(30,840)=2.96; p<0.001).
Furthermore, as can be seen in Figure 1, females fed the HF diet gained significantly less weight,
irrespective of line, than those fed the LF diet (diet*time interaction: F(15,840)=1.73; p<0.05).

Chapter 5
72
25
30
35
40
45
50
1 3 5 7 9 11 13 15 17 19 21
days of lactation
bo
dy
ma
ss
(g
)
line 2 LF
line 7 LF
line 8 LF
A
25
30
35
40
45
50
1 3 5 7 9 11 13 15 17 19 21
days of lactation
bo
dy
ma
ss
(g
)
line 2 HF
line 7 HF
line 8 HF
B
Figure 1. Body weight of line 2 (control line), line 7, and line 8 (selected lines) mothers fed a low-
fat (LF, panel A) or a high-fat (HF, panel B) diet during lactation.
Within-subject repeated measures analysis over days 1 through 16 revealed that food
intake (Fig. 2) of lactating females was increasing over time (F(14,770)=46.18; p<0.001). This
effect interacted with line (line*time: (F(28,770)=2.01; p<0.01), but not with diet. Specifically, line
2 mothers ate 3 times more over the 16-day period, whereas line 7 and line 8 mothers ate only 2.3
times more over the period of lactation. When GLM Univariate Analysis was performed for each
day, line 8 mothers were found to eat the most on the first and second day after delivery in the
HF diet group only (day 2: F(2,60)=3.55; p<0.05). Post-hoc differences were lost after day 2.
0
100
200
300
400
500
600
1 3 5 7 9 11 13 15 17 19 21
days of lactation
en
erg
y in
tak
e (
kJ
)
line 2 LF
line 7 LF
line 8 LF
A
0
100
200
300
400
500
600
1 3 5 7 9 11 13 15 17 19 21
days of lactation
en
erg
y in
tak
e (
kJ
)
line 2 HF
line 7 HF
line 8 HF
B
Figure 2. Energy intake of line 2 (control line), line 7, and line 8 (selected lines) mothers fed a
low-fat (LF, panel A) or a high-fat (HF, panel B) diet during lactation.
3.2. Litter characteristics
At birth, litter sizes of line 7 and line 8 females were significantly larger (F(2,61)=7.24; p<0.01)
than those of line 2 (see Table 2). Over the course of lactation, pups were found missing in all
lines, but, on average, line 7 females lost significantly more pups per litter than line 2 and 8
females, irrespective of diet (F(2,61)=8.68; p<0.001). Litter weight at birth was lower in females
fed the HF diet (F(1,60)=4.73; p<0.05), and litter weights of line 2 and 7 females contributed
mostly to this effect. At day 13, however, litter weight of HF-fed mothers became higher

Growth efficiency during lactation
73
(F(1,56)=4.36; p<0.05) compared to litters of LF-fed mothers. This effect was particularly
observed in line 8, which persisted until day 16 (F(1,56)=6.65; p<0.05). At day 13, litter weight
was also influenced by line (F(2,56)=5.20; p<0.01); i.e., litter weight of line 7 was smaller than
litter weight of line 2 and line 8 females, which remained at day 16 (F(2,55)=5.45; p<0.01) and
day 21 (F(2,55)=7.88; p<0.001). On day 21, effects of diet were lost, an effect presumably caused
by the fact that mothers were switched back to the LF diet (see table 2).
Mean individual pup mass at birth was 14% lower in line 7 and 12% lower in line 8 than
that of line 2 (F(2,60)=14.87; p<0.001), irrespective of diet. From day 13 onwards, these
differences became larger; mean pup mass of line 7 was 29 % lower and line 8 was 27 % lower
than that of line 2 (F(2,54)=29.48; p<0.001). Furthermore, mean pup mass became increased by
diet irrespective of line from day 13 onwards (F(1,56)=23.92; p<0.001) (see table 2).
Table 2. Litter characteristics of line 2 (control line), line 7, and line 8 (selected lines) mothers fed
a low-fat (LF) or a high-fat (HF) diet.
LF HF LF HF LF HF
Litter size
day 1 9.0 ± 0.8 7.2 ± 1.0 11.6 ± 0.5 # 9.5 ± 0.8 10.5 ± 0.6 11 ± 0.8
day 13 8.8 ± 0.8 6.9 ± 1.0 8.1 ± 1.3 5.8 ± 1.3 8.6 ± 1.3 10.9 ± 0.8
day 16 8.8 ± 0.8 6.9 ± 1.0 7.8 ± 1.3 5.6 ± 1.3 8.6 ± 1.3 10.8 ± 0.7
day 21 8.8 ± 0.8 6.9 ± 1.0 7.7 ± 1.3 5.6 ± 1.3 8.6 ± 1.3 10.8 ± 0.7
Litter weight
day 1 16.1 ± 1.2 12.5 ± 1.6 17.8 ± 0.7 14.3 ± 1.2* 16.4 ± 0.7 17.4 ± 1.0
day 13 68.4 ± 3.8 71.4 ± 7.1 48.2 ± 5.9 ## 53.8 ± 8.1 54.4 ± 5.2 # 76.8 ± 6.1*
day 16 75.7 ± 4.4 82.5 ± 8.1 53.1 ± 6.3 ## 61.5 ± 10.0 62.3 ± 5.2 89.9 ± 6.2**
day 21 103 ± 6.4 104.8 ± 10.6 65.6 ± 7.9 ## 74.3 ± 12.4 83.8 ± 8.3 113.6 ± 8.5
Mean pup mass
day 1 1.8 ± 0.1 1.8 ± 0.0 1.5 ± 0.0 ## 1.5 ± 0.0 1.6 ± 0.0 ## 1.6 ± 0.1
day 13 8.3 ± 0.5 10.9 ± 0.5** 5.5 ± 0.4 ## 7.2 ± 0.5* 5.9 ± 0.3 ## 7.1 ± 0.4*
day 16 9.1 ± 0.5 12.6 ± 0.7** 6.3 ± 0.4 ## 8.8 ± 0.5** 6.9 ± 0.4 ## 8.4 ± 0.5*
day 21 12.3 ± 0.6 16 ± 0.8** 7.9 ± 0.5 ## 10.4 ± 0.8* 9.4 ± 0.6 ## 10.6 ± 0.6
2 7 82 Control 7 Selected 8 Selected
# denotes significant difference with line 2 (line effect) (#, p<0.05; ##, p<0.01). *denotes
significance difference with LF diet (diet effect) (*, p<0.05; **, p<0.01).
3.3. Peak lactation
3.3.1. Maternal energetic characteristics
Table 3 shows maternal energetics during peak lactation (day 13-16). The total weight of food
eaten during peak lactation was significantly influenced by diet (F(1,59)=12.93; p<0.001).
Specifically, HF-fed mothers ate 18.2 % less than LF-fed females, without any effects of line.
Conversion to energy content of the food revealed that energy intake (in kJ) was not significantly
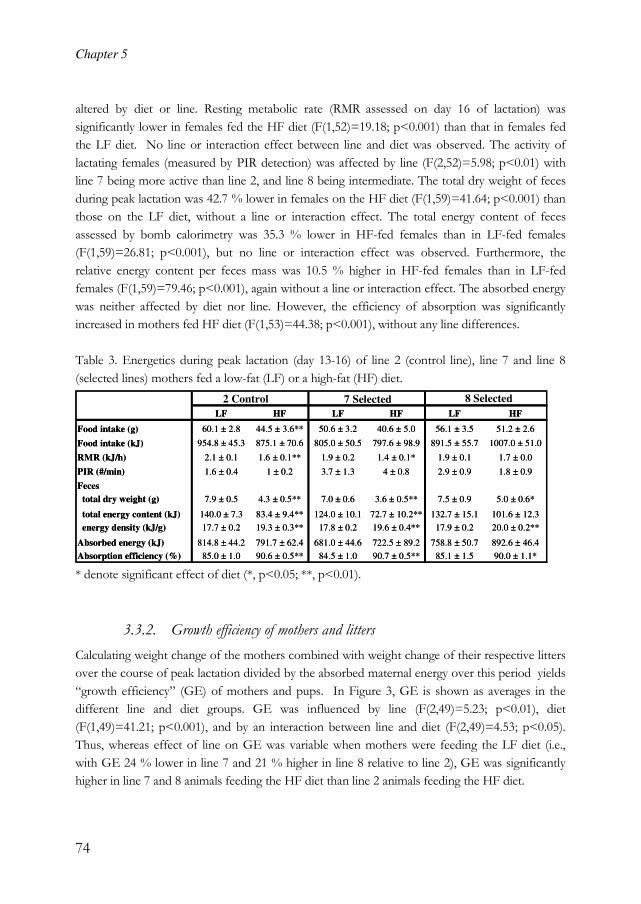
Chapter 5
74
altered by diet or line. Resting metabolic rate (RMR assessed on day 16 of lactation) was
significantly lower in females fed the HF diet (F(1,52)=19.18; p<0.001) than that in females fed
the LF diet. No line or interaction effect between line and diet was observed. The activity of
lactating females (measured by PIR detection) was affected by line (F(2,52)=5.98; p<0.01) with
line 7 being more active than line 2, and line 8 being intermediate. The total dry weight of feces
during peak lactation was 42.7 % lower in females on the HF diet (F(1,59)=41.64; p<0.001) than
those on the LF diet, without a line or interaction effect. The total energy content of feces
assessed by bomb calorimetry was 35.3 % lower in HF-fed females than in LF-fed females
(F(1,59)=26.81; p<0.001), but no line or interaction effect was observed. Furthermore, the
relative energy content per feces mass was 10.5 % higher in HF-fed females than in LF-fed
females (F(1,59)=79.46; p<0.001), again without a line or interaction effect. The absorbed energy
was neither affected by diet nor line. However, the efficiency of absorption was significantly
increased in mothers fed HF diet (F(1,53)=44.38; p<0.001), without any line differences.
Table 3. Energetics during peak lactation (day 13-16) of line 2 (control line), line 7 and line 8
(selected lines) mothers fed a low-fat (LF) or a high-fat (HF) diet.
LF HF LF HF LF HF
Food intake (g) 60.1 ± 2.8 44.5 ± 3.6** 50.6 ± 3.2 40.6 ± 5.0 56.1 ± 3.5 51.2 ± 2.6
Food intake (kJ) 954.8 ± 45.3 875.1 ± 70.6 805.0 ± 50.5 797.6 ± 98.9 891.5 ± 55.7 1007.0 ± 51.0
RMR (kJ/h) 2.1 ± 0.1 1.6 ± 0.1** 1.9 ± 0.2 1.4 ± 0.1* 1.9 ± 0.1 1.7 ± 0.0
PIR (#/min) 1.6 ± 0.4 1 ± 0.2 3.7 ± 1.3 4 ± 0.8 2.9 ± 0.9 1.8 ± 0.9
Feces
total dry weight (g) 7.9 ± 0.5 4.3 ± 0.5** 7.0 ± 0.6 3.6 ± 0.5** 7.5 ± 0.9 5.0 ± 0.6*
total energy content (kJ) 140.0 ± 7.3 83.4 ± 9.4** 124.0 ± 10.1 72.7 ± 10.2** 132.7 ± 15.1 101.6 ± 12.3
energy density (kJ/g) 17.7 ± 0.2 19.3 ± 0.3** 17.8 ± 0.2 19.6 ± 0.4** 17.9 ± 0.2 20.0 ± 0.2**
Absorbed energy (kJ) 814.8 ± 44.2 791.7 ± 62.4 681.0 ± 44.6 722.5 ± 89.2 758.8 ± 50.7 892.6 ± 46.4
Absorption efficiency (%) 85.0 ± 1.0 90.6 ± 0.5** 84.5 ± 1.0 90.7 ± 0.5** 85.1 ± 1.5 90.0 ± 1.1*
2 7 82 Control 7 Selected 8 Selected
* denote significant effect of diet (*, p<0.05; **, p<0.01).
3.3.2. Growth efficiency of mothers and litters
Calculating weight change of the mothers combined with weight change of their respective litters
over the course of peak lactation divided by the absorbed maternal energy over this period yields
“growth efficiency” (GE) of mothers and pups. In Figure 3, GE is shown as averages in the
different line and diet groups. GE was influenced by line (F(2,49)=5.23; p<0.01), diet
(F(1,49)=41.21; p<0.001), and by an interaction between line and diet (F(2,49)=4.53; p<0.05).
Thus, whereas effect of line on GE was variable when mothers were feeding the LF diet (i.e.,
with GE 24 % lower in line 7 and 21 % higher in line 8 relative to line 2), GE was significantly
higher in line 7 and 8 animals feeding the HF diet than line 2 animals feeding the HF diet.

Growth efficiency during lactation
75
0
4
8
12
16
20
2 7 8
mouse lines
GE
(m
g/k
J)
LF
HF*
#
*** *
Figure 3. Growth efficiency (GE) of line 2 (control line), line 7, and line 8 (selected lines) mothers
and their offspring fed a low-fat (LF) or a high-fat (HF) diet at peak lactation. # denotes
significant line effect (p<0.05). *denotes significance difference with LF diet (diet effect) (*,
p<0.05; ***, p<0.001).
3.4. Multiple regression analysis
It was reported previously that litter size is an important factor influencing (negatively) individual
pup mass (e.g., Hayes et al., 1992), but it also might influence maternal investments in the
offspring and therefore could affect ingestive behavior of the mother (Johnson, Thomson, and
Speakman 2001a). Using multiple regression analysis, we investigated whether the relation
between litter size and maternal and/or offspring traits were influenced by line and diet.
3.4.1. Litter size and mean pup mass
As expected and consistent with previous work of Johnson and colleagues (Johnson, Thomson,
and Speakman 2001a), mean pup mass was correlated in a negative direction to litter size at birth.
Within this correlation, pups of line 7 and line 8 weighed significantly less than those of line 2 at
each corresponding litter size. HF diet did not cause any change in mean pup mass at birth at
each corresponding litter sizes. From day 13 onwards, however, HF diet increased mean pup
mass compared to those of LF-fed mothers at each corresponding litter size, and this effect was
still observed at day 21.
Litter size remained negatively correlated to mean pup mass at day 13, 16, and 21.
Furthermore, at these time points, line 7 and line 8 pup masses interacted positively with litter
size, meaning that line 7 and line 8 pup masses were only smaller than those of line 2 pups in
relatively small but not in large litters independent of diet. The interactions are shown for day 16
(peak lactation) in figure 4, which are exemplary for days 13 and 21. For intercepts, slopes, and p-
values at the four time points of the lactation period, see Table 4.

Chapter 5
76
0
4
8
12
16
0 2 4 6 8 10 12 14 16
litter size
me
an
pu
p m
as
s (
g)
line 2 LF
line 7 LF
line 8 LF
A
0
4
8
12
16
0 2 4 6 8 10 12 14 16
litter size
me
an
pu
p m
as
s (
g)
line 2 HF
line 7 HF
line 8 HF
B
Figure 4. Relations between litter size and mean pup mass of line 2 (control line), line 7, and line
8 (selected lines) mothers fed a low-fat (LF, panel A) or a high-fat (HF, panel B) diet at peak
lactation. Least-squares linear regressions are shown overall in LF diet condition: R2=0.31,
p=0.001; and in HF diet condition: R2=0.49, p<0.001.
Table 4. Multiple regression analysis of litter size in relation to mean pup mass and litter weight at
day 1 (birth), day 13, day 16, and day 21 (weaning) in interaction with line and diet.
B p-level B p-level B p-level B p-level
MEAN PUP MASS
Intercept 2.21 <0.001 12.76 <0.001 13.94 <0.001 19.42 <0.001littersize -0.04 <0.001 -0.50 <0.001 -0.55 <0.001 -0.79 <0.001Diet -0.26 0.040 1.52 <0.001 2.50 <0.001Line 7 -0.17 <0.001 -6.22 <0.001 -5.37 <0.001 -8.71 <0.001Line 8 -6.06 <0.001 -4.89 <0.001 -6.57 <0.001Line 7 x DietLine 8 x DietLine 7 x Litter size 0.39 0.001 0.29 0.028 0.47 0.001Line 8 x Litter size -0.02 0.001 0.41 0.002 0.32 0.010 0.42 0.031Diet x Litter size 0.27 <0.001Line 7 x Diet x Litter sizeLine 8 x Diet x Litter size
LITTER WEIGHTIntercept 1.55 0.038 29.90 <0.001 29.23 <0.001 41.62 <0.001littersize 1.58 <0.001 4.44 <0.001 5.33 <0.001 7.00 <0.001DietLine 7 -21.70 <0.001 -22.52 <0.001 -35.07 <0.001Line 8 3.24 0.023 -18.15 <0.001Line 7 x DietLine 8 x DietLine 7 x Litter sizeLine 8 x Litter size -0.46 0.001 -1.85 <0.001Diet x Litter size 1.56 <0.001 2.19 <0.001 2.17 <0.001Line 7 x Diet x Litter sizeLine 8 x Diet x Litter size
day 21day 13 day 16day 1p p p pB p-level B p-level B p-level B p-level
MEAN PUP MASS
Intercept 2.21 <0.001 12.76 <0.001 13.94 <0.001 19.42 <0.001littersize -0.04 <0.001 -0.50 <0.001 -0.55 <0.001 -0.79 <0.001Diet -0.26 0.040 1.52 <0.001 2.50 <0.001Line 7 -0.17 <0.001 -6.22 <0.001 -5.37 <0.001 -8.71 <0.001Line 8 -6.06 <0.001 -4.89 <0.001 -6.57 <0.001Line 7 x DietLine 8 x DietLine 7 x Litter size 0.39 0.001 0.29 0.028 0.47 0.001Line 8 x Litter size -0.02 0.001 0.41 0.002 0.32 0.010 0.42 0.031Diet x Litter size 0.27 <0.001Line 7 x Diet x Litter sizeLine 8 x Diet x Litter size
LITTER WEIGHTIntercept 1.55 0.038 29.90 <0.001 29.23 <0.001 41.62 <0.001littersize 1.58 <0.001 4.44 <0.001 5.33 <0.001 7.00 <0.001DietLine 7 -21.70 <0.001 -22.52 <0.001 -35.07 <0.001Line 8 3.24 0.023 -18.15 <0.001Line 7 x DietLine 8 x DietLine 7 x Litter sizeLine 8 x Litter size -0.46 0.001 -1.85 <0.001Diet x Litter size 1.56 <0.001 2.19 <0.001 2.17 <0.001Line 7 x Diet x Litter sizeLine 8 x Diet x Litter size
day 21day 13 day 16day 1p p p p
Intercept (B) is shown by main effects and the interaction terms between line and diet; slope is
shown by the two- and three-way interaction terms with litter size. P indicates the level of
significance.

Growth efficiency during lactation
77
3.4.2. Litter size and litter weight
If mean pup mass contributes to the weight of a litter, then one would expect that litter size is
positively correlated to litter weight, and that was indeed the case at birth as well as during other
time points over the period of lactation. Line 7 had smaller litter weights than line 2 at each
corresponding litter size from day 13 onwards. Line 8 also had smaller litter weights than line 2 in
interaction with litter size at birth and at day 16, meaning that litter weights of line 8 were smaller
only at large litter sizes. Furthermore, at day 13, litter weights of line 8 were smaller than those of
line 2 at each corresponding litter size. At day 21, differences between lines were lost. Diet alone
did not contribute to this model, but there was a significant interaction between diet and litter
size from day 13 onwards (see Fig. 5 and Table 4).
0
20
40
60
80
100
120
140
0 2 4 6 8 10 12 14 16
litter size
litt
er w
eig
ht
(g)
line 2 LF
line 7 LF
line 8 LF
A
0
20
40
60
80
100
120
140
0 2 4 6 8 10 12 14 16
litter size
litt
er w
eig
ht
(g)
line 2 HF
line 7 HF
line 8 HF
B
Figure 5. Relationship between litter size and litter weight of line 2 (control line), line 7 and line 8
(selected lines) mothers fed a low-fat (LF, panel A) or a high-fat (HF, panel B) diet at peak
lactation. Least-squares linear regressions are shown overall in LF diet condition: R2=0.53,
p<0.001; and in HF diet condition: R2=0.69, p<0.001.
3.4.3. Litter size and maternal energy absorption at peak lactation
As mentioned earlier, SusEI is maximized during the period of peak lactation, and the effect of
energy procurement to each pup thus depends on litter size. The finding that mean pup mass was
smaller only at small litter sizes but not at large ones in the selection lines makes it of interest to
test relationships between litter size and absorbed energy. As expected, multiple regression
analysis revealed a positive relation between absorbed energy and litter size (Table 5 and Fig. 6).
Within this relation, feeding the HF diet caused the slope of the regression line to be more
positive than for mice feeding the LF diet, which indicates that the absorbed energy was
increased only at large litter sizes. Line 7 mice had significantly smaller absorption than line 2 at
each corresponding litter size. Absorbed energy of line 8 was similar to that of line 2 in relation to
litter size.

Chapter 5
78
0
200
400
600
800
1000
1200
0 2 4 6 8 10 12 14 16
litter size
ab
so
rb
ed
en
erg
y (
kJ
) line 2 LF
line 7 LF
line 8 LF
0
200
400
600
800
1000
1200
0 2 4 6 8 10 12 14 16
litter size
ab
so
rb
ed
en
erg
y (
kJ
)
line 2 HF
line 7 HF
line 8 HF
Figure 6. Relations between litter size and maternal absorbed energy of line 2 (control line), line 7
and line 8 (selected lines) mothers fed a low-fat (LF, left panel) or a high-fat (HF, right panel) diet
at peak lactation. Least-squares linear regressions are shown overall in LF diet condition:
R2=0.48, p<0.001; and in HF diet condition: R2=0.62, p<0.001.
Table 5. Multiple regression analysis between litter size and maternal/offspring traits (absorbed
energy, combined weight gain of litter and mother, growth efficiency (GE) and Resting Metabolic
Rate (RMR) during peak lactation in interaction with line and diet.
B p B p-level B p-level B p-level
Intercept 484.39 <0.001 5.76 <0.001 10.18 <0.001 1.54 <0.001littersize 36.00 <0.001 0.07 <0.001Diet -0.38 <0.001Line 7 -206.79 0.024 -2.43 0.029Line 8 10.42 <0.001 -0.24 0.025Line 7 x Diet 4.93 0.002Line 8 x DietLine 7 x Litter size -0.03 0.025Line 8 x Litter size -0.85 <0.001Diet x Litter size 10.08 0.003 0.76 0.002 0.42 <0.001Line 7 x Diet x Litter sizeLine 8 x Diet x Litter size
RMRGEComb. weight gain Absorbed energy
p p pB p B p-level B p-level B p-level
Intercept 484.39 <0.001 5.76 <0.001 10.18 <0.001 1.54 <0.001littersize 36.00 <0.001 0.07 <0.001Diet -0.38 <0.001Line 7 -206.79 0.024 -2.43 0.029Line 8 10.42 <0.001 -0.24 0.025Line 7 x Diet 4.93 0.002Line 8 x DietLine 7 x Litter size -0.03 0.025Line 8 x Litter size -0.85 <0.001Diet x Litter size 10.08 0.003 0.76 0.002 0.42 <0.001Line 7 x Diet x Litter sizeLine 8 x Diet x Litter size
RMRGEComb. weight gain Absorbed energy
p p p
Intercept (B) is shown by main effects and the interactions term between line and diet; slope is
shown by the two- and three-way interaction terms with litter size. P indicates the level of
significance.
3.4.4. Interaction between litter size and combined weight gain of litter and
mother
Litter size was not correlated with the combined weight gain of litter and mother over the course
of peak lactation in the LF feeding condition (Table 5 and Fig. 7). However, the HF diet
increased combined weight gain of litter and mother in interaction with litter size, meaning that
combined weight gain was increased in the HF diet condition compared to the LF diet condition

Growth efficiency during lactation
79
only at large litter sizes. Combined weight gain of line 7 and line 8 was not different from that of
line 2.
0
5
10
15
20
25
30
0 2 4 6 8 10 12 14 16
litter size
co
mb
ine
d w
eig
ht
ga
in o
f
litt
er a
nd
mo
the
r
line 2 LF
line 7 LF
line 8 LF
A
0
5
10
15
20
25
30
0 2 4 6 8 10 12 14 16
litter size
co
mb
ine
d w
eig
ht
ga
in o
f
litt
er a
nd
mo
the
r
line 2 HF
line 7 HF
line 8 HF
B
Figure 7. Relations between litter size and combined weight gain of line 2 (control line), line 7,
and line 8 (selected lines) mothers and their litters fed a low-fat (LF, panel A) or a high-fat (HF,
panel B) diet at peak lactation. Least-squares linear regressions are shown overall in LF diet
condition: R2=0.06, p=0.186; and in HF diet condition: R2=0.57, p<0.001.
3.4.5. Interactions between litter size and GE at peak lactation
Litter size was not correlated with GE when animals fed the LF diet (Table 5 and Fig. 8).
However, viewing lines separately, we observed that line 8 had a negative relationship with litter
size, meaning that GE of line 8 was increased only at small litter sizes relative to that of line 2.
Line 7 had smaller GE than line 2 at each corresponding litter size when fed a LF diet. Compared
to the LF diet condition, HF diet caused an increase in GE only at large litter sizes, although the
overall correlation was weak. Furthermore, HF diet caused line 7 to increase their GE to a larger
extent than line 2 females and pups at each corresponding litter size.
0
5
10
15
20
25
0 2 4 6 8 10 12 14 16
litter size
GE
(m
g/k
J)
line 2 LF
line 7 LF
line 8 LF
A
0
5
10
15
20
25
0 2 4 6 8 10 12 14 16
litter size
GE
(m
g/k
J)
line 2 HF
line 7 HF
line 8 HF
B
Figure 8. Relationship between litter size and GE of line 2 (control line), line 7 and line 8
(selected lines) mothers and litters fed a low-fat (LF, panel A) or a high-fat (HF, panel B) diet at
peak lactation. Least-squares linear regressions are shown overall in LF diet condition: R2=0.05,
p=0.26; and in HF diet condition: R2=0.17, p=0.039.

Chapter 5
80
3.4.6. Interactions between litter size and RMR
Litter size was positively correlated with maternal RMR (Table 5 and Fig. 9). Line 7 showed an
interaction with litter size, meaning that at large litter sizes RMR of line 7 mothers was lower than
that of line 2 when fed the LF diet. Line 8 mothers fed the LF diet had lower RMR relative to
line 2 at each corresponding litter size. HF diet decreased RMR at each corresponding litter size
compared to the LF condition.
0
1
2
3
0 2 4 6 8 10 12 14 16
litter size
RM
R (
kJ/h
)
line 2 LF
line 7 LF
line 8 LF
A
0
1
2
3
0 2 4 6 8 10 12 14 16
litter size
RM
R (
kJ/h
)
line 2 HF
line 7 HF
line 8 HF
B
Figure 9. Relationship between litter size and resting metabolic rate (RMR) of line 2 (control line),
line 7 and line 8 (selected lines) mothers fed a low-fat (LF, panel A) or a high-fat (HF, panel B)
diet at peak lactation. Least-squares linear regressions are shown overall in LF diet condition:
R2=0.14, p=0.049; and in HF diet condition: R2=0.57, p<0.001.
4. Discussion
The capacity to turn-over energy efficiently and at a high rate is an important asset to maintain a
high level of physical activity over a long period. Finding nutrients under conditions of
(anticipated) famine, or escaping increased levels of predation, for example, may rely on this
capacity, and probably served as selective factors for many species. In many species,
reproduction is a condition during which energy absorption and metabolic efficiency are
increased, and often maximized. Rodents, for example, give birth to relatively large litters with a
high growth rate, and subsequently face enormous energetic challenges during lactation (Johnson,
Thomson, and Speakman 2001a; Johnson, Thomson, and Speakman 2001b). In the present
study, we tested the hypothesis that a high capacity for physical activity and energy turn-over
negatively affects a number of lactation characteristics, which we investigated in two mouse lines
(designated line 7 and line 8) selectively bred for high voluntary wheel-running behavior and in a
randomly bred control line (line 2) (see Swallow et al. 1998a) under conditions of feeding a low-
fat (LF) or a high-fat/high-sucrose (HF) diet.
During pregnancy, line 7 and line 8 females were smaller than line 2 females - as under
non-reproductive conditions – and also delivered pups with a lower birth weight. The number of
newborn pups per litter, however, was increased in line 7 and 8 compared to line 2. While this

Growth efficiency during lactation
81
difference is largely consistent with a previous report on these activity-selected mice (Girard et al.
2002), a reduction in individual pup mass may be explained by energetic limitations intrinsically
imposed by the size of the litter the pups were born in. As expected according to the work of
Hayes et al. (1992), Johnson et al, and others, (Johnson, Thomson, and Speakman 2001a), mean
pup mass was indeed correlated in a negative direction to litter size at birth in the present study.
Within this correlation, however, pups of line 7 and line 8 weighed significantly less than those of
line 2 at each corresponding litter size. Thus, selective breeding for increased physical activity has
caused animals in these two lines to be smaller per sé - perhaps as an adaptation to limit
incremental cost of locomotion (Rezende et al. 2006b) - rather than being the consequence of
higher litter sizes in line 7 and line 8 mice relative to line 2. Diet effects on birth characteristics
were less conspicuous, although a tendency was observed for lower litter sizes and weights in the
HF diet condition in lines 2 and 7, but not in line 8, compared to the LF diet condition.
Differences in vulnerability to HF-diet induced lipotoxicity may have caused line-specific effects
(McCurdy et al. 2009). Over the course of lactation, litter weight and individual pup mass became increased in
the HF diet condition irrespective of line relative to the LF condition, despite the fact that
absorbed energy was indistinguishable between diets and lines. As resting metabolic rate (RMR)
of the HF diet feeding mothers was lower than of the LF feeding mothers at corresponding litter
sizes, it is conceivable that more nutrients became available for lactation. This could have
subsequently increased the flow of nutrients derived from dietary fat, presumably without first
being processed by de novo lipogenesis in the condition of the LF diet (Rudolph, Neville, and
Anderson 2007; Neville and Picciano 1997). Secondly, dietary fat causes lower thermic effects of
ingestion than carbohydrate (Donato 1987), which allows more energy to be available for
production of milk as well, and refined sugars are more easily absorbed. A consequence of this is
that sustainable energy intake (SusEI) could have been elevated more easily without running the
risk of lethal overheating, as suggested by the heat dissipation hypothesis of Krol and Speakman
and colleagues (Krol and Speakman 2003). In line with this is the notion that above-mentioned
effects of the HF diet to increase energy absorption and litter weight gain occurred specifically at
large litter sizes, i.e., when SusEI would have been maximized sooner in the LF condition than in
the HF condition.
When maternal energy absorption was taken into account during peak lactation (i.e.,
when energy intake by the mother reached a plateau between days 13 and 16), also growth
efficiency (GE) of mother and pups was higher in the HF diet condition than in the LF
condition. Interestingly, this effect appeared significantly stronger in both of the high-activity
selected lines as compared with the control line. These data therefore imply that a trait for
increased voluntary activity increases efficiency by which lactating females can procure energy for
growth. At this point, we do not know whether the HF diet-induced exaggeration of GE in the
high-activity lines was due to a more efficient mobilization of fuels for production of milk in the
mammary tissue of the lactating mothers, to increased growth efficiency of line 7 and line 8 pups,

Chapter 5
82
or both. RMR of the mother assessed by indirect calorimetry during peak lactation did not seem
to play a role in the observed effects since the average values were affected by diet, but not by an
interaction between line and diet. Furthermore, viewing RMR in relation to litter size only
revealed differences between lines in the LF, but not in the HF diet condition, thus ruling out a
potential role of this trait in the observed differences in GE. Under non-reproductive conditions,
a physically active state is associated with increased energy requirements and fast nutrient
mobilization and utilization (Hamilton and Booth 2000). This has also been supported by studies
in selection lines having increased metabolic turn-over (Vaanholt et al. 2008) and increased
aerobic capacity (Swallow et al. 1998). To facilitate these processes, there may be muscular
enzymatic changes, which promote aerobic capacity (Rezende et al. 2006a; Vaanholt et al. 2008;
Wong et al. 2009; Houle-Leroy et al. 2000). Provided that these differences exist in the
reproductive state between the highly active animals and their controls, this might fuel mammary
glands more optimally in the selected mothers, particularly in the HF condition. Studies in
humans have shown that physical exercise can increase fertility and reproduction success by
causing an increase in placental growth and vascularization only in the condition of obesity, i.e., a
situation which might share some homology with the HF diet condition in the present study
(Rich-Edwards et al. 2002; Weissgerber et al. 2006). Thus, animals with a trait for increased
physical activity may redirect their high level of fat turn-over during the non-reproductive phase
towards offspring development during lactation. This, however, does not rule out the possibility
that line 7 and line 8 pups are more efficiently utilizing the nutrients obtained from the mother
and add significantly to the increased growth efficiency of line 7 and line 8 animals relative to the
line 2 animals.
Besides similarities in birth characteristics and GEs during peak lactation, a major
difference between the two high-activity lines was that line 7 mothers, but not line 8 mothers, lost
37% of their offspring irrespective of diet. Perhaps the suppression of behavioral hyperactivity
normally seen during lactation (Karasawa, Suwa, and Kimura 1981; Collier et al. 1984) was less
effective in line 7 mothers than in line 8 and line 2 mothers, and this is indeed consistent with the
higher PIR count during indirect calorimetry in the line 7 mothers. Physically active lactating
mothers may be draining fuels away from milk production towards muscular activity (Speakman
and Krol 2005). Such a mechanism is supported by our most recent observation that animals
forced to work during lactation had increased pup loss and pups with stunted pup growth. One
of the main differences among that studies and the current one is that selected animals in the
present study were not forced to be active. We do not know at this point whether the increased
voluntary and/or forced locomotor activity in these and other studies interfered directly with
maternal care. At least, assessment of maternal care of these activity-selected mouse strains at
generation 21 did not reveal differences in maternal care, but neither was there a difference in
locomotor activity relative to the control lines when dams were housed without wheel access
(Girard et al. 2002). Further studies must be performed to unravel the mechanisms of pup loss
by line 7 mothers, as opposed to the other lines.

Growth efficiency during lactation
83
In summary, selection for high voluntary wheel-running activity generally favored
increased growth efficiency (GE) when the mice were feeding a HF diet during pregnancy and
lactation, but had variable effects when they were feeding a LF. The effects of the HF diet to
promote GE occurred irrespective of reproductive success, as pup loss was variable among lines.
It may be argued that the increased GE is adaptive for animals that need to cover a large habitat
to fulfill nutritional requirements.
References
Butte, N. F. and King, J. C. (2005). Energy requirements during pregnancy and lactation. Public Health Nutr.
8, 1010-1027.
Collier, R. J. et al. (1984). A review of endocrine regulation of metabolism during lactation. J.Anim Sci. 59,
498-510.
Donato, K. A. (1987). Efficiency and utilization of various energy sources for growth. Am.J.Clin.Nutr. 45,
164-167.
Girard, I. et al. (2002). Maternal-care behavior and life-history traits in house mice (Mus domesticus)
artificially selected for high voluntary wheel-running activity. Behav.Processes 57, 37-50.
Hamilton, M. T. and Booth, F. W. (2000). Skeletal muscle adaptation to exercise: a century of progress.
J.Appl.Physiol 88, 327-331.
Hill, R. W. (1972). Determination of oxygen consumption by use of the paramagnetic oxygen analyzer.
J.Appl.Physiol 33, 261-263.
Houle-Leroy, P. et al. (2000). Effects of voluntary activity and genetic selection on muscle metabolic
capacities in house mice Mus domesticus. J.Appl.Physiol 89, 1608-1616.
Johnson, M. S., Thomson, S. C., and Speakman, J. R. (2001a). Limits to sustained energy intake. I. Lactation
in the laboratory mouse Mus musculus. J.Exp.Biol. 204, 1925-1935.
Johnson, M. S., Thomson, S. C., and Speakman, J. R. (2001b). Limits to sustained energy intake. II. Inter-
relationships between resting metabolic rate, life-history traits and morphology in Mus musculus.
J.Exp.Biol. 204, 1937-1946.
Karasawa, K., Suwa, J., and Kimura, S. (1981). Voluntary exercise during pregnancy and lactation and its
effect on lactational performance in mice. J.Nutr.Sci.Vitaminol.(Tokyo) 27, 333-339.
Koteja, P. et al. (2003). Different effects of intensity and duration of locomotor activity on circadian period.
J.Biol.Rhythms 18, 491-501.
Krol, E., Johnson, M. S., and Speakman, J. R. (2003). Limits to sustained energy intake. VIII. Resting
metabolic rate and organ morphology of laboratory mice lactating at thermoneutrality. J.Exp.Biol.
206, 4283-4291.
Krol, E., Murphy, M., and Speakman, J. R. (2007). Limits to sustained energy intake. X. Effects of fur
removal on reproductive performance in laboratory mice. J.Exp.Biol. 210, 4233-4243.

Chapter 5
84
Krol, E. and Speakman, J. R. (2003). Limits to sustained energy intake. VI. Energetics of lactation in
laboratory mice at thermoneutrality. J.Exp.Biol. 206, 4255-4266.
McCurdy, C. E. et al. (2009). Maternal high-fat diet triggers lipotoxicity in the fetal livers of nonhuman
primates. J.Clin.Invest 119, 323-335.
Meek, T. H. et al. (2009). Endurance capacity of mice selectively bred for high voluntary wheel running.
J.Exp.Biol. 212, 2908-2917.
Neville, M. C. and Picciano, M. F. (1997). Regulation of milk lipid secretion and composition.
Annu.Rev.Nutr. 17, 159-183.
Oklejewicz, M. et al. (1997). Metabolic rate changes proportionally to circadian frequency in tau mutant
Syrian hamsters. J.Biol.Rhythms 12, 413-422.
Rezende, E. L. et al. (2006a). Maximal oxygen consumption in relation to subordinate traits in lines of house
mice selectively bred for high voluntary wheel running. J.Appl.Physiol 101, 477-485.
Rezende, E. L. et al. (2006b). Effects of size, sex, and voluntary running speeds on costs of locomotion in
lines of laboratory mice selectively bred for high wheel-running activity. Physiol Biochem.Zool. 79,
83-99.
Rich-Edwards, J. W. et al. (2002). Physical activity, body mass index, and ovulatory disorder infertility.
Epidemiology 13, 184-190.
Romijn, C. and Lokhorst, W. (1961). Some aspects of energy metabolism in birds. Proceedings second
symposium on energy metabolism (eds.Brouwer, E.and van Es, A.J.H.) 49-58.
Rudolph, M. C., Neville, M. C., and Anderson, S. M. (2007). Lipid synthesis in lactation: diet and the fatty
acid switch. J.Mammary.Gland.Biol.Neoplasia. 12, 269-281.
Speakman, J. R. and Krol, E. (2005). Limits to sustained energy intake IX: a review of hypotheses. J.Comp
Physiol [B] 175, 375-394.
Swallow, J. G., Carter, P. A., and Garland, T., Jr. (1998a). Artificial selection for increased wheel-running
behavior in house mice. Behav.Genet. 28, 227-237.
Swallow, J. G. et al. (1998b). Effects of voluntary activity and genetic selection on aerobic capacity in house
mice (Mus domesticus). J.Appl.Physiol 84, 69-76.
Thompson, S. D. and Nicoll, M. E. (1986). Basal metabolic rate and energetics of reproduction in therian
mammals. Nature 321, 690-693.
Vaanholt, L. M. et al. (2007). Behavioural and physiological responses to increased foraging effort in male
mice. J.Exp.Biol. 210, 2013-2024.
Vaanholt, L. M. et al. (2008). Metabolic and behavioral responses to high-fat feeding in mice selectively bred
for high wheel-running activity. Int.J.Obes.(Lond) 32, 1566-1575.
Weissgerber, T. L. et al. (2006). Exercise in the prevention and treatment of maternal-fetal disease: a review
of the literature. Appl.Physiol Nutr.Metab 31, 661-674.
Wong, L. E. et al. (2009). Anatomic capillarization is elevated in the medial gastrocnemius muscle of mighty
mini mice. J.Appl.Physiol 106, 1660-1667.

Growth efficiency during lactation
85


66
CCHHAAPPTTEERR
MICE SELECTIVELY BRED FOR HIGH VOLUNTARY RUNNING ARE
RESISTANT TO PERINATAL PROGRAMMING OF WEIGHT GAIN BY A
HIGH FAT DIET
I. Jónás, K. Schubert, T. Garland Jr, A. J.W. Scheurink, C. Nyakas, G. van Dijk
Summary
Feeding a high-fat/high sucrose (HF) diet during perinatal life programs offspring energy balance
and may cause several health disturbing diseases associated with obesity at adulthood. However,
a trait for high physical activity may balance and prevent these effects in the offspring. We
hypothesized that selective breeding for high voluntary running in mice would protect offspring
against these deleterious effects of perinatal HF feeding. Regression analysis, besides mean
comparisons, was performed to investigate contribution of naturally occurring litter size in the
effect of diet. At adulthood, HF diet caused proportional weight gain in male but not female
offspring of the control line with elevated plasma insulin and low adiponectin levels. This was
observed independent of the size of litter, but with a higher risk in small litter male offspring.
Control female offspring from larger litter sizes developed elevated levels of glucose and
cholesterol which might be the consequence of their increased food intake behavior. In contrast,
male and female offspring of active lines became lean with elevated adiponectin levels and
increased water intake, and particularly active female offspring developed lower levels of plasma
leptin and insulin relative to controls. From these results, we conclude that male offspring are
more susceptible to weight gain by the programming effects of HF diet. The trait for high
voluntary running behavior in both genders reverses and/or defends against these effects and
may provide a mechanism to prevent diet-induced weight gain.

Chapter 6
88
1. Introduction
Locomotion enables animals to travel across the environment in the attempt to find partners,
nutrients and fluids. In doing so, they need to combust extra fuels above the amount to maintain
resting metabolic rate, in order to provide the energy for skeletal and cardiovascular muscular
activity. The display of locomotor activity can vary tremendously between species, but also
considerable individual differences can be observed within certain species (Scholz et al. 2008). In
an extensive selective breeding program, Garland and colleagues assessed individual differences
in running wheel activity of outbred mice, and created four replicate lines with high and four with
normal locomotor activity (Swallow, Carter, and Garland, Jr. 1998). We and others have found
that these high activity lines of mice have a number of metabolic and behavioral characteristics
which may be viewed as adaptive to sustain increased physical activity levels in the natural
environment (see Chapters 2, 3, and 4). From an energy balance point of view, these high activity
mice are more resistant to develop diet-induced obesity (DIO) than control mice when subjected
to feeding a high-fat (HF) diet at adulthood (Vaanholt et al. 2008). This is highly relevant in light
of the view that dietary fat combined with a sedentary life-style is a frequent cause of human
obesity in the modern industrialized societies (Dourmashkin et al. 2005; Lee and Korner 2008;
Sanderson et al. 2008).
Besides studies dealing with regulation of energy balance at adulthood, also the perinatal
origins of energy balance are becoming subject of intense investigation. Mechanism include
maternal behavioral, hormonal and/or metabolic factors that can program fundamental
regulatory systems in the fetal-newborn state, and this can subsequently influence the risk for
attracting metabolic diseases in the offspring later in life (Levin 2006; Plagemann 2004;
Plagemann 2005; Srinivasan and Patel 2008). One of the potential causal factors underlying the
fetal origins of excess body weight at adulthood is early maternal overnutrition of dietary fat
(Armitage, Taylor, and Poston 2005). Indeed, offspring from HF diet-induced obese female rats
develop increased adiposity associated with cardiovascular and metabolic dysfunction indicative
of the metabolic syndrome at adulthood (Samuelsson et al. 2008). Besides absorbed nutrients,
also physical activity is an important determining factor in the energy balance equation
(McMurray and Hackney 2005; Teske, Billington, and Kotz 2008). Physical activity is inversely
related to the risk of attracting obesity (Patterson and Levin 2008; Tappy, Binnert, and Schneiter
2003), and it improves metabolic abnormalities even in the absence of weight loss in adults
(Colberg 2007; Kruk 2007; Pearce 2008) as well in as children (Colberg 2007; Fogelholm 2008;
Pearce 2008). In line with this view is the finding that already as little as 3 weeks of voluntary
running wheel exercise at the juvenile stage is able to postpone obesity in diet-induced obese
(DIO) male rats (Patterson, Dunn-Meynell, and Levin 2008). As mentioned earlier, mice
selectively bred for voluntary high wheel running activity are shown to be resistant against HF
DIO, even in the absence of running wheels (Vaanholt et al. 2008). Thus, while the trait for
increased physical activity in mice is sufficient to maintain leanness by increasing metabolic rate
and fat oxidation in the context of feeding a HF diet (see Chapter 3), it is unknown whether such
Long term perinatal high-fat diet effect
89
a trait also protects mice from developing disturbances in energy balance regulation when their
mothers were fed a HF diet during pregnancy and lactation. Therefore, in the present study,
selectively bred highly active mice and their randomly-bred controls were used to investigate the
interactions between a physical activity trait and the effects of the peri-gestational HF diet feeding
on several energy balance parameters in the offspring at adulthood, including body composition,
food and water intake, and plasma levels of fuels and hormones. Since litter size is a major
determinant of early growth as well (chapter 5 and (Johnson, Thomson, and Speakman 2001)),
we investigated whether this factor also explained variations in the aforementioned energy
balance parameters at adulthood of control and selected mice.
2. Materials and methods
2.1. Origin of animals and housing
Offspring of two selectively bred lines for high voluntary wheel running activity (line 7 and line 8)
and of one randomly-bred control line (line 2) in generation 50 were used in these experiments.
Parents of these mice were born to breeding couples within selected lines in their 48th
generation, which were obtained from T. Garland Jr, Riverside, CA. For a detailed description of
the selection procedure see (Swallow, Carter, and Garland, Jr. 1998). Selected lines were used for
breeding without further selection at our facility in Haren. Mothers of offspring mice were fed
either a standard low-fat (LF) lab chow diet (3.8 kcal/g; 58 % carbohydrate, 6 % fat, 22 %
protein; Standard lab chow RMH-B 2181, HopeFarms BV, Woerden, NL) or a 40 % fat diet,
additionally containing fast sugars (HF) (4.7 kcal/g; 30 % carbohydrate, 45 % fat, 18 % protein;
AB Animal Diets, Woerden, NL) ad libitum 3 weeks before pregnancy until day 16 of lactation.
After this period, the HF was replaced by the standard chow diet to avoid that the developing
pups ingested the HF. This was necessary since mice start to ingest solid food after day 16. At
birth, litter characteristics were assessed and litter sizes were kept non-manipulated (see Chapter
4).
2.2. Offspring and conditions
At weaning, offspring gender was determined and 3-4 mice of similar sex and perigestational diet
were housed in standard cages (Macrolon Type II, UNO Roestvaststaal BV, Zevenaar, NL) with
wood shavings and EnviroDry® bedding and they had ad libitum assess to standard lab chow
diet and water. The room temperature was 22±1 °C with a 12:12 light-dark cycle (lights on at 8
am).
At 5-6 weeks of age, mice were characterized for running wheel activity over a 6 day
period in similar type cages with bedding material and food and water available ad libitum, and
with a running wheel (diameter: 14cm, code 0131 Savic®, Kortrijk, BE) attached to the side of
the cage. The wheel revolutions were assessed by a computer, which collected data on a minute
to minute basis. Data on running wheel activity over day 5 and day 6 were averaged, in the same

Chapter 6
90
way as in the selection protocol. Right after the running wheel measurements, body mass was
assessed. From each litter, two male and two female mice were blindly assigned to be included in
these experiments, while the rest was used for other purposes.
Offspring included in this study were housed in couples of similar sex and from the same
litter, with ad libitum access to food and water with the above-mentioned light, temperature and
cage conditions. When they reached 4 months of age, food and water intake in each cage was
assessed on two consecutive days, and was averaged per day per animal. Following food and
water intake measurements, all offspring were anaesthetized by CO2, their nose-anal length was
determined, and they were decapitated. Trunk blood was collected in tubes with Trasylol- EDTA,
which then were centrifuged at 2600 g for 15 min at 4°C. Plasma was collected and stored at -
80°C for later analysis of insulin, adiponectin, and leptin (analyzed by radioimmuno assays of
Linco Research, Nucli lab, The Netherlands), and for cholesterol (enzymatic kit from
Roche/Hitachi) and for glucose (by ferrycyanide method of Hoffman). Whole carcasses were
kept without heads for total analysis. This included weighing of wet and dry masses (after drying
to constant weight at 103°C for 24 plus 1 hour) and followed by fat extraction with petroleum
ether in a soxhlet apparatus for 8 complete cycles. Thereafter, bodies were dried again to obtain
dry-lean masses and calculate total fat- and fat-free mass (FFM).
2.3. Statistical analysis
Results were analyzed with GLM Univariate Analysis to test line and diet effects and their
interaction in the measured parameters. Secondly, a Linear Regression Forward method was
applied, which allowed us to investigate the contribution of litter size in the measured parameters.
P value less than 0.05 was considered significant for all tests.
3. Results
3.1. Offspring characteristics at the adolescent stage
3.1.1. Running wheel activity
Between 6 and 7 weeks of age, all offspring animals were tested for running wheel activity. In
figure 1, averages of running wheel activity on the 5th and 6th day of the 6-day subjection period
are shown. In both genders, running wheel activity was significantly influenced by line (♂:
F(2,191)=141.3; p<0.001, ♀: F(2,188)=36.03; p<0.001), but not by diet. Post-hoc analysis
revealed that line 8 offspring ran significantly more than those of line 2 in both genders (♂: 2.9
times more, ♀: 1.7 times more). Males of line 8 also ran significantly more (2.3x) than those of
line 7, but this effect was not observed in females. Females of line 7, on the other hand, ran 1.7x
more than those of line 2, an effect not seen in males.

Long term perinatal high-fat diet effect
91
0
10000
20000
30000
40000
50000
2 7 8 2 7 8
male female
rev
olu
tio
ns
/da
yLF
HF
Figure 1. Average running wheel activity of male and female offspring of mothers perinatally fed
LF and HF diet in line 2 (control line), line 7 and line 8 (selected lines) at 6-7 weeks of age.
3.1.2. Body weight
At the 7th week of age, body weight was significantly influenced by line in both genders (♂:
F(2,207)=93.5; p<0.001; ♀: F(2,204)=48.6; p<0.001). Post-hoc analysis revealed increased body
weight of line 2 males and females relative to those of line 7 and 8. Furthermore, body weight of
line 7 female offspring was lower than that of line 8, an effect not observed in males. Body
weight was also influenced by perigestational diet in males (F(1,207)=51.7; p<0.001), but not in
females. Post-hoc analysis revealed that offspring of HF diet fed mothers had increased body
weight relative to those of LF fed mothers. This effect appeared to interact with line
(F(2,207)=5.7; p<0.01), meaning that line 2 and line 7, but not line 8 male offspring from HF fed
mothers were found to be heavier than those of LF fed mothers (see table 1).
3.2. Offspring characteristics at the adult stage
3.2.1. Food and water consumption
At 4 months of age, food intake of offspring was significantly influenced by line (F(2,80)=9.62;
p<0.001) in males, but not in females. Specifically, male offspring of line 8 consumed more food
than those of line 2 and line 7. Perigestational HF diet had no effect on food intake (see Figure
2). In both genders, however, water intake was significantly influenced by line (♂: F(2,79)=10.06;
p<0.001, ♀: F(2,73)=19.85; p<0.001) as well as diet (♂: F(1,79)=7.57; p<0.01, ♀: F(1,73)=4.45;
p<0.05). Post-hoc analysis revealed increased water intake by line 7 and line 8 offspring relative
to that of line 2 offspring, and offspring of HF-fed mothers consumed more water than that of
LF-fed females irrespective of line (see Figure 3).

Chapter 6
92
0
2
4
6
8
10
2 7 8 2 7 8
male female
foo
d in
tak
e (
g/d
ay
) LF
HF
Figure 2. Food intake of male and female offspring of mothers perinatally fed LF and HF diet in
line 2 (control line), line 7 and line 8 (selected lines) at 4 months of age.
0
2
4
6
8
10
2 7 8 2 7 8
male female
wa
ter
inta
ke
(g
/da
y) LF
HF
Figure 3. Water intake of male and female offspring of mothers perinatally fed LF and HF diet in
line 2 (control line), line 7 and line 8 (selected lines) at 4 months of age.
3.2.2. Body weight and composition
At 4 months of age, offspring body weight was influenced by line in both genders (♂:
F(2,133)=23.28; p<0.001, ♀: F(2,130)=71.92; p<0.001), and post-hoc analysis revealed that line 2
offspring was heavier than line 7 and line 8 offspring. Only in males, body weights were
influenced by perigestational diet (F(1,133)=13.41; p<0.001), and increases were found in
offspring of HF-fed mothers. Post-hoc analysis only revealed increased body weight in offspring
from HF-fed mothers in line 2 (see Table 1).
Nose-anal length of offspring was influenced by line in both genders (♂: F(2,130)=10.53;
p<0.001), ♀: F(2,128)=37.81; p<0.001). In line with the effects on body weight was the
observation that line 2 offspring had higher nose-anal length than offspring of line 7 and line 8.
Furthermore, nose-anal length was also influenced by perigestational diet (F(1,130)=6.19;
p<0.05), but only in males; specifically male offspring of HF diet-fed mothers had higher nose-
anal length than those of LF diet-fed mothers. Moreover, in males, an interaction between line

Long term perinatal high-fat diet effect
93
and diet (F(2,130)=7.24; p<0.01) was observed, and post-hoc analysis revealed that the nose-anal
length of male offspring from HF diet fed mothers was increased only in line 2 (See table 1).
By absolute measures, drymass (♂: F(2,132)=14.30; p<0.001, ♀: F(2,130)=65.31;
p<0.001), dry-lean mass (♂: F(2,132)=22.11; p<0.001, ♀: F(2,130)=54.52; p<0.001), body water
content (♂: F(2,132)=29.61; p<0.001, ♀: F(2,130)=47.47; p<0.001) and body fat content (♂:
F(2,132)=12.70; p<0.001, ♀: F(2,130)=51.33; p<0.001) were influenced by line in both genders.
In general, these parameters were significantly increased in line 2 relative to lines 7 and/or 8 (see
table 1). In addition, differences were found between lines 7 and 8 for dry mass (line 7 ♂ > line 8
♂) and body water content (line 7 ♂ < line 8 ♂). Expressed as a proportion of body weight,
%dry mass (♂: F(2,128)=10.52; p<0.001, ♀: F(2,126)=46.51; p<0.001), %dry-lean mass (♂:
F(2,128)=3.74; p<0.05, ♀: F(2,126)=20.37; p<0.001), %body water (♂: F(2,128)=10.13;
p<0.001, ♀: F(2,126)=41.88; p<0.001), and %body fat (♂: F(2,128)=12.28; p<0.001, ♀:
F(2,126)=45.15; p<0.001) were all affected by line in both genders. Line 8 had the smallest %dry
mass and %body fat and the highest %dry lean mass and %body water. In these respects, males
of line 7 were similar to those of line 2, whereas females of line 7 were intermediate phenotype
and significantly different from those of line 2 and line 8.
Perigestational diet influenced the absolute measures of dry mass (F(1,132)=4.58;
p<0.05), dry-lean mass (F(1,132)=9.68; p<0.01), and body water content (F(1,132)=17.16;
p<0.001) in males. In females, no effect of perigestational diet was observed. Post-hoc analysis
revealed that above-mentioned parameters were increased in line 2 offspring of HF diet-fed
mothers relative to those fed the LF diet. Body fat content was not influenced by diet in either
gender when all lines were included in the analysis. However, when viewing line 2 males
separately from lines 7 and 8, the HF diet condition significantly increased the level of body fat
by 41%. When expressed proportionally to body weight, however, the perigestational diet effects
were lost in male offspring, and was not observed in females either.
3.2.3. Metabolic fuel and hormone levels
Plasma insulin (♂: F(2,131)=9.48; p<0.001, ♀: F(2,127)=11.64; p<0.001), leptin (♂:
F(2,132)=8.74; p<0.001, ♀: F(2,130)=23.31; p<0.001) and adiponectin levels (♂: F(2,129)=6.44;
p<0.01, ♀: F(2,129)=13.58; p<0.001) were influenced by line in both genders. Post-hoc analysis
revealed that offspring of line 2 had higher plasma levels of insulin and leptin, and lower plasma
levels of adiponectin than those of line 7 and/or line 8 (see Table 2). Plasma glucose levels were
also influenced by line (F(2,127)=9.08; p<0.001) but only in females; specifically, offspring of line
2 had higher levels of glucose than offspring of line 8. Furthermore, a line effect was revealed on
plasma cholesterol levels (F(1,129)=5.64; p<0.01) in male, but not in female offspring;
specifically, line 2 had lower cholesterol levels that those of line 7 and line 8. Perigestational diet
had no effect on the above-mentioned fuel and hormone levels.

Chapter 6
94
Table 1. Characteristics male and female offspring mice from line 2 (control line) and line 7 and
line 8 (selected lines) mothers feeding either a LF diet or a HF diet during pregnancy and
lactation.
LF HF LF HF LF HF
MALE
Body mass
7 weeks 30.5 ± 0.4 33.6 ± 0.4## 25.3 ± 0.5** 28.0 ± 0.4## 26.6 ± 0.4** 27.9 ± 0.3#4 mnths 37.0 ± 0.6 40.7 ± 0.8## 34.0 ± 0.6** 35.9 ± 0.9 34.4 ± 0.7** 35.4 ± 0.7
Body composition
Length 9.3 ± 0.1 9.9 ± 0.1## 9.1 ± 0.1 9.3 ± 0.1 9.2 ± 0.1 9.1 ± 0.1
Drymass 10.9 ± 0.3 12.8 ± 0.5## 10.3 ± 0.4 11.1 ± 0.9 9.6 ± 0.3** 9.4 ± 0.3
Drylean mass 8.0 ± 0.1 8.7 ± 0.2## 7.2 ± 0.1* 7.6 ± 0.2# 7.5 ± 0.1** 7.7 ± 0.2
Body water 21.2 ± 0.3 22.8 ± 0.4## 18.6 ± 0.3** 20.1 ± 0.4## 20.1 ± 0.4* 20.8 ± 0.4
Body fat 2.9 ± 0.2 4.1 ± 0.4 3.2 ± 0.3 3.4 ± 0.8 2.0 ± 0.2** 1.7 ± 0.2
% Dry mass 33.9 ± 0.5 35.8 ± 0.7 35.5 ± 0.8 34.9 ± 1.8 32.1 ± 0.5* 30.8 ± 0.6% Dry-lean mass 25.0 ± 0.1 24.3 ± 0.3 24.8 ± 0.2 24.5 ± 0.3 25.5 ± 0.2 25.4 ± 0.3
% Body water 66.1 ± 0.5 64.2 ± 0.7 64.5 ± 0.8 65.1 ± 1.8 67.9 ± 0.5* 69.2 ± 0.6
% Body fat 8.9 ± 0.5 11.4 ± 0.8 10.7 ± 1.0 10.4 ± 2.0 6.7 ± 0.7* 5.4 ± 0.6
FEMALE
Body mass
7 weeks 25 ± 0.5 25.8 ± 0.6 19.6 ± 0.4** 21.6 ± 0.6 21.8 ± 0.4** 21.9 ± 0.3
4 mnths 34.2 ± 0.8 35 ± 1.5 26.7 ± 0.5** 27.6 ± 0.7 26.3 ± 0.5** 26.9 ± 0.6
Body composition
Length 9.3 ± 0.1 9.4 ± 0.1 8.7 ± 0.1** 8.8 ± 0.1 8.6 ± 0.1** 8.5 ± 0.1
Drymass 11.1 ± 0.4 12.3 ± 1.0 7.8 ± 0.2** 7.6 ± 0.3 7.2 ± 0.3** 7.1 ± 0.2
Drylean mass 6.9 ± 0.1 6.8 ± 0.2 5.6 ± 0.1** 5.5 ± 0.1 5.6 ± 0.1** 5.7 ± 0.1
Body water 18.3 ± 0.4 18.0 ± 0.6 14.9 ± 0.3** 15.1 ± 0.3 15.2 ± 0.2** 15.5 ± 0.3
Body fat 4.2 ± 0.3 5.4 ± 0.9 2.2 ± 0.2** 2.1 ± 0.2 1.6 ± 0.2** 1.4± 0.1
% Dry mass 37.4 ± 0.6 39.8 ± 1.6 34.1 ± 0.5** 33.5 ± 0.6 31.9 ± 0.7** 31.1 ± 0.3
% Dry-lean mass 23.6 ± 0.3 22.8 ± 0.5 24.6 ± 0.1** 24.4 ± 0.3 25.1 ± 0.3** 25.2 ± 0.2
% Body water 62.6 ± 0.6 60.2 ± 1.6 65.9 ± 0.5** 66.5 ± 0.6 68.1 ± 0.7** 68.9 ± 0.3% Body fat 13.8 ± 0.9 17.0 ± 2.0 9.5 ± 0.6** 9.0 ± 0.8 6.8 ± 0.9** 5.9 ± 0.4
2 7 8
Values given are means ± SEM. * denotes significant difference with line 2 (line effect) (*,
p<0.05; **, p<0.01). # denotes significant difference with LF diet (diet effect) (#, p<0.05; ##,
p<0.01).
4. Regression analysis
In chapter 4 it was observed that a number of growth and developmental pup characteristics
were negatively correlated to litter size during lactation. An explanation for these correlations is
that individual pups in relatively large litters received relatively less nutrients than those in

Long term perinatal high-fat diet effect
95
Table 2. Plasma hormone and fuel levels of 4 months old male and female offspring mice from
line 2 (control line) and line 7 and line 8 (selected lines) mothers feeding either a LF diet or a HF
diet during pregnancy and lactation.
LF HF LF HF LF HF
MALE
Glucose (mM) 8.5 ± 0.3 8.1 ± 0.3 8.2 ± 0.4 7.5 ± 0.3 7.6 ± 0.3 7.8 ± 0.3
Insulin (ng/ml) 1.9 ± 0.2 2.7 ± 0.4 1.4 ± 0.2 1.6 ± 0.4 1.2 ± 0.2* 1.2 ± 0.2Leptin (ng/ml) 1.8 ± 0.2 3.1 ± 0.5# 2.7 ± 0.4 3 ± 0.8 1.3 ± 0.3 1.1 ± 0.2
Adiponectin (µg/ml) 5 ± 0.4 4.8 ± 0.4 6.5 ± 0.5* 5.7 ± 0.6 6.9 ± 0.5** 5.9 ± 0.4
Cholesterol (mM) 2.6 ± 0.1 2.4 ± 0.1 3 ± 0.1* 3 ± 0.2 2.9 ± 0.2 3 ± 0.2
FEMALE
Glucose (mM) 7.8 ± 0.3 8.2 ± 0.4 7.7± 0.2 7.0 ± 0.2# 6.6 ± 0.2** 7.1± 0.3
Insulin (ng/ml) 1.9 ± 0.3 2 ± 0.4 1 ± 0.1* 0.9 ± 0.2 0.9 ± 0.2* 0.8 ± 0.1
Leptin (ng/ml) 4 ± 0.5 4.5 ± 0.7 2.3 ± 0.3** 2.2 ± 0.4 1.3 ± 0.5** 1.1 ± 0.2
Adiponectin (µg/ml) 9.4 ± 0.8 9.5 ± 1.0 14.9 ± 1.4** 13.8 ± 1.2 16.8 ± 1.9** 15.7 ± 1.2Cholesterol (mM) 1.9 ± 0.1 2 ± 0.2 2 ± 0.1 2.1 ± 0.1 1.8 ± 0.1 2 ± 0.1
2 7 8
Values given are means ± SEM. * denotes significant difference with line 2 (line effect)
(*, p<0.05; **, p<0.01). # denotes significant difference with LF diet (diet effect) (#, p<0.05).
relatively small litters. Using multiple linear regression analysis, some of these “litter size-
correlated pup characteristics” were line and/or diet specific. Here we investigated whether
nutritional/energetic state parameters during adulthood were correlated to the size of the litter at
peak lactation, and whether these correlations provided additional information above the
statistical outcomes provided by mean comparisons.
4.1. Offspring characteristics at the adolescent stage
4.1.1. Running wheel activity
No overall correlation of running wheel activity with litter size was found, indicating that
variation in litter size does not improve discrimination between groups.
4.1.2. Body weight
At 7 weeks of age, body weight of male and female offspring was negatively correlated to litter
size, meaning that offspring mice reared in relatively large litters weighed less than those reared in
relative small litters. Within this correlation, no overall effects of diet were observed, indicating
that the effects of diet found by mean comparison are weakened when corrected for litter size.
There was, however, an effect of diet in line 8 male offspring which appeared to interact with
litter size (see Table 3), meaning that line 8 males born to HF diet fed mothers were smaller than
line 2 males from HF diet fed mothers at large litter sizes, but not at small ones.

Chapter 6
96
4.2. Offspring characteristics at the adult stage
4.2.1. Food and water consumption
Food intake was overall negatively correlated to litter size in female offspring, but no overall
correlation was found in male offspring. Within this correlation, female offspring of HF diet fed
mothers ate less than those of LF diet fed mothers. Since diet interacted positively with litter size
in female offspring, this decreased food intake of female offspring of HF fed mothers occurred at
small litter sizes, but not at large ones. Overall, water intake was not related to litter size.
4.2.2. Body weight and composition
Body weight at 4 months of age in males, but not in females, was negatively correlated with litter
size. Within this correlation, line and diet effects were observed. First, male offspring from HF
diet feeding mothers were heavier than those from LF feeding mothers at corresponding litter
sizes. Secondly, line 7 and line 8 male offspring weighed less than those of line 2 mothers at
corresponding litter sizes, irrespective of diet. Nose-anal length was negatively correlated with
litter size at 4 months of age in both genders, with offspring from HF diet feeding mothers
longer than those from LF feeding mothers at corresponding litter sizes, but this HF diet effect
was only observed in males. Additional interactions showed that this correlation was significantly
more negative in line 8 male and female offspring from HF diet feeding mothers relative to line 2
offspring, indicating that line 8 males and females were smaller than those of line 2, particularly
when they were from large litters. In line 7 male and female offspring from LF feeding mothers,
this correlation was less negative than found in line 2 offspring from LF feeding mothers
irrespective of diet. None of the other body composition parameters were correlated with litter
size.
4.2.3. Metabolic fuel and hormone levels
Plasma levels of adiponectin levels in males but not in females, were positively correlated with
litter size. Within this correlation, plasma adiponectin levels were more negatively related to litter
size in line 8 males than in line 2 males irrespective of diet. Furthermore, maternal HF diet
feeding increased plasma adiponectin levels at each corresponding litter size in males irrespective
of line. Plasma insulin levels in the male offspring were significantly correlated with litter size,
but only in the HF diet condition, meaning that plasma insulin levels of male offspring from HF
diet feeding mothers were only increased compared to those of LF feeding mothers at small litter
sizes. In female offspring, on the other hand, plasma glucose and cholesterol levels were
correlated with litter size only in the perigestational HF diet condition, meaning that plasma
glucose and cholesterol levels were increased in female offspring from HF diet feeding mothers
at large litter sizes, compared to female offspring from LF feeding mothers.

Long term perinatal high-fat diet effect
97
BW
(4
mon
)D
ryle
an m
ass
% D
ryle
an m
ass
Bod
y w
ater
Bod
y fa
tIn
sulin
Cho
lest
erol
Bp
Bp
Bp-
leve
lB
p-le
vel
Bp-
leve
lB
p-le
vel
Bp-
leve
lB
p-le
vel
Bp-
leve
lB
p-le
vel
Bp-
leve
lB
p-le
vel
MA
LE
S
Inte
rcep
t36
.26
<0.0
0140
.99
<0.0
019.
75<0
.001
8.68
<0.0
0123
.01
<0.0
013.
06<0
.001
1.98
<0.0
012.
760.
009
litte
rsiz
e-0
.59
<0.0
01-0
.39
0.00
2-0
.05
<0.0
01-0
.07
0.02
4-0
.19
0.04
50.
230.
030
Die
t2.
10<0
.001
0.50
<0.0
010.
42<0
.001
1.17
<0.0
011.
070.
011
1.63
0.00
43.
230.
010
Lin
e 7
-5.5
<0.0
01-5
.90
0.00
3-1
.11
0.01
0-3
.25
0.00
61.
700.
001
Lin
e 8
-6.0
4<0
.001
-3.4
2<0
.001
-1.0
50.
016
-0.8
10.
004
5.07
<0.0
01
Lin
e 7
x D
iet
-1.0
00.
005
Lin
e 8
x D
iet
6.64
0.01
8
Lin
e 7
x L
itter
siz
e
Lin
e 8
x L
itter
siz
e-0
.06
<0.0
01-0
.31
0.03
3
Die
t x L
itter
siz
e-0
.14
0.01
4-0
.36
<0.0
01
Lin
e 7
x D
iet x
Litt
er s
ize
Lin
e 8
x D
iet x
Litt
er s
ize
-0.7
40.
008
-0.0
5<0
.001
-0.1
20.
028
FEM
AL
ES
Inte
rcep
t30
.17
<0.0
019.
92<0
.001
20.1
2<0
.001
1.94
<0.0
017.
74<0
.001
7.21
<0.0
01
litte
rsiz
e-0
.54
<0.0
01-0
.07
0.00
3-0
.24
0.01
4
Die
t-0
.35
0.04
9-2
.27
0.01
9
Lin
e 7
-5.1
90.
015
-1.1
8<0
.001
0.79
<0.0
01
Lin
e 8
-1.0
60.
024
1.34
<0.0
01-1
.26
<0.0
01
Lin
e 7
x D
iet
-1.3
2<0
.001
Lin
e 8
x D
iet
Lin
e 7
x L
itter
siz
e0.
070.
024
Lin
e 8
x L
itter
siz
e
Die
t x L
itter
siz
e0.
020.
021
0.06
0.01
20.
260.
010
Lin
e 7
x D
iet x
Litt
er s
ize
Lin
e 8
x D
iet x
Litt
er s
ize
-0.1
00.
032
Food
inta
keB
W (
7wee
k)B
ody
leng
thA
dipo
nect
inG
luco
se
Tab
le 3
. Results o
f Reg
ression
Ana
lysis, w
here B
is the regression
coe
fficient and
p-le
vel is the
lev
el o
f sign
ifican
ce. Line an
d diet
indicated
as dum
my va
riab
les, w
hereas litter size is the
con
tinuo
us ind
epen
dent variable. In
the left colum
n, Intercept rep
resents the
value of line
2 (referenc
e grou
p) crossing the y-ax
is and
litter size represen
ts the
slope
of the lin
e represen
ting the referenc
e grou
p (line
2). W
hen lin
e, diet an
d/or the
ir in
teractions
were foun
d sign
ifican
t, the intercep
t of tha
t pa
rticular group
differed from
line
2 (referenc
e
grou
p). W
hen
an interactio
n with
litter size was fou
nd significant, the slop
e of tha
t pa
rticular group
differed
from
line 2 (referen
ce
grou
p).

Chapter 6
98
5. Discussion
The aim of the present study was to investigate the effects of feeding a high-fat (HF) diet during
pregnancy and lactation on offspring body weight gain and several associated parameters related
to energy balance. This study was performed in a group of randomly bred control mice (line 2),
and in two mouse lines that were from the same ancestral line as the controls, but were selectively
bred for high voluntary wheel running behavior over 48 generations (Swallow, Carter, and
Garland, Jr. 1998). We have previously observed that these highly active mice are hyperphagic
but nonetheless resistant to diet-induced obesity (DIO), when fed a HF diet at adulthood.
Control mice, on the other hand, were prone to develop DIO when subjected to a HF diet
(Vaanholt et al. 2008). We hypothesized that the randomly bred female control mice, but not the
highly active female mice, would program their offspring to exaggerated weight gain and related
changes at adulthood when they would be fed a HF diet during pregnancy and lactation.
At 7 weeks of age, perigestational HF diet had an overall effect to increase body weight in
male but not female offspring irrespective of line compared to the LF diet condition. This means
that the trait for voluntary high-wheel running behavior did not protect the offspring against the
stimulatory effect of perigestational HF feeding on body weight gain at the adolescent stage.
Differences in running wheel activity between control and high activity lines were not influenced
by the perinatal HF diet indicating that the HF diet did not program weight gain via behavioral
inactivity. At the adult stage of 4 months of age, the stimulatory effect of perigestational HF
feeding on body weight gain persisted in the highly active males irrespective of line. Viewing the
data more closely, this effect of perigestational HF diet appeared to be skewed towards the
control line, and was less pronounced in line 7 and even less so in line 8 males. Fluctuations in
body weight can be the result of changes in fat-free mass, fat mass and/or body water. Analysis
of these parameters revealed that particularly fat free mass and body water contributed to the
increased body weights of the male offspring from HF diet fed line 2 mothers, and pointing out
that these line 2 offspring from HF fed mothers were simply larger animals than the line 2
offspring from LF feeding mothers. This is reflected by the finding that also nose-anal lengths of
line 2 offspring from HF feeding mothers were increased compared to the offspring from LF
feeding mothers. Almost none of these parameters (except for the elevated water content and
dry-lean mass content in the male line 7 offspring from HF fed mothers compared to the LF
mothers) were significantly affected by the perigestational HF diet in the line 7 and 8 male
offspring. Thus, it may be concluded that 1) male offspring is more susceptible to weight gain by
perigestational HF diet than female offspring, and 2) programming effects of perigestational HF
diet feeding are largely corrected in male offspring with a trait for increased voluntary wheel
running behavior.
In previous studies, it was observed that feeding a HF diet during the perigestational
period causes disproportional increases in adipose tissue (Lemonnier 1972; Samuelsson et al.
2008; Srinivasan et al. 2006). The finding in the present study that perigestational HF diet feeding
did not cause an overall effect to increase fat mass is inconsistent with those previous

Long term perinatal high-fat diet effect
99
observations. This has two reasons. First, when only considering line 2 offspring, the
perigestational diet caused a 41% increase in fat mass, which was not observed in line 7 and 8.
Thus, the effect of perigestational HF feeding on adiposity was “missed” because of inclusion of
all lines. Secondly, a strong disproportional increase in male line 2 offspring from perigestational
HF fed mothers might have been ameliorated due the fact that the HF diet feeding mothers in
the present study were switched back to the LF diet on day 16 of lactation, and the offspring
were maintained on the LF diet as well. Most other studies investigating dietary programming
effects on offspring energy balance left lactating mothers and progeny on the HF diet at least
throughout weaning (see references above). The reason for the “early switch” was that we wanted
to avoid direct effects of dietary fat on the offspring, and ended dietary treatment before pups
have been observed to start ingesting solid foods (Kounig, Riester, and Markl 1988). Despite the
absence of disproportional adiposity we found that plasma levels of insulin and adiponectin were
increased in male offspring from HF feeding mothers relative to the LF feeding ones, irrespective
of line. An elevation of plasma insulin has been shown previously to result from perigestational
HF diet feeding (Parente, Aguila, and Mandarim-de-Lacerda 2008; Srinivasan et al. 2006), and
together with the unchanged glucose levels this may be seen as an early sign of insulin resistance.
An interesting phenomenon in light of the previous observations is that the perigestational HF
diet feeding caused an increase in water intake, which was most pronounced in the high activity
lines. In fact, the high activity lines had higher water intakes compared to the control line
irrespective of diet. Since increased water intake stimulates cellular metabolism (Thornton, Even,
and van Dijk 2009), it might be hypothesized that the high level of water intake is connected to
the resistance of high activity lines to develop weight gain and potential metabolic disturbances
induced by perigestational HF diet feeding.
Since litters of mice in the present study were not manipulated in size, it might be
possible that naturally occurring differences in litter size among lines could have influenced body
weights and associated parameters at adulthood. As mentioned in Chapter 5, sizes of litters the
animals were born in were larger in lines 7 and 8 compared to line 2, and line 2 mothers feeding
the HF diet tended to have even smaller litters than mothers feeding the LF diet. Although line 7
mothers had considerable pup loss during lactation, also litter size in this line tended to be lower
in the HF condition than in the LF diet condition. In contrast, line 8 mothers feeding the HF
diet tended to have even larger litters than in the condition of the LF diet. These differences
between lines and diets might have contributed to differences in offspring energy balance
parameters at adulthood. Indeed, it is known that extreme manipulation to very small (3-4 pups)
or very large litters (18-20 pups) causes small litter offspring to become obese due to early
overfeeding and large litter offspring to remain lean in the absence of overfeeding (Aubert,
Suquet, and Lemonnier 1980; Plagemann et al. 1999). However, also relatively small differences
of 2 pups less or more in the litter may contribute to differences in body weight parameters at
adulthood (Epstein 1978). For example, observations in the study of Buckley et al. where litter
size was reduced by perinatal HF diet from 15 to 12 probably contributed to the increased

Chapter 6
100
adiposity of adult offspring from HF diet feeding mothers (Buckley et al. 2005). We therefore
performed a Linear Regression Analysis including litter size, diet, line, as well as their interactions
as independent factors and body weight and related parameters as dependent factor. We
consistently observed in male, but also in female offspring that litter size contributed significantly
in a negative direction to body weight at 7 weeks of age and only in male offspring at 4 months of
age. Within this correlation in males, we observed that perigestational HF diet feeding
contributed significantly to the increase in body weight at adulthood at each corresponding litter
size, and line 7 and 8 males were smaller than line 2 offspring at each corresponding litter size.
Furthermore, dry lean mass and body water content were also increased by perigestational HF
feeding, and reduced in line 7 and 8 compared to line 2. These results are largely consistent with
those obtained from the mean comparisons by GLM analysis.
The regression analysis between energy balance characteristics and litter size also revealed
some novel effects that were not observed by mean comparisons in the GLM analysis. The level
of body fat, for example, was not significantly increased by perigestational HF feeding in the
overall mean comparison analysis, but was significantly elevated in the regression analysis by
perigestational diet when ignoring line as a factor. Also line effects were found on the level of
body fat, specifically line 8 male offspring had significantly less fat than line 2 males, irrespective
of diet. Other effects found with regression analysis, which were not observed with mean
comparisons related to differences in plasma hormone and fuel levels. Plasma levels of insulin in
male offspring were negatively correlated to litter size, but only in the HF diet condition. The
regression analysis revealed that differences between plasma insulin levels of HF and LF
offspring was largest in small litters. Plasma adiponectin levels, on the other hand, were
positively correlated with litter size in male offspring. Although plasma adiponectin levels within
this correlation were increased somewhat at smaller litter sizes by perigestational HF diet feeding,
these opposite correlations of insulin and adiponectin with litter size may have important
consequences. Taking into account that the HF diet caused the largest weight gain in line 2 male
offspring born in small litters, with the highest plasma insulin levels, but lowest plasma levels of
adiponectin (despite some recovery as mentioned above), these animals were probably at highest
risk to develop insulin resistance. The slight recovery of plasma adiponectin at small litter sizes
by perigestational HF feeding might have protected them from developing type-II diabetes
mellitus. Hence, adiponectin stimulates fat oxidation in skeletal muscle and contributes to
glucose disposal and insulin action (Fruebis et al. 2001; Yamauchi et al. 2002), and reduces the
risk of type-2 diabetes mellitus (Fruebis et al. 2001; Hara, Yamauchi, and Kadowaki 2005;
Kadowaki et al. 2006). This is most relevant for offspring of line 2 since the high activity lines 7
and 8 have significantly elevated levels of plasma adiponectin. These latter effects are consistent
with the findings in Chapter 4 and with previous work of Vaanholt et al. The final effects
observed with regression analysis and not observed with mean comparisons related to plasma
levels of glucose and cholesterol in female offspring, which were both positively correlated to
litter size only in the HF diet condition. This means that the fuel levels were increased

Long term perinatal high-fat diet effect
101
independent of line in female offspring from HF feeding mothers at large litter sizes compared to
offspring from LF feeding mothers. These effects may be related to food intake, since female
offspring from HF feeding mothers ate more than those of LF feeding mothers at large litter
sizes.
In summary, perigestation HF diet feeding caused weight gain in male offspring from
randomly bred line 2 mothers, and this effect was largely absent in male offspring from the highly
active line 7 and 8 mothers feeding the HF diet. Fat mass, fat-free mass as well as body water
content appeared to contribute proportionally to the increased weight gain of the line 2 male
offspring of HF fed mothers, and this effect was independent from litter size. Besides similarities
between the high activity lines to resist effects of the perigestational diet, it was also clear that this
resistance was strongest in line 8 offspring. It is likely that these differences results from the fact
that the line 7 mothers lost an average 37% of pups in their litters during lactation, whereas line 8
mothers did not lose pups (see Chapter 5). The latter is remarkable since line 8 mothers had the
largest litters among lines. It is therefore conceivable that individual pups in litters of line 8
mothers received less nutrition than individual pups in litters from line 7 mothers, and therefore
remained the smallest and the lightest after lactation and at adulthood. Thus, even though line 7
offspring was relatively overnourished, the programming effects of perigestational dietary fat
were probably offset by the genetic trait for increased wheel running behavior. Contributing
mechanisms to this trait – besides increased voluntary activity and increased associated energy
expenditure - could be related to the relatively high level of water intake, and a relatively high
plasma level of adiponectin.
References
Armitage, J. A., Taylor, P. D., and Poston, L. (2005). Experimental models of developmental programming:
consequences of exposure to an energy rich diet during development. J.Physiol 565, 3-8.
Aubert, R., Suquet, J. P., and Lemonnier, D. (1980). Long-term morphological and metabolic effects of early
under- and over-nutrition in mice. J.Nutr. 110, 649-661.
Buckley, A. J. et al. (2005). Altered body composition and metabolism in the male offspring of high fat-fed
rats. Metabolism 54, 500-507.
Colberg, S. R. (2007). Physical activity, insulin action, and diabetes prevention and control. Curr.Diabetes
Rev. 3, 176-184.
Dourmashkin, J. T. et al. (2005). Different forms of obesity as a function of diet composition.
Int.J.Obes.(Lond) 29, 1368-1378.
Epstein, H. T. (1978). The effect of litter size on weight gain in mice. J.Nutr. 108, 120-123.
Fogelholm, M. (2008). How physical activity can work? Int.J.Pediatr.Obes. 3 Suppl 1, 10-14.

Chapter 6
102
Fruebis, J. et al. (2001). Proteolytic cleavage product of 30-kDa adipocyte complement-related protein
increases fatty acid oxidation in muscle and causes weight loss in mice. Proc.Natl.Acad.Sci.U.S.A 98,
2005-2010.
Hara, K., Yamauchi, T., and Kadowaki, T. (2005). Adiponectin: an adipokine linking adipocytes and type 2
diabetes in humans. Curr.Diab.Rep. 5, 136-140.
Johnson, M. S., Thomson, S. C., and Speakman, J. R. (2001). Limits to sustained energy intake. I. Lactation
in the laboratory mouse Mus musculus. J.Exp.Biol. 204, 1925-1935.
Kadowaki, T. et al. (2006). Adiponectin and adiponectin receptors in insulin resistance, diabetes, and the
metabolic syndrome. J.Clin.Invest 116, 1784-1792.
Kounig, B., Riester, J., and Markl, H. (1988). Maternal care in house mice (Mus musculus): II. The energy
cost of lactation as a function of litter size. Journal of Zoology 216, 195-210.
Kruk, J. (2007). Physical activity in the prevention of the most frequent chronic diseases: an analysis of the
recent evidence. Asian Pac.J.Cancer Prev. 8, 325-338.
Lee, M. and Korner, J. (2008). Review of physiology, clinical manifestations, and management of
hypothalamic obesity in humans. Pituitary.
Lemonnier, D. (1972). Effect of age, sex, and sites on the cellularity of the adipose tissue in mice and rats
rendered obese by a high-fat diet. J.Clin.Invest 51, 2907-2915.
Levin, B. E. (2006). Metabolic imprinting: critical impact of the perinatal environment on the regulation of
energy homeostasis. Philos.Trans.R.Soc.Lond B Biol.Sci. 361, 1107-1121.
McMurray, R. G. and Hackney, A. C. (2005). Interactions of metabolic hormones, adipose tissue and
exercise. Sports Med. 35, 393-412.
Parente, L. B., Aguila, M. B., and Mandarim-de-Lacerda, C. A. (2008). Deleterious effects of high-fat diet on
perinatal and postweaning periods in adult rat offspring. Clin.Nutr. 27, 623-634.
Patterson, C. M., Dunn-Meynell, A. A., and Levin, B. E. (2008). Three weeks of early-onset exercise
prolongs obesity resistance in DIO rats after exercise cessation. Am.J.Physiol Regul.Integr.Comp
Physiol 294, R290-R301.
Patterson, C. M. and Levin, B. E. (2008). Role of exercise in the central regulation of energy homeostasis and
in the prevention of obesity. Neuroendocrinology 87, 65-70.
Pearce, P. Z. (2008). Exercise is medicine. Curr.Sports Med.Rep. 7, 171-175.
Plagemann, A. (2004). 'Fetal programming' and 'functional teratogenesis': on epigenetic mechanisms and
prevention of perinatally acquired lasting health risks. J.Perinat.Med. 32, 297-305.
Plagemann, A. (2005). Perinatal programming and functional teratogenesis: impact on body weight
regulation and obesity. Physiol Behav. 86, 661-668.
Plagemann, A. et al. (1999). Observations on the orexigenic hypothalamic neuropeptide Y-system in
neonatally overfed weanling rats. J.Neuroendocrinol. 11, 541-546.
Samuelsson, A. M. et al. (2008). Diet-induced obesity in female mice leads to offspring hyperphagia,
adiposity, hypertension, and insulin resistance: a novel murine model of developmental programming.
Hypertension 51, 383-392.

Long term perinatal high-fat diet effect
103
Sanderson, S. C. et al. (2008). Awareness of lifestyle risk factors for cancer and heart disease among adults in
the UK. Patient.Educ.Couns.
Scholz, U. et al. (2008). The role of motivational and volitional factors for self-regulated running training:
associations on the between- and within- person level. Br.J.Soc.Psychol. 47, 421-439.
Srinivasan, M. et al. (2006). Maternal high-fat diet consumption results in fetal malprogramming
predisposing to the onset of metabolic syndrome-like phenotype in adulthood. Am.J.Physiol
Endocrinol.Metab 291, E792-E799.
Srinivasan, M. and Patel, M. S. (2008). Metabolic programming in the immediate postnatal period. Trends
Endocrinol.Metab 19, 146-152.
Swallow, J. G., Carter, P. A., and Garland, T., Jr. (1998). Artificial selection for increased wheel-running
behavior in house mice. Behav.Genet. 28, 227-237.
Tappy, L., Binnert, C., and Schneiter, P. (2003). Energy expenditure, physical activity and body-weight
control. Proc.Nutr.Soc. 62, 663-666.
Teske, J. A., Billington, C. J., and Kotz, C. M. (2008). Neuropeptidergic mediators of spontaneous physical
activity and non-exercise activity thermogenesis. Neuroendocrinology 87, 71-90.
Thornton, S. N., Even, P. C., and van Dijk, G. (2009). Hydration increases cell metabolism.
Int.J.Obes.(Lond) 33, 385.
Vaanholt, L. M. et al. (2008). Metabolic and behavioral responses to high-fat feeding in mice selectively bred
for high wheel-running activity. Int.J.Obes.(Lond) 32, 1566-1575.
Yamauchi, T. et al. (2002). Adiponectin stimulates glucose utilization and fatty-acid oxidation by activating
AMP-activated protein kinase. Nat.Med. 8, 1288-1295.


77
CCHH
AAPP
TTEE
RR
POSTNATAL VERSUS PRENATAL EFFECTS ON OFFSPRING ENERGY
BALANCE REGULATION IN CONTROL MICE AND MICE SELECTIVELY
BRED FOR HIGH VOLUNTARY WHEEL RUNNING
I. Jónás, T. Garland Jr, A. J.W. Scheurink, C. Nyakas, and G. van Dijk
Summary
Maternal behavior and nutritional factors have been shown to imprint neurobiological controls
over energy balance in the offspring during postnatal life. This is particularly relevant in species
that give birth to multiple pups at once, and are faced with nursing large litters where above-
mentioned maternal factors can easily become limited for the individual kids. In these
experiments, we investigated the effects of the postnatal influences in mice selectively bred for
voluntary high running under low-fat (LF) and a high-fat (HF) feeding conditions. The activity
selected lines generally give birth to relative large litters, but have mixed success in nursing their
offspring, presumably due to the activity trait. Our aims were 1) to examine the effects of
perigestational diet on maternal and offspring characteristics in equalized litter conditions, and 2)
to investigate postnatal environment exchange between active and control lines by cross-fostering
of pups. Firstly, we found that litter size at birth needs to be taken account in equalizing litter
sizes. Manipulation with already two pups difference in the litter can result in contradictory
effects, potentially due to a mismatch with expected number of pups the mothers prepared for.
Secondly, control offspring fostered by active mothers resulted in smaller growth, lower glucose
and insulin levels at adulthood of the fostered controls, meaning that the physical activity trait of
mothers strongly influences the control offspring later in life. The opposite, in which selection
line pups were fostered by control mothers did not have a major effect on adult energy balance
regulation in these animals. Thus the prenatal, genetic make-up of activity selected offspring
overpowered the relatively rich postnatal environment of control mothers, even when they were
subjected to a HF diet. In conclusion, postnatal epigenetic effects seem to play only a limited role
in the phenotype of mice selectively bred for high running wheel behavior.

Chapter 7
106
1. Introduction
During the perinatal stage, metabolic, physiological and behavioral traits can be programmed
which could affect maintenance of health and proneness for certain diseases later in life (Bouret
2009; Armitage et al. 2005; MohanKumar et al. 2007; McGowan, Meaney, and Szyf 2008; Barnes
et al. 1966). It has been claimed for example that pregnant and lactating subjects eating high
amounts of sugars and saturated fats adversely influence their offspring, with increased risk of
developing obesity and related co-morbidities later in their lives. In our previous study in control
mice, we consistently observed that feeding a 40% high-fat diet combined with refined sugars
until day 16 of lactation, was able to increase weight gain and adiposity in the adult male
offspring. These perinatal diet effects, however, were not observed in mice from the same
ancestral line, but subsequently selectively bred for increased voluntary wheel running behavior
over 50 generations. Programming effects of an unhealthy diet can apparently be offset by a trait
for voluntary behavior. In that study, we also observed that the reproduction output of the
selected and control animals differed, i.e., selected mice gave birth to on average larger litters than
control mice. Large litters are generally comprised of relative small pups, while pups in relatively
small litters tend to be larger. This could imply that individual pups from selected mothers are
less well nourished than those of controls. It was also shown previously that energy intake of
lactating mice becomes limited intrinsically, when they have to nurse too large litter, which
additionally influences average pup growth and development (Johnson, Thomson, and Speakman
2001). Therefore, litter size could be a major postnatal contributing factor to programming of
energy balance in the newborn and later life.
Perinatal under- and overnourishment has been studied by experimentally increasing
and decreasing litter size (Schultze 1954). The quantity of nutrition in suckling animals indeed
resulted in permanent effects on growth and metabolism as well as mental development.
Overnutrition early in life as a result of relatively fewer pups in a litter is an important cause of
obesity and related metabolic diseases in the adult mice (Aubert, Suquet, and Lemonnier 1980;
Winick and Noble 1967; Plagemann 2006; Faust, Johnson, and Hirsch 1980), and may be a
model for human disease as well. To study the contribution of litter size in the effects of
perinatal HF diet feeding and the trait for increased physical activity in offspring body weight
development and associated metabolic, hormonal, and behavioral parameters, we equalized litter
sizes in control and high activity lines under the different diet conditions. We hypothesized that
line differences would be maintained with respect to consequences of perinatal HF diet feeding
on offspring.
Next we addressed whether perinatal diet/ line interactions on pup characteristics and
subsequent body weight related factors at adulthood are due to genetic differences between lines,
or caused by postnatal effects of mothers on pups. The technique of cross-fostering is generally
used to distinguish between the influence of genes and the postnatal environment (Hager,
Cheverud, and Wolf 2009). For this reason equalizing litter size was combined with cross-

Postnatal vs. prenatal environment
107
fostering of pups a) between litters born to mothers of similar lines, or b) between litters of
mothers born to different lines. These effects were investigated in the situation when mothers
were either feeding a low fat (LF) carbohydrate rich diet, or when they were feeding a HF diet.
When a parameter relevant to regulation of body weight is not altered by cross-fostering between
lines, a genetic basis for this parameter inside the cross-fostered pup may be considered more
persistent than the postnatal influence exerted via the mother.
2. Materials and methods
2.1. Animals and housing
Female mice 5-7 months of age were selectively bred for voluntary wheel-running behavior (the
base population was the Hsd:ICR strain) in generation 49 and they were the siblings of the
animals used in chapter 4 and 5. Their founders from generation 48 were obtained from T.
Garland Jr, Riverside, CA, which were used for further breeding for 2 separate selection lines
(line 7 and line 8) and one separate control line (line 2) at our facilities in Haren without further
selection for wheel-running activity. For a detailed description of the selection procedure see
(Swallow, Carter, and Garland, Jr. 1998). All female mice were individually housed in type C cages
with wood shavings and EnviroDry® bedding with food and water ad libitum. The food was
either a healthy fibered low-fat diet (LF) (3.8 kcal/g; 58 % carbohydrate, 6 % fat, 22 % protein;
Standard lab chow RMH-B 2181, HopeFarms BV, Woerden, NL) for half of the animals or a 40
% fat diet, additionally containing fast sugars (HF) (4.7 kcal/g; 30 % carbohydrate, 45 % fat, 18
% protein; AB Animal Diets, Woerden, NL. Animals were housed in a room with a temperature
of 22±1 °C on a 12:12 light-dark cycle with lights on at 8 am. Virgin female mice were paired
with males from the same line, diet and generation. After 3 weeks of pairing, males were removed
and totally 39 females gave birth and allowed to raise litters.
Handling of lactating mothers was exactly the same as it was described in Chapter 4 (see
in details in Chapter 4). Briefly, maternal body mass and food intake were assessed daily
throughout lactation. Feces produced over day 13-16 of lactation were collected to determined
energy absorption. Growth Efficiency (GE) was calculated for body weight gain of mother and
pups (i.e., expressed as mg body weight gain/ kJ food absorbed).
2.2. Equalizing of litters and cross-fostering
At the day of delivery, the size and the mass of the litter were assessed and the proportion of
males and females in the litters were scored. Based on that outcome male as well as female pups
were either A) not exchanged and left with their own mother, B) exchanged between mothers
within the same line and diet, C) exchanged between the lines on the same diet, or D) exchanged
within the same line on different diets. Exchanging of pups according to C) was never done
between lines 7 and 8. Only when two or more litters were born within one day difference or

Chapter 7
108
less, exchanging pups was allowed before the 3rd day of post-natal life, because after the 3rd day
pup-mother bonding is does not occur anymore. In the process of exchange on the first post-
natal day, the largest variations in litter size were first narrowed to 9-12, and manipulated to 10-11
on the second or third post-natal day. At day 8, all the litters were equalized to 10, if possible.
Individual pups (recognized by sex and toe-clip) were weighed at day 8, 13, 16 and 21. Cages
were cleaned at the time of weighing. During peak lactation, between day 13 and 16, feces were
collected from bedding material for analysis of energy density. At day 16, HF diet was changed
for chow (LF) diet, for the reason that offspring start to eat from food hoppers. At day 21,
offspring were weaned and group-housed into 3-4 with their same sex littermates.
At 4 weeks of age, half of the own offspring that was raised by the mother that
delivered them, were sacrificed for hormone and body composition analysis. At 6-8 weeks of age
running wheel characterization was performed with body mass measurement. At 3 months of
age, body mass of offspring was assessed again and they were individually housed for food and
water intake measurements. At 4 months of age, they were sacrificed for body composition and
hormone analysis (the procedures more in details in Chapter 5).
2.3. Statistical analysis
Data was analysed with General Linear Model Univariate Analysis with the exception of GLM
Repeated Measures of maternal body weight and food intake over the course of lactation. Body
masses of offspring during lactation were analyzed with ANOVA nested design where mothers
were nested into line*diet interaction.
3. Results of mothers and litters at birth
3.1. Mother characteristics
3.1.1. Body mass during pregnancy and lactation
Before pregnancy the average body weights of line 2, 7, and 8 females on LF diet were
respectively 30.9g; 24.0g; and 25.6g. On the HF diet these body weights were respectively 33.9g;
24.5g; and 27.8g. GLM Univariate Analysis revealed effect of line (F(2,43)=14.11; p<0.001), and
post-hoc analysis revealed that line 7 and 8 females weighed less than line 2 females irrespective
of diet. Over the course of pregnancy, body weight increases were found without effects of line
(Figure 1).
During lactation (d1-d16), GLM Repeated measures revealed line effects (F(2,34)=5.85;
p<0.01), where line 7 mothers had significantly lower body masses than line 2, and line 8 mothers
appeared to have an intermediate body weight. Time interacted with diet (F(15,525)=2.62;
p<0.001), meaning that HF fed mothers weighed significantly less over time (Figure 2).

Postnatal vs. prenatal environment
109
0
20
40
60
80
2 LF 2 HF 7 LF 7 HF 8 LF 8 HF
bo
dy
we
igh
t (g
)
pre-gestational body weight weight gain during pregnancy
Figure 1. Pre-gestational body weight and weight gain during pregnancy in females fed LF diet
(A) and HF diet (B) in line 2 (control line), line 7 and line 8 (selected lines).
30
35
40
45
50
55
60
65
-6 -3 0 3 6 9 12 15 18 21
days of lactation
bo
dy
we
igh
t (g
)
line 2 LF
line 7 LF
line 8 LF
30
35
40
45
50
55
60
65
-6 -3 0 3 6 9 12 15 18 21
days of lactation
bo
dy
we
igh
t (g
)
line 2 HF
line 7 HF
line 8 HF
Figure 2. Body weight of females fed LF diet (A) and HF diet (B) in line 2 (control line), line 7
and line 8 (selected lines) during lactation.
3.1.2. Food intake during lactation
With repeated measures between day 1 and day 16 of lactation, a diet effect (F(1,33)=5.67;
p<0.05), but not line effect was found on maternal energy intake (in kJ). Specifically, females
feeding the HF diet increased their food intake compared to females eating the LF diet. There
was an interaction between time and line (F(28,476)=1.57; p<0.05), time and diet
(F(14,476)=8.83; p<0.001) and between time, line and diet F(28,476)=1.79; p<0.01), meaning
that both line 7 and line 8 mothers increased their food intake when fed a HF diet, but not line 2.
When the cumulative amount of food eaten during lactation was assessed from day 8 to day 16,
an effect of line was revealed (F(2,35)=3.70; p<0.05), and post-hoc analysis showed that
specifically line 8 females ate significantly more than line 7 females. Also an effect of diet was
found (F(1,35)=6.97; p<0.05); i.e., mothers fed the HF diet ate more than those fed LF diet.
(Figure 3).

Chapter 7
110
0
5
10
15
20
25
30
-6 -3 0 3 6 9 12 15 18 21
days of lactation
foo
d in
tak
e (
g)
line 2 LF
line 7 LF
line 8 LF
0
5
10
15
20
25
30
-6 -3 0 3 6 9 12 15 18 21
days of lactation
foo
d i
nta
ke
(g
)
line 2 HF
line 7 HF
line 8 HF
Figure 3. Food intake of females fed LF diet (A) and HF diet (B) in line 2 (control line), line 7
and line 8 (selected lines) during lactation.
3.2. Litter characteristics at birth
At birth, litter sizes and masses were assessed. We observed that line 8 had significantly larger
litter sizes than line 2 (F(2,38)=3.41; p<0.05). Line 7 did not differ from either line (Table 1).
Litter mass did not differ significantly between groups, however line 8 tended to have larger litter
masses than line 2 (F(2,38)=3.06; p=0.06). Mean pup mass at birth did not differ between lines
and diet conditions.
Table 1. Litter characteristics of mothers fed LF and HF diet during pregnancy and lactation in
line 2 (control line), line 7 and line 8 (selected lines) at birth.
LF HF LF HF LF HF
Litter size 11.8 ± 0.8 8.1 ± 1.0# 12.0 ± 1.3 11.5 ± 0.7 12.2 ± 1.2 13.3 ± 1.1Litter mass 18.7 ± 0.8 13.6 ± 1.8# 19.6 ± 1.6 18.0 ± 1.7 19.3 ± 1.8 20.3 ± 1.0Mean pup mass 1.6 ± 0.0 1.7 ± 0.1 1.7 ± 0.1 1.5 ± 0.1 1.6 ± 0.0 1.5 ± 0.1
At birth
2 7 8
# denotes significance difference with LF diet (p<0.05).
Based on the outcome of the counted male and female pups, they were divided
according to cross-fostering protocols A), B), C) mentioned earlier in the material and methods
section. There were totally 3 litters in which adjusting the litter size to 10 was not possible,
because of pup loss after day 3. These 3 litters were from one line 7 mother feeding HF diet (with
9 pups), from one line 8 mother feeding the LF diet (with 7 pups) and from one line 8 mother
feeding HF diet (with 9 pups). Further details on the number of cross-fostered pups are
provided in table 2 at pre-weaning. At post-weaning, the half of the own and all the cross-
fostered offspring were used.

Postnatal vs. prenatal environment
111
Table 2. Number of cross-fostered male and female pups raised by own, xf (condition B), line 2,
line 7 and line 8 (condition C) mothers.
mothers own xf 7 8 own xf 2 own xf 2
male 15 3 4 3 18 6 6 17 4 6
female 15 4 6 3 24 4 5 19 6 4
male 8 4 3 3 13 3 3 25 4 7female 9 4 4 5 12 4 5 15 4 3
2HF offspring 7HF offspring 8HF offspring
8LF offspring2LF offspring 7LF offspring
4. Part A. Characteristics of own offspring
4.1. Body weight of own offspring
During the pre-weaning period, offspring characteristics were continuingly assessed at 8, 13, 16
and 21 days after birth. Using an ANOVA with a nested design, in which mother was a random
factor and nested into line*diet interaction, males and females were analyzed separately. Mother
attained a strong significant factor in each time point in the body mass differences of offspring
during lactation in both genders. In general, maternal HF diet caused male and female offspring
to be larger than those of LF diet fed mothers in each of the above-mentioned time points (d8:
♂: F(1,92)=38.86; p<0.001 and ♀: F(1,89)=49.97; p<0.001, d13: ♂: F(1,92)=72.31; p<0.001 and
♀: F(1,89)=42.05; p<0.001, d16: ♂: F(1,92)=131.90; p<0.001 and ♀: F(1,89)=136.09; p<0.001
and d21: ♂: F(1,92)=57.03; p<0.001 and ♀: F(1,89)=61.47; p<0.001) (see table 3). In males, line
differences were revealed; i.e., at day 8 (F(2,92)=8.27; p<0.001) line 2 offspring were significantly
heavier than that of line 7 and line 8. From day 13 onward (d13: F(2,92)=13.27; p<0.001, d16:
F(2,92)=17.07; p<0.001, d21: F(2,92)=30.27; p<0.001), male offspring from different lines
differed significantly from one another, with line 2 offspring being the heaviest and line 7 the
lightest, and line 8 offspring of intermediate body weight. In the case of females, line effects were
revealed only from day 16 onward (d16: F(2,89)=17.46; p<0.001, d21: F(2,89)=22.92; p<0.001),
with line 2 offspring being the heaviest and line 7 the lightest with line 8 intermediate, similar to
male offspring.
After weaning, body weights were assessed at 4 weeks, 6 weeks, at 3 months, and 4
months of age. At 4 weeks, maternal HF diet increased body mass in male (F(1,39)=15.28;
p<0.001) offspring, but an effect in female offspring was lost. The HF diet effect was not
attributed to the male offspring of line 2, but both line 7 and line 8 male offspring of HF feeding
mothers were heavier than from LF feeding mothers (shown by interaction of line and diet). At
6 weeks of age, body mass was affected by line in both genders (♂: F(2,52)=11.72; p<0.001; ♀:
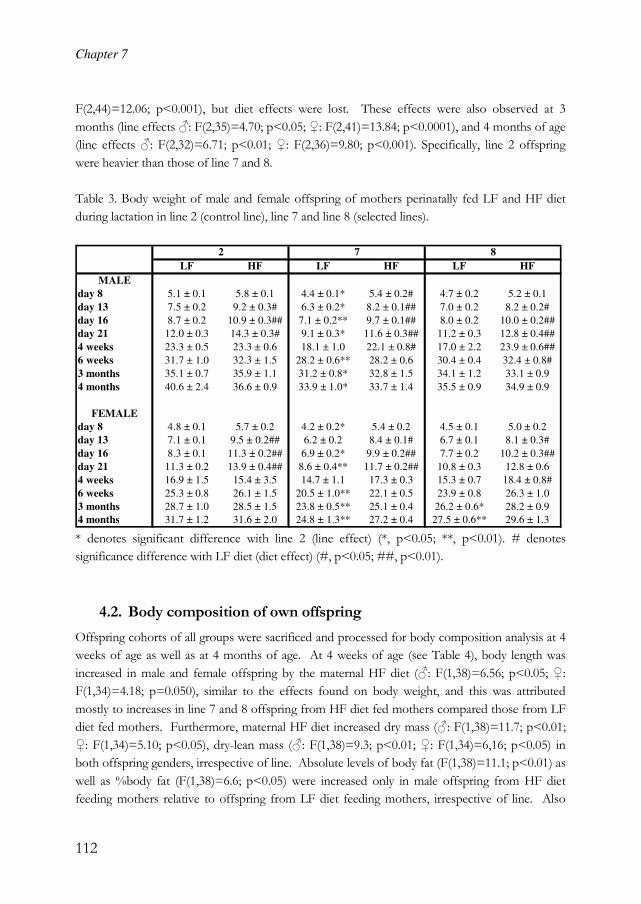
Chapter 7
112
F(2,44)=12.06; p<0.001), but diet effects were lost. These effects were also observed at 3
months (line effects ♂: F(2,35)=4.70; p<0.05; ♀: F(2,41)=13.84; p<0.0001), and 4 months of age
(line effects ♂: F(2,32)=6.71; p<0.01; ♀: F(2,36)=9.80; p<0.001). Specifically, line 2 offspring
were heavier than those of line 7 and 8.
Table 3. Body weight of male and female offspring of mothers perinatally fed LF and HF diet
during lactation in line 2 (control line), line 7 and line 8 (selected lines).
LF HF LF HF LF HF
MALE
day 8 5.1 ± 0.1 5.8 ± 0.1 4.4 ± 0.1* 5.4 ± 0.2# 4.7 ± 0.2 5.2 ± 0.1
day 13 7.5 ± 0.2 9.2 ± 0.3# 6.3 ± 0.2* 8.2 ± 0.1## 7.0 ± 0.2 8.2 ± 0.2#day 16 8.7 ± 0.2 10.9 ± 0.3## 7.1 ± 0.2** 9.7 ± 0.1## 8.0 ± 0.2 10.0 ± 0.2##day 21 12.0 ± 0.3 14.3 ± 0.3# 9.1 ± 0.3* 11.6 ± 0.3## 11.2 ± 0.3 12.8 ± 0.4##
4 weeks 23.3 ± 0.5 23.3 ± 0.6 18.1 ± 1.0 22.1 ± 0.8# 17.0 ± 2.2 23.9 ± 0.6##6 weeks 31.7 ± 1.0 32.3 ± 1.5 28.2 ± 0.6** 28.2 ± 0.6 30.4 ± 0.4 32.4 ± 0.8#
3 months 35.1 ± 0.7 35.9 ± 1.1 31.2 ± 0.8* 32.8 ± 1.5 34.1 ± 1.2 33.1 ± 0.9
4 months 40.6 ± 2.4 36.6 ± 0.9 33.9 ± 1.0* 33.7 ± 1.4 35.5 ± 0.9 34.9 ± 0.9
FEMALE
day 8 4.8 ± 0.1 5.7 ± 0.2 4.2 ± 0.2* 5.4 ± 0.2 4.5 ± 0.1 5.0 ± 0.2day 13 7.1 ± 0.1 9.5 ± 0.2## 6.2 ± 0.2 8.4 ± 0.1# 6.7 ± 0.1 8.1 ± 0.3#
day 16 8.3 ± 0.1 11.3 ± 0.2## 6.9 ± 0.2* 9.9 ± 0.2## 7.7 ± 0.2 10.2 ± 0.3##day 21 11.3 ± 0.2 13.9 ± 0.4## 8.6 ± 0.4** 11.7 ± 0.2## 10.8 ± 0.3 12.8 ± 0.6
4 weeks 16.9 ± 1.5 15.4 ± 3.5 14.7 ± 1.1 17.3 ± 0.3 15.3 ± 0.7 18.4 ± 0.8#
6 weeks 25.3 ± 0.8 26.1 ± 1.5 20.5 ± 1.0** 22.1 ± 0.5 23.9 ± 0.8 26.3 ± 1.03 months 28.7 ± 1.0 28.5 ± 1.5 23.8 ± 0.5** 25.1 ± 0.4 26.2 ± 0.6* 28.2 ± 0.94 months 31.7 ± 1.2 31.6 ± 2.0 24.8 ± 1.3** 27.2 ± 0.4 27.5 ± 0.6** 29.6 ± 1.3
2 7 8
* denotes significant difference with line 2 (line effect) (*, p<0.05; **, p<0.01). # denotes
significance difference with LF diet (diet effect) (#, p<0.05; ##, p<0.01).
4.2. Body composition of own offspring
Offspring cohorts of all groups were sacrificed and processed for body composition analysis at 4
weeks of age as well as at 4 months of age. At 4 weeks of age (see Table 4), body length was
increased in male and female offspring by the maternal HF diet (♂: F(1,38)=6.56; p<0.05; ♀:
F(1,34)=4.18; p=0.050), similar to the effects found on body weight, and this was attributed
mostly to increases in line 7 and 8 offspring from HF diet fed mothers compared those from LF
diet fed mothers. Furthermore, maternal HF diet increased dry mass (♂: F(1,38)=11.7; p<0.01;
♀: F(1,34)=5.10; p<0.05), dry-lean mass (♂: F(1,38)=9.3; p<0.01; ♀: F(1,34)=6,16; p<0.05) in
both offspring genders, irrespective of line. Absolute levels of body fat (F(1,38)=11.1; p<0.01) as
well as %body fat (F(1,38)=6.6; p<0.05) were increased only in male offspring from HF diet
feeding mothers relative to offspring from LF diet feeding mothers, irrespective of line. Also

Postnatal vs. prenatal environment
113
body water content (F(1,38)=7.3; p<0.05) was increased but %body water decreased in male
offspring from HF diet feeding mothers relative to those from LF feeding mothers, and an
interaction of line and diet revealed that effects of the peri-gestational diet on dry mass
(F(1,38)=3.2; p=0.052) and body water content (F(2,38)=3.5; p<0.05) were mainly attributed to
increased levels in lines 7 and 8, but not line 2 offspring. Female offspring of line 8 had increased
dry mass (F(2,34)=3.82; p<0.05) and a tendency for increased dry-lean mass (F(2,34)=3.28;
p=0.052) relative to line 2 female offspring.
With respect to the liver of 4 week old mice, male offspring of mothers on the HF diet
had increased fresh liver weight (F(1,38)=6.75; p<0.05), liver dry mass (F(1,38)=7.0; p<0.05),
liver dry-lean mass (F(1,38)=7.6; p<0.01) and liver water content (F(1,38)=6.43; p<0.05), effects
not seen in female mice. Furthermore, compared to line 2 male offspring line 7 male offspring
had livers with lower fresh weight (F(2,38)=3.76; p<0.05), dry mass (F(2,38)=4.84; p<0.05), dry-
lean mass (F(2,38)=4.06; p<0.05) and water content (F(2,38)=3.35; p<0.05). The %liver dry lean
mass (F(2,34)=4.46; p<0.05) was smaller in female offspring line 7 than that of line 2 offspring.
On the other hand, liver fat content (♂: F(2,38)=5.76; p<0.01; ♀: F(2,34)=4.97; p<0.05) and
%liver fat content (♂: F(2,38)=3.55; p<0.05, ♀: F(2,34)=6.23; p<0.01) was the higher in male
and female offspring of line 8 relative to male offspring of line 7 and female offspring of line 2.
At 4 months of age (See Table 5), prior differences in body length caused by maternal
HF diet were lost in both genders. The maternal HF diet increased %body water content in male
offspring (F(1,32)=6.30; p<0.05), but none of the other body parameters in either gender was
affected by maternal diet. In male offspring, maternal HF diet decreased dry-lean mass
(F(2,32)=3.73; p<0.05) as well as total body water content (F(2,32)=4.64; p<0.05) in line 7
relative to line 2. An increased %body water content (F(2,32)=4.16; p<0.05) in line 8 male
offspring was observed in male offspring from HF diet fed mothers relative to those of line 2
mothers. None of the other parameters reached significance. In female offspring, line effects
revealed smaller dry mass (F(2,36)=9.66; p<0.001), fat mass (F(2,36)=10.24; p<0.001), %body
water (F(2,36)=6.04; p<0.01), %dry-lean mass (F(2,36)=3.70; p<0.05) and %body fat
(F(2,36)=9.73; p<0.001) in line 7 and line 8 relative to line 2 and in addition smaller dry-lean mass
(F(2,36)=8.22; p<0.01) and body water (F(2,36)=8.04; p<0.01) in line 7 but not in line 8 relative
to line 2.
Composition of the livers of 4 month old mice was not affected by diet. In general,
effects of line revealed smaller liver fresh weight (♂: F(2,37)=12.08; p<0.001; ♀: F(2,37)=6.04;
p<0.01), liver dry mass (♂: F(2,37)=9.49; p<0.01; ♀: F(2,37)=6.96; p<0.01), liver dry-lean mass
(♂: F(2,37)=7.25; p<0.01; ♀: F(2,37)=6.24; p<0.01), liver water content (♂: F(2,37)=12.60;
p<0.001; ♀: F(2,37)=5.42; p<0.01) and %liver water content (♂: F(2,37)=3.4; p<0.05; but not in
♀) mostly in line 7 male offspring relative to line 2 and line 8 male offspring. Liver fat content,
%liver fat content and other % parameters were not affected by line or diet.

Chapter 7
114
Table 4. Body composition of male and female offspring of mothers perinatally fed LF and HF
diet in line 2 (control line), line 7 and line 8 (selected lines) at 4 weeks of age.
LF HF LF HF LF HF
MALE
Body mass (g) 23.3 ± 0.5 23.3 ± 0.6 18.1 ± 1.0** 22.1 ± 0.8# 17.0 ± 2.2* 23.9 ± 0.6##Length (cm) 7.9 ± 0.1 7.7 ± 0.1 7.3 ± 0.2 7.8 ± 0.2 7.1 ± 0.3 8.0 ± 0.1##
Drymass (g) 5.1 ± 0.1 5.1 ± 0.1 3.9 ± 0.3 4.9 ± 0.2# 3.6 ± 0.4 5.3 ± 0.2##Dry-lean mass (g) 3.9 ± 0.1 3.8 ± 0.1 3.0 ± 0.2 3.7 ± 0.1# 2.8 ± 0.3 3.9 ± 0.2##
Water content (g) 12.4 ± 0.2 11.7 ± 0.4 9.4 ± 0.6 11.7 ± 0.4# 8.7 ± 1.0 12.0 ± 0.5##
Fat mass (g) 1.2 ± 0.1 1.3 ± 0.2 0.9 ± 0.1 1.2 ± 0.1 0.8 ± 0.1 1.4 ± 0.1##
%Dry-lean mass 22.2 ± 0.5 22.8 ± 0.4 22.4 ± 0.3 22.3 ± 0.2 22.8 ± 0.7 22.4 ± 0.2
%Water 71.1 ± 0.3 69.8 ± 0.9 70.8 ± 0.4 70.6 ± 0.5 71.1 ± 0.3 69.5 ± 0.5#
%Fat mass 6.7 ± 0.4 7.5 ± 1.2 6.7 ± 0.3 7.1 ± 0.6 6.1 ± 0.6 8.1 ± 0.5#
Liver fresh mass (g) 1.5 ± 0.0 1.5 ± 0.1 1.2 ± 0.1** 1.3 ± 0.1 1.1 ± 0.2* 1.5 ± 0.1#
Liver fat content (mg) 50.5 ± 3.4 47.4 ± 6.5 31.9 ± 2.4** 36.4 ± 4.8 37.7 ± 6.4 46.6 ± 2.2
%Liver fat content 3.4 ± 0.2 3.1 ± 0.3 2.8 ± 0.1* 2.7 ± 0.3 3.6 ± 0.5 3.2 ± 0.1
FEMALE
Body mass (g) 16.9 ± 1.5 15.4 ± 3.5 14.7 ± 1.1 17.3 ± 0.3 15.3 ± 0.7 18.4 ± 0.8#
Length (cm) 7.4 ± 0.2 7.4 ± 0.3 6.9 ± 0.2 7.5 ± 0.1 7.1 ± 0.1 7.6 ± 0.1#
Drymass (g) 3.8 ± 0.3 3.4 ± 0.8 3.2 ± 0.3 3.8 ± 0.0 3.4 ± 0.1 4.9 ± 0.4##
Dry-lean mass (g) 2.9 ± 0.2 2.7 ± 0.4 2.4 ± 0.2 2.9 ± 0.0 2.5 ± 0.1 3.5 ± 0.3##
Water content (g) 8.6 ± 0.9 7.4 ± 1.7 7.4 ± 0.6 8.7 ± 0.2 7.4 ± 0.3 10.2 ± 1.0##
Fat mass (g) 0.9 ± 0.1 0.7 ± 0.3 0.8 ± 0.1 0.9 ± 0.1 0.8 ± 0.1 1.4 ± 0.3#
%Dry-lean mass 24.1 ± 1.4 25.8 ± 1.6 22.6 ± 0.3 23.0 ± 0.3 23.4 ± 0.6 23.4 ± 0.8
%Water 69.3 ± 0.7 68.5 ± 0.4 69.9 ± 0.5 69.5 ± 0.5 68.8 ± 0.4 67.3 ± 1.5
%Fat mass 6.6 ± 1.0 5.7 ± 1.4 7.3 ± 0.5 7.5 ± 0.5 7.6 ± 0.8 9.2 ± 2.1
Liver fresh mass (g) 1.1 ± 0.1 0.9 ± 0.3 1.0 ± 0.0 1.0 ± 0.0 1.0 ± 0.1 1.4 ± 0.1#Liver fat content (mg) 27.3 ± 4.2 20.9 ± 10.9 27.4 ± 3.1 29.2 ± 2.2 35.1 ± 3.4 42.8 ± 7.3
%Liver fat content 2.4 ± 0.3 2.1 ± 0.6 2.8 ± 0.2 2.8 ± 0.2 3.4 ± 0.2 3.1 ± 0.2##
2 7 8
* denotes significant difference with line 2 (line effect) (*, p<0.05; **, p<0.01). # denotes
significance difference with LF diet (diet effect) (#, p<0.05; ##, p<0.01).
4.3. Plasma hormone and glucose levels of own offspring
Analysis of blood samples taken from 4 month old mice revealed that maternal HF diet tended to
decrease insulin levels in both genders (♂: F(1,40)=4.06; p=0.052; ♀: F(1,37)=3.83; p=0.058) and
glucose levels in female offspring (F(1,37)=3.82; p=0.059), see table 6. In fact, these effects were
attributed by line 2 offspring from mothers fed the HF diet. None of the other assessed
circulating parameters were affected by diet. Line effects revealed low levels of insulin (♂:
F(2,40)=5.26; p<0.05; ♀: F(2,39)=4.87; p<0.05) and leptin (♂: F(2,40)=5.90; p<0.01; ♀:
F(2,39)=11.74; p<0.001) in male offspring of line 8 and female offspring of line 7 and line 8
relative to those of line 2. Glucose levels were also lower in line 7 and line 8 female
(F(2,37)=4.01; p<0.05), but not in male offspring. Adiponectin levels were significantly different
among all the three lines (F(2,39)=15.03; p<0.001) with line 8 having the highest and line 2
having the lowest levels of adiponectin and line 7 being intermediate.

Postnatal vs. prenatal environment
115
Table 5. Body composition of male and female offspring of mothers perinatally fed LF and HF
diet in line 2 (control line), line 7 and line 8 (selected lines) at 4 months of age.
LF HF LF HF LF HF
MALE
Body mass (g) 40.6 ± 2.3 36.6 ± 0.9 33.9 ± 1.0* 33.7 ± 1.4 35.5 ± 0.9 34.9 ± 0.9Length (cm) 9.7 ± 0.3 9.5 ± 0.1 9.4 ± 0.1 9.2 ± 0.2 9.2 ± 0.2 9.2 ± 0.2
Drymass (g) 9.6 ± 0.6 8.9 ± 0.4 8.6 ± 0.2 8.6 ± 0.5 8.6 ± 0.5 7.8 ± 0.3Dry-lean mass (g) 7.6 ± 0.3 7.4 ± 0.2 6.9 ± 0.3 6.7 ± 0.2 7.1 ± 0.2 6.8 ± 0.1
Water content (g) 19.3 ± 0.3 20.0 ± 0.4 18.0 ± 0.6* 18.2 ± 0.8 19.4 ± 0.4 19.3 ± 0.4
Fat mass (g) 2.1 ± 0.5 1.5 ± 0.3 1.6 ± 0.3 1.9 ± 0.4 1.6 ± 0.4 1.0 ± 0.2
%Dry-lean mass 26.1 ± 0.9 25.7 ± 0.2 26.0 ± 0.7 25.2 ± 0.4 25.2 ± 0.3 25.1 ± 0.2
%Water 66.8 ± 1.4 69.2 ± 0.7 67.7 ± 0.6 68.0 ± 1.0 68.0 ± 6.8 71.3 ± 0.5
%Fat mass 7.1 ± 1.6 5.1 ± 0.8 6.3 ± 1.1 6.8 ± 1.2 6.8 ± 1.4 3.6 ± 0.5Liver fresh mass (g) 2.2 ± 0.1 2.1 ± 0.1 1.7 ± 0.1** 1.8 ± 0.1 2.1 ± 0.0 2.1 ± 0.1
Liver fat content (mg) 80.0 ± 9.4 66.5 ± 6.5 53.3 ± 3.2* 64.8 ± 8.1 60.8 ± 6.3 72.4 ± 10.0 %Liver fat content 3.6 ± 0.4 3.1 ± 0.3 3.2 ± 0.2 3.6 ± 0.5 2.9 ± 0.3 3.5 ± 0.5
FEMALE
Body mass (g) 31.7 ± 1.2 31.6 ± 2.0 24.8 ± 1.3** 27.2 ± 0.4 27.5 ± 0.6** 29.6 ± 1.3
Length (cm) 9.2 ± 0.1 9.1 ± 0.2 8.8 ± 0.2 8.8 ± 0.1 8.9 ± 0.1* 8.9 ± 0.2
Drymass (g) 9.4 ± 0.6 8.9 ± 0.9 6.3 ± 0.4** 6.9 ± 0.3 6.6 ± 0.2** 7.3 ± 0.8
Dry-lean mass (g) 6.0 ± 0.2 5.7 ± 0.4 5.0 ± 0.2** 5.2 ± 0.0 5.4 ± 0.1* 5.7 ± 0.2Water content (g) 15.7 ± 0.5 15.5 ± 0.8 13.3 ± 0.7* 14.3 ± 0.2 14.5 ± 0.3* 15.7 ± 0.4#
Fat mass (g) 3.5 ± 0.5 3.2 ± 0.6 1.3 ± 0.3** 1.7 ± 0.3 1.2 ± 0.1** 1.6 ± 0.7 %Dry-lean mass 23.7 ± 0.4 23.6 ± 0.5 25.6 ± 0.7* 24.7 ± 0.3 25.8 ± 0.3** 24.7 ± 0.6
%Water 62.7 ± 0.8 63.8 ± 1.3 68.0 ± 0.9** 67.4 ± 1.2 68.7 ± 0.7** 68.6 ± 1.7
%Fat mass 13.6 ± 1.1 12.7 ± 1.7 6.3 ± 1.2** 7.9 ± 1.4 5.6 ± 0.6** 6.7 ± 2.2
Liver fresh mass (g) 1.9 ± 0.1 1.7 ± 0.2 1.4 ± 0.1** 1.6 ± 0.1 1.7 ± 0.1 1.8 ± 0.1Liver fat content (mg) 107.6 ± 12.6 98.5 ± 5.6 71.0 ± 15.5 74.4 ± 5.6 76.7 ± 8.5 94.5 ± 15.7
%Liver fat content 5.7 ± 0.5 5.7 ± 0.5 4.8 ± 1.0 4.8 ± 0.3 4.6 ± 0.5 5.1 ± 0.6
2 7 8
* denotes significant difference with line 2 (line effect) (*, p<0.05; **, p<0.01). # denotes
significance difference with LF diet (diet effect) (#, p<0.05).
4.4. Food and water intake of own offspring
Assessment and analysis of food intake by the offspring at 3 months of age revealed effects of
diet in male offspring (F(1,35)=6.12; p<0.05), but no line effect was observed. Male offspring of
HF diet feeding mothers ate significantly more than male offspring of LF diet feeding mothers,
irrespective of line. In female offspring, a line effect (F(2,41)=12.96; p<0.0001), and a line*diet
effect (F(2,41)=5.35; p<0.01) was observed on food intake. Specifically, female offspring of line
2 ate significantly less than line 7 and line 8 irrespective of diet, and female offspring of HF
feeding mothers only had increased food intake in line 8. (see Figure 4).
In male offspring water intake revealed effects of diet (F(1,35)=7.67; p<0.01), but not
of line. Specifically, male offspring of HF diet fed mothers drank more than offspring of LF diet
fed mothers. In female offspring, however, water intake revealed a line effect (F(2,41)=7.54;
p<0.01), but not a diet effect; with line 7 female offspring drinking more than 2 female offspring
(see Figure 5).

Chapter 7
116
Table 6. Hormonal and fuel levels in male and female offspring of mothers perinatally fed LF and
HF diet in line 2 (control line), line 7 and line 8 (selected lines) at 4 months of age.
LF HF LF HF LF HF
MALE
Glucose (mM) 9.4 ± 0.9 7.8 ± 0.5 8.5 ± 0.6 7.7 ± 1.0 6.9 ± 0.9 7.9 ± 0.6Insulin (ng/ml) 1.7 ± 0.5 0.8 ± 0.3 1.2 ± 0.2 1.0 ± 0.2 0.6 ± 0.1 0.5 ± 0.1
Leptin (ng/ml) 2.5 ± 0.6 2.3 ± 0.5 3.0 ± 0.4 2.6 ± 0.6 1.8 ± 0.3 1.2 ± 0.2Adiponectin µg/ml) 3.8 ± 0.6 4.5 ± 1.1 5.2 ± 0.4 4.7 ± 0.3 4.3 ± 0.6 4.3 ± 0.5
FEMALE
Glucose (mM) 9.5 ± 0.8 7.5 ± 0.6 7.4 ± 0.4* 6.3 ± 0.5 7.1 ± 0.4** 7.4 ± 0.7Insulin (ng/ml) 1.5 ± 0.4 0.7 ± 0.3 0.4 ± 0.2* 0.3 ± 0.1 0.6 ± 0.2* 0.3 ± 0.2Leptin (ng/ml) 5.4 ± 1.0 4.3 ± 0.8 2.6 ± 0.6* 2.2 ± 0.3 1.6 ± 0.2** 1.9 ± 0.7Adiponectin µg/ml) 8.3 ± 0.5 6.9 ± 1.0 9.6 ± 0.8 10.0 ± 0.8 11.2 ± 0.7** 12.7 ± 0.9
2 7 8
* denotes significant difference with line 2 (line effect) (*, p<0.05; **, p<0.01). No diet effect was
observed.
0
5
10
15
20
25
2 7 8 2 7 8
male female
foo
d in
take (
g)
LF diet
HF diet
Figure 4. Food intake of male and female offspring of mothers perinatally fed LF and HF diet
during lactation in line 2 (control line), line 7 and line 8 (selected lines) at 3 months of age.
0
5
10
15
20
2 7 8 2 7 8
male female
wa
ter
inta
ke
(g
)
LF diet
HF diet
Figure 5. Water intake of male and female offspring of mothers perinatally fed LF and HF diet in
line 2 (control line), line 7 and line 8 (selected lines) at 3 months of age.

Postnatal vs. prenatal environment
117
4.5. Running wheel behavior of own offspring
Running wheel behavior was assessed according to the same methodology as used for selective
breeding of lines. The average of the 5th and 6th day of total number of wheel revolutions was
analyzed and since rodents are active in the dark phase, the dark phase of the 6th day was also
examined specifically. In male offspring, running wheel behavior did not differ between lines and
diet in either time period (see figure 6). In females, however, GLM revealed effect of line
(F(2,38)=4.20; p<0.05), but not of diet. Specifically, line 8 offspring ran significantly more
revolutions than line 2 offspring when the whole two days were examined. When only the dark
phase was considered, both line 7 and 8 females ran significantly more than line 2 females
(F(2,38)=4.69, p<0.05).
0
10000
20000
30000
40000
50000
60000
70000
2 7 8 2 7 8
male female
rev
olu
tio
ns
/ d
ay
LF diet
HF diet
Figure 6. Average running wheel activity of male and female offspring of mothers perinatally fed
LF and HF diet in line 2 (control line), line 7 and line 8 (selected lines) at 7 weeks of age.
4.6. Plus maze performance of own offspring
In male offspring, GLM Univariate Analysis revealed that maternal HF diet feeding increased the
percentage of time spent in open arms (F(1,48)=9.12; p<0.01), the number of open arm entries
(F(1,48)=4.62; p<0.05) and the percentage of open arm entries (F(1,48)=10.42; p<0.01). The
percentage time spent in closed arms tended to be significant in the interaction of line and diet
(F(2,48)=3.14; p=0.053). Closed arm entries were affected by line (F(2,48)=3.28; p<0.05), diet
(F(1,48)=7.09; p<0.05), and by a line*diet interaction (F(2,48)=4.25; p<0.05). Specifically,
offspring of HF diet fed mothers decreased their entries to closed arms, particularly in line 7,
while offspring of line 8 was not affected. Percentage time spent in center area was affected by
line (F(2,48)=3.95; p<0.05), diet (F(1,48)=12.93; p<0.001), and by a line*diet interaction
(F(2,48)=7.81; p<0.01). Specifically, maternal HF diet feeding significantly decreased the time
spent in the center, particularly strongly in line 7 offspring, while line 8 offspring were not
affected. Total arm entries showed effect of line (F(1,48)=3.64; p<0.05); offspring of line 7 had
increased total arm travels relative to offspring of line 2 (see Table 7).

Chapter 7
118
In female offspring, GLM Univariate Analysis revealed that percentage of time spent in
the center area was affected by line (F(2,43)=7.10; p<0.01), and by a line*diet interaction
(F(2,43)=7.01; p<0.01). Specifically, offspring of line 2 spent significantly more time in the
center relative to offspring of line 8, and this effect was amplified in line 2 offspring relative to
lines 7 and 8 offspring from mother feeding the HF diet. While no effects were observed on
time spent in closed or open arms, total arm entries in female offspring revealed effect of line
(F(2,43)=4.40; p<0.05). Specifically, increased total arm entries of line 7 offspring relative to line
2 offspring were observed, with line 8 being intermediate. None of open arm or closed arm
entries or percentage of open arm or closed arm showed difference among groups (see Table 7).
Table 7. Plus maze performance in male and female offspring of mothers perinatally fed LF and
HF diet in line 2 (control line), line 7 and line 8 (selected lines) at adolescence age.
LF HF LF HF LF HF
MALE
% Open time 13.6 ± 3.6 26.9 ± 12.9 4.2 ± 2.5* 16.7 ± 6.0# 8.6 ± 1.9 15.3 ± 1.8#% Closed time 40.2 ± 3.6 49.4 ± 11.8 40.8 ± 4.6 51.3 ± 8.0 62.6 ± 3.9** 50.1 ± 4.0#
% Center time 46.2 ± 2.4 23.7 ± 3.0## 55 ± 3.9 32.1 ± 9.3# 28.9 ± 3.2** 34.7 ± 3.6Open entries 4 ± 1.0 3.6 ± 1.3 2.3 ± 1.4 7.7 ± 2.1# 2.7 ± 0.6 4.3 ± 1.0
Closed entries 14.1 ± 1.5 9.2 ± 2.3 19.9 ± 1.9* 12.5 ± 1.7# 12.9 ± 1.1 14.3 ± 1.5
Total entries 18.1 ± 1.9 12.8 ± 1.5 22.2 ± 1.7 20.2 ± 3.7 15.6 ± 1.5 18.5 ± 1.8
% Open entries 21.4 ± 5.1 31.9 ± 12.4 9.9 ± 5.4 34.4 ± 4.1## 16 ± 2.6 22.6 ± 3.5% Close entries 78.6 ± 5.1 68.1 ± 12.4 90.1 ± 5.4 65.6 ± 4.1## 84 ± 2.6 77.4 ± 3.5
FEMALE
% Open time 8.5 ± 3.0 7.6 ± 4.4 10.2 ± 2.6 16.7 ± 6.9 13.6 ± 2.2 13.1 ± 2.8
% Closed time 51.4 ± 5.4 35 ± 5.2 45 ± 3.9 51.7 ± 5.8 53.8 ± 2.4 52.8 ± 3.4
% Center time 40.2 ± 3.8 57.4 ± 6.2# 44.8 ± 4.7 31.6 ± 1.5# 32.6 ± 2.4 34.2 ± 4.4
Open entries 3.4 ± 0.7 3.3 ± 1.6 5.2 ± 1.3 7.6 ± 2.2 4.7 ± 0.9 4.8 ± 0.7Closed entries 15.3 ± 0.9 15.8 ± 2.8 18.2 ± 1.9 19.6 ± 2.1 15.8 ± 1.2 16.5 ± 1.3Total entries 18.6 ± 1.3 19 ± 2.7 23.4 ± 2.9 27.1 ± 2.7 20.5 ± 1.2 21.3 ± 1.1% Open entries 17.1 ± 3.1 16.7 ± 7.8 20.1 ± 3.9 26.3 ± 7.8 22.8 ± 3.7 23 ± 3.9% Close entries 82.9 ± 3.1 83.3 ± 7.8 79.9 ± 3.9 73.7 ± 7.8 77.2 ± 3.7 77 ± 3.9
2 7 8
* denotes significant difference with line 2 (line effect) (*, p<0.05; **, p<0.01). # denotes
significance difference with LF diet (diet effect) (#, p<0.05; ##, p<0.01).
5. Discussion on perinatal nutritional effects on own offspring
In a previous study, we observed that control mice subjected to a diet with an high fat (HF) and
refined sugar content during pregnancy and lactation give birth to pups with increase growth
rates and subsequently increased body weights at adulthood (see Chapter 4 and 5). This effect
was found in males only. These data are seemingly consistent with many other studies

Postnatal vs. prenatal environment
119
investigating the effects of western type cafeteria diets during the perinatal stage on programming
of energy balance in the offspring (Lemonnier 1972; Parente, Aguila, and Mandarim-de-Lacerda
2008; Samuelsson et al. 2008; Srinivasan et al. 2006). We additionally found that the perinatal
effects of feeding a HF diet did not result in increased growth rates in mice from the same
ancestral line, but subsequently selectively bred for increased voluntary wheel running behavior
over 50 generations. Programming effects of an unhealthy diet can apparently be offset by a trait
for voluntary physical activity, even in the absence of running wheels. In that particular study,
however, we observed that the number of pups per litter at birth of the selected mothers was
significantly higher in the high activity selected mice than of the control line. Moreover, the HF
feeding control mothers, but not the selected mothers, gave birth to fewer pups per litter than the
low fat (LF) diet feeding controls. These effects were largely repeated in the present study. Since
litter size is inversely related to individual pup weight (Chapter 4, (Johnson, Thomson, and
Speakman 2001)) during lactation, and thus may be an important factor determining pup weight
gain and development and subsequent body weight at adulthood (Chapter 5), a permissive role of
reduced litter size in the perinatal HF diet effects on offspring body weight homeostasis can not
be ruled out.
The mechanism underlying this effect is probably related to the fact that nutrient
procurement of the mother to each extra pup is not entirely met by increased maternal nutrient
intake (Schultze 1954; Johnson, Thomson, and Speakman 2001), which renders individual pups
in large litters smaller than those in relatively small litters. In the present study, we aimed at
investigation the consequences of equalizing litters of all mothers to 10 pups, and hypothesized
that diet and line effects would be maintained despite equalizing litter sizes. Hence, adjusting
litter size to 10 pups would cause line 2 HF feeding mothers to nurse two pups extra per litter,
whereas it would cause line 7 mothers to nurse on average 1.5 and line 8 to nurse on average 3
pups less per litter. There is supporting data pointing out that even a difference of 2 pups
additionally or less in the litter could cause a significant difference in body weight gain of
offspring after weaning (Epstein 1978), which could indeed explain the observed effects in the
previous chapters.
Consistent with our hypothesis was the observation that equalizing litter sizes to 10
caused individual pup weights of HF feeding mothers during lactation to be larger than those of
LF feeding mothers, and secondly, differences between lines during lactation (i.e., with line 2
pups being heavier than line 7 and 8 pups) were maintained. While the HF feeding line 2
mothers were the only group nursing more pups than they were prepared for, their food intake
was markedly reduced on the HF diet and remained behind that of line 7 and 8 females feeding
the HF diet. It seems unlikely that the mothers of the control line feeding the HF diet were
limited intrinsically by maximized heat dissipation, and unable to increase their food intake to
nurse the additional two pups in the litter above the ones they received at birth. The argument
for this idea is that dietary fat has a lower specific dynamic action than carbohydrates (Donato
1987), and this would allow higher energy intake before running the risk over over-heating (Krol

Chapter 7
120
and Speakman 2003). At this moment, we have no explanation for this phenomenon. Line 7
and line 8 mothers, on the other hand increased their food intake, despite the fact that they
nursed a lower number of pups relative to the number they were prepared for at birth. This
provided extra procurement of nutrients from the HF diet feeding mothers to their pups, and
probably amplified the HF diet effect leading to transiently increased body weights of line 7 and 8
offspring after weaning; i.e., an effect not seen in the unmanipulated litter condition of chapter 4
and 5. Because ingestive behavior of line 2 mothers feeding the HF diet did not compensate the
two additional pups they were not prepared for, differences in offspring weight gain of HF- and
LF feeding line 2 mothers were lost at weaning.
The lack of HF diet effects in line 2 controls, and the emergence of HF diet effects in
line 7 and 8 at weaning - both phenomena contrasting with the findings in the unmanipulated
litter condition in Chapters 4 and 5 and against our initial hypothesis- were largely reflected by
body composition at 4 weeks of age. Thus, male offspring from HF diet fed line 7 and line 8
mothers had increased body fat content, lean mass, and body water compared to line 7 and 8
male offspring from LF feeding mothers. In line 2, male offspring from HF feeding and LF
feeding mothers did not differ in body composition, and these effects differ from the
unmanipulated litter condition in Chapters 4 and 5, where only line 2 HF feeding male offspring
was heavier and had more body fat content that line 2 male offspring from LF feeding mothers.
In female offspring in the present study, body fat content and body mass even increased in line 8
offspring from HF diet feeding mothers relative to the HF diet feeding line 2 mothers. Taken
together, these data indicate that litter size appears to be an important factor in HF diet-induced
alterations in body weight homeostasis at the pre-pubertal stage. Since line 8 females prepared for
the largest litters, and thus nursed relatively fewest pups per litter, it is plausible to find the largest
weight gain of individual pups at equalized litters in this particular line.
In the offspring at 4 months of age, diet effects on adiposity and lean mass were
generally lost, while line effects became stronger, with line 7 and 8 male and particularly female
offspring being smaller and leaner than line 2 male and female offspring. The hormonal profile
of these animals very well fit these differences, with plasma leptin and insulin levels particularly
lower in line 7 and 8 female offspring relative to those in line 2 offspring. In addition, increases
were observed in plasma adiponectin levels in the high activity female offspring, reflecting the
findings we had in previous studies (Vaanholt et al. 2007). These data demonstrate that perinatal
effects of dietary fat content are limited on the long term in the offspring, even if initial body
weight gain is in the opposite direction due to equalizing litter sizes. The trait for increased
voluntary physical activity apparently overpowers pre-pubertal increases in body adiposity.
Interestingly, food and water intake were increased in the male offspring from HF feeding
mothers irrespective of line. This points out that perinatal HF diet feeding increased turn-over of
nutrients specifically in male offspring, and may be related to early imprinting on neural circuits in
the hypothalamus regulating energy fluxes. There are indeed supporting studies showing that
early overfeeding or underfeeding either by diet or litter size manipulation caused permanent

Postnatal vs. prenatal environment
121
changes in hypothalamic hormonal controls on food intake at adulthood (Davidowa, Li, and
Plagemann 2003; Plagemann et al. 1999; Bouret 2009; Bouret and Simerly 2006). Other
behavioral effects of perinatal HF feeding were decreased anxiety-like behaviors in male (i.e.,
increased time spent in the open arms in the plus maze test), but to a lesser extent in female (i.e.,
increased time in the center of the plus maze test) offspring during the plus maze performance
test. Besides these effects, there were line effects to indicate that the offspring from the high
activity lines showed more anxiety-like behavior and running wheel activity (in females only) than
the control offspring, which is in agreement with the results of previous chapters.
In summary, energy supply, both qualitatively (maternal diet) and quantitatively
(determined by litter size manipulation) during lactation have huge impacts on offspring
development. Feeding a HF diet caused female mice in the control line to deliver smaller litters,
but those in the selection lines to deliver the same or even larger litters than when they were
feeding the fed LF diet. Equalizing litter sizes caused control females on a HF diet to nurse two
pups more than they delivered, while selected lines nursed 1.5-3 pups less than they delivered
irrespective of diet. Thus, control mothers faced increased requirements from their litters
despite HF diet feeding, and this permanently diminished perigestational HF diet effects on body
characteristics including weight, length, and adiposity. Selected mothers, on the other hand, were
feeding less pups than they prepared for, which resulted in perinatal HF diet-induced obesogenic
effects at the adolescent stage, particularly in line 8. These effects, however, were transient and
overpowered by the physical activity trait at adulthood leading to smaller and leaner mice in lines
7 and 8 relative to lines 2.

Chapter 7
122
6. Part B. Characteristics of cross-fostered offspring
Litter characteristics at birth were already described in paragraph 3.2 and shown in table 1. In
this part, growth and development will be described of pups that were either cross-fostered by
mothers within the same line and diet (condition B), or cross-fostered between lines 2 and 7, or
between lines 2 and 8 within the same diet condition (condition C). Cross-fostering of pups
between mothers on different diets within the same line was also performed (condition D), but
yielded too few cases and is not described further. Table 2 shows numbers of cross-fostered and
non cross-fostered pups in the different conditions. To assess whether body weight and related
parameters are determined 1) by a genetic basis for these parameters inside the cross-fostered
pup, or 2) by the postnatal influence exerted via the mother (“environment”), characteristics of
cross-fostered offspring between lines (condition C) were compared to non cross-fostered “own”
offspring (condition A; described in the previous part of this chapter). Effect of cross-fostering
per sé was investigated by comparing non cross-fostered “own” offspring (condition A) with
cross-fostered offspring between mothers within the same lines (condition B). Differences
between offspring were analyzed with GLM Univariate Analysis according to comparisons
mentioned above. Males and females were included in the analysis to investigate interactions
between “environment” and “gender”. Gender effects alone were not discussed.
6.1. Body weight of cross-fostered offspring before weaning
Before weaning, body masses of offspring were assessed at day 8, 13, 16 and 21. Before weaning,
cross-fostering of pups between mothers within the same line on either diet never caused body
weights of pups to differ from the non cross-fostered pups (comparison of condition A versus
B). This means that the procedure of fostering was a negligible factor in adolescent growth.
Line 2 offspring from LF feeding mothers (further mentioned as 2LF, 7LF, etc)
fostered by 7LF mothers yielded significant body weight effects from day 8 onwards (day 8
(F(3,55)=6.94; p<0.001), day 13 (F(3,52)=23.20; p<0.001), day 16 (F(3,52)=26.48; p<0.001) and
day 21 (F(3,52)=31.44; p<0.001)). Specifically, 2LF offspring weighed significantly less when
they were fostered by 7LF mothers than when they were raised by their own mothers, and in fact
weighed less than 7LF own pups. Line 2LF offspring by fostered by 8LF mothers did not change
body weight. Line 7LF offspring fostered by 2LF mothers significantly affected body weight
from day 16 onward (d16: F(2,63)=4.10; p<0.05 and d21: F(2,63)=3.39; p<0.05). Specifically,
7LF offspring were heavier when they were fostered by 2LF mothers, but they weighed
significantly less than 2LF own offspring (d16 and d21: p<0.001). Body weight of 8LF offspring
was not altered due to fostering by line 2LF mothers or by the interaction with gender at any age.
See Figure 7 left column.

Postnatal vs. prenatal environment
123
In the HF diet condition, body weight of line 2HF offspring fostered by 7HF mothers
caused significant effects on body weight only at day 21 (F(3,44)=2.89; p<0.05). Specifically, 2HF
offspring weighed less when they were fostered by 7HF mothers, and in fact had similar weights
as 7HF own offspring. No effect of fostering of 2HF offspring by 8HF mothers was found.
From day 13 onward, body weight of 7HF (d13: F(2,39)=6.03; p<0.01, d16: F(2,39)=8.61;
p<0.001 and d21: F(2,39)=7.49; p<0.01) as well as 8HF offspring (d13: F(2,57)=4.70; p<0.05,
d16: F(2,56)=4.60; p<0.05 and d21: F(2,47)=3.96; p<0.05) fostered by 2HF mothers yielded
significant effects. Both 7HF and 8HF offspring were heavier when they were raised by 2HF
mothers compared to when they were raised by their own mothers, and in fact had similar
weights as 2HF own biological offspring. See Figure 8 left column.
Figure 7. Offspring (males and females) body weight development described preweaning (left
column) and postweaning (right column) when perinatally fed LF diet. Top raw shows 2LF
offspring, middle raw shows 7LF offspring and bottom raw shows 8LF offspring raised by
different mothers indicated in legend. * denotes significant difference between cross-fostered and
own offspring (p<0.05).
0
5
10
15
d8 d13 d16 d21
own xf 7LF 8LF
** *
*
0
10
20
30
40
50
7weeks 3mon 4mon
* * *
0
5
10
15
d8 d13 d16 d21
own xf 2LF
* *
0
10
20
30
40
50
7weeks 3mon 4mon
*
0
5
10
15
d8 d13 d16 d21
own xf 2LF
0
10
20
30
40
50
7weeks 3mon 4mon

Chapter 7
124
Figure 8. Offspring (males and females) body weight development described preweaning (left
column) and postweaning (right column) when perinatally fed HF diet. Top raw shows 2HF
offspring, middle raw shows 7HF offspring and bottom raw shows 8HF offspring raised by
different mothers indicated in legend. * denotes significant difference between cross-fostered and
own offspring (p<0.05).
6.2. Energy fluxes during peak lactation
During peak lactation (day 13-16), maternal food intake (g) was significantly influenced by line
(F(2,35)=3.38; p<0.05) and by a line*diet interaction (F(2,35)=3.49; p<0.05); i.e., line 7 ate
significantly less than line 8 mothers. When food intake was expressed as energy (kJ) effect of line
(F(2,35)=3.44; p<0.05), diet (F(1,35)=19.42; p<0.001), and interactions of line and diet
(F(2,35)=3.41; p<0.05) were revealed, and post-hoc analysis showed that mothers fed a HF diet
ate more that those fed a LF diet, with the exception of line 2. Line 8 mothers ate more than line
7 mothers irrespective of diet (see Table 8).
The total amount of defecated waste during 3 days of peak lactation was significantly
influenced by diet (F(1,34)=12.33; p<0.01), but not by line. Specifically, lactating females feeding
HF diet defecated less than when they were feeding LF diet. The total energy content of the
waste was also decreased by diet (F(1,34)=5.99; p<0.05). The waste energy content per unit
0
5
10
15
d8 d13 d16 d21
own xf 7HF 8HF
*
0
10
20
30
40
50
7weeks 3mon 4mon
0
5
10
15
d8 d13 d16 d21
own xf 2HF
* * *
0
10
20
30
40
50
7weeks 3mon 4mon
0
5
10
15
d8 d13 d16 d21
own xf 2HF
**
*
0
10
20
30
40
50
7weeks 3mon 4mon

Postnatal vs. prenatal environment
125
weight was significantly influenced by line (F(2,34)=4.29; p<0.05), diet (F(1,34)=197.85;
p<0.001) and by a line*diet interaction (F(2,34)=5.56; p<0.01). Specifically, line 8 mothers had
increased energy content in the feces per unit weight relative to line 2 mothers, and HF feeding
also increased the energy content per unit weight.
Table 8. Energetic parameters during peak lactation (day 13-16) in females fed LF diet and HF
diet in line 2 (control line), line 7 and line 8 (selected lines).
LF HF LF HF LF HF
Food intake (g) 66.5 ± 1.1 55.7 ± 2.3## 55.1 ± 3.1** 58.1 ± 5.4 62.8 ± 2.5 67.3 ± 4.1
Food intake (kJ) 1057.7 ± 18.0 1095.5 ± 45.1 875.6 ± 49.4** 1141.9 ± 106.4# 998.2 ± 39.7 1323.6 ± 80.6##
Feces
total dry weight (g) 10.0 ± 1.8 6.0 ± 0.2# 6.3 ± 0.4 5.2 ± 0.3 8.4 ± 1.0 5.6 ± 0.3#
total energy content (kJ) 177.9 ± 33.1 115.9 ± 3.6 112.1 ± 7.5 106.1 ± 7.1 147.6 ± 17.6 116.5 ± 5.4
energy density (kJ/g) 17.7 ± 0.1 19.4 ± 0.3## 17.9 ± 0.2 20.2 ± 0.3## 17.6 ± 0.1 20.6 ± 0.2##
Absorbed energy (kJ) 879.8 ± 48.1 979.6 ± 43.1 763.5 ± 46.1 1035.9 ± 102.6# 850.7 ± 27.6 1207.2 ± 80.0##
Absorption efficiency (%) 82.9 ± 3.5 89.4 ± 0.4 87.1 ± 0.8 90.6 ± 0.6# 85.4 ± 1.4 91.1 ± 0.5##
2 7 8
* denotes significant difference with line 2 (line effect) (*, p<0.05; **, p<0.01). # denotes
significance difference with LF diet (diet effect) (#, p<0.05; ##, p<0.01).
The energy absorption of the mothers was subtracted from the total ingested energy
minus the total measured energy of the feces. This absorbed energy was higher in mothers fed a
HF diet (F(1,34)=24.3; p<0.001). Absorption efficiency was increased by HF diet (F(1,34)=14.69;
p<0.001). This energy was used by the mother itself and by the pups. Therefore to calculate the
growth efficiency, the body weight gain of the mother and the pups was counted from day 13 to
day 16 and both divided with the absorbed energy of the mother (mg/kJ). Growth efficiency was
significantly influenced by line (F(2,33)=4.16; p<0.05), diet (F(1,33)=258.10; p<0.001) and
line*diet interaction (F(2,33)=6.11; p<0.01). Specifically, line 7 had smaller GE when fed a LF
diet. HF diet significantly increased GE with the exception of line 8. (Figure 9).
0
4
8
12
16
20
2 7 8
GE
(m
g/k
J)
LF
HF
Figure 9. Growth efficiency of females
fed LF and HF diet in line 2 (control
line), line 7 and line 8 (selected lines) at
peak lactation.

Chapter 7
126
6.3. Body weight of cross-fostered offspring after weaning
Similar to the pre-weaning period, cross-fostering of pups between mothers in either line on
either diet did not cause body weights of pups to differ from the non cross-fostered pups
(comparison of condition A versus B).
Body weight of line 2LF offspring fostered by 7LF mothers yielded significant effects
throughout the postweaning period to adulthood (at 6 weeks of age (F(3,20)=7.30; p<0.005), at 3
months of age (F(3,20)=3.88; p<0.05) and at 4 months of age (F(3,23)=8.73; p<0.0005)). See
Figure 7 right column. Specifically, 2LF offspring weighed less when they were fostered by 7LF
mothers compared to when they were raised by their own mothers, and in fact were
indistinguishable from 7LF own offspring. Body weight of 7LF offspring fostered by 2LF
mothers yielded interaction effect of environment and gender (F(2,27)=4.49; p<0.05) at 3
months of age but not at other time points. Thus at 3 months of age, 7LF male, but not 7LF
female offspring were heavier when they were fostered by 2LF mothers and were
indistinguishable from 2LF offspring. Body weight of 8LF offspring fostered by 2LF mothers
was neither significantly by environment nor by the interaction with gender at any age. In the HF
diet condition, neither body weights of 2HF, 7HF, nor of 8HF offspring were affected by cross-
fostering. See Table 8 right column.
6.4. Body composition of cross-fostered offspring
Offspring body composition at 4 months of age is shown in Table 9. In the LF diet condition
(Table 9A), 2LF offspring fostered by 7LF mothers yielded significant effects on body length
(F(3,23)=3.67; p<0.05), dry-lean mass (F(3,23)=4.28; p<0.05), analogous to the effects on body
weight. In none of the groups was body fat mass or %body fat significantly affected by cross-
fostering. In stead, body length and dry-lean mass were smaller in 2LF offspring when they were
fostered by 7LF, but not by 8LF mothers, and in fact indistinguishable from 7LF own offspring.
When 7LF offspring were fostered by 2LF mothers, total body water content yielded an
interaction effect of environment and gender (F(2,28)=3.4; p<0.05), but no other parameters
were affected. Specifically, male offspring, but not female offspring, of 7LF mothers had
increased body water content when they were fostered by 2LF mothers, and were
indistinguishable from 2LF own biological offspring. Line 8LF offspring were not altered due to
fostering by 2LF mothers. An effect of cross-fostering per sé was observed in 8LF offspring.
Specifically, body water content (p<0.001) was increased in 8LF offspring by cross-fostering
within lines.
In the HF diet condition (Table 9B), fostering of 7HF offspring by 2HF mothers
caused significant effects on dry-lean mass (F(2,17)=6.88; p<0.01) and body water content
(F(2,17)=6.52; p<0.01). Specifically, dry-lean mass and body water content were larger in 7HF
offspring when they were fostered by 2HF mothers than when they were raised by their own
mothers.

Postnatal vs. prenatal environment
127
Ao
wn
xf
78
ow
nxf
2o
wn
xf
2
MA
LE
BW
40.6
± 2
.334
.4 ±
28.7
± 2
.6*
34.8
± 1
.233
.9 ±
1.0
31.3
± 0
.535
.2 ±
1.9
35.5
± 0
.933
.9 ±
1.3
35.2
± 0
.6
Len
gth
9.7
± 0.
39.
3 ±
9.1
± 0
.29.
1 ±
0.1
9.4
± 0.
19.
5 ±
0.0
9.4
± 0
.39.
2 ±
0.2
8.8
± 0.
39.
4 ±
0.1
Dry
ma
ss9.
6 ±
0.6
9 ±
7.7
± 0
.89.
2 ±
1.0
8.6
± 0.
28.
7 ±
0.4
9.5
± 1
.08.
6 ±
0.5
8.9
± 0.
79.
6 ±
0.3
Dry
lea
n
7.6
± 0.
38.
3 ±
6.6
± 0
.47.
3 ±
0.4
6.9
± 0.
36.
7 ±
0.1
7.5
± 0
.47.
1 ±
0.2
7.2
± 0.
47.
5 ±
0.1
Wa
ter
19.3
± 0
.320
.7 ±
16.3
± 2
.120
.7 ±
0.6
18 ±
0.6
17.9
± 0
.420
.7 ±
0.9
*19
.4 ±
0.4
20 ±
0.7
20.8
± 0
.3*
Fat
2.1
± 0.
50.
7 ±
1.2
± 0
.41.
9 ±
0.6
1.6
± 0.
32
± 0.
32
± 0.
61.
6 ±
0.4
1.6
± 0.
42.
1 ±
0.3
Dry
lea
n%
26.1
± 0
.928
.0 ±
24.9
± 0
.324
.7 ±
0.2
26.0
± 0
.725
.2 ±
0.4
27.9
± 2
.124
.6 ±
0.3
25.0
± 0
.224
.5 ±
0.5
Wa
ter%
66.8
± 1
.469
.8 ±
68.8
± 1
.468
.4 ±
0.7
67.7
± 0
.667
.2 ±
0.8
67.6
± 1
.069
.2 ±
1.2
69.4
± 1
.169
.3 ±
2.0
Fat%
7.1
± 1.
62.
2 ±
6.3
± 1
.66.
8 ±
0.8
6.3
± 1.
17.
6 ±
1.1
4.5
± 1
.26.
2 ±
1.4
5.5
± 1.
16.
2 ±
1.6
FE
MA
LE
BW
31.7
± 1
.233
.8 ±
3.3
24.3
± 2
.3**
28.2
± 0
.624
.8 ±
1.3
27.1
± 0
.825
.8 ±
0.3
27.5
± 0
.628
.7 ±
1.1
27.1
± 1
.4
Len
gth
9.2
± 0.
19.
5 ±
0.3
8.7
± 0
.2*
9 ±
0.2
8.8
± 0.
29.
1 ±
0.3
8.7
± 0
.18.
9 ±
0.1
8.7
± 0.
29
± 0.
2
Dry
ma
ss9.
4 ±
0.6
9.8
± 1
.67.
1 ±
0.8
*8
± 0
.56.
3 ±
0.4
7.7
± 0
.66.
8 ±
0.3
6.6
± 0.
28
± 0
.77.
3 ±
0.5
Dry
lea
n
6 ±
0.2
6.2
± 0
.35.
1 ±
0.4
5.9
± 0.
25
± 0
.25.
4 ±
0.1
5.2
± 0
.15.
4 ±
0.1
6 ±
0.1
5.8
± 0
.3
Wa
ter
15.7
± 0
.516
.8 ±
0.8
14.4
± 1
.416
.2 ±
0.2
13.3
± 0
.715
.3 ±
0.3
14.6
± 0
.214
.5 ±
0.3
16.4
± 0
.4*
16.5
± 1
.0*
Fat
3.5
± 0.
53.
6 ±
1.3
2 ±
0.5
2.2
± 0.
31.
3 ±
0.3
2.3
± 0
.51.
6 ±
0.3
1.2
± 0.
12
± 0
.61.
5 ±
0.2
Dry
lea
n%
23.7
± 0
.423
.4 ±
0.9
24.4
± 0
.524
.9 ±
0.3
25.6
± 0
.723
.7 ±
0.3
24.2
± 1
.625
.8 ±
0.3
24.8
± 0
.824
.2 ±
0.3
Wa
ter%
62.7
± 0
.863
.9 ±
2.8
68.2
± 1
.169
.5 ±
0.6
68.0
± 0
.966
.7 ±
1.6
67.1
± 1
.468
.7 ±
0.7
67.3
± 1
.466
.8 ±
1.2
Fat%
13.6
± 1
.112
.7 ±
3.6
7.4
± 1
.67.
7 ±
1.0
6.3
± 1.
29.
6 ±
1.9
8.7
± 1
.55.
6 ±
0.6
8.0
± 2.
19.
0 ±
1.1
2L
F o
ffsp
rin
g7L
F o
ffsp
rin
g8
LF
off
spri
ng
Tab
le 9
A.
Bod
y co
mpo
sitio
n of
mic
e se
lect
ivel
y br
ed f
or h
igh
volu
ntar
y w
heel
run
ning
beh
avio
r (li
nes
7 an
d 8)
and
the
con
trol
line
rai
sed
by m
othe
rs t
hey
wer
e bo
rn t
o (“
own”
), or
whe
n th
ey w
ere
fost
ered
by
othe
r m
othe
rs o
f th
e sa
me
line
(xf)
, or
by o
ther
mot
hers
of
othe
r
lines
(xf2
, xf7
, or
xf8)
. M
ales
, fem
ales
and
LF
- (A
), H
F d
iet (
B)
are
show
n in
sep
arat
e pa
nels
.
* de
note
s si
gnif
ican
t dif
fere
nce
from
the
ow
n (*
, p<
0.05
; **,
p<
0.01
).

Chapter 7
128
Bow
nxf
78
own
xf2
own
xf2
MA
LE
BW
36.6
± 0
.939
.2 ±
1.4
35.4
± 2
.835
.9 ±
0.7
33.7
± 1
.433
.2 ±
0.4
34.9
± 2
.734
.9 ±
0.9
39.4
± 2
.937
.2 ±
0.7
Len
gth
9.5
± 0.
19.
6 ±
0.3
9.6
± 0.
29.
3 ±
0.4
9.2
± 0.
29.
5 ±
0.3
9.7
± 0.
39.
2 ±
0.2
9.5
± 0.
09.
7 ±
0.2
Dry
mas
s8.
9 ±
0.4
11.5
± 0
.39.
5 ±
0.5
9.5
± 0.
58.
6 ±
0.5
8.3
± 0.
49.
5 ±
0.7
8 ±
0.3
10.8
± 1
.79.
8 ±
0.6
Dry
lean
7.
4 ±
0.2
8.5
± 0.
47.
7 ±
0.5
7.6
± 0.
36.
7 ±
0.2
7 ±
0.0
7.7
± 0.
56.
9 ±
0.2
7.8
± 0.
47.
9 ±
0.2
Wat
er20
± 0
.422
.5 ±
1.2
20.8
± 1
.921
.2 ±
0.3
18.2
± 0
.820
.3 ±
0.1
21 ±
1.8
19.7
± 0
.523
± 0
.522
.1 ±
0.5
Fat
1.5
± 0.
33.
1 ±
0.4
1.8
± 0.
41.
9 ±
0.3
1.9
± 0.
41.
3 ±
0.4
1.8
± 0.
21
± 0.
13
± 1.
41.
9 ±
0.5
Dry
lean
%25
.7 ±
0.2
24.5
± 0
.325
.3 ±
0.5
24.9
± 0
.225
.2 ±
0.4
24.5
± 0
.225
.4 ±
0.3
25.1
± 0
.223
.3 ±
0.4
24.9
± 0
.3W
ater
%69
.2 ±
0.7
67.4
± 0
.568
.9 ±
0.3
69.3
± 1
.468
.0 ±
1.0
71.0
± 1
.268
.4 ±
1.4
71.3
± 0
.568
.2 ±
3.1
69.0
± 1
.0F
at%
5.1
± 0.
88.
1 ±
0.7
5.8
± 0.
35.
8 ±
1.6
6.8
± 1.
24.
6 ±
1.4
6.2
± 1.
43.
6 ±
0.5
8.5
± 3.
56.
1 ±
0.8
FE
MA
LE
BW
31.6
± 2
.028
.6 ±
1.7
27.4
± 3
.131
.8 ±
3.2
27.2
± 0
.426
.8 ±
0.7
29 ±
1.0
29.6
± 1
.326
.8 ±
0.7
28.1
± 1
.2*
Len
gth
9.1
± 0.
29.
1 ±
0.3
9 ±
0.4
9.2
± 0.
38.
8 ±
0.1
8.9
± 0.
29.
2 ±
0.2
8.9
± 0.
28.
5 ±
0.1
9 ±
0.4
Dry
mas
s8.
9 ±
0.9
8.4
± 0.
38.
4 ±
1.2
9.7
± 1.
46.
9 ±
0.3
7.2
± 0.
27.
9 ±
0.7
7.3
± 0.
86.
7 ±
0.0
6.9
± 0.
4D
ryle
an
5.7
± 0.
45.
9 ±
0.5
5.5
± 0.
56.
2 ±
0.5
5.2
± 0.
05.
8 ±
0.2
5.9
± 0.
3*5.
7 ±
0.2
5.9
± 0.
15.
8 ±
0.2
Wat
er15
.5 ±
0.8
16.2
± 1
.514
.7 ±
1.6
17.3
± 1
.714
.3 ±
0.2
15.5
± 0
.416
.2 ±
0.5
*15
.7 ±
0.4
15.7
± 0
.316
.2 ±
0.8
*F
at3.
2 ±
0.6
2.5
± 0.
72.
9 ±
0.7
3.5
± 0.
81.
7 ±
0.3
1.4
± 0.
12
± 0.
41.
6 ±
0.7
0.9
± 0.
11
± 0.
2D
ryle
an%
23.6
± 0
.523
.8 ±
0.8
24.7
± 0
.325
.2 ±
0.3
24.7
± 0
.325
.4 ±
0.3
24.2
± 0
.824
.7 ±
0.6
26.1
± 0
.223
.2 ±
0.6
Wat
er%
63.8
± 1
.365
.6 ±
2.6
67.2
± 1
.870
.3 ±
0.1
67.4
± 1
.268
.2 ±
0.3
64.0
± 1
.468
.6 ±
1.7
70.1
± 0
.564
.2 ±
1.1
Fat
%12
.7 ±
1.7
10.6
± 3
.38.
1 ±
1.5
4.5
± 0.
57.
9 ±
1.4
6.4
± 0.
311
.8 ±
2.2
6.7
± 2.
23.
8 ±
0.7
12.5
± 1
.6
2HF
off
spri
ng
7HF
off
spri
ng
8HF
off
spri
ng
Tab
le 9
B.
Bod
y co
mpo
sitio
n of
mic
e se
lect
ivel
y br
ed f
or h
igh
volu
ntar
y w
heel
run
ning
beh
avio
r (li
nes
7 an
d 8)
and
the
con
trol
line
rais
ed b
y m
othe
rs t
hey
wer
e bo
rn t
o (“
own”
), or
whe
n th
ey w
ere
fost
ered
by
othe
r m
othe
rs o
f th
e sa
me
line
(xf)
, or
by o
ther
mot
hers
of o
ther
line
s (x
f2, x
f7, o
r xf
8).
Mal
es, f
emal
es a
nd L
F-
(A),
HF
die
t (B
) are
sho
wn
in s
epar
ate
pane
ls.
* de
note
s si
gnif
ican
t dif
fere
nce
from
the
ow
n (*
, p<
0.05
; **,
p<
0.01
).

Postnatal vs. prenatal environment
129
6.5. Hormone levels of cross-fostered offspring
In the LF condition, fostering of 2LF offspring by 8LF mothers caused significant effects on
plasma levels of insulin (F(3,30)=3.03; p<0.05) and glucose (F(3,30)=6.34; p<0.01). See Table 10.
Specifically, 2LF offspring had lower levels of insulin when they were fostered by 8LF mothers
and in fact were indistinguishable from 8LF own offspring. Glucose levels were also decreased
when 2LF offspring were fostered by 7LF and 8LF mothers, and were indistinguishable from to
8LF own offspring and even lower than in 7LF own offspring. No effects on plasma levels of
adiponectin and leptin were observed by cross-fostering. Cross-fostering of pups between
mothers in the same line caused an increased in insulin levels in 8HF offspring (p<0.05), but no
other effects were observed.
6.6. Food and water intake of cross-fostered offspring
Food and water intake assessed at 3 months of age are shown in Table 11. No effect of cross-
fostering within or between lines was found on food and water intake.
6.7. Running wheel behavior of cross-fostered offspring
Running wheel behavior was assessed according to the same methodology as used for selection
of lines. Therefore the average of the 5th and 6th day of total number of wheel revolutions was
analysed and since rodents are active in the dark phase, the dark phase of the 6th day was also
examined specifically. No effect of cross-fostering was found in any line and diet condition. See
Table 12.
6.8. Plus maze performance of cross-fostered offspring
Line 2LF offspring fostered by line 8LF mothers showed an interaction effects with gender on
time spent in open arms (F(2,25)=9.25; p<0.001), %open arm entries (F(2,25)=5.65; p<0.01),
closed arm entries (F(2,25)=7.25; p<0.005) and %closed arm entries (F(2,25)=5.65; p<0.01)
(Table 13). Specifically, female offspring of 2LF fostered by 8LF mothers spent more time in
open arms, had higher percentage open arm entries, less closed arm entries and lower percentage
closed arm entries than 2LF own offspring. Line 7LF offspring fostered by 2LF mothers showed
an interaction with gender on time spent in closed arms (F(1,22)=5.05; p<0.05) and time spent in
the center (F(1,22)=4.60; p<0.05). Specifically, male offspring of 7LF spent more time and
females spent less time in the closed arms. Male, but not female, line 7LF offspring spent less
time in the center when they were fostered by 2LF mothers.
In the HF diet condition, 2HF offspring during plus maze test had only one male and
one female mice in the group when they were cross-fostered to 8HF mothers, therefore, results
were not shown. No effects were observed in 7HF and 8HF offspring.

Chapter 7
130
ow
nx
f7
8o
wn
xf
2ow
nx
f2
MA
LE
glu
cose
(m
M)
9.4
± 0
.95.
7 ±
6.4
± 0
.86
.2 ±
0.8
8.5
± 0
.68
± 0
.48
.9 ±
0.8
6.9
± 0
.99
.2 ±
1.2
9 ±
0.3
insu
lin
(n
g/m
l)1
.7 ±
0.5
1.2
±0
.6 ±
0.1
0.9
± 0
.71
.2 ±
0.2
0.8
± 0
.30
.9 ±
0.5
0.6
± 0
.10
.7 ±
0.3
1.5
± 0
.5le
pti
n (
ng
/ml)
2.5
± 0
.61.
3 ±
1.3
± 0
.11
.5 ±
0.2
3 ±
0.4
2.9
± 0
.62
.4 ±
0.7
1.8
± 0
.31
.8 ±
0.3
2.4
± 0
.6a
dip
on
ecti
n (µ
g/m
l)3
.8 ±
0.6
2 ±
2.5
± 0
.22
.7 ±
1.2
5.2
± 0
.46
± 0
.24
± 0
.64
.3 ±
0.6
4.1
± 0
.65
± 0
.6
FE
MA
LE
glu
cose
(m
M)
9.5
± 0
.88
± 0
.86
.2 ±
0.8
*6
.9 ±
0.8
7.4
± 0
.46
.6 ±
0.4
5.9
± 0
.57
.1 ±
0.4
7.6
± 0
.76
.2 ±
0.3
insu
lin
(n
g/m
l)1
.5 ±
0.4
1.5
± 0
.60
.7 ±
0.2
0.1
± 0
.1*
0.4
± 0
.20
.6 ±
0.3
0.2
± 0
.10
.6 ±
0.2
0.8
± 0
.30
.2 ±
0.1
lep
tin
(n
g/m
l)5
.4 ±
1.0
7.1
± 2
.02
.5 ±
0.7
2.5
± 1
.02
.6 ±
0.6
3.5
± 0
.91
.6 ±
0.2
1.6
± 0
.22
.4 ±
0.8
1.3
± 0
.5a
dip
on
ecti
n (µ
g/m
l)8
.3 ±
0.5
9 ±
1.1
6.9
± 0
.78
.5 ±
2.1
9.6
± 0
.88
.5 ±
0.8
9.5
± 2
.011
.2 ±
0.7
9.1
± 1
.89
.5 ±
0.8
MA
LE
glu
cose
(m
M)
7.8
± 0
.57
.6 ±
1.0
7.6
± 1
.39
.5 ±
1.6
7.7
± 1
.07
.1 ±
0.5
7.2
± 0
.07
.9 ±
0.6
9.7
± 1
.89
.2 ±
2.0
insu
lin
(n
g/m
l)0
.8 ±
0.3
1.3
± 0
.21
.3 ±
0.7
1 ±
0.3
1 ±
0.2
0.8
± 0
.11
.4 ±
1.0
0.5
± 0
.11.
2 ±
0.1
*0
.6 ±
0.4
lep
tin
(n
g/m
l)2
.3 ±
0.5
3.2
± 0
.72
.5 ±
0.6
1.8
± 0
.52
.6 ±
0.6
1.6
± 0
.01
.3 ±
0.6
1.2
± 0
.22
.2 ±
0.9
1.6
± 0
.6a
dip
on
ecti
n (µ
g/m
l)4
.5 ±
1.1
3.5
± 0
.54
± 0
.93
.6 ±
0.5
4.7
± 0
.35
.4 ±
1.4
4.6
± 0
.74
.3 ±
0.5
3.7
± 0
.74
.7 ±
1.2
FE
MA
LE
glu
cose
(m
M)
7.5
± 0
.67
.3 ±
0.9
7.5
± 0
.68
.5 ±
0.7
7.1
± 0
.85
.9 ±
0.9
8.3
± 0
.97
.4 ±
0.7
7.5
± 1
.38
.3 ±
0.2
insu
lin
(n
g/m
l)0
.7 ±
0.3
0.8
± 0
.51
.2 ±
0.2
1 ±
0.2
0.3
± 0
.10
.5 ±
0.2
0.9
± 0
.60
.3 ±
0.2
0.9
± 0
.60
.2 ±
0.2
lep
tin
(n
g/m
l)4
.3 ±
0.8
3.1
± 1
.13
.5 ±
0.9
4.2
± 0
.42
.2 ±
0.3
1.7
± 0
.13
.3 ±
1.2
1.9
± 0
.71
.7 ±
0.2
1.3
± 0
.1a
dip
on
ecti
n (µ
g/m
l)6
.9 ±
1.0
7.2
± 0
.51
0 ±
3.9
7.2
± 1
.21
0 ±
0.8
8.8
± 0
.710
.8 ±
1.1
12.7
± 0
.99
.1 ±
0.5
11.3
± 1
.4
2H
F o
ffsp
rin
g7
HF
off
spri
ng
8H
F o
ffsp
rin
g
2L
F o
ffsp
rin
g7
LF
off
spri
ng
8L
F o
ffsp
rin
g
Tab
le 1
0.
Pla
sma
horm
one
and
gluc
ose
leve
ls o
f m
ice
sele
ctiv
ely
bred
for
hig
h vo
lunt
ary
whe
el r
unni
ng b
ehav
ior
(line
s 7
and
8) a
nd t
he
cont
rol l
ine
rais
ed b
y m
othe
rs t
hey
wer
e bo
rn t
o (“
own”
), or
whe
n th
ey w
ere
fost
ered
by
othe
r m
othe
rs o
f th
e sa
me
line
(xf)
, or
by o
ther
mot
hers
of
othe
r lin
es (
xf2,
xf7
, or
xf8)
. L
F-,
HF
die
t are
sho
wn
in s
epar
ate
pane
ls.
* de
note
s si
gnif
ican
t dif
fere
nce
from
the
ow
n (*
, p<
0.05
).

Postnatal vs. prenatal environment
131
own
xf7
8ow
nxf
2ow
nxf
2
MA
LE
Foo
d in
tak
e (g
)10
.5 ±
0.7
13.7
±11
.7 ±
1.1
11.5
± 0
.213
.4 ±
0.4
13.5
± 0
.312
.2 ±
0.4
14.2
± 1
.712
± 0
.613
.2 ±
0.4
Wat
er in
tak
e (g
)11
± 1
.012
.6 ±
10.8
± 0
.511
.1 ±
0.3
12.7
± 1
.413
.2 ±
0.5
13.1
± 1
.212
.8 ±
0.9
8.7
± 1.
614
.4 ±
2.9
FE
MA
LE
Foo
d in
tak
e (g
)9.
1 ±
0.4
10.8
3 ±
1.13
7.9
± 0.
68.
9 ±
1.3
14.3
± 0
.712
.8 ±
1.0
15 ±
1.3
11 ±
0.5
12.1
± 1
.311
.1 ±
1.3
Wat
er in
tak
e (g
)9.
4 ±
0.5
8.3
± 1.
79.
9 ±
0.7
10.3
± 1
.016
.7 ±
1.0
14.4
± 1
.814
.9 ±
0.8
12 ±
1.3
13.7
± 0
.611
± 1
.0
MA
LE
Foo
d in
tak
e (g
)15
.9 ±
2.6
11.4
± 0
.712
± 0
.99.
8 ±
0.2
14.2
± 1
.016
.4 ±
1.0
16 ±
1.0
17.4
± 1
.913
.7 ±
0.5
12.6
± 0
.1W
ater
inta
ke
(g)
14.1
± 1
.311
.1 ±
0.6
12.8
± 1
.25.
5 ±
3.4
14.4
± 0
.717
.4 ±
1.2
16.2
± 0
.517
.2 ±
1.1
15.2
± 1
.213
.3 ±
3.0
FE
MA
LE
Foo
d in
tak
e (g
)8.
1 ±
0.8
9.6
± 2.
113
.1 ±
2.4
8.2
± 1.
912
.4 ±
1.5
13.9
± 0
.614
.5 ±
2.0
14.7
± 1
.614
.3 ±
1.8
14.4
± 0
.6W
ater
inta
ke
(g)
9.5
± 0.
68.
6 ±
1.3
9.8
± 0.
716
.1 ±
6.3
13.9
± 2
.715
.7 ±
1.6
21.1
± 3
.613
.4 ±
1.0
13.4
± 0
.415
.5 ±
0.8
2LF
off
spri
ng
7LF
off
spri
ng
8LF
off
spri
ng
2HF
off
spri
ng
7HF
off
spri
ng
8HF
off
spri
ng
Tab
le 1
1.
Foo
d an
d w
ater
int
ake
of m
ice
sele
ctiv
ely
bred
for
hig
h vo
lunt
ary
whe
el r
unni
ng b
ehav
ior
(line
s 7
and
8) a
nd t
he c
ontr
ol li
ne
rais
ed b
y m
othe
rs t
hey
wer
e bo
rn t
o (“
own”
), or
whe
n th
ey w
ere
fost
ered
by
othe
r m
othe
rs o
f th
e sa
me
line
(xf)
, or
by o
ther
mot
hers
of
othe
r lin
es (
xf2,
xf7
, or
xf8)
. LF
-, H
F d
iet a
re s
how
n in
sep
arat
e pa
nels
.
No
sign
ific
ant e
ffec
t w
as f
ound
.

Chapter 7
132
own
xf7
8ow
nxf
2ow
nxf
2
MA
LE
revo
luti
on
s/d
ay
1817
1 ±
5637
6403
±
6662
± 3
5279
24 ±
436
1444
3 ±
2031
2727
7 ±
1433
1927
9 ±
3322
2198
3 ±
2881
3646
2 ±
3798
2240
9 ±
4030
FE
MA
LE
revo
luti
on
s/d
ay
1160
3 ±
3935
2004
0 ±
2430
1434
2 ±
1753
1475
1 ±
3890
3710
3 ±
5363
4871
0 ±
2805
824
736
± 64
5153
909
± 10
309
1962
3 ±
9161
3107
2 ±
5999
MA
LE
revo
luti
on
s/d
ay
1818
9 ±
7043
1876
6 ±
3494
7545
± 1
754
3044
8 ±
1144
722
575
± 79
2818
088
± 34
617
716
± 37
2325
974
± 41
1344
616
± 86
2716
291
± 71
98
FE
MA
LE
revo
luti
on
s/d
ay
1625
3 ±
1323
1707
2 ±
1013
120
784
± 49
0717
895
± 38
6234
784
± 59
2828
696
± 45
4130
822
± 96
7738
172
± 18
817
3729
2 ±
1267
439
446
± 81
58
2LF
off
spri
ng7L
F o
ffsp
ring
8LF
off
spri
ng
2HF
off
spri
ng7H
F o
ffsp
ring
8HF
off
spri
ng
No
sign
ific
ant e
ffec
t w
as f
ound
.
Tab
le 1
2.
Run
ning
whe
el a
ctiv
ity o
f m
ice
sele
ctiv
ely
bred
for
hig
h vo
lunt
ary
whe
el r
unni
ng b
ehav
ior
(line
s 7
and
8) a
nd t
he c
ontr
ol li
ne
rais
ed b
y m
othe
rs t
hey
wer
e bo
rn t
o (“
own”
), or
whe
n th
ey w
ere
fost
ered
by
othe
r m
othe
rs o
f th
e sa
me
line
(xf)
, or
by o
ther
mot
hers
of
othe
r lin
es (
xf2,
xf7
, or
xf8)
. LF
-, H
F d
iet a
re s
how
n in
sep
arat
e pa
nels
.

Postnatal vs. prenatal environment
133
Table 13. Plus maze performance behavior of mice selectively bred for high voluntary wheel
running behavior (lines 7 and 8) and the control line raised by mothers they were born to
(“own”), or when they were fostered by mothers of other lines (xf2, xf7, or xf8). Males, females
and LF-, HF diet are shown in separate panels. own 7 8 own 2 own 2
MALE
%Topen 13.6 ± 3.6 6.4 ± 4.1 10.5 ± 5.9 4.2 ± 2.5 2.7 ± 1.5 8.6 ± 2.7 10.2 ± 5.1%Tclosed 40.2 ±3.6 50.4 ± 3.9 53.8 ± 4.6 40.8 ± 4.6 61.7 ± 9.2* 62.6 ± 19.8 58.5 ± 8.2%Tcenter 46.2 ± 2.4 43.2 ± 1.5 35.7 ± 4.6 55 ± 3.9 35.6 ± 8.0* 28.9 ± 9.1 31.3 ± 4.8open entries 4 ± 1.0 3.7 ± 2.0 4 ± 2.6 2.3 ± 1.4 2 ± 1.4 2.7 ± 0.9 3.7 ± 1.6closed entries 14.1 ± 1.5 11.7 ± 0.3 18.7 ± 4.3 19.9 ± 1.9 15.8 ± 2.6 12.9 ± 4.1 14.2 ± 1.1total entries 18.1 ± 1.9 15.3 ± 2.3 22.7 ± 3.4 22.2 ± 1.7 17.8 ± 3.5 15.6 ± 4.9 17.8 ± 1.9%open entries 21.4 ± 5.1 20.6 ± 10.9 18.3 ± 10.4 9.91 ± 5.4 8.9 ± 5.2 16 ± 5.1 18.3 ± 6.6
%close entries 78.6 ± 5.1 79.4 ± 10.9 81.8 ± 10.4 90.1 ± 5.4 91.1 ± 5.2 84 ± 26.6 81.7 ± 6.6
FEMALE
%Topen 8.5 ± 3.0 12.2 ± 2.9 57.2 ± 19.2** 10.2 ± 2.6 12.4 ± 7.6 13.6 ± 2.2 12.8 ± 5.5%Tclosed 51.4 ± 5.4 56 ± 5.4 15.3 ± 8.5** 45 ± 3.9 39.2 ± 7.6 53.8 ± 2.4 48 ± 5.9%Tcenter 40.2 ± 3.8 31.8 ± 4.1 27.5 ± 11.0 44.8 ± 4.7 48.5 ± 2.8 32.6 ± 2.4 39.2 ± 4.3open entries 3.4 ± 0.7 6.7 ± 1.9 6 ± 2.9 5.2 ± 1.3 4.3 ± 1.3 4.7 ± 0.9 2.3 ± 1.3closed entries 15.3 ± 0.9 14.5 ± 1.3 6.3 ± 3.8** 18.2 ± 1.9 17.5 ± 3.9 15.8 ± 1.2 14.8 ± 1.1total entries 18.6 ± 1.3 21.2 ± 2.4 12.3 ± 6.6 23.4 ± 2.9 21.8 ± 3.6 20.5 ± 1.2 17 ± 1.2%open entries 17.1 ± 3.1 29.4 ± 6.3 65.3 ± 17.4** 20.1 ± 3.9 21.6 ± 8.2 22.8 ± 3.7 12.5 ± 6.5%close entries 82.9 ± 3.1 70.6 ± 6.3 34.7 ± 17.4** 79.9 ± 3.9 78.4 ± 8.2 77.2 ± 3.7 87.5 ± 6.5
MALE
%Topen 26.9 ± 12.9 6.2 ± 1.9 29.3 ± 16.7 ± 6.0 8.5 ± 5.3 15.3 ± 1.8 11.6 ± 2.2%Tclosed 49.4 ± 11.8 56.4 ± 8.8 6.6 ± 51.3 ± 8.0 58.6 ± 13.8 50.1 ± 4.0 62.7 ± 10.6%Tcenter 23.7 ± 3.0 37.4 ± 9.1 64.1 ± 32.1 ± 9.3 32.9 ± 8.5 34.7 ± 3.6 25.7 ± 9.2open entries 3.6 ± 1.3 4 ± 0.0 5 ± 7.7 ± 2.1 5 ± 2.5 4.3 ± 1.0 3.7 ± 1.5
closed entries 9.2 ± 2.3 12.7 ± 2.3 2 ± 12.5 ± 1.7 10 ± 2.5 14.3 ± 1.5 10.7 ± 3.2total entries 12.8 ± 1.5 16.7 ± 2.3 7 ± 20.2 ± 3.7 15 ± 4.0 18.5 ± 1.8 14.3 ± 4.6
%open entries 31.9 ± 12.4 24.9 ± 3.4 71.4 ± 34.4 ± 4.1 32.1 ± 9.7 22.6 ± 3.5 23.5 ± 3.4
%close entries 68.1 ± 12.4 75.1 ± 3.4 28.6 ± 65.6 ± 4.1 67.9 ± 9.7 77.4 ± 3.5 76.5 ± 3.4
FEMALE
%Topen 7.6 ± 4.4 25.5 ± 12.8 0.7 ± 16.7 ± 6.9 15.5 ± 8.0 13.1 ± 2.8 17.2 ± 3.0%Tclosed 35 ± 5.2 42.9 ± 3.4 70.3 ± 51.7 ± 5.8 49.9 ± 8.1 52.8 ± 3.4 48.7 ± 5.1%Tcenter 57.4 ± 6.2 31.6 ± 10.4 29 ± 31.6 ± 1.5 34.6 ± 0.1 34.2 ± 4.4 34.1 ± 3.7open entries 3.3 ± 1.6 4 ± 2.3 1 ± 7.6 ± 2.2 6.7 ± 4.1 4.8 ± 0.7 5.3 ± 1.9closed entries 15.8 ± 2.8 12.3 ± 2.6 18 ± 19.6 ± 2.1 18 ± 2.5 16.5 ± 1.3 15.7 ± 1.2total entries 19 ± 2.7 16.3 ± 2.3 19 ± 27.1 ± 2.7 24.7 ± 4.7 21.3 ± 1.1 21 ± 3.0
%open entries 16.7 ± 7.8 24.4 ± 12.4 5.3 ± 26.3 ± 7.8 24.3 ± 12.4 23 ± 3.9 24.1 ± 4.9%close entries 83.3 ± 7.8 75.6 ± 12.4 94.7 ± 73.7 ± 7.8 75.7 ± 12.4 77 ± 3.9 75.9 ± 4.9
2LF offspring 7LF offspring 8LF offspring
2HF offspring 7HF offspring 8HF offspring
* denotes significant difference from the own (*, p<0.05; **, p<0.01).
7. Discussion on perinatal nutritional effects of cross-fostered offspring
Mice selectively bred for increased running wheel behavior have several behavioral, physiological,
and metabolic changes compared to non-selected mice, among which some may be viewed as co-
adaptations to sustain endurance exercise (Girard et al. 2001; Gomes et al. 2009; Houle-Leroy et

Chapter 7
134
al. 2003; Koteja et al. 1999; Vaanholt et al. 2007; Wong et al. 2009; Rezende et al. 2006a) and also
(Chapter 2, 3, 4 of this thesis). We were interested to know to which extent the post-natal phase
is critically important for the display of these phenomena. During the post-natal period, maternal
influences are reported to cause programming effects in the developing offspring and
subsequently cause long-lasting changes at adulthood (Armitage et al. 2005; Gallou-Kabani et al.
2007; Napoli and Palinski 2001; Samuelsson et al. 2008). For this reason, we performed an
experiment in which we cross-fostered pups between mothers from different lines and between
mothers from the same line. These comparisons were made when mothers were either feeding a
low-fat (LF) carbohydrate-rich diet, or a high- fat (HF) diet enriched with refined sugars.
Offspring growth during lactation and several parameters relevant to energy balance regulation
after weaning were assessed in these cross-fostered mice, and were compared to the
characteristics of the non cross-fostered offspring described in the first part of this chapter.
It was previously mentioned that growth rates of mice from the high activity lines 7 and
8 are lower than those of the control line 2 during the pre-weaning period as well as during
adulthood. These effects were interpreted to indicate that selection for running wheel behavior
causes a reduction in body size and mass which may be adaptive to sustain running wheel
behavior (Rezende et al. 2006b). Cross-fostering of pups between line 2 and line 8 mothers
feeding the LF diet (further referred to as 2LF and 8LF mothers) diet did not show alterations in
growth during the pre-weaning stage compared to the line 2LF and 8LF pups raised by their own
mothers. This indicates that differences between line 2 and 8 offspring are probably the result of
differences in pre-natal (epi) genetic programming, and not by post-natal influences. In contrast,
line 7LF offspring fostered by line 2LF mothers increased pup growth of line 7LF pups in the
direction of 2LF own pups and became indistinguishable from cross-fostered 8LF pups. Vice
versa, line 2LF offspring fostered by line 7LF mothers showed a markedly attenuated growth,
even below the levels found in the line 7LF offspring. Therefore line 7 mothers provide a poor
post-natal environment in the LF diet condition for offspring growth and development, and
essentially similar effects are observed when mothers were feeding a HF diet. In the HF diet
condition, both line 7 as well as line 8 offspring fostered by line 2HF mothers increased pup
growth compared to condition when they were raised by their own mothers, thus presenting a
richer environment for growth and development in line 2 mothers relative to mothers in the high
activity lines, when the mothers are provided with an energy rich diet.
Effects of the poor pre-weaning maternal line 7 environment persistently reduced body
weight of line 2 offspring in adulthood. In fact, the line 2 offspring at 4 months of age fostered
by line 7 mothers were indistinguishable from line 7 own offspring in terms of dry-lean mass, fat
mass, and body length. On the others hand, line 7LF offspring fostered by line 2LF mothers
were only slightly and transiently heavier than line 7 offspring raised by their own LF mothers.
These effects rely on the type of diet, because all cross-fostering effects are lost in adulthood
when mothers are feeding a HF diet. Two conclusions can be drawn from these findings. First,
the poor maternal line 7LF environment causes long-lasting physiological and morphological

Postnatal vs. prenatal environment
135
changes that overrule pre-natal (epi)genetic make-up of line 2 offspring, and may potentially
contribute to some extent to the phenotype of line 7 mice at adulthood as well. Secondly, the
pre-natal (epi)genetic make-up of line 7 offspring cannot be overridden by the relatively rich
post-natal environment provided by line 2 mothers, even when they are subjected to a HF diet. A
poor environment may therefore have stronger effects on long-term programming of energy
balance and growth than a rich environment. While this is consistent with the current conceptual
framework of developmental metabolic programming founded on the idea of the thrifty
phenotype and the pioneering work of Hales and Barker (Hales and Barker 1992), the directions
of body weight changes in the current study are not consistent with this idea. According to the
thrifty phenotype hypothesis, poor postnatal nutrition would be expected to cause catch-up
growth (Gluckman and Hanson 2004; Gluckman, Hanson, and Pinal 2005), and in line with that
we anticipated that line 2 offspring fostered by line 7 mothers would develop obesity and
hyperglycemia at adulthood. In stead, they developed lower growth and lower growth efficiency
(based on lower body weights combined with similar food intake), and lower levels of glucose
and insulin at adulthood. The observed long-term fostering effects of line 7 mothers are not
generalizable to selection for increased running wheel behavior per se, since cross-fostering of
line 2 and line 8 pups by respectively line 8 and line 2 mothers did not yield aforementioned
effects on adult body weights. In this case, differences in body weight and composition between
these lines are apparently determined by prenatal gene-environment interactions. Neither did line
7 nor line 8 cross-fostering with line 2 result in changes in running wheel behavior, food intake
nor water intake. The only effect of cross-fostering which we observed was that line 7 female
offspring fostered by line 2 mothers became more anxious in the plus maze performance test,
whereas line 2 female offspring fostered by line 8 mothers became less anxious. This indicates
some postnatal effects of line 2 mothers to increase anxiety levels in their female offspring which
might be offset in the high activity lines.
A remarkable observation in Chapter 5 was that line 7 mothers lost considerably more
pups during lactation than mothers of other lines. Although litter characteristics at birth in
Chapter 5 were very similar to those in this study, here we did not find pups missing during
lactation. We suspect that these differences are the result of the cross-fostering procedure in the
present study. Surviving the post-natal environment is not only dependent on maternal (line) and
dietary (HF/LF) influences acting unidirectional on the offspring. For example, suckling
(Schroeder et al. 2007; Fride, Bregman, and Kirkham 2005; Uvnas-Moberg 1996) and ultrasonic
vocalization by pups (Shair 2007; Hofer et al. 1999) have been reported to markedly affect
maternal behavior and physiology, and this in turn feeds back to pup growth and development.
It may be speculated, that the pup losses of line 7 mothers that we have observed in Chapter 5
were “rescued” by line 2 pups fostered by line 7 mothers in the present study. A mechanism may
be that line 2 pups suckled more vigorously than line 7 pups, and thus contributed to a higher
milk production of line 7 mothers in the present study, benefiting both fostered and own
offspring. Along these lines, also differences in growth efficiency (GE) during lactation found in

Chapter 7
136
the present study and Chapter 5 may be explained. Thus, while line 7HF and 8HF mothers and
offspring had the highest GEs in Chapter 5, here we observed that GE of line 2HF mothers was
the highest. These effects may very well be explained by the contribution of growth efficiency of
line 7HF and line 8HF offspring which were fostered by line 2 HF mothers. Further studies are
needed to further explore these potential mechanisms, and whether they are relevant to
behavioral and metabolic characteristics at adulthood.
References
Armitage, J. A., L. Lakasing, P. D. Taylor, A. A. Balachandran, R. I. Jensen, V. Dekou, N. Ashton, J. R.
Nyengaard, and L. Poston. 2005. Developmental programming of aortic and renal structure in
offspring of rats fed fat-rich diets in pregnancy. J. Physiol 565:171-184.
Aubert, R., J. P. Suquet, and D. Lemonnier. 1980. Long-term morphological and metabolic effects of early
under- and over-nutrition in mice. J. Nutr. 110:649-661.
Barnes, R. H., S. R. Cunnold, R. R. Zimmermann, H. Simmons, R. B. MacLeod, and L. Krook. 1966.
Influence of nutritional deprivations in early life on learning behavior of rats as measured by
performance in a water maze. J. Nutr. 89:399-410.
Bouret, S. G. 2009. Early life origins of obesity: role of hypothalamic programming. J. Pediatr.
Gastroenterol. Nutr. 48 Suppl 1:S31-S38.
Bouret, S. G. and R. B. Simerly. 2006. Developmental programming of hypothalamic feeding circuits. Clin.
Genet. 70:295-301.
Davidowa, H., Y. Li, and A. Plagemann. 2003. Altered responses to orexigenic (AGRP, MCH) and
anorexigenic (alpha-MSH, CART) neuropeptides of paraventricular hypothalamic neurons in early
postnatally overfed rats. Eur. J. Neurosci. 18:613-621.
Donato, K. A. 1987. Efficiency and utilization of various energy sources for growth. Am. J. Clin. Nutr.
45:164-167.
Epstein, H. T. 1978. The effect of litter size on weight gain in mice. J. Nutr. 108:120-123.
Faust, I. M., P. R. Johnson, and J. Hirsch. 1980. Long-term effects of early nutritional experience on the
development of obesity in the rat. J. Nutr. 110:2027-2034.
Fride, E., T. Bregman, and T. C. Kirkham. 2005. Endocannabinoids and food intake: newborn suckling and
appetite regulation in adulthood. Exp. Biol. Med. (Maywood. ) 230:225-234.
Gallou-Kabani, C., A. Vige, M. S. Gross, C. Boileau, J. P. Rabes, J. Fruchart-Najib, J. P. Jais, and C. Junien.
2007. Resistance to high-fat diet in the female progeny of obese mice fed a control diet during the
periconceptual, gestation, and lactation periods. Am. J. Physiol Endocrinol. Metab 292:E1095-E1100.
Girard, I., M. W. McAleer, J. S. Rhodes, and T. Garland, Jr. 2001. Selection for high voluntary wheel-running
increases speed and intermittency in house mice (Mus domesticus). J. Exp. Biol. 204:4311-4320.

Postnatal vs. prenatal environment
137
Gluckman, P. D. and M. A. Hanson. 2004. Developmental origins of disease paradigm: a mechanistic and
evolutionary perspective. Pediatr. Res. 56:311-317.
Gluckman, P. D., M. A. Hanson, and C. Pinal. 2005. The developmental origins of adult disease. Matern.
Child Nutr. 1:130-141.
Gomes, F. R., E. L. Rezende, J. L. Malisch, S. K. Lee, D. A. Rivas, S. A. Kelly, C. Lytle, B. B. Yaspelkis, III,
and T. Garland, Jr. 2009. Glycogen storage and muscle glucose transporters (GLUT-4) of mice
selectively bred for high voluntary wheel running. J. Exp. Biol. 212:238-248.
Hager, R., J. M. Cheverud, and J. B. Wolf. 2009. Change in maternal environment induced by cross-fostering
alters genetic and epigenetic effects on complex traits in mice. Proc. Biol. Sci.
Hales, C. N. and D. J. Barker. 1992. Type 2 (non-insulin-dependent) diabetes mellitus: the thrifty phenotype
hypothesis. Diabetologia 35:595-601.
Hofer, M. A., J. R. Masmela, S. A. Brunelli, and H. N. Shair. 1999. Behavioral mechanisms for active
maternal potentiation of isolation calling in rat pups. Behav. Neurosci. 113:51-61.
Houle-Leroy, P., H. Guderley, J. G. Swallow, and T. Garland, Jr. 2003. Artificial selection for high activity
favors mighty mini-muscles in house mice. Am. J. Physiol Regul. Integr. Comp Physiol 284:R433-
R443.
Johnson, M. S., S. C. Thomson, and J. R. Speakman. 2001. Limits to sustained energy intake. I. Lactation in
the laboratory mouse Mus musculus. J. Exp. Biol. 204:1925-1935.
Koteja, P., T. Garland, Jr., J. K. Sax, J. G. Swallow, and P. A. Carter. 1999. Behaviour of house mice
artificially selected for high levels of voluntary wheel running. Anim Behav. 58:1307-1318.
Krol, E. and J. R. Speakman. 2003. Limits to sustained energy intake. VI. Energetics of lactation in
laboratory mice at thermoneutrality. J. Exp. Biol. 206:4255-4266.
Lemonnier, D. 1972. Effect of age, sex, and sites on the cellularity of the adipose tissue in mice and rats
rendered obese by a high-fat diet. J. Clin. Invest 51:2907-2915.
McGowan, P. O., M. J. Meaney, and M. Szyf. 2008. Diet and the epigenetic (re)programming of phenotypic
differences in behavior. Brain Res. 1237:12-24.
MohanKumar, S. M., A. King, A. C. Shin, M. P. Sirivelu, P. S. MohanKumar, and G. D. Fink. 2007.
Developmental programming of cardiovascular disorders: focus on hypertension. Rev. Endocr.
Metab Disord. 8:115-125.
Napoli, C. and W. Palinski. 2001. Maternal hypercholesterolemia during pregnancy influences the later
development of atherosclerosis: clinical and pathogenic implications. Eur. Heart J. 22:4-9.
Parente, L. B., M. B. Aguila, and C. A. Mandarim-de-Lacerda. 2008. Deleterious effects of high-fat diet on
perinatal and postweaning periods in adult rat offspring. Clin. Nutr. 27:623-634.
Plagemann, A. 2006. Perinatal nutrition and hormone-dependent programming of food intake. Horm. Res.
65 Suppl 3:83-89.
Plagemann, A., T. Harder, A. Rake, T. Waas, K. Melchior, T. Ziska, W. Rohde, and G. Dorner. 1999.
Observations on the orexigenic hypothalamic neuropeptide Y-system in neonatally overfed weanling
rats. J. Neuroendocrinol. 11:541-546.

Chapter 7
138
Rezende, E. L., F. R. Gomes, J. L. Malisch, M. A. Chappell, and T. Garland, Jr. 2006a. Maximal oxygen
consumption in relation to subordinate traits in lines of house mice selectively bred for high voluntary
wheel running. J. Appl. Physiol 101:477-485.
Rezende, E. L., S. A. Kelly, F. R. Gomes, M. A. Chappell, and T. Garland, Jr. 2006b. Effects of size, sex, and
voluntary running speeds on costs of locomotion in lines of laboratory mice selectively bred for high
wheel-running activity. Physiol Biochem. Zool. 79:83-99.
Samuelsson, A. M., P. A. Matthews, M. Argenton, M. R. Christie, J. M. McConnell, E. H. Jansen, A. H.
Piersma, S. E. Ozanne, D. F. Twinn, C. Remacle, A. Rowlerson, L. Poston, and P. D. Taylor. 2008.
Diet-induced obesity in female mice leads to offspring hyperphagia, adiposity, hypertension, and
insulin resistance: a novel murine model of developmental programming. Hypertension 51:383-392.
Schroeder, M., Y. Lavi-Avnon, O. Zagoory-Sharon, T. H. Moran, and A. Weller. 2007. Preobesity in the
infant OLETF rat: the role of suckling. Dev. Psychobiol. 49:685-691.
Schultze, M. O. 1954. Weight increments of suckling rats as affected by litter size and maternal diet. J. Nutr.
54:453-460.
Shair, H. N. 2007. Acquisition and expression of a socially mediated separation response. Behav. Brain Res.
182:180-192.
Srinivasan, M., S. D. Katewa, A. Palaniyappan, J. D. Pandya, and M. S. Patel. 2006. Maternal high-fat diet
consumption results in fetal malprogramming predisposing to the onset of metabolic syndrome-like
phenotype in adulthood. Am. J. Physiol Endocrinol. Metab 291:E792-E799.
Swallow, J. G., P. A. Carter, and T. Garland, Jr. 1998. Artificial selection for increased wheel-running
behavior in house mice. Behav. Genet. 28:227-237.
Uvnas-Moberg, K. 1996. Neuroendocrinology of the mother-child interaction. Trends Endocrinol. Metab
7:126-131.
Vaanholt, L. M., P. Meerlo, T. Garland, Jr., G. H. Visser, and G. van Dijk. 2007. Plasma adiponectin is
increased in mice selectively bred for high wheel-running activity, but not by wheel running per se.
Horm. Metab Res. 39:377-383.
Winick, M. and A. Noble. 1967. Cellular response with increased feeding in neonatal rats. J. Nutr. 91:179-
182.
Wong, L. E., T. Garland, Jr., S. L. Rowan, and R. T. Hepple. 2009. Anatomic capillarization is elevated in the
medial gastrocnemius muscle of mighty mini mice. J. Appl. Physiol 106:1660-1667.

Postnatal vs. prenatal environment
139


88
CCHHAAPPTTEERR
GENERAL DISCUSSION:
EFFECTS OF “NATURE” AND “NURTURE” IN VOLUNTARY ACTIVITY
AND NUTRITION ON ENERGY BALANCE AND EMOTIONALITY

Chapter 8
142
1. Introduction
Animals are able to travel across the environment in the attempt to overcome environmental
challenges (e.g., escaping predation, climate change, etc.), or to achieve certain goals (e.g., find
nutrients, fluids, partners, social interaction, etc.). In doing so, they need to combust extra fuels
above the basic requirements, in order to provide energy for skeletal muscular and cardiovascular
activity. The level of locomotor activity can vary tremendously between species, but also
considerable individual differences can be observed within certain species. An increased level of
locomotor activity may increase survival rate of animals by allowing the coverage of larger
habitats. Co-adaptational changes may be needed for animal physiology, morphology and
behavior to facilitate and sustain high levels of physical activity. Selective breeding for voluntary
physical activity is an appropriate tool to study potential co-adaptational changes, since selective
breeding for one trait could be linked to changes of several sub-ordinate traits that may determine
individual variation. In this thesis, I used two lines of mice selectively bred for increased wheel
running behavior and one control line created by Prof T. Garland and colleagues. The aim was to
investigate in these lines of mice regulation of energy homeostasis under non-reproductive and
reproductive conditions, and its contribution to perinatal programming of energy homeostasis in
the offspring. Below, the main results from the different studies are summarized.
The aim of Chapter 2 was to study behavioral consequences of selective breeding for
high voluntary activity. The results demonstrated that mice with high activity levels responded
differently in novel and habituated environments. In a novel environment, high activity mice
were more anxious, more explorative and risk-taking suggesting that their level of carefulness,
cautiousness and attentiveness was increased relative to non-selected mice. In a habituated
environment, they had increased routine behavior, which probably helps them to sustain their
physical endurance activity.
In Chapter 3, activity selected and control mice were subjected to feeding either a
carbohydrate-rich/low-fat (LF) or a 60% high-fat (HF) diet and temporal changes in energy
balance characteristics over the daily cycle were studied. Compared to controls, physically active
mice had an increased locomotor activity and increased energy expenditure (particularly in the
HF diet condition) during the dark phase. In active males, the latter was particularly due to
increased carbohydrate oxidation. In contrast, active females showed a strongly increased fat
oxidation, particularly on the HF diet. Since active females started ingesting their bulk food later
in their active phase, this might make them more prone to metabolic insufficiency. In view of
their leanness, their LF diet preference over the HF diet was surprising, but may be viewed as a
result of metabolic sensors potentially signaling shortage of intermediary citric acid metabolites
necessary for fat oxidation, and refers to old adage that “fats burn in the flame of carbohydrates”.
In Chapter 4, control and activity selected mice were subjected to a LF or a 40% HF
diet with added refined sugars, and the effects were studied on parameters related to energy
balance and emotional stress. The results showed that the active lines were HF diet obesity
resistant, with increased food intake, similar absorption rates and higher non-exercise

Discussion
143
thermogenesis (NEAT) than their randomly bred controls. While activity selected females had a
higher anxiety level in the LF condition than controls, this effect reversed on a HF diet, without
concomitant changes in plasma levels of corticosterone. Since active lines again had a lower HF
preference than controls, these data may be viewed such that the activity lines, and in particular
the females may improve their mood on a HF diet, without necessarily liking the HF diet more
than control mice.
In Chapter 5, the differences between control and activity selected mice were
investigated on reproductive performance during the perigestational period in relation to feeding
a LF or 40% HF diet with added refined sugars. The results showed that the active lines had
increased reproduction output and an increase in growth efficiency during peak lactation on the
HF diet relative to controls, but had mixed advantageous effects on pup survival. Regression
analysis revealed that litter size acted as a strong dependent variable, and effects of diet and line
on several pup characteristics remained significant within the regression analysis.
In Chapter 6, we aimed to study the long-term consequences of feeding HF or LF
diets during the perigestational period in activity-selected mice and in their controls on energy
balance regulation in the offspring. The outcomes showed that active lines are protected against
the early programming effects of HF diet feeding as demonstrated by the maintenance of a lean
phenotype, elevated plasma levels plasma of adiponectin, and low plasma levels of leptin and
insulin. In contrast, their randomly bred controls had increased longitudinal growth, higher
adipose tissue mass, and elevated insulin and low adiponectin levels. Again, regression analysis
revealed that litter size the animals were born in was an important dependent factor, but with diet
and line having particular effects on structural growth parameters.
Chapter 7 had two aims: A) to study the contribution of perigestational HF or LF diet
feeding in activity selected mice and in controls independent of differences in litter size on
reproductive performance and offspring characteristics and B) to study postnatal influences in
active and control mice by cross-fostering of pups between lines. In part A) the results
demonstrated that equalizing litter size to 10 pups/litter prevented perigestational HF diet effects
on postnatal body weight gain in the control line, but instead caused transiently increased weight
gain and increased adiposity at the adolescent stage in the activity selected mice. An explanation
for these unexpected results is that equalizing litters frequently needed culling down in the active
lines, whereas those of the control line often needed additional pups. In this situation, the highly
active mothers suddenly faced on average two pups less than they prepared for, and probably
over-nourished their offspring to higher average body weights and adiposity. Controls on the
other hand, had to nurse more pups than they prepared for, and this could have lead to a
normalization of body weight and body adiposity levels. Effects of over-nourishment in the
activity-selected lines, however, were transient and overridden by trait at adulthood.
In part B) cross-fostering experiments revealed that females of selection lines provided
different postnatal environments to their offspring than control females, but also differences
between activity selected lines 7 and 8 were observed. When pups were exchanged between the

Chapter 8
144
control and selected line 8 mothers, pup growth was not affected. However, when pups were
fostered between control and selected line 7 mothers, control pups became smaller and line 7
pups became transiently larger. The postnatal environment of selected lines, irrespective of diet,
resulted in low plasma levels of insulin and glucose in control animals, overriding the prenatal
(epi)genetic make-up of control offspring later in life. However, prenatal genetic make-up of
selected lines could not be overridden at adulthood by a relatively rich environment of controls
even in the presence of a HF diet during the perigestational period. Interestingly, growth
efficiency during lactation of pups and mothers of the control line became increased on a HF
diet. This was different compared to the results in Chapter 5, and may be caused by the
contribution of fostered selected pups in the control litters. Furthermore, the pup loss of line 7
mothers found in Chapter 5 did not occur in the line 7 litters with fostered control pups of line 2
in the present study. This improved pup survival could indicate that pup loss in line 7 litters of
Chapter 5 was the result of bi-directional pup mother interactions rather than the result of poor
maternal care per sé.
2. Connecting physical activity and emotionality/personality
In nature, animals invading novel habitats and having no prior experiences with their challenges
usually have increased stress levels since they do not know what to expect (e.g., of predators,
climate etc.). However, they need to overcome these emotional challenges and find nutrients,
water, partners etc, to secure their own survival as well as that of its progeny. As mentioned
earlier, highly active animals might have an advantage to cover larger habitats, but exposure to the
outside environment may require other specific qualities to improve survival. In the present
thesis, highly active mice were found to be explorative, risk taking and at the same time had
increased levels of anxiety in unfamiliar conditions, which may translate to a cautious and
attentive behavior relative to that of control mice (Chapter 2). On the other hand, in a habituated
environment, they were less attentive, and increased their stereotype, routine behavior. Although
the high activity mice were more resistant to develop diet-induced obesity (DIO) than control
mice when subjected to a HF diet (Vaanholt et al. 2008), the HF diet did appear to have a large
influence on these personality traits in the activity selected animals just as well as did in the
control mice. The directions of effects, however, were quite different between control and
selected lines. In the control mice, for example, the HF diet increased anxiety in unfamiliar
conditions, but the opposite was observed in the activity selected mice. These differential effects
are reminiscent of opposing reports in literature that fats and refined sugars can either be
comforting and decreasing stress sensitivity (Dallman, Pecoraro, and la Fleur 2005), or act as a
form of background stress (Dallman, Pecoraro, and la Fleur 2005; Souza et al. 2007;
Tannenbaum et al. 1997). The data in the presented studies may be interpreted such that (a trait
for) physical activity acts as a lever to determine the direction of emotionality behavioral when
subjected to diets differing in HF and sugar content. Congruent changes in neuroendocrine and

Discussion
145
physiological parameters were less clear, although emotional and behavioral effects of HF diets
have previously been shown to have specific neuroendocrine and physiological correlates
(Steimer, la Fleur, and Schulz 1997). From a teleological standpoint, a too dramatic decrease in
the level of anxiety may negatively affect chances of survival. However, without the beneficial
effects of diet-induced thriftiness (i.e., which probably enables the control mice to survive
upcoming periods of famine better than the activity selected mice), a trait for increased physical
activity might benefit survival in well-fed conditions by augmenting agility, extraversion and
fearlessness under unfamiliar conditions.
3. Life-style factors in relation to complex diseases
Besides understanding neurobiology of energy balance regulation from an adaptive standpoint,
animal models with selected complex traits have also been used for understanding pathological
mechanisms and treatment effectiveness of human diseases. Human studies suggest a complex
interplay of life-style factors, including behavioral inactivity, “unhealthy” eating habits, in the
aetiology and manifestation of disease. Again, stress might play an important role since, for
example, the metabolic syndrome is found more prevalent among individuals under psychosocial
pressure or chronic stress (Bjorntorp 1992; Brunner et al. 2002), and this has been associated with
emotional eating, binge-eating and depression as well (Pinaquy et al. 2003). Furthermore, several
reports taken together seem to suggest that a change in any of these life-style factors can bring
about changes in the others, and ignite a chain reaction leading to pathology development (van
Dijk and Buwalda 2008; Tsatsoulis and Fountoulakis 2006; Kishi and Elmquist 2005; Foreyt
2006). Different disciplines revealed that physical activity can be used as a preventive or
corrective tool in many metabolic abnormalities and diseases (Hayes and Kriska 2008; Brock et al.
2005; Colberg 2007; Donnelly et al. 2009), as well as emotional and mental complications
(Antunes et al. 2005; Budde et al. 2008; Galper et al. 2006; Kramer and Erickson 2007; Kruk
2007; Otto et al. 2007; Pearce 2008). Therefore, studying physiology and behavior in animals with
complex traits for high physical activity can help to improve our understanding of the underlying
mechanisms of these prevention and treatment options.
4. Physiological co-adaptations of endurance activity
Endurance exercise requires an increase in aerobic capacity and increased oxygen consumption,
which is strongly related to an increase in heart-minute volume during activity. This facilitates
oxygen perfusion of energetically demanding organs and increases transport of carbon dioxide
and waste products away from these organs (Laughlin and Roseguini 2008; Betik et al. 2009; Baar
2009; Hickson, Bomze, and Holloszy 1977). To serve these energetic requirements, nutrients
need to be taken up from ingested food and transported to the demanding organs or first being

Chapter 8
146
stored in the form of glycogen or fat, and released later. Because of higher voluntary activity and
energy expenditure in the selected mice, an increase in food intake behavior needs to be
temporally spaced between bouts of activity across the circadian cycle. In the selected mice, this
caused ingestive behavior at times when controls were not feeding (Chapter 3). Not only the
amount but the type of ingested food is important to support energy utilization. In the present
experiments, the activity selected mice had increased preference for carbohydrate-rich food over
fat food, potentially to secure their fatty acid oxidation rate (chapter 3). A decrease in fat tissue
and a shift to an increase in dry lean mass is associated with the increased rate of fat oxidation,
and others have shown that this is paralleled by an increase in the number of mitochondria and
oxidative muscle types (Guderley et al. 2006; Guderley et al. 2008; Houle-Leroy et al. 2000).
Since the increased nutrient delivery during physical activity can be caused independent of insulin
(Hamilton and Booth 2000), the level of the metabolic hormones insulin and leptin, which
promote glucose uptake and lipid storage, are less important under conditions of chronic
exercise. The high level of adiponectin, on the other hand is important since this hormone has
been shown to stimulate mitochondrial biogenesis and to augment fatty acid oxidation in skeletal
muscle (Yamauchi et al. 2002; Civitarese et al. 2006).
Over the last decades, environmental factors largely changed and favored consumption
of comfort foods, containing high percentages of saturated fats and/or sugars. In order to
maintain body weight and energy homeostasis, this “nutritional challenge” should be balanced by
a higher intensity of physical activity, to reverse metabolic abnormalities. The mechanism by
which physical activity can reverse these abnormalities is related to an increased non-exercise
thermogenesis (NEAT) (chapter 4). Increasing sports during leisure time may be less effective,
since this may lead to compensations by resting more (McCrady and Levine 2009; Levine 2007).
A high level of NEAT, however, may clear triglycerides and increase skeletal muscle oxidative
capacity as well. According to the findings in Chapter 3, this might stimulate carbohydrate
preference, allowing that the dietary or stored fat is burning in the flame of carbohydrates
(chapter 3).
Although leanness and increased aerobic capacity as a result of endurance training are
not associated with a clear reduction in basal metabolic rate (Bouchard, Depres, and Tremblay
1993), there is however evidence that it increases metabolic efficiency in humans as well as
rodents (Schrauwen and Hesselink 2003; Amati et al. 2008). This increased metabolic efficiency
and nutrient utilization gained by increased physical activity could have been beneficial for growth
efficiency during the reproduction stage, when energy requirements are sustained far above
normal requirements. Indeed, highly active females were able to reallocate their energy, which
was used normally to sustain physical activity to their offspring by decreasing their physical
activity levels. The latter may be facilitated by hormonal changes that occur during lactation.
Human studies also supported the notion that moderate exercise training during pregnancy and
lactation is beneficial both for mothers and offspring development later in life (Gavard and Artal
2008; Impact of physical activity during pregnancy and postpartum on chronic disease risk2006).

Discussion
147
5. Early life influences
Early life experiences are relevant in the context of maintenance of adult health, or disease
development later in life. The mechanisms have yet to be resolved, but probably include gene-
environment influences. The “thrifty genotype hypothesis” explains that genetic factors only
predispose individuals to diseases but environmental factors determine phenotypic expression
whether the disease becomes manifest or not (Neel 1999). For example, a thrifty gene enables
the organism to store nutrients during times when food is scarce, but in times when it is plenty it
leads to excess energy storage and metabolic diseases. In this way, comfort foods could have
maladaptive consequences on offspring development and later in life, when availability of food
remains and psychological stressors are chronic (van Dijk and Buwalda 2008). According to
Chapter 6, palatable high fat/sugar feeding during the perinatal stage causes exaggerated weight
gain and adiposity with a larger susceptibility in male offspring than in female offspring (chapter
6). The duration of the diet supply also determines the intensity of derangements (chapter 5), and
probably depends on the critical timing of postnatal development of feeding circuits in the central
nervous system (Bouret and Simerly 2006). When the maternal HF diet is supplied to the pups
via nursing (i.e., feeding via the milk), the offspring show less severe consequences of the
maternal HF diet than when they start eating from it by themselves. For example, in the case of a
perigestational HF diet condition strictly via the milk, offspring developed increased growth with
a proportional increase in fat mass. Nutritional effects on postnatal development in rodents are
also dependent on the size of the litter beyond the type of diet. Small litter offspring are more
prone to develop metabolic diseases together with elevated plasma insulin and low levels of
adiponectin even without disproportional fat mass increases (Chapter 6). On the other hand, the
trait for high voluntary activity seems to protect against the deleterious effects of perinatal HF
diet feeding with an increased water intake and adiponectin levels. These effects facilitate cell
metabolism and energy expenditure (Chapter 6). Although cross-fostering pups between
mothers of different lines caused transient changes at adulthood, the trait of high physical activity
was not influenced by postnatal environmental conditions, meaning that the protective function
of a high activity trait was determined by prenatal (epigenetic) factors (chapter 7). In contrast,
control mice fostered by activity selected mothers were sensitive to postnatal influences and
developed similar growth, glucose and insulin levels as selected mothers. This is in line with
studies showing that maternal physical activity positively influences offspring metabolic- and
mental development, and promotes long-term benefit against chronic diseases in the offspring
(Impact of physical activity during pregnancy and postpartum on chronic disease risk2006;
Gavard and Artal 2008; Larson-Meyer 2002). The task that lies ahead of us is to unravel the
mechanisms behind these interactions.

Chapter 8
148
6. Mapping genotype after phenotyping selectively bred animals
Despite our vast knowledge on the beneficial effects of physical activity, and the efforts of
healthcare officials, medical specialists, and government programs to promote it, many people
still remain physically inactive, and have an increased risk to attract metabolic diseases.
Apparently our understanding in the treatment of complex diseases falls short. Studying complex
traits such as those of mice selectively bred for increased running wheel activity may provide
novel directions for research (see: http://biology.ucr.edu/people/faculty/Garland/
Experimental_Evolution_Publications_by_Ted_Garland.html). One of these directions should
acknowledge the genetic underpinnings of differences in expression of phenotypes. The level of
physical activity has been shown to be determined by many (heritable) genes. More than 214
genes and quantitative trait loci (QTL) have been mapped in humans for performance and
health-related phenotypes (Bray et al. 2009), including linkages to physical activity levels (Simonen
et al. 2003; Cai et al. 2006). Although the map is exhaustive for currently published accounts of
genes and exercise associations and linkages, there are undoubtedly many more gene-exercise
interaction effects that have not even been considered thus far, reported by Bray et al (Bray et al.
2009). Recently, the work of Leamy et al provided evidence that epistatic genetic interactions (i.e.,
when an allele in one locus masks the expression of an allele at another locus) contribute
significantly to the variation in physical activity (Leamy, Pomp, and Lightfoot 2008). In other
studies, epistatic combinations were found between physical activity and body weight (Leamy,
Pomp, and Lightfoot 2009a; Leamy, Pomp, and Lightfoot 2009b), running distance and duration
of running (Leamy, Pomp, and Lightfoot 2008; Lightfoot et al. 2008), litter size and maternal
performance (Peripato et al. 2002; Peripato et al. 2004). Moreover, some of the QTL discovered
for physical activity had pleiotropic effects (i.e., when a mutation of a single gene causes changes
in multiple independent phenotypes) on several physical activity related traits in mice selectively
bred for high voluntary wheel running (Nehrenberg et al. 2009). Finding these “hot-spots” and
how (physiologically/nutritionally or perhaps pharmacologically) and when (i.e., perinatally,
during adolescence, or at adulthood) to target them would be of major interest, and could
eventually contribute to improvement of health of people in our society.
7. Epilogue.
In modern societies, the competitive and ”fast” life-style causes an increase in stressful situations
for which physical actions (fight/flight) no longer serve proper solutions. The parallel rise in the
availability of comfort foods and automation/industrialization results in multidimensional
metabolic diseases. Indeed, in 2005 the World Health Organization estimated the number of
obese people worldwide to be 400 million, and they project that in 2015 the number will be as
high as 700 million. Obesity is associated with several diseases, for example diabetes mellitus type
II, cardiovascular diseases, some types of cancer and musculoskeletal disorders. Cardiovascular

Discussion
149
diseases already have the highest death toll and this will continue to rise with the increasing
number of people with obesity (World Health Organization 2005, http://www.who.int/).
Besides being harmful for health and liveability, the increase in the prevalence of metabolic
diseases is also a big economic burden to society. A study by The Conference Board has
estimated the costs of obesity in the US to be around $100 billion (The Conference Board, 2008,
http://www.conference-board.org/webcasts/describe_wc.cfm?ID=1373). The results described
in this thesis may help to understand the protective and preventive nature of physical activity on
the growing epidemic of obesity and its related diseases. This not only applies to individuals at
adulthood, but particularly to their offspring. Although Westerterp and Speakman argued that
human weight gain and obesity over the last decades was not the result of a reduction in energy
expenditure, but caused by an increase in energy intake (Westerterp and Speakman 2008;
Westerterp and Speakman 2008), healthy daily habits, such as a high degree of physical activity,
dietary choice and avoiding anxiety and stress, could perhaps be imprinted during early life
conditions. The need for parents to recognize the importance of physical activity and diet during
early perinatal development could be supported by widespread means of education.
References
2006. Impact of physical activity during pregnancy and postpartum on chronic disease risk. Med. Sci. Sports
Exerc. 38:989-1006.
Amati, F., J. J. Dube, C. Shay, and B. H. Goodpaster. 2008. Separate and combined effects of exercise
training and weight loss on exercise efficiency and substrate oxidation. J. Appl. Physiol 105:825-831.
Antunes, H. K., S. G. Stella, R. F. Santos, O. F. Bueno, and M. T. de Mello. 2005. Depression, anxiety and
quality of life scores in seniors after an endurance exercise program. Rev. Bras. Psiquiatr. 27:266-271.
Baar, K. 2009. The signaling underlying FITness. Appl. Physiol Nutr. Metab 34:411-419.
Betik, A. C., M. M. Thomas, K. J. Wright, C. D. Riel, and R. T. Hepple. 2009. Exercise training from late
middle age until senescence does not attenuate the declines in skeletal muscle aerobic function. Am. J.
Physiol Regul. Integr. Comp Physiol.
Bjorntorp, P. 1992. Abdominal obesity and the metabolic syndrome. Ann. Med. 24:465-468.
Bouchard, C., J. P. Depres, and A. Tremblay. 1993. Exercise and obesity. Obes. Res. 1:133-147.
Bouret, S. G. and R. B. Simerly. 2006. Developmental programming of hypothalamic feeding circuits. Clin.
Genet. 70:295-301.
Bray, M. S., J. M. Hagberg, L. Perusse, T. Rankinen, S. M. Roth, B. Wolfarth, and C. Bouchard. 2009. The
human gene map for performance and health-related fitness phenotypes: the 2006-2007 update. Med.
Sci. Sports Exerc. 41:35-73.
Brock, C. M., D. S. King, M. R. Wofford, and T. K. Harrell. 2005. Exercise, insulin resistance, and
hypertension: a complex relationship. Metab Syndr. Relat Disord. 3:60-65.

Chapter 8
150
Brunner, E. J., H. Hemingway, B. R. Walker, M. Page, P. Clarke, M. Juneja, M. J. Shipley, M. Kumari, R.
Andrew, J. R. Seckl, A. Papadopoulos, S. Checkley, A. Rumley, G. D. Lowe, S. A. Stansfeld, and M.
G. Marmot. 2002. Adrenocortical, autonomic, and inflammatory causes of the metabolic syndrome:
nested case-control study. Circulation 106:2659-2665.
Budde, H., C. Voelcker-Rehage, S. Pietrassyk-Kendziorra, P. Ribeiro, and G. Tidow. 2008. Acute
coordinative exercise improves attentional performance in adolescents. Neurosci. Lett.
Cai, G., S. A. Cole, N. Butte, C. Bacino, V. Diego, K. Tan, H. H. Goring, S. O'Rahilly, I. S. Farooqi, and A.
G. Comuzzie. 2006. A quantitative trait locus on chromosome 18q for physical activity and dietary
intake in Hispanic children. Obesity. (Silver. Spring) 14:1596-1604.
Civitarese, A. E., B. Ukropcova, S. Carling, M. Hulver, R. A. DeFronzo, L. Mandarino, E. Ravussin, and S.
R. Smith. 2006. Role of adiponectin in human skeletal muscle bioenergetics. Cell Metab 4:75-87.
Colberg, S. R. 2007. Physical activity, insulin action, and diabetes prevention and control. Curr. Diabetes
Rev. 3:176-184.
Dallman, M. F., N. C. Pecoraro, and S. E. la Fleur. 2005. Chronic stress and comfort foods: self-medication
and abdominal obesity. Brain Behav. Immun. 19:275-280.
Donnelly, J. E., S. N. Blair, J. M. Jakicic, M. M. Manore, J. W. Rankin, and B. K. Smith. 2009. American
College of Sports Medicine Position Stand. Appropriate physical activity intervention strategies for
weight loss and prevention of weight regain for adults. Med. Sci. Sports Exerc. 41:459-471.
Foreyt, J. P. 2006. The role of lifestyle modification in dysmetabolic syndrome management. Nestle. Nutr.
Workshop Ser. Clin. Perform. Programme. 11:197-205.
Galper, D. I., M. H. Trivedi, C. E. Barlow, A. L. Dunn, and J. B. Kampert. 2006. Inverse association
between physical inactivity and mental health in men and women. Med. Sci. Sports Exerc. 38:173-178.
Gavard, J. A. and R. Artal. 2008. Effect of exercise on pregnancy outcome. Clin. Obstet. Gynecol. 51:467-
480.
Guderley, H., P. Houle-Leroy, G. M. Diffee, D. M. Camp, and T. Garland, Jr. 2006. Morphometry,
ultrastructure, myosin isoforms, and metabolic capacities of the "mini muscles" favoured by selection
for high activity in house mice. Comp Biochem. Physiol B Biochem. Mol. Biol. 144:271-282.
Guderley, H., D. R. Joanisse, S. Mokas, G. M. Bilodeau, and T. Garland, Jr. 2008. Altered fibre types in
gastrocnemius muscle of high wheel-running selected mice with mini-muscle phenotypes. Comp
Biochem. Physiol B Biochem. Mol. Biol. 149:490-500.
Hamilton, M. T. and F. W. Booth. 2000. Skeletal muscle adaptation to exercise: a century of progress. J.
Appl. Physiol 88:327-331.
Hayes, C. and A. Kriska. 2008. Role of physical activity in diabetes management and prevention. J. Am. Diet.
Assoc. 108:S19-S23.
Hickson, R. C., H. A. Bomze, and J. O. Holloszy. 1977. Linear increase in aerobic power induced by a
strenuous program of endurance exercise. J. Appl. Physiol 42:372-376.
Houle-Leroy, P., T. Garland, Jr., J. G. Swallow, and H. Guderley. 2000. Effects of voluntary activity and
genetic selection on muscle metabolic capacities in house mice Mus domesticus. J. Appl. Physiol
89:1608-1616.

Discussion
151
Kishi, T. and J. K. Elmquist. 2005. Body weight is regulated by the brain: a link between feeding and
emotion. Mol. Psychiatry 10:132-146.
Kramer, A. F. and K. I. Erickson. 2007. Capitalizing on cortical plasticity: influence of physical activity on
cognition and brain function. Trends Cogn Sci. 11:342-348.
Kruk, J. 2007. Physical activity in the prevention of the most frequent chronic diseases: an analysis of the
recent evidence. Asian Pac. J. Cancer Prev. 8:325-338.
Larson-Meyer, D. E. 2002. Effect of postpartum exercise on mothers and their offspring: a review of the
literature. Obes. Res. 10:841-853.
Laughlin, M. H. and B. Roseguini. 2008. Mechanisms for exercise training-induced increases in skeletal
muscle blood flow capacity: differences with interval sprint training versus aerobic endurance training.
J. Physiol Pharmacol. 59 Suppl 7:71-88.
Leamy, L. J., D. Pomp, and J. T. Lightfoot. 2008. An epistatic genetic basis for physical activity traits in mice.
J. Hered. 99:639-646.
Leamy, L. J., D. Pomp, and J. T. Lightfoot. 2009a. Genetic variation for body weight change in mice in
response to physical exercise. BMC. Genet. 10:58.
Leamy, L. J., D. Pomp, and J. T. Lightfoot. 2009b. Genetic variation in the pleiotropic association between
physical activity and body weight in mice. Genet. Sel Evol. 41:41.
Levine, J. A. 2007. Nonexercise activity thermogenesis--liberating the life-force. J. Intern. Med. 262:273-287.
Lightfoot, J. T., M. J. Turner, D. Pomp, S. R. Kleeberger, and L. J. Leamy. 2008. Quantitative trait loci for
physical activity traits in mice. Physiol Genomics 32:401-408.
McCrady, S. K. and J. A. Levine. 2009. Sedentariness at Work: How Much Do We Really Sit? Obesity.
(Silver. Spring).
Neel, J. V. 1999. The "thrifty genotype" in 1998. Nutr. Rev. 57:S2-S9.
Nehrenberg, D. L., S. Wang, R. M. Hannon, T. Garland, Jr., and D. Pomp. 2009. QTL Underlying
Voluntary Exercise in Mice: Interactions with the "Mini Muscle" Locus and Sex. J. Hered.
Otto, M. W., T. S. Church, L. L. Craft, T. L. Greer, J. A. Smits, and M. H. Trivedi. 2007. Exercise for mood
and anxiety disorders. Prim. Care Companion. J. Clin. Psychiatry 9:287-294.
Pearce, P. Z. 2008. Exercise is medicine. Curr. Sports Med. Rep. 7:171-175.
Peripato, A. C., R. A. De Brito, S. R. Matioli, L. S. Pletscher, T. T. Vaughn, and J. M. Cheverud. 2004.
Epistasis affecting litter size in mice. J. Evol. Biol. 17:593-602.
Peripato, A. C., R. A. De Brito, T. T. Vaughn, L. S. Pletscher, S. R. Matioli, and J. M. Cheverud. 2002.
Quantitative trait loci for maternal performance for offspring survival in mice. Genetics 162:1341-
1353.
Pinaquy, S., H. Chabrol, C. Simon, J. P. Louvet, and P. Barbe. 2003. Emotional eating, alexithymia, and
binge-eating disorder in obese women. Obes. Res. 11:195-201.
Schrauwen, P. and M. Hesselink. 2003. Uncoupling protein 3 and physical activity: the role of uncoupling
protein 3 in energy metabolism revisited. Proc. Nutr. Soc. 62:635-643.

Chapter 8
152
Simonen, R. L., T. Rankinen, L. Perusse, T. Rice, D. C. Rao, Y. Chagnon, and C. Bouchard. 2003. Genome-
wide linkage scan for physical activity levels in the Quebec Family study. Med. Sci. Sports Exerc.
35:1355-1359.
Souza, C. G., J. D. Moreira, I. R. Siqueira, A. G. Pereira, D. K. Rieger, D. O. Souza, T. M. Souza, L. V.
Portela, and M. L. Perry. 2007. Highly palatable diet consumption increases protein oxidation in rat
frontal cortex and anxiety-like behavior. Life Sci. 81:198-203.
Steimer, T., S. la Fleur, and P. E. Schulz. 1997. Neuroendocrine correlates of emotional reactivity and coping
in male rats from the Roman high (RHA/Verh)- and low (RLA/Verh)-avoidance lines. Behav. Genet.
27:503-512.
Tannenbaum, B. M., D. N. Brindley, G. S. Tannenbaum, M. F. Dallman, M. D. McArthur, and M. J.
Meaney. 1997. High-fat feeding alters both basal and stress-induced hypothalamic-pituitary-adrenal
activity in the rat. Am. J. Physiol 273:E1168-E1177.
Tsatsoulis, A. and S. Fountoulakis. 2006. The protective role of exercise on stress system dysregulation and
comorbidities. Ann. N. Y. Acad. Sci. 1083:196-213.
Vaanholt, L. M., I. Jonas, M. Doornbos, K. A. Schubert, C. Nyakas, T. Garland, Jr., G. H. Visser, and D. G.
van. 2008. Metabolic and behavioral responses to high-fat feeding in mice selectively bred for high
wheel-running activity. Int. J. Obes. (Lond) 32:1566-1575.
van Dijk, G. and B. Buwalda. 2008. Neurobiology of the metabolic syndrome: an allostatic perspective. Eur.
J. Pharmacol. 585:137-146.
Westerterp, K. R. and J. R. Speakman. 2008. Physical activity energy expenditure has not declined since the
1980s and matches energy expenditures of wild mammals. Int. J. Obes. (Lond) 32:1256-1263.
Yamauchi, T., J. Kamon, Y. Minokoshi, Y. Ito, H. Waki, S. Uchida, S. Yamashita, M. Noda, S. Kita, K. Ueki,
K. Eto, Y. Akanuma, P. Froguel, F. Foufelle, P. Ferre, D. Carling, S. Kimura, R. Nagai, B. B. Kahn,
and T. Kadowaki. 2002. Adiponectin stimulates glucose utilization and fatty-acid oxidation by
activating AMP-activated protein kinase. Nat. Med. 8:1288-1295.

Discussion
153


NEDERLANDSE SAMENVATTING
“NATURE-NURTURE” EFFECTEN VAN SPONTANE FYSIEKE
ACTIVITEIT EN VOEDING OP ENERGIEBALANS REGULATIE EN
EMOTIONALITEIT

Dutch Summary
156
1. Introductie
Dieren kunnen zich over het algemeen verplaatsen door hun omgeving, hetgeen hen in staat stelt
om bepaalde uitdagingen of moelijkheden in hun omgeving uit de weg te gaan (zoals predatie,
klimatologische veranderingen, etc.), of juist om bepaalde doelen te verwezenlijken (zoals het
vinden van voeding, partners, sociale interacties, etc.). Hierbij verbruiken ze, door
spiercontracties en verhoogde activiteit van het cardiovasculair systeem, extra energie boven hun
normale energieverbruik. Dit inspanningsgerelateerd verbruik kan per diersoort erg variëren, en
zelfs grote variaties kunnen worden gevonden bij verschillende individuen binnen diersoorten.
Een toename in de verplaatsingssnelheid of verplaatsbaarheid (locomotie) kan onder bepaalde
condities belangrijk zijn, bijvoorbeeld wanneer voedselbeschikbaar in een bepaald gebied
plotseling sterk afneemt en dus een groter gebied of “habitaat” moet worden bestreken om te
kunnen overleven. Diverse veranderingen in de fysiologie, metabolisme, morfologie, en gedrag
van dieren kunnen een positieve bijdragen leveren aan aanpassingen om onder bovengenoemde
condities te kunnen overleven als individu en als soort. Het selectief fokken van muizen met
verhoogde loopwielactiviteit kan een experimenteel middel zijn om te onderzoeken of dieren met
een verhoogde activiteit inderdaad fysiologische, metabole, morfologische en/of gedragsmatige
veranderingen laten zien, die mogelijk “adaptief” zijn om een verhoogd activiteitsniveau te
kunnen handhaven. In dit proefschrift heb ik gebruik gemaakt van twee muizenlijnen selectief
gefokt op hoge loopwielactiviteit, en een controle lijn allen afkomstig uit het laboratorium van
Prof dr. T. Garland. In het oorspronkelijke selectiewerk van Garland en collega’s werden 4
muizenlijen gefokt op hoge loopwielactiviteit, en 4 controle lijnen waarbij niet werd geselecteerd
op loopwielactiviteit. De door ons gebruikte activiteitslijnen (line 7 en lijn 8) vertonen de hoogste
loopwielactiviteit, en rennen onder normale condities ongeveer 2.7 keer zoveel in loopwielen dan
controle muizen (lijn 2). Ze zijn echter ook een stuk actiever in hun thuiskooi dan
controlemuizen wanneer de toegang tot de wielen is geblokkeerd. Het doel van dit
promotieonderzoek was om in deze selectielijnen van muizen regulatie van energiebalans en
emotionaliteit en evenuele storingen hierin te onderzoeken onder zowel non-reproductieve als
reproductieve condities, en om te bestuderen of bepaalde eigenschappen van deze dieren konden
worden beinvloed tijdens de perinatale fase. Dit onderzoek is van groot belang voor de
gezondheid van de mens aangezien er consensus bestaat over de positieve rol van
lichaamsbeweging als middel om overgewicht en daaraan gerelateerde gezondheidsproblemen
tegen te gaan. Dergelijke gezondheidsproblemen blijken op steeds jeugdigere leeftijd voor te
komen, en zullen mogelijkerwijs een gevolg zijn van processen die tijdens de zwangerschap en de
periode vlak na de geboorte “ingeprint” worden door moeder-kind interacties. Dus, door deze
processen te volgen in selectielijnen van muizen kon worden onderzocht waar, op welke manier,
en wanneer fysieke inspanning of daaraan gerelateerde aanpassingen (fysiologisch, metabool,
morfologisch, en/of emotionleel gedragsmatig) bescherming biedt tegen het ontwikkelen van

Nederlandse Samenvatting
157
overgewicht en metabole ziekten. De uitkomsten van de verschillende experimenten zijn
hieronder kort samengevat.
2. Samenvatting van de resultaten
In Hoofdstuk 2 werden emotioneel gedragsmatige consequenties bestudeerd van selectie voor
een hoge mate van loopwielactiviteit bij muizen. Daartoe werden muizen zonder loopwielen
getest in diverse gestandardiseerde proefopstellingen (“plus-maze, “complex-maze”, en “open-
field”). Uit de proeven bleek dat hoog actieve muizen een verhoogd niveau van aandacht en angst
hadden in een nieuwe omgeving dan controle muizen, maar in een bekende omgeving bleken ze
routinematiger te zijn dan controle muizen. Routinematig handelen zou bij kunnen dragen tot
een toename in de fysieke activiteit/locomotie onder stress-vrije condities, terwijl een verhoogd
aandachtsniveau juist bij kan dragen aan het vroeger en sneller opsporen van bedreigingen en dus
verbeterde overleving op onbekend terrein.
In Hoofdstuk 3 werden hoog actieve en controle muizen voorzien van een gezond
vezelrijke vetarm (VA) dieet of een relatief ongezond vezelarm vetrijke (VR) dieet. Na enige
weken van habituatie aan deze diëten werd vervolgens onderzocht of de hoog actieve muizen
zich op een andere manier aan zouden passen aan het VR dieet dan controles. Uit eerder
onderzoek was al gebleken dat de controle muizen op het VR dieet vetzuchtiger werden dan de
hoogactieve muizen. In dit experiment bleek dat de laatsten een hogere mate van
thuiskooibewegingen lieten zien, en dit bleek verder verhoogd te worden door het VR dieet,
terwijl in de controles het bewegingsniveau juist omlaag ging op het VR dieet (t.o.v. het VA
dieet). Daarnaast lieten vrouwelijke hoog actieve muizen een toename zien in de vetoxidatie
terwijl mannelijke hoog actieve muizen een toename lieten zien van koolhydraatoxidatie. In een
dieet voorkeurstest bleek dat m.n. hoog actieve vrouwtjes een sterk verhoogde voorkeur te
hebben voor het VA dieet vergeleken met controles. Het is waarschijnlijk dat deze dieren v.w.b.
hun koolhydraatstofwisseling op het randje balanceren, en nauwelijks voldoende intermediaire
brandstoffen hebben om hun hoog niveau van vetoxidatie op peil te kunnen houden.
In Hoofdstuk 4 werden hoogactieve muizen en controles voorzien van twee
verschillende diëten; wederom een VA dieet, en dit keer een VR dieet tevens bestaande uit een
verhoogde concentratie “snelle” suikers (VR/suiker). Na gedurende enkele maanden op de
verschillende diëten te zijn geweest bleek dat de hoo gactieve muizen, ondanks een verhoogde
opname van het VR/suiker dieet, een verminderde aanleg hadden om vetzuchtig te worden op
dit dieet dan controles. Bovendien waren de hoogactieve muizen kleiner dan de controlemuizen.
Dit verschil bleek niet te kunnen worden verklaard door een verminderde absorptie, maar door
een verhoogde mate van thermogenese gekoppeld aan thuiskooiactiviteit, m.n. wanneer ze op het
VR/suiker dieet stonden. Hoogactieve muizen bleken een hogere angst-niveau te hebben in de
voor hen onbekende “plus-maze” dan controles, maar dit bleek totaal om te keren wanneer ze
het VR/suiker dieet aten. Aangezien de hoogactieve muizen wederom een verhoogde voorkeur
Dutch Summary
158
voor het VA dieet hadden dan voor het VR/suiker dieet kon worden geconcludeerd dat het
VR/suiker dieet een stemmingsverbeterend effect heeft in de hoogactieve dieren zonder dat de
dieren dit dieet daadwerkelijk ook smakelijker vinden.
In Hoofdstuk 5 werden vrouwelijke hoogactieve en controle muizen wederom
voorzien van één van beide diëten als genoemd onder Hoofdstuk 4. Vervolgens werden ze
zwanger gemaakt door een mannetje uit overeenkomstige lijn, en werden de reproductieve
prestaties onderzocht. Uit de resultaten bleek dat de muizen uit hoog actieve lijnen gemiddeld
zwaardere en grotere nesten hadden dan de controle lijn, vooral wanneer ze op het VR/suiker
dieet stonden. Tijdens lactatie bleek tevens dat de hoog actieve dieren een verhoogde groei-
efficientie (i.e., groei van moeder en pups tezamen tijdens de lactatie gedeeld door de hoeveelheid
geabsorbeerde energie) hadden t.o.v. controle muizen, en dit verschil kwam m.n. tot uiting
wanneer ze op het VR/suiker dieet stonden. Uiteindelijke werden pups van de controle moeders
gemiddeld zwaarder dan die van de hoog actieve moeders, vooral bij diegene op het VR/suiker
dieet. Overleving van pups in de hoog actieve lijnen was niet eenduidig, aangezien één van de
hoog actieve lijnen (lijn 7) relatief veel pups verloor, terwijl dit juist helemaal niet het geval was in
de andere hoog actieve lijn (lijn 8) en controle lijn 2. Regressie analyse liet zien dat effecten op
groei van de nakomelingen in grote mate afhankelijk bleek te zijn van nestgrootte waarin de pups
werden geboren, maar significante verschillen tussen controle en selectielijnen bleef bestaan.
In Hoofdstuk 6 werden de lange termijn consequenties onderzocht bij de
nakomelingen van de onder Hoofdstuk 5 gemanipuleerde moeders. Ondanks het feit dat alle
muizen na het verspenen werden groot gebracht op het VA dieet, bleek het perinatal VR/suiker
dieet grotere en dikkere volwassen mannelijke muizen (met hogere insuline, maar niet hogere
leptine spiegels) voort te brengen in de controle lijn. Dit effect bleef overeind wanneer werd
gecorrigeerd voor verschillen in nestgrootte waarin de dieren werden geboren. Het VR/suiker
dieet tijdens zwangerschap en lactatie bleek echter niet tot grotere en zwaardere dieren te leiden
in de hoog actieve lijnen. Hieruit kon worden geconcludeerd dat de eigenschap van hoge fysieke
activiteit bescherming biedt tegen het perinatale effect van het VR/suiker dieet.
Het doel van Hoofdstuk 7 was tweeledig: A) Bestudering van de effecten van de twee
dieten tijdens het perinatal stadium op regulatie van energiebalans bij de nakomelingen (zoals
genoemd onder Hoofdstuk 6), maar nu in de conditie waarin de nestgrootte meteen na de
geboorte werd gemanipuleerd naar 10 pups/nest. B) Bestudering van de bijdrage van het
postnatale miljeu op energiebalans regulatie door nakomelingen van moeders van verschillende
lijnen te verruilen (“cross-fostering”), en dit eveneens in nesten van 10 pups. Uit de
experimenten van deel A) bleek dat het perinataal toedienen van het VR/suiker dieet geen
noemenswaardige effecten had op energiebalans regulatie van de controle muizen afkomstig uit
gemanipuleerde nesten (in tegenstelling tot uitkomsten van Hoofdstuk 6) Nu echter bleek dat de
hoog actieve muizen afkomstig van moeders op het VR/suiker dieet zwaarder en dikker waren
dan hoogactieve nakomelingen van VA moeders, maar dit effect bleek van tijdelijke aard. Een
verklaring van deze uitkomsten kan gevonden worden in het feit dat nesten van controle

Nederlandse Samenvatting
159
moeders, en dan met name diegene op het VR/suiker dieet, vaak een eigen nestgrootte van 7 à 8
pups hadden, en daardoor wellicht geprepareerd waren voor relatief kleine nesten. Aanvullen tot
10/nest leverde daardoor wellicht relatief kleinere/lichtere dieren op. In de hoogactieve muizen
was vaak sprake van nesten >10 pups, waardoor moeders na manipulatie dus minder pups
hoefden te voeden dan waarvoor ze waren geprepareerd. Dit zou dan kunnen leiden tot relatief
grotere pups, en sneller groeiende nakomelingen. Maar, zoals eerder gezegd was dit effect van
voorbijgaande aard. Kennelijk zijn hoog actieve muizen in staat om opvetting als gevolg van
perinatal manipulatie (“nurture”) op te vangen vanwege hun specifieke
fysiologische/gedragsmatige eigenschappen (“nature”). In deel B) werd gevonden dat controle
pups overgelegd naar hoog actieve lijn 8 moeders geen verschillen lieten zien in groeisnelheid
t.o.v. controle pups die bij de eigen moeder bleven. Controle pups overgelegd naar hoog actieve
lijn 7 moeders lieten echter een groei achterstand zien t.o.v. de controle pups bij controle
moeders. Dit effect bleef zichtbaar in volwassen controle muizen, en was geassocieerd met
relatief lage insuline en glucose spiegels. Kennelijk overheerst de relatief “zuinige” postnatale
omgeving van hoog actieve lijn 7 moeders de prenatale (epi)genetische “make-up” van
controlemuizen. Darentegen kon de (epi)genetische “make-up” van hoog actieve lijn 7 en 8 pups
overgelegd naar controle moeders niet worden overheersd door de relatief “rijke” postnatale
omgeving van controle moeders. Effecten van “cross-fostering” werden niet gevonden op
loopwiel activiteit bij de nakomelingen. Lijn 7 moeders bleken nu geen pups meer te verliezen
(dit i.t.t. de experimenten in Hoofdstuk 5), hetgeen mogelijk verklaard kan worden doordat de
overgelegde controle pups in deze nesten de zorg van lijn 7 moeders verbeterd. De groei-
efficientie bleek te zijn toegenomen in controle moeders en hun nest (m.n. op een VR/suiker
dieet), hetgeen mogelijk verklaard kan worden door een hogere groei-efficientie van overgelegde
lijn 7 en lijn 8 pups.
3. Conclusie en perspectief
Muizen geselecteerd op een hoge mate van loopwiel activitiet hebben diverse (epi)genetisch
vastgelegde fysiologische, morfologische, en gedragsmatige veranderingen (t.o.v. controlemuizen)
die hen in staat stellen om actief te zijn in loopwielen, maar waarschijnlijk ook in relatief grote
biologische habitaten. Verder zijn de hoog actieve muizen in staat opvetting op een VR/suiker
dieet tegen te gaan, zowel in het volwassen stadium als tijdens de perinatale ontwikkeling. Hierbij
spelen zowel de (epi)genetsiche als postnatal invloeden een rol. Deze bevindingen kunnen van
belang zijn voor de humane situatie. Immers, mensen stammen af van paleolithische voorouders
die waarschijnlijk waren geselecteerd en aangepast aan een situatie waarin ze fysiek actief moesten
zijn om te kunnen overleven, en daarnaast een relatief karig bestaan hadden. De genetische
aanleg van de huidige mens wijkt waarschijnlijk niet erg af van deze voorouders, maar de
omgeving darentegen is dramatisch veranderd. In de huidige maatschappij is er sprake van een
overvloed aan vaak ongezonde voedingsmiddelen, vermindering van fysieke arbeid (door

Dutch Summary
160
toename van transportmiddelen, industrialisatie, en communicatie), en vaak een gejaagde “life-
style”, waarin stressvolle situaties niet meer beslecht kunnen worden door fysieke energie-
kostende acties (zoals waarschijnlijk wel het geval was bij onze paleolithische voorouders), maar
vaak chronisch en psychosociaal van aard zijn. Ondanks deze “obesogene” omstandigheden zijn
sommige mensen toch in staat om een “normaal” en gezond lichaamsgewicht te handhaven, en
geen metabole verstoringen/ziekten te ontwikkelen. Volgens Levine en collega’s (Science 28: Vol
307, 5709, pp 584-586, 2005) wordt deze obesitas-resistentie veroorzaakt door verschillen in
spontane fysieke activiteit. Westerterp en Speakman (International Journal of Obesity 32: pp
1256-1263, 2008) noemen echter dat toename van voedselinname, en niet energie verbruik, hier
een belangrijkere rol in speelt. Toekomstig onderzoek zal moeten uitwijzen welke strategie de
beste zal zijn om een verdere toename van metabole welvaartziekten tegen te gaan, en uiteindelijk
uit te bannen.

Nederlandse Samenvatting
161


MAGYAR ÖSSZEFOGLALÁS
A TERMÉSZET/GENETIKA ÉS A NEVELÉS HATÁSAI AZ ÖNKÉNTES
MOZGÁS AKTIVITÁSRA ÉS TÁPLÁLKOZÁSRA; ENERGIA HÁZTARTÁS
ÉS VISELKEDÉS

Hungarian Summary
164
A mozgás segíti az állatfajt abban, hogy feltérképezzék környezetüket táplálék, folyadék, partner felkutatásának reményében vagy éppen környezeti kihívások elkerülése végett úgy, mint a predáció elkerülése, éghajlati változások, stb. A fizikai aktivitás szintje különbözhet bizonyos állatfajok között, de még egyes állatfajokon belül is. Magas szinten növelheti a túlélés esélyeit azáltal, hogy az állat nagyobb területet képes befedni. Ennek következményeként a tápanyagszükséglet megnövekszik, hogy kielégítse a vázizomzat és a szív-érrendszer energia igényeit. Hosszabb távon ez fiziológiai, morfológiai és viselkedésbeli változásokat okozhat a szervezetben, melyek segítik fenntartani a fizikai aktivitás magas szintjét. Az önkéntes fizikai aktivitással együtt járó lehetséges adaptációs változások tanulmányozására állatkísérletekben kifejlesztett módszer a szelektív tovább-tenyésztés vagy mesterséges szelekció. Ez esetben az állatokat egy bizonyos phenotipikus tulajdonságra szelektálva tenyésztenek, amely szelekció változásokat idéz elő a kiválasztott phenotipusnak alárendelt jellegzetességekre nézve, amik erősítik az egyéni eltéréseket. Prof. T. Garland és kollégái a megnövekedett futókerék hajtásra tenyésztett egereket, amiket négy aktív származási ágra osztott és a randomszerűen tenyésztett 4 másik kontroll ághoz hasonlította őket. E tézis kereteiben a magas mozgásaktivitású egerek két leszármazási ágból kerültek ki (7-es ág és 8-as ág), amiket az egyik randomszerűen tenyésztett kontroll ághoz viszonyítottunk (2-es ág). Célkitűzéseink voltak, hogy vizsgáljuk a magas fizikai aktivitás hatását és adaptációs változásait az energia háztartás szabályozásában és a viselkedésben normál és szaporodási időszakban, valamint, hogy e változások képesek-e kivédeni a zsírdús diéta „obeso-gen” (elhízást okozó) hatásait mind felnőtt- és perinatális táplálás alkalmával. Továbbá, a posztnatális környezet – nevelés fontosságát vizsgáltuk a magas fizikai aktivitás meghatározásában. Az alábbiakban a különböző tanulmányok főbb eredményeit összegeztem fejezetenként.
A 2. fejezet célkitűzése volt a mozgás aktivitásra vonatkozó szelektációval együtt járó
következményes viselkedésbeli változások tanulmányozása. Az eredmények azt mutatták, hogy a magas fizikai aktivitású egerek különbözőképpen viselkedtek új és megszokott környezetben. Új környezetben magasabb anxietással, nagyobb explorációval és kockázat vállalással reagáltak arra utalva, hogy nagyobb óvatossággal és figyelmességgel rendelkeznek a kontroll egerekhez képest. Ezzel ellentétben, megszokott környezetben a rutin jellegű viselkedésük dominált, ami valószínűleg hozzájárul a kifejezettebb állóképességi munkájuk fenntartásához.
A 3. fejezetben az energia háztartás időbeli változását vizsgáltuk a napi ciklus
függvényében szelektált és kontroll egyedeken, amikor magas szénhidrát és alacsony zsírtartalmú (LF) vagy 60%-os, azaz magas zsírtartalmú tápot (HF) fogyasztottak. A kontrollokhoz viszonyítva, a magas fizikai aktivitású egyedek fokozott mozgás aktivitással és

Összefoglalás magyarul
165
energiafogyasztással/égetéssel rendelkeztek (különösképpen a HF diétán) az aktív fázis alatt. Ez utóbbi a hímekben magas szénhidrát égetésnek felelt meg, míg a nőstényekben ez a fokozott zsírégetés következménye volt, különösképpen a HF diétán. Mivel, a szelektált nőstények a megnövekedett energia szükségletük nagy részét az aktív fázis vége felé elégítették ki, elképzelések szerint ez anyagcsere elégtelenséghez vezethet hosszú távon, ami részben magyarázza soványságukat. Ezek ismeretében a LF diéta preferálása a HF diétával szemben, táplálék választásos kísérletben, meglepő lehet, habár ez anyagcseréjük jelzéseként is felfogható, ami a zsír égetéséhez szükséges szénhidrát szükségességét jelzi. A zsírból származó energia pótlást csak akkor tudják normalizálni, ha elegendő szénhidrátot is fogyasztanak; egy régi mondás szerint is „a zsírok a szénhidrátok tüzében égnek el”.
A 4. fejezetben a LF/normál és finomított cukrot tartalmazó 40%-os HF diéta hatását
vizsgáltuk az energia háztartásra és az érzelmi stresszre kontroll és aktív egyedeken. Az eredmények azt mutatták, hogy az aktív egerek rezisztensek voltak az „obeso-gen” HF diétára nézve és magas táplálék felvétellel, hasonló tápanyag felszívódással és magasabb „nem mozgás-indukált termogenezissel” rendelkeztek, mint a kontrollok. Amíg a szelektált nőstényeknek magasabb volt az anxietási szintjük a LF diétán, ez ellentétessé vált a HF diétán, plazma kortikoszteron változás nélkül. Ez talán azt sugallja, hogy a HF diétának hangulat javító szerepe van a szelektív aktív egereken, különösképpen a nőstényeknél, annak ellenére, hogy kevésbé preferálták a HF diétát, mint a kontrollok.
Az 5. fejezetben a szaporodási képességet vizsgáltuk LF és finomított cukrot
tartalmazó 40%-os HF diétán kontroll és aktív egerek között. Az eredmények azt mutatták, hogy az aktív egyedek magas alom-számot prdukáltak, és alom-tömeget szültek, és a növekedésük hatékonysága kiemelkedő volt a kontrollokhoz képest a laktáció időszakának maximumán, amikor HF diétát fogyasztottak. Habár, a szelekciónak negatív következménye volt az utódok korai posztnatális túlélésére a 7-es aktív ágban. Regressziós analízis felfedte, hogy az alom szám egy fontos meghatározó faktor volt az utód jellegzetességekre nézve, a diéta és származási ág hatásaitól függetlenül.
A 6. fejezetben a terhesség és laktáció alatti HF és LF diéta hosszú távú hatását
vizsgáltuk az energia egyensúly szabályozására aktív és kontroll egér utódokban. Az eredmények azt mutatták, hogy az aktív egerek védve voltak a korai HF diéta táplálás káros hatásai ellen. A szelektált egerek megtartották a sovány phenotípusukat emelkedett plazma adiponektin és csökkent plazma inzulin, leptin szintek mellett. Ezzel ellentétben a randomszerűen tenyésztett kontrollok megnövekedett testhosszal, nagyobb zsírtömeggel, emelkedett inzulin és csökkent adiponektin szintekkel rendelkeztek. Regressziós analízis kimutatta, hogy a születési alomszám egy meghatározó faktor felnőttkori paraméterekre nézve is, és a korai diétával és származási ággal együttesen befolyása van a strukturális növekedésre.

Hungarian Summary
166
A 7. fejezetnek két fő célkitűzése volt: A) a terhesség és laktáció környéki LF és HF diéta táplálás hatásainak vizsgálata az alomszám különbözőségektől függetlenül a szaporodási teljesítményre és az utód jellegzetességekre nézve; B) posztnatális környezet befolyása az aktív és kontroll egerekben „cross-fostering” típusú kísérletben. E fejezet A) részében az eredmények azt mutatták, hogy az alomszám azonos számra hozatala kivédte a posztnatális perigesztációs HF diéta testtömeg növelő hatását a kontroll utódokban, míg ideiglenesen testsúly és zsírtömeg növekedést okozott az aktív egyedekben, serdülőkorban. A váratlan eredményekre utaló magyarázat az, hogy a csoportok közötti alomszám kiegyenlítődés az utódszám csökkenését okozta az aktív anyáknál, míg a kontrolloknál az utódszám növekedését eredményezte. Így, az aktív anyák átlag két utóddal kevesebbet neveltek fel, ami túltáplálást okozott utódaiban, akiknek testsúlyuk és adipositásuk megnőtt. Ennek ellenére, a kontrollok több utódot neveltek fel, mint amennyire előkészültek a terhesség alatt, és ez az utódok testsúly és zsírtömeg normalizálódását eredményezte. Az aktív utódok túltáplálásának hatása átmeneti volt, amit a magas fizikai aktivitás felülírt felnőttkorban. A fejezet B) részében a cross-fostering kísérlet kimutatta, hogy az aktív anyák különböző posztnatális környezetet biztosítottak utódaiknak, mint a kontroll anyák; habár különbség mutatkozott a két szelektált ág anyái között is. Az utódok kicserélése a kontroll és a 8-as ág aktív anyái között nem volt befolyással az utódok növekedésére. Viszont az utódok kicserélése a kontroll és a 7-es ág aktív anyái között, a kontroll utódok testsúly csökkenését, és a 7-es aktív utódok időleges testsúly növekedését okozta. Az aktív anyák posztnatális környezete alacsony plazma inzulin és glukóz szinteket eredményezett a felnőtt kontroll utódokban, függetlenül a diéta hatásától, hatástalanítva a kontroll utódok prenatális (epi)genetikai hátterét. Ettől ellentétesen a felnőtt szelektált utódok prenatális genetikai hátterét nem tudta felülmúlni a kontrollok aránylag gazdagabb posztnatális környezete, még a perigesztációs HF diéta táplálása esetén sem. Érdekes módon, a kontroll anyák és utódaik növekedési hatékonysága kiemelkedő volt a laktációs időszakban, amikor HF diétát fogyasztottak. Ez az eredmény különbözött az 5. fejezetben találtaktól, ami arra enged következtetni, hogy a fogadott aktív utódok feljavították a növekedés hatékonyságát a kontroll ágban. Továbbá az 5. fejezetben talált 7-es ág aktív anyáinak utód vesztesége nem ismétlődött meg e fejezet 7-es ág anyáinál, akik kontroll utódokat is neveltek. A feljavult utód túlélés valószínűleg azt mutatja, hogy az utódveszteség az anya-utód kétirányú kapcsolat következménye és nem a gyengült anyai gondoskodás által volt megfigyelhető.
A mai korszerű társadalmakban a versenyszerű és felgyorsult életstílus feszültségekkel
teli szituációkat okoz, amihez a következményes stressz reakció (fight or flight) nem szolgál megfelelő megoldással. Ezzel párhuzamban a táplálék megnövekedett mennyisége és megromlott minősége, a gépesítés/indusztrializáció mind multi-dimenzionális megbetegedéseket eredményez. 2005-ben a Világ Egészségügyi Szervezetének (WHO) felmérése 400 millióra becsülte az elhízottak számát világszerte, ami 2015-re kivetítve elérheti a 700 milliót. Sok esetben, az elhízás együtt jár különböző megbetegedésekkel úgy, mint a 2-es típusú cukorbetegség, cardiovasculáris

Összefoglalás magyarul
167
megbetegedések, rákos daganatok bizonyos típusai és váz-izomrendszeri elváltozások. A cardiovasculáris megbetegedéseknek van a legmagasabb halálozási aránya, ami tovább nő az elhízás fokozott előfordulásával (World Health Organization 2005, http://www.who.int/). Mindezeken túl a kapcsolt metabolikus betegségek magas pénzügyi terhet jelentenek. A Conference Board egy tanulmánya az elhízás költségeit 100 milliárd dollárra becsülte az Egyesült Államokban (The Conference Board, 2008, http://www.conference-board.org/webcasts/describe_wc.cfm?ID=1373).
E tézisben leírt eredmények remélhetően segítséget nyújtanak a mozgás aktivitás
természetes védő és megelőző szerepének megerősítésére az egyre növekvő elhízás és társbetegségeinek megelőzésében és kezelésében. A mozgás aktivitás jótékony hatása nemcsak felnőtt egyénekre vonatkozik, hanem egyre fokozottan a gyermekekre is. Westerterp és Speakman megállapították, hogy a múlt évtized testsúly növekedése és a fokozott elhízás nem az energia felhasználás/égetés csökkenésének tulajdonítható, hanem az energia felvétel/táplálkozás növekedésének. Ezenfelül kimutatott, hogy a korai és gyermekkori életkörülmények befolyásolhatják a felnőttkori egészséges napi ritmus kialakítását úgy, mint a rendszeres mozgásaktivitást, megfelelő táplálék választást és a stresszes életritmus elkerülését. Ezért, a szülők felvilágosítása a megfelelő mozgás aktivitás és helyes táplálkozás fontosságára nézve támogatásra szorul széleskörű oktatással.


ACKNOWLEDGEMENTS

Acknowledgements
170
Here, I would like to thank to the people who helped me with my PhD work and helped
me to enjoy my life in Groningen.
Gertjan, thank you for being my supervisor. I liked your big enthusiasm for your job. You
supported me on my way to complete my thesis from the beginning to the end.
Csaba Nyakas, I can thank you a lot, since without you I may not arrive to Groningen. I also
thank your support in the scientific life. Köszönöm támogatását!
A further thank to G. Henk Visser who could assist my first steps during my PhD.
I am grateful to the technical support that I got from Jan Bruggink and Ramon that contributed a
lot to my chapters. To Linda, Saskia and Auke, for the animal care and also to Jan Kaiser and
Gerard Overkamp.
I want to thank to the students, Mark who introduced the mice to me, to Fiona, Jan and Caroline.
To my first office mate, Angelique, thank you being very kind. You welcomed me in the lab, and
helped me a lot in the first days, even making my birthday special with travels.
Kristin, thanks a lot. It was very nice working with you and having you as a friend. I could learn a
lot from you.
Anniek, I wish you the best and I remember for our nice conversations in our office with some
nice cups of tea.
Lobke, thank you your help in the beginning of my PhD work.
Thank you to my friends from the lab. Jose, thanks sharing lots of things together.
Marcelo, it was nice to be your friend.
Girste, thanks your lovely attitude and your warm welcome.
Arianna, for our nice spontaneous talks.
Henriette, thank you sharing nice times in a period of our life.
Folkert, for being a nice friend and coming to my last yoga class in Groningen with Alida.

Acknowledgements
171
To Niki and Géza helping me at the end of my journey in Groningen.
To my latest roommates, to Simon and Pauline, and also to Greta, Stefano, Guilia, Caroline,
Rijanne and Timur.
To Doretta, Deepa and Ivi for your interest and wish you all the best and strenght.
To the former PhDs, Viktor, Anghel, Amalia and Alinda.
I am very thankful for the help of Henk, Joke and Pleunie.
To Paul Luiten helping me to stay couple of months longer in Groningen.
To the senior academic staff, Jan Strubbe, Jaap Koolhaas, Anton Scheurink, Eddy van der Zee,
Uli Eisel Peter Meerlo, Sietse de Boer and Bauke Buwalda .
I thank to Ted Garland providing the mice.
Outside of the lab, I thank to my very nice friends, Asia, Constanze, Orly and Esther, wishing the
best for their life. Thank you to my former house mate, to Rashid.
Also, to the people, I met through dancing Otto, Kirsten and Edan.
And to my yoga friend, Silvie and who first introduced yoga to me Esther Chang.
I thank to my family, apu és anyu köszönöm támogatásotokat és kitartásotokat, Pityu, Zsuzsi és a
lányok, Anikó és Andi.
And the two most important and closest persons that were with me in Groningen in difficulties
and easy times are Esther van de Wall and Xavi.
Thank you very much Esther for everything. For your lovely being, friendship and support.
Thank you very much to Xavi, helping, supporting and loving me. Y muchas gracias para tus
padres, Anna y Eduard, por su confianza y paciencia.
Finally, I hope you enjoyed reading my first book,
All my best to You,
Barcelona, Nov. 2009


