university of groningen deep hubble space telescope ...€¦ · hubble space telescope (hst), it is...
TRANSCRIPT
University of Groningen
Deep Hubble Space Telescope Imaging of IC 1613. I. Variable Stars and DistanceDolphin, Andrew E.; Saha, A.; Skillman, Evan D.; Tolstoy, Eline; Cole, A.A.; Dohm-Palmer,R.C.; Gallagher, J.S.; Mateo, Mario; Hoessel, J.G.Published in:The Astrophysical Journal
DOI:10.1086/319809
IMPORTANT NOTE: You are advised to consult the publisher's version (publisher's PDF) if you wish to cite fromit. Please check the document version below.
Document VersionPublisher's PDF, also known as Version of record
Publication date:2001
Link to publication in University of Groningen/UMCG research database
Citation for published version (APA):Dolphin, A. E., Saha, A., Skillman, E. D., Tolstoy, E., Cole, A. A., Dohm-Palmer, R. C., ... Hoessel, J. G.(2001). Deep Hubble Space Telescope Imaging of IC 1613. I. Variable Stars and Distance. TheAstrophysical Journal, 550(2), 554-569. https://doi.org/10.1086/319809
CopyrightOther than for strictly personal use, it is not permitted to download or to forward/distribute the text or part of it without the consent of theauthor(s) and/or copyright holder(s), unless the work is under an open content license (like Creative Commons).
Take-down policyIf you believe that this document breaches copyright please contact us providing details, and we will remove access to the work immediatelyand investigate your claim.
Downloaded from the University of Groningen/UMCG research database (Pure): http://www.rug.nl/research/portal. For technical reasons thenumber of authors shown on this cover page is limited to 10 maximum.
Download date: 19-07-2020

THE ASTROPHYSICAL JOURNAL, 550 :554È569, 2001 April 1( 2001. The American Astronomical Society. All rights reserved. Printed in U.S.A.
DEEP HUBBL E SPACE T EL ESCOPE IMAGING OF IC 1613. I. VARIABLE STARS AND DISTANCE1ANDREW E. DOLPHIN AND A. SAHA
National Optical Astronomy Observatories, PO Box 26372, Tucson, AZ 85726 ; dolphin=noao.edu, saha=noao.edu
EVAN D. SKILLMAN
Astronomy Department, University of Minnesota, Minneapolis, MN 55455 ; skillman=astro.umn.edu
ELINE TOLSTOY
UK Gemini Support Group, Astrophysics, NAPL, University of Oxford, Keble Road, Oxford OX1 3RH, UK; etolstoy=astro.ox.ac.uk
A. A. COLE
Physics and Astronomy Department, 538 LGRT, University of Massachusetts, Amherst, MA 01003 ; cole=condor.astro.umass.edu
R. C. DOHM-PALMER
University of Michigan, Department of Astronomy, 821 Dennison Building, Ann Arbor, MI 48109-1090 ; rdpalmer=astro.lsa.umich.edu
J. S. GALLAGHER
University of Wisconsin, Department of Astronomy, 475 North Charter Street, Madison, WI 53706 ; jsg=astro.wisc.edu
MARIO MATEO
University of Michigan, Department of Astronomy, 821 Dennison Building, Ann Arbor, MI 48109-1090 ; mateo=astro.lsa.umich.edu
AND
J. G. HOESSEL
University of Wisconsin, Department of Astronomy, 475 North Charter Street, Madison, WI 53706 ; hoessel=astro.wisc.eduReceived 2000 September 22 ; accepted 2000 November 16
ABSTRACTWe present WFPC2 V I photometry of a Ðeld in the halo of IC 1613, Ðnding 13 RR Lyrae stars and
11 Cepheids. Our photometry of the red giant branch tip and red clump is used to derive distances to IC1613, which are consistent with each other and with distances based on the variable stars. We comparethese values with similarly measured distances for the Magellanic Clouds, and are able to measuremetallicity dependencies of the RR Lyrae and Cepheid distances by requiring consistent relative distancemeasurements from the four techniques. For metallicities of [Fe/H]\ [1.3 (RR Lyrae stars) and [1.0(Cepheids), we Ðnd a relatively steep slope of 0.34^ 0.20 mag per dex for the RR Lyrae stars and ashallow slope of [0.07^ 0.16 mag per dex for the Cepheids, both values within the range of theoreticaland empirical results in the literature. We Ðnd that a dependence of the red clump absolute magnitudeon age, in addition to metallicity, is required to produce self-consistent relative distances between IC1613 and the Magellanic Clouds. Adopting such a red clump calibration and self-consistent calibrationsfor the other three distance indicators, we Ðnd that the distances to all three objects are in excellentagreement. Our best distance modulus to IC 1613 is corresponding to a distance ofk0\ 24.31 ^ 0.06,730 ^ 20 kpc. This distance produces an RR Lyrae absolute magnitude of 0.61 ^ 0.08.Subject headings : Cepheids È galaxies : distances and redshifts È galaxies : individual (IC 1613) È
Local Group È stars : variables : other
1. INTRODUCTION
Studies of the stellar populations in nearby galaxiesprovide a powerful tool for determining the key physicalparameters of galaxy evolution, such as the age (star forma-tion history), the chemical composition and enrichmenthistory, the stellar initial mass function, environmentale†ects, and the dynamical history of the system. Using theHubble Space Telescope (HST ), it is possible to photometerindividual stars down to very faint magnitudes, and tointerpret the observable parameters such as the morphol-ogy of the color-magnitude diagram (CMD). This approachis a logical stepping stone to understanding galaxy evolu-tion and provides a physical basis for understanding obser-vations of high-redshift galaxies and their implications forcosmological models. Detailed analysis of the intermediate
1 Based on observations with the NASA/ESA Hubble Space Telescope,obtained at the Space Telescope Science Institute, which is operated by theAssociation of Universities for Research in Astronomy, Inc., under NASAcontract NAS5-26555. These observations are associated with proposal ID7496.
and old stellar populations of Local Group galaxies shouldreveal histories in accordance with those implied by studiesof galaxies at higher redshift (Tolstoy 1999). With theappropriate data, which currently are obtained primarilyusing HST , this hypothesis can be directly tested.
Here we present new HST observations of a Ðeld in thehalo of IC 1613, a dwarf irregular galaxy in the LocalGroup. In this paper we concentrate on the variable stars ofIC 1613, and in particular their relevance to its distancedetermination. In a future paper we will reconstruct the starformation history of IC 1613 by analysis of the stellar popu-lations.
The known properties of IC 1613 have recently beensummarized by van den Bergh (2000). We here give only abrief summary of relevant properties. Because of its proxim-ity (distance D720 kpc), its high Galactic latitude ([60¡.6)and thus small Galactic extinction, and its inclination (38¡ ;Lake & Skillman 1989), IC 1613 provides an excellentopportunity to observe stellar populations in a relativelylow metallicity environment. Interestingly, there are fewstudies of the metallicity in IC 1613. Mateo (1998) gives a
554

IC 1613 VARIABLES. I. 555
value of the mean iron abundance for the old andintermediate-age stellar populations of [Fe/H]\[1.3^ 0.2 (from Lee, Freedman, & Madore 1993, usingthe RGB color at see also Cole et al. 1999) andM
I\ [3.5 ;
an oxygen abundance of the interstellar medium of12 ] log (O/H) \ 7.8^ 0.2 (Talent 1980). Because of thehigh Galactic latitude, the reddening to IC 1613 is very low,and here we adopt an extinction of fromA
V\ 0.08^ 0.02
Schlegel, Finkbeiner, & Davis (1998).The distance to IC 1613 was determined from Cepheid
variable stars early on by Baade (Sandage 1971) and, basedin part on the observations of Cepheids by Freedman(1988), Madore & Freedman (1991) placed IC 1613 at adistance of 765 kpc Saha et al. (1992)(k0\ 24.42^ 0.13).observed RR Lyrae variable stars and derived a distance of660 kpc Using the observation of the(k0\ 24.10 ^ 0.27).tip of the red giant branch, Lee et al. (1993) derived a dis-tance of 714 kpc a value conÐrmed by(k0\ 24.27^ 0.25),the WFPC2 study of an inner Ðeld of IC 1613 by Cole et al.(1999). These values are all consistent within the errors, buttheir di†erences may be dominated by systematic errors.
Cole et al. (1999) presented an initial study of IC 1613stellar populations based on 10,700 s of integration in bothF555W and F814W, as well as 2600 s in F439W, of a Ðeldnearer the center of the Galaxy. They found evidence of acontinuous star-forming history, with the presence of allexpected components of the CMD (main sequence, redsupergiants, blue and red helium burners, asymptotic redgiants, red giants, and a red clump), as well as a hint of ablue horizontal branch. From the CMD morphology of thecentral Ðeld, Cole et al. derived an approximate age-metallicity relation for IC 1613, Ðnding it to be similar inform to that of the SMC but D0.3 dex more metal-poor atany given age. Their data, however, were not designed forvariable-star study (the primary goal of this paper), so weleave a detailed comparison of their results and the resultsfrom these data for a future paper on the stellar popu-lations.
A critical issue in the use of extragalactic stellar distanceindicators is their sensitivity to changes in metallicity. Thisquestion has received a good deal of attention in the recentliterature (e.g., Kennicutt et al. 1998 ; Sandage, Bell, & Tri-picco 1999 ; Caputo, Marconi, & Musella 2000b for dis-cussions of the Cepheid scale ; McNamara 1997 ; Caputo etal. 2000a ; and Demarque et al. 2000 for RR Lyrae stars ; Leeet al. 1993 and Salaris & Cassisi 1998 for the RGB tip ; andGirardi & Salaris 2000 and Udalski 2000 for the red clump).A fundamental point in these discussions is whether o†setsdue to metallicity are more or less important than uncer-tainties in the various luminosity zero points. Since the Ðrstrung of the variable-star distance ladder is the MagellanicClouds, which are moderately metal-poor, observations ofsimilar galaxies, such as IC 1613, provide an opportunity toempirically test for the importance of modest variations inmetallicity among metal-poor systems. In the present obser-vations, we are able to measure the magnitudes of fourindependent ““ standard candles ÏÏÈRR Lyrae variable stars,Cepheid variable stars, the tip of the red giant branch, andthe mean magnitude of the red clumpÈin a galaxy that hasslightly lower metallicity than the Small Magellanic Cloud.By comparing these four distance determinations to thoseof the Magellanic Clouds, we are able to test for systematicdi†erences associated with each indicator and potentialmetallicity dependencies.
2. DATA AND REDUCTION
2.1. ObservationsWFPC2 observations of a Ðeld in the halo of IC 1613
were obtained during 1999 22È27 August, as part ofprogram GO-7496, whose purpose is to investigate thestellar populations of dwarf irregular galaxies. The Ðeldcenter ]02¡03@16A, J2000) is located(01h04m26s.7, [email protected] of the center of the galaxy and southwest [email protected] Ðeld studied by Cole et al. (1999). There is no overlapwith the Ðeld examined by Saha et al. (1992) in the previousIC 1613 RR Lyrae study, which is to the west, or [email protected] Ðeld of Antonello et al. (1999). The data consist of 481200 s images : 16 in F555W and 32 in F814W, spreadevenly among four dithering pointings. Each orbit consistedof two images in the same Ðlter to aid in cosmic-rayremoval. A 25th orbit was used to obtain two F656N (Ha)images, which were used for other purposes, but not for thevariable-star work that is the topic of this paper.
2.2. ReductionsThe data were obtained from the STScI archive using
on-the-Ñy calibration, and thus were pipeline-calibratedusing the best available calibration images at the time ofretrieval. The images were then reduced using theHSTPHOT package (Dolphin 2000a). The data-qualityimage (c1f) was used to mask bad and questionable pixels,and the pairs of images from each orbit were combined forcosmic-ray removal, producing eight clean 2400 s images inF555W and 16 images in F814W. A deep image producedby combining all eight F814W images at the Ðrst pointing isshown in Figure 1. The sky image (which contains calcu-lated sky values at each pixel and is determined beforerunning photometry for uncrowded images for greaterefficiency) was then calculated and hot pixels removed usingthe HSTPHOT utilities.
Photometry was made using the multiphot routine ofHSTPHOT, which solves the photometry simultaneously
FIG. 1.ÈF814W WFPC2 image of IC 1613 Ðeld, combined from eight1200 s exposures.

556 DOLPHIN ET AL. Vol. 550
on multiple images (all 24, in this case) in order to reducethe number of free parameters. The detection threshold wasa minimum signal-to-noise ratio (S/N) of 3.5 in both thecombined F555W and combined F814W measurements.Charge transfer loss corrections and calibrations were madefollowing Dolphin (2000b). Because of the presence ofbright, isolated stars, point-spread function (PSF) solutionsand aperture corrections were made for each chip of eachimage. The color-magnitude diagram is shown in Figure 2,using all stars with the goodness-of-Ðt parameter s ¹ 1.5,o object sharpness o¹ 0.3 (sharpness of a perfect star is zero),and total S/N of at least 5 in both F555W and F814W. Inorder to eliminate poor detections, these requirements werealso made on the detections at each epoch, with detectionsfailing to meet the s, sharpness, and S/N criteria eliminated.To verify the accuracy of our photometry, we reduced thedata at one pointing independently, using DoPHOT pro-cedures described by Saha et al. (1996). This comparison isshown in detail in Dolphin (2000a), with agreement towithin 0.01 mag in both Ðlters.
Before proceeding with the variable-star search, it wasnecessary to determine the maximum accuracy of the pho-tometry. This was done by comparing the magnitudes ofwell-measured upper red giant branch stars at each epochwith the combined magnitudes. This comparison, whichtests both the reliability of the photometry and that of theaperture corrections, showed a median scatter of 0.015 mag.This value was adopted as the minimum error in thevariable-star work, with all smaller photometric uncer-tainties increased to 0.015 mag. The source of this error is acombination of photometric error from the undersampledimages and error in the aperture corrections.
Figure 3 shows the scatter (individual epoch minus com-bined magnitude) for all stars. The locations of the Cepheids(F555W of D22È23) and RR Lyrae stars (F555W of D25)
FIG. 2.È(V [ I), I color-magnitude diagram (12,983 stars), calculatedfrom mean magnitudes in all epochs. Poorly Ðtted stars (s [ 1.5 oro sharpness o[ 0.3) are not included. Error bars show typical (V [ I)uncertainties as a function of I. Absolute magnitudes (on the y-axis on theright) are calculated assuming I[ M
I\ 24.36.
FIG. 3.ÈPhotometry accuracy for the IC 1613 data. Values given aremagnitudes at individual epochs minus mean magnitudes. The locations ofthe Cepheids (F555W of D22È23) and RR Lyrae stars (F555W of D25) areshown by the excess scatter, and the limiting accuracy of 0.015 mag at thebright end is clear.
are shown by the excess scatter, and the limiting accuracy of0.015 mag at the bright end is clear. Otherwise, the Ðgure istypical for a star-forming dwarf.
2.3. Variable Star IdentiÐcationVariable star candidates were identiÐed using a pro-
cedure similar to that described by Saha & Hoessel (1990).For a star to be considered a candidate variable, it had tomeet four criteria. First, the star had to have good photo-metry in at least 16 of the 24 epochs, and an rms scatter of atleast 0.08 mag. Second, the reduced s2 of the photometry, asdeÐned by
s2\ 1NF555W ] NF814W
]C
;i/1
NF555W (F555Wi[ F555W)2pi2
] ;i/1
NF814W (F814Wi[ F814W)2pi2
D(1)
had to be at least 6.25, where and are theNF555W NF814Wnumber of exposures in the two Ðlters, andF555Wi
F814Wiare the magnitudes at each epoch, and andF555W F814W
are the mean magnitudes for each star. The minimum valueof 6.25 corresponds to mean deviation of 2.5 p, and wasdetermined empirically for these data. A second s2 test wasmade in order to reduce the ability of single bad points tocause a false detection. The one-third of the points contrib-uting the most to the s2 were eliminated, and the reduced s2recalculated from the remaining points. If this value was notat least 0.25, the star was eliminated from the list of candi-date variables. Again, the value of 0.25 was determinedempirically.

No. 2, 2001 IC 1613 VARIABLES. I. 557
FIG. 4.ÈCMD of IC 1613 Ðeld, showing the periodic variable stars.Filled circles show the Cepheids, diamonds the RR Lyrae stars, and tri-angles the two possible eclipsing binaries. The detection efficiency was not100%, and thus there are many stars in the instability strip. Absolutemagnitudes (on the y-axis on the right) are calculated assuming I[ M
I\
24.36.
Finally, a modiÐed LaÑer-Kinman algorithm (LaÑer &Kinman 1965) was used to test the stars for periodicity. Thiswas implemented by computing # for periods between 0.1and 5.0 days. The # parameter is calculated by determiningthe light curve for a trial period and using the equation
#(p)\ ;i/1N (m
i[ m
i`1)2;
i/1N (mi[ m)2 , (2)
where N is the number of exposures for a given Ðlter, ismithe magnitude at epoch i, and is the mean magnitude. Ifm
the trial period is incorrect, will be the di†erencemi[ m
i`1between two random points, times the rms scatter,J2producing a # of 2. However, if the trial period is correct,the di†erence between adjacent points will scale as N~1,producing a # that scales as N~2. A goodness of periodicityparameter can then be deÐned as "(p)\ 2/#(p). For thisstudy, the o†-period # was deÐned to be the 90th percentilevalue of # over the range of trial periods, giving our good-ness of periodicity parameter as "(p)\#90/#(p).
For the present data set, however, a sufficient number ofobservations were made in both F555W and F814W forlight-curve measurements to be made in both Ðlters. Thus, acombined goodness of periodicity parameter needed to bedeveloped. Given that "1@2 scales as the number of obser-vations in a given Ðlter when at the correct period, a reason-able combined parameter would be
"\ 0.25(J"F555W ] J"F814W )2 , (3)
where the constant of 0.25 is included to force the o†-period" to 1. In the general case, a goodness of periodicity for anynumber of Ðlters can be calculated with
"\A 1Nfilt
;i/1
NfiltJ"
i
B2. (4)
For this study, " was required to be at least 2.0 for a star tobe considered a candidate variable.
We note that because # is statistically independent ofamplitude (doubling the amplitude would leave #unchanged, for example), our determination of " does notaccount for the larger amplitudes of RR Lyrae stars andCepheid variables in F555W. It is not immediately obviousif or how such an accounting should be made. Nevertheless,we have experimented with other algorithms for the calcu-lation of " and #, such as
#(p) \C
;i/1
NF555W(F555W
i[ F555W
i`1)2
] ;i/1
NF814W(F814W
i[ F814W
i`1)2D
]C
;i/1
NF555W(F555W
i[ F555W)2
] ;i/1
NF814W(F814W
i[ F814W)2
D~1(5)
and Ðnd the selection of variables and their periods to bequite robust, regardless of the choice of algorithm.
Out of the 12,983 total stars, the steps listed above selec-ted 57 variable-star candidates, which were examined inter-actively. Since this study is primarily concerned withpulsating variables, stars that were variable in only oneÐlter and stars whose F555W and F814W light curves wereout of phase were removed from the candidate list, as werefalse detections, leaving 26 stars in the list. Eleven fall in theinstability strip above the horizontal branch, and were clas-siÐed as Cepheids. Thirteen fall along the horizontalbranch, and were classiÐed as RR Lyrae stars. The remain-ing two are possible eclipsing binaries. Figure 4 shows theIC 1613 CMD, with the variable stars highlighted. It shouldbe emphasized that our detection efficiency was not 100%(and was much lower for stars with periods greater than 0.6days, the duration of our longest set of consecutive orbits).Thus we cannot rule out the existence of Population IICepheids, nor are we conÐdent that the ““ nonvariable ÏÏ starsfalling within the instability strip are not, in fact, variablesthat were not detected. In addition, while the CMD fromcombined photometry is largely complete to I\ 27, thesingle-epoch S/N of stars below the horizontal branch issuch that detection of variables would have been extremelydifficult.
Mean magnitudes were calculated for each variable,using a period-weighted average
SmT \ [2.5 log ;i/1
N /i`1 [ /
i~12
10~0.4mi , (6)
where is the phase and is the magnitude at each point/i
mialong the light curve. These values, still in WFPC2 F555W
and F814W magnitudes, were then transformed to standardV and I.
3. ANALYSIS
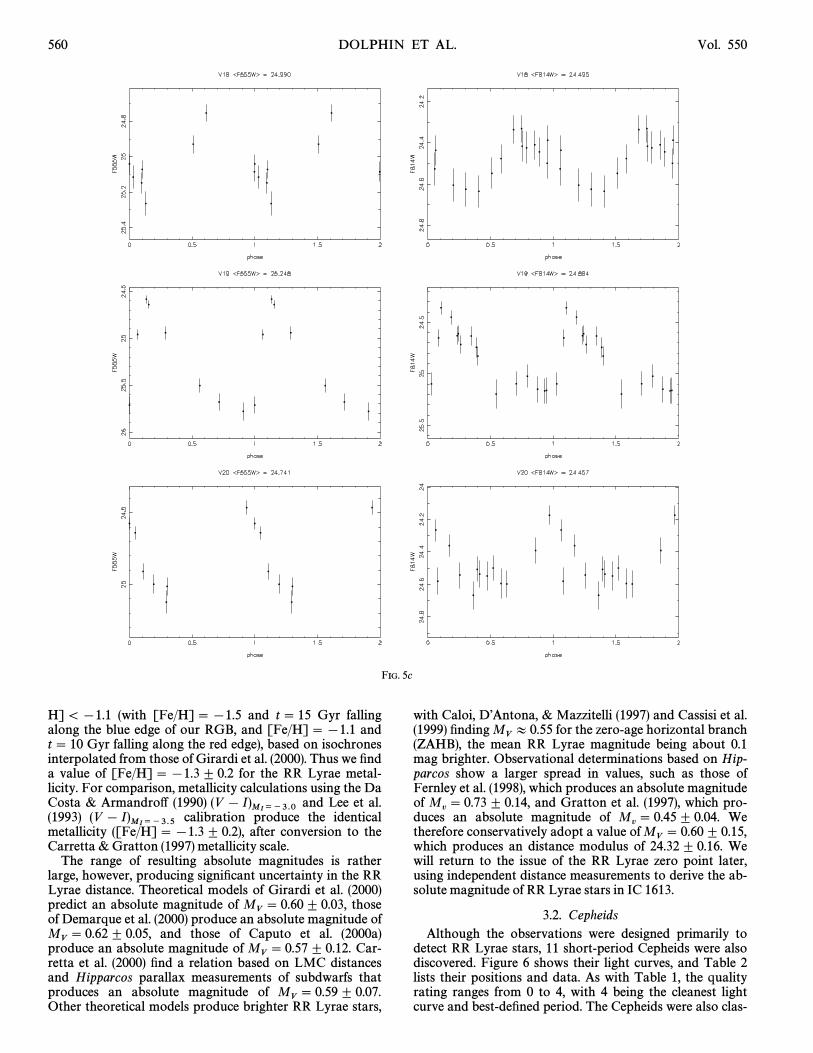
3.1. RR L yrae StarsFigure 5 shows the light curves of the 13 RR Lyrae candi-
dates, and Table 1 contains their positions and data. Allpositions are given relative to the F555W images at the Ðrstpointing. The Ðnal column in Table 1 lists the quality of the

FIG. 5a
FIG. 5.ÈLight curves of 13 candidate RR Lyrae stars
TABLE 1
RR LYRAE STARS
ID Chip X Y SV T SV [IT Period Q
V5 . . . . . . . WFC2 174.01 582.68 25.222^ 0.087 0.678 ^ 0.097 0.59 3V8 . . . . . . . WFC2 498.73 101.37 24.948^ 0.039 0.333 ^ 0.051 0.50 2V14 . . . . . . WFC3 368.24 153.10 25.098^ 0.083 0.345 ^ 0.092 0.31 3V15 . . . . . . WFC3 447.66 154.61 25.077^ 0.056 0.554 ^ 0.067 0.63 3V16 . . . . . . WFC3 519.91 703.76 25.097^ 0.068 0.463 ^ 0.074 0.34 2V17 . . . . . . WFC3 559.79 569.96 24.790^ 0.102 0.410 ^ 0.111 0.62 3V18 . . . . . . WFC3 599.32 495.63 24.971^ 0.085 0.501 ^ 0.090 0.65 4V19 . . . . . . WFC3 661.68 400.55 25.233^ 0.152 0.368 ^ 0.170 0.43 4V20 . . . . . . WFC3 770.59 790.22 24.728^ 0.135 0.287 ^ 0.142 0.61 2V21 . . . . . . WFC4 343.38 584.32 24.987^ 0.120 0.529 ^ 0.132 0.60 4V22 . . . . . . WFC4 585.38 573.20 25.058^ 0.091 0.550 ^ 0.107 0.58 2V23 . . . . . . WFC4 610.83 108.18 24.843^ 0.112 0.406 ^ 0.121 0.39 4V24 . . . . . . WFC4 691.07 215.75 24.890^ 0.053 0.707 ^ 0.094 0.48 2

IC 1613 VARIABLES. I. 559
FIG. 5b
light curve, from 0 to 4 (although all stars with qualityvalues of 0 or 1 have been removed). The criteria that areused to determine the light-curve quality are the uniquenessof the period, the presence or absence of bad points, lightcurves in phase between the two Ðlters, and the resemblanceto a template light curve of the appropriate class of object.We do not attempt to distinguish between fundamental-mode and overtone pulsators in the RR Lyrae stars, giventhe relatively poor S/N at each epoch (the typical uncer-tainty in both Ðlters is 0.1 mag). However, we do note thatthe short periods of variables V14 and V16 make themlikely overtone pulsators, and that those of V19 and V23make them possible overtone pulsators.
Multiplying the uncertainties in SV T by 4 divided by thelight-curve quality, and taking an average weighted by p~2,the best SV T for the sample of 13 RR Lyrae stars is25.00^ 0.03 mag. Eliminating the two possible outliersfainter than V \ 25.2, the weighted average is 24.98^ 0.03.Similarly eliminating the two possible outliers brighter thanV \ 24.8, the weighted average becomes 25.02^ 0.03.Given the very small shift in the mean magnitude after
eliminating the lowest and highest points, it seems reason-able to adopt the value of SV T \ 25.00 for the mean RRLyrae magnitude, while adding the ^0.02 shift in quadra-ture to the 0.03 mag uncertainty, producing a Ðnal uncer-tainty of 0.04 mag. This mean V magnitude is consistentwith the value of SgT \ 24.90^ 0.10 obtained by Saha et al.(1992), which corresponds to a mean V magnitude of24.94^ 0.10 (Saha & Hoessel 1987). An extinction ofA
V0.08 mag is adopted from Schlegel et al. (1998) (assumingwith the uncertainty estimated to beA
V/A
B\ 3.1/4.1),
^0.02 mag, producing an extinction-corrected mean Vmagnitude of SV T0\ 24.92^ 0.04.
Once the mean V magnitude is established, obtaining adistance estimate requires a value for the absolute magni-tude. This is generally done by adopting a value for themean RR Lyrae metallicity and a preferred versusM
V[Fe/H] relation. We can measure the mean RR Lyraemetallicity via the red giant branch, whose tip spans thecolor range 1.45\ (V [ I) \ 1.62. Assuming that RR Lyraestars are only produced in populations older than 10 Gyr,we Ðnd an allowable metallicity range of [1.5\ [Fe/
560 DOLPHIN ET AL. Vol. 550
FIG. 5c
H]\ [1.1 (with [Fe/H]\ [1.5 and t \ 15 Gyr fallingalong the blue edge of our RGB, and [Fe/H]\ [1.1 andt \ 10 Gyr falling along the red edge), based on isochronesinterpolated from those of Girardi et al. (2000). Thus we Ðnda value of [Fe/H]\ [1.3^ 0.2 for the RR Lyrae metal-licity. For comparison, metallicity calculations using the DaCosta & Armandro† (1990) and Lee et al.(V [ I)
MI/~3.0(1993) calibration produce the identical(V [ I)MI/~3.5metallicity ([Fe/H]\ [1.3^ 0.2), after conversion to the
Carretta & Gratton (1997) metallicity scale.The range of resulting absolute magnitudes is rather
large, however, producing signiÐcant uncertainty in the RRLyrae distance. Theoretical models of Girardi et al. (2000)predict an absolute magnitude of thoseM
V\ 0.60^ 0.03,
of Demarque et al. (2000) produce an absolute magnitude ofand those of Caputo et al. (2000a)M
V\ 0.62 ^ 0.05,
produce an absolute magnitude of Car-MV
\ 0.57 ^ 0.12.retta et al. (2000) Ðnd a relation based on LMC distancesand Hipparcos parallax measurements of subdwarfs thatproduces an absolute magnitude of M
V\ 0.59^ 0.07.
Other theoretical models produce brighter RR Lyrae stars,
with Caloi, DÏAntona, & Mazzitelli (1997) and Cassisi et al.(1999) Ðnding for the zero-age horizontal branchM
VB 0.55
(ZAHB), the mean RR Lyrae magnitude being about 0.1mag brighter. Observational determinations based on Hip-parcos show a larger spread in values, such as those ofFernley et al. (1998), which produces an absolute magnitudeof and Gratton et al. (1997), which pro-M
v\ 0.73 ^ 0.14,
duces an absolute magnitude of WeMv\ 0.45^ 0.04.
therefore conservatively adopt a value of MV
\ 0.60^ 0.15,which produces an distance modulus of 24.32^ 0.16. Wewill return to the issue of the RR Lyrae zero point later,using independent distance measurements to derive the ab-solute magnitude of RR Lyrae stars in IC 1613.
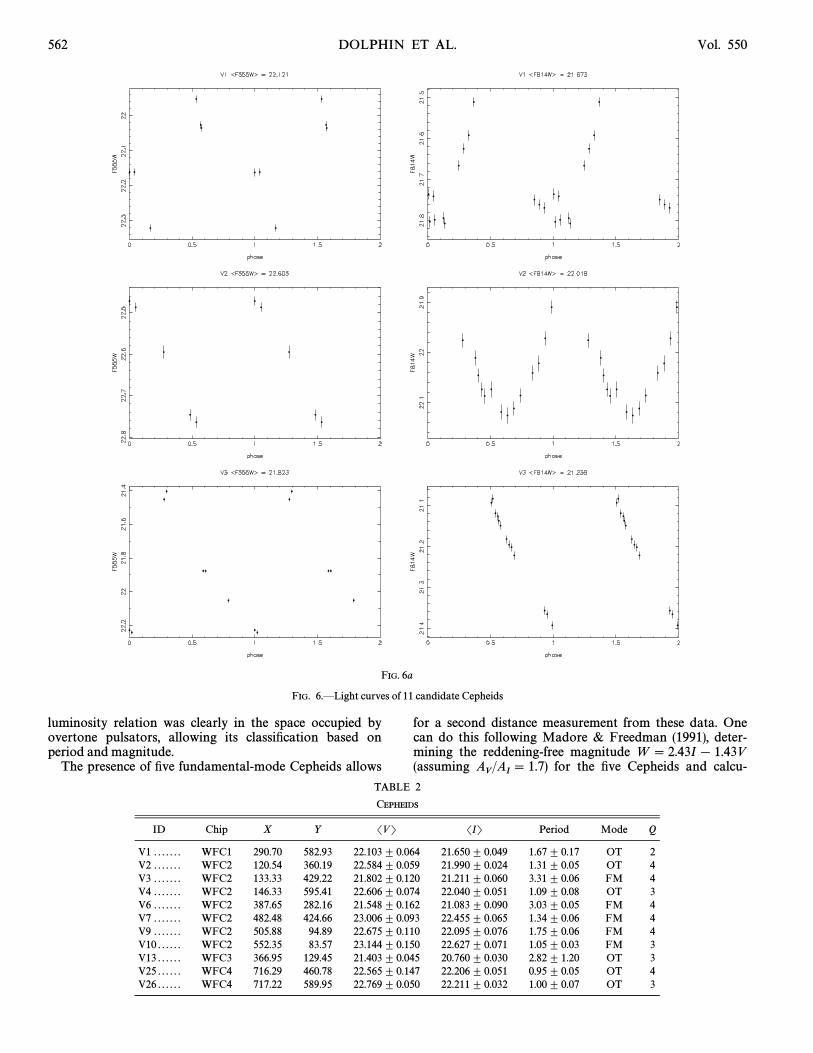
3.2. CepheidsAlthough the observations were designed primarily to
detect RR Lyrae stars, 11 short-period Cepheids were alsodiscovered. Figure 6 shows their light curves, and Table 2lists their positions and data. As with Table 1, the qualityrating ranges from 0 to 4, with 4 being the cleanest lightcurve and best-deÐned period. The Cepheids were also clas-

No. 2, 2001 IC 1613 VARIABLES. I. 561
FIG. 5d
FIG. 5e
siÐed into fundamental-mode and overtone pulsators, withall but V13 classiÐed based on their light curves. As shownby Mantegazza & Poretti (1992), overtone pulsators have aFourier spectrum with a weaker second order than that offundamental pulsators, meaning that their light curves willbe more sinusoidal. Ten of the eleven Cepheids were thus
classiÐed, and the period-luminosity relation in Figure 7shows this discrimination to be successful, with all overtonepulsators falling well above the mean period-luminosityrelation. The period of V13 was poorly constrained becauseof the poor sampling of epochs, and thus it could not besimilarly classiÐed. However, its position on the period-
562 DOLPHIN ET AL. Vol. 550
FIG. 6a
FIG. 6.ÈLight curves of 11 candidate Cepheids
luminosity relation was clearly in the space occupied byovertone pulsators, allowing its classiÐcation based onperiod and magnitude.
The presence of Ðve fundamental-mode Cepheids allows
for a second distance measurement from these data. Onecan do this following Madore & Freedman (1991), deter-mining the reddening-free magnitude W \ 2.43I[ 1.43V(assuming for the Ðve Cepheids and calcu-A
V/A
I\ 1.7)
TABLE 2
CEPHEIDS
ID Chip X Y SV T SIT Period Mode Q
V1 . . . . . . . WFC1 290.70 582.93 22.103^ 0.064 21.650 ^ 0.049 1.67^ 0.17 OT 2V2 . . . . . . . WFC2 120.54 360.19 22.584^ 0.059 21.990 ^ 0.024 1.31^ 0.05 OT 4V3 . . . . . . . WFC2 133.33 429.22 21.802^ 0.120 21.211 ^ 0.060 3.31^ 0.06 FM 4V4 . . . . . . . WFC2 146.33 595.41 22.606^ 0.074 22.040 ^ 0.051 1.09^ 0.08 OT 3V6 . . . . . . . WFC2 387.65 282.16 21.548^ 0.162 21.083 ^ 0.090 3.03^ 0.05 FM 4V7 . . . . . . . WFC2 482.48 424.66 23.006^ 0.093 22.455 ^ 0.065 1.34^ 0.06 FM 4V9 . . . . . . . WFC2 505.88 94.89 22.675^ 0.110 22.095 ^ 0.076 1.75^ 0.06 FM 4V10 . . . . . . WFC2 552.35 83.57 23.144^ 0.150 22.627 ^ 0.071 1.05^ 0.03 FM 3V13 . . . . . . WFC3 366.95 129.45 21.403^ 0.045 20.760 ^ 0.030 2.82^ 1.20 OT 3V25 . . . . . . WFC4 716.29 460.78 22.565^ 0.147 22.206 ^ 0.051 0.95^ 0.05 OT 4V26 . . . . . . WFC4 717.22 589.95 22.769^ 0.050 22.211 ^ 0.032 1.00^ 0.07 OT 3

No. 2, 2001 IC 1613 VARIABLES. I. 563
FIG. 6b
lating the reddening-free absolute magnitude MW
\using the Madore & Freedman (1991)[3.049 log P[ 2.40
calibration. Applying this technique to the IC 1613 funda-mental Cepheids and using a weighted average of the uncer-tainties gives a reddening-corrected distance modulus of
and a mean extinction, of 0.16^ 0.11k0\ 24.50 ^ 0.11 AV,
mag. The V and I period-luminosity relations are shown inFigure 7, with the Cepheids found by Freedman (1988)plotted as well. As can be seen in the Ðgure, the present dataare consistent with and provide an extension to the longerperiod data of Freedman (1988).
However, the EROS Collaboration result (Bauer et al.1999) of a steepening in the period-luminosity relation forperiods shorter than 2 days implies that three of our Ðvefundamental-mode Cepheids should be eliminated from thiscalculation. (This break is shown by the dashed line in Fig.7.) Thus, the reddening-corrected distance modulusbecomes for the two remainingk0\ 24.55^ 0.18fundamental-mode Cepheids. The large uncertainty is theresult of using the reddening-free distance, which multiplies
V uncertainties by 2.43 and I by 1.43 and adds them inquadrature. Given the low extinction to IC 1613 and thepresence of a good extinction estimate of A
V\ 0.08 ^ 0.02,
the uncertainty can be lowered by correcting the individualV and I distance moduli for extinction and combiningthem.
Finally, it should be noted that the I photometry of V3do not adequately sample the full range of the light curve,since the earliest epoch was at a phase of 0.2 after the peak.Thus the phase-averaged SIT magnitude is biased towardfainter magnitudes. Because this was not a problem in the Vphotometry, the procedure of Labhardt, Sandage, &Tammann (1997) was used to calculate the correct meanSIT, brightening the value from 21.21 to 21.15. The data forV6 have a similar problem, but a similar correction isimpossible because neither the V nor I photometry span theentire range of magnitudes. However, because the V lightcurve omits as much of the trough as the I light curve omitsof the peak, these errors should largely cancel when averag-ing the V and I distances obtained for V6.

564 DOLPHIN ET AL. Vol. 550
FIG. 6c
Table 3 shows the mean V and I magnitudes correctedfor extinction values andA
V\ 0.08^ 0.02 A
I\ 0.05
^ 0.02. Absolute magnitudes and are calculatedMV
MIusing Madore & Freedman (1991), with their rms scatter
adopted as the uncertainties. Given the smaller intrinsicscatter in the I period-luminosity relation, the distance foreach of the Cepheids is weighted twice as much in I as in V .Averaging the values for the two stars gives a best Cepheiddistance from these data of mag, consis-k0\ 24.45 ^ 0.15tent with the value of determined byk0\ 24.42^ 0.13Madore & Freedman (1991) from the Cepheid calibrationused here, as well as with previous measurements ofSandage (1971), McAlary, Madore, & Davis (1984), andFreedman (1988). The values in Figure 7 are for this dis-
tance and the adopted extinction, with the dashed lineshowing the expected V relation for P\ 2 days based onthe EROS result. Because of their larger sample size, weadopt the Madore & Freedman (1991) value in our dis-cussion, after converting it to our adopted extinction of
for the sake of comparison with other distanceAV
\ 0.08measurements. This decreases their distance to k0\ 24.40^ 0.13. We discuss possible metallicity e†ects on theCepheid distance scale below.
3.3. Other Distance MeasurementsAlthough variable stars provide excellent distance indica-
tors, there remain questions about the zero-point cali-brations at the 20% level, as well as uncertainties regarding
TABLE 3
CEPHEID DISTANCES
ID SV T0 SIT0 Period MV
MI
k0V3 . . . . . . 21.80^ 0.12 21.15 ^ 0.06 3.31 ^ 0.06 [2.83^ 0.27 [3.40^ 0.18 24.58 ^ 0.21V6 . . . . . . 21.55^ 0.16 21.08 ^ 0.09 3.03 ^ 0.05 [2.73^ 0.27 [3.28^ 0.18 24.33 ^ 0.21

No. 2, 2001 IC 1613 VARIABLES. I. 565
FIG. 6d
their dependencies on the metallicity of the parent popu-lation of stars. These issues are discussed in the followingsection. IC 1613 also provides us with additional distancebenchmarks, which provide further constraints for studyingthis problem.
FIG. 7.ÈCepheid period-luminosity relation. Filled circles show funda-mental pulsators, open circles show overtone pulsators, and crosses showthe Cepheids found by Freedman (1988). All but one of the Cepheids wereclassiÐed by light-curve shape. The solid lines show mean P-L relationsfrom Madore & Freedman (1991), with a distance modulus of 24.45 andextinction of The dashed line shows the break at P\ 2 days,A
V\ 0.08.
based on Bauer et al. (1999).
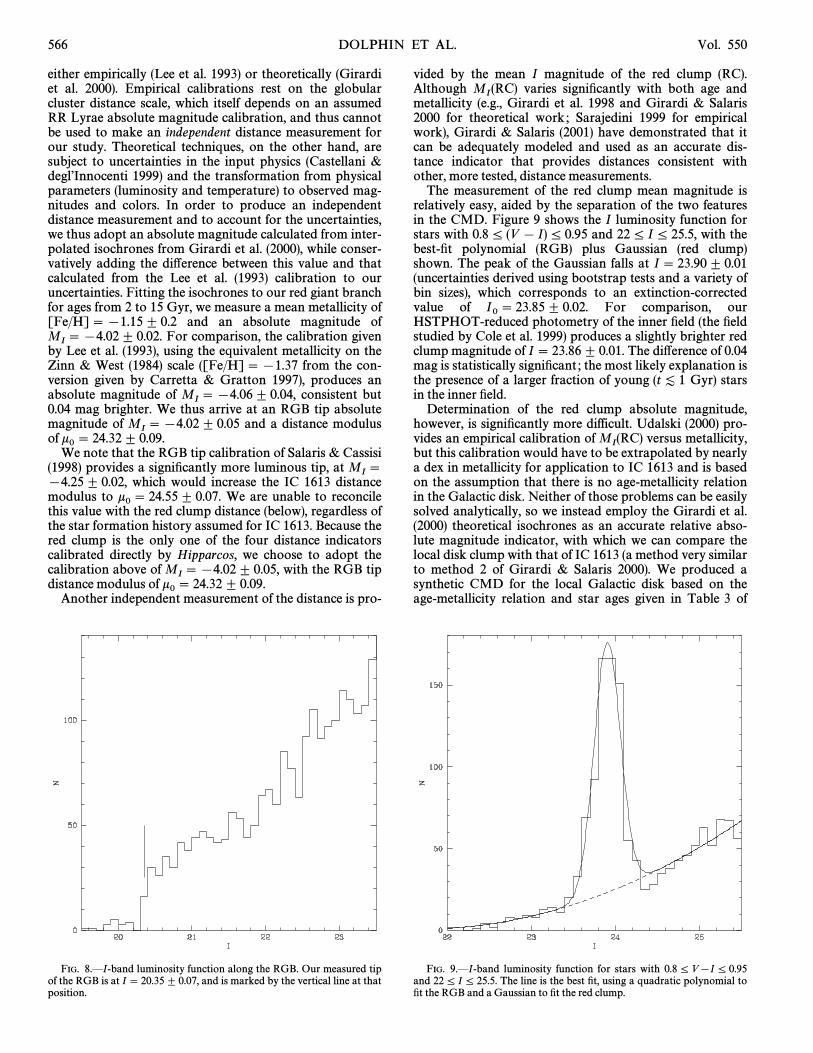
The red giant branch (RGB) tip (Lee et al. 1993) and redclump (Paczynski & Stanek 1998 ; Udalski 2000) providetwo possible standard candles. The RGB tip in I is espe-cially attractive, given its insensitivity to age and metallicityin theoretical models (e.g., Girardi et al. 2000). From theCMD in Figure 2 and an edge-detection algorithm, wemeasure an RGB tip at I\ 20.40^ 0.09. However, thisvalue is something of an upper limit to the RGB tip magni-tude, since the small number of stars present in the upperRGB makes it plausible that the theoretical RGB extendsabove the position of these stars. With an upper RGB lumi-nosity function of roughly seven stars per 0.1 mag, our 68%conÐdence limit for the true RGB tip is 0.03 mag above thebrightest star, increasing our uncertainty in the RGB tipmeasurement to 0.10 mag.
We can derive a more accurate RGB tip by using thedenser Ðeld studied by Cole et al. (1999), which containssigniÐcantly more red giants. Reducing those data withHSTPHOT and applying the Dolphin (2000b) CTE correc-tion and calibration, we Ðnd the RGB tip atI\ 20.35^ 0.07, consistent with that determined for thepresent data (where the 0.07 mag uncertainty is a result ofpossible red giant branch/asymptotic giant branch confu-sion near the tip). The luminosity function for the upperRGB is shown in Figure 8. Applying our adopted extinctioncorrection of produces an extinction-A
I\ 0.05^ 0.02
corrected RGB tip magnitude of We ÐndI0\ 20.30^ 0.07.the photometry of Cole et al. to be nearly 0.1 mag brighter,and note that we adopt the HSTPHOT-based photometryfor the inner Ðeld, since it is more consistent with the photo-metry for the outer Ðeld (which was consistent withDoPHOT reductions of the same data), and because of theavailability of an HSTPHOT-based calibration and CTEcorrection (Dolphin 2000b).
The absolute magnitude at the RGB tip can be estimated
566 DOLPHIN ET AL. Vol. 550
either empirically (Lee et al. 1993) or theoretically (Girardiet al. 2000). Empirical calibrations rest on the globularcluster distance scale, which itself depends on an assumedRR Lyrae absolute magnitude calibration, and thus cannotbe used to make an independent distance measurement forour study. Theoretical techniques, on the other hand, aresubject to uncertainties in the input physics (Castellani °lÏInnocenti 1999) and the transformation from physicalparameters (luminosity and temperature) to observed mag-nitudes and colors. In order to produce an independentdistance measurement and to account for the uncertainties,we thus adopt an absolute magnitude calculated from inter-polated isochrones from Girardi et al. (2000), while conser-vatively adding the di†erence between this value and thatcalculated from the Lee et al. (1993) calibration to ouruncertainties. Fitting the isochrones to our red giant branchfor ages from 2 to 15 Gyr, we measure a mean metallicity of[Fe/H]\ [1.15^ 0.2 and an absolute magnitude of
For comparison, the calibration givenMI\ [4.02^ 0.02.
by Lee et al. (1993), using the equivalent metallicity on theZinn & West (1984) scale ([Fe/H]\ [1.37 from the con-version given by Carretta & Gratton 1997), produces anabsolute magnitude of consistent butM
I\ [4.06^ 0.04,
0.04 mag brighter. We thus arrive at an RGB tip absolutemagnitude of and a distance modulusM
I\[4.02 ^ 0.05
of k0\ 24.32^ 0.09.We note that the RGB tip calibration of Salaris & Cassisi
(1998) provides a signiÐcantly more luminous tip, at MI\
[4.25^ 0.02, which would increase the IC 1613 distancemodulus to We are unable to reconcilek0\ 24.55^ 0.07.this value with the red clump distance (below), regardless ofthe star formation history assumed for IC 1613. Because thered clump is the only one of the four distance indicatorscalibrated directly by Hipparcos, we choose to adopt thecalibration above of with the RGB tipM
I\ [4.02^ 0.05,
distance modulus of k0\ 24.32 ^ 0.09.Another independent measurement of the distance is pro-
FIG. 8.ÈI-band luminosity function along the RGB. Our measured tipof the RGB is at I\ 20.35^ 0.07, and is marked by the vertical line at thatposition.
vided by the mean I magnitude of the red clump (RC).Although varies signiÐcantly with both age andM
I(RC)
metallicity (e.g., Girardi et al. 1998 and Girardi & Salaris2000 for theoretical work ; Sarajedini 1999 for empiricalwork), Girardi & Salaris (2001) have demonstrated that itcan be adequately modeled and used as an accurate dis-tance indicator that provides distances consistent withother, more tested, distance measurements.
The measurement of the red clump mean magnitude isrelatively easy, aided by the separation of the two featuresin the CMD. Figure 9 shows the I luminosity function forstars with 0.8 ¹ (V [ I) ¹ 0.95 and 22 ¹ I¹ 25.5, with thebest-Ðt polynomial (RGB) plus Gaussian (red clump)shown. The peak of the Gaussian falls at I\ 23.90^ 0.01(uncertainties derived using bootstrap tests and a variety ofbin sizes), which corresponds to an extinction-correctedvalue of For comparison, ourI0\ 23.85 ^ 0.02.HSTPHOT-reduced photometry of the inner Ðeld (the Ðeldstudied by Cole et al. 1999) produces a slightly brighter redclump magnitude of I\ 23.86^ 0.01. The di†erence of 0.04mag is statistically signiÐcant ; the most likely explanation isthe presence of a larger fraction of young Gyr) stars(t [ 1in the inner Ðeld.
Determination of the red clump absolute magnitude,however, is signiÐcantly more difficult. Udalski (2000) pro-vides an empirical calibration of versus metallicity,M
I(RC)
but this calibration would have to be extrapolated by nearlya dex in metallicity for application to IC 1613 and is basedon the assumption that there is no age-metallicity relationin the Galactic disk. Neither of those problems can be easilysolved analytically, so we instead employ the Girardi et al.(2000) theoretical isochrones as an accurate relative abso-lute magnitude indicator, with which we can compare thelocal disk clump with that of IC 1613 (a method very similarto method 2 of Girardi & Salaris 2000). We produced asynthetic CMD for the local Galactic disk based on theage-metallicity relation and star ages given in Table 3 of
FIG. 9.ÈI-band luminosity function for stars with 0.8 ¹ V [I¹ 0.95and 22 ¹ I¹ 25.5. The line is the best Ðt, using a quadratic polynomial toÐt the RGB and a Gaussian to Ðt the red clump.
No. 2, 2001 IC 1613 VARIABLES. I. 567
Rocha-Pinto et al. (2000), and a set of 15 synthetic CMDsfor IC 1613 based on a range of possible age-metallicityrelations and star formation histories consistent with theresults of Cole et al. (1999). Applying the usual Gaussianclump plus quadratic RGB Ðt to the synthetic CMDs, wemeasure a di†erence of mag betweendM
I\[0.22 ^ 0.08
the IC 1613 red clump and the Galactic disk red clump, theIC 1613 clump being brighter. Combined with theHipparcos-based local red clump calibration of M
I\
[0.23^ 0.02 (Stanek & Garnavich 1998), we derive a semi-empirical IC 1613 red clump absolute magnitude of M
I\
[0.45^ 0.09 and a red clump distance modulus of k0\24.30^ 0.09.
Thus, two additional independent distances can beobtained using the RGB tip and the red clump. The RGBtip distance is corrected for age and metallicity relativelyeasily, but difficulty in observational determination of thetip magnitude and uncertainty in the calibration createadditional error. In contrast, the red clump position is easilymeasured with high precision, but the systematics from ageand metallicity dependencies are not as well constrained.
4. DISCUSSION
4.1. Relative IC 1613ÈSMCÈL MC DistancesWith the availability of four independent distance mea-
surements to IC 1613, we can attempt to determine relativedistances between IC 1613 and the Magellanic Clouds.Since the zero point subtracts out when measuring relativedistances, this allows us, for the time being, to ignore theuncertainties in the calibrations. Table 4 and Figure 10show these comparison values.
For RR Lyrae stars, we adopt an absolute magnitude ofat [Fe/H]\ [1.3. We conservatively adopt aM
V\ 0.60
metallicity dependence of 0.25^ 0.10 mag per dex, which isconsistent with both the steep scale (dM
V/d[Fe/H]D 0.3 ;
e.g., Sandage & Cacciari 1990) and the shallow scalee.g., Carretta et al. 2000), producing(dM
V/d[Fe/H]D 0.2 ;
absolute magnitudes of at [Fe/MV
\ 0.58^ 0.01H]\ [1.4 (NGC 121 in the SMC) and M
V\ 0.45^ 0.06
at [Fe/H]\ [1.9 (the clusters used for the LMC measure-ment). The resulting relative distances are shown in the Ðrst
row of Table 4 ; we note that absolute distances would alsoneed to include the zero-point error of ^0.15 mag.
The Cepheid distance scale is based on the Madore &Freedman (1991) calibration, which assumes an LMC dis-tance modulus of 18.50. This calibration does not includeany metallicity dependence, a potential source of error,given the signiÐcant metallicity range covered by these threeobjects (from [Fe/H]^ [1.0 for IC 1613 to [Fe/H]^[0.4 for the LMC). Because literature values for the depen-dence are more varied than are those for the RR Lyraedependence, we do not attempt to make a correction here ;instead, the values in the second row of Table 4 assume nometallicity dependence.
The third and fourth rows of Table 4 similarly give RGBtip and red clump distances to the three objects. We adoptthe Girardi et al. (2000) models to provide the absolutemagnitudes of the RGB tips, and the Girardi & Salarissemiempirical calibrations of the Magellanic Cloud redclump absolute magnitudes.
We note that both the relative IC 1613-SMC distancesand the relative IC 1613-LMC distances are consistentbetween the four measurement methods. Using a weightedaverage of the four (by p~2) relative IC 1613ÈSMC distancemeasurements, we Ðnd a value of 5.44^ 0.05, correspond-ing to a linear distance ratio of dIC 1613/dSMC\ 12.2^ 0.3.Because of the possible metallicity dependence in the Ce-pheids and the large metallicity di†erence between IC 1613and the LMC, we average only the RR Lyrae, RGB tip, andred clump relative distances, Ðnding a relative IC 1613ÈLMC distance of 5.83^ 0.06 (a linear distance ratio ofdIC 1613/dLMC \ 14.7 ^ 0.4).
4.2. Metallicity Dependencies of Distance IndicatorsAlthough the uncertainties are signiÐcant, we also wish to
use the metallicity baseline in this comparison to examinethe e†ects of metallicity on the RR Lyrae and Cepheid dis-tance measurements. We Ðrst note that since the four rela-tive IC 1613ÈLMC distance measurements are allconsistent, our data are consistent with the metallicitydependencies adopted in the previous section : dM
V/
d[Fe/H]\ 0.25 for RR Lyrae stars and dMV/d[Fe/H]\
for Cepheids.dMI/d[Fe/H]\ 0
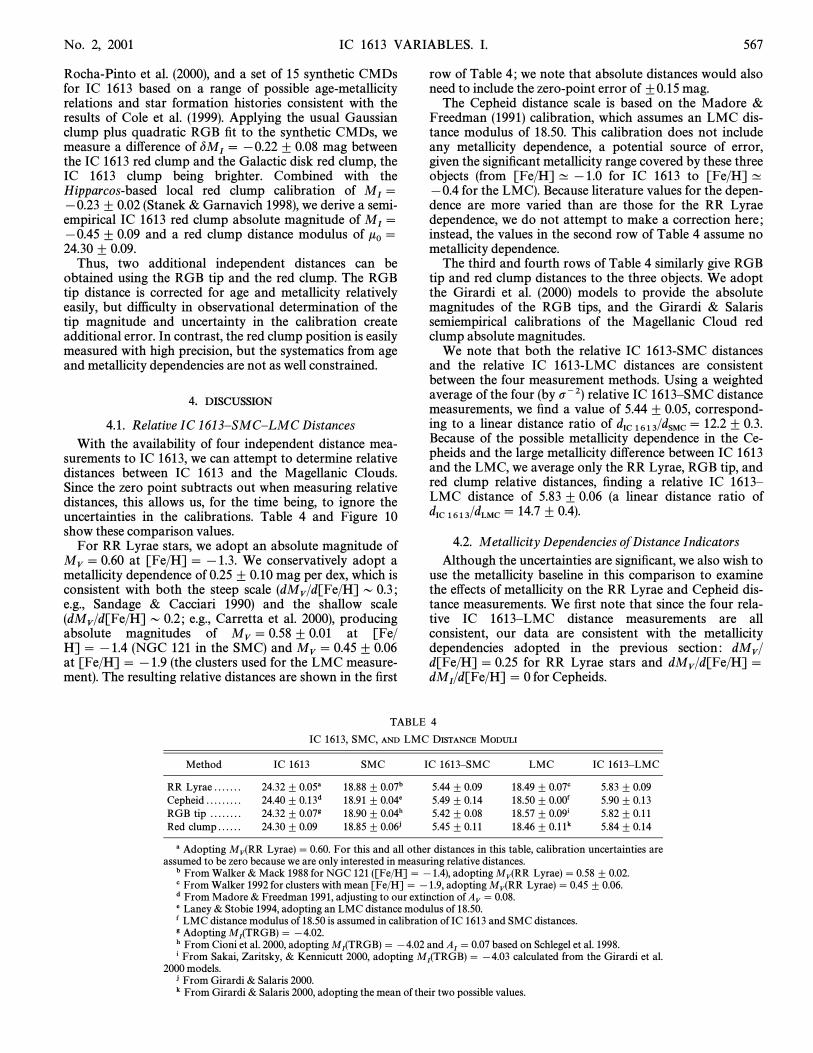
TABLE 4
IC 1613, SMC, AND LMC DISTANCE MODULI
Method IC 1613 SMC IC 1613ÈSMC LMC IC 1613ÈLMC
RR Lyrae . . . . . . . 24.32^ 0.05a 18.88^ 0.07b 5.44^ 0.09 18.49^ 0.07c 5.83^ 0.09Cepheid . . . . . . . . . 24.40^ 0.13d 18.91^ 0.04e 5.49^ 0.14 18.50^ 0.00f 5.90^ 0.13RGB tip . . . . . . . . 24.32^ 0.07g 18.90^ 0.04h 5.42^ 0.08 18.57^ 0.09i 5.82^ 0.11Red clump . . . . . . 24.30^ 0.09 18.85^ 0.06j 5.45^ 0.11 18.46^ 0.11k 5.84^ 0.14
a Adopting For this and all other distances in this table, calibration uncertainties areMV(RR Lyrae)\ 0.60.
assumed to be zero because we are only interested in measuring relative distances.b From Walker & Mack 1988 for NGC 121 ([Fe/H]\ [1.4), adopting M
V(RR Lyrae)\ 0.58 ^ 0.02.
c From Walker 1992 for clusters with mean [Fe/H]\ [1.9, adopting MV(RR Lyrae)\ 0.45^ 0.06.
d From Madore & Freedman 1991, adjusting to our extinction of AV
\ 0.08.e Laney & Stobie 1994, adopting an LMC distance modulus of 18.50.f LMC distance modulus of 18.50 is assumed in calibration of IC 1613 and SMC distances.g Adopting M
I(TRGB)\ [4.02.
h From Cioni et al. 2000, adopting and based on Schlegel et al. 1998.MI(TRGB)\ [4.02 A
I\ 0.07
i From Sakai, Zaritsky, & Kennicutt 2000, adopting calculated from the Girardi et al.MI(TRGB)\ [4.03
2000 models.j From Girardi & Salaris 2000.k From Girardi & Salaris 2000, adopting the mean of their two possible values.

568 DOLPHIN ET AL. Vol. 550
FIG. 10.ÈDistance modulus di†erences between IC 1613 and theMagellanic Clouds, using four distance measurements. The top panelshows the IC 1613ÈSMC di†erences, and the bottom panel the IC 1613ÈLMC di†erences. We note that all four distance measurement techniquesproduce consistent distance ratios.
We Ðrst address the issue of the RR Lyrae metallicitydependence. Combining the red clump and RGB tip dis-tances (which have both been corrected for populatione†ects) to determine relative distances to the three objects,we derive reddening-corrected absolute magnitudes of
1613)\ 0.61^ 0.08, andMV(IC M
V(SMC)\ 0.58^ 0.08,
Fitting these values to a straightMV(LMC)\ 0.41 ^ 0.10.
line (and adopting the metallicities from the previoussection) with a least-s2 algorithm, we Ðnd a metallicitydependence of mag per dex fordM
V/d[Fe/H]\ 0.34 ^ 0.20
the RR Lyrae absolute magnitude, a large value but consis-tent with more robust estimates of the metallicity depen-dency of the RR Lyrae absolute magnitudes (e.g., Sandageet al. 1999 ; McNamara 1997 ; Layden et al. 1996 ; Carney,Storm, & Jones 1992 ; Sandage & Cacciari 1990 ; Liu &Janes 1990). Since our measured value has a large uncer-tainty, we continue to use the adopted dependence of
mag per dex.dMV/d[Fe/H]\ 0.25^ 0.10
For the Cepheids, we adopt recent metallicities of [Fe/H]^ [1.0 for IC 1613 (based on an isochrone Ðt to thesedata), [Fe/H]^ [0.8 for the SMC (based on the clusterage-metallicity relation given by Olszewski, Suntze†, &Mateo 1996), and [Fe/H]^ [0.4 for the LMC (also basedon the cluster age-metallicity relation given by Olszewski et
al. 1996). Following our procedure from the RR Lyraedependence measurement, we compare the Cepheid dis-tances to those from the other distances (this time using theRR Lyrae, red clump, and RGB tip distances to measure the““ true ÏÏ distances). From the data in Table 4, we measureCepheid[ ““ true ÏÏ distances of 0.08 ^ 0.14 for IC 1613,0.03^ 0.06 for the SMC, and 0.01^ 0.05 for the LMC. Aleast-s2 Ðt to these points produces a metallicity depen-dence of [0.07^ 0.16 mag per dex in the Cepheid dis-tances, consistent with zero or with the small metallicitydependencies determined empirically by Kennicutt et al.(1998) and theoretically by Sandage et al. (1999) and Alibertet al. (1999). Despite the large uncertainty, these dataappear to rule out extreme values of the metallicity depen-dence, such as those of Caputo et al. (2000b), Beaulieu et al.(1997), and Gould (1994). We adopt a conservative correc-tion of [0.1^ 0.2 mag per dex, and correct the IC 1613Cepheid distance (taken from Madore & Freedman 1991)to This value is still based on ank0\ 24.34 ^ 0.18.assumed LMC distance modulus of 18.50, and adding 0.1mag of uncertainty to that value produces our best IC 1613Cepheid distance of k0\ 24.34^ 0.20.
4.3. T he Distance to IC 1613 and RR L yrae CalibrationAfter applying the corrections above, we have four dis-
tance measurements to IC 1613, summarized in Table 5.Taking a weighted average (again weighting by p~2), wemeasure the IC 1613 distance modulus to be k0\ 24.31^ 0.06, corresponding to a distance of 730 ^ 20 kpc.Although we have, in a sense, required the four distancemeasurements to be consistent in the previous section andthus have the possibility of circularity, we note that the RRLyrae, RGB tip, and red clump distances are taken from° 3.3 (the RR Lyrae metallicity dependence measured abovedoes not factor into the IC 1613 distance). In addition, ourweighted average of the distance measurements is24.31^ 0.06, whether or not the Cepheid distance isincluded (because of its high uncertainty). For complete-ness, we note that, had we used the Burstein & Heiles (1982)extinction maps instead of the Schlegel et al. (1998) maps,we would have used extinctions of andA
V\ 0.02 A
I\ 0.01,
and arrived at a distance modulus of k0\ 24.36^ 0.06.We note that, given the accurate RGB tip and red clump
measurements, we are able to work ““ backward ÏÏ to deter-mine the RR Lyrae absolute magnitude. Removing the RRLyrae distance from the weighted average, we arrive at anIC 1613 distance of Combining this withk0\ 24.31^ 0.07.our reddening-corrected mean magnitude of V0\ 24.92^ 0.04, we calculate the absolute magnitude of IC 1613 RRLyrae stars to be 0.61 ^ 0.08.
5. SUMMARY
We have presented photometry, variable-star analysis,and a series of distance measurements of a WFPC2 Ðeld in
TABLE 5
IC 1613 DISTANCE MODULI
Method This Work Primary Source of Error Best Value
RR Lyrae . . . . . . . . . . 24.32^ 0.16 MV
vs. [Fe/H] calibration 24.32^ 0.16Cepheid . . . . . . . . . . . . 24.45^ 0.15 Small number (2) 24.34^ 0.20RGB Tip . . . . . . . . . . 24.32^ 0.09 Measurement 24.32^ 0.09Red Clump . . . . . . . . 24.30^ 0.09 Age e†ects 24.30^ 0.09
Combined : 24.31^ 0.06
No. 2, 2001 IC 1613 VARIABLES. I. 569
the halo of IC 1613. We found 13 RR Lyrae stars anda mean extinction-corrected magnitude of SV T0(RRLyrae)\ 24.92^ 0.04. The presence of these stars conÐrmsthe existence of an old horizontal branch, consistent withthe ground-based results of Saha et al. (1992). We alsofound 11 short-period Cepheids, two of which werefundamental-mode with sufficiently long periods to deter-mine a distance. Finally, we applied RGB tip and red clumpdistance measurements to IC 1613, determining distancesfor each. The summary of our values is given in Table 5,along with the primary sources of error in those four mea-surements.
We assume that the RGB tip distance is the most robustof the four, given that the dependencies on age and metal-licity are very small and have been calibrated. However, thesmall Ðeld of view of WFPC2 limits our ability to accuratelymeasure the position of the tip, limiting the accuracy of ourmeasurement to The red clumpk0(RGB)\ 24.32^ 0.09.distance, on the other hand, has signiÐcant calibrationuncertainty based on the age dependence, but its positioncan be accurately measured in these data. Adding the popu-lation dependencies into our uncertainties, we Ðnd a redclump distance of k0(RC)\ 24.30 ^ 0.09.
Our sample of Cepheids was insufficient to produce anaccurate distance measurement, but we were able toconÐrm that our two D3 day fundamental-mode Cepheidswere consistent with the Cepheid distance obtained byMadore & Freedman (1991). We were also able to estimate,via comparisons with LMC and SMC distances, a metal-licity dependence of [0.07^ 0.16 mag per dex. Applying aconservative estimate of the metallicity dependence([0.1^ 0.2 mag per dex) and an extinction of A
V\ 0.08
from Schlegel et al. (1998) to the Madore & Freedman
(1991) values produces a corrected IC 1613 Cepheid dis-tance modulus of Combiningk0(Cepheid)\ 24.34 ^ 0.20.this with our other distance measurements with a weightedaverage, we arrive at our best IC 1613 distance modulus of
corresponding to a distance of 730 ^ 20k0\ 24.31 ^ 0.06,kpc.
A similar treatment was given to the RR Lyrae stars,producing a metallicity dependence of 0.34^ 0.20 mag perdex in the V absolute magnitude, consistent with literaturevalues. Given the wide variety of RR Lyrae absolute magni-tudes in the literature, we also found it useful to measure theIC 1613 RR Lyrae absolute magnitude, given our observedmean V magnitude and the distances calculated throughother measurements. We calculated a mean ofM
V0.61^ 0.08 at [Fe/H]^ [1.3, a value consistent with boththe ““ faint ÏÏ calibration of Fernley et al. (1998) and the““ bright ÏÏ calibration of Gratton et al. (1997).
We note that when each distance measurement is prop-erly calibrated and corrected for population e†ects, the RRLyrae, Cepheid, RGB tip, and red clump distance tech-niques produce consistent relative distances between IC1613 and the Magellanic Clouds. We Ðnd a relative IC1613ÈSMC distance modulus of 5.44 ^ 0.05 and a relativeIC 1613ÈLMC distance modulus of 5.83 ^ 0.06. We alsonote that all four distance indicators produce consistentdistances to IC 1613.
Support for this work was provided by NASA throughgrants GO-07496 and GO-02227.06-A from the Space Tele-scope Science Institute, which is operated by AURA, Inc.,under NASA contract NAS5-26555. E. D. S. is grateful forpartial support from NASA LTSARP grants NAGW-3189and NAG5-9221.
REFERENCESAlibert, Y., Bara†e, I., Hauschildt, P., & Allard, F. 1999, A&A, 344, 551Antonello, E., Mantegazza, L., Fugazza, D., Bossi, M., & Covino, S. 1999,
A&A, 349, 55Bauer, F., et al. 1999, A&A, 348, 175Beaulieu, J. P., et al. 1997, A&A, 318, L47Burstein, D., & Heiles, C. 1982, AJ, 87, 1165Caloi, V., DÏAntona, F., & Mazzitelli, I. 1997, A&A, 320, 823Caputo, F., Castellani, V., Marconi, M., & Ripepi, V. 2000a, MNRAS, 316,
819Caputo, F., Marconi, M., & Musella, I. 2000b, A&A, 354, 610Carney, B. W., Storm, J., & Jones, R. V. 1992, ApJ, 386, 663Carretta, E., & Gratton, R. G. 1997, A&AS, 121, 95Carretta, E., Gratton, R. G., Clementini, G., & Fusi Pecci, F. 2000, ApJ,
533, 215Cassisi, S., Castellani, V., DeglÏInnocenti, S., Salaris, M., & Weiss, A. 1999,
A&AS, 134, 103Castellani, V., & DeglÏInnocenti, S. 1999, A&A, 344, 97Cioni, M.-R. L., van der Marel, R. P., Loup, C., & Habing, H. J. 2000,
A&A, 359, 601Cole, A. A., et al. 1999, AJ, 118, 1657Da Costa, G. S., & Armandro†, T. E. 1990, AJ, 100, 162Demarque, P., Zinn, R., Lee, Y.-W., & Yi, S. 2000, AJ, 119, 1398Dolphin, A. E. 2000a, PASP, 112, 1383ÈÈÈ. 2000b, PASP, 112, 1397Fernley, J., Barnes, T. G., Skillen, I., Hawley, S. L., Hanley, C. J., Evans,
D. W., Solano, E., & Garrido, R. 1998, A&A, 330, 515Freedman, W. L. 1988, ApJ, 326, 691Girardi, L., Bressan, A., Bertelli, G., & Chiosi, C. 2000, A&AS, 141, 371Girardi, L., Groenewegen, M. A. T., Weiss, A., & Salaris, M. 1998,
MNRAS, 301, 149Girardi, L., & Salaris, M. 2001, MNRAS, in pressGould, A. 1994, ApJ, 426, 542Gratton, R. G., Fusi Pecci, F., Carretta, E., Clementini, G., Corsi, C. E., &
Lattanzi, M. 1997, ApJ, 491, 749Kennicutt, R. C., et al. 1998, ApJ, 498, 181Labhardt, L., Sandage, A., & Tammann, G. A. 1997, A&A, 322, 751LaÑer, J., & Kinman, T. D. 1965, ApJS, 11, 216
Lake, G. R., & Skillman, E. D. 1989, AJ, 98, 1274Laney, C. D., & Stobie, R. S. 1994, MNRAS, 266, 441Layden, A. C., Hanson, R. B., Hawley, S. L., Klemora, A. R., & Hanley,
C. J. 1996, AJ, 112, 2110Lee, M. G., Freedman, W. L., & Madore, B. F. 1993, ApJ, 417, 553Liu, T., & Janes, K. A. 1990, ApJ, 354, 273Madore, B. F., & Freedman, W. L. 1991, PASP, 103, 933Mantegazza, L., & Poretti, E. 1992, A&A, 261, 137Mateo, M. 1998, ARA&A, 36, 435McAlary, C. W., Madore, B. F., & Davis, L. E. 1984, ApJ, 276, 487McNamara, D. H. 1997, PASP, 109, 857Olszewski, E. W., Suntze†, N. B., & Mateo, M. 1996, ARA&A, 34, 511Paczynski, B., & Stanek, K. Z. 1998, ApJ, 494, L219Rocha-Pinto, H. J., Maciel, W. J., Scalo, J., & Flynn, C. 2000, A&A, 358,
850Saha, A., Freedman, W. L., Hoessel, J. G., & Mossman, A. E. 1992, AJ, 104,
1072Saha, A., & Hoessel, J. G. 1987, AJ, 94, 1556ÈÈÈ. 1990, AJ, 99, 97Saha, A., Sandage, A., Labhardt, L., Tammann, G. A., Macchetto, F. D., &
Panagia, N. 1996, ApJ, 466, 55Sakai, S., Zaritsky, D., & Kennicutt, R. C. 2000, AJ, 119, 1197Salaris, M., & Cassisi, S. 1998, MNRAS, 298, 166Sandage, A. 1971, ApJ, 166, 13Sandage, A., Bell, R. A., & Tripicco, M. J. 1999, ApJ, 522, 250Sandage, A., & Cacciari, C. 1990, ApJ, 350, 645Sarajedini, A. 1999, AJ, 118, 2321Schlegel, D. J., Finkbeiner, D. P., & Davis, M. 1998, ApJ, 500, 525Stanek, K. Z., & Garnavich, P. M. 1998, BAAS, 193, 106.05Talent, D. L. 1980, Ph.D. thesis, Rice Univ.Tolstoy, E. 1999, Ap&SS, 265, 199Udalski, A. 2000, ApJ, 531, L25van den Bergh, S. 2000, The Galaxies of the Local Group (Cambridge :
Cambridge Univ. Press)Walker, A. 1992, ApJ, 390, L81Walker, A., & Mack, A. R. 1988, AJ, 96, 872Zinn, R., & West, M. J. 1984, ApJS, 55, 45