university of groningen capillary instabilities in thin
TRANSCRIPT
University of Groningen
Capillary instabilities in thin polymer filmsHarkema, Stephan
IMPORTANT NOTE: You are advised to consult the publisher's version (publisher's PDF) if you wish to cite fromit. Please check the document version below.
Document VersionPublisher's PDF, also known as Version of record
Publication date:2006
Link to publication in University of Groningen/UMCG research database
Citation for published version (APA):Harkema, S. (2006). Capillary instabilities in thin polymer films: Mechanism of structure formation andpattern replication. [S.n.].
CopyrightOther than for strictly personal use, it is not permitted to download or to forward/distribute the text or part of it without the consent of theauthor(s) and/or copyright holder(s), unless the work is under an open content license (like Creative Commons).
The publication may also be distributed here under the terms of Article 25fa of the Dutch Copyright Act, indicated by the “Taverne” license.More information can be found on the University of Groningen website: https://www.rug.nl/library/open-access/self-archiving-pure/taverne-amendment.
Take-down policyIf you believe that this document breaches copyright please contact us providing details, and we will remove access to the work immediatelyand investigate your claim.
Downloaded from the University of Groningen/UMCG research database (Pure): http://www.rug.nl/research/portal. For technical reasons thenumber of authors shown on this cover page is limited to 10 maximum.
Download date: 08-01-2022

Chapter 4Confinement
ofCapillary Instabilities
in aPolymer Blend Film
1

Confinement of Capillary Instabilities
4.1 Introduction
Liquids in a confined geometry behave differently from those in large volumes. This isdue to the dominance of the liquids surface and interfacial tension over other body andsurface forces at length scales below the capillary length. The capillary length (seeChapter 2) is the length scale at which a balance exists between the surface energyγ and the gravitational acceleration g of a liquid. In the capillary regime, liquidmorphologies are dominated by a minimization of the overall surface free energy. Asdescribed in Chapter 2, minimization of the surface free energy leads to wetting ofsurfaces, capillary rise of a liquid in a narrow tube and the absorption of water byplants and in granular materials, such as sand.
A second aspect where the confinement of a liquid plays a role concerns the sta-bility of thin films. While planar liquid films are intrinsically stable, they can forinstance be destabilized by a van der Waals pressure. In the process of film desta-bilization, the driving force couples to the spectrum of capillary waves and a singlecapillary mode with a well-defined wavelength develops.
In this chapter, instabilities in thin polymer blend films in an unconfined (freepolymer/air interface) as well as in a confined geometry (by second silicon wafermounted on top) are described. Blends of polystyrene and poly(vinyl methyl ether)were chosen because films of these blends destabilize and retract from a solid surfacein a short time span. The polymer is accumulated in droplets on the silicon surface. Incontrast, pure PS and PVME films (of comparable molecular weights) are metastableon silicon and take much longer to break-up by the heterogeneous nucleation of holes.Upon film destabilization, the blend films withdrew from the substrate, much likethe dewetting process described in Chapter 2, and the resulting morphology wasinvestigated.
4.2 Film Destabilization
The morphology of an unconfined 2:5 PS/PVME blend film upon heating to 170◦C,is shown in Fig.[4.1]. In a-f), the film destabilized and formed droplets of severalhundred nm high (multiple interference fringes) with a lateral size of ≈ 25 − 50 µm.The evolution of film destabilization appears to be consistent with the dewettingmorphology that was reported for homopolymers and another blend system (deuter-ated oligomeric styrene and oligomeric ethylene-propylene)22. In b), an initially flat100 nm film (a), developed film thickness fluctuations. In addition to this spontaneousprocess, in c), film rupture by heterogeneous nucleation is visible. In d), the surfaceroughness increased dramatically within a time frame of 3 minutes. In e), dropletshave formed on a residual polymer film with an estimated thickness of 50 nm. In f),all of the polymer material had accumulated in large droplets on the silicon substrate.
Comparing d) and f) in Fig.[4.1], not only the height of the surface structures hasincreased, but also the lateral spacing. The droplets on the surface experience little
2

Chapter 4
Figure 4.1: Optical microscopy images of a 2:5 PS:PVME blend annealed at 170 ◦C.In addition to a spontaneously occurring dewetting instability, dewetting by hetero-geneous nucleation is also visible. Images were taken at a) t = 30 sec b) t = 7min c)t = 18 min d) t = 21 min e) t = 37min f) t = 37 min after the sample was placed ona preheated heating plate.
friction on the residual polymer layer and are able to move in lateral direction andaccumulate more material. As long as this film is not ruptured, it allows neighboringdroplets to interact and merge. When in proximity of a neighboring droplet with alarger volume, a process analogous to Ostwald ripening sets in. Ostwald ripening isthe preferential growth of crystals at the expense of smaller adjacent crystals. Here,the analogy is found in the incorporation of a smaller droplet into a larger droplet,driven by the capillary pressure difference of the two drops. As was recently shown forcolloidal liquid droplets1, it is expected that capillary waves at the liquid/air interfaceof merging droplets engender the coarsening process.
4.3 PVME and PS/PVME blends
The instability that led to film destabilization in Fig.[4.1] is caused by an interplayof instabilities. Polymer blends are known for their complex behavior, which de-pends on the compatibility of the components, as well as their molecular weights,polydispersities and surface tensions. Polymer blends have different properties ascompared to the individual homopolymers. The interactions of the polymers in theblend have a remarkable influence on the stability and the observed morphology uponfilm destabilization. In temperature or composition regimes where the blend compo-
3

Confinement of Capillary Instabilities
nents are immiscible, macrophase separation occurs. Upon macrophase separation,each component is accumulated in a volume fraction that is rich with that component.PS/PVME exhibits a low critical solution temperature (LCST, see Fig.[4.2]). Blendsof these polymers are miscible at temperatures below the LCST, but phase separateabove the LCST (for most compositions, see Fig.[4.2]). The exact value of the LCSTdepends on the blend composition, the molecular weight, polydispersity of the com-ponents and their interactions. For a PS/PVME blend of 110 kg/mol and 52.8 kg/molfor PS and PVME, respectively, the LCST temperature of a blend with a 2:5 blendcomposition was reported between 85– 90 ◦C18 and 110 ◦C9. In the experiments here,the films are annealed well above the LCST, at 170 ◦C.
For the experiments described in this Chapter, polystyrene and poly(vinyl methylether) were used. Polystyrene had a molecular weight Mw = 106 kg/mol with apolydispersity of Pd = Mw/Mn = 1.03. and poly(vinyl methyl ether had Mw =33 kg/mol and Pd = 1.15. The blend used in our experiments had a composition φPS =0.29 (2:5 PS:PVME). The glass transition temperature of the blend is compositiondependent and for a blend with a polystyrene volume fraction φPS ≈0.3, the glasstransition temperature is approximately -20 ◦C (pure PVME: Tg = −40 ◦C, pure PS:Tg = 100 ◦C). In Fig.[4.2], a schematic drawing is shown of the phase diagram andthe glass transition temperature of the blend as a function of the blend composition.In the two-phase region (above the LCST) the blend macrophase separates into twophases with volume fractions φ1 and φ2 (indicated by the arrow) by a mechanismthat is defined by the temperature and the blend composition.
Figure 4.2: A schematic phase diagram of a mixture of PS and PVME. Below thelower critical solution temperature (LCST), the PS/PVME blend is miscible. Abovethe LCST, phase separation occurs and the blend separates in two phases (φ1 andφ2). A schematic drawing of the glass transition temperature with volume fraction ofPS (φPS) has been included.
4
Chapter 4
4.4 Surface Enrichment
In mixtures of polymers with different surface tensions, the low surface tension com-ponent (PVME) segregates at the interfaces of the polymer film9,15. The polymerwith the lower surface energy migrates to the polymer/air and polymer/substrate in-terface in order to minimize the interfacial free energies5. A blend of PS and PVMEalso exhibits this behavior. The degree of surface enrichment scales with the bulkcomposition and the molecular weights of the components15, as well as the relativewettability of the components, blend morphology and the degree of phase separa-tion2. In the study by Karim et al.9, segregation at the polymer/substrate interfaceby PVME is intentionally promoted by etching away the silicon oxide layer, therebyincreasing the surface energy of the silicon substrate. Wetting of a silicon substrate byPVME is further enhanced by the hygroscopic nature of PVME9. Hydration of thesubstrate by moist PVME leads to a symmetric surface segregation where the siliconsurface is homogeneously covered by PVME. Often, PVME is extensively dried andthe silicon oxide layer is etched away in order to remove all traces of water. It isnot exactly known to what extent this effect plays a role at 170 ◦C, the temperatureof our experiments, however, since this is far above the boiling point of water, it isexpected that hydration is of little influence.
The extent of surface enrichment also depends on the process that initiates phaseseparation. A pronounced surface enrichment up to of 93% by weight of PVMEwas demonstrated in the surface layer of 1:1 PS/PVME blends2. Molecular weightsof 119.5 kg/mol and 103.6 kg/mol were used for PS and PVME, respectively. Thehighest surface concentration was reported for thermally induced phase separation(93 w-%), as compared to solvent-cast phase separation (82 w-%) and miscible blendsof PS/PVME (74w-%). Solvent-cast phase separation was induced by dip-coatingfrom a trichloroethylene (TCE) solution, whereas a miscible blend was obtained afterdip-coating from toluene. For a 3:1 PS:PVME bulk composition, that matches ourexperimental system, the surface enrichment of PVME was lower, with values of82, 63 and 52w-%, respectively. In Fig.[4.3], the graphs show the average surfacecomposition of PVME. For all compositions, an almost pure PVME layer forms atthe polymer/air interface. The average composition scales with the PVME volumefraction in the bulk and is expected to be even more pronounced for higher PVMEvolume fractions than for the symmetrical blend shown here.
4.5 Nature of the Instability
Phase separation in thin blend films is accompanied by an increase in surface rough-ness (film thickness fluctuations) for blend compositions other than the critical com-position, according to studies by Wang et al., Karim et al. and Ermi et al.7,9,20. Thereported accumulation of the minority phase in droplets in the film and the subsequentincrease in surface roughness occurred in the absence of so-called surface-directed spin-
5

Confinement of Capillary Instabilities
Figure 4.3: Surface enrichment of PVME (99kMw versus 3.1k Mw PS) at the poly-mer/air interface. From a) to c), the PVME weight fraction increases from 5 w-% to20 w-% and 50w-%. Solid lines are a guide to the eye. The data points are the integralvalues of the composition averaged over the sampling depth. The dotted lines give thepredicted concentration profile2. Reprinted with permission from Q.S. Bhatia, D.H.Pan, and J.T. Koberstein, Macromolecules 1988, 21, 2166–2175. Copyright 1988,American Chemical Society.
odal decomposition and could well explain the morphology that was observed in ourexperiments (shown in Fig.[4.1]). According to these studies, surface-directed spin-odal decomposition was suppressed in polystyrene and poly(vinyl methyl ether) blendfilms with a thickness below 200–1500 nm23, where the limiting thickness depends onthe blend composition. Surface-directed spinodal decomposition, the development ofcomposition waves normal to the surface, is induced by the preferential surface segre-gation of one component in a thin blend film with a near-critical blend composition.For films thinner than the wavelength of the surface directed waves, surface-directedspinodal decomposition is suppressed and lateral phase separation occurs instead7.
It should be remarked that the domains of the blend components in an undulatingand phase separating film are revealed, for instance, by AFM, but not by opticalmicroscopy. In this section, the mechanism leading to film destabilization is describedat the hand of other studies of blend films, for instance those by Morariu12, Karim9
and Wang20. While the suspected mechanism that leads to structure formation isdescribed in this chapter, it is the aim of this study to focus on the replication ofa confining topography, as it is observed with optical microscopy and atomic forcemicroscopy.
Using blends of PS (Mw = 32 kg/mol) and PVME (Mw = 52 kg/mol) in variouscompositions, Morariu12 studied the wavelength selection of an instability that formedin thin blend films. These instabilities spontaneously developed at temperatures above
6
Chapter 4
the glass transition temperatures and showed a clear relation with composition andfilm thickness during the early stages of their development. The temperature waskept below the critical temperature (LCST) of ≈ 40◦C at which phase separation forthese blends took place.
In the mixed liquid state, below the critical temperature, composition fluctuationsoccurred in the bulk as well as at the surface. Similar to the case of van der Waalsinduced spontaneous dewetting, a single characteristic wavelength dominated the de-velopment of the instability. This indicated that the film ruptured via a capillaryinstability.
Shifting the composition to smaller or larger volume fractions of PVME, relativeto a 50:50 blend composition, resulted in an increase in wavelength λ. This shift wasexplained in terms of composition fluctuation arguments. The volume fraction of thePVME varies from φs at surface to φb in the bulk, an assumption that is supported byprevious studies on PS/PVME blends. As mentioned above, these describe a surfaceexcess of PVME and a rapid decay of the surface composition of PVME in the firstfew nm of the film.
The composition fluctuations at the surface induced lateral surface tension varia-tions leading to a Marangoni flow instability. The extent of these variations weredescribed to depend on the volume fraction of the PVME at the surface and in thebulk. The wavelength data12 for constant film thickness (190 nm) showed wavelengthsof (estimated) 5.8, 5, 5.2, and 6.3µm, where the PVME fraction was increased from20 to 40, 60 and 80 w-%.
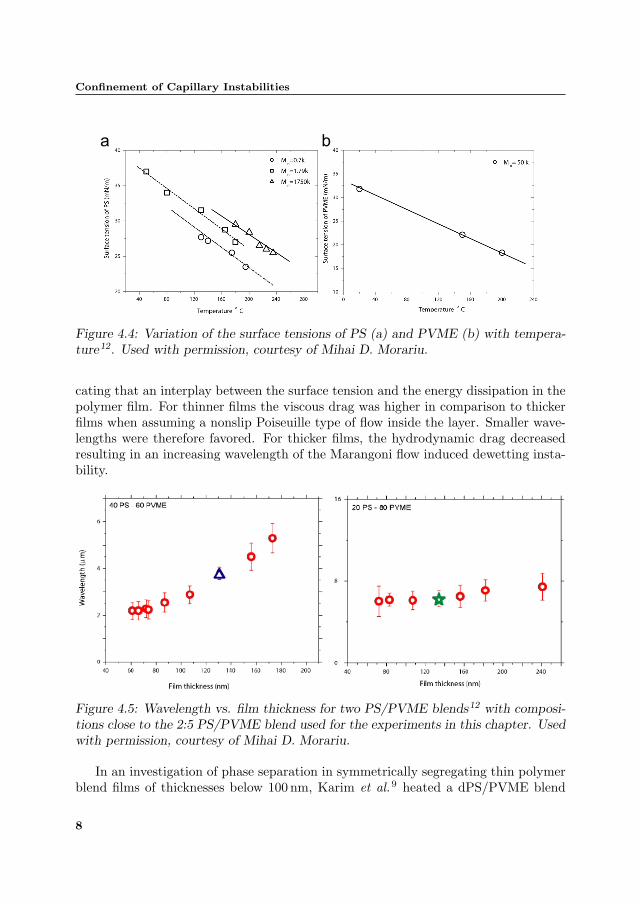
It should be noted that the Marangoni effect that led to film destabilization inthese experiments is not the same as the process known as Marangoni convection. Asurface tension gradient along a fluid-fluid interface is known to give rise to strongconvective effects6,16. Such gradients may occur in pure liquids when a temperatureinhomogeneity exists in the system. A thermal Marangoni effect generates a surfacefluid motion towards decreasing surface tension, due to the surface tension variationwith temperature16 (Fig.[4.4]). In thin polymer films with a high viscosity, however,convection does not take place. The gradients in interfacial tension that led to a netmass transport in lateral direction and the related instability described by Morariuwas generated by composition fluctuations. Also in this type of Marangoni instability,the material flow is directed towards decreasing surface tensions.
The characteristic wavelength of the instability showed a minimum at a 50:50blend composition. It was argued that the driving force for a 50:50 PS:PVME blendis larger than for other compositions due to a lower PVME enrichment for thosecompositions. However, it is visible in Fig.[4.3] that an increasing enrichment wasmeasured for increasing bulk PVME weight fractions2. What is striking is that thesurface excess decreased the most for the 50:50 PS:PVME blend and may well accountfor the wavelength selection observed by Morariu.
A relation between the wavelength and the film thickness was also observed, indi-
7
Confinement of Capillary Instabilities
Figure 4.4: Variation of the surface tensions of PS (a) and PVME (b) with tempera-ture12. Used with permission, courtesy of Mihai D. Morariu.
cating that an interplay between the surface tension and the energy dissipation in thepolymer film. For thinner films the viscous drag was higher in comparison to thickerfilms when assuming a nonslip Poiseuille type of flow inside the layer. Smaller wave-lengths were therefore favored. For thicker films, the hydrodynamic drag decreasedresulting in an increasing wavelength of the Marangoni flow induced dewetting insta-bility.
Figure 4.5: Wavelength vs. film thickness for two PS/PVME blends12 with composi-tions close to the 2:5 PS/PVME blend used for the experiments in this chapter. Usedwith permission, courtesy of Mihai D. Morariu.
In an investigation of phase separation in symmetrically segregating thin polymerblend films of thicknesses below 100 nm, Karim et al.9 heated a dPS/PVME blend
8
Chapter 4
film to 130 and 170 ◦C (deuterated PS: 443 kg/mol, PVME: 84 kg/mol in a 3:7 volumeratio). It was found that films less than 250 nm were thin enough to suppress thedevelopment of surface-directed spinodal decomposition waves. Their measurementsconfirmed that PVME segregates at the surface, most likely because of the lowersurface tension and higher mobility for PVME (the viscosity for PVME is severalorders of magnitude lower than for of PS8). At a temperature of 170 ◦C, well abovethe LCST, the film developed micron sized droplets. At 130 ◦C, the film remained flatfor a period of at least 120 min. The morphology of the destabilizing film at 170 ◦Cwas described to have the appearance of a pattern obtained from a blend undergoingspinodal decomposition in the bulk. The undulations of the film surface were causedby variations of the interfacial tension in the plane of the film arising from phaseseparation. From the experimental observations and a positive spreading coefficient,they concluded that dPS is encapsulated in the phase separated film by PVME (seealso Fig.[4.6]). The spreading coefficient S is defined as S = γb,s − γa,s − γp > 0,where γa,s and γb,s are the pure component surface tensions (PS: 30 dyn/cm, PVME:21 dyn/cm), and γp (≈ 1 dyn/cm) is the polymer/polymer interfacial tension.
The phase evolution in thin films is complex, as it shows an interplay between(de)wetting, wetting, phase separation and capillary instabilities related to compo-sition fluctuations. Wang et al.20 described the evolution of a 495 nm thick dP-MMA/SAN (deuterated poly(methyl methacrylate) and poly(styrene-ran-acrylonitrile))blend film by 3 stages, namely 1) trilayer structuring (symmetric surface enrichment),2) interphase coarsening and redistribution of material and 3) surface (de)wetting androughening. The term surface roughening refers to the process that bears resemblanceto dewetting and is often used to avoid confusion with a pure dewetting mechanism.It is interesting to note that in Fig.[4.1], a thin PVME layer remained on the siliconsubstrate while the rest of the film retracted into droplets by a dewetting mechanism.At the time dewetting of the polymer blend film occurred, PVME covered the sub-strate. PVME is the low viscosity component that acted as the liquid substrate4,11,14
and reduced the time scale of the process that led to the retraction of the polymerblend film.
In the early stage of film destabilization, as presented by Wang et al., the lowersurface tension component segregates to the interfaces. The intermediate layer (calledthe bulk phase) initially has a homogeneous composition. During phase separationof the intermediate layer, a pressure gradient along the film plane is produced dueto composition variations. The wetting component (in their case dPMMA, in ourcase PVME) flows from this layer towards the surface and causes the perforation ofthe intermediate layer. Capillary fluctuations start to develop in the film that leadto a further redistribution of polymer material. Once the amplitude of the capillaryfluctuations is equal to the thickness of the intermediate film, the film ruptures andall the material is accumulated into large and isolated droplets. We have observedthat the surface segregated PVME layer allows the droplets to merge via an Ostwald-
9

Confinement of Capillary Instabilities
ripening mechanism, as shown in Fig.[4.1]. Once the PVME film has withdrawn fromthe silicon substrate (in f), a final morphology is observed that resembles the patternsobserved for dewetting of homopolymer films.
Figure 4.6: Schematic drawings (a,b) and optical microscopy images (c,d) showingthe onset of the film instabilities of a 110 nm thick PS/PVME film that was heatedto 170 ◦C for 60 s.
Fig.[4.6] shows the morphology of a PS/PVME blend film upon heating for 60seconds at 170 ◦C. At room temperature, after spin-coating of the film, the film is flatand the components are miscible. Upon heating to a temperature in the two phaseregion (above the LCST), the film macrophase separates (b). The schematic drawingof the film morphology in b) is based on the mechanism of film destabilization byKamir and Wang. The wetting component, PVME, has encapsulated PS that has ahigher surface tension. Part of the film was covered by a second silicon wafer thatwas mounted on top with the highly polished side facing down. In c), the distancebetween the two silicon wafers d was 308 nm. In d), the morphology of the film witha free polymer/air interface is shown. The undulatory character of the structures isdue to a spontaneous surface instability in both cases (confined and unconfined). Thelarger amplitude and wavelength of the surface undulation in c) indicates an earlieronset of the instability, as compared to part d), presumably due to differing initialheating rates when placing the sample in the oven. When the sample was put intothe oven, both confining plates were brought into contact with metal pieces that werepreheated to 170 ◦C, whereas the unconfined film was brought into good thermalcontact only on the substrate side.
10

Chapter 4
Also of influence is the van der Waals disjoining pressure that is slightly increasedby the confinement. It is expected that with increasing confinement, the change indisjoining pressure increases. For our sample geometry for Fig.[4.6], d � 3h, thechange in disjoining pressure is estimated at a few percent and therefore does notsignificantly affect the rupture time and the instability wavelength.
The schematic drawing in b) assumes that film destabilization of our experimentscorresponds to the mechanism described by Wang et al. and Karim et al. Thefilm thickness, the polymers, the ratio in the molecular weights of PS and PVMEand the annealing temperature in our study were most comparable to those used byKarim et al. It is therefore assumed that our polymer blend films destabilized byphase separation in the absence of surface-directed spinodal decomposition, resultingin an increased surface roughness. These film thickness fluctuations are assumed tooriginate from variations in the interfacial tension in the plane of the film arising fromphase separation. In the following part of the chapter, film destabilization and surfaceroughening is used to reproduce micron-sized patterns.
4.6 Experimental
Our experimental system consisted of polymer films confined between two siliconplates. In Fig.[4.6], the upper plate is flat, but also top plates with design topographicpatterns were used. The polymer films were spin-cast from a mixture (2:5 by weight)of polystyrene (PS; molecular weight, Mw = 106 kg/mol, Pd = 1.03 and poly(vinylmethyl ether) (PVME; Mw = 33 kg/mol, Pd = 1.15) in toluene (2–5% by weight)onto silicon wafers, resulting in film thicknesses ranging from 60 to 300 nm. Prior tofilm deposition, all surfaces were cleaned in a jet of CO2 expanded through a smallnozzle (snow-jet). Dewetting was initiated by annealing the film in an oven at 170 ◦Cfor times ranging from 1min up to 1 h. The films were analyzed by optical microscopy(Olympus BX60) and atomic force microscopy (AFM, Veeco Dimension 3100) afterquenching the samples to room temperature and removing the confining surface.
The confining (top) surfaces were covered with a self-assembled alkane monolayerof octadecyltrichlorosilane (OTS) by a process called silanization (Chapter 3). Thesemolecules with apolar tails formed a dense brush that was covalently bonded to thesilicon substrate. A low-energy (apolar) confining surface was obtained that provideda non-wetting polymer/surface system. Polymer structures that make contact withthis surface have a high contact angle and do not spread.
4.7 Pattern Formation by Confined Dewetting
The schematic drawing in Fig.[4.7] shows the experimental setup. While in a) andb), the confining wafer is flat, in c-f), a topographically structured silicon wafer wasused. The template pattern consists of 200 µm×200 µm patches with lines, square andhexagonally shaped pillars, and grid patterns with square and hexagonally shaped
11

Confinement of Capillary Instabilities
holes. Our experimental observations are subdevided in 3 regimes that are indicatedby Fig.[4.7]c), d) and e).
For a flat confining surface, the initial spontaneous capillary instability in Fig.[4.7]a)leads to the formation of capillary bridges in b) by the above described mechanism.In c-f), in the presence of the laterally varying confinement (from d′ to d), the liquidmorphologies are organized by the ratio of the plate spacing d′ and the initial filmthickness h. In Fig.[4.7]c), for d′ < h, the template is pressed into the polymer film.The pattern assumed by the film is the inverse of the template topography and iscalled a negative replica. The technique is often called hot embossing, or when rub-ber templates are used, micro-moulding. In d), for d′ � h, the film destabilizes andis accumulated into droplets. If these droplets reach the top surface, they reproducethe confining topography. In Fig.[4.7]e), the template is perfectly reproduced by theindividual structures (positive replicae). In f), the individual structures in e) havecoarsened and resemble c) (negative replica).
Figure 4.7: Schematic representation of the sample setup and the liquid morphologiesin a confined geometry.
Film destabilization leads to the formation of droplets when the plates are sepa-
12

Chapter 4
rated at a large distance (d′ � h). In the late stages of structure formation, dropletswith a diameter of tens of microns have formed with a height of 1.4µm (multipleinterference fringes). Once all the polymer material is accumulated in the droplets,the droplets contract, driven by the surface tension that minimizes the interactionsbetween the polymer and the silicon surface. In Fig.[4.8] several examples are shownthat formed in a 272 nm PS/PVME blend film that was annealed for 30min (h/d ≈ 5).In a), a droplet had formed underneath a flat portion of the confining surface. Con-traction of the droplet led to forced spreading along the top surface, hence its flat andfeatureless appearance. From b) to e), the template topography consisted of lines (b),square (c) pillars, hexagonal pillars (d) and a grid pattern with hexagonally shapedholes (e). Before or during contraction of the droplets, the top of the droplets madecontact with the template surface. Further contraction caused a partial filling of thefeatures of the template structure, leading to negative replica of the template. Theamount of filling of the confining pattern depends on the surface energy of the topwafer. Because an apolar confining surface was used, the pattern was only partiallyfilled. Capillary forces would, on the other hand, completely fill a high-surface energypattern.
Figure 4.8: Film destabilization in a wide slit allows the formation of micron sizeddroplets. Here, droplets with a height of 1.4µm and a diameter of ≈ 25 µm formedunderneath a patterned surface. In the final stages of droplet formation, the dropletcontracts in order to assume the contact angle defined by Young’s Law. If beforeor during this contraction the droplets reaches the top surface, polymer materialpartially filled the features of the patterned surface.
Reducing the plate spacing further confines destabilization of the film. The film
13

Confinement of Capillary Instabilities
is unable to break-up into large droplets, as in Fig.[4.8], and make contact to theconfining top plate by capillary bridges in an earlier stage of film destabilization. Inan extreme case, the plate spacing is smaller than the film thickness. This regimeof pattern formation is called hot embossing and leads to a negative reproductionof the template surface (Fig.[4.9]c)). In a) and b), a schematic drawing and opticalmicroscopy image of the master structure are superimposed on the optical micrographof the sample surface. The master structure consists of 24 protruding lines and 25grooves where d − d′ ≈ 450 nm. In c), 25 lines with a width and spacing of 2µm hadformed by hot embossing in an ≈100 nm film that was annealed for 1 h.
In the intermediate regime, for 1 < d′/h � x, the protruding surface area isperfectly replicated. The parameter x follows from volume conservation and is givenby
S =�p�0
(4.1)
h
d= S (4.2)
x =1S
(4.3)
where length � represents the surface area in a 2D schematic drawing.An example of this regime is given in Fig.[4.9]f). Rather than filling the 25 grooves ofthe confining surface (Fig.[4.9]c)), the 24 protruding lines were replicated by a 85 nmfilm that was annealed for 29 min. Pinning of the film thickness undulations to theprotruding lines led to the formation of isolated capillary bridges that replicated thetemplate pattern. The absence of an interconnecting layer and a reduction in mobilityof the structures because of the pinning to the line grid prevented further destabiliza-tion of the pattern. Lateral coarsening, via a process that resembles Ostwald ripening,was for this morphology not possible. The capillary bridges span from the substrateto the confining surface over a distance of 120 nm (d′/h ≈ 1.4, S = 0.5, x = 2). In thenon-patterned areas, the polymer has coalesced into wide plugs (corresponding to theschematic drawing in Fig.[4.7]b)).
The difference between this mechanism and embossing can clearly be seen bycomparing Fig.[4.9]c) and Fig.[4.9]f). In both cases, the same confining surface wasused, resulting in 25 lines in Fig.[4.9]c) (i.e., a negative replica of the confining pattern)versus 24 lines in Fig.[4.9]f) (positive replica).
Another example is shown in Fig.[4.10] where a grid pattern with hexagonallyshaped holes (c) was replicated into a 63 nm film (t =1h, d′=225 nm, d′/h=3.6,1/S = 1.5). An atomic force microscopy (AFM) image of the polymer morphology isshown in b). Insufficient polymer material was available to reproduce the templatetopography accurately. This is indicated by mismatch in the plate spacing to filmthickness ratio d′/h and the value for x = 1/S. Compared to Fig.[4.9]f), the plate
14

Chapter 4
Figure 4.9: Pattern replication by confining a capillary instability. Two replicationmodes that are possible with our experimental set-up are shown in a-c) and d-f). Ford′ < h, the template is pushed into the polymer film (a-c). The polymer film is forcedinto the template and produces a negative replica of the template. This process isknown as hot embossing. In d-f), for d′ > h, a positive replica is obtained. Duringfilm destabilization, the thickness fluctuations are pinned to the protruding templatestructure. Rendering the top surface apolar suppresses a lateral coarsening of thestructure. Within the time frame of the experiment, f) corresponds to a metastablestate of the replicated pattern.
spacing is larger by almost a factor 2 and the film was thinner. Contact with thetop plate was made in a later stage of film destabilization. As a result, the polymerdroplets that made contact to the top surface are expected to be larger as a result oflateral coarsening. This should lead to isolated patches that replicated the top surface.On the contrary, a rather precise reproduction is obtained (b), albeit on a smallersurface area. The completion of pattern replication here reveals the importance oflateral coarsening and wetting along a laterally continuous template surface. Thisis enhanced by the PVME layer that wets the silicon substrate during the initial tointermediate stages of film destabilization.
A more extreme case of lateral coarsening is shown in Fig.[4.11]. The destabiliza-tion of the film has developed several large polymer structures. A single flatteneddroplet had formed at the expense of nearby smaller droplets. Underneath a struc-tured part of the confining surface, a similar structure had developed. The film clearlyassumed a shape with an inverse topography. The topography consisted of hexagonalpillars that are spaced apart ≈ 1.6 µm (shown in the inset). The initial film thick-ness was 103 nm, the plate spacing was 440 nm (d′/h = 4.3) and the annealing timewas 8 min. Insufficient material was available to reproduce the template topographyaccurately. While the experimental circumstances indicate a mismatch in d′/h and1/S (=3), similar to Fig.[4.10], and Fig.[4.8], a partial negative replica has developed,
15

Confinement of Capillary Instabilities
Figure 4.10: Pattern replication of a silicon matrix with hexagonally shaped holes.The imperfect replication of the hexagonal pattern of holes that developed in a 63 nmfilm is shown in a). The plate spacing is 225 nm (d/h =3.6) and the film was annealedat 170 ◦C for 1 h. In b) and c), respectively, the AFM scans of the polymer film andthe master are shown.
instead of isolated droplets or a partial positive replica. Lateral coarsening, wettingof the flat regions of the top surface, and filling of the template topography indicatea high surface energy of the confining surface. The filling of the high surface energytemplate topography is known as capillary filling and is a well-known alternativestructure replication technique19,21. The reason for the higher surface energy in ourexperiments is the degradation of the self-assembled monolayer. Multiple cleaningprocedures of the silicon master that was covered with an OTS monolayer leads todeterioration of the monolayer, resulting in a higher surface energy.
The apolar nature of the confining surface (as in Fig.[4.10]) is thus essential toobtain a positive replication of the patterned surface. Highly apolar surfaces aretypically not wetted by any liquid because the wetting of the surface by the liquid doesnot reduce its effective surface energy. Rough (or corrugated) apolar surfaces repelany type of surface coverage to an even larger extent. Such low-energy corrugatedsurfaces are often called super-hydrophobic and are one of the approaches to self-cleaning surfaces, as described in Chapter 3. Following the topography of a patternedor rough surface is energetically unfavorable and the lowest free-energy shape thata liquid can assume is a droplet with a contact angle near 180 ◦ 3. If, on the otherhand, the surface has a high interfacial free energy, roughness promotes wetting, and
16

Chapter 4
Figure 4.11: Capillary filling of the patterned top surface resulted in a negative replicaof the template topography. The initial film thickness, the plate spacing and theannealing time are 103 nm, 440 nm and 8min, respectively. The inset shows an AFMimage of the confining surface.
the liquid preferentially fills any corrugation or surface pattern, as is the case forFig.[4.11].
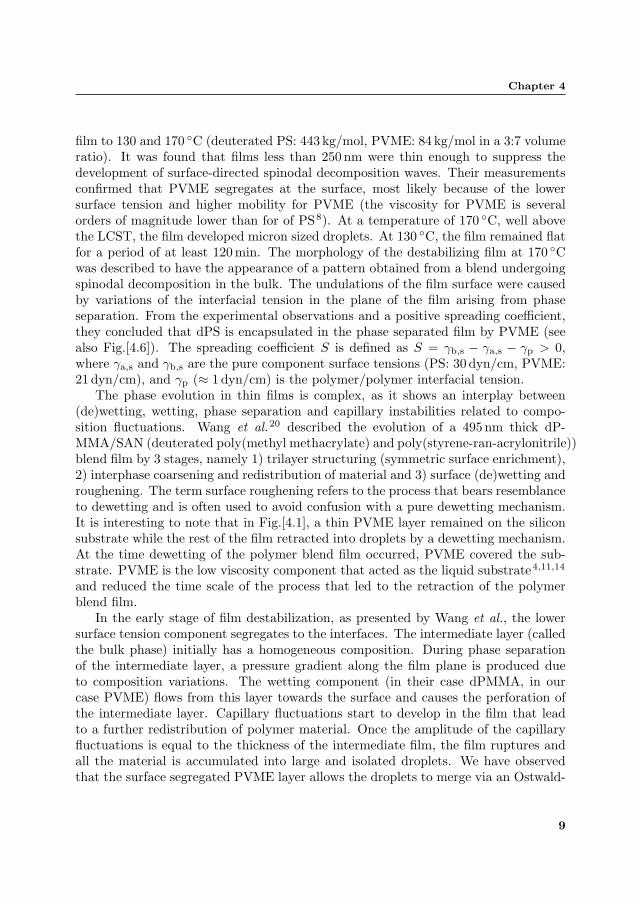
When the majority of the confining surface is rendered apolar, but imperfectionsin the grafting density exist, an initially positive replica reduces its overall surfaceenergy by contracting and filling of the master structure. Fig.[4.12] shows a positivereplica of a silicon matrix with hexagonal holes in a) and the positive line replica thatwas previously shown in Fig.[4.9]d)–f). In the latter case, d′/h and 1/S are appro-ximately equal, with slightly more material than necessary to perfectly replicate thetemplate. Most of the line pattern was faithfully replicated within 29 min. The abun-dance in material led to incidental capillary filling of the master, as indicated by thearrows, but a large scale filling transition remained absent. In a), a film morphologyconsisting of fragmented replication patches, developed in a 110 nm film at a platespacing d′=275 nm (d′/h=2.5, 1/S=1.5) within 12min of annealing at 170 ◦C. Unlike
17
Confinement of Capillary Instabilities
Figure 4.12: (a) Imperfect replication of a hexagonal pattern of holes (d = 275 nm,d/h =2.5, h = 110 nm, t = 12 min). In some of the smaller replicated areas, thepolymer has filled the hole pattern (marked by arrows), which still persists on theremaining parts of the sample. (b) Overfilling of the pattern in another region of thereplica shown in Fig.[4.9] reveals the formation of a plug between the lines.
Fig.[4.10], where a single patch replicated the master topography in 1 h (h = 63 nm,d′=225 nm, d′/h=3.6), here, multiple isolated patches had formed. The formation of asingle patch or multiple patches is affected by several circumstances. 1) The thicknessundulations that lead to film rupture have a range of wavelengths (see Fig.[4.6]c)).This range increases when lateral coarsening sets in. Bridges formed by pinning ofrelatively nearby undulations form a single replication patch by wetting of the tem-plate. A laterally (bi)continuous template allows wetting in all directions and thusthe completion of the pattern replication process. For isolated template structures,a filling transition is more likely to occur as the material is unable to spread in alldirections. 2) the process in 1) is vulnerable to imperfections in the apolar mono-layer. An apolar liquid is unable to reduce its surface energy by spreading along a lowenergy surface. A homogeneous and dense monolayer suppresses a filling transitionand thereby promotes the formation of large replication areas. For imperfect mono-layers, the capillary filling prevents the formation of larger replication patches. 3)Coarsening to form a single patch is also a matter of time. This is, however, only pos-sible as long as the PVME wetting layer is intact. The existence of multiple patchesin Fig.[4.12] is likely caused by a combination of the above mentioned circumstances.If spreading is halted by capillary filling or the rupturing of the PVME wetting layer,the patches are unable to coarsen. As multiple smaller structures are energeticallyless favorable than a single larger structure, these smaller replication patches show ahigher degree of capillary filling (arrows in a).
18
Chapter 4
4.8 Conclusion
Film destabilization of PS/PVME blend is likely to proceed by a complex combinationof instabilities. In the initial stage, a PS/PVME blend segregates to the air surfaceand to the substrate/polymer interface. The blend films were heated to a temperatureabove the lower critical solution temperature and the blend was well into the two phaseregion. We observed that the polymer blend films destabilized by undulations at thepolymer/air interface. These undulations are assumed to originate from variationsin the interfacial tension in the plane of the film, arising from phase separation.The interfacial tension gradients in the blend films led to the accumulation of theminority blend component, polystyrene, in droplets within the film, resulting in anincrease in surface roughness. In a confined geometry with a patterned top surface,surface roughening in PS/PVME blend films led to the reproduction of the patternedsurface. Surface roughening by spontaneous or nucleated dewetting in unstable ormetastable homopolymer films, respectively, is expected to result in a similar patternreplication process.
Film destabilization in a patterned confinement shows a rich variation of repli-cation mechanisms. While the well-known embossing and capillary filling techniquesresult in a negative replica of a surface pattern, a novel phenomenon is observed for aconfinement with d ≥ h. In this case, metastable liquid morphologies are formed bythe interplay of dewetting and capillary bridging. The lateral formation of the capil-lary bridges can be controlled and directed using a patterned confining surface. This,combined with the pinning of a large number of contact lines, leads to a long-lived,metastable positive replica of the confining surface.
Interestingly, a single experimental system consisting of a polymer film and atopographically patterned plate can be used in three different ways in a replicationtechnique: (1) embossing, (2) capillary filling, and (3) capillary bridging, with (1)and (2) resulting in negative replica and (3) resulting in a positive replication process.The combination of these three techniques exhibits a versatility not normally foundin similar pattern-replication processes.
19

Bibliography
Bibliography
1. D.G.A.L. Aarts, M. Schmidt, and H.N.W. Lekkerkerker,Science, 2004, 304, 847
2. Q.S. Bhatia, D.H. Pan, and J.T. Koberstein,Macromolecules, 1988, 21, 2166
3. R. Blossey,Nat. Mater., 2002, 2, 301
4. F. Brochard-Wyart, P. Martin, and C. Redon,Langmuir, 1993, 12, 3682
5. J.M.G. Cowie, B.G. Devlin, and I.J. McEwen,Polymer, 1993, 34, 501
6. M.C. Cross, and P.C. Hohenberg,Rev. Mod. Phys., 1993, 65 (3), 851
7. B.D. Ermi, A. Karim, and J.F. Douglas,J. Polym. Sci.: Part B: Polym. Phys., 1998, 36, 191
8. P.F. Green, D.B. Adolf, and L.R. Gilliom,Macromolecules, 1991, 24, 3377
9. A. Karim, T.M. Slawecki, S.K. Kumar, J.F. Douglas, S.K. Satija, C.C. Han, T.P. Russell, Y. Liu, R. Overney, J. Sokolov, and M.H. Rafailovich,Macromolecules, 1998, 31, 857
10. J.K. Kim, H.H. Lee, and H.W. Son,Macromolecules, 1998, 31, 8566
11. G. Krausch,J. Phys.: Condens. Matter, 1997, 9, 7741
12. M.D. Morariu,Dissertation, 2004, University of Groningen, The Netherlands
13. D.H. Pan, and M.W. Prest, Jr.,J. Appl. Phys., 1988, 58, 2861
14. S. Qu, C.J. Clarke, Y. Liu, M.H. Rafailovich, J. Sokolov, K.C. Phelan, and G.KrauschMacromolecules, 1997, 30, 3640
20

Chapter 4
15. T.P. Russell,Ann. Rev. Mat. Sci., 1991, 21, 249
16. C. de Saedeleer, A. Garcimartin, G. Chavepeyer, and J.K. Platten,Phys. Fluids, 1996, 8, 670
17. E. Schaffer,Dissertation, 2001, University of Konstanz
18. T. Shiomi, K. Hamada, T. Nasako, K. Yoneda, K. Imai, and A. Nakajima,Macromolecules, 1990, 23, 229
19. K.Y. Suh, and H.H. Lee,Adv. Funct. Mater., 2002, 12, 405
20. H. Wang, and R.J. Composto,J. Chem. Phys., 2000, 113, 10386Europhys. Lett., 2000, 50, 622
21. Y. Xia, J.A. Rogers, K.E. Paul, and G.M. Whitesides,Chem. Rev., 1999, 99, 1823
22. R. Yerushalmi-Rozen, T. Kerle, and J. Klein,Science, 1999, 285, 1254
23. K. Yurekli, A. Karim, E.J. Amis, and R. Krishnamoorti,Macromolecules, 2003, 36, 7256
21