university of california santa barbara improving …
TRANSCRIPT
UNIVERSITY OF CALIFORNIA
Santa Barbara
Improving Electron Paramagnetic Resonance Spectroscopy at 240 GHz
A dissertation submitted in partial satisfaction of the
requirements for the degree Bachelor of Science
in Physics
by
Mary Lou Padlan Bailey
Committee in charge:
Professor Mark S. Sherwin, Chair
Professor Elisabeth G. Gwinn
Professor Claudio Campagnari
June 2015

The dissertation of Mary Lou Padlan Bailey is approved.
____________________________________________
Mark S. Sherwin
____________________________________________
Elisabeth G. Gwinn
____________________________________________
Claudio Campagnari
June 2015
iii
Improving Electron Paramagnetic Resonance Spectroscopy at 240 GHz
Copyright © 2015
by
Mary Lou Padlan Bailey
iv
ACKNOWLEDGEMENTS
I would like to thank Dr. Mark Sherwin for his mentorship and for kindly taking me into
the group during my freshman year at UCSB. In addition, I would like to thank the graduate
students who have guided me through my research: Devin Edwards, Jessica Clayton, Blake
Wilson, and Hunter Banks; as well as the undergraduates who worked closely with me on
the absorber project: Andrew Pierce and Aaron Simon. Thank you to Nikolay Agladze, Jerry
Ramian, Guy Patterson, and Dave Enyeart for their help in lab and machine shop. Thank you
to Arica Lubin and Roxanna Van Norman with EUREKA and UC LEADS for the
undergraduate research internship programs and funding. Lastly, thank you to my family for
their support in all of my endeavors.
v
VITA OF MARY LOU PADLAN BAILEY
June 2015
EDUCATION
Bachelor of Science in Physics and Biological Sciences, University of California, Santa
Barbara, June 2015 (expected)
Doctor of Philosophy in Applied Physics, Yale University, June 2020 (expected)
PROFESSIONAL EMPLOYMENT
2012-2015: Undergraduate Researcher, Department of Physics, University of California,
Santa Barbara (through EUREKA and UC LEADS).
August 2013: Resident Assistant for the Summer Institute in Math and Science (SIMS)
Program, Center for Science and Engineering Partnerships, University of California, Santa
Barbara.
Summer 2014: Undergraduate Researcher, Department of Physics, University of California,
Berkeley (through UC LEADS).
August 2014: Resident Assistant for the Summer Institute in Math and Science (SIMS)
Program, Center for Science and Engineering Partnerships, University of California, Santa
Barbara.
Summer 2010, 2013-2014: Computer programmer and document writer, Advanced
Scientific Concepts, Inc.
PUBLICATIONS
Bailey, M. L. P., Pierce, A. T., Simon, A.J., Edwards, D.T., Ramian, G. J., Agladze, N. I., &
Sherwin, M. S. (2015). Narrow-band water-based absorber for terahertz spectroscopy. IEEE
Trans on Terahertz Sci and Tech, submitted.
AWARDS
Honorable mention for poster presentation “Developing High Quailty Absorbers for
Terahertz Spectroscopy” at the 2014 UC LEADS Symposium. University of California,
Riverside, 2014.
First place for poster presentation “Developing High Quailty Absorbers for Terahertz
Spectroscopy” at the 2015 Conference for Undergraduate Women in Physics. University of
California, Santa Cruz, 2015.
Honorable mention for poster presentation “Optical Imaging of Single DNA Molecules” at
the 2015 UC LEADS Symposium. University of California, Merced, 2015.
vi
ABSTRACT
Improving Electron Paramagnetic Resonance Spectroscopy at 240 GHz
by
Mary Lou Padlan Bailey
Electron Paramagnetic Resonance (EPR) spectroscopy investigates unpaired electron
spins in solids and liquids to reveal their local environment; in biology, it reveals critical
structural information of proteins. At UCSB we have developed a high-field EPR
spectrometer that excites and detects spins 100x faster than otherwise possible by using a
Free Electron Laser (FEL) source, which provides high power at the frequencies necessary
for high-field EPR. In EPR experiments, the FEL pulse is directed at a sample, where rapidly
decaying signals emitted by the electron spins are measured by a detector. Since the FEL
pulse travels through open space, some of this light pulse is scattered and reaches our
detector, obscuring the signal from our sample. To realize the full potential of the
spectrometer, it is crucial to minimize scattered light. To do this, we first redesigned the
sample holder to minimize FEL pulse reflections from the detector. This was done by
studying geometry and materials of the holder. New holders were machined in rexolite and
Teflon, in a cone shape and cylindrical shape. The cylindrical shape in rexolite showed the
least FEL reflections. Next, the FEL-pulse slicing delay line was modified to more precisely
control FEL pulse length such that no extra FEL pulse reaches the detector. We automated
the delay-line using two stepper motors with gear reducers that pull a cart carrying optics.
vii
Lastly, we developed new terahertz absorbers to place within the FEL EPR optical setup to
reduce scattered light. Absorbers in the terahertz range exist, but are extremely costly and
bulky. We have successfully designed and fabricated a compact, cost-effective absorber. The
absorber consists of a thin layer of Plexiglas placed over a small volume of water. The
Plexiglas is machined to be a precise thickness, such that it acts as an anti-reflection coating
on the highly-absorbing water. Testing this new absorber with our Vector Network Analyzer
with frequency extenders shows absorption is optimal at 240 GHz, the frequency used for
EPR experiments. Further studies show that using a solution of water and glycerol to tune
the liquid’s index of refraction increases the absorption to a range comparable to that of
absorbers currently available on the market.
viii
TABLE OF CONTENTS
I. Background/Introduction ........................................ Error! Bookmark not defined.
II. Developing Sample Holders for Ultrafast Electron Paramagnetic Resonance…….3
A. Sample Holder Design and Fabrication………………………………..4
1. Design ............................................................................................. .4
2. Fabrication ....................................................................................... 5
B. Testing the Sample Holders with the FEL……………………………..…5
C. Sample Holder Reflection Results……………………………..…………6
D. Sample Holder Final Conclusions…………………………………..……8
III. Developing an innovative Free Electron Laser switch system for EPR studies…..8
A. Improving the Delay Line…………………………..……………..……10
IV. Developing Single Frequency Absorbers for Terahertz Spectroscopy…………12
A. Absorber Design and Fabrication………………………………………… 13
1. Theory………………………………………………………………..13
2. Design………………………………………………………………..15
3. Fabrication…………………………….……………………………..15
B. Absorber Testing with the Vector Network Analyzer……………………...16
C. Absorber Performance ………………………………………………..……16
D. Absorber Conclusions………………………………………………………19
V. Bibliography………………………………………………………………..……21
VI. Appendix ............................................................................................................. 23
1
I. Background/Introduction
Electron Paramagnetic Resonance (EPR) spectroscopy investigates unpaired electron
spins in solids and liquids to reveal their local environment. EPR has many applications in
various fields, including physics, chemistry, materials science, and biology. In biology, EPR
has revealed critical structural information of proteins that have otherwise resisted structural
techniques [1]. For example, EPR played a crucial role in determining the oligomeric
structure of the Proteorhodopsin membrane protein [2]. Membrane proteins are critical for
cell function because they lie at the interface of the inner cell and its environment. In
essence, membrane proteins control the flow of energy and matter between the interior and
exterior of the cell, as well as play an important role in initiating cell signal transduction
pathways. Because membrane proteins lie within the lipid bilayer of the cell, they are
difficult to access and study compared to cytoplasmic proteins. Studying these membrane
proteins in an environment similar to in vivo conditions is a great challenge in biology.
Therefore it is important to develop and improve upon techniques that are capable of
studying these delicate proteins that are integral to life.
At UCSB we have developed a high-field EPR spectrometer capable of exciting and
detecting spins 100x faster than is otherwise possible by using a Free Electron Laser (FEL)
source, which provides high power (approximately 1 kW) at the frequencies necessary for
high-field EPR [3]. The FEL EPR experiments are run at a frequency of 240 GHz, while the
sample sits in a 12.5 Tesla magnet (run at 8.5T). The FEL pulse is directed at a sample in a
sample holder, placed in a waveguide which is then placed into the magnet (see Figure 1).
The FEL pulse travels down the waveguide to the sample. The sample is spin-labeled with
an unpaired electron spin-label. Recent studies in our lab have used the spin-7/2 Gd3+ ion
due to the high EPR line-width resolution it affords [4]. After the FEL pulse hits the sample,

2
rapidly decaying signals emitted by the electron spins are measured by a detector. This
signal, called free induction decay, provides information that can elucidate the structure of
the sample.
Figure 1: Sample placed in waveguide, which is then placed in the 12.5T magnet.
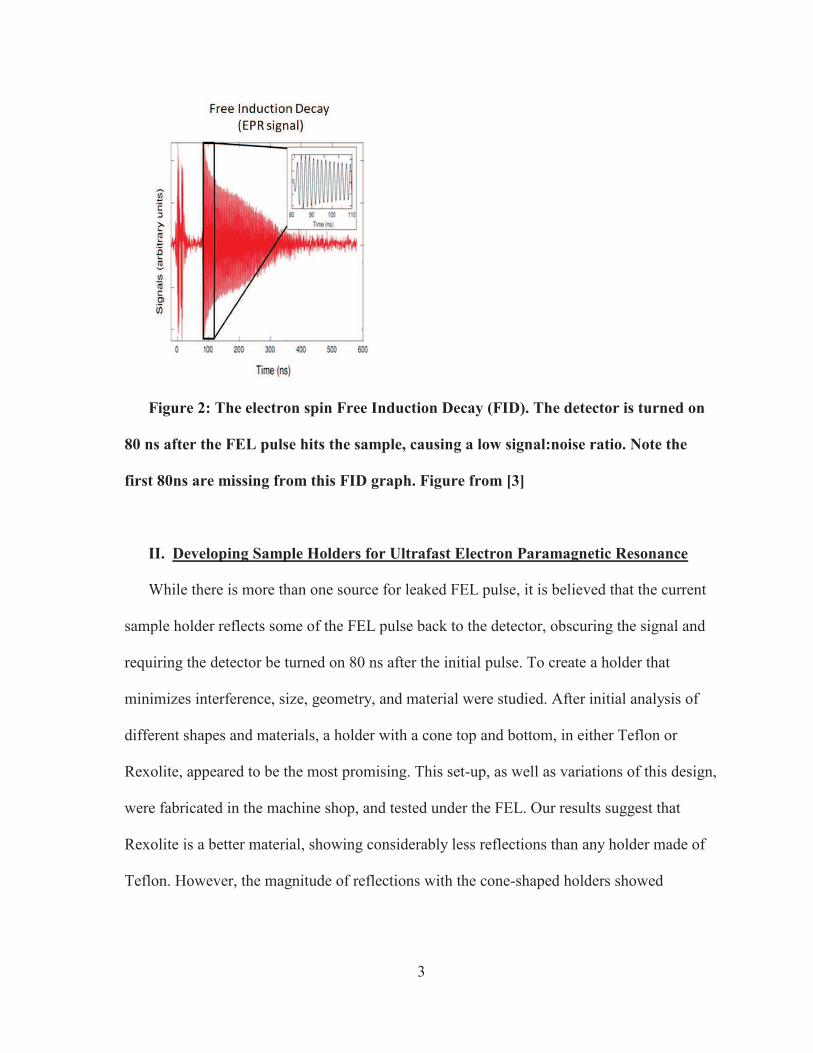
One of the greatest challenges of performing FEL EPR is the amount of scattered FEL
pulse that gets into the detector, obscuring the electron spin signal. This leaked light causes
the detector to be turned on 80 ns after the initial pulse irradiates the sample (see figure 2).
Therefore, a great deal of signal is missing from our data. In order to realize the full potential
of the spectrometer, it is crucial to shorten this time. This thesis aims to reduce this dead-
time through three different projects: improving the current sample holder design, improving
upon the FEL pulse slicer delay-line, and by developing new single frequency light absorbers
to implement within the FEL EPR optical setup.
3
Figure 2: The electron spin Free Induction Decay (FID). The detector is turned on
80 ns after the FEL pulse hits the sample, causing a low signal:noise ratio. Note the
first 80ns are missing from this FID graph. Figure from [3]
II. Developing Sample Holders for Ultrafast Electron Paramagnetic Resonance
While there is more than one source for leaked FEL pulse, it is believed that the current
sample holder reflects some of the FEL pulse back to the detector, obscuring the signal and
requiring the detector be turned on 80 ns after the initial pulse. To create a holder that
minimizes interference, size, geometry, and material were studied. After initial analysis of
different shapes and materials, a holder with a cone top and bottom, in either Teflon or
Rexolite, appeared to be the most promising. This set-up, as well as variations of this design,
were fabricated in the machine shop, and tested under the FEL. Our results suggest that
Rexolite is a better material, showing considerably less reflections than any holder made of
Teflon. However, the magnitude of reflections with the cone-shaped holders showed
4
substantial variations in many tests, making it unclear whether these new shapes offer
reliably improved performance.
A. Sample Holder Design and Fabrication
1. Design
The original sample holder for FEL EPR experiments is a 5mm x 5mm cylindrical
Teflon holder. Because the FEL pulse hits the flat top of the holder at normal incidence
suggests that FEL pulse is reflected back to the detector (thus contributing to the dead-time).
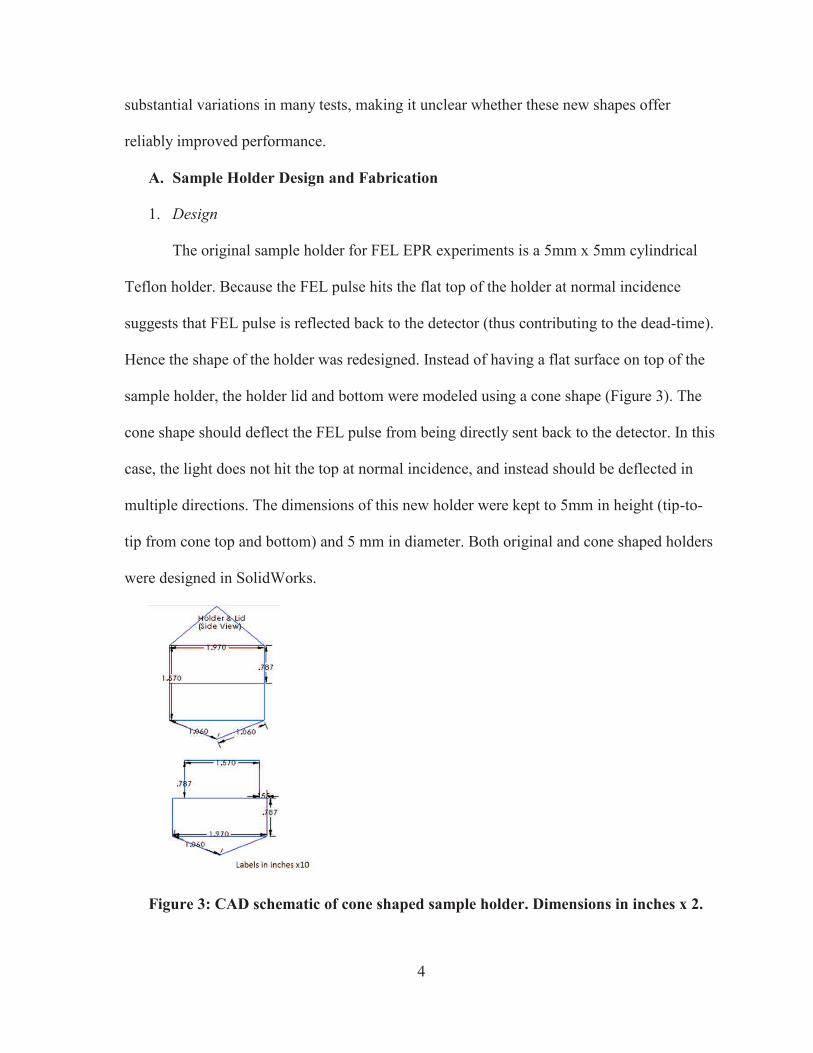
Hence the shape of the holder was redesigned. Instead of having a flat surface on top of the
sample holder, the holder lid and bottom were modeled using a cone shape (Figure 3). The
cone shape should deflect the FEL pulse from being directly sent back to the detector. In this
case, the light does not hit the top at normal incidence, and instead should be deflected in
multiple directions. The dimensions of this new holder were kept to 5mm in height (tip-to-
tip from cone top and bottom) and 5 mm in diameter. Both original and cone shaped holders
were designed in SolidWorks.
Figure 3: CAD schematic of cone shaped sample holder. Dimensions in inches x 2.
5
In addition to shape, the material used for the holders was tested. A new holder was
fabricated using Rexolite, a cross-linked polystyrene plastic. Rexolite sample holders are
widely used in various EPR experiments [5],[6]. Both Rexolite and Teflon have low loss
dielectric constants, making them ideal materials for EPR sample holders [7],[8].
2. Fabrication
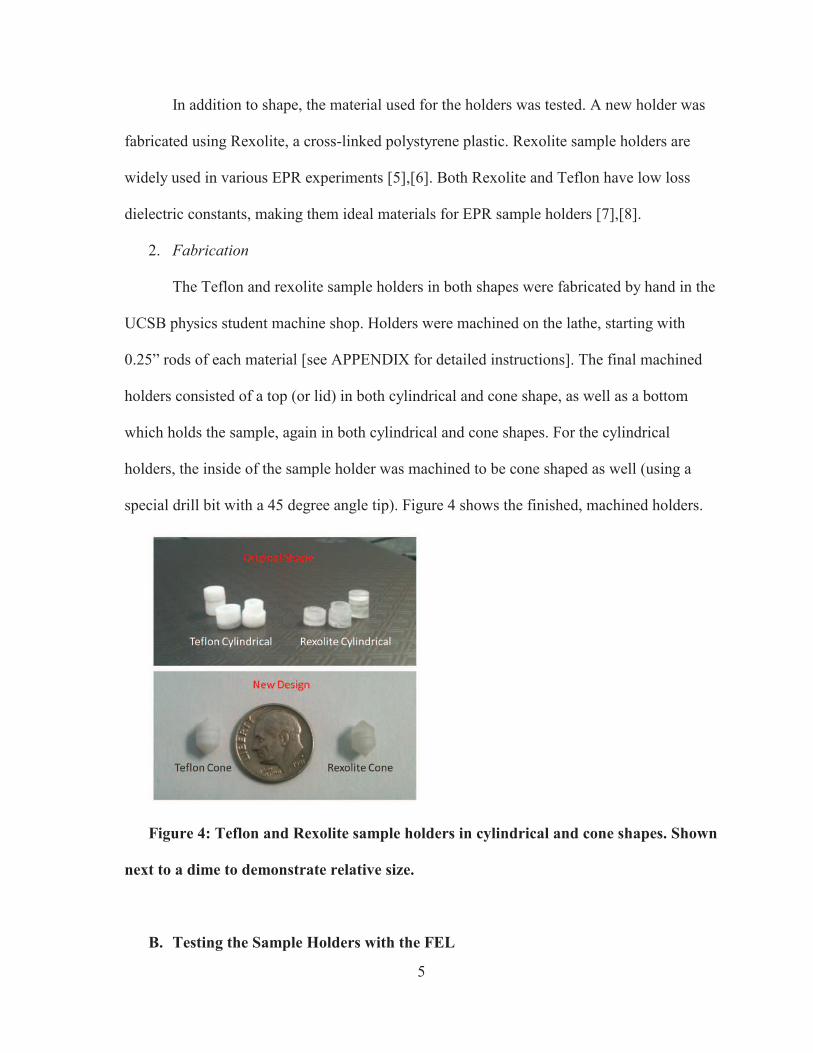
The Teflon and rexolite sample holders in both shapes were fabricated by hand in the
UCSB physics student machine shop. Holders were machined on the lathe, starting with
0.25” rods of each material [see APPENDIX for detailed instructions]. The final machined
holders consisted of a top (or lid) in both cylindrical and cone shape, as well as a bottom
which holds the sample, again in both cylindrical and cone shapes. For the cylindrical
holders, the inside of the sample holder was machined to be cone shaped as well (using a
special drill bit with a 45 degree angle tip). Figure 4 shows the finished, machined holders.
Figure 4: Teflon and Rexolite sample holders in cylindrical and cone shapes. Shown
next to a dime to demonstrate relative size.
B. Testing the Sample Holders with the FEL
6
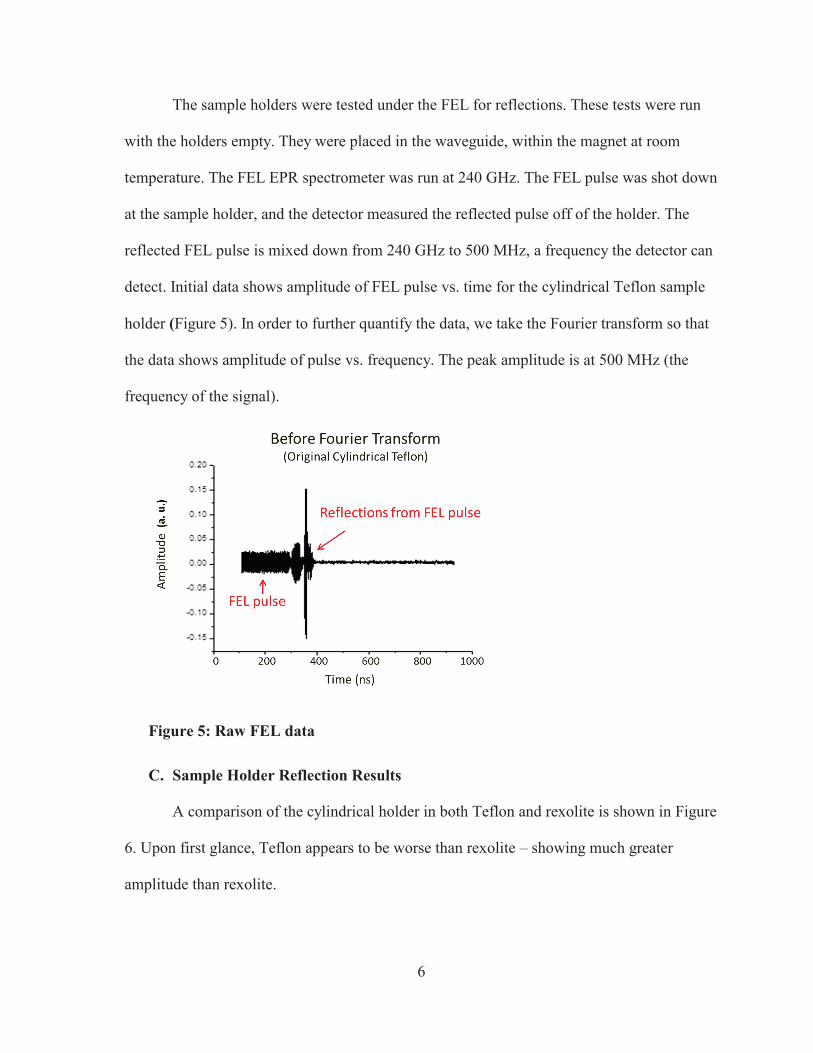
The sample holders were tested under the FEL for reflections. These tests were run
with the holders empty. They were placed in the waveguide, within the magnet at room
temperature. The FEL EPR spectrometer was run at 240 GHz. The FEL pulse was shot down
at the sample holder, and the detector measured the reflected pulse off of the holder. The
reflected FEL pulse is mixed down from 240 GHz to 500 MHz, a frequency the detector can
detect. Initial data shows amplitude of FEL pulse vs. time for the cylindrical Teflon sample
holder (Figure 5). In order to further quantify the data, we take the Fourier transform so that
the data shows amplitude of pulse vs. frequency. The peak amplitude is at 500 MHz (the
frequency of the signal).
Figure 5: Raw FEL data
C. Sample Holder Reflection Results
A comparison of the cylindrical holder in both Teflon and rexolite is shown in Figure
6. Upon first glance, Teflon appears to be worse than rexolite – showing much greater
amplitude than rexolite.

7
Figure 6: Cylindrical Teflon v. Rexolite
A comparison of the reflections from the cone holders in Teflon and rexolite (called
double cone due to the cone top and bottom) are shown in Figure 7. The data shows that
Teflon is somewhat worse than rexolite in cone shape. However, a quick comparison of the
cone amplitudes to the cylindrical suggests the cone shape might reduce reflections.
Figure 7 Teflon v. Rexolite cone
In order to further quantify this data, the peaks for each holder were integrated and
compared. The greater the area under the peaks conveys more reflections. A graph

8
comparing the integrated reflections (Figure 8) shows that the cylindrical rexolite holder
performed the best, giving the least amount of reflections. The Teflon counterpart
(cylindrical) performed the worst, rendering the most reflections. Both double cone holders
performed about the same.
Figure 8 Area under FEL Reflections
D. Sample Holder Final Conclusions
From this project it is determined that the cylindrical rexolite holder performs the
best, while the Teflon cylindrical holder performs the worst. The cone shape did not
minimize the most reflections as initially hypothesized, and further studies would have to be
done to determine whether the geometry is truly beneficial. In sum the sample holder for
FEL EPR experiments remains cylindrical, but rexolite can be adopted for less reflections.
While the change in material can reduce some unwanted reflections that get to the detector,
there are still other sources of leaked light that must be eliminated.
III. Developing an innovative Free Electron Laser switch system for EPR studies
9
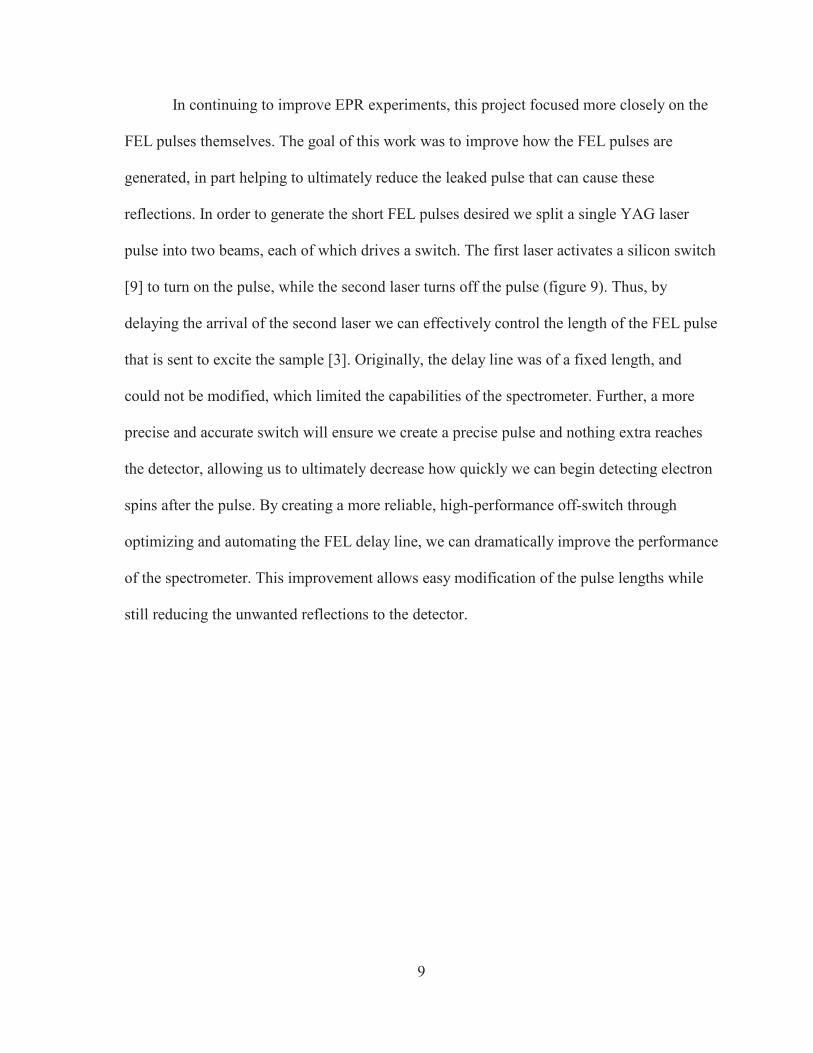
In continuing to improve EPR experiments, this project focused more closely on the
FEL pulses themselves. The goal of this work was to improve how the FEL pulses are
generated, in part helping to ultimately reduce the leaked pulse that can cause these
reflections. In order to generate the short FEL pulses desired we split a single YAG laser
pulse into two beams, each of which drives a switch. The first laser activates a silicon switch
[9] to turn on the pulse, while the second laser turns off the pulse (figure 9). Thus, by
delaying the arrival of the second laser we can effectively control the length of the FEL pulse
that is sent to excite the sample [3]. Originally, the delay line was of a fixed length, and
could not be modified, which limited the capabilities of the spectrometer. Further, a more
precise and accurate switch will ensure we create a precise pulse and nothing extra reaches
the detector, allowing us to ultimately decrease how quickly we can begin detecting electron
spins after the pulse. By creating a more reliable, high-performance off-switch through
optimizing and automating the FEL delay line, we can dramatically improve the performance
of the spectrometer. This improvement allows easy modification of the pulse lengths while
still reducing the unwanted reflections to the detector.
10
Figure 9: FEL EPR experimental set-up. Step 2 shows the laser activated silicon
switches. Original schematic from [3]
B. Improving the Delay Line
To accomplish this goal, I worked on automating a motorized delay line, so that we can
more efficiently and effectively control the length of the FEL pulse. The initial immobile
delay line consisted of a cart carrying an aluminum plate which holds the FEL pulse switch
optics. The cart was held on an optical delay-line track using a rubber belt and one TIMS
stepper motor. Initial attempts to automate the delay line using the original setup revealed
problems in moving the optics cart itself: the single motor was unable to pull the cart. To
mobilize the cart, the optics carrying plate was redesigned. The new aluminum plate was
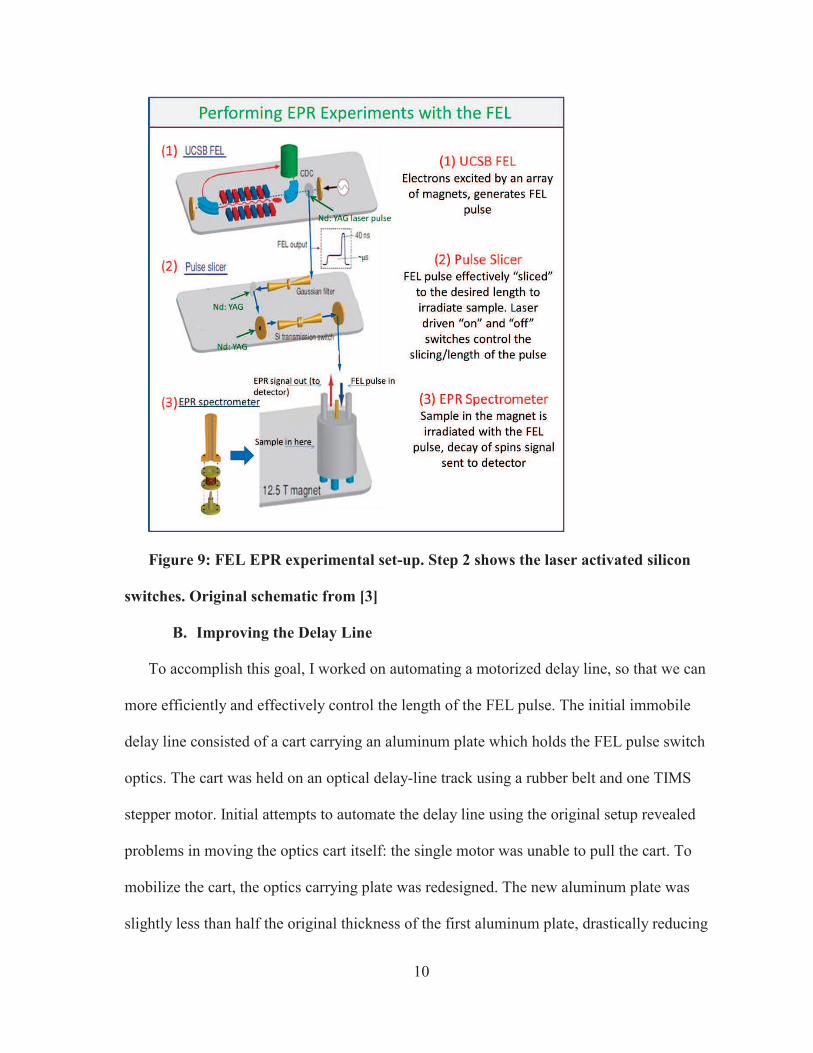
slightly less than half the original thickness of the first aluminum plate, drastically reducing
11
the weight for the motor to pull (figure 10). The plate was fabricated to ensure that all the
original optics could still be mounted securely onto the plate. This new aluminum plate was
first designed in SolidWorks, with evenly spaced 1/4” screw holes included for mounting
purposes. The plate was then fabricated in the UCSB physics student machine shop, using
the mill. In addition to the plate, the motor portion of the delay-line was redesigned. The
single initial stepper motor was repositioned to align with the cart for optimal cart
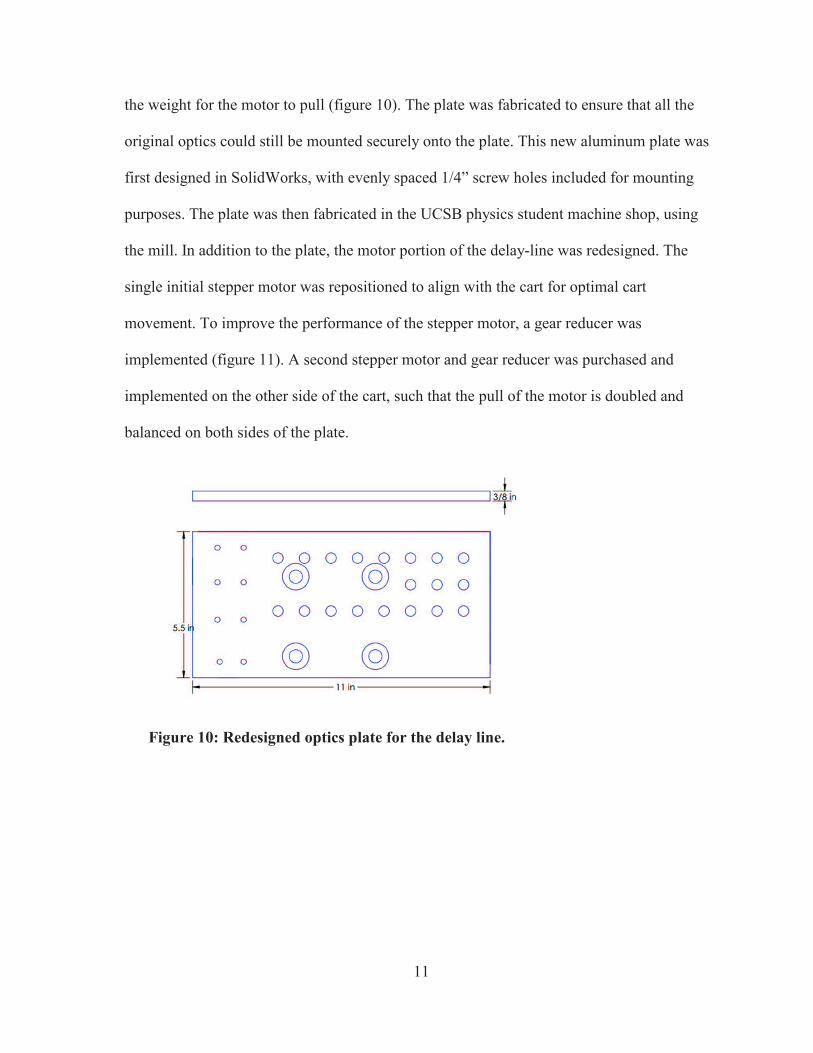
movement. To improve the performance of the stepper motor, a gear reducer was
implemented (figure 11). A second stepper motor and gear reducer was purchased and
implemented on the other side of the cart, such that the pull of the motor is doubled and
balanced on both sides of the plate.
Figure 10: Redesigned optics plate for the delay line.
12
Figure 11: Gear reducer added to the original stepper motor, implemented into the
delay line.
IV. Developing Single Frequency Absorbers for Terahertz Spectroscopy
Currently, light absorbers are implemented in order to more effectively control the
leaked FEL pulse that gets to the detector. Absorbers in the terahertz range exist, but are
extremely costly and bulky. The highest performing absorbers we are aware of are 400 mm
long injection molding cones made of carbon-loaded plastic (figure 12). These absorbers
show about 60-75 dB return loss at 95 GHz [10]. We have successfully designed and
fabricated a compact, cost-effective absorber. The absorber consists of a thin layer of
PMMA (Plexiglas plastic) placed over a small volume of water. The PMMA is machined to
be a precise thickness, such that it acts as an anti-reflection coating on the highly-absorbing
water. The light to be absorbed by the absorbers travels through three mediums – air, the
plastic coating, and water – rendering destructive interference of light reflected off of the
plastic and water’s surfaces (figure 13). The absorber is water-based because water exhibits
a very high absorption coefficient (a = 100 cm-1
) due to Debye relaxation processes [11].
Testing this new absorber with our Vector Network Analyzer with frequency extenders

13
shows absorption is optimal at 240 GHz, the frequency used for EPR experiments. Further
studies show that using a solution of water and glycerol to tune the liquid’s index of
refraction increases the absorption to a range comparable to that of absorbers currently
available on the market. With a precise, small fraction of glycerol in solution, the absorbers
show a power loss of over 60 dB at 240 GHz [12].
Figure 12: Cone-shaped absorbers made by Thomas Keating Co, rendering high
absorption (60-75 dB at 95 GHz). Image from Thomas Keating.
Figure 13: Theoretical desing of the absorber.
A. Absorber Design and Fabrication
1.Theory
14
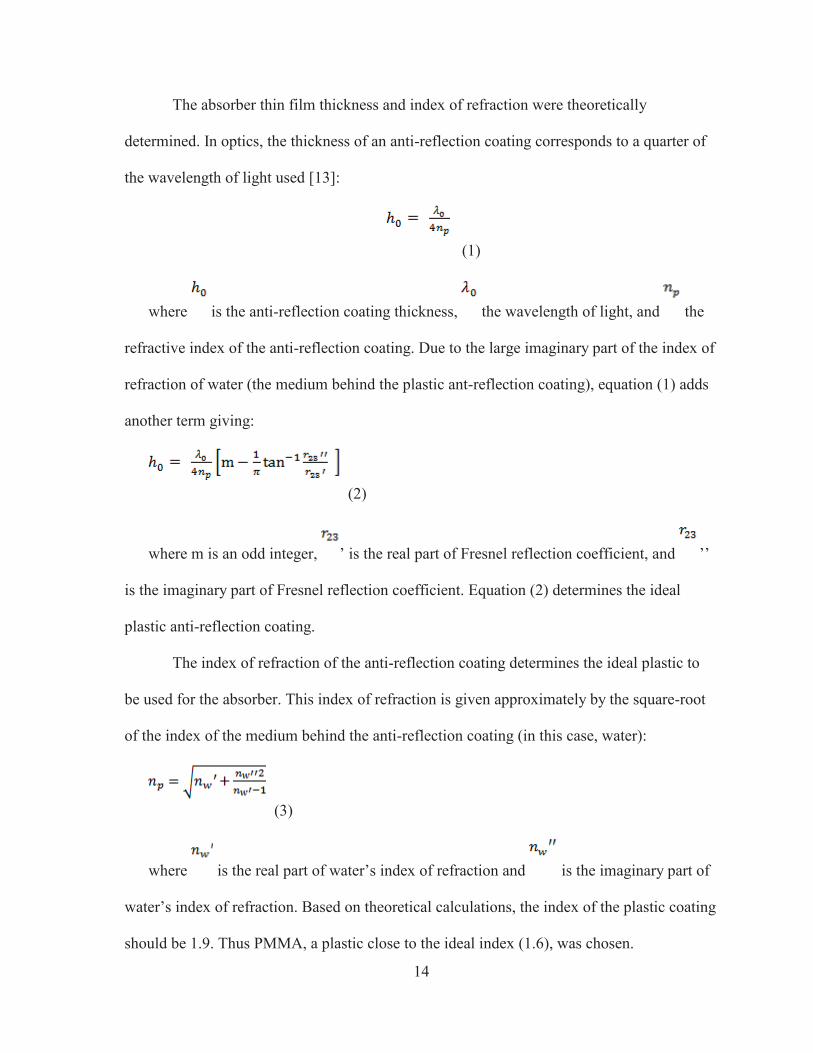
The absorber thin film thickness and index of refraction were theoretically
determined. In optics, the thickness of an anti-reflection coating corresponds to a quarter of
the wavelength of light used [13]:
(1)
where is the anti-reflection coating thickness, the wavelength of light, and the
refractive index of the anti-reflection coating. Due to the large imaginary part of the index of
refraction of water (the medium behind the plastic ant-reflection coating), equation (1) adds
another term giving:
(2)
where m is an odd integer, ’ is the real part of Fresnel reflection coefficient, and ’’
is the imaginary part of Fresnel reflection coefficient. Equation (2) determines the ideal
plastic anti-reflection coating.
The index of refraction of the anti-reflection coating determines the ideal plastic to
be used for the absorber. This index of refraction is given approximately by the square-root
of the index of the medium behind the anti-reflection coating (in this case, water):
(3)
where is the real part of water’s index of refraction and is the imaginary part of
water’s index of refraction. Based on theoretical calculations, the index of the plastic coating
should be 1.9. Thus PMMA, a plastic close to the ideal index (1.6), was chosen.
15
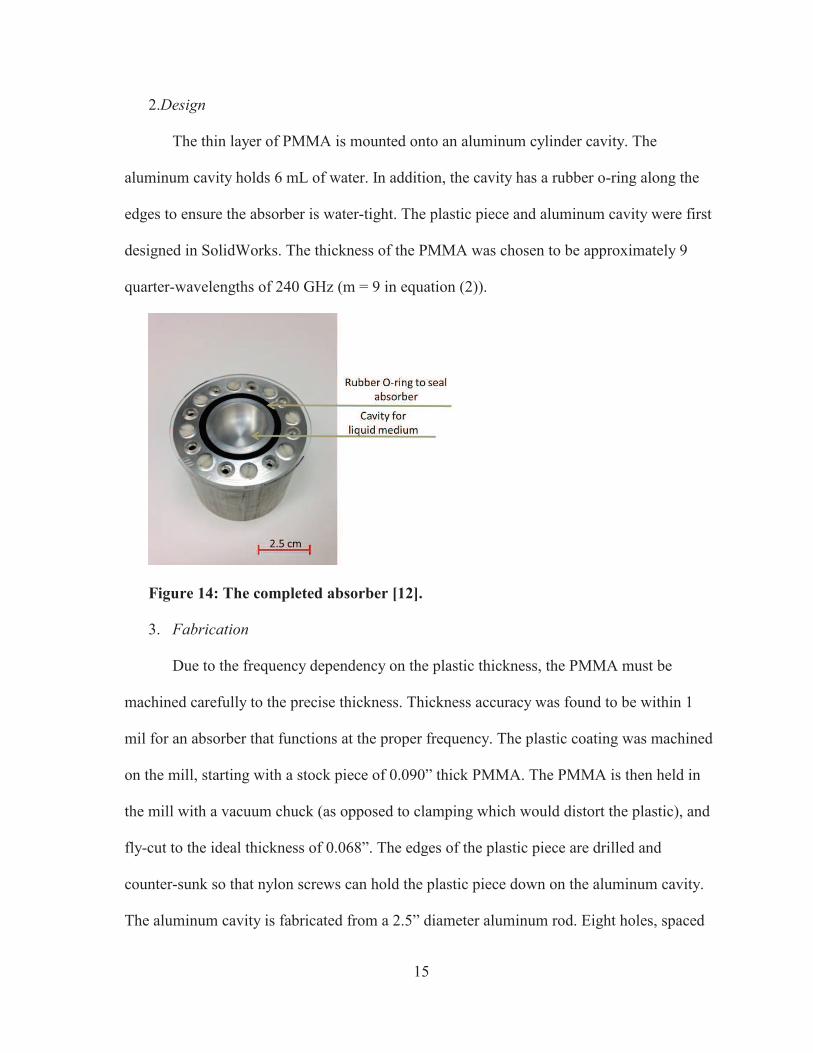
2.Design
The thin layer of PMMA is mounted onto an aluminum cylinder cavity. The
aluminum cavity holds 6 mL of water. In addition, the cavity has a rubber o-ring along the
edges to ensure the absorber is water-tight. The plastic piece and aluminum cavity were first
designed in SolidWorks. The thickness of the PMMA was chosen to be approximately 9
quarter-wavelengths of 240 GHz (m = 9 in equation (2)).
Figure 14: The completed absorber [12].
3. Fabrication
Due to the frequency dependency on the plastic thickness, the PMMA must be
machined carefully to the precise thickness. Thickness accuracy was found to be within 1
mil for an absorber that functions at the proper frequency. The plastic coating was machined
on the mill, starting with a stock piece of 0.090” thick PMMA. The PMMA is then held in
the mill with a vacuum chuck (as opposed to clamping which would distort the plastic), and
fly-cut to the ideal thickness of 0.068”. The edges of the plastic piece are drilled and
counter-sunk so that nylon screws can hold the plastic piece down on the aluminum cavity.
The aluminum cavity is fabricated from a 2.5” diameter aluminum rod. Eight holes, spaced
16
45° apart, are drilled into the rod and tapped so that the PMMA piece can be secured. The
water-containing cavity within the aluminum rod is ¾” deep, made on the lathe.
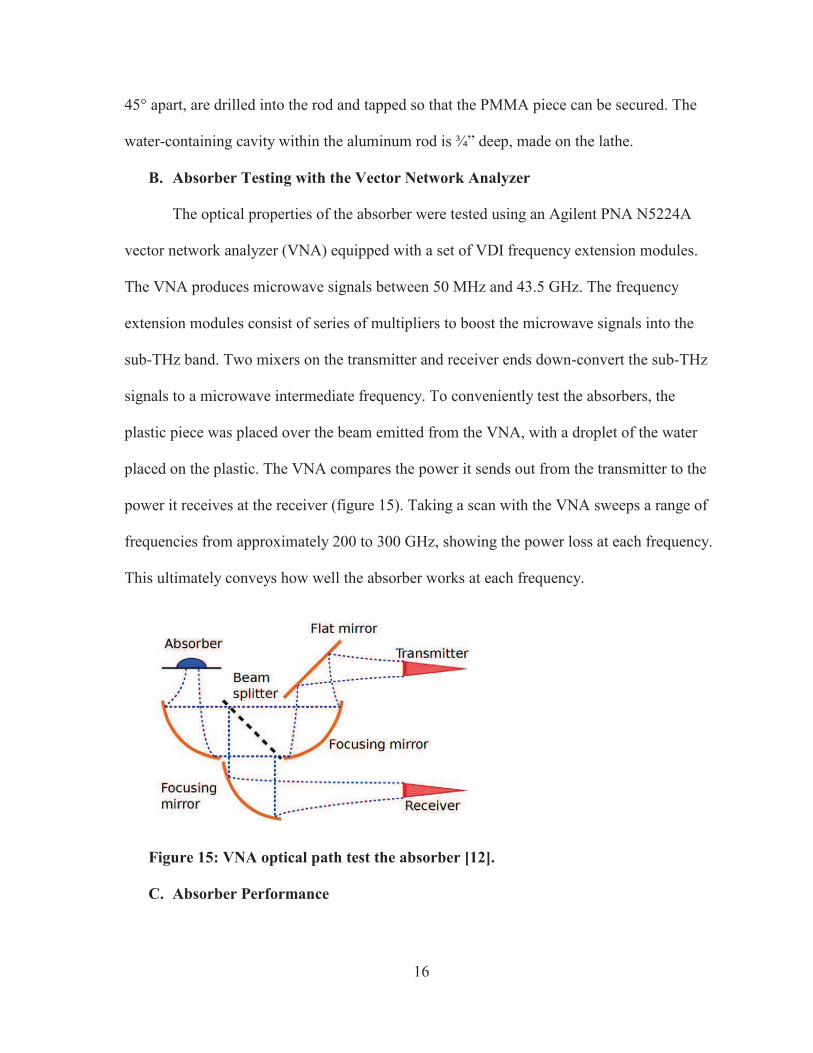
B. Absorber Testing with the Vector Network Analyzer
The optical properties of the absorber were tested using an Agilent PNA N5224A
vector network analyzer (VNA) equipped with a set of VDI frequency extension modules.
The VNA produces microwave signals between 50 MHz and 43.5 GHz. The frequency
extension modules consist of series of multipliers to boost the microwave signals into the
sub-THz band. Two mixers on the transmitter and receiver ends down-convert the sub-THz
signals to a microwave intermediate frequency. To conveniently test the absorbers, the
plastic piece was placed over the beam emitted from the VNA, with a droplet of the water
placed on the plastic. The VNA compares the power it sends out from the transmitter to the
power it receives at the receiver (figure 15). Taking a scan with the VNA sweeps a range of
frequencies from approximately 200 to 300 GHz, showing the power loss at each frequency.
This ultimately conveys how well the absorber works at each frequency.
Figure 15: VNA optical path test the absorber [12].
C. Absorber Performance

17
The performance of the absorber was measured in terms of power loss (dB) vs.
frequency. The peak absorbance is expected to be at 240 GHz to be used within FEL EPR
experiments. The absorber containing only water showed an absorbance of approximately -
30 dB (Figure 16). For reference, this is roughly the absorbance of the commercially
available absorber called Eccosorb [14]. The dashed grey line represents the noise floor of
the VNA.
Figure 16: Water in absorber
Due to the initial slight mismatch of the water and plastic index of refraction, the
index of refraction of the water can be tuned to better match the index of the plastic, thus
giving better absorbance. The index of refraction of the water can be tuned by adding a small
fraction of glycerol. The viscous glycerol changes the debye relaxation of the liquid medium,
thus changing the index of refraction. A plot showing the absorbance of the absorber with
varying fractions of glycerol is shown in figure 17. This data suggests increasing amounts of
glycerol increase the absorbance. However, I tested 21 glycerol-water solutions ranging from
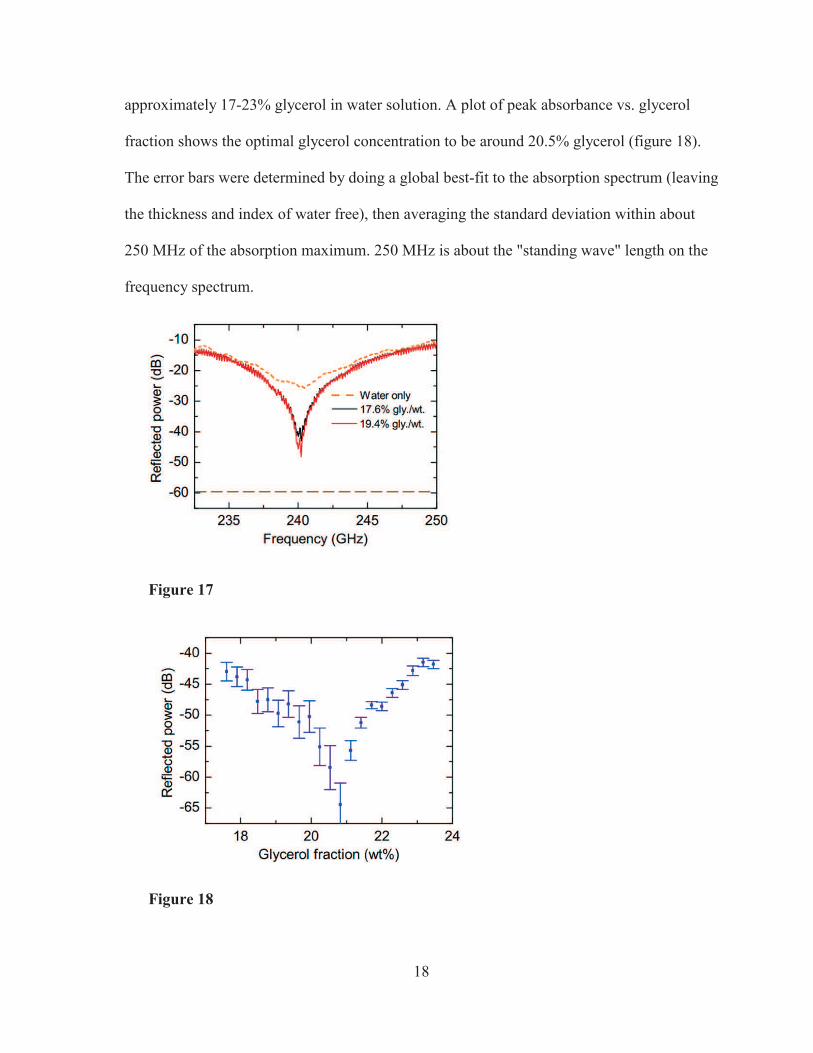
18
approximately 17-23% glycerol in water solution. A plot of peak absorbance vs. glycerol
fraction shows the optimal glycerol concentration to be around 20.5% glycerol (figure 18).
The error bars were determined by doing a global best-fit to the absorption spectrum (leaving
the thickness and index of water free), then averaging the standard deviation within about
250 MHz of the absorption maximum. 250 MHz is about the "standing wave" length on the
frequency spectrum.
Figure 17
Figure 18
19
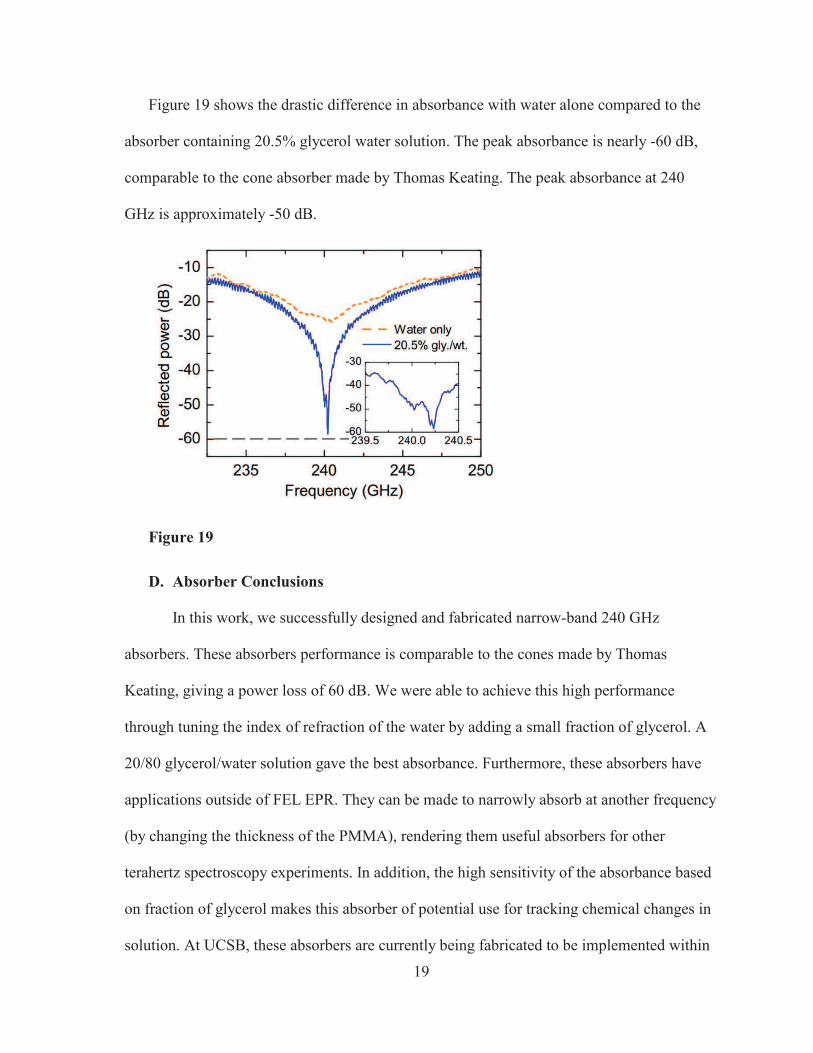
Figure 19 shows the drastic difference in absorbance with water alone compared to the
absorber containing 20.5% glycerol water solution. The peak absorbance is nearly -60 dB,
comparable to the cone absorber made by Thomas Keating. The peak absorbance at 240
GHz is approximately -50 dB.
Figure 19
D. Absorber Conclusions
In this work, we successfully designed and fabricated narrow-band 240 GHz
absorbers. These absorbers performance is comparable to the cones made by Thomas
Keating, giving a power loss of 60 dB. We were able to achieve this high performance
through tuning the index of refraction of the water by adding a small fraction of glycerol. A
20/80 glycerol/water solution gave the best absorbance. Furthermore, these absorbers have
applications outside of FEL EPR. They can be made to narrowly absorb at another frequency
(by changing the thickness of the PMMA), rendering them useful absorbers for other
terahertz spectroscopy experiments. In addition, the high sensitivity of the absorbance based
on fraction of glycerol makes this absorber of potential use for tracking chemical changes in
solution. At UCSB, these absorbers are currently being fabricated to be implemented within
20
the optical setup of the FEL EPR spectrometer. In addition, I am working on “absorber
sample holders,” sample holders with a PMMA lid that is the thickness to absorb at 240
GHz. For this absorber sample holder, the sample would sit in a 20.5% glycerol solution at
room temperature. Having an absorbing sample holder would theoretically greatly reduce
any FEL pulse reflections to the detector.
particularly clever graphic materials are added to play down the makeup pattern. There
is no functional reason why a four-column page arrangement should not be perfectly usable,
even on a standard 8.25”–wide page. Even five columns are perfectly practicable. Nor is
there any reason why columns should be of equal width or why various column widths
cannot be mixed, so that a number of different page arrangements can be achieved
Live-matter page column structure has traditionally been the two-column and three-
column break-up. There’s nothing wrong with this arrangement — it works very well,
people are used to it, and it is coordinated with the ad spaces which have been sold. The
traditional three-column makeup is also ideal for running stories in fast closing news
magazines, or for stories where there is neither the time or the need for special layout
treatment. But its very efficiency and overuse makes this format unexciting unless
particularly clever graphic materials are added to play down the makeup pattern. There is no
functional reason why a four-column page arrangement should not be perfectly usable, even
on a standard 8.25”–wide page. Even five columns are perfectly practicable. Nor is there
any reason why columns should be of equal width or why various column widths cannot be
mixed, so that a number of different page arrangements can be achieved.

21
V. Bibliography
[1] Hubbell, W. L., Mchaourab, H. S., Altenbach, C. & Lietzow, M. A. (1996). Watching
proteins move using site-directed spin labeling. Structure 4, 779–783.
[2] Edwards, D. T., Huber, T., Hussain, S., Stone, K. M., Kinnebrew, M., Kaminker, I.,
Matalon, E. Sherwin, M.S., Goldfarb, D., & Han, S. (2014). Determining the Oligomeric
Structure of Proteorhodopsin by Gd 3+-Based Pulsed Dipolar Spectroscopy of Multiple
Distances. Structure, 22(11), 1677-1686.
[3] Takahashi, S., Brunel, L. C., Edwards, D. T., van Tol, J., Ramian, G., Han, S., &
Sherwin, M. S. (2012). Pulsed electron paramagnetic resonance spectroscopy powered by a
free-electron laser. Nature, 489(7416), 409-413.
[4] Edwards, D. T., Ma, Z., Meade, T. J., Goldfarb, D., Han, S., & Sherwin, M. S. (2013).
Extending the distance range accessed with continuous wave EPR with Gd 3+ spin probes at
high magnetic fields. Physical Chemistry Chemical Physics, 15(27), 11313-11326.
[5] Warwar, N., Mor, A., Fluhr, R., Pandian, R. P., Kuppusamy, P., & Blank, A. (2011).
Detection and Imaging of Superoxide in Roots by an Electron Spin Resonance Spin-Probe
Method. Biophysical Journal, 101(6), 1529–1538. doi:10.1016/j.bpj.2011.07.029.
[6] Van Tol, J., Brunel, L. C., & Wylde, R. J. (2005). A quasioptical transient electron spin
resonance spectrometer operating at 120 and 240 GHz. Review of scientific
instruments, 76(7), 074101.
[7] Laminated Plastics. Technical Data Sheet: Rexolite.
http://www.laminatedplastics.com/rexolite.pdf.
[8] Laminated Plastics. Technical Data Sheet: Teflon.
http://www.laminatedplastics.com/teflon.pdf.
[9] Doty, M.F., Cole, B.E., King, B.T., & Sherwin, M.S. (2004). Wavelength-specific laser-
activated switches for improved contrast ratio in generation of short THz pulses. Review of
Scientific Instruments 75, 2921.
[10] Cruickshank, P. A. S., Bolton, D. R., Robertson, D. A., Hunter, R. I., Wylde, R. J., &
Smith, G. M. (2009). A kilowatt pulsed 94 GHz electron paramagnetic resonance
spectrometer with high concentration sensitivity, high instantaneous bandwidth, and low
dead time. Rev. Sci. Instrum., vol. 80, p. 103102.
[11] Vinh, N. Q., Sherwin, M. S., Allen, S. J., George, D. K., Rahmani, A. J., & Plaxco, K.
W. (2015). High-precision gigahertz-to-terahertz spectroscopy of aqueous salt solutions as a
probe of the femtosecond-to-picosecond dynamics of liquid water. J. Chem. Phys., accepted.
22
[12] Bailey, M. L. P., Pierce, A. T., Simon, A.J., Edwards, D.T., Ramian, G. J., Agladze, N.
I., & Sherwin, M. S. (2015). Narrow-band water-based absorber for terahertz spectroscopy.
IEEE Trans on Terahertz Sci and Tech, submitted.
[13] M. Born and E. Wolf, Principles of Optics, 7th ed. Cambridge University Press, 1999.
[14] Eccosorb Principles. Laird Technologies. http://www.eccosorb.com/notes-eccosorb-
principles.htm. 2015.
23
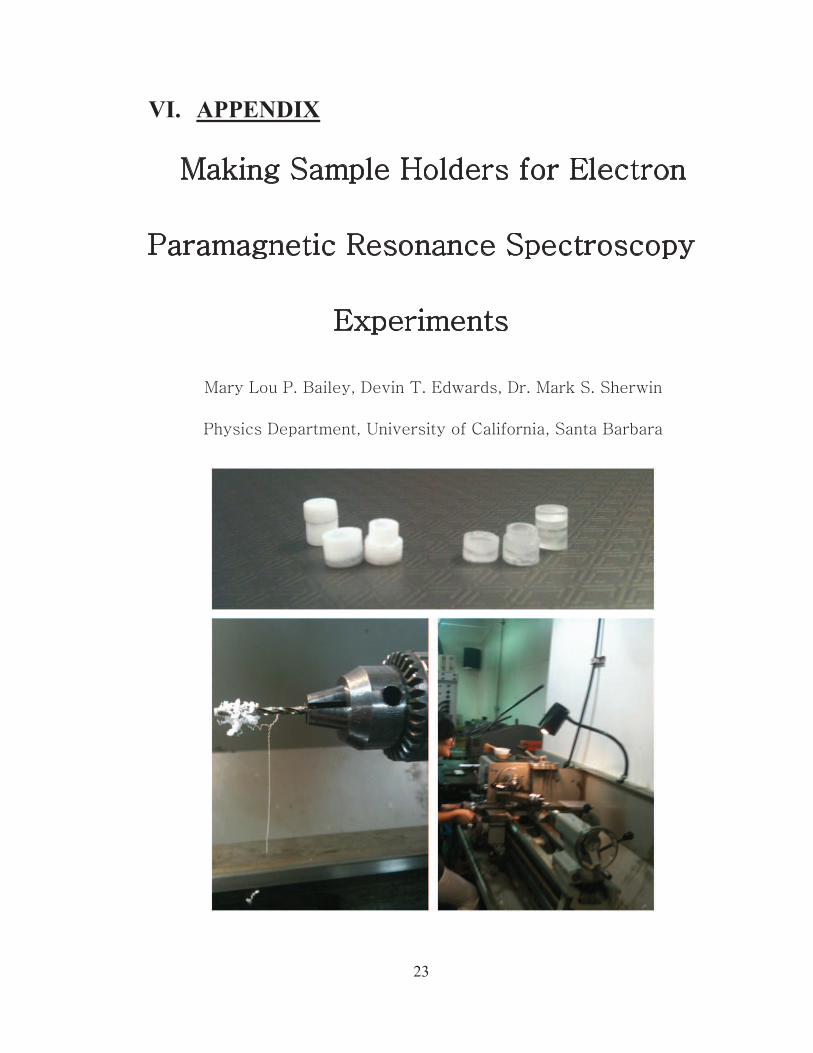
VI. APPENDIX

24
Materials:
· 0.25 in. plastic rod (Teflon or Rexolite)
· Sandpaper
· Fine tip sharpie
· Calipers
· Vial to keep sample holders in
· Razor blade
Lathe:
· Lathe cutting tool
· Lathe (horizontal) blade
· ¼ in. rod holder
· 0.1340 in. flat-head drill bit
*First thing’s first: You’re required to wear safety classes in the machine shop.*
This guide explains each step for making a sample holder in either Teflon or
Rexolite:
1) Cut off Enough Material: Take the 0.25 in. plastic rod, and measure a ~12 mm
portion. Mark the 12 mm line with a sharpie (see Fig. 1). This amount of plastic is
enough to create the base of the holder and lid, with some leftover in case there is a
mistake in making the lid.

25
Fig. 1: Measure about 12mm with calipers and mark on the rod
26
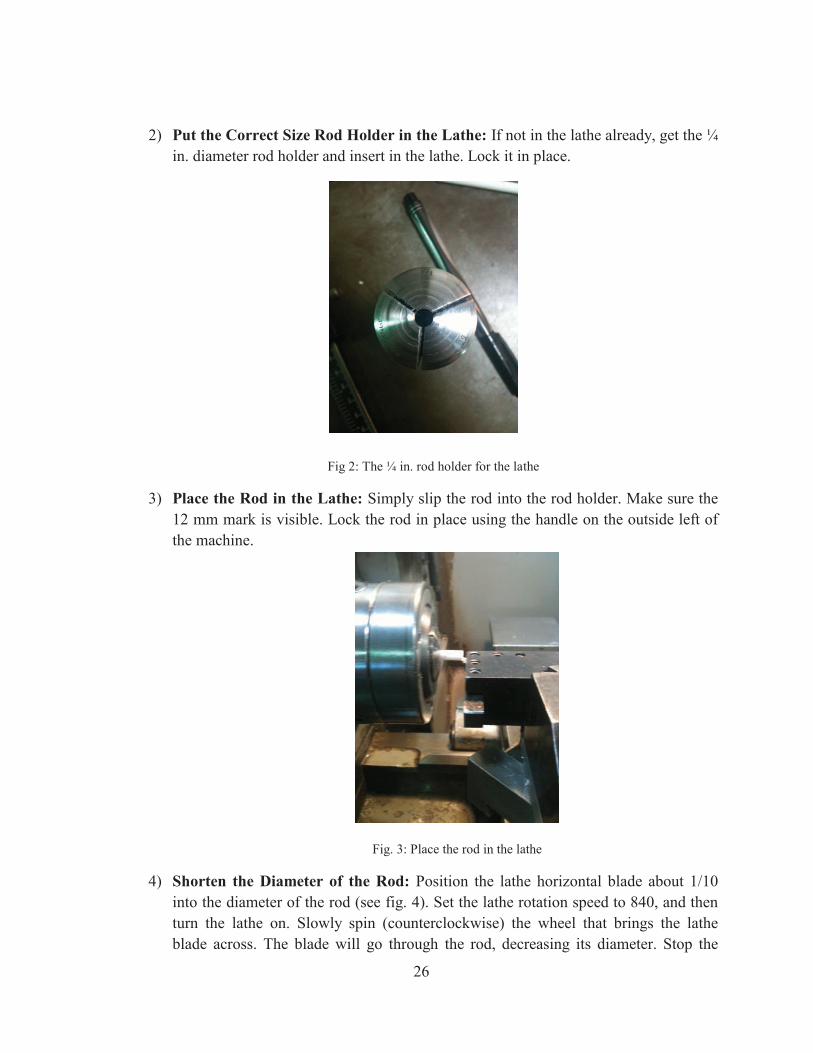
2) Put the Correct Size Rod Holder in the Lathe: If not in the lathe already, get the ¼
in. diameter rod holder and insert in the lathe. Lock it in place.
Fig 2: The ¼ in. rod holder for the lathe
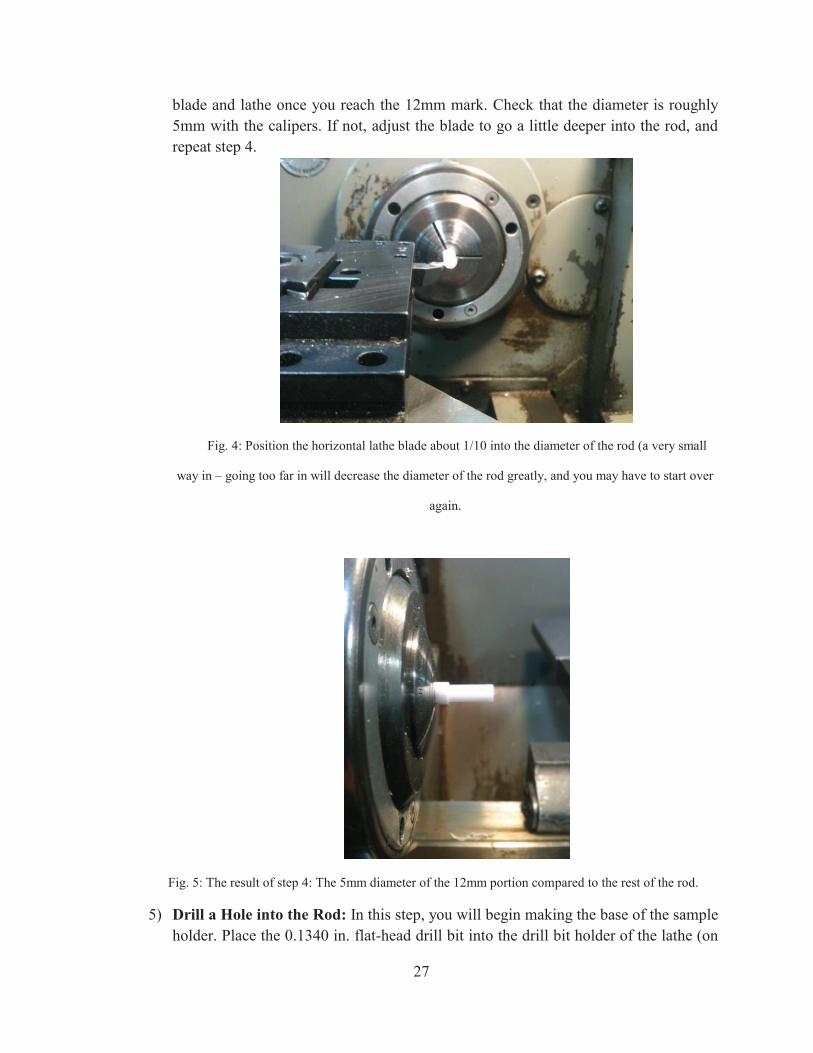
3) Place the Rod in the Lathe: Simply slip the rod into the rod holder. Make sure the
12 mm mark is visible. Lock the rod in place using the handle on the outside left of
the machine.
Fig. 3: Place the rod in the lathe
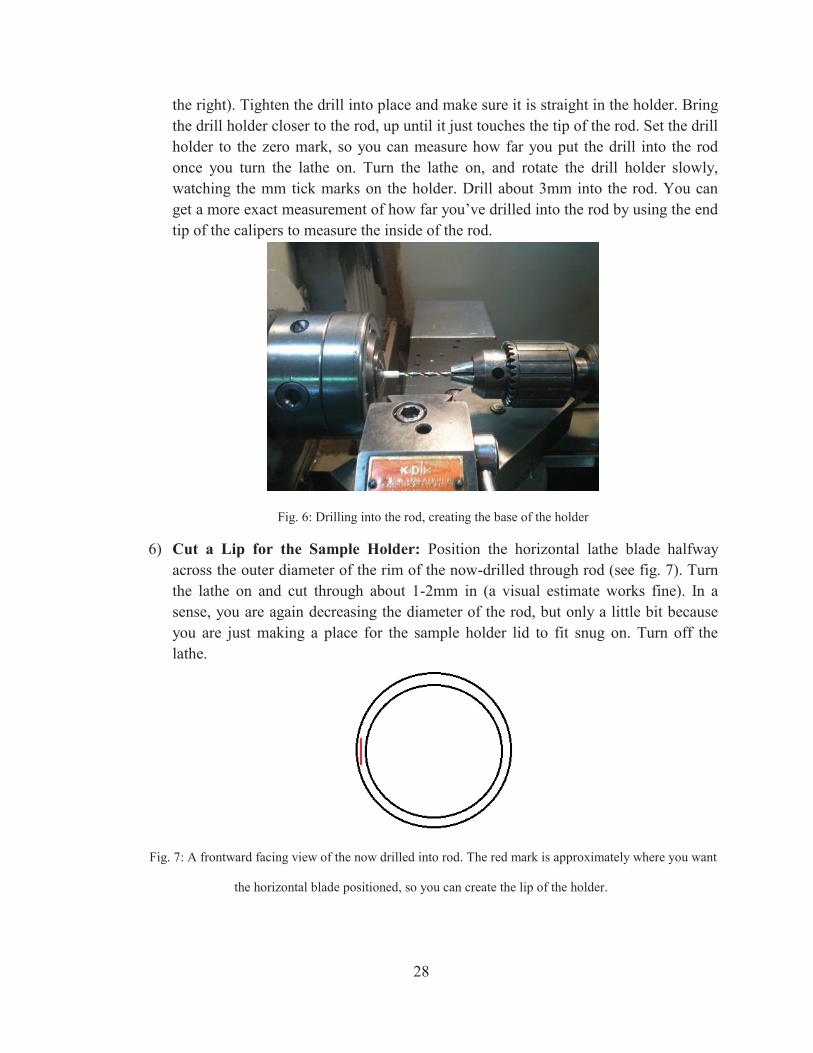
4) Shorten the Diameter of the Rod: Position the lathe horizontal blade about 1/10
into the diameter of the rod (see fig. 4). Set the lathe rotation speed to 840, and then
turn the lathe on. Slowly spin (counterclockwise) the wheel that brings the lathe
blade across. The blade will go through the rod, decreasing its diameter. Stop the
27
blade and lathe once you reach the 12mm mark. Check that the diameter is roughly
5mm with the calipers. If not, adjust the blade to go a little deeper into the rod, and
repeat step 4.
Fig. 4: Position the horizontal lathe blade about 1/10 into the diameter of the rod (a very small
way in – going too far in will decrease the diameter of the rod greatly, and you may have to start over
again.
Fig. 5: The result of step 4: The 5mm diameter of the 12mm portion compared to the rest of the rod.
5) Drill a Hole into the Rod: In this step, you will begin making the base of the sample
holder. Place the 0.1340 in. flat-head drill bit into the drill bit holder of the lathe (on
28
the right). Tighten the drill into place and make sure it is straight in the holder. Bring
the drill holder closer to the rod, up until it just touches the tip of the rod. Set the drill
holder to the zero mark, so you can measure how far you put the drill into the rod
once you turn the lathe on. Turn the lathe on, and rotate the drill holder slowly,
watching the mm tick marks on the holder. Drill about 3mm into the rod. You can
get a more exact measurement of how far you’ve drilled into the rod by using the end
tip of the calipers to measure the inside of the rod.
Fig. 6: Drilling into the rod, creating the base of the holder
6) Cut a Lip for the Sample Holder: Position the horizontal lathe blade halfway
across the outer diameter of the rim of the now-drilled through rod (see fig. 7). Turn
the lathe on and cut through about 1-2mm in (a visual estimate works fine). In a
sense, you are again decreasing the diameter of the rod, but only a little bit because
you are just making a place for the sample holder lid to fit snug on. Turn off the
lathe.
Fig. 7: A frontward facing view of the now drilled into rod. The red mark is approximately where you want
the horizontal blade positioned, so you can create the lip of the holder.
29
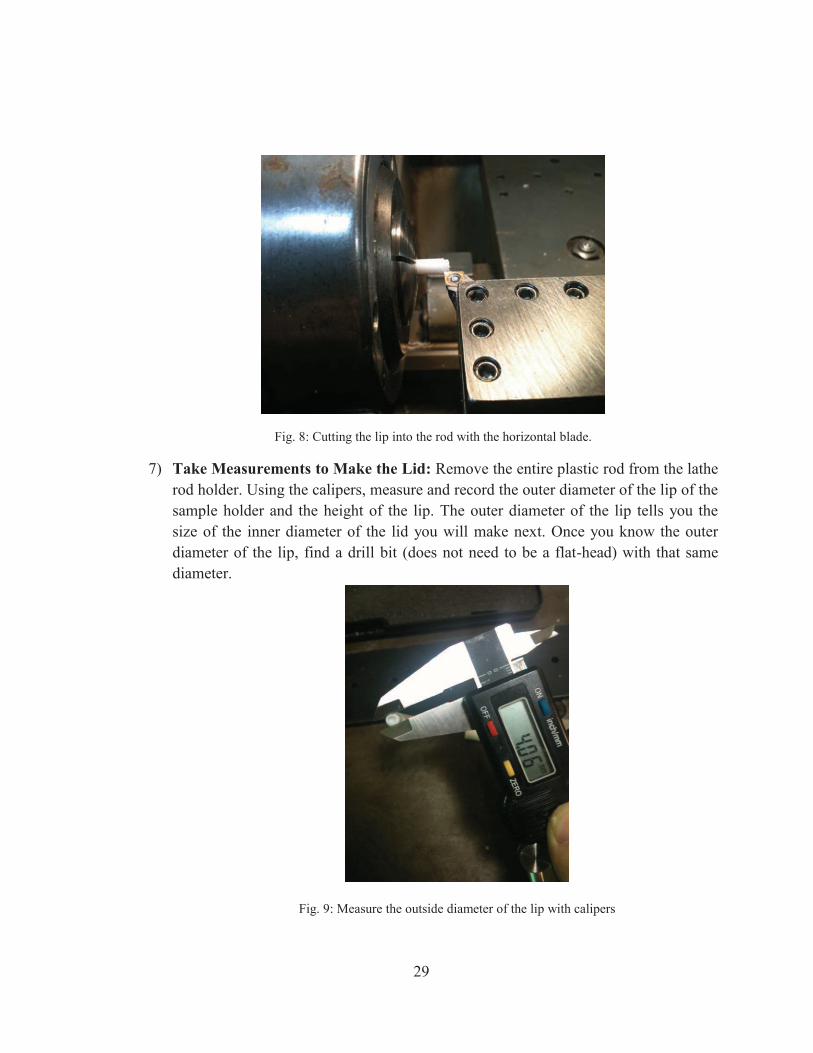
Fig. 8: Cutting the lip into the rod with the horizontal blade.
7) Take Measurements to Make the Lid: Remove the entire plastic rod from the lathe
rod holder. Using the calipers, measure and record the outer diameter of the lip of the
sample holder and the height of the lip. The outer diameter of the lip tells you the
size of the inner diameter of the lid you will make next. Once you know the outer
diameter of the lip, find a drill bit (does not need to be a flat-head) with that same
diameter.
Fig. 9: Measure the outside diameter of the lip with calipers

30
Fig. 10: Measure the height of the lip (in this case, the measurement was taken after the base of
the holder was cut off from the rest of the rod). This distance tells you how far to drill into the lid.
8) Cut the Base of the Holder off from the Rod: Using the calipers, measure about 3-
4mm on the rod and mark it with a sharpie (does not need to be precise, as long as
you put the mark under where you drilled into – you don’t want to cut right into the
holder). Put the rod back into the rod holder in the lathe, lock it in, and remove the
horizontal blade. Replace the horizontal blade with the lathe cutting tool. Position the
cutting tool right on the mark you just made (see fig. 12). Turn the lathe on, and push
the cutting tool forward, all the way through the rod. Turn off the lathe.

31
Fig. 11: Mark where you want to cut the base off of the rod (~3-4mm down)
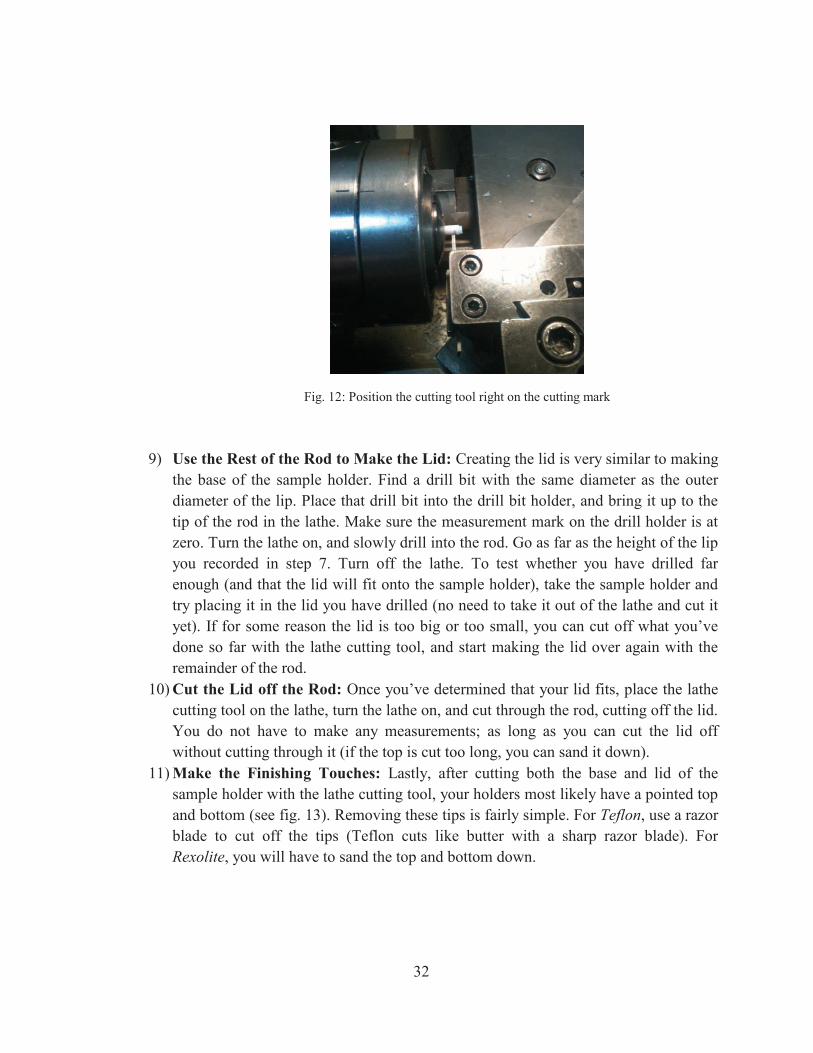
32
Fig. 12: Position the cutting tool right on the cutting mark
9) Use the Rest of the Rod to Make the Lid: Creating the lid is very similar to making
the base of the sample holder. Find a drill bit with the same diameter as the outer
diameter of the lip. Place that drill bit into the drill bit holder, and bring it up to the
tip of the rod in the lathe. Make sure the measurement mark on the drill holder is at
zero. Turn the lathe on, and slowly drill into the rod. Go as far as the height of the lip
you recorded in step 7. Turn off the lathe. To test whether you have drilled far
enough (and that the lid will fit onto the sample holder), take the sample holder and
try placing it in the lid you have drilled (no need to take it out of the lathe and cut it
yet). If for some reason the lid is too big or too small, you can cut off what you’ve
done so far with the lathe cutting tool, and start making the lid over again with the
remainder of the rod.
10) Cut the Lid off the Rod: Once you’ve determined that your lid fits, place the lathe
cutting tool on the lathe, turn the lathe on, and cut through the rod, cutting off the lid.
You do not have to make any measurements; as long as you can cut the lid off
without cutting through it (if the top is cut too long, you can sand it down).
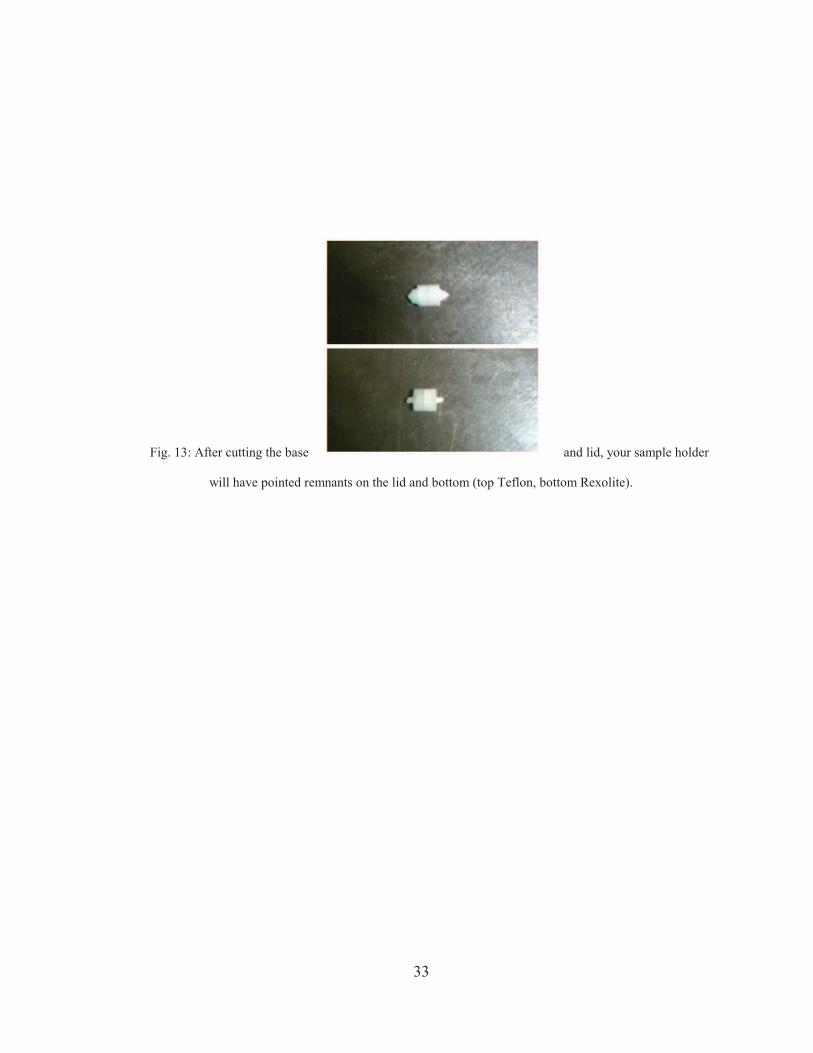
11) Make the Finishing Touches: Lastly, after cutting both the base and lid of the
sample holder with the lathe cutting tool, your holders most likely have a pointed top
and bottom (see fig. 13). Removing these tips is fairly simple. For Teflon, use a razor
blade to cut off the tips (Teflon cuts like butter with a sharp razor blade). For
Rexolite, you will have to sand the top and bottom down.
33
Fig. 13: After cutting the base and lid, your sample holder
will have pointed remnants on the lid and bottom (top Teflon, bottom Rexolite).