university of california, san diego ucsd-cer-06-08 ... · university of california, san diego...
TRANSCRIPT
University of California, San Diego UCSD-CER-06-08
Center for Energy Research University of California, San Diego 9500 Gilman Drive La Jolla, CA 92093-0420
Manuscripts of Papers from the UCSD PISCES Program
Presented at the 17th Plasma-Surface Interactions Conference, May 22-26, 2006, Hefei, China.
G. Antar, M. J. Baldwin D. Buchenauer, R.A. Causey, W.M. Clift, R.P.
Doerner, C. Holland D. Nishijima, R. Seraydarian K. Schmid, G. R. Tynan, J. H. Yu, and Z. Yan

This Report contains manuscripts of the following papers which were presented at the 17th International Conference on Plasma-Surface Interactions, held May 2006 in Hefei, China. Upon completion of their review, these papers will appear in a future edition of the Journal of Nuclear Materials.
1) The implications of mixed-material plasma-facing surfaces, R.P.
Doerner (review)
2) Parametric studies of carbon erosion mitigation dynamics in beryllium seeded deuterium plasmas, D. Nishijima, M.J. Baldwin, R.P. Doerner and R. Seraydarian
3) Examination of the velocity time-delay-estimation technique J. H. Yu, C. Holland, G. R. Tynan, G. Antar, Z. Yan
4) Be-W alloy formation in static and divertor-plasma simulator M.J. Baldwin, D. Buchenauer, R. P. Doerner, R.A. Causey, D. Nishijima, W.M. Clift) and K. Schmid
R-4
1
The implications of mixed-material plasma-facing surfaces
R. P. Doerner
University of California at San Diego, 9500 Gilman Dr., La Jolla, CA. 92093-0417 USA
Abstract
In all plasma confinement devices, material eroded from plasma-facing surfaces will be
transported and redeposited at other, sometimes remote, locations. If the plasma facing
material in a device consists of more than a single element there is a high probability that
the composition of the plasma-facing surfaces will evolve over time and may exhibit
plasma interaction properties much different from the originally installed material. These
plasma-created materials, or mixed materials, are the subjects of this review paper which
focuses on the ITER relevant mix of materials, namely carbon, tungsten and beryllium.
Knowledge concerning the formation conditions, erosion behavior and hydrogen isotope
retention properties of each binary combination of materials is described. Where available
information concerning tertiary combinations of materials is discussed.
PACS: 52.40.Hf
JNM Keywords: Plasma Material Interactions, Surface Effects, Beryllium, Carbon,
Tungsten
PSI-17 Keywords: ITER, Erosion and Deposition, Chemical erosion, Co-deposition,
Deuterium Inventory
Author address: Center for Energy Research
R-4
2
University of California at San Diego
9500 Gilman Dr.
Mail code: 0417
La Jolla, CA. 92093-0417
USA
Author e-mail: [email protected]
R-4
3
INTRODUCTION
The plasma facing surfaces provide the boundary conditions that govern the
performance of any magnetically confined plasma device. The importance of these
material surfaces will continue to increase as devices push toward higher and higher power
and longer discharge duration. In machines that operate using a mixture of deuterium and
tritium fuel, many safety aspects of operational capability will be determined by the
behavior of the plasma-facing components and materials. For these reasons, the designers
of the ITER project [1] have settled on a multi-material solution for their plasma-facing
surfaces.
Unfortunately, the properties of the materials used in design calculations are
usually the values associated with the ‘as-received’ material. In the proximity of high
temperature plasma, material erodes from plasma-facing materials in one location and is
transported to other locations throughout the device. The transported material may then be
deposited on, or implanted into, other materials. In 1978, S. A. Cohen succinctly described
this process [2] as “The wall may be eroded due to a variety of possible mechanisms which
generate plasma impurities, and subsequent plasma transport of impurities may deposit
material onto the wall. This modified surface of the wall is the wall component subjected
to subsequent plasma-wall interactions; it is both a source and sink of plasma impurities
and the working gas.” The term ‘mixed material’ has recently been coined to describe the
resultant, plasma-created surface. Even though the importance of this issue was recognized
almost three decades ago, detailed investigations of plasma interactions with surfaces
composed of more than a single element began only during the last decade or so.
R-4
4
Although plasma altered surfaces have been observed in many confinement
devices, once their compositions have been characterized, they have been largely ignored.
The exceptions to this general statement seem to be those machines that have operated with
a mixture of deuterium and tritium (D/T) fuel. The primary reason for the increased
attention in D/T machines was the need to understand the tritium retention locations and
characteristics throughout the devices. In the late 1980s, the term ‘tokamakium’ was used
to refer to plasma created mixed-material surfaces found in TFTR [3]. Although TFTR was
primarily an all-carbon machine, the impurity content and morphology of the mixed-
material surfaces was found to reflect changes in the operational history of the device.
The other major D/T facility, JET, has also spent considerable effort on
understanding the behavior of mixed-material surfaces [4-6]. In the JET device both
carbon and beryllium were used together as plasma-facing materials and the resultant
surfaces show considerable mixing between the two elements. Again, compositional
changes in the depth profiles of the mixed-material surfaces can be correlated to the
operational history of the machine [7]. The interrelated nature of the machine performance
and the resultant plasma-facing surfaces indicates the importance of predicting the
behavior of mixed-material surfaces in ITER prior to operating the device, both for facility
safety requirements, as well as from the point of view of plasma performance and the
achievement of the goals of the overall ITER project.
The conclusions derived from many active areas of research are needed to be able
to accurately predict which mixed-materials surfaces will form in which regions of the
ITER plasma-facing surfaces. The creation of mixed-material surfaces will depend on
many factors that determine the arrival and loss rate of material from those surfaces [8]. In
R-4
5
order to know the arrival rate of an impurity species in the plasma at a given surface, one
must understand the transport properties of the scrape-off layer (SOL) plasma. Edge
plasma turbulence induces cross-field transport, resulting in both diffusive-like and
convective plasma transport into and through the SOL region [9]. The magnitude of
convectively transported flux to the first wall, commonly called blob transport [10], is
actively being investigated. In addition, large SOL plasma flows have been measured but
not yet explained in several plasma confinement machines [8]. Finally, erosion terms due
to asymmetries and off-normal events, such as ELMs [11], also contribute to the
distribution of impurities throughout the ITER vessel.
In spite of the large uncertainties associated with the locations where mixed
materials will form in ITER, it can be predicted with some certainty that mixed-material
surfaces will occur. Data on the characteristics and behavior of mixed-material surfaces is
urgently needed by the ITER design team to try to anticipate and possibly mitigate any
undesirable effects. Since ITER is presently designed with a beryllium first wall, tungsten
armor in the baffle and divertor regions, and carbon strike point plates, this paper focuses
on the mixed-material characteristics of these three materials. The present understanding of
each of the binary systems, C/W, Be/C and Be/W, is described, including a discussion of
the added complexity of tertiary systems incorporating oxygen into the mix. For each
system, the formation conditions, the erosion characteristics and the hydrogen isotope
retention properties of the mixed materials are described.
Carbon/Tungsten System
R-4
6
The carbon-tungsten mixed-material system is probably the most widely studied
system, both experimentally and computationally. In 1991, experiments detected an
interesting and unexpected reversal in the mass loss from room temperature tungsten
samples bombarded with carbon ion beams at normal incidence [12]. Kinetics based
Monte-Carlo codes using a binary collision approximation (BCA), such as TRIDYN [13]
and EDDY [14], have had success predicting the sputtering behavior of tungsten surfaces
exposed to such a flux of energetic carbon ions. The models track the changes in the
composition of the implantation zone due to the bombardment of carbon ions. During the
stopping process of the carbon ions, tungsten atoms can be sputtered from the initially
pristine tungsten surface. The surface recession due to sputtering effectively acts to move
the implanted carbon toward the surface. After some fluence, the initially implanted carbon
ions will become part of the composition of the surface layer.
Once initially implanted carbon ions reach the new surface in the model several
effects occur which change the interaction of the incoming carbon with the now mixed-
material surface. First, the reflection probability of the incoming ions decreases due to a
decrease in the mass difference between the projectile and the ‘average’ target species. The
mass loss of tungsten from the surface then decreases as the concentration of surface
carbon increases which is of course coupled to an increase in the loss rate of carbon from
the surface. However, since the self-sputtering yield of carbon at normal incidence is
always below unity [15], the overall mass of the sample begins to increase. At sufficiently
large fluence, the sample will begin to experience a net mass gain.
The effect of the incident angle of the carbon ions can be used to verify the
understanding obtained from the model. By simply increasing the angle between the
R-4
7
incident ions and the surface normal, one can obtain a condition where the self-sputtering
yield of carbon is larger than unity. Under such condition, both the experiment and the
model show a continuous decrease in the mass of bombarded tungsten samples [12].
To properly predict the behavior of material systems in confinement devices, it is
necessary to include effects that become important at elevated surface temperature. While
temperature dependent effects are not included in these models, it is possible to couple the
kinetcis models with subroutines that allow variations of the composition in surface layers
to include effects, such as diffusion. This has been done [16-18] and the comparison of the
model to experiments can be quite good. However, in each case the diffusion coefficients
needed to reproduce the experimental data are smaller than the values prescribed in the
literature [see list of references in 16].
One possible explanation for this behavior begins to shed light on the complexity of
modeling plasma created mixed-material surfaces. In addition to activating diffusion at
elevated sample temperature, reactions between the substrate material and the implanted
carbon species occur, resulting in the formation of carbides. Depending on the substrate
material involved, carbides with different bonding characteristics are observed [19].
Carbides that form ionic bonds, such as Be2C, are very stable against diffusion of carbon.
Similarly, but to a somewhat lesser extent, covalent carbides, such as SiC, also resist
diffusion of the carbon component. However, carbides that form with carbon filling the
regions in the close packed metal lattice, such as WC, tend to be more favorable for
diffusion since for diffusion to occur no direct bonds between the metal and the carbon
must be broken in the process [19]. Effects such as this demonstrate the importance of
including chemical effects in the models to accurately predict the behavior of plasma-
R-4
8
exposed surfaces. It may not be adequate to search the literature for data obtained during
measurements performed under equilibrium, or trace concentration, conditions and then
attempt to use that data to model the behavior of materials exposed to plasma where the
situation may be far from equilibrium and the concentrations of species may not be
negligibly small [18].
Chemical bonding in the surface plays a large role in determining the behavior of
the plasma-surface interactions. For the case of carbide formation in tungsten, during the
annealing of carbon films on tungsten, the carbon begins to strongly react and form
carbides with the tungsten substrate at around 900K [20] (although some small amount of
carbide exists at the carbon-tungsten interface even at room temperature). Carbide
interlayers have also been observed between carbon layers deposited on tungsten substrates
when exposed to plasma containing carbon impurities [21]. The chemical erosion
properties of a plasma-facing surface that has reacted to form even a partial carbide layer,
or when experimentally examining the plasma-interaction behavior of a fully carbidic
surface, is completely different from chemical erosion properties of graphite. For a fully
carbidized sample the CH4 production rate drops by at least an order of magnitude
compared to that of graphite [22, 23]. Presumably the presence of the carbidic bonding
inhibits the production rate of C-H bond formation.
From the modeling perspective, properly including chemical effects becomes even
more apparent when the BCA approach to the W/C system is expanded to include the
effects associated with large a flux of hydrogen to the system. It is again possible to obtain
good agreement between simulation and experimental data [24], but the agreement is
obtained after the fact and could not be considered predictive. Determining the appropriate
R-4
9
value to use for the chemical erosion yield of carbon in the ITER situation is particularly
difficult given the wide range of measured values in the literature and its dependence on
parameters such as temperature [25], flux [26], surface composition [23, 24] and possibly
other variables.
A final complication worth mentioning is the possibility, or perhaps even
likelihood, of additional elements being present in a confinement device scenario.
Exploration of the teriary W/C/O system has shown that the presence of oxygen in a mixed
tungsten-carbon surface can inhibit, or in some cases even prevent the formation of
tungsten carbide [20]. The presence of oxygen allows for the formation of volatile species,
CO and CO2, which deplete carbon from the surface and influence the amount of carbon
available for reaction with surface tungsten. At this stage it is still speculation to attempt to
estimate the amount of oxygen that may be present in the ITER vacuum system, although
it should be noted that baking in an oxygen atmosphere is being considered as a possible
technique to remove tritium-containing codeposits in ITER [27].
An important variable to quantify from a safety perspective is the fuel retention
capability of mixed-material plasma-facing surfaces. Again the difficulty becomes how to
relate the behavior of plasma-created mixed materials to other measurements. In vacuum
annealing measurements of tungsten coated with an amorphous C:H layer, the formation of
W2C is accompanied by a release of hydrogen from the surface [28]. The conclusion drawn
is that when a mixed W-C surface forms on a plasma-facing surface it will retain little fuel
atoms. However, during deuterium ion beam irradiation studies of a W2C sample the
measured deuterium retention level was between that measured from a clean tungsten
surface and a fully carbon covered tungsten surface [29]. Similar measurements obtaining
R-4
10
retention levels of mixed W-C surfaces lying between that of carbon surfaces and tungsten
surfaces have also been reported [22, 30, 31].
Beryllium/Carbon System
Material eroded from the ITER first wall will be ionized in the scrape-off layer
plasma and tend to flow along the magnetic field toward the divertor. Recent modeling of
the transport of eroded material in ITER shows that significant amounts of beryllium may
be deposited on the baffle and divertor areas [32].
To first order, the processes used to describe the interaction of carbon ion beams
with beryllium samples [33] are similar to the interaction of carbon with tungsten. Initially,
the bombardment results in a beryllium carbide rich implantation zone that, due to surface
erosion, migrates and eventually become the surface layer. The change in surface layer
composition directly effects the composition of material leaving the surface, however,
there is a subtle difference between tungsten and beryllium interactions with the incident
carbon ions. For the W-C system a primary mechanism responsible for building up carbon
layers is the change in the reflection probability for the incident ions due to a lower
average mass of the target surface. In the case of the Be-C system, the reflection
coefficient does not change appreciably due to the development of the beryllium carbide
layer. The effective binding energy calculated by the code changes more dramatically in
the Be-C case then in the W-C case and this changes the calculated Be surface loss rate.
The TRIDYN code varies the effective surface binding energy linearly between the mean
value of the two elemental binding energies and the value of the pure element based on the

R-4
11
composition of the layer [34]. In the case of beryllium, Eb ~ 3.3 eV, and carbon, Eb ~ 7.4
eV, this is a more dramatic effects than between tungsten, Eb ~ 8.9 eV and carbon [35].
Once the surface recession rate is reduced more carbon will build up in the implantation
zone and eventually a carbon rich layer results. Calculations based on this mathematical
expression for the surface binding energy do a good job of replicating ion beam sputtering
results [36, 37]. Similar behavior is predicted for Be ions impinging on a carbon target
[38].
While the approximation used to simulate surface binding energies of mixed
surfaces appears to work well at higher energy, where the sputtering yield does not vary
dramatically with the value for the binding energy, it appears that a more rigorous
treatment is needed in the near-threshold-energy range when large amount of deuterium are
also present in the surface. The PISCES device has observed the formation of beryllium-
rich layers on graphite targets exposed to deuterium plasma containing very small amounts
(~0.1%) of beryllium impurities [39, 40]. However, in the inverse Be-C system, namely
carbon plasma contamination incident on Be samples, carbon-rich surfaces required a
much larger (1-2%) incident impurity fraction to form [41]. While the equilibrium surface
composition of the resultant plasma exposed surfaces could be predicted [41, 42]
reasonably well using typical values for plasma-material interaction parameters in the
literature, the temporal evolution of the surface composition could not be.
The surface of the plasma-exposed samples are observed to evolve over time
frames that can be as long as thousands of seconds, or as short as seconds, depending on
the plasma experimental conditions [43]. The change in the composition of the surface is
correlated to a reduction in the chemical erosion of the graphite sample. As in the case of
R-4
12
tungsten carbide formation in a surface reducing the chemical erosion properties of the
bound carbon, beryllium carbide formation in the surface of these samples appears to again
be responsible for the reduction [44]. In the plasma environment many parameters can
have an influence on the formation of beryllium carbide layers, such as, incident Be flux,
surface temperature, incident energy, etc. A systematic variation of plasma and target
conditions has resulted in the development of a scaling law to describe the formation time
of the beryllium-rich layers in the PISCES experiments [45].
The scaling law is a different approach, compared to using the kinetic Monte Carlo
models, to predicting the behavior of mixed-material surfaces. Application of this scaling
to typical conditions expected in the ITER divertor provides an estimate of the fluence
necessary to inhibit the production of hydrocarbons from the ITER divertor plates. If the
extrapolation of this scaling law to ITER is valid, it predicts a beryllium-rich layer to form
in approximately 5 milliseconds [45] of ITER-type plasma exposure. This formation time
estimate is considerably shorter than the ELM frequency (~1 Hz) expected in ITER, which
means that the Be-C mixed-material surfaces may be present most of the time on the ITER
divertor plates.
Another issue being addressed in the beryllium-seeded plasma experiments, is the
robustness of the beryllium-carbide surfaces to the transient heating effects associated with
ELM power losses in ITER. Previous measurements of the existence of thin aluminum
layers (as a surrogate for beryllium layers) deposited on graphite and then subjected to
extreme power loading revealed that the aluminum did not ablate from the surface until the
temperature of the surface exceeded the boiling point of aluminum [46]. While the
PISCES-B heat pulsing experiments have not yet achieved a surface temperature
R-4
13
exceeding the boiling temperature of beryllium (Tboil = 2744K), or the decomposition
temperature of beryllium carbide (T Be2C decom. ~ 2400K), they have shown that the
protective Be layer forms faster while periodic heat pulses are applied to the samples
during the course of the plasma exposure [47]. The quicker suppression of chemical
erosion from the plasma-exposed samples is in qualitative agreement with the predictions
of the scaling law [45] previously described.
One complication to directly applying these results to predictions for the behavior
of ITER is the composition of the incident ion flux to the surface. In measurements
involving the tertiary mixed-material Be-C-O system, dramatically different results are
obtained. Recall that the interaction of the two-component Be-C system resulted in the
formation of a Be2C layer, the bombardment of beryllium with CO+ ion beams results in
almost exclusive binding of the beryllium to the oxygen in the implantation zone [33, 37].
The carbon atoms present are then bound up in C-C or C-O bonds. Once this implantation
zone reaches the receding surface, the carbon is easily chemically eroded. The differences
between these measurements and those described in the PISCES simulator relate to the
amount of oxygen present in the incident ion flux. Depending on the level of oxygen
present in ITER, the final behavior may lie somewhere between the two results described.
A trend similar to that observed with the W-C system with respect to hydrogen
release is also exhibited during formation of beryllium carbide obtained by reacting a
surface layer of amorphous C:H with a beryllium substrate. Once the carbide reaction
begins to occur, typically in the temperature range of 773K to 873K, hydrogen is released
from the reacted material [48, 49]. Again, such a result does not guarantee that Be2C
bombarded with energetic hydrogen isotopes will retain little of the incident particle
R-4
14
fluence. Deuterium ion beam implantation into mixed Be-C layers showed higher retention
in the mixed-material samples, compared to clean Be samples [50]. Retention
measurements from plasma created mixed-material targets also show larger retention in
mixed Be-C layers compared to clean Be targets [41], but surprisingly mixed Be-C targets
also show larger retention when compared with clean carbon targets exposed to identical
plasma discharges [44]. In both cases of plasma-created mixed Be-C (Be incident on C and
C incident on Be) surfaces the differences in retention are largest during low surface
temperature exposure. The differences in retention decrease as the exposure temperature
increases.
For the ITER device, the dominant term driving the tritium inventory in the vessel
is predicted to be codeposition of tritium with eroded material, rather than implantation
and retention in plasma exposed target surfaces [27]. The eroded material capable of
codepositing will be determined by the mixed-material surfaces with which the plasma
interacts. In measurements of codeposition of deuterium with a mixed Be-C-O layer [51],
the deuterium concentration was observed to be similar to that of codeposition of
deuterium with pure carbon. The hypothesis was that deuterium was coimplanting into a
growing BeO film, rather than codepositing with the smaller amount of carbon present in
the films. Subsequent measurement seemed to confirm this hypothesis, as the measured
deuterium content in coimplanted Be films seemed to scale with the cleanliness of the
films produced [52]. During PISCES beryllium seeded plasma experiments when Be2C
surface layers form on mixed-material targets, the codepositing material is measured to
consist almost exclusively of beryllium [53] with a varying amount of oxygen present in
the coimplanted beryllium. However, during the PISCES codeposited material collection,
R-4
15
films collected at higher temperature had decreasing amounts of deuterium retained in the
films, yet also contained an increasing amount of oxygen. It has been suggested that the
varying concentration of deuterium is governed by the energy of the incident deuterium
during the coimplantation rather than by the oxygen content in the films [54].
While the mechanism governing the retention is still under investigation, certain
information is already clear. First, if beryllium-rich layers form on ITER plasma-facing
materials, then the codepositing material will consist primarily of beryllium. Second,
although the level of codeposition, or coimplantation, in beryllium-rich layers at room
temperature is similar to that expected in carbon-rich codeposits, the concentration
decreases much more rapidly with temperature in beryllium codeposits than it does in
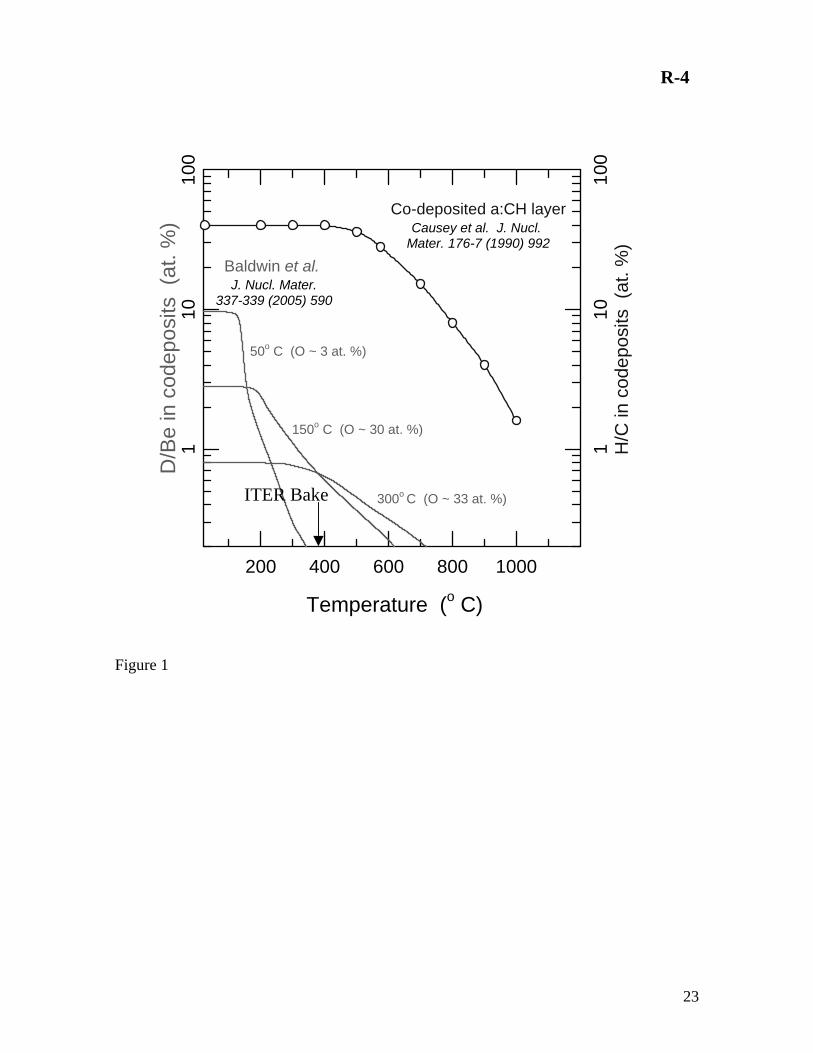
carbon codeposits. And finally, it appears to be easier to remove the deuterium content in
beryllium-rich codeposits at lower temperature than from carbon-rich codeposits. This last
fact is shown in Figure 1, where data from outgassing measurements of beryllium-rich
codeposits [53] is replotted and compared to data from thermally desorbing carbon-rich
codeposits [55]. Also indicated in the figure is the design value for the maximum bake
temperature achievable in the ITER divertor (650K) after the coolant is drained from the
divertor components.
Beryllium/Tungsten System
The third binary system of materials that is a concern for the ITER design is that of
beryllium-tungsten alloys, so called tungsten beryllides. While the existence of these alloys
(Be2W, Be12W and Be22W) has been known for some time [56], it is only recently that
R-4
16
their importance has been recognized. The primary reason for concern stems from the
beryllium plasma-seeding experiments carried out in the PISCES Laboratory. In the initial
series of measurements the beryllium-supplying oven contained a tungsten crucible
holding the molten beryllium. This crucible melted and destroyed the oven while operating
at only about 1500K [57]. The uncertainty associated with any possibility for a similar
major malfunction in the ITER divertor region has brought significant new effort to this
area. A detailed description of tungsten beryllides is presented in these proceedings [58]
and so will not be repeated here.
The formation of beryllides will be governed by the conditions experienced by
tungsten plasma-facing materials due to interaction with the incident plasma. Since the
temperature of the surface must be fairly large (~1100K or more) to allow significant
growth of the alloy, the loss rate of beryllium from these surfaces will be impacted
significantly by both thermal sublimation and thermally enhanced erosion of beryllium
[59] from the material. A model has been proposed to describe plasma conditions that
should result in the formation of a beryllium layer on a plasma exposed tungsten surface
[60] and this model should provide insight into which surfaces in ITER might be most
susceptible to beryllide formation.
While there is presently no data available concerning retention, or codeposition, of
deuterium in Be/W alloys, one might expect that when and if these alloys form, the
codeposited material will consist primarily of beryllium and the codeposition discussion
presented in the previous section will hold. In addition there has been little, if any,
codeposition of deuterium with tungsten observed experimentally [61].
R-4
17
A final word of caution is perhaps in order with regard to similar consequences
from unexpected mixed-material formation. There has been an ongoing discussion in the
community about the necessity of designing a boronization system for possible use in
ITER. Similar to the tungsten-beryllide alloys, tungsten-boride alloys exist [62] that have
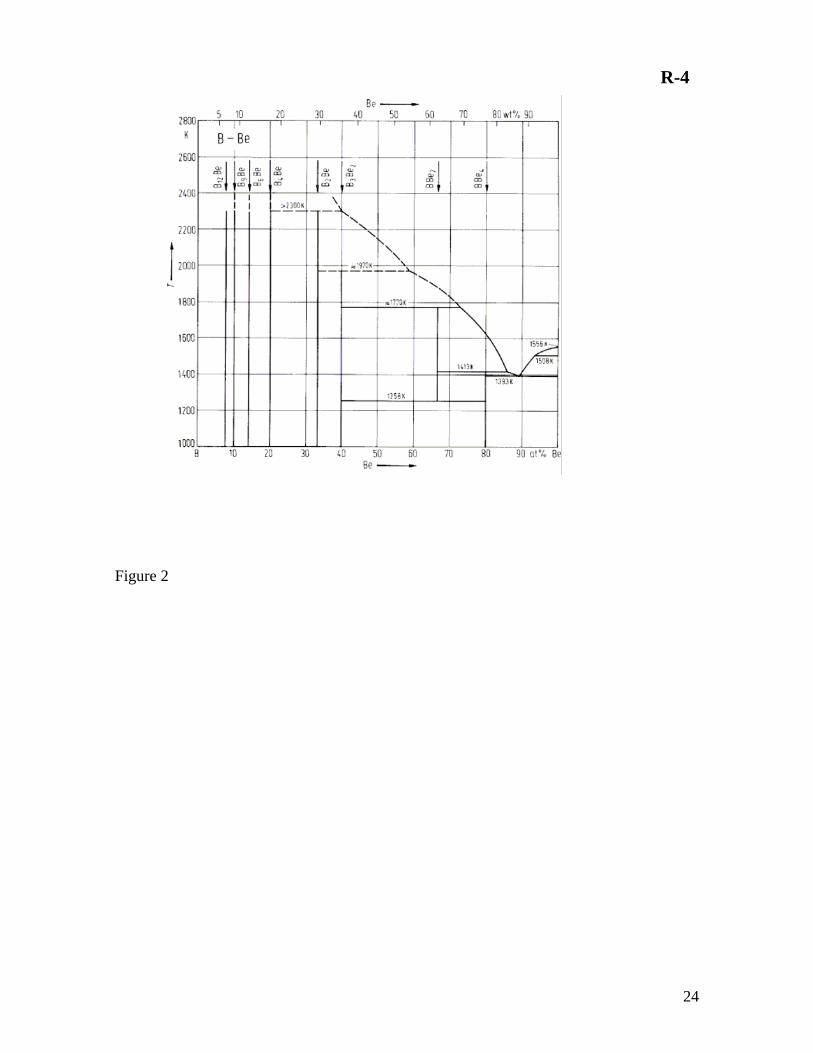
melting temperatures lower than that of elemental tungsten. In addition, beryllium-boride
alloys could form on the beryllium first wall. The beryllium boride phase diagram, Figure
2, shows that the mixed Be-B system can even have a melting temperature lower than that
of elemental beryllium [63].
Summary
Due to the combination of materials employed in different locations in the ITER
design there is a strong likelihood that some types of mixed materials will form on plasma-
facing surfaces. This review has summarized present knowledge of each of the three binary
mixed-material systems, C/W, Be/C and Be/W. The added complications associated with
including the effects of oxygen, or hydrogen, in the mix have also been discussed. While
no definitive conclusions can yet be drawn concerning the implication of mixed materials
in ITER, there have been significant advancements in the understanding of mixed materials
in recent years.
The ability of models to correctly predict the formation conditions of mixed
materials depends critically on chemical effects in the surface layers. Unfortunately, the
inclusion of chemistry in kinetic models must be done in some ad hoc manner based on
literature values that may not be applicable to plasma-created mixed materials. Likewise
R-4
18
the large fluence of particles associated with plasma facing surfaces in ITER may not be
compatible with a molecular dynamics modeling approach to the mixed systems. Some
technique is urgently needed to self-consistently address the issue of chemical effects with
respect to plasma-surface interactions.
It is clear that the mixing of materials in plasma-facing surfaces can alter the
hydrogenic retention properties of surfaces. In the W/C case, the retention level seems to
lie between those expected from the pure materials. In the Be/C case, retention is increased
somewhat above that expected from pure carbon. However, the largest impact on the
tritium accumulation inside the ITER vessel appears to be associated with changes in the
hydrogenic inventory in codeposited layers located in regions away from direct plasma
contact. The composition of codeposited layers, and thereby their hydrogen retention
properties, may be determined by the erosion properties of mixed materials, as has been
seen in the PISCES experiments. Or the codeposited materials containing W/C or Be/C
mixes may react similar to laboratory carbide formation measurements that observe the
release of hydrogen when carbides form. Finally, the retention properties of the tungsten
beryllides is still completely unknown and it can only be hoped that the elevated
temperature required for their formation may mitigate any adverse effects.
Acknowledgements
It is my pleasure to acknowledge many useful discussions with, and suggestions from, the
members of the PISCES Laboratory and our European collaborators. In particular, I would

R-4
19
like to thank Prof. Marie Doerner for her editing and, Dr. Matthew Baldwin and Prof.
Sergei Krasheninnikov, for their input.
R-4
20
References
[1] ITER Technical Basis, ITER EDA Documentation Series No. 24, IAEA, Vienna, 2002. [2] S. A. Cohen et al., J. Nucl. Mater. 76&77 (1978) 459. [3] B. E. Mills et al., J. Nucl. Mater 162-164(1989)343. [4] M. Rubel et al., J. Nucl. Mater. 313-316(2003)321. [5] J. Likonen, E. Vainonen-Ahlgren, J. P. Coad et al., J. Nucl. Mater. 337-339(2005)60. [6] J. P. Coad, P. L. Andrew and A. T. Peacock, Phys. Scripta T81(1999)7. [7] J. P. Coad, P. Andrew, D. E. Hole et al., J. Nucl. Mater. 313-316(2003)419. [8] G. F. Matthews, J. Nucl. Mater. 337-339(2005)1. [9] B. A. Carreras, J. Nucl. Mater. 337-339(2005)315. [10] S. J. Zweben and R. W. Gould, Nucl. Fusion 25(1985)171. [11] A. Loarte, G. Saibene, R. Satori et al., Phys. Plasmas 11,5(2004)2668. [12] W. Eckstein and J. Roth, Nucl. Instr. & Methods in Phys.Res. B53(1991)279. [13] W. Moeller, W. Eckstein and J. P. Biersack, Comp. Phys.Commun. 51(1988)355. [14] R. Kawakami and K. Ohya, Jpn. J. Appl. Phys. 40(2001)5399. [15] W. Eckstein, C. Garcia-Rosales, J. Roth and W. Ottenberger, Sputtering Datt IPP Report 9/82(1993). [16] W. Eckstein, V. I. Shulga nd J. Roth, Nucl. Instr. & Methods in Phys.Res. B153(1999)415. [17] R. Kawakami and K. Ohya, Jpn. J. Appl. Phys. 42(2003)5259. [18] K. Schmid and J. Roth, J. Nucl. Mater. 302(2002)96. [19] Ch. Linsmeier, J. Luthin and P. Goldstrass, J. Nucl. Mater. 290-293(2001)25. [20] J. Luthin and Ch. Linsmeier, J. Nucl. Mater. 290-293(2001)121. [21] F. C. Sze, L. Chousal, R. P. Doerner et al., J. Nucl. Mater. 266-269(1999)1212. [22] W. Wang, V. Kh. Alimov, B. M. U. Scherzer et al., J. Nulc. Mater. 241-243(1997)1087. [23] M Taniguchi, K. Sato, K. Ezato et al., J. Nucl. Mater. 313-316(2003)360. [24] K. Schmid and J. Roth, J. Nucl. Mater. 313-316(2003)302. [25] J. W. Davis and A. A. Haasz, J. Nucl. Mater. 241-243(1997)37. [26] J. Roth, R. Preuss, W. Bohmeyer et al., Nucl. Fusion 44(2004)L21. [27] G. Federici, R. A. Anderl, P. Andrew et al., J. Nucl. Mater 266-269(1999)14. [28] K. Ashida, K. Fujino, T. Okabe et al., J. Nucl. Mater. 290-293(2001)42. [29] R. A. Anderl, R. J. Pawelko and S. T. Schuetz, J. Nucl. Mater. 290-293(2001)38. [30] V. Kh. Alimov, Phys. Scripta, T108(2004)46. [31] O. V. Ogorodnikova, J. Roth and M. Mayer, J. Nucl. Mater. 313-316(2003)469. [32] J. N. Brooks et al., these proceedings. [33] P. Goldstrass and Ch. Linsmeier, J. Nucl. Mater. 290-293(2001)71. [34] W. Eckstein, M. Hou and V. I. Shulga, Nucl. Instrum. & Meth. In Phys. Res. B 119(1996)477. [35] C. Kittel, Introduction to Solid State Physics (Wiley, New York, 1976). [36] E. Gauthier, W. Eckstein, J. Laszlo et al., J. Nucl. Mater. 176&177(1990)438. [37] P. Goldstrass, W. Eckstein and Ch. Linsmeier, J. Nucl. Mater. 266-269(1999)581. [38] W. Eckstein, J. Nucl. Mater. 281(2000)195. [39] R. P. Doerner, M. J. Baldwin and K. Schmid, Phys. Scripta T111(2004)75. [40] K. Schmid, M. Baldwin, R. Doerner and A. Wiltner, Nucl Fusion 44(2004)815.
R-4
21
[41] R. P. Doerner, A. A Grossman, S. C. Luckhardt et al., J. Nucl. Mater. 266-269(1999)392. [42] K. Schmid, M. Baldwin and R. Doerner, J. Appl. Phys. 97(2005)064912. [43] M. J. Baldwin and R. P. Doerner, Nucl. Fusion 46(2006)444. [44] M. J. Baldwin, R. P. Doerner, K. Schmid et al., submitted to J. Nucl. Mater. (2006). [45] D. Nishijima et al., these proceedings. [46] G. Federici, A. Zhitlukhin, N. Arkhipov et al., J. Nucl. Mater. 337-339(2005)684. [47] R. Pugno et al., these proceedings. [48] K. Ashida, K. Watanabe and T. Okabe, J. Nucl. Mater. 241-243(1997)1060. [49] J. Roth, W. R. Wampler and W. Jacob, J. Nucl. Mater. 250(1997)23. [50] R. A. Anderl, G. R. Longhurst, R. J. Pawelko et al., J. Fusion Energy 16(1997)95. [51] M. Mayer, J. Nucl. Mater. 240(1997)164. [52] R. A. Causey and D. S. Walsh, J. Nucl. Mater. 254(1998)84. [53] M. J. Baldwin, K. Schmid, R. P. Doerner et al., J. Nucl. Mater. 337-339(2005)590. [54] A. V. Markin, V. P. Dubkov, A. E. Gorodetsky et al., J. Nucl. Mater. 283-287(2000)1094. [55] R. A. Causey, W. R. Wampler and D. S. Walsh, J. Nucl. Mater. 176&177(1990)992. [56] C. R. Watts, Int. J. Powder Met. 4(1968)49. [57] R. P. Doerner, M. J. Baldwin and R. A. Causey, J. Nucl. Mater. 342(2005)63. [58] Ch. Linsmeier, these proceedings. [59] R. P. Doerner, S. I. Krasheninnikov and K. Schmid, J. Appl. Phys. 95(2004)4471. [60] M. J. Baldwin, these proceedings. [61] M. Mayer, R. Berisch, H. Plank et al., J. Nucl. Mater. 230(1996)67. [62] H. Itoh, T. Matsudaira, S. Naka et al., J. Mater. Sci. 22(1987)2811. [63] T. Massalski (Ed.), Binary Alloy Phase Diagrams, ASM International, Metals Park, OH, 1987, p. 341.
R-4
22
Figure Captions
Figure 1 – Comparison of hydrogen isotope desorption characteristics from beryllium
based and carbon based codeposits.
Figure 2 – Phase diagram of beryllium boride [61].
R-4
23
Figure 1
Temperature (o C)
200 400 600 800 1000
D/B
e in
cod
epos
its (
at. %
)1
1010
0
H/C
in c
odep
osits
(at
. %)
110
100
50o C (O ~ 3 at. %)
150o C (O ~ 30 at. %)
300o C (O ~ 33 at. %)
Co-deposited a:CH layerCausey et al. J. Nucl.
Mater. 176-7 (1990) 992
Baldwin et al. J. Nucl. Mater.
337-339 (2005) 590
ITER Bake
R-4
24
Figure 2
1
P2-53
Parametric studies of carbon erosion mitigation dynamics
in beryllium seeded deuterium plasmas
D. Nishijima*, M.J. Baldwin, R.P. Doerner and R. Seraydarian
Center for Energy Research, University of California at San Diego,
9500 Gilman Dr., La Jolla, CA 92093-0417, USA
Abstract
The characteristic time of protective beryllium layer formation on a graphite target, τBe/C, has been
investigated as a function of surface temperature, Ts, ion energy, Ei, ion flux, Γi, and beryllium ion
concentration, cBe, in beryllium seeded deuterium plasma. τBe/C is found to be strongly decreased
with increasing Ts in the range of 550-970 K. This is thought to be associated with the more
efficient formation of beryllium carbide (Be2C). By scanning the parameters, a scaling expression
for τBe/C has been derived as,
τBe/C [s] = 1.0x10⁻⁷ cBe-1.9±0.1 Ei
0.9±0.3 Γi-0.6±0.3 exp((4.8±0.5)x103/Ts).
Should this scaling extend to an ITER scenario, carbon erosion of the divertor strike point region
may be reduced with characteristic time of ~ 6 ms. This is much shorter than the time between
predicted ITER type I ELMs (~ 1 s), and suggests that protective beryllium layers can be formed
in between ELMs, and mitigate carbon erosion.
2
PACS: 52.40.Hf
JNM Keywords: Beryllium, Beryllium Alloys and Compounds, Carbon, Divertor Materials,
Plasma-Materials Interaction
PSI-17 Keywords: PISCES-B, Beryllium, Carbon, Mixed-material, Chemical erosion
*Corresponding author address: Center for Energy Research, University of California at San
Diego, 9500 Gilman Dr. Mail Code: 0417, La Jolla, CA 92093, USA
*Corresponding author e-mail: [email protected]
Presenting author: Daisuke Nishijima
Presenting author e-mail: [email protected]
3
1. Introduction
Mixed-material effects have attracted great interest since ITER will have beryllium, carbon and
tungsten as plasma facing components (PFCs). Beryllium sputtered from the first wall is expected
to migrate to the divertor region, where the strike point region is made of carbon material.
Tungsten is used in the baffle region. Since the beryllium concentration in the divertor plasma is
predicted to be in the range of 0.01-0.1, interaction of beryllium with carbon and tungsten
materials may change the original properties of those materials.
Previous experiments [1, 2] on beryllium/carbon mixed-material effects in the linear
divertor plasma simulator PISCES-B revealed that both chemical and physical erosion of carbon
was mitigated by beryllium impurities in the plasma. This was identified by a reduction of CD
(A2Δ-X2Π) band intensity and C I line intensity. X-ray photoelectron spectroscopy (XPS)
analyses of these targets subsequent to plasma exposure revealed the formation of beryllium
carbide (Be2C), which is thought to play an important role in carbon erosion mitigation. Work on
beryllium/tungsten mixed-material effects has been also performed in PISCES-B, and is reported
in these proceedings [3].
In this paper we extend previous work [2] on carbon erosion mitigation in beryllium
seeded deuterium plasma. In ref. [2], the dependence of the protective beryllium layer formation
time, τBe/C, on beryllium ion concentration, cBe, was investigated. Here, we reveal further
dependence of τBe/C on other parameters, such as incident ion energy, Ei, surface temperature, Ts,
and incident ion flux, Γi. A scaling law for τBe/C is derived from a regression analysis of the data
and this scaling is used to predict carbon erosion behavior under ITER divertor relevant
4
conditions.
2. Experimental setup
Experiments are performed in the linear divertor plasma simulator PISCES-B [4], which
produces a high flux (up to 1023 m-2s-1) steady state plasma. ATJ graphite targets, 22 mm in
diameter and 2.8 mm thick, are exposed to beryllium seeded deuterium plasmas. Beryllium
impurities are injected into the plasma column using a high-temperature effusion cell (Veeco
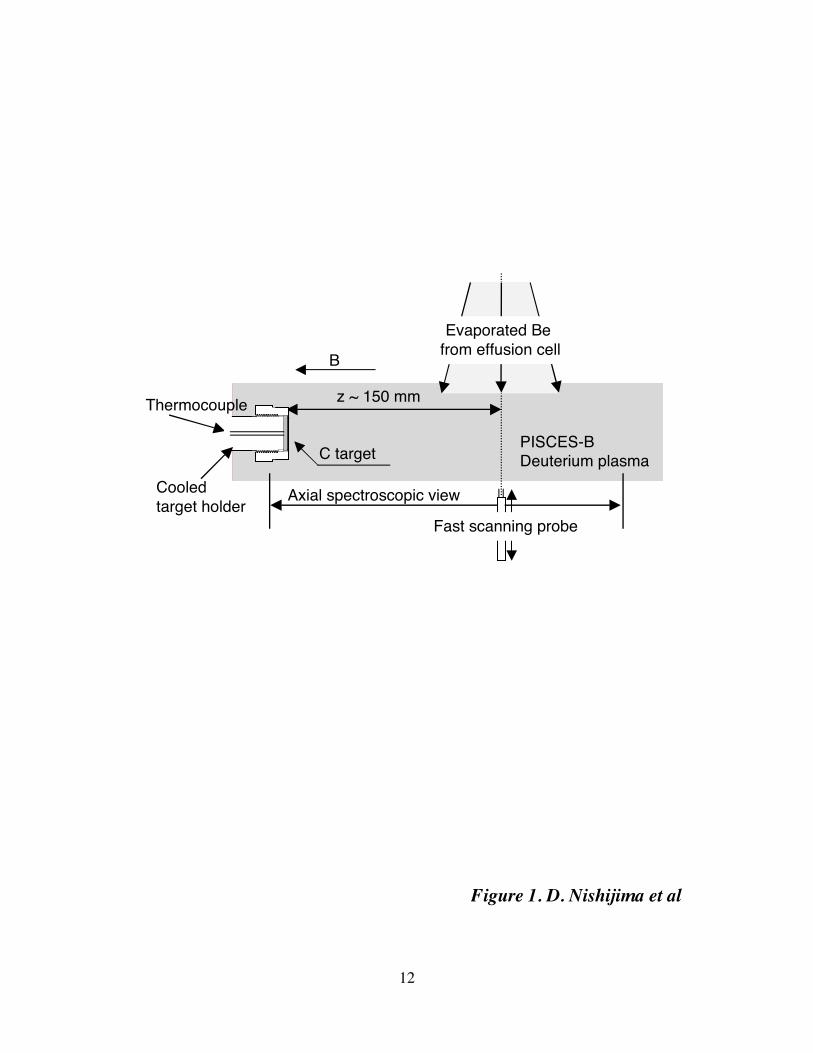
Applied EPI), located at ~ 150 mm upstream from the target as shown in figure 1. The amount of
beryllium impurities can be controlled by varying the temperature of effusion cell. The injected
beryllium atoms are ionized in the plasma and transported to the target. The singly ionized
beryllium density, nBe+, in the plasma is obtained from Be II (λ = 467.3 nm) line intensity
measured with an absolutely calibrated spectroscopic system. The necessary photon emission
coefficient is taken from the ADAS database [5]. The electron density, ne, the electron
temperature, Te, and the ion flux, Γi, are measured with a fast scanning double probe system at the
same axial position as the effusion cell. The incident ion energy, Ei, is controlled by biasing the
target with a negative potential relative to the plasma potential. The sample temperature is
measured with a thermocouple contacted to the back side of target.
3. Measuring τBe/C
The characteristic time of protective beryllium layer formation on a graphite sample, in
other words, the carbon erosion mitigation time, τBe/C, is determined from the decay of CD (A2Δ-
5
X2Π) band intensity around λ ~ 430 nm as shown in figure 2. In ref. [2], the CD band intensity
decay is found to correlate closely with beryllium layer formation on a graphite sample. At t = 0 s,
beryllium is injected into the plasma by opening the shutter of the effusion cell. During the
exposure, the Dγ intensity is fairly constant, indicating that the plasma conditions are unchanged.
The subtraction of CD band intensity taken in a region far from the target (~ 70 mm upstream) is
used to eliminate the effects of the intensity originating from wall carbon erosion [2, 6]. From the
exponential fit, τBe/C is derived in this example to be around 83 s.
4. Individual parameter dependence of τBe/C
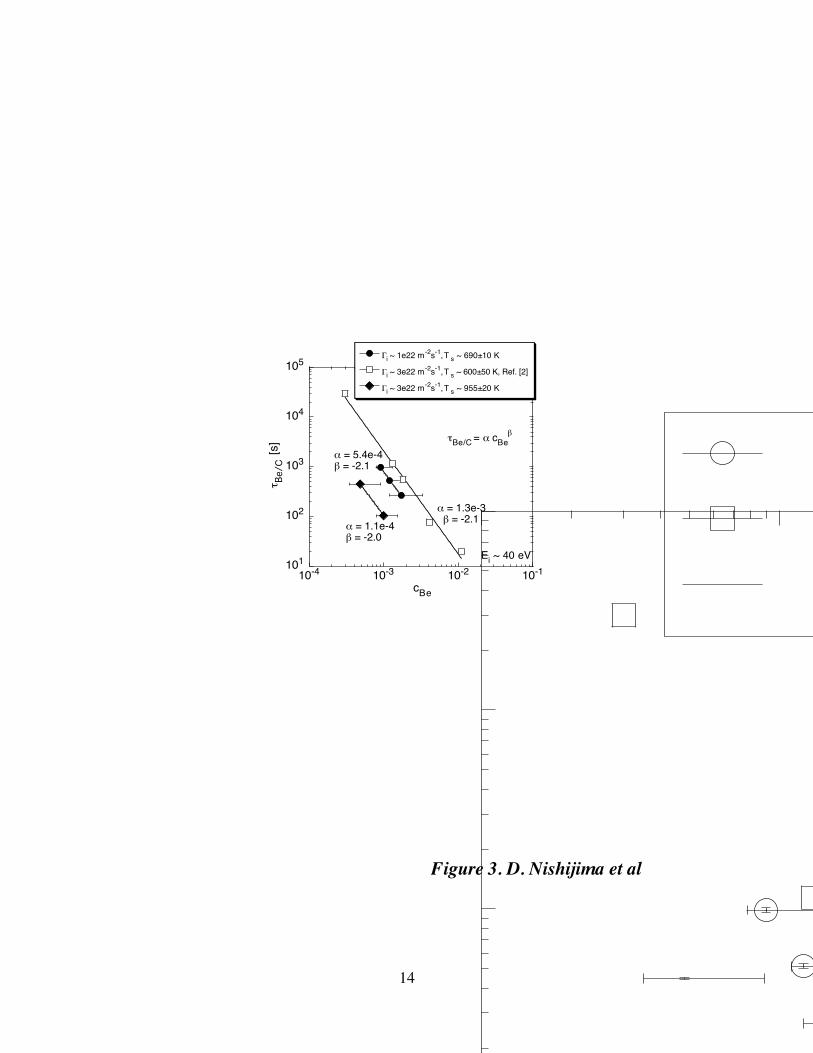
In figure 3, τBe/C is plotted as a function of beryllium ion concentration, cBe = nBe+/ne. In this data
set, Ei, Ts and Γi are kept constant for three different plasma regimes. As reported in ref. [2], the
higher cBe leads to the shorter τBe/C, where a power function fit, τBe/C = α cBeβ, gives β ~ -2. The
additional data confirm the cBe dependence of τBe/C at different Γi and Ts that were not investigated
in ref. [2].
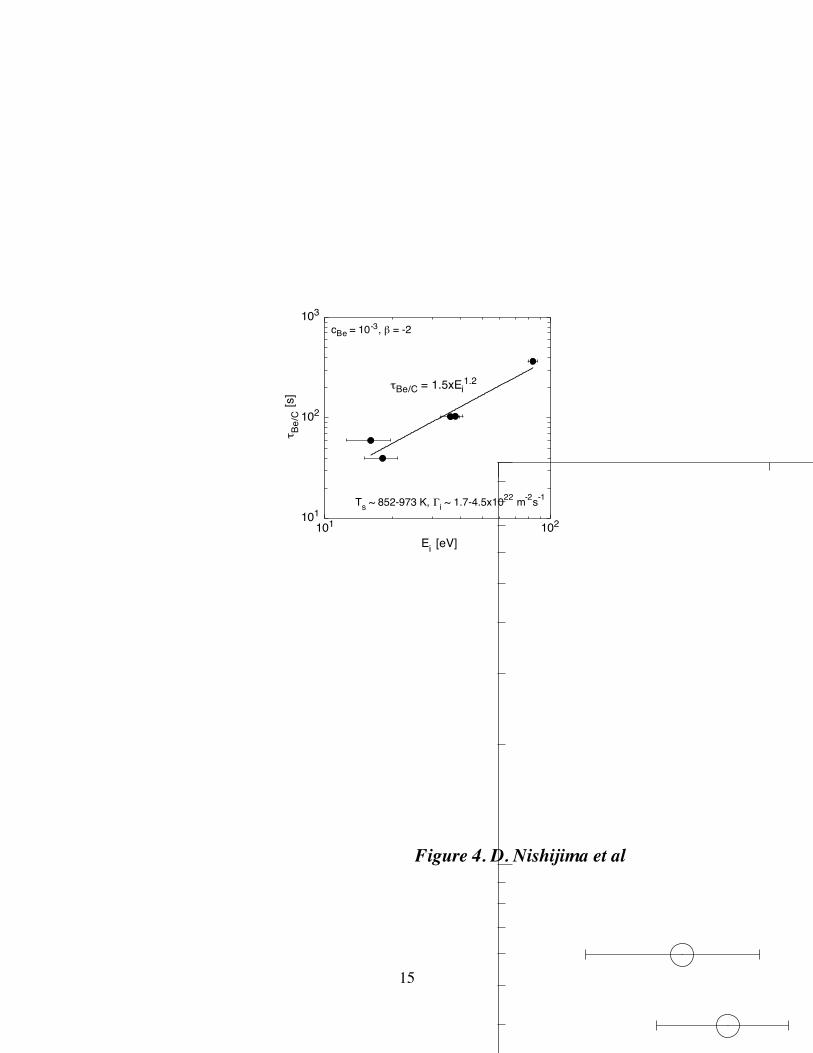
Figure 4 shows the dependence of τBe/C on Ei for the chosen value of cBe = 10-3 by
assuming β = -2 in the power law, τBe/C = α cBeβ to compensate the cBe dependence. The
dependence on Ts and Γi is not compensated. It is found from figure 4 that τBe/C increases with Ei,
at least up to ~ 85 eV. This tendency can be qualitatively explained by the fact that beryllium
deposited on the graphite target can be more readily sputtered at higher Ei, thus resulting in a
longer τBe/C.
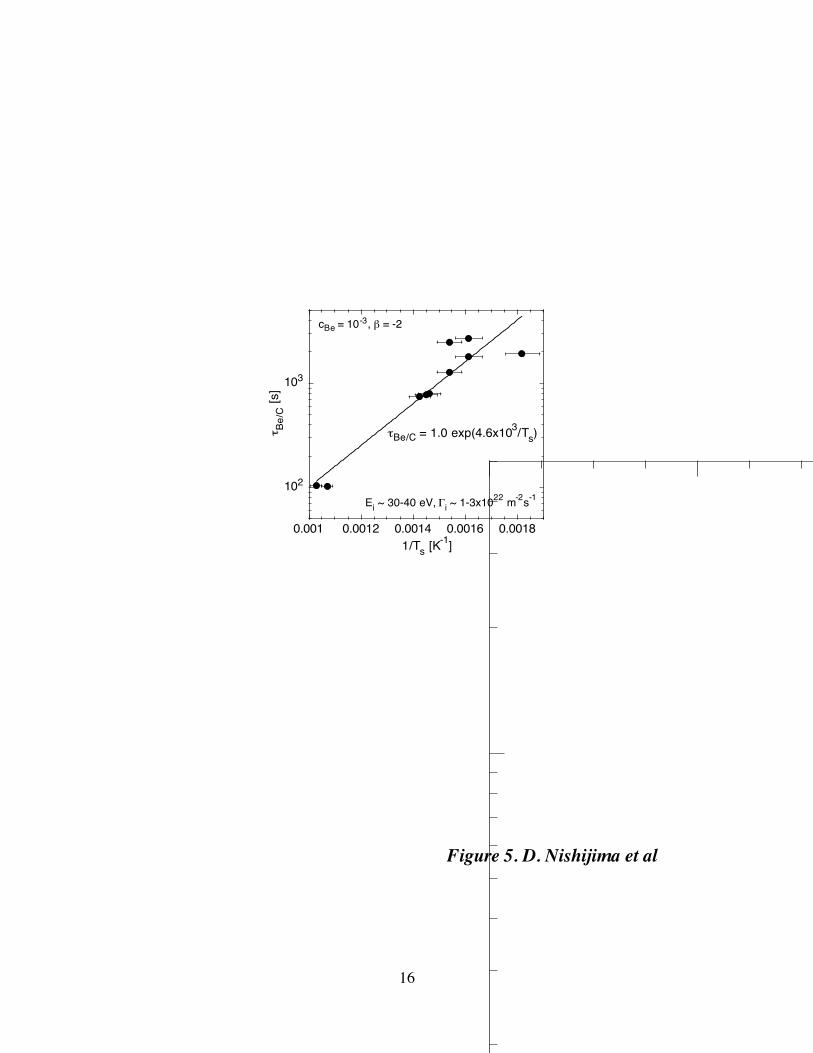
As shown in figure 5, where τBe/C is similarly calculated at cBe = 10-3 with β = -2 from measured
6
data, τBe/C is found to strongly depend on Ts. At a higher Ts of ~ 950 K (1/Ts ~ 0.001 K-1), τBe/C is
shorter than that at Ts ~ 600 K (1/Ts ~ 0.0017 K-1) by a factor of ~ 20. This observation is
qualitatively consistent with XPS analyses of graphite samples exposed to beryllium seeded
deuterium plasmas at several different Ts [7]. Namely, the higher Ts leads to increased reaction of
the beryllium and carbon, resulting in full surface carbidisation with Be2C.
An Arrhenius exponential function is used to fit the surface temperature dependent data since a
surface reaction rate, K, is generally described by an exponent of a ratio of the enthalpy of
formation, ΔH298, to Ts. The enthalpy of formation of Be2C, ΔH298(Be2C), is reported as
–117.0±1.0 kJ/mol [8], giving the Be2C formation time as, τBe2C
€
∝ 1/KBe2C
€
∝ exp(1.4e4/Ts). The
numerator in the exponential function is around 3 times larger than that in the protective
beryllium layer formation time, τBe/C
€
∝ exp(4.6e3/Ts), derived from the experiments, meaning that
τBe/C has the weaker Ts dependence than τBe2C. This implies that pure beryllium layers on Be2C
also contributes to the carbon erosion reduction especially at lower Ts and/or ΔH298(Be2C) may be
lower in the plasma-material interaction environment than the equilibrium value reported in the
literature. It should be noted that our value is very similar to around 5000 K obtained from an
Arrhenius plot of the intensity of Be2C(111) peak measured with X-ray diffractometry (XRD),
where a carbon film was deposited on a beryllium plate by rf discharge of C2H4, subsequently the
sample was heated up at given temperatures [9].
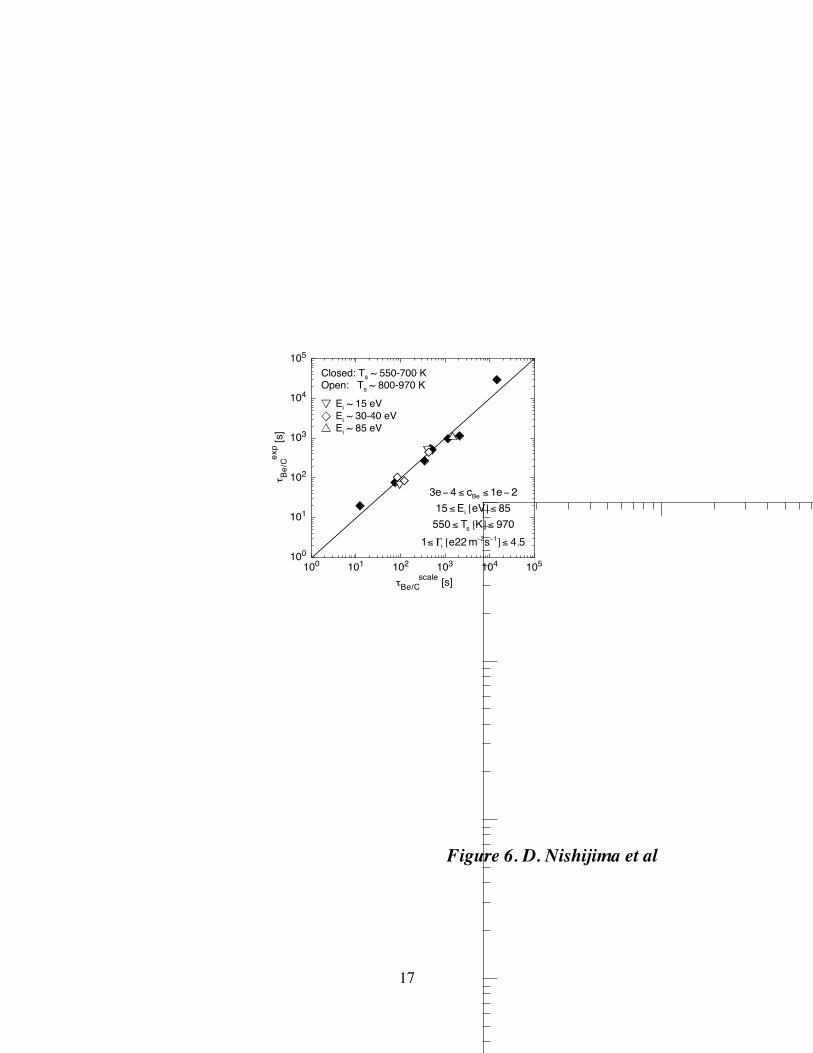
5. Scaling expression for τBe/C and extrapolation to ITER condition
Given the experimentally determined parametric forms, a regression analysis was performed with
7
the parameters, cBe, Ei, Ts and Γi to obtain a scaling law for τBe/C. In figure 6 the experimentally
derived τBe/C is compared with the scaling expression,
τBe/Cscale [s] = 1.0x10⁻⁷ cBe
-1.9±0.1 Ei0.9±0.3 Γi
-0.6±0.3 exp((4.8±0.5)x103/Ts), (1)
where cBe = nBe+/ne is dimensionless, Ei in eV, Γi in 1022 m-2s-1 and Ts in K. Each parameter scan
range is shown in the figure. The experimental values are found to agree well with the scaling law.
Note that the exponent of each parameter is slightly different from that shown in the previous
section since in the individual parameter scan (Figures 3, 4 and 5) the dependence on other
parameters are not precisely taken into account while the cBe dependence is compensated by using
β = -2.
It is found from the scaling law that τBe/C has a negative power law dependence on Γi. This is
because a larger fraction of sputtered beryllium atoms from the target is ionized in the plasma at
higher fluxes, therefore the redeposited fraction of beryllium is increased, contributing to quicker
beryllium layer formation.
Although some of typical values for the parameters expected in the ITER divertor
carbon targets are outside our scanned ranges, the scaling law can be used to predict the
protective beryllium layer formation time in the ITER situation. With cBe = 0.05, Ei = 20 eV, Ts =
1200 K and Γi = 1023 m-2s-1 [10], the scaling expression gives τBe/C ~ 6 ms, which is much shorter
than a predicted ITER type I ELM period, i.e. the inverse of ELM frequency, of ~ 1 s [11]. This
suggests that protective beryllium layers on carbon targets can be formed in between ELMs,
thereby reducing the carbon erosion during the period between ELMs.

8
6. Conclusion
We have derived a scaling expression for the characteristic formation time of protective beryllium
layer on a graphite sample from parametric scan experiments in beryllium seeded deuterium
plasmas of the PISCES-B linear divertor simulator. The scaling expression is in good agreement
with the experimentally derived beryllium layer formation time. The predicted formation time in
a typical ITER divertor condition is found to be much shorter than the inverse of expected ITER
type I ELM frequency of ~ 1 Hz. This result is favorable for mitigating carbon erosion. We plan
to extend the experimental parameter ranges to increase confidence in the scaling law.
Acknowledgements
The authors express their sincere thanks to PISCES technical staff for their professional skill and
dedication. Discussion with PISCES scientific members was really fruitful. This work is
conducted under the US Department of Energy Contract: DOE DE-FG03-95ER-54301.
9
References
[1] R.P. Doerner et al., Proc. 20th IAEA Fus. Ener. Conf. (Vilamoura, Portugal, 2004), IT/P3-18.
[2] M.J. Baldwin and R.P. Doerner, Nucl. Fusion 46 (2006) 444.
[3] M.J. Baldwin et al., in these proceedings.
[4] R.P. Doerner et al., Physica Scripta. T111 (2004) 75.
[5] H.P. Summers, Atomic Data and Analysis Structure-User Manual, Report JET-IR(94), JET
Joint Undertaking, Abingdon (1994).
[6] D.G. Whyte et al., Nucl. Fusion 41 (2001) 47.
[7] M.J. Baldwin et al., submitted to J. Nucl. Mater.
[8] O. Kubaschewski et al., Materials Thermo-chemistry, 6th Ed., Pegamon Press, Oxford 1993.
[9] K. Ashida et al., J. Nucl. Mater. 241-243 (1997) 1060.
[10] G. Federici et al., J. Nucl. Mater. 266-269 (1999) 14.
[11] G. Federici et al., Plasma Phys. Control. Fusion 45 (2003) 1523.
10
Figure captions
Figure 1. Schematic view of the target region in the linear divertor plasma simulator PISCES-B.
A graphite target is exposed to a beryllium seeded deuterium plasma.
Figure 2. Time evolution of Dγ, normalized Be I (457.3 nm) and CD (A2Δ-X2Π) band intensity
near the target during a beryllium seeded deuterium plasma exposure of a graphite target (cBe ~
1.3x10⁻³, Ts ~ 800 K, Ei ~ 34 eV, Γi ~ 3.5x10²² m-2s-1). The CD band intensity taken in a region far
from the target is subtracted from that near the target to eliminate changes in the CD band
intensity originating from wall carbon erosion.
Figure 3. Beryllium ion concentration, cBe, dependence of τBe/C at three different conditions with
Ei of ~ 40 eV. Circles: Γi ~ 1x10²² m-2s-1, Ts ~ 690±10 K, Squares: Γi ~ 3x10²² m-2s-1, Ts ~ 600±50
K [2], Diamonds: Γi ~ 3x10²² m-2s-1, Ts ~ 955±20 K. Lines show results of power function fits
(τBe/C = α cBeβ), revealing β ~ -2.
Figure 4. Incident ion energy, Ei, dependence of τBe/C. To compensate the cBe dependence, τBe/C is
calculated at cBe = 10-3 with β = -2 in the power law, τBe/C = α cBeβ, from measured data.
Figure 5. Surface temperature, Ts, dependence of τBe/C. Similarly, τBe/C is derived at cBe = 10-3 with
β = -2 from measured data.
11
Figure 6. Comparison of experimental protective beryllium layer formation time, τBe/Cexp, with the
scaling expression in eq. (1).
12
Figure 1. D. Nishijima et al
Cooled target holder
PISCES-B Deuterium plasmaC target
Axial spectroscopic view
z ~ 150 mm
Fast scanning probe
Evaporated Be from effusion cellB
Thermocouple

13
Figure 2. D. Nishijima et al
10-4
10-3
10-2
10-1
100
101
0 100 200 300 400 500 600
Inte
nsity
[a.u
.]
Time [s]
IDγ
IBeI/IDγ
ICD/IDγ(near)- ICD/IDγ(far)
20060322
τBe/C = 83±1 sec
14
Figure 3. D. Nishijima et al
101
102
103
104
105
10-4 10-3 10-2 10-1
Γi ~ 1e22 m-2s-1, T s ~ 690±10 K
Γi ~ 3e22 m-2s-1, T s ~ 600±50 K, Ref. [2]
Γi ~ 3e22 m-2s-1, T s ~ 955±20 K
τ Be/
C [s
]
cBe
α = 1.3e-3β = -2.1
α = 1.1e-4β = -2.0
α = 5.4e-4β = -2.1
τBe/C = α cBeβ
Ei ~ 40 eV
15
Figure 4. D. Nishijima et al
101
102
103
101 102
τ Be/
C [s
]
Ei [eV]
cBe = 10-3, β = -2
Ts ~ 852-973 K, Γi ~ 1.7-4.5x10²² m-2s-1
τBe/C = 1.5xEi1.2
16
Figure 5. D. Nishijima et al
102
103
0.001 0.0012 0.0014 0.0016 0.0018
τ Be/
C [s
]
1/Ts [K-1]
Ei ~ 30-40 eV, Γi ~ 1-3x10²² m-2s-1
cBe = 10-3, β = -2
τBe/C = 1.0 exp(4.6x10³/Ts)
17
Figure 6. D. Nishijima et al
100
101
102
103
104
105
100 101 102 103 104 105
τ Be/
Cexp [s
]
τBe/Cscale [s]
Closed: Ts ~ 550-700 KOpen: Ts ~ 800-970 K
Ei ~ 15 eVEi ~ 30-40 eVEi ~ 85 eV
€
3e−4 ≤ cBe ≤1e− 215 ≤Ei [eV]≤ 85
550 ≤ Ts [K]≤ 9701≤ Γi [e22 m−2s−1]≤ 4.5
1
P3-43
Examination of the velocity time-delay-estimation technique
J. H. Yu*, C. Holland, G. R. Tynan, G. Antar, Z. Yan
University of California, San Diego, La Jolla, CA 92093, USA
Abstract
The one-dimensional time-delay-estimation (TDE) velocity technique infers the
velocity of plasma fluctuations using cross-correlations between two spatially separated signals,
and here this technique is evaluated using experimental results and numerical simulations. Probe
arrays and a fast-framing imaging camera are used to measure the azimuthal fluctuation
propagation speed in a cylindrical magnetized plasma device. The time-averaged TDE velocity
field obtained in this way is found to be approximately 30% larger than Mach probe
measurements of the plasma fluid velocity, suggesting that the TDE method infers the plasma
ExB velocity and presumably a diamagnetic flow. The TDE technique is also applied to
turbulent simulation data with known velocity fields. The results show that one-dimensional
TDE techniques can be used to infer the large-scale, slowly varying velocity, but that small scale
or turbulent velocity fields cannot be reliably inferred with such one-dimensional approaches.
PACS: 52.30.-q, 52.35.Ra, 52.35.KtJNM keywords: Diffusion, Experimental TechniquesPSI-17 keywords: Cross-Field Transport, Edge Plasma, Fluctuations and turbulence, Plasma flow*Corresponding author address: 9500 Gilman Dr., MC 0417, La Jolla, CA 92093, USA*Corresponding author E-mail: [email protected] author: Jonathan H. YuPresenting author e-mail: [email protected]
2
INTRODUCTION
Measurements of both the time-averaged and turbulent plasma velocity fields are
desirable to validate theories and simulations of edge plasma turbulence, edge plasma flows,
material migration, and plasma surface interactions. Several schemes for inferring the plasma
velocity field from time-resolved imaging diagnostics have recently been proposed [1,2,3]. The
simplest of these schemes is based on the cross-correlation analysis of two spatially-separated
fluctuation measurements, and we denote this technique as the velocity time-delay estimation
(TDE).
The TDE method has a rich history in neutral fluids [4]. In recent work the TDE method
is applied to density fluctuation measurements obtained with beam emission spectroscopy [5],
showing the existence of geodesic acoustic modes [6] (GAMs), which are finite frequency zonal
flows [7] and are believed to be a major player in edge turbulence in DIII-D and other machines
such as ASDEX Upgrade, JFT-2M, and the CHS stellarator. The TDE technique is being
pursued as a way to infer the turbulent velocity associated with turbulent fluxes at locations
inside the separatrix [8,9]. Caution should be used, however, when applying the results of the
TDE algorithm to quantify the actual advection of particles (which is due only to guiding center
drifts such as ExB flow). The fluctuations generally cannot be treated as passive tracers in a
background advecting flow, because diamagnetic effects can drive a phase velocity relative to
the mean plasma flow.
In this paper, we focus on steady flows in the experiments, and compare the 1D TDE
scheme applied to probes and imaging data. Both the probes and the fast-framing imaging yield
similar TDE velocity profiles, opening the possibility of using images to infer the velocity field
in regions where probes cannot be used. The TDE measurement is then compared to Mach
3
probe measurements of the ion fluid velocity. We use simulations to further understand how the
TDE technique relates to ExB drifts and diamagnetic effects.
TDE METHOD
Fluctuations (density, potential, or image intensity) are sampled at rate 1/t, and the time
lag p is calculated between the two spatially-separated signals based on the peak of the cross
correlation
txxntxndt
TR
Tt
Tt
x ,,1 2/
2/
, where n is the measured signal and T is the
duration over which each cross correlation is calculated. From the peak time lag and known
separation distance x, the TDE velocity is calculated as VTDE = x/p. By moving the time
window T and repeating the calculation, an ensemble of different realizations is used in
calculating VTDE, thus reducing the error. Denoting the total number of time windows as N, the
TDE velocity can be obtained by finding the mean velocity from N time windows, allowing a
measure of the statistical variation in VTDE. Alternatively, the N correlation functions from all
time windows can be averaged, and the mean velocity found from the peak of the average
correlation function. We have tested both methods and they yield similar results; in the data
presented here, we use the method that allows error bars to be calculated from the statistical
variation.
The range of velocities that the TDE method can reliably infer is limited by the fact that
the signals are discretely sampled over a finite time window. If we denote the length of the time
window under consideration as T, then there is a maximum lag that can be inferred, max = T/2,
which in turn specifies a minimum velocity magnitude Vmin = x/max that can be inferred.
Discrete sampling implies that there is a maximum velocity magnitude that can be inferred, Vmax
4
= xt, such that fluctuations do not move a distance x in a time faster than t. Note that
interpolation can be used to reduce the size of t significantly below the sampling period. In
addition, the timescale decor for the turbulence to decorrelate must be longer than the time
window T so that the flow is approximately steady within T, because the TDE method relies on
the Taylor frozen-flow hypothesis. Therefore, the range of inferable velocity magnitudes is
bounded, with the range given by
t
xV
T
xx
decor
22
. (1)
In Ref. [3], the TDE method was applied to test signals with known velocity fields in the
presence of noise, showing that the TDE method reliably infers the mean velocity with
magnitude greater than or equal to 0.2 x/t with signal to noise ratios larger than 10, and
reliably infers time-dependent flows if the flow varies sufficiently slowly (f < 2/T).
EXPERIMENTAL SET-UP AND RESULTS
The experiments are performed with the Controlled Shear De-correlation Experiment
(CSDX) plasma device, which uses an azimuthally symmetric half-wavelength helicon antenna
operating at 13.56 MHz with 1500 W of power (less than 20 W is reflected), with an Argon gas
pressure of 3.0 mTorr. The plasma source radius is approximately 4.5 cm and is connected to a
downstream cylindrical chamber of 10 cm radius and approximately 3 m length which is
immersed in a solenoidal magnetic field of 1 kG (directed from the downstream end of the
chamber toward the source). The field lines terminate on insulating surfaces in the plasma
source and on the downstream end the field lines terminate on an insulating vacuum window,
through which an axial view of the plasma column is recorded with a fast-framing camera. All
5
of the probe data shown here are obtained a distance 75 cm downstream from the exit plane of
the plasma source, sampled at 1 MHz with azimuthal probe separation x = 0.5 cm. At 1 kG, the
ion cyclotron frequency for Argon fci = ci/2 = 38 kHz, the sound speed
5107.2 ies MTC cm/s (using Te = 3.0 eV), and ion-sound gyroradius s = Cs/ci = 1.1
cm; the density scale length (in the region of strongest gradient) 3ln 10 dxndLn cm. A
more detailed description of the plasma source and fluctuation characteristics can be found in the
literature [10,11,12,13].
A four tip Mach probe is used to measure the plasma flow velocity, in both the parallel
and perpendicular directions with respect to the axial magnetic field. The measurement is based
on taking the ratio RM of ion saturation currents from two 180-degree opposed probes. By
rotating the Mach probe, RM is measured as a function of the angle between the line connecting
opposing probes and B. Following recent work by Shikama et al. [14], we then fit the data with
a function of the form )]sincos(/sinexp[ perpparM MMKR
, where is the
acceptance angle of each probe tip, Mpar and Mperp are used as fitting parameters, and we use
Hutchinson’s model of ion collection [15] with K = 1.34.
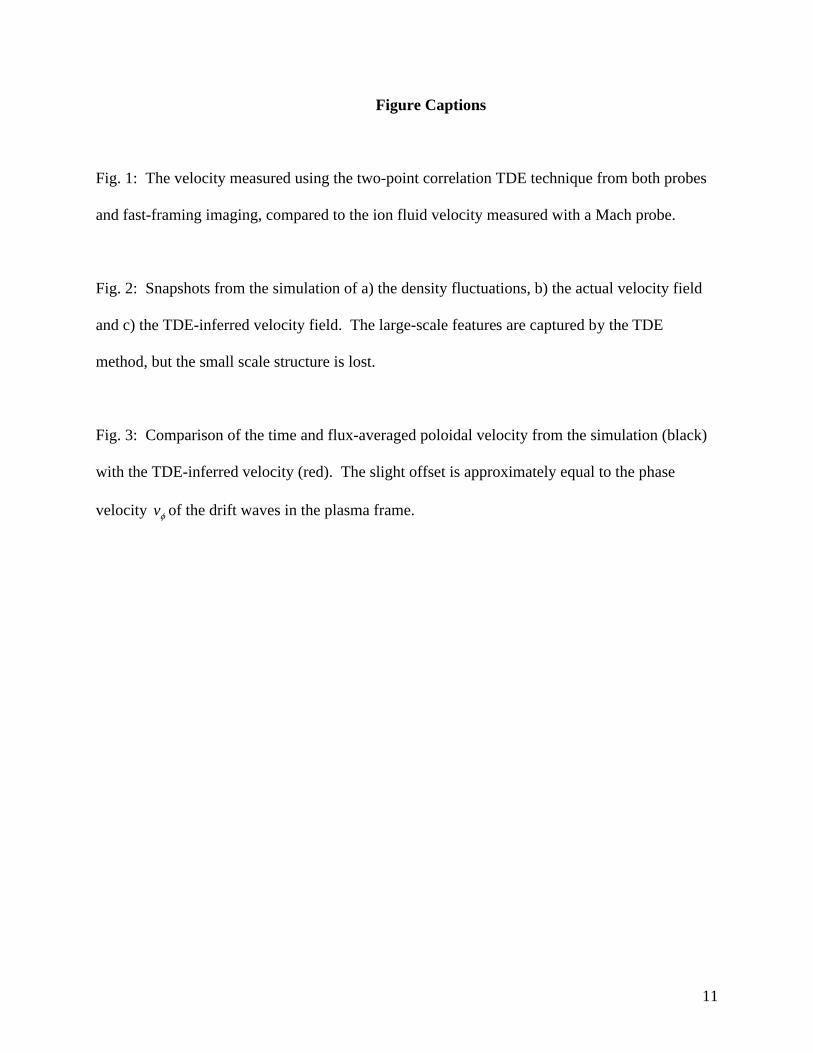
Fig. 1 shows the TDE velocity obtained from probes and fast-framing imaging, compared
with the azimuthal fluid velocity measured with the Mach probe. Here, the Mach probe velocity
perpsM MrCv )( includes radial variation of Cs due to Te(r). Applying the TDE algorithm to the
probe data yields a velocity profile shown by the red points. Images of the plasma viewed along
an axial line-of-sight are obtained with a Phantom v.7.1 fast framing camera, using a frame rate
of 67 kHz and spatial resolution of 64x64 pixels. We apply the TDE technique to 1500 frames
of broadband emission intensity recorded by two pixels that image two azimuthally-separated
6
locations in the plasma. The results demonstrate that the TDE technique applied to imaging data
agrees with the TDE velocity obtained from probes. We also observe that the TDE velocity is
approximately 30% larger than the ion fluid velocity measured by the Mach probe. The results
suggest that the fluctuations are advected by the plasma ExB flow and have an inherent phase
velocity v , which is presumably given by the dominant drift mode plasma-frame phase velocity
driven by diamagnetic effects.
SIMULATION AND RESULTS
We can quantify the significance of the diamagnetic contribution to the TDE velocity
using results from drift turbulence simulations with known advecting velocities and known
pressure gradients, that is, with known ExB and drift wave phase velocities. Using a modified
Hasagawa-Wakatani model [16] to describe a simple drift-wave system, we have applied to the
TDE technique to fluctuations that naturally result from the turbulent simulation. The equations
used in the simulation are given by
,~~~~~2
||0 nDn
dx
dnV
dt
ndx (2)
,~~~
~4
||
2
ndt
d(3)
where the tildes denote fluctuating quantities, n and refer to the density and potential, is the
normalized ion viscosity, the time scales have been normalized by ns LC / , and the spatial scales
have been normalized by s . The “adiabatic parameter” ethe
vk 22|||| quantifies the degree to
which the Boltzmann relation eBe Tkenn /exp0 is maintained via parallel electron
dynamics (where ethv is the electron thermal speed and e is the electron collision frequency).
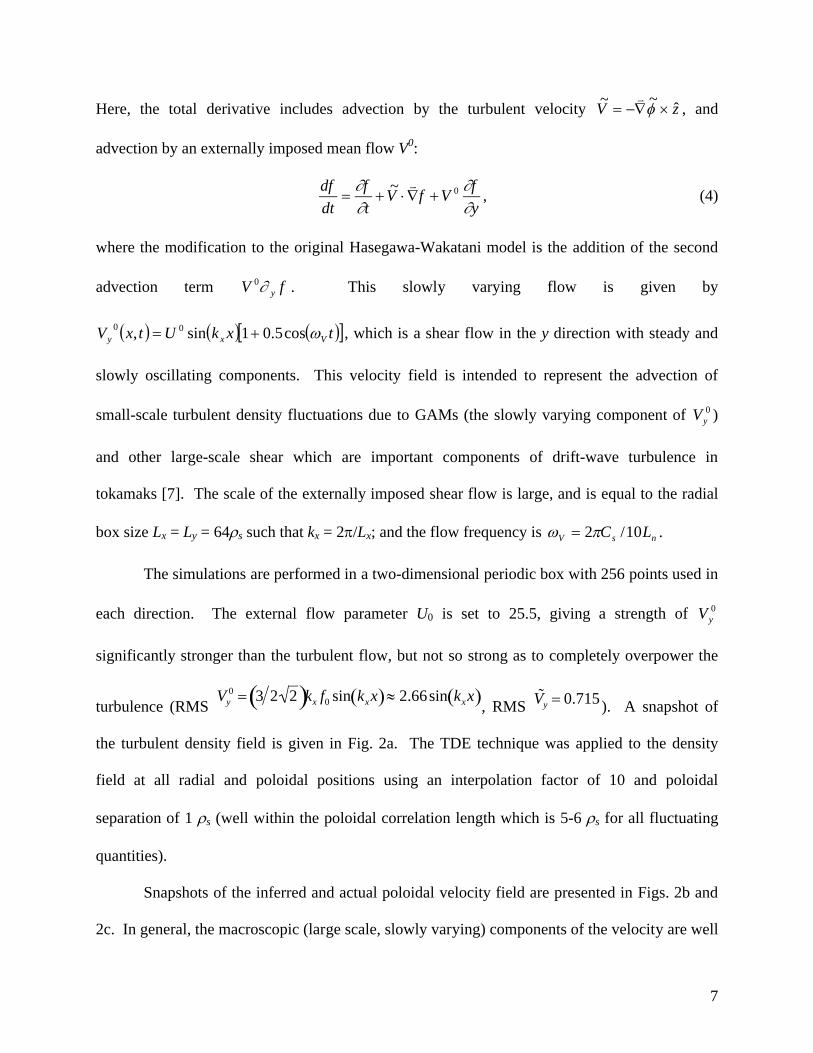
7
Here, the total derivative includes advection by the turbulent velocity zV ˆ~~
, and
advection by an externally imposed mean flow V0:
y
fVfV
t
f
dt
df
0~
, (4)
where the modification to the original Hasegawa-Wakatani model is the addition of the second
advection term fV y0 . This slowly varying flow is given by
txkUtxV Vxy cos5.01sin, 00 , which is a shear flow in the y direction with steady and
slowly oscillating components. This velocity field is intended to represent the advection of
small-scale turbulent density fluctuations due to GAMs (the slowly varying component of 0yV )
and other large-scale shear which are important components of drift-wave turbulence in
tokamaks [7]. The scale of the externally imposed shear flow is large, and is equal to the radial
box size Lx = Ly = 64s such that kx = 2/Lx; and the flow frequency is nsV LC 10/2 .
The simulations are performed in a two-dimensional periodic box with 256 points used in
each direction. The external flow parameter U0 is set to 25.5, giving a strength of 0yV
significantly stronger than the turbulent flow, but not so strong as to completely overpower the
turbulence (RMS Vy
0 3 2 2 kx f0 sin kxx 2.66sin kxx , RMS
˜ V y 0.715). A snapshot of
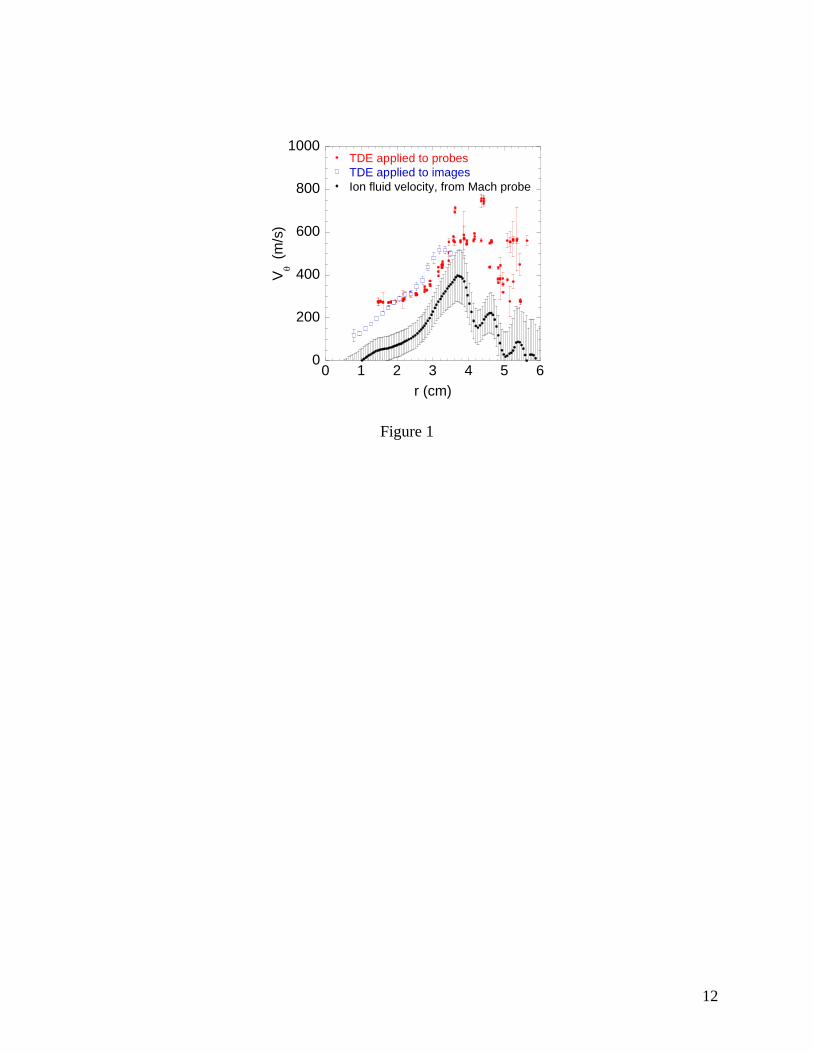
the turbulent density field is given in Fig. 2a. The TDE technique was applied to the density
field at all radial and poloidal positions using an interpolation factor of 10 and poloidal
separation of 1 s (well within the poloidal correlation length which is 5-6 s for all fluctuating
quantities).
Snapshots of the inferred and actual poloidal velocity field are presented in Figs. 2b and
2c. In general, the macroscopic (large scale, slowly varying) components of the velocity are well
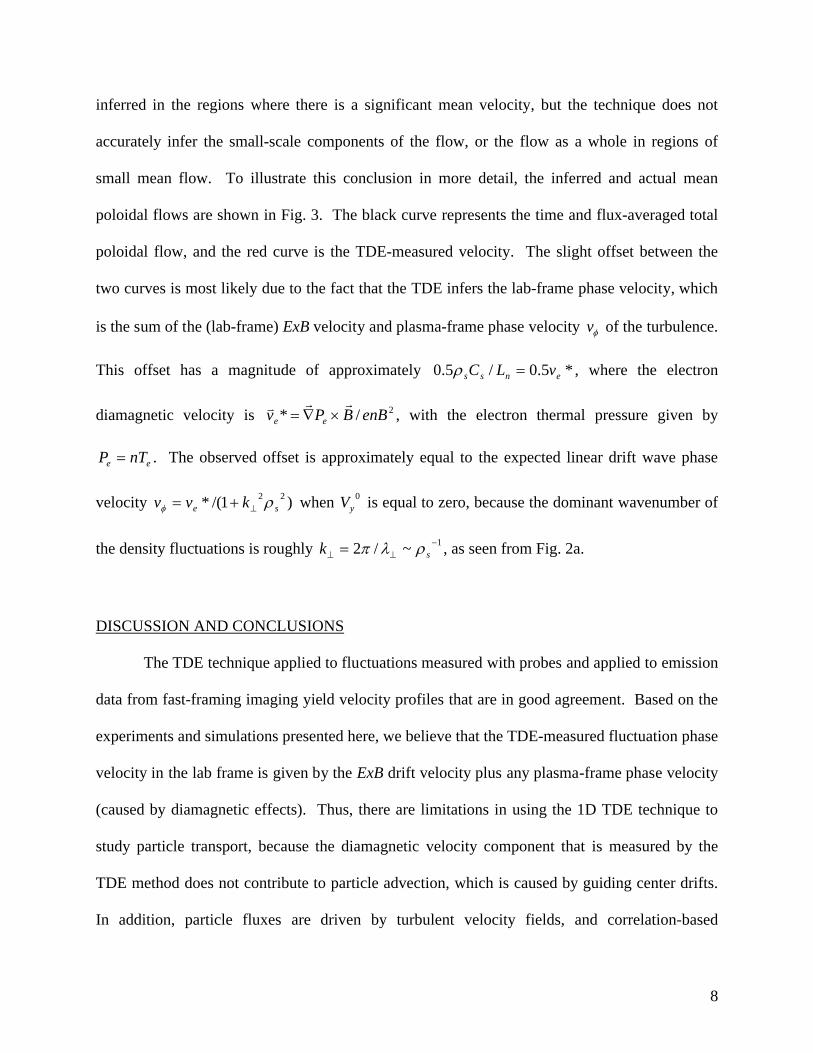
8
inferred in the regions where there is a significant mean velocity, but the technique does not
accurately infer the small-scale components of the flow, or the flow as a whole in regions of
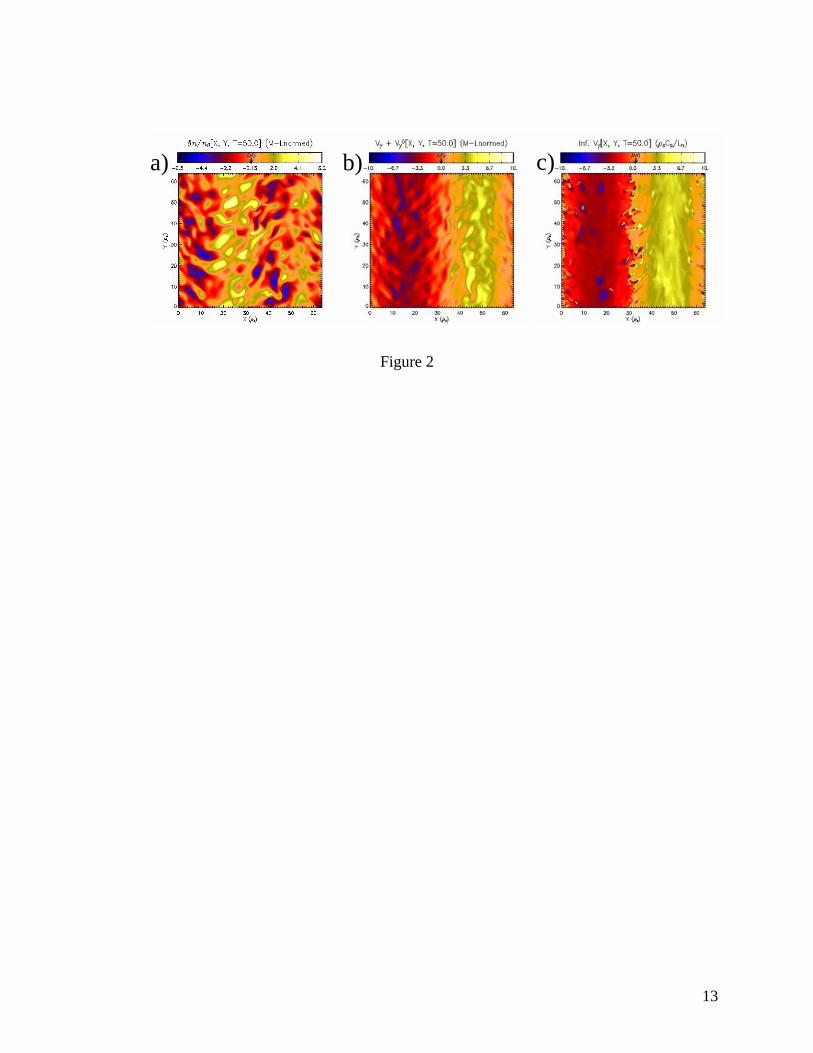
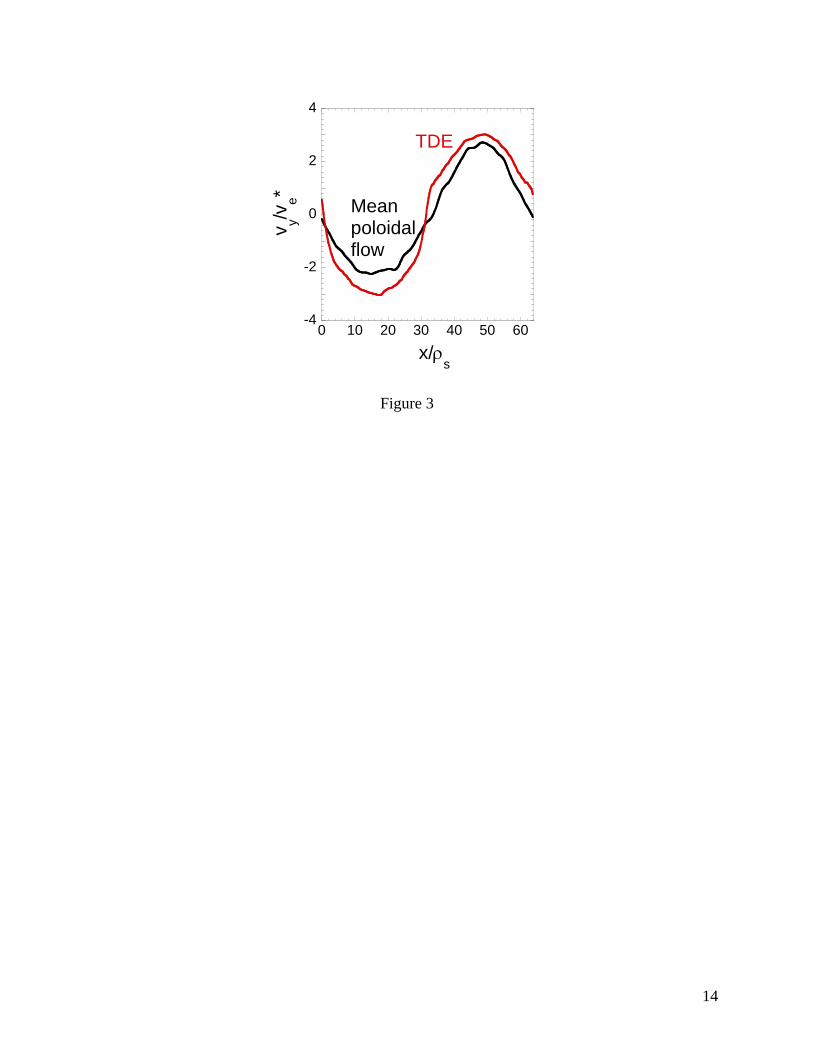
small mean flow. To illustrate this conclusion in more detail, the inferred and actual mean
poloidal flows are shown in Fig. 3. The black curve represents the time and flux-averaged total
poloidal flow, and the red curve is the TDE-measured velocity. The slight offset between the
two curves is most likely due to the fact that the TDE infers the lab-frame phase velocity, which
is the sum of the (lab-frame) ExB velocity and plasma-frame phase velocity v of the turbulence.
This offset has a magnitude of approximately *5.0/5.0 enss vLC , where the electron
diamagnetic velocity is 2/* enBBPv ee
, with the electron thermal pressure given by
ee nTP . The observed offset is approximately equal to the expected linear drift wave phase
velocity )1/(* 22se kvv when 0
yV is equal to zero, because the dominant wavenumber of
the density fluctuations is roughly 1~/2 sk , as seen from Fig. 2a.
DISCUSSION AND CONCLUSIONS
The TDE technique applied to fluctuations measured with probes and applied to emission
data from fast-framing imaging yield velocity profiles that are in good agreement. Based on the
experiments and simulations presented here, we believe that the TDE-measured fluctuation phase
velocity in the lab frame is given by the ExB drift velocity plus any plasma-frame phase velocity
(caused by diamagnetic effects). Thus, there are limitations in using the 1D TDE technique to
study particle transport, because the diamagnetic velocity component that is measured by the
TDE method does not contribute to particle advection, which is caused by guiding center drifts.
In addition, particle fluxes are driven by turbulent velocity fields, and correlation-based
9
algorithms such as TDE fail to infer rapidly varying velocity fields. The TDE technique can,
however, be used to infer large-scale, slowly varying velocities, such as the equilibrium and
slowly varying ExB flow within a flux surface in the scrape-off-layer of tokamaks. More
advanced schemes such as 2D velocimetry [1] or orthogonal dynamic programming [17] may be
more successful in overcoming some of the TDE limitations, and will be pursued in future work.
ACKNOWLEDGEMENTS
This research was performed under U.S. Department of Energy (DOE) grants DE-FG02-
04ER54773 and DE-FG02-04ER54734. CH performed this research under appointment to the
Fusion Energy Postdoctoral Research Program administered by the Oak Ridge Institute for
Science and Education under contract number DE-AC05-00OR22750 between the U.S. DOE
and Oak Ridge Associated Universities.
10
REFERENCES
[1] G. R. McKee, R. J. Fonck, D. K. Gupta, D. J. Schlossberg, M. W. Shafer, Rev. Sci. Instr. 75
(2004) 3490.
[2] J. L. Terry, S. J. Zweben, O. Grulke, M. J. Greenwald, B. LaBombard, J. Nucl. Mat. 337-339
(2005) 322.
[3] C. Holland, G. R. Tynan, G. R. McKee, R. J. Fonck, Rev. Sci. Instr. 75 (2004) 4278.
[4] Y. T. Chan, J. M. F. Riley, J. B. Plant, IEEE Trans. Acoust. Speech Signal Process. ASSP-29
(1981) 577.
[5] G. R. McKee, R. J. Fonck, M. Jakubowski, K. H. Burrell, K. Hallatschek, R. A. Moyer, D.
L. Rudakov, W. Nevins, G. D. Porter, P. Schoch, X. Xu, Phys. Plasmas 10 (2003) 1712.
[6] K. Hallatschek, D. Biskamp, Phys. Rev. Lett. 86 (2001) 1223.
[7] Diamond, P. H., Itoh, S.-I., Itoh, K., Hahm, T.S., Plasma Phys. Controlled Fusion 47 (2005)
R35.
[8] M. Jakubowski, R. J. Fonck, G. R. McKee, Phys. Rev. Lett. 89 (2002) 265003-1/4.
[9] G.R. McKee, R.J. Fonck, M. Jakubowski, K.H. Burrell, K. Hallatschek, R.A.Moyer, D.L.
Rudakov, W. Nevins, G.D. Porter, P. Schoch, X. Xu, Phys. Plasmas 10 (2003) 1712.
[10] G. R. Tynan, A. D. Bailey III, G. A. Campbell, R. Charatan, A. de Chambrier, G. Gibson,
D. J. Hemker, K. Jones, A. Kuthi, C. Lee, T. Shoji, M.Wilcoxson, J. Vac. Sci. Tech-A 15 (1997)
2885.
[11] J. George, Experimental Study of Linear Resistive Drift Waves in a Cylindrical Helicon
Plasma Device, M.S. Thesis, Department of Mechanical and Aerospace Engineering, University
of California, San Diego (2002).
[12] G. R. Tynan, M.J. Burin, C. Holland, G. Antar, N. Crocker, P.H. Diamond, Phys. Plasmas
11 (2004) 5195.
[13] M. Burin, G. Antar, N. Crocker, G.R. Tynan, Phys. Plasmas 12 (2005) 052320.
[14] T. Shikama, S. Kado, A. Okamoto, S. Kajita, S. Tanaka, Phys. of Plas. 12, 044504 (2005).
[15] I. H. Hutchinson, Plasma Phys. Cont. Fusion 47, 71 (2005).
[16] A. Hasegawa, M. Wakatani, Phys. Rev. Lett. 50 (1983) 682.
[17] G. M. Quenot, J. Pakleza, T. A. Kowalewski, Exp. Fluids 25 (1998) 177.
11
Figure Captions
Fig. 1: The velocity measured using the two-point correlation TDE technique from both probes
and fast-framing imaging, compared to the ion fluid velocity measured with a Mach probe.
Fig. 2: Snapshots from the simulation of a) the density fluctuations, b) the actual velocity field
and c) the TDE-inferred velocity field. The large-scale features are captured by the TDE
method, but the small scale structure is lost.
Fig. 3: Comparison of the time and flux-averaged poloidal velocity from the simulation (black)
with the TDE-inferred velocity (red). The slight offset is approximately equal to the phase
velocity v of the drift waves in the plasma frame.
12
0
200
400
600
800
1000
0 1 2 3 4 5 6
TDE applied to probesTDE applied to imagesIon fluid velocity, from Mach probe
V (
m/s
)
r (cm)
Figure 1
13
Figure 2
a) b) c)
14
-4
-2
0
2
4
0 10 20 30 40 50 60
v y/ve*
x/s
TDE
Meanpoloidalflow
Figure 3
P2-25
Be-W alloy formation in static and divertor-plasma simulator
experiments
M. J. Baldwin(a)*, D. Buchenauer(b), R. P. Doerner(a), R.A. Causey(b), D. Nishijima(a),
W.M. Clift(b) and K. Schmid(c)
(a) University of California at San Diego, CA 92093 USA
(b) Sandia National Laboratories, Livermore, CA 94550, USA
(c) Max-Planck Institut für Plasmaphysik, Garching Germany
Abstract
Collaborative Be–W interaction experiments conducted at UC-San Diego
PISCES, and Sandia National Laboratories-Livermore, CA (SNL/CA), are reported. In
the divertor-plasma simulator PISCES–B, W targets are exposed to Be seeded D2 plasma
in the temperature range 1070–1320 K. All targets reveal the formation of surface Be–W
alloying. The alloy reaction rate is found to increase with surface temperature in the
range 1023–1123 K in SNL vacuum-deposition phase formation experiments. In both
sets of experiments the efficiency of surface alloying is found to depend on the
availability of surface deposited Be. This availability is reduced by evaporation at high
temperature, and also by plasma re-erosion in the case of PISCES–B targets. Surface
analysis of targets using Auger electron spectroscopy (AES), wavelength dispersive x-ray
spectroscopy (WDS), and x-ray diffraction (XRD) reveals Be12W as the dominant alloy
composition where Be surface availability is optimal.
JNM Keywords: Beryllium, Beryllium Alloys and Compounds, Divertor Materials,
First Wall Materials, Plasma-Materials Interaction, Tungsten, Tungsten Alloys and
Compounds
PSI-17 Keywords: Beryllium, ITER, mixed materials, PISCES-B, tungsten
PACS: 52.40.Hf
Corresponding Author address: UCSD Center for Energy Research, 9500 Gilman
Drive, La Jolla, CA 92093-0417 USA
E-mail address: [email protected]
Presenting author: Dr. Matthew James Baldwin
Presenting author E-mail address: [email protected]
1. Introduction
The current ITER design makes use of Be, W and C (graphite) plasma facing
component (PFC) materials [1]. In the near future, JET will undertake ‘ITER-like wall’
experiments where a combination of these materials is also to be investigated [2]. In both
devices, a Be first wall and a full or partial, W divertor will be common and the divertor
plasma is expected to contain ionized Be due to first-wall erosion. In ITER, the fraction
of Be in the plasma, eBeBennf ++ ≈ , is expected to be in the range 0.01–0.10 [3], leading
to an incident flux of ~100–1000 ML s–1 of Be on ITER divertor surfaces.
A real concern, where Be and W interact, is the formation of Be-W alloy. All
Be–W alloy compositions have partial equilibrium liquid phases at or significantly below
the melting point of W (3695 K) [4]. For dissolved Be levels ~5–67 at. %, a liquid phase
component precipitates above ~2370 K . With increasing Be content, the stable alloy
stiochiometries Be2W, Be12W and Be22W are known to form, and these have molten
phase components at ~2520 K, ~1780 K, and ~1600 K respectively. While the
operational temperature range for ITER W PFCs is expected to be lower than this, at
~600–1300 K [5], localized hot regions and the effects of ELMs may see surface
temperature excursions well into the Be–W partial liquid phase regime. Should Be
transport into the W bulk be rapid enough that alloy formation is not limited to the near
surface, a potentially serious problem that could affect reactor operation and PFC lifetime
is possible.
2. Experiments
2.1. UC–PISCES
Plasma–materials interactions (PMI) studies are conducted in the PISCES–B
divertor plasma simulator. PISCES–B produces intense deuterium plasmas (ne~1018–1019
m–3, Te~6–12 eV as measured by Langmuir probe) that can be seeded with controlled
amounts of Be using a neutral Be atom source [3, 6]. Polished ITER grade W targets, 25
mm in diameter and 1 mm thick are exposed to high-flux ( +ΓD
=0.2–1.0 ×10²³ ions m–2s–
1) plasma over ~3600 s with set in the range 0.0005–0.008. Plasma conditions and
target temperature, T
+Bef
s, are kept fixed and a temperature range spanning 1070–1320 K was
explored. Target bias regimes of floating and –75 V were used to explore the role of
energetic ion bombardment. The energy of impacting ions is estimated from the target
bias, ebiasions 2kTVE −≈ . Subsequent to exposure, targets are analyzed using scanning
electron microscopy (SEM) and a wavelength dispersive x-ray spectrometer (WDS).
2.2. SNL Vacuum deposition experiments
Phase formation and reaction kinetics experiments are conducted in vacuum
(<2×10⁻⁶ Torr) by depositing Be on to W targets (similar to those in section 2.1) with a
high-temperature (up to 1750 K) effusion cell. A thermocouple and optical pyrometer are
used to determine the surface temperature during both the deposition and a 1 hour pre-
anneal at 1223 K. The average deposition rate for Be is measured on a cooled Si target.
Full target surface coverage in Be (i.e. net Be deposition) was achieved with fluxes of
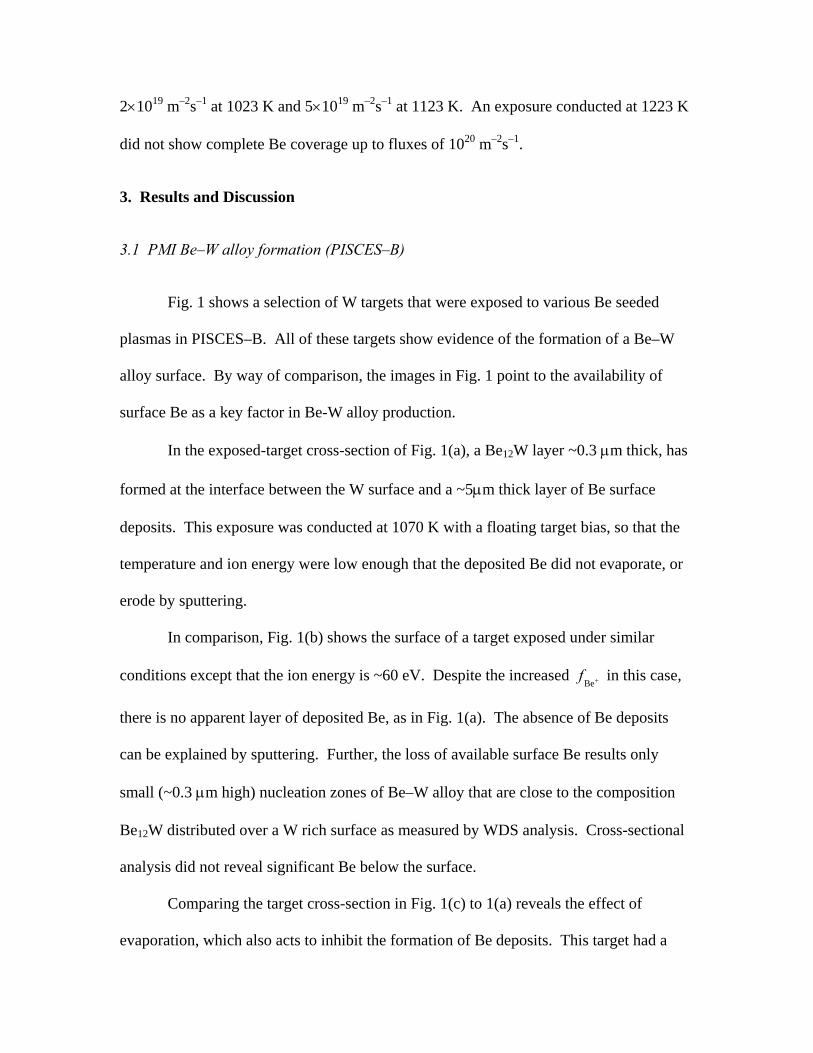
2×10¹⁹ m–2s–1 at 1023 K and 5×10¹⁹ m–2s–1 at 1123 K. An exposure conducted at 1223 K
did not show complete Be coverage up to fluxes of 1020 m–2s–1.
3. Results and Discussion
3.1 PMI Be–W alloy formation (PISCES–B)
Fig. 1 shows a selection of W targets that were exposed to various Be seeded
plasmas in PISCES–B. All of these targets show evidence of the formation of a Be–W
alloy surface. By way of comparison, the images in Fig. 1 point to the availability of
surface Be as a key factor in Be-W alloy production.
In the exposed-target cross-section of Fig. 1(a), a Be12W layer ~0.3 µm thick, has
formed at the interface between the W surface and a ~5µm thick layer of Be surface
deposits. This exposure was conducted at 1070 K with a floating target bias, so that the
temperature and ion energy were low enough that the deposited Be did not evaporate, or
erode by sputtering.
In comparison, Fig. 1(b) shows the surface of a target exposed under similar
conditions except that the ion energy is ~60 eV. Despite the increased in this case,
there is no apparent layer of deposited Be, as in Fig. 1(a). The absence of Be deposits
can be explained by sputtering. Further, the loss of available surface Be results only
small (~0.3 µm high) nucleation zones of Be–W alloy that are close to the composition
Be
+Bef
12W distributed over a W rich surface as measured by WDS analysis. Cross-sectional
analysis did not reveal significant Be below the surface.
Comparing the target cross-section in Fig. 1(c) to 1(a) reveals the effect of
evaporation, which also acts to inhibit the formation of Be deposits. This target had a
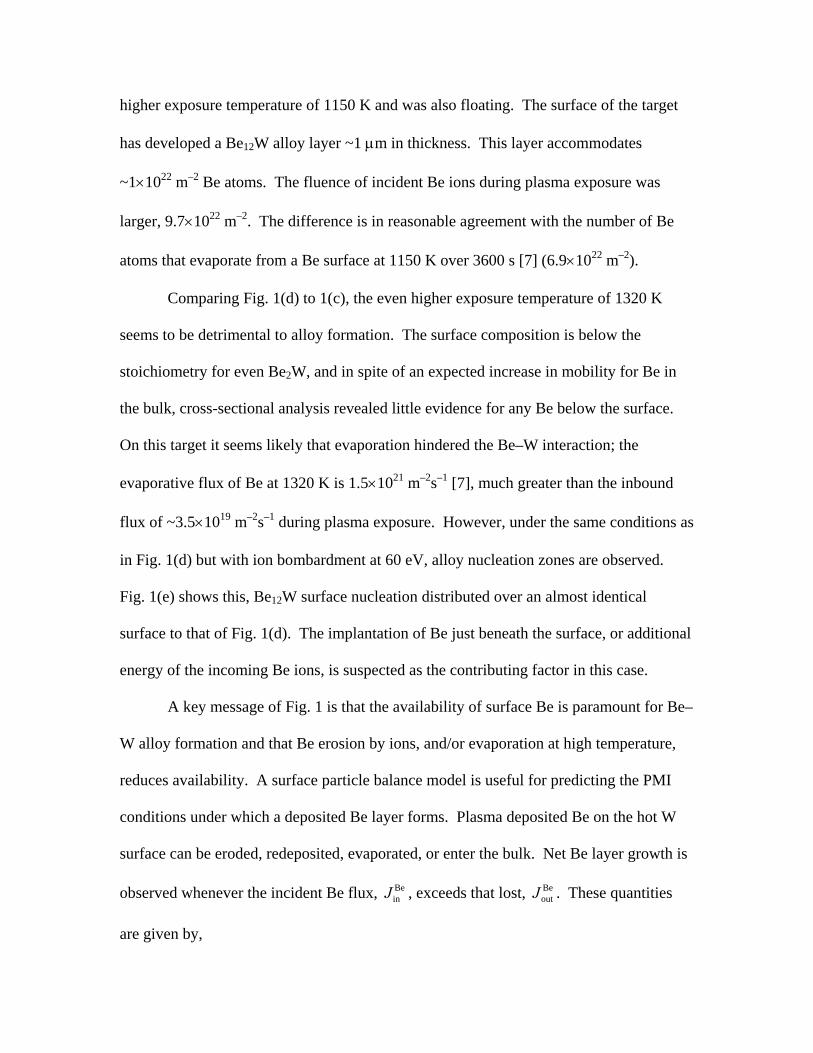
higher exposure temperature of 1150 K and was also floating. The surface of the target
has developed a Be12W alloy layer ~1 µm in thickness. This layer accommodates
~1×10²² m–2 Be atoms. The fluence of incident Be ions during plasma exposure was
larger, 9.7×10²² m–2. The difference is in reasonable agreement with the number of Be
atoms that evaporate from a Be surface at 1150 K over 3600 s [7] (6.9×10²² m–2).
Comparing Fig. 1(d) to 1(c), the even higher exposure temperature of 1320 K
seems to be detrimental to alloy formation. The surface composition is below the
stoichiometry for even Be2W, and in spite of an expected increase in mobility for Be in
the bulk, cross-sectional analysis revealed little evidence for any Be below the surface.
On this target it seems likely that evaporation hindered the Be–W interaction; the
evaporative flux of Be at 1320 K is 1.5×10²¹ m–2s–1 [7], much greater than the inbound
flux of ~3.5×10¹⁹ m–2s–1 during plasma exposure. However, under the same conditions as
in Fig. 1(d) but with ion bombardment at 60 eV, alloy nucleation zones are observed.
Fig. 1(e) shows this, Be12W surface nucleation distributed over an almost identical
surface to that of Fig. 1(d). The implantation of Be just beneath the surface, or additional
energy of the incoming Be ions, is suspected as the contributing factor in this case.
A key message of Fig. 1 is that the availability of surface Be is paramount for Be–
W alloy formation and that Be erosion by ions, and/or evaporation at high temperature,
reduces availability. A surface particle balance model is useful for predicting the PMI
conditions under which a deposited Be layer forms. Plasma deposited Be on the hot W
surface can be eroded, redeposited, evaporated, or enter the bulk. Net Be layer growth is
observed whenever the incident Be flux, , exceeds that lost, . These quantities
are given by,
BeinJ Be
outJ
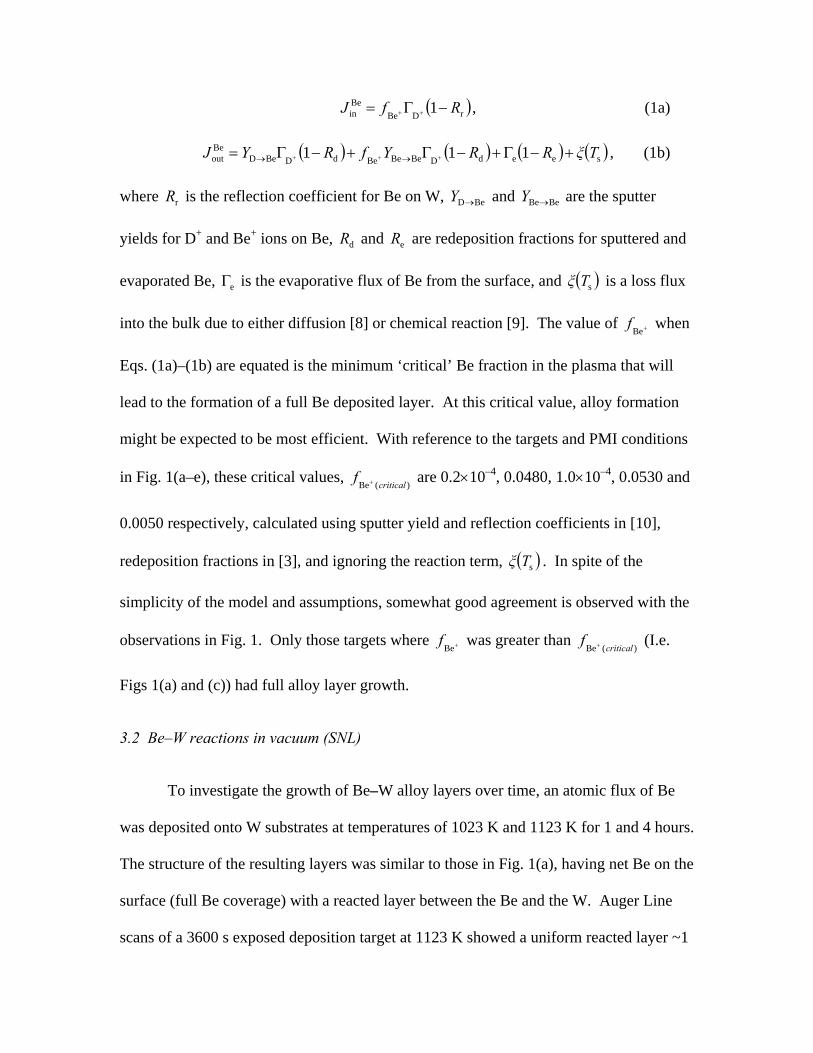
( )rDBe
Bein 1 RfJ −Γ= ++ , (1a)
( ) ( ) ( ) ( seedDBeBeBedDBeDBeout 111 TξRRYfRYJ +−Γ+−Γ+−Γ= +++ →→ ) , (1b)
where is the reflection coefficient for Be on W, and are the sputter
yields for D
rR BeD→Y BeBe→Y
+ and Be+ ions on Be, and are redeposition fractions for sputtered and
evaporated Be, is the evaporative flux of Be from the surface, and is a loss flux
into the bulk due to either diffusion [8] or chemical reaction [9]. The value of when
Eqs. (1a)–(1b) are equated is the minimum ‘critical’ Be fraction in the plasma that will
lead to the formation of a full Be deposited layer. At this critical value, alloy formation
might be expected to be most efficient. With reference to the targets and PMI conditions
in Fig. 1(a–e), these critical values, are 0.2×10
dR eR
eΓ ( )sTξ
+Bef
)(Be criticalf +
–4, 0.0480, 1.0×10⁻⁴, 0.0530 and
0.0050 respectively, calculated using sputter yield and reflection coefficients in [10],
redeposition fractions in [3], and ignoring the reaction term, ( )sTξ . In spite of the
simplicity of the model and assumptions, somewhat good agreement is observed with the
observations in Fig. 1. Only those targets where was greater than (I.e.
Figs 1(a) and (c)) had full alloy layer growth.
+Bef
)(Be criticalf +
3.2 Be–W reactions in vacuum (SNL)
To investigate the growth of Be–W alloy layers over time, an atomic flux of Be
was deposited onto W substrates at temperatures of 1023 K and 1123 K for 1 and 4 hours.
The structure of the resulting layers was similar to those in Fig. 1(a), having net Be on the
surface (full Be coverage) with a reacted layer between the Be and the W. Auger Line
scans of a 3600 s exposed deposition target at 1123 K showed a uniform reacted layer ~1
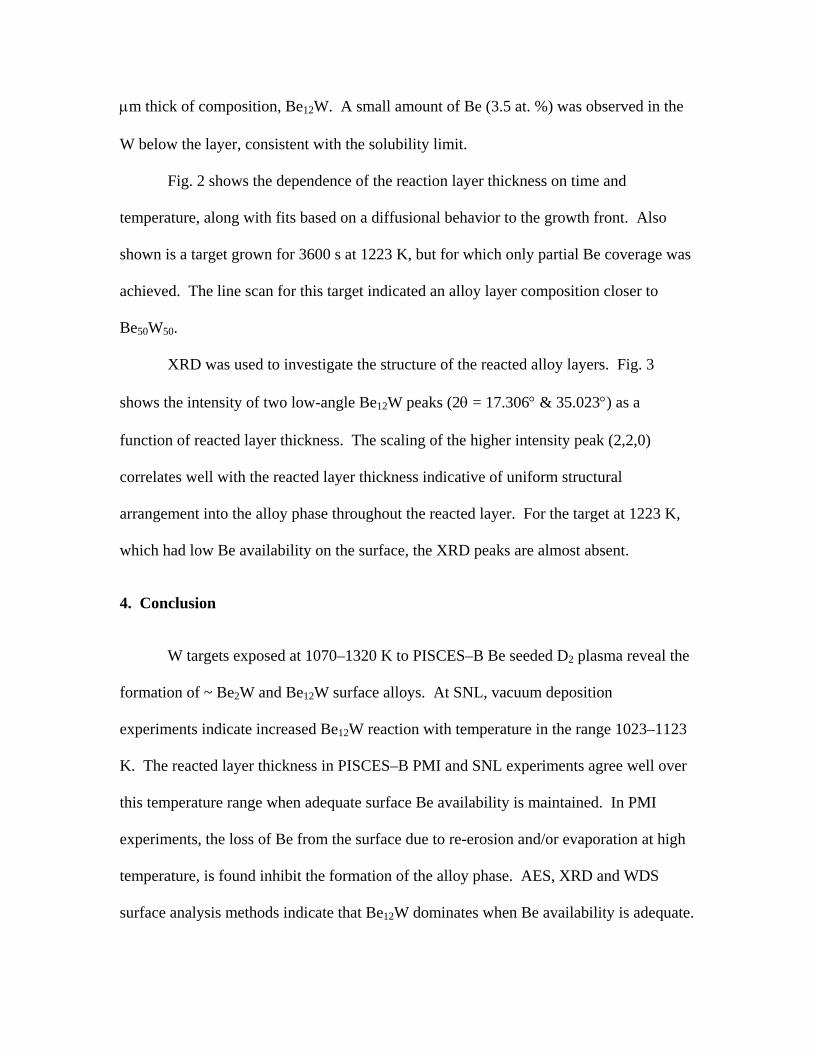
µm thick of composition, Be12W. A small amount of Be (3.5 at. %) was observed in the
W below the layer, consistent with the solubility limit.
Fig. 2 shows the dependence of the reaction layer thickness on time and
temperature, along with fits based on a diffusional behavior to the growth front. Also
shown is a target grown for 3600 s at 1223 K, but for which only partial Be coverage was
achieved. The line scan for this target indicated an alloy layer composition closer to
Be50W50.
XRD was used to investigate the structure of the reacted alloy layers. Fig. 3
shows the intensity of two low-angle Be12W peaks (2θ = 17.306° & 35.023°) as a
function of reacted layer thickness. The scaling of the higher intensity peak (2,2,0)
correlates well with the reacted layer thickness indicative of uniform structural
arrangement into the alloy phase throughout the reacted layer. For the target at 1223 K,
which had low Be availability on the surface, the XRD peaks are almost absent.
4. Conclusion
W targets exposed at 1070–1320 K to PISCES–B Be seeded D2 plasma reveal the
formation of ~ Be2W and Be12W surface alloys. At SNL, vacuum deposition
experiments indicate increased Be12W reaction with temperature in the range 1023–1123
K. The reacted layer thickness in PISCES–B PMI and SNL experiments agree well over
this temperature range when adequate surface Be availability is maintained. In PMI
experiments, the loss of Be from the surface due to re-erosion and/or evaporation at high
temperature, is found inhibit the formation of the alloy phase. AES, XRD and WDS
surface analysis methods indicate that Be12W dominates when Be availability is adequate.
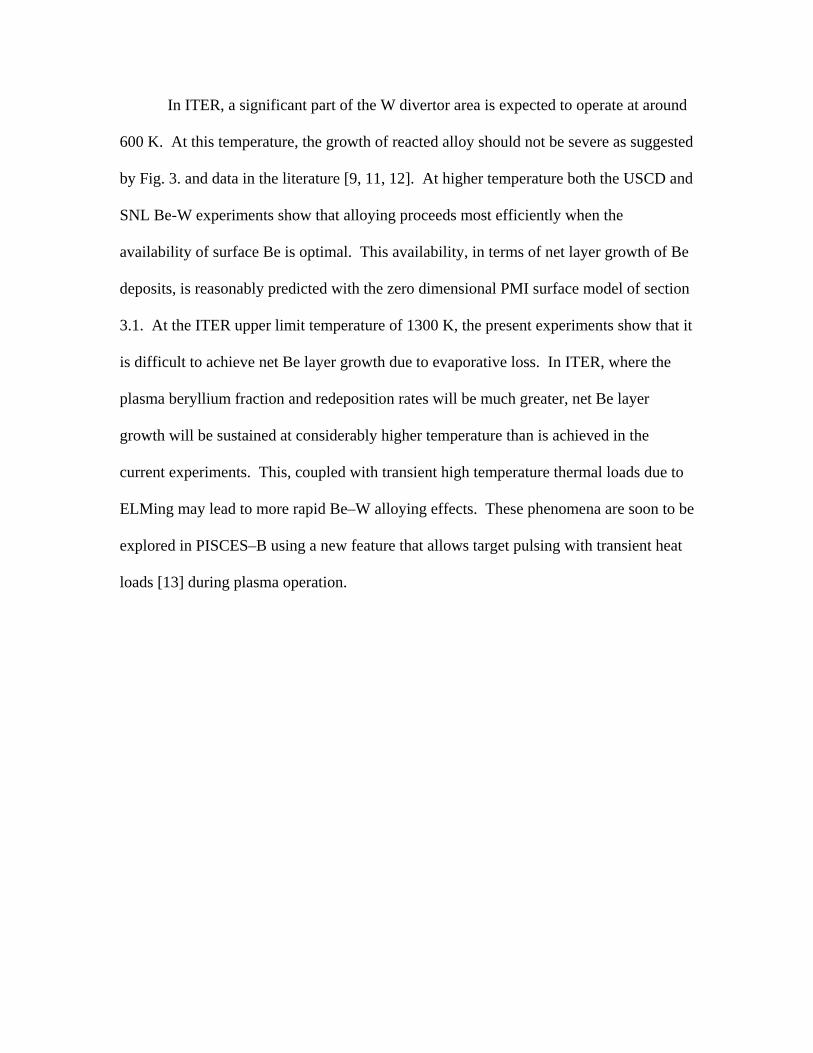
In ITER, a significant part of the W divertor area is expected to operate at around
600 K. At this temperature, the growth of reacted alloy should not be severe as suggested
by Fig. 3. and data in the literature [9, 11, 12]. At higher temperature both the USCD and
SNL Be-W experiments show that alloying proceeds most efficiently when the
availability of surface Be is optimal. This availability, in terms of net layer growth of Be
deposits, is reasonably predicted with the zero dimensional PMI surface model of section
3.1. At the ITER upper limit temperature of 1300 K, the present experiments show that it
is difficult to achieve net Be layer growth due to evaporative loss. In ITER, where the
plasma beryllium fraction and redeposition rates will be much greater, net Be layer
growth will be sustained at considerably higher temperature than is achieved in the
current experiments. This, coupled with transient high temperature thermal loads due to
ELMing may lead to more rapid Be–W alloying effects. These phenomena are soon to be
explored in PISCES–B using a new feature that allows target pulsing with transient heat
loads [13] during plasma operation.

Acknowledgements
The authors gratefully acknowledge PISCES–B and SNL technical staff. This work is
supported by USDoE contracts: DOE DE-FG03-95ER-54301 & DE-AC04-94AL85000.
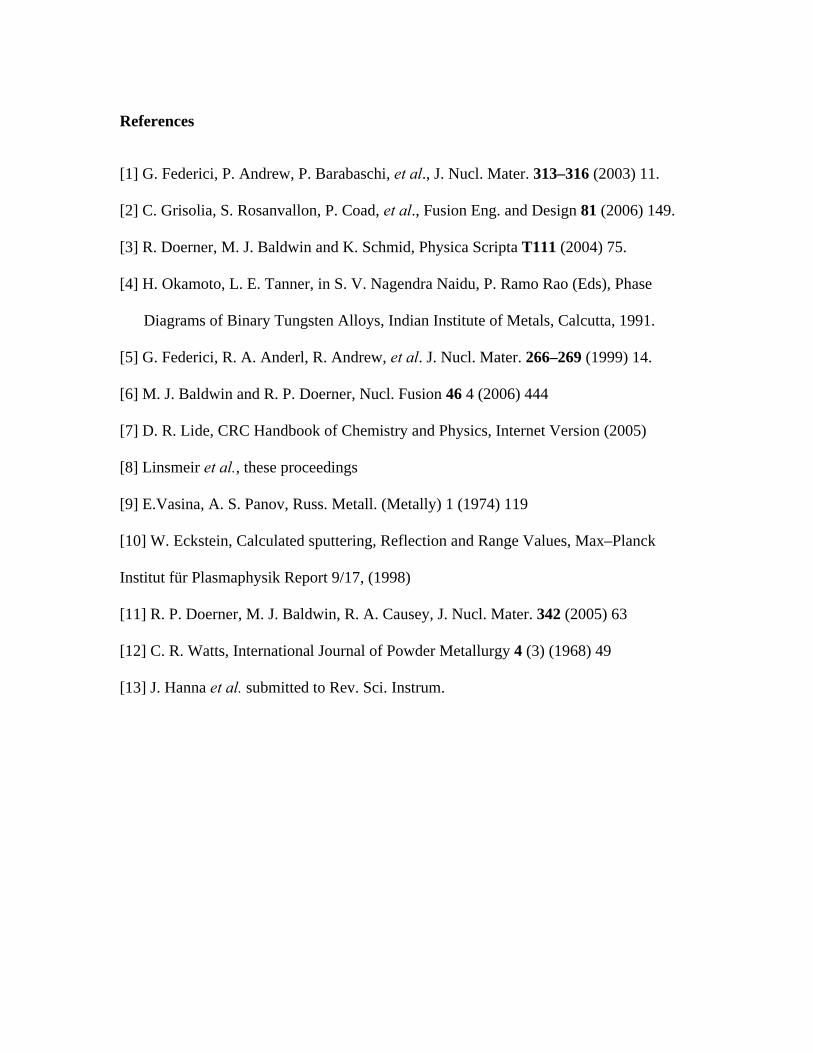
References
[1] G. Federici, P. Andrew, P. Barabaschi, et al., J. Nucl. Mater. 313–316 (2003) 11.
[2] C. Grisolia, S. Rosanvallon, P. Coad, et al., Fusion Eng. and Design 81 (2006) 149.
[3] R. Doerner, M. J. Baldwin and K. Schmid, Physica Scripta T111 (2004) 75.
[4] H. Okamoto, L. E. Tanner, in S. V. Nagendra Naidu, P. Ramo Rao (Eds), Phase
Diagrams of Binary Tungsten Alloys, Indian Institute of Metals, Calcutta, 1991.
[5] G. Federici, R. A. Anderl, R. Andrew, et al. J. Nucl. Mater. 266–269 (1999) 14.
[6] M. J. Baldwin and R. P. Doerner, Nucl. Fusion 46 4 (2006) 444
[7] D. R. Lide, CRC Handbook of Chemistry and Physics, Internet Version (2005)
[8] Linsmeir et al., these proceedings
[9] E.Vasina, A. S. Panov, Russ. Metall. (Metally) 1 (1974) 119
[10] W. Eckstein, Calculated sputtering, Reflection and Range Values, Max–Planck
Institut für Plasmaphysik Report 9/17, (1998)
[11] R. P. Doerner, M. J. Baldwin, R. A. Causey, J. Nucl. Mater. 342 (2005) 63
[12] C. R. Watts, International Journal of Powder Metallurgy 4 (3) (1968) 49
[13] J. Hanna et al. submitted to Rev. Sci. Instrum.
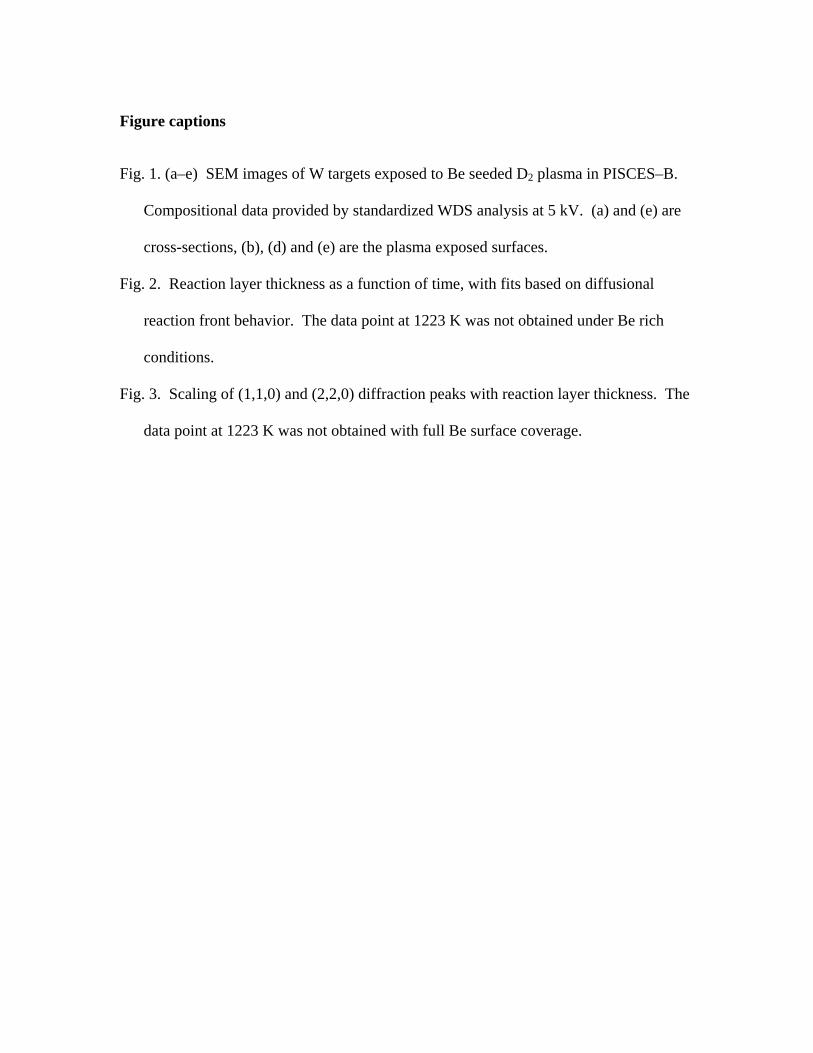
Figure captions
Fig. 1. (a–e) SEM images of W targets exposed to Be seeded D2 plasma in PISCES–B.
Compositional data provided by standardized WDS analysis at 5 kV. (a) and (e) are
cross-sections, (b), (d) and (e) are the plasma exposed surfaces.
Fig. 2. Reaction layer thickness as a function of time, with fits based on diffusional
reaction front behavior. The data point at 1223 K was not obtained under Be rich
conditions.
Fig. 3. Scaling of (1,1,0) and (2,2,0) diffraction peaks with reaction layer thickness. The
data point at 1223 K was not obtained with full Be surface coverage.
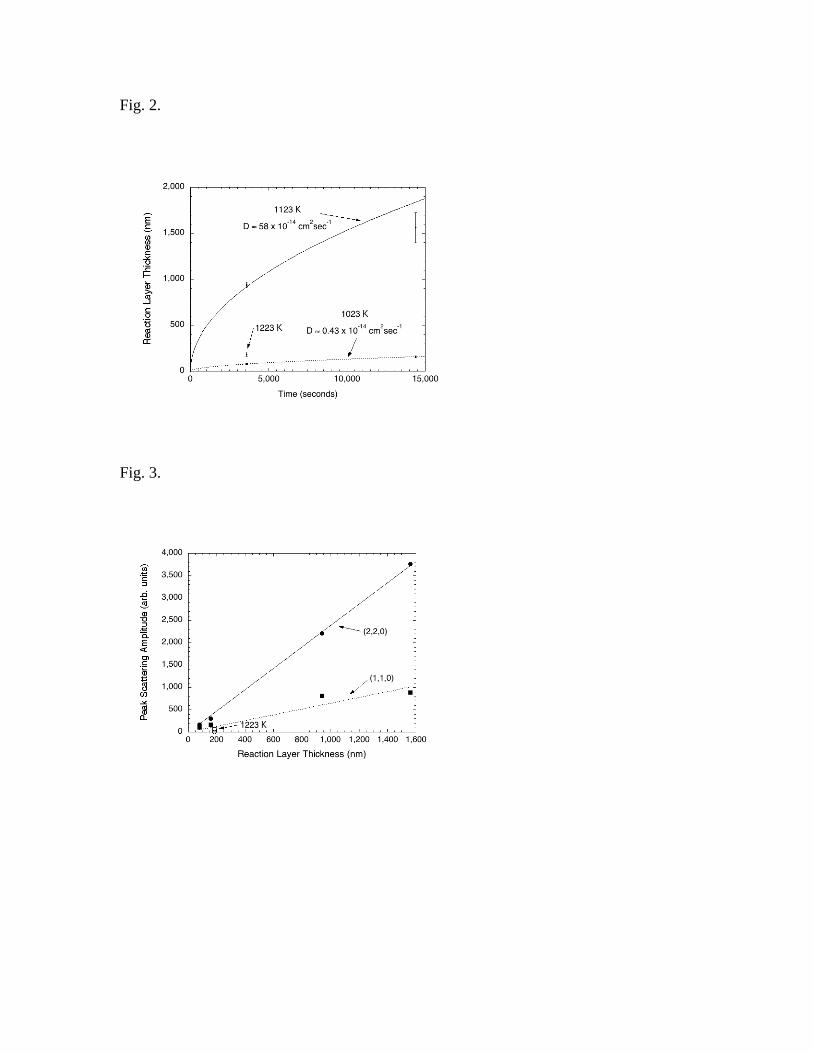
Fig. 2.
Fig. 3.
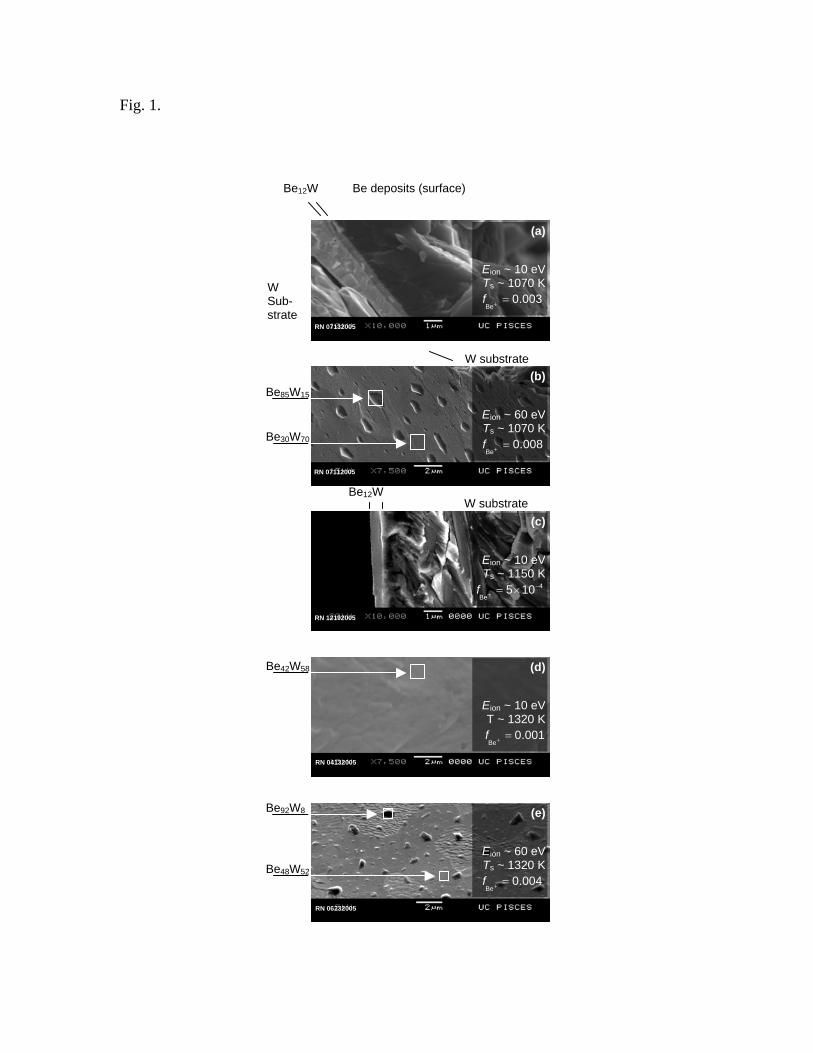
Fig. 1.
Be12W Be deposits (surface)
RN 07132005
(a)
Eion ~ 10 eVTs ~ 1070 K
003.0Be
=+fW Sub- strate
W substrate
RN 07112005
(b)
Eion ~ 60 eVTs ~ 1070 K
008.0Be
=+f
(c)
Eion ~ 10 eVTs ~ 1150 K
4
Be105 −
+ ×=f
RN 12192005
Be12W W substrate
Be30W70
Be85W15
Be48W52
Be92W8 (e)
Eion ~ 60 eVTs ~ 1320 K
004.0Be
=+f
(d)
Eion ~ 10 eVT ~ 1320 K
001.0Be
=+f
Be42W58
RN 04132005
RN 06232005