university of calgary shvil, planwell, & flying … · university of calgary shvil, planwell,...
TRANSCRIPT
UNIVERSITY OF CALGARY
SHVIL, PLANWELL, & FLYING FRUSTUM : Spatial Interaction
With 3D Physical Maps
by
Aditya Shekhar Nittala
A THESIS
SUBMITTED TO THE FACULTY OF GRADUATE STUDIES
IN PARTIAL FULFILLMENT OF THE REQUIREMENTS FOR
THE
DEGREE OF MASTER OF SCIENCE
DEPARTMENT OF COMPUTER SCIENCE
CALGARY, ALBERTA
January, 2016
c© Aditya Shekhar Nittala 2016

UNIVERSITY OF CALGARY
FACULTY OF GRADUATE STUDIES
The undersigned certify that they have read, and recommend to the Faculty of
Graduate Studies for acceptance, a thesis entitled “SHVIL, PLANWELL, & FLY-
ING FRUSTUM : Spatial Interaction With 3D Physical Maps” submitted by
Aditya Shekhar Nittala in partial fulfillment of the requirements for the degree
of MASTER OF SCIENCE.
Supervisor, Prof. Dr.Mario CostaSousa
Department of Computer Science
Co-Supervisor, Prof. Dr.EhudSharlin
Department of Computer Science
Prof. Dr.Kazuki TakashimaDepartment of Computer Science
Prof. April A. Viczko,Department of Drama
Date

Abstract
Spatial representations are crucial when people interact with the physical envi-
ronment. For example, geographic maps are one of the primary sources for way-
finding, spatial planning and navigational activities. Spatial representations of the
environment, such as geographic maps, have evolved from the age-old physical pa-
per maps to current maps on GPS navigation systems and mobile devices. Recent
technological advancements enable further evolution of current 2D interactive spa-
tial representations of the environment to physical 3D interactive representations
using techniques such as 3D printing and mixed reality interaction. We believe that
novel interactive technologies which leverage the physicality and spatiality offered
by physical 3D spatial representations could be useful for a variety of applications
such as collaborative terrain navigation, rescue missions, petroleum-well planning
tasks, and human-UAV (Unmanned Aerial Vehicle) awareness. Our exploratory
research presented in this thesis aims to design and implement applications across
various domains where 3D spatial awareness of the terrain could be a crucial factor
for the success of the task.
In this thesis, we undertake the task of designing collaborative spatial inter-
action techniques for physical representation of maps. We designed interfaces for
the following application scenarios: collaborative terrain navigation, petroleum-
well planning, and remote unmanned aerial vehicle (UAV) control. We present
our research, encompassing three prototypes we designed and implemented: Shvil,
an augmented reality interface for collaborative terrain navigation; PlanWell, a
spatial user interface for collaborative petroleum well planning; and Flying Frus-
tum, a spatial interface for enhancing human-UAV awareness. We conclude by
presenting some of the design lessons we learned and describe future directions for
our work.
ii

Publications
Some of the materials, ideas and figures in this thesis have previously appeared in
the following publications :
• Nico Li, Aditya Shekhar Nittala, Ehud Sharlin, and Mario
Costa Sousa. “Shvil: collaborative augmented reality land
navigation.” In CHI’14 Extended Abstracts on Human Fac-
tors in Computing Systems, pp. 1291-1296. ACM, 2014.
• Aditya Shekhar Nittala,Nico Li, Stephen Cartwright, Kazuki
Takashima, Ehud Sharlin, Mario Costa Sousa. “PlanWell:
Spatial User Interface for Collaborative Petroleum Well
Planning.” In SIGGRAPH ASIA 2015 Symposium on Mo-
bile Graphics and Interactive Applications. ACM,2015.
• Nico Li, Stephen Cartwright, Aditya Shekhar Nittala, Ehud
Sharlin, and Mario Costa Sousa. “Flying Frustum: A
Spatial Interface for Enhancing Human-UAV Awareness.”
In Proceedings of the Third international conference on
Human-agent interaction(ACM HAI’15). ACM, 2015.
iii

Video Figures
This thesis contains two video figures that illustrate the interfaces described in
chapters 4 and chapter 5.
• PlanWell : Spatial Interface for collaborative well-planning
This video is available at the University of Calgary Prism Online
Repository with report number : 2016-1083-02
• Flying Frustum : A Spatial Interface for Enhancing Human-
UAV Awareness
This video is available at the University of Calgary Prism Online
Repository with report number: 2016-1082-01.
iv

Acknowledgements
Indian tradition equates the teacher/Guru/Advisor to God, as the Sanskrit hymn
goes “acharya devo bhava” (In Devanagari/Sanskrit script: aAcy d�voBv ). Deeply
influenced by this ancient Hindu tradition I revere my advisors Prof. Ehud Sharlin
and Prof. Mario Costa Sousa with highest regard.
This thesis would not have been possible without the support and encourage-
ment of several awesome people. Firstly I would like to thank my advisors Dr.
Mario Costa Sousa and Dr. Ehud Sharlin, who gave me the opportunity to pur-
sue my Masters in a wonderful, diverse and intellectually invigorating academic
setting. Thank you very much for all your guidance, advice, and support during
this wonderful journey. I consider myself to be very lucky to have such amazing
advisors. Apart from the academic nuances I have learnt a lot of life lessons from
you guys which I will keep for the rest of my life.
A special thanks to Dr. Xing-Dong Yang, who has been a wonderful mentor. I
have learnt a lot from you (including shooting amazing videos) and I would never
forget the SonicData ( [Nittala et al., 2015b], [Nittala et al., 2014]) project expe-
rience. It was a joy working with you and the experience has been instrumental
in exposing me to the top-class HCI research and helped me towards becoming a
more matured researcher. I hope we will do a lot more projects together in the
future. A big thanks to Dr. Kazuki Takashima for your advice and suggestions
during the various phases of my degree. And last but not the least I am grateful
to Prof. April Viczko and all the other members of my examining committee for
all the meaningful suggestions and ideas that have made this thesis stronger.
I would like to thank my collaborators Nico and Stephen without whom none
of the prototypes in this thesis would have been possible. Thank you very much
for all the help.
v

I would like to thank all my lab mates Allan, Reza, Bita, Felipe, Sowmya,
Xiaoyang, Ahmed, for bearing with me for two years. For a grad student, lab is
your first home, and you guys have made the lab a home. I will always cherish
and miss those beautiful “coffee times” and the random discussions we had.
I would like to thank the members of the iLab and Graphics jungle labs for be-
ing bright and friendly communities, creating a dynamic environment for exchange
of ideas.
Special thanks to my roommates Prashanth and Deepak for bearing with me
and my cooking skills. I would like to thank my friends outside the CS depart-
ment, Prakash, Sriraman, Jeevan, Tushar and all the members of the “cricket
community” for making my stay in Calgary a joyful one.
I would like to thank Lata, Amrita and Sowmya for being such amazing friends
and feeding me delicious Indian food during my initial days in Calgary.
Last but not the least, a big thank you to my family who stood by me for
all my decisions and providing constant support and encouragement during this
journey. Without this truly wonderful family I would not have been here.
Thank you everyone! :-)
vi

Dedication
To my ParentsRamaKrishna Nittala and Lakshmi Nittala
and my brotherKrishna Chaitanya Nittala
vii

List of Figures and Illustrations
1.1 Various representations of elevations in maps (a) shaded relief mapof Colorado in 1894 (b) Elevation represented as contour lines in acontour map (c) Elevation colored map with contour lines . . . . . 2
1.2 Lightweight relief shearing for Interactive maps by [Willett et al.,2015]. Using explicit interactive relief shearing, the user grabs apoint on the map (left) and drags it upward (right). The base ofthe terrain model stays in place, but the model is sheared so thatthe selected point remains under the cursor, revealing the shape ofthe terrain. When released, the map animates back to the originalun-sheared position. . . . . . . . . . . . . . . . . . . . . . . . . . . 3
1.3 3D printed physical representation by [Rase, 2009] . . . . . . . . . 4
2.1 The two route interfaces and the scroll map used by [Reilly et al.,2008]. (a) The paged interface, providing a map section and textualdescription for each phase in a route. (b) The textual interface,providing the entire route as a numbered list. (c) The scroll map,traversed using the jog dial . . . . . . . . . . . . . . . . . . . . . . 12
2.2 Illuminating Clay developed by [Piper et al., 2002]. for Landscapeanalysis. . . . . . . . . . . . . . . . . . . . . . . . . . . . . . . . . . 14
2.3 Applications of Tangible user interfaces across various domains (a)Snakey : A tangible user interface for supporting reservoir well plan-ning [Harris et al., 2011].(b) TanGeoMS is a tangible geo-spatialmodeling system [Tateosian et al., 2010]. (c) Physical models ofmolecular structure. (d) Augmented reality overlaid onto the phys-ical molecular structures for analysis [Gillet et al., 2005] . . . . . . 15
2.4 Physical Telepresence with shape transmission through actuatedtables. [Leithinger et al., 2014]. . . . . . . . . . . . . . . . . . . . . 16
2.5 First head-mounted display realized by [Sutherland, 1968] . . . . . . 182.6 Spatially augmented reality by [Raskar et al., 1998] . . . . . . . . . 192.7 Applications of Augmented Reality across various Domains (a) Aug-
mented reality for civil engineering in real environments [Schallet al., 2008](b) Mediated Reality for collaborative crime scene inves-tigation [Poelman et al., 2012] (c) Augmented Reality to dynam-ically augment a landscape view with weed data [Ghadirian andBishop, 2008] (d) Seamless augmented reality tracking system fortabletop reservoir engineering [Lapides et al., 2012] . . . . . . . . . 20
2.8 Mobile Augmented Reality System developed by [Hollerer et al.,1999]. (left) indoor user interface showing the overview of the out-door scene and (right) an outdoor user exploring the spatially reg-istered information with the real-world. . . . . . . . . . . . . . . . 21
viii

2.9 God-Like Interactions by [Stafford et al., 2006]. (a) indoor userpointing at a location on the table-top surface, which contains therepresentation of the outdoor world. (b) Outdoor AR view show-ing the indoor user’s hand appearing form the sky and pointingtoward a location in the distance.(c) Physical objects used as propsto convey extra meaningful information about the environment. . . 22
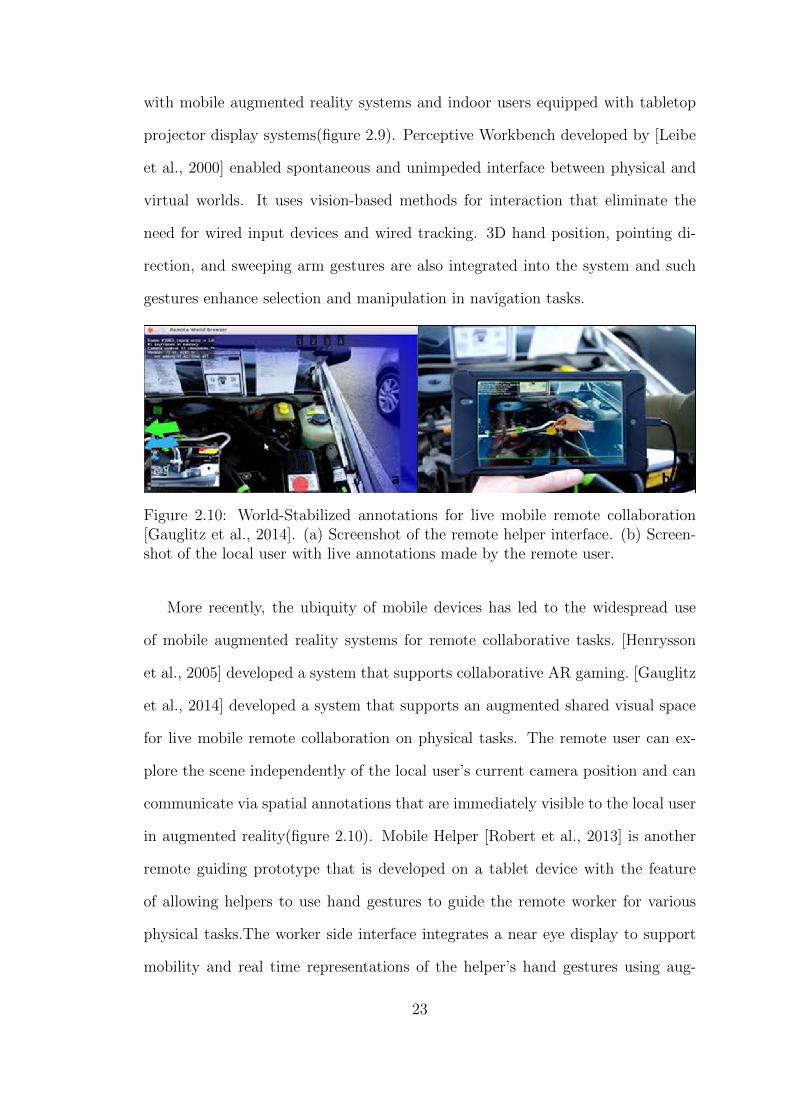
2.10 World-Stabilized annotations for live mobile remote collaboration[Gauglitz et al., 2014]. (a) Screenshot of the remote helper interface.(b) Screenshot of the local user with live annotations made by theremote user. . . . . . . . . . . . . . . . . . . . . . . . . . . . . . . 23
2.11 (a) Freewalk interface from [Nakanishi et al., 1998] and (b) Aug-mented Reality Video conferencing interface from [Barakonyi et al.,2004] . . . . . . . . . . . . . . . . . . . . . . . . . . . . . . . . . . 25
2.12 Supporting Telepresencein distributed 3D collaborative design en-vironments. Virtual shadows, visualization of hand movements ofremote partners were designed to indicated location and activitiesof collaborators and also facilitated pointing and gestures towards3D objects. . . . . . . . . . . . . . . . . . . . . . . . . . . . . . . . 26
2.13 Screenshot of the BeThere collaborative interface. For the remoteuser “Alice” the scene is reconstructed using depth and rgb camerasand the local user’s actions are represented through a 3D virtualhand. Similarly, the local user “Bob” can see Alice’s interactionsrepresented by the 3D virtual hand. . . . . . . . . . . . . . . . . . 27
2.14 JackIn interface (left) First-person video streaming from Body userand (right) the Ghost user can view the first-person video fromBody user, understand spatialiy and interact with scene . . . . . . 28
2.16 Various human-robot interfaces developed by [Quigley et al., 2004]that support real-time control of small semi-autonomous UnmannedAerial Vehicle(UAV).(a) A PDA interface to control the headingand ”wing-view” display (b) Tangible the physical icon interfacewhich is opened to show the placement of its on-board autopilot(c) A Twiddler controller to facilitate single-handed operation (d)Mixed-Reality Physical Icon interface. The actual telemetry,plottedas a transparent blue OpenGL model, is shown slightly rolling tothe left. The user has requested a climb and a sharper left roll, asshown in the second OpenGL model, which is transparent red whenseen in color. The simulated video image has been rolled so as tolevel the horizon. . . . . . . . . . . . . . . . . . . . . . . . . . . . . 29
ix

2.15 UAV interaction design approach developed by [Drury et al., 2006a]to improve the situation awareness of the conditions pertaining tothe UAVs. (a) The center of the screen shows a transparent silhou-ette of the UAV from behind that changes attitude in real time asthe aircraft flies through the virtual environment. The video displayis in the inset box. The video is geo-referenced to the pre-loadedmap data, meaning that it appears on top of the map area to whichit refers.(b)The video is shown in a stationery window of the samesize as the video presentation in the augmented display. . . . . . . 30
2.17 [szafir et al.2015] explored the design of visual signalling mecha-nisms for flying robots to support the expression of robot intentand increase usability in collocated interactions. . . . . . . . . . . 31
2.18 Commercial applications such Glympse(left) and Apple Find MyFriends(right) allows users to track the locations of their friends ontradtional 2D maps. . . . . . . . . . . . . . . . . . . . . . . . . . . 33
3.1 3D printout of the terrain. . . . . . . . . . . . . . . . . . . . . . . . 383.2 The overseer interface of Shvil. (a)An overseer (indoor user)is ex-
amining the 3D printout of the topological terrain data through anAR interface (b)Screenshot of Shvil ’s overseer visualization, includ-ing the terrain model,route information, and corresponding pointsof interest (i.e. timestamps) . . . . . . . . . . . . . . . . . . . . . . 40
3.3 The explorer interface of Shvil. (a)An explorer (outdoor user) iswalking on the terrain viewing his surroundings via Shvil ’s AR vi-sualizations (b)Screenshot of Shvil ’s explorer visualization, whichdemonstrates the route and timestamps in their spatial locationsfrom the explorer ’s perspective . . . . . . . . . . . . . . . . . . . . 41
3.4 Block diagram showing the bi-directional communication betweenthe explorer and overseer interfaces with the intermediate server. . 43
4.1 The oil and gas production cycle. Image Courtesy : Climate.org . . 524.2 Oil and gas exploration, development and production (E, D & P)
stages and the various disciplines and tasks involved [Sousa et al.,2015]. . . . . . . . . . . . . . . . . . . . . . . . . . . . . . . . . . . 54
4.3 An oil-rig constructed at a well location. . . . . . . . . . . . . . . . 554.4 A multi-well pad site containing four wells. . . . . . . . . . . . . . . 554.5 The overseer interface which consists of the 3D printout of the
terrain, an iPad as the AR device and a stylus. . . . . . . . . . . . 614.6 The overseer can sketch on the 3D printout with the AR- based
stylus . . . . . . . . . . . . . . . . . . . . . . . . . . . . . . . . . . 614.7 The overseer interface is mobile geo-location based Augmented Re-
ality(AR) system, that superimposes various domain-specific dataon the surrounding physical terrain. . . . . . . . . . . . . . . . . . . 63
4.8 The explorer position is dynamically updated on the 3D print-out(left) as he navigates in the field(right) . . . . . . . . . . . . . . 64
x
4.9 The point-of-interest(POI) selected by the explorer is updated onthe 3D printout (left). The point-of-interest is labeled in the ex-plorer ’s interface (right) . . . . . . . . . . . . . . . . . . . . . . . . 65
4.10 The overseer updating a point-of-interest(a well location in thisparticular case) with the pen tool (left). Updated position of thewell is shown on the explorer ’s interface(right) . . . . . . . . . . . 65
5.1 (a) Lily Camera (b) Sketch of a Lily Camera in action . . . . . . . 795.2 Amazon air prime drone prototype in action. . . . . . . . . . . . . 795.3 Flying Frustum; (left) the operator draws a path using a pen on
the augmented 3D printout of the terrain; (middle) the UAV, aquadrotor in the current prototype, flies along the path in the field;(right) live video footage streaming from the UAV is displayed asa view frustum situated at the correct location on the 3D printout,using augmented reality . . . . . . . . . . . . . . . . . . . . . . . . 80
5.4 The drone used by SkyHunter Inc. for geophysical surveys. . . . . 815.5 (left) using a 3D printout model as a physical representation to
the topographical terrain; (right) augmented reality visualization issuperimposed onto the model . . . . . . . . . . . . . . . . . . . . . 82
5.6 (Flying Frustums augmented reality devices including (left) hand-held screen and (right) see-through headset . . . . . . . . . . . . . 83
5.7 (Flying Frustum’s augmented reality devices including (left) hand-held screen and (right) see-through headset . . . . . . . . . . . . . 83
5.8 (live video footage captured by the drone is displayed on the viewfrustum in the augmented reality visualization . . . . . . . . . . . 84
5.9 The Parrot Bebop drone used in Flying Frustum. . . . . . . . . . . 855.10 Flying Frustum’s block diagram . . . . . . . . . . . . . . . . . . . . 86
6.1 ( top) Small scale 3D printout with 20cm x 20cm dimension and(bottom) larger scale 3d printout with 26cm x 54cm . . . . . . . . 91
6.2 Projection Based Augmented Reality overlays content on to the 3Dprintout . . . . . . . . . . . . . . . . . . . . . . . . . . . . . . . . . 92
6.3 Mobile based augmented reality where the content is superimposedon an iPad screen . . . . . . . . . . . . . . . . . . . . . . . . . . . 93
6.4 (a)Picture of a “chicken-hill” in our university locale (b) Pictureof a pond in our university locale (c)a 3D model representing the“chicken-hill” area designed in Blender (d) a 3D model representingthe pond designed in Blender . . . . . . . . . . . . . . . . . . . . . 95
6.5 Various stylus prototypes used in our experiments. (left) Viconbased stylus. Three reflective markers are attached for Vicon track-ing. Since the Vicon requires a larger area for tracking, the area ofstylus has been increased by attaching a scale to it (right) stylusbased out on augmented reality. Fiducial markers are attached atthe top for AR tracking. . . . . . . . . . . . . . . . . . . . . . . . . 96
xi

6.6 A Tangible flexible lens developed by [Looser et al., 2007]. The lenscan be bended, twisted, stretched, enabling various AR visualiza-tions . . . . . . . . . . . . . . . . . . . . . . . . . . . . . . . . . . . 98
6.7 Shape displays realized by Leithinger et,al. [Leithinger et al., 2015]can render dynamic 3D shapes. These shape displays could be usedto render dynamic physical maps. . . . . . . . . . . . . . . . . . . 98
7.1 Multiple overseers collaborating over the physical 3D map. . . . . 1057.2 (top) Google map image of the wilderness park near out university.
The red rectangle is the area which we 3D printed and (bottom)the 3D prinout of the area marked in the google map image. . . . . 106
7.3 Mock locations of petroleum-wells superimposed onto the 3D print-out. The red dot represents the location of the explorer . . . . . . 108
7.4 User interaction on the 3D printout with a stylus. . . . . . . . . . 1087.5 Our projection-based augmented reality setup. A Vicon system
with 8 cameras is used for tracking the stylus. . . . . . . . . . . . . 1097.6 Our Stylus prototype with 3 vicon markers.The stylus has been
elongated by attaching a scale, for better visibility of the markers. 1097.7 The Phantom Haptic Interface. The stylus could also be used on 3D
physical maps for various operations such as sketching, annotating,and erasing. . . . . . . . . . . . . . . . . . . . . . . . . . . . . . . 111
B.1 Grayscale image of the Digital Elevation Model(DEM) . . . . . . . 118B.2 3D mesh of the obtained from the Grayscale image. . . . . . . . . 119B.3 3D printout of the terrain model. . . . . . . . . . . . . . . . . . . . 120B.4 (left) The section of the Nosehill park we used for 3D printing and
the corresponding range of the latitude and longitude co-ordinates(right) 3D printout with co-ordinates mapped to [0-1] range. . . . . 125
xii

Chapter 1
INTRODUCTION
1.1 Background
Spatial representations are crucial when humans interact with physical environ-
ments. For example, geographical maps are a primary resource for way-finding,
spatial planning and navigation activities, and people have been creating such
maps ever since the beginning of human civilization. One of the oldest maps that
survives today is the representation of northern Mesopotamia scratched into an
earthenware plate, dating from about BC 2400-2200 [Imhof, 2007]. Already this
map shows mountains; portrayed from the side, as they would be seen when look-
ing up from a valley. This shows that efforts and new techniques were devised to
depict and represent the topography in an intuitive way since the advent of maps.
The study of map-making and the practice of crafting representations of earth
upon a flat surface is called Cartography. This thesis is a contemporary reflection
on the age-old art of map representation through a technological lens involving
3D printing, mixed reality, UAVs and other modern techniques and tasks.
This thesis deals with the design of spatial interaction techniques or physi-
cal representation of maps. The evolution of maps has come a long way from
physical paper maps to digital maps available on mobile devices and GPS naviga-
tion systems. Topography and elevation are among the most important pieces of
information on many maps. Traditionally, cartographers attempted to make the
terrain more accessible by using relief representations such as contour lines, shaded
relief and elevation colouring [Imhof, 2007]. A contour line in a contour map joins
points of equal elevation above a given level such as mean sea-level. Hence contour
1

Figure 1.1: Various representations of elevations in maps (a) shaded relief map ofColorado in 1894 (b) Elevation represented as contour lines in a contour map (c)Elevation colored map with contour lines
maps are used in many applications to represent the elevations of a terrain (Figure
1(b)). Though still widely used in many domains such as military and defense ap-
plications, contour lines are difficult to read compared to other techniques [Phillips
et al., 1975] [Rapp et al., 2007] but with training it is possible to extract absolute
elevations by interpolating between the contour lines. Another method cartogra-
phers use for relief representation is through shaded relief maps. Shaded relief or
“hill-shading” is a technique in which the terrain is shaded to simulate the high-
lights and shadows produced by a light source (Figure 1(a)). It is widely used in
modern maps including many digital mapping services. This approach was pio-
neered by Swiss cartographers in the late 19th century and was further refined and
documented by cartographers like Eduard Imhof [Imhof, 2007] and uses natural vi-
sual cues to suggest the shape of the terrain. The use of illumination and shadows
in “hill-shading” produce an appearance of the three-dimensional space. Elevation
coloring or “hypsometric tinting” is another technique which uses color gradients
to visualize terrain elevation. Colors may be modulated with illumination to more
clearly illustrate shaded and illuminated terrain slopes. Relief shading and ele-
vation colouring provide only relative elevation, but are easier and faster to read
2

than contour lines and portray the terrain as a continuous surface(shown in Figure
1(c)) [Castner and Wheate, 1979] [Phillips et al., 1975] [Potash et al., 1978].
Intuitive spatial representation of the topographical maps has been of particu-
lar interest to Cartographers, geographers and computer scientists. Over the past
few years, new visualization techniques have been developed to better represent
and enhance perception of the maps. For example, [Willett et al., 2015] developed
a set of non-intrusive, direct manipulation interactions that expose depth and
shape information in terrain maps using ephemeral animations. This interactive
relief shearing on interactive digital maps reveals depth information via shearing
animations on 2D maps and can be paired with existing interactions such as pan
and zoom.
Figure 1.2: Lightweight relief shearing for Interactive maps by [Willett et al.,2015]. Using explicit interactive relief shearing, the user grabs a point on the map(left) and drags it upward (right). The base of the terrain model stays in place,but the model is sheared so that the selected point remains under the cursor,revealing the shape of the terrain. When released, the map animates back to theoriginal un-sheared position.
Recently, the GeoViz and cartography community has also explored the use of
3

physical models of landscapes, and city models for better spatial perception [Rase,
2009].
Figure 1.3: 3D printed physical representation by [Rase, 2009]
Traditionally, the Cartography community has only focused on novel repre-
sentations of height and altitude, and to the best of our knowledge, no previous
work studied the performance of 3D physical maps with the 2D maps with stan-
dard tests such Line-of-Sight(LOS) comparisons, relative elevation comparisons
and absolute elevation comparisons.Physical models have the advantage over 2D
drawings that slight movements of the head or body suffice to compare heights, to
solve viewing ambiguities or to reveal parts of the model that might be obscured
in a fixed view. The estimation of distance and height within the model is eas-
4

ier with a physical model due to the lifelong experience with 3D views. Physical
models have an advantage over Virtual Reality (VR) methods when a group of
people are trying to grasp spatial situation.
3D Physical representation of the maps offer the advantages of physicality and
spatiality, and to the best of our knowledge, few interfaces have been designed or
built that leverage the advantages offered by the 3D physical maps. This thesis
aims to explore the design of collaborative spatial interfaces for physical maps and
to provide a set of application instances where such interfaces could be beneficial.
1.2 Motivation: Why Spatial Interfaces for Physical Maps
The goal of this thesis is to explore the design, and to build spatial collaborative
interfaces which take advantage of the spatiality and physicality offered by the 3D
physical maps.
Many collaborative field tasks involve centralized remote mission control over-
seeing multiple in-field teams. Oftentimes the collaboration between the remote
mission control and the in-field teams requires real-time information sharing where
data needs to be dynamically communicated, processed, and represented to each
stakeholder according to their different roles in the task. The need to continu-
ously and properly represent data, adapting it to each participant’s perspective,
situational awareness and role in the task is an inherent challenge that can hinder
collaboration. Failing to provide a clear representation of the shared data within
the different task contexts and scales can prevent the remote mission control from
effectively advising the in-field teams, or limit the teams from situating the mis-
sion control’s requests within the context of the task. Such failures could be very
expensive in critical applications such as Remote rescue missions, remote defence
monitoring systems etc. Our motivation for this thesis comes from various appli-
cation tasks in the following domains: Land navigation, petroleum engineering,
5
human-UAV tele-operation, military expeditions, search and rescue operations
where spatial awareness of the terrain is essential for the two remote teams to
make swift and effective decisions.
Users at of both the remote mission control and the on-field explorers explo-
rations tasks rely heavily on the 2D maps and navigation aids. The use of 2D
maps (including the contour ones) requires extensive training and even after ex-
tensive training, they impose a certain amount of cognitive load onto the users.
They also have certain issues such as the inversion of depth impression (which
leads to ambiguity in recognizing a mountain or a valley). The military research
labs have already started experimenting with the user of outdoor-based augmented
reality for military operations (Livingston et al. 2002). The advantage of such
augmented-reality based systems is that it keeps the user immersed in to the local
physical environment while adding appropriate points of interest (POIs) such as
landmarks, routes etc into the user’s surroundings. The users in the remote mis-
sion control need to have access to spatial information which cannot be provided
by 2D maps and displays. There is a need for another layer of abstraction which
can enhance the spatial awareness. 3D maps, city and surface models have been
explored by the Urban Planning and GeoViz community (Rase, Wolf-Deiter, 2009)
and they state that such 3D spatial representations are advantageous over flat 2D
surface maps.
Therefore, this thesis aims to explore the design and implementation of novel
spatial interfaces for physical representation of maps facilitating collaboration be-
tween remote teams.
1.3 Research Questions
The overall objective of this thesis is to explore and answer the following research
questions:
6

• What are some of the technical limitations and strengths of a novel
spatial interface for physical representations of maps?
• What are the possible application scenarios of such novel physical
representations of maps?
To investigate these research questions we follow a multi-disciplinary approach
and draw upon the theories and concepts from various disciplines such as in-
teraction design, human-computer interaction, petroleum engineering, UAV-tele
operation, tangible user interfaces, and computer-supported co-operative work.
Therefore in this thesis, the reader will find elements from all these domains.
To address our research questions we set the following practical goals for our
research:
• To design and realize a spatial interface that can leverage the spa-
tiality and physicality offered by physical maps.
• To explore individual application instances of 3D spatial maps and
then design and build spatial interfaces tailored for these instances.
1.4 Contributions
Following the research questions previously described, this thesis documents the
following contributions:
• Design and implementation of Shvil - an augmented reality interface
for collaborative terrain navigation. We also present some of the
lessons learned while realizing the prototype.
• Design, Implementation and Preliminary Evaluation of PlanWell - a
spatial interface for collaborative petroleum-well planning.
7

• Design and implementation of Flying Frustum - a spatial interface
for enhancing the user spatial awareness during a remote UAV (Un-
manned Aerial Vehicle) interaction task.
• We contribute lessons learned from our research on 3D interactive
spatial representations which can aid future efforts in this area of
research.
1.5 Approach
3D physical representation of maps can be used for a wide variety of applications
such as military expeditions, gaming applications, collaborative field navigation,
geological field-trips, petroleum well-planning, theatre and performing arts. How-
ever, in this thesis we designed and built three prototypes: Shvil, PlanWell and
Flying Frustum for the specific tasks of collaborative land navigation, collabora-
tive petroleum-well planning and enhancing human-UAV awareness respectively.
Our prototypes are meant to augment and support the existing methods and tools
but not to replace them.
For our first prototype Shvil we explored the design of a system that provides
real-time information exchange between the outdoor explorer (outdoor user) and
an indoor overseer by using the same topographical representation of the terrain
at difference scales. In case of the explorer geo-location based augmented reality
is used and related Points of Interest (POIs) are overlaid onto the physical terrain
surrounding the explorer. We provide a scaled-down 3D representation of the same
topography to the overseer (indoor user). Hence both the users are interacting
over the same spatial representation at different scales.
Our second and third prototypes are application scenarios which aim to ad-
dress our second research question. These applications have been designed for the
8

petroleum engineering and remote-UAV tele-operation domains respectively.
In our second prototype, we use a petroleum-engineering task as our application
scenario. We designed and implemented our prototype of PlanWell which enables
an overseer and an explorer to collaboratively plan the location of petroleum wells
on the physical terrain. Since the overseer and explorer interact with the same
terrain at different scales, we believe that they share the same spatial awareness
which is required for well-placement and planning. We conducted a preliminary
evaluation of our prototype by conducting two focus group sessions with the do-
main experts and present the results in chapter 4.
In the third prototype, we explore the design of a spatial interface that we
believe can enhance the spatial awareness during a remote UAV (Unmanned Aerial
Vehicle) tele-operation task. Tele-operating a drone over a remote terrain is a very
complex task and often requires the operator to have significant level of spatial
awareness of the terrain to safely operate the drone. We believe that the physical
representation of the terrain models help in enhancing the spatial awareness which
might reduce the cognitive load for tele-operating the UAV.
1.6 Thesis Overview
The remainder of this thesis proceeds as follows:
• In Chapter Two, we provide an overview of the key related work
regarding different elements of this thesis. We discuss a number
of relevant efforts in the realm of Augmented Reality, Computer
Supported Cooperative Work (CSCW), Tangible User Interfaces
(TUIs), human-robot interaction and terrain exploration.
• In Chapter Three, we present in details, the design and implemen-
tation of Shvil : an augmented reality interface for collaborative
9

terrain navigation. We report the results of the technical evaluation
and the lessons we learnt while realizing the prototype.
• In Chapter Four, we present PlanWell the petroleum-engineering
application scenario for 3D printed terrain models which enables
petroleum engineers to collaboratively plan the location of petroleum
wells. We briefly present an overview of the oil and gas domain to
setup the context for the design, implementation and preliminary
evaluation of the PlanWell prototype.
• In Chapter Five we introduce Flying Frustum which is a prototype
designed and developed for enhancing the human-UAV awareness
during a UAV tele-operation task. We provide a brief overview of
situational and human-UAV awareness and describe in details the
design and implementation of the Flying Frustum prototype.
• In Chapter Six, we present the lessons learned from our research
and discuss our reflections which can help facilitate further research
in this area.
• In Chapter Seven, we present some of the avenues for future work
and conclude this thesis by revisiting and highlighting our contribu-
tions.
10

Chapter 2
BACKGROUND AND RELATED WORK
This thesis is concerned with the design of novel spatial user interfaces for 3D
physical maps. We designed, and developed spatial interfaces for 3D physical maps
across various domains. All the prototypes and application instances detailed in
this thesis encompass the following major themes in HCI research:
• Navigation and Collaborative Way-finding
• Tangible User Interfaces for Remote Collaboration
• Collaborative Augmented Reality
• Computer Supported Co-Operative Work
• Human-Robot Interaction
This section presents brief overview of the five themes of the research and
discusses the prior related work pertaining to all these themes.
2.1 Navigation and Collaborative Way-Finding
Land Navigation is a military term for the study of traversing through unfamil-
iar terrain by foot or by a land vehicle. Such land navigation exercises are very
common in many domains such as military and defense, geology, petroleum engi-
neering and also in sports such as orienteering. Land navigation typically requires
the ability to read maps, use compass and other navigational skills, and hence the
geographical information presentation plays an important role in the success of the
task. Way-finding is another term which closely relates to land navigation. Way
11

finding refers to various ways in which people orient themselves in physical space
and navigate from place to place. Recent advances in technology have provided
for better interfaces and interaction techniques to accomplish these tasks and var-
ious scientific studies have also been conducted to examine how people performed
collaborative way-finding and navigation tasks.
Figure 2.1: The two route interfaces and the scroll map used by [Reilly et al.,2008]. (a) The paged interface, providing a map section and textual descriptionfor each phase in a route. (b) The textual interface, providing the entire route asa numbered list. (c) The scroll map, traversed using the jog dial
[Bidwell et al., 2005] proposed design guidelines for designing navigational
aids for way-finding and navigational applications. Mobile map interfaces were
augmented with other tools such as kiosk maps for way-finding and navigation
inside buildings. The studies showed that using kiosk maps alongside a mobile
way-finding application promoted acquisition of spatial knowledge [Reilly et al.,
2008]. [Reilly et al., 2009] (figure 2.1)conducted studies to examine how pairs
share a single mobile phone during a collaborative way-finding activity. The au-
thors provide a classification of strategies, role relationships and phone interactions
employed to conduct the way-finding activities.
[Bouwer et al., 2011] presented a number of requirements for mobile indoor
navigation systems that support collaborative destination and path finding tasks
based on observation studies of visitors at a large public fair.
12
In our first prototype Shvil [Li et al., 2014](explained in chapter 3), we draw
inspiration from this existing work on navigational and way-finding interfaces and
realized an augmented reality interface for collaborative land navigation.
2.2 Tangible User Interfaces For Remote Collaboration
Tangible user interface is a user interface which allows an user to interact with
digital information through physical form. Interactions with digital information
are largely confined to Graphical User Interfaces (GUIs). The Graphical User
Interface (GUI) has been in extensive use since 1970s and has first appeared com-
mercially in the Xerox 8010 Star System in 1981 [Smith et al., 2001]. With the
commercial success of the Apple Macintosh and Microsoft Windows, the GUI has
become the standard paradigm for human computer interaction (HCI). GUIs rep-
resent information with pixels on a display. These graphical representations of
information can then be manipulated with remote controllers such as mice and
keyboards. Though such graphical representation of information made a signifi-
cant improvement over its predecessor Command User Interface (CUI), interaction
with the pixels on the display is inconsistent with our interactions with the rest of
the physical environment in which we live. When interacting with the GUI world,
we cannot take advantage of our dexterity or utilize our skills for manipulating
various physical objects such as our ability to shape models of clay or building
blocks. Tangible user interfaces (TUIs) aim to take advantage of these haptic in-
teraction skills, which is a different approach from GUI. The key concept behind
TUIs is to give physical form to digital information [Ishii, 2007] [Dourish, 2004].
Urp [Underkoffler and Ishii, 1999] was the first tangible user interface developed
that facilitated collaborative urban planning and design. Since, then tangible user
interfaces (TUIs) have been developed for various domains and applications such
as Reservoir engineering, Landscape planning and molecular biology. Illuminating
13

Figure 2.2: Illuminating Clay developed by [Piper et al., 2002]. for Landscapeanalysis.
clay is a 3-D tangible interface that was designed for landscape analysis [Piper
et al., 2002](figure 2.2). Users of the system could alter the topography of a
clay landscape model while the changing geometry is captured in real-time by a
ceiling-mounted laser scanner. A depth image of the model served as an input for
landscape analysis functions and the result of the analyses were projected back
in to the workspace and registered with the surface of the model. Snakey is an-
other tangible user interface that was designed to support well path planning in
reservoir engineering domain [Harris et al., 2011]. The design of Snakey(figure
2.3(a)) emphasized intuitive manipulation and interaction with 3D curves, com-
mon to underground well path exploration and planning in reservoir engineering.
It facilitated tangible and collaborative interaction and spatial exploration dur-
ing the multi-stage planning processes involved in well path design. Structural
14
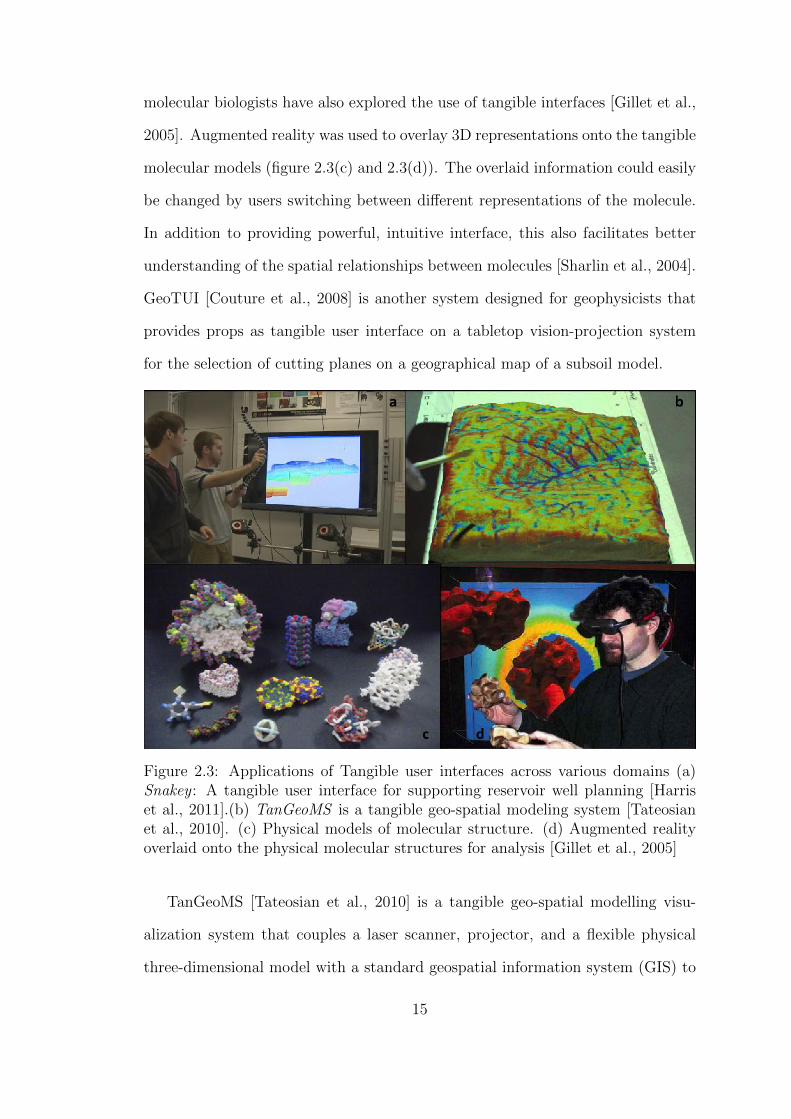
molecular biologists have also explored the use of tangible interfaces [Gillet et al.,
2005]. Augmented reality was used to overlay 3D representations onto the tangible
molecular models (figure 2.3(c) and 2.3(d)). The overlaid information could easily
be changed by users switching between different representations of the molecule.
In addition to providing powerful, intuitive interface, this also facilitates better
understanding of the spatial relationships between molecules [Sharlin et al., 2004].
GeoTUI [Couture et al., 2008] is another system designed for geophysicists that
provides props as tangible user interface on a tabletop vision-projection system
for the selection of cutting planes on a geographical map of a subsoil model.
Figure 2.3: Applications of Tangible user interfaces across various domains (a)Snakey : A tangible user interface for supporting reservoir well planning [Harriset al., 2011].(b) TanGeoMS is a tangible geo-spatial modeling system [Tateosianet al., 2010]. (c) Physical models of molecular structure. (d) Augmented realityoverlaid onto the physical molecular structures for analysis [Gillet et al., 2005]
TanGeoMS [Tateosian et al., 2010] is a tangible geo-spatial modelling visu-
alization system that couples a laser scanner, projector, and a flexible physical
three-dimensional model with a standard geospatial information system (GIS) to
15

create a tangible user interface for terrain data (figure 2.3(b)). TanGeoMS pro-
jected real-world data onto a physical terrain model and allowed the users to alter
the topography of the model by modifying the clay surface or placing additional
objects on the surface.
[Brave et al., 1998] proposed the use of tangible user interfaces for collabora-
tion and communication. Unlike the traditional visual and auditory media, tangi-
ble interfaces place greater emphasis on physicality and touch and hence enhance
the remote collaboration and communication. They demonstrated this with two
Figure 2.4: Physical Telepresence with shape transmission through actuated ta-bles. [Leithinger et al., 2014].
prototypes: Physically Synchronized Bench (PSyBench) and inTouch. PsyBench
employed the concept of Synchronized Distributed Physical Objects to provide a
generic shared physical workspace across distance.It allowed distributed users to
cooperate in tangible interface application such as Illuminating Light which are
heavily based around physical objects. Each physical interface object was turned
into a Synchronized Distributed physical object so that it can be shared by distant
16

users. inTouch [Brave and Dahley, 1997] is another tangible interface that pro-
vides interpersonal communication. inTouch used haptic feedback technology to
create a physical link between people separated by distance. [Richter et al., 2007]
built a display-based measurement system to support remote active tangible inter-
actions. [Riedenklau et al., 2012] showcased an integrative approach to actuated
Tangible Active Objects (TAOs), that demonstrated distributed collaboration sup-
port. Physical actuation, visual projection in 2D and 3D and vibro-tactile feedback
were incorporated to provide multi-modal feedback.
[Leithinger et al., 2014] proposed a novel approach to physical telepresence
based on shared workspaces. They described the concept of shape transmission,
and proposed interaction techniques to manipulate physical objects and physical
rendering of shared digital content(figure 2.4).
[Kurata et al., 2005] presented a tabgible tableTop(TTT) interface to support
remote collaborative works between an expert and multiple field workers in a
direct and intuitive way. The TTT interface consisted of a large touchscreen LCD
as a tabletop display and small ultrasonic transmitters that act as physical tags
on the display. The physical tags represent either each worker or each tool and
since they are equipped with ultrasonic transmitters, the orientation of the tags
is easily known. The TTT interface offered several remarkable features including
affordances of physical tags, tag gesture and bi-manual manipulation with tags
and touchscreen.
We build upon this existing work on tangible user interfaces. In chapters
3 (Shvil [Li et al., 2014], 4 (PlanWell [Nittala et al., 2015a] ) and 5 (Flying
Frustum [Li et al., 2015]), a 3D physical map acts a tangible user interface enabling
the user to perform operations such as sketching and annotation. In chapters 3
and 4, we show how physical map can facilitate collaboration between two remote
users.
17

2.3 Collaborative Augmented Reality
Augmented Reality refers to the technology where a physical,real-world environ-
ment area is augmented by computer-generated sensory input such as sound,video,
graphics or GPS data. Hence, the Augmented Reality(AR) technology enhances
the user’s perception of reality [Azuma et al., 1997] [Alem and Huang, 2011].
Unlike virtual environments, in which a virtual world replaces the real world,
in augmented reality a virtual world supplements the real world with additional
information. This concept was first pioneered by [Sutherland, 1968] (figure 2.5).
Figure 2.5: First head-mounted display
realized by [Sutherland, 1968]
Spatially augmented reality intro-
duced by [Raskar et al., 1998] is a new
paradigm of augmented reality where
virtual objects are rendered directly
within or on the user’s physical space.
The key benefit of such spatially aug-
mented reality is that the user does not
need to wear a head-mounted display.
Instead, the images of virtual objects
can be integrated directly into the en-
vironment with the use of spatial displays. For example, the virtual objects can
be realized by using digital light projectors to “paint” 2D/3D imagery onto real
surfaces or flat panel displays and current mobile displays could also be user to
provide AR experience to the users (figure 2.6).
Since its introduction, Augmented Reality has been used in a variety of ap-
plications. Touring Machine is a 3D mobile augmented reality system that was
designed for exploring the urban environment [Feiner et al., 1997]. The applica-
tion was designed to provide the user with information about their surroundings,
18

Figure 2.6: Spatially augmented reality by [Raskar et al., 1998]
creating a personal “Touring Machine”. The prototype assists users who are in-
terested in the authors’ university campus overlaying information about items of
interest in their vicinity. The user’s position is tracked with GPS and the content
is updated dynamically and presented to the user (figure 2.8).
The domain of civil engineering has also experimented with the use of Aug-
mented reality for Virtual redlining and annotations on underground infrastruc-
ture such as gas pipes or power lines [Schall et al., 2008] (figure 2.7(a)). Similarly,
Landscape and Urban planning community has also explored the use of augmented
reality techniques in combination with geographic information systems (GIS) to
dynamically augment a landscape view with weed (blackberries) data [Ghadirian
and Bishop, 2008](figure 2.7(c)).
[Lapides et al., 2012] implemented a seamless augmented reality tracking sys-
tem for tabletop reservoir engineering which enables the reservoir engineers to
19
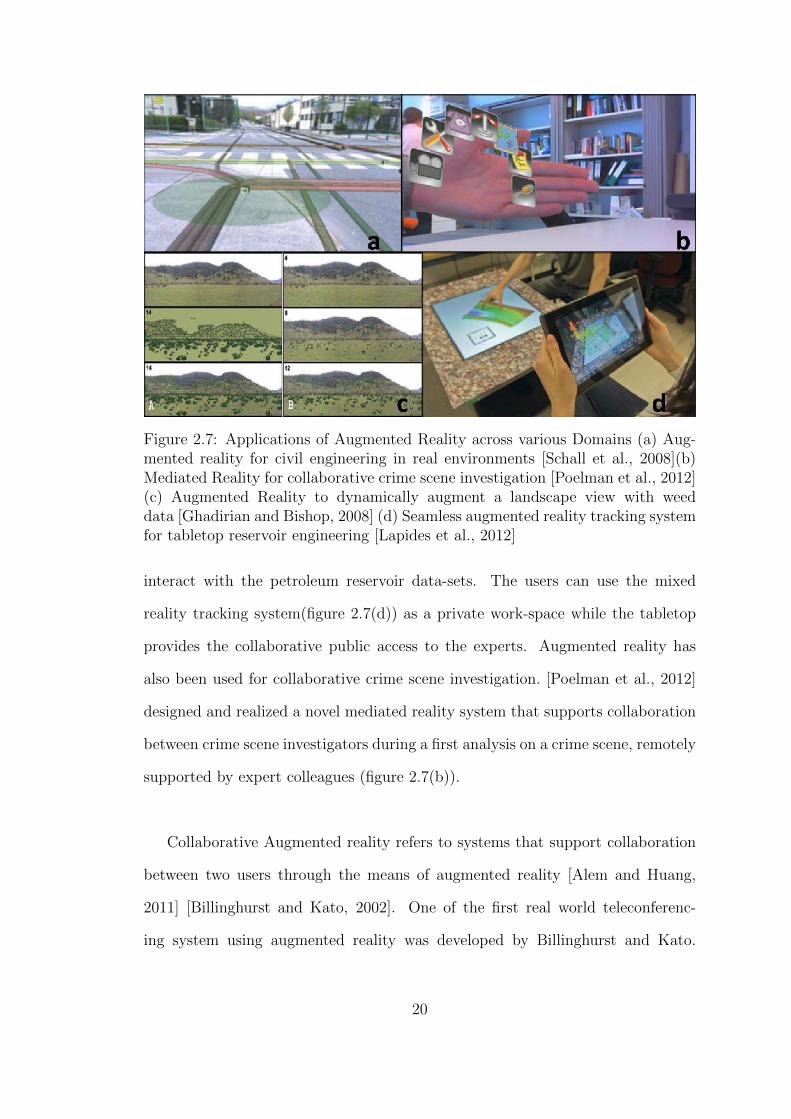
Figure 2.7: Applications of Augmented Reality across various Domains (a) Aug-mented reality for civil engineering in real environments [Schall et al., 2008](b)Mediated Reality for collaborative crime scene investigation [Poelman et al., 2012](c) Augmented Reality to dynamically augment a landscape view with weeddata [Ghadirian and Bishop, 2008] (d) Seamless augmented reality tracking systemfor tabletop reservoir engineering [Lapides et al., 2012]
interact with the petroleum reservoir data-sets. The users can use the mixed
reality tracking system(figure 2.7(d)) as a private work-space while the tabletop
provides the collaborative public access to the experts. Augmented reality has
also been used for collaborative crime scene investigation. [Poelman et al., 2012]
designed and realized a novel mediated reality system that supports collaboration
between crime scene investigators during a first analysis on a crime scene, remotely
supported by expert colleagues (figure 2.7(b)).
Collaborative Augmented reality refers to systems that support collaboration
between two users through the means of augmented reality [Alem and Huang,
2011] [Billinghurst and Kato, 2002]. One of the first real world teleconferenc-
ing system using augmented reality was developed by Billinghurst and Kato.
20
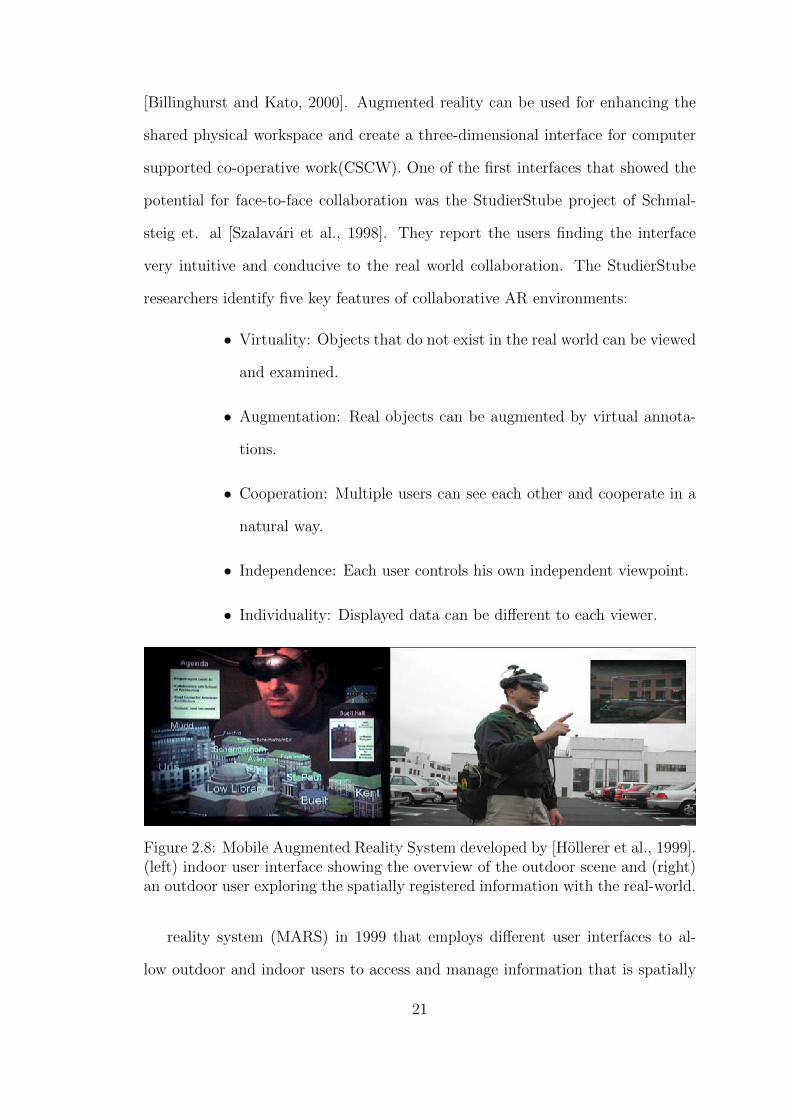
[Billinghurst and Kato, 2000]. Augmented reality can be used for enhancing the
shared physical workspace and create a three-dimensional interface for computer
supported co-operative work(CSCW). One of the first interfaces that showed the
potential for face-to-face collaboration was the StudierStube project of Schmal-
steig et. al [Szalavari et al., 1998]. They report the users finding the interface
very intuitive and conducive to the real world collaboration. The StudierStube
researchers identify five key features of collaborative AR environments:
• Virtuality: Objects that do not exist in the real world can be viewed
and examined.
• Augmentation: Real objects can be augmented by virtual annota-
tions.
• Cooperation: Multiple users can see each other and cooperate in a
natural way.
• Independence: Each user controls his own independent viewpoint.
• Individuality: Displayed data can be different to each viewer.
Figure 2.8: Mobile Augmented Reality System developed by [Hollerer et al., 1999].(left) indoor user interface showing the overview of the outdoor scene and (right)an outdoor user exploring the spatially registered information with the real-world.
reality system (MARS) in 1999 that employs different user interfaces to al-
low outdoor and indoor users to access and manage information that is spatially
21
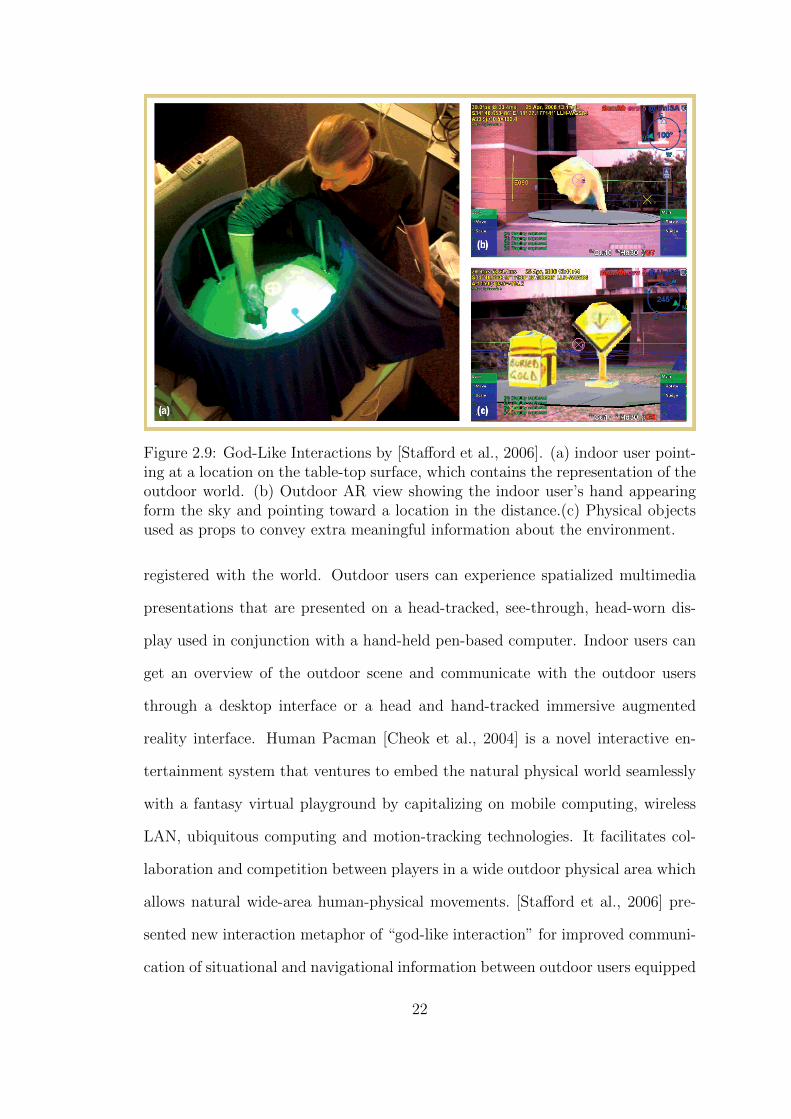
Figure 2.9: God-Like Interactions by [Stafford et al., 2006]. (a) indoor user point-ing at a location on the table-top surface, which contains the representation of theoutdoor world. (b) Outdoor AR view showing the indoor user’s hand appearingform the sky and pointing toward a location in the distance.(c) Physical objectsused as props to convey extra meaningful information about the environment.
registered with the world. Outdoor users can experience spatialized multimedia
presentations that are presented on a head-tracked, see-through, head-worn dis-
play used in conjunction with a hand-held pen-based computer. Indoor users can
get an overview of the outdoor scene and communicate with the outdoor users
through a desktop interface or a head and hand-tracked immersive augmented
reality interface. Human Pacman [Cheok et al., 2004] is a novel interactive en-
tertainment system that ventures to embed the natural physical world seamlessly
with a fantasy virtual playground by capitalizing on mobile computing, wireless
LAN, ubiquitous computing and motion-tracking technologies. It facilitates col-
laboration and competition between players in a wide outdoor physical area which
allows natural wide-area human-physical movements. [Stafford et al., 2006] pre-
sented new interaction metaphor of “god-like interaction” for improved communi-
cation of situational and navigational information between outdoor users equipped
22
with mobile augmented reality systems and indoor users equipped with tabletop
projector display systems(figure 2.9). Perceptive Workbench developed by [Leibe
et al., 2000] enabled spontaneous and unimpeded interface between physical and
virtual worlds. It uses vision-based methods for interaction that eliminate the
need for wired input devices and wired tracking. 3D hand position, pointing di-
rection, and sweeping arm gestures are also integrated into the system and such
gestures enhance selection and manipulation in navigation tasks.
Figure 2.10: World-Stabilized annotations for live mobile remote collaboration[Gauglitz et al., 2014]. (a) Screenshot of the remote helper interface. (b) Screen-shot of the local user with live annotations made by the remote user.
More recently, the ubiquity of mobile devices has led to the widespread use
of mobile augmented reality systems for remote collaborative tasks. [Henrysson
et al., 2005] developed a system that supports collaborative AR gaming. [Gauglitz
et al., 2014] developed a system that supports an augmented shared visual space
for live mobile remote collaboration on physical tasks. The remote user can ex-
plore the scene independently of the local user’s current camera position and can
communicate via spatial annotations that are immediately visible to the local user
in augmented reality(figure 2.10). Mobile Helper [Robert et al., 2013] is another
remote guiding prototype that is developed on a tablet device with the feature
of allowing helpers to use hand gestures to guide the remote worker for various
physical tasks.The worker side interface integrates a near eye display to support
mobility and real time representations of the helper’s hand gestures using aug-
23
mented reality technologies. TeleAdvisor [Gurevich et al., 2012] is another novel
solution that was designed to support remote assistance for real-world scenarios.
It consists of a video camera and a small projector mounted at the end of a tele-
operated robotic arm. This enables a remote helper to view and interact with
workers’ workspace, while controlling the point of view.
Our work draws inspiration from systems such as MARS [Hollerer et al., 1999]
and the above mentioned existing work to enable spatial interaction with the
terrain through augmented reality.
2.4 Computer Supported Co-Operative Work
Computer Supported Co-operative Work (CSCW) is a generic term that combines
the understanding of the way people work in groups with the enabling technologies
of computer networking and associated hardware, software, services and techniques
[Wilson, 1991]. It was first coined by Irene Greif and Paul M.Cashman in 1984,
at a workshop attended by individuals interested in technology to support people
in their work [Grudin, 1994].
The advances in CSCW research has led to the development of real-time com-
munication systems that support effective collaboration between physically dis-
persed teams. CSCW researchers are developing many novel video mediated com-
munication (VMC) systems that allow distant colleagues to accomplish tasks with
same or better efficiency and satisfaction than when collocated [Hollan and Stor-
netta, 1992]. Although the traditional VMC systems are commonly used and are
able to meet the needs of the users, they may not be suitable for communicating
the same level of spatial awareness between the remote users [Gaver, 1992].
Spatiality in Computer Supported Co-operative work(CSCW) has been an ac-
tive research area since a long time. [Kuzuoka, 1992] introduced “spatial workspace
24

collaboration” and developed a SharedView system having the capability to sup-
port spatial workspace collaboration. One of the attempts in supporting spa-
tialiy for collaboration was FreeWalk [Nakanishi et al., 1998]which is an appli-
cation that supports casual meetings among many people. It provides a three-
dimensional(3D) community where participants can behave just as they do in real
life(figure 2.11(a)). [Regenbrecht et al., 2004] presented the concept of Augmented
Virtuality for remote collaboration. Their system allows three participants at
different locations to communicate over a network in an Augmented virutality en-
vironment. Integrated into the AV(Augmented Virtuality) environment are live
video streams of participants spatially arranged around a table, a large virtual pre-
sentation screen for 2D display and application sharing, and 3D geometry(models)
within the room and on top of the table. [Barakonyi et al., 2004] developed a novel
Augmented Reality(AR) videoconferencing system combining a desktop-based AR
system and a videoconferencing module(figure 2.11(b)).
Figure 2.11: (a) Freewalk interface from [Nakanishi et al., 1998] and (b) Aug-mented Reality Video conferencing interface from [Barakonyi et al., 2004]
[Sakong and Nam, 2006] presented new interaction techniques for supporting
telepresence in distributed 3D collaborative design environments. Synchronized
turntables were employed which enhanced physicality in manipulation of virtual
3D objects and provided physical cues for awareness of others. Virtual shadows,
visualization of hand movements of remote partners were also designed which im-
plied not only location and activities of others but also indicated pointing and
25

gestures towards 3D objects(figure 2.12). [Robinson and Tuddenham, 2007] de-
Figure 2.12: Supporting Telepresencein distributed 3D collaborative design envi-ronments. Virtual shadows, visualization of hand movements of remote partnerswere designed to indicated location and activities of collaborators and also facili-tated pointing and gestures towards 3D objects.
rived design guidelines for mixed-presence and remote collaboration for tabletop
systems.They also presented Distributed Tabletops, a novel system that can be
customized to investigate various mixed-presence tasks. Previous research also
explored collaborative navigation, though in CVE(Collaborative Virtual Environ-
ments). [Yang and Olson, 2002] explored collaborative navigation task in CVE
and investigated the effect of the dimension of egocentric-exocentric perspectives
on collaborative navigation performance. Based on the results of the study they
proposed a set of design guidelines to design interaction techniques that support
collaborative navigation and awareness in CVE.
[Hauber et al., 2006] compared a variety of social and performance mea-
sures of collaboration when using two approaches of adding spatial cues to video-
conferencing: once based on immersive 3D, the other based on traditional 2D
video-planes. Their studies showed that the 3D interface positively influenced
social-and-co-presence measure in comparison to 2D but the task measures fa-
vored the two-dimensional interfaces.
3D helping hands was a gesture based Mixed Reality system for remote col-
26

Figure 2.13: Screenshot of the BeThere collaborative interface. For the remoteuser “Alice” the scene is reconstructed using depth and rgb cameras and the localuser’s actions are represented through a 3D virtual hand. Similarly, the local user“Bob” can see Alice’s interactions represented by the 3D virtual hand.
laboration [Tecchia et al., 2012]. It enabled a remote helper to assist a physically
distant worker to perform manual tasks through hand gestures.
BeThere was a proof-of-concept system designed to explore 3D input for mo-
bile collaborative interactions [Sodhi et al., 2013]. 3D gestures and spatial input
allowed remote users to perform a variety of virtual interactions in a local user’s
physical environment.The system used depth sensors to track the location of user’s
fingers,as well as to capture the 3D shape of objects in front of the sensor(figure
2.13).
JackIn is another new human-human communication framework for connecting
two or more people. With first-person view video streaming from a person(called
Body) wearing a transparent head-mounted display and a head-mounted camera,
the other person (called Ghost) participates in shared first-person view [Kasahara
and Rekimoto, 2014].With
JackIn, people’s activities can be shared and assisted or guidance can be given
through other’s expertise. User evaluation of JackIn revealed that Ghosts could
27

Figure 2.14: JackIn interface (left) First-person video streaming from Body userand (right) the Ghost user can view the first-person video from Body user, under-stand spatialiy and interact with scene
easily understand the spatial situation of Body (figure 2.14).
28

2.5 Human-Robot Interaction
Human robot interaction is the study of interactions between the robots and hu-
mans and is commonly referred as HRI. UAV(Unmanned Aerial Vehicle) and semi-
autonomous UAV control and interaction is an area within HRI which deals with
the studying, designing, implementing and evaluating interfaces which aid in op-
erating the UAVs. A number of remote teleoperation interfaces have been devel-
oped to operate these UAVs remotely [Quigley et al., 2004], and as these UAVs
are increasingly becoming common for a variety of tasks such as search and rescue
operations, military expeditions, and geological explorations, the need to design
and develop novel human-UAV interfaces is becoming even more essential.
Maintaining situational awareness has a crucial impact on the design of remote
teleoperation interfaces [Endsley et al., 2000] [Drury et al., 2006a]. While the orig-
inal situational awareness theory evolved around pilots, air traffic controllers and
other critical interaction settings, it soon emerged as a more general CSCW the-
ory, which can be applied to various workplace scenarios (for example [Gutwin
and Greenberg, 2002]). The domain of Human-Robot Interaction (HRI) adapted
situational awareness onto its own unique collaborative settings and tasks, using
the term HRI Awareness, and recognizing the inherently different and asymmet-
rical roles humans and robots play within the HRI collaborative settings [Yanco
et al., 2004] [Drury et al., 2003]. Work was also done on applying HRI awareness
to UAVs related settings and tasks, for example by studying Desert Hawk UAVs
and their operators [Drury et al., 2006b]. These efforts resulted in a discussion of
a subset of HRI-awareness called Human-UAV awareness [Drury and Scott, 2008],
which addresses the specified interaction space of UAV and their remote operators.
As previously mentioned, communicating directionality and human-UAV aware-
ness has emerged as a significant research area in the realm of HRI. Szafir et
29

Figure 2.15: UAV interaction design approach developed by [Drury et al., 2006a] toimprove the situation awareness of the conditions pertaining to the UAVs. (a) Thecenter of the screen shows a transparent silhouette of the UAV from behind thatchanges attitude in real time as the aircraft flies through the virtual environment.The video display is in the inset box. The video is geo-referenced to the pre-loaded map data, meaning that it appears on top of the map area to which itrefers.(b)The video is shown in a stationery window of the same size as the videopresentation in the augmented display.
30

Figure 2.16: Various human-robot interfaces developed by [Quigley et al., 2004]that support real-time control of small semi-autonomous Unmanned Aerial Ve-hicle(UAV).(a) A PDA interface to control the heading and ”wing-view” display(b) Tangible the physical icon interface which is opened to show the placement ofits on-board autopilot (c) A Twiddler controller to facilitate single-handed opera-tion (d) Mixed-Reality Physical Icon interface. The actual telemetry,plotted as atransparent blue OpenGL model, is shown slightly rolling to the left. The user hasrequested a climb and a sharper left roll, as shown in the second OpenGL model,which is transparent red when seen in color. The simulated video image has beenrolled so as to level the horizon.
31
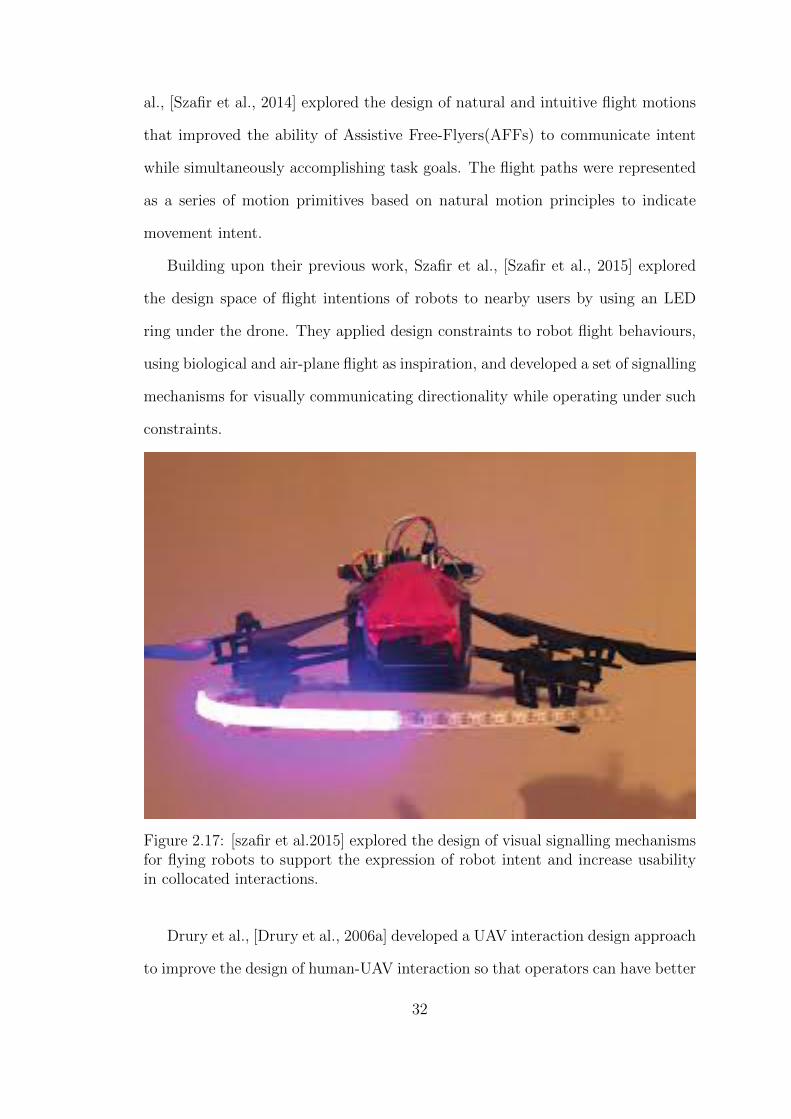
al., [Szafir et al., 2014] explored the design of natural and intuitive flight motions
that improved the ability of Assistive Free-Flyers(AFFs) to communicate intent
while simultaneously accomplishing task goals. The flight paths were represented
as a series of motion primitives based on natural motion principles to indicate
movement intent.
Building upon their previous work, Szafir et al., [Szafir et al., 2015] explored
the design space of flight intentions of robots to nearby users by using an LED
ring under the drone. They applied design constraints to robot flight behaviours,
using biological and air-plane flight as inspiration, and developed a set of signalling
mechanisms for visually communicating directionality while operating under such
constraints.
Figure 2.17: [szafir et al.2015] explored the design of visual signalling mechanismsfor flying robots to support the expression of robot intent and increase usabilityin collocated interactions.
Drury et al., [Drury et al., 2006a] developed a UAV interaction design approach
to improve the design of human-UAV interaction so that operators can have better
32

situation awareness (SA) of the conditions pertaining to the UAVs. Their design
approach uses pre-loaded terrain data to augment real-time video data sensed
by the UAVs. Their hypothesis was that such augmentation of the video would
improve the overall situational awareness of the operators and a counterbalanced
within-subjects experiment showed that the technique helped the operators to
have better comprehension of the spatial relationships between the UAV and the
terrain. One of our prototypes in this thesis Flying Frustum (chapter 5) [Li et al.,
2015] extends upon this work of Drury et al., [Drury et al., 2006a].
Flying Frustum builds on this past effort by extending the interface into 3D
using a physical printout of the terrain, a situated pen-based interface that is used
to draw the UAV’s commands on the terrain, and 3D situated streaming video
from the UAV.
2.6 Commercial Applications
There are some commercial applications that allow users to track the location
of their friends and other people of interest. Though these applications such as
Apple find my Friends [Fin, 2016] , Glympse [Gly, 2016], Google Location History
[Goo, 2016] superimpose the locations on traditional 2D maps. However these
applications have some major drawbacks. Firstly, though they provide information
about the remote users, they do not support collaboration between the remote
users. Secondly, traditional 2D maps are used which might not provide any idea
about the spatiality of the users.
Our work builds upon the previous research though with notable differences.
From the standpoint of spatial perception of 3D physical maps, we use 3D printed
models of terrain as a spatial interactive medium which facilitates spatial aware-
ness of the terrain. From the collaboration stance, our work focuses on using the
terrain itself as the spatial interactive medium. For the indoor user, it is rep-
33

Figure 2.18: Commercial applications such Glympse(left) and Apple Find MyFriends(right) allows users to track the locations of their friends on tradtional 2Dmaps.
resented as a scaled-down 3D printed model while for the remote field explorer,
the actual physical terrain becomes an interactive medium and we use augmented
reality to provide collaborative immersive experience to both the users.
2.7 Summary
In this chapter, we reviewed related research and background for this thesis by
reviewing the past work in Navigation and Collaborative way-finding, Tangible
User Interfaces, Collaborative Augmented Reality, and Computer Supported Co-
operative Work (CSCW).
In the first section , we introduced the concept of land navigation and collab-
orative way-finding. We reviewed the previous scientific literature that focused
on the specific problems related to collaboration and spatial knowledge for col-
laborative way-finding tasks. We also presented previous research that presented
and informed us about the various design guidelines that need to be followed for
34

designing systems that support collaborative way-finding.
In the second section we introduced tangible user interfaces and their appli-
cations for remote collaboration. We presented the various domains and applica-
tions such molecular biology, geo-spatial modeling, reservoir engineering and GIS
(Geographical information Systems) simulations where tangible user interfaces
enhanced spatial perception. We then presented the past research that explored
remote collaboration with tangible user interfaces and discussed how tangible user
interfaces can facilitate engaging remote collaboration for performing shared phys-
ical tasks.
In the third section we introduced the Augmented Reality(AR) technology and
presented the results of the very first research and inventions in the area. We de-
scribed the various applications of augmented reality in a variety of domains such
as tabletop reservoir engineering, civil engineering, landscape visualization. We
then presented the concept of collaborative augmented reality and the research
that introduced AR for collaborative tasks. We also presented some of the con-
ceptual ideas that emanated from the past research in collaborative augmented
reality.
In the fourth section we introduced Computer Supported Co-Operative work(CSCW)
and presented the first initial research in the area. We then focused on the role
and importance of spatiality in computer supported co-operative work(CSCW).
We presented the previous research which explored spatiality for collaboration
and presented previous research which used the Reailty-Virtuality continuum for
facilitating collaboration. We discussed the previous research that used spatial
cues for performing collaborative tasks and the research that explored the role
of spatiality in collaborative virtual environments(CVE).We then concluded by
presenting the most recent research that used 3D gestures and spatial inputs for
collaborative tasks.
35

In the fifth section we introduced human-robot interaction. We then presented
the sub-discipline of human-UAV interaction and human-UAV awareness. We
then discussed the previous research work in the area of human-UAV awareness
and concluded by mentioning how our work draws inspiration from the previous
work.
We described earlier research works in navigation, Tangible UIs, Augmented
Reality, CSCW, Human-Robot Interaction and a few commercial applications.
Though these works inspired us and have some similarities to our work, we also
mentioned how our own work differs from them and the contributions we make
building on the previous work.
36

Chapter 3
Shvil : Augmented Reality Interface For
Collaborative Land Navigation
In this chapter we present our first exploration into the design of spatial user in-
terfaces for 3D physical maps. We present our prototype of Shvil, an Augmented
Reality (AR) system for collaborative land navigation. Shvil facilitates path plan-
ning and execution by creating a collaborative medium between an overseer (in-
door user) and an explorer (outdoor user) using AR and 3D printing techniques.
Shvil provides a remote overseer with a physical representation of the topography
of the mission via a 3D printout of the terrain, and merges the physical presence
of the explorer and the actions of the overseer via dynamic AR visualization. The
system supports collaboration by both overlaying visual information related to the
explorer on top of the overseer ’s scaled-down physical representation, and overlay-
ing visual information for the explorer in-situ as it emerges from the overseer. In
the remainder of this chapter we describe in detail the design, and implementation
efforts of our prototype. We then present some of the preliminary reflections of
our prototype and conclude the chapter by presenting avenues for future work for
our Shvil prototype.
3.1 Introduction
Many collaborative field tasks involve a centralized control center overseeing mul-
tiple teams in the field. Collaboration between this central control and the remote
teams requires pertinent information to be presented to each individual involved
according to their role in a timely and effective manner. Furthermore, it is neces-
37

sary to provide clear presentation of this information within different contexts so
that central control may effectively monitor and advise individuals in the field and
allow them to apply the appropriate context to central control’s requests. Failure
to accomplish this compromises situational awareness as well as communication
and thus the ability to complete the tasks efficiently. Such failures could have a
very high impact in critical applications such as search and rescue, remote emer-
gency response and military operations. Even in less critical applications these
failures could lead to wasted time and money. Such collaborative land navigation
tasks are common in many domains including archaeology, geology, reservoir en-
gineering, petroleum engineering, military operations, and mountaineering. We
design spatial tangible mobile interfaces that help alleviate some of these chal-
lenges and apply it in the context of collaborative land navigation.
Shvil (Hebrew for path or trail) attempts to address tasks where a remote over-
seer (indoor user) and an insitu explorer (outdoor user) are performing land nav-
igations collaboratively. Shvil also attempts to provide better situational aware-
ness [Endsley, 1995] and task awareness to overseer and explorer by allowing
both of them to experience the task representation physically through a tangible
medium, as well as visually via AR techniques.
3.2 Design
“We now use the country itself as its own map, and I assure you it does nearly as
well”
- Lewis Carroll’s Sylvie and Bruno, 1893
Shvil aspires to convey the spatiality of the area being navigated into an inter-
active medium. For the overseer, this spatiality is embedded in the physical 3D
printout(figure 3.1), and for the explorer, the spatiality is expressed via the actual
physical terrain that becomes an active, one-to-one-scale map .
38

Figure 3.1: 3D printout of the terrain.
The component of Shvil used by the overseer handles the data visualization
technique in an offsite (indoor) facility, while the explorer component deals with
the data visualization in the field. In addition, each component also takes care
of the presentation of the shared data, which allows Shvil to facilitate the collab-
oration between the explorer and the overseer. Both the overseer and explorer
components of Shvil use AR to enhance the interactive environment and to access
the 3D spatial navigational data in real-time. The explorer interacts with the
physical terrain using AR directly in the field; however, the overseer benefits from
accessing the 3D printout of the terrain, not only as a realistic illusion enhanced
by the superimposed AR visualization, but also the tangible provides additional
perceptional advantage and understanding of the terrain as experienced by the
explorer. Shvil is based on a 3D printout model of the terrain data (figure 3.1).
With the current advances and accessibility of 3D printing technology, such print-
39

outs are easy to generate and becoming less costly. We expect that, similar to
how conventional 2D maps are commonly printed and distributed, 3D printouts
of terrains could be easily produced and distributed in the near future. Shvil ’s
overseer interface combines the 3D printout with AR tracking (see the bottom
left image of figure 3.2).
The route information is rendered via mobile devices running the AR library
with the virtual representations overlaid and correctly aligned on the physical
3D printout. Changes in the virtual content (such as position updates of the
explorer) are instantly applied upon the physical 3D printout enabling the overseer
to visualize these changes. The experience is enhanced when the overseer moves
around the physical model, since the AR device automatically detects the location
and orientation of the model in real-time and adjusts the virtual image along with
it. Various routes and related points of interest from the explorer are rendered
in the AR environment in real time. Since the virtual image presented to the
overseer is aligned with the physical model, it feels like those routes and points of
interest are marked on the physical presentation of the terrain directly (see Figure
3.2).
The explorer component of the system is used as an aid for an in-the-field
explorer to identify the routes and various points of interest on the terrain. It is
essentially a geo-location based AR system that helps to identify aforementioned
information in the scene, based on the explorer ’s location and direction. The sys-
tem overlays this information onto the live camera feed in order to create the in-situ
experience. The explorer interface demonstrates an egocentric system, while the
overseer component presents an exocentric view of the terrain (see figure 3.3).
Since the goal of this system is to facilitate the collaboration between the overseer
and the explorer in real-time, both people in different locations are de facto exam-
ining the same set of data. However, rather than a birds-eye view as experienced
40

Figure 3.2: The overseer interface of Shvil. (a)An overseer (indoor user)is ex-amining the 3D printout of the topological terrain data through an AR interface(b)Screenshot of Shvil ’s overseer visualization, including the terrain model,routeinformation, and corresponding points of interest (i.e. timestamps)
41
by the overseer, the explorer observes the information in-situ. Also, information
will be updated dynamically to either part of the system simultaneously.
3.3 Implementation
Shvil is designed with loose coupling as a goal, so any component may be changed
without impacting other parts of the system. There is an intermediate server
to handle the information sharing, and standard REST APIs are used for data
transmission in between.The overseer and explorer clients are implemented on
different devices and runtime environments (iOS vs Android). The overseer inter-
face was implemented on an iPad Air running iOS and the explorer interface was
implemented on a Google Nexus 5 running Android.
3.3.1 Overseer Interface
In the overseer interface, the AR and the 3D printout of the terrain are used
for creating the exocentric visual experience. Markers are placed around the 3D
printout, and Qualcomm Vuforia1 [vuf, 2016] is used as the image recognition
library for obtaining the location and orientation of these markers. Based on the
spatial information, the mobile device adjusts the virtual image correspondingly
when the viewer walks around the physical model. Navigational information,
including the route of the field explorer and other points of interest, are visually
mapped onto the physical model to give the impression that they are indicated
and labeled on the model directly (see figure 3.2(b)).
3.3.2 Explorer Interface
The explorer interface is a geo-location based augmented reality system [Schmal-
stieg et al., 2011]. Location and orientation of the explorer are collected from
1Vuforia. www.qualcomm.com/products/vuforia
42

Figure 3.3: The explorer interface of Shvil. (a)An explorer (outdoor user) iswalking on the terrain viewing his surroundings via Shvil ’s AR visualizations(b)Screenshot of Shvil ’s explorer visualization, which demonstrates the route andtimestamps in their spatial locations from the explorer ’s perspective
43

the built-in GPS sensor, compass, and inclinometer sensors. Low-pass filtering
algorithms were implemented to smoothen and filter out the noise in sensor read-
ings(see Appendix B.2 for the Low-pass filtering used to smoothen the compass
values). Based on this data, routes and points of interest are mapped to the
physical position so that it looks like they are painted “on the ground” from the
explorer ’s perspective (see the figure 3.3(b)). For the GPS triangulation on the
3D printout, we initially, map the four corners of the 3D printout with the cor-
responding GPS coordinates and triangulate each and every point within the 3D
printout by simple linear interpolation. The explorer ’s interface, queries the cur-
rent GPS location of the explorer, normalizes it into the [0 -1] range and sends it
to the overseer. The overseer’s AR device after receiving the normalized location
co-ordinates updates it on the 3D printout.
3.3.3 Remote Communication
The explorer interface and the overseer interface communicate with each other
through an intermediate server which handles the information exchange through
standard REST APIs (Figure 3.4).
The information to be exchanged is encapsulated as JSON packets. A sample
location packet(contains the normalized GPS coordinates of the epxlorer) which
is sent from the explorer AR device to the intermediate server is shown below.
{
‘ ‘ type ” : ‘ ‘ e x p l o r e r ” ,
‘ ‘ l o c a t i o n ” : [ 0 . 2 5 , 0 . 1 2 3 5 0 ]
}
The corresponding JAVA class for de-serializing the received JSON string is
shown below.
44

Figure 3.4: Block diagram showing the bi-directional communication between theexplorer and overseer interfaces with the intermediate server.
public class ExplorerLocat ion
{
private St r ing [ ] l o c a t i o n ;
private St r ing type ;
public St r ing [ ] ge tLocat ion ( )
{
return l o c a t i o n ;
}
public void s e tLoca t i on ( S t r ing [ ] l o c a t i o n )
{
this . l o c a t i o n = l o c a t i o n ;
}
45

public St r ing getType ( )
{
return type ;
}
public void setType ( S t r ing type )
{
this . type = type ;
}
}
3.4 Technical Evaluation
In this section we reflect on the potential of our system and report the results of
the technical evaluation of our system. We measured the accuracy and latency of
our system.
3.4.1 Accuracy
The GPS accuracy of the current day smartphones and tablets is 10-20 meters
and varies from device to device. The GPS accuracy of the Nexus5 smartphone
which was used as the explorer AR device is 10 meters. In our case, we have
mapped an area of 6km x 6km to 20cm x 20cm 3D printout, which scales 1cm
on the 3D printout to 300 meters on the actual physical reservoir terrain. This
means that the explorer has to walk for 150 meters for the overseer to observe a
46
change of 0.5mm in the location of the explorer on the 3D printout. This scale
issue might negatively impact the application design. Depending on the required
accuracy and exploration styles, (e.g. rough exploration by a car or a detailed
exploration by walking) the impact of this metric varies. To offset this scale issue,
we suggest the use of dynamic multi- scale visualization on the 3D printout where
the detailed information can be presented with a magnification lens [Looser et al.,
2007] while enabling the user to switch back to the overview view with correct
spatial scale and texture. Alternatively a much larger 3D printout could be used,
thereby reducing the 3D printout to real world scale ratio, but this could be a
trade-off for portability.
3.4.2 Latency
Latency refers to the time taken for the data transmission from the explorer to
the overseer. We measured the average time taken for a JSON packet to reach
the overseer from the explorer ’s AR device. We measured the latency by logging
the timestamps of the packets sent from the explorer ’s device to the intermediate
server. An automated script on the server logs down the time stamps on the
packet and calculates the latency in milliseconds. We measured the latency by
sending the packets for duration of 60 minutes and calculated the average latency.
The total turnaround latency was 2.4 seconds. We used public commercial cellular
carriers (3G) to transmit data between the explorer and the overseer. Such latency
value strongly depends on the transmission infrastructure, and we believe that
the latency can easily improve with a more reliable, customized infrastructure.
Nevertheless, the latency is acceptable because the distance covered by the explorer
in such a short time is negligible when compared to the scale of the 3D printout.
47

3.5 Lessons Learned
Though we did not perform formal evaluation on our Shvil prototype, we did
demo our proof-of-concept prototype to various other graduate students , visiting
researchers ,professors, and industry professionals who visited our lab and also at
international HCI conferences where we presented our work. These discussions
gave further insights into the design of our prototype and we will describing each
of those in this section. We have adopted some of the design decisions into other
prototypes in this thesis while some of the other research ideas are out of scope
for this thesis.
The lessons learned from our discussion can be summarized into the following
:
• Tangible Interactions : Our current prototype supports no ma-
jor interactions for the users, other than visualizing content overlaid
onto the different scales of the same terrain. One of the major feed-
back we received was the design of tangible interactions specifically
for the overseer. One of the design decisions which we adopted
based on this was the design of pen-based interactions for the over-
seer interface which allow the overseer to sketch paths over the 3D
printout and send them over to the explorer. These interactions are
implemented in our other prototypes, described in chapters 4 and
5.
• Scale Of the Printout : One of the other major discussion theme
was the scale of the printout. Our current printout is 20x20cm in
width and height respectively and is highly portable. While smaller
printouts support high portability, they have the disadvantage of
offering limited resolution. The larger printouts on the other hand
48
can offer higher resolution at the cost of limited portability. We
therefore suggest that the scale of the printout be tailored specific
to the application design. For example, in case of geological appli-
cations, the resolution of the printout could be very crucial whereas
for a trivial navigation application, lower resolution and a smaller
printout could be sufficient.
• Mobile Augmented Reality Approach vs Projection Map-
ping - One of the key discussion points during our interactions was
the use of alternate AR methods for overlaying content onto the
3D printout. This is very much related to the portability aspect
which we described previously. Though our mobile augmented re-
ality approach is very much portable and works well within its own
limitations on the small scale 3D printout, it might not be appro-
priate for overlaying content on much larger, higher resolution 3D
printouts. One of the simplest approach for this issue is to use pro-
jection mapping to project content onto the 3D printout. Though
this might effect the portability by constraining the setup to a lab-
oratory environment, it offers higher degree of collaboration where
multiple overseers can visualize the shared content.
• Personal and Public AR Displays for Overseer - The final key
discussion point was related to supporting both personal and shared
workspaces similar to the ones supported by tabletop systems [Scott
et al., 2004]. One of the ideas was to use the projection mapping
as a means to display shared content while the tablets or wearable
displays could display private content. Though this research idea is
worth exploring, currently, this is out of scope for this thesis.
49

• User Hierarchy - We use the terms “overseer” and “explorer” for
our indoor and outdoor users respectively. This signifies a hierarchy
between the users, where the overseer is “guiding” or “managing”
the explorer. This might be true in some applications such as mil-
itary or police operations. However, it might not hold good for
various other applications such as gaming, and rescue missions.
3.6 Critique And Limitations
Our Shvil prototype is currently a proof-of-concept. The 3D printed model of the
terrain we used in our prototype is a placeholder of the actual terrain. However,
in the appendix(A.2) we describe in detail, a simple automated procedure for
fabricating 3D printouts of realistic landscapes and we also exemplify this effort
by 3D printing a wilderness park near our university.
In our current prototype version, we offer only visualization on both the over-
seer and explorer interfaces. In further chapters (chapter 4 and chapter 5) we
developed interactions which enable the users to interact and exchange dynamic
information.
Besides the aforementioned technical limitations, we are also aware of limita-
tions related to our design approach. Our augmented reality mediators are based
on consumer-level tablets. This results in the users, especially the explorer, needing
to interact with relatively inconvenient and heavy hand-held devices. This design
approach could be improved dramatically by moving Shvil onto head-mounted or
wearable devices, such as Google Glasses, that would likely provide a more natural
experience.
On the other hand, obtaining our current 3D printed topographical terrain
required considerable resources, and certainly there exist approaches that use other
tangible mechanisms to represent the terrain [Ishii et al., 2004] [Leithinger and
50

Ishii, 2010]. However, with the progression of 3D printing technology driving
down the cost, and with more precise 3D printers becoming abundant, this barrier
could be reduced if not completely eliminated.
3.7 Future Work
We would like to extend the Shvil concept to multiple (non-collocated) explorers,
and also to multiple (non-collocated) overseers, all relating to the same geograph-
ical location by either walking on top of it physically or by interacting with copies
of its 3D printed representation. Another improvement to Shvil we are planning
is to incorporate more sophisticated interaction techniques, such as using touch
directly on the 3D model in the case of the overseer, and gestures in the case of the
explorer. We are exploring the possibility of applying Shvil to domains where the
topography of the physical site could be augmented with meta-data well beyond
Shvil ’s current basic terrain surface navigation. For example, we are planning
to use Shvil for collaborative exploration of interactive visualizations of oil and
gas reservoirs, where enabling collaboration between remote overseer experts and
in-situ explorers can be very useful to track and explore complex domain specific
features.
3.8 Summary
In this chapter, we presented a collaborative land navigation system named Shvil,
which uses Augmented reality(AR) and 3D printing technologies to facilitate and
visualize route planning and execution. This system allows two collaborators, an
in-situ explorer and a remote overseer, to exchange route information during a field
exploration using terrain as the interactive medium. Although Shvil is a design
concept with only a proof-of-concept prototype implementation, we discussed some
51

of our preliminary reflections and future directions and improvements for Shvil.
52

Chapter 4
PlanWell : Spatial User Interface For
Collaborative Well Planning
In this chapter we present an engineering application scenario where interactive
spatial representation of physical maps could be beneficial. We apply our design
concept to the task of collaborative well planning in the domain of petroleum
engineering. Collaborative Petroleum well planning is one of the crucial steps
in the oil and gas E & P (Exploration & Production) cycle where experts from
multiple departments collaborate to plan the specific and optimal locations of
petroleum-wells. In this chapter, we present our preliminary experimental proto-
type PlanWell, a spatial augmented reality interface that facilitates collaborative
field operations in collaborative well planning. We present the details of the de-
sign and implementation of PlanWell prototype in the context of petroleum well
planning and drilling and discuss some of the preliminary reflections of two focus
group sessions we conducted with domain experts.
4.1 Overview
Oil and gas reservoirs are sub-surface portions of earth which contain pool of hy-
drocarbons. An oil or a gas reservoir is a subsurface body of rock having sufficient
porosity and permeability to store and transmit fluids. Sedimentary rocks are
the most common reservoir rocks because they have more porosity than most ig-
neous and metamorphic rocks and form under temperature conditions at which
hydrocarbons can be preserved. A reservoir is a critical component of a complete
petroleum system.A variety of domains are generally involved in extracting these
53

hydrocarbons, producing, refining and transporting it for our daily commercial
use. Some of these domains include geology (the study of the Earth-its history,
structure, composition, life forms and the processes that continue to change it),
geophysics (the study of the physics of the Earth, especially its electrical, grav-
itational and magnetic fields and propagation of elastic (seismic) waves within
it. Geophysics plays a critical role in the petroleum industry because geophysical
data are used by exploration and development personnel to make predictions about
the presence, nature and size of subsurface hydrocarbon accumulations), reservoir
engineering,and petroleum engineering. As shown in figure 4.1, exploration and
production(commonly referred as E & P in the oil and gas domain) is one of the
most preliminary and primary steps in resource extraction and production.
Figure 4.1: The oil and gas production cycle. Image Courtesy : Climate.org
54

Oil and gas exploration and production(E & P) is one of the main important
steps which itself consists of several stages of data gathering, simulation ,data
analysis, well-site planning and preparation, and drilling. It involves complex
tasks comprising work-flows with pipelined processes that require processing a
large volume of variables related to multidisciplinary data sources from geophysics,
geology, reservoir & production engineering, and reservoir economics.
Exploration is the initial phase in petroleum operations that includes genera-
tion of a prospect or play or both, and drilling of an exploration well. Appraisal,
development and production phases follow successful exploration. During ap-
praisal, delineation wells might be drilled to determine the size of the oil or gas
field and how to develop it most efficiently. Development is the phase of petroleum
operations that occurs after exploration has proven successful, and before full-scale
production. The newly discovered oil or gas field is assessed during an appraisal
phase, a plan to fully and efficiently exploit it is created, and additional wells are
usually drilled. Production is the phase that occurs after successful exploration
and development and during which hydrocarbons are drained from an oil or gas
field. It involves planning and installation of production facilities, equipment,
monitoring, etc.
Geophysicists and geologists study the earth and its sub-surfaces, using grav-
ity, electrical and seismic methods and prepare mathematical and computational
models of a particular area (Figure 4.2). These experts are engaged in exploration
in search of oil and gas reservoirs which contain hydrocarbons. Once the ideal
sites are explored, reservoir engineers study these reservoir models, prepare reser-
voir simulation-models and analyse the reservoir for ideal locations where wells
could be placed for production. Once the well locations are planned and decided,
an on-field team of drilling engineers design and implement procedures to drill
wells as safely and economically as possible, while at the same time protecting
55

Figure 4.2: Oil and gas exploration, development and production (E, D & P)stages and the various disciplines and tasks involved [Sousa et al., 2015].
the health and safety of workers (construction engineers,and contractors) who are
responsible for well construction. Once the well locations are finalized, the terrain
surface is evened out by digging the dirt and well pads are constructed which can
accommodate multiple wells. Once the wells are set-up, the production engineers
and economists take care of the logistics involved in the production cycle.
4.1.1 Well-Planning
We briefly explained the oil and gas exploration and production (E & P) cycle
in the previous section. In this section we will briefly explain the well-planning
process and the opportunities that have motivated the design of PlanWell.
The process of well-planning is highly interdisciplinary and involves a number
of experts from various domains such as geology, geophysics, petroleum engineers
and planners. This team of experts is often known as the “surface team” as they
analyse sub-surface portions of earth. The desired well locations are based on data
56

Figure 4.3: An oil-rig constructed at a well location.
Figure 4.4: A multi-well pad site containing four wells.
57
provided from reservoir engineers, although in practice there is flexibility with
regards to the actual location of the well due to directional drilling (Directional
drilling is the practice of drilling non-vertical wells). The surface team determines
potential locations for the wells based on the recommendations of the reservoir
engineers as well as the economics and logistics determined by the surface team.
This plan is then sent over to the drilling team (often a contractor), which is
responsible for the drilling and operations of the physical wells on the field. The
drilling team must then build a more detailed plan of how to implement the well,
and suggest any necessary changes to the surface team’s plan. During the course
of the drilling team’s planning, the potential well locations will typically require
site surveys and there may be back-and-forth dialogue between the surface team
and the drilling team based on information uncovered during the site surveys.
Potential well locations may have environmental or archaeological significance, or
have features that impact the economics or safety of the well.
After many potential iterations of planning, the drilling plan may be executed.
This entire turn-around time could take days or weeks based on the complexity of
the terrain and the drilling plan. With PlanWell, we hope to expedite this process
and reduce the time of this collaboration as well as improve communication of
information and therefore reduce the probability of errors.
4.2 PlanWell - Spatial User Interface For Collaborative Petroleum
Well Planning
PlanWell uses augmented reality and 3D printing to provide both overseer and
explorer with spatial interactive representations of the task, enhancing situational
awareness and sense-making.
Though PlanWell can be applied to various collaborative terrain exploration
58

scenarios and tasks such as military operations and rescue missions, in this chapter
we use a specific petroleum engineering scenario as the context and design the
system to address practical problems relating to remote collaboration in such
activities. We also conducted two focus group discussions with domain experts to
gather qualitative feedback of our prototype and design approach.
Our work makes following contributions:
• A tangible 3D augmented reality technique providing clear and in-
tuitive spatial and structural awareness to a central overseer in a
command center, while providing immediate and relevant informa-
tion to a user in the field.
• Application of the technique to a realistic engineering scenario, based
on feedback and suggestions gathered during interviews with domain
experts. This application is further supported by a set of design
guidelines developed based on information from the subject matter
expert interviews.
• Details of our implementation so that others may build similar appli-
cations as well as a technical evaluation which presents the technical
strengths and limitations of our system.
In the remainder of this chapter, we will describe in detail, the design, imple-
mentation of our PlanWell prototype. We will also be discussing in detail the
evaluation efforts and the results of two focus group discussions we conducted on
PlanWell.
4.2.1 Design Considerations
Since our design and system has to be used by experts from various domains
who may not be experts in using computing systems and environments, we had
59

the following set of design considerations and their respective implications on the
design.
• 3D Printout as a Tangible User Interface: Previous TUI re-
search has confirmed that physical representations help in under-
standing complex spatial representations and relationships [Har-
ris et al., 2011] [Gillet et al., 2005] [Jansen et al., 2013]. Geol-
ogy and Urban planning communities have already explored the
effectiveness of 3D printing to print physical models of GIS data
[rase2009visualization]. They believe that such physical printed
models enhance the spatial situational awareness during collabo-
ration.
Implications on Design: This previous interdisciplinary research in-
spired us to use physical 3D printed representation of the terrain as
an interactive medium for collaboration.
• Maintaining The Local Physical Context: One of the require-
ments of our system is that it should preserve the actual physical
context of the surroundings in which the users are present.
Implications on Design: We could have used map based naviga-
tion system or pure virtual environments for the collaborative tasks.
Though these techniques are efficient and provide various essential
features such as the zooming and panning, they disconnect the user
from the actual physical environment. We hence used Augmented
Reality to ensure that the users (both the overseer and the explorer)
can perceive the actual local environment as well.
• Interaction Design: Based on our discussions with domain ex-
perts, we learnt that the Surface Team is responsible for driving
60

and planning the drilling operations and the on-field drilling team
performs the required tasks. Based upon this setting,we envision
the overseer as the major force who drives the entire task, while
the explorer is the user who typically “executes” tasks based on the
directions from the overseer.
Implications on Design: We empower the overseer to a wider set of
stylus-based interaction which enables him to annotate, and sketch
on the 3D printout, while the explorer can only visualize or select
some important features for analyzing them in-situ and relaying the
same information to the overseer.
• Simple and Commercially available Experimental Apparatus:
Another obvious requirement is that the system should be small and
easily setup because of its possible usage in various domains and re-
alistic field studies. The domain experts whom we envision to be
our system users might not be well-versed with setting up the envi-
ronment; hence our system needs to be easy and simple to be setup
by novice users without much training.
Implications on Design: There are multiple approaches such as a
shape/surface-changing display [Follmer et al., 2013] with AR, using
a projector for overlaying content on the 3D printout. However these
solutions are very difficult and non-intuitive to setup and confine
the apparatus to laboratory. Hence we use the Mobile Augmented
Reality (MobileAR) approach.
4.2.2 Design
Our design concept enables two remote users to share the same spatial experience
via an intelligent interface that bridges distance, differences of scale and perspec-
61

tive, allowing one, the explorer to use the actual physical space as an interactive
medium, and the other, the overseer, to use a 3D scale printout model of the same
environment as her interactive medium. We realized the design concept merging
the 3D printing techniques and augmented reality and by designing for a specific
oil-and-gas task scenario where our approach can be deployed and tested in a valid
setting. Below we describe the design of PlanWell and the interactive reservoir
exploration and analysis scenario. PlanWell contains two major components: the
mission control part, which we name as the overseer interface, and the in-field
part, which we name the explorer interface.
The overseer PlanWell interface uses a 3D printout as the physical represen-
tation of the topographical and reservoir model. Though this particular printout
was provided by a 3D printing service vendor (Shapeways Inc.) based on the digi-
tal model of the reservoir terrain, the printing process is quite standard and can be
replicated with any regular commercial 3D printer. Augmented reality is used to
superimpose necessary application-specific virtual information, onto the 3D print-
out, as well as, dynamic data reflecting the geo-location of the explorer and other
points of interest. The combination of the visual illustration and the tangible
access of the topographical shape of the model allows the overseer to understand
the topographical properties of the terrain and the related spatial structure of
the reservoir model, along with its association to the simulation visualization in
a direct manner, allowing physical (e.g. by touch) and visual exploration of the
reservoir model. The goal of this arrangement is to offer the overseer direct physi-
cal representation of the topographical spatial properties, accessing the 3D printed
TUI both visually or by touch, maintaining overall awareness of the activities on
the reservoir in real time via the AR visual feedback, and enabling interactive ac-
cess to the application-specific visualization, superimposed on its scaled-down 3D
physical representation PlanWell also provides interactions that allow the over-
62

Figure 4.5: The overseer interface which consists of the 3D printout of the terrain,an iPad as the AR device and a stylus.
Figure 4.6: The overseer can sketch on the 3D printout with the AR- based stylus
63

seer to annotate and modify the existing data with a stylus (Figure 4.5 and Figure
4.6). The stylus enables the overseer to draw a relatively precise path or select
an area on the surface of the 3D printout and send it to the explorer, cut open
a vertical intersection to examine the interior structure of the or drag and move
an existing point-of-interest (POI), which in an oil-and-gas exploration scenario
could be an oil well, to a new location, in order to allow the explorer to examine
it in the field.
The explorer PlanWell interface uses augmented reality to superimpose the
application-specific data (in this case, reservoir data) onto the terrain around the
explorer, presenting static information such as aforementioned reservoir properties,
as well as dynamic information broadcasted from the overseer such as paths,
selected areas, and suggested locations of wells (Figure 4.7). The communication
is bidirectional.
4.3 Implementation
PlanWell uses an intermediate server to exchange information, including geo-
references marked by the explorer and point-of-interests (POIs) marked by the
overseer or explorer. The overseer and explorer clients are implemented on differ-
ent devices and runtime environments. The overseer interface was implemented
on an iPad Air running iOS and the explorer interface was implemented on a
Google Nexus 5 running Android. Both clients display content via augmented
reality. However, the explorer interface provides a geo-reference based in-situ ex-
perience by placing visualizations over the surrounding environment, while the
overseer interface creates an exocentric visual experience and superimposes visu-
alizations over the 3D printout with pen based interactions implemented using
the Qualcomm Vuforia [vuf, 2016] library. To achieve alignment between the per-
spective and the physicality, the explorer interface uses the built-in functions on
64

Figure 4.7: The overseer interface is mobile geo-location based Augmented Real-ity(AR) system, that superimposes various domain-specific data on the surround-ing physical terrain.
65

the explorer ’s device such as the accelerometer, step detector, magnetic and GPS
sensors. The overseer maintains alignment by tracking fiducial markers placed
around the 3D printout.
To tailor our design for the petroleum engineering domain, we overlaid infor-
mation, such as petrol-reservoir data and production wells on the 3D printout
as well as on actual physical terrain as shown in figure 4.6 and figure 4.7. Both
interfaces use OpenGL ES to provide the visual elements.
4.4 Interaction Techniques
Petroleum well planning and drilling is the application that we have targeted for
this project. To test the effectiveness of our prototype, we consider a scenario that
contains tasks commonly carried out during well planning and drilling operations.
We designed three primary interaction scenarios to facilitate such remote col-
laboration for well-planning. In the first scenario the explorer ’s location is dynam-
ically updated on the 3D printout of the overseer. While navigating the field , the
explorer ’s geo-reference is continuously sent to the overseer, allowing the overseer
to maintain the spatial awareness of the explorer (Figure 4.8).
In the second scenario, The explorer may select a particular POI on the field
by tapping on the touchscreen of the device (Figure 2d), and then the selection
will be translated into world coordinates and rendered as a red arrow on both the
overseer and explorer screens, pointing at the corresponding location. This POI
could be a certain terrain feature such as an environmental or safety concern or it
could be a potential well location (Figure 4.9).
66

Figure 4.8: The explorer position is dynamically updated on the 3D printout(left)as he navigates in the field(right)
In the third scenario, in the case of a location determined to be suitable for a
well based on the site survey, the overseer then could drag the representation of
the well from an unsuitable place, to this POI (Figure 4.10 (left) ). Meanwhile,
the explorer could also see the well representation appear on his AR interface
(Figure 4.10(right)) at the proper location as it is moved by the overseer. The
above scenario demonstrates the bidirectional information exchange triggered by
user interactions, and the corresponding visual representations on both interfaces.
4.5 User Study
We conducted two focus group sessions with domain experts to gain further in-
sights into our design. In this section we will be describing the major themes and
discussion points that emerged out of our focus group discussions.
67

Figure 4.9: The point-of-interest(POI) selected by the explorer is updated onthe 3D printout (left). The point-of-interest is labeled in the explorer ’s interface(right)
Figure 4.10: The overseer updating a point-of-interest(a well location in this par-ticular case) with the pen tool (left). Updated position of the well is shown onthe explorer ’s interface(right)
4.5.1 Focus Group Study Design
We conducted two focus groups with different set of domain experts in each group.
The first group had three experts who were from the petroleum and reservoir
engineering departments at the University of Calgary. Though all of these experts
are from the academia, they have worked in or alongside different teams and
disciplines within the oil-and-gas-production cycle. They had several years’ of
experience in the industry as well. The second group had three experts who were
from the industry. They are part of the surface team and perform the well-planning
and analysis on a daily basis.
68

Based on this, we believe our participants were qualified enough to comment
about the validity of our prototype. The aim of the focus group was to gather
qualitative feedback about the validity of our prototype and its perceived benefit
to the oil-and-gas production cycle. We also sought to find the specific workflows
for which our prototype could provide value and gain feedback and comments
regarding improvements to the visual representation of data and interaction tech-
niques.
The focus group was conducted in a controlled setting. The domain experts
were first instructed on the technology and concepts involved, such as augmented
reality. The instruction included both conceptual discussions as well as demon-
strations of the AR devices showing some sample AR applications. The 3D printed
model of the terrain was then explained and the AR overlay on the 3D printout
was demonstrated. The participants had the opportunity to try our demo with
both the iPad and the Epson headset. The participants were then introduced to
the pen-based interactions and encouraged to try them on the 3D printout. The
participants were also shown the explorer interface. For simplicity, we mocked
up the explorer interface to show the explorer AR overlay and visualizations in
the focus group session. The experts were given the opportunity to try our entire
system with mock scenarios and the participants had the opportunity to take the
role of both the overseer and the explorer.
Once the experts seemed to fully understand the functionality and interaction
techniques of the prototype, we conducted the focus group. The entire conversa-
tion was audio-recorded and the sessions lasted for 60 minutes each. The entire
protocol that was followed for conducting the focus group study can be found in
the Appendix A.1. section. Using the audio recordings we transcribed the audio
for both the focus group discussions. We performed open coding of the transcribed
data in order to group broad themes and identify interesting observations [Corbin
69

and Strauss, 2014]. For the discussion of the results we refer to the academic
experts from the first focus group discussion as A1, A2 and A3, while the experts
from the industry are referred as I1, I2 , I3.
4.5.2 Results and Discussion
The domain experts were quite excited and interested by the prototype. They
claimed to have not seen anything similar and provided valuable feedback about
how PlanWell could be useful in the oil and gas industry. During our focus group
study, the following major themes emerged.
The Role of 3Dprintout for Better Spatial Understanding
Previous TUI research has confirmed that physical representations help in under-
standing complex spatial representations and relationships [Harris et al., 2011]
[Gillet et al., 2005] [Couture et al., 2008]. Our focus group affirmed these claims.
The domain experts felt that the 3D printed models could be useful in clearly
and intuitively understanding the nuances of the terrain. For example one of the
domain experts explained that with a 3D printout of the terrain, its easier to get
to know the appropriate pad sites for well construction which ultimately helps in
reducing the time and cost and eliminates guess-work. One of the domain experts
from the first group also expressed similar views saying that 3D printed models
could help in understanding the regularities and irregularities on the surface based
on which well platforms can be constructed. However, with respect to quantitative
measures such as task efficiency and productivity, she was unsure how 2d maps
would compare against a 3D printed model. We believe that a quantitative task
based evaluation would help us in answering this question.
“With the 2D map, it is tougher. For example, we decide a pad on the edge
of the hill and then the scout guys takes two weeks, and analyses the location and
says, that its not going to work, then we choose a new pad and then again scout
70

again takes 15 days, goes to the new place and then maybe if it works then we
start with the drilling, otherwise the cycle continues. So with the 3D printout, its
easier to get to know the appropriate pad sites. Having a better idea about whats
there on the ground and the features help in reducing the time and cost.” - I1
“In Mexico, when I used to work a project, we were drilling 20-30 wells per
month and the way, the field-team decides on the well platforms and locations are
by using 2D maps. I dont exactly how they do it but I am pretty much sure that
this 3D model could be very much useful there.” - A1.
‘‘Based on the regularity or irregularities of the surface, well platforms can
be constructed. These regularities and irregularities can be easily visible on a 3D
printout. But I am not sure how this can be compared to 2D maps.” - A2.
The domain expert also claimed that given the scale of the 3D printout, pre-
cise approximations of the elevations can also be made which is important for
the well- construction operations. With the current tools most of the elevation
approximations have some guess-work involved.
“precise knowledge of the elevation is important because, even if the elevation
difference is 5 meters , then they have to dig out the dirt to even out the pads
, and this is very expensive and costs about 1 million dollars for evening out a
place with even 5m elevation difference. This tool gives a tighter estimate about
the project rather than guess work with the current tools.” - I1.
Though all the opinions and results of the focus group discussions show that
the 3D-printed terrain model could facilitate better spatial understanding, with
respect to quantitative measures such as task efficiency and productivity, it is not
known how 2d maps would compare against a 3D printed model. We believe that
a quantitative task-based evaluation would help us in answering this question.
71

Enhanced Collaboration between the two remote teams
With current practices in the petroleum engineering domain, the planning of a well
can take a very long time and there is a need for collaboration throughout this time
period. Our experts claimed that this application could be best for facilitating
real-time coordination and communication between remote teams and planners
and could significantly reduce both the time spent planning and the potential for
miscommunication and error.
“Communication breaks between the field scout and the office planning team.
The coordination misses and results in lot of time and money. There is a lot of
break between the guys on field trying to find the location and the office team tries
to plan the location.It takes a lot longer for us to get these pads approved. By the
time they get the crown approved, it takes 6-8 months time. And the from the time
we plan the pad to the time we start drilling there sometimes we miss the timing
and coordination and then we have to go somewhere else. Having a tool like this
allows you to be able to in the office and see right upfront, what is happening, what
is looks like, the issues encountered and shorten the time, so that the locations can
be approved, and get them on production and follow the yearly production forecast
cycle.” - I1.
“This application could be best for the coordination between the surface team
and the on-field drilling team.” - A1.
“When there is change in the location of the well, then it has to go back to the
drilling engineer because they have to correspondingly change the plan according
to the new location. With this tool, the information exchange between the remote
sites enables the teams to dynamically change the plans.” - A3.
Based on the comments of the experts, it is very much evident that the col-
laboration facilitated by PlanWell can help the remote teams to dynamically plan
change and edit well locations and operations there by reducing the turn-over time
72

and cost.
The power of Spatial Augmented Reality
Our experts were impressed with the AR interface and the ability to overlay in-
formation onto the physical environment. They suggested that such spatially aug-
mented reality could save them time and money as they can test the well locations
and well types by overlaying virtual wells while in direct communication with the
planners. They also suggested other information that could be overlaid on both
the explorer ’s surroundings and the 3D printout. This includes information such
as details regarding well locations and well types, locations of archaeological sites,
environmentally sensitive areas, floodplains and watersheds.
“There could be constraints such as a particular site could be archaeological
site, or there could be lot of underground water, or there could be lakes and rivers.
All this information can also be overlaid.” - A2.
3D printout as a Co-located Collaborative Interface
The current PCs and desktop computers which are widely used are single-user cen-
tric and donot support comfortable and effective collocated collaboration. Table-
top systems have been developed that support such collocated collaboration and
these systems have supported collocated collaboration between users [Buisine
et al., 2012] [Rogers and Lindley, 2004]. Extending upon these tabletop interfaces,
tangible user interfaces have also been built that supported collocated collabora-
tion. For example, Designer’s Outpost is such tangible interface that supported
collaborative website design [Klemmer et al., 2001]. Based on this previous litera-
ture we envision that our 3D printed terrain-model could be an effective tangible
user interface that supports collocated collaboration. The domain experts’ views
from our focus group discussion also supported our vision. The experts claimed
that the 3D printed physical terrain model in the PlanWell interface could be
73

a useful collaboration tool which could be useful in bringing multiple experts
from various domains to collaborate on well-planning tasks. Such a collaborative
medium could facilitate common spatial awareness between all the users and hence
could significantly reduce the time for decision-making process.
“The 3D printed terrain model could be very useful collaboration tool. This
could be leveraged as a useful collaboration tool to get multiple people.” - I3.
“The overseer rather than one person per explorer trip could be an entire team
that could collaborate over the 3d printout and finalize it in a single trip and reduce
the cycle time and cost.” - I2.
Physicality And The 3D Stylus-Based Interaction on The 3D Printout
One of the important features that our PlanWell prototype offers is the physicality
provided by the 3D printout. Physical interfaces add value as they allow the user
to touch, feel and manipulate the interface. This particularly useful in domains
such as geology, archaeology, and reservoir engineering as the experts generally
prefer to touch and “feel” the surface for analysis.
“physicality adds value. I always prefer the physical models, touching it and
feeling it. We use 2D maps which are so old-fashioned and we miss so many
things. Now this 3D model acts as a decision space where I can now everything
in 3D. Now I see the value in physical level in addition because with software 3D
models there always some issues with respect to perception and there are always
some errors and spatial data errors and these would easily be corrected with the
physical model. You can measure it to fair extent and look at the 3D digital models,
but it doesnt much relate to the real world.” - I1.
Although the computer generated models provide 3D visualization, these vi-
sualizations are often complex and there are always perception issues [Johnson,
2004] [Ware, 2012]. The physicality provided by the 3D printed model resolves this
perception issue as the visualization now is physical and relates to the real-world.
74

The experts during the focus group discussion revealed the various perception is-
sues which are introduced by the commercial 3D software packages. Sometimes
these perception issues make it very difficult for the older staff to grasp the interac-
tion with the 3D virtual models in relation to their physical real-world interaction.
Also the modes of interaction with the 3D spatial data in the commercial software
packages is with 2D interfaces such as mouse and keypads. This makes the inter-
action non-intuitive and often leaves the user clueless about the orientation of the
model. These issues were explained in detail by the experts in our focus group
discussions.
“For older staff, sometimes its very difficult to orient and visualize the 3D
visualization. Not even operating the tool, just visualizing the model, spinning
and orienting themselves to the view is very difficult to get and understand what
they are seeing. It does happen quite often. Physicality helps in conveying certain
spatial concepts to people.” - I2.
One of the other important features the PlanWell interface provides is the
natural 3D stylus- based interactions which allow the overseer to sketch and draw
on the 3D printout. This is in particular useful as it provides natural 3D interaction
with the physical world, when compared to the 2D sketches on 3D data as offered
by the current commercial software packages. Many of the times, the experts
interact with the high resolution data and sketching paths is one of the most
common modes of interaction. However the current 3D software packages make it
very non-intuitive for this mode of interaction and the current sketching is multi-
step approach. The users have to make 2D sketches and these need to converted
into 3D shape file by another specialized software and this file is fed as input
to the 3D visualization software to visualize the final output. Our stylus-based
interaction approach eliminates this multi-step approach and enables the user to
directly interact with the data without any perception issues.
75

“Sometimes we work on smaller area and higher resolution. The process we do
now are with commercial map based software, make 2D sketches, and go through
a rather multiple-step process, like make that into a shape file, load it into a 3D
software. The pen-based interactions are very intuitive because they can sketch
it into the actual 3D printout and there are no perception issues. More direct
input on the 3D printout is very intuitive and presents natural interaction, rather
than 2d sketches on 3d data using software . The current sketching and planning
process is multiple-step approach. They use a 2d map-based software which allows
them make some sketches for planning. In order to visualize and plan them in 3D,
these 2d sketches involve a multiple step process to convert to 3D, i.e they need
to create shape file and then input this into another commercial 3D viz software
and then visualize it. And again when they have to make a new sketch or change
the existing sketch, they have to go back to the previous 2D maps-bsaed software,
make a new sketch and convert and then see it 3D using the 3D software. So this
sketching and planning operations are very time consuming and non-intuitive.” -
I1.
Mobile Augmented Reality Based Approach
In our design considerations section we mentioned that one of the goals of our
system design should be that the experimental apparatus should be simple to
setup. Due to this design goal, we used mobile augmented reality approach to
design our overseer and explorer interface. The focus group discussion helped
in evaluating this design approach of ours. The experts liked our approach and
claimed that this mobile AR based approach would particularly appeal to the users
as most of the users carrying out the domain-specific tasks are not tech-savvy and
technology friendly.
“I like this approach of cell phones because; the guys doing the scouting are not
the technology friendly guys. They have cell phones. The guys are generally old
76

about 65 years, and they would prefer using the cell phones.” - I1.
However, they did suggest that projection-based AR approach for the overseer
interface could be experimented as it could facilitate co-located collaboration be-
tween the experts. Apart from this the experts also presented insights into more
sophisticated technological systems that could aid their daily tasks. For example,
one of the experts suggested modelling clay like interface for the overseer which
would allow the geologists to manipulate, shave and carve and perform various
other operations with the sub-surface data. This suggestions strongly resonates
with Ishii’s [Piper et al., 2002] illuminating Clay prototype which was developed
for landscape simulations.
“Sometimes we geologists could add some modelling clay and most of the time
geologists think about shaping it, shaving it and carving and various other opera-
tions . physicality of sub-surface mapping is also very useful and advantageous.” -
I2.
Applicability of PlanWell Beyond Well Planning
Our experts commented that our prototype had the potential to be useful for other
workflows within the petroleum engineering domain. These include monitoring
remote oil rigs, reservoir planning and facilitating collaboration between reservoir
engineers and geologists for tasks such as extrapolating sub-surface models from
the surface terrain, geomatics and civil engineering.
“This could be very useful for the geomatics guys, especially the ones who do
mapping and surveying.” - A3.
“Civil engineers could also use PlanWell, for construction of roads, structures
etc” - A3.
“This 3D model could help in estimating the sub-surface model that lies beneath
the earth. The terrain pattern could be used to extrapolate the subsurface which
could also be useful in reservoir engineering studies.” - A1.
77

“The application could be useful in monitoring rig movements. For example
if there are a number of rigs place on the field, the overseer can monitor the rig
movements and plan for the upcoming strategies, for production.” - A2.
Based on this feedback, we envision that our PlanWell concept could be useful
and applicable across a various domains for a variety of tasks.
4.6 Limitations And Future Work
PlanWell is functional and was designed according to input from domain experts
and reservoir engineers. However, though our focus groups and interviews affirm
the applicability and usability of our prototype, it is still a preliminary prototype.
We have not validated its usability “in-the-wild” with domain users performing
actual tasks. One current limitation of our design is the procurement of high qual-
ity 3D printed models. A geographical region may be very detailed and complex
and it is still an effort to print a high quality 3D version of it. However with the
progression of the current 3D printing technologies, it is likely that this barrier
will eventually be reduced if not completely eliminated. Another limitation is the
AR devices of the overseer interface. It could be tiresome for the users to hold
the hand-held device and operate on the TUI. Though this ergonomic issue could
be solved by the AR headset, the headset suffered from a limited field-of view and
low resolution display which might not be suitable for visualizing high-resolution
data. Although PlanWell provides a novel interaction and collaboration mecha-
nism for remote users, its comparison with traditional maps or desktop tools must
be further investigated to determine if there are clear advantages to conventional
2d maps. With respect to the collaborative features, we would like to extend the
design to multiple (non-collocated) explorers and also to multiple (non-collocated)
overseers, all analyzing the same reservoir model.
78
4.7 Summary
We presented our PlanWell prototype which facilitates collaborative well planning
and drilling operations using AR and 3D printing technologies. This system allows
a central overseer and an in the field explorer to dynamically exchange information
within a shared spatial medium. The overseer uses a scaled 3D printed model
of the petroleum-reservoir surface terrain, which acts as an aid to understand
the spatial nuances of the terrain and also as a tangible user interface (TUI).
The seamless integration of AR with the TUI provides visual as well as tactile
sensation about the petroleum-reservoir surface terrain and supports collaboration
between the overseer and the explorer. The explorer interacts with the surface
environment directly via an AR interface. Our contributions include the use of an
AR interface using a 3D printed terrain model to support interactive techniques
that provide spatial and structural awareness during collaborative navigational
tasks. We apply this interface to a realistic petroleum engineering scenario and
discuss our design and prototype implementation with domain experts. Based on
these discussions, PlanWell could prove to be a practical tool which would provide
value to collaborative petroleum engineering workflows.
79
Chapter 5
Flying Frustum : A Spatial Interface For
Enhancing Human-UAV Awareness
In this chapter we present another application of 3D physical maps. We present
Flying Frustum, a spatial interface that enables control of semi-autonomous UAVs
(Unmanned Aerial Vehicles) using pen interaction on a physical model of the ter-
rain, and that spatially situates the information streaming from the UAVs onto
the physical model. Our interface is based on a 3D printout of the terrain, which
allows the operator to enter goals and paths to the UAV by drawing them directly
on the physical model. In turn, the UAVs streaming reconnaissance information
is superimposed on the 3D printout as a view frustum, which is situated accord-
ing to the UAVs position and orientation on the actual terrain. We argue that
Flying Frustums 3D spatially situated interaction can potentially help improve
human-UAV awareness and enhance the overall situational awareness. We moti-
vate our design approach for Flying Frustum,present our preliminary prototype
using both handheld and headset augmented reality interfaces, reflect on Flying
Frustum’s strengths and weaknesses, and discuss our plans for future evaluation
and prototype improvements.
5.1 Introduction
Unmanned Aerial Vehicles (UAVs) are increasingly ubiquitous and have many
well established uses, including various reconnaissance applications in search-and-
rescue and military settings [Goodrich and Schultz, 2007] [Mitchell et al., 2005].
80

There are also many other applications emerging, from cinematography [lil, 2016]1
(Figure 5.1) to shipping and delivery [ama, 2016] (Figure 5.2)2 .
Figure 5.1: (a) Lily Camera (b) Sketch of a Lily Camera in action
Figure 5.2: Amazon air prime drone prototype in action.
As UAV technology is emerging, many of the challenges of controlling these
robots remain acute, from more efficient interaction with their low-level flying
mechanisms, to higher-level issues of tele-operation and control [Goodrich and
Schultz, 2007] [Mitchell et al., 2005]. Flying Frustum focuses on the highlevel
issues of teleoperation when interacting with UAVs which are performing a recon-
naissance task over a remote terrain. Flying Frustum provides the UAV operator
1Lily Camera. https://www.lily.camera2Amazon Air Prime. http://www.amazon.com/b?node=8037720011
81

with a 3D printout of the terrain, which can be used to plan and draw flight paths
for the UAVs. A visualization of the UAVs position on the 3D terrain is super-
imposed on the 3D printed model and a correctly situated frustum can display
real-time information about the UAV. In the case of this prototype the informa-
tion displayed is a video feed from the UAVs camera. Flying Frustum is designed
to provide a remote operator an enhanced level of human-UAV awareness [Drury
et al., 2006b] [Drury and Scott, 2008] and improved situational awareness [Endsley
et al., 2000] when controlling one or more semi-autonomous UAVs. Our approach
closely follows the footsteps of Drury, et al. [Drury et al., 2006a] which argues that
situated streaming information from a UAV would increase the operators situa-
tional awareness. However, Flying Frustum extends this paradigm by using a 3D
terrain printout with augmented reality visualizations as the interactive medium
(Figure 5.3).
Figure 5.3: Flying Frustum; (left) the operator draws a path using a pen onthe augmented 3D printout of the terrain; (middle) the UAV, a quadrotor inthe current prototype, flies along the path in the field; (right) live video footagestreaming from the UAV is displayed as a view frustum situated at the correctlocation on the 3D printout, using augmented reality
In this chapter we present a prototype realizing the Flying Frustum concept,
based on visualization superimposed on a 3D printout using either a hand-held or
headset augmented reality interface, and a Parrot Bebop drone3 as the UAV. While
our current prototype is still preliminary, it does allow us to reflect on the strength
and weaknesses of the Flying Frustum approach, argue the benefits of providing
streaming information from the UAVs correctly situated and superimposed on
3Parrot Bebop Drone. http://www.parrot.com/ca/products/bebop-drone/
82
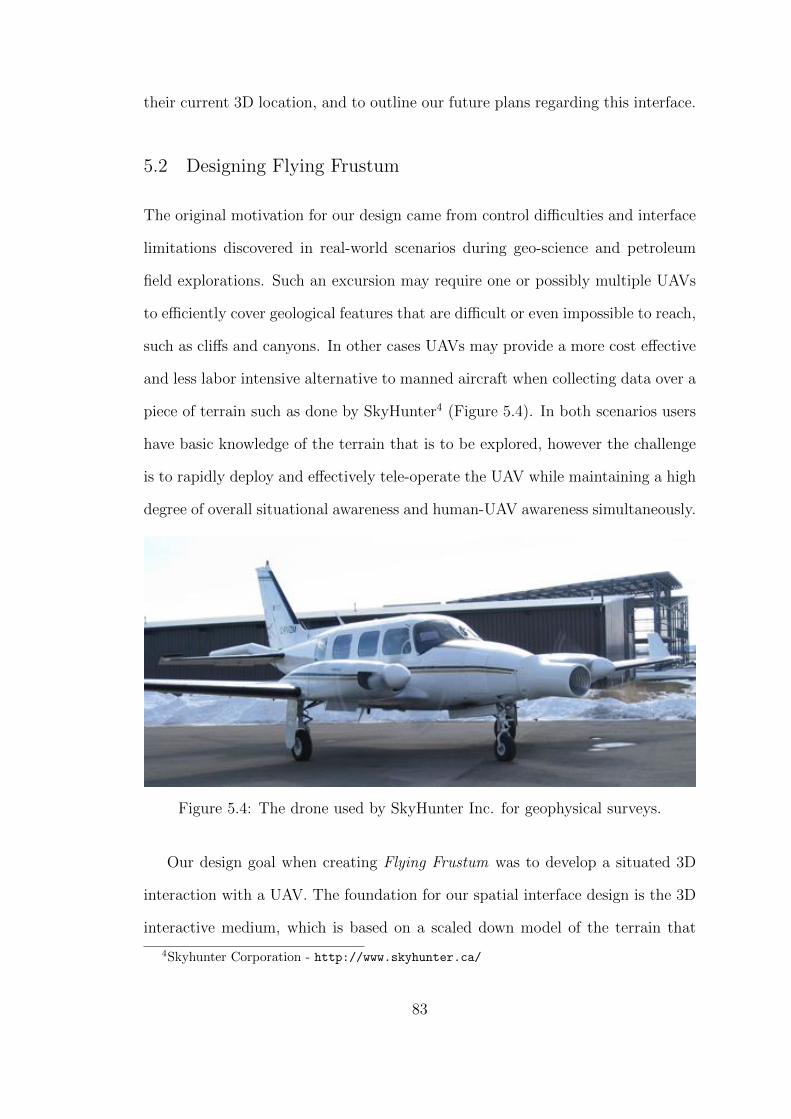
their current 3D location, and to outline our future plans regarding this interface.
5.2 Designing Flying Frustum
The original motivation for our design came from control difficulties and interface
limitations discovered in real-world scenarios during geo-science and petroleum
field explorations. Such an excursion may require one or possibly multiple UAVs
to efficiently cover geological features that are difficult or even impossible to reach,
such as cliffs and canyons. In other cases UAVs may provide a more cost effective
and less labor intensive alternative to manned aircraft when collecting data over a
piece of terrain such as done by SkyHunter4 (Figure 5.4). In both scenarios users
have basic knowledge of the terrain that is to be explored, however the challenge
is to rapidly deploy and effectively tele-operate the UAV while maintaining a high
degree of overall situational awareness and human-UAV awareness simultaneously.
Figure 5.4: The drone used by SkyHunter Inc. for geophysical surveys.
Our design goal when creating Flying Frustum was to develop a situated 3D
interaction with a UAV. The foundation for our spatial interface design is the 3D
interactive medium, which is based on a scaled down model of the terrain that
4Skyhunter Corporation - http://www.skyhunter.ca/
83

Figure 5.5: (left) using a 3D printout model as a physical representation to thetopographical terrain; (right) augmented reality visualization is superimposed ontothe model
the UAVs are exploring. We create this medium using 3D printing, generating
a physical representation of the terrain. The 3D printout provides users with a
tangible entity that accurately and intuitively communicates detailed topographic
information through both visual and tangible sensation. Augmented reality is
used to superimpose spatial information onto the physical printout(figure 5.5).
We designed the augmented reality layer of Flying Frustum considering both
see-through AR headset (using Epson Moverio5) and handheld AR screen (using
iPad Air) (Figure 5.6). The 3D terrain printout is used as the interactive medium
for sending user commands to the UAV by sketching on the terrain model, and for
communicating information back to the user via 3D situated visualizations super-
imposed on the terrain. In order to correctly situate the various 3D information
components, Flying Frustum needs to track the position and orientation of the
handheld or the headset interface relatively to the 3D printout, and the position
and orientation of the 3D sketching stylus.
We designed a set of pen-based interactions performed directly on the physical
model of the terrain(similar to the ones designed in the PlanWell prototype in
chapter 4) that allow the operator to control the movement of the UAV. We
5http://www.epson.jp/products/moverio
84

Figure 5.6: (Flying Frustums augmented reality devices including (left) handheldscreen and (right) see-through headset
used physical pen-based interactions to address the “fat finger” problem and to
enhance the precision of the operator commands to the UAV, while still allowing
direct, tangible interaction and intuitive understanding of the topography of the
3D printout and therefore the terrain (Figure 5.7).
Figure 5.7: (Flying Frustum’s augmented reality devices including (left) handheldscreen and (right) see-through headset
Similar to drawing a path on a traditional map, the operator may define a
path for the UAV by sketching a line upon the surface of the physical model.
After the operator has created a path, the drone will fly to the location that is
marked the start point of the path on the model, and then move along the path
until it reaches the end point. The visualization of the UAV flight on the model
corresponds spatially and temporally to the actual flight path of the drone in the
85
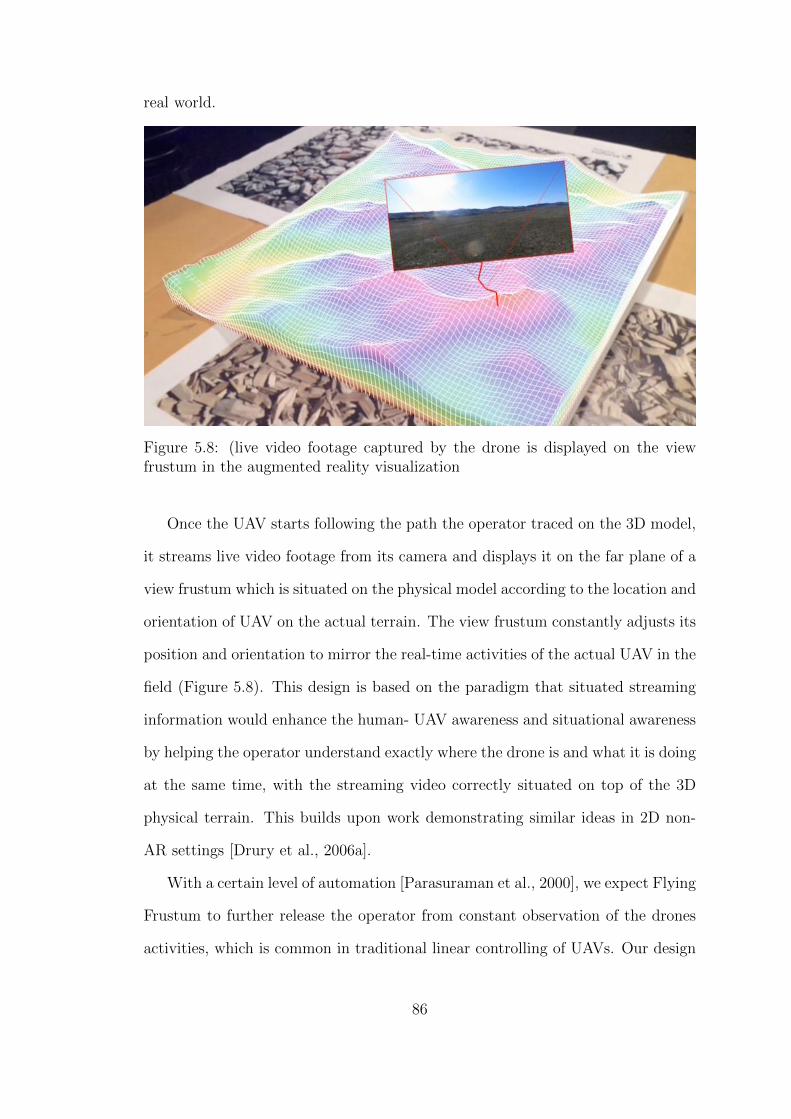
real world.
Figure 5.8: (live video footage captured by the drone is displayed on the viewfrustum in the augmented reality visualization
Once the UAV starts following the path the operator traced on the 3D model,
it streams live video footage from its camera and displays it on the far plane of a
view frustum which is situated on the physical model according to the location and
orientation of UAV on the actual terrain. The view frustum constantly adjusts its
position and orientation to mirror the real-time activities of the actual UAV in the
field (Figure 5.8). This design is based on the paradigm that situated streaming
information would enhance the human- UAV awareness and situational awareness
by helping the operator understand exactly where the drone is and what it is doing
at the same time, with the streaming video correctly situated on top of the 3D
physical terrain. This builds upon work demonstrating similar ideas in 2D non-
AR settings [Drury et al., 2006a].
With a certain level of automation [Parasuraman et al., 2000], we expect Flying
Frustum to further release the operator from constant observation of the drones
activities, which is common in traditional linear controlling of UAVs. Our design
86

assumes that the UAV is semi-autonomous, meaning that it is able to hover and
follow a predetermined path without human supervision until receiving any further
instructions.
We believe that such an interface can help the operator maintain a high level
of situational awareness without dramatically increasing the workload or cognitive
load, which in turn could enable the operator to control multiple drones simulta-
neously.
5.3 Implementation
The prototype of Flying Frustum presented in this chapter is a preliminary proof-
of-concept. The 3D printed interactive medium including the augmented reality
functionality, the pen input and the 3D video frustum are fully realized and are
completely functional. However, direct control and communication with the UAV
has not been implemented and we use the Wizard-of-Oz prototyping method when
flying the UAV and when playing the video back to the user via the situated
frustum.
Our prototype was tested with both an Epson Moverio2 headset and an iPad
as the augmented reality devices, and the Qualcomm Vuforia3 engine was used
to illustrate the visualization. The 3D printout is made from strong flexible plas-
tic6 and was acquired from a commercial 3D printing company (Shapeways Inc.).
We use the iPad as our primary augmented reality device to realize our proof-
ofconcept.
A Parrot Bebop Drone7(Figure 5.9) is used as our UAV. It is a lightweight drone
capable of performing 3-axes movements, and recording full HD video footage.
Due to the lack of reliable network coverage by commercial cellular networks
6http://www.shapeways.com/materials/strong-and-flexible-plastic7http://www.parrot.com/ca/products/bebop-drone
87

Figure 5.9: The Parrot Bebop drone used in Flying Frustum.
and ISPs at certain locations the drone was operated, the communications between
the operator and the UAV is implemented by means of the Wizard-of- Oz technique
[Dahlback et al., 1993], including sending the instruction and receiving the video
footage (Figure 5.10). We believe that this comprise still allows us to reflect on
the overall validity of the Flying Frustum concept.
Figure 5.10: Flying Frustum’s block diagram
88

5.4 Limitations And Future Work
Although we see Flying Frustum as a direct extension of past work that demon-
strated that situated streaming information improves human-UAV awareness [Drury
et al., 2006a], our augmented reality approach still requires formal evaluation and
validation, and the preliminary prototype we presented here still needs to be so-
lidified to make sure it is ready for use in an actual user study.
One limitation is the current state of augmented reality technology, and specif-
ically the questionable usability of see-through headsets primarily due to the lim-
ited field of view. However, we believe that with the rapid development of this
technology future augmented reality headsets will have much larger field-of-view
and higher fidelity. We are looking forward to integrating future headsets (e.g.
Microsoft HoloLens8) in Flying Frustum as well as to exploring other visual aug-
mentation approaches such as projection mapping on top of the 3D model.
We would like Flying Frustum to support a much richer gesture vocabulary.
For example, allowing the operator to sketch a loop to indicate an area on the
3D printout, or to use a pre-defined search pattern (e.g. spiral or grid), which
will direct the UAV to continuously monitor a path above the terrain, to search
a specific area, or to follow a specific flight pattern. Such an extended gesture
vocabulary could have applications and benefits to various tasks such as search
and rescue operations.
In addition, we plan to study how Flying Frustum can improve the operator-
UAV ratio, and allow control of a several UAVs simultaneously. We are inter-
ested in learning the overall workload and performance impact of Flying Frustum
on operators of multiple UAVs, especially in comparison to other UAVs control
mechanisms (e.g. [Mitchell et al., 2005]).
8https://www.microsoft.com/microsoft-hololens/en-us
89

5.5 Summary
In this chapter we presented a new human-interface we call Flying Frustum, which
facilitates spatial situated remote interaction with drones. Flying Frustum uses a
3D printout of the terrain as an interactive medium. The UAV operator can use
pen-based interactions to input flight paths and send commands to the UAVs by
sketching directly on the physical topographical model of the terrain. The UAVs
can in turn present information such as streaming video back to the operator via
the augmented reality overlay on the terrain model. The information is situated in
a 3D view frustum on the model in the correct location corresponding to the UAVs
current position. We outlined our design approach using handheld and headset
augmented reality techniques, and our current preliminary prototype based on a
Parrot Bebop drone.
Though our work on Flying Frustum is still ongoing and while we have not
performed a formal evaluation, we believe that Flying Frustum provides a unique
human-UAV interface, and that the 3D real-time situated interaction it affords is
intuitive and increases human-UAV awareness over previous works.
90

Chapter 6
Lessons Learned And Discussion
In this chapter we present some of the lessons we learned while designing spatial
interfaces for physical representation of maps. We discuss our reflections based
on our design and implementation efforts. The lessons we provide here may not
be a comprehensive set since they are based only on our experience within the
limited scope of this thesis, however, we believe that the themes we discuss here
are valuable and embody fundamental concepts for the design of collaborative
spatial interfaces for physical representations of maps.
In the first section we describe some of the lessons we learned and general design
guidelines pertaining to the physical scale of the 3D physical representation of
maps. We then present our reflections and then conclude this chapter by presenting
limitations of our work.
In this chapter we describe the lessons we
6.1 Lessons Learned
In this section, we detail our insights regarding the scale of the physical representa-
tion. These insights have been developed based on our experiences while realizing
the prototypes in this thesis and also on the current limitation of 3D printers.
Lesson #1 : Choosing the Appropriate Scale
One of the current limitations of 3D printers is that they cannot print large high
resolution areas. So, the size of the medium, and thus, the resulting 3D maps,
and the resolution in which fine details can be written upon it, are both limited.
For example, the maximum dimension of the printout we could obtain from a
91

commercial 3D printing service (Shapeways Inc) was 26cm x 54cm x 6cm (breadth
x length x height, shown in Appendix B.1)(Figure 6.1). This printout covered an
area of 2.8 km x 4.9 km which results in a scale ratio of 1: 10800 cm along the width
(X-axis) and 1:9000 cm along the Y-axis. We use linear interpolation along X and
Y axis to convert a latitude longitude co-ordinate to the normalized co-ordinate
on the 3D printout (see Appendix B.3 for details on this conversion). As per this
calculation, for every 100 meters travelled by the explorer, the corresponding
travelled distance on the 3D printout will be 1cm.
We suggest that the scale ratio is an important consideration to take into
account based on the application. For example a scale ratio of 1:100000 cms
might not be appropriate for a walking-based exploration application wherein the
explorer would need to travel 1km, for a 1cm update on the 3D printout. In
contrast, such large scales might be a better fit for other explorations wherein the
exploring entity is a vehicle or a drone.
Lesson #2 : Portability vs Resolution
One of the other major design decisions that has to be made for an application
is the trade-off between portability and the resolution of the printout. Larger 3D
printouts have the advantage of offering higher resolutions and lower scale ratios
but they can be very bulky and non-portable.
We used mobile based Augmented Reality approach for all our prototypes
which makes our apparatus highly portable (Figure 6.3). For larger printouts,
mobile based AR approach might not be suitable as the area to be tracked is
larger, and given the limited field-of-view (fov) of the current mobile cameras, the
robustness of the tracking could be mediocre. Projection mapping could be used
to project content onto such large physical representations (Figure 6.2). Another
major advantage of projection mapping is that it allows multiple users to view the
content simultaneously enabling a highly collaborative environment. However, the
92

Figure 6.1: ( top) Small scale 3D printout with 20cm x 20cm dimension and(bottom) larger scale 3d printout with 26cm x 54cm
93

Figure 6.2: Projection Based Augmented Reality overlays content on to the 3Dprintout
94

Figure 6.3: Mobile based augmented reality where the content is superimposed onan iPad screen
95

disadvantages of projection mapping are:
• It might confine the apparatus to a laboratory environment.
• Projectors might require calibration and setting up the entire appa-
ratus could be tedious and non-intuitive for non-tech savvy users.
Wearable devices can be integrated into our current design eliminating the need
to hold the mobile devices for long periods of time. Wearable devices could also
be useful when the content is overlaid onto the physical map through projection
based augmented reality. In such a case, wearable devices can serve as private
displays for individual users, while the projection based AR could function as a
shared public display.
Lesson #3 : Printing Higher Resolution Models
As previously mentioned, one of the major limitations of the current 3D printers
is that they cannot print large-scale high resolution 3D printouts. One of the
approach we suggest to print higher resolution models is to print-by-parts. The
high-resolution 3D model can be divided into separate parts, each of these parts
could be printed separately and then the modules can be united into a single map.
The scale of all the separate parts should be maintained constant. We created 3D
models of such individual parts of our university locale (these parts include a hill, a
small pond) (Figure 6.4) so that these could be integrated into one large landscape
enabling us to scale a 300m x 300m area into a 30cm x 30cm physical representation
which gives us a high scale factor of 1: 1000 (compared to 1: 30000 scale for the
3D printouts in our prototypes). We intend to conduct controlled experiments
for collaborative navigation tasks using 3D physical maps (also described in the
future work section of chapter 7) and we followed this print-by-parts approach to
generate a higher resolution printout of a small area.
96

Figure 6.4: (a)Picture of a “chicken-hill” in our university locale (b) Picture of apond in our university locale (c)a 3D model representing the “chicken-hill” areadesigned in Blender (d) a 3D model representing the pond designed in Blender
6.2 Discussion
In this section we provide some of our insights into the design of interactions for
physical interactions of maps.
6.2.1 Direct Physical Interaction
Classic 2D maps offer physicality but the interaction on them is very restricted or
non-existent. For example, they do not allow various operations such as sketching,
painting and deleting regions. 2D digital maps offer these interactions with various
tools such as pen, brush and eraser, which enable users to perform a variety of
actions such as sketching, painting and deleting regions. However, the downside
of digital maps is that they do not offer physicality and spatiality. Since the
physical 3D maps offer spatiality and physicality, we advocate the design of direct
interactions on the physical representation instead of the traditional interfaces such
as a keyboard or mouse (Figure 6.5). This is also shown by our design of stylus-
97

based interactions in our PlanWell and Flying Frustum prototypes which enable
the user to sketch, and annotate on the 3D printout. Another advantage of having
direct interactions on the 3D printout is that it eliminates depth-perception issues,
which are very common with 3D software packages and virtual environments. This
was also highlighted by one of the domain experts during the evaluation of our
PlanWell prototype.
Figure 6.5: Various stylus prototypes used in our experiments. (left) Vicon basedstylus. Three reflective markers are attached for Vicon tracking. Since the Viconrequires a larger area for tracking, the area of stylus has been increased by attach-ing a scale to it (right) stylus based out on augmented reality. Fiducial markersare attached at the top for AR tracking.
6.2.2 Co-located Collaboration
Physical paper maps have been powerful co-located collaborative mediums for a
wide range of activities such as spatial planning, navigational activity planning,
and defence missions. They enable multiple users to work, plan and view maps
together supporting collaborative decision making. 3D physical maps can also
serve as powerful co-located collaborative mediums similar to the paper maps.
The scale of the physical map could be one of the factors effecting collaboration.
For example, larger higher resolutions maps can support more number of people
when compared to a smaller low-resolution one.
98

6.2.3 Multi-Resolution Visualization And Zooming
One of the limitations of 3D physical maps is that they have fixed resolution
and do not support common operations such as zooming and multi-resolution
visualization, which are offered by the 2D digital maps. We suggest the following
approaches to counter this limitation:
Printing Multiple Maps
The brute-force approach for having multiple-resolutions is to 3D print multiple
maps with different resolutions. With advances in 3D printing technology, this
approach could be more feasible when 3D printers become more ubiquitous and
cost-effective.
Physical Tools For Multi-Resolution Zooming
One of the other approach is to have a 3D flexible and tangible lens tool to
provide multi-resolution visualization [Looser et al., 2007](figure 6.5). This enables
the users to perform various natural interactions such as stretching,bending and
twisting, for visualizing in multiple resolutions.
Shape Displays
Shape Displays are new class of I/O devices that dynamically render physical shape
and geometry [Leithinger et al., 2015](Figure 6.6). Such shape displays could be
used to render 3D physical maps. The advantage of shape displays is that they
can dynamically render maps with multiple resolutions. The current drawback of
shape displays is that they have limited resolution(30 x 30) but in the near future
this resolution could improve enabling the rendering of high-resolution physical
maps.
99

Figure 6.6: A Tangible flexible lens developed by [Looser et al., 2007]. The lenscan be bended, twisted, stretched, enabling various AR visualizations
Figure 6.7: Shape displays realized by Leithinger et,al. [Leithinger et al., 2015]can render dynamic 3D shapes. These shape displays could be used to renderdynamic physical maps.
100

6.3 Limitations
Our approach for this thesis follows breadth-based approach, where we explore
application areas and developed prototypes for a variety of tasks compared to
a depth-based approach, in which a prototype is designed, developed and thor-
oughly evaluated using user-studies. While our approach enabled us to explore
multiple prototypes, we could not conduct task-oriented evaluations for each of
the prototypes. Our future efforts would be focused on evaluating each of these
prototypes.
All of our prototypes are exploratory prototypes and though we had demon-
strated and had qualitative discussion with various personnel (including domain
experts, designers, and HCI researchers) we did not conduct a full formal evalua-
tion of our prototypes. Therefore we think that future efforts call for conducting
a detailed evaluation study of our prototypes, thoroughly assessing the validity of
the presented prototypes in a more comprehensive way (e.g task-oriented scenario).
Conducting full evaluation of our prototypes also presents various challenges,
for example, the logistics involved in having a participant exploring at a remote
terrain are complex. Also there could be various other technical issues such as
limited internet connection, and low cell-phone network coverage of the traditional
telecom service providers. One of the solutions for such problems could be to
conduct the evaluation on a lower scale (e.g in a university locale) in a controlled
setting.
One of the other limitations is the cost and ease of fabricating physical terrain
models. The terrain models used in our prototypes are fairly simple and it still
took us considerable resources to obtain these printouts. The current 3D printers
have limitations on the dimensions of the printouts. For example, the maximum
dimension of the printout we could obtain was 26cm x 54cm x 6cm (breadth x
length x heightm, shown in Appendix A.2)provided by a professional 3D printing
101

service company (Shapeways Inc.). While this size is large, it might still be insuffi-
cient for applications that require high resolution and size. Even for the navigation
based tasks, the scale issue (actual distance vs scaled 3d printout distance) can-
not be completely eliminated. With the advances in 3D printing technology, we
believe that the future 3D printers will be able to fabricate larger scale printouts
with lower cost.
Direct physical interactions on the 3D printout offer many advantages over the
traditional 2D interfaces and devices. However, we believe that these interactions
should not be evaluated against the 2D interfaces (such as keyboards, joysticks,
mouse and touch interactions on traditional touch-screen devices). This is because
the underlying technology behind traditional 2D interfaces (such as touch sensing)
have been evolving over a long period of time and are more-mature than our
current physical interactions. Hence we believe that it is too early to have a
comprehensive evaluation of our physical interactions and compare them against
the 2D interaction devices.
6.4 Summary
In this chapter we presented some of the lessons we learned while designing and
implementing all of our prototypes. We centered our discussion on three major
themes: Scale of the 3D printout, interaction design for physical maps and col-
laborative design. For the first theme, we discussed the lessons learnt regarding
the selection of appropriate scale of physical maps, and also touched upon the
portability vs resolution trade-off. For the second theme we described some of
our reflections with regard to physical interactions and their comparison with the
traditional 2D interfaces. Finally, we presented some of the additional modalities
for facilitating richer communication and collaboration experience and concluded
by outlining the limitations of our work.
102

Chapter 7
Future Directions And Conclusion
7.1 Conclusion
In this thesis we presented our research efforts in the exploration of novel spatial
interaction techniques for 3D physical maps. Through the design,and implemen-
tation of three prototypes - Shvil - an augmented reality interface for collabora-
tive terrain navigation , Planwell - a spatial interface targeted for collaborative
petroleum-well planning and Flying Frustum- a spatial interface for enhancing
human-UAV awareness - we gained new insights on these new prototypes, to com-
plement the present technologies and provide enhanced user experience and po-
tentially foster better decision making. A set of design guidelines have also been
presented along with this research effort detailing various lessons we learned during
the design and implementation of our prototypes and encompassing several other
points of relevance.With this, we revisit the main contributions of this thesis as
follows:
• Design and implementation of Shvil - an augmented real-
ity interface for collaborative terrain navigation : in chapter
3 we detailed the design and implementation efforts of our Shvil
prototype. We also presented some of the lessons we learned while
realizing this prototype.
• Design, Implementation and Preliminary Evaluation of Plan-
Well- a spatial interface for collaborative petroleum-well
planning : in chapter 4 we presented our application scenario for
interactive physical maps. We designed and implemented a spatial
103

user interface for collaborative petroleum-well planning. We gained
new insights into our efforts by conducting two focus group discus-
sions with the domain experts.
• Design and implementation of Flying Frustum - a spatial
interface for enhancing the user spatial awareness during a
remote UAV (Unmanned Aerial Vehicle) interaction task:
in chapter 5 we provided a brief introduction on situational and
human-UAV awareness and detailed the design and implementation
efforts of our Flying Frustum prototype.
• Lessons learned from the design of spatial interfaces for
3D physical maps - in chapter 6 we presented the lessons learned
and our reflections while designing and implementing our three pro-
totypes. We believe these lessons and reflections can inform the
community of the insights we gained and how similar design efforts
can be approached in the future.
7.2 Perspective For The Future
In the chapters 3,4, and 5 immediate follow-up work was discussed, pertaining to
each individual effort. In this section, more general instances of future work are
presented, and briefly discussed.
7.2.1 Designing For Wearable Displays
Currently , the design of all our prototypes is based on the consumer-level mo-
bile devices and tablets. While this approach has the advantage of deploying our
prototype without any additional hardware and simple, readily-available exper-
imental setup, ergonomically it is not suitable for performing tasks over a long
104

period of time. One of our immediate goals is to extend our current prototype
to the wearable displays on both the indoor and outdoor devices(for example,
wearable head-mounted displays such as Google Glass or Microsoft Hololens could
be used to view the augmented reality content at both the overseer and explorer
sites ). However, on the flip side, the current wearable devices have some serious
drawbacks with respect to hardware, battery, display resolution, power consump-
tion and usability issues such as lack of natural input and output modalities for
interaction. This makes the current wearable devices unsuitable for our applica-
tions. However we hope that, with advancing hardware technologies the current
drawbacks of wearable devices could be mitigated if not completely eliminated,
which would make them more suitable for our applications.
7.2.2 Multiple Explorers and Multiple Overseers
Our current prototypes are simple versions with only one user on both the sites.
However, this could be easily scaled to multiple overseers and multiple explorers.
In case of the Flying Frustum prototype, this could mean multiple operators and
multiple drones operating over the same terrain.
Multiple overseers and explorers/drones,would open a plethora of opportunities
for future research. Some of those directions are :
• Single Overseer tele-operating multiple drones : It would be interest-
ing to study how a single overseer can tele-operate multiple drones
and the role of the 3D printout in such tasks. “How does the 3D
physical representation perform in reducing the cognitive load for a
multiple drone controlling task?”.
• Studying Collaboration Between multiple overseers : As discussed
in chapter 4, terrain models could be an effective collaborative tool
similar to the current day tabletops. We would like to study how 3D
105
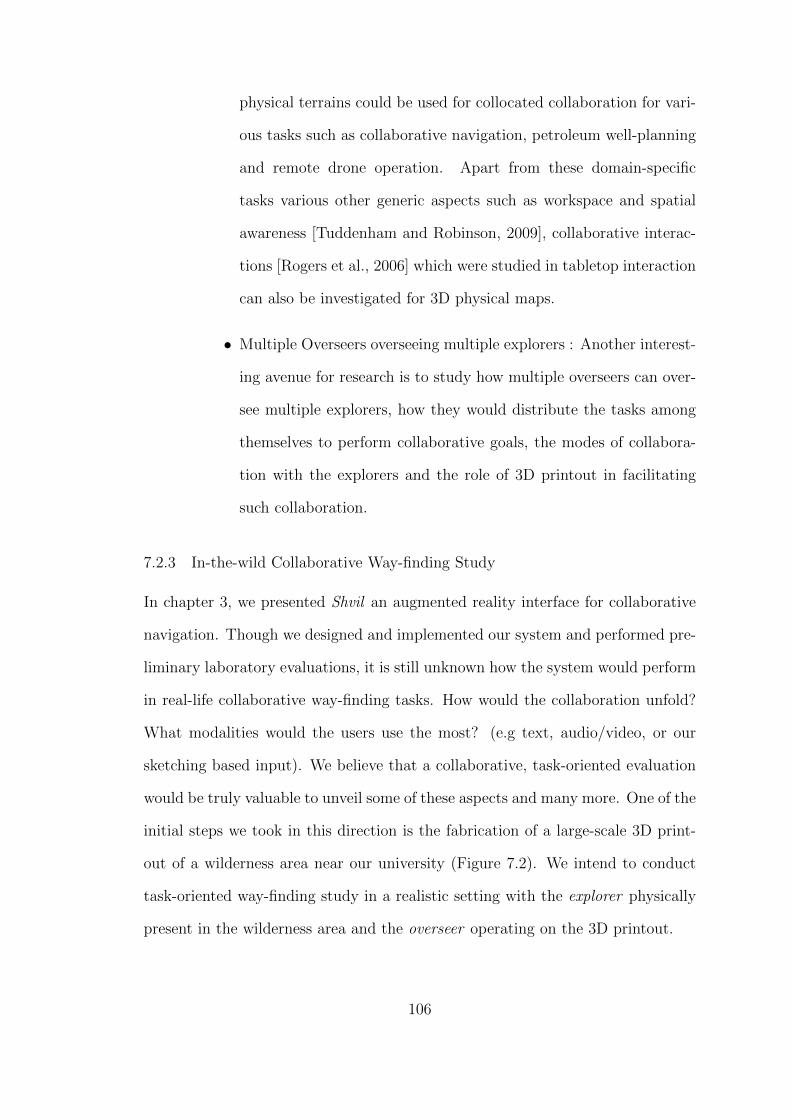
physical terrains could be used for collocated collaboration for vari-
ous tasks such as collaborative navigation, petroleum well-planning
and remote drone operation. Apart from these domain-specific
tasks various other generic aspects such as workspace and spatial
awareness [Tuddenham and Robinson, 2009], collaborative interac-
tions [Rogers et al., 2006] which were studied in tabletop interaction
can also be investigated for 3D physical maps.
• Multiple Overseers overseeing multiple explorers : Another interest-
ing avenue for research is to study how multiple overseers can over-
see multiple explorers, how they would distribute the tasks among
themselves to perform collaborative goals, the modes of collabora-
tion with the explorers and the role of 3D printout in facilitating
such collaboration.
7.2.3 In-the-wild Collaborative Way-finding Study
In chapter 3, we presented Shvil an augmented reality interface for collaborative
navigation. Though we designed and implemented our system and performed pre-
liminary laboratory evaluations, it is still unknown how the system would perform
in real-life collaborative way-finding tasks. How would the collaboration unfold?
What modalities would the users use the most? (e.g text, audio/video, or our
sketching based input). We believe that a collaborative, task-oriented evaluation
would be truly valuable to unveil some of these aspects and many more. One of the
initial steps we took in this direction is the fabrication of a large-scale 3D print-
out of a wilderness area near our university (Figure 7.2). We intend to conduct
task-oriented way-finding study in a realistic setting with the explorer physically
present in the wilderness area and the overseer operating on the 3D printout.
106

Figure 7.1: Multiple overseers collaborating over the physical 3D map.
107
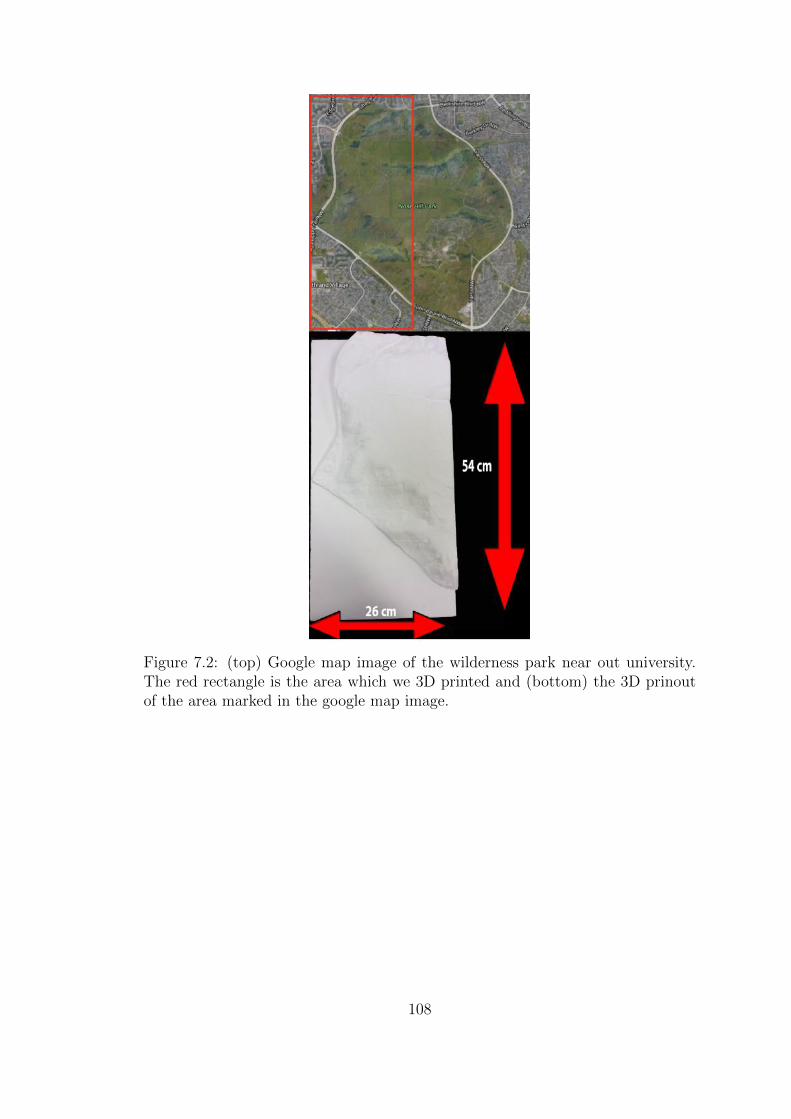
Figure 7.2: (top) Google map image of the wilderness park near out university.The red rectangle is the area which we 3D printed and (bottom) the 3D prinoutof the area marked in the google map image.
108

7.2.4 Projection Mapping For Overseer Interface
All of our prototypes discussed in this thesis are mobile augmented reality inter-
faces. While this approach has the advantage of deploying our prototype on off-
the-shelf mobile devices and tablets, ergonomically it is not suitable for performing
tasks over a long period of time. Projection-mapping was one of the alternative
techniques discussed during our PlanWell prototype focus group session. Our fu-
ture efforts would include designing projection-mapping based augmented reality
interface for the overseer.
One of our initial efforts in this direction is the projection of content on the 3D
printout (Figure 7.3). We superimposed various information such as the mock-
locations of the explorer and petroleum wells. For stylus based interactions we
are currently designing and exploring various prototypes. We used Vicon system
for tracking the stylus. The vicon setup used for our experiments is shown in
figure 7.5. The tracking volume of a Vicon system is larger when compared to
the size of a traditional pen (which we originally intended to use as a stylus),
hence we had high tracking inaccuracy due to various reasons such as occlusion
by hand, occlusion by body and also due the inherent smaller size of the pen.
To achieve better tracking accuracy, we increased the size of the stylus. We are
still experimenting various sizes of styluses and working on improving our tracking
efficiency. One of the initial stylus designed is shown in figure 7.6.
7.2.5 Studying the Spatial Perception On Physical Terrain Models
One of the other avenues for future research is to study how 3D physical maps can
enhance the spatial awareness of the terrain. “How do 3D Physical maps perform
in enhancing spatial awareness of the terrain when compared to the traditional
techniques of height representation on 2D maps?”. We intend to study this re-
search question by conducting in-depth task-oriented user studies. We intend to
109
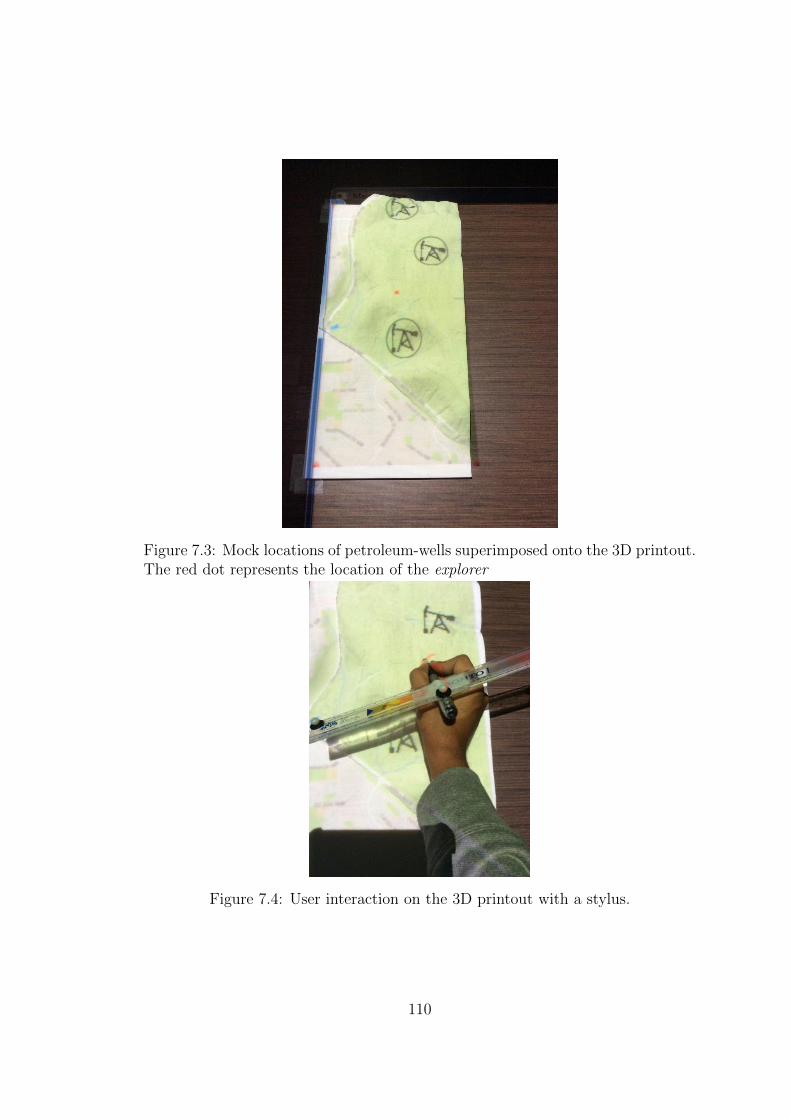
Figure 7.3: Mock locations of petroleum-wells superimposed onto the 3D printout.The red dot represents the location of the explorer
Figure 7.4: User interaction on the 3D printout with a stylus.
110

Figure 7.5: Our projection-based augmented reality setup. A Vicon system with8 cameras is used for tracking the stylus.
Figure 7.6: Our Stylus prototype with 3 vicon markers.The stylus has been elon-gated by attaching a scale, for better visibility of the markers.
111

use traditional methods used in cartographic studies such as line-of-sight deter-
mination, relative altitude comparison. Apart from these quantitative measures,
qualitative feedback from the participants would help us in understanding the
benefits of 3D physical maps.
7.2.6 Exploring Other Input Modalities for Interaction with 3D Physical Maps
In this thesis, we primarily used only a simple stylus based interaction with the
3D physical maps. The stylus-based interaction was based on augmented reality
and uses fiducial markers for tracking. We would like to explore other devices
and technologies for our future iterations of our prototypes. One of the devices
which we would like to integrate into our prototypes is the Phantom Haptic In-
terface [Massie and Salisbury, 1994]. The Phantom Haptic Device was originally
designed by Massie and Salisbury in 1994 and commercialized by Sensable Tech-
nologies , Inc.,(Woburn , MA, USA) 1. This system is widely used in the haptics
community and as an haptic interface in virtual environments(VE) communities
for a variety of applications due to its high position precision, low intertia, and
low friction.Though this system is majorly used as an haptic interface, we could
use it as an alternate high-precision stylus in our prototypes.
Apart from this it would also be very interesting to add touch functionality
to 3D physical maps, enabling the users to touch any part of the map and view
corresponding information overlaid onto the 3D printout.
7.2.7 Exploring Other Application Instances
In this thesis we presented three specific application instances of 3D physical maps.
We would like to explore various other application scenarios of 3D physical maps
such in Gaming, and in performing arts.
1Phantom Haptic Interface. http://www.dentsable.com/haptic-phantom-omni.htm
112

Figure 7.7: The Phantom Haptic Interface. The stylus could also be used on 3Dphysical maps for various operations such as sketching, annotating, and erasing.
3D physical maps could be a powerful spatial interactive medium which can
enable multi-player gaming. Apart from real geographic maps, game designers
can design, and generate imaginative terrains and 3D print them to create new
gaming experiences. Wearable devices such as Microsoft Hololens could be used
to create immersive gaming experiences which can open new avenues for physical
gaming.
Another application area for 3D physical maps could be in creative and per-
forming arts such as Dance and theatre. Performers and directors can plan their
shows with 3D physical maps of the stage sets. This could include various as-
pects such as planning lighting positions, planning and analysing the movements
of performers/actors.
113

7.3 Closing Remarks
This thesis presented our exploratory research, supported by the design, imple-
mentation, and preliminary evaluation of three experimental spatial interfaces for
physical representation of maps. Our efforts encompass three novel prototypes,
Shvil - a augmented reality interface for collaborative land navigation, PlanWell -
a spatial interface for collaborative petroleum-well planning and Flying Frustum -
a spatial interface for enhancing human-UAV awareness, that were designed and
implemented, followed by critiques from domain experts. Insights obtained from
these efforts materialized into a concise lessons, guiding future efforts in this area
of research. All these prototypes are meant to augment the existing tools and
practices but not replace them.We believe that there are vast possibilities for im-
provement within this area of interactive physical representations. We hope this
work can prove useful in inspiring and guiding future endeavours in this area of
research.
114

Appendix A
APPENDIX A
A.1 PLANWELL Focus Group Protocol
Good morning / afternoon, my name is XXX . Thank you very much for partici-
pating the brainstorming session of PlanWell.
PlanWell is a collaborative tool that facilitates remote field navigation between
the indoor mission control, named overseer, and outdoor explorer individuals or
teams. In this project, we experiment the possibility of using augmented reality
and 3D printout to enhance the situational and spatial awareness during the col-
laboration, and enrich the user experience as well. We aim to apply this project to
the field of oil and gas E &P cycle and your feedback on the applicability, validity
of this approach would be very much useful for us in improving our prototype.
Also, this is not an attempt to replace the existing methods and approach but we
envision that this could be potentially useful in future.
[Show the video]
At the current stage, we focus on the 1-to-1 configuration. That is, the col-
laboration between one overseer and one explorer. The overseer part uses a 3D
printout as the physical representation of the topographical terrain. Visualiza-
tion is superimposed on the physical model via the augmented reality technology.
Point-of-interests are displayed situated on the model according to their actual
position in the real-world.
[A quick demo and trial of the overseer interface]
On the other hand, the explorer interface superimposes visual information upon
the actual surrounding of the user, to create an in-situ experience.
115

[A quick demo and trial of the explorer interface]
Various kinds of information can be communicated with the aid of PlanWell.
For instance, the real-time position of the explorer is visualized in the overseers
interface constantly. Interactions and data manipulations from either side can be
broadcasted and displayed on the other users interfaces. And there are many more
possible cases.
However, these are all conceptual ideas, from the computer science perspective.
Here we are seeking opinions, experience, and possibly real-world scenarios from
your expertise in reservoir engineering / geo-science / etc.
Questions (from general to specific):
• What do you feel about the system?
• Do you think this system is useful / helpful in your working envi-
ronment? Can you think any scenario in specific that such a system
can be really valuable?
• Certainly many activities can be performed on regular display or in-
teract mediums, such as traditional computer screen. However, we
are providing the enhanced spatiality and physicality via using aug-
mented reality and the physical model. Can you think any condition
in your working experience that such spatiality and physicality can
be the fundamental and unique features that differentiate it from
alternative solutions?
• We use augmented reality technology to superimpose various infor-
mation on both the overseer and explorer interfaces to create more
immersive experiences. How would you compare this technology to
the existing ones, could you comment about the advantages/disad-
116

vantages of such a technology, and could you comment about the
validity of the technology for real-world tasks?
• In our prototype system, we provide real-time dynamic communica-
tion and information exchange between the remote users. We hope
that with this communication along with enhanced spatiality could
potentially reduce the turn-around time for some specific tasks. Are
there are scenarios and tasks in the oil and gas e& p where such
communication could help reduce the overall turn-around time and
fasten the decision-making process?
• We use 3D printout as a spatial representation of the terrain, does
this 3D physical spatial representation be valid in any of the various
oil and gas e & p tasks?
117

Appendix B
APPENDIX B
B.1 3D Printed Models of Landscapes
The recent price drop in personal fabrication tools and 3D printing [Malone and
Lipson, 2007], makes them available to a broader audience and enables a range of
applications. We envision that such 3D printing could be useful in ubiquitously
printing out models of landscapes and terrains.
The approach for 3D printing realistic terrains can be described in the following
three steps :
• Digital Elevation Models(DEM)to GrayScale Image Conversion : In
this first step, we obtained the Digital Elevation Model(DEM) of
Nosehill Park(a wilderness park near our university). The DEM
data was provided by the SANDS(Spatial And Numeric Data Ser-
vices) department at the University of Calgary. Once the data
was obtained, we used ArcGis [Arc, 2016](which is the most com-
monly used software package to visualize Geographic Information
System(GIS) data) to visualize the DEM data and exported into a
grayscale depth map image.
• Grayscale to Heightmap Conversion : In the second step, we gener-
ated a 3D heightmap of the terrain from the grayscale image. There
are number of ways to generate landscapes as described by [Mack-
lem, 2003]. In our case, we used the simple height-map approach to
generate the 3D mesh. The algorithm scans each and every pixel in
the image and the intensity of the pixel value(since the image is a
118

grayscale image, the intensity ranges from 0 to 255) is taken to be
the corresponding height value for each grid point. The algorithm
takes the maximum and minimum height values as inputs and maps
the intensity values to these height values. For example, if the max-
imum and minimum height values provided by the user are 0 and 20
units respectively, then a pixel with intensity value of 255 will have
height of 20 units while the pixel with intensity value of 0 will have
height of 0 units and the pixel with intensity of 128 will be linearly
interpolated and will have a height value of 10 units. The generated
3D mesh from the grayscale image is shown in the figure below.
119

Figure B.1: Grayscale image of the Digital Elevation Model(DEM)
• 3D Printing Mesh : Once the 3D digital model is available, the 3D
printout of the model could be obtained from an off-the-shelf 3D
printer. However, in our case, the 3D printout was obtained from a
commercial 3D printing service vendor(Shapeways Inc [Sha, 2016]).
The dimensions of our model are 27 x 54 x 5 cm (width,depth and
height respectively) and the material used was strong and flexible
plastic.
120

Figure B.2: 3D mesh of the obtained from the Grayscale image.
121
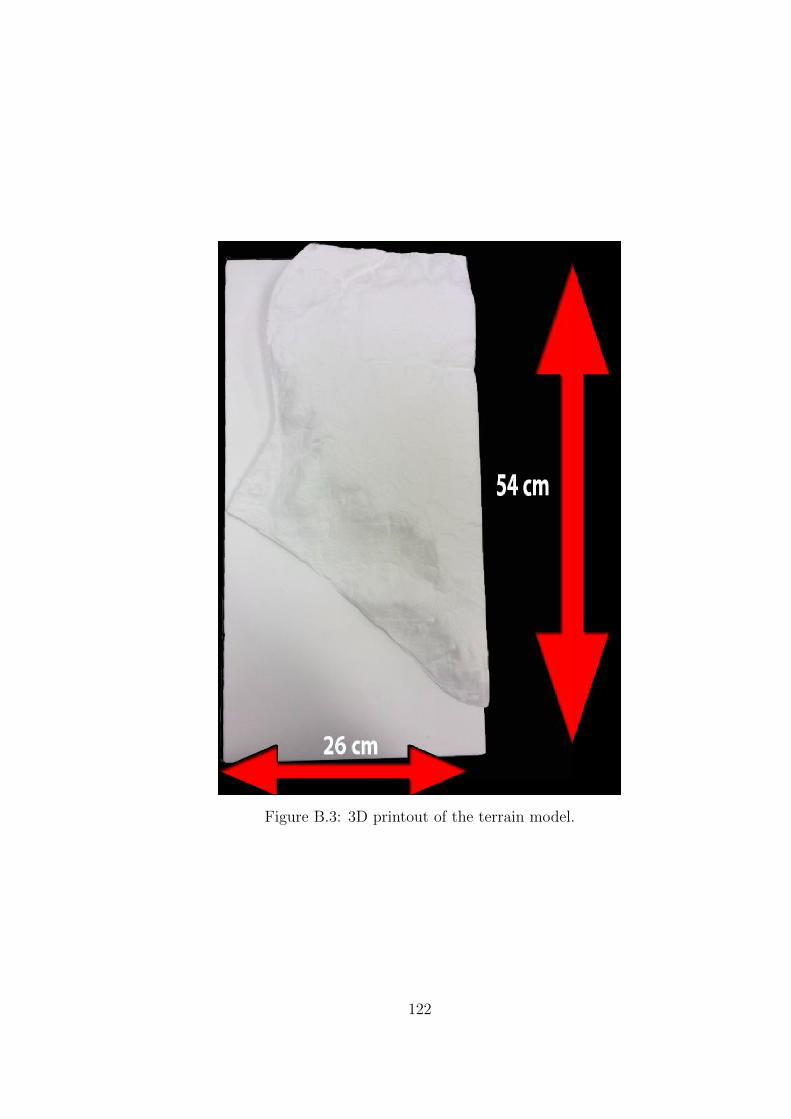
Figure B.3: 3D printout of the terrain model.
122

B.2 Low-Pass Filter
In this section we will be explaining the low-pass filter which we implemented for
smoothening the compass sensor values. The algorithm was implemented for the
explorer interface to reduce the noise in compass readings. Though we present the
JAVA version of the algorithm for Android OS, this can be easily ported across
various other programming languages and operating systems.
The filter has been implemented as a JAVA class and is called in the onSen-
sorChanged(SensorEvent event) event handler in android. The onSensorChanged
event handler is called by the Android system when there is a change in the sensor
readings.
@Override
public void onSensorChanged ( SensorEvent event ) {
// TODO Auto−genera ted method s t u b
int type = event . s enso r . getType ( ) ;
f loat [ ] va lue s = null ;
switch ( type ) {
case Sensor .TYPE MAGNETIC FIELD:
LowPassFi l ter . f i l t e r ( event . values ,
mMagneticValues ) ;
va lue s = mMagneticValues ;
break ;
123

default :
break ;
}
}
The above code shows how the LowPassFilter class could be used to filter the
compass values.
The LowPassFilter class which handles the filtering, is shown below :
/∗∗
∗ Low pass f i l t e r c l a s s to f i l t e r the sensors no i se .
∗/
public class LowPassFi l ter {
/∗∗
∗ Time smoothing cons tant f o r low−pass f i l t e r 0 − 1 ;
a s m a l l e r v a l u e
∗ b a s i c a l l y means more smoothing .
∗
∗
∗/
public stat ic f loat ALPHA = 0.03 f ;
/∗∗
∗ F i l t e r the g iven input a g a i n s t the p r e v i o u s
v a l u e s
124

∗ and re turn a low−pass
∗ f i l t e r e d r e s u l t .
∗
∗ @param input
∗ f l o a t array to smooth .
∗ @param prev
∗ f l o a t array r e p r e s e n t i n g the
p r e v i o u s v a l u e s .
∗ @return f l o a t array smoothed wi th a
low−pass f i l t e r .
∗/
public stat ic f loat [ ] f i l t e r ( f loat [ ] input ,
f loat [ ] prev )
{
return f i l t e r ( input , prev , ALPHA) ;
}
/∗∗
∗ F i l t e r the g iven input a g a i n s t the
p r e v i o u s v a l u e s
and re turn a low−pass
∗ f i l t e r e d r e s u l t .
∗
∗ @param input
∗ f l o a t array to smooth .
∗ @param prev
125

∗ f l o a t array r e p r e s e n t i n g the
p r e v i o u s v a l u e s .
∗ @param alpha
∗ Time smoothing cons tant
f o r low−pass f i l t e r 0 − 1 ; a s m a l l e r
∗ v a l u e b a s i c a l l y means more smoothing
∗ @return f l o a t array smoothed wi th
a low−pass f i l t e r .
∗/
public stat ic f loat [ ] f i l t e r ( f loat [ ] input ,
f loat [ ] prev ,
f loat alpha ) {
i f ( input == null | | prev == null )
throw new Nul lPo interExcept ion ( ” input
and
prev ar rays must be non−NULL” ) ;
i f ( input . l ength != prev . l ength )
throw new I l l ega lArgumentExcept ion
( ” input
and prev must be the same length ” ) ;
for ( int i = 0 ; i < input . l ength ; i++) {
prev [ i ] = prev [ i ] +
( alpha ∗ ( input [ i ] − prev [ i ] ) ) ;
}
return prev ;
126

}
}
127

B.3 GPS Co-Ordinates to Physical Co-Ordinates Conversion
In this section we will explain how we converted GPS latitude and longitude co-
ordinates to the co-ordinates on the 3D printout.
In this example, we will be using the 3D printout of Nosehill park(a wilderness
area near the University of Calgary). The section of the nosehill park which we
chose to 3D print in shown in A.4(left). The latitude of the area ranges from
51.0903 to 51.1297 and the longitude ranges from -114.1400 to -114.1100. For our
3D printout we used normalized co-ordinates i.e the the co-ordinates vary from 0
to 1 on both the X and Y axis (Figure A.4 right).
Figure B.4: (left) The section of the Nosehill park we used for 3D printing and thecorresponding range of the latitude and longitude co-ordinates (right) 3D printoutwith co-ordinates mapped to [0-1] range.
We use simple linear interpolation to convert a latitude and longitude co-
ordinate to a physical co-ordinate on the 3D printout. The pseudo-code below
shows the conversion of a latitude and longitude co-ordinate to the physical X and
Y co-ordinates on the 3D printout.
/∗ Constants to d e c l a r e the l a t i t u d e and l o n g i t u d e
128
bounds o f the N o s e h i l l area .
cons t f l o a t NOSEHILL MIN LATITUDE = 51.0903 f ;
cons t f l o a t NOSEHILL MAX LATITUDE = 51.1297 f ;
cons t f l o a t NOSEHILL MIN LONGITUDE = −114.1400 f ;
cons t f l o a t NOSEHILL MAX LONGITUDE = −114.1100 f ;
// conver ted p h y s i c a l co−o r d i n a t e s
f l o a t physica lX , phys ica lY ;
p u b l i c f l o a t conver tLat i tudeToPhys ica lY ( f l o a t l a t V a l u e )
{
i f ( l a t V a l u e < NOSEHILL MIN LATITUDE)
re turn NOSEHILL MIN LATITUDE;
e l s e i f ( l a t V a l u e > NOSEHILL MAX LATITUDE)
re turn NOSEHILL MAX LATITUDE;
e l s e
{
phys ica lY = ( l a t V a l u e − NOSEHILL MIN LATITUDE) /
(NOSEHILL MAX LATITUDE − NOSEHILL MIN LATITUDE ) ;
}
re turn phys ica lY ;
}
p u b l i c f l o a t convertLongi tudeToPhysica lX ( f l o a t longValue )
{
129

i f ( longValue < NOSEHILL MIN LONGITUDE)
re turn NOSEHILL MIN LONGITUDE;
e l s e i f ( longValue > NOSEHILL MAX LONGITUDE)
re turn NOSEHILL MAX LONGITUDE;
e l s e
{
phys ica lX = ( longValue −NOSEHILL MIN LONGITUDE) /
(NOSEHILL MAX LONGITUDE − NOSEHILL MIN LONGITUDE) ;
}
re turn phys ica lX ;
}
130

Bibliography
[ama, 2016] (2016). Amazon prime aircamera. http://www.amazon.com/b?
node=8037720011. Accessed: 2015-09-22.
[Fin, 2016] (2016). Apple find my friends. https://www.apple.com/apps/
find-my-friends/. Accessed: 2015-08-06.
[Arc, 2016] (2016). Arcgis. https://www.arcgis.com/features/. Accessed:
2015-09-08.
[Sha, 2016] (2016). Arcgis. http://www.shapeways.com/. Accessed: 2015-09-
08.
[Gly, 2016] (2016). Glympse location sharing app. http://www.glympse.com/
what-is-glympse. Accessed: 2015-08-06.
[Goo, 2016] (2016). Google location history. https://maps.google.ca/
locationhistory/b/0/. Accessed: 2015-08-06.
[lil, 2016] (2016). Lily camera. https://www.lily.camera. Accessed: 2015-09-
22.
[vuf, 2016] (2016). Vuforia. https://www.qualcomm.com/products/vuforia.
Accessed: 2015-08-13.
[Alem and Huang, 2011] Alem, L. and Huang, W. (2011). Recent trends of mobile
collaborative augmented reality systems. Springer Science & Business Media.
[Azuma et al., 1997] Azuma, R. T. et al. (1997). A survey of augmented reality.
Presence, 6(4):355–385.
[Barakonyi et al., 2004] Barakonyi, I., Fahmy, T., and Schmalstieg, D. (2004). Re-
mote collaboration using augmented reality videoconferencing. In Proceedings
131

of Graphics interface 2004, pages 89–96. Canadian Human-Computer Commu-
nications Society.
[Bidwell et al., 2005] Bidwell, N. J., Lueg, C., and Axup, J. (2005). The terri-
tory is the map: Designing navigational aids. In Proceedings of the 6th ACM
SIGCHI New Zealand Chapter’s International Conference on Computer-human
Interaction: Making CHI Natural, CHINZ ’05, pages 91–100, New York, NY,
USA. ACM.
[Billinghurst and Kato, 2000] Billinghurst, M. and Kato, H. (2000). Out and
aboutreal world teleconferencing. BT technology journal, 18(1):80–82.
[Billinghurst and Kato, 2002] Billinghurst, M. and Kato, H. (2002). Collaborative
augmented reality. Communications of the ACM, 45(7):64–70.
[Bouwer et al., 2011] Bouwer, A., Nack, F., and Evers, V. (2011). Towards sup-
port for collaborative navigation in complex indoor environments. In Proceed-
ings of the ACM 2011 Conference on Computer Supported Cooperative Work,
CSCW ’11, pages 601–604, New York, NY, USA. ACM.
[Brave and Dahley, 1997] Brave, S. and Dahley, A. (1997). intouch: a medium for
haptic interpersonal communication. In CHI’97 Extended Abstracts on Human
Factors in Computing Systems, pages 363–364. ACM.
[Brave et al., 1998] Brave, S., Ishii, H., and Dahley, A. (1998). Tangible interfaces
for remote collaboration and communication. In Proceedings of the 1998 ACM
conference on Computer supported cooperative work, pages 169–178. ACM.
[Buisine et al., 2012] Buisine, S., Besacier, G., Aoussat, A., and Vernier, F.
(2012). How do interactive tabletop systems influence collaboration? Com-
puters in Human Behavior, 28(1):49–59.
132

[Castner and Wheate, 1979] Castner, H. W. and Wheate, R. (1979). Re-assessing
the role played by shaded relief in topographic scale maps. The Cartographic
Journal, 16(2):77–85.
[Cheok et al., 2004] Cheok, A. D., Goh, K. H., Liu, W., Farbiz, F., Fong, S. W.,
Teo, S. L., Li, Y., and Yang, X. (2004). Human pacman: a mobile, wide-
area entertainment system based on physical, social, and ubiquitous computing.
Personal and ubiquitous computing, 8(2):71–81.
[Corbin and Strauss, 2014] Corbin, J. and Strauss, A. (2014). Basics of qualita-
tive research: Techniques and procedures for developing grounded theory. Sage
publications.
[Couture et al., 2008] Couture, N., Riviere, G., and Reuter, P. (2008). Geotui: a
tangible user interface for geoscience. In Proceedings of the 2nd international
conference on Tangible and embedded interaction, pages 89–96. ACM.
[Dahlback et al., 1993] Dahlback, N., Jonsson, A., and Ahrenberg, L. (1993).
Wizard of oz studies: why and how. In Proceedings of the 1st international
conference on Intelligent user interfaces, pages 193–200. ACM.
[Dourish, 2004] Dourish, P. (2004). Where the action is: the foundations of em-
bodied interaction. MIT press.
[Drury et al., 2006a] Drury, J. L., Richer, J., Rackliffe, N., and Goodrich, M. A.
(2006a). Comparing situation awareness for two unmanned aerial vehicle human
interface approaches. Technical report, DTIC Document.
[Drury et al., 2006b] Drury, J. L., Riek, L., and Rackliffe, N. (2006b). A decom-
position of uav-related situation awareness. In Proceedings of the 1st ACM
SIGCHI/SIGART conference on Human-robot interaction, pages 88–94. ACM.
133

[Drury et al., 2003] Drury, J. L., Scholtz, J., Yanco, H., et al. (2003). Awareness
in human-robot interactions. In Systems, Man and Cybernetics, 2003. IEEE
International Conference on, volume 1, pages 912–918. IEEE.
[Drury and Scott, 2008] Drury, J. L. and Scott, S. D. (2008). Awareness in un-
manned aerial vehicle operations. The International C2 Journal, 2(1):1–10.
[Endsley, 1995] Endsley, M. R. (1995). Toward a theory of situation awareness
in dynamic systems. Human Factors: The Journal of the Human Factors and
Ergonomics Society, 37(1):32–64.
[Endsley et al., 2000] Endsley, M. R. et al. (2000). Theoretical underpinnings
of situation awareness: A critical review. Situation awareness analysis and
measurement, pages 3–32.
[Feiner et al., 1997] Feiner, S., MacIntyre, B., Hollerer, T., and Webster, A.
(1997). A touring machine: Prototyping 3d mobile augmented reality systems
for exploring the urban environment. Personal Technologies, 1(4):208–217.
[Follmer et al., 2013] Follmer, S., Leithinger, D., Olwal, A., Hogge, A., and Ishii,
H. (2013). inform: dynamic physical affordances and constraints through shape
and object actuation. In UIST, volume 13, pages 417–426.
[Gauglitz et al., 2014] Gauglitz, S., Nuernberger, B., Turk, M., and Hollerer, T.
(2014). World-stabilized annotations and virtual scene navigation for remote
collaboration. In Proceedings of the 27th annual ACM symposium on User
interface software and technology, pages 449–459. ACM.
[Gaver, 1992] Gaver, W. W. (1992). The affordances of media spaces for collab-
oration. In Proceedings of the 1992 ACM conference on Computer-supported
cooperative work, pages 17–24. ACM.
134
[Ghadirian and Bishop, 2008] Ghadirian, P. and Bishop, I. D. (2008). Integration
of augmented reality and gis: A new approach to realistic landscape visualisa-
tion. Landscape and Urban Planning, 86(3):226–232.
[Gillet et al., 2005] Gillet, A., Sanner, M., Stoffler, D., and Olson, A. (2005). Tan-
gible interfaces for structural molecular biology. Structure, 13(3):483–491.
[Goodrich and Schultz, 2007] Goodrich, M. A. and Schultz, A. C. (2007). Human-
robot interaction: a survey. Foundations and trends in human-computer inter-
action, 1(3):203–275.
[Grudin, 1994] Grudin, J. (1994). Computer-supported cooperative work: History
and focus. Computer, (5):19–26.
[Gurevich et al., 2012] Gurevich, P., Lanir, J., Cohen, B., and Stone, R. (2012).
Teleadvisor: a versatile augmented reality tool for remote assistance. In Pro-
ceedings of the SIGCHI Conference on Human Factors in Computing Systems,
pages 619–622. ACM.
[Gutwin and Greenberg, 2002] Gutwin, C. and Greenberg, S. (2002). A descrip-
tive framework of workspace awareness for real-time groupware. Computer Sup-
ported Cooperative Work (CSCW), 11(3-4):411–446.
[Harris et al., 2011] Harris, J., Young, J., Sultanum, N., Lapides, P., Sharlin, E.,
and Sousa, M. C. (2011). Designing snakey: a tangible user interface supporting
well path planning. In Human-Computer Interaction–INTERACT 2011, pages
45–53. Springer.
[Hauber et al., 2006] Hauber, J., Regenbrecht, H., Billinghurst, M., and Cock-
burn, A. (2006). Spatiality in videoconferencing: trade-offs between efficiency
and social presence. In Proceedings of the 2006 20th anniversary conference on
Computer supported cooperative work, pages 413–422. ACM.
135

[Henrysson et al., 2005] Henrysson, A., Billinghurst, M., and Ollila, M. (2005).
Face to face collaborative ar on mobile phones. In Mixed and Augmented Reality,
2005. Proceedings. Fourth IEEE and ACM International Symposium on, pages
80–89. IEEE.
[Hollan and Stornetta, 1992] Hollan, J. and Stornetta, S. (1992). Beyond being
there. In Proceedings of the SIGCHI conference on Human factors in computing
systems, pages 119–125. ACM.
[Hollerer et al., 1999] Hollerer, T., Feiner, S., Terauchi, T., Rashid, G., and Hall-
away, D. (1999). Exploring mars: developing indoor and outdoor user interfaces
to a mobile augmented reality system. Computers & Graphics, 23(6):779–785.
[Imhof, 2007] Imhof, E. (2007). Cartographic relief presentation. ESRI, Inc.
[Ishii, 2007] Ishii, H. (2007). Tangible user interfaces. CRC Press.
[Ishii et al., 2004] Ishii, H., Ratti, C., Piper, B., Wang, Y., Biderman, A., and
Ben-Joseph, E. (2004). Bringing clay and sand into digital designcontinuous
tangible user interfaces. BT technology journal, 22(4):287–299.
[Jansen et al., 2013] Jansen, Y., Dragicevic, P., and Fekete, J.-D. (2013). Eval-
uating the efficiency of physical visualizations. In Proceedings of the SIGCHI
Conference on Human Factors in Computing Systems, pages 2593–2602. ACM.
[Johnson, 2004] Johnson, C. (2004). Top scientific visualization research prob-
lems. Computer graphics and applications, IEEE, 24(4):13–17.
[Kasahara and Rekimoto, 2014] Kasahara, S. and Rekimoto, J. (2014). Jackin:
integrating first-person view with out-of-body vision generation for human-
human augmentation. In Proceedings of the 5th Augmented Human Interna-
tional Conference, page 46. ACM.
136
[Klemmer et al., 2001] Klemmer, S. R., Newman, M. W., Farrell, R., Bilezikjian,
M., and Landay, J. A. (2001). The designers’ outpost: a tangible interface for
collaborative web site. In Proceedings of the 14th annual ACM symposium on
User interface software and technology, pages 1–10. ACM.
[Kurata et al., 2005] Kurata, T., Oyabu, T., Sakata, N., Kourogi, M., and
Kuzuoka, H. (2005). Tangible tabletop interface for an expert to collaborate
with remote field workers. In Proc. CollabTech2005, pages 58–63.
[Kuzuoka, 1992] Kuzuoka, H. (1992). Spatial workspace collaboration: A shared-
view video support system for remote collaboration capability. In Proceedings
of the SIGCHI Conference on Human Factors in Computing Systems, CHI ’92,
pages 533–540, New York, NY, USA. ACM.
[Lapides et al., 2012] Lapides, P., Sultanum, N., Sharlin, E., and Sousa, M. C.
(2012). Seamless mixed reality tracking in tabletop reservoir engineering inter-
action. In Proceedings of the International Working Conference on Advanced
Visual Interfaces, pages 725–728. ACM.
[Leibe et al., 2000] Leibe, B., Starner, T., Ribarsky, W., Wartell, Z., Krum, D.,
Weeks, J., Singletary, B., and Hedges, L. (2000). Toward spontaneous inter-
action with the perceptive workbench. Computer Graphics and Applications,
IEEE, 20(6):54–65.
[Leithinger et al., 2014] Leithinger, D., Follmer, S., Olwal, A., and Ishii, H.
(2014). Physical telepresence: shape capture and display for embodied,
computer-mediated remote collaboration. In Proceedings of the 27th annual
ACM symposium on User Interface Software and Technology, pages 461–470.
ACM.
[Leithinger et al., 2015] Leithinger, D., Follmer, S., Olwal, A., and Ishii, H.
137

(2015). Shape displays: Spatial interaction with dynamic physical form. Com-
puter Graphics and Applications, IEEE, 35(5):5–11.
[Leithinger and Ishii, 2010] Leithinger, D. and Ishii, H. (2010). Relief: a scalable
actuated shape display. In Proceedings of the fourth international conference on
Tangible, embedded, and embodied interaction, pages 221–222. ACM.
[Li et al., 2015] Li, N., Cartwright, S., Nittala, A. S., Sharlin, E., and Costa Sousa,
M. (2015). Flying frustum: A spatial interface for enhancing humanuav aware-
ness. In Proceedings of the third international conference on Human-agent in-
teraction. ACM.
[Li et al., 2014] Li, N., Nittala, A. S., Sharlin, E., and Costa Sousa, M. (2014).
Shvil: collaborative augmented reality land navigation. In CHI’14 Extended
Abstracts on Human Factors in Computing Systems, pages 1291–1296. ACM.
[Looser et al., 2007] Looser, J., Grasset, R., and Billinghurst, M. (2007). A 3d
flexible and tangible magic lens in augmented reality. In Proceedings of the
2007 6th IEEE and ACM International Symposium on Mixed and Augmented
Reality, pages 1–4. IEEE Computer Society.
[Macklem, 2003] Macklem, G. (2003). Computer landscape generation and
smoothing. Masters Comprehensive Exam.
[Malone and Lipson, 2007] Malone, E. and Lipson, H. (2007). Fab@ home: the
personal desktop fabricator kit. Rapid Prototyping Journal, 13(4):245–255.
[Massie and Salisbury, 1994] Massie, T. H. and Salisbury, J. K. (1994). The phan-
tom haptic interface: A device for probing virtual objects. In Proceedings of
the ASME winter annual meeting, symposium on haptic interfaces for virtual
environment and teleoperator systems, volume 55, pages 295–300. Chicago, IL.
138

[Mitchell et al., 2005] Mitchell, P., Cummings, M., and Sheridan, T. (2005). Man-
agement of multiple dynamic human supervisory control tasks. In 10th Inter-
national Command and Control Research and Technology Symposium.
[Nakanishi et al., 1998] Nakanishi, H., Yoshida, C., Nishimura, T., and Ishida, T.
(1998). Freewalk: a three-dimensional meeting-place for communities. Ishida,
1998b], chapitre, 3:55–89.
[Nittala et al., 2015a] Nittala, A. S., Li, N., Cartwright, S., Takashima, K., Shar-
lin, E., and Sousa, M. C. (2015a). Planwell: spatial user interface for collabora-
tive petroleum well-planning. In SIGGRAPH ASIA 2015 Mobile Graphics and
Interactive Applications, page 19. ACM.
[Nittala et al., 2015b] Nittala, A. S., Yang, X.-D., Bateman, S., Sharlin, E., and
Greenberg, S. (2015b). Phoneear: Interactions for mobile devices that hear
high-frequency sound-encoded data. In Proceedings of the 7th ACM SIGCHI
Symposium on Engineering Interactive Computing Systems, EICS ’15, pages
174–179, New York, NY, USA. ACM.
[Nittala et al., 2014] Nittala, A. S., Yang, X.-D., Sharlin, E., Bateman, S., and
Greenberg, S. (2014). Sonicdata: Broadcasting data via sound for smartphones.
[Parasuraman et al., 2000] Parasuraman, R., Sheridan, T. B., and Wickens, C. D.
(2000). A model for types and levels of human interaction with automation.
Systems, Man and Cybernetics, Part A: Systems and Humans, IEEE Transac-
tions on, 30(3):286–297.
[Phillips et al., 1975] Phillips, R. J., Lucia, A., and Skelton, N. (1975). Some ob-
jective tests of the legibility of relief maps. The Cartographic Journal, 12(1):39–
46.
139

[Piper et al., 2002] Piper, B., Ratti, C., and Ishii, H. (2002). Illuminating clay:
a 3-d tangible interface for landscape analysis. In Proceedings of the SIGCHI
conference on Human factors in computing systems, pages 355–362. ACM.
[Poelman et al., 2012] Poelman, R., Akman, O., Lukosch, S., and Jonker, P.
(2012). As if being there: mediated reality for crime scene investigation. In
Proceedings of the ACM 2012 conference on computer supported cooperative
work, pages 1267–1276. ACM.
[Potash et al., 1978] Potash, L., Farrell, J., and Jeffrey, T. (1978). A technique
for assessing map relief legibility. The Cartographic Journal, 15(1):28–35.
[Quigley et al., 2004] Quigley, M., Goodrich, M., Beard, R. W., et al. (2004).
Semi-autonomous human-uav interfaces for fixed-wing mini-uavs. In Intelligent
Robots and Systems, 2004.(IROS 2004). Proceedings. 2004 IEEE/RSJ Interna-
tional Conference on, volume 3, pages 2457–2462. IEEE.
[Rapp et al., 2007] Rapp, D. N., Culpepper, S. A., Kirkby, K., and Morin, P.
(2007). Fostering students’ comprehension of topographic maps. Journal of
Geoscience Education, 55(1):5.
[Rase, 2009] Rase, W.-D. (2009). Visualization of three-dimensional gis objects
using rapid prototyping technology. Paper presented at GeoViz Hamburg, 3:5.
[Raskar et al., 1998] Raskar, R., Welch, G., and Fuchs, H. (1998). Spatially aug-
mented reality. In First IEEE Workshop on Augmented Reality (IWAR98),
pages 11–20. Citeseer.
[Regenbrecht et al., 2004] Regenbrecht, H., Lum, T., Kohler, P., Ott, C., Wagner,
M., Wilke, W., and Mueller, E. (2004). Using augmented virtuality for remote
collaboration. Presence: Teleoperators and virtual environments, 13(3):338–
354.
140

[Reilly et al., 2008] Reilly, D., Mackay, B., and Inkpen, K. (2008). How mobile
maps cooperate with existing navigational infrastructure. In Map-based Mobile
Services, pages 267–292. Springer.
[Reilly et al., 2009] Reilly, D., Mackay, B., Watters, C., and Inkpen, K. (2009).
Planners, navigators, and pragmatists: collaborative wayfinding using a single
mobile phone. Personal and Ubiquitous Computing, 13(4):321–329.
[Richter et al., 2007] Richter, J., Thomas, B. H., Sugimoto, M., and Inami, M.
(2007). Remote active tangible interactions. In Proceedings of the 1st interna-
tional conference on Tangible and embedded interaction, pages 39–42. ACM.
[Riedenklau et al., 2012] Riedenklau, E., Hermann, T., and Ritter, H. (2012). An
integrated multi-modal actuated tangible user interface for distributed collabo-
rative planning. In Proceedings of the Sixth International Conference on Tan-
gible, Embedded and Embodied Interaction, pages 169–174. ACM.
[Robert et al., 2013] Robert, K., Zhu, D., Huang, W., Alem, L., and Gedeon, T.
(2013). Mobilehelper: remote guiding using smart mobile devices, hand ges-
tures and augmented reality. In SIGGRAPH Asia 2013 Symposium on Mobile
Graphics and Interactive Applications, page 39. ACM.
[Robinson and Tuddenham, 2007] Robinson, P. and Tuddenham, P. (2007). Dis-
tributed tabletops: Supporting remote and mixed-presence tabletop collabo-
ration. In Horizontal Interactive Human-Computer Systems, 2007. TABLE-
TOP’07. Second Annual IEEE International Workshop on, pages 19–26. IEEE.
[Rogers et al., 2006] Rogers, Y., Lim, Y.-K., and Hazlewood, W. R. (2006). Ex-
tending tabletops to support flexible collaborative interactions. In Horizontal
Interactive Human-Computer Systems, 2006. TableTop 2006. First IEEE Inter-
national Workshop on, pages 8–pp. IEEE.
141

[Rogers and Lindley, 2004] Rogers, Y. and Lindley, S. (2004). Collaborating
around vertical and horizontal large interactive displays: which way is best?
Interacting with Computers, 16(6):1133–1152.
[Sakong and Nam, 2006] Sakong, K. and Nam, T.-j. (2006). Supporting telep-
resence by visual and physical cues in distributed 3d collaborative design en-
vironments. In CHI’06 Extended Abstracts on Human Factors in Computing
Systems, pages 1283–1288. ACM.
[Schall et al., 2008] Schall, G., Mendez, E., and Schmalstieg, D. (2008). Virtual
redlining for civil engineering in real environments. In Proceedings of the 7th
IEEE/ACM International Symposium on Mixed and Augmented Reality, pages
95–98. IEEE Computer Society.
[Schmalstieg et al., 2011] Schmalstieg, D., Langlotz, T., and Billinghurst, M.
(2011). Augmented Reality 2.0. Springer.
[Scott et al., 2004] Scott, S. D., Carpendale, M. S. T., and Inkpen, K. M. (2004).
Territoriality in collaborative tabletop workspaces. In Proceedings of the 2004
ACM conference on Computer supported cooperative work, pages 294–303. ACM.
[Sharlin et al., 2004] Sharlin, E., Watson, B., Kitamura, Y., Kishino, F., and Itoh,
Y. (2004). On tangible user interfaces, humans and spatiality. Personal and
Ubiquitous Computing, 8(5):338–346.
[Smith et al., 2001] Smith, D. C., Irby, C., Kimball, R., and Harslem, E. (2001).
The star user interface: An overview. In Classic operating systems, pages 460–
490. Springer.
[Sodhi et al., 2013] Sodhi, R. S., Jones, B. R., Forsyth, D., Bailey, B. P., and
Maciocci, G. (2013). Bethere: 3d mobile collaboration with spatial input. In
142

Proceedings of the SIGCHI Conference on Human Factors in Computing Sys-
tems, pages 179–188. ACM.
[Sousa et al., 2015] Sousa, M. C., Brazil, E. V., and Sharlin, E. (2015). Scal-
able and interactive visual computing in geosciences and reservoir engineering.
Geological Society, London, Special Publications, 406(1):447–466.
[Stafford et al., 2006] Stafford, A., Piekarski, W., and Thomas, B. (2006). Im-
plementation of god-like interaction techniques for supporting collaboration be-
tween outdoor ar and indoor tabletop users. In Proceedings of the 5th IEEE
and ACM International Symposium on Mixed and Augmented Reality, pages
165–172. IEEE Computer Society.
[Sutherland, 1968] Sutherland, I. E. (1968). A head-mounted three dimensional
display. In Proceedings of the December 9-11, 1968, fall joint computer confer-
ence, part I, pages 757–764. ACM.
[Szafir et al., 2014] Szafir, D., Mutlu, B., and Fong, T. (2014). Communication
of intent in assistive free flyers. In Proceedings of the 2014 ACM/IEEE inter-
national conference on Human-robot interaction, pages 358–365. ACM.
[Szafir et al., 2015] Szafir, D., Mutlu, B., and Fong, T. (2015). Communicating
directionality in flying robots. In Proceedings of the Tenth Annual ACM/IEEE
International Conference on Human-Robot Interaction, pages 19–26. ACM.
[Szalavari et al., 1998] Szalavari, Z., Schmalstieg, D., Fuhrmann, A., and Ger-
vautz, M. (1998). studierstube: An environment for collaboration in augmented
reality. Virtual Reality, 3(1):37–48.
[Tateosian et al., 2010] Tateosian, L. G., Mitasova, H., Harmon, B., Fogleman,
B., Weaver, K., Harmon, R. S., et al. (2010). Tangeoms: Tangible geospatial
143

modeling system. Visualization and Computer Graphics, IEEE Transactions
on, 16(6):1605–1612.
[Tecchia et al., 2012] Tecchia, F., Alem, L., and Huang, W. (2012). 3d helping
hands: A gesture based mr system for remote collaboration. In Proceedings of
the 11th ACM SIGGRAPH International Conference on Virtual-Reality Con-
tinuum and Its Applications in Industry, VRCAI ’12, pages 323–328, New York,
NY, USA. ACM.
[Tuddenham and Robinson, 2009] Tuddenham, P. and Robinson, P. (2009). Ter-
ritorial coordination and workspace awareness in remote tabletop collaboration.
In Proceedings of the SIGCHI Conference on Human Factors in Computing Sys-
tems, pages 2139–2148. ACM.
[Underkoffler and Ishii, 1999] Underkoffler, J. and Ishii, H. (1999). Urp: a
luminous-tangible workbench for urban planning and design. In Proceedings
of the SIGCHI conference on Human Factors in Computing Systems, pages
386–393. ACM.
[Ware, 2012] Ware, C. (2012). Information visualization: perception for design.
Elsevier.
[Willett et al., 2015] Willett, W., Jenny, B., Isenberg, T., and Dragicevic, P.
(2015). Lightweight relief shearing for enhanced terrain perception on inter-
active maps. In Proceedings of the 33rd ACM Conference on Human Factors in
Computing Systems (CHI 2015).
[Wilson, 1991] Wilson, P. (1991). Computer supported cooperative work:: An in-
troduction. Springer Science & Business Media.
[Yanco et al., 2004] Yanco, H. A., Drury, J. L., et al. (2004). Classifying human-
robot interaction: an updated taxonomy. In SMC (3), pages 2841–2846.
144

[Yang and Olson, 2002] Yang, H. and Olson, G. M. (2002). Exploring collabora-
tive navigation:: the effect of perspectives on group performance. In Proceedings
of the 4th international conference on Collaborative virtual environments, pages
135–142. ACM.
145