universitÉ montpellier 2 - cirad · universitÉ montpellier 2 ecole doctorale : systémes...
TRANSCRIPT
UNIVERSITÉ MONTPELLIER 2
Ecole Doctorale : Systémes intégrés en Biologie, Agronomie, Géosciences, Hydrosciences
et Environnement Spécialité
THÈSE
Pour obtenir le grade de
DOCTEUR DE L’UNIVERSITÉ MONTPELLIER 2
Discipline : Biologie Intégrative des Plantes
Présentée et soutenue publiquement par
Peerapat ROONGSATTHAM
le 16 Décembre 2011
Cell separation processes that underlie fruit abscission and shedding
in oil palm (Elaeis guineensis Jacq.)
Equipe Biologie du Développement des Palmiers, UMR DIADE
BP 64501, 911 avenue Agropolis, F-34394 Montpellier Cedex 5, France
Jury :
Professor Paul Knox University of Leeds, UK Rapporteur
Dr. Shimon Meir Agricultural Research Organization, Israel Rapporteur
Professor Jeremy Roberts University of Nottingham, UK Examinateur
Dr. Serge Hamon IRD, France Examinateur
Dr. Jean-Luc VERDEIL CIRAD, France Directeur de Thèse
Dr. Timothy J. TRANBARGER IRD, France Co-directeur de Thèse
Dr. Fabienne Morcillo CIRAD, France Invité
Dr. Chatchawan_Jantasuriyarat Kasetsart University, Thailand Invité

Cell separation processes that underlie fruit abscission and
shedding in oil palm (Elaeis guineensis Jacq.)
Etude moléculaire et développementale sur
le processus d'abscission des fruits chez le palmier à huile
(Elaeis guineensis Jacq.)

Acknowledgement
I would like to acknowledge the “Réseau Thématique de Recherche Avancée
(RTRA)” for the financial support from “Agropolis Fondation” which provided a scholarship
during my doctoral degree program at Université Montpellier 2 and Institut de Recherche
pour le Développement (IRD). I also would like to acknowledge PHC Thailande projects
2007-2010 (codes 16589YK and 16589YK) to TJT and ST, and PalmElit SAS/IRD/CIRAD
for the financial support for this project.
First of all, I would like to thank my thesis director, Dr. Jean-Luc Verdeil for his
excellent guidance and training on histology research. I am also grateful for his critical
discussions and comments on my laboratory work and thesis.
I also would like to thank my co-thesis directors, Dr. Timothy J. Tranbarger and Dr.
Fabienne Morcillo for the time and all types of support they had given to me while I was
working at IRD. I am impressed by their words that they came to help me to graduate not to
take me down.
I appreciate my thesis committee, Professor Jeremy Roberts, University of
Nottingham, Professor Bruno Touraine, UM2, and Dr. Bruno Nouy from PalmElit for their
kind suggestions and comments on my thesis.
I thank Dr. Chatchawan Jantasuriyarat who suggested me to this program. I also thank
Dr. Apichart Vanavichit, Dr. Somvong Tragoonrung, and the members of Rice Science
Center & Rice Gene Discovery Unit for their supports while I performed research in
Thailand. I also would like to thank Anek Limsriwilai, Golden Tenera Plantation, Thailand
for the materials used in this study.
I appreciate Dr. James W. Tregear, Dr. Stefan Jouannic, Dr. Hélène Adam, and the
members of oil palm group for their very kind of support.

I thank Myriam Collin, Chloé Guerin, Maxime Pizot, Amandine Crabos, Steven
Moussu, Chonlada Borisut, Nusaneesa Jaedo, Pornpiroon Pleankong, Stéphanie Loubet and
Marc Lartaud for their help on my research.
I would like to thank Nattawut Leelakanok and Ken Chuaphalakit for their spiritual
support along my study.
I truly appreciate for everyone who passed me their regards when I had a health
problem and had a depression. I thank Pornapat Surasombatpattana, Sirilaksana Patramool,
Panupat Patramool and Dr. Potjaman Suraninpong for their supports during the illness. I
would like to thank especially Dr. Timothy J. Tranbarger for his concern, understanding, and
supports.
Finally, I dedicate all the success to my family who always have faith and always
believe in me. Thank you for the supports and strength given to me. Without them, I could
not come this far. Thank you very much.
Peerapat Roongsattham
November 2011

Abstract
The current thesis provides new insights into the molecular and cellular mechanisms
underlying fruit abscission in the oil palm (Elaeis guineensis Jacq). Molecular and cellular
approaches were used to examine the events during abscission zone (AZ) development and
function. First, a field experimental system was setup and used to define the precise timing of
cell separation, and to examine the response of oil palm fruit at different stages of
development to ethylene. The results indicate the response to ethylene is developmentally
regulated, with the ripest fruit beginning to separate first within 9 h. The search for
polygalacturonase (PG) genes expressed in the fruit base containing the AZ led to the
identification of fourteen transcripts that encode PGs. One PG transcript (EgPG4) increases
700-5000 fold during the ethylene treatment time course with the confirmation by in situ
hybridization indicating a preferential increase in the AZ cell layers in the base of the fruit in
response to ethylene prior to cell separation. Histological analysis of the oil palm fruit base
reveals that AZ cells undergo periclinal cell divisions, while the adjacent mesocarp and
pedicel cells divide anticlinally resulting in 10-12 AZ cell layers with aligned centrally
localized nuclei during fruit development. The AZ cells accumulate large amounts of pectic
substances during development, which is lost from the cells after separation suggesting a
possible relation to the capacity for AZ function. Ultrastructural analysis indicates a polarized
vesicle accumulation at the tip of AZ cells occurs during development, while immunohisto-
analysis indicates an increase in the JIM5 epitope in the AZ layers during ethylene treatments
prior to separation is observed, followed by a polarized increase in both JIM5 and JIM7 on
the separated cell surfaces. The results obtained from diverse approaches allow an integrated
view of the fruit abscission process in oil palm and a schematic model of AZ development
and function during shedding has been developed.

Key Words: abscission, shedding, cell separation, Elaeis guineensis, oil palm, ethylene,
polygalacturonase, pectin, methyl-esterification, fruit development, monocot

Résumé
Les travaux présentés dans ce mémoire apportent un éclairage nouveau sur les
mécanismes moléculaires et cellulaires impliqués dans l'abscission du fruit chez le palmier à
huile (/Elaeis guineensis/ Jacq.). Des approches moléculaires et cellulaires ont été utilisées
pour examiner les événements qui accompagnent la mise en place et le fonctionnement de la
zone d'abscission (AZ). Tout d'abord, un protocole expérimental au champ a été mis en place
pour définir avec précision, la cinétique d’abscission des fruits et examiner la réponse à
l’éthylène en fonction de leur stade de développement. Les résultats indiquent que la réponse
à l'éthylène est régulée au cours du développement et que l’abscission des fruits matures
commencent après 9 h de traitement. La recherche des gènes codants des polygalacturonases
(PG), exprimés à la base de fruit contenant l'AZ a permis l'identification de quatorze
transcrits qui codent des PGs. L’un de ces transcrits EgPG4 augmente de 700 à 5000 fois au
cours du temps, après traitement à d'éthylène. Sa localisation par hybridation /in situ/ a
permis de montrer qu’il s’accumule préférentiellement dans les assises cellulaires qui
composent la zone d’abscission, avant même que la séparation des cellules qui conduira à
l’abscision du fruit soit initiée. L'analyse histologique de la base de fruits de palmier à huile
montre la présence de mitoses essentiellement périclines. Il en résulte une organisation de la
zone d’abscission en assises cellulaires (10 à 12 assises) dont les noyaux en position centrale
sont alignés. Les cellules de l’AZ accumulent au cours du développement de grandes
quantités de composés pectiques. Ces composés pectiques ne sont plus détectés dans les
cellules de l’AZ lorsqu’elles se sont séparées, ce qui suggère une relation possible avec le
fonctionnement de cette zone conduisant à la chute des fruits. L’analyse ultrastructurale par
microscopie électronique à transmission a mis en évidence au cours du développement, une
accumulation polarisée de vésicules à l'extrémité des cellules de l’AZ. L’analyse par
immunohistochimie indique une augmentation de l’épitope JIM5 dans les assises cellulaires

de l’AZ, après traitement à l’éthylène et avant la séparation des cellules . Elle est suivie d 'une
l’accumulation considérable des deux épitopes JIM5 et JIM7 sur le pourtour des cellules
après leur séparation.
Mots cles: abscission, séparation cellulaire, Elaeis guineensis, palmier à huile, éthylène,
polygalacturonase, pectine, methyl-estérification, développement du fruit, monocotylédone

Table of Contents
1. Chapter 1. Introduction.................................................................................................. 1
1.1 Organ Abscission ...................................................................................................... 2
1.2 Cell Wall, Pectin and Cell Separation ...................................................................... 12
1.3 Oil Palm Fruit Abscission........................................................................................ 19
1.4 Objectives of the Thesis .......................................................................................... 23
2. Chapter 2. Temporal and Spatial Expression of Polygalacturonase Gene Family
Members Reveals Complex Regulation During Fleshy Fruit Ripening and
Abscission of the Monocot Oil Palm* .......................................................................... 36
2.1 Introduction ............................................................................................................. 37
2.2 Results .................................................................................................................... 41
2.2.1 Ethylene induced oil palm fruit shedding experimental system ..................... 41
2.2.2 Polygalacturonase gene family expression in the oil palm fruit tissues and
the identification of the EgPG4 transcript induced in the abscission zone
prior to fruit shedding ................................................................................... 42
2.2.3 In situ analysis of the spatial and temporal expression of EgPG4 during
ethylene induced fruit shedding .................................................................... 50
2.2.4 Phylogenetic analysis of EgPG4 with relation to polygalacturonases with
known functions ........................................................................................... 51
2.3 Discussion ............................................................................................................... 56
2.3.1 The sequence and expression analysis of EgPG4 suggest functional
conservation and divergence between monocots and eudicots ....................... 56
2.3.2 The sequence and expression of EgPG4 suggest functional divergence
between dry and fleshy fruit ......................................................................... 57
2.3.3 The high expression and induction of EgPG4 by ethylene suggests
functions during both fruit ripening and abscission ....................................... 58
2.4 Materials and Methods ............................................................................................ 63
2.4.1 Plant material, ethylene treatment and RNA extraction ................................. 63
2.4.2 Identification of oil palm non-redundant polygalacturonase nucleotide
sequences from fruit ..................................................................................... 64
2.4.3 Quantitative Real-Time RT-PCR .................................................................. 64
2.4.4 Phylogenetic Analysis .................................................................................. 65
2.4.5 RNA in situ hybridization ............................................................................. 66
2.5 Appendix ................................................................................................................ 68
3. Chapter 3. Abscission Zone Development and Acquisition of Competence for
Cell Separation Functions and Response to Ethylene ................................................. 85

3.1 Introduction ............................................................................................................. 86
3.2 Results .................................................................................................................... 91
3.2.1 Cellular studies of the oil palm fruit abscission zone ..................................... 91
3.2.1.1 Cellular characteristics of the primary abscission zone of ripe
fruit................................................................................................. 91
3.2.1.2 Ontogenesis and cellular characteristic evolution of primary AZ
during fruit development ................................................................. 92
3.2.1.3 Cellular characteristics of primary AZ during and after cell
separation ....................................................................................... 94
3.2.2 Ultrastructure of oil palm fruit abscission zone during development
analysis ...................................................................................................... 107
3.2.3 Alterations to methylated homogalacturonan and xylogalacturonan in the
oil palm fruit abscission zone ..................................................................... 108
3.2.3.1 Immunolocalization of the main pectin epitopes during
abscission zone ontogenesis and after cell separation .................... 108
3.2.3.2 Pectin biochemical modification mapping by immunolocalizaton
after fruit shedding induced by ethylene ........................................ 113
3.3 Discussion ............................................................................................................. 128
3.3.1 General cellular characteristics of oil palm fruit abscission zone ................. 128
3.3.2 Pectin fluctuation during developmental stages........................................... 130
3.3.3 Pectin fluctuation after cell separation ........................................................ 131
3.4 Materials and Methods .......................................................................................... 135
3.4.1 Plant Materials ........................................................................................... 135
3.4.2 Oil palm fruit collection and ethylene treatment.......................................... 135
3.4.3 Classical histology sample preparation ....................................................... 135
3.4.4 Scanning electron microscopy sample preparation ...................................... 135
3.4.5 Immunohistochemistry sample preparation ................................................. 135
3.5 Appendix .............................................................................................................. 137
4. Chapter 4. Conclusion and Future Prospects ............................................................ 152

1
Chapter 1. Introduction

Chapter 1
2
Organ Abscission
Abscission in plants is the separation of an organ from the plant body at an abscission
zone (AZ) located at the base of the organ where cell separation leads to organ shedding. It is
a tissue process with the differentiation of the AZ and a cellular process with cell separation
(Roberts et al. 2002). The shedding of plant organs is a highly coordinated developmentally
programmed event that can occur in different contexts throughout the plant life cycle
(Addicott 1982; Sexton and Roberts 1982; Roberts et al. 2002; Leslie et al. 2007). Organ
abscission (from the Latin words, ab means away and scindere means to cut) is important for
plant reproduction (shedding of flowers, fruits, and seeds), recycling of nutrients (senescence
and subsequent leaf shedding), plant architecture (branch shedding), defence (branch and
bark shedding) and assimilate partitioning (floral organ shedding for optimized reproduction)
(Figure 1.1). The separation events that underlie organ abscission must be under a strict
temporal regulation to avoid organ loss at inappropriate times. For example, the premature
shedding of stamens before pollination, or a delay or inhibition of fruit or seed shedding
would all have a negative effect on plant reproduction. Separation events must also be under
tight spatial regulation to maintain adjacent tissue integrity and/or to avoid improper shedding
of organs.
While the examples of organ shedding in plants are diverse, a common mechanism
and model can be defined (Figure 1.2). Firstly, the differentiation of the AZ takes place at the
base of the organ to be shed. Once the AZ develops, it must be activated to become
competent for cell separation events that must take place at the base of the subtending organ
to be shed. Secondly, the AZ is commonly characterized as one or more layers of generally
small isodiametrically shaped cells with dense cytoplasms (Addicott 1982; Sexton and
Roberts 1982; Roberts et al. 2002). For example, the AZs localized at the base of Arabidopsis
floral organs consist of 1-2 layers, in the tomato flower/fruit pedicel AZ there are 5-10 layers,

Chapter 1
3
while the AZ in the leaflet rachis of Sambucus nigra (common elder) consists of 30-40 layers.
Differentiation of the AZ cell layers develops prior to cell separation and once developed,
responds differently from adjacent tissues to the signals that induce cell separation (Taylor
and Whitelaw 2001). Cells at the AZ are easily recognized prior to cell separation because
they are typically smaller than adjacent cells, have dense cytoplasm, relatively small
intercellular spaces, contain large deposits of starch, and have highly branched
plasmodesmada (Sexton and Roberts 1982). As separation proceeds, the expansion of the
golgi vesicles and the activation of the endomembrane system are observed. Finally,
degradation of the middle lamella and dissociation of cellulose microfibrils occur. As cells
separate, they may become rounded and that is thought to provide a hydraulic mechanism to
separate the vascular traces, given that the walls of which do not break down (Brown 1997;
Roberts et al. 2002).
Abscission can be induced by various factors including temperature, hormones, light,
water and nutrient availability, photoperiod, wounding, pathogen attack and ozone (Addicott
1982; Taylor and Whitelaw 2001; Roberts et al. 2002). The two hormones that have the
greatest influence on abscission are ethylene and auxin (Addicott 1982; Henderson and
Osborne 1994; Taylor and Whitelaw 2001; Roberts et al. 2002). Ethylene is an abscission
stimulator while auxin acts as abscission inhibitor. AZ cells are especially sensitive to
ethylene and respond preferentially by changes in gene expression, in particular those
encoding hydrolytic enzymes that are required to remodel and/or dismantle the cell wall
(Brown 1997). Auxin is thought to delay abscission by decreasing the sensitivity of the AZ
cells to ethylene, and thereby inhibits changes in gene expression necessary for abscission to
occur (Roberts et al. 2002) .
Chapter 1
4
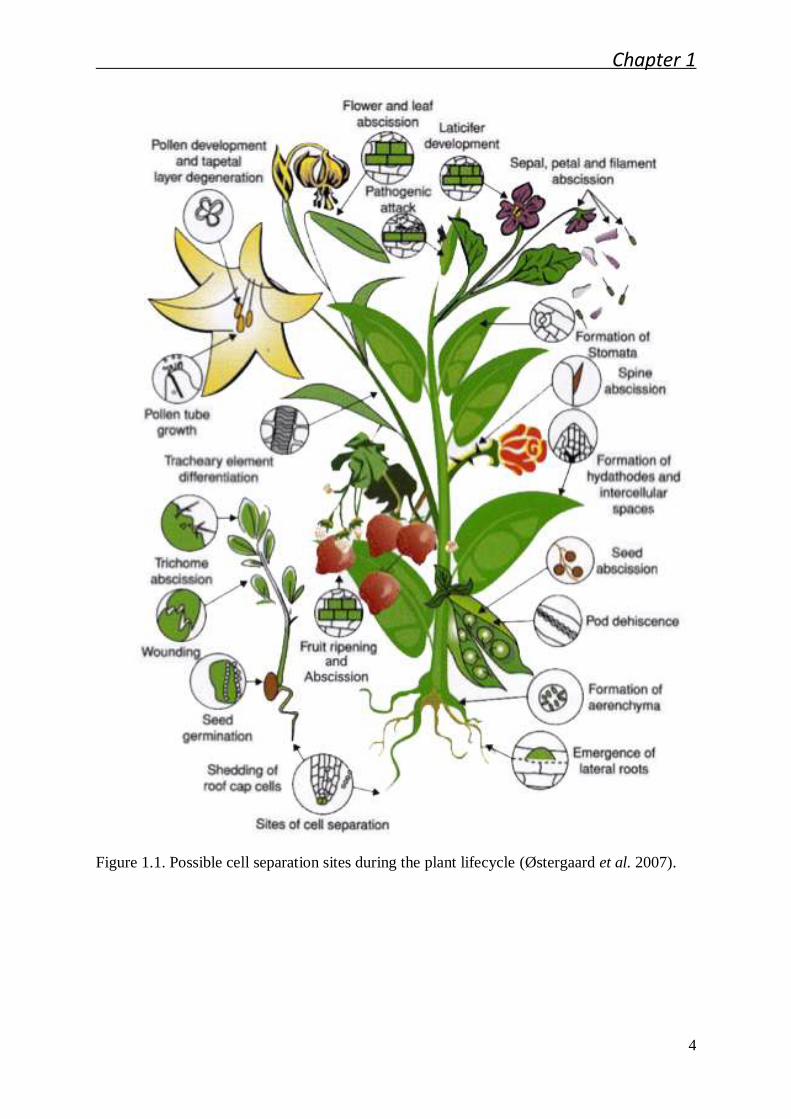
Figure 1.1. Possible cell separation sites during the plant lifecycle (Østergaard et al. 2007).
Chapter 1
5
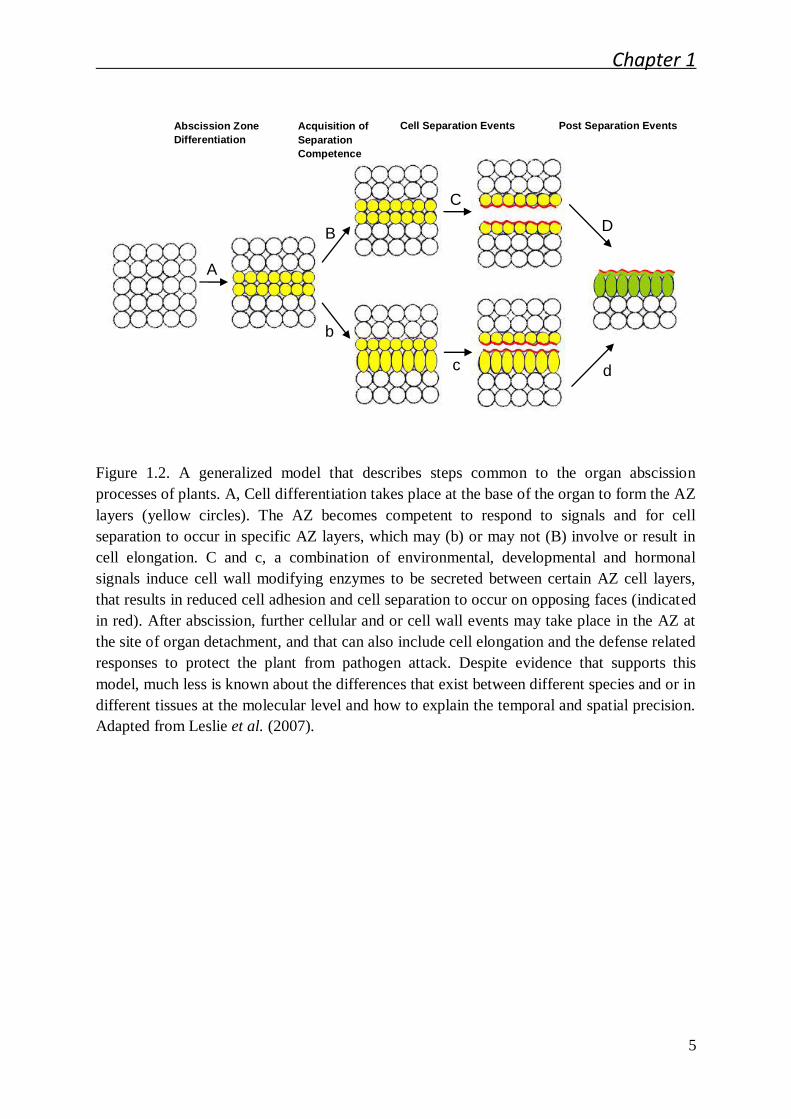
Figure 1.2. A generalized model that describes steps common to the organ abscission
processes of plants. A, Cell differentiation takes place at the base of the organ to form the AZ
layers (yellow circles). The AZ becomes competent to respond to signals and for cell
separation to occur in specific AZ layers, which may (b) or may not (B) involve or result in
cell elongation. C and c, a combination of environmental, developmental and hormonal
signals induce cell wall modifying enzymes to be secreted between certain AZ cell layers,
that results in reduced cell adhesion and cell separation to occur on opposing faces (indicated
in red). After abscission, further cellular and or cell wall events may take place in the AZ at
the site of organ detachment, and that can also include cell elongation and the defense related
responses to protect the plant from pathogen attack. Despite evidence that supports this
model, much less is known about the differences that exist between different species and or in
different tissues at the molecular level and how to explain the temporal and spatial precision.
Adapted from Leslie et al. (2007).
A
B
b
C
c
D
d
Cell Separation Events Post Separation Events Abscission Zone
Differentiation
Acquisition of
Separation
Competence
Chapter 1
6
While ethylene has been studied extensively in the relation to abscission, both
ethylene dependent and independent pathways control floral organ abscission in Arabidopsis.
The analysis of the dab (delayed floral organ abscission) mutants compared to the ethylene-
insensitive mutants etr1-1 (ETHYLENE RESPONSE1 ethylene receptor mutant) and ein2-1
(ETHYLENE-INSENSITIVE2 ethylene signal transduction mutant) indicate both ethylene
dependent and independent processes control Arabidopsis floral abscission (Patterson 2001;
Patterson and Bleecker 2004). While both the dab and the ethylene signalling mutants all
displayed delayed floral organ abscission, ethylene treatment accelerated the process only in
the dab mutants. Together the data indicate that ethylene may not be essential for abscission
induction, but acts to stimulate or accelerate the process. The isolation of the abscission
mutant ida (mutant of the INFLORESCENCE DEFICIENT IN ABSCISSION gene) and the
characterization of the leucine-rich repeat receptor kinase HAESE validates the central
importance of the ethylene independent pathways (Jinn et al. 2000; Butenko et al. 2003). The
ida mutant is blocked in abscission, while HAESA reduced function plants display delayed
floral abscission. Both signalling components are independent of ethylene given that the ida
mutant remains sensitive to ethylene, and HAESA expression is independent of ethylene
signal transduction. Furthermore, IDA and IDA-like proteins are thought to be ligands that
act through HAESA to regulate abscission apparently in an ethylene independent manner
(Stenvik et al. 2008). However, in the ethylene insensitive tomato mutant Nr (Never-ripe),
flower abscission was completely blocked and wildtype plants with overexpression of
ethylene production led to premature floral abscission (Lanahan et al. 1994). The results
indicate differences may exist between species and or organ types and support an important
role of ethylene for the organ abscission process in certain cases.
A central concept about the mechanism for organ abscission is the requirement for
cell wall remodelling and or degradation, in particular within the pectin portion of the middle

Chapter 1
7
lamella and possibly the primary cell wall (Addicott 1982; Brown 1997; Roberts and
Gonzalez-Carranza 2007). Cell separation during organ abscission depends on the activity of
at least two major families of hydrolytic enzymes that modify the cell wall including endo-β-
1,4-glucanases (cellulase) and pectinases (PG, pectate lyase (polygalacturonate lyase) (PL))
and also one pectin modification enzyme, pectin methylesterase (PME) (Figure 1.3)
(Addicott 1982). The common model includes the induction of the genes encoding cell wall
hydrolytic enzymes that are secreted to the apoplast where they participate in modifications
to the cell wall that allow separation to occur. Furthermore, the expression of these genes are
often induced by ethylene and inhibited by auxin, features that correlate with the positive and
negative effects of these hormones on the abscission process respectively (Addicott 1982;
Brown 1997; Roberts et al. 2002; Roberts and Gonzalez-Carranza 2007).
PG gene expression and activity are common features of organ abscission (Addicott
1982; Roberts and Gonzalez-Carranza 2007). As with EGases, PG transcripts and activity
increase in various species during the abscission process, and can be induced by ethylene or
inhibited by auxin (Taylor et al. 1990; Bonghi et al. 1992; Taylor et al. 1993; Kalaitzis et al.
1995; Kalaitzis et al. 1997; Burns et al. 1998). PGs are thought to be a part of pectin
disassembly occurring in many stages of plant development, especially those that require cell
separation, and may be involved in cell expansion due to activity found in rapidly growing
tissues (Hadfield and Bennett 1998). There are many reports indicating PG gene expression
in fruits for example, banana (Mbéguié-A-Mbéguié et al. 2009), peach (Bonghi et al. 1992;
Trainotti et al. 1993), apple (Pandita and Jindal 1991) and citrus (Greenberg et al. 1975). In
tomato, there is a single PG transcript, pTOM6, expressed during fruit ripening (Grierson et
al. 1986; Sheehy et al. 1988; Smith et al. 1988), while four other PGs (TAPG1, TAPG2,
TAPG4, and TAPG5) are expressed in the flower and leaf AZ (Kalaitzis et al. 1995; Kalaitzis
et al. 1997; Hong and Tucker 1998). Interestingly, the down-regulation or knockout of the
Chapter 1
8
PG expressed in the fruit during ripening PG resulted in a decrease in soluble polyuronide
and depolymerization during ripening, but surprisingly no change in fruit softening (Sheehy
et al. 1988; Smith et al. 1988; Cooley and Yoder 1998). Overall, these experiments suggest
that while PGs may indeed be important for cell separation during both ripening and
abscission, there are other factors involved. By contrast, silencing of polygalacturonase
(TAPG1) expression delayed abscission and increased break strength of the AZ (Jiang et al.
2008).
There may also be functional redundancy within the PG gene family. Indeed, there are
at least 66 PG genes known in Arabidopsis and 59 for rice, all phylogenetically grouped
within three distinct clades (clade A, B, and C), and all with glycosyl hydrolase 28 (GH28)
domains. Four members of clade A (At2g41850, At2g43880, At2g43890, and At3g07970)
are implicated in Arabidopsis floral abscission (Kim et al. 2006). Hadfield and Bennett
(1998) have also classified PGs in three different clades based on full length cDNAs that
encode PGs (clade A, B and C). Members of clade A relate to fruit and/or AZ, of which clade
B relate to fruit or dehiscence zone while clade C are involved in pollen and anther
development. Three PGs (ADPG1, ADPG2, and QRT2) from Arabidopsis have overlapping
functions (Ogawa et al. 2009). ADPG1 and ADPG2 are essential for silique dehiscence,
while ADPG2 and QRT2 contribute to floral organ abscission, and all three genes contribute
to anther dehiscence (Ogawa et al. 2009). Furthermore, jasmonic acid (JA) and ethylene act
together with abscisic acid to promote QRT2 expression and hence regulate floral organ
abscission. Together these results reveal the underlying complexity of the abscission process
and the key role of PGs in different abscission and cell separation processes. Finally,
although the biochemical process of cell separation in each organ has similar sequence of
events, our knowledge of the specific molecular basis of the different cell separation events in
Chapter 1
9
different developmental contexts and different species including those with high commercial
value is limited (Roberts et al. 2002; Swain et al. 2011).
Cellulase (Endo-1,4-β-D-glucanase, EGase) is a large family of enzymes thought to
hydrolyze β-1,4 linkages whereas their, in planta, substrates are still undetermined (Ferrarese
et al. 1998; Loopstra et al. 1998; del Campillo 1999). There are three EGase subfamilies α-,
β- and γ- in Arabidopsis, comprised of at least 25 sequences (Libertini et al. 2004). Two of
the subfamilies (α and β) are secreted EGases with members implicated in abscission. The
increase of activity of cellulase during the abscission process appears to be under
transcriptional regulation induced by ethylene and inhibited by auxin (Tucker et al. 1988;
Tucker et al. 2002). Furthermore, when the function of the tomato Cel2 gene encoding an
endo-1,4-β-glucanase (EGase) is reduced, an increase in the force required for separation to
occur in the fruit AZ was observed, which provides evidence that Cel2 contributes to cell
wall disassembly during fruit abscission (Brummell et al. 1999). The exact substrate for
EGases in the context of abscission is unknown but is thought to be the hemicellulose
portion, possibly within the primary cell wall (Addicott 1982; Gonzalez-Bosch et al. 1997;
Trainotti et al. 1997; Henderson et al. 2001b; Roberts and Gonzalez-Carranza 2007).
PLL cleaves α-1,4-linked galacturonic acid through transelimination reaction (Pedrolli
et al. 2009; Sun and van Nocker 2010). In Arabidopsis, there are 26 genes (AtPLLs) which
encode pectate lyase-like proteins (Palusa et al. 2007). It has been found that PLLs express in
several Arabidopsis organs programmed for abscission – the perianth floral organ AZ, the DZ
of the fruit, and the seed AZ. The activity is also seen in cell layers in the region of initiating
lateral roots, flowers, and pollens. PLL genes are also involved in several aspects of growth
and development both dependent and independent of cell separation (Palusa et al. 2007; Sun
and van Nocker 2010)
Chapter 1
10
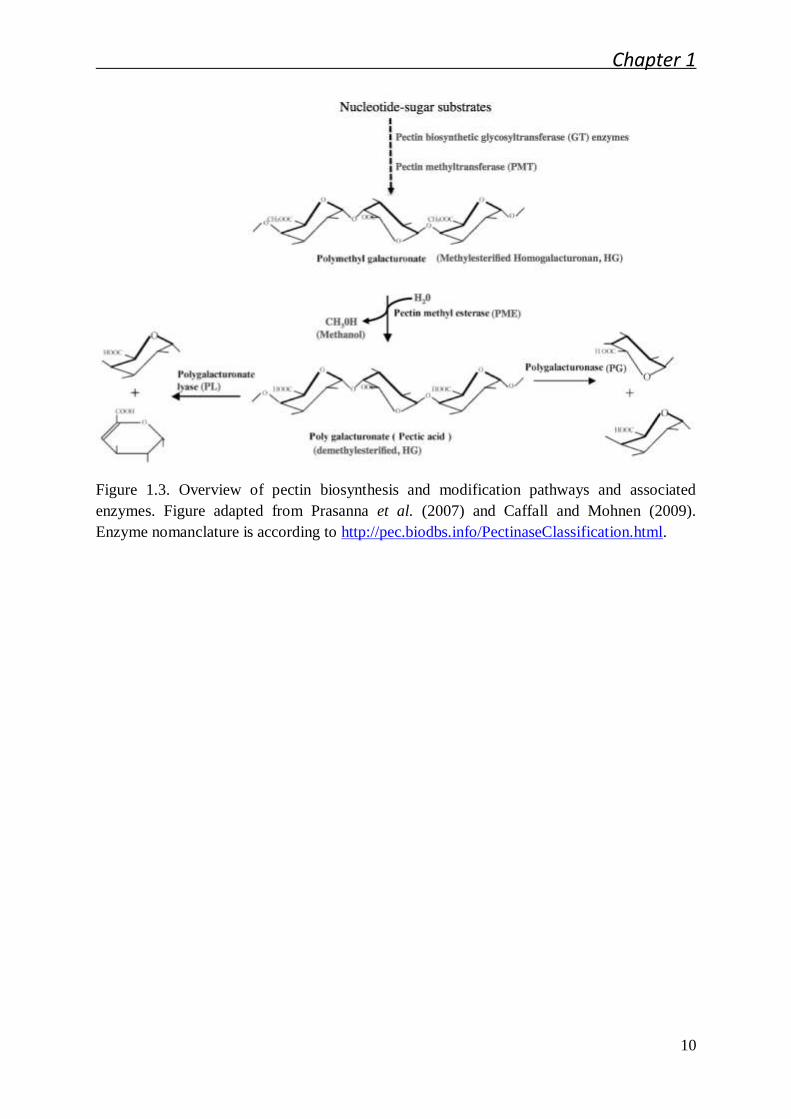
Figure 1.3. Overview of pectin biosynthesis and modification pathways and associated
enzymes. Figure adapted from Prasanna et al. (2007) and Caffall and Mohnen (2009).
Enzyme nomanclature is according to http://pec.biodbs.info/PectinaseClassification.html.

Chapter 1
11
PME activity is thought to modulate the cell wall pectin methyl-esterification status
and to play important roles during plant vegetative and reproductive development (Micheli
2001; Pelloux et al. 2007; Wolf et al. 2009). There are up to 66 PME-related proteins in the
Arabidopsis genome. Twenty-three of them contain only catalytic PME domain while 43 of
them also contain a PME inhibitor (PMEI) domain (Tian et al. 2006). PME activity was first
shown to decrease during abscission, but in some cases did not change (Osborne 1958;
Lamotte et al. 1969; Ratner et al. 1969; Moline et al. 1972). In the AZ of cotton petioles,
there is an increase in methyl-esterified pectin, and the process is inhibited by auxin
(Valdovinos and Muir 1965). During strawberry fruit ripening, PME gene expression is
induced by auxin, inhibited by ethylene and associated with textural changes during ripening
(Castillejo et al. 2004). PMEs are also implicated in cell separation events during pollen
formation and root cap border cell shedding, (Wen et al. 1999; Francis et al. 2006; Wolf et al.
2009; Sun and van Nocker 2010). The mutation of QUARTET1 (QRT1), a PME expressed in
Arabidopsis pollen, and anthers leads to impaired pollen tetrad separation during flower
development (Francis et al. 2006). A decrease in PME function in pea plants prevented
normal separation of root border cells from the root tip (Wen et al. 1999). The expression of
PME genes is observed in the Arabidopsis sepal, petal, stamen, and seed AZs, the fruit
dehiscence zone, and in other separation sites including the flower styles, and the root
endodermal and cortical layers during lateral root emergence (Sun and van Nocker 2010).
During fruit ripening, PME activity is thought to prepare HG as substrate for PG hydrolysis
by random de-methyl-esterification (Koch and Nevins 1989; Wakabayashi et al. 2000;
Micheli 2001; Wakabayashi et al. 2003). Indeed, in Arabidopsis, QRT1 may act in tandem
with QUARTET3 (QRT3), a polygalacturonase, to degrade de-methyl-esterified HG in the
pollen mother cell primary walls (Rhee et al. 2003; Francis et al. 2006). Whether a similar
relation between PMEs and PG exists in the context of organ abscission is yet to be

Chapter 1
12
determined. Finally, several studies have used monoclonal antibodies to reveal dynamic
changes in pectin methyl-esterification occurring prior to and during abscission (Uheda and
Nakamura 2000; Lee et al. 2008). For example using the JIM5 and JIM7 monoclonal
antibodies, which detect epitopes of different degrees of pectin methyl-esterification, revealed
the presence of both JIM5 and JIM7 epitopes in the wall between AZ cells of branches of
Azolla before abscission occurred, whereas the JIM5 epitope disappeared and only the JIM7
epitopes were observed in the middle lamella remaining after ethylene-induced abscission
(Uheda and Nakamura 2000). A comparable result was observed during Impatiens leaf
abscission, during which only the highly de-esterified HG epitope detected by JIM5 was
observed to be reduced in the middle lamellae post-abscission and only at the plane of
separation (Bowling and Vaughn 2011). In contrast to these first two studies, an AZ-
associated de-esterification of HG was revealed by a reduction in the JIM5 epitope only in
the AZ and distal area on day 7 after AZ induction, but no reduction after separation (Lee et
al. 2008). It is not clear whether the differences observed are due to examining abscission
processes in different subtending organs, or because the studies were done with different
species. In any case, the studies suggest changes in the pectic methyl-esterification status are
common to cell separation during organ abscission.
Cell Wall, Pectin and Cell Separation
Plant cells are surrounded by cell walls composed of structural proteins and complex
polysaccharides including cellulose, hemicelluloses, and pectin. The cell wall is a dynamic
structure that undergoes modifications during development and its composition depends on
the tissue, developmental stage and relates to its functional specificity (Knox 2008). Indeed,
the cell wall not only functions as a structure and protective layer against pathogenic attack,
but also plays a central role in plant development and response to environmental changes. For

Chapter 1
13
example, the cell wall contributes to a plant cell’s rigidity and strength, however, in order for
a plant to develop, the cell wall must undergo modifications to allow cell expansion and
elongation (Cosgrove 2005). Furthermore, separation between adjacent cells is an essential
part of developmental processes that occur throughout the life cycle of the plant (Figure 1.1)
(Roberts et al. 2002; Driouich et al. 2007; Chervin et al. 2008). Despite the importance of
cell separation in plants, our knowledge about the cell wall structural dynamics and molecular
mechanisms that underlie the spatial and temporal precision of cell separation in different
species, plant tissues and developmental contexts remains limited.
Pectin is the most structurally complex family of cell wall polysaccharides and is also
a major component of primary walls of both monocots and dicots (Mohnen 2008). Pectic
polysaccharides have roles in plant growth and development, provide mechanical strength
and physical properties of primary walls, are involved in intercellular signalling that controls
plant morphogenesis and plant defence against pathogens (Mohnen 2008; Caffall and
Mohnen 2009). Pectin is abundantly found in walls of expanding and dividing cells, walls of
cells in the soft parts of the plant, and most abundantly in the middle lamella and cell corners.
In addition, pectin as the cement between two adjacent cells is of paramount importance for
cell adhesion and during cell separation (Jarvis et al. 2003). Not only does it form the matrix
in which the cellulose microfibers of the primary cell wall are embedded, but also is the main
component of the middle lamella that adjoins adjacent cells (Figure 1.4) (Willats et al. 2001a;
O'Neill et al. 2004). The structural characteristics and the role of how pectin participates
towards cell separation to occur in a temporally and spatially precise manner are not
completely understood despite a central importance during plant vegetative and reproductive
development.
Pectin is comprised of the most complex naturally occurring polysaccharides known.
Pectin is mainly composed of four major complex polysaccharides namely homogalacturan

Chapter 1
14
(HG), rhamnogalacturonan I (RG-I), rhamnogalacturonan II (RG-II) and xylogalacturonan
(XGA) (Figure 1.5) (Mohnen 2008; Caffall and Mohnen 2009). Pectic content is variable
both between species and different organs, but in general more than 60% of pectin consists of
HG, a linear homopolymer of α-1,4-linked galacturonic acid (GalA) (Figure 1.5). All the
complex pectin polysaccharides contain O-1 to O-4 linked GalA as a component of their
backbones, whereas only RG-I consists of 1,4-α-D-GalA-1,2-α-L-Rha disaccharide repeats.
HG polymers can be 100-200 GalA residues in length and the GalA residues can be modified
by methyl-esterification at the C-6 carboxyl and O-acetylated at O-2 or O-3 (Figure 1.6A)
(Francis et al. 2006; Mohnen 2008). In particular, the methyl-esterification status of the HG
has been shown to be important to maintain cell adhesion and implicated in mechanisms
underlying separation as described below (Orfila et al. 2001; Willats et al. 2001a; Willats et
al. 2001b; Jarvis et al. 2003; O'Neill et al. 2004; Caffall and Mohnen 2009). RG-II is the
most complex structure of pectin, accounts for approximately 10% of total composition, and
is fairly conserved across plant species (Mohnen 2008; Caffall and Mohnen 2009). RG-II
form dimers that cross link with HG domains important for the overall macromolecular
pectin network necessary for normal plant growth and development and cellular adhesion.
RG-I represents 20-35% of the composition of pectin and with its repeating 1-4-α-D-GalA-
1,2-α-L-Rha disaccharide backbone presents a large diversity that depends on developmental
stage or cell type. The large variation in the RG-I structure observed in plants suggests
diverse functional roles yet to be determined (Mohnen 2008; Caffall and Mohnen 2009).
Finally, XGA is comprised of HG substituted at the O-3 with a β-linked xylose, and
occasionally, further substituted at O-4 (Mohnen 2008). While XGA is most prevalent in
reproductive tissues, it has also been detected in Arabidopsis stems and leaves. Furthermore,
XGA functions during cell detachment (Willats et al. 2004) and resistance to pathogen attack
(Jensen et al. 2008).

Chapter 1
15
Figure 1.4. Schematic non-proportional representation of (A) the plant cell wall (Campbell
and Reece 2002), (B) the pectin rich primary cell wall and middle lamella that joins together
adjacent cells. Modified from Cosgrove (2005).
A
B

Chapter 1
16
Figure 1.5. Schematic representation of pectin showing the four complex pectic
polysaccharides homogalacturonan (HG), xylogalacturonan (XGA), rhamnogalacturonan I
(RG-I) and rhamnogalacturonan II (RG-II) linked to each other. Blue arrows indicate pectin
modifications implicated in cell separation. Figure adapted from Mohnen (2008).

Chapter 1
17
Figure 1.6. A, The primary structure of homogalacturonan indicating possible sites of methyl-
esterification at the C-6 carboxyl and O-acetylation at the O-2 or O3 of linked GalA residues.
B, Schematic model “egg-box” of ionic calcium bridge crosslinks between unmethyl-
esterified carboxyl groups in antiparallel homogalacturonan that results in stiff gels. Adapted
from Caffall and Mohnen (2009) and Cosgrove (2005).

Chapter 1
18
The biosynthesis of pectin presumably involves many enzymes and the details have
not fully been elucidated (Caffall and Mohnen 2009). In general, HG is thought to be
synthesized in the golgi complex and modified by pectin methyltransferases (PMTs). PMTs
add methyl groups at the C-6 carboxyl group (Caffall and Mohnen 2009). Then, modified
pectin is targeted through vesicles via the plasmodesmata (PM) to the apoplast and finally
inserted into the cell wall in a highly methylated form (Figures 1.3-1.6) (Kauss and Hassid
1967; Zhang and Staehelin 1992; Lennon and Lord 2000). The substrate for pectin
polysaccharide synthesis including HG comes from nucleotide sugars and involves the
activity of glycosyltransferase enzymes that have been localized within the golgi lumen
(Sterling et al. 2001) (Figure 1.3). The current model of pectin biosynthesis pathway
postulates that the HG backbone is initiated in the cis cisternae while extension and methyl-
esterification of the HG GalA residues occurs in medial cisternae. Once new highly
methylated pectin is inserted into the cell wall, PMEs are thought to remove the methyl
groups in either a blockwise fashion resulting in domains of contiguous de-esterified GalA
residues, or in a non-blockwise fashion that results in domains of non-contiguous de-
esterified GalA residues (Willats et al. 2001b; Pelloux et al. 2007).
The methyl-esterification of HG plays an important role during plant development, as
the methylation status can modulate the functionality of the pectin, in particular for cell
adhesion and separation to occur (Jarvis et al. 2003). For example, during pollen tube tip
growth, de-methyl-esterification of HG following tip expansion results in a more rigid pectin
that contributes to the construction of the pollen tube wall, while the tip remains pliable to
allow the burst of pollen necessary for fertilization (Hasegawa et al. 2000) (Li et al. 1994).
Cells in other tissues also undergo de-esterification during development, as observed when
intercellular spaces are formed (Willats et al. 2001b). Intercellular spaces arise during
development and begin to form after cell division. When a cell divides, portions of the old

Chapter 1
19
primary cell wall must be dismantled in order to link up adjacent middle lamellae to maintain
apoplastic continuity between cells. Part of this process is characterized by the de-
esterification of HG in specific locations of the primary wall that separate and lead to
intracellular space formation. It is thought that de-esterification allows the formation of
calcium (Ca2+
) cross links that results in the so-called “egg-box” pectin configuration
between adjacent polymers (Figure 1.6 B) (Grant et al. 1973; Cosgrove 2005). As mentioned
above, the de-methyl-esterification of HG is catalyzed by PME (EC 3.1.1.11), cell wall
targeted proteins that modulate the methylation status of pectin HG (Micheli 2001; Pelloux et
al. 2007). Furthermore, de-esterification related crosslinking increases pectin rigidity and
may also allow targeting of cell wall modifying or pectin-degrading enzymes such as
polygalacturonase (PG, EC 3.2.1.15) that further effect the texture and rigidity of the cell wall
and may have roles during cell separation events such as those underlying organ abscission
(Figure 1.3) (Hadfield and Bennett 1998). Pectate lyase or polygalacturonate lyase or pectate
transeliminase (PL, EC 4.2.2.2) (Andro et al. 1984; Palusa et al. 2007) have been studied
extensively in Erwinia sp., a plant pathogen (Andro et al. 1984; Keen and Tamaki 1986). In
the plant, there are proteins similar to PL called pectate lyase-like (PLL) proteins. The role of
PLL is to depolymerise pectin by catalyzing the eliminative cleavage of α-1,4-linked
galacturonic acid (Sun and van Nocker 2010) (Figure 1.3).
Oil Palm Fruit Abscission
Oil palm’s botanical name is Elaeis guineensis, (Jacq.) which is derived from the Greek
word elaion (oil) and the guineensis describes its origin from the Guinea coast (Henderson
and Osborne 2000). Oil palm (Figure 1.7) is a tropical perennial monocotyledonous species
in the Arecaceae family. It is one of the most important tropical crops due to the fleshly
mesocarp from which edible oils are derived and recently became the number one source of

Chapter 1
20
edible vegetable oil worldwide (Rival 2007). In addition, the oil from the mesocarp and
kernel are used as major components of soaps, emulsifiers and pharmaceuticals (Henderson
and Osborne 2000; Edem 2002; Rodrigues et al. 2004). Recently, due to depletion and the
increased cost of fossil fuels, palm oil is considered a potential source of renewable energy
usable as a biodiesel (Kalam and Masjuki 2002; Yusoff 2006; Tan et al. 2009). An increase
in the use of palm oil as a source of biofuel is predicted to cause constraints on the worldwide
supply of edible palm oil and increase the pressure for higher yields and an expansion of
cultivatable areas. Conventional breeding schemes have allowed an increase in yield of palm
oil up to 1 % per year (Rival 2007). However, while increases in yields are clearly possible
with oil palm, one factor that limits overall yield gains is the loss due to non-synchronized
ripening and subsequent shedding of the ripest fruit before harvest. In this context, our main
goal is to examine the cellular and molecular mechanisms that occur during the cell
separation process that leads to the abscission and shedding of the oil palm fruit.
The oil palm is monoecious; however, it is considered temporally dioecious given that
separate male and female inflorescences occur on the same palm in an alternating cycle that
depends on genetic factors, age and environmental (Cruden 1988; Adam et al. 2005). The oil
palm fruit anatomy is as follows (Figure 1.8): i) the fleshy lipid rich mesocarp surrounds ii)
the lignified shell containing the kernel with a distinct lipid composition, all situated on iii)
the pedicel that is the fibrous stalk connection between the fruit base and the spikelet; iv) the
rudimentary androecium refers to the aborted staminoid that forms a ring at the fruit base,
while v) the tepals are the perianth located adjacent to rudimentary androecium, vi) the
bracteoles are the outer perianth extensions of the spikelets, and finally vii) at the junction of
the mesocarp and the pedicel is the primary AZ visible with the naked eye (Figure 1.8,
position 1,). There are also four additional AZs around the outer perimeter of the fruit that
originate at the perimeter of the primary AZ and terminate in four possible locations: between
Chapter 1
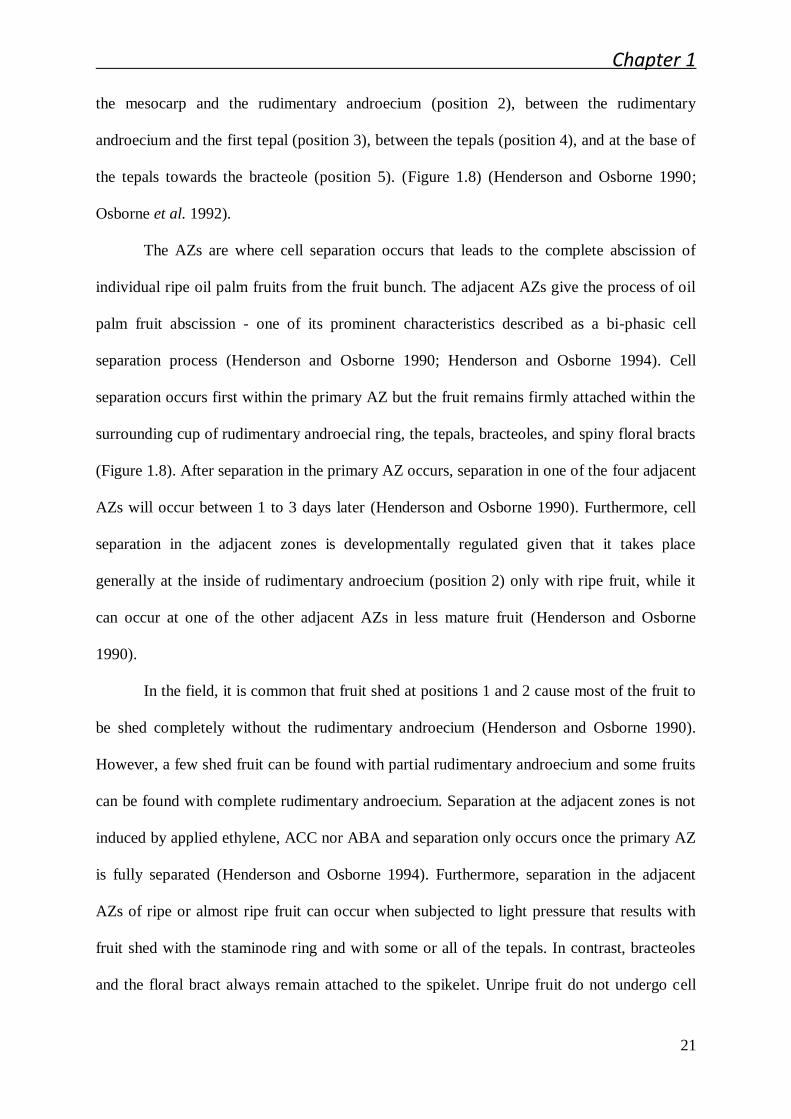
21
the mesocarp and the rudimentary androecium (position 2), between the rudimentary
androecium and the first tepal (position 3), between the tepals (position 4), and at the base of
the tepals towards the bracteole (position 5). (Figure 1.8) (Henderson and Osborne 1990;
Osborne et al. 1992).
The AZs are where cell separation occurs that leads to the complete abscission of
individual ripe oil palm fruits from the fruit bunch. The adjacent AZs give the process of oil
palm fruit abscission - one of its prominent characteristics described as a bi-phasic cell
separation process (Henderson and Osborne 1990; Henderson and Osborne 1994). Cell
separation occurs first within the primary AZ but the fruit remains firmly attached within the
surrounding cup of rudimentary androecial ring, the tepals, bracteoles, and spiny floral bracts
(Figure 1.8). After separation in the primary AZ occurs, separation in one of the four adjacent
AZs will occur between 1 to 3 days later (Henderson and Osborne 1990). Furthermore, cell
separation in the adjacent zones is developmentally regulated given that it takes place
generally at the inside of rudimentary androecium (position 2) only with ripe fruit, while it
can occur at one of the other adjacent AZs in less mature fruit (Henderson and Osborne
1990).
In the field, it is common that fruit shed at positions 1 and 2 cause most of the fruit to
be shed completely without the rudimentary androecium (Henderson and Osborne 1990).
However, a few shed fruit can be found with partial rudimentary androecium and some fruits
can be found with complete rudimentary androecium. Separation at the adjacent zones is not
induced by applied ethylene, ACC nor ABA and separation only occurs once the primary AZ
is fully separated (Henderson and Osborne 1994). Furthermore, separation in the adjacent
AZs of ripe or almost ripe fruit can occur when subjected to light pressure that results with
fruit shed with the staminode ring and with some or all of the tepals. In contrast, bracteoles
and the floral bract always remain attached to the spikelet. Unripe fruit do not undergo cell

Chapter 1
22
separation either at position 1 or at other positions and fruit are not shed (Henderson and
Osborne 1990). Finally, it was proposed that a signal other than ethylene may be released
from the primary AZ to induce separation in the adjacent zones (Henderson and Osborne
1994).
Ethylene or its precursor 1-aminocyclopropane-l-carboxylic acid (ACC) initiates
while auxin inhibits cell separation in the primary AZ of the oil palm fruit, This suggests both
these hormones function to regulate abscission in oil palm as during the abscission processes
with other species (Henderson and Osborne 1994; Brown 1997; Taylor and Whitelaw 2001;
Roberts et al. 2002). Ethylene production is initiated at the ripe fruit stage and the
progression of synthesis starts from the apex to base of the mesocarp in a positive correlation
to the percentage of separation that occurs in the primary AZ. While the primary AZ, tepals
and rudimentary androecium also increase in ethylene production during ripening, the amount
is low which suggests the main source of ethylene production is in the mesocarp cells.
Transmission electron microscopy confirmed that cell separation at the AZ occurs at
the middle lamella but attachment remains at the plasmodesmatal connections that may be
last to separate. The cytoplasmic organelles of separating abscission cells include expanded
mitochondria with multiple cristae, multiple polyribosomal clusters, expanded golgi stacks
with associated vesicles, and evidence of vesicular traffic from the cytoplasm to the cell wall
via the plasmalema (Henderson et al. 2001a). Phloroglucinol staining, which stains for the
presence of lignin, indicated that intact AZ of ripe fruits shows continuous vascular tissue
from pedicel traversing across the whole abscission region. However, the proportion of
phloroglucinol-stained lignified vascular tissue with the intact AZ of ripe fruit is very low
comparing to the adjacent mesocarp and pedicel tissues suggesting lignin synthesis is
inhibited within the AZ layers (Henderson et al. 2001a).

Chapter 1
23
Another interesting feature of the oil palm fruit abscission is that the abscinded AZ
cells have higher pectin content when compared to the adjacent mesocarp and pedicel tissues
that do not separate, based on uronic acid analysis (Henderson et al. 2001a). Furthermore, 13
C
CP/MAS NMR spectra analysis revealed fewer methoxyl groups that was interpreted to
reflect a lower level of pectin esterification exists in the abscinded AZ cells (Henderson et al.
2001a). Finally, an inducible polygalacturonase activity in abscinded AZ that is at least 35
fold compared with the value of intact AZ and adjoining zones (Henderson et al. 2001a).
Together, these results were proposed as part of the basis for the localized precision of cell
separation events in the base of the oil palm fruit. Together, these features and observations
provide a basis towards understanding the cellular and molecular basis of abscission in the oil
palm fruit and the context of this thesis.
Objectives of the Thesis
The objectives of this thesis are as follows:
1. Identify the PG genes responsible for the activity induced during separation;
provide a global analysis of PG gene expression in the oil palm fruit tissues.
2. Identify characteristic features related to the development of the primary AZ in the
oil palm fruit. To reach this goal we conducted a detailed histological examination of the
development of the primary AZ compared to the adjacent pedicel and mesocarp tissue during
oil palm fruit development.
3. Identify characteristic features of the primary AZ during cell separation induced by
ethylene; microscopic and histological examination of the cellular changes that take place
before, during, and after cell separation and abscission.
4. Identify characteristic features of the pectin within the primary AZ during
development and cell separation induced by ethylene. To reach this goal, I conducted a histo-
Chapter 1
24
immuno characterization of the primary AZ pectin using antibodies raised against pectin with
different methyl-esterification patterns, in addition to one antibody for xylogalacturonan
associated with cell separation. Develop an integrated model as a basis to explain the
mechanisms underlying cell separation and fruit shedding in the oil palm.

Chapter 1
25
Figure 1.7. Oil palm tree (Elaeis guineensis)
Chapter 1
26
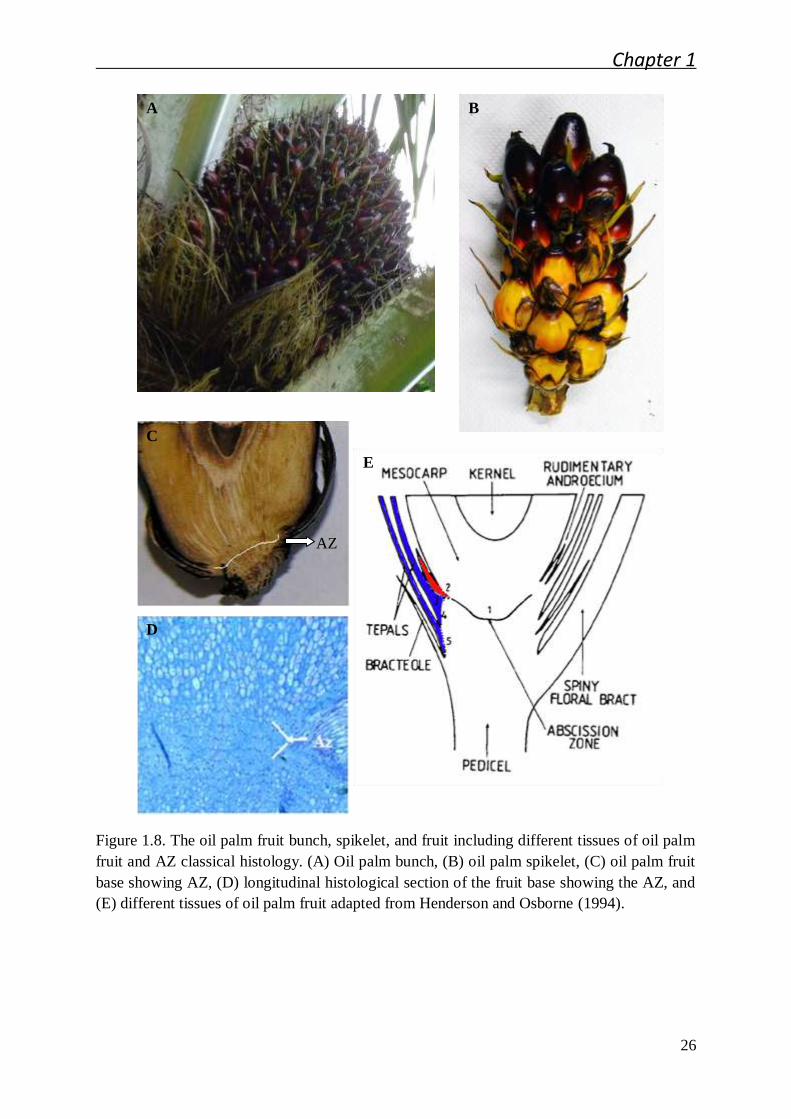
Figure 1.8. The oil palm fruit bunch, spikelet, and fruit including different tissues of oil palm
fruit and AZ classical histology. (A) Oil palm bunch, (B) oil palm spikelet, (C) oil palm fruit
base showing AZ, (D) longitudinal histological section of the fruit base showing the AZ, and
(E) different tissues of oil palm fruit adapted from Henderson and Osborne (1994).
A B
C
E
D
AZ
Chapter 1
27
Literature Cited
Adam, H., S. Jouannic, J. Escoute, Y. Duval, J.-L. Verdeil and J. W. Tregear (2005).
"Reproductive developmental complexity in the African oil palm (Elaeis guineensis,
Arecaceae)." Am J Bot 92(11): 1836-1852.
Addicott, F. (1982). Abscission, University of California Press, Ltd. London.
Andro, T., J. P. Chambost, A. Kotoujansky, J. Cattaneo, Y. Bertheau, F. Barras, F. Van
Gijsegem and A. Coleno (1984). "Mutants of Erwinia chrysanthemi defective in
secretion of pectinase and cellulase." J Bacteriol 160(3): 1199-1203.
Bonghi, C., N. Rascio, A. Ramina and G. Casadoro (1992). "Cellulase and polygalacturonase
involvement in the abscission of leaf and fruit explants of peach." Plant Mol Biol
20(5): 839-848.
Bowling, A. J. and K. C. Vaughn (2011). "Leaf abscission in Impatiens (Balsaminaceae) is
due to loss of highly de-esterified homogalacturonans in the middle lamellae." Am J
Bot 98(4): 619-629.
Brown, K. M. (1997). "Ethylene and abscission." Physiol Plant 100(3): 567-576.
Brummell, D., B. Hall and A. Bennett (1999). "Antisense suppression of tomato endo-1,4-β-
glucanase Cel2 mRNA accumulation increases the force required to break fruit
abscission zones but does not affect fruit softening." Plant Mol Biol 40(4): 615-622.
Burns, J. K., D. J. Lewandowski, C. J. Nairn and G. E. Brown (1998). "Endo-1,4-β-glucanase
gene expression and cell wall hydrolase activities during abscission in Valencia
orange." Physiol Plant 102(2): 217-225.
Butenko, M. A., S. E. Patterson, P. E. Grini, G.-E. Stenvik, S. S. Amundsen, A. Mandal and
R. B. Aalen (2003). "INFLORESCENCE DEFICIENT IN ABSCISSION Controls
Floral Organ Abscission in Arabidopsis and Identifies a Novel Family of Putative
Ligands in Plants." Plant Cell 15(10): 2296-2307.
Caffall, K. H. and D. Mohnen (2009). "The structure, function, and biosynthesis of plant cell
wall pectic polysaccharides." Carbohydr Res 344(14): 1879-1900.
Campbell, N. A. and J. B. Reece (2002). Biology, Benjamin Cummings.
Castillejo, C., J. I. de la Fuente, P. Iannetta, M. Á. Botella and V. Valpuesta (2004). "Pectin
esterase gene family in strawberry fruit: study of FaPE1, a ripening‐specific
isoform*." J Exp Bot 55(398): 909-918.

Chapter 1
28
Chervin, C., A. Tira-umphon, N. Terrier, M. Zouine, D. Severac and J.-P. Roustan (2008).
"Stimulation of the grape berry expansion by ethylene and effects on related gene
transcripts, over the ripening phase." Physiol Plant 134(3): 534-546.
Cooley, M. B. and J. I. Yoder (1998). "Insertional inactivation of the tomato
polygalacturonase gene." Plant Mol Biol 38(4): 521-530.
Cosgrove, D. J. (2005). "Growth of the plant cell wall." Nat Rev Mol Cell Biol 6(11): 850-
861.
Cruden, R. W. (1988). "Temporal Dioecism: Systematic Breadth, Associated Traits, and
Temporal Patterns." Bot Gaz 149(1): 1-15.
del Campillo, E. (1999). 2 Multiple Endo-1, 4-β-D-glucanase (Cellulase) Genes in
Arabidopsis. Current Topics in Developmental Biology. A. P. Roger and P. S. Gerald,
Academic Press. Volume 46: 39-61.
Driouich, A., C. Durand and M. Vicre-Gibouin (2007). "Formation and separation of root
border cells." Trends Plant Sci 12(1): 14-19.
Edem, D. O. (2002). "Palm oil: Biochemical, physiological, nutritional, hematological and
toxicological aspects: A review." Plant Food Hum Nutr 57(3): 319-341.
Ferrarese, L., L. Trainotti, S. Gattolin and G. Casadoro (1998). "Secretion, purification and
activity of two recombinant pepper endo-β-1,4-glucanases expressed in the yeast
Pichia pastoris." FEBS Lett 422(1): 23-26.
Francis, K. E., S. Y. Lam and G. P. Copenhaver (2006). "Separation of Arabidopsis Pollen
Tetrads Is Regulated by QUARTET1, a Pectin Methylesterase Gene." Plant Physiol
142(3): 1004-1013.
Gonzalez-Bosch, C., E. del Campillo and A. B. Bennett (1997). "Immunodetection and
Characterization of Tomato Endo-[beta]-1,4-Glucanase Cel1 Protein in Flower
Abscission Zones." Plant Physiol 114(4): 1541-1546.
Grant, G. T., E. R. Morris, D. A. Rees, P. J. C. Smith and D. Thom (1973). "Biological
interactions between polysaccharides and divalent cations: The egg-box model."
FEBS Lett 32(1): 195-198.
Greenberg, J., R. Goren and J. Riov (1975). "The Role of Cellulase and Polygalacturonase in
Abscission of Young and Mature Shamouti Orange Fruits." Physiol Plant 34(1): 1-7.
Grierson, D., M. J. Maunders, A. Slater, J. Ray, C. R. Bird, W. Schuch, M. J. Holdsworth, G.
A. Tucker and J. E. Knapp (1986). "Gene Expression During Tomato Ripening."
Philosophical Transactions of the Royal Society of London Series B, Biological
Sciences 314(1166): 399-410.

Chapter 1
29
Hadfield, K. A. and A. B. Bennett (1998). "Polygalacturonases: Many Genes in Search of a
Function." Plant Physiol 117(2): 337-343.
Hasegawa, Y., S. Nakamura, E. Uheda and N. Nakamura (2000). "Immunolocalization and
possible roles of pectins during pollen growth and callose plug formation in
angiosperms." Grana 39(1): 46-55.
Henderson, J., H. A. Davies, S. J. Heyes and D. J. Osborne (2001a). "The study of a
monocotyledon abscission zone using microscopic, chemical, enzymatic and solid
state 13C CP/MAS NMR analyses." Phytochemistry 56(2): 131-139.
Henderson, J., L. Lyne and D. J. Osborne (2001b). "Failed expression of an endo-β-1,4-
glucanhydrolase (cellulase) in a non-abscinding mutant of Lupinus angustifolius cv
Danja." Phytochemistry 58(7): 1025-1034.
Henderson, J. and D. J. Osborne (1990). "Cell Separation and Anatomy of Abscission in the
Oil Palm, Elaeis guineensis Jacq." J Exp Bot 41(2): 203-210.
Henderson, J. and D. J. Osborne (1994). "Inter-tissue signalling during the two-phase
abscission in oil palm fruit." J Exp Bot 45(7): 943-951.
Henderson, J. and D. J. Osborne (2000). "The oil palm in all our lives: how this came about."
Endeavour 24(2): 63-68.
Hong, S. B. and M. L. Tucker (1998). "Genomic organization of six tomato
polygalacturonases and 5 ' upstream sequence identity with tap1 and win2 genes."
Mol Gen Genet 258(5): 479-487.
Jarvis, M. C., S. P. H. Briggs and J. P. Knox (2003). "Intercellular adhesion and cell
separation in plants." Plant, Cell Environ 26(7): 977-989.
Jensen, J. K., S. O. Sørensen, J. Harholt, N. Geshi, Y. Sakuragi, I. Møller, J. Zandleven, A. J.
Bernal, N. B. Jensen, C. Sørensen, M. Pauly, G. Beldman, W. G. T. Willats and H. V.
Scheller (2008). "Identification of a Xylogalacturonan Xylosyltransferase Involved in
Pectin Biosynthesis in Arabidopsis." Plant Cell 20(5): 1289-1302.
Jiang, C. Z., F. Lu, W. Imsabai, S. Meir and M. S. Reid (2008). "Silencing polygalacturonase
expression inhibits tomato petiole abscission." J Exp Bot 59(4): 973-979.
Jinn, T.-L., J. M. Stone and J. C. Walker (2000). "HAESA, an Arabidopsis leucine-rich
repeat receptor kinase, controls floral organ abscission." Genes Dev 14(1): 108-117.
Kalaitzis, P., S. M. Koehler and M. L. Tucker (1995). "Cloning of a tomato
polygalacturonase expressed in abscission." Plant Mol Biol 28(4): 647-656.
Chapter 1
30
Kalaitzis, P., T. Solomos and M. L. Tucker (1997). "Three Different Polygalacturonases Are
Expressed in Tomato Leaf and Flower Abscission, Each with a Different Temporal
Expression Pattern." Plant Physiol 113(4): 1303-1308.
Kalam, M. A. and H. H. Masjuki (2002). "Biodiesel from palmoil--an analysis of its
properties and potential." Biomass Bioenerg 23(6): 471-479.
Kauss, H. and W. Z. Hassid (1967). "Enzymic Introduction of the Methyl Ester Groups of
Pectin." J Biol Chem 242(15): 3449-3453.
Keen, N. T. and S. Tamaki (1986). "Structure of two pectate lyase genes from Erwinia
chrysanthemi EC16 and their high-level expression in Escherichia coli." J Bacteriol
168(2): 595-606.
Kim, J., S.-H. Shiu, S. Thoma, W.-H. Li and S. Patterson (2006). "Patterns of expansion and
expression divergence in the plant polygalacturonase gene family." Genome Biol
7(9): R87.
Knox, J. P. (2008). "Revealing the structural and functional diversity of plant cell walls."
Curr Opin Plant Biol 11(3): 308-313.
Koch, J. L. and D. J. Nevins (1989). "Tomato Fruit Cell Wall : I. Use of Purified Tomato
Polygalacturonase and Pectinmethylesterase to Identify Developmental Changes in
Pectins." Plant Physiol 91(3): 816-822.
Lamotte, C. E., C. Gochnauer, L. R. Lamotte, J. R. Mathur and L. L. R. Davies (1969).
"Pectin Esterase in Relation to Leaf Abscission in Coleus and Phaseolus." Plant
Physiol 44(1): 21-26.
Lanahan, M. B., H. C. Yen, J. J. Giovannoni and H. J. Klee (1994). "The Never Ripe
Mutation Blocks Ethylene Perception in Tomato." Plant Cell 6(4): 521-530.
Lee, Y., P. Derbyshire, J. P. Knox and A. K. Hvoslef-Eide (2008). "Sequential cell wall
transformations in response to the induction of a pedicel abscission event in
Euphorbia pulcherrima (poinsettia)." Plant J 54(6): 993-1003.
Lennon, K. and E. Lord (2000). "In vivo pollen tube cell of Arabidopsis thaliana; I. Tube cell
cytoplasm and wall." Protoplasma 214(1): 45-56.
Leslie, M. E., M. W. Lewis and S. J. Liljegren (2007). Organ Abscission. Annual Plant
Reviews Volume 25: Plant Cell Separation and Adhesion, Blackwell Publishing Ltd:
106-136.
Li, Y., F. Chen, H. Linskens and M. Cresti (1994). "Distribution of unesterified and esterified
pectins in cell walls of pollen tubes of flowering plants." Sex Plant Reprod 7(3): 145-
152.

Chapter 1
31
Libertini, E., Y. Li and S. McQueen-Mason (2004). "Phylogenetic Analysis of the Plant
Endo-ß-1,4-Glucanase Gene Family." J Mol Evol 58(5): 506-515.
Loopstra, C. A., A. Mouradov, A. Vivian-Smith, T. V. Glassick, B. V. Gale, S. G.
Southerton, H. Marshall and R. D. Teasdale (1998). "Two Pine Endo-β-1,4-
Glucanases Are Associated with Rapidly Growing Reproductive Structures." Plant
Physiol 116(3): 959-967.
Mbéguié-A-Mbéguié, D., O. Hubert, F. C. Baurens, T. Matsumoto, M. Chillet, B. Fils-
Lycaon and S. Sidibé-Bocs (2009). "Expression patterns of cell wall-modifying genes
from banana during fruit ripening and in relationship with finger drop." J Exp Bot
60(7): 2021-2034.
Micheli, F. (2001). "Pectin methylesterases: cell wall enzymes with important roles in plant
physiology." Trends Plant Sci 6(9): 414-419.
Mohnen, D. (2008). "Pectin structure and biosynthesis." Curr Opin Plant Biol 11(3): 266-277.
Moline, H. E., C. E. LaMotte, C. Gochnauer and A. McNamer (1972). "Further Comparative
Studies of Pectin Esterase in Relation to Leaf and Flower Abscission." Plant Physiol
50(6): 655-659.
O'Neill, M. A., T. Ishii, P. Albersheim and A. G. Darvill (2004).
"RHAMNOGALACTURONAN II: Structure and Function of a Borate Cross-Linked
Cell Wall Pectic Polysaccharide." Annu Rev Plant Biol 55(1): 109-139.
Orfila, C., G. B. Seymour, W. G. T. Willats, I. M. Huxham, M. C. Jarvis, C. J. Dover, A. J.
Thompson and J. P. Knox (2001). "Altered Middle Lamella Homogalacturonan and
Disrupted Deposition of (1→5)-α-l-Arabinan in the Pericarp ofCnr, a Ripening
Mutant of Tomato." Plant Physiol 126(1): 210-221.
Osborne, D. J. (1958). "Changes in the Distribution of Pectin Methylesterase across Leaf
Abscission Zones of Phaseolus vulgaris." J Exp Bot 9(3): 446-457.
Osborne, D. J., J. Henderson and R. H. V. Corley (1992). "Controlling fruit-shedding in the
oil palm." Endeavour 16(4): 173-177.
Østergaard, L., B. Borkhardt and P. Ulvskov (2007). Dehiscence. Annual Plant Reviews
Volume 25: Plant Cell Separation and Adhesion, Blackwell Publishing Ltd: 137-163.
Palusa, S. G., M. Golovkin, S. B. Shin, D. N. Richardson and A. S. Reddy (2007). "Organ-
specific, developmental, hormonal and stress regulation of expression of putative
pectate lyase genes in Arabidopsis." New Phytol 174(3): 537-550.
Pandita, V. and K. Jindal (1991). "Enzymatic and anatomical changes in abscission zone cells
of apple fruits induced by Ethephon." Biol Plant 33(1): 20-25.

Chapter 1
32
Patterson, S. E. (2001). "Cutting Loose. Abscission and Dehiscence in Arabidopsis." Plant
Physiol 126(2): 494-500.
Patterson, S. E. and A. B. Bleecker (2004). "Ethylene-Dependent and -Independent Processes
Associated with Floral Organ Abscission in Arabidopsis." Plant Physiol 134(1): 194-
203.
Pedrolli, D. B., A. C. Monteiro, E. Gomes and E. C. Carmona (2009). "Pectin and Pectinases:
Production, Characterization and Industrial Application of Microbial Pectinolytic
Enzymes." The Open Biotechnology Journal 3: 9-18.
Pelloux, J., C. Rustérucci and E. J. Mellerowicz (2007). "New insights into pectin
methylesterase structure and function." Trends Plant Sci 12(6): 267-277.
Prasanna, V., T. N. Prabha and R. N. Tharanathan (2007). "Fruit Ripening Phenomena–An
Overview." Crit Rev Food Sci Nutr 47(1): 1-19.
Ratner, A., R. Goren and S. P. Monselise (1969). "Activity of Pectin Esterase and Cellulase
in the Abscission Zone of Citrus Leaf Explants." Plant Physiol 44(12): 1717-1723.
Rhee, S. Y., E. Osborne, P. D. Poindexter and C. R. Somerville (2003). "Microspore
Separation in the quartet 3 Mutants of Arabidopsis Is Impaired by a Defect in a
Developmentally Regulated Polygalacturonase Required for Pollen Mother Cell Wall
Degradation." Plant Physiol 133(3): 1170-1180.
Rival, A. (2007). Oil Palm. Biotechnology in Agriculture and Forestry, Springer-Verlag
Berlin Heidelberg. 61: 59-80.
Roberts, J. and Z. Gonzalez-Carranza (2007). Cell Separation and Adhesion Processes in
Plants. Annual Plant Reviews Volume 25: Plant Cell Separation and Adhesion,
Blackwell Publishing Ltd: 1-7.
Roberts, J. A., K. A. Elliott and Z. H. Gonzalez-Carranza (2002). "Abscission, Dehiscence,
and Other Cell Separation Processes." Annu Rev Plant Biol 53(1): 131-158.
Rodrigues, M., N. Peiriço, H. Matos, E. Gomes de Azevedo, M. R. Lobato and A. J. Almeida
(2004). "Microcomposites theophylline/hydrogenated palm oil from a PGSS process
for controlled drug delivery systems." J Supercrit Fluids 29(1-2): 175-184.
Sexton, R. and J. A. Roberts (1982). "Cell Biology of Abscission." Ann Rev Plant Physio
33(1): 133-162.
Sheehy, R. E., M. Kramer and W. R. Hiatt (1988). "Reduction of polygalacturonase activity
in tomato fruit by antisense RNA." Proc Natl Acad Sci USA 85(23): 8805-8809.

Chapter 1
33
Smith, C. J. S., C. F. Watson, J. Ray, C. R. Bird, P. C. Morris, W. Schuch and D. Grierson
(1988). "Antisense RNA inhibition of polygalacturonase gene expression in
transgenic tomatoes." Nature 334(6184): 724-726.
Stenvik, G.-E., N. M. Tandstad, Y. Guo, C.-L. Shi, W. Kristiansen, A. Holmgren, S. E. Clark,
R. B. Aalen and M. A. Butenko (2008). "The EPIP Peptide of INFLORESCENCE
DEFICIENT IN ABSCISSION Is Sufficient to Induce Abscission in Arabidopsis
through the Receptor-Like Kinases HAESA and HAESA-LIKE2." Plant Cell 20(7):
1805-1817.
Sterling, J. D., H. F. Quigley, A. Orellana and D. Mohnen (2001). "The Catalytic Site of the
Pectin Biosynthetic Enzyme α-1,4-Galacturonosyltransferase Is Located in the Lumen
of the Golgi." Plant Physiol 127(1): 360-371.
Sun, L. and S. van Nocker (2010). "Analysis of promoter activity of members of the
PECTATE LYASE-LIKE (PLL) gene family in cell separation in Arabidopsis." BMC
Plant Biol 10(1): 152.
Swain, S., P. Kay and M. Ogawa (2011). "Preventing unwanted breakups: using
polygalacturonases to regulate cell separation." Plant Signal Behav 6(1): 93-97.
Tan, K. T., K. T. Lee, A. R. Mohamed and S. Bhatia (2009). "Palm oil: Addressing issues
and towards sustainable development." Renew Sust Energ Rev 13(2): 420-427.
Taylor, J. E., G. A. Tucker, Y. Lasslett, C. J. S. Smith, C. M. Arnold, C. F. Watson, W.
Schuch, D. Grierson and J. A. Roberts (1990). "Polygalacturonase expression during
leaf abscission of normal and transgenic tomato plants." Planta 183(1): 133-138.
Taylor, J. E., S. T. J. Webb, S. A. Coupe, G. A. Tucker and J. A. Roberts (1993). "Changes in
Polygalacturonase Activity and Solubility of Polyuronides during Ethylene-stimulated
Leaf Abscission in Sambucus nigra." J Exp Bot 44(1): 93-98.
Taylor, J. E. and C. A. Whitelaw (2001). "Signals in abscission." New Phytol 151(2): 323-
340.
Tian, G.-W., M.-H. Chen, A. Zaltsman and V. Citovsky (2006). "Pollen-specific pectin
methylesterase involved in pollen tube growth." Dev Biol 294(1): 83-91.
Trainotti, L., N. Rascio and G. Casadoro (1993). "Expression of an endopolygalacturonase
gene during growth and abscission of peach fruits." Hereditas 119(3): 301-304.
Trainotti, L., S. Spolaore, L. Ferrarese and G. Casadoro (1997). "Characterization of ppEG1,
a member of a multigene family which encodes endo-β-1,4-glucanase in peach." Plant
Mol Biol 34(5): 791-802.

Chapter 1
34
Tucker, M. L., R. Sexton, E. del Campillo and L. N. Lewis (1988). "Bean Abscission
Cellulase : Characterization of a cDNA Clone and Regulation of Gene Expression by
Ethylene and Auxin." Plant Physiol 88(4): 1257-1262.
Tucker, M. L., C. A. Whitelaw, N. N. Lyssenko and P. Nath (2002). "Functional Analysis of
Regulatory Elements in the Gene Promoter for an Abscission-Specific Cellulase from
Bean and Isolation, Expression, and Binding Affinity of Three TGA-Type Basic
Leucine Zipper Transcription Factors." Plant Physiol 130(3): 1487-1496.
Uheda, E. and S. Nakamura (2000). "Abscission of Azolla Branches Induced by Ethylene and
Sodium Azide." Plant Cell Physiol 41(12): 1365-1372.
Valdovinos, J. G. and R. M. Muir (1965). "Effects of D and L Amino Acids on Foliar
Abscission." Plant Physiol 40(2): 335-340.
Wakabayashi, K., J.-P. Chun and D. J. Huber (2000). "Extensive solubilization and
depolymerization of cell wall polysaccharides during avocado (Perseaamericana)
ripening involves concerted action of polygalacturonase and pectinmethylesterase."
Physiol Plant 108(4): 345-352.
Wakabayashi, K., T. Hoson and D. J. Huber (2003). "Methyl de-esterification as a major
factor regulating the extent of pectin depolymerization during fruit ripening: a
comparison of the action of avocado (Persea americana) and tomato (Lycopersicon
esculentum) polygalacturonases." J Plant Physiol 160(6): 667-673.
Wen, F., Y. Zhu and M. C. Hawes (1999). "Effect of Pectin Methylesterase Gene Expression
on Pea Root Development." Plant Cell 11(6): 1129-1140.
Willats, W. G. T., L. McCartney, W. Mackie and J. P. Knox (2001a). "Pectin: cell biology
and prospects for functional analysis." Plant Mol Biol 47(1): 9-27.
Willats, W. G. T., C. Orfila, G. Limberg, H. C. Buchholt, G.-J. W. M. van Alebeek, A. G. J.
Voragen, S. E. Marcus, T. M. I. E. Christensen, J. D. Mikkelsen, B. S. Murray and J.
P. Knox (2001b). "Modulation of the Degree and Pattern of Methyl-esterification of
Pectic Homogalacturonan in Plant Cell Walls." J Biol Chem 276(22): 19404-19413.
Willats, W. T., L. McCartney, C. Steele-King, S. Marcus, A. Mort, M. Huisman, G.-J.
Alebeek, H. Schols, A. J. Voragen, A. Goff, E. Bonnin, J.-F. Thibault and J. P. Knox
(2004). "A xylogalacturonan epitope is specifically associated with plant cell
detachment." Planta 218(4): 673-681.
Wolf, S., G. Mouille and J. Pelloux (2009). "Homogalacturonan Methyl-Esterification and
Plant Development." Mol Plant 2(5): 851-860.
Yusoff, S. (2006). "Renewable energy from palm oil - innovation on effective utilization of
waste." J Clean Prod 14(1): 87-93.

Chapter 1
35
Zhang, G. F. and L. A. Staehelin (1992). "Functional Compartmentation of the Golgi
Apparatus of Plant Cells : Immunocytochemical Analysis of High-Pressure Frozen-
and Freeze-Substituted Sycamore Maple Suspension Culture Cells." Plant Physiol
99(3): 1070-1083.

*This chapter was submitted for publication to the Journal of Experimental Botany on
November 1, 2011 and is currently under review. 36
Chapter 2. Temporal and Spatial Expression of
Polygalacturonase Gene Family Members Reveals Complex
Regulation During Fleshy Fruit Ripening and Abscission of the
Monocot Oil Palm*
Chapter 2
37
Introduction
The shedding of plant organs is a highly coordinated developmentally programmed
event that can occur in different contexts throughout the plant life cycle (Addicott 1982;
Sexton and Roberts 1982; Roberts et al. 2002; Leslie et al. 2007). Organ shedding is
important for both plant vegetative and reproductive development, including abscission of
leaves, branches, whole flowers, floral parts, seeds and immaturely aborted or ripe fruit. In
particular, cell separation that occurs during fleshy fruit abscission and dry fruit dehiscence
facilitate seed dispersal, the final stage of reproductive development, and are important
characters to control the abscission for many crop species. For fruit to be shed, cell separation
must occur in a precise location timed for optimize dispersal under the most favourable
conditions. For crop species, if fruit are shed too early or too late, economic consequences
can be significant. Whereas our understanding of the evolutionary context for these
phenomenon are mainly limited to model systems such as tomato and Arabidopsis, less is
known about the mechanisms underlying fruit abscission in non-model crop species in
general and, monocot species in particular.
Oil palm is a tropical perennial monocotyledonous species in the Arecaceae family
with an extraordinarily oil-rich fleshly mesocarp, which is the number one source of edible
vegetable oil worldwide. In addition, potential use of palm oil as a biofuel is predicted to
cause constraints on the worldwide supply of edible palm oil and increase the pressure for
higher yields and an expansion of cultivatable areas. While conventional breeding schemes
have allowed increases in yield of palm oil up to 1% per year, non-synchronized ripening and
subsequent shedding of the ripest fruit before harvest limit yield gains (Osborne et al. 1992;
Rival 2007). In addition, the difficulty to schedule regular harvests due to non-synchronized
fruit shedding results in a labour intensive logistics that increases overall production costs.
Furthermore, several original characters of oil palm fruit shedding warrant further detailed

Chapter 2
38
investigations. Namely, a two-stage process involving primary and adjacent abscission zones
(AZs), the extraordinary low amount of methylated pectin and high levels of
polygalacturonase (PG) activity suggest that divergent mechanisms may underlie the cell
separation that leads to fruit shedding in this monocotyledonous species (Henderson and
Osborne 1990; Henderson and Osborne 1994; Henderson et al. 2001a). Finally, the only
organ observed to shed in this palm species is the ripe fruit. Notably, flowers and immature
fruitlets from many species are naturally thinned by organ abscission in response to
nutritional status to optimized reproductive success, whereas this phenomenon is not
observed to any extent in oil palm. Indeed, the oil palm maintains all fruit on a bunch until
ripening related signalling takes place to induce ripe fruit abscission.
While examples of organ shedding in plants are diverse, the common model proposed
is mainly based on studies with dicotyledons (Roberts et al. 2002; Leslie et al. 2007). Firstly,
the development of the AZ takes place at the base of subtending organ to be shed. Secondly,
as the AZ develops, it must become competent for cell separation events required for organ
abscission. Indeed, once the AZ develops, it responds differently from adjacent tissues to the
signals that induce cell separation (Taylor and Whitelaw 2001). After the AZ becomes
competent for separation to be induced, cellular activity, in particular the expansion of the
golgi vesicles and activation of the endomembrane system with the release of hydrolytic
enzymes to the apoplast leads to the degradation of the middle lamella that leads to cell
separation. An important feature of the model is the induction of the genes encoding cell wall
hydrolytic enzymes targeted to modify and degrade cell wall components for separation to
occur. The expression of these genes are often induced by ethylene and inhibited by auxin,
characteristics that correlate with the positive and negative effects of these hormones on the
abscission process respectively (Addicott 1982; Roberts et al. 2002; Leslie et al. 2007).
Despite the central importance of the mechanisms that allow changes in adhesion of adjacent

Chapter 2
39
cells to take place with such temporal and spatial precision, our understanding of these events
even in model organisms is limited.
PG gene expression and activity are common features of organ abscission, observed in
bean, tomato, peach and Sambucus nigra (Berger and Reid 1979; Tucker et al. 1984; Bonghi
et al. 1992; Taylor et al. 1993). PG activity depolymerises the homogalacturonan backbone
of pectin and while PG transcripts and activity increase in various species during the
abscission process, they can also be induced by ethylene or inhibited by auxin (Giovannoni et
al. 1989; Taylor et al. 1990; Bonghi et al. 1992; Taylor et al. 1993; Kalaitzis et al. 1995;
Kalaitzis et al. 1997; Hadfield and Bennett 1998; Hadfield et al. 1998). In tomato, there is a
single PG transcript (pTOM6, also known as TFPG) expressed during fruit ripening, while up
to four other PGs (TAPG1, TAPG2, TAPG4 and TAPG5) are expressed in the flower/fruit
pedicel AZ associated with abscission (Dellapenna et al. 1986; Sheehy et al. 1988; Smith et
al. 1988; Dellapenna et al. 1989; Kalaitzis et al. 1995; Kalaitzis et al. 1997; Hong and Tucker
1998; Sitrit and Bennett 1998). Interestingly, the down-regulation or knockout of TFPG
resulted in a decrease in pectin depolymerization, but surprisingly no change in fruit
softening which suggests other components are involved (Sheehy et al. 1988; Smith et al.
1988; Smith et al. 1990; Cooley and Yoder 1998). Furthermore, down regulation of fruit
TFPG has no effect on the timing or rate of leaf abscission, indicating a specific function of
this enzyme during fruit ripening but not organ abscission (Taylor et al. 1990). In contrast,
silencing of the abscission TAPG1 expression delayed abscission and increased break
strength of the AZ (Jiang et al. 2008). Overall, these experiments suggest that while PGs are
important for processes during both ripening and abscission, the same genes may not be
responsible and there are other factors involved in abscission. Indeed, there are up to 69 and
59 PG genes in Arabidopsis and rice respectively, many with overlapping expression
domains (Kim and Patterson 2006; Gonzalez-Carranza et al. 2007). At least four of the
Chapter 2
40
Arabidopsis PG genes have expression profiles correlated to cell wall loosening and cell wall
dissolution events during floral organ abscission (Kim and Patterson 2006). Furthermore,
ADPG1, ADPG2 and QRT2 were shown to have overlapping functions during different cell
separation processes. ADPG1 and ADPG2 are essential for silique dehiscence, while ADPG2
and QRT2 contribute to floral organ abscission, and all three genes contribute to anther
dehiscence, suggesting precise combinations of PG activities may be necessary during the
cell separation events underlying these different processes.
A previous study revealed a large increase in PG activity in the oil palm AZ in the
base of the fruit during cell separation events that lead to fruit abscission (Henderson et al.
2001a). Our main objective in the present study was to identify PG genes that could be
responsible for this activity observed during fruit shedding. We have performed a detailed
expression analysis of 14 genes that encode PGs from diverse phyologenetic clades, and that
are expressed in the base of the oil palm fruit. PG diversity in the fruit tissues and there
profiles of expression during ripening and during ethylene induced abscission contrasts with
that observed in tomato suggesting some functional divergence underlying these processes in
this monocotyledon fruit species. The results of a phylogenetic analysis of EgPG4 with PGs
with known functions from various species will also be discussed with relation to divergence
that may have occurred between eudicots and monocots, in particular between fleshy and dry
fruit species.
Chapter 2
41
Results
Ethylene induced oil palm fruit shedding experimental system
Previous studies published on oil palm fruit shedding were done with material
transported by airfreight from plantations in Malaysia to a laboratory in the United Kingdom
where the experiments were performed (Henderson and Osborne 1990; Henderson and
Osborne 1994; Henderson et al. 2001a). In order to determine precisely the timing of events
that occur during abscission, our first objective was to set up an experimental system that
could be used in a local field setting to eliminate problems that could arise due to the time
and conditions required for storage and long distance shipment of the fruit. Based on the
results of earlier studies with oil palm, ethylene was implicated as the main signal that
induces cell separation in the primary AZ of the oil palm fruit (Henderson and Osborne
1994). Therefore, to synchronize fruit shedding, we treated spikelet explants with ethylene in
airtight boxes (see Material and Methods for details; Figure 2.1A). The first experiment
examined the ethylene dose effect on the induction of cell separation in the primary AZ of
ripe fruit (150 days after pollination, DAP) treated for 12 h (Figure 2.1B). An increase in the
number of fruit shed (13%) was observed in spikelets treated with 0.1 µl l-1
ethylene, while at
10 µl l-1
, 100% of the fruit underwent cell separation in the primary AZ. This experiment
confirmed the use of 10 µl l-1
as an effective concentration for our studies as used previously
(Henderson and Osborne 1994). In addition, the experiment also confirmed the two-stage
separation process (data not shown) during which separation first occurs within the
predetermined primary AZ, followed later by separation events in adjacent AZs (Henderson
and Osborne 1990; Henderson and Osborne 1994). Further experiments used the
concentration of 10 µl l-1
to compare separation in fruit at different stages of development
(Figure 2.1C). Spikelets of fruit at 30, 120 and 180 DAP were treated and shedding was
quantified at time intervals up to 24 h after of treatment. No fruit were observed to shed at 3

Chapter 2
42
and 6 h. Fruit at 30 DAP were only observed to shed after 24 hours of treatment, while 120
DAP fruit and 180 DAP fruit began to separate after 12 h and 9 h of treatment respectively.
In air controls, only the 180 DAP fruit were observed to shed at 12 h (1%) and 24 h (100%).
These experiments define the time frame during which cell separation must occur for oil
palm fruit shedding to take place, and suggest importance of developmental factors that
influence the response to ethylene.
Polygalacturonase gene family expression in the oil palm fruit tissues and the
identification of the EgPG4 transcript induced in the abscission zone prior to fruit
shedding
A 35-fold increase in PG activity was reported to occur in the AZ during fruit
shedding (Henderson et al. 2001a). Furthermore, PGs are implicated in cell separation
underlying organ separation in many species. In this context, our next objective was to
identify PG candidate genes responsible for this large PG activity observed during cell
separation events in the AZ. Briefly, our approach involved searches of available databases
for sequences similar to known PGs, including local 454 derived transcriptome data; then
followed by designing specific primers for each sequence identified to test, along with
degenerate primers, for amplification from a mixture of cDNAs derived from fruit tissues
treated or not with ethylene, or from genomic DNA (see Materials and Methods for details).
Overall, our searches resulted in the identification of 35 putative non-redundant PG
sequences, 28 of which contained either a partial or complete GH28 PG signature domain and
were retained for further studies (see Supplementary Table S2.3 for nucleotide sequences).
From the 28 sequences, RT-PCR analysis revealed that 14 non-redundant PG transcripts were
expressed in the AZ of oil palm fruit and a detailed analysis of their expression in fruit tissues
during ethylene induced abscission was performed. The 14 transcripts are EgPG1, EgPG3,

Chapter 2
43
EgPG4, EgPG7, EgPG8, EgPG9, EgPG10, EgPG11, EgPG16, EgPG17, EgPG18, EgPG19,
EgPG22 and EgPG26.
To analyze expression, qPCR analysis was performed with tissue samples from the
ethylene experiments described above (Figure 2.1C). The results confirmed the RT-PCR
analysis in that each of the 14 primer pairs successfully amplified a PG sequence from the oil
palm fruit AZ, and also from the adjacent pedicel or mesocarp tissues before and after
ethylene treatment (Figure 2.2A-N). The profiles of transcript abundance can be grouped into
the following three main categories: I) five transcripts increase significantly (more than two
fold; Figure 2.2A-E), II) four transcripts decrease significantly (less than 0.5 fold; Figure
2.2F-I) and, III) five transcripts have no significant change in abundance in the AZ during
ethylene treatments (Figure 2.2J-N) respectively. By far the most abundant PG transcript
detected with the most dramatic increase in abundance in the AZ is that of EgPG4 (Fig 2B
and Figure 2.3). EgPG4 transcript increases approximately 700, 2000, 4000 and 5000 fold in
the AZ after 3, 6, 9 and 12 h of ethylene treatment respectively. In contrast, EgPG4 is also
highly expressed in the mesocarp sampled from the upper portion of the untreated fruit, but
only increases 10, 5, 36 and 13 fold after 3, 6, 9 and 12 h of ethylene treatment respectively
(Figure 2.2B and Figure 2.3). Finally, EgPG4 is faintly detectable in pedicel tissue before
ethylene treatment, and increases at a lower magnitude during the ethylene treatments
compared to that observed in the AZ.
An overview of PG gene expression reveals that the three adjacent fruit tissues
respond differently to the ethylene treatments (Figure 2.3). In the upper portion of the
mesocarp of untreated 180 DAP fruit, the EgPG4 transcript represents 95% of the total PG
transcript detected, while increases to 99% after 6h of ethylene treatment (Figure 2.3). In
contrast, in the AZ of fruit prior to ethylene treatment, EgPG11 is the most abundant (43%)
followed by EgPG10 (15%) and EgPG8 (10%) and EgPG18 (10%), whereas EgPG4,

Chapter 2
44
represented only 4% of the total PG transcript detected. By contrast, EgPG4 accounts for
99% of the PG transcript in the AZ after 6 h of ethylene treatment. In the pedicel, EgPG10
(62%) and EgPG11 (19%) are the most abundant PG transcripts after 6 h ethylene treatment,
while the EgPG4 transcript accounts for only 7% and 4% total transcript in untreated and
ethylene treated fruit respectively.
Our findings indicate that EgPG4, the most abundant PG transcript detected, is
spatially and temporally differentially regulated in the three adjacent fruit tissues examined.
Indeed, EgPG4 accounts for the majority of the total PG transcript detected in the mesocarp,
and more notably undergoes a dramatic increase in abundance preferentially in the AZ, that
correlates with the onset of separation observed by 9 h of ethylene treatment (Figure 2.1C).
During our ethylene experiments, we observed that 30 and 120 DAP fruit do not separate
without treatment with ethylene (control treatments in air in the presence of ethylene
absorbing material), while in the presence of ethylene first separate after 12 h and 24 h
respectively, and only after 24 h of ethylene treatment are the majority of the fruit shed
(Figure 2.1C). By contrast, the 180 DAP fruit treated with air in the presence of ethylene
absorbing material (control treatments) will begin to undergo cell separation after 12 h and
will completely separate after 24 h (Figure 2.1C). To determine whether EgPG transcript
accumulation correlates with these observations, we examined the expression of EgPG4 in
30, 120 and 180 DAP fruit in the presence or absence of ethylene (Figure 2.1 C and Figure
2.4). The results reveal a close correlation to the expression of EgPG4 with the timing of
shedding of 30, 120 and 180 DAP fruit. Indeed, EgPG4 has very low relative expression in
untreated 30 and 120 DAP fruit compared to 180 DAP, and after 3 h of ethylene treatment,
the increase is 2,400 fold in the 180 DAP fruit compared to only 2.5 fold and 17 fold in the
30 and 120 DAP fruit, respectively. After 6 h, EgPG4 transcript increases 0.70, 260 and
6,803 fold in 30, 120 and 180 DAP fruit, respectively, while after 9 h of ethylene treatment,

Chapter 2
45
the EgPG4 transcript is increased 143, 350 and 14,200 in 30, 120 and 180 DAP fruit,
respectively.

Chapter 2
46
Figure 2.1. (A) Experimental system used for ethylene-induced fruit shedding experiments.
(B) Dose response of ripening fruit (150 days after pollination, DAP) treated with a selected
concentration range of ethylene for 12 h. C, Ethylene time course treatment of oil palm fruit
spikelets at contrasting stages of development (DAP 30, 120, and 180). To test for separation,
fruits were subjected to light pressure and separation in the primary zone was recorded. For
30 DAP samples, n = > 200, for 120 DAP samples n = > 90 and for 150 DAP samples n = >
80 per time point/treatment respectively. Experiments were performed twice during 2010 and
once during 2011 for three biological repetitions with comparable results.
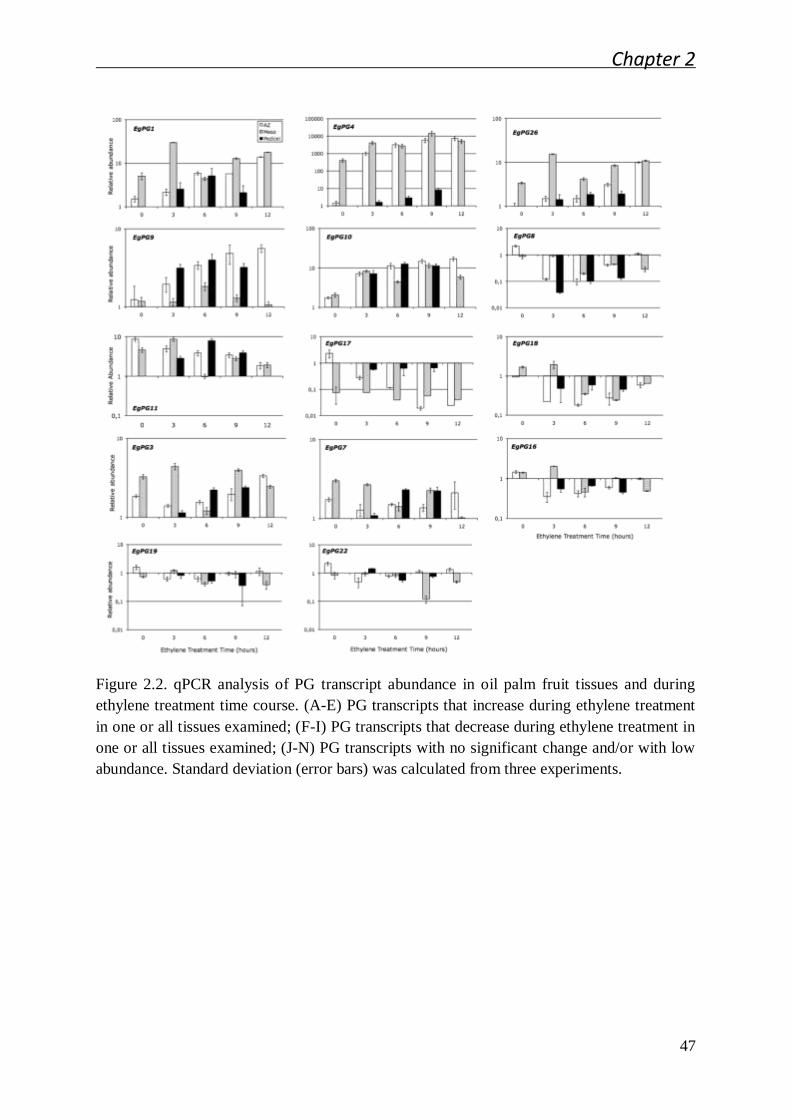
Chapter 2
47
Figure 2.2. qPCR analysis of PG transcript abundance in oil palm fruit tissues and during
ethylene treatment time course. (A-E) PG transcripts that increase during ethylene treatment
in one or all tissues examined; (F-I) PG transcripts that decrease during ethylene treatment in
one or all tissues examined; (J-N) PG transcripts with no significant change and/or with low
abundance. Standard deviation (error bars) was calculated from three experiments.

Chapter 2
48
Figure 2.3. The percentage contribution of individual PG family members to total expression
in the AZ, mesocarp and pedicel of the oil palm fruit in untreated and six-hour ethylene
treated fruit. Data were calculated from the expression values shown in Figure 2.2. Standard
error is in Supplementary Table S2.4. Scale bar 1 cm.

Chapter 2
49
Figure 2.4. qPCR analysis of EgPG4 transcript abundance in the AZ of fruit treated for
different time periods with ethylene (10 µl l-1
) or air. Standard deviation (error bars) was
calculated from three experiments.
EgPG4
0
50
100
150
200
0 3 6 9Ethylene Treatment T ime (hours)
Rela
tive A
bundance
A Z 30 DA P ethylene
A Z 30 DA P air
EgPG4
0
100
200
300
400
500
0 3 6 9Ethylene Treatment T ime (hours)
Rela
tive A
bundance
A Z 120 DA P ethylene
A Z 120 DA P air
EgPG4
0
5000
10000
15000
20000
0 3 6 9Ethylene Treatment T ime (hours)
Rela
tive A
bundance
A Z 180 DA P ethylene
A Z 180 DA P air
Chapter 2
50
In situ analysis of the spatial and temporal expression of EgPG4 during ethylene
induced fruit shedding
Whereas the qPCR analysis of EgPG4 transcript accumulation correlates well with
the timing of cell separation events that occur in the base of the oil palm fruit, the AZ
samples that were used for the gene analysis include a mixture of all three tissues including
the AZ and the margins of the adjacent pedicel and mesocarp tissues (Figure 2.5). To
examine whether both the temporal and spatial expression of EgPG4 correlates with the cell
separation events in the AZ that lead to fruit shedding, in situ hybridization analysis was
performed. Firstly, we used a combination of bright field, polarized light and epifluorescence
microscopy to clearly distinguish the localization of the EgPG4 transcript within the AZ
cells, compared to the adjacent mesocarp and pedicel tissues (Figure 2.5A-J). With polarized
light, the AZ cell layers are well defined in addition to the lignified vasculature in all the
tissues (Figure 2.5E-G). In contrast, epifluorescence microscopy mainly detected the lignified
vasculature, predominantly in the pedicel and the mesocarp and only at the lower
magnifications (Figure 2.5H-J). In the base of ripe fruit before ethylene treatment, EgPG4
transcript was neither detected in the AZ, nor the lower margin of the mesocarp or upper
margin of the pedicel tissues (Figure 2.5A, E, H). By 6 h after ethylene treatment, the EgPG4
transcript increased in abundance preferentially in the AZ cell layers, including the
parenchyma cells and the undifferentiated xylem cells of the vascular bundles (Figure 2.5B,
F, I). By contrast, no EgPG4 transcript was detected or was only present in relatively lower
amounts in the adjacent pedicel and mesocarp tissues, or in the central cells of the vascular
strands within the AZ. At higher magnification of the boundary region between the pedicel
and the AZ, the EgPG4 transcript clearly accumulates in the AZ cells while remains at very
low or undetectable amounts in the adjacent pedicel cells (Figure 2.5C, G, J, G). In contrast,
the control hybridizations with ribosomal RNA (rRNA) revealed an even distribution of

Chapter 2
51
rRNA throughout the pedicel, AZ and mesocarp tissues (Figure 2.5D). As a comparison, in
situ hybridization experiments were also performed with EgPG10 and EgPG8, the former of
which is shown by qPCR analysis to increase similarly in all three tissues, while the later
decreases during the ethylene treatments (Figure 2.2E and F). For EgPG10, the results
showed an even distribution of transcript present in the three tissues after ethylene treatment,
while EgPG8 was not detected (data not shown). Together, these results corroborate the
correlation between the spatial and temporal expression profile of the EgPG4 transcript in
relation to ethylene and cell separation observed by qPCR, and provides further evidence for
an important function for this transcript during fruit abscission.
Phylogenetic analysis of EgPG4 with relation to polygalacturonases with known
functions
To examine the relationship of EgPG4 and plant PGs, a phylogenetic comparison of
its amino acid sequence with those from Arabidopsis and rice was performed. Firstly, EgPG4
groups within the PG clade A3 formed with members from both rice and Arabidopsis
previously defined (Kim and Patterson 2006) (see supplementary data Figure S2.1). Notably,
EgPG4 does not group with the PGs from Arabidopsis in clade A15 shown to function during
floral organ abscission, silique or anther dehiscence including At2g41850
(PGAZAT/ADPG2), At3g07970 (QUARTET2), and At3g57510 (PGDZAT/ADPG1) (Kim
and Patterson 2006; Gonzalez-Carranza et al. 2007; Ogawa et al. 2009). However, EgPG4 is
grouped in the A3 clade with two other Arabidopsis PGs (At2g43880 and At2g43890) that
are expressed during floral organ abscission (Kim and Patterson 2006).

Chapter 2
52
Figure 2.5. In situ localization of EgPG4 transcripts in the fruit base containing the AZ. (A-
C) Longitudinal sections of the fruit base were hybridized with digoxigenin-labelled
antisense RNA fragments of EgPG3 and (D) the 18S ribosome and expression is observed as
a blue coloring using bright field microscopy. Sections were made from fruit prior to ethylene
treatment (A, E, H) and after 6 h of ethylene treatments (B-D, F, G, I, J). (E-G) Sections were
also observed using polarized light and (H-J) epiflourescence microscopy to distinguish the
AZ from the adjacent pedicel (P) and mesocarp (M) tissues.
Chapter 2
53
To examine possible structure function relationships of the EgPG4 amino acid
sequence with those of known PGs from a variety of species, including those from fleshy
fruit (apple, plum, peach, tomato, kiwi, grape, papaya), and dry fruit (soybean, B. napus,
Arabidopsis), a phylogenetic analysis was performed with selected plant PGs with expression
associated with or shown to function during germination, root or pollen development, fruit
ripening, organ abscission, and anther and pod dehiscence (Dellapenna et al. 1986; Sheehy et
al. 1988; Smith et al. 1988; Atkinson 1994; Lester et al. 1994; Tebbutt et al. 1994; Kalaitzis
et al. 1995; Jenkins et al. 1996; Petersen et al. 1996; Kalaitzis et al. 1997; Hadfield et al.
1998; Hong and Tucker 1998; Sitrit and Bennett 1998; Jenkins et al. 1999; Sitrit et al. 1999;
Wang et al. 2000; Degan et al. 2001; Sander et al. 2001; Gonzalez-Carranza et al. 2002;
Hayama et al. 2006; Kim et al. 2006; Murayama et al. 2006; Sekine et al. 2006; Gonzalez-
Carranza et al. 2007; Tucker et al. 2007; Deytieux-Belleau et al. 2008; Fabi et al. 2009;
Huang et al. 2009a; Huang et al. 2009b; Ogawa et al. 2009; Tacken et al. 2010). Firstly, the
reconstructed tree and bootstrap values confirm earlier analyses that PGs can be separated
into three major subclades, two that consist of PGs involved in fruit ripening and abscission
and one with PGs involved in pollen development (Hadfield and Bennett 1998; Hadfield et
al. 1998) (Figure 2.6). The presence of a fourth clade containing soybean
(GmPG6_DQ382356) and grape (VvPG2_EU078975) PGs supports more recent studies that
indicate this gene family consists of more than three subclades (Torki et al. 2000; Deytieux-
Belleau et al. 2008). In addition, the bootstrap analysis confirms a close phylogenetic
relationship between EgPG4 and two Arabidopsis PGs expressed during floral organ
abscission (Kim and Patterson 2006). Notably, in the same subclade there are also four
abscission related tomato PGs (TAPG1, TAPG2, TAPG4 and TAPG5) in addition to two PGs
associated with ripening and abscission of melon (CmPG1 and CmPG2), and PGs expressed
during ripening of papaya (CpPG), pear (PcPG3) and peach (PpPRF5). An additional
Chapter 2
54
Arabidopsis PG (At2g43860) that functions in cell separation between endosperm cells when
the radicle emerges during germination was also found within this subclade. The analysis
also revealed that the Arabidopsis PGs involved in abscission or dehiscence including
PGDZAT, PGAZAT, and QTR2, are grouped within a distinct subclade with other PGs that
function during fruit ripening, floral organ abscission and pod dehiscence. Notably, no PG
involved in abscission of a fleshy fruit is found in this clade, only those from species with dry
fruit such as Arabidopsis, B. napus and soybean.

Chapter 2
55
Figure 2.6. Phylogenetic analysis of EgPG4 and selected plant PGs from clade A with known
functions using the neighbor-joining method based on multiple alignment of the sequences
containing the GH28 domain. The endo-PG ErPeh1 from Erwinia carotovora was used as a
root. Numbers on the branches are bootstrap values for 100 replicates. The black asterisks at
bootstrap values indicate branch points of the four PG subclades.

Chapter 2
56
Discussion
The sequence and expression analysis of EgPG4 suggest functional conservation and
divergence between monocots and eudicots
PGs are thought to play a central role in the disassembly of pectin in the middle
lamella or primary cell wall during cell separation and cell elongation (Hadfield and Bennett
1998). In particular, PGs have been extensively studied during fruit ripening, organ
abscission and pollen development, yet how divergence has occurred between species and to
fulfil different roles in these various tissues is still not completely understood. In particular,
very little data is available from monocot species to compare the ripening and abscission
processes with those of eudicots.
The phylogenetic and bootstrap analysis confirmed several previous phylogenetic
analysis that showed PGs involved in organ abscission and fruit ripening are found mainly in
two distinct subclades, with a third subclade containing only pollen related PGs (Hadfield and
Bennett 1998; Hadfield et al. 1998; Kim and Patterson 2006; Gonzalez-Carranza et al. 2007).
A fourth minor subclade that contained a PG from ripening grape skin was also observed as
previously (Deytieux-Belleau et al. 2008). While the current phylogenetic analysis was done
with the complete GH28 domain, not including the prosequences characteristic of some PGs,
the results support a previous conclusion that the presence or lack of prosequences are not the
basis for the divergence of these sequences into distinct clades (Hadfield and Bennett 1998).
The first notable observation is that all the tomato abscission PGs known group closely
within a subclade that also contains the two closely related Arabidopsis floral organ
abscission associated PGs (At2g43890 and At2g43880), in addition to an Arabidopsis PG
(At2g43860) implicated in radicle emergence (Kim and Patterson 2006; Gonzalez-Carranza
et al. 2007). The presence of At2g43860 that functions during separation of endosperm cells
when the radicle emerges during germination, suggests structural relationships between PGs
Chapter 2
57
with functions beyond fruit ripening and organ abscission. Notably, EgPG4 groups closest
with these Arabidopsis abscission PGs, which suggests functional conservation, and that
these sequences are derived from a common ancestral PG prior to the separation of monocots
and eudicots. A second notable observation is that the tomato fruit PG (TFPG) is more
closely associated with the abscission and dehiscence PGs than the tomato PGs involved in
organ abscission. This contrasts with sequences from melon that are in the same subclade
with the tomato abscission PGs, and have expression profiles associated with both fruit
ripening and abscission (Hadfield et al. 1998). Similarly, the EgPG4 transcript does not only
increase in the AZ in relation to abscission, but also is highly expressed in the portion of the
ripening mesocarp. Together, it appears that some PGs may function both in ripening fruit
tissues, in addition to during cell separation in the AZ that leads to fruit organ abscission in
monocots and eudicots. Our data also indicate that the regulation of EgPG4 is closely
associated with the capacity for cells to respond to ethylene, related to the developmental
stage of ripening, and may be an important mechanism to control the spatial and temporal
functionality of EgPG4 during mesocarp ripening and cell separation in the AZ. Indeed, the
mesocarp produces an increasing amount of ethylene as development progresses, was found
to progress from the apex to the fruit base, and was proposed that an increase just above the
AZ provides the signal for the initiation of the separation events (Henderson and Osborne
1994; Tranbarger et al. 2011).
The sequence and expression of EgPG4 suggest functional divergence between dry and
fleshy fruit
Another notable observation is that PGs related to fleshy fruit abscission are not found
within the clade containing the well-characterized abscission and/or dehiscent related PGs
including QRT2, PGAZAT, PGDZAT, BnRDPG1 and PGAZBRAN (Gonzalez-Carranza et

Chapter 2
58
al. 2002; Ogawa et al. 2009). By contrast, PGs involved in fleshy fruit ripening, such as the
tomato (TFPG), grape (VvPG1), apple (MdPG1), kiwi (CkPGA3) and pear (PcPG1) are also
found within this clade (Dellapenna et al. 1986; Sheehy et al. 1988; Smith et al. 1988;
Atkinson 1994; Sitrit and Bennett 1998; Wang et al. 2000; Murayama et al. 2006; Sekine et
al. 2006; Deytieux-Belleau et al. 2008; Tacken et al. 2010). In addition, only the melon PG
(CmPG3) that has a profile related to ripening is found in the same subclade as the dry fruit
dehiscence and abscission PGs, while the other two melon PGs (CmPG1 and CmPG2)
associated with organ abscission and ripening are in the same subclade as EgPG4 (Hadfield et
al. 1998). While there is no current data that suggests that the fleshy fruit PGs within this
subclade are involved in fruit or other organ abscission processes, it is possible their
involvement in cell separation during organ abscission has not but sufficiently investigated.
Indeed, the analysis and results discussed here are based on the two best-characterized organ
abscission model systems available, including tomato and Arabidopsis, and indicate a
limitation of our current status to evaluate the functional diversity of plant PGs. Nevertheless,
the results suggest that dry fruit species appear to have PGs from at least two distinct
subclades involved in cell separation for dehiscence, while fleshy fruit may have PGs
specialized in ripening or abscission, or, that may function in both contexts. Overall, the
results suggest that divergence may have occurred between PGs involved in dry fruit
dehiscence and fleshy fruit abscission, which merits further investigations.
The high expression and induction of EgPG4 by ethylene suggests functions during both
fruit ripening and abscission
Studies on fruit ripening and floral pedicel abscission of tomato provide examples of
how individual members of this gene family may have distinct functions in adjacent tissues
undergoing cell separation processes in a fleshy fruit species, and highlight the central
Chapter 2
59
importance of tissue specific transcriptional regulation of PGs during these developmental
processes. Indeed, the tomato fruit TFPG is the only PG gene expressed in the ripening fruit
tissues, its transcription is positively regulated by ethylene, and the encoded protein is
responsible for the PG activity required for pectin depolymerization that occurs during
ripening (Dellapenna et al. 1986; Sheehy et al. 1988; Smith et al. 1988; Dellapenna et al.
1989; Sitrit and Bennett 1998). Notably, the TFPG mRNA accounts for up to 2.3% of the
total RNA in ripening tomato fruit, and down regulation of TFPG has no effect on the timing
or rate of leaf abscission, indicating a specific function of this enzyme during fruit ripening
but not organ abscission (Dellapenna et al. 1987; Taylor et al. 1990). In contrast, in the
pedicel where the AZ is located at the base of the tomato floral organs, there are at least four
abscission-related PG genes (TAPG1, TAPG2, TAPG4 and TAPG5) expressed, three of which
are induced by ethylene and correlate well with the cell separation that occurs in the flower
and leaf AZs (Kalaitzis et al. 1995; Kalaitzis et al. 1997; Hong and Tucker 1998).
Furthermore, silencing of the tomato abscission-related PGs using a TAPG1 fragment,
delayed abscission and increased break strength of the leaf petiole AZs in explants treated
with ethylene. These studies suggest a combination of tissue specific transcriptional
regulation and/or localized cellular differences in response to ethylene are important factors
that determine the spatial and temporal precision for their functional roles during fruit
ripening and organ abscission.
Oil palm fruit shedding has some similarities but also notable differences from that
seen with tomato. Firstly, the timing of separation induced by ethylene in oil palm is
comparable to that in tomato. In the presence of ethylene, cell separation begins to occur by 9
h, while 80-100% of ripe fruit are shed by 12 h, whereas in tomato, flower shedding begins at
6 h and is complete by 12 h (Roberts et al. 1984). This result is striking given the surface area
of the primary AZ of ripe oil palm, up to 10 mm (Figure 2.3) is approximately 20 times larger
Chapter 2
60
than the tomato pedicel AZ, up to 0.55 mm (Roberts et al. 1984). Secondly, we observe a
greater diversity of PGs expressed in the oil palm fruit tissues than that of tomato during
ripening or abscission. Notably, at least 14 transcripts that encode distinct PGs with either
partial or complete GH28 domains are expressed in the base of the fruit containing the AZ,
five of which appear to be regulated positively, while four others negatively in response to
ethylene. In addition, five PGs revealed no significant change in abundance during the
ethylene treatments. A previous study with banana fruit reported at least four PG genes are
expressed during ripening (Asif and Nath 2005). However, none of the PGs identified in that
study contained the full-length GH28 domain and thus we were not able to compare their
phylogenetic relationship with the oil palm PGs and other PGs presented in Figure 2.6. The
expression of the banana PG genes was also analyzed during finger drop, a process that also
involves pectin breakdown disassembly (Asif and Nath 2005; Mbéguié-A-Mbéguié et al.
2009). The results indicated that the four banana PGs were also expressed in the finger drop
zone where cell separation takes place, while MaPG4 was the most highly expressed with a
profile of accumulation correlated to the decrease in the pedicel rupture force observed.
Together with the present results, the mechanisms of pectin disassembly during banana and
oil palm fruit ripening may involve a larger number of PGs than with dicotyledonous species
examined thus far. The current study allows a more complete view of PG expression in
relation to ethylene in a monocot fruit, given that the earlier studies with banana included
fewer and shorter PG sequences (Asif and Nath 2005; Mbéguié-A-Mbéguié et al. 2009). In
addition, whereas both are monocots, the banana is a parthenocarpic berry-type fruit that
accumulates large amounts of starch, while the oil palm is a drupe with the high oil content,
which may also implicate different ripening regulatory mechanisms between these two
species. Future work awaits molecular resources for more complete comparative studies on

Chapter 2
61
ripening and abscission of these two diverse monocots, in addition to the well-characterized
dicot tomato model.
In comparison to tomato, the diversity and complexity of PG expression in the oil
palm fruit tissues are far greater than that observed in the AZs or during ripening. In the oil
palm, all 14 EgPG transcripts are detected to some extent in the ripening mesocarp tissue in
contrast to the single TFPG expressed during tomato fruit ripening. Notable, none of the
EgPGs identified appear to be completely tissue specific as observed with the tomato PGs
involved in abscission and ripening. However, the data presented here suggests that
differences in their tissue and developmental stage dependent response to the ethylene may
be important for spatial and temporal control. The most notable example is that of EgPG4,
which is not only the most abundant PG transcript in the mesocarp of untreated ripe fruit, but
also undergoes the most dramatic increase in abundance in the base of the fruit containing the
AZ in response to ethylene. The high abundance of EgPG4 in the mesocarp and the massive
increase in response to ethylene is similar to PG expression in tomato, however, EgPG4 is
highly expressed in both the ripening mesocarp and the AZ after ethylene treatment.
Furthermore, our in situ hybridization experiments indicate the increase in EgPG4 transcript
abundance in the base of the fruit occurs preferentially in the AZ compared with the adjacent
mesocarp and pedicel tissues. Importantly, a delayed and less significant increase in EgPG4
transcript is also observed in the AZ of untreated fruit, as well as in 30 and 120 DAP fruit
treated with ethylene, which corresponds to the delay in shedding observed at these stages of
ripening. Together, these results provide evidence that EgPG4 integrates cell wall pectin
modifications during both mesocarp ripening and in the AZ cells during fruit shedding, in
close relation to a developmentally regulated cell sensitivity or competence to respond to
ethylene. Future work has the objective to identify the regulatory factors that control the
ripening and abscission related expression of EgPG4, to provide a basis to compare these

Chapter 2
62
processes not only between monocots and eudicots, but in particular between fleshy and dry
fruit species. Finally, the identification of genes involved in oil palm fruit shedding will be
helpful for oil palm improvement selection strategies.

Chapter 2
63
Materials and Methods
Plant material, ethylene treatment and RNA extraction
Oil palm (Elaeis guineensis Jacq) fruits were harvested at Krabi Golden Tenera
plantation, from a tenera clone (clone C) produced in Thailand. For each stage of
development studied, independent bunches were collected on distinct individuals of the same
genotype. Spikelets were then collected in the centre of each bunch and sets of 6 spikelets
were randomly sampled from them and put in individual hermetically sealed 50 l volume
boxes. Spikelets with fruits at 150 days after pollination (DAP) were treated with different
concentrations of ethylene (0, 0.001, 0.01, 0.1, 1, 10 µl l-1
). In absence of ethylene treatment,
ethylene absorber (ETHYL-GONE, http://www.biosafer.com/ethyl-gone.php) was added in
the box. All the boxes were kept at ambient temperature (approximately 30 °C), and after 24
h of treatment the number of fruit separating from the spikelets were counted. Using the
concentration of ethylene (10 µl l-1
) that induced and synchronized the highest amount shed
fruit, a time course analysis was then conducted that used the same process with fruit from
30, 120 and 180 DAP. Spikelets were treated with or without ethylene, and every 3 h, for
each stage of development, treated or untreated spikelets were collected and shedding was
quantified. For each time point, the mesocarp, pedicel and the base of the fruit containing the
primary and adjacent AZs were isolated and frozen immediately in liquid nitrogen. Samples
from two independent experimentations were collected immediately after bunches were
harvested.
Total RNA from mesocarp, pedicel and the base of the fruit enriched in AZs, treated
or not with ethylene was extracted as previously described (Morcillo et al. 2006). Total RNA
(1µg) was used to synthesis cDNA using the first-strand cDNA synthesis kit (ImProm-IITM
Reverse Transcription System, Promega).

Chapter 2
64
Identification of oil palm non-redundant polygalacturonase nucleotide sequences from
fruit
To identify oil palm PG cDNA sequences a number of molecular resources were used.
First, the tblastn program was used to search available databases that contain Elaeis
guineensis sequences, including NCBI (http://www.ncbi.nlm.nih.gov), local 454
pyrosequencing derived oil palm mesocarp contigs (Tranbarger et al. 2011) and contigs
derived from tissues enriched in the AZ (Jantasuriyarat et al., unpublished), for sequences
with high similarity to PGs from Arabidopsis and rice previously described (Kim and
Patterson 2006). Additional sequences were also kindly contributed by Dr. Arondel (Bourgis
et al. 2011). A complementary approach utilized degenerate primers (Gonzalez-Carranza et
al. 2002) to amplify cDNA from AZ tissues treated with or without ethylene at different
development stages and from oil palm genomic DNA. Primers from the oil palm PEST643
(accession number N° AY291341) were designed in the most conserved regions of PGs and
also used to amplify PGs from fruit tissues. For sequences lacking the 3’ regions, RACE
(Clontech) amplification was performed and from sequences obtained, sequence specific
primer pairs were designed and used to amplify non-redundant PGs from the oil palm fruit
tissues. A total of 35 putative non-redundant PG sequences were identified from these
complementary approaches and were compared to confirm similarity to plant PGs, in
particular the presence of a partial or complete glycoside hydrolase 28 (GH28) domain that
covers approximately 75% of each PG coding sequence (Kim et al. 2006).
Quantitative Real-Time RT-PCR
qPCR was conducted on a LightCycler 480 (Roche) in 96 well plates in a volume of
10 µl containing 2 µl of cDNA diluted 1/100, 1.5 µl of primer forward (2 µM), 1.5 µl of
reverse primer (2 µM) and 5 µl SYBR® Green Mastermix (Roche). Supplemental Table S2.1
Chapter 2
65
lists the primers used. PCR was initiated by denaturation at 95 °C for 10 min, followed by 45
cycles of 95°C for 15 s, 60°C for 15 s, and a final extension at 70 °C for 1 min. All
expression was normalized to the EgEfα1 (accession number: AY550990) mRNA from
Elaeis guineensis, and relative mRNA abundance was determined with the formula as
described previously (Pfaffl 2001). No change of EgEfα1 transcript accumulation was found
in the fruit tissues treated or not treated with ethylene. Control using RNA matrices were also
conducted to validate the absence of DNA in each sample. Each time point was replicated
three times from 2 independent biological samples, and all amplified cDNA fragments were
sequenced by Beckman-Cogenics to check the specificity of the amplification products. Gene
abundance is expressed as mean and standard error bars are calculated from the technical
replicates of one of the biological repetitions.
Phylogenetic Analysis
Phylogenetic trees were constructed based on similarity searches performed with
BLASTp programs with default parameters in protein sequence databases provided by the
NCBI server (http://www.ncbi.nlm.nih.gov). Phylogenetic analyses were performed on the
Phylogeny.fr platform (http://www.phylogeny.fr) (Dereeper et al. 2008). Amino acid
sequences from the GH28 domain were aligned with ClustalW (v2.0.3) (Thompson et al.
1994). After alignment, ambiguous regions (i.e. containing gaps and/or poorly aligned) were
removed with Gblocks (v0.91b). The phylogenetic tree was constructed using the neighbor
joining method implemented in Neighbor from the PHYLIP package (v3.66) (Saitou and Nei
1987). Distances were calculated using ProtDist. The Jones-Taylor-Thornton substitution
model was selected for the analysis (Jones et al. 1992). The robustness of the nodes was
assessed by bootstrap proportion analysis computed from 100 replicates (Felsenstein 1985).

Chapter 2
66
Graphical representation and edition of the phylogenetic tree were performed with TreeDyn
(v198.3) and Inkskape, respectively.
RNA in situ hybridization
To obtain DNA templates for the RNA probe synthesis, PCR amplifications were
performed with gene-specific antisense primers tailed with a T7 RNA polymerase binding
site. PCRs were performed with the EgPG4qS1–EgPG4qAS1T7 and EgPGq4S1T7–
EgPG4qAS1, and the EgRiboS-EgRiboAST7 and EgRiboST7–EgRiboAS primer pairs for
EgPG4, and EgRibo-specific probes, respectively (Supplementary Table S2.2). The resulting
DNA fragments were used directly as templates to synthesize antisense probes, with the
incorporation of UTP–digoxigenin (Roche) as the label with using the MAXIscript® T7 Kit
(Ambion). Each amplification product was sequenced to check the specificity of the
amplification products. In situ hybridization experiments were carried out as described
previously (Jabnoune et al. 2009) with some modifications. The fruit bases were fixed
overnight in the dark at 4°C in fixation buffer (4% paraformaldehyde, 0.1 M phosphate buffer
pH 7). After 16h, they were washed two times in 0.1 M phosphate buffer with 2% glycine,
then two times in 0.1 M phosphate buffer before dehydration through a increasing series of
ethanol and butanol concentrations. After 15 days in butanol to soften the tissues, the samples
were embedded in Paraplast plus (Paraplast X-Tra, Oxford Labware) and sectioned to 12 µm
with a microtome. Tissue sections were deparaffinised with Safesol (LaboNord, France),
rehydrated through an ethanol series of decreasing concentrations, and then pre-treated with
proteinase K (100 U µl-1
, Roche) in TRIS-HCl (100 mM, pH 7.5), EDTA (50 mM) at 37 °C
for 35 min. Digestion was stopped by washing twice for 5 min each with TRIS-HCL (20 mM,
pH 7.5, CaCl2 (2mM) and MgCl2 (50 mM), then phosphate-buffered saline (0.1 M PBS) with
0.2% glycine for 2 min, and then twice with 0.1 M PBS. After ethanol baths, hybridization
Chapter 2
67
was performed at 45 °C overnight with 200 ng of the digoxigenin-labelled RNA probe in 100
µl of hybridization solution (50 µl formamide, 10 µl 20X SSC, 1 µl Denhardt 100X, 20 µl
dextran sulphate 50%, 1 µl tRNA at 100 mg/ml). After hybridization, slides were washed in
2X SSC at 25 °C for 5 min, in 2X SSC at 50 °C for 45 min and in 1X NTE (TRIS-HCl 10
mM, NaCl 0.5 M, EDTA 1 mM, pH 7.5) at 25 °C then 37 °C for 5 min each. An RNase A
digestion (20 µg/ml) was carried out for 30 min at 37 °C and stopped by washing with 1X
NTE at 37 °C. Final washes were conducted twice in 1X SSC for 30 min each at 55 °C.
Detection was performed using the Vector Blue Alkaline Phosphatase Substrate Kit III
(Vector Laboratories). Control without probe was conducted to valid the absence of
endogenous alkaline phosphate activity. Samples were incubated in blocking reagent [Roche;
10% (w/v) in PBS] for 1 h and afterwards for 45 min at 37 °C containing antidigoxigenin
alkaline phosphatase-conjugated Fab fragment antibody (Roche) diluted at 1:500 in blocking
reagent. After three washes for 10 min in 0.1 M PBS, tissues were equilibrated in detection
buffer (100 mM TRIS-HCl pH 8.2) then several batches of 3 h at 37 °C with Blue vector.
Finally the detection was amplified by ethanol vapour for 20 min and samples were mounted
on slides with Mowiol and observed with a bright-field microscope (Leica DM6000) using
the 40X/0.75 numeric aperture. To visualize the AZ, tissue sections were also observed under
polarized light and epifluorescence with a TXR filter. Photographs were taken with a Retiga
2000R camera (Qimaging). In situ hybridization and microscopy analysis were conducted at
the “Plate-Forme d’Histocytologie et Imagerie Cellulaire Végétale” (PHIV platform;
http://phiv.cirad.fr/).

Chapter 2
68
Appendix
Name of genes Name and sequence of primers
EgPG1 EGPG1qS1 ACAAACAGAGCTAAAGACCC EGPG1qAS1 GGTGCACAAATATACTGAAACTAC
EgPG3 EGPG3qS1 GTTACCCAGCTAATCATTTGAAAC EGPG3qAS1 CAAACATTTCGGACAAATGAAGA
EgPG4 EGPG4qS1 ACCTACGGAAACAAGCC EGPG4qAS1 AATCCTACATCACCCATTTCA
EgPG7 EGPG7qS1 CTCATCCAAGCTCCAATATTAGT EGPG7qAS1 TTTATTCTGATACCATGCTTTGAGTTA
EgPG8 EGPG8qS1 AGCTACATTTCTTCATTCAAACTGTAA EGPG8qAS1 CTCCTATCCCATTCCCAGATAA
EgPG9 EGPG9qS1 AATACTGATGGCATTGATCCAGA EGPG9qAS1 GAGACCCTGCGAACAAC
EgPG10 EGPG10qS1 CACAAGATACTATGATCCTTCGT EGPG10qAS1 TTTCTAAGAAGTCCACCACCG
EgPG11 EGPG11qS1 AATCTCCGAGGTTGCATTC EGPG11qAS1 AACCTTCAAGGCTTTAACATTT
EgPG16 EGPG16qS1 CATGTCAGAATCTCGACCTTT EGPG16qAS1 ACTGCCACGGAATAACC
EgPG17 EGPG17qS2 TGTGGATGTTGTGAAGTCGAA EGPG17qAS2 ATGGGTAAAGAACCTGTTGG
EgPG18 EGPG18qS2 GTTGTCACATCAAACACTCTGGTA EGPG18qAS2 CCTCTGCTCCGTTCAAT
EgPG19 EGPG19S1 TGAGCTATTGAAGCAGACAC EGPG19AS1 ATTTATGAAGCATGGACAAATACG
EgPG22 EGPG22qS1 CATTGTGAATGCTAGCTCAATTAT EGPG22qAS1 CATTGGTAGTGCCTGTAAGT
EgPG26 EGPG26qS2 AAAGGATGTCTCATACATGAACATAAA EGPG26qAS2 GGGTCATCCACCAACTC
EgEF1 EGEF1S4 TATCAAAGGATGGGCAGACC EGEF1AS4 TCATCATACCTTGCCTTGGA
Table S2.1. List of primers for the expression analysis of oil palm PG genes by qPCR.

Chapter 2
69
Name of genes Name and sequence of primers
EgPG4 EGPG4qS1 ACCTACGGAAACAAGCC EGPG4qS1T7 GAAATTAATACGACTCACTATAGGGAGAACCTACGGAAACAAGCC EGPG4qAS1 AATCCTACATCACCCATTTCA EGPG4qAS1T7 GAAATTAATACGACTCACTATAGGGAGAAATCCTACATCACCCATTTCA
EgRIB EGRiboS GCCGACCCTGATCTTCTG EGRiboST7 GAAATTAATACGACTCACTATAGGGAGAGCCGACCCTGATCTTCTG EGRiboAS TCTTTCGCCCCTATACCCAA EGRiboAST7 GAAATTAATACGACTCACTATAGGGAGATCTTTCGCCCCTATACCCAA
Table S2.2. List of primers used for the synthesis of in situ hybridization probes.

Chapter 2
70
Table S2.3. (Cont.) List of the 28 sequences contained either a partial or complete
GH28 PG signature domain.
Name of genes sequence
EgPG1 >Contig_223666S6AS7 AGGCATCAGCATTGGGAGCCTCGGCGTGCACAACTCGCAGGCTTGCGTTTCGAACATTAGGGTCAAGAATGCAGTGATCAGGAACTCTGACAATGGGGTCAGGATCAAGACATGGCAGGGTGGGATGGGCTCAGTAACAAGCATTAGCTTCGAGAACATCATCATGGAGAATGTTAAAAACTGCATCATTATAGACCAGTACTATTGCCTAAGCAAGCAGTGTATGAATCAAACGTCGGCGGTCTACGTAAAGGATGTCTCATACATGAACATAAAGGGGACGTATGATGTCAGGAGCCCACCGATACACTTTGCTTGCAGTGATGCCGTGCCATGCACCAACATCACCATGTCTGATGTGGAGCTGCTCCCATTTGATGGAGAGTTGGTGGATGACCCCTTTTGTTGGAATGCCTATGGGAGCATGGAGACACTAACAATTCCACCCATCTCTTGCTTGCAGGATGGGGAGCCTCAGTCCATCAAAGAGAACCTTAGATTAGGTTGCTGAACTTGTTAGTGCTTCAGGTACCGCAATTTAGAGACACAATAACACAAACAGAGCTAAAGACCCATATGGTCAAACCTTTATTTTTTCCAATATGTGGCTGTTGTGGGGATTTAGTCATGCTTGGGGGGCCCTCATGGAGCTTGTTTTCATGTATTGATCGGAACATATTATGCATGGGCTTATTTCAAAGTGTCAAAAGTTCAGGTAGTTTGAGTATATTTGTGCACCTGTGGAAGGAACAATGTTTGGCTCTGTTTAACTTCTGTAGCTGGTTCACTAGAAGAAACGGATAGTGACGAGAATTTTTCTGTAAAAAAAAAAAAAAAAAAAAAA
EgPG3 >CL1Contig7023 TTGTTACATCAGCACTGGTGGATGATCTAAATTGCAGTCAAAAGCGGACTGGGAGTGAATATGGCATTCCTTTGCTCATCCAAGCTCCAATATTAGTATCCGCCGCATCACTGGAGAAACAAAATTAGGTGCTGGCATTGCGTTTGGAAGTGAGATGTCTGGTGGTGTATCAGAAGTTTGGGCAGAGGACATCCACCTCTTTAACTCAAAGCATGGTATCAGAATAAAACATCTCCAGGGCGAGGTGGCTATATTCGAAATATCTACATCTCTGATGTGATCATGAAGAATGTGGACATAGCGATCAGGATCCAAGGTCAATATGGCGAGCATCCAGATGAAAAGTATGACCCAAATGCACTTCCAATCATAAACAGGATAACCATAAAAAATGTTGCGGGAGCAAATATCAGACTTGCAGGTCTTTTAGAGGGTATTCACGGAGATAATTTCAGCAACATATGCCTATCTAATATCATCCTTAACGTAACATCCCCTCATCCTTGGAATTGTTCATATGTTGAAGGTTATTCCAATATGGTGTCTCCAGAGTCCTGTGAGCCTCTTAAAGAAATACCTGAAGATTCTTCTATTTGTTACCCAGCTAATCATTTGAAACCACAACAATCCAGTGCAATTCGTTTGATTAGTCCCTTCATTAAGTTCATAGCAATGTAACCAAAGTCTGGCGCTGTATATAAGTTGGAACTTCTGTCAAGGGATCTTCATTTGTCCGAAATGTTTGGTTTTGTATGGTTTTTCAACAATAAAGTGTATAGAGTTTTGGGGTTTCCGTCATGTAAGTAATTGTATGGTGAACAGCTATATGAAATTGATTTTTTTTTTTTTCCTTGTAACATTTTTGGCAAGCAATTTATTTGAGATGAGGATCTTGC
EgPG4 >CL1Contig5616 GATGCATCCATCGAAGACGCTCTGCAGCATCACGTGAGCTGCTTCAGCGGCCATCGGAGCACTGGAATCGGAAGAAGAAGGCTTTTTGGCTCCCCCCGCGTACTCTGCGTTGATACCACTGCTTAAGCAGTGGTATCAACGCAGAGTACGCGGGGCATCCAAGTCCCTCCAAACCCACTCATACCTATATCTCATAATCTCCTTCCTTTAAGACCTTCTATACTTTCATAAAAAAAAGGAGTCCAATGACTCAAATCATGTGCTCCTTCCGCCTCCTCCTCCTAGCAATTCTCATGATCCATTTCTCCTCATCAGTAAAAGCATCTTACGACGTTACTTCCTTTGGTGCCAAACCCAATGGTCGGACAGACTCGACCAAATCATTCATTAGTGCATGGACTGCCGCCTGTCACTCAACAAACCCTGCAACCATCCATGTACCCTCCGGCTTCTTCCTGATAGGTCCGGTCACCTTCAATGGTCCTTGTAGGAGCAGTAGGATCACCATCCAGATCGACGGAACCCTCGTCGCACCATCGAATTATGCTAATCTTCGCAATCTTGAACAGTGGATTTTGTTCGATCATGTCGACGGCATCTCGGTGTACGGTGGGACCATCGACGGCCATGGCTCACCTCTATGGGCCTGCAAGGCTGCCGGCCGGAACTGCCCTGCCGGTGCAAGGTCGTTAGTGTTCAGGAACTCGAAGAACATCTTGATCAGTGGACTGACGTCGATCAATAGCGAGAGGTTCCACATCGTGATCGATGGCTGCCAGGTGGTGACGGTGCACGGGGTCAGGATCACGGCCCCCGGCAACAGCCCCAACACCGATGGCATCCACGTCCAGTCCTCCACCGACGTCACGATCACCGGAGCCGGCATCAAGACGGGCGACGACTGCATCTCGATCGGGCCCGGCACGACGAACCTATGGATCGAGAAGGTCACTTGTGGACCTGGCCATGGCATAAGCATTGGGAGCTTGGGGAATGAGTACGAGGAGAAGGGGGTGGAGAACGTAACGGTGAAGACGGCGGTGTTCACGGGAACGGAGAACGGGCTGAGGATAAAGACGTGGGGGAGGCCGAGCGAGGGGTTCGTGAAGGGAGTGGTGTTCGAGCACGCCATGATGCAGAATGTCCGAAATCCCATCATCATTGACCAAAATTACTGCCCCCATGAGAAAAGATGCCCTGGCCAGAATTCTGGAGTGAAGATTAGTCAGGTGAACTATATGGATGTCCAAGGGTCATCTGCATCACAAGTGGGGATAAACTTTGACTGTAGTGCCAGCAACCCATGCACCGGAATTGGACTGCAAGACATCAAGCTTACCTACGGAAACAAGCCAGCAAAATCGTTTTGTGAGCATGTCCATGGTACTGCCTCTGGTTCTGTTGTGCCGAGTTGCTTCTGACTCTTCGAGTTGGAATAGTATGTATAGATCGTATGTCAGAGTATGCATGTGTTGATGAAATGGGTGATGTAGGATTCGTAACTTTTCTTATCCTCCATGTCCAAGCGTTACTCTAGTAGACATGGAATGGAATAAATATTTAATGGATTGATATGTGTTTTTTATTATAATAATTTCGGCCTAAACTAACGTTCTCATTCATGGTCCCCAATTAAAAAAAAAANAAAAAAAGTAACTCTGCGTTGATACTACTGCTTAAGCAGTGGTATCAAC
EgPG6 >CL1Contig8210_RC CCTACGGGAACTGTTTGTGATATTTTAAGGAAGGCAGAATTATTTCAAGAAAGAACTTCGATTCGAGTTAATTAAAGGAAAAAAAAAGAAAAAAANAAAAAAAAAAAGTAACTCTGCGTTGATACCACTGCTTAAGCAGTGGTATCAACGCAGAGTACGCGGGGGAACTGCCCTGCCGGTGCAAGGTCGTTAGTGTTCAGGAACTCGAAGAACATCTTGATCAGTGGACTGACGTCGATCAATAGCGAGAGGTTCCACATCGTGATCGATGGCTGCCAGGTGGTGACGGTGCACGGGGTCAGGATCACGGCCCCCGGCAACAGCCCCAACACCGATGGCATCCACGTCCAGTCCTCCACCGACGTCACGATCACCGGAGCCGGCATCAAGACGGGCGACGACTGCATCTCGATCGGGCCCGGCACGACGAACCTATGGATCGAGAAGGTCACTTGTGGACCTGGCCATGGCATAAGCATTGGGAGNTTGGGGAATGAGTA
EgPG7 >CL1Contig694_RC TTCAACGAGTCTATAGCCTTGGCCGACAGGCCCGGGTAATCTTCGAAAATTTCATCGTGATGGAGTGACACTTAACACTAAAGCATTTCAAAATGCTATCTTTTATCTACAGTCATTTGCTGATAAGGGTGGGGCACAGCTCTTTGTACCAGCAGGAAGGTGGTTGACGGGAAGTTTTAATCTTATCAGCCACCTCACATTATGCTTAGACAAGGATGCAGTAATTATTGGATCCACAGATTCGTCAAGCTGGCCAGTTATCGATCCATTGCCTTCATATGGAAGAGGTAGAGAGCTACCTGGTGGGAGGCATAAAAGCCTCATT

Chapter 2
71
Table S2.3. (Cont.) List of the 28 sequences contained either a partial or complete
GH28 PG signature domain.
Name of genes sequence
CACGGTTCCAATCTGACAGATGTGATAATAACAGGTGACAATGGGACTATTGATGGCCAAGGCAGCATTTGGTGGGATTGGTTCCATAATAAAACGTTGAACTTTACTCGCCCCCATTTGGTTGAGCTCATGTATTCAACCAAGGTGGTTATCTCAAATCTGACATTCATTAATTCCCCATTTTGGACCATTCATCCTGTATATTGCAGCAATGTCCTTGTCCGGAATGTCACAATTCTCGCCCCTCTTGATTCACCAAACACAGATGGAATTGATCCAGACTCAGCAAACAATGTCTGCATTGAAGATTGTTACATCAGCACTGGTGATGATCTAATTGCAGTCAAAAGCGGATGGGATGAATATGGCATTTCCTTTGCTCATCCAAGCTCCAATATTAGTATCCGCCGCATCACTGGAGAAACAAAATTAGGTGCTGGCATTGCGTTTGGAAGTGAGATGTCTGGTGGTGTATCAGAAGTTTGGGCAGAGGACATCCACCTCTTTAACTCAAAGCATGGTATCAGAATAAAAACATCTCCAGGGCGAGGTGGCTATATTCGAAATATCTACATCTCTGATGTGATCATGAAGAATGTGGACATAGCGATCAGGATCCAAGGTCAATATGGCGAGCATCCAGATGAAAAGTATGACCCAAATGC
EgPG8 >CL1Contig4380 AACGCAGAGTACNCGGGGGACTTCTCCTCTGTATCTCATTCTTCCTCCATAATTCCACCCCGTCTCTCTCTTAATCTTCTTCATCTATTCATTCTCTTTGCCGGCTCTTCTGGTTGGAGCTTCTCCTTGTGCCTTGTCCTGCCCCTGGGCTTAAGGGGGCTCATGAGGAGGCTAGTAGTTGTGCTATTAGTTTTAGCAGTTGCTAATGCTGTAGGAGTCGATGGAGCCAGTTATGAGAATTGCAAATATGAGAGGAGTTTGAACCAAAGGCCGCACAGTGTTTCTATAACGGATTTTGGTGCTGTCGGAGATGGGGTGACACTAAATACACTCGCCTTTCAGAATGCCATCTTCTATTTGCGGTCATTCGCCGACAAGGGCGGCGCTCAACTTTATGTTCCTAAAGGAAGGTGGCTGACTGGAAGTTTCAACCTCACCAGCCACCTCACCCTCTTTTTGGACAAGGATGCTGTTATAATTGGCACTCAGGAATCATCTCAGTGGCCTATTGTTGAGCCGCTACCTTCATATGGCCAAGGCCAGGATCTTCCAGGTGGAAGGCATCGTAGCTTGATAAATGGGCAAAACTTGACAGATGTTGATAACAGGTGATAATGGAACCATTGATGGTCAGGGTTCAGTTTGGTGGGGGTGGCTCCGTTCTCACACATTAAACTTTAGCCGTCCTCACCTTGTGGAACTTGTGAGTTCCAATGATATTGTGATTTCAAATCTGATATTTTTGAATTCCCCTGCTTGGAGCATTCATCCAGTATACTGTGGAAATGTGGAGGTCCGGAACATAACGATCCACACTTCATCCGATTCTTCATTTACAAGTGGTATAGTTCCAGATTCATGCTCAAATGTATGCATTGAGGATTGCAGCATTAGTGTCTCACATGATGCCATTTCTCTGAAAAGCGGTTGGGACAACTATGGAATCTCTTTTGGAAGACCTTCCTCCAACATTCACATCGACAATGTCCATCTGCAGACTTCTCTTGGTTCTGCCCTTGCTTTTGGCAGTGAGATGTCTGGTGGAATATCTGACATACATGTTCAGCACCTACATGTCCATGATTCTTTCACCGGTATAAAATTCAAGACTATCCGAGGCCGAGGTGGGTTCATGGAAAACATAGTCATATCGGATGTGGAGATGGAAAATGTTCAGGAGGCTTTTCAATTCACAGGACATTGTGGAAGCCACCCTGATGACCATTATGATCCTGATGCTCTTCCAGTCATCAAGCGGATTACCCTTAAGAATGTGGTTGGTACAAACATTTCAATTGCTGGTGTCCTCTCTGGAATTGAAGATGATCCCTTCACTGCTATCTGCCTTTCAAATGTCAACTTTTCTGTCACCTCAGATCCTTCTGCTTCTTGGGTTTGTTCATATGTCTCCGGGTTCTCCGAATCAGTCTTCCCTCAACCATGTGCCGATCTCCAAATCCCATACTCAAATTCTTCTCTCGTGTGCTTCTCGCTTCCAAACTACAGTGCTCTTGCAGCAGCCAAATGAGATCTTTTTGCTATCTTATCATTTGCTTCAGTCCCTCTGTACGATTGAGAGACTTGAGCTTCCATTACCATCTTGCCAATTCTTTTGCCAATAAATCCCAAAAAAGTCGGACCAAAGATTTCCTTTCTATCACCATTCAATTCATGCTTCTTGGGACTCAAGCAATTAGTTATCTTGCACCTTCAAACAGGAAAAAAAAAAGGGTGGGGGGGCCATCCGAGATGACAATGTGCTTGCCTGTACAGCTACATTTCTTCATTCAAACTGTAAGAAAAAGTTTTGGTAGTTGTTGGAATCCAGACATTGATTGACACTGTTGCATTTGCCATTAAACCATTAGAATTTGGTTGATATTTGTATATTCTATCCTGTGTGGACATGAAAATGAATTAAATTATCTGGGAATGGGATAGGAGTGGTTTGTGTATGCCACATGGCTTCATGTTATTAAAATAAATGGGTGGTTGGCTGTTAAAGTTATAAAACAGCTTGATCTAGAAAAAAAAAAAAAAAAAAAAAANAAAAAAAGTACTCTAGCGTTGATACCA
EgPG9 >CL8640Contig1 TCATGGCTCCAGATGAGTCCGACGAGGCCGGTGGGGGTCGCAACCCCTCCGGCCTATGGAGACGCCGGTGCCGCGCCGGTGGAACACCCGAGCAGCAGCTGCTCGGGTTTCTACCGGCCCGGCGGGGGAGGAGGGTGGTTTGCTCGATAGAGGAATTTGGCGGCGTGGGGGACGGGACGACGTCGAACACCGACGCGTTTCGAAGGGCGGTGGAGCACCTGAAGGCCTTCGCCGATGAGGGCGGGTCGCAGCTGACCGTGCCTCGGGGAAGGTGGCTCACCGGCAGCTTCAACCTGACGAGCAACTTCACCCTCTACTTGGAGGAGGGTGCAATTATTTTGGGATCACAGGATCCAAAAGAGTGGCCTCTGATAGAGCCATTGCCAATCCTATGGGCGTGGAAGAGAGAGGTTAGGAGCACGCTACATTAGCCTCATCCATGGAGATGGCCTCAGTGATGTTGTCATCACGGGACAGAATGGGAGCATTGATGGACAAGGGAGGATGTGGTGGGAGCTGTGGTGGAATAGAACTCTGAAACACACTAGGGGACACCTTCTTGAGCTAATGAATTCACACAACATCCTCATATCCAACCTCACCTTCATCAACTCTCCATTTTGGACAATCCATCCAGTCTATTGCAGCAACGTGGTGGTAAAAATGTAACCATACTGGCACCACTTAATGCTCCAAATACTGATGGCATTGATCCAGACTCGAGCTCAAATGTGTGCATTGAAGACTGTTACATTGAGAGCGGGGATGACCTGGTTGCCATAAGAGTGGCTGGGACCAGTATGGGATCGCCATGGCCTATCCTAGCTCAAACNTTGTTGTTCGCAGGGTCTCCGGCACAACTCCGA
EgPG10 >CL4959Contig1 GTGCCGCCCCGCCTCGTGGGCTTCATCGACTCCAAGGACGTTCGGATCTGGGACATCACGCTCAACCAGCCCGCCTACTGGTGTTTACATCTAGTCAGGTGCGATAACACATTGATTCACGATATATCCATTTATGGAGATTTTGATTCCCCCAACAATGATGGCATCGACATCGAGGATTCAAACAACACAGTCATCACAAGGTGTCATATTGACACTGGAGATGATGCAATATGTCCAAAATCTTCGACAGGGCCTGTATATAACTTAACAGCAACAGACTGTTGGATTCGCACCAAATCTAGTGCAATTAAGCTTGGAAGCGCTAGCTGGTTTGATTTCAGAAGGTTCTTCTTCAACAATATTGACATTGTGGATTCACATAGAGGGCTTGGGATGCAGATACGAGATGGAGGAAATGTGAATGACATTGTCTTCTCTAACATCAGAATAAGCACAAGATACTATGATCCTTCGTGGTGGGGAAGAGCAGAGCCTATTTACATCACAACCTGCCCGAGGGATTCAAATTCAAAAGCTGGGTCTATCTCCAACGTTCTCTTTGTTAACATATCAGCAACTTCGGAAAATGGAGTGTTCCTATCGGGTTCCGGTGGTGGACTTCTTAGAAATCTAAGATTCGAAAATGTCCAATTAACTTATAGAAGAACAACCCGCTATCCAGGTGGGTTGTATGATTACAGGCCTGGATGTCAGGGCCTGGTTCCTCACAGAATGGGTGGAATCATGATGGAGCATGTTTCAGGTCTGGAGATAGAGAATGTGAAGATGAGGTGGATTAAGAGCAACTCAAGAGGCTGGAACAACCCTCTTGAGTTCACACCTTCCACTGTAAACAAGCTCTCTTTCCATGAATGGCTGTCAGATGTCTCTTAGCCAAAAGAAAAAAAGAAAAGATCAAAGGATTTCAATTTGAGTGAAGGCTCCCAGGTCATTCTTATGCAAAGTCAGAAT
Chapter 2
72
Table S2.3. (Cont.) List of the 28 sequences contained either a partial or complete
GH28 PG signature domain.
Name of genes sequence
AGATACTATGTCTCTATTTATTGTTATCATTTGCTCATGATTAAT
EgPG11 >M01000011018:1,1896 CCGTGCCAACCTGCTGCTTTCTCCGTCCTTCTTCACAAATGGCTTGGCGGAGGCACAGTAGCATCTCACTCCAAACCTTGGCGTTATGGATTTCACTAATGGCGGTATTCATCGGAACGGCGGAATGCGCCCGGCGGAGCATCCACCTCCCCGGCGGCAGCCGCGATGGCGGGGTGATGGGGGCGTTCCAGTACGCGGCGACGAGCTGCCGGGCCAACACGGCGTCGCTGAAGGACTTCGGCGGGGTTGGCGACGGCAAGACCTCCAACACGAAGGCCTTCCAGGCGGCGGTGGCGCACCTGGCCCAGTTCGCCGGCGACGGCGGCGGTGGTATGCTGTACGTGCCGGCGGGGCGGTGGCTGACGGGCCCCTTCAACCTTACCAGCTCCTTCACCCTCTTCCTCCACCGCGACGCCGTCATCCTCGCCACCCAGGATATTAGTGAATGGCCTGTCATCGATCCTCTGCCCTCGTATGGAAGAGGAAGAGATCATGCTGGTGGAAGATACAGCAGCCTCATTGGAGGATCAAACCTCACTGATGTAATTATCACAGGGGACAATGGAACAATTGATGGGCAGGGGGCCTTCTGGTGGCAGCAATTCCATGGAGGCAAGCTTAAATACACACGCGGATATCTCATTGAACTATTACACTCCGACCAGATATTTATATCCAATCTTACACTACTCAACTCTCCTGCATGGAACGTCCATCCGGTCTACAGCAGCAACATTATAATTTCGGGCATCACTATACTCGCACCACTCCATTCTCCAAACACAGATGGGATAAACCCAGACTCCTGCACCCATGTTCGAATTGAGGACTGCTACATAGTCTCTGGTGATGACTGCGTTGCCATCAAGAGCGGCTGGGATGAGTATGGCATTGCTTTCGGAATGCCGAGCCAGCACATCATTATCCGAAGGCTAACCTGCATCTCCCCGACCAGTGCCGTCATCGCTCTAGGGAGCGAGATGTCAGGTGGAATTCAAGATGTGAGGGCTGAGGATATCACCGCCATCGATTCCGAGTCCGGTGTCCGAATCAAGACTGCTATTGGGAGGGGAGCATATGTGAAGGATATCTTTGTCAGGGGGATGAATCTCAACACCATGAAGTGGGTGTTCTGGATGACTGGAGCCTACAAGTCCCACCCTCGATAACAAGTATGATCCCAATGCCATTCCGGTTGTCAAAGGGATCAGTTACAGTGATGTTGTTGCCACAGATGTAACACAAGCAGCAAGGTTGGAGGGGATTTCAAACGCACCATTTACAGGCATTTGCATTTCTAATGTCACAGTCCATTTAGCAGCAAAGGCAAAGAAGCAGTCATGGACCTGTACTGATGTTGAGGGTGTGTCTAGTGGAGTGAGTCCTACACCTTGTGCTTCACTACCAGATCGGGGTGCCGGTGCTGAGCCATGCCCGTTCCCGACCGACAGACTACCTATTGATGATGTGGTGTTTGAGGAGTGCTCATACATGAGCTAATAATCTCCGAGGTTGCATTCGCATATGGTTCGTTCATATAGTGTTTATCAAGTCAATCCTCATGTACAATGGTGGCTGGTGGCAGAGCTTTTGTGTGCTTCTAGCTTCTTGATGCTTAAGGTTTGCTATAAAAATGTTAAAGCCTTGAAGGTTATGGAGTAATCCATTCCTCCTTTGTGTGCTAGATCTATGTTCTTACATTTCAAAGTTCTATAATATTTCCACATAACTTGATTACAGAGGACTGTATACTAAAAATGCATGATGCCATGATGTTATTACTTGGACAGGGTCTTGCCTTCATTTTGATAGAAATGGTACATGAAAATTGAACAAAGAAAGACTGCAATTGACAACAAGATTTTAGTGGAGCAATAAAATGTTGATACAAATATT
EgPG12 >M01000058719:1,1373 TGAAGGGATACTTGAAGGGAACAACAGATTTGAGCCAGTATGTCACAGGTGATTGGGTGGATATGTTGATATTGACCGGAGGAGGGACCTTCGATGGCCAAGGAGCTGTATCATGGCCCTATAACAAGTGCCCTACAAATAAACATTGCAAAGTCCTCCCCACTTCGGTCAAGTTCGTTGTCACATCAAACACTCTGGTACAGAACATCAAATCAAGTTTTTCCACATAGCTCTGGTTGGCTGCAAGAACTTCTGGGGCAAAAATATCCAGATCACCGCCCCTTCAAACAGCCCCAACACCGACGGAATTCACATTGAACGGAGCAGAGGCGTAACTATATATAACTCGGTGATCGGAACTGGTGATGATTGTATCTCCATTGGACATGGTAACTCACAAGTATTACTGAGTGGCATCAGTTGTGGACCAGGGCATGGGATCAGGCAAGTCCTCTTGAAGTTCTCCTGCTACAATATTGTTATGTTCTGATTGAAATTTTTGATCCAATCCAAATGAGAACAGATCCTTGGATTAATCCTGGGTTTAGACTGATGTCCGATGCACTTCTATTTGACCCTCACCAGACCCCGCAATGCATTGGGAGTTTAGGAAGATATCATAATGAAGGGGACGTCCGAGGACTCGTCATCAAAGATAGCACCCTTGCCGGGACTTCAAACGGTGTAAGGATCAAGACATGGGAGAACTCTCCAGGAACCAGTAAGGCTGTTAACATGACCTTTGAGAACATTGTCATGAACAGTGTTGCAAATCCCATCATCATTGACCAGATGTACTGCCCCTACAGCTCTTGTGCATCAGATGCACCATCTGGGGTGATTCTGAGTGACATCTTCTTCCGGAACATAAGAGGGACGTCGACGACTCCGGTGGCGGTGACCCTCAGGTGCAGCAGAGGAGTGCCATGCAAGAACGTCAATCTCCAAGACGTCAACCTCAAGTACGTTGGCCAGCTTCCGGCCACTGCCTCGTGCATGAACGTCAAAGCAAGCTTCAGCGGGACCCAAATCCCCCCACCTTGCCGCTAGGCAAACCGACCCAAAACTTAGCTAATTGGCCCCCTTGGTGCTCGTGGAACTCATTGAAGCCATTCTTCCTGGCCTCCATCTAAGGCTGGGTTACATTCTTTCCTGTGGGTTGTAACCATCTTACCATCAAGCATGAGTAATTTGTTTTTGGATTATATTTACAGGCTGTGGAAATCCGGGGACTGAGTAATTTGTTTTTGGATGGATTATATTGAGAGGTGGCTCTGGTTGAACCGCCATTCTTTCTGTGGTTATCTTTCTTTCTTTGTATTTTTTGGGAACCAATGTTGTTATCTTTGTTTAGTTGTTGGGATTTTGATTTG
EgPG13 >M01000001841:1,1933 CTAAACATTCTTACGCTTTTTTTCTGTTTCCATCTTCACGGCTTGGCGGAGCTCCTCTGCTTCTCCCTGGGCCAAGAAAAATAAAAACTAAACAACTTCAGATGGCGTCAAGACCACCGATGGCGCTGGTACTGGCAGCGTTCCTTCTCTTGGTGGAATGGGGCTCGGCGGCGGCGGCGGCGGCGGCGGCAGGGGAGGAGACGTGCTCGGGGATAGTGCCGATGAAGGAGCGGGGAACGGCAATGTCGGTGGAGGATTTCGGCGGGGTGGGGGACGGCCGGACGCTCAACACGGCGGCTTTCGAGAAGGCCGTGGCGGAGATCGAACGGCGAGGGGTGGCCGGTGGCACCCTCTACGTCCCGCCGGGGGTCTGGCTCACGGGGGCCTTCAATCTCACCAGCCATATGACCCTTTTCCTCGCCAGGGGCGCCGTCATCAAGGCCACCCAGGATACATCGAGCTGGCCTTTGATCGATGCTTTGCCATCATATGGGAGAGGTCGGGAGCTACCTGGTGGGAGATATATGAGTCTGATTCATGGAAATGGAATTCATGATGTGATAATAACAGGTGAGAATGGAACAATTGATGGGCAAGGCGAGGTCTGGTGGAATATGTGGAGGCAAAGAACCCTACCTTTCACAAGACCAAATATATTGGAGCTCATGCATTCTAAAGATATTATTATTTCTAATGTGGTCTTCCAAAACTCACCATTTTGGAACATTCACCCTGTTTATTGCAGTAATGTGGTAGTAAGAAATGTGACCGTGTTGGCTCCATATGACTCTCCTAACACGGATGGAATCGATCCAGATTCCAGCTTAAATGTCTGCATAGAGGACTGCTATATTTCAACAGGGGATGATCTAGTAGCTGTGAAAAGTGGGTGGGATGAGTATGGCATGGCCTATGCCCGCCCCAGCTCTGGCATCACCATTCGGCGGTTGACCGGCTCCTCTCCTTTTGCCGGAATCGCAGTTGGAAGCGAAACCTCCGGTGGGGTGGAGAATGTCTTAGTGGAGAGCATACATATCTATAACACTGGTATTGGGATACATATAAAAACCAATTCTGGTAGGGGTGGGTATATAAGAAACATAACCGTCTCCGGTGTGAATCTGAGCAATGTTCGCAAGGCTCTGAGAATTGCAGGTGATGTTGGAGATC
Chapter 2
73
Table S2.3. (Cont.) List of the 28 sequences contained either a partial or complete
GH28 PG signature domain.
Name of genes sequence
ATCCTGACGACATGTATAATCCAAATGCTCTTCCAATTGTCAATGGTTTGACCATCAAGGATGTGTGGGGTGCGGATATCCAGCAGCCTGGGTCGATAGATGGCATCAAGAACTCACCCTTCACAGGGGTATGTCTTTCTAATGTCAAGCTTAATGGTGATGGAACACGGGAAGTGCCATGGAAGTGTGCGGATGTGAGTGGTGGTGCCCTCGGGGTGCAGCCATCACCATGCACGGAGTTGACAAGTATTTCTGGGTTGAGCTTTTGTACGAATGCAATCTGATGTTCTATCATTTGTTGGATGCCGTTGTCACTAAGAAAATGCATGTCTTTGCCTATTTGGCTGATAGAAAAAAAATTTGAGCATAAAATTTGGTGCTATTATAAAGATATGCAGCTTGTATATGAAAGAATCTATATCTCATGATTTTCAAAGCATGAAAATATTTGAAGTTATCGACCAAGTGCCGGAGGTATTGCCGATATAAGTATCAACCAGGCAGAAGATAAGCTCTGTTTCTGTGCAACTAACAAAAATGCGGGTTGATTTTTATTGAACTAGAGTGGCTATCATAGTACAGTTGCAGTGTTATGCTGGAAAGAGATCTAAGATATGGCATACTACAATTTGCAGTATTATGCTATCTAGTTAACAAGCAGCATTTGCAAACGGGCTTAAATTGTTATCTATTGTAATTTCATTGGATGCATATACAGTTATTCTAGAGTATGGTTTAATATTTGATGGTCCTTGACTGGATG
EgPG16 >M01000013617_RC:1,1490 CCGGACAAGGCGGCGCCGAGGCTCCGTCCGTTTGCGTACAATATCACGGACTTTGGTGGGGTTGGCGATGGAGTGACGCTGAATACTGAGGCATTTGAGCGCGCGGTGGCGGCGATCGCGAGGCATAGGGGGAGGGGCGGCGGGCAGCTCAATGTGCCGCCTGGAGTCTGGTTGACGGCGCCGTTCAATCTTACGAGTCATATGACTCTATTTCTTGCAGAAGGTGCCGAGATTCGTGGAATTGAGGATGAGAGATATTGGCCATTAATGCCTCCAGTTCCATCATATGGATTTGGGAGGGAACATAAGGGACCTCGATATGGAAGTCTGATCCATGGCCAGAATCTGAAGGATTTGGTTATAACAGGACACAATGGAACCATAAATGGACAAGGTCAAGCATGGTGGGCAAAATATCGCAAAAGGCTTCTCAACAACACTAGAGGACCTCTTGTGCAGATCATGTGGTCCAAAGACATAGTTATTTCCAACATAACTCTGCGCGATTCTCCTTTTTGGACACTCCATCCTTTCGATTGCAAAAATGTTACTGTTACAAATGTTACCATCTTGGCTCCTGTTACTGGAGCTCCAAACACGGATGGGATAGATCCGGATTCATGTGAGGATGTGGTGATAGAGAACTGTTACATATGCGTAGGTGATGATGGAGTGGCCATAAAGAGTGGTTGGGATCAGTATGGAATTGCGTATGGGCGCCCATCTACTAACATTTTAATCCGCAATCTCACTGTTCGCTCTGTGGTGAGTGCTGGAGTATCAATAGGCAGTGAGATGTCTGGAGGAGTTTCAAATGTTACTGTGGAAGACCTTAATATCTGGGAGTCCAGGCGGGGCATTAGAATAAAGACTGCCCCTGGGAGAGGAGGCTACATTCGCAACATATCCTACCACAATGTGACCCTTGATAATGTTCGTGTTGGCATTGTGATCAAGACCGACTACAACGAGCACCCTGATGAAGGCTTCGATCCCAAGGCTGTTCCCCTCTTTGAGAACATATCCTTCAGTGGGATTCATGGCCAGGGAGTCCGTGTCCCAGTTCGGATCCATGGCAGTGAGGACATCCCTGTTAAGGGTGTCAGCTTCCGTGACATGTCTGTGGGTATAACCTACAAGAAGAAGCACATATTCCAGTGTTCCTTTGTTCAAGGACGTGTGATTGGGTCCATCTTCCCTGCACCATGTCAGAATCTCGACCTTTATGATGAGCAGGGGCAGCTGGTGAGGCAATCAGCATCACAGAACAGCACCGACATTGACTATGATATTTGAAAATTTTGTTCCCTCTCCATTGTCCAGATGGGAGGAGTGCCGGGTTATTCCGTGGCAGTGATGGTTCTGTCAAGCATCTGTTCCCAAGGTTTCAACCCCCCTGGCTTGTACATACAGAGCTTTCAATTTTTGATTTTTTTTTTTTTTTTTGGTAATTATCTGGTGATATGCCTCACCACTTCATGATCTTGCAG
EgPG17 >M01000033226:1,1913 GTCTCTCTGTGGGACGGTTGCAGTCTTTCTAGCTAATAATGGCGTTGCTCGGAAGCAATCCCTCAAGAAACCTCTACGTACTAAAGTTGGTGATTTTATGGATGGTGGTGGCGGGACTTATGAGGGCGGCGGAGTGCACGAGGCTAAGGCACCACGGCCACCACCGCCGGAGGCCCGGCGGAGGCTTGCCCGCGGGGGCGGCGGCGGCGGGTGCCTTCGGCTGCCGAGCCTACAAGGCGAGCCTGACGGATTTCGGGGCGGTGGGTGACGGGACCACCTCCAACACCCACGCCTTCGCCGCGGCCGTCGCCAACCTCAGCCTCTACGCCGCCCACGGCGGGGCGATGCTCTTCGTGCCCCCCGGCAAATGGCTCACTGGTCCTTTCAATCTCACCAGCCACTTCACCCTCTTCCTCCACCGCGACGCCGAAATCCTGGCCTCCCAGGACATTGATGAATGGCCAATTATTGATCCCTTGCCCTCTTATGGGAGAGGAAGGGACTTACCTGGTGGAAGATACAGCAACTTCATCATGGGATCTAACCTCACTGATGTGATCATCACAGGGGATAATGGAACAATCAATGGGCAGGGGAAAGTCTGGTGGGATAAGTTTCATGATAACAAGCTGGAGTACACTCGTGGTTACTTCGTTGAAATAATGTACTCAGACCACATCCTTATTTCCAACCTTATATTCAAAGATGCTCCTGCATGGAACCTTCATCCGGTTTACAGCAGCAATGTTCTTGTGTTAAATGTGACAATTCTTGCACCGGTTACCTCTCCAAACACCGATGGAATTGATCCAGACTCCAGCTCCAACGTCCTCATCGAGGACTGCTTCATAGTCTCTGGTGATGATTGCATCGCCATCAAAAGTGGTTGGGATGAGTATGGAATTGCCTTCAACATGCCAACCCGACATGTAATTATTAGAAGGCTCACCTGCATTTCCCCCACCAGTGCCACCATTGCCCTTGGAAGCGAGATGTCTGGTGGTATCGAAGACGTCAGGGCTGAAGATATCACGGCCATCAACACAGAATCTGGGGTCAGAATCAAGACGGCCATTGGTAGGGGAGGATATGTTAAGGATATTTTTGTGAGAAGAATGACCTTGAACACCATGAAGTATGTTTTTTGGATGGCTGGAAATTATGGGCAGCACCCTGATGACAAGTATGACCCCAACGCAATCCCAATAATCCACAATATCAATTACAGAGATGTGGTTGCCGAGGATGTCACCATAGCTGGAAAGTTGGAGGGACTTCCTAAGGCACCCTTCACTGGGATATGCTTGTCTAATGTGACTGTGGATGTTGTGAAGTCGAAGAAGCTGAAGTGGAACTGCACTGATGTTGAGGGGGTCTCAAGTGCTGTGATGCCTACTCCTTGCGACTCACTCCGAGATCTAGGAGCTGATGATGCTCCATGCCCTTTCCCAACAGGTTCTTTACCCATAGAAACTGTTGCATTCCAGGAATGTCAATACGGAAGAGTTAAACTGTGAGTGTTGGTGTGAGCTTTGTTTTATTTTCCTTGGAGTCATTCCTCATGACCGATGTCTGCAAGGAGAAGAGCTCTTATGTGCTTCTGTCTCTTGATAATTGGAGGTTCGATGAGGAAAACTAGTGTTGCAATAAGTCATTTGTTTCTCCTAGGTATTGGAGTTTTTTCCTTTTTAAAGTATATTATGTCATGTGAGTGCATGTATGTGAAGCTGGACCTAAATTTGTGACCAACAAGTGGTAGTTTAATGGCTACAGGGGCTACTGCAAGTGATTCTAAACCTTTTTGGATTGCTATGCTAGCTTCATCAGGTCAGCCTAAACCTTTTACTTCATTATGTAAATTAAACTTTATCATCTGAAAGTTTATATATATATATCTGGAATTTGTATCAAAA
EgPG18 >M01000001611:1,1662 AACAACAGATTTGAGCCAGTATGTCACAGGTGATTGGGTGGATATGTTGATATTGACCGGAGGAGGGACCTTCGATGGCCAAGGAGCTGTATCATGGCCCTATAACAAGTGCCCTACAAATAAACATTGCAAAGTCCTCCCCACTGTAAACTCTCAAGCCTCATTTATCCTTTATGCTCTCTACGGTAGATCTAATACTTGCAACTCGAGTATATATAGTTACCACGTACACGTCCTTTCTAATTTGACAATTTTGCACAAAAGTAGAAATAATGTATGAAATCAAGCCAATCACATACTGGTGCATTTTAGAGCTTTAAAACTAGCTCACTGCATAAGGCAATTAGTATTTCCCAGCTAGTAGCTACTTCACCAAAAGTTTCACAGTGGAATAATGGCAGTGCCAGATTTTTTTTGTCCGCATCAAGGAAGAATGAATAACTCTATATAGGCTT

Chapter 2
74
Table S2.3. (Cont.) List of the 28 sequences contained either a partial or complete
GH28 PG signature domain.
Name of genes sequence
AGATTAATGAATATTCTAGACTAGAGTAGTACTTTCATGTTGCTACCCAAACTGCAGTAGCAAAATTTGTCCAACCGTTGTCTTTTAGATGTAACACTTGCCCTCTGCATTTTAGGGTGAAGTATTTTTCTAAGACAAGCATTGTAGCATGAAGTTATAGCAGCTAGCTATCAATACTCATAATTGCCAGCATCATTAAGATCACAGATGTTAGTAAAAACTGTAGAAGCTCTATAGTCCAAATTTGCTATTCAGCTTATCATCTAAACATGCTTAATTGTCATTTTGGTGATTATCTTGAGCATTTCAGTCGGTCAAGTTCGTTGTCACATCAAACACTCTGGTACAGAACATCAAATCAAGTTTTTCCACATAGCTCTGGTTGGCTGCAAGAACTTCTGGGGCAAAAATATCCAGATCACCGCCCCTTCAAACAGCCCCAACACCGACGGAATTCACATTGAACGGAGCAGAGGCGTAACTATATATAACTCGGTGATCGGAACTGGTGATGATTGTATCTCCATTGGACATGGTAACTCACAAGTATTACTGAGTGGCATCAGTTGTGGACCAGGGCATGGGATCAGGCAAGTCCTCTTGAAGTTCTCCTGCTACAATATTGTTATGTTCTGATTGAAATTTTTGATCCAATCCAAATGAGAACAGATCCTTGGATTAATCCTGGGTTTAGACTGATGTCCGATGCACTTCTATTTGACCCTCACCAGACCCCGCAATGCATTGGGAGTTTAGGAAGATATCATAATGAAGGGGACGTCCGAGGACTCGTCATCAAAGATAGCACCCTTGCCGGGACTTCAAACGGTGTAAGGATCAAGACATGGGAGAACTCTCCAGGAACCAGTAAGGCTGTTAACATGACCTTTGAGAACATTGTCATGAACAGTGTTGCAAATCCCATCATCATTGACCAGATGTACTGCCCCTACAGCTCTTGTGCATCAGATGTAAGCAAGCTAACACAATCATGTCATGCAAAAATATGAGGGGCTCATATAATATTTTTTCCGCATATAGTGCTTAGAGCTTGATAATGCATGCATTTAAACAACAAAACTTGGCCAGGGCTTGGAGGAGATGGTCCGCTGTGGTTTCTCCTGTGAATAGGCTCTACTTATCTTTCCCTGCTACAGAAGAAGGCATTACTTAGTTTGACAATAAAATTGTGCAAAGTACTAAATCC
EgPG19 >M01000015126:1,1043 GCAGTTGCATCCTATATCTCAGGAAGTGCCCAGCTGGATTGCTTTGTTTTTAGTTGTCTCAAGTAAAAAGACAACTGATAATATCATTTTTTTAATCTTAATTTTTGTATGGAATCAGCATAGGGAGCCTCGGGAAGGACAATGCGACTGCCATAGTTACAGCAATCGTCTTGGACACAGCAACACTTACAGGCACTACCAATGGCCTTAGAATCAAAACCTGGCAAGGAGGATCAGGCTATGTTAAATCAGTGCGCTTTGAAAATGTGAAGATGGATGATGTTGAGAACCCAATCATCATCGACCAATTTTACTGTGATTCTCCAACCAGTTGCAAGAACCAGACATCGGCAGTGAAGATAAGCCAAGTCCTCTACAGGAACATAAGTGGGACCTCAAGGACTCCTAATGCCATGAAATTTGCTTGCAGTGACACAGTACCATGCAGCAACATTGTGTTGAACAACATAAATCTAGAGAGAGAAAATGGCATTGTAGAGACCTTCTGCAACTGTGCCATGGGATTTGACTATGGGTTTGTGCGGCCAGCGGCAGATTGCCTTCGCAATGCTAAAAATTCCCGCTGTGATGGGACAAAGAATGACAACCAAAACCAAACTTATGATCCCGTGCATACAGAGCTATGATCTCTCTATATCATATCAAGGTATCATATTACAGACCACGATAGGTGGAGACCAACAAAAAACCGTACTTACAAGTACGCCTACATGTTACTGAGTTCTGGCATATTGAATAGAAAGATTTAGTGGAAGAATTTGAGCTATTGAAGCAGACACAAGCTAGCGACTTTGACGCATATATCTTAGGCAATCAAAAATGGTATAGAAGAAAGAAATCGATGTACTTGAACTCTAAAGATATCCTGTATGACTTTTAAGGAACAACCGTATTTGTCCATGCTTCATAAATGGAAACAGAAATCACAAGGACACTCTTTCTGGACTATTGGATCCAGGGGATGTAAAACCCATACCACTACCATGTCAATTGTAGAAGCATTTATGCAGCAATTATTGTTC
EgPG20 >M01000028952_RC:1,1051 TTTTCGGTATTGTATTTTAGTTGCATGACTTTTGTCTCATCTGTCTTTTCTATAGTTATTTTCTCGCAATATGTGCTTGGTAGATTCTTTTTTTTTTTTTGTTTTTTATTCTAATTGCTTTTTTTTTAGTTATGATTCGATCATGATCCATTGTTTTTTACTCTTTCTTTTCTTCTCCCTTCAACTCTTCTCTCATTCCTTTTTTTTTTGAATAATAAAATTTAAATAACTAACGTTTAAGTTTTTCTTTTGCTTGATTCTTTTTGGAAGTATTTTGTTCTGCATGCCGGGAGGCCAATTTAAATTGAAGCTGAACCTTCCTTCATGATCCAACATAACGAGAAGATAATGTGATCTCAGCCATCTATTGAATGGACTTCAGAAACTGATCATCACATAGAAATCTATCTTCCAAATGTTACGGTTGTTGTCATTTATTTTTGTTTTAAAGACATAATGGCTTTTTTAATAAACTACAATGCTTCAAAACTTTTTGTTTGGAGATAATATACTGTCCTTAATTCTAAAGTGAGAAACATTGCATCAAAGGTAGTCTTAGAACATCAAAAGCAAGGTAGCAATGTTTAAATCTAGGATTTGTTCTTGCTGTGCTAATTGTTTCCTTGTTGGTGATGGGTAAGCTGGCTTTTAATCAATTAGCTAAGGCATTCATGGCCGCATGGAAGGCAGCATGCGCAGCAGTTGGTGTGGTCAAGCTTCAGATACCTGCAGGAACTTATCTTATTGGCCCTACTAAGTTTGCTGGTCCTTGCAAAAATGTTCACTCCCTTACAGTGAATATGAAGGGATACTTGAAGGGAACAACAGATTTGAGCCAGTATGTCACAGGTGATTGGGTGGATATGTTGATATTGACCGGAGGAGGGGACCTTCGATGGCCAAGGAGCTGTATCATGGCCCTATAACAAGTGCCCTACCAAATAAACAATTGCAAAGTACCTCCCCACCTTCGGTTCAAGTTACGTTGTCACATCAAACACTCTGGTACAGAACAATCAAATACAAGTTTTTACCTACCATAGCTCTGGTT
EgPG21 >M01000034881:1,1267 GCGTTTCGAAGGGCGGTGGAGCACCTGAAGGCCTTCGCCGATGAGGGCGGGTCGCAGCTGACCGTGCCTCGGGGAAGGTGGCTCACCGGCAGCTTCAACCTGACGAGCAACTTCACCCTCTACTTGGAGGAGGGTGCAATTATTTTGGGATCACAGGATCCAAAAGAGTGGCCTCTGATAGAGCCATTGCCATCCTATGGGCGTGGAAGAGAGAGGTTAGGAGCACGCTACATTAGCCTCATCCATGGAGATGGCCTCAGTGATGTTGTCATCACGGACTCGAGCTCAAATGTGTGCATTGAAGACTGTTACATTGAGAGCGGGGATGACCTGGTTGCCATAAAGAGTGGCTGGGACCAGTATGGGATCGCCATGGCCTATCCTAGCTCAAACATTGTTGTTCGCAGGGTCTCCGGCACAACTCCGACTTGCTCAGGGATTGGATTTGGAAGTGAAATGTCTGGTGGAATATCCAACGTCTTGGTGGAAGACCTGCATGTCTGGAATTCAGCAGCAGCAGTGAGACTGAAGACTGACAGAGGGAGGGGAGGATACATTTCCAACATCACAATTGCTAATGTGACCATGGAAAGGGTTAAGATTCCCATAAGATTTAGCAGAGGCTCTAATGATCATGCCGATGAAGGTTATGACCCAAAGGCCCTTCCTAGAATAAATGGTGTTTACATTAAAAATAGTAGCCGGCATCGACGTAGGGAAGGCGCCGGTTCTGGAAGGCATTGAGGGAACAATATATGAAAAGATATGCTTCAGAAATGTTAGCTTAGGGAGGTTAAGCCCTAAGGCCAGATGGCATTGTGAGTTTGTTGCTGGAGAAGCTTATGATGTGTTCCCAACGCCATGTCAACAGCTTAAGAACAATGGTTCTTCATCTTGGTGCAGATACTCCTAGGCCATATAGACAGGAATCAAGGTTTTCAGCCTCAACTCTGCCTCAAAGATAATGAGGTGGAATGATCCATAACAATCTTGAAGTAGTAGTCCAAATGGTATACATGAGGGTGTGGTATCTTGGAGATGTTAGCTTTGGGATTAGTTCGTTTGTATTTTCTTTTATTTGGTAGGTTCAGATATAAACTAGAAAGTAGCATATAGGATTAACAAGATACATATTCCATTTATTTGTACTTATTAAAGAGAGTGACGTAGGTCTTTGTGATTCTTTTAGTCAAGGAAGTTTATTCTATAAATTTTTTTTTTATCAATAGTAGAGG

Chapter 2
75
Table S2.3. (Cont.) List of the 28 sequences contained either a partial or complete
GH28 PG signature domain.
Name of genes sequence
AAGACTGAAAGTTCCTTTTTCTTTAAAAGAAG
EgPG22 >M01000018577:1,1075 AGTCAGAGCAATCGACTTAGTAATAGAGGGCGAGAAGTATGTCGTGCTTCTCCCTGCTTCTTATGCTGATGTTAGTTGTACTGATGATGGGGGCCGTGTCCAAAGGTGATGACAATTTTGCCCCATCTGAGGATATCGGGCCCTGGACGGTCGGTACGGACGGCGAGGAAGAGCAAGAAGGAGACGAGTATGATGAATTGGACTCCCTACCGGCATGGGGAAGCGAGCGGGTTGGGAGGATCCCTGTCAATGTCGACAGCTTTGGTGCTGTAGGGGATGGAGTTGCAGACGATACCCAGGCATTTCTAGAGGCTTGGGAAACGGCGTGCTCCATAAAGAATGCAGTTTTCCTAGTGCCCGAGCGGCGCCGTTACAAAGTCAACGCAACCAGGCTACGAGGGCCGTGCGAAAGGAAGCTACTCATCCAGGTGAGCGGGACAATTGTAGCCCCTGATGAGCCAAACGACTGGGACCCGAAGAACCCAAGGACATGGCTATCTTTCTCTATGCTGAAGGGCGTCAGGATCCAGGGCGGTGGGATTATCGACGGCTCAGGCAGCAAATGGTGGGCGTCATCCTGCAAAATCAACAGGACCAGTCCATGCAGAGGAGCTCCAACGGCACTGACCATAGATTCAAGCTCAAAGGTAAGGGTGAAGGACCTCACCATCCAGAATGCACAGCAGATGCACTTCACCATCTCCCGATCTGATGCCATACGAGTGTCTGGGTTGCGTGTGAGAGCTCCACAAGACAGCCCTAACACAGATGGCATTCATATCAGTGAATCCACCAATGTTGCCATCCAGAACTGCCACATTGGAACAGGGGACGACTGTATCTCCATTGTGAATGCTAGCTCAATTATCAAGATGAAAAACATTGTGTGTGGGCCAGGGCATGGAATCAGCATAGGGAGCCTCGGGAAGGACAATGCGACTGCCATAGTTACAGCAATCGTCTTGGACACAGCAACACTTACAGGCACTACCAATGGCCTTAGAATCAAAACCTGGCAAGGAGGATCAGGCTATGTTAAAATCAAGTGCGCTTTGAAAATGTGAAGATGGATGAT
EgPG24 >M01000015281_RC:1,623 AAAAAAGATCCTTGTTACCCCACCTACTCCTTATACCAATCAAGGATAAGTACACTTCCTATCCAGTAGGCTTGATCTATTTTTTATGTTCAGTGTGTTCTCTGTATGTATGTATGATGAACAGAAGCATTCATGGAGAAGTATTTTGCCAGGGGATTCTAAGAGTTGCTCTAAAGTTTTTTTTCTTTTTCCTCCTTGGATTTCATCTGATCTGAGGTCTCACTACTTAGTTTCTGAGGCATGGTTTTGTGAGCCAGGTCTATGGATGATGGGTGAATAGGGTTGTTTTTGAAAGCTTTATGTTTTCATTTTTTAATTTTTTATTGAATGGTGCAGGATACATCGAGCTGGCCTTTGATCGATGCTTTGCCATCATATGGGAGAGGTCGGGAGCTACCTGGTGGGAGATATATGAGTCTGATTCATGGAAATGGAATTCATGATGTGATAATAACAGGTGAGAATGGAACAATTGATGGGCAAGGCGAGGTCTGGTGGAATATGTGGAGGCAAAGAACCCTACCTTTCACGAGACCAAATATATTGGAGCTCATGCATTCTAAAGATATTATTATTTCTAATGTGGTCTTCCAAAACTCACCATTTTGGAACATTCACCCTGT
EgPG25 >M01000031930_RC:1,710 CAAACTATGAGTACAACTTTGGAAAGCCTTATTAACCTAACTTCAAAGATGTCAAAACTGGTATTTTTATTTCAAAGATTGTTGTTACATAGGCAAGCCTTTCTGAGTAAGCTGGAAATTAATTAGCTTTGCAGATAATGGGAACTCATAGTTTTTCTTGTATTTTAATTGCATTGCCTTTATTTTCTCTGAATAATAATTTTCGATAATAACTGGCCATCTTATCTTTAATCAGAACCTGATCATGAATTTGAGTGCATTAGTATATGCACATATAATGACTGTAATATGTAGAATATCTTGTATGTTTATATATGTACGTAGGTATGTGTATATGTACGTATATATGTATGGCTGTATGCATTCATGTTATTTCGTTCTTTAATTTATCTCATTGCATACTAGTATGATTCTATGAACTAATTAATATGGGCATTATCCTTAAAAACATTACGTTAAATTTCTTTTGTCCCACTTCTTGTTCCCAGGTGAGAATGGAACAATTGATGGGCAAGGCGAGGTCTGGTGGAATATGTGGAGGCAAAGAACCCTACCTTTCCCGAGACCAAATATATTGGAGCTCATGCATTCTAAAGATATTATTATTTCTAATGTGGTCTTCCAAAACTCACCATTTTGGAACATTCACCCTGTTTATTGCAGTAATGTGGTAGTAAGAAATGTGACCGTGTTGGCTCCATATGACTCTC
EgPG26 >M01000039313:1,541 GGAGAATGTTAAAAACTGCATCATTATAGACCAGTACTATTGCCTAAGCAAGCAGTGTATGAATCAAACATCGGCGGTCTACGTAAAGGATGTCTCATACATGAACATAAAGGGGACGTATGATGTCAGGAGCCCACCAATACACTTTGCTTGCAGTGATGCCGTGCCATGCACCAACATCACCATGTCTGATGTGGAGCTGCTCCCATTTGATGGAGAGTTGGTGGATGACCCTTTTGTTGGAATGCCTATGGGAGCATGGAGACACTAACAATTCCACCCATCTCTTGCTTGCAGGAAGGGGAGCCTCAGTCCATCAAAGAGAACTCATACAGTCTCGGGCTGTGCTTTGTGGTGGCATTAGAAGAGATATATCTGTCAATCCTGTAAGTTCACGAGCTCTTGCAAAGAAGAGGACCTTAACCTCGATCCATGGACCCACTTCCCTTTCTTCCATGTCACTTGTTTTCTGCATCTTGGTTACTCCACCCGCTTTATTAGCAGCACAAGTGTCTTCGGATTCTTCCGCCATGGACGTAAC
EgPG27 >M01000041301_RC:1,603 TGATAAGGCACTCTGATAATGGTCTAAGGATCAAGACATGGCAGGGTGGTATGGGGACCGTATCGAGTATTAGCTTCGACACCGTATACCTGGAGAACGTAAGGAATTGTATCATCATAGACCAATACTATTGCTTGGACAAGAAGTGTAGGAATCAAACATCGGCGGTCTACGTATCCGATGTCTCATACACTAACATCAAAGGGACATACGATGTAAGGAGTGCCCCCATACACTTTGCATGCAGTGACACCGTGCCATGCACCAATATTACCATGTCGGAGGTCGAGCTACTACCTTATGAAGGGGAGCTTGTGGATGATCCCTTCTGTTGGAATGCTTATGGGGTCACACAGACCCTCACAATCCCTCCTATCCTTTTTGTTTGCAGGACTGGGCAGCCTCAGAATCTCCAGGACAGCTCCAATTATAATTGCTAACACAACATAACATGCTTTGGCCATAGCAAATAGTAGCCACATATAGAACATAGAATAAAGTCCAAGACCCGTACAGCTGATGAACAATTTAATTTTTCTTCGTTGTTCTGGCCATTGTGGGGCTTGCATGGTGTTTGTGAACCTTTTCTATATGTATTTGCTT
EgPG28 >M01000041909:1,534 CCTGCTACAATATTGTTATGTTCTGATTGAAATTTTTGATCCAATCCAAAATGAGAACAGATCCTTGGATTAATCCTGGGTTTAGACTGATGTCCGATGCACTTCTATTTGACCCTCACCAGACCCCGCAATGGTAAGAGCCTCGTGTACTAGGGTACCTCCCTTTTTTTGGTTTCCGACTTTTTATGGGTTAGATGTGGCCCAAGTAAGGTCTAGAACTGCTAAATGAGCTAAATTGTGCTGCCACAGCTGCTGCTAATATTGCTGATGCAGTTTCATTTTATATGGTCATTGCAGCATTGGGAGTTTAGGAAGATATCATAATGAAGGGGACGTCCGAGGACTCGTCATCAAAGATAGCACCCTTGCCGGGACTTCAAACGGTGTAAGGATCAAGACATGGGAGAACTCTCCAGGAACCAGTAAGGCTGTTAACATGACCTTTGAGAACATTG

Chapter 2
76
Table S2.3. (Cont.) List of the 28 sequences contained either a partial or complete
GH28 PG signature domain.
Name of genes sequence
TCATGAACAGTGTTGCAAATCCCATCATCATTGACCAGATGTACTGCCCCTANAGCTCTTGTGCATCAGATGCACCATC
EgPG29 >M01000051458:1,630 AAGGGTAGTTTAGTTCTCATAATCTTGGTGATATTAGTTTAATTTATCGTGTAGATGAAACTCATAGGCAAGTTTTTGGTGCACACAATAATATGAGAAGCCCTCTGCCTGTGTTCCCTGATTCCTCTATCCTGAATTAGGTGGGACTGGTTCTTAGGTCTCTGACAGAGCACAAAGTCATCATCAATGAATAAACTTTACCAGTGAACTCTAACAAGAACATTCTGATGCAATCCTATTATGACATTGCCCTACTTTAGATTTGGTGCTGTTTCCTATCTTAAGCCAGAAGAACATAAACTAATATGAGCAGTGAGTTTAGCTAAATCTTTCCTAACGTTCACCCTAAGAAAAATAAATTAAAATCAACACACAAAAACAATAGCAATGAGTGTATGTGATTGAATGCAGGCACCATCTGGGGTGATTCTGAGTGACATCTTCTTCCGGAACATAAGAGGGACGTCGACGACTCCGGTGGCGGTGACCCTCAGGTGCAGCAGAGGAGTGCCATGCAAGAACGTCAATCTCCAAGACGTCAACCTCAAGTACGTTGGCCAGCTTCCGGCCACTGCCTCGTGCATGAACGTCAAAGCAAGCTTCAGCGGGGACCCCAAAATCCCCCCNCCT
EgPG30 >M01000063855_RC:1,693 AGTTTACTCTGCTAAGAAAAAGAGCAAACAAAGCTACAATTCTGCTTCAAAGTTGCTAACGCTACTTTCTCCAGTTCAGCATGGCGATCCTTCGATCGCTGTTCTGTGTCTGGATGTTGGTCACATTGCTGTCATTGGGTCCCCAGAGCTCACTCGGAAGATCTCATTTCCATAAGAAGCAAAAGAGTACTCCGAAAAACGGTAAAGGCCATAGCTCTGTGTCCCCCTGTAAATTCCCCAGCAAACGCACCAGGTACTACCACTACCGATCCCTGCAATTCAAGCTCGGATCCATGTATCTTCGATGTGAGATCCTTCGGTGCGGTCGGTGATGGTTCCACCGATGACACCGAAGCATTCCGGTCGGCATGGAAGGAAGCCTGCTCCGTCGAGTCAGGTACGCTGCTCGTGCCGTCGGATGGCGTCTTCATGATCACTTCCACAATCTTCTCTGGCCCTTGCCAACCGGGGCTTGTGTTTCAAGTTGATGGAGTTTTGATGCCACCCAACGGCCCCGACTGCTGGCCAGAGTCCGACAGCAAGCTCCAGTGGCTCGTGTTTTATCGACTCGATGGGATGACTTTGAGAGGAGAAGGAACAATTGAAGGGAATGGAGAAGAGTGGTGGAACCTCCCCTGCAAACCCCACAGAGGGCCAAATGGATCCACATTGCCCGGACCTTGCAGCAGTCCT
EgPG32 >M01000031649_RC:1,535 GTACCGAGAATAGTTGTATAGGGCCTACAATAGACTGAAATAGGTCCCTCACTGCCAAGGAGGTGAGAAAGAAAGAAAGGAGGACCAAGAGAATCAGCCTCACAGTTCCACTTGGGCCATCTTTTAGCTTCCCCTCCTTTACCAAGTAGAGATGGATCTGCTACACTCCCTTGAGATTGAAACGAGGCATAAAACATCATCAAAGATTGTTTCTGTTCCTCACCTTTCCTTGTATAGATCCACTGTATAACACAACACATACTGCAGTGGTCAAACAAGTGTGAAAATCCCATATGTTTGCTGACATTAGAGTTTTGGCTTGTGTCATACAGGTGATGACTGCATCTCCATCCAAACAGGATGCTCAAATGTATACATACACAATGTGAACTGTGGACCAGGCCATGGGATTAGCATAGGCGGACTTGGGAAGGACAACACCAAAGCATGCGTCTCCAATATAACAGTAAGGGATGTCAACATGCATAACACGATGACTGGTGTCCGAATCAAGACCTGGCAGGTAACAAACTTC
EgPG34 >M01000044771_RC:1,534 TAAATTTTCCAGTACAAGTCAGGCAATAAAGTAGGCCTTGGCTAATAGTCGGTCGAAGCTGCACAACATGGCTAGACCAGCAAAGTTTCTGTCGCTGAAGAAAATAAAAACAATACTTATAGGCAATGCTGTCGAGGTGACAATCCACTGCCACCATCTTCACCATCACCGCCATTTTTTTGTGTAGGCACTGACCATAGATTCAAGCTCAAAGGTAGGGTGAAGGACCTCACCATCCAGAATGCACAGCAGATGCACTTCACCATCTCCCGATCTGATGCCATACGAGTGTCTGGGTTGCGTGTGAGAGCTCCACAAGACAGCCCTAACACAGATGGCATTCATATCAGTGAATCCACCAATGTTGCCATCCAGAACTGCCACATTGGAACAGGTACCTTGACATGCTTGTACATTGATCTACCATTCTGATATACCATACATGAAAGATTACCTGAAGGAAACGAGAAGAATAATAACAATAACAGTGATTATTCATTGACTTCACTATGACTGAAACTGCAATTAACTTCC
EgPG35 >M01000046001:1,808 AGCATAGGAGGACTCGGGAAAGGCAATAGCCCTAGCCTGTGTCTCCAATGTCACTGTTGATACGCATCAATGTTCAAAATGCTCTGTCTGGAGTAAGGATCAAAACATGGCAGGTAAATACTAAGAAGACATGTAAAAACCTTGATTTAGATGTACTGTAATACTAAATATGTGTCCACCAAAAAAGCCATGTAATCTTACCTTGTGATTTAAGAGATGCTACAAAAATAGTTGATTTATAACTCCTAAACTTTCATCACAGGGAGGTCTAGGATCTGTCAGGAATGTCATATTTTCCGATGTTCGAGTCTCCAATGTTGAGATCCCAGTTGTGATTGATCAGTATTACTGCAACAAGAAGGCATGCAAGAACAAGACTGATGCAGTGGCTGTTTCAGGAGTCATGTACAAAAGGATAACTGGGACATATTCATACCAACCAATGCATCTTGCTTGCAGTGACAGCAATCCATGCACGAGCATCAAATTGACTGATATCCGGCTATCACCAGTTAATGCATCTCAATTTCAGCAGGACGCCTTCTGCTGGAAGTCATATGGAGAGTCACAAGGTCCTCTTGAGCCTTTAAGCATTGGTTGCTTGCAAAGGACCAGTAGGTCCATCAAGCCCCTAATAAAGTCATCCAATCACACTTGCTAGGAAGTATGGCTATTCAATTTCTAGGGCTACTATATTGTTATCATGGCTTCCCCTTTCTGAACTTTGGACAGTAAGAAGGTGATGGTTTTTCTGATGCGTTGATAAGCAGGGAGTGATTCAAAGTTAATTCAGAGAAGAAGAGATTAT

Chapter 2
77
Gene
Fruit tissue, expression values, percentages and standard deviations
AZ M P
Means SD Means SD Means SD
Eth
yle
ne T
reatm
ent
Tim
e (
hours
)
0
EgPG1 0.01 0.003 0.06 0.02 0.10 0.10
EgPG3 0.71 0.03 5.65 0.27 7.29 0.38
EgPG4 94.32 2.38 4.37 0.38 7.11 0.96
EgPG7 0.11 0.01 0.88 0.22 1.15 0.11
EgPG8 0.27 0.02 9.95 0.90 10.84 0.41
EgPG9 0.26 0.01 3.88 0.53 7.28 0.90
EgPG10 1.26 0.02 15.04 1.88 20.01 1.05
EgPG11 1.55 0.12 42.68 2.56 10.82 1.03
EgPG16 0.13 0.01 1.96 0.16 3.23 0.12
EgPG17 0.02 0.002 3.41 0.53 4.29 0.43
EgPG18 1.21 0.07 9.58 0.66 24.46 0.98
EgPG19 0.03 0.004 0.82 0.15 1.20 0.12
EgPG22 0.03 0.01 1.35 0.05 1.32 0.19
EgPG26 0.09 0.01 0.37 0.06 0.92 0.21
TOTAL 100.00 2.70 100.00 8.37 100.00 7.01
6
EgPG1 0.002 0.0003 0.002 0.001 0.11 0.03
EgPG3 0.04 0.003 0.04 0.002 3.21 0.10
EgPG4 99.33 2.85 98.64 4.54 4.23 0.21
EgPG7 0.01 0.001 0.01 0.0004 0.58 0.03
EgPG8 0.01 0.002 0.004 0.0004 0.20 0.02
EgPG9 0.06 0.003 0.11 0.01 7.03 0.32
EgPG10 0.43 0.02 0.99 0.04 61.60 1.95
EgPG11 0.05 0.002 0.17 0.01 18.63 0.38
EgPG16 0.01 0.001 0.01 0.0005 0.42 0.01
EgPG17 0.002 0.001 0.003 0.001 0.57 0.10
EgPG18 0.04 0.003 0.02 0.001 2.83 0.27
EgPG19 0.002 0.0001 0.003 0.0002 0.12 0.02
EgPG22 0.005 0.001 0.004 0.001 0.13 0.04
EgPG26 0.02 0.001 0.01 0.001 0.33 0.05
TOTAL 100.00 2.70 100.00 4.60 100.00 3.54
Table S2.4. Percentages were calculated from gene expression data derived from qPCR
analysis that included individual values (3 technical repetitions) compared to the average
expression of the reference gene (EgΕF1α : elongation factor 1α), together with the standard
deviation (SD) for the following three tissue regions of the fruit: AZ, Abscission Zone; M,
Mesocarp; P, Pedicel.

Chapter 2
78
Figure S2.1. Phylogenetic analysis of EgPG4, EgPG8 and EgPG10 with sequences from Arabidopsis and rice.

Chapter 2
79
Literature Cited
Addicott, F. (1982). Abscission, University of California Press, Ltd. London.
Asif, M. H. and P. Nath (2005). "Expression of multiple forms of polygalacturonase gene
during ripening in banana fruit." Plant Physiol Biochem 43(2): 177-184.
Atkinson, R. G. (1994). "A cDNA clone for endopolygalacturonase from apple." Plant
Physiol 105(4): 1437-1438.
Berger, R. K. and P. D. Reid (1979). "Role of polygalacturonase in bean leaf abscission."
Plant Physiol 63(6): 1133-1137.
Bonghi, C., N. Rascio, A. Ramina and G. Casadoro (1992). "Cellulase and polygalacturonase
involvement in the abscission of leaf and fruit explants of peach." Plant Mol Biol
20(5): 839-848.
Bourgis, F., A. Kilaru, X. Cao, G. F. Ngando-Ebongue, N. Drira, J. B. Ohlrogge and V.
Arondel (2011). "Comparative transcriptome and metabolite analysis of oil palm and
date palm mesocarp that differ dramatically in carbon partitioning." P Natl Acad Sci
USA 108(30): 12527-12532.
Cooley, M. B. and J. I. Yoder (1998). "Insertional inactivation of the tomato
polygalacturonase gene." Plant Mol Biol 38(4): 521-530.
Degan, F. D., R. Child, I. Svendsen and P. Ulvskov (2001). "The cleavable N-terminal
domain of plant endopolygalacturonases from clade B may be involved in a regulated
secretion mechanism." J Biol Chem 276(38): 35297-35304.
Dellapenna, D., D. C. Alexander and A. B. Bennett (1986). "Molecular cloning of tomato
fruit polygalacturonase: Analysis of polygalacturonase mRNA levels during
ripening." Proc Natl Acad Sci U S A 83(17): 6420-6424.
Dellapenna, D., D. S. Kates and A. B. Bennett (1987). "Polygalacturonase Gene Expression
in Rutgers, rin, nor, and Nr Tomato Fruits." Plant Physiol 85(2): 502-507.
Dellapenna, D., J. E. Lincoln, R. L. Fischer and A. B. Bennett (1989). "Transcriptional
Analysis of Polygalacturonase and Other Ripening Associated Genes in Rutgers, rin,
nor, and Nr Tomato Fruit." Plant Physiol 90(4): 1372-1377.
Dereeper, A., V. Guignon, G. Blanc, S. Audic, S. Buffet, F. Chevenet, J. F. Dufayard, S.
Guindon, V. Lefort, M. Lescot, J. M. Claverie and O. Gascuel (2008). "Phylogeny.fr:
robust phylogenetic analysis for the non-specialist." Nucleic Acids Res 36(Web
Server issue): W465-469.

Chapter 2
80
Deytieux-Belleau, C., A. Vallet, B. Doneche and L. Geny (2008). "Pectin methylesterase and
polygalacturonase in the developing grape skin." Plant Physiol Biochem 46(7): 638-
646.
Fabi, J. P., B. R. Cordenunsi, G. B. Seymour, F. M. Lajolo and J. R. do Nascimento (2009).
"Molecular cloning and characterization of a ripening-induced polygalacturonase
related to papaya fruit softening." Plant Physiol Biochem 47(11-12): 1075-1081.
Felsenstein (1985). "Confidence Limits on Phylogenies: An Approach Using the Bootstrap."
Evolution 39(4): 783-791
Giovannoni, J. J., D. DellaPenna, A. B. Bennett and R. L. Fischer (1989). "Expression of a
chimeric polygalacturonase gene in transgenic rin (ripening inhibitor) tomato fruit
results in polyuronide degradation but not fruit softening." Plant Cell 1(1): 53-63.
Gonzalez-Carranza, Z. H., K. A. Elliott and J. A. Roberts (2007). "Expression of
polygalacturonases and evidence to support their role during cell separation processes
in Arabidopsis thaliana." J Exp Bot 58(13): 3719-3730.
Gonzalez-Carranza, Z. H., C. A. Whitelaw, R. Swarup and J. A. Roberts (2002). "Temporal
and spatial expression of a polygalacturonase during leaf and flower abscission in
oilseed rape and Arabidopsis." Plant Physiol 128(2): 534-543.
Hadfield, K. A. and A. B. Bennett (1998). "Polygalacturonases: Many Genes in Search of a
Function." Plant Physiol 117(2): 337-343.
Hadfield, K. A., J. K. C. Rose, D. S. Yaver, R. M. Berka and A. B. Bennett (1998).
"Polygalacturonase gene expression in ripe melon fruit supports a role for
polygalacturonase in ripening-associated pectin disassembly." Plant Physiol 117(2):
363-373.
Hayama, H., T. Shimada, H. Fujii, A. Ito and Y. Kashimura (2006). "Ethylene-regulation of
fruit softening and softening-related genes in peach." J Exp Bot 57(15): 4071-4077.
Henderson, J., H. A. Davies, S. J. Heyes and D. J. Osborne (2001). "The study of a
monocotyledon abscission zone using microscopic, chemical, enzymatic and solid
state 13C CP/MAS NMR analyses." Phytochemistry 56(2): 131-139.
Henderson, J. and D. J. Osborne (1990). "Cell Separation and Anatomy of Abscission in the
Oil Palm, Elaeis guineensis Jacq." J Exp Bot 41(2): 203-210.
Henderson, J. and D. J. Osborne (1994). "Inter-tissue signalling during the two-phase
abscission in oil palm fruit." J Exp Bot 45(7): 943-951.
Chapter 2
81
Hong, S. B. and M. L. Tucker (1998). "Genomic organization of six tomato
polygalacturonases and 5 ' upstream sequence identity with tap1 and win2 genes."
Mol Gen Genet 258(5): 479-487.
Huang, L., J. Cao, A. Zhang, Y. Ye, Y. Zhang and T. Liu (2009a). "The polygalacturonase
gene BcMF2 from Brassica campestris is associated with intine development." J Exp
Bot 60(1): 301-313.
Huang, L., Y. Ye, Y. Zhang, A. Zhang, T. Liu and J. Cao (2009b). "BcMF9, a novel
polygalacturonase gene, is required for both Brassica campestris intine and exine
formation." Ann Bot 104(7): 1339-1351.
Jabnoune, M., S. Espeout, D. Mieulet, C. Fizames, J. L. Verdeil, G. Conejero, A. Rodriguez-
Navarro, H. Sentenac, E. Guiderdoni, C. Abdelly and A. A. Very (2009). "Diversity
in expression patterns and functional properties in the rice HKT transporter family."
Plant Physiol 150(4): 1955-1971.
Jenkins, E. S., W. Paul, S. A. Coupe, S. J. Bell, E. C. Davies and J. A. Roberts (1996).
"Characterization of an mRNA encoding a polygalacturonase expressed during pod
development in oilseed rape (Brassica napus L)." J Exp Bot 47(294): 111-115.
Jenkins, E. S., W. Paul, M. Craze, C. A. Whitelaw, A. Weigand and J. A. Roberts (1999).
"Dehiscence-related expression of an Arabidopsis thaliana gene encoding a
polygalacturonase in transgenic plants of Brassica napus." Plant Cell Environ 22(2):
159-167.
Jiang, C. Z., F. Lu, W. Imsabai, S. Meir and M. S. Reid (2008). "Silencing polygalacturonase
expression inhibits tomato petiole abscission." J Exp Bot 59(4): 973-979.
Jones, D. T., W. R. Taylor and J. M. Thornton (1992). "The rapid generation of mutation data
matrices from protein sequences." Comput Appl Biosci 8(3): 275-282.
Kalaitzis, P., S. M. Koehler and M. L. Tucker (1995). "Cloning of a tomato
polygalacturonase expressed in abscission." Plant Mol Biol 28(4): 647-656.
Kalaitzis, P., T. Solomos and M. L. Tucker (1997). "Three Different Polygalacturonases Are
Expressed in Tomato Leaf and Flower Abscission, Each with a Different Temporal
Expression Pattern." Plant Physiol 113(4): 1303-1308.
Kim, J. and S. E. Patterson (2006). "Expression divergence and functional redundancy of
polygalacturonases in floral organ abscission." Plant Signal Behav 1(6): 281-283.
Kim, J., S.-H. Shiu, S. Thoma, W.-H. Li and S. Patterson (2006). "Patterns of expansion and
expression divergence in the plant polygalacturonase gene family." Genome Biol
7(9): R87.

Chapter 2
82
Leslie, M. E., M. W. Lewis and S. J. Liljegren (2007). Organ Abscission. Annual Plant
Reviews Volume 25: Plant Cell Separation and Adhesion, Blackwell Publishing Ltd:
106-136.
Lester, D. R., J. Speirs, G. Orr and C. J. Brady (1994). "Peach (Prunus persica)
endopolygalacturonase cDNA isolation and mRNA analysis in melting and
nonmelting peach cultivars." Plant Physiol 105(1): 225-231.
Mbéguié-A-Mbéguié, D., O. Hubert, F. C. Baurens, T. Matsumoto, M. Chillet, B. Fils-
Lycaon and S. Sidibé-Bocs (2009). "Expression patterns of cell wall-modifying genes
from banana during fruit ripening and in relationship with finger drop." J Exp Bot
60(7): 2021-2034.
Morcillo, F., C. Gagneur, H. Adam, F. Richaud, R. Singh, S.-C. Cheah, A. Rival, Y. Duval
and J. W. Tregear (2006). "Somaclonal variation in micropropagated oil palm.
Characterization of two novel genes with enhanced expression in epigenetically
abnormal cell lines and in response to auxin." Tree Physiol 26(5): 585-594.
Murayama, H., D. Sekine, Y. Yamauchi, M. Gao, W. Mitsuhashi and T. Toyomasu (2006).
"Effect of girdling above the abscission zone of fruit on 'Bartlett' pear ripening on the
tree." J Exp Bot 57(14): 3679-3686.
Ogawa, M., P. Kay, S. Wilson and S. M. Swain (2009). "ARABIDOPSIS DEHISCENCE
ZONE POLYGALACTURONASE1 (ADPG1), ADPG2, and QUARTET2 Are
Polygalacturonases Required for Cell Separation during Reproductive Development
in Arabidopsis." Plant Cell 21(1): 216-233.
Osborne, D. J., J. Henderson and R. H. V. Corley (1992). "Controlling fruit-shedding in the
oil palm." Endeavour 16(4): 173-177.
Petersen, M., L. Sander, R. Child, H. vanOnckelen, P. Ulvskov and B. Borkhardt (1996).
"Isolation and characterisation of a pod dehiscence zone-specific polygalacturonase
from Brassica napus." Plant Mol Biol 31(3): 517-527.
Pfaffl, M. W. (2001). "A new mathematical model for relative quantification in real-time RT-
PCR." Nucleic Acids Res 29(9): e45.
Rival, A. (2007). Oil Palm. Biotechnology in Agriculture and Forestry, Springer-Verlag
Berlin Heidelberg. 61: 59-80.
Roberts, J. A., K. A. Elliott and Z. H. Gonzalez-Carranza (2002). "Abscission, Dehiscence,
and Other Cell Separation Processes." Annu Rev Plant Biol 53(1): 131-158.
Roberts, J. A., B. Schindler and G. A. Tucker (1984). "Ethylene-promoted tomato flower
abscission and the possible involvement of an inhibitor." Planta 160: 159-163.

Chapter 2
83
Saitou, N. and M. Nei (1987). "The neighbor-joining method: a new method for
reconstructing phylogenetic trees." Mol Biol Evol 4(4): 406-425.
Sander, L., R. Child, P. Ulvskov, M. Albrechtsen and B. Borkhardt (2001). "Analysis of a
dehiscence zone endo-polygalacturonase in oilseed rape (Brassica napus) and
Arabidopsis thaliana: evidence for roles in cell separation in dehiscence and
abscission zones, and in stylar tissues during pollen tube growth." Plant Mol Biol
46(4): 469-479.
Sekine, D., I. Munemura, M. Gao, W. Mitsuhashi, T. Toyomasu and H. Murayama (2006).
"Cloning of cDNAs encoding cell-wall hydrolases from pear (Pyrus communis) fruit
and their involvement in fruit softening and development of melting texture." Physiol
Plant 126(2): 163-174.
Sexton, R. and J. A. Roberts (1982). "Cell Biology of Abscission." Ann Rev Plant Physio
33(1): 133-162.
Sheehy, R. E., M. Kramer and W. R. Hiatt (1988). "Reduction of polygalacturonase activity
in tomato fruit by antisense RNA." Proc Natl Acad Sci USA 85(23): 8805-8809.
Sitrit, Y. and A. B. Bennett (1998). "Regulation of tomato fruit polygalacturonase mRNA
accumulation by ethylene: A Re-examination." Plant Physiol 116(3): 1145-1150.
Sitrit, Y., K. A. Hadfield, A. B. Bennett, K. J. Bradford and A. B. Downie (1999).
"Expression of a polygalacturonase associated with tomato seed germination." Plant
Physiol 121(2): 419-428.
Smith, C. J., C. F. Watson, P. C. Morris, C. R. Bird, G. B. Seymour, J. E. Gray, C. Arnold, G.
A. Tucker, W. Schuch, S. Harding and et al. (1990). "Inheritance and effect on
ripening of antisense polygalacturonase genes in transgenic tomatoes." Plant Mol Biol
14(3): 369-379.
Smith, C. J. S., C. F. Watson, J. Ray, C. R. Bird, P. C. Morris, W. Schuch and D. Grierson
(1988). "Antisense RNA inhibition of polygalacturonase gene expression in
transgenic tomatoes." Nature 334(6184): 724-726.
Tacken, E., H. Ireland, K. Gunaseelan, S. Karunairetnam, D. Wang, K. Schultz, J. Bowen, R.
G. Atkinson, J. W. Johnston, J. Putterill, R. P. Hellens and R. J. Schaffer (2010). "The
role of ethylene and cold temperature in the regulation of the apple
POLYGALACTURONASE1 gene and fruit softening." Plant Physiol 153(1): 294-
305.
Taylor, J. E., G. A. Tucker, Y. Lasslett, C. J. S. Smith, C. M. Arnold, C. F. Watson, W.
Schuch, D. Grierson and J. A. Roberts (1990). "Polygalacturonase expression during
leaf abscission of normal and transgenic tomato plants." Planta 183(1): 133-138.

Chapter 2
84
Taylor, J. E., S. T. J. Webb, S. A. Coupe, G. A. Tucker and J. A. Roberts (1993). "Changes in
Polygalacturonase Activity and Solubility of Polyuronides during Ethylene-stimulated
Leaf Abscission in Sambucus nigra." J Exp Bot 44(1): 93-98.
Taylor, J. E. and C. A. Whitelaw (2001). "Signals in abscission." New Phytol 151(2): 323-
340.
Tebbutt, S. J., H. J. Rogers and D. M. Lonsdale (1994). "Characterization of a tobacco gene
encoding a pollen-specific polygalacturonase." Plant Mol Biol 25(2): 283-297.
Thompson, J. D., D. G. Higgins and T. J. Gibson (1994). "CLUSTAL W: improving the
sensitivity of progressive multiple sequence alignment through sequence weighting,
position-specific gap penalties and weight matrix choice." Nucleic Acids Res 22(22):
4673-4680.
Torki, M., P. Mandaron, R. Mache and D. Falconet (2000). "Characterization of a ubiquitous
expressed gene family encoding polygalacturonase in Arabidopsis thaliana." Gene
242(1-2): 427-436.
Tranbarger, T. J., S. Dussert, T. Joët, X. Argout, M. Summo, A. Champion, D. Cros, A.
Omore, B. Nouy and F. Morcillo (2011). "Regulatory mechanisms underlying oil
palm fruit mesocarp maturation, ripening and functional specialization in lipid and
carotenoid metabolism." Plant Physiol.
Tucker, G. A., B. Schindler and J. A. Roberts (1984). "Flower abscission in mutant tomato
plants." Planta 160: 164-167.
Tucker, M. L., A. Burke, C. A. Murphy, V. K. Thai and M. L. Ehrenfried (2007). "Gene
expression profiles for cell wall-modifying proteins associated with soybean cyst
nematode infection, petiole abscission, root tips, flowers, apical buds, and leaves." J
Exp Bot 58(12): 3395-3406.
Wang, Z. Y., E. A. MacRae, M. A. Wright, K. M. Bolitho, G. S. Ross and R. G. Atkinson
(2000). "Polygalacturonase gene expression in kiwifruit: relationship to fruit softening
and ethylene production." Plant Mol Biol 42(2): 317-328.

85
Chapter 3. Abscission Zone Development and Acquisition of
Competence for Cell Separation Functions and Response to
Ethylene

Chapter 3
86
Introduction
Abscission can also occur in various parts of plant such as leaf (Belfield et al. 2005),
flower (Patterson and Bleecker 2004), and fruit (Cin et al. 2005). Ethylene-containing
illuminating gas was first reported in defoliation between 1860 and 1870 (Burg 1968). Since
ethylene is recognized as a plant organ shedding and separation substance, studies have been
performed in many plant species such as Arabidopsis (Francis et al. 2006), apple (Li and
Yuan 2008), tomato (Gonzalez-Bosch et al. 1997), and oil palm (Henderson and Osborne
1994).
Cell separation occurring during abscission is a tissue and cellular process involving
the differentiation of a special zone located at the base of the organ called abscission zone
(AZ). Generally, the plant AZ consists of one to several layers of cells. Cells in this zone
have isodiametrically shape with dense cytoplasms (Addicott 1982; Sexton and Roberts
1982; Roberts et al. 2002). The oil palm AZ has distinct characteristics. It has two main AZs,
called primary and adjacent zones. The primary zone is the first area to be separated while
adjacent zones separate only after the primary zone has separated, that suggested an inducing
signal arises from the primary zone (Henderson and Osborne 1994). Adjacent cell walls are
joined together by the middle lamella composed primarily of pectin. Pectin, known as the
most structurally complex family of cell wall polysaccharides, is a major component of
primary walls of both monocots and dicots (Mohnen 2008). Pectin is also the main
component of the middle lamella between adjacent cells (Willats et al. 2001a; O'Neill et al.
2004). It is of paramount importance for cell adhesion and during cell separation (Jarvis et al.
2003). However, the structural characteristics and the role of how pectin functions during cell
separation are not completely understood.
The methyl-esterification of homogalacturonan (HG) plays an important role during
plant development, can modulate the functionality of the pectin, and plays particular roles for
Chapter 3
87
cell adhesion and for cell separation to occur (Jarvis et al. 2003). HG is thought to be
synthesized in the golgi complex, targeted through vesicles via the PM to the apoplast and
finally inserted into the cell wall in a highly methylated form (Kauss and Hassid 1967; Zhang
and Staehelin 1992; Lennon and Lord 2000). However, the current model of pectin synthesis
is limited to studies on only a few species and developmental contexts, and therefore may not
be universal. In ripe oil palm fruit, high levels of unmethylated pectin shows in AZ
(Henderson et al. 2001a). During development, cells undergo de-esterification and when
intercellular spaces arise after cell division, modulation of the methyl-esterification status
occurs at cell junctions for separation to take place (Willats et al. 2001b). It is believed that
de-esterification allows the formation of calcium (Ca2+
) cross links resulting in the “egg-box”
pectin configuration between adjacent polymers (Grant et al. 1973; Cosgrove 2005). The de-
esterification of HG is catalyzed by enzymes called pectin methylesterases (PME, EC
3.1.1.11) which modulate the methylation status of pectin HG (Pelloux et al. 2007). Besides,
de-esterification-related crosslinking increases pectin rigidity and may also allow targeting of
other cell wall modifying or pectin-degrading enzymes such as polygalacturonase (PG, EC
3.2.1.15) that further modify the texture and rigidity of the cell wall and may have roles
during cell separation processes such as those controlling organ abscission (Hadfield and
Bennett 1998).
The objectives of this chapter are:
1. To determine the cellular characteristic changes associated to the development of
the AZ during oil palm fruit development and after shedding to provide insight in to the
mechanisms that underlie the acquisition of AZ function.
2. To examine changes in cellular characteristics related to cell separation to gain
insight into the underlying mechanisms of AZ function.

Chapter 3
88
In this chapter, classical histology stained with different dyes was used to examine
cellular characteristics of the oil palm fruit AZ. Toluidine blue is a metachromasia compound
that stains lignin and phenols to bluish-green with a pH-independent covalent bonding and
non-lignin cell wall components to reddish-violet (acid) (e.g. pectin) and bluish-violet
(neutral) (Conrad 2008). Ruthenium red is a specific dye to pectin, which selectively binds to
the intramolecular spaces of carboxyl groups of pectin (Hou et al. 1999; Usadel et al. 2004;
Leroux et al. 2007).
Due to the resolution limitation of low contrast microscopy, the electron microscope
(EM) was used to allow a more detailed histological characterization. EM achieves resolution
lower than 20 Å in micrographs (Watson 1958). Thus, the electron microscope was also used
in this experiment in order to determine ultrastructure characteristics.
In the current study, the use of immunochemical techniques were employed to
characterize the pectin in the cell walls of the AZ compared to the neighbouring mesocarp
(M) and pedicel (P) tissues during development and cell separation that leads to fruit
shedding. Advantages of immunochemical techniques over other methods such as chemical
methods in structural analysis of pectin are the relatively small amounts of material required,
possible to use for single cell wall localization, and no pectin property changes (Willats et al.
2000). Willats et al. (2000), found that JIM5 and JIM7 both bound preferentially to samples
with a wide methyl-esterification pattern rather to fully de-esterified pectin. In order to
understand the epitope structures recognized by JIM5, JIM7 and LM7, another pectin
antibody, Clausen et al, 2003 used five methyl hexagalacturonates with varying occurrences
of methyl-ester groups (Figure 3.1). Competitive-inhibition ELISAs were used by
determining the effectiveness of the methyl hexagalacturonates in inhibiting the binding of
the antibodies to model pectin (Figure 3.1). JIM5 was inhibited by compounds 1 and 2 and it
was concluded that JIM5 requires at least four contiguous un-esterified residues between or

Chapter 3
89
adjacent to a methyl-ester group to optimally bind. In contrast, JIM7 was inhibited by
compounds 3, 4 and 5, which indicated that the important features of the JIM7 epitope are
methyl-ester groups at every second residue and no preference for the esterification state of
the intervening residue. LM7 was inhibited only by compound 1, indicating that LM7
requires four un-esterified GalA residues between methyl-ester groups. The epitope of LM8
is xylogalacturonan (XGA) associated with detached cells or supposed to be detached cells in
pea and legume (Willats et al. 2004).

Chapter 3
90
Figure 3.1. Structure of methyl hexagalacturonates (compounds 1-5) used as potential
haptens. The presence or absence of methyl-ester groups is shown for each residue (R1 to R
6).
The methyl-esterification pattern of each compound is shown schematically. The inhibited
antibodies are shown for each compound. Adapted from (Clausen et al. 2003)

Chapter 3
91
Results
Cellular studies of the oil palm fruit abscission zone
Cellular characteristics of the primary abscission zone of ripe fruit
At 30 DAP, cell division and expansion known to take place in the M at this stage
(Tranbarger et al. (2011). The size of the fruit increases dramatically from 30 DAP to 60
DAP fruit. After that, 120 DAP is the beginning of maturation stage by an increase in M fresh
mass and the beginning of lipid accumulation (Tranbarger et al. 2011). During maturation,
the ripening stage starts at 140 DAP and continues until the fruit are shed. During the
ripening process, the signal initiating cell separation starts and leads to the final step: fruit
shedding at the AZ (Osborne et al. 1992). The ethylene treatment experimental data
presented in Chapter Two clearly showed that fruits at 30, 120, and 180 DAP responded to
ethylene differently. 30 DAP fruits abscised at 24 h with ethylene treatment, while 120 DAP
and 180 DAP fruits started to abscised at 12 h and 9 h with ethylene treatment. The selected
ages of fruit in this experiment are good stages to examine the developmental aspects but in
relation to ethylene treatment.
At the ripe stage of development, around 180 DAP, the fruit AZ are fully functional to
respond to the signals that start the process of cell separation and lead to fruit shedding. In the
following section, I have performed a detailed description of the AZ at this precise stage of
fruit development, just before cell separation process.
In the AZ there are two main types of tissues: parenchyma tissue and vascular bundles
(phloem and xylem, vascular parenchyma). In addition, parenchyma tissue has two cell types:
non-polyphenol containing parenchyma cells and polyphenol-containing parenchyma cells
(Figure 3.2 B). Polyphenol-containing cells can be found throughout three fruit tissues (M,
AZ, and P) with a high amount in the P and AZ tissues (Figure 3.2 A). Parenchyma cells in
AZ appear smaller than those in adjoining tissues (M and P) (Figure 3.2) and they have a lot

Chapter 3
92
of different shape particles accumulated inside them which are supposed to be acidic pectin
because they are stained with toluidine blue in reddish-violet, and ruthenium red (Figure 3.2
B, 2.4 H, and Figure 3.10 C). One other interesting characteristic is the well aligned nuclei of
the AZ cells which can easily be used to count the AZ cell layers after DAPI staining (Figure
3.2 C, and D). Generally, there are 8-10 cell layers in AZ and possibly more or less in some
regions. Vascular tissues have another interesting characteristic of non-fully differentiated
tissues which is unlignified when passing through the AZ and becoming lignified in non-AZ
tissues (Figure 3.2 A, and B).
Ontogenesis and cellular characteristic evolution of primary AZ during fruit development
Because the previous data showed a difference in the response to ethylene depend on
stage of fruit development and consequently affected the number of fruit separated (Figure
2.1), we decided to compare the AZ at the cellular level at 30, 120 and 180 DAP that
represent different degrees of capacity for the AZ to function. An overview of the cellular
characteristics of the M, AZ and P during these three stages of fruit development is shown in
Figures 3.3, 3.4, and 3.7-3.9.
At 30 DAP, differences in the orientation of cell division between M, AZ and P are
visible. In the AZ, cell division is periclinal while in the M and P, cell divisions are anticlinal
(Figure 3.4 A-C, see arrows). The cell shape at this stage is quite isodiametric (Figure 3.7).
Vascular parenchyma tissues have not been lignified yet but can be distinguished from
parenchyma cells (longer thinner cells) (Figure 3.2 B). As mentioned before, polyphenol-
containing cells are found among M, AZ and P parenchyma cells but are most evident in P
and AZ (Figure 3.3 A). Nuclear alignment is starting to be visualized in vascular tissues. It is
easily to define nucleus by conventional histological method. At 120 DAP, most of the cells
have finished cell division, however, a few recent cell divisions can be observed (Figure 3.4
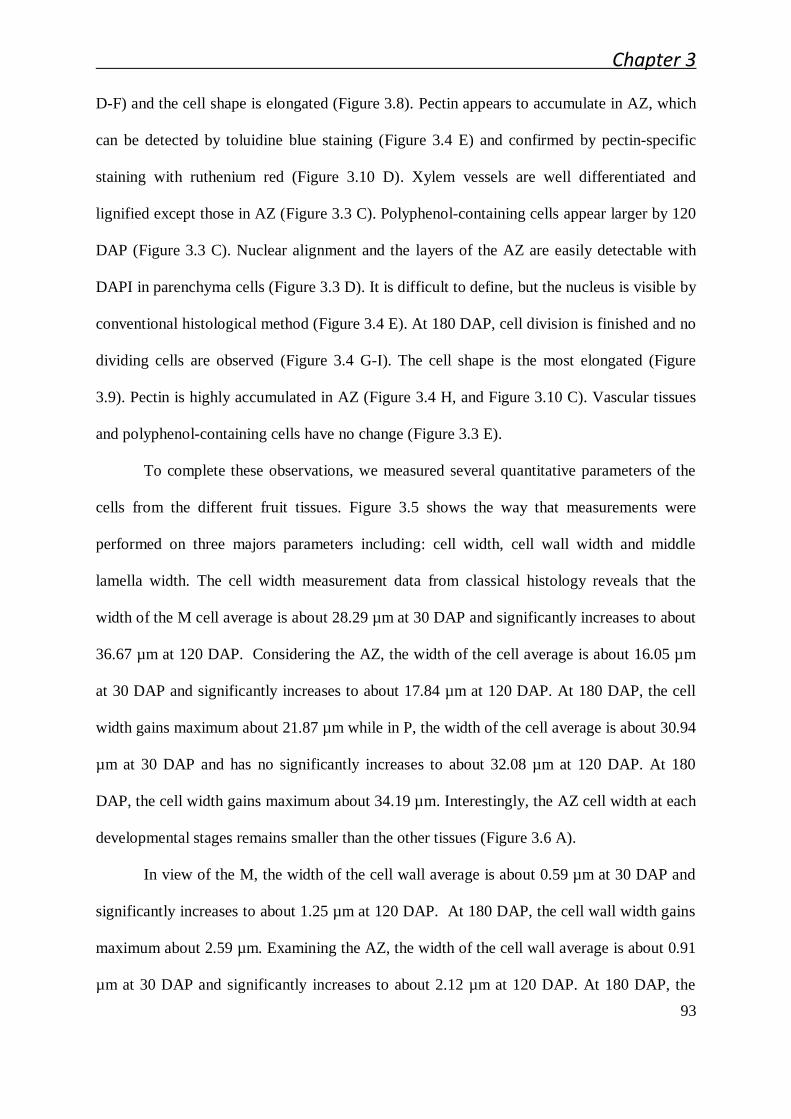
Chapter 3
93
D-F) and the cell shape is elongated (Figure 3.8). Pectin appears to accumulate in AZ, which
can be detected by toluidine blue staining (Figure 3.4 E) and confirmed by pectin-specific
staining with ruthenium red (Figure 3.10 D). Xylem vessels are well differentiated and
lignified except those in AZ (Figure 3.3 C). Polyphenol-containing cells appear larger by 120
DAP (Figure 3.3 C). Nuclear alignment and the layers of the AZ are easily detectable with
DAPI in parenchyma cells (Figure 3.3 D). It is difficult to define, but the nucleus is visible by
conventional histological method (Figure 3.4 E). At 180 DAP, cell division is finished and no
dividing cells are observed (Figure 3.4 G-I). The cell shape is the most elongated (Figure
3.9). Pectin is highly accumulated in AZ (Figure 3.4 H, and Figure 3.10 C). Vascular tissues
and polyphenol-containing cells have no change (Figure 3.3 E).
To complete these observations, we measured several quantitative parameters of the
cells from the different fruit tissues. Figure 3.5 shows the way that measurements were
performed on three majors parameters including: cell width, cell wall width and middle
lamella width. The cell width measurement data from classical histology reveals that the
width of the M cell average is about 28.29 µm at 30 DAP and significantly increases to about
36.67 µm at 120 DAP. Considering the AZ, the width of the cell average is about 16.05 µm
at 30 DAP and significantly increases to about 17.84 µm at 120 DAP. At 180 DAP, the cell
width gains maximum about 21.87 µm while in P, the width of the cell average is about 30.94
µm at 30 DAP and has no significantly increases to about 32.08 µm at 120 DAP. At 180
DAP, the cell width gains maximum about 34.19 µm. Interestingly, the AZ cell width at each
developmental stages remains smaller than the other tissues (Figure 3.6 A).
In view of the M, the width of the cell wall average is about 0.59 µm at 30 DAP and
significantly increases to about 1.25 µm at 120 DAP. At 180 DAP, the cell wall width gains
maximum about 2.59 µm. Examining the AZ, the width of the cell wall average is about 0.91
µm at 30 DAP and significantly increases to about 2.12 µm at 120 DAP. At 180 DAP, the
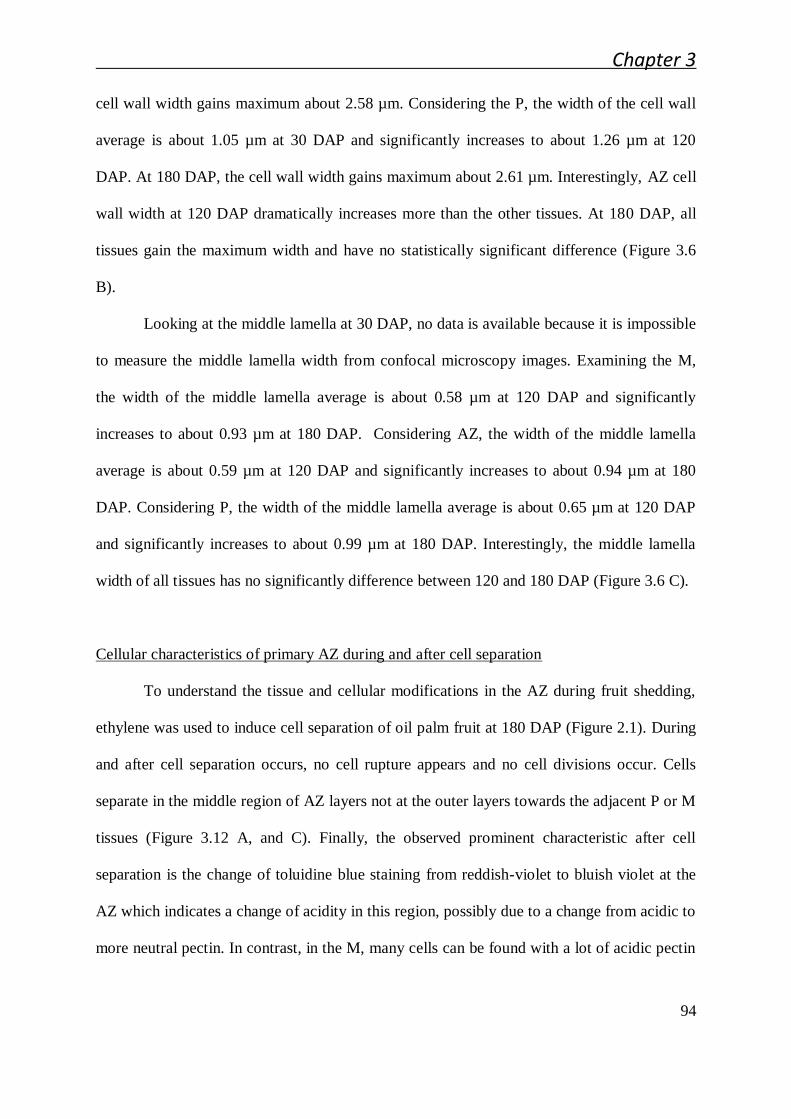
Chapter 3
94
cell wall width gains maximum about 2.58 µm. Considering the P, the width of the cell wall
average is about 1.05 µm at 30 DAP and significantly increases to about 1.26 µm at 120
DAP. At 180 DAP, the cell wall width gains maximum about 2.61 µm. Interestingly, AZ cell
wall width at 120 DAP dramatically increases more than the other tissues. At 180 DAP, all
tissues gain the maximum width and have no statistically significant difference (Figure 3.6
B).
Looking at the middle lamella at 30 DAP, no data is available because it is impossible
to measure the middle lamella width from confocal microscopy images. Examining the M,
the width of the middle lamella average is about 0.58 µm at 120 DAP and significantly
increases to about 0.93 µm at 180 DAP. Considering AZ, the width of the middle lamella
average is about 0.59 µm at 120 DAP and significantly increases to about 0.94 µm at 180
DAP. Considering P, the width of the middle lamella average is about 0.65 µm at 120 DAP
and significantly increases to about 0.99 µm at 180 DAP. Interestingly, the middle lamella
width of all tissues has no significantly difference between 120 and 180 DAP (Figure 3.6 C).
Cellular characteristics of primary AZ during and after cell separation
To understand the tissue and cellular modifications in the AZ during fruit shedding,
ethylene was used to induce cell separation of oil palm fruit at 180 DAP (Figure 2.1). During
and after cell separation occurs, no cell rupture appears and no cell divisions occur. Cells
separate in the middle region of AZ layers not at the outer layers towards the adjacent P or M
tissues (Figure 3.12 A, and C). Finally, the observed prominent characteristic after cell
separation is the change of toluidine blue staining from reddish-violet to bluish violet at the
AZ which indicates a change of acidity in this region, possibly due to a change from acidic to
more neutral pectin. In contrast, in the M, many cells can be found with a lot of acidic pectin
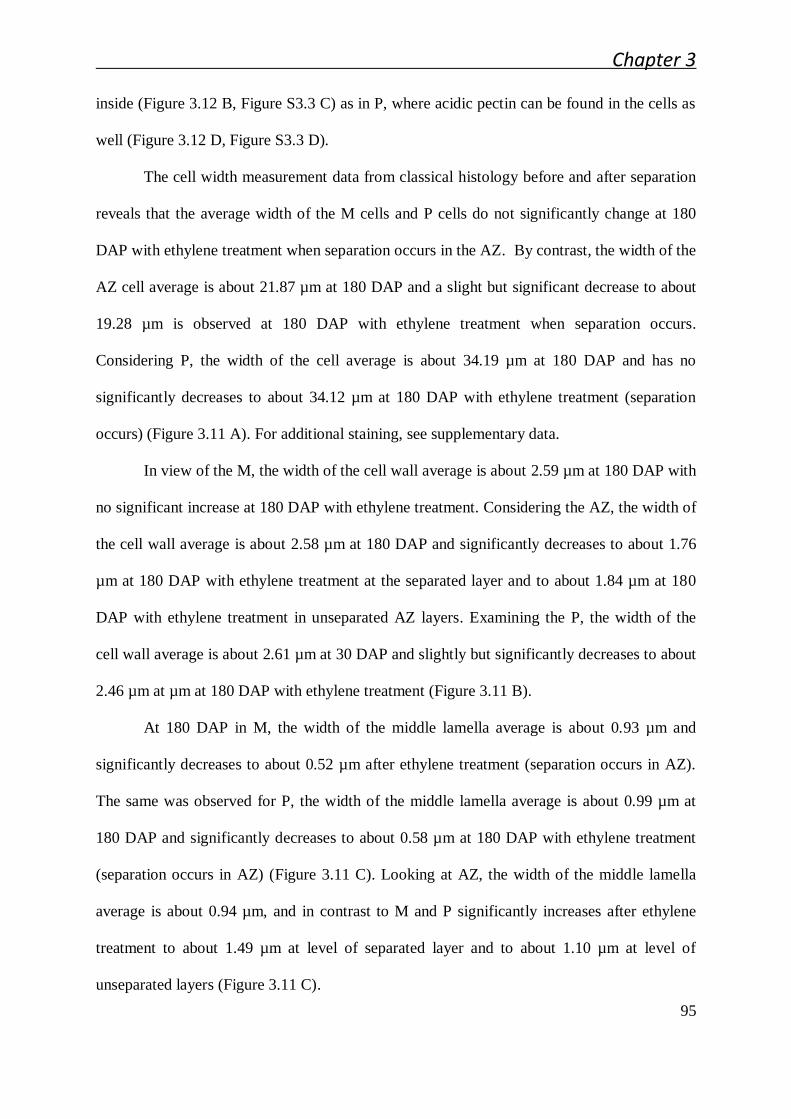
Chapter 3
95
inside (Figure 3.12 B, Figure S3.3 C) as in P, where acidic pectin can be found in the cells as
well (Figure 3.12 D, Figure S3.3 D).
The cell width measurement data from classical histology before and after separation
reveals that the average width of the M cells and P cells do not significantly change at 180
DAP with ethylene treatment when separation occurs in the AZ. By contrast, the width of the
AZ cell average is about 21.87 µm at 180 DAP and a slight but significant decrease to about
19.28 µm is observed at 180 DAP with ethylene treatment when separation occurs.
Considering P, the width of the cell average is about 34.19 µm at 180 DAP and has no
significantly decreases to about 34.12 µm at 180 DAP with ethylene treatment (separation
occurs) (Figure 3.11 A). For additional staining, see supplementary data.
In view of the M, the width of the cell wall average is about 2.59 µm at 180 DAP with
no significant increase at 180 DAP with ethylene treatment. Considering the AZ, the width of
the cell wall average is about 2.58 µm at 180 DAP and significantly decreases to about 1.76
µm at 180 DAP with ethylene treatment at the separated layer and to about 1.84 µm at 180
DAP with ethylene treatment in unseparated AZ layers. Examining the P, the width of the
cell wall average is about 2.61 µm at 30 DAP and slightly but significantly decreases to about
2.46 µm at µm at 180 DAP with ethylene treatment (Figure 3.11 B).
At 180 DAP in M, the width of the middle lamella average is about 0.93 µm and
significantly decreases to about 0.52 µm after ethylene treatment (separation occurs in AZ).
The same was observed for P, the width of the middle lamella average is about 0.99 µm at
180 DAP and significantly decreases to about 0.58 µm at 180 DAP with ethylene treatment
(separation occurs in AZ) (Figure 3.11 C). Looking at AZ, the width of the middle lamella
average is about 0.94 µm, and in contrast to M and P significantly increases after ethylene
treatment to about 1.49 µm at level of separated layer and to about 1.10 µm at level of
unseparated layers (Figure 3.11 C).
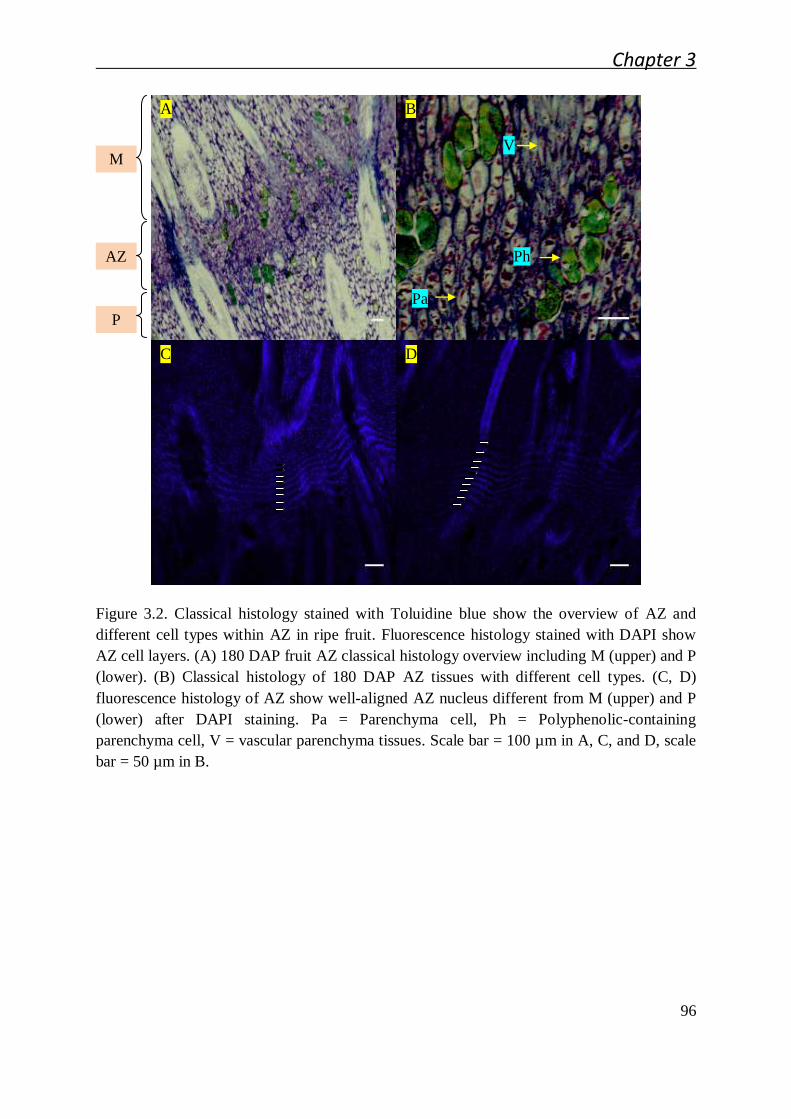
Chapter 3
96
Figure 3.2. Classical histology stained with Toluidine blue show the overview of AZ and
different cell types within AZ in ripe fruit. Fluorescence histology stained with DAPI show
AZ cell layers. (A) 180 DAP fruit AZ classical histology overview including M (upper) and P
(lower). (B) Classical histology of 180 DAP AZ tissues with different cell types. (C, D)
fluorescence histology of AZ show well-aligned AZ nucleus different from M (upper) and P
(lower) after DAPI staining. Pa = Parenchyma cell, Ph = Polyphenolic-containing
parenchyma cell, V = vascular parenchyma tissues. Scale bar = 100 µm in A, C, and D, scale
bar = 50 µm in B.
A B
C D
V
Pa
Ph AZ
M
P

Chapter 3
97
Figure 3.3. Comparison of AZ during developmental stages by classical histology and
fluorescence histology after DAPI staining. (A, B) 30 DAP classical histology and
fluorescence histology, respectively. (C, D) 120 DAP classical histology and fluorescence
histology, respectively. (E, F) 180 DAP classical histology and fluorescence histology,
respectively. Scale bar = 100 µm.
A B
C D
E F
AZ
M
P

Chapter 3
98
Figure 3.4. Classical histology stained with toluidine blue show M, AZ, and P cells during
fruit development at 30, 120, and 180 DAP. (A) 30 DAP M shows cell division in anticlinal
direction. (D), and (G) show 120, and 180 DAP M, respectively. (B) 30 DAP AZ shows cell
division in periclinal direction. (E), and (H) show 120, and 180 DAP AZ accumulating
pectic-supposed substances inside, respectively. (C) 30 DAP P shows cell division in
anticlinal direction. (F), and (I) show 120, and 180 DAP P, respectively. N = Nucleus.
Scalebar = 10 µm.
A D G
B E H
C F I
Mes
oca
rp
30 DAP 120 DAP 180 DAP
N
N N
Absc
issi
on z
one
Ped
icel

Chapter 3
99
Figure 3.5. Adapted plant cell wall diagram (http://www.ccrc.uga.edu/~mao/intro/ouline.htm)
shows measured region for cell width (measured under low contrast microscopy images), cell
wall width (measured under confocal microscopy images), and middle lamella width
(measured under confocal microscopy images). The red bracket represents the measured cell
width. The green straight line represents the measured cell wall width. The red straight line
represents the measured middle lamella.

Chapter 3
100
Figure 3.6. Characterization of the cells by measuring cell width, cell wall width, and middle
lamella width. (A) cell width, (B) cell wall width, and (C) middle lamella width of different
tissues during development. The same lower case alphabets represent non-statistical
significance. The different lower case alphabets represent statistical significance. The two
lower case alphabets represent non-statistical significance to the shared alphabet one. The
error bars represents standard deviation.
a d dg b e f c cg dg 0
10
20
30
40
50
30 120 180
µm
DAP
Cell Width
Mesocarp
Abscission zone
Pedicel
a d f b e f c d f 0
0.5
1
1.5
2
2.5
3
3.5
30 120 180
µm
DAP
Cell Wall Width
Mesocarp
Abscission zone
Pedicel
a b a b a b 0
0.5
1
1.5
30 120 180
µm
DAP
Middle Lamella Width
Mesocarp
Abscission zone
Pedicel
A
B
C
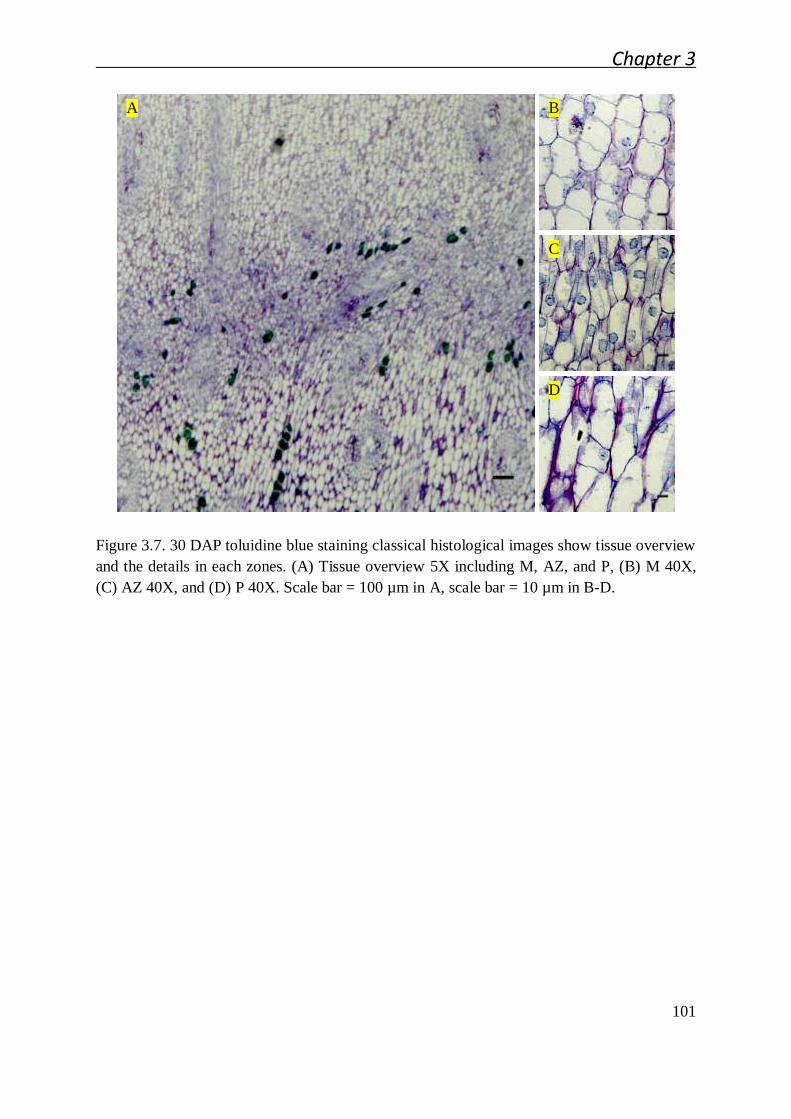
Chapter 3
101
Figure 3.7. 30 DAP toluidine blue staining classical histological images show tissue overview
and the details in each zones. (A) Tissue overview 5X including M, AZ, and P, (B) M 40X,
(C) AZ 40X, and (D) P 40X. Scale bar = 100 µm in A, scale bar = 10 µm in B-D.
A B
C
D

Chapter 3
102
Figure 3.8. 120 DAP toluidine blue staining classical histological images show tissue
overview and the details in each zones. (A) Tissue overview 5X including M, AZ, and P, (B)
M 40X, (C) AZ 40X, and (D) P 40X. Scale bar = 100 µm in A, scale bar = 10 µm in B-D.
A B
C
D
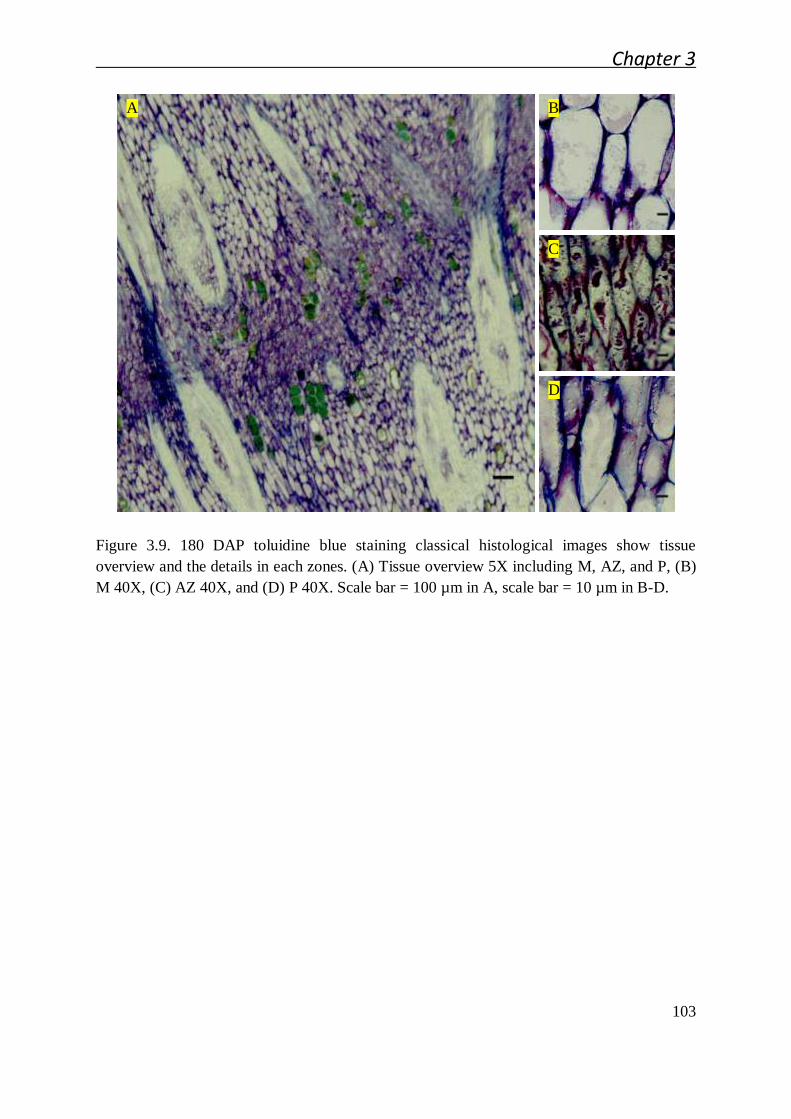
Chapter 3
103
Figure 3.9. 180 DAP toluidine blue staining classical histological images show tissue
overview and the details in each zones. (A) Tissue overview 5X including M, AZ, and P, (B)
M 40X, (C) AZ 40X, and (D) P 40X. Scale bar = 100 µm in A, scale bar = 10 µm in B-D.
A B
C
D
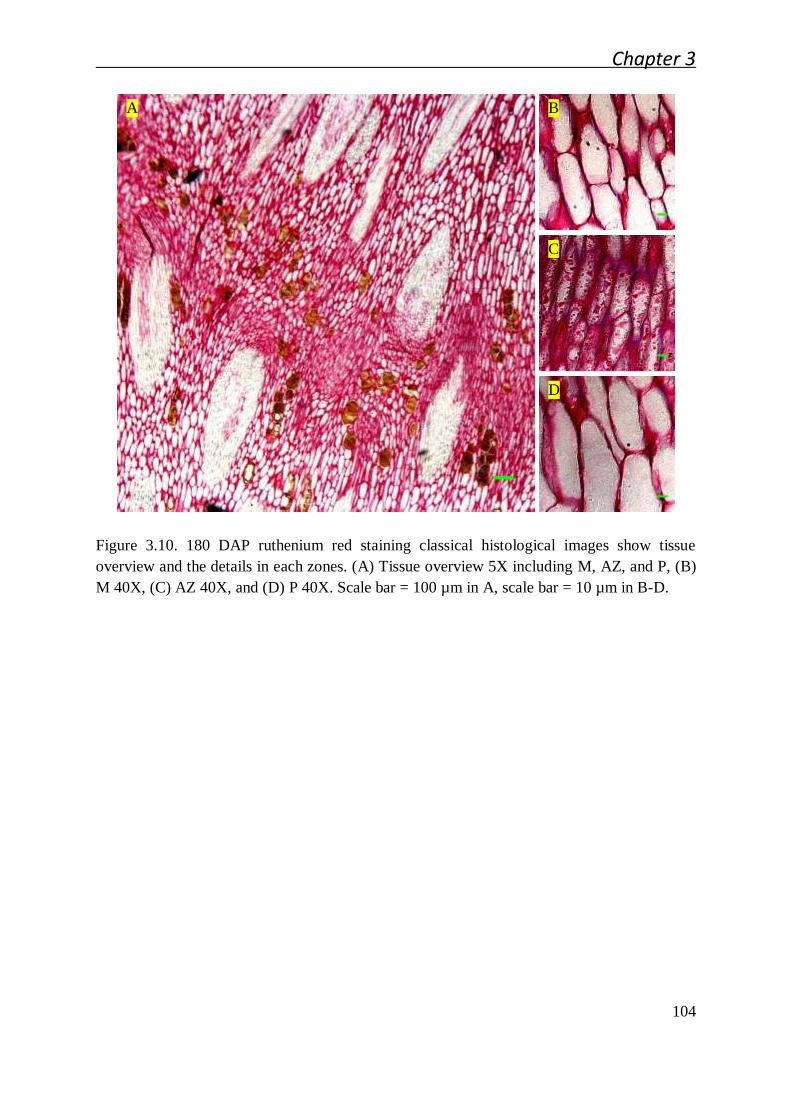
Chapter 3
104
Figure 3.10. 180 DAP ruthenium red staining classical histological images show tissue
overview and the details in each zones. (A) Tissue overview 5X including M, AZ, and P, (B)
M 40X, (C) AZ 40X, and (D) P 40X. Scale bar = 100 µm in A, scale bar = 10 µm in B-D.
A B
C
D

Chapter 3
105
Figure 3.11. Characterization of the cells by measuring cell width, cell wall width, and
middle lamella width. (A) cell width, (B) cell wall width, and (C) middle lamella width
comparing separated and non-separated samples. The same lower case alphabets represent
non-statistical significance. The different lower case alphabets represent statistical
significance. The two lower case alphabets represent non-statistical significance to the shared
alphabet one. 180+ represents 180 DAP with ethylene treatment at 9 h. The error bars
represents standard deviation.
a a b c a a 0
10
20
30
40
50
180 180+
µm
DAP
Cell Width
Mesocarp
Abscission zone
Pedicel
ab a ab ab c d e 0
1
2
3
4
180 180+
µm
DAP
Cell Wall Width
Mesocarp
Abscission zone
Pedicel
AZ separation layer cells
AZ unseparation layer cells
a b a a b c d 0
0.5
1
1.5
2
2.5
180 180+
µm
DAP
Middle Lamella Width
Mesocarp
Abscission zone
Pedicel
AZ separation layer cells
AZ unseparation layer cells
C
B
A
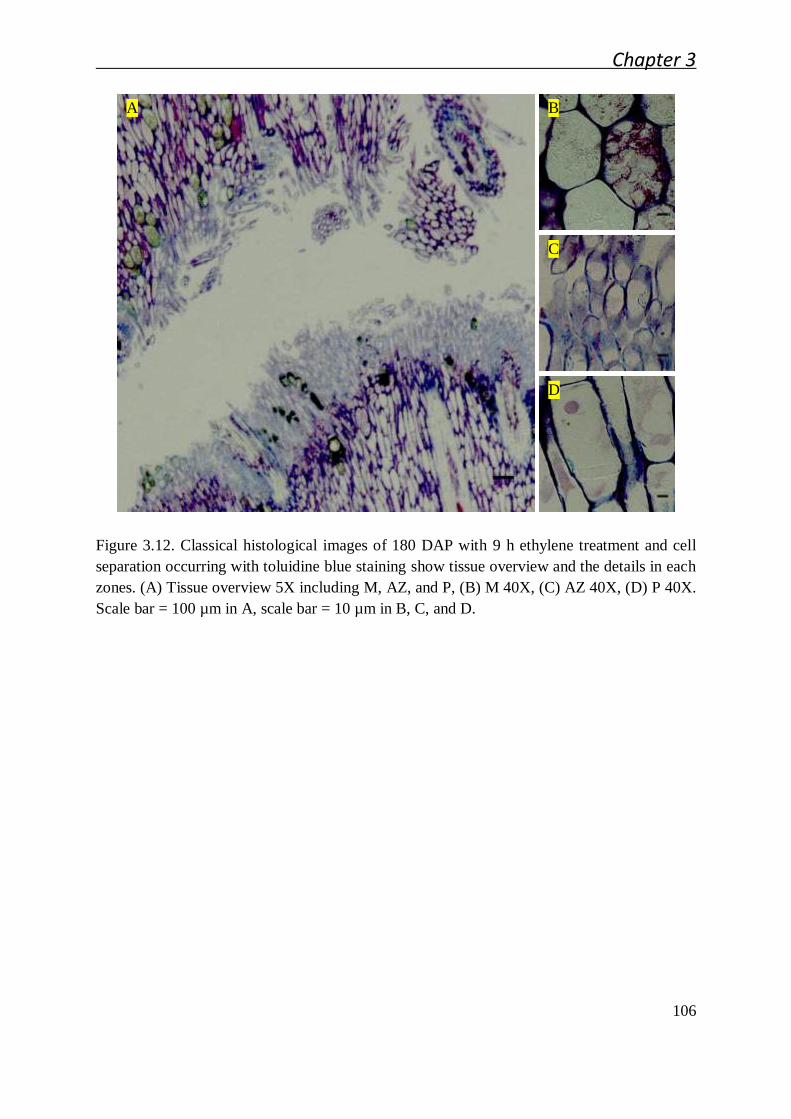
Chapter 3
106
Figure 3.12. Classical histological images of 180 DAP with 9 h ethylene treatment and cell
separation occurring with toluidine blue staining show tissue overview and the details in each
zones. (A) Tissue overview 5X including M, AZ, and P, (B) M 40X, (C) AZ 40X, (D) P 40X.
Scale bar = 100 µm in A, scale bar = 10 µm in B, C, and D.
A B
C
D
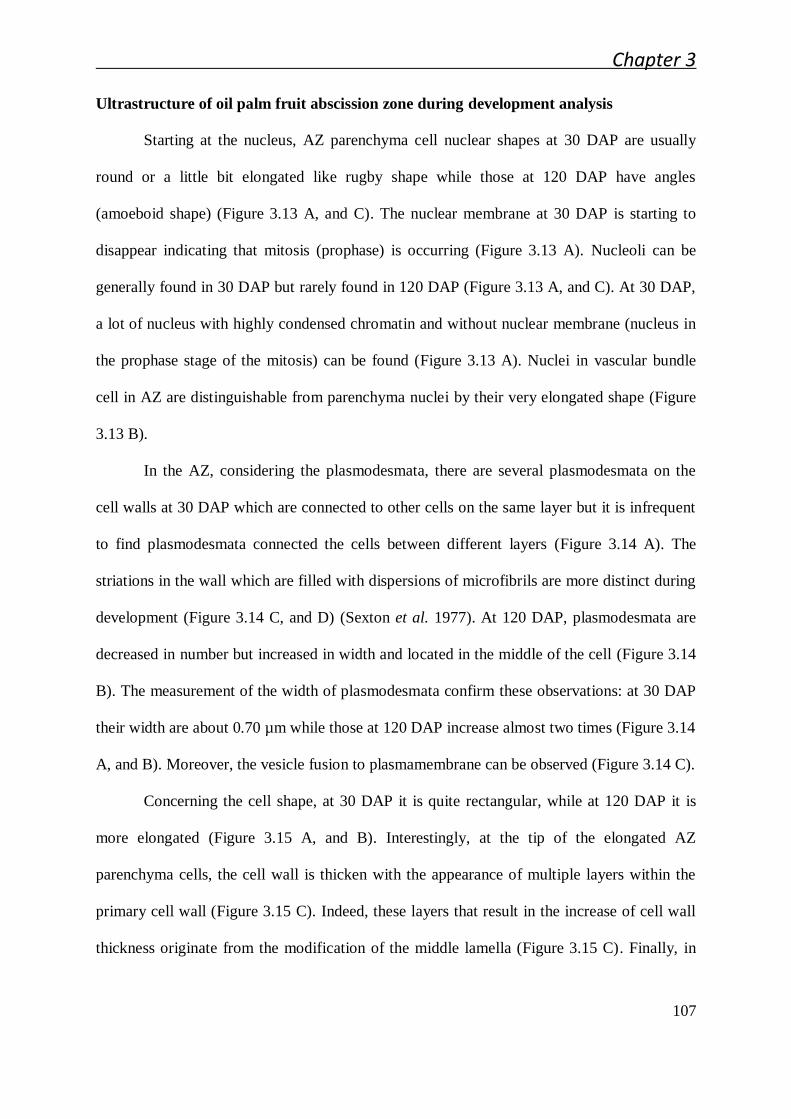
Chapter 3
107
Ultrastructure of oil palm fruit abscission zone during development analysis
Starting at the nucleus, AZ parenchyma cell nuclear shapes at 30 DAP are usually
round or a little bit elongated like rugby shape while those at 120 DAP have angles
(amoeboid shape) (Figure 3.13 A, and C). The nuclear membrane at 30 DAP is starting to
disappear indicating that mitosis (prophase) is occurring (Figure 3.13 A). Nucleoli can be
generally found in 30 DAP but rarely found in 120 DAP (Figure 3.13 A, and C). At 30 DAP,
a lot of nucleus with highly condensed chromatin and without nuclear membrane (nucleus in
the prophase stage of the mitosis) can be found (Figure 3.13 A). Nuclei in vascular bundle
cell in AZ are distinguishable from parenchyma nuclei by their very elongated shape (Figure
3.13 B).
In the AZ, considering the plasmodesmata, there are several plasmodesmata on the
cell walls at 30 DAP which are connected to other cells on the same layer but it is infrequent
to find plasmodesmata connected the cells between different layers (Figure 3.14 A). The
striations in the wall which are filled with dispersions of microfibrils are more distinct during
development (Figure 3.14 C, and D) (Sexton et al. 1977). At 120 DAP, plasmodesmata are
decreased in number but increased in width and located in the middle of the cell (Figure 3.14
B). The measurement of the width of plasmodesmata confirm these observations: at 30 DAP
their width are about 0.70 µm while those at 120 DAP increase almost two times (Figure 3.14
A, and B). Moreover, the vesicle fusion to plasmamembrane can be observed (Figure 3.14 C).
Concerning the cell shape, at 30 DAP it is quite rectangular, while at 120 DAP it is
more elongated (Figure 3.15 A, and B). Interestingly, at the tip of the elongated AZ
parenchyma cells, the cell wall is thicken with the appearance of multiple layers within the
primary cell wall (Figure 3.15 C). Indeed, these layers that result in the increase of cell wall
thickness originate from the modification of the middle lamella (Figure 3.15 C). Finally, in

Chapter 3
108
the cytoplasm, ribosome, mitochondria, and vesicles are accumulated at the border of
cytoplasm and fibrous matrix can be found throughout the cell interior (Figure 3.15 C).
.
Alterations to methylated homogalacturonan and xylogalacturonan in the oil palm fruit
abscission zone
Immunolocalization of the main pectin epitopes during abscission zone ontogenesis and after
cell separation
The classical and electron microscopy results discovered that pectin accumulates
during development and appears to be lost after separation (Figure 3.10 and Figure 3.12).
JIM5, JIM7, and LM7 can be used to distinguish the cellular localization of partially methyl-
estirified HG, while LM8 recognizes XGA. For each experiment, DAPI reveals well aligned
nuclei to visualize the location of AZ easily. The immunohistological controls were
performed with a combination of primary antibody and/or secondary antibody and/or none
with the combinations with the different tissues examined (Figure 3.16).
The signal intensity corresponding to JIM5 epitope at 30 DAP shows the highest
signal in all tissues (M, AZ, and P) by comparison with the later stages of development
(Figure 3.17A-R). At this stage, each fruit tissue has diffuse signals in the cytoplasm and also
signals throughout the cell periphery are clearly noticeable (Figure 3.17A-F). At 120 DAP,
the signal intensity in all tissues is dramatically decreased (Figure 3.17G-L). M and P tissues
show low signal throughout cell walls, and have a little bit higher signal on the inner side of
primary cell wall (Figure 3.17G, H, K and L). AZ tissue shows no signal at the wall but
maintains some signals on the inner side of primary cell wall. At 180 DAP, M and P show
very low signal while AZ shows the signal mostly on the inner side of the primary cell wall
(Figure 3.17). The localization of JIM5 in inner side of primary cell wall was confirmed by
symplastic localization (Figure 3.21).

Chapter 3
109
Figure 3.13. Scanning electron microscopy AZ nucleus comparison during developmental stages and comparison between parenchyma and
vascular bundle nucleus. (A) 30 DAP parenchyma nucleus. (B) 30 DAP vascular parenchyma nucleus. (C) 120 DAP parenchyma nucleus. ER =
Endoplasmic reticulum, EUCH = Euchromatin, HECH = Heterochromatin, NL = Nucleolus, and R = Ribosome. Scale bar = 1 µm.
NL
HECH
ER
R
NL HECH
A B C
N
EUC
H

Chapter 3
110
Figure 3.14. AZ cell wall shows different number of plasmodesmata and striation appearance
during development. (A, C) Cell wall at 30 DAP. (B, D) Cell wall at 120 DAP. M =
Mitochondria. N = Nucleus. PD = Plasmodesmata. R = Ribosome. Scale bar = 1 µm in A, B,
and D. Scale bar = 0.1 µm in C.
PD
R
Fusing
vesicle
C
N
PD
N
B
1.33
µm
PD
PD
PD
A
M
0.72
µm
0.69
µm
D

Chapter 3
111
Figure 3.15. Cell change during development. (A) 30 DAP AZ cell. (B, C) 120 DAP AZ cell.
ML = Middle lamella. M = Mitochondria. R = Ribosome. Scale bar = 1 µm.
N
A B
M
Fibrous
matrix
R
R
ML
C
Expansion of
primary wall

Chapter 3
112
As found with JIM5, the signal intensity corresponding to JIM7 epitope at 30 DAP
shows the highest signal in all tissues (M, AZ, and P) by comparison with the later stages of
development studied (Figure 3.18 A-R). At this immature stage, M tissue has a slightly
higher signal intensity than that of the AZ and P (Figure 3.18 A-F). M, AZ, and P tissues
have diffuse signal in the cytoplasm but signal throughout the cell periphery is also clearly
noticeable. P tissue shows the highest signal within the inner sides of the primary cell wall
and at the junction of intercellular spaces. At 120 DAP, the signal intensity in all tissues is
dramatically decreased (Figure 3.18 G-L). AZ and P tissues show low signal throughout cell
walls and have a little bit higher signal on the inner side of the primary cell wall (Figure 3.18
I-L). M tissue shows very low signal (Figure 3.18 G and H). Finally, at 180 DAP, M and P
show no signal while AZ shows low signal on the inner side of the primary cell wall (Figure
3.18 M-R).
The signal intensity corresponding to the LM7 epitope at 30 DAP also shows the
highest signal in all tissues (M, AZ, and P) as with the two previous antibodies (Figure 3.19
A-R). At this stage, M and AZ tissues have diffuse signals in the cytoplasm (Figure 3.19 A-
F). Signal throughout the cell walls in all tissues is clearly noticeable. P tissue shows clear
evidence of signal on the inner side of primary cell wall. At 120 DAP, the signal intensity in
all tissue is dramatically decreased. M and P show only faint signal throughout the cell wall.
AZ shows signal on the inner side of the primary cell wall. At the ripe stage, 180 DAP, all
tissues show very low signal, mostly on the inner side of primary cell wall (Figure 3.19 M-
R).
As with the three previous antibodies, the signal intensity corresponding to the LM8
epitope shows the highest signal in all tissues (M, AZ, and P) at 30 DAP (Figure 3.20 A-R).
At this stage, M and AZ tissues have diffuse signals in cytoplasm and higher signal than P
tissue. Signal throughout the cell walls in the three tissues are clearly noticeable. At 120

Chapter 3
113
DAP, the signal intensity is dramatically decreased in fruit, and found mostly on the inner
side of primary cell wall. At 180 DAP, the signal appears to increase slightly in all the
tissues. Notably, there are unevenly spaced points of signal concentrations in that ring the cell
on the inner side of the cell wall in all tissues, especially the AZ (Figure 3.20 O-P). A
summary of the results described above is shown in Table 3.1.
Pectin biochemical modification mapping by immunolocalizaton after fruit shedding induced
by ethylene
The signal intensity corresponding to the JIM5 epitope in the AZ from ripe fruit (180
DAP) after 3 h with air treatment only shows very low signal (Figure 3.22 A and B). In
contrast by 3 h and 6 h after ethylene treatment, the signal obtained with JIM5 increases on
the inner side of primary cell wall (Figure 3.22 C-F). By 9 h after ethylene treatment when
separation has occurred, the signal increases dramatically at the separated primary cell wall of
separation layer cells on both the M and P sides (Figure 3.22 G-J). Signals on the inner side
of the primary cell wall and in cytoplasm can be detected, in addition to line like signals that
arise from deeper within the AZ cells and/or cell layers. By 12 h after ethylene treatment, the
signal at the separated primary cell wall of separation layer cells in both M and P side
remains high, while the line like signals are lost from the M side (Figure 3.22 K-N). Finally,
the “zipper” AZ samples (samples of the AZ where both separation has both occurred and not
yet occurred) at 9 h with ethylene treatment show the signal gradually increases towards the
site of separation (3.22 O and P). In addition, the signal intensity increases along the
separated cell surface. Moreover, the signal at possible future separation sites within the non-
separated zone can be detected (Figure 3.22, and Figure 3.26 A-D). This has been confirmed
by analyzing grey level profile across the AZ (Figure 3.27).
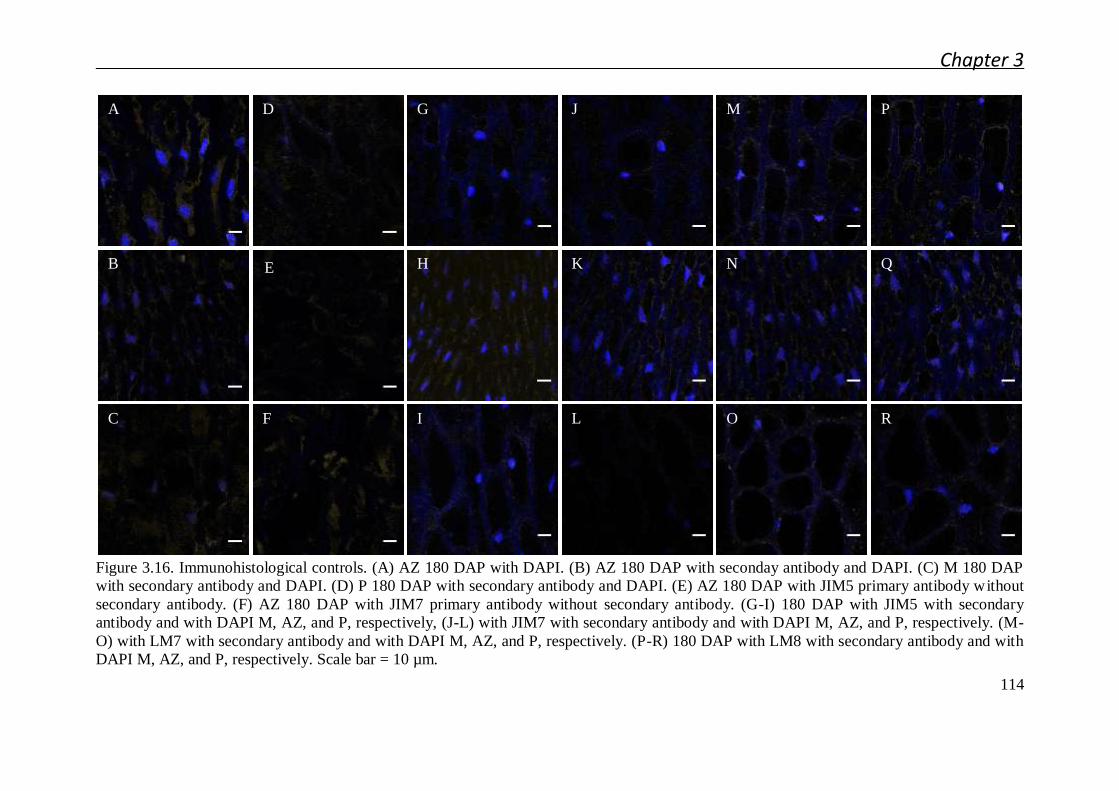
Chapter 3
114
Figure 3.16. Immunohistological controls. (A) AZ 180 DAP with DAPI. (B) AZ 180 DAP with seconday antibody and DAPI. (C) M 180 DAP
with secondary antibody and DAPI. (D) P 180 DAP with secondary antibody and DAPI. (E) AZ 180 DAP with JIM5 primary antibody without
secondary antibody. (F) AZ 180 DAP with JIM7 primary antibody without secondary antibody. (G-I) 180 DAP with JIM5 with secondary
antibody and with DAPI M, AZ, and P, respectively, (J-L) with JIM7 with secondary antibody and with DAPI M, AZ, and P, respectively. (M-
O) with LM7 with secondary antibody and with DAPI M, AZ, and P, respectively. (P-R) 180 DAP with LM8 with secondary antibody and with
DAPI M, AZ, and P, respectively. Scale bar = 10 µm.
A
B
C
E
F
G
H
I
J
K
L
M
N
O
P
Q
R
D

Chapter 3
115
Figure 3.17. JIM5 immunohistological images show decreased signal during developmental stages. (A) 30 DAP M JIM5, and (B) 30 DAP M
JIM5 and DAPI. (C) 30 DAP AZ JIM5, and (D) 30 DAP AZ JIM5 and DAPI. (E) 30 DAP P JIM5, and (F) 30 DAP P JIM5 and DAPI. (G) 120
DAP M JIM5, and (H) 120 DAP M JIM5 and DAPI. (I) 120 DAP AZ JIM5, and (J) 120 DAP AZ JIM5 and DAPI. (K) 120 DAP P JIM5, and
(L) 120 DAP P JIM5 and DAPI. (M) 180 DAP M JIM5, and (N) 180 DAP M JIM5 and DAPI. (O) 180 DAP AZ JIM5, and (P) 180 DAP AZ
JIM5 and DAPI. (Q) 180 DAP P JIM5, and (R) 180 DAP P JIM5 and DAPI. n = nucleus, w = cell wall. Scale bar = 10 µm.
A B
C
E
G H
I
K L
M N
O P
Q R
D J
F
n
w
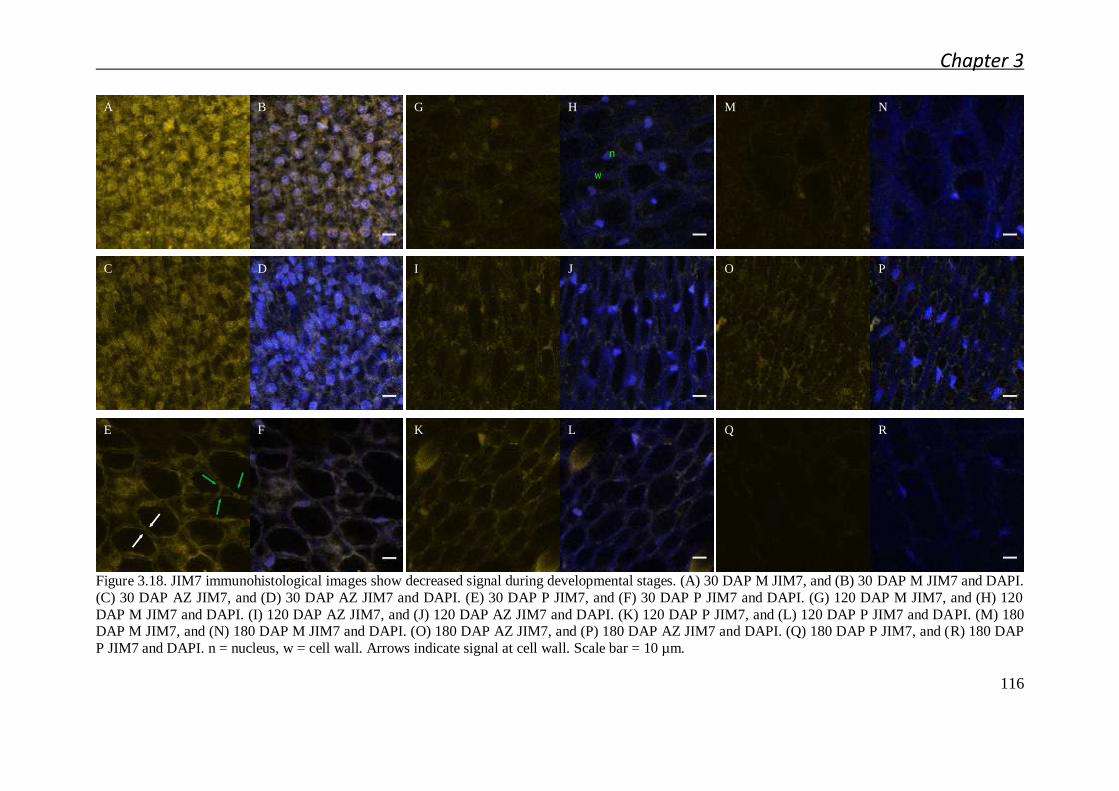
Chapter 3
116
Figure 3.18. JIM7 immunohistological images show decreased signal during developmental stages. (A) 30 DAP M JIM7, and (B) 30 DAP M JIM7 and DAPI.
(C) 30 DAP AZ JIM7, and (D) 30 DAP AZ JIM7 and DAPI. (E) 30 DAP P JIM7, and (F) 30 DAP P JIM7 and DAPI. (G) 120 DAP M JIM7, and (H) 120
DAP M JIM7 and DAPI. (I) 120 DAP AZ JIM7, and (J) 120 DAP AZ JIM7 and DAPI. (K) 120 DAP P JIM7, and (L) 120 DAP P JIM7 and DAPI. (M) 180 DAP M JIM7, and (N) 180 DAP M JIM7 and DAPI. (O) 180 DAP AZ JIM7, and (P) 180 DAP AZ JIM7 and DAPI. (Q) 180 DAP P JIM7, and (R) 180 DAP
P JIM7 and DAPI. n = nucleus, w = cell wall. Arrows indicate signal at cell wall. Scale bar = 10 µm.
A B
C D
G H
I J
M N
O P
E F K L Q R
w
n

Chapter 3
117
Figure 3.19. LM7 immunohistological images show decreased signal during developmental stages. (A) 30 DAP M LM7, and (B) 30 DAP M
LM7 and DAPI. (C) 30 DAP AZ LM7, and (D) 30 DAP AZ LM7 and DAPI. (E) 30 DAP P LM7, and (F) 30 DAP P LM7 and DAPI. (G) 120
DAP M LM7, and (H) 120 DAP M LM7 and DAPI. (I) 120 DAP AZ LM7, and (J) 120 DAP AZ LM7 and DAPI. (K) 120 DAP P LM7, and (L)
120 DAP P LM7 and DAPI. (M) 180 DAP M LM7, and (N) 180 DAP M LM7 and DAPI. (O) 180 DAP AZ LM7, and (P) 180 DAP AZ LM7
and DAPI. (Q) 180 DAP P LM7, and (R) 180 DAP P LM7 and DAPI. n = nucleus, w = cell wall. Scale bar = 10 µm.
A B
C D
G H
I J
M N
O P
E F K L Q R
w
n

Chapter 3
118
Figure 3.20. LM8 immunohistological images show decreased signal during developmental stages. (A) 30 DAP M LM8, and (B) 30 DAP M LM8 and DAPI.
(C) 30 DAP AZ LM8, and (D) 30 DAP AZ LM8 and DAPI. (E) 30 DAP P LM8, and (F) 30 DAP P LM8 and DAPI. (G) 120 DAP M LM8, and (H) 120 DAP
M LM8 and DAPI. (I) 120 DAP AZ LM8, and (J) 120 DAP AZ LM8 and DAPI. (K) 120 DAP P LM8, and (L) 120 DAP P LM8 and DAPI. (M) 180 DAP M LM8, and (N) 180 DAP M LM8 and DAPI. (O) 180 DAP AZ LM8, and (P) 180 DAP AZ LM8 and DAPI. (Q) 180 DAP P LM8, and (R) 180 DAP P LM8
and DAPI. n = nucleus, w = cell wall, p = polyphenolic compound. Scale bar = 10 µm.
w
n
p
p
A B
C D
G H
I J
M N
O P
E F K L Q R

Chapter 3
119
Figure 3.21. Symplastic JIM5 epitope localization shows red signal, which is the signal of
DAPI autofluorescence due to ferrulic acid, and green signal that indicates the JIM5 epitope
that does not co-localize with autofluorescence signal.

Chapter 3
120
The signal intensity corresponding to JIM7 epitope at 30 DAP in AZ 180 DAP at 3 h
without ethylene treatment and 180 DAP at 3 h and 6 h with ethylene treatment show very
low immunohistological signal on the inner side of the primary cell wall. At 9 h with ethylene
treatment and with separation occurring, the signal increases at the separated primary cell
wall of separation layer cells in both M and P side comparing to the control (3 h without
ethylene treatment). The signal on the inner side of primary cell wall and in the cytoplasm
can be detected. Similar to the signal at 9 h, the signal at 12 h with ethylene treatment at the
separated primary cell wall of separation layer cells in both M and P side still increases at
high level. The signal inner side of primary cell wall at M side decreases but those at P side
still remains. The zipper AZ at 9 h with ethylene treatment shows the signal gradually
increases as separation has occurred (Figure 3.23, and Figure 3.26 E-H).
The signal in AZ of all samples (3 h without ethylene treatment, 3 h, 6 h, 9 h, 12 h
with ethylene treatment) has very low signal intensity corresponding to LM7 inner side of
primary cell wall (Figure 3.24).
The LM8 signal in 3 h without ethylene treatment sample is undetectable and it
becomes a little bit stronger inner side of primary cell wall in 6 h and 9 h with ethylene
treatment. At 9 h and 12 h with ethylene treatment and separation occurring, the signal at
separation layer cells shows spotted signal and the signal shows related to vascular tissue cells
(Figure 3.25, and Figure 3.26 I-L). The summary of data described above is shown in Table
3.1.
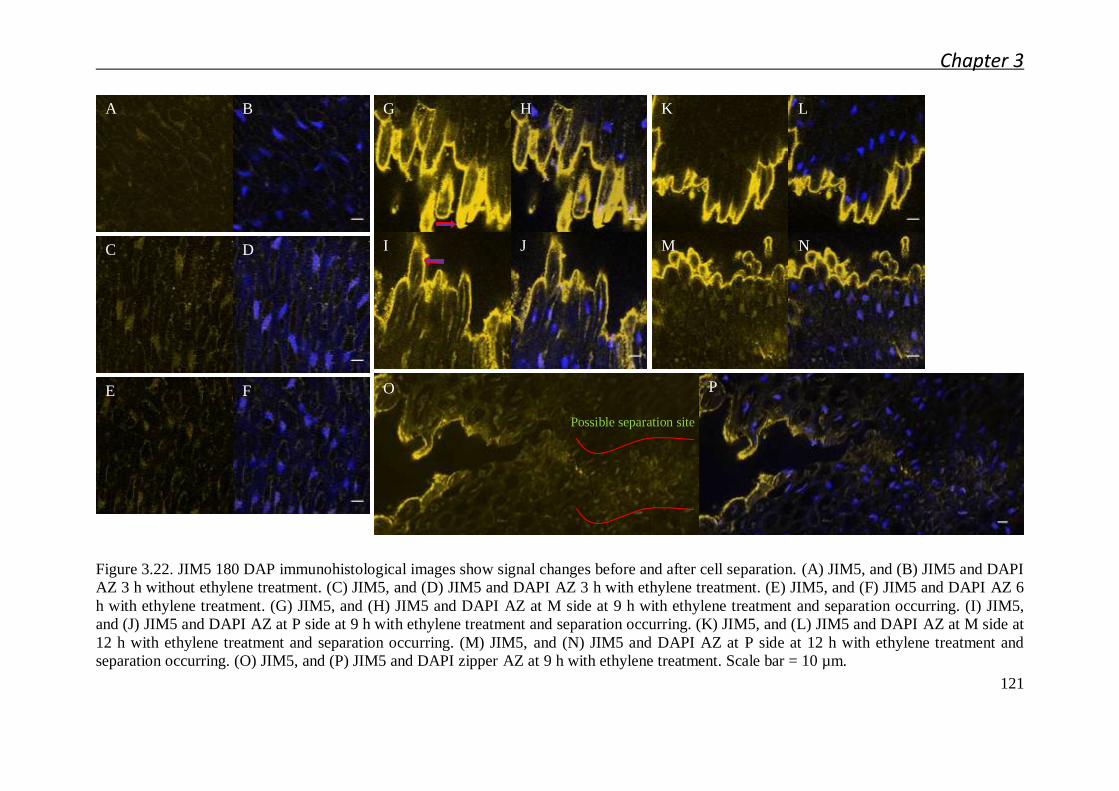
Chapter 3
121
Figure 3.22. JIM5 180 DAP immunohistological images show signal changes before and after cell separation. (A) JIM5, and (B) JIM5 and DAPI
AZ 3 h without ethylene treatment. (C) JIM5, and (D) JIM5 and DAPI AZ 3 h with ethylene treatment. (E) JIM5, and (F) JIM5 and DAPI AZ 6
h with ethylene treatment. (G) JIM5, and (H) JIM5 and DAPI AZ at M side at 9 h with ethylene treatment and separation occurring. (I) JIM5,
and (J) JIM5 and DAPI AZ at P side at 9 h with ethylene treatment and separation occurring. (K) JIM5, and (L) JIM5 and DAPI AZ at M side at
12 h with ethylene treatment and separation occurring. (M) JIM5, and (N) JIM5 and DAPI AZ at P side at 12 h with ethylene treatment and
separation occurring. (O) JIM5, and (P) JIM5 and DAPI zipper AZ at 9 h with ethylene treatment. Scale bar = 10 µm.
A B
C D
E F
G H
I J
K L
M N
O P
Possible separation site

Chapter 3
122
Figure 3.23. JIM7 180 DAP immunohistological images show signal changes before and after cell separation. (A) JIM7, and (B) JIM7 and DAPI
AZ 3 h without ethylene treatment. (C) JIM7, and (D) JIM7 and DAPI AZ 3 h with ethylene treatment. (E) JIM7, and (F) JIM7 and DAPI AZ 6
h with ethylene treatment. (G) JIM7, and (H) JIM7 and DAPI AZ at M side at 9 h with ethylene treatment and separation occurring. (I) JIM7,
and (J) JIM7 and DAPI AZ at P side at 9 h with ethylene treatment and separation occurring. (K) JIM7, and (L) JIM7 and DAPI AZ at M side at
12 h with ethylene treatment and separation occurring. (M) JIM7, and (N) JIM7 and DAPI AZ at P side at 12 h with ethylene treatment and
separation occurring. (O) JIM7, and (P) JIM7 and DAPI zipper AZ at 9 h with ethylene treatment. Scale bar = 10 µm.
A B
C D
E F
G H
I J
K L
M N
O P
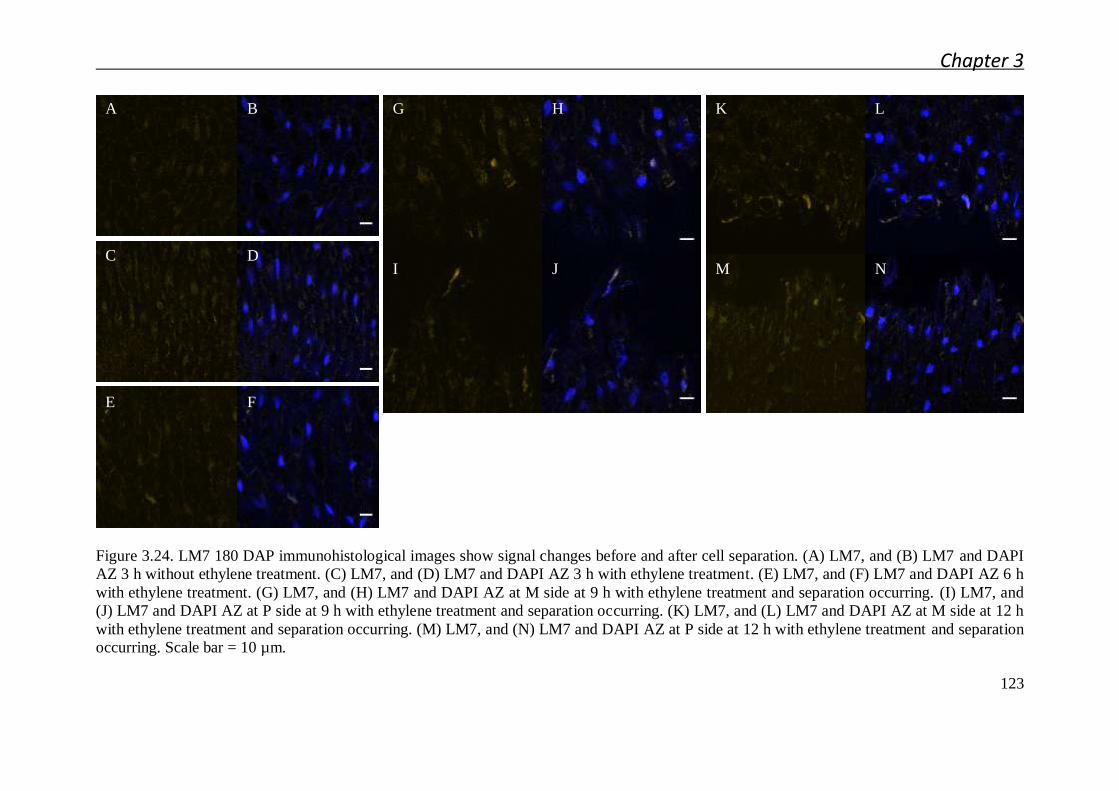
Chapter 3
123
Figure 3.24. LM7 180 DAP immunohistological images show signal changes before and after cell separation. (A) LM7, and (B) LM7 and DAPI
AZ 3 h without ethylene treatment. (C) LM7, and (D) LM7 and DAPI AZ 3 h with ethylene treatment. (E) LM7, and (F) LM7 and DAPI AZ 6 h
with ethylene treatment. (G) LM7, and (H) LM7 and DAPI AZ at M side at 9 h with ethylene treatment and separation occurring. (I) LM7, and
(J) LM7 and DAPI AZ at P side at 9 h with ethylene treatment and separation occurring. (K) LM7, and (L) LM7 and DAPI AZ at M side at 12 h
with ethylene treatment and separation occurring. (M) LM7, and (N) LM7 and DAPI AZ at P side at 12 h with ethylene treatment and separation
occurring. Scale bar = 10 µm.
A B
C D
E F
G H
I J
K L
M N

Chapter 3
124
Figure 3.25. LM8 180 DAP immunohistological images show signal changes before and after cell separation. (A) LM8, and (B) LM8 and DAPI
AZ 3 h without ethylene treatment. (C) LM8, and (D) LM8 and DAPI AZ 3 h with ethylene treatment. (E) LM8, and (F) LM8 and DAPI AZ 6 h
with ethylene treatment. (G) LM8, and (H) LM8 and DAPI AZ at M side at 9 h with ethylene treatment and separation occurring. (I) LM8, and
(J) LM8 and DAPI AZ at P side at 9 h with ethylene treatment and separation occurring. (K) LM8, and (L) LM8 and DAPI AZ at M side at 12 h
with ethylene treatment and separation occurring. (M) LM8, and (N) LM8 and DAPI AZ at P side at 12 h with ethylene treatment and separation
occurring. Scale bar = 10 µm.
A B
C D
E F
G H
I J
K L
M N

Chapter 3
125
Figure 3.26. JIM5, JIM7, and LM8 180 DAP separated AZ immunohistological images show increased signal at the separation sites. (A) JIM5
separated AZ 9 h with ethylene treatment, (B) JIM5 and DAPI 9 h, (C) JIM5 separated AZ 12 h with ethylene treatment, (D) JIM7 AND DAPI
12 h, (E) JIM7 separated AZ 9 h with ethylene treatment, (F) JIM7 and DAPI 9 h, (G) JIM7 separated AZ 12 h with ethylene treatment, JIM7
and (H) DAPI 12 h, (I) LM8 separated AZ 9 h with ethylene treatment, (J) LM8 AND DAPI 9 h, (K) LM8 separated AZ 12 h with ethylene
treatment, (L) LM8 and DAPI 12 h. Scale bar = 100 µm.
A B
C D
E F
G H
I J
K L
9 h
12 h
JIM5 JIM7 LM8

Chapter 3
126
Figure 3.27. Predicted sites of separation may be associated with the JIM5 epitope. Quantification of the JIM5 grey level profile across in the AZ
180 DAP 9 h with ethylene treatment. The region 1 and 2 are the zones where separation may occur, and the region 3, which is far away from
separated site, may not separate.
Region 1
Region 2
Region 3

Chapter 3
127
Antibody Tissue
Before separation
After
separation
30 DAP 120 DAP 180 DAP 180 DAP
JIM5
Mesocarp +++++ ++ + +
Abscission zone +++++ ++ + +++++ (*)
Pedicel +++++ ++ + +
JIM7
Mesocarp +++++ ++ + +
Abscission zone +++++ ++ ++ +++++ (*)
Pedicel +++++ ++ + +
LM7
Mesocarp +++++ ++ ++ ++
Abscission zone +++++ ++ ++ ++
Pedicel +++++ ++ ++ ++
LM8
Mesocarp +++++ + ++ +
Abscission zone +++++ + ++ +++ (**)
Pedicel ++++ + ++ +
Table 3.1. Summary table of the intensity signal in different tissues at different
developmental stages and after separation corresponding to JIM5, JIM7, LM7, and LM8
epitopes. * signal intensity at the separated sites, ** signal intensity of the vascular bundle tip
at the separated sites. + represents signal intensity, the more +, the more signal intensity.
Chapter 3
128
Discussion
Shedding of the oil palm fruit takes place after cell separation events in the AZ that
consist of specialized cell layers located between the M and P. Cell separation in the AZ can
be initiated by ethylene treatment, but this response depends on the developmental stage of
the fruit. For example, ripe fruit at 180 DAP starts to shed within 9 h while immature fruit at
30 DAP sheds at 24 h when treated with ethylene. This study had the objective to determine
whether changes in the cellular in general and in pectin portion in particular of the cell wall
of AZ cells relate to functional acquisition of this zone and to cell separation events that lead
to fruit shedding.
General cellular characteristics of oil palm fruit abscission zone
The combination of classical histological and electron microscopy approaches has
allowed distinguishing specific cellular characteristics of oil palm fruit AZ at different stages
of fruit development and by comparison with the adjacent tissues, M and P. The data revealed
that AZ is differentiated early during fruit development. However at 30 DAP the AZ does not
have the capacity to respond to ethylene in the same way, and does not function the same as
in cells at later stages of development. Indeed, the cells of this zone show different
characteristics than those observed in the functional AZ at 180 DAP. For example, at the
mature stage, the observation of aligned nuclei of the AZ cells revealed in this study is the
first observation found in documented plant system. The reason to explain this phenomenon
is that the AZ cell division appeared at 30 DAP is periclinal, thus, at the later stages (120, and
180 DAP) the layers of the AZ prominently appear. However, the nuclear alignment can be
firstly observed in vascular parenchyma tissue at 30 DAP. The observation suggests that the
development in vascular parenchyma tissue starts before regular parenchyma tissue in this
zone. The nuclear shape has changed during development. At 30 DAP, the shape of nucleus

Chapter 3
129
is round as usually described in general cell biology books but at 120 DAP, the nuclear shape
has changed to have more angles. This could be explained by the hypothesis that changes in
nuclear shape affects chromatin reorganization and thereby affect gene expression (Webster
et al. 2009). The observation also found that the nuclear shape of the parenchyma and
vascular parenchyma cells within the AZ at 30 DAP are different. There is another hypothesis
that could explain this phenomenon. It is proposed that changes in nuclear shape alter the
rigidity of the nucleus which is beneficial for cells that need to squeeze through tight spaces
(Webster et al. 2009).
Changing of plasmodesmata position at 120 DAP to the middle of the cell which is
close to the position of nucleus might facilitate transportation of the matrix between the cell
in the same layer. The other method which AZ parenchyma cells use to transport the
cytoplasmic matrix is that vesicle fuses to plasmamembrane and transport to cell wall or
adjoining cells (Sexton et al. 1977).
Incorporation of data from classical histology staining with toluidine blue and
ruthenium red and electron microscopy, confirms that the fibrous matrix found by electron
microscopy in AZ 120 DAP must be pectin. Moreover, the expansion of primary cell wall at
the tip of the AZ 120 DAP parenchyma cell found in electron microscopy could be the dark
pink staining observed with toluidine blue. However, it is unclear how the expansion of the
primary cell wall at the tip of the cell has occurred, but it could be related to the accumulation
of ribosome and mitochondria at the tip of the cell. Sexton et al. (1977) clearly showed
Impatiens leaf AZ having the striations at the tip of the cell and plasmodesmata. They also
demonstrated that Coleus and Impatiens leaf AZs increase the amount of rough endoplasmic
reticulum, dictyosomes, and cytoplasmic vesicles after abscission.
In sum, the observations reveal that the AZ tissue has unique characteristics other than
adjoining tissues. It has well-aligned nucleus due to periclinal division and also the nuclear

Chapter 3
130
shape change during development which might involve in gene expression. Not only does the
nuclear shape change, but the cell wall and cytoplasmic contents also alter. The amount of
cytoplasmic vesicles increase in AZ 120 DAP, which might be involved in synthesizing
substances involved in the expansion of the tip of the cell. The plasmodesmata position is
changed as well which might speed up the transportation of cytoplasmic contents to neighbor
cells.
Pectin fluctuation during developmental stages
Alteration of HG methylation state is important during plant development in case of
cell adhesion and separation to occur (Jarvis et al. 2003). It is believed that pectin is
synthesized in a highly methyl-esterified form in the golgi apparatus and transported to cell
wall (Zhang and Staehelin 1992; Lennon and Lord 2000). After pectin deposition in the cell
wall, the subsequent modification is processed by PME in order to de-methyl-esterify to form
the egg-box pectin formation and to facilitate PGs hydrolysis function (Micheli 2001; Willats
et al. 2001b). Changing in signal intensity in JIM5, JIM7, LM7, and LM8 antibodies indicates
the pectin state and XGA status change during development. JIM5 binds pectin containing
four contiguous unesterified GalA residues between two methyl-ester groups and also binds
three unesterfied GalA residues between two methyl-ester groups. JIM7 binds three and four
contiguous methyl-ester groups flanked by unesterified residues and also binds to alternating
methyl-esterified and unesterified residues. LM7 binds methyl-esterified pectin containing
four contiguous unesterified GalA residues between two methyl-ester groups which is one of
the same methyl-esterified pectin recognized by JIM5 (Clausen et al. 2003) LM8 binds highly
to xylose-substituted XGA (Willats et al. 2004) (Figure 3.1). The results confirm that
methylated pectin can be found in early stage (30 DAP) in all tissues. The methylated pectin
is de-methylated during maturation (120 DAP) and remains low during ripening (180 DAP).

Chapter 3
131
Henderson et al. (2001a) demonstrated that highly unmethylated pectin could be found in ripe
AZ fruit that is consistent with our data at 120 and 180 DAP. However, the previous study
found more highly methylated pectin in M and P, which conflicts to our results at 120 and 180
DAP that show low signal intensity in JIM5, JIM7, and LM7. The diffused signals of JIM5,
JIM7, and LM7 throughout the cell at the early stage of development are possibly due to
transporting methyl-esterified pectin from golgi apparatus to be deposited in cell wall (Wolf et
al. 2009). XGA is also found in early stage of development and decreases during the time
before ripening and before cell separation occurs. This result could be explained as XGA
prevents calcium-dependent interactions between HG chains (Jensen et al. 2008). Thus, in
order to weaken the cell adhesion, XGA should be increased. In our result, it could be
visualized that LM8 increases slightly at 180 DAP in all tissues compared to that of 120 DAP,
and again during ethlylene induced separation.
Pectin fluctuation after cell separation
Considering the data from LM7 which has no detected signal after cell separation
(Figure 3.24 G-N) and detected JIM5 signal (Figure 3.22 G-N) and also the methylated pectin
patterns (Figure 3.1), it could be concluded that there is no induction of methylated pectin
conformation 1 which is recognized by both JIM5 and JIM7 and the induction of methylated
pectin detected by JIM5 after cell separation comes from conformation 2 (Clausen et al.
2003). At the present, 3 epitopes of JIM7 cannot be ruled out. The function of XGA is not
well understood especially in cell detachment events; however, it might affect the physical
properties of the pectic matrix. For example, the XGA will prevent calcium crosslinking of
HGA chains and will also make an alteration on enzyme profiles capable of XGA
modification, such that XGA is resistant to endo-PG digestion (Willats et al. 2004; Jensen et
al. 2008). LM8 was found associated to cell detachment restricted to loosely attached

Chapter 3
132
parenchyma cells at the inner face of the pea testa (Willats et al. 2004). This study supports
the previous study that LM8 is associated to cell detachment by increasing the signal of LM8
epitope before and after cell separation (Figure 3.25). Moreover, an interesting feature of the
oil palm fruit AZ is that the LM8 epitope is specific to separated vascular parenchyma cells
(Figure 3.26 I-L).
The plant reponse to plant pathogens has been studied in several species. A high
degree of pectin methylation in the middle lamella of sorghum confers plant resistant to
aphids (Dreyer and Campbell 1984). The stem cell wall of potato genotype resistant to
Erwinia carotovora subsp. atroseptica also shows highly methylated and branched water-
soluable pectin (Marty et al. 1997). Thus, it could be possible that after cell separation occurs,
the dramatic increase of methylated pectin along separated site might function in plant
pathogen defense as a protective layer. However, it is curious that a defense layer would be
synthesized as a response to pathogen attack on both the separated cell face of the P and the
shed fruit M.
In this study, there are three hypotheses that could explain the occurrence of the higher
JIM5 and JIM7 signal intensities observed on the separated cell faces. The first hypothesis,
the “homeostasis in the wall”, predicts that the activity of pectin modifying enzymes such as
PME, give rise to the increase in the epitopes detected within the cell wall. After cell
separation occurs, modifying enzymes within the cell wall may become active on the
separated cell faces to modify pectin already present in the wall to give rise to the forms
recognized by JIM5 and JIM7. Once JIM5 and JIM7 epitopes are produced through enzyme
modifications of the pectin, the huge signal intensity appears (Figure 3.28 A). The second
hypothesis, “separation cell layer homeostasis”, is similar to the first hypothesis, except the
pectin modifications are carried out by enzymes, such as PMT, within the cell (Figure 3.28
B). This hypothesis predicts that the pectin within the cell is modified by enyzmes within the

Chapter 3
133
cell then secreted to the cell wall where the JIM5 and 7 epitopes accumulate to a high level.
The last hypothesis, the “apoplastic transfer”, predicts that pectin is transferred from other
layers of AZ toward the separation layers where it accumulates. The result of
immunohistology reveals that there are some line-like signals appearing within the inner side
of primary walls at 9 h with ethylene treatment, and less signals at 12 h with ethylene
treatment especially on M side (Figure 3.22 G-N, and Figure 3.23 G-N). This observation
combined with the result of electron microscopy, which shows fewer plasmodesmata between
AZ layers, suggests the lower signal at 12 h with ethylene treatment might be due to the
removal of pectin from the separation layers through the apoplast, and/or channeled through
the few remaining plasmodesmata between layers (Figure 3.28 C). This hypothesis is also
supported by the observation that the pectin content of the AZ layers cells appears to be lost
once separation has occurred. The mechanisms proposed in these hypotheses may not be
mutually exclusive and may all function in combination to result in the high signal observed
on the separation cell faces

Chapter 3
134
Figure 3.28. Three proposed hypotheses explain the event after cell separation occurs for JIM5 and JIM7 antibodies. (A) Homeostasis
in wall hypothesis relates to PME in cell wall. (B) Separation layer homeostasis hypothesis relates to PMT within cell wall. (C)
Apoplastic transfer hypothesis relates to transferring pectins from other layers of AZ to the separated layers via the apoplastic and/or
plasmodesmata transfer mechanisms.
Cell separation
PME in wall PMT within cell
Homeostasis in wall Separation layer homeostasis Apoplastic transfer
A B C
Pectin transfer
: Antibody
: Pectins AZ

Chapter 3
135
Materials and Methods
Plant Materials
Oil palm Elaeis guineensis fruits from CRA-PP Pobé plantation, Benin were used for
classical histology experiment. Oil palm Elaeis guineensis variety Tenera clone C from
Golden Tenera Plantation in Krabi Province, Thailand were used in the other experiments.
Oil palm fruit collection and ethylene treatment
See chapter 2
Classical histology sample preparation
Samples were fixed in 0.2 M phosphate buffer containing 2% (w/v)
paraformaldehyde, 1% (w/v) caffeine, and 2% (v/v) glutaraldehyde 25% for a minimum of 2
days at 4 °C according to Buffard-Morel et al. (1992). Serail dehydration with ethanol from
30% to 100%, then 100% butanol/100% ethanol (v/v), and finally 100% butanol was
performed for each sample and followed by impregnation and embedding in Technovit 7100
resin (Heraeus Kulzer). Semi-thin sections of 3 µm were cut using a microtome. Each section
was stained with toluidine blue or ruthenium red. Microphotographs were taken with a Leica
camera on a Leica LEITZ DMRB light microscope (x20/0.5; x40/0.7 and x100/1.3).
Scanning electron microscopy sample preparation
The samples were prepared as described in Verdeil et al. (2001).
Immunohistochemistry sample preparation
Blocking buffer (BB) : Phosphate-buffered saline (PBS) = 1:1 was prepared then add
BB/PBS (500-1000 μl) mixed solution to the glass blocks. Next, add sample tissues two

Chapter 3
136
pieces on each glass blocks and shake them gently on a shaker for three hours at room
temperature (RT). Afterward, prepare BB : PBS : primary antibody (JIM5, JIM7, LM7, or
LM8) = 9:9:2 and pipette the previous mixed solution out and add the new mixed solution
containing primary antibody (500-1000 μl) to the glass blocks. Shake them gently on a shaker
overnight (18 h) at 4 °C. After that, remove the mixed solution in the glass block, add PBS
solution (500-1000 μl), shake them gently on a shaker for 15 min, drain out and repeat this
step for two more times. From this step, do the preparation in a dark room. Prepare BB : PBS
: secondary antibody (Alexa Fluor 546) = 499:499:2. Remove the mixed solution in the glass
blocks and add the mixed solution with secondary antibody (500-1000 μl). Immediately,
cover them with aluminum foil and shake them gently on a shaker for 1 h at RT. Add PBS
solution (500-1000 μl), shake them gently on a shaker for 15 min, drain out and repeat this
step for 2 more times. Prepare PBS : DAPI = 499 : 1. Cover them with aluminum foil and
shake them gently on a shaker for 1 h at RT. Add PBS solution (500-1000 μl), shake them
gently on a shaker for 15 min, drain out and repeat this step for 2 more times. Put the tissues
on slides. Then, add a few MOWIAL droplets and cover with cover slips (No. 0). Next, leave
the solution dry for a few days at RT. Finally, keep them at 4 °C with dark condition. The
tissue observation was performed on Zeiss LSM 510 Meta Confocal Microscope.

Chapter 3
137
Appendix
Figure S3.1. 30 DAP ruthenium red staining classical histological images show tissue
overview and the details in each zones. (A) Tissue overview 5X including M, AZ, and P, (B)
M 40X, (C) AZ 40X, and (D) P 40X. Scale bar = 100 µm in A, scale bar = 10 µm in B-D.
A B
C
D
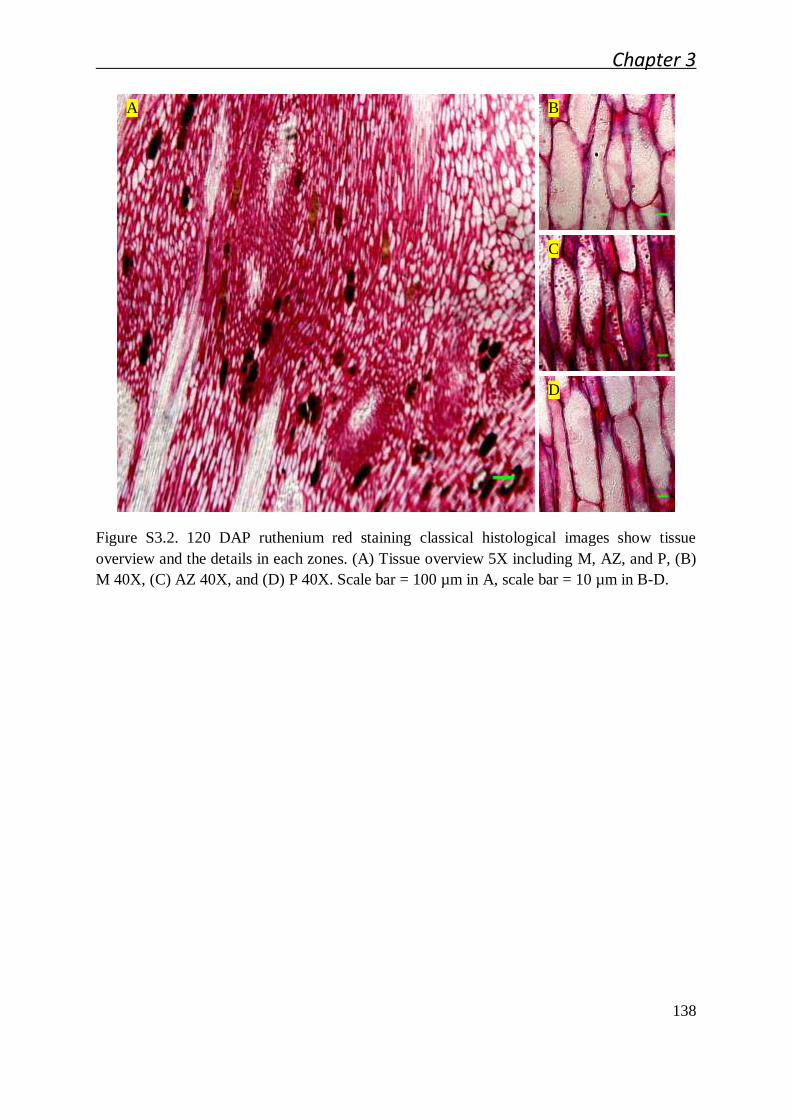
Chapter 3
138
Figure S3.2. 120 DAP ruthenium red staining classical histological images show tissue
overview and the details in each zones. (A) Tissue overview 5X including M, AZ, and P, (B)
M 40X, (C) AZ 40X, and (D) P 40X. Scale bar = 100 µm in A, scale bar = 10 µm in B-D.
A B
C
D

Chapter 3
139
Figure S3.3. Classical histological images of 180 DAP with 9 h ethylene treatment and cell
separation occurring with ruthenium red staining show tissue overview and the details in each
zones. (A) Tissue overview 5X including M, AZ, and P, (B) M 40X, (C) AZ 40X, (D) P 40X.
Scale bar = 100 µm in A, scale bar = 10 µm in B, C, and D.
A B
C
D

Chapter 3
140
Figure S3.4. 30 DAP alcian blue staining classical histological images show tissue overview
and the details in each zones. (A) Tissue overview 5X including M, AZ, and P, (B) M 40X,
(C) AZ 40X, and (D) P 40X. Scale bar = 100 µm in A, scale bar = 10 µm in B-D.
A B
C
D

Chapter 3
141
Figure S3.5. 120 DAP alcian blue staining classical histological images show tissue overview
and the details in each zones. (A) Tissue overview 5X including M, AZ, and P, (B) M 40X,
(C) AZ 40X, and (D) P 40X. Scale bar = 100 µm in A, scale bar = 10 µm in B-D.
A B
C
D

Chapter 3
142
Figure S3.6. 180 DAP alcian blue staining classical histological images show tissue overview
and the details in each zones. (A) Tissue overview 5X including M, AZ, and P, (B) M 40X,
(C) AZ 40X, and (D) P 40X. Scale bar = 100 µm in A, scale bar = 10 µm in B-D.
A B
C
D

Chapter 3
143
Figure S3.7. Classical histological images of 180 DAP with 9 h ethylene treatment and cell
separation occurring with alcian blue staining show tissue overview and the details in each
zones. (A) Tissue overview 5X including M, AZ, and P, (B) M 40X, (C) AZ 40X, (D) P 40X.
Scale bar = 100 µm in A, scale bar = 10 µm in B, C, and D.
A B
C
D

Chapter 3
144
Figure S3.8. 30 DAP alcian blue and schiff’s staining classical histological images show
tissue overview and the details in each zones. (A) Tissue overview 10X including M, AZ, and
P, (B) M 40X, (C) AZ 40X, and (D) P 40X. Scale bar = 100 µm in A, scale bar = 10 µm in B-
D.
A B
C
D
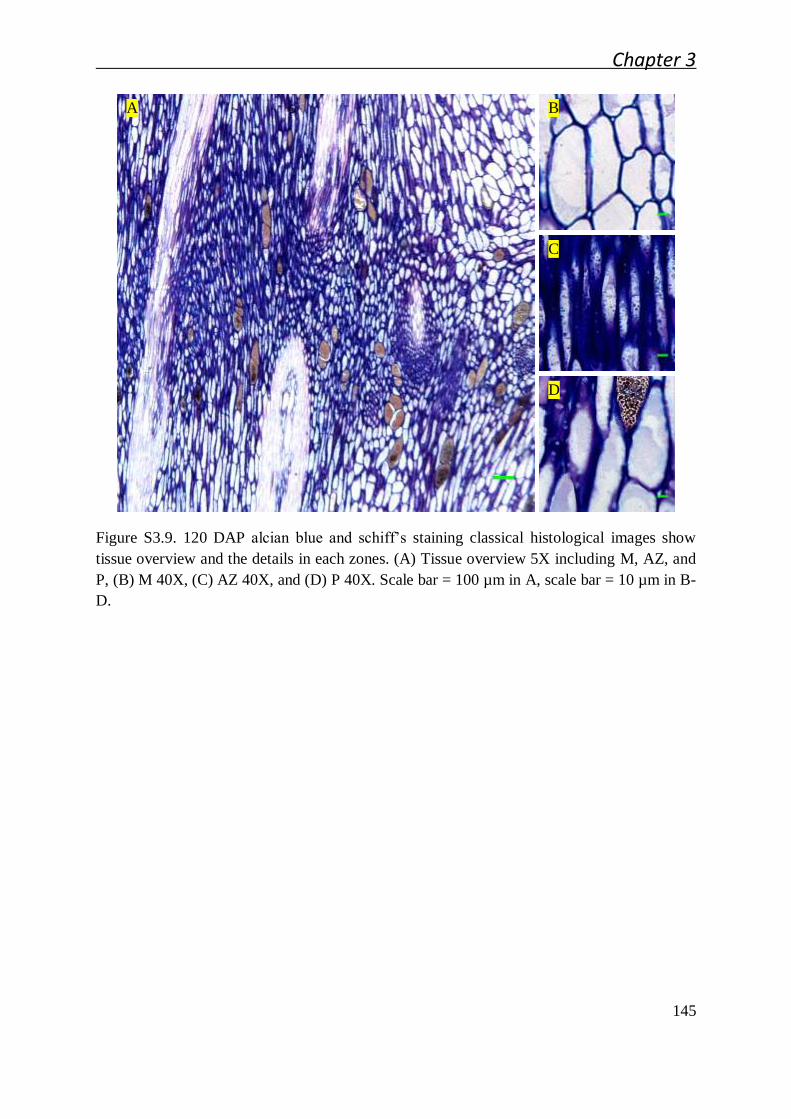
Chapter 3
145
Figure S3.9. 120 DAP alcian blue and schiff’s staining classical histological images show
tissue overview and the details in each zones. (A) Tissue overview 5X including M, AZ, and
P, (B) M 40X, (C) AZ 40X, and (D) P 40X. Scale bar = 100 µm in A, scale bar = 10 µm in B-
D.
A B
C
D

Chapter 3
146
Figure S3.10. 180 DAP alcian blue and schiff’s staining classical histological images show
tissue overview and the details in each zones. (A) Tissue overview 5X including M, AZ, and
P, (B) M 40X, (C) AZ 40X, and (D) P 40X. Scale bar = 100 µm in A, scale bar = 10 µm in B-
D.
A B
C
D
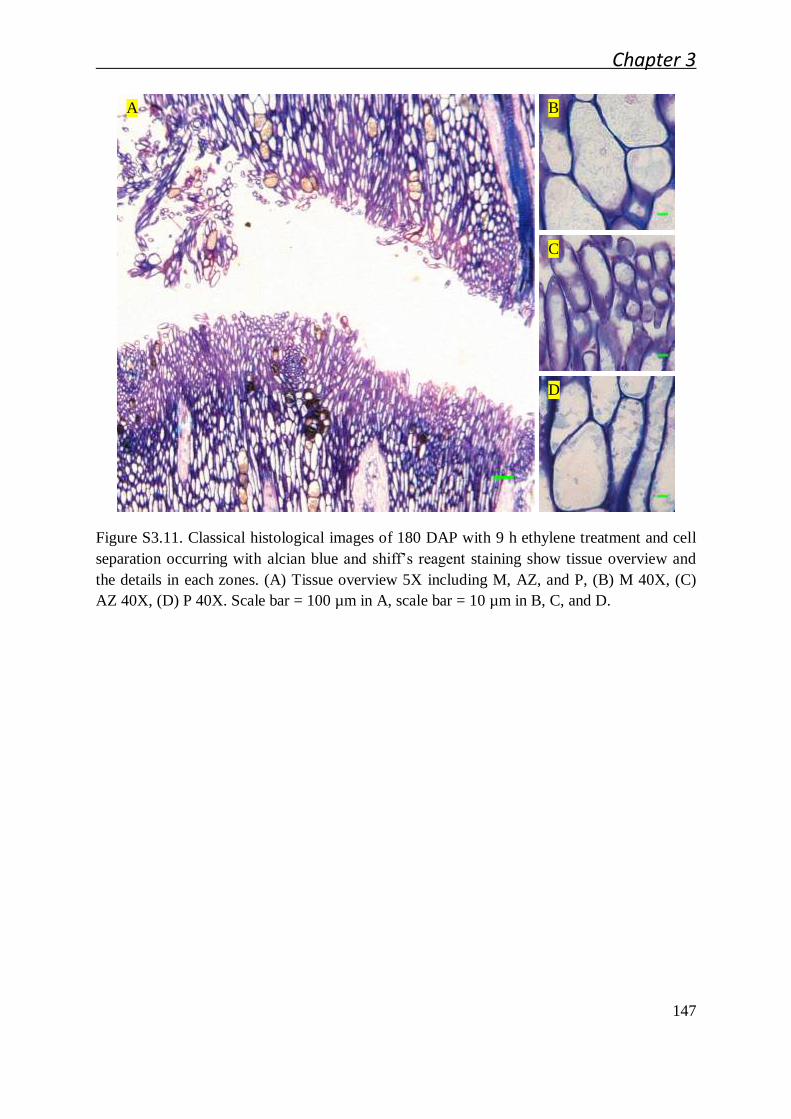
Chapter 3
147
Figure S3.11. Classical histological images of 180 DAP with 9 h ethylene treatment and cell
separation occurring with alcian blue and shiff’s reagent staining show tissue overview and
the details in each zones. (A) Tissue overview 5X including M, AZ, and P, (B) M 40X, (C)
AZ 40X, (D) P 40X. Scale bar = 100 µm in A, scale bar = 10 µm in B, C, and D.
A B
C
D

Chapter 3
148
Literature Cited
Addicott, F. (1982). Abscission, University of California Press, Ltd. London.
Belfield, E. J., B. Ruperti, J. A. Roberts and S. McQueen-Mason (2005). "Changes in
expansin activity and gene expression during ethylene-promoted leaflet abscission in
Sambucus nigra." J Exp Bot 56(413): 817-823.
Buffard-Morel, J., J. L. Verdeil and C. Pannetier (1992). "Embryogenèse somatique du
Cocotier (Cocos nucifera L.) à partir de tissus foliaires : étude histologique." Can J
Bot/Rev Can Bot 70: 735-741.
Burg, S. P. (1968). "Ethylene, plant senescence and abscission." Plant Physiol 43(9 Pt B):
1503-1511.
Cin, V. D., M. Danesin, A. Boschetti, A. Dorigoni and A. Ramina (2005). "Ethylene
biosynthesis and perception in apple fruitlet abscission (Malus domestica L. Borck)."
J Exp Bot 56(421): 2995-3005.
Clausen, M. H., W. G. T. Willats and J. P. Knox (2003). "Synthetic methyl hexagalacturonate
hapten inhibitors of anti-homogalacturonan monoclonal antibodies LM7, JIM5 and
JIM7." Carbohydr Res 338(17): 1797-1800.
Conrad, K. (2008). "Correlation between the distribution of lignin and pectin and distribution
of sorbed metal ions (lead and zinc) on coir (Cocos nucifera L.)." Bioresour Technol
99(17): 8476-8484.
Cosgrove, D. J. (2005). "Growth of the plant cell wall." Nat Rev Mol Cell Biol 6(11): 850-
861.
Dreyer, D. L. and B. C. Campbell (1984). "Association of the degree of methylation of
intercellular pectin with plant resistance to aphids and with induction of aphid
biotypes." Cell Mol Life Sci 40(2): 224-226.
Francis, K. E., S. Y. Lam and G. P. Copenhaver (2006). "Separation of Arabidopsis Pollen
Tetrads Is Regulated by QUARTET1, a Pectin Methylesterase Gene." Plant Physiol
142(3): 1004-1013.
Gonzalez-Bosch, C., E. del Campillo and A. B. Bennett (1997). "Immunodetection and
Characterization of Tomato Endo-[beta]-1,4-Glucanase Cel1 Protein in Flower
Abscission Zones." Plant Physiol 114(4): 1541-1546.
Grant, G. T., E. R. Morris, D. A. Rees, P. J. C. Smith and D. Thom (1973). "Biological
interactions between polysaccharides and divalent cations: The egg-box model."
FEBS Lett 32(1): 195-198.

Chapter 3
149
Hadfield, K. A. and A. B. Bennett (1998). "Polygalacturonases: Many Genes in Search of a
Function." Plant Physiol 117(2): 337-343.
Henderson, J., H. A. Davies, S. J. Heyes and D. J. Osborne (2001). "The study of a
monocotyledon abscission zone using microscopic, chemical, enzymatic and solid
state 13C CP/MAS NMR analyses." Phytochemistry 56(2): 131-139.
Henderson, J. and D. J. Osborne (1994). "Inter-tissue signalling during the two-phase
abscission in oil palm fruit." J Exp Bot 45(7): 943-951.
Hou, W.-C., W.-H. Chang and C.-M. Jiang (1999). "Qualitative distinction of carboxyl group
distributions in pectins with ruthenium red." Bot Bull Acad Sinica 40: 115-119.
Jarvis, M. C., S. P. H. Briggs and J. P. Knox (2003). "Intercellular adhesion and cell
separation in plants." Plant, Cell Environ 26(7): 977-989.
Jensen, J. K., S. O. Sørensen, J. Harholt, N. Geshi, Y. Sakuragi, I. Møller, J. Zandleven, A. J.
Bernal, N. B. Jensen, C. Sørensen, M. Pauly, G. Beldman, W. G. T. Willats and H. V.
Scheller (2008). "Identification of a Xylogalacturonan Xylosyltransferase Involved in
Pectin Biosynthesis in Arabidopsis." Plant Cell 20(5): 1289-1302.
Kauss, H. and W. Z. Hassid (1967). "Enzymic Introduction of the Methyl Ester Groups of
Pectin." J Biol Chem 242(15): 3449-3453.
Lennon, K. and E. Lord (2000). "In vivo pollen tube cell of Arabidopsis thaliana; I. Tube cell
cytoplasm and wall." Protoplasma 214(1): 45-56.
Leroux, O., J. P. Knox, F. Leroux, A. Vrijdaghs, E. Bellefroid, G. Borgonie and R. L. L.
Viane (2007). "Intercellular Pectic Protuberances in Asplenium: New Data on their
Composition and Origin." Ann Bot 100(6): 1165-1173.
Li, J. and R. Yuan (2008). "NAA and Ethylene Regulate Expression of Genes Related to
Ethylene Biosynthesis, Perception, and Cell Wall Degradation During Fruit
Abscission and Ripening in ‘Delicious’ Apples." J Plant Growth Regul 27(3): 283-
295.
Marty, P., B. Jouan, Y. Bertheau, B. Vian and R. Goldberg (1997). "Charge density in stem
cell walls of Solanum tuberosum genotypes and susceptibility to blackleg."
Phytochemistry 44(8): 1435-1441.
Micheli, F. (2001). "Pectin methylesterases: cell wall enzymes with important roles in plant
physiology." Trends Plant Sci 6(9): 414-419.
Mohnen, D. (2008). "Pectin structure and biosynthesis." Curr Opin Plant Biol 11(3): 266-277.

Chapter 3
150
O'Neill, M. A., T. Ishii, P. Albersheim and A. G. Darvill (2004).
"RHAMNOGALACTURONAN II: Structure and Function of a Borate Cross-Linked
Cell Wall Pectic Polysaccharide." Annu Rev Plant Biol 55(1): 109-139.
Osborne, D. J., J. Henderson and R. H. V. Corley (1992). "Controlling fruit-shedding in the
oil palm." Endeavour 16(4): 173-177.
Patterson, S. E. and A. B. Bleecker (2004). "Ethylene-Dependent and -Independent Processes
Associated with Floral Organ Abscission in Arabidopsis." Plant Physiol 134(1): 194-
203.
Pelloux, J., C. Rustérucci and E. J. Mellerowicz (2007). "New insights into pectin
methylesterase structure and function." Trends Plant Sci 12(6): 267-277.
Roberts, J. A., K. A. Elliott and Z. H. Gonzalez-Carranza (2002). "Abscission, Dehiscence,
and Other Cell Separation Processes." Annu Rev Plant Biol 53(1): 131-158.
Sexton, R., G. G. C. Jamieson and M. H. I. L. Allan (1977). "An ultrastructural study of
abscission zone cells with special reference to the mechanism of enzyme secretion."
Protoplasma 91(4): 369-387.
Sexton, R. and J. A. Roberts (1982). "Cell Biology of Abscission." Ann Rev Plant Physio
33(1): 133-162.
Tranbarger, T. J., S. Dussert, T. Joët, X. Argout, M. Summo, A. Champion, D. Cros, A.
Omore, B. Nouy and F. Morcillo (2011). "Regulatory mechanisms underlying oil
palm fruit mesocarp maturation, ripening and functional specialization in lipid and
carotenoid metabolism." Plant Physiol.
Usadel, B., A. M. Kuschinsky, M. G. Rosso, N. Eckermann and M. Pauly (2004). "RHM2 Is
Involved in Mucilage Pectin Synthesis and Is Required for the Development of the
Seed Coat in Arabidopsis." Plant Physiol 134(1): 286-295.
Verdeil, J. L., V. Hocher, C. Huet, F. Grosdemange, J. Escoute, N. Ferrière and M. Nicole
(2001). "Ultrastructural Changes in Coconut Calli Associated with the Acquisition of
Embryogenic Competence." Ann Bot 88(1): 9-18.
Watson, M. L. (1958). "Staining of Tissue Sections for Electron Microscopy with Heavy
Metals." The Journal of Biophysical and Biochemical Cytology 4(4): 475-478.
Webster, M., K. L. Witkin and O. Cohen-Fix (2009). "Sizing up the nucleus: nuclear shape,
size and nuclear-envelope assembly." J Cell Sci 122(10): 1477-1486.
Willats, W. G. T., G. Limberg, H. C. Buchholt, G.-J. van Alebeek, J. Benen, T. M. I. E.
Christensen, J. Visser, A. Voragen, J. D. Mikkelsen and J. P. Knox (2000). "Analysis

Chapter 3
151
of pectic epitopes recognised by hybridoma and phage display monoclonal antibodies
using defined oligosaccharides, polysaccharides, and enzymatic degradation."
Carbohydr Res 327(3): 309-320.
Willats, W. G. T., L. McCartney, W. Mackie and J. P. Knox (2001a). "Pectin: cell biology
and prospects for functional analysis." Plant Mol Biol 47(1): 9-27.
Willats, W. G. T., C. Orfila, G. Limberg, H. C. Buchholt, G.-J. W. M. van Alebeek, A. G. J.
Voragen, S. E. Marcus, T. M. I. E. Christensen, J. D. Mikkelsen, B. S. Murray and J.
P. Knox (2001b). "Modulation of the Degree and Pattern of Methyl-esterification of
Pectic Homogalacturonan in Plant Cell Walls." J Biol Chem 276(22): 19404-19413.
Willats, W. T., L. McCartney, C. Steele-King, S. Marcus, A. Mort, M. Huisman, G.-J.
Alebeek, H. Schols, A. J. Voragen, A. Goff, E. Bonnin, J.-F. Thibault and J. P. Knox
(2004). "A xylogalacturonan epitope is specifically associated with plant cell
detachment." Planta 218(4): 673-681.
Wolf, S., G. Mouille and J. Pelloux (2009). "Homogalacturonan Methyl-Esterification and
Plant Development." Mol Plant 2(5): 851-860.
Zhang, G. F. and L. A. Staehelin (1992). "Functional Compartmentation of the Golgi
Apparatus of Plant Cells : Immunocytochemical Analysis of High-Pressure Frozen-
and Freeze-Substituted Sycamore Maple Suspension Culture Cells." Plant Physiol
99(3): 1070-1083.

152
Chapter 4. Conclusion and Future Prospects
Chapter 4
153
Non-synchronized ripening and subsequent shedding of the ripest fruit before harvest
is an important factor that limits overall palm oil yields and increases harvest costs
(Henderson and Osborne 1990). Understanding the process of oil palm fruit abscission is an
important step towards providing tools for molecular breeding strategies to limit fruit
shedding. In addition, a two-stage abscission process involving primary and adjacent
abscission zones (AZs), plus high levels of unmethylated pectin and polygalacturonase (PG)
activity reported previously in the fruit AZ, warrant further investigation to provide insights
into the mechanisms of abscission in a monocot fruit species. An originality of the current
study is that it is based on multi-disciplinary approaches including physiology, histology,
immunolocalization, and molecular biology. The results obtained from these different
approaches allow an integrated view of the fruit abscission process in oil palm and a
schematic model of AZ development and function during shedding has been developed
(Figure 4.1).
Briefly, the AZ arises from periclinal cell divisions early during fruit development
and the capacity for the AZ to respond to ethylene increases during development and
coincides with an increase in the accumulation of unmethylated pectin particles within the
AZ cells. From early development, plasmodesmata (PD) are apparent between adjacent AZ
cells, whereas during development, the PD become larger and less numerous between layers
and remain numerous within layers. These results suggest intra-layer cell-cell communication
via PD is important for the functional capacity of the AZ layers. This may be especially
important for the alignment of the nuclei of the AZ cell layers that arises early during
development and persists up until fruit shedding. Furthermore, AZ cells have polarized
vesicle activity at the cell tips that coincides with cell elongation, which may provide inter-
layer communication functions.

Chapter 4
154
A major finding of these studies is the identification of EgPG4 transcript as the best
candidate for the large increase in PG activity previously observed (Henderson et al. 2001a).
In the current study, evidence has been provided that EgPG4 is highly induced in the AZ, but
also the fact that it occurs in an exceptionally high amount in the ripening mesocarp suggests
it may also function during ripening of this tissue. This contrasts with specialization of PGs
that function either in ripening or abscission in tomato, and suggests differences between the
associated regulatory pathways of these two divergent fruit species. Therefore, two important
questions arise from these results: 1) what factors regulate the spatial expression and
specificity of EgPG4 activity during abscission and during ripening in the mesocarp and 2)
what is the exact function of the EgPG4 enzyme in these two distinct tissues. To address
these questions is a great challenge considering the limitations to do functional studies in oil
palm. Nevertheless, some available approaches have already been initiated and others can be
envisaged to provide evidence for the role of EgPG4 and the regulatory factors that function
during oil palm fruit shedding.
Firstly, to examine the possible factors that regulate the transcription of EgPG4,
genomic DNA library is under construction to isolate the EgPG4 promoter. In addition,
samples collected during the ethylene time course (Figure 2.1) were collected to do both
transcriptome and proteome sequencing. The proteome data is currently available and is
being analyzed by the group, while the 454 pyrosequencing analysis of the abscission
transcriptome is planned for the end of 2011 in Thailand. Another possible approach could be
to raise antibodies to the EgPG4 protein to examine its subcellular localization in the AZ and
the mesocarp. This approach could provide evidence for the role of EgPG4 in these tissues
and provide additional tools for examining abscission in this species. These approaches could
give insight into the regulatory pathways that function in the oil palm AZ during shedding.

Chapter 4
155
The current studies also raise the question about the significance of the JIM5 and
JIM7 epitopes at the separated sites, and the mechanism by which these signals increase in a
polarized manner preferentially on the separated cell surface layer. Several mechanisms can
be proposed to explain the phenomenon including: 1) PME activity in the separation layer
cell walls acts on either pectin already present in the cell wall, or newly inserted pectin
secreted during the cell separation process, 2) PMT activity within the separation layer cells
methylates unmethylated pectin that is then secreted to the apoplast, 3) the transfer of pectin
throughout the AZ cell layers towards the separation layer where the JIM5 and 7 pectin
epitopes accumulate. These are not mutually exclusive and the increase in the JIM5 and 7
epitopes could be a combination of all these mechanisms. One important question remains to
be answered is the exact subcellular localization of these epitopes and how they change
during separation. In order to determine the subcellular localization, experiments have been
initiated with JIM5 and JIM7 antibodies combined with electron microscopy. The results
from these experiments are currently unavailable. In addition, to complete the cellular
characterization of oil palm fruit AZ during development and after separation, the
ultrastructure of fruit at 180 DAP and 180 DAP 9 h with ethylene treatment should be studied
with electron microscopy. Together, these experiments should give a better view of cellular
ultrastructure changes during development and after separation and the localization dynamics
of the JIM5 and 7 epitopes during fruit shedding.
Finally, a study of the AZ using infrared spectroscopy (IRS) has been initiated and
could also provide further evidence of the importance of methyl-esterification in the AZ of
separated and unseparated sites comparing to mesocarp and pedicel. After the infrared
spectroscopy analysis finishes, the information can be compared with the results of the
immunohistochemistry of JIM5, JIM7, and LM7 given that IRS can also quantify the amount
of methyl-esterification in the fruit tissues and different cell types. Moreover, it can also
Chapter 4
156
quantify the amount of other compounds such as hydroxyl compounds, other
polysaccharides, and lipid contents, which will also expand knowledge of the oil palm fruit
AZ.
This Ph.D. work shows that the oil palm fruit AZ has many interesting characteristics.
The work and results extends the oil palm fruit AZ to be used as a model to study abscission
in plants, especially in fruit bearing monocots. The author also assumes that using different
cellular and molecular approaches in this study and future experiments will give a better
knowledge in abscission process for the ultimate goal to control the fruit shedding and to
limit the loss of palm oil yield from unsynchronizing fruit shedding.

Chapter 4
157
Figure 4.1. Schematic of abscission zone evolution during development until after separation corresponding to JIM5 and JIM7 epitopes.
PMT PMT
PMT PMT
PME
- Periclinal cell division
- Demethyl esterification
- Unmethylated pectin accumulation
- Cell expansion
- Cell wall width expansion
- Cell wall striation appearance
- Loss of pectin within cell
- Increase of methylated pectin
recognized by JIM5, and JIM7 epitopes
at separated sites
- JIM5 epitope signal increases within 3
h with ethylene treatment
- Separation about the middle of the
zone
- EgPG4 transcript increase
- Transfer of pectin within cell to the
separated sites with cooperation of PME
or PMT modifying pectin to the forms
recognized by the epitopes should
explain the result of the increase of
JIM5, JIM7 epitopes at the separated
sites
AZ cell 30 DAP shows
plasmodesmata, nuclei, and
JIM5 or JIM7 epitopes signal
presence
AZ cell 180 DAP shows JIM5
or JIM7 epitopes signal
absence (left) and appearance
(right)
Pectin within cell
Ribosomes, mitochondria, and
other vesicles
30 DAP 180 DAP before separation 180 DAP after separation Nucleus 30 DAP (left) and
180 DAP (right)
Ethylene
- Plasmodesmata expansion and amount
decrease
- Angular nuclear shape alteration
Chapter 4
158
Literature Cited
Henderson, J., H. A. Davies, S. J. Heyes and D. J. Osborne (2001). "The study of a
monocotyledon abscission zone using microscopic, chemical, enzymatic and solid
state 13C CP/MAS NMR analyses." Phytochemistry 56(2): 131-139.
Henderson, J. and D. J. Osborne (1990). "Cell Separation and Anatomy of Abscission in the
Oil Palm, Elaeis guineensis Jacq." J Exp Bot 41(2): 203-210.