universitÀ degli studi di rento - unitrento
TRANSCRIPT

UNIVERSITÀ DEGLI STUDI DI TRENTO
FACOLTÀ DI SCIENZE MATEMATICHE FISICHE E NATURALI
SCUOLA DI DOTTORATO IN FISICA (23◦ CICLO)
INVESTIGATIONS OF BIOLOGICAL MEMBRANES
BY NMR AND ESI-MS METHODOLOGIES
DOCTOR OF PHILOSOPHY IN PHYSICS
BY
TOMMASO SANDRON
SUPERVISOR: PROF. GRAZIANO GUELLA
December 2010


To my parents


Contents
1 Introduction 71.1 Lipidomics . . . . . . . . . . . . . . . . . . . . . . . . . . . . . . 7
1.2 Detergent Resistant Membranes . . . . . . . . . . . . . . . . . 14
1.3 Cold resistance in insects larvae . . . . . . . . . . . . . . . . . 16
2 Analytical methodologies in lipidomics 212.1 Basic theory of NMR spectroscopy . . . . . . . . . . . . . . . . 21
2.2 NMR experiment . . . . . . . . . . . . . . . . . . . . . . . . . . 23
2.3 Debye model . . . . . . . . . . . . . . . . . . . . . . . . . . . . . 27
2.4 Solid-state NMR . . . . . . . . . . . . . . . . . . . . . . . . . . . 28
2.5 ESI mass spectrometry . . . . . . . . . . . . . . . . . . . . . . . 30
2.5.1 Phosphocholine lipids . . . . . . . . . . . . . . . . . . . . 34
2.5.2 Phosphoethanolamine lipids . . . . . . . . . . . . . . . . 36
3 Material and methods 393.1 Materials . . . . . . . . . . . . . . . . . . . . . . . . . . . . . . . 39
3.2 Mixture of standard lipids . . . . . . . . . . . . . . . . . . . . . 39
3.3 DRMs and whole cell membranes isolation and extraction . . 40
3.4 FAME preparation and GC-MS analysis . . . . . . . . . . . . . 40
3.5 Stress protocol and lipid extraction from larvae . . . . . . . . . 41
3.6 LC-MS Measurements . . . . . . . . . . . . . . . . . . . . . . . 42
3.7 NMR Measurements . . . . . . . . . . . . . . . . . . . . . . . . 43
5

CONTENTS
4 Results and discussion 454.1 Standard mixture of lipids . . . . . . . . . . . . . . . . . . . . . 454.2 Lipid profile of PSMA-anchoring rafts . . . . . . . . . . . . . . 514.3 Cold resistance in Chironomid larvae . . . . . . . . . . . . . . 61
4.3.1 Diamesa cinerella . . . . . . . . . . . . . . . . . . . . . . 624.3.2 Pseudodiamesa branickii . . . . . . . . . . . . . . . . . . 734.3.3 Discussion . . . . . . . . . . . . . . . . . . . . . . . . . . 80
5 Conclusions 87
6

Chapter 1
Introduction
1.1 Lipidomics
System biology is the computational integration of genetic, transcriptomic,proteomic and metabolomic information with the intent of understandingall of the molecular processes within a cell organism. The sequencing ofthe human genome, the development of gene arrays and the availabilityof soft-ionization mass spectrometry techniques have led the way for high-throughput genomics and proteomics [1]. The end product of genetic andprotein expression is the metabolome (see figure 1.1), the total component ofmetabolites within a cell organism, reflecting the most downstream effectsof gene and protein regulation and providing relevant information about thebiological state of the system [2]. Metabolomics represents a paradigm shiftfrom looking at individual metabolites to examining complete metabolic net-works in an entire cell or organism.
Within the big area of metabolomics, in the last ten years there has beena new reappraisal of the function of lipids in the cell life, not only with astructural role as cell wall or an energy storage function, but also with asignificant function on signaling and protein recognition processes (see fi-gure 1.2). This new attention on lipids has led to a new research field in themetabolomics world called Lipidomics [3]. Lipidomics is more than just the
7

Introduction
Figure 1.1: The "‘omics"’ world from gene to metabolite
complete characterization of all lipids in a particular biological sample. Itis the comprehensive understanding of the influence of all lipids on a bio-logical system with respect to cell signaling, membrane architecture, tran-scriptional and translational modulation, cell-cell and cell-protein interac-tion and response to environmental changes over time. The critical role oflipids in cell, tissue and organ physiology is demonstrated by many humandiseases involving the disruption of lipid metabolic enzymes and pathways.Examples of such diseases include diabetes, cancer, neurodegenerative dis-orders and infectious diseases. This warrants the expectation that clinicaldiagnosis of these diseases will greatly take advantage from lipid patternanalysis and represents a clue for understanding the molecular diversityobserved in membrane phospholipids. Subtle biophysical properties are alsoanother possible explanation of strong interest toward lipids especially withreference to the emerging field of heterogeneous membrane microdomains(rafts). The major goal in lipidomics is the identification of metabolic path-ways which are activated or deactivated during development of an organismor when a cell is shifted from an established physiological condition to an-
8

1.1 Lipidomics
other physiological or pathological condition (metabolic learning). A betterunderstanding of the regulation of underlying metabolic pathways is neces-sary to design novel strategies for intervention.
Figure 1.2: Diverse biological roles of lipids, with a few common representa-tive molecular species listed. Reprinted from [4]
Even at present time, lipids are defined as molecules soluble in organicsolvents or at least extracted from aqueous systems by use of an immisci-ble solvent; there are so many examples of lipid substances that do notobey this simple rule that defining these substances based on their biosyn-thetic origin is much more descriptive [5]; thus a new nomenclature hasbeen proposed for lipids, classifying them into eight major categories: fattyacyls, glycerolipids, glycerophospholipids, sphingolipids, sterol lipids, prenollipids, saccharolipids and polyketides. This classification shows us the ex-traordinary large number of lipids in nature. In our work attention has beenmainly focused on glycerophospholipids, sphingolipids and cholesterol. The
9
Introduction
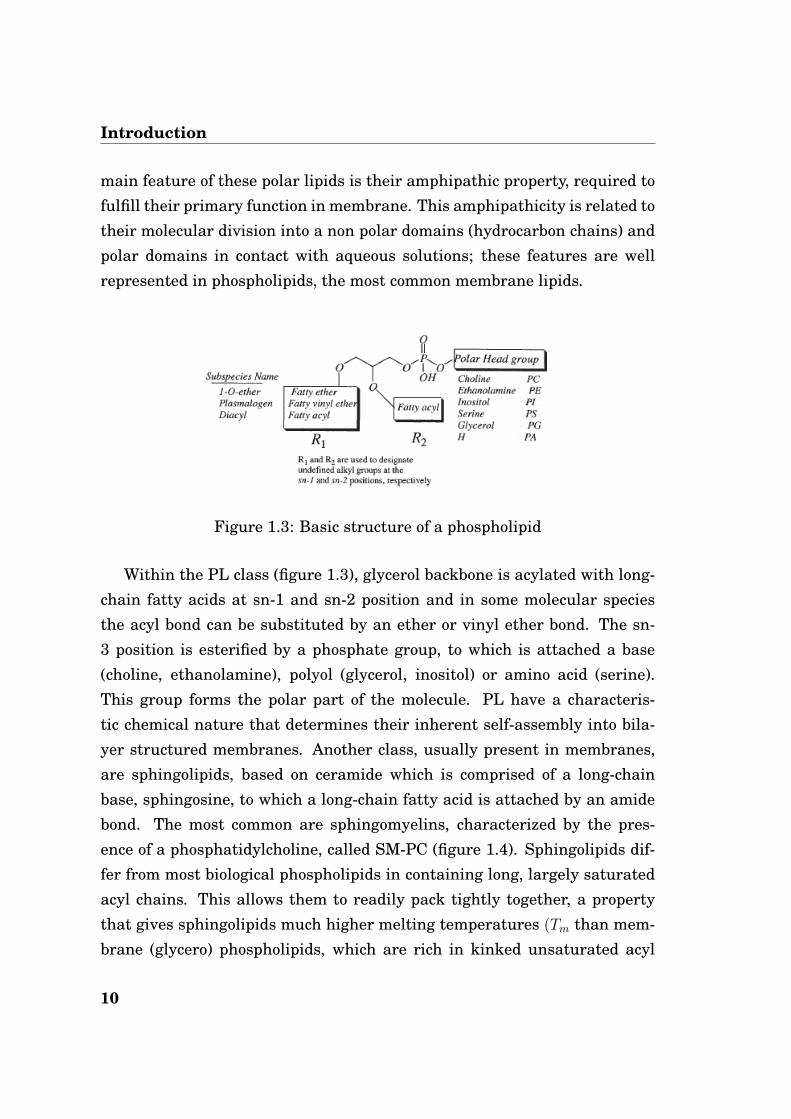
main feature of these polar lipids is their amphipathic property, required tofulfill their primary function in membrane. This amphipathicity is related totheir molecular division into a non polar domains (hydrocarbon chains) andpolar domains in contact with aqueous solutions; these features are wellrepresented in phospholipids, the most common membrane lipids.
Figure 1.3: Basic structure of a phospholipid
Within the PL class (figure 1.3), glycerol backbone is acylated with long-chain fatty acids at sn-1 and sn-2 position and in some molecular speciesthe acyl bond can be substituted by an ether or vinyl ether bond. The sn-3 position is esterified by a phosphate group, to which is attached a base(choline, ethanolamine), polyol (glycerol, inositol) or amino acid (serine).This group forms the polar part of the molecule. PL have a characteris-tic chemical nature that determines their inherent self-assembly into bila-yer structured membranes. Another class, usually present in membranes,are sphingolipids, based on ceramide which is comprised of a long-chainbase, sphingosine, to which a long-chain fatty acid is attached by an amidebond. The most common are sphingomyelins, characterized by the pres-ence of a phosphatidylcholine, called SM-PC (figure 1.4). Sphingolipids dif-fer from most biological phospholipids in containing long, largely saturatedacyl chains. This allows them to readily pack tightly together, a propertythat gives sphingolipids much higher melting temperatures (Tm than mem-brane (glycero) phospholipids, which are rich in kinked unsaturated acyl
10

1.1 Lipidomics
chains.
Figure 1.4: Structure of a sphingomyelin
Another important lipid, present mainly in eukaryotic membranes, ischolesterol (figure 1.5). Cholesterol is largely hydrophobic. But it has onepolar group, a hydroxyl, making it amphipathic. Cholesterol, an importantconstituent of cell membranes, has a rigid ring system and a short branchedhydrocarbon tail.
Figure 1.5: Structure of cholesterol
Cholesterol or closely related sterols are major lipid components of theplasma membranes of most eukaryotic cells, and are also found in lower
11

Introduction
concentrations in many intracellular membranes. Cholesterol has nume-rous different functions in eukaryotic cells, one of its primary roles beingto modulate the physical properties of the plasma membrane phospholipidbilayer. Cholesterol incorporation into bilayers has four effects: first, itbroadens and eventually eliminates the cooperative gel to liquid crystallinephase transition of phospholipid bilayers; second, it decreases (increases)the area per molecule of the liquid crystalline (gel) state monolayers; third,it increases (decreases) the orientational order of the hydrocarbon chainsof liquid crystalline (gel) bilayers; and fourth, it decreases (increases) thepassive permeability of phospholipid bilayers above (below) their gel to li-quid crystalline phase transition temperatures. The largest contribution tocholesterol-phospholipid interactions appears to derive from van der Waalsand hydrophobic forces, although hydrogen bonding to the polar headgroupand interfacial regions of the host lipid bilayer may be of considerable im-portance, especially in the sphingolipids and anionic phospholipids.
The rapid growth of lipidomics has primarily resulted from technologi-cal advances in mass spectrometry (MS) and the analysis of lipids has beenperformed by a diverse variety of approaches reflecting the diverse chemi-cal subclasses. Gas chromatography (GC and GC/MS) approaches providea rapid and sensitive method of analysis. However, in this approach thelipid sample has to be hydrolyzed prior to analysis and the resulting freefatty acids (FFA) have to be converted into the corresponding trimethylsilylor methyl esters to enhance their volatility. Therefore, the information onthe fatty acid prime location is lost. A great improvement to metabolomicsand, specifically, to lipidomics has been made by the development of soft-ionization mass spectrometry techniques like ESI-MS [6] and MALDI [7],the former also coupled to an high pressure liquid chromatographic system(HPLC-MS). An example of the great potential of these techniques on lipi-domics is the recently work by Ejsing et al. [8], where they have mappedthe global composition of lipid component of Saccharomyces cerevisiae. Fur-thermore MALDI has permitted to make experiments not only on extracts
12

1.1 Lipidomics
but also on samples simply obtained from whole cells, tissues or organisms[9]. These mass spectrometric techniques are useful thanks to their highresolution and sensitivity and to the ability to profile complex mixtures in astraightforward way. There are also some disadvantages: the necessity (forESI) of of samples prepared by preliminary extraction procedures, , the dif-ficulties in quantitative analyses due to the MS response factors of the pho-spholipids classes [10] requiring to provide reliable working curves and/orinternal standards.
Another powerful technique that has contributed to the development oflipidomics allowing to obtain quantitative and qualitative informations hasbeen high-resolution NMR. It allows structure elucidation, qualitative andquantitative analysis of defined molecules and even complex mixtures. Notall nuclei are accessible to the NMR-experiment. But those which are im-portant in lipid chemistry like 1H, 13C, and 31P are recordable as a matterof routine with modern instruments equipped with multinuclear trasmitter-probes. The drawbacks are the low sensitivity intrinsic of this technique,the need of extraction procedures and the use of detergents to resolve allsignals in a 31P NMR spectrum, hindering a final recovery of the sample.To overcome these problems, in recent years, another NMR technique hasbeen applied to metabolomic/lipidomics investigations that permits to makemeasurements directly on cell or tissues: solid state NMR.
In addition to LC-MS and NMR, another physical techniques have beenapplied in lipidomics: infrared and Raman spectroscopy. These techniquesallow to perform analysis on ex-vivo samples, avoiding extraction proce-dures, and to identify possible markers of diseases [11] also with the cou-pling with microscopic techniques. These techniques, however, are not ableto distinguish the various phospholipid classes or to separate contributiondue to triglycerides and to phospholipids because they give informationsonly about the lipid conformational order, the acyl chain packing order orthe mean unsaturation degree, all global data and not specific to a singleclass or lipid.
13

Introduction
In this thesis attention has been focused on two biological systems todemonstrate how the study of membrane lipids can help for a better un-derstanding of the mechanisms involved in different biochemical processes.In the first example we have studied the components of DRM (detergentresistant membrane) associated with the expression of PSMA, a protein in-volved in the prostate carcinoma. In the second we have analyzed the com-position of membranes of two insect larvae of two species (Pseudodiamesabranickii and Diamesa cinerella) to obtain information about the mecha-nisms involved in the adaptation of the organisms at temperatures below 0◦C.
1.2 Detergent Resistant Membranes
The fluid mosaic model [12] was the principal model used to describe mem-brane structure until two decades ago. Instead, it is now known that lipidsare distributed asymmetrically between the outer and inner leaflets of thebilayer [13] and that this imposes a different organization of membrane com-ponents on the lateral axis. According to this, the disparity between vari-ous lipid populations results in the separation of liquid and gel-like phaseswithin one membrane. The gel-like phase consists of small membrane enti-ties, which can move easily in the fluid remainder of the membrane. Thesedynamic structures are called lipid rafts (or lipid microdomains, membranemicrodomains, DRMs) [14]. The single universal physicochemical attributeof membrane microdomains is their ability to resist extraction with non-ionic detergents (for example, Triton X-100) at 4◦C [15]. This initial demon-stration of the existence of DRMs in cells has now become a widely es-tablished and adopted method for their isolation from biological samplesand has led to the term "‘Detergent Resistant Microdomains, DRMs"’ [16]which encompasses several membrane populations that share the commonability to remain insoluble in various detergents. Their resistance to de-tergents is ,in turn, related reciprocally to their composition, as reported
14

1.2 Detergent Resistant Membranes
in a work by Schuck and coworkers [17]. These microdomains exist in aliquid-ordered (lo) phase, an intermediate state between the conventionallynamed Lβ and Lα states that have also been designated solid-ordered (so)and liquid-disordered (ld) respectively, and they are dispersed into the liquid-disordered phase of the lipid bilayer. This new phase is related to its com-position, formed principally by cholesterol and sphingolipids. The first hasthe ability, in a liquid crystalline phase, to order acyl chains decreasing thearea per molecule and inducing the segregation of liquid ordered domains;sphingolipids favor this segregation process because they have more satu-rated chains optimizing acyl chain packing [18]. Acyl chains of lipids in the(lo) phase are extended and tightly packed, as in the gel phase, but have ahigh degree of lateral mobility [15]. Two general models have emerged toexplain the relative stability of lipid rafts [19]. One centers on the role ofheadgroup interactions and hydrogen bonding [20] [21]. In one form [14],it is posited that sphingolipids interact with each other through their head-groups and through the interaction of the amide of the sphingosine base ofone sphingolipid with hydroxyls or carboxyls of an adjacent sphingolipid. Inthat case, many sphingolipids would associate through the formation of anetwork of bonds [22]. The cholesterol would effectively pack into the spacebetween the sphingolipids in a manner analogous to the way it fills spacebetween phospholipids. Hydrogen bonding between the 3-OH group of cho-lesterol and the amide of the sphingosine would stabilize this localizationof cholesterol. The other model [23] considers the interactions between thechains as the primary determinant. This model places emphasis on the factthat saturated acyl chains are more extended than unsaturated ones andpack well with each other into liquid-ordered phases [24]. Cholesterol mayinteract more favorably with a saturated than an unsaturated sphingolipidbecause cholesterol is a flat, rigid molecule. The interactions between acylchains of the sphingolipids and cholesterol would be the critical factor increating rafts.
DRM are involved in the recognition and transport process of the prostate
15

Introduction
specific membrane antigen (PSMA) [25], a 750-residue type II transmem-brane glycoprotein of the normal prostate cells and one of the most promi-sing biomarkers of prostate carcinoma [26] as its expression is drasticallyincreased in cancer cells protein involved in the prostate carcinoma [27]. Inparticular, the complex glycosylated form of the protein is found in Lubrolinsoluble DRMs. Many essential cellular events, such as protein sorting,endocytosis and signal transduction pathways, are triggered via associationof the proteins directly implicated in these processes with DRMs. The aimof this work is to determine the lipidic profile of these microdomains, inparticular to establish the quali-quantitative changes in lipid distributionbetween DRM and whole cell membrane of the cancer cell line. We havefocused the attention on two factors: the molar ratio between cholesteroland phosphatidylcholine (PC) and the relative molar ratio of the various be-tween the various phospholipid classes (PC, SM, PE). In order to gain thisinformation we analyzed the samples by NMR (1H and 31P ) and HPLC/ESI-MS.
1.3 Cold resistance in insects larvae
Membrane is the main part used by cell to communicate with the outside,to transport molecules inside and outside it and to preserve its integrityand life against abiotic and biotic stresses. In physiological conditions mem-brane is in a liquid-crystalline phase characterized by a certain degree ofdisorder, mobility and fluidity and these features have to be maintained topreserve the integrity of the cell. The main process accessible to the cell toconserve membrane fluidity, in case of low temperature adaptation, is thelowering of the transition temperature from gel to liquid phase, also calledmelting temperature (Tm) modifying the membrane composition [28]. Thislowering can be obtained with many processes, among which the increaseof unsaturation degree of the fatty acid chain of phospholipids, the increaseof expression of some proteins (antifreeze proteins and heat shock proteins)
16

1.3 Cold resistance in insects larvae
and the binding of little molecules (sugars, glycerol) to the membrane.
It has been demonstrated, in literature, that the insertion of unsaturatedchains in phospholipids (both PC and PE) lowers the melting temperatureof the membrane [29][30] varying, for example, from 82.5 ◦C for a 20:0/20:0PE model bilayer to 3.5 ◦C for a 20:0/20:5 PE bilayer [31]. The trend ofmelting temperature with temperature could be described, at first approach,by a simple model based on these assumptions: 1) the monoenoic sn-2-acylchain in the sn-1-saturated/sn-2-monounsaturated phospholipid molecule isassumed to adopt, at T < Tm, an energy-minimized crankshaft-like motifin the gel state bilayer; hence, it consists of a longer chain segment and ashorter chain segment separated by the cis double bond; 2) the longer seg-ment and the neighboring all-trans sn-1-acyl chain run in a parallel man-ner with favorable van der Waals attractive distance between them; 3) theshorter segment is considered to be partially disordered at T < Tm, analo-gous to the molten polypeptide chain of proteins, thus playing a relativelyinsignificant role in the attractive van der Waals chain-chain interactionsin the gel state bilayer; 4) the sn-2-acyl chain containing two cis doublebonds is highly flexible in the gel state bilayer, leading to a weakest late-ral chain-chain interaction in comparison with other sn-1-saturated/sn-2-polyunsaturated lipids; 5) when the sn-2-acyl chain contains three or morecis double bonds, however, these methylene-interrupted cis double bonds canbe considered as an essentially immobile unit in the gel state bilayer.
The use of small molecules (sugars, polyols) as cryoprotectants is one ofthe most used methods by invertebrates and plants, in particular trehaloseand glycerol [32][33][34]. It has been shown that the molecular mechanismunderlying this cryo-protective effect is the hydrogen bonding pattern of thetrehalose molecules to the bilayer headgroups [35]. The sugar can "‘substi-tute"’ some of the hydrogen bonds normally provided by water and by thatstabilize the fragile bilayer arrangement. Stabilization or destabilizationhere mean that the bilayer is able to withstand harsher or less harsh condi-tions in presence of small molecules compared to the pure bilayer in water.
17

Introduction
Trehalose is experimentally known to prevent the lipid from undergoing aphase transition under cooling, i.e., it shifts the main phase transition tem-perature significantly [36].
Knowledge as to how aquatic insects will potentially react and adapt inface of increasing human impacts is one of the major challenge in predictionof future freshwater biodiversity trends. One main driver of biodiversitychange has been individuated, global warming. In relation to this driver, oneadaptive trait was selected, resistance to adverse temperature conditions,in two target insect species (Diptera: Chironomidae): the cold stenother-mal and stenotope Pseudodiamesa branickii (Nowicki) and Diamesa cine-rella (Meigen). These species are frequent in cold mountain springs andstreams (<7-8 ◦C). These species, as reported in literature [37], have devel-oped a complex of strategies to survive at their physiological temperatureminimum, comprising morphological, behavioral, ecological, physiologicaland biochemical adaptations. The first three adaptations have been deeplydiscussed [38], whereas the last two only recently have been investigated,highlighting the role of cryo-protectants and anti-freezers molecules (poly-ols, sugars and proteins) [39][40]. Five candidate genes have been indicatedas determinants for resistance to cold and warm temperature (hsc70, hsp70,hsp90, afps). Heat shock proteins are known to be involved in temperaturevariation resistance in many organisms, as well as antifreeze proteins incold resistance.
The general aim of this project is to give new insights on how theseaquatic organisms could respond to the oncoming temperature increase re-lated to global climate change. This by the i) characterization of geneticdeterminants of resistance to abiotic stresses in natural populations of thetwo selected target species and ii) definition of the role of metabolites such asproteins and sugars and of the membrane lipid composition in developmentof such resistances.
This work is inserted in a bigger study on biodiversity with the aim tostudy the direct consequences that biodiversity changes or loss may involve
18

1.3 Cold resistance in insects larvae
in the ecosystem and the selected ecological, genetic and biochemical mecha-nisms implemented by living organisms to adapt to environmental stresses.
19

Introduction
20

Chapter 2
Analytical methodologies inlipidomics
2.1 Basic theory of NMR spectroscopy
NMR spectroscopy was developed in ’50s observing the interaction betweenthe magnetic component of radiation and the magnetic dipoles associated toangular momentum of nuclei. Angular momentum of nuclei is related to amagnetic momentum by the costant γ, defined as gyromagnetic ratio
µz = γlz = γMlh (2.1)
µz is z component of magnetic momentum, lz z component of angularmomentum and Ml is quantic number related to angular orbitalic momen-tum. In solution, with good approximation, we can consider only the spincomponent of magnetic momentum, defined by the quantic number I. If weconsider only nuclei with I = 1/2, we have only two value for MI = ±1/2,representing two different spin states, autofunctions of operator Iz: |α〉 stateand |β〉 state, with respective autovalues +1/2 and -1/2. These states havethe same energy with zero field, but, if we applied a static magnetic field,the states are splitted to two different energies due to Zeeman interactionbetween magnetic field and nuclear magnetic dipoles. This interaction can
21

Analytical methodologies in lipidomics
be expressed by a spin hamiltonian
HZe = −γhIzB0 (2.2)
From equation 2.2 we can calculate autoenergies of the two spin states
Eα = 〈α |H|α〉 = −1
2γhB0 (2.3)
Eβ = 〈β |H| β〉 =1
2γhB0 (2.4)
In figure 2.1 the energy splitting due to Zeeman interaction is schemati-cally drawn.
Figure 2.1: Energy splitting of spin states due to Zeeman interaction
The response of the spin of the overall magnetization to an applied mag-netic field is to move around the field, like in figure 2.2; this motion is calledprecession.
The spin rotate around magnetic field with a frequency of precession thatis equal to
ω0 = −γB0 (2.5)
22

2.2 NMR experiment
Figure 2.2: Precession of magnetization around magnetic field
where B0 is the magnetic field applied and γ is the gyromagnetic ratio.In NMR ω0 is called Larmor frequency and it’s also related to the transitionenergy between two spin states ∆E = hω0. The sense of spin prcessiondepends on the sign of γ. Most nuclei have positive γ, with a consequentnegative Larmor frequency; in this case the precession is in the clockwisedirection.
2.2 NMR experiment
At equilibrium, once applied the static magnetic field along z-axis, we haveonly longitudinal magnetization that is undetectable. To observe signal, wehave to distort the equilibrium magnetization and the simplest method todo this is to apply an additional magnetic field B1(t) perpendicualar to B0
to excite spin transitions; in this way we obtain a transverse magnetizationthat is observable, as we can observe in figure 2.3. Normally the additionalmagnetic field is applied as an radiofrequency pulse with an appropriatepower, frequency and duration.
The transverse magnetization is observed as a complex signal, called FID
23

Analytical methodologies in lipidomics
Figure 2.3: Effect of the application of a rf pulse on magnetization
(Free induction decay), that could be divided in two parts: one real and onecomplex, expressed in equation 2.6
f(t) = fc(t) + ifs(t) (2.6)
fc(t) = cos(∆ωt)exp(−t/T ∗2 ) (2.7)
fs(t) = sin(∆ωt)exp(−t/T ∗2 ) (2.8)
f(t) = exp(i∆ωt)exp(−t/T ∗2 ) (2.9)
where ∆ω = ω0 − ω is the offset frequency and T ∗2 (overall tranverse re-
laxation time) includes contributions from field inhomogeneity of the sample(T ′
2) and from transverse relaxation (T2).
1/T ∗2 = 1/T2 + 1/T
′
2 (2.10)
Converting from time domain to frequency domain by Fourier transform,we obtain a signal with the form of a lorentzian curve with a full width athalf-height equal to ∆ν1/2 = 1/πT ∗
2
F (ω) =∫f(t)exp(−iωt)dt =
λ
λ2 + (ω − ω0)2(2.11)
24

2.2 NMR experiment
As seen above, if we obtain a good field homogeneity along the sampleby a good shimming, the principal contribution to linewidth is the trans-verse relaxation. This relaxation is due to molecular motions creating somefluctuating magnetic fields that can be expressed in this way
b(t) = |b0| f(t) (2.12)
where f(t) is a function characteristic of the particular motion with theseproperties: f(t) = 0 and f(t)f ∗(t) 6= 0. The fluctuations are described bythe autocorrelation function G(τ) = f(t)f ∗(t+ τ), with these properties: forsmall τG(τ) is always positive and has an high value, for long τ G(τ) canbe positive or negative and is equal to zero for infinite τ , while for τ equal tozero G(τ) has its maximum value. From these properties we can adopt anexponential form for G(τ)
G(τ) = G(0)exp(−τ/τC) (2.13)
where τC is called rotational correlation time. If we apply Fourier trans-form to autocorrelation function we obtain the spectral density J(ω) with theform
J(ω) = f(t)f ∗(t)2τC
1 + ω2τ 2C=
2τC1 + ω2τ 2C
(2.14)
Generally we can express the velocity of a transition induced by a mag-netic field with the formula
W =1
4γ2(
1
2µ0
B20x) (2.15)
In the case of relaxation, where the transitions are induced by the fluc-tuating fields b, we can rearrange the previous equation in this form
W ∝ γ2b2xJ(ω0) (2.16)
25

Analytical methodologies in lipidomics
and, for the particular case where the fluctuating fields are due to relax-ation, we obtain the following expression
W =1
T2∝ D2[AJ(0) +BJ(ω0 + CJ(2ω0)] (2.17)
where D represent the strength of the anisotropic interaction that causesrelaxation, and J(ω) has the form reported in equation 2.14. The last equa-tion shows us the relation between linewidth, related to T2, and the rota-tional correlation time, like described in figure 2.4.
Figure 2.4: Correlation between relaxation time and rotational correlationtime τC
τC depends on some variables like temperature, viscosity of the solvent
26

2.3 Debye model
and molecular dimensions. The simplest model that describe this relation isDebye model.
2.3 Debye model
The Debye model is the simplest approach to describe rotational moleculardiffusion is this: we consider a vector, determining the orientation of thesystem, that randomly walks around a sphere with an isotropic Brownianmotion. We can calculate the vector probability distribution on (θ, φ) at timet, starting from the origin (0,0), by the diffusion equation
dP (θ, φ, t)
dt= DR
{1
sinθ
∂
∂θ
(sinθ
∂
∂θ
)+
1
sin2θ
∂2
∂φ2
}P (θ, φ, t) (2.18)
DR is rotational diffusion coefficient, characteristic of the motion. Theequation 2.18 can be solved if P (θ, φ, t) is constructed as an expansion ofspherical harmonics Yl,m(θ, φ)
P (θ, φ, t) =∑l,m
cl,mYl,m(θ, φ) exp−l(l + 1)DRt (2.19)
The correlation time, describing time employed to cover one radiant,could be related to the rotational diffusion coefficient
τc =1
6DR
(2.20)
Diffusion coefficient is related to the coefficient of friction, fR, by Einsteinequation
DR =kBT
fR(2.21)
and the coefficient of friction is correlated to molecular parameters byStoke law
27

Analytical methodologies in lipidomics
fR = 8πηr30 (2.22)
η is solvent viscosity and r0 is the molecular hydrodynamic radius ap-proximated to a sphere. Combining two last equations, we obtain Debyeequation correlating rotational correlation time to molecular parameters.
τc =4πηr303kBT
(2.23)
From this model we can deduce that in NMR spectroscopy there is a limiton resolution due to molecular dimensions, i.e. over a certain dimension thelinewidth is too large to separate all peaks. To overcome this problem, in the’60s, it has been developed another technique, called Solid-State NMR, al-lowing to perform NMR experiments on solid and macromolecular samples.
2.4 Solid-state NMR
As we see in the previous section, the spin hamiltonian can be divided intwo parts that take account of internal and external contributions.
H = Hex + Hint = HZe + Hrf︸ ︷︷ ︸Hex
+ HCS + HQ + HD + HJ + . . .︸ ︷︷ ︸Hin
(2.24)
In solids the relative contribution of these interactions is different thanin anisotropic or isotropic liquids, as showed in figure 2.5.
From the figure 2.5 we note that the major contributions come fromchemical shift, short range dipolar interaction and quadrupolar interaction(only for nuclei with I ≥ 1). In the general case these contributions over-lap resulting in very broad and featureless lines. To reduce the effects ofthese interactions and to obtain an high resolution solid-state NMR spec-trum, some techniques have been developed with the aim of narrowing linesand enhancing signal. The principal techniques, now always used to these
28

2.4 Solid-state NMR
Figure 2.5: Relative magnitudes of the motionally-averaged spin Hamilto-nian terms in different phases of matter
29

Analytical methodologies in lipidomics
aims, are magi-angle spinning (MAS), cross polarization (CP) and spin de-coupling.The two major anisotropic contributions (chemical shift and heteronucleardipolar coupling), as we can see from the respective hamiltonian 2.25 and2.26, only if the term (3cos2θ − 1) is equal to zero, i.e. if the angle θ=54.7◦;if we spin the sample at this angle we eliminate these contributions and wenarrow the lines.
HCS = γhB0IZ1
2δ(3cos2θ − 1) (2.25)
HD,IS =µ0
4π
γIγSh2
r31
2(3cos2θ − 1)(I · S − 3IZSZ) (2.26)
MAS is unable to eliminate totally the contribution from heteronucleardipolar coupling; to do this, we add the effects of heteronuclear decoupling,obtained with multipulse decoupling techniques, less heating the samplethan continuous wave decoupling. The other most used technique is thecross polarization that takes advantage of heteronuclear dipolar coupling totransfer polarization from abundant spins (typical 1H) to dilute spins (13Cor other).
2.5 ESI mass spectrometry
Mass spectrometry (MS) is an analytical technique that measures the mass-to-charge ratio of charged particles. It is used for determining masses ofparticles, for determining the elemental composition of a molecule, and forelucidating the chemical structures of molecules, such as peptides and otherchemical compounds. The MS principle consists of ionizing chemical com-pounds to generate charged molecules or molecule fragments and measure-ment of their mass-to-charge ratios. In a typical MS procedure:
1. A sample is loaded onto the MS instrument, and undergoes vaporiza-tion;
30

2.5 ESI mass spectrometry
2. The components of the sample are ionized by one of a variety of me-thods (e.g., by impacting them with an electron beam), which resultsin the formation of charged particles (ions);
3. the ions are separated according to their mass-to-charge ratio in ananalyzer by electromagnetic fields;
4. The ions are detected, usually by a quantitative method;
5. The ion signal is processed into mass spectra.
MS instruments consist of three modules:
• An ion source, which can convert gas phase sample molecules into ions(or, in the case of electrospray ionization, move ions that exist in solu-tion into the gas phase);
• A mass analyzer, which sorts the ions by their masses by applying elec-tromagnetic fields;
• A detector, which measures the value of an indicator quantity and thusprovides data for calculating the abundances of each ion present
The ion source is the part of the mass spectrometer that ionizes the ma-terial under analysis (the analyte). The ions are then transported by mag-netic or electric fields to the mass analyzer. A critical step is generatingdetectable ions from a mixed complex solution. During the last two decades,atmospheric pressure ionization (API) systems have undergone much deve-lopment and they are now widely utilized in many scientific and technicalfields. Their wide spread use is due to their ability to ionize a wide variety ofcompounds, as well as the complementary information they provide to liquidchromatography. Among API sources, the most popular is the electrosprayionization source [41][42]. It is commonly referred to as "‘soft source"’, due toits ability to produce an intense pseudo-molecular parent ion with few frag-ments, especially in the analysis of polar compounds. It is especially useful
31

Analytical methodologies in lipidomics
in producing ions from macromolecules because it overcomes the propensityof these molecules to fragment when ionized. Three fundamental processesoccur in the ESI-MS, all at atmospheric pressure: aerosol generation, parti-cle ionization and solvent removal from incipient ion.
Figure 2.6: A schematic picture of an ESI-MS apparatus with its main parts:a nebulizing source, an ion beam guide and a mass analyzer
During standard electrospray ionization [43], the sample is dissolved ina polar, volatile solvent and pumped through a narrow, stainless steel cap-illary (75 - 150 micrometers i.d.) at a flow rate of between 1 µL/min and 1mL/min. A high voltage of 3 or 4 kV is applied to the tip of the capillary,which is situated within the ionization source of the mass spectrometer, andas a consequence of this strong electric field, the sample emerging from thetip is dispersed into an aerosol of highly charged droplets, a process that isaided by a co-axially introduced nebulizing gas flowing around the outside ofthe capillary. This gas, usually nitrogen, helps to direct the spray emergingfrom the capillary tip towards the mass spectrometer. The charged dropletsdiminish in size by solvent evaporation, assisted by a warm flow of nitro-gen known as the drying gas which passes across the front of the ionizationsource. Droplets with high superficial charge density are produced, and are,thus, dispersed through attraction or repulsion within the electric field. Acounter flow of inert heated gas, usually nitrogen, eliminate the residualsolvent molecules. This reduces the droplet size until electrostatic repulsion
Ec =Vc
rcln(4d/rc)(2.27)
32

2.5 ESI mass spectrometry
(Vc is the potential difference at capillary-electrode, rc is the capillaryradius, d is the distance between them) overrides the cohesive force of thesolvent. There are two major theories that explain the final production ofgas-phase ions:
• The Ion Evaporation Model (IEM) [44] suggests that as the dropletreaches a certain radius the field strength at the surface of the dropletbecomes large enough to assist the field desorption of solvated ions.
• The Charged Residue Model (CRM) [45] suggests that electrospraydroplets undergo evaporation and fission cycles, eventually leading pro-geny droplets that contain on average one analyte ion or less. Thegas-phase ions form after the remaining solvent molecules evaporate,leaving the analyte with the charges that the droplet carried.
Eventually charged sample ions, free from solvent, are released from thedroplets, some of which pass through a sampling cone or orifice into an inter-mediate vacuum region, and from there through a small aperture into theanalyzer of the mass spectrometer, which is held under high vacuum. Thelens voltages are optimized individually for each sample. The ions observedby mass spectrometry may be quasimolecular ions created by the addition ofa proton (a hydrogen ion) and denoted [M +H]+, or of another cation such assodium ion, [M+Na]+, or the removal of a proton, [M−H]−. The introductionof electrospray ionization mass spectrometry to analyze intact phospholipidshas further advanced this area of biochemistry and an additional benefithas come by the coupling of ESI-MS with on-line high-performance liquidchromatography (HPLC) for the separation of phospholipid classes as wellas molecular species because it minimizes the exposure of lipids to atmo-spheric oxygen associated to other chromatographic techniques. Separationof lipids can be accomplished either with normal-phase or reversed-phaseHPLC strategies. Normal-phase HPLC separates phospholipids by class onthe basis of the head-group polarity. In reversed-phase the separation isbased on lipophilicity of individual molecular species; because the elution
33

Analytical methodologies in lipidomics
sequence is determined by the fatty acyl chains and, therefore, molecularspecies of different classes likely coelute, some care must be exercised inthe analysis of phospholipids. It’s very difficult in ESI to obtain absolutequantitative information about composition of a sample, because the degreeof ionization of phospholipids varies from one molecular species to anotherand the instrument response is affected by acyl chain length, unsaturationand lipid concentration [10]. Each phospholipid class has a different ioniza-tion and fragmentation mechanism in ESI and in the following paragraphswe discuss the behavior of the two principal classes: PC and PE.
2.5.1 Phosphocholine lipids
Phosphocholine lipids are characterized by the presence of quaternary ni-trogen atom whose positive charge is neutralized by the negative charge ofphosphate group. The nitrogen atom readily forms an abundant [M + H]+
ion by ESI because the phosphate anion can be easily protonated during theelectrospray process. Furthermore, also abundant sodiated ion, [M + Na]+,are observed in positive-ion mode, when sodium ions are present in the elec-trospray solvent. The first fragment produced by collision-induced decompo-sition of protonated molecular ion [M +H]+ is the phosphocholine ion at m/z184 (see figure 2.7), which is typical of all phosphocholine-containing lipids,and is diagnostic for this specific class of phospholipids.
The facile formation of this ion allows us to use precursor-ion scanningof m/z 184 to detect as well as to quantify molecular species of PC lipidspresent in a complex sample (see figure 2.8, where it’s shown the isolationof PC peaks by precursor-ion scanning of m/z 184).
The phosphocholine ion is also present in the fragmentation pattern ofsphingomyelin and can be used as marker to detect molecular species ofSM lipids. SM can be distinguished from PC because SM molecular ion[M+H]+ has an odd m/z value while PC molecular ion has an even m/z value.In spite of quaternary nitrogen atom with its permanent positive chargealso negative ions are formed from PC lipids. The most abundant ions are
34

2.5 ESI mass spectrometry
Figure 2.7: Scheme of mechanism for the formation of phosphocholine ion atm/z 184
Figure 2.8: LC-MS chromatogram of a lipid sample. Top: UV chromatogram.Bottom: Chromatogram extracted by precursor-ion scanning of m/z 184
35

Analytical methodologies in lipidomics
[M−15]−, corresponding to the loss of a methyl group from ammonium group,and ions characteristic of the fatty acyl group esterified at the sn-1 and sn-2position.
2.5.2 Phosphoethanolamine lipids
PE lipids are one of the major class of phospholipids present in cell mem-branes and in ESI they produce in high abundance positive and negativeions corresponding to [M+H]+ and [M−H]−. The main diagnostic fragmentis the ion corresponding to the neutral loss of phosphoethanolamine group(141 U), [M +H − 141]+ (see figure 2.9)
Figure 2.9: Scheme of the formation of [M +H − 141]+ ion
In negative-ion mode the characteristic fragments produced from [M −H]− ion are the carboxylate anions of the fatty acyl chains. These diagnosticions are well represented in figure 2.10
36

2.5 ESI mass spectrometry
Figure 2.10: Mass spectrometry of phosphoethanolamine lipid in (A)positive-ion mode and (B) negative-ion mode derived from 18:0/22:6 PE.Reprinted from [46]
37

Analytical methodologies in lipidomics
38

Chapter 3
Material and methods
3.1 Materials
Synthetic PC, PE, PS, PG, SM, PI and PA were obtained from Avanti PolarLipids (Alabaster, AL). All solvents were of high performance liquid chro-matography (HPLC) or analytical grade and were purchased from CarloErba (Milano, Italy), Baker (Deventer, Holland) and Riedel de Haen (Seelze,Germany). Deuterated solvents were purchased from Euriso-top (Gif-sur-Yvette, France) and Aldrich (Steinheim, Germany).
3.2 Mixture of standard lipids
The lipids used to prepare standard mixtures have been: PSPC, DOPE,DOPG, DOPS, SM brain, PI liver and PA egg. All the solution have beenprepared in the same solvent (CHCl3) and have the same concentration (5mg/ml) except PA (10 mg/ml). Two standard lipids mixture have been pre-pared. For mixture 1 500 µl of each lipid solution (PSPC, DOPE, DOPG,DOPS, SM brain, PI liver) have been taken and added together. The fi-nal solution has been vacuum evaporated to dryness and redissolved in thevarious solvent systems chosen for 31P NMR experiments: CDCl3, Et3N /CD3OD / Na2EDTA (0.2 M in D2O) 8/1/1 and CDCl3 / CH3OH / K2EDTA
39

Material and methods
(0.2 M) 8/4/1. For mixture 2 100 µl of DOPG, DOPE and PSPC solutionsand 200 µl of DOPS, SM, PI and PA solutions have been taken and addedtogether. The final solution has been vacuum evaporated to dryness andredissolved in a sodium cholate solution in D2O (0.9 M).
3.3 DRMs and whole cell membranes isolationand extraction
Lubrol-insoluble DRMs and whole cell membranes were isolated from hu-man lymph node prostate cancer cells (LNCaP). For DRMs extraction, cellswere solubilized in Lubrol PX 1 in a cocktail of proteinase inhibitors. Af-ter homogenization with a 21-G needle, they were maintained on ice for 2-5h. Then a first centrifugation (10 min at 1000g) was performed in orderto remove cell debris before a second high-speed centrifugation (90 min at100000g). DRMs were retained in the insoluble pellet. For whole cell mem-branes extraction, cells were incubated for 30 min in a cocktail of proteinaseinhibitors and then homogenized for 1 min at 20000rpm. By a first cen-trifugation (5 min at 500g) the cell debris was removed. The supernatantwas centrifugated (15 min at 10000g) to obtain the heavy membrane frac-tion. After this centrifugation, the supernatant was centrifugated (60 minat 150000g) to obtain the light membrane fraction. The two fraction (heavyand light) was combined for NMR and LC-MS analysis. Finally lipids ex-traction from the pellets was carried out according to the method of Blighand Dyer [47] for both samples.
3.4 FAME preparation and GC-MS analysis
1.2 ml of DRM extract and 0.6 ml of total membrane extract reacted with,respectively, 1 ml or 0.5 ml of solution 0.5 M KOH in methanol and the re-sulting solution was stirred for 3 hours. The solution was neutralized with
40

3.5 Stress protocol and lipid extraction from larvae
few drops of sulfuric acid and was vacuum evaporated to dryness. 0.1 mlof hexane was added to the dried sample for GC-MS analysis. A Thermo-Finnigan Trace GC Ultra, equipped with a flame ionization detector andcoupled to a Thermo-Finnigan Trace DSQ quadrupole mass spectrometer,was used to carry out the GC-MS analysis of FAMEs derivatives. The chro-matographic column used was a DB-WAX 30 m x 0.250 mm x 0.50 µ m. Thetemperature of the injector and detector were maintained constant at 250◦Cand 280◦C, respectively. The flow of the carrier gas (He) was 1.0 ml/min. Thesource and the transfer line are maintained at 300◦C. The detector gain isset at 1.0 x 10⁵ (multiplier voltage: 1326 V). For every chromatographic run1.0 ?l of sample solution was injected. The oven method starts with an initialtemperature of 50 0C held for 1.0 min, followed by a linear ramp from 50 to200 0C at 25 0C/min, from 200 to 230 0C at 3 0C/min. The final temperatureof 230 0C was held for 19.0 min. The source filament and the electron multi-plier were switched off during the initial 5 min to avoid the detection of thesolvent front. Mass spectra were recorded with Chemical Ionization (CI) ionsource. The mass range scanned was from m/z 50 to m/z 500 at 500 amu/s.Data were collected and processed with Xcalibur (version 1.4). Fatty acidmethyl esters were identified by the comparison of their retention times forthose of a reference solution run at identical GC conditions and by matchingof the MS spectra with the MS-library implemented in the GC apparatus.
3.5 Stress protocol and lipid extraction fromlarvae
Specimens of Pseudodiamesa branickii and Diamesa cinerella at 4th larvalstage were collected in the Noce Bianco stream (Trentino) in March 2009and July 2009 respectively (average T= 4◦C), and stocked in the laboratoryfacilities at 4◦C for 1-4 days without feeding before experimental procedures.Animals (three replicates, 5 specimens for replicates or 1 replicate, 50 lar-vae) were stressed at decreasing temperature (2, 0, -1, -2, -3 and -4◦C) for 30
41

Material and methods
minutes, with a decreasing temperature ratio of -0.1◦C/2 min. Animal sur-vival was checked. Survival curves have been performed on larvae exposedto different temperatures. Animals were the frozen at -80◦C for further ex-perimental procedures. The expression levels of all genes has been analyzedin stressed and control larvae via quantitative real-time RT-PCR. All theseecological and biochemical experiments have been carried out in the labora-tories of the research group of Dr.ssa Lencioni (MTSN, Museo Tridentino diScienze Naturali) and in the research group of Prof. Jousson (CIBIO, Centrefor Integrative Biology, UNITN). For the lipids extraction from larvae wehave adopted a two-steps procedure. In the first step, in according to liter-ature [39], 2 ml of distilled water and 1 ml of chloroform were added to thelarvae and hand-vortexed. The resultant two-phase mixture was allowed tosit for 30min and then vacuum-filtered through a glass filter; the filter waswashed with 1 ml chloroform/methanol/water (2:1:0.8). After filtration thetwo-phase mixture was separated into an aqueous phase containing polarmetabolites (sugars, polyols, amino acids) and an organic phase containingmedium-low polar metabolites (lipids). The larvae, after this first extrac-tion, were recovered from the glass filter and reextracted following Folchmethod [48]: 2 ml of chloroform and 1 ml of methanol were added, the mix-ture was sonicated for 10min, allowed to sit for 90min, sonicated for 10minand finally vacuum-filtered through a glass filter. The resulting solution,after a comparison with the previous organic phase by a TLC, was added tothe previous one.
3.6 LC-MS Measurements
Lipid composition analysis: LC/ESI-MS analysis of the mixture of lipidswas performed on a Hewlett-Packard Model 1100 Series liquid chromato-graph coupled both to a PDAD (Photo Diode-Array Detector), Agilent 1100Series, and to a Bruker Esquire-LC quadrupole ion-trap mass spectrometerequipped with atmospheric pressure ESI (electrospray ionization mass spec-
42

3.7 NMR Measurements
trometry) interface. Chromatography: C18 column (Phenomenex Kinetex2.6u 100A); two eluents: A is CH3OH : H2O + CH3COONH4 28mM 7 : 3
and B is CH3OH +CH3COONH4 12mM with a gradient A/B starting from30/70 to 0/100 with a flow 1ml/min. MS parameters: positive- and negative-ion mode ESI; dry gas 6 l/min, heated to 300oC. Further parameters dur-ing LC/MS analyses were: trap drive 54, skim 1 set at -43.2 V in negativemode and trap drive 44, skim 1 set at 43.2 V in positive mode. PC and SMlipids were identified in positive-ion mode extracting a chromatogram bythe marker ion at m/z 184 and, then, searching the specific species by themolecular ion; the area of [M + H]+ and [M + Na]+ ions were integrated toobtain the percentage composition inside PC or SM class. PC species havebeen confirmed by negative-ion mode spectra identifying the corresponding[M − 15]− ion. SM species have been confirmed by negative-ion mode spec-tra identifying the corresponding [M − H]− ion. PE lipids were identifiedby the abundant ion [M + H − 141]+ in positive-mode and its area was in-tegrated to obtain the percentage composition inside PE class. PE specieshave been confirmed by negative-ion mode spectra identifying the correspon-ding [M − H]− ion. From negative-ion mode spectra information on fattyacyl chains of PE species have been obtained. For PC the same informationshaven’t been obtained because of the low intensity of the signals due to lowerdegree of ionization and fragmentation of PC in negative mode.
3.7 NMR Measurements
NMR analysis was performed with a Bruker Avance spectrometer operatingat 400 MHz. We have used different conditions to perform different mea-surements on various sample.DRM: 1H spectra were obtained in CD3OD at 25 ◦C with the sequence zgprto saturate water signal, and the calibration of the frequency-scale has doneon proton-residual chemical shift of methanol (3.31 ppm). 31P spectra wereobtained in a solution of sodium cholate in D2O 0.9 M at 25 ◦C; we have cal-
43

Material and methods
ibrated the spectra on external signal of H3PO4 in D2O.Chironomids larvae: 1H and 31P spectra were obtained in a mixture CDCl3 :
CD3OD 2 : 1 at 25 ◦C. The calibration of the frequency-scale of proton spec-tra has done with proton-residual chemical shift of methanol (3.31 ppm);instead, the signal of PC has been chosen for the calibration of phosphorusspectra at -0.8 ppm [49]. 2D spectra (COSY, HSQC, HMBC) were obtainedwith standard Bruker pulse sequences at 25 ◦C in the previous conditions.
44

Chapter 4
Results and discussion
4.1 Standard mixture of lipids
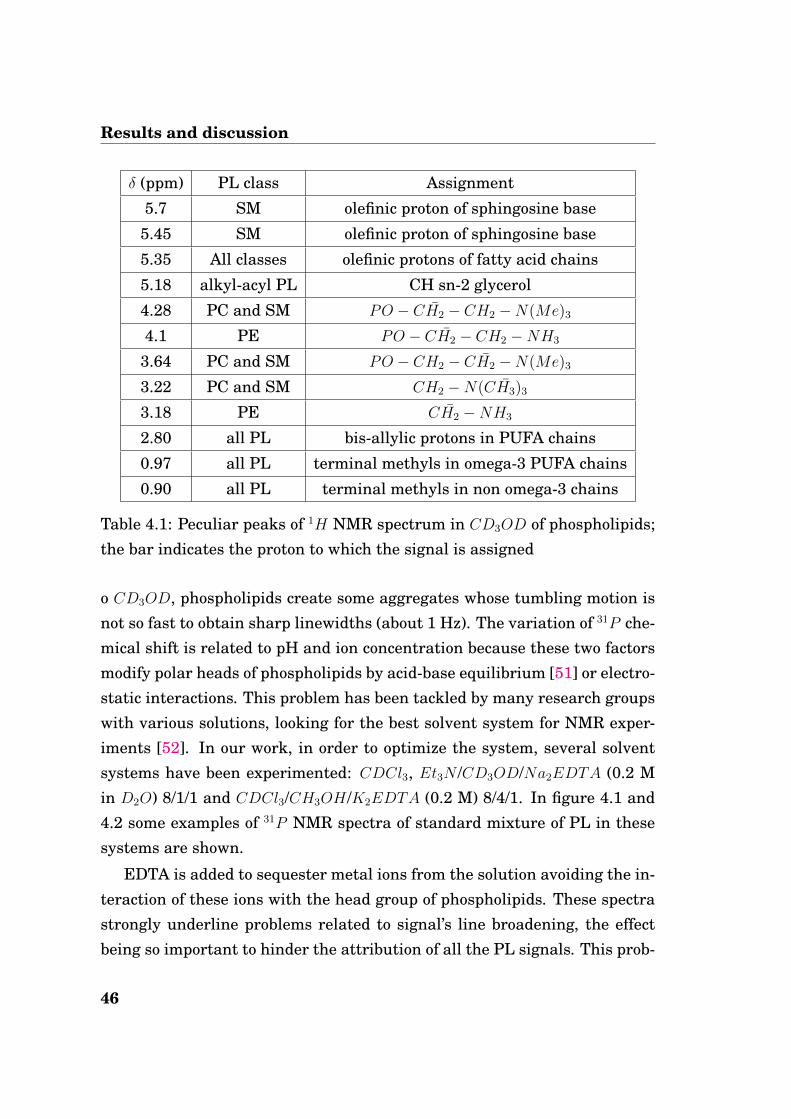
Each phospholipid class has been tested by 1H NMR obtaining a list of char-acteristic signals for each class useful to recognize and assign them in the1H NMR complex mixture spectrum. In the table 4.1 the peculiar peaks ofthe various classes are reported.
For phospholipids analysis , 31P NMR is preferred to 1H NMR techniquessince the signals are better resolved and do not overlap with signals fromneutral lipids usually present in the extracts. However, in order to minimizethe factors which heavily affect the true resolution of the acquired 31P NMRspectrum of any PL mixtures, several factors have to be taken into account.First of all, electrostatic complexes with cations or anions must not occur or,if they do, the rate of exchange of the participating groups must be rapidwith respect to the NMR time scale so that the phosphorus nucleus onlysenses an average electrostatic field. Furthermore, one must be well awarethat the fatty acid side chains, which in a preparation from natural sourceswill be numerous and diverse, contribute little to the chemical shielding ofthe constituent phosphorus atoms. Last but not least, the contribution tothe line width of chemical-shift anisotropy must be as low as possible [50].The first problem is arising because in commonly used solvents, like CDCl3
45
Results and discussion
δ (ppm) PL class Assignment
5.7 SM olefinic proton of sphingosine base
5.45 SM olefinic proton of sphingosine base
5.35 All classes olefinic protons of fatty acid chains
5.18 alkyl-acyl PL CH sn-2 glycerol
4.28 PC and SM PO − CH2 − CH2 −N(Me)3
4.1 PE PO − CH2 − CH2 −NH3
3.64 PC and SM PO − CH2 − CH2 −N(Me)3
3.22 PC and SM CH2 −N(CH3)3
3.18 PE CH2 −NH3
2.80 all PL bis-allylic protons in PUFA chains
0.97 all PL terminal methyls in omega-3 PUFA chains
0.90 all PL terminal methyls in non omega-3 chains
Table 4.1: Peculiar peaks of 1H NMR spectrum in CD3OD of phospholipids;the bar indicates the proton to which the signal is assigned
o CD3OD, phospholipids create some aggregates whose tumbling motion isnot so fast to obtain sharp linewidths (about 1 Hz). The variation of 31P che-mical shift is related to pH and ion concentration because these two factorsmodify polar heads of phospholipids by acid-base equilibrium [51] or electro-static interactions. This problem has been tackled by many research groupswith various solutions, looking for the best solvent system for NMR exper-iments [52]. In our work, in order to optimize the system, several solventsystems have been experimented: CDCl3, Et3N /CD3OD/Na2EDTA (0.2 Min D2O) 8/1/1 and CDCl3/CH3OH/K2EDTA (0.2 M) 8/4/1. In figure 4.1 and4.2 some examples of 31P NMR spectra of standard mixture of PL in thesesystems are shown.
EDTA is added to sequester metal ions from the solution avoiding the in-teraction of these ions with the head group of phospholipids. These spectrastrongly underline problems related to signal’s line broadening, the effectbeing so important to hinder the attribution of all the PL signals. This prob-
46

4.1 Standard mixture of lipids
Figure 4.1: 31P NMR spectrum of mixture 1 in CDCl3
Figure 4.2: 31P NMR spectrum of mixture 1 in Et3N/CD3OD/Na2EDTA (0.2M in D2O) 8/1/1
47

Results and discussion
lem is evident in the spectrum recorded in CDCl3, where SM and PS havethe same chemical shift and their signals overlap to those of PE and PI sig-nal. Concerns due to the heterogeneous character of some solvent systemsare also arising after looking at the corresponding 31P NMR spectra. Toovercome these problems another system was tested using a detergent. Theoptimal detergent should form small micelles with a fast tumbling motion[51]; sodium cholate fulfills these requirements because it forms small mi-celles with an aggregation number equal to four [53].
Figure 4.3: Molecular structure of sodium cholate
Although using sodium cholate PL class attribution is a straightforward(Figure 4.4), the complete resolution between SM and PE heads is not achie-ved.
Although solution-state NMR of cell extracts is considered a standardway of identifying tissue lipids providing useful information on their meta-bolic changes, there are some major drawbacks. In fact, the extraction pro-cesses are laborious, secondly there are risk of degradation and artefact gen-eration, and finally only soluble components can be studied - not those as-sociated with membranes cannot. A possible alternative to identify metabo-lites is to carry out analysis on whole tissue/cell samples by solid-state NMRtechnique with high resolution Magical Angle Spinning (HRMAS). By spin-ning a small intact tissue sample at the well known ’magic angle’ of 54.7◦
in principle, we could obtain spectra of resolution comparable to liquid-stateNMR of extracts. In fact, spinning at the magic angle counteracts the linebroadening effects resulting from the restricted motion of the molecules in
48

4.1 Standard mixture of lipids
Figure 4.4: 31P NMR spectrum of mixture 2 in solution of sodium cholate inD2O 0.9 M
the solid state. More specifically, there is no dipolar coupling and chemicalshift anisotropy when a sample is spun at the magic angle.
Looking for avoiding chemical workup of the biological samples, we didsome experiments on solid state NMR trying to obtain a resolution similarto high-resolution NMR. However, results were far behind the expectationsbased on recent literature reports (Figure 4.5); suffice to say that all thesignals attributable to the main PL classes were buried under a single broadresonance. The two signals at -12 ppm are due to phosphorus nuclei of ATP.
This spectrum has shown that solid-state NMR does not provide enoughresolution to acquire significant information about the composition of themembrane in ex-vivo sample. For this reason high-resolution NMR on liquidextracts has been chosen as the technique to obtain a reliable quantificationof phospholipids in our biological samples.
49

Results and discussion
Figure 4.5: top: SS 31P NMR spectrum of LNCAP cells at 298 K and a MASfrequency of 2 kHz; bottom: high resolution 31P NMR spectrum of lipid ex-tract from LNCaP cells at 298 K in sodium cholate solution 0.9 M in D2O
50

4.2 Lipid profile of PSMA-anchoring rafts
4.2 Lipid profile of PSMA-anchoring rafts
The extracted lipid components were analyzed by different analytical tech-niques. A qualitative screening was made by thin layer chromatographyfollowed by an extended NMR analysis of the sample. In particular, 1H and31P NMR spectra allowed to detect and quantify cholesterol and the rela-tive contribution of all the lipids belonging to a given PL class to the overallPL composition. From 1H spectra (see figure 4.6 and 4.7) the molar ra-tio between cholesterol and choline lipids (PC+SM) has been evaluated byintegration of the singlet at 3.22 ppm for choline lipids (methyl groups oftetramethylammonium group) and the singlet at 0.72 ppm for cholesterol(methyl group in C18 position). This ratio is 0.52 in whole cell membranesand to 0.84 in Lubrol DRMs, with a 60% increase.
Figure 4.6: 1H spectrum of DRM extract in CD3OD
From 31P spectra (see figure 4.8 and 4.9) we have resolved the composi-tion of various phospholipids.
In the 31P spectra there is only partial resolution between the signals ofSM and PE but the deconvolution of the spectra by lorentzian functions (see
51

Results and discussion
Figure 4.7: 1H spectrum of whole cell membrane extract in CD3OD
Figure 4.8: 31P spectrum of DRM extract in sodium cholate solution 0.9 Min D2O
52

4.2 Lipid profile of PSMA-anchoring rafts
Figure 4.9: 31P spectrum of whole cell membrane extract in sodium cholatesolution 0.9 M in D2O
figure 4.10 and 4.11) allowed us to obtain the reliable values for the SM andPE molar ratios.
From 31P spectra and their deconvolution the total composition of PL inwhole cell membrane and DRM has been obtained and is graphically shownin figure 4.12.
On the other hand, Electrospray Ionization (ESI-MS) measurements car-ried out on the same sample allowed us to establish some structural detailssuch as the length and the degree of unsaturation of their acyl chains. Theperformed mass spectrometric analysis only allowed the determination ofthe total number of carbon atoms and double bonds in the FA moiety forlipid classes containing two FA esterified to the glycerol-backbone (PC, PE,PG, PI, PS). For example a PC 34:1 may represent different combinationsof FA such as 18:0/16:1, 16:0/18:1, etc. Moreover, the assignment to a bondtype (acyl or ether) is based on the assumption that FA with odd-numberedcarbon atoms are not present at all or,at least, represent a negligible frac-tion of the overall lipid amount. Therefore, when structural information is
53

Results and discussion
Figure 4.10: 31P spectrum of whole cell membrane extract in sodium cho-late solution 0.9 M in D2O with deconvolution of the signals by lorentzianfunctions
Figure 4.11: 31P spectrum of DRM extract in sodium cholate solution 0.9 Min D2O with deconvolution of the signals by lorentzian functions
54

4.2 Lipid profile of PSMA-anchoring rafts
Figure 4.12: Composition of phospholipids classes in whole cell membraneand DRM obtained by 31P spectra and their deconvolution
required, tandem mass spectrometry (MS/MS) was employed. In this proce-dure, the precursor ion undergoes further fragmentation either by collision-induced dissociation (CID) or spontaneous in-source dissociation. In the fol-lowing figures are shown the LC chromatogram of DRM and the distributionof all PC, PE and SM identified by MS analysis.
For PE, from negative-ion mode ESI, information about the single fattyacid chain of the lipids has been obtained (see table 4.2).
Furthermore, GC-MS analysis of FAME (fatty acid methyl ester) ex-tracted from whole cell membrane and DRM samples has been afforded (seefigure 4.17).
The comparison between LC-MS and GC-MS data did not show to bepossible; GC measurements lead to reliable quantitative data because theintegration is done on peaks detected by a Flame Induction Detector (FID)whereas, ESI measurements do not usually lead to quantitative data be-cause the signal intensity depends on the degree of ionization, which, inturn, depends on the acyl length, unsaturation of fatty acid chain and lipidconcentration [10]. This difference is well notable if we analyze the arachi-
55

Results and discussion
Figure 4.13: LC-MS chromatogram of a DRM extract. Top: chromatogrambased on total ion current. Bottom: chromatogram based on UV absorptionat 215 nm
Figure 4.14: Distribution of PC in whole cell membrane and DRM as ob-tained by LC-MS experiment
56

4.2 Lipid profile of PSMA-anchoring rafts
Figure 4.15: Distribution of PE in whole cell membrane and DRM as ob-tained by LC-MS experiment
Figure 4.16: Distribution of SM in whole cell membrane and DRM as ob-tained by LC-MS experiment
57

Results and discussion
PE lipid Chain 1 Chain 2
34:1 18:1 16:0
36:1 18:0 18:1
36:2 18:1 18:1
36:4 20:4 16:0
38:2 Unknown Unknown
38:3 20:3 18:0
38:3 Unknown Unknown
38:3 Unknown Unknown
38:4 20:4 18:0
38:5 20:4 18:1
40:3 Unknown Unknown
40:6 22:6 18:0
Table 4.2: Fatty acid chains of PE lipids from negative-ion mode ESI
Figure 4.17: Distribution of FAME in whole cell membrane and DRM
58
4.2 Lipid profile of PSMA-anchoring rafts
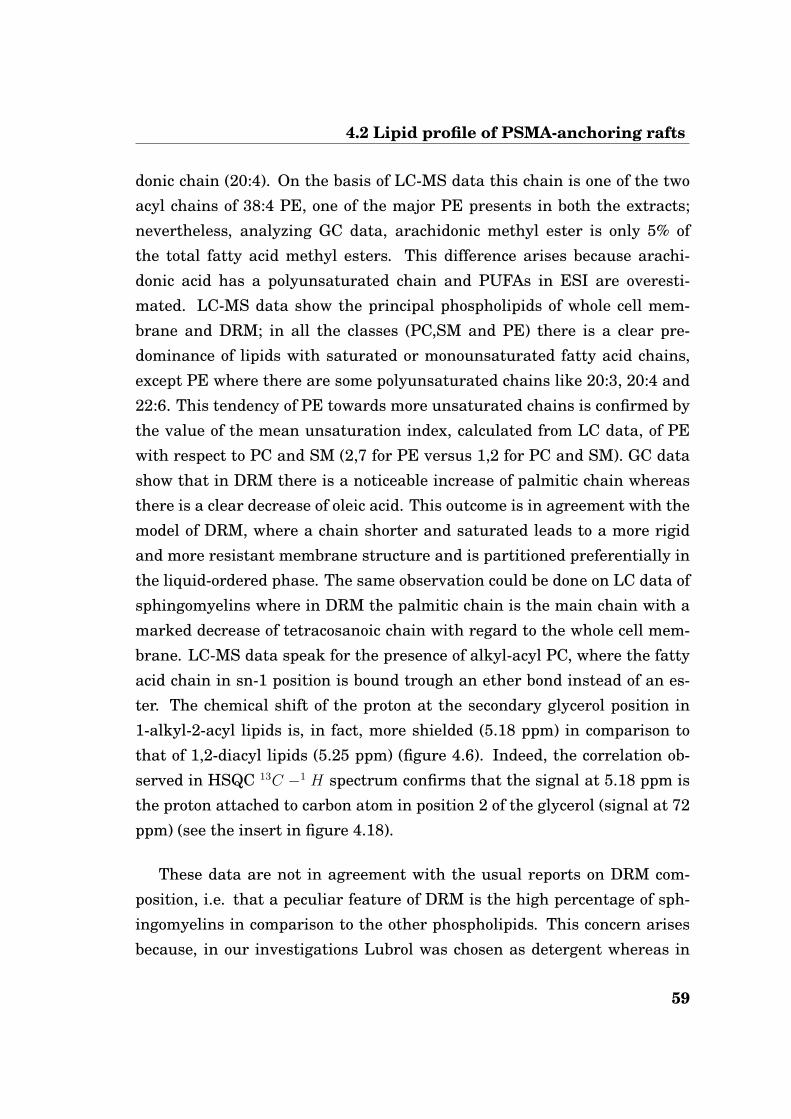
donic chain (20:4). On the basis of LC-MS data this chain is one of the twoacyl chains of 38:4 PE, one of the major PE presents in both the extracts;nevertheless, analyzing GC data, arachidonic methyl ester is only 5% ofthe total fatty acid methyl esters. This difference arises because arachi-donic acid has a polyunsaturated chain and PUFAs in ESI are overesti-mated. LC-MS data show the principal phospholipids of whole cell mem-brane and DRM; in all the classes (PC,SM and PE) there is a clear pre-dominance of lipids with saturated or monounsaturated fatty acid chains,except PE where there are some polyunsaturated chains like 20:3, 20:4 and22:6. This tendency of PE towards more unsaturated chains is confirmed bythe value of the mean unsaturation index, calculated from LC data, of PEwith respect to PC and SM (2,7 for PE versus 1,2 for PC and SM). GC datashow that in DRM there is a noticeable increase of palmitic chain whereasthere is a clear decrease of oleic acid. This outcome is in agreement with themodel of DRM, where a chain shorter and saturated leads to a more rigidand more resistant membrane structure and is partitioned preferentially inthe liquid-ordered phase. The same observation could be done on LC data ofsphingomyelins where in DRM the palmitic chain is the main chain with amarked decrease of tetracosanoic chain with regard to the whole cell mem-brane. LC-MS data speak for the presence of alkyl-acyl PC, where the fattyacid chain in sn-1 position is bound trough an ether bond instead of an es-ter. The chemical shift of the proton at the secondary glycerol position in1-alkyl-2-acyl lipids is, in fact, more shielded (5.18 ppm) in comparison tothat of 1,2-diacyl lipids (5.25 ppm) (figure 4.6). Indeed, the correlation ob-served in HSQC 13C −1 H spectrum confirms that the signal at 5.18 ppm isthe proton attached to carbon atom in position 2 of the glycerol (signal at 72ppm) (see the insert in figure 4.18).
These data are not in agreement with the usual reports on DRM com-position, i.e. that a peculiar feature of DRM is the high percentage of sph-ingomyelins in comparison to the other phospholipids. This concern arisesbecause, in our investigations Lubrol was chosen as detergent whereas in
59

Results and discussion
Figure 4.18: HSQC 13C −1 H spectrum of DRM extract in CD3OD
almost all literature reports Triton X100 (more aggressive) is used. Lubrolhas been chosen as detergent because PSMA has shown a differential as-sociation with DRM corresponding to isolation with Lubrol but not TX-100.Lubrol has been reported being to be a mild detergent leading to the for-mation of DRMs without denaturing membrane proteins. The distinctivefeature of Lubrol is to favor the formation of DRM with a composition simi-lar to the whole cell membrane without promoting the enrichment in sphin-golipids and cholesterol as Triton does [17]. NMR data confirm this assump-tion because PC and PE are the two principal classes in both cases (DRMand whole cell membranes) although the amount of PE increases around40% in DRMs demonstrating a tendency of Lubrol to provide DRM with anhigher PE concentration. The PLs molar ratio of DRM in this work is inagreement with a previous work on similar samples [25], confirming thevalidity of our results. It is known from literature that cholesterol inter-acts with phospholipids and the strength of this interaction depends on theheadgroup (SM>PC>PE) and on the degree of saturation of the acyl lipidchain (saturated > monounsaturated » polyunsaturated); the strongest in-
60

4.3 Cold resistance in Chironomid larvae
teraction occurs with sphingolipids because they have, usually, saturatedchain and can form hydrogen bonding between the NH group of sphingosinebase and the hydroxyl group of cholesterol. It has been shown [54] [55] theinability of cholesterol to intercalate in model membranes composed exclu-sively of PUFA (22:6/22:6 PC or 22:6/22:6 PE) because close proximity to thesterol of polyunsaturated chains is hindered by their high degree of disor-der; however it has been demonstrated that in model membrane, composedby lipids like 18:0/22:6 PC, the near approach and the intercalation of chole-sterol is facilitated by the configuration adopted by the upper portion of thesaturated chain. Our data confirm the importance of cholesterol to triggerrafts formation because in DRM there is an increase of cholesterol aroundto 60%. The preference of rafts for saturated or monounsaturated fatty acidchains is confirmed by our results, because GC data show that polyunsatu-rated chains (20:4, 22:3 and 22:6) represent only the 10% of the total fattyacid and the two most abundant FAMEs are 16:0 and 18:1. Regarding thecomposition, the high percentage of PE is not in contrast with literaturebecause it has been demonstrated the less aggressive properties of Lubrolcompared to Triton X-100 and its tendency to form DRMs with a composi-tion similar to whole cell membrane. Furthermore our results demonstratethat the main driving force to the rafts formation is the acyl chain packingand the interaction of cholesterol with saturated or monounsaturated fattyacid chains other than lipid headgroup. This study supports the model thatlipid raft stability is conferred by acyl chain structure and its interactionwith cholesterol.
4.3 Cold resistance in Chironomid larvae
In this chapter we report the results obtained in the studies of larvae oftwo species chosen as target samples to observe the influence of environ-mental changes on alpine ecosystems. The two species investigated arePseudodiamesa branickii and Diamesa cinerella. The main membrane lipid
61

Results and discussion
components (fatty acids, glycerolipids and phospholipids) have been charac-terized with mass spectrometry and NMR techniques. Particular attentionhas been paid to phospholipids, membrane constituents that are expected tochange in response to freezing, both in the acyl chains and/or in their polarheads. A preliminary analysis of cryoprotectans such as polyols and sugarsinvolved in cold hardness has been also carried out by different spectroscopictechniques. Overall, the experimental approach outlined has been led to abetter understanding of the abiotic factors that represent major selectiveconstrains to various aquatic taxa.
4.3.1 Diamesa cinerella
A qualitative screening made by thin layer chromatography (TLC) has shownthat triglycerides and phospholipids are the main components of the totallipid fraction in these larvae. 1H NMR data (figure 4.19) have also shown avery low quantity of cholesterol (< 1%, signal at 0.68 ppm).
Figure 4.19: 1H NMR spectrum of raw organic extract of Diamesa cinerellain CDCl3 : CD3OD 2 : 1
From 1H NMR spectrum it’s clear the presence of a significant amount ofPUFA chains, as established by the relative high integral ratio of the peak
62
4.3 Cold resistance in Chironomid larvae
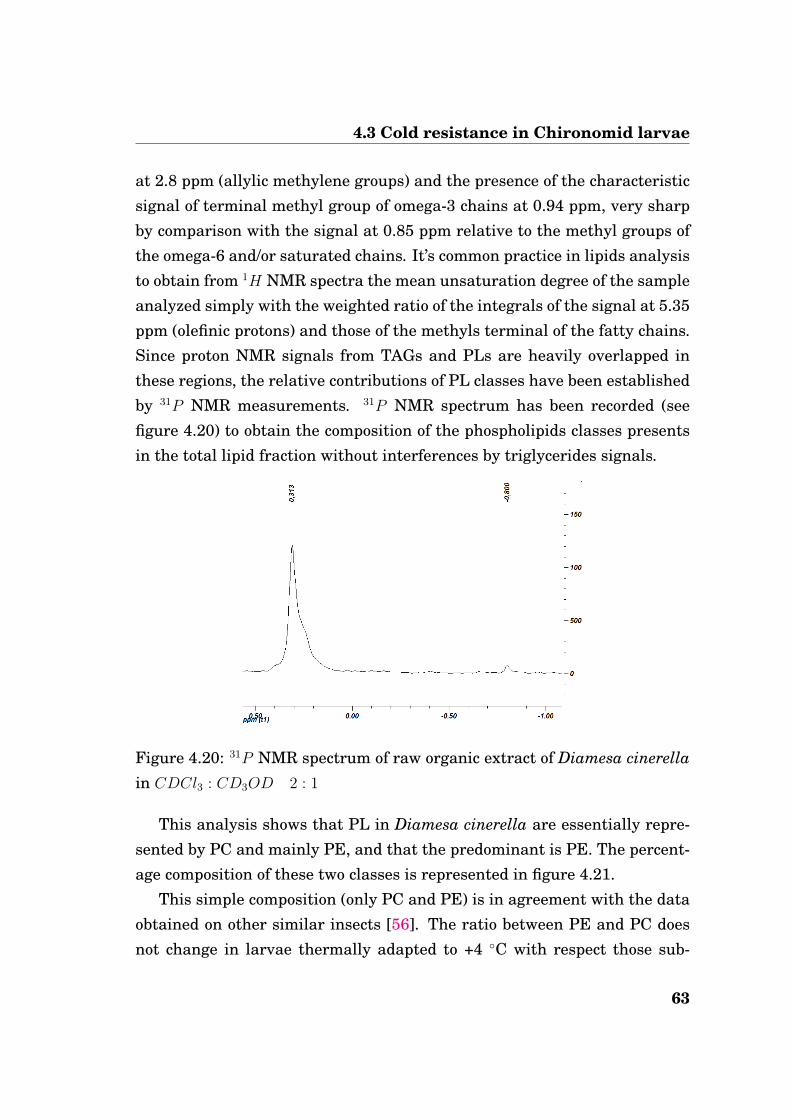
at 2.8 ppm (allylic methylene groups) and the presence of the characteristicsignal of terminal methyl group of omega-3 chains at 0.94 ppm, very sharpby comparison with the signal at 0.85 ppm relative to the methyl groups ofthe omega-6 and/or saturated chains. It’s common practice in lipids analysisto obtain from 1H NMR spectra the mean unsaturation degree of the sampleanalyzed simply with the weighted ratio of the integrals of the signal at 5.35ppm (olefinic protons) and those of the methyls terminal of the fatty chains.Since proton NMR signals from TAGs and PLs are heavily overlapped inthese regions, the relative contributions of PL classes have been establishedby 31P NMR measurements. 31P NMR spectrum has been recorded (seefigure 4.20) to obtain the composition of the phospholipids classes presentsin the total lipid fraction without interferences by triglycerides signals.
Figure 4.20: 31P NMR spectrum of raw organic extract of Diamesa cinerellain CDCl3 : CD3OD 2 : 1
This analysis shows that PL in Diamesa cinerella are essentially repre-sented by PC and mainly PE, and that the predominant is PE. The percent-age composition of these two classes is represented in figure 4.21.
This simple composition (only PC and PE) is in agreement with the dataobtained on other similar insects [56]. The ratio between PE and PC doesnot change in larvae thermally adapted to +4 ◦C with respect those sub-
63

Results and discussion
Figure 4.21: Percentage composition of Diamesa cinerella obtained by 31P
NMR data
jected to -4 ◦C. To investigate more deeply the differences at these two tem-peratures, representing the vital range of these larvae, HPLC/ESI-MS ex-periments have been carried out (figure 4.22) allowing the identification ofall the fatty chains bound to these two PL classes.
Figure 4.22: UV chromatogram LC of Diamesa cinerella
The fatty chains distribution of PE (figure 4.23) presents remarkable dif-ferences between the two temperatures. Although in both cases the maincomponents in the lipid pattern are the chains 32:4, 34:5 and 36:5, in the
64

4.3 Cold resistance in Chironomid larvae
high temperature adaptation-system 32:4 is significantly more populatedthan in the low temperature adapted larvae. On the other hand the latterpresent a PL distribution richer in the chains 32:5 and 36:5.
Figure 4.23: Distribution of PE in Diamesa cinerella at +4◦C and -4◦C asobtained by LC-MS experiment
For PE, from negative-ion mode ESI, it has been possible to obtain infor-mation about the single fatty acid chain of the lipids. In table 4.3 recognizedchains are reported.
The data shown in table 4.3 confirm the high unsaturation degree of PE.When there is a pair of chain, one short and more saturated and the other
65

Results and discussion
PE lipid Chain 1 Chain 2
28:0 Unknown Unknown
30:1 14:0 16:1
30:2 Unknown Unknown
30:3 14:0 16:3
30:4 Unknown Unknown
30:4 Unknown Unknown
32:0 Unknown Unknown
32:1 14:0 18:1
32:2 14:0 18:2
32:3 14:0 18:3
32:3 16:0 16:3
32:4 14:0 18:4
32:5 14:0 18:5
34:1 16:0 18:1
34:2 16:0 18:2
34:2 Unknown Unknown
34:3 18:0 16:3
34:3 16:0 18:3
34:4 16:0 18:4
34:4 Unknown Unknown
34:5 Unknown Unknown
34:5 14:0 20:5
34:5 Unknown Unknown
PE lipid Chain 1 Chain 2
34:6 Unknown Unknown
34:7 18:4 16:3
36:1 18:0 18:1
36:2 18:0 18:2
36:2 18:1 18:1
36:3 18:0 18:3
36:3 18:1 18:2
36:4 18:0 18:4
36:5 16:0 20:5
36:5 18:1 18:4
36:6 14:0 22:6
36:6 Unknown Unknown
36:6 18:2 18:4
36:7 Unknown Unknown
36:8 18:4 18:4
38:2 20:0 18:2
38:3 20:0 18:3
38:3 Unknown Unknown
38:4 20:0 18:4
38:5 18:0 20:5
38:8 Unknown Unknown
38:9 Unknown Unknown
Table 4.3: Fatty acid chains of PE lipids from negative-ion mode ESI inDiamesa cinerella
66

4.3 Cold resistance in Chironomid larvae
longer and with an higher unsaturation degree, it’s clear from literaturethat the more unsaturated chain preferred the sn2 position, because in thisway it creates more disorder [57]. Observing the chains identified in PE it’spossible noting some characteristic sequences of lipids with one chain fixedand varying the other, like the sequence based on the couple 14:0/18:x (x=1-5) or the couple 16:0/18:x (x=1-4). In the sequence based on 14:0/18:x, thelast species is a particular lipid with a double bond in position ∆3, as shownin figure 4.24.
Figure 4.24: Sequence of PE with 32 C chains
This structure is confirmed by NMR data showing a specific signal at5.53 ppm due to olefinic protons in ∆3 position [58] and its correlation witha signal at 3.12 ppm, due to methylene in ∆2 position, and with a peak at2.80 ppm, due to bis-allylic methylene group (see figure 4.25).
This double bond position is unusual but, recently, in literature has beenreported the presence of a phospholipid species containing a double bond in∆3 position and they have identified the protein responsible of this synthe-sis, a ∆3 desaturase codified by fad4 gene [59]. From the ESI negative-iondata we could infer that one of the main solution adopted by these larvae toobtain lipids with an high mean unsaturation degree seems to be the inser-tion of a polyunsaturated chain omega3 like 20:5 or 22:6 (see figure 4.26).
67

Results and discussion
Figure 4.25: COSY of raw organic extract of Diamesa cinerella (+4 ◦C) inCDCl3/CD3OD 2:1
Figure 4.26: Principal PUFA found in organic extract of Diamesa cinerella
68
4.3 Cold resistance in Chironomid larvae
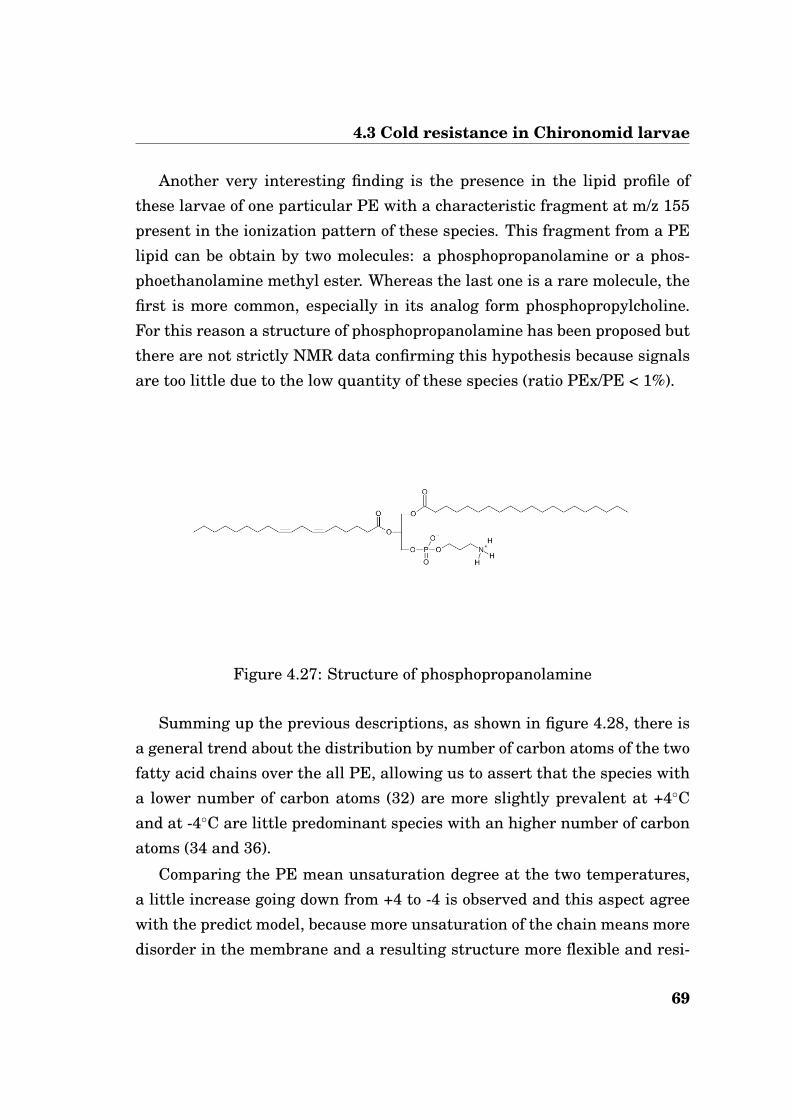
Another very interesting finding is the presence in the lipid profile ofthese larvae of one particular PE with a characteristic fragment at m/z 155present in the ionization pattern of these species. This fragment from a PElipid can be obtain by two molecules: a phosphopropanolamine or a phos-phoethanolamine methyl ester. Whereas the last one is a rare molecule, thefirst is more common, especially in its analog form phosphopropylcholine.For this reason a structure of phosphopropanolamine has been proposed butthere are not strictly NMR data confirming this hypothesis because signalsare too little due to the low quantity of these species (ratio PEx/PE < 1%).
Figure 4.27: Structure of phosphopropanolamine
Summing up the previous descriptions, as shown in figure 4.28, there isa general trend about the distribution by number of carbon atoms of the twofatty acid chains over the all PE, allowing us to assert that the species witha lower number of carbon atoms (32) are more slightly prevalent at +4◦Cand at -4◦C are little predominant species with an higher number of carbonatoms (34 and 36).
Comparing the PE mean unsaturation degree at the two temperatures,a little increase going down from +4 to -4 is observed and this aspect agreewith the predict model, because more unsaturation of the chain means moredisorder in the membrane and a resulting structure more flexible and resi-
69

Results and discussion
Figure 4.28: Distribution of PE divided by number of carbon atoms of thetwo fatty acid chains in Diamesa cinerella
stant to a lower temperature.
Figure 4.29: Distribution of PE divided by number of unsaturated bonds ofthe two fatty acid chains in Diamesa cinerella
As shown in the figure 4.30, in the distribution of PC there are some
70

4.3 Cold resistance in Chironomid larvae
remarkable differences between the two temperatures: at +4 ◦C there is arelevant dominance of the species 34:5 and 38:9 (yellow circles), at -4 ◦C thespecies predominant are 34:2 and 36:8 (red circles). Furthermore the maincomponents in the lipid pattern are 32:4, 34:2, 34:4 and 36:5 PC.
Figure 4.30: Distribution of PC in Diamesa cinerella at +4◦C and -4◦C asobtained by LC-MS experiment
Like to PE, the corresponding specie has been found, identified by thefragment 198 present in the ionization pattern of these species. Also for thisspecie a structure of phosphopropylcholine has been hypothesized but thereare not reliable NMR data confirming this hypothesis.
For PC it has not been possible doing a sure assignment of the fatty acidchains because of the low intensity of signals. Summing up the previousdescriptions, as we can see from figure 4.32, there is a significant increase ofthe lipids with 34 carbon atoms at -4◦C whereas for the other chains thereisn’t a preponderance in one of the two cases.
For these extracts GC-MS experiments have not been carried out becauseof the low quantity of the two samples.
71

Results and discussion
Figure 4.31: Structure of phosphopropylcholine
Figure 4.32: Distribution of PC divided by number of carbon atoms of thetwo fatty acid chains in Diamesa cinerella
72

4.3 Cold resistance in Chironomid larvae
Figure 4.33: Distribution of PC divided by number of unsaturated bonds ofthe two fatty acid chains in Diamesa cinerella
The analysis of aqueous extracts has been carried out first by NMR; be-cause the NMR spectrum is too crowded with signals and it has not beenpossible to make a sure assignment of the various peaks, HPLC/ESI-MSexperiments in positive and negative ion mode have been accomplished toidentify sugars and polyols presents in the samples and to observe if thereare some significant trends with the temperature. Some sugars have beenidentified (glucose, sorbitol, sucrose, raffinose and lactose) but not trehalose,and the concentration of these molecules are similar without significant dif-ferences between the two samples at +4 and -4 ◦C.
4.3.2 Pseudodiamesa branickii
In Pseudodiamesa branickii we have found results similar to Diamesa cine-rella (low quantity of cholesterol, significant amount of PUFA chains, impos-sibility to separate TG and PL contribution in 1H NMR spectrum).
31P NMR spectrum has been recorded (see figure 4.20) to obtain the com-position of the phospholipids classes presents in the total lipid fraction with-
73
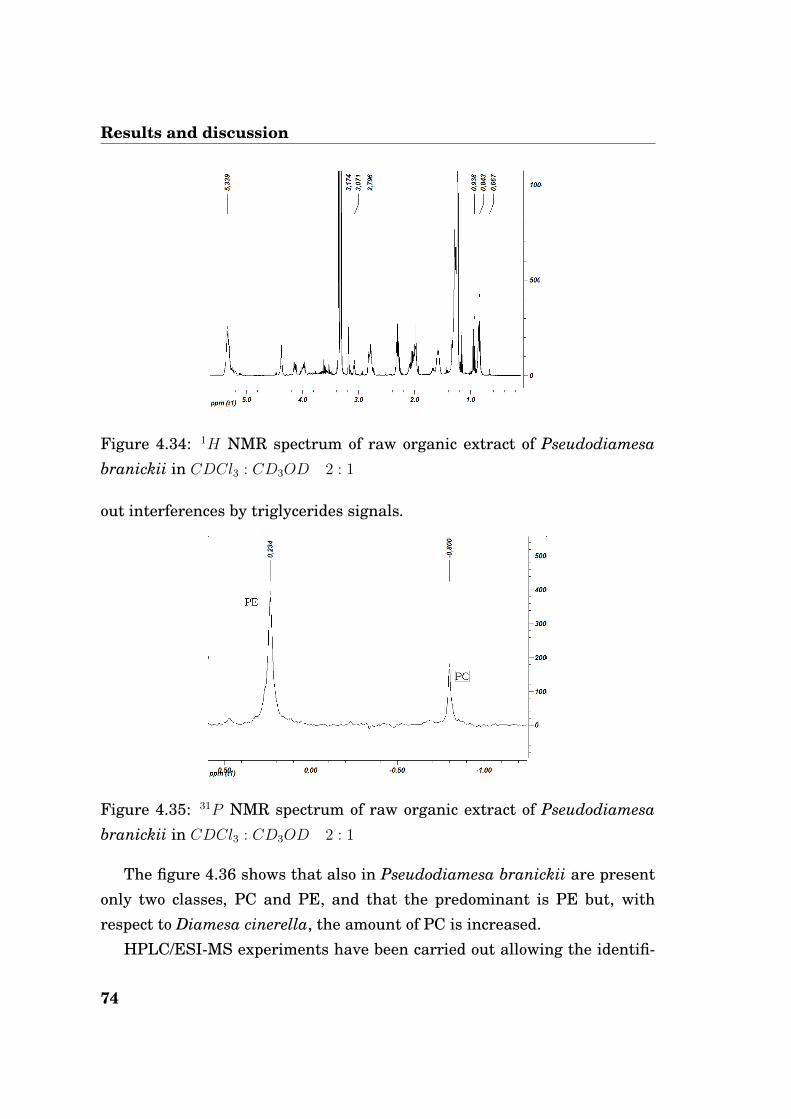
Results and discussion
Figure 4.34: 1H NMR spectrum of raw organic extract of Pseudodiamesabranickii in CDCl3 : CD3OD 2 : 1
out interferences by triglycerides signals.
Figure 4.35: 31P NMR spectrum of raw organic extract of Pseudodiamesabranickii in CDCl3 : CD3OD 2 : 1
The figure 4.36 shows that also in Pseudodiamesa branickii are presentonly two classes, PC and PE, and that the predominant is PE but, withrespect to Diamesa cinerella, the amount of PC is increased.
HPLC/ESI-MS experiments have been carried out allowing the identifi-
74

4.3 Cold resistance in Chironomid larvae
Figure 4.36: Percentage composition of Pseudodiamesa branickii
cation of all the fatty chains bound to these two PL classes. As shown in thefigure 4.37, in the distribution of PE there are some remarkable differencesbetween the two temperatures: at +4 ◦C there is a relevant domination ofthe species 34:3 (yellow circles), at -4 ◦C the species predominant are 36:5and 36:6 (red circles).
Figure 4.37: Distribution of PE in Pseudodiamesa branickii at +4◦C and-4◦C as obtained by LC-MS experiment
75
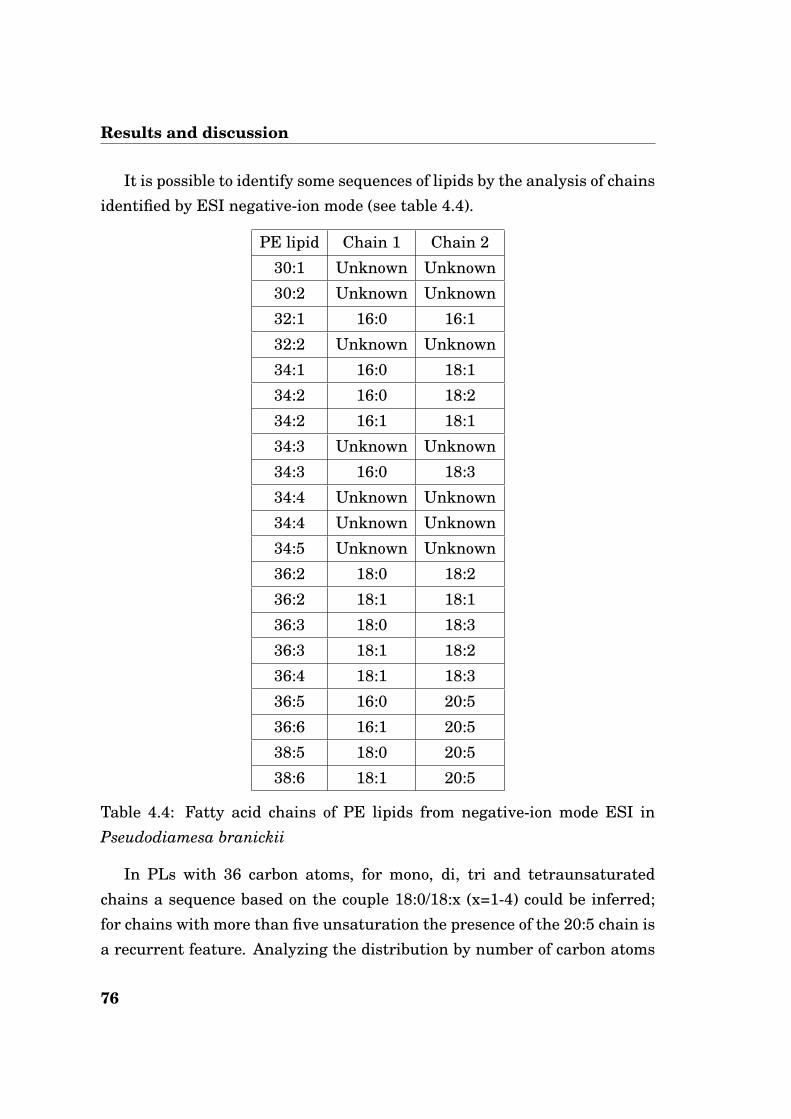
Results and discussion
It is possible to identify some sequences of lipids by the analysis of chainsidentified by ESI negative-ion mode (see table 4.4).
PE lipid Chain 1 Chain 2
30:1 Unknown Unknown
30:2 Unknown Unknown
32:1 16:0 16:1
32:2 Unknown Unknown
34:1 16:0 18:1
34:2 16:0 18:2
34:2 16:1 18:1
34:3 Unknown Unknown
34:3 16:0 18:3
34:4 Unknown Unknown
34:4 Unknown Unknown
34:5 Unknown Unknown
36:2 18:0 18:2
36:2 18:1 18:1
36:3 18:0 18:3
36:3 18:1 18:2
36:4 18:1 18:3
36:5 16:0 20:5
36:6 16:1 20:5
38:5 18:0 20:5
38:6 18:1 20:5
Table 4.4: Fatty acid chains of PE lipids from negative-ion mode ESI inPseudodiamesa branickii
In PLs with 36 carbon atoms, for mono, di, tri and tetraunsaturatedchains a sequence based on the couple 18:0/18:x (x=1-4) could be inferred;for chains with more than five unsaturation the presence of the 20:5 chain isa recurrent feature. Analyzing the distribution by number of carbon atoms
76

4.3 Cold resistance in Chironomid larvae
of fatty acid chains in figure 4.38, a little predominance at + 4◦C of PLs with34 carbon atoms and at -4◦C of PLs with 36 carbon atoms is observed.
Figure 4.38: Distribution of PE divided by number of carbon atoms of thetwo fatty acid chains in Pseudodiamesa branickii
Figure 4.39: Distribution of PE divided by number of unsaturated bonds ofthe two fatty acid chains in Pseudodiamesa branickii
77

Results and discussion
As shown in the figure 4.40, in the distribution of PC there are someremarkable differences between the two temperatures: at +4 ◦C there is arelevant domination of the species 34:3 (yellow circles), at -4 ◦C the speciespredominant are 36:5 and 36:6 (red circles).
Figure 4.40: Distribution of PC in Pseudodiamesa branickii at +4◦C and-4◦C as obtained by LC-MS experiment
Analyzing the distribution by number of carbon atoms of fatty acid chains(figure 4.41), a net predominance at + 4◦C of lipid with 34 carbon atoms andat -4◦C of lipid with 36 carbon atoms is observed, like in Diamesa cinerella.
In Pseudodiamesa branickii the species identified as PEx and PCx havenot been detected. For these extracts GC-MS measurements have not beencarried out because of the low quantity of the two samples.
After observing that NMR spectrum was too crowded for allowing a re-liable assignment of the various peaks, HPLC/ESI-MS experiments in pos-itive and negative ion mode were performed to identify sugars and polyolspresents in the samples and to observe if there are some significant trendswith the temperature. Some sugars have been identified (glucose, sorbitol,sucrose, raffinose and lactose) but not trehalose. From +4 ◦C to -4 ◦C thereis a little increase of glucose concentration and a decrease of lactose andraffinose.
78

4.3 Cold resistance in Chironomid larvae
Figure 4.41: Distribution of PC divided by number of carbon atoms of thetwo fatty acid chains in Pseudodiamesa branickii
Figure 4.42: Distribution of PC divided by number of unsaturated bonds ofthe two fatty acid chains in Pseudodiamesa branickii
79

Results and discussion
4.3.3 Discussion
If the attention is focused only on the global trend of each class, observ-ing the variations on the mean unsaturation index (MUI) calculated fromLC-MS experiments (see table 4.5), the differences between the two temper-atures are small and not particularly meaningful.
PB +4◦C PB -4◦C DC +4◦C DC -4◦C
PE 3,17 3,08 3,73 3,82
PC 4,07 4,09 4,63 4,51
Table 4.5: Mean unsaturation index of PE and PC in Pseudodiamesa brani-ckii (PB) and in Diamesa cinerella (DC) at +4◦C and -4◦C obtained by LC-MSmeasurements
In Diamesa cinerella there is a little increase of PE mean unsaturationcounterbalanced by a small decrease of PC mean unsaturation. In Pseudo-diamesa branickii PC mean unsaturation have the same value and there isa small decrease of PE mean unsaturation. The counterbalance observedin Diamesa larvae adapted to low temperature living conditions could beinterpreted as a mechanism of redistribution of acyl chains among the pho-spholipids rather than large changes in acyl chain unsaturation, that it hasbeen already reported in literature for ciliates [60]. However, if the attentionis focused on the variations of the relative molar ratios of each phospholipid,there are some significant differences.
The great amount of PE compared to PC has been already reported inliterature and it has been correlated to the cold adaptation [61]; moreover,from MUI data it’s clear that in both species PE are less unsaturated thanPC, in apparent contrast to the normal behavior reported in literature [62],but in agreement with previous results reported for insects [61]. Analyzingthe distribution of the total number of carbon atoms in the FA chains ofPE and PC, it’s clear that at the lower temperature (-4◦C) there is alwaysa small prevalence of longer chains (36 C atoms); this observation could be
80

4.3 Cold resistance in Chironomid larvae
explained by the more disorder produced by longer chains contributing topreserve membrane fluidity.
Comparing Diamesa cinerella to Pseudodiamesa branickii, the first ob-servation is that the former has a greater ratio PE/PC and has a MUI valuehigher than the later. These two factors could be explained by the higheraltitude where Diamesa larvae usually live with environmental conditionsharder than Pseudodiamesa requiring stronger cold adaptation mechanismsto restore a functional membrane fluidity. One interesting fact is the wide-spread coupling in PL of one chain essentially saturated and short and ofa second one with a significantly higher MUI and carbon atoms number.This pairing could be explained as another cold adaptation mechanism, be-cause a similar pairing of FA chains enlarges the range of temperaturesat which membranes are fluid and results in both cold and heat tolerance.This assumption is based on the finding of Lewis et al. [63] that the dif-ference (Th − Tm) between the two phase transition temperatures of PE-phospholipids (Tm for transition to gel phase and Th for transition to invertedhexagonal phase) increases markedly with a decrease in acyl chain length.Lowering of Tm could prevent unregulated formation of gel phase at lowerambient temperatures typical for overwintering larvae. Maintaining largedifference between Tm and Th temperatures could assure that the transitionto hexagonal phase in PEs does not occur in unregulated way upon a suddenincrease of temperature or during dehydration upon freezing.
Our results also suggest that the concentration of PE species with a 20:5esterified chain at sn-2 position is higher at -4◦C than at +4◦C (see in Dia-mesa larvae 34:5 and 36:5 PE or in Pseudodiamesa larvae 36:5 PE). FromESI negative-ion mode measurements on PE we have established that themain PUFA present in the fatty acid chain pattern is 20:5, with a very smallpercentage of 22:6. It has been demonstrated in literature that in aquaticinvertebrates FA composition in phospholipids is strongly determined ge-netically by specific biosynthesis [64]. The main enzymes related to thelipid biosynthesis are desaturases and elongases. Fatty acid desaturases
81

Results and discussion
are enzymes that convert a single bond between two carbon atoms (C-C)to a double bond (C=C) in a fatty acyl chain and the distribution of theseproteins is almost universal. The ability of cells to modulate the physicalcharacteristics of their membrane lipids is determined mainly by the ac-tions of fatty acid desaturases, which introduce double bonds into fatty acids[65]. There are three types of fatty acid desaturase: acyl-CoA, acyl-ACP, andacyl-lipid desaturases [66]. In plants and cyanobacteria, most desaturationreactions are catalyzed by acyl-lipid desaturases, which introduce unsatu-rated bonds into fatty acids that are are bound to the glycerol moiety ofpolar glycerolipids [67]. Acyl-ACP desaturases are present in the plastids ofplant cells and introduce the first double bond into fatty acids that are boundto acyl carrier protein (ACP). Acyl-CoA desaturases are present in animal,yeast and fungal cells, and they introduce unsaturated bonds into fatty acidsthat are bound to coenzyme A (CoA) [68]. The terms such as elongase sys-tem, elongase, or fatty acid chain elongation system (FACES), all refer toenzymes that are responsible for the addition of two carbon units to the car-boxyl end of a fatty acid chain. In both plants and animals, the elongasesystem is composed of four enzymes: a condensing enzyme (β-ketoacyl CoAsynthase, KCS), β-ketoacyl CoA reductase (KCR), β-hydroxyacyl CoA dehy-drase, and trans-2-enoyl CoA reductase. Fatty acid elongation mechanismis represented in figure 4.43. In the cell, there exist multiple microsomalelongation systems with different chain length specificity.
The importance of these enzymes in restoring membrane fluidity in stressconditions has been highlightened in many studies where it has been re-ported that one of the first biochemical responses to the membrane rigidityis the action of desaturases to lower the membrane melting temperature[28][69]. The PUFA biosynthesis mechanisms have been elucidated [70] andthey require the action of some desaturases and elongases enzymes, as de-scribed in figure 4.44.
Whereas the synthetic mechanism of eicosapentaenoic acid (20:5) is un-ambiguous, for docosahexanoic acid (22:6) there are two distinct mecha-
82

4.3 Cold resistance in Chironomid larvae
Figure 4.43: Fatty acid chain elongation reaction
83

Results and discussion
Figure 4.44: Biosynthesis of long-chain polyunsaturated fatty acids. Arrowswith solid line are found both in mammals and lower eukaryotes, while ar-rows with dotted line are exclusively for lower eukaryotes. Fatty acids in thebox indicate the pathway is exclusively in mammals. Reprinted from [70]
84

4.3 Cold resistance in Chironomid larvae
nisms for mammals [71] and for lower eukaryotes [72]. The cellular struc-tures of Diamesa cinerella and Pesudodiamesa branickii are more similarto lower eukaryotes and so it could be supposed that they synthesize 22:6trough the direct action of ∆4 desaturase on 22:5 without the steps impli-cating the formation of 24:5 and 24:6 fatty acids but we don’t have sufficientresults to assert absolutely this mechanism.
The low concentration of PL with 22:6 chain esterified (there is only 36:6PE) could be attributed to a low activity of ∆4 desaturase or to a low activityof elongases. In the past the desaturation steps have long been consideredthe rate-limiting steps for the biosynthesis of PUFAs, but recently studiesin M. alpina indicate that the elongation of C18:3 ω-6 to C20:3 ω-6 is therate-limiting step in 20:4 acid biosynthesis [73]. Another biochemical prob-lem is the identification of the type of desaturases presents in our samples,i.e. if the desaturation process is localized in the fatty acid bound to glyc-erol backbone, like in cyanobacteria, or if they introduce unsaturated bondsinto fatty acids that are bound to coenzyme A (CoA), like in mammals. Thefuture perspective is the identification of desaturases present in Diamesa ci-nerella and Pseudodiamesa branickii trying to define the mechanism of lipidbiosynthesis in these insects.
Summarizing, membrane composition is important to preserve the lifeof the organisms and the membrane fluidity is kept by phospholipids withan high unsaturation degree to lower the melting temperature of the mem-brane. Varying temperature inside their vital range (from +4◦C to -4◦C) wecan assume a mechanism of redistribution of acyl chains among the pho-spholipids in the absence of large changes in acyl chain unsaturation. Thepairing of chains with different length in the phospholipids is another mech-anism to lower melting temperature and to preserve membrane structurefrom cold stress. The high ratio PE/PC, not so common in other type oforganisms, is typical of cold adapted species because PEs help to preservemembrane fluidity. It remains unclear the mechanism of lipid biosynthesisin these insects to have a more descriptive comprehension of biochemical
85

Results and discussion
processes inside the cell, which type of desaturases are present in these or-ganisms and if the unsaturated bonds are introduced on fatty acids bound tothe glycerol moiety of polar glycerolipids or bound to coenzyme A. In a pre-liminary analysis, polyols and sugars don’t seem to play an important rolein adaptation in their vital range. Other experiments on larvae adapted atvery low temperature (< -8◦C) or at very high temperature (> 20◦C) couldbe useful to have a description of stress response in Diamesa cinerella andPseudodiamesa branickii.
86

Chapter 5
Conclusions
The aim of this study was to investigate biological membranes and to demon-strate how the knowledge about their composition can be useful to under-stand the biochemical processes involved in the response to environmentalstressors or diseases and the great relevance that lipidomics can play inthis context. The study has been focused on two specific biological systems:i) the components of DRM (detergent resistant membrane) associated withthe expression of PSMA, a protein involved in the prostate carcinoma andii) the composition of membranes of insect larvae of two species (Pseudodia-mesa branickii and Diamesa cinerella) to obtain a better understanding ofthe mechanisms involved in the adaptation of the organisms at temperaturebelow 0◦C.
From the analysis of components of DRMs our investigations outlinethe mild "extracting power" of Lubrol which leads to rafts with a low ra-tio Chol/PL respect to other stronger detergents, like Triton X-100, with alower SM/PC and higher PE/PC ratios with PE representing almost 50% ofthe total PL in the membrane. Furthermore this study has strengthened theimportance of cholesterol to trigger rafts formation and it is in agreementwith the model that lipid raft stability is provided by acyl chains structureand their interaction with cholesterol.
Concerning the study on Pseudodiamesa branickii and Diamesa cine-
87

Conclusions
rella, our results underline the high unsaturation degree of fatty acid chainsthat has been related to mechanisms adopted to decrease the membranemelting temperature. By lowering temperature inside their vital range (from+4 ◦C to -4 ◦C) this species seems able to activate a mechanism of redistri-bution of PL acyl chains. In particular, PLs bearing acyl chains of differentlength are expected to be more disordered than "symmetric" PLs and, thusbetter-suited to tackle cold stress adaptation. Another interesting outcomeis the high molar ratio of PE, a factor which seem to enhance membranefluidity at low temperature. Polyols and sugars, molecules with well-knowncryoprotective role, in a preliminary analysis don’t seem to have a signifi-cant role in temperature adaptation of these insects. Two questions are leftunresolved: the lipid biosynthetic mechanisms and the modification of cellu-lar membrane in response to hot stresses. The first is important to completethe comprehension of biochemical processes involved in cold adaptation, toknow which type of desaturases are present in these insects, how polyunsat-urated lipids are synthesized and if the unsaturated bonds are introducedon fatty acids bound to the glycerol moiety of polar glycerolipids or bound tocoenzyme A. The second question is relevant in an ecological perspective tounderstand how these organisms respond to the increase of environmentaltemperature and if they are able to survive the global warming.
88

Bibliography
[1] Domon B and Aebersold R., Review - Mass spectrometry and proteinanalysis, Science,2006, 312, 212; Sickmann A., Mreyen M. and MeyerH.E., Mass spectrometry - a key technology in proteom research, Adv.Biochem. Eng. Biotechnol.,2003, 83, 141.
[2] Goodacre R., Vaidyanathan S., Dunn W.B., Harrigan G.G. and KellD.B., Metabolomics by numbers: acquiring and understanding globalmetabolic data, Trends Biotechnol.,2004, 22, 245
[3] Wenk M.R., The emerging field of lipidomics, Nat. Rev. Drug. Dis-cov.,2005, 4, 594.
[4] Oresic M., Hänninen V.A. and Vidal-Puig A., Lipidomics: a new windowto biomedical frontiers, Trends Biotechnol.,2008, 26, 647-652
[5] Fahy E., Subramaniam S., Brown H.A., Glass C.K., Merrill A.H., Mur-phy R.C., Raetz C.R.H., Russell D.W., Seyama Y., Shaw W., ShimizuT., Spener F., van Meer G., VanNieuwenhze M.S., White S.H., WitztumJ.L. and Dennis E.A., A comprehensive classification system for lipids,J. Lipid Res.,2005, 46, 839-861
[6] Pulfer M. and Murphy R.C., Electrospray mass spectrometry of pho-spholipids, Mass Spectrom. Rev.,2003, 22, 332-364
[7] Schiller J., Suss R., Arnhold J., Fuchs B., Lessig J., Muller M., PetkovicM., Spalteholz H., Zschornig O. and Arnold K., Matrix-assisted laser
89

BIBLIOGRAPHY
desorption and ionization time-of-flight (MALDI-TOF) mass spectro-metry in lipid and phospholipid research, Prog. Lipid Res.,2004, 43,449-488
[8] Ejsing C.S., Sampaio J.L., Surendranath V., Duchoslav E., Ekroos K.,Klemm R.W., Simons K. and Shevchenko A., Global analysis of theyeast lipidome by quantitative shotgun mass spectrometry, Proc. Natl.Acad. Sci. U.S.A.,2009, 106, 2136
[9] Deeley J.M., Hankin J.A., Friedrich M.G., Murphy R.C., TruscottR.J.W., Mitchell T.W. and Blanksby S.J., Sphingolipid distributionchanges with age in the human lens, J. Lipid Res.,2010, 51, 2753-2760
[10] Koivusalo M., Perttu Haimi P., Heikinheimo L., Kostiainen R. andSomerharju P., Quantitative determination of phospholipid composi-tions by ESI-MS: effects of acyl chain length, unsaturation, and lipidconcentration on instrument response, J. Lipid Res.,2001, 42, 663-672
[11] Taleb A., Diamond J., McGarvey J.J., Beattie J.R., Toland C. and Hamil-ton P.W., Raman microscopy for the chemiometric analysis of tumorcells, J. Phys. Chem. B,2006, 110, 19625-19631
[12] Singer S.J. and Nicolson G.L., The fluid mosaic model of the structureof cell membranes, Science,1972, 175, 720-731
[13] Van Meer G., Lipid traffic in animal-cells, Annu. Rev. Cell. Biol.,1989,5, 247
[14] Simons K. and Ikonen E., Functional rafts in cell membranes, Na-ture,1997, 387, 569-572
[15] Brown D.A. and London E., Structure and origin of ordered lipid do-mains in biological membranes, J. Membr. Biol.,1998, 164, 103-114
90

BIBLIOGRAPHY
[16] Brown D.A. and Rose J., Sorting og GPI-anchored proteins to glycolipid-enriched membrane subdomains during transport to the apical cell-surface, Cell,1992, 68, 533-544
[17] Schuck S., Honsho M., Ekroos K., Shevchenko A. and Simons K., Resis-tance of cell membranes to different detergents, Proc. Natl. Acad. Sci.U.S.A.,2003, 100, 5795-5800
[18] Niemelä P.S., Ollila S., Hyvönen M.T., Karttunen M. and VattulainenI., Assessing the nature of lipid raft membranes, PLOS Comput.Biol.,2007, 3, 304-312; Edidin M., The state of lipid rafts: From modelmembranes to cells, Annu. Rev. Biophys. Biomolec. Struct.,2003, 32,257-283
[19] Samsonov A.V., Mihalyov I. and Cohen F.S., Characterization ofcholesterol-sphingomyelin domains and their dynamics in bilayermembranes, Biophys. J.,2001, 81, 1486-1500
[20] Schmidt C.F., Barenholz Y. and Thompson T.E., Nuclear Magnetic-resonance study of sphingomyelin in bilayer systems, Biochemistry,1977, 16, 2649-2656
[21] Boggs J.M., Intermolecular hydrogen bonding between lipids: influenceon organization and function of lipids in membranes, Can. J. Biochem.,1980, 58, 755-770
[22] Simons K. and van Meer G., Lipid sorting in epithelial cells, Biochem-istry, 1988, 27, 6197-6202
[23] Brown D.A. and London E., Structure and Function of Sphingolipid-and Cholesterol-rich Membrane Rafts, J. Biol. Chem.,2000, 275, 17221-17224
[24] London E. and Brown D.A., Insolubility of lipids in Triton X-100: phys-ical origin and relationship to sphingolipid/cholesterol membrane do-mains (rafts), Biochim. Biophys. Acta,2000, 1508, 182-195
91

BIBLIOGRAPHY
[25] Castelletti D., Alfalah M., Heine M., Hein Z., Schmitte R., Fracasso G.,Colombatti M. and Naim H.Y., Different glycoforms of prostate-specificmembrane antigen are intracellularly transported through their asso-ciation with distinct detergent-resistant membranes, Biochem. J.,2008,409, 149-157
[26] Landers K.A., Burger M.J., Tebay M.A., Purdie D.M., Scells B., Sama-ratunga H., Lavin M.F. and Gardiner R.A., Use of multiple biomarkersfor a molecular diagnosis of prostate cancer, Int. J. Cancer,2005, 114,950-956
[27] Israeli R.S., Powell C.T., Corr J.G., Fair W.R. and Heston W.D., Expres-sion of the prostate-specific membrane antigen, Cancer Res.,1994, 54,1807-1811
[28] Los D.A. and Murata N., Membrane fluidity and its roles in the per-ception of environmental signals, Biochim. Biophys. Acta,2004, 1666,142-157
[29] Wang G., Shusen L, Hainan L., Brumbaugh E.E. and Huang C., Effectsof various numbers and positions of cis double bonds in the sn-2 acylchain of phosphatidylethanolamine on the chain-melting temperature,J. Biol. Chem.,1999, 274, 12289-12299
[30] Keough, K. M. W., Influence of chain unsaturation and chain posi-tion on thermotropism and intermolecular interactions in membranes,Biochem. Soc. Trans.,1990, 18, 835-837
[31] Huang C., Hainan L., Shusen L. and Wang G., Influence of the positionsof cis double bonds in the sn-2 acyl chain of phosphatidylethanolamineon the bilayer’s melting behavior, J. Biol. Chem.,1997, 272, 21917-21926
92
BIBLIOGRAPHY
[32] Watanabe M., Kikawada T. and Okuda T., Increase of internal ion con-centration triggers trehalose synthesis associated to cryptobiosis in lar-vae of Polypedilum vanderplanki, J. Exp. Biol.,2003, 206, 2281-2286
[33] Behm C.A., The role of trehalose in the physiology of nematodes, Int. J.Parasit.,1997, 27, 215-229
[34] Schulze U., Larsen M.E. and Villadsen J., Determination of intra-cellular trehalose and glycogen in Saccharomyces cerevisiae, Anal.Biochem.,1995, 228, 143-149
[35] Sum A.K., Faller R. and de Pablo J.J., Molecular simulation study ofphospholipid bilayers and insights of the interactions with disaccha-rides, Biophys. J.,2003, 85, 2830-2844
[36] Crowe J.H., Crowe L.M. and Chapman D., Preservation of membranesin anhydrobiotic organisms - the role of trehalose, Science,1984, 223,701-703
[37] Lencioni V., Survival strategies of freshwater insects in cold environ-ments, J. Limnol.,2004, 63(Suppl.1), 45
[38] Bouchard R.W., Carrillo M.A., Kells S.A. and Ferrington L.C., Freezetolerance in larvae of the winter-active Diamesa mendotae Muttkowski(Diptera : Chironomidae): a contrast to adult strategy for survivalat low temperatures, Hydrobiologia,2006, 568, 403-416; Rossaro, B.Chironomids and water temperature, Aquatic Insects,1991, 13, 87-98;Lencioni V. and Rossaro B., Microdistribution of chironomids (Diptera:Chironomidae) in Alpine streams: an autoecological perspective, Hy-drobiologia,2005, 533, 61-76
[39] Michaud M.B., Benoit J.B., Lopez-Martinez G., Elnitsky M.A., Lee R.E.and Denlinger D.L., Metabolomics reveals unique and shared metabo-lic changes in response to heat shock, freezing and desiccation in the
93

BIBLIOGRAPHY
Antarctic midge, Belgica antarctica, J. Insect Physiol.,2008, 54, 645-655
[40] Benoit J.B., Lopez-Martinez G., Elnitsky M.A., Lee R.E. and DenlingerD.L., Dehydration-induced cross tolerance of Belgica antarctica lar-vae to cold and heat is facilitated by trehalose accumulation, Comp.Biochem. Physiol. A,2009, 152, 518-523
[41] Hopfgartner G., Vilbois F. and Piguet C., Characterization ofsupramolecular complexes by high resolution electrospray ionizationmass spectrometry, Rapid Commun. Mass Specttrom.,1999, 13, 302-306
[42] Pitt A.R., Application of electrospray mass spectrometry in biology, Nat.Prod. Rep.,1998, 15, 59-72
[43] Yamashita M. and Fenn J.B., Electrospray ion-source - another varia-tion on the free-jet theme, J. Phys. Chem.,1984, 88, 4451-4459
[44] Iribarne J.V. and Thomson B.A., On the evaporation of small ions fromcharged droplets, J. Chem. Phys.,1976, 64, 2287
[45] Dole M., Mack L.L., Hines R.L., Mobley R.C., Ferguson L.D. and AliceM.B., Molecular beams of macroions, J. Chem. Phys.,1968, 49, 2240
[46] Kerwin J.L., Tuininga A.R. and Ericsson L.H., Identification ofmolecular-species of glycerophospholipids and sphingomyelin usingelectrospray mass-spectrometry, J. Lipid Res.,1994, 35, 1102-1114
[47] Bligh E.G. and Dyer W.J. , A rapid method of total lipid extraction andpurification, Can. J. Biochem. Physiol.,1959, 37, 911-917
[48] Folch J., Lees M. and Stanley G.H.S., A simple method for the iso-lation and purification of total lipides from animal tissues, J. Biol.Chem.,1957, 226, 497-509
94

BIBLIOGRAPHY
[49] Dennis A. and Plückthun A., Phosphorus-31 NMR of Phospholipids inMicelles, in Phosphorus-31 NMR - Principles and Applications, Goren-stein editor, Orlando Academic Press Inc, 1984, 423-446
[50] Schiller J., Muller M., Fuchs B., Arnold K. and Huster D., P-31 NMRSpectroscopy of phospholipids: from micelles to membranes, Curr.Anal. Chem.,2007, 3, 283-301; Schiller J. and Arnold K., Applicationof high resolution 31P NMR spectroscopy to the characterization of thephospholipid composition of tissues and body fluids - a methodologicalreview, Med. Sci. Monitor,2002, 8, 205-222
[51] London E. and Feigenson G.W., Phosphorus NMR analysis of phospho-lipids in detergentsJ. Lipid Res.,1979, 20, 408-412
[52] Meneses P. and Glonek T., High resolution 31P NMR of extracted pho-spholipids, J. Lipid Res.,1988, 29, 679-689; Bosco M., Culeddu N., Tof-fanin R. and Pollesello P., Organic Solvent Systems for 31P NuclearMagnetic Resonance Analysis of Lecithin Phospholipids: Applicationsto Two-Dimensional Gradient-Enhanced 1H-Detected HeteronuclearMultiple Quantum Coherence Experiments, Anal. Biochem.,1997, 245,38-47; Culeddu N., Bosco M., Toffanin R. and Pollesello P., 31P NMRanalysis of phospholipids in crude extracts from different sources: im-proved efficiency of the solvent system, Magn. Reson. Chem.,1998, 36,907-912
[53] Hao L., Lu R.H., Leaist D.G. and Poulin P.R., Aggregation number ofaqueous sodium cholate micelles from mutual diffusion measurements,J. Solut. Chem., 1997, 26, 113-125
[54] Brzustowicz M.R., Cherezov V., Zerouga M., Caffrey M., Stillwell W.and Wassall S.R., Controlling membrane cholesterol content. A rolefor polyunsaturated (Docosahexaenoate) phospholipids, Biochemistry,2002, 41, 12509-12519
95

BIBLIOGRAPHY
[55] Shaikh S.R., Cherezov V., Caffrey M., Stillwell W. and Wassall S.R.,Interaction of cholesterol with a docosahexaenoic acid-containing phos-phatidylethanolamine: Trigger for microdomain/raft formation?, Bio-chemistry, 2003, 42, 12028-12037
[56] Koštal V., Berkova P. and Šimek P., Remodelling of membrane pho-spholipids during transition to diapause and cold-acclimation in thelarvae of Chymomyza costata (Drosophilidae), Comp. Biochem. Physiol.B, 2003, 135, 407-419
[57] Martinez-Seara H., Rog T., Karttunen M., Vattulainen I. and ReigadaR., Why is the sn-2 chain of monounsaturated glycerophospholipidsusually unsaturated whereas the sn-1 chain is saturated? Studiesof 1-stearoyl-2-oleoyl-sn-glycero-3-phosphatidylcholine (SOPC) and 1-oleoyl-2-stearoyl-sn-glycero-3-phosphatidylcholine (OSPC) membraneswith and without cholesterol, J. Phys. Chem. B, 2009, 113, 8347-8356
[58] Lie Ken M.S.F. and Lam C.C., 1H Nuclear magnetic resonance spec-troscopic studies of saturated, acetylenic and ethylenic triacylglycerols,Chem. Phys. Lipids,1995, 77, 155-171
[59] Gao J., Ajjawi I., Manoli A., Sawin A., Xu C., Froehlich J.E., LastR.L. and Benning C., FATTY ACID DESATURASE4 of Arabidopsisencodes a protein distinct from characterized fatty acid desaturases,Plant J.,2009, 60, 832-839
[60] Dickens, B.F. and Thompson, G.A., Phospholipid molecular species al-terations in microsomal membranes as an initial key step during cellu-lar acclimation to low temperature, Biochemistry,1982, 21, 3604-3611
[61] Hodkova, N. Šimek P., Zahradnickova H. and Novakova O., Seasonalchanges in the phospholipid composition in thoracic muscles of a het-eropteran, Pyrrhocoris apterus, Insect Biochem. Mol. Biol., 1999, 29,367-376
96

BIBLIOGRAPHY
[62] Hazel, J.R., Cold adaptation in ectotherms: regulation of membranefunction and cellular metabolism. Adv. Comp. Environ. Physiol.,1989,4, 1-49
[63] Lewis, R.N.A.H., Mannock D.A., McElhaney R.N., Turner D.C. andGruner S.M., Effect of fatty acyl chain length and structure on thelamellar gel to liquidcrystalline and lamellar to reversed hexagonalphase transition of aqueous phosphatidylethanolamine dispersions,Biochemistry, 1989, 28, 541-548
[64] Falk-Petersen S., Sargent J.R., Kwasniewski S., Gulliksen B. and Mil-lar R.M., Lipids and fatty acids in Clione limacina and Limacina he-licina in Svalbard waters and the Arctic Ocean: trophic implications,Polar Biol.,2001, 24, 163-170
[65] Kates M. and Manson L.A., Regulation of membrane fluidity by lipiddesaturases, Biomembranes,1984, 12, 379-395
[66] Murata N. and Wada H., Acyl-lipid desaturases and their importancein the tolerance and acclimatization to cold of cyanobacteria, Biochem.J.,1995, 308, 1-8
[67] Murata N., Wada H.and Gombos Z., Modes of fatty-acid desaturationin cyanobacteria, Plant Cell Physiol.,1992, 33, 933-941
[68] Macartney A., Maresca B and Cossins A.R., Acyl-CoA desaturasesand the adaptive regulation of membrane lipid composition, in: A.R.Cossins (Ed.), Temperature adaptation of biological membranes, Port-land Press, London, 1994, pp. 129-139
[69] Sakamoto T. and Murata N., Regulation of the desaturation of fattyacids and its role in tolerance to cold and salt stress, Curr. Opin. Mi-crobiol., 2002, 5, 206-210; Aguilera J., Randez-Gil F. and Prieto J.A.,Cold response in Saccharomyces cerevisiae: new functions for old mech-anisms, FEMS Microbiol. Rev.,2007, 31 327-341
97

BIBLIOGRAPHY
[70] Leonard A.E., Pereira S.L., Sprecher H. and Huang Y., Elongation oflong-chain fatty acids, Prog. Lipid Res.,2004, 43, 36-54
[71] Sprecher H., Metabolism of highly unsaturated n-3 and n-6 fatty acids,Biochim. Biophys. Acta,2000, 1486, 219-231
[72] Pereira, S.L., Leonard A.E. and Mukerji P., Recent advances in thestudy of fatty acid desaturases from animals and lower eukaryotes,Prostaglandins Leukot. Essent. Fatty Acids,2003, 68, 97-106
[73] Wynn J.P. and Ratledge C., Evidence that the rate-limiting step far thebiosynthesis of arachidonic acid in Mortierella alpina is at the level ofthe 18:3 to 20:3 elongase, Microbiol.,2000, 146, 2325-2331
98

Acknowledgments
First of all, I convey my gratitude to my supervisor Prof. Graziano Guella forgiving me the opportunity to work in his group. I am grateful for his patienceand immense knowledge that have been a very precious help during all thePhD period.
The part of this thesis on DRMs has done in collaboration with dr. MauroDalla Serra and dr. Rossella Tomazzoli (CNR-IBF) and in collaboration withdr. Marco Colombati (University of Verona). They have taken care of all thebiological part, from the cell growth to the membrane isolation.
The part of this thesis on chironomid larvae has been co-funded by theAutonomous Province of Trento (Italy), ACE-SAP project (Ecosistemi Alpinie Cambiamento Ambientale: Sensibilità e Potenziale Adattativo della biodi-versità/ Alpine Ecosystems in A Changing Environment: Biodiversity Sensi-tivity And Adaptive Potential; regulation number 23, June 12th 2008, of theUniversity and Scientific Research Service). I thank to dr. Valeria Lencioni(MTSN), as coordinator of the workpackage 3 activity 2, for the advicesduring the research and for the help in the revision of the thesis, and dr.Paola Bernabò and dr. Luigi Caputi (MTSN-CIBIO) for larvae collectionand stressing experiments.
I thank to Adriano Sterni for LC-MS experiments. I thank to LorenzaConterno for English revision of the thesis. I am grateful to Andrea, Ritaand Giorgina for their initial welcome, for all lunches shared in these threeyears, for all the discussions and exchange of ideas.
Last but not least, I must thank very much to my parents for giving me
99

BIBLIOGRAPHY
support and for being always a safe haven.
100

List of publications
1. Toffoletti A., Conti F., Sandron T., Napolitano A., Panzella L. and D’IschiaM., Time-resolved EPR observation of synthetic eumelanin-superoxide rad-ical pairs, Chem. Comm., 2009, 33, 4977-4979
2. Guella G., Frassanito R., Mancini I., Sandron T., Modeo L., VerniF., Dini F. and Petroni G., Keronopsamides, a New Class of Pigments fromMarine Ciliates, Eur. J. Org. Chem., 2010, 3, 427-434
101