universidade de lisboarepositorio.ul.pt/bitstream/10451/4179/1/620647_tese.pdf · universidade de...
TRANSCRIPT

UNIVERSIDADE DE LISBOA
FACULDADE DE MEDICINA
Strategies for early detection of renal injury in HIV-infected patients: the new troponin
Sara Sofia dos Santos Brilha
Mestrado em Doenças Infecciosas Emergentes
2011

2
UNIVERSIDADE DE LISBOA
FACULDADE DE MEDICINA
Strategies for early detection of renal injury in HIV-infected patients: the new troponin
Sara Sofia dos Santos Brilha
Supervisor: Prof. Doutora Emília Valadas, Faculdade de Medicina de Lisboa
All information mentioned in this manuscript is the author’s exclusive
responsibility and therefore, the Faculdade de Medicina da Universidade
de Lisboa is independent from any accountability regarding its contents.
Mestrado em Doenças Infecciosas Emergentes 2011

The present dissertation was approved by the Scientific Committee of the Faculdade de
Medicina da Universidade de Lisboa on the 15th of March, 2011.

“(...) All our science, measured against reality, is primitive and childlike and yet it is the
most precious thing we have.”
Albert Einstein (1879-1955)

5
Abstract
Background: HIV-infected patients have a known increased risk of kidney disease.
For that reason, a biomarker that enables reliable detection of early and mild kidney
dysfunction would be advantageous. Cystatin C is considered to be a better marker
of kidney function than creatinine.
Objectives: This study aimed to evaluate if serum cystatin C was a better marker
than creatinine in a HIV-infected population.
Material and Methods: This was an observational study of HIV-infected patients that
attend the Infectious Diseases Department, at the Hospital Santa Maria, Lisbon.
Patients with known kidney disease or HIV-2 infection were excluded. Clinical and
demographic data was recorded and serum creatinine and cystatin C levels were
determined.
Results: A total of 242 patients were included. Cystatin C is an independent factor of
age, gender, ethnicity and body mass index. Of the 17 patients with elevated levels
of cystatin C but with an estimated creatinine clearance within normal range, 11 were
on antiretroviral therapy with tenofovir and/or atazanavir. Fourteen patients were
smokers and 10 patients had hepatitis C virus co-infection, which are known causes
of inflammation.
In a matched control group of 27 patients, with cystatin C within normal range, the
majority of patients also were on an antiretroviral regimen with tenofovir and/or
atazanavir. However, none of them had hepatitis C virus co-infection. Moreover, a

6
statistical association was found between high levels of cystatin C and alanine
transaminase.
Differences between biomarkers’ levels and patients on combinations with tenofovir,
ritonavir boosted atazanavir or both were also studied. Although it was not found any
statistically significant difference in creatinine and estimated creatinine clearance,
with cystatin C, patients that were on atazanavir or tenofovir and had a higher level of
cystatin C, compared with patients that never were on these drugs.
Conclusion: Cystatin C levels may be increased in inflammatory conditions.
Therefore, in HIV-infected patients, where chronic systemic inflammation is present,
often associated to other inflammation sources, such as chronic hepatitis C virus co-
infection, the use of cystatin C to monitor kidney function may overestimate kidney
impairment.
In what concerns to nephrotoxicity, it was found that patients on atazanavir had
higher levels of cystatin C. It is important to develop prospective studies, in order to
assess the real long-time impact of the more recent antiretroviral drugs on kidney
function.
Keywords:
cART, creatinine, cystatin C, HIV, kidney injury

7
Resumo
Introdução: Os doentes infectados por VIH possuem um risco aumentado para o
desenvolvimento de doença renal. Por esta razão, seria importante utilizar um
marcador que permitisse uma detecção precoce de alterações da função renal. A
cistatina C tem sido referida na literatura como um melhor marcador da função renal,
comparativamente com a creatinina.
Objectivos: O objectivo deste estudo é analisar se a cistatina C sérica constitui um
melhor marcador da função renal que a creatinina, para a população de doentes
infectados por VIH.
Material e métodos: Este é um estudo observacional de doentes infectados por
VIH, seguidos no Serviço de Doenças Infecciosas do Hospital de Santa Maria,
Lisboa. Os doentes com doença renal documentada e infecção por VIH-2 foram
excluídos deste estudo.
Foram recolhidos dados clínicos e demográficos e foram determinados os níveis
séricos de creatinina e cistatina C.
Resultados: Um total de 242 doentes foi incluído neste estudo. Os níveis de
cistatina C mostraram-se independentes da idade, sexo, etnia e índice de massa
corporal. Dos 17 doentes com níveis elevados de cistatina C mas com clearance da
creatinina dentro dos valores de referência, 11 doentes estavam sob terapêutica
antirretroviral com tenofovir e/ou atazanavir potenciado com ritonavir. Catorze
doentes eram fumadores e 10 estavam co-infectados por vírus da hepatite C, que
constitui um factor conhecido de inflamação. Num grupo controlo de 27 doentes,

8
com cistatina C dentro dos valores normais, a maioria dos doentes também se
encontrava sob terapêutica antirretroviral com tenofovir e/ou atazanavir. No entanto,
nenhum possuía co-infecção por vírus da hepatite C.
Foram também analisadas diferenças entre os níveis dos marcadores e doentes em
combinações com tenofovir, atazanavir potenciado com ritonavir ou com ambos.
Embora não tenha sido encontrada nenhuma diferença estatisticamente significativa
nos níveis de creatinina e clearence da creatinina estimado, com a cistatina C,
doentes sob atazanavir ou tenofovir e atazanavir possuíam níveis mais elevados
deste marcador, comparativamente com os doentes que nunca estiveram sob estes
antirretrovirais.
Conclusão: Os níveis de cistatina C podem aumentar com factores inflamatórios.
Por esta razão, no caso dos doentes infectados por VIH, onde existe uma
inflamação sistémica crónica, muitas vezes associada a outras fontes de inflamação,
como a co-infecção por vírus da hepatite C, a utilização exclusiva da cistatina C para
a monitorização da função renal pode conduzir a uma sobrestimação de uma lesão
renal.
Em termos de nefrotoxicidade, verificou-se que doentes sob atazanavir possuíam
níveis mais elevados de cistatina C. É de extrema importância, o desenvolvimento
de novos estudos prospectivos, de forma a permitir a análise do impacto a longo
prazo destes antirretrovirais mais recentes na função renal.
Palavras-chave:
Cistatina C, creatinina, lesão renal, TARVc, VIH

9
Acknowledgments
I dedicate the present dissertation to my grandparents, who I will always carry in my
heart. Thank you for everything you taught me.
A warm thanks to my beloved family and dearest friends. Thank you for the
everlasting support and understanding.
Here I express my deepest gratitude to my mother, who is my reference of strength
and conduct. Thank you for always being present and, more than anybody, for
always believing in me.
I wish to express my sincere gratitude to my supervisor, Professor Emília Valadas,
for all the support and guidance, all the given opportunities and also for the important
life lessons during these almost two years at the Laboratório de Diagnóstico
Molecular de Doenças Infecciosas, Faculdade de Medicina de Lisboa.
A kind thanks to Professor Thomas Hänscheid, from whom I have also learned so
much, and helped and guided me during my last year of the undergraduate degree. If
I am now so passionate about research in infectious diseases, it is also due to his
mentoring.
I would also want to give a special thank to Professor Francisco Antunes, Director of
the Infectious Diseases Department, Hospital Santa Maria, for consenting with the
realization of this study.

10
A sincere thanks to Dr. Robert Badura, Nurse Bárbara Silva, Ana Ferrão and Sandra
Sousa, from the Clínica Universitária de Doenças Infecciosas e Parasitárias. Without
their help and support this work would not be possible.
I also want to thank Dr. Maria João and Dr. António Santos from the Instituto de
Formação Avançada, for always being available to help me during this time as a
student of the Master in Emergent Infectious Diseases.
Finally I would like to thank ViiV Healthcare for the financial support.

11
Table of contents
FIGURES INDEX ................................................................................................................................... 13
TABLES INDEX ..................................................................................................................................... 15
ABBREVIATIONS LIST ...................................................................................................................... 17
INTRODUCTION .................................................................................................................................... 21
1. EPIDEMIOLOGY OF HIV INFECTION ................................................................. 21
2. MECHANISM OF KIDNEY FUNCTION ................................................................. 24
3. ACUTE KIDNEY INJURY .................................................................................. 26
4. CHRONIC KIDNEY DISEASE ............................................................................ 32
5. MECHANISM OF HIV INFECTION OF KIDNEY CELLS ............................................ 37
5. COMBINATION ANTIRETROVIRAL THERAPY ...................................................... 38
5.1. cART associated kidney disease ........................................................... 40
6. KIDNEY FUNCTION ASSESSMENT: TRADITIONAL METHODS VERSUS NEW
BIOMARKERS ............................................................................................................44
6.1 Cystatin C .............................................................................................. 45

12
6.2 Interleukin 18 ......................................................................................... 47
6.3 Kidney injury molecule 1 ........................................................................ 48
6.4 Liver fatty acid binding protein ............................................................... 49
6.5 Lipocalin-2 or Neutrophil gelatinase-associated lipocalin ...................... 51
STUDY OBJECTIVES ......................................................................................................................... 57
MATERIAL AND METHODS ............................................................................................................ 59
Study settings ................................................................................................. 59
Study population ............................................................................................. 60
Kidney function markers measurements ......................................................... 61
Statistical analysis ........................................................................................... 62
RESULTS ................................................................................................................................................. 64
DISCUSSION .......................................................................................................................................... 81
CONCLUDING REMARKS ................................................................................................................ 91
BIBLIOGRAPHY .................................................................................................................................... 95
ANNEXES ............................................................................................................................................... 123

13
Figures Index
FIGURE 1- GENERAL PERSPECTIVE OF HIV INFECTION IN THE WORLD (1990-
2008) ........................................................................................................................................................... 21
FIGURE 2- CONDITIONS REPORTED IN US DEATH CERTIFICATES THAT
MENTIONED HIV INFECTION, IN 2006 ...................................................................................... 23
FIGURE 3- PHYSIOLOGY OF A NEPHRON ............................................................................. 25
FIGURE 4 – RIFLE CLASSIFICATION SCHEME .................................................................... 27
FIGURE 5 - PROXIMAL TUBULAR CELL TRANSPORT PATHWAY FOR
TENOFOVIR ............................................................................................................................................ 42
FIGURE 6- RIBBON DIAGRAM OF HUMAN CYSTATIN C STRUCTURE .................... 46
FIGURE 7 – RIBBON DIAGRAM OF HUMAN INTERLEUKIN-18 STRUCTURE ........ 47
FIGURE 8 – RIBBON DIAGRAM OF KIDNEY INJURY MOLECULE 1 STRUCTURE. 48
FIGURE 9 – RIBBON DIAGRAM OF LIVER FATTY ACID BINDING PROTEIN
STRUCTURE ........................................................................................................................................... 50

14
FIGURE 10 - NGAL CRYSTAL STRUCTURE WITH THE BACTERIAL
ENTEROCHELIN LIGAND ................................................................................................................. 52
FIGURE 11- SAMPLES DISTRIBUTION PER CREATININE LEVEL ............................... 54
FIGURE 12 – CORRELATION BETWEEN CR, CYST C AND ESTIMATED CRCL ... 71
FIGURE 13- BOX-PLOT OF CYSTATIN C LEVELS IN PATIENTS WITH HIV/HCV
CO-INFECTION, ACCORDING WITH THE LEVELS OF ALT ............................................. 75
FIGURE 14- BOX-PLOT OF CYST C AND ECRCL LEVELS PER CART GROUP .... 77
FIGURE 15- CR, ECRCL AND CYST C DETERMINATIONS PER YEAR ON CART. 78

15
Tables Index
TABLE 1. HIV-RELATED ACUTE KIDNEY DISEASES. ........................................... 30
TABLE 2. STAGES OF CHRONIC KIDNEY DISEASE. ............................................ 33
TABLE 3. CAUSES AND CHARACTERISTICS OF CKD IN HIV-INFECTED
PATIENTS. ................................................................................................................ 35
TABLE 4. ANTIRETROVIRAL DRUG ASSOCIATED KIDNEY INJURY ................... 41
TABLE 5. DEMOGRAPHIC AND LABORATORY DATA OF THE STUDY
POPULATION (N=242) ............................................................................................. 65
TABLE 6. CURRENT CART REGIMENS. ................................................................ 66
TABLE 7. KIDNEY FUNCTION ACCORDING TO ANTIRETROVIRAL THERAPY .. 68
TABLE 8. KIDNEY FUNCTION ACCORDING TO THE DURATION OF INFECTION. 68
TABLE 9. KIDNEY FUNCTION ACCORDING WITH THE NUMBER OF YEARS ON
CART. ........................................................................................................................ 69
TABLE 10. KIDNEY FUNCTION ACCORDING TO CD4+ T CELL NADIR ............... 70

16
TABLE 11. MULTIPLE LINEAR REGRESSION MODEL FOR AGE, GENDER,
ETHNICITY AND BMI. ............................................................................................... 72
TABLE 12. RESULTS OF ECRCL AND CYSTATIN C IN 242 HIV-INFECTED
PATIENTS. ................................................................................................................ 73
TABLE 13. COMPARISON BETWEEN TWO SUBGROUPS OF PATIENTS: WITHIN
NORMAL RANGE AND ELEVATED CYSTATIN C LEVELS. .................................... 74

17
Abbreviations List
ACE- Angiotensin-converting enzyme
ADQI - Acute Dialysis and Quality Initiative
AIDS- Acquired immunodeficiency syndrome
ALT- Alanin transaminase
AKI- Acute kidney injury
AKIN- Acute Kidney Injury Network
AKF- Acute kidney failure
ART- Antiretroviral therapy
ATN- Acute tubular necrosis
ATIN- Acute tubule interstitial nephritis
ATV/r – Atazanavir boosted with ritonavir
cART- Combination antiretroviral therapy
CHLN- Centro Hospitalar Lisboa Norte
Cr – Creatinine
CrCl- Creatinine clearance
Cyst C– Cystatin C
CKD- Chronic kidney disease
CSF- Cefalorraquidian fluid
eCrCl – Estimated creatinine clearance
eGFR- Estimated glomerular filtration rate
ELISA- Enzyme-linked immunosorbent assay
ESKD- End-stage kidney disease

18
FABPs - Fatty acid binding proteins
GFR- Glomerular filtration rate
GN- Glomerulonephritis
HBV- Hepatitis B virus
HCV- Hepatitis C virus
H-FABP- Heart fatty acid binding protein
HIV- Human immunodeficiency virus
HIVICK- Human immunodeficiency virus immune complex-mediated kidney disease
HSM- Hospital Santa Maria
HUS- Haemolytic uremic syndrome
ICU – Intensive Care Unit
IDV- Indinavir
IgA- Immunoglobulin A
IL-8– Interleukin 8
IQR- Inter-quartile range
KIM-1- Kidney injury molecule 1
L-FABP- Liver fatty acid binding protein
MDRD- Modified Diet in Renal Disease
NGAL- Neutrophil gelatinase-associated lipocalin
NNRTI- Non nucleoside reverse transcriptase inhibitor
NRTI- Nucleoside reverse transcriptase inhibitors
NSAID- Nonsteroidal anti-inflammatory drug
PIs- Protease inhibitors
RBCs- Red blood cells

19
RIFLE– Risk, injury, fail, lost, end-stage kidney disease classification
RTV- Ritonavir
SD- Standard deviation
sNGAL- Serum neutrophil gelatinase-associated lipocalin
TDF- Tenofovir disoproxil fumarate
uNGAL- Urinary neutrophil gelatinase-associated lipocalin
UO- Urinary output
w/o - Without

Introduction
Objectives
Material and Methods
Results
Discussion
Concluding remarks
Bibliography
Annexes

21
Introduction
1. Epidemiology of HIV infection
Human immunodeficiency virus (HIV) infection continues to be an important global
epidemic, with an estimate of 2.7 million people newly infected and two million
deceased people due to AIDS related conditions, in the year of 20081.
Figure 1- General perspective of HIV infection in the world (1990-2008).
Number of people living with HIV, number of people newly infected with HIV and
number of AIDS deaths in the world (in Millions), between the years of 1990 and
20081.

22
Nowadays, the number of HIV infected individuals is higher than in any previous
year, as the advent of the combination antiretroviral therapy (cART) had a dramatic
impact on morbidity and mortality. In a similar way, the number of AIDS-related
deaths has declined by over 10% during the last five years1.
Since the introduction of cART in 1996, developed countries are witnessing changes
in morbidity and mortality in HIV-infected patients. Opportunistic infections are being
replaced by kidney, liver and cardiac diseases which are, in developed countries, the
leading causes of death in this population2 (figure 2). According to the American
death certificates, that mentioned HIV infection, in the year 2006, kidney disease
were, in fact, the forth cause of death, only surpassed by pneumonia, liver disease
and sepis2.
It is known that a considerable proportion of all HIV-infected patients develop at least
transient changes in the kidney function, during the course of HIV infection. Studies
have shown that 20-30% of infected individuals have kidney dysfunctions 3,4,
whereas others reported that 15% of these patients develop chronic kidney disease
(CKD) or end-stage kidney disease (ESKD)5. These patients not only have a risk of
HIV-associated kidney disease, but also an increased risk of other diseases, such as
thrombotic microangiopathy, associated to the immune system6,7, associated with
hepatitis virus B or C (HBV/HCV) co-infection8, drug induced nephrotoxicity and
electrolytic changes. Furthermore, as HIV infection is becoming more frequent in
older patient groups, age-associated conditions such as diabetes, hypertension or
metabolic syndrome are now more common. These facts led, in 2005, to the
publication of guidelines, for Chronic Kidney Disease treatment in HIV-infected
patients, by the Infectious Diseases Society of America4.

23
Figure 2- Conditions reported in U.S. death certificates that mentioned HIV
infection, in 2006.
Adapted from: Adih et al. JIAPAC 2010 [ahead of print]
NHL- Non-Hodgkin’s lymphoma; KS- Kaposi sarcoma
Number of patients

24
2. Mechanism of Kidney Function
The volume of urine excreted per day (around 1.5L) is a result of two opposing
processes namely, ultrafiltration and reabsorption. In the first process, 180 L or more
fluid per day is filtered by glomerular capillaries9. The glomeruli filter the blood,
leaving blood cells and large proteins (such as albumin), while other material, such
as water, small proteins and waste products are passed through Bowman’s capsule,
and then into the tubule (figure 3)10.
On the reabsorption process, more than 99% of this ultrafiltrate is sent back to the
bloodstream9. Different parts of the tubules perform different functions in this
process. The proximal convulated tubule processes and reabsorbs the substances
that are still necessary (water, electrolytes, glucose, amino acids and minerals)
passing them back to the bloodstream. At the same time that this occurs, other
substances such as hydrogen ions, ammonia, creatinine and metabolic products of
drugs are secreted from the bloodstream directly to the tubule10. More water is
reabsorbed in the distal tubule, which passes the excess water and waste products
to the collecting tubule, which travels through the ureter and into the bladder10.
The kidney also secretes hormones namely, erythropoietin, renin, and calcitriol.
Erythropoietin stimulates the bone marrow to produce new red blood cells (RBCs).
Renin helps regulate blood pressure, and calcitriol is a form of vitamin D and it is
important in maintaining bones and the level of calcium in the body10.

25
Figure 3- Physiology of a nephron.
Legend: (1)Filtration; (2)Reabsorption; (3) Secretion; (4) Excretion
Adapted from: www.cic-caracas.org/departments/science/Topic12.php
Although the kidney is a resilient organ, kidney disorders can occur and be either
glomerular, causing problems in the filtration process, or tubular, affecting the
reabsorption process, which is often associated with electrolyte imbalances and
problems in concentrating urine10. The loss of kidney function is usually accompanied

26
by a progressive distortion of kidney morphology and architecture. At an advanced
stage of the disease, usually called kidney failure, the kidney loses the capacity to
remove and regulate water and other products and, waste products (causing uremia)
and excess water (causing swelling) start to build up9. The various kidney diseases
are categorized according to whether they are acute and potentially reversible or
chronic and generally irreversible, as well as the site of the damage (either
glomerular or tubulointerstitial).
3. Acute Kidney Injury
Acute kidney failure (AKF) is a generic term for an abrupt and sustained decrease of
kidney function leading to retention of nitrogenous, such as urea and creatinine, and
non-nitrogenous waste products11.
Despite the advances in treatment strategies and comprehension of the
pathogenesis, until recently there was no clear definition of AKF. This definition still
remains subjected to controversy and there is a lack of consensus. In fact, there are
more than 30 definitions in the literature for AKF. The definitions varied from a 25%
increase over baseline serum creatinine to the need for dialysis12.
The term acute kidney injury (AKI) has been recently proposed to replace AKF, since
an acute decline in kidney function is generally secondary to an injury which leads to
functional and structural changes in the kidney13. The term AKI is also intended to
reflect the entire spectrum of AKF.

27
Figure 4 – RIFLE classification scheme.
In the risk, injury, fail, loss and end-stage kidney disease (RIFLE) classification the
criteria (GFR or UO) that lead to the worst possible classification should be used. The
Failure class is present even if the increase in serum creatinine is below threefold, as
long as the serum creatinine is 4.0 mg per 100 ml or above in the setting of an acute
increase of at least 0.5 mg per 100 ml. The shape of the figure indicates that more
patients (high sensitivity) will be included in the upper category, including some without
actually having kidney failure (less specificity). In contrast, at the bottom, the criteria are
strict (high specificity), but some patients will be missed (less sensitivity).
GFR-glomerular filtration rate; UO-urinary output AKF-acute kidney failure; ESKD- End-
stage kidney disease.

28
In order to meet the need of an uniform definition, the Acute Dialysis and Quality
Initiative (ADQI) group published, in 2004, a new classification which includes several
parameters: the risk, injury, failure, loss and end-stage kidney disease (RIFLE)
classification, in which are defined three classes of severity- risk (R), injury (I) and
failure (F) classes - and two outcomes – loss (L) and end-stage kidney disease
(ESKD)14.
The proposed classification of AKI by the RIFLE criteria is shown in figure 4.
Some studies have applied the RIFLE classification to evaluate the occurrence rate
and/or outcome of AKI. More recently, this classification has been applied to evaluate
clinical characteristics and its predictive ability in intensive care unit (ICU) patients,
one of them specifically directed for critically ill HIV-infected patients15-18. Those
studies reported a good discriminative ability and in a Portuguese study, Lopes et al.
reported that the RIFLE criteria represent a helpful tool in the prognosis of ICU HIV-
infected patients18.
In order to further improve the AKI definition, the Acute Kidney Injury Network (AKIN)
was created, proposing a modified version of RIFLE classification, known as AKIN
criteria19. The most important modifications of AKIN criteria include:
a) the removal of the outcome criteria and the severity criteria are designated
as stage 1, 2 and 3;
b) the broadening of the risk category to include an increase in serum
creatinine of at least 0.3 mg/dl, even if it this does not reach the 50%
threshold;
c) the setting of a 48 hour window for the first documentation of any stage;

29
d) the categorization of any patient treated with kidney replacement therapy
as stage 3 regardless of serum creatinine and urine output.
The AKIN criteria were found to improve detection of AKI sensitivity when compared
with the RIFLE classification by Lopes et al .20. On the other hand, a retrospective
study of the Australian and New Zealand Intensive Care Society database did not
reveal any significant difference21.
AKI has been reported in up to 20% of all hospitalized HIV-infected patients22 and
etiologies of AKI in HIV-infected patients are generally similar to what is seen in non-
infected hospitalized patients23.
Acute deterioration into kidney failure can be prerenal (hypoperfusion), renal (intrinsic
to kidney tissue) or postrenal (obstructive) (table 1).
Prerenal azotemia is characterized by increased levels of nitrogen-containing
compounds and in the blood caused by a decrease in blood flow to the kidneys, and
therefore by an insufficient filtering of the blood. This condition is the most common
cause of AKI in HIV-infected patients24,25. This type of hemodynamic kidney failure
includes hypovolumetric states, often as a result of gastrointestinal fluid loss,
associated with profuse vomiting and/or diarrhea. Disordered kidney regulation of salt
and water balance can also contribute to intravascular volume depletion in these
patients. Similarly, central or nephrogenic diabetes insipidus in these patients often
causes unregulated water loss, which leads to dehydration26. Prerenal azotemia can
also result from sepsis which develops from a combination of endotoxin-associated
systemic vasodilatation, arterial hypotension, capillary leakage and kidney arteriolar
vasoconstriction associated with vasopressor drug therapy26.

30
Table 1. HIV-related acute kidney diseases.
Acute Kidney Injury
Prerenal Prerenal azotemia Hypovolemia (diarrhea, vomiting, bleeding,
pancreatitis).
Renal ATN Tubular necrosis (pentamidine, aminoglycosides,
amphotericin B, foscarnet, NSAIDs, contrast
based dyes, HUS, microangiopathies,
rhabdomyolisis, statins).
ATIN Interstitial nephritis (cephalosporin, sulfonamides,
quinolones, phenitoin, beta-lactams, allopurinol,
protease inhibitors, NSAIDs).
Postrenal Crystal-induced
nephropathy
Internal obstruction (crystal deposition, tumour
lysis, blood clots).
Urinary obstruction
External obstruction (tumour, prostate
hyperplasia, urethral obstruction, retroperitoneal
fibrosis, drug-associated calculi).
ATN- Acute tubular necrosis; ATIN- Acute tubulointerstitial nephritis; NSAIDs- nonsteroidal anti-
inflammatory drugs; HUS- haemolytic uremic syndrome.
Acute tubular necrosis (ATN) is the death of tubular cells, when they do not get
enough oxygen (ischemic ATN) or when they have been exposed to a toxic drug or
molecule (nephrotoxic ATN). This can be due to hypovolemia, sepsis, shock and use
of nephrotoxic agents for therapeutic and diagnosis purposes. However, medication-
induced ATN is the most common cause of AKI in hospitalized HIV-infected patients

31
due to the variety of nephrotoxic drugs often required for treatment of opportunistic
and nosocomial infections27. Commonly implicated drugs include: pentamidine,
foscanet, amphotericin B, amynoglycoside antibiotics, non-steroid anti-inflammatory
drugs (NSAIDs). Statin use for hyperlipidemia secondary to cART and concomitant
use of gemfibrozil have also been found to cause rhabdomyolysis26.
Acute tubulointerstitial nephritis (ATIN) is an inflammation of the tubules that affect
the interstitium. ATIN should also be considered as a possible cause of AKI when
certain drugs are prescribed for HIV-infected patients. Common implicated drugs
include: β-Lactam antibiotics, sulfonamides, quinolones, phenitoin, allopurinol,
NSAIDs and indinavir25.
The deposition of insoluble crystals in the kidney can also cause AKI in HIV-infected
patients. Severe AKI due to crystal-induced nephropathy can develop in the
presence of risk factors that increase intra-tubular crystal precipitation. As an
example, patients with AIDS-associated lymphoma which produce excessive
amounts of uric acid during cell death24, that cannot be filtered and secreted by the
kidney, which results in precipitation and deposit of uric acid crystals in the tubular
lumens of the distal nephron causing intrarenal obstruction24. Indinavir, sulfadiazine,
foscarnet and acyclovir have been implicated in crystalluria and intrarenal
obstruction28. Intravascular volume depletion and low urinary flow rates increase the
risk for crystal deposition of these substances, as well as uric acid28.
Abnormal results on urinalysis usually provide the only evidence of crystal-related
kidney injury. Cristalluria, cylindruria, hematuria and proteinuria in varying degrees
can be found on urinalysis24,28.

32
Obstruction of the urinary tract is a rare cause of AKI but gains importance in
HIV-infected patients. Several unusual causes of obstruction have been described in
these patients23,24, which are summarised in table 1. The most common cause of
obstruction in HIV-infected patients is the development of drug-induced calculi. This
has been noted with the antibiotic sulfadiazine and the protease inhibitor indinavir.
Symptomatic nephrolithiasis, characterized by classic renal colic with hematuria and
dysuria can also occur28.
Opportunistic infections and septicaemia are becoming less common causes of
kidney injury in cART-treated patients. In opposition, drug toxicity is becoming an
increasing cause of both AKI and chronic kidney disease in HIV-infected patients.
4. Chronic Kidney Disease
Chronic Kidney Disease (CKD) is a syndrome which results from progressive and
irreversible destruction of the nephrons, regardless of the cause. It is defined by the
maintenance of kidney injury or reduced kidney function for three months or longer
(table 2). Proof of chronicity can be also provided by the demonstration of bilateral
reduction of kidney size by diagnostic imaging techniques9. Other findings consist
with long standing kidney disease, such as osteodystrophy, signs of uremia, anemia,
hyperphosphatemia or hipercalcemia, however these are not specific. In contrast, the
finding of broad casts in urinary sediments is specific for CKD. The wide diameter of
33
these casts reflects the compensatory function and hypertrophy of surviving
nephrons9.
Recently, in a study with 1,239 HIV-infected patients, the CKD prevalence was
15.5% 29 and in another study it was reported that HIV-infected patients account for
1-2% of all the end-stage kidney failure population30.
In Portugal, the annual incidence of HIV-infected patients on dialysis grew from 0.5%,
in 1997, to 0.9% in 2002. Approximately 75% of these patients were receiving
treatment in the Lisbon metropolitan area31.
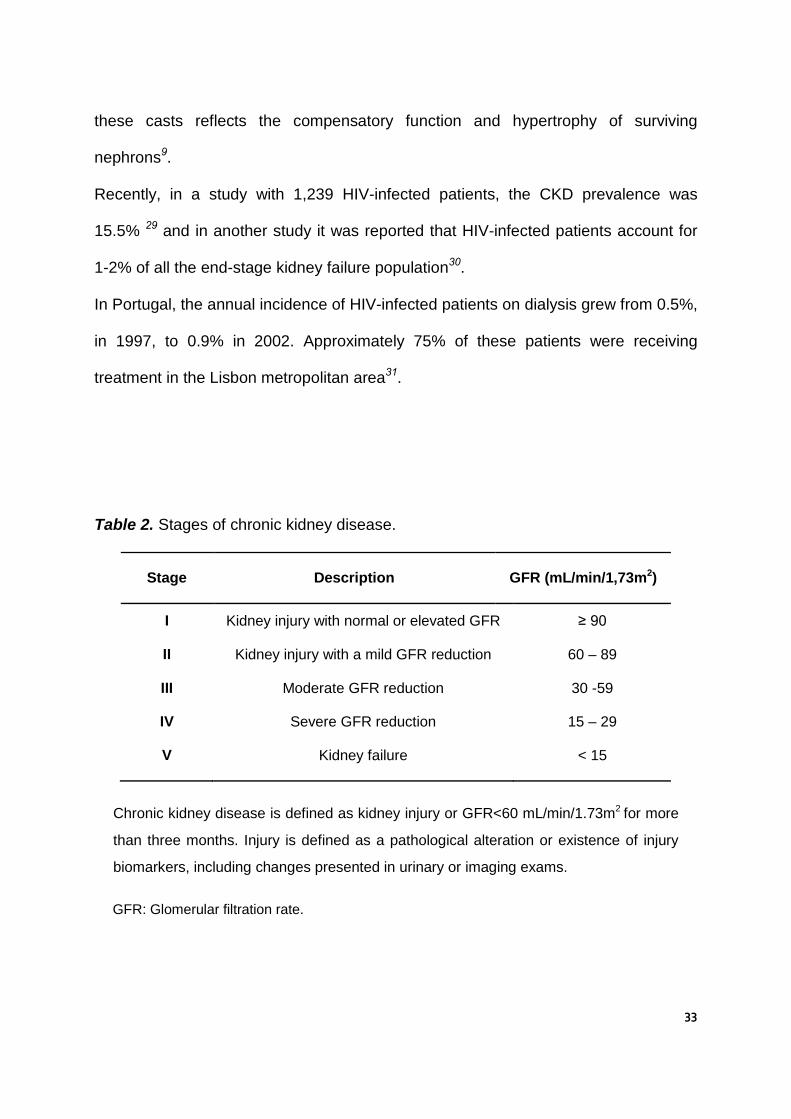
Table 2. Stages of chronic kidney disease.
Stage Description GFR (mL/min/1,73m2)
I Kidney injury with normal or elevated GFR ≥ 90
II Kidney injury with a mild GFR reduction 60 – 89
III Moderate GFR reduction 30 -59
IV Severe GFR reduction 15 – 29
V Kidney failure < 15
Chronic kidney disease is defined as kidney injury or GFR<60 mL/min/1.73m2 for more
than three months. Injury is defined as a pathological alteration or existence of injury
biomarkers, including changes presented in urinary or imaging exams.
GFR: Glomerular filtration rate.

34
In cases of CKD in HIV-infected patients, it is important to consider not only infection-
associated etiologies, but also factors or comorbidity conditions which are frequent in
the general population, such as diabetes mellitus or hypertension. In this group of
patients, the most frequent cause of CKD is HIV-associated nephropathy (HIVAN).
HIVAN was first reported in 1984 by Rao et al.32. This author described a focal and
segmental glomerulosclerosis in nine patients with AIDS and nephritic syndrome.
Before the cART era, the usual presentation of HIVAN was the onset of
asymptomatic proteinuria, followed by a rapid decrease of kidney function and, in a
matter of months, end-stage kidney failure33. It is considered that HIVAN
pathogenesis involves a direct citotoxic effect, caused by the HIV infection and also
by viral gene expression in kidney cells. It seems that a host genetic predisposition
for occurrence of HIVAN might also be present34. Several studies have shown that
HIVAN is predominant and more severe in black individuals. Nowadays in the USA,
HIVAN corresponds to the third cause of CKD in the adult black population that
initiates dialysis 35.
Non-HIVAN causes of CKD in these patients include: thrombotic microangiopathy,
HIV immune complex-mediated kidney disease (HIVICK), diabetic nephropathy and
hypertensive nephropathy (table 3).Thrombotic microangiopathy can occur due to an
endothelial cell dysfunction, partially mediated by viral proteins36,37. This disease is
characterized by five findings with variable expression: fever, neurologic dysfunction,
thrombocytopenia, microangiopathic hemolytic anemia and kidney failure with
hematuria. Presence of a high level of proteinuria is not frequent, which helps in the
differential diagnosis with HIVAN38, 39.

35
Table 3. Causes and characteristics of CKD in HIV-infected patients.
Condition Characteristics
HIV-associated Nephropathy (HIVAN) Severe proteinuria, large echogenic kidneys, absent of edema, urinalysis often bland.
HIV immune complex disease (HIVICK) Identical clinical presentation as HIVAN – varying degrees of kidney dysfunction.
Immune complex mediated glomerulonephritis
Ig A nephritis Proteinuria, hematuria, mild kidney dysfunction, elevated levels of serum Ig A.
Post-infectious glomerulonephritis Edema, proteinuria, hematuria, hypertension is frequent.
Membranous nephritis Sub-epithelial immune deposits (thickened glomerular capillary walls), proteinuria, nephrotic urine sediment.
Membranoproliferative glomerulonephritis Hematuria with dysmorphic RBCs and casts. Proteinuria (50% of patients have nephrotic proteinuria). Enlarged kidneys and hypercellular.
Mesangial proliferative glomerulonephritis Edema, hematuria, proteinuria, hyperlipidemia. Increase of mesangial cells.
Fibrillary or immunotactoid glomerulonephritis Nephrotic proteinuria, microhematuria, Ig G and C3 glomerular deposits.
Lupus-like nephritis Microhematuria, proteinuria, relatively rapid progression to kidney failure. Large sub-epithelial deposits with a basement membrane reaction.
Interstitial nephritis Proteinuria, hematuria. Kidney biopsy shows mononuclear and often eosinophilic cellular infiltration of the kidney parenchyma.
Thrombotic microangiopathies Schistocytes on a blood smear (fragmented RBCs), thrombocytopenia, lactate dehydrogenase level is extremely elevated.
Minimal change glomerulonephritis Severe proteinuria, oval fat bodies can be observed, edema, hypoalbuminemia, hyperlipidemia, hyponatremia.
Diabetic nephropathy Persistent proteinuria, microalbuminuria.
Hypertensive nephropathy Hyaline arteriolosclerosis in the kidneys. Nephrons with dilated tubules, often hyaline casts in the lumen.
IgA= immunoglobulin A; RBCs= red blood cells

36
HIVICK represents a variety of different presentations namely, glomerulonephritis
lupus-like, proliferative, membranous, fibrillar, imunotactoid or post-infection40-43
(table 3). The pathogenesis of the different forms of HIVICK can have common
etiologic features, including deposits of immune complexes containing HIV-1
antigens, specific cytokine expression profiles, genetic factors, inflammatory
infiltrates, and the development of kidney scarring30.
Immunoglobulin A (IgA) nephropathy is characterized by mostly IgA deposition in the
glomerular mesangium and, in HIV-infected patients, appears to be the result of
immune complexes containing HIV antigens44. It is characterized by proteinuria,
hematuria, and mild kidney impairment and is less severe than HIVAN and some
other variants of HIVICK45. Elevated levels of serum IgA, as well as detectable serum
IgA immune complexes and rheumatoid factor, may be present46.
IgA nephropathy seems to be more frequent in European men, being quite rare in
Africa descendents47, as in the non-infected population48.
Diabetes is one of the leading causes of kidney disease in the general population. In
Europe and USA, the prevalence of stage 3 CKD, among people with diabetes is
26.5%49. The pathogenesis of diabetic nephropathy is complex. Initially
hyperglycaemia, oxidative stress and altered insulin seem to trigger kidney
vasodilatation, leading to an increase of the glomerular filtration around 25-50%
above the normal range10. This causes an increased blood pressure and volume
flowing into the glomeruli, which results in glomerular capillary distension. The
increased tension and inflammation causes changes to the kidney parenchyma,
resulting in glomerular and tubular hypertrophy. This leads to a glomerular capillary
compression, resulting in a decrease of glomerular filtration with microalbuminuria

37
and hypertension10. The progressive increase of cellular damage, including kidney
podocytes apoptosis, leads to a further decrease on glomerular filtration and the
occurrence of severe proteinuria (>3g/day). Without intervention, the patient
eventually progresses to ESKD10.
Hypertension is another leading cause of CKD. High blood pressure leads to an
increase of blood volume that passes though the glomeruli, which creates stress on
the glomerular cells, including mesangial and epithelial cells and podocytes50. This
leads to an overproduction of vasoactive substances that activate the production of
inflammatory cytokines and growth factors, which promote cell damage and fibrosis,
reducing glomerular filtration51. Patients with hypertensive nephropathy usually
present severe proteinuria, edema and uremia, which can lead to death, frequently
from cerebral hemorrhage10.
5. Mechanism of HIV infection of kidney cells
It is still an issue under discussion whether HIV can or cannot directly infect kidney
cells. Although viral replication in kidney cells is probably restricted by the lack of
CD4 and chemokine co-receptors required for viral entry, it was shown that HIV
transfection allows kidney epithelial cells to produce viral particles52-54.
The mechanism through which HIV-1 enters kidney cells remains unclear. One
possibility is viral transcytosis through lymphocytes to kidney epithelial cells55.

38
Another possibility is CCR5 transfer by microparticles released from peripheral blood
mononuclear cells56.
The potential role of dendritic cells also needs to be considered. Dendritic cells are
involved in binding, dissemination and transfer of HIV to lymphoid and non lymphoid
tissues and, for that reason, may also be implicated in HIV infection of kidney cells55.
5. Combination Antiretroviral Therapy
The first treatment for HIV-infection was available in 1987 and consisted in the
nucleoside analog reverse transcriptase inhibitor (NRTI) zidovudine (ZDV, Retrovir®,
first manufactured by GlaxoSmithKline). At the time, most HIV-infected patients were
dying within months after the diagnosis of AIDS, usually after a sequence of multiple
episodes of Pneumocystis jiroveci pneumonia57.
ZDV was initially developed in 1964 as a candidate for cancer chemotherapy, but
was never used before due to its toxicity57. In initial clinical trials, ZDV monotherapy
was shown to decrease mortality, increase CD4+ T cell counts and lead to fewer
opportunistic infections in patients with symptomatic HIV-infection or AIDS58, 59.
Monotherapy limitations were later demonstrated, as studies showed that the
duration of ZDV therapy benefits lasted for just one to two years60, 61. However, given
the prognosis of a patient diagnosed with AIDS at the time, an apparent extension of
a few months of life was regarded as worthwhile. Nevertheless, this opened a
window of opportunities for the development of other antiretroviral drugs, with four

39
additional NRTI drugs licensed for this purpose: didanosine (ddI; Videx®, Bristol-
Myers Squibb), zalcacitabine (ddC; Hivid®, Roche), stavudine (d4T; Zerit®, Bristol-
Myers Squibb) and lamivudine (3TC; Epivir®, GlaxoSmithKline).
Combinations of two NRTI constituted the first cART. Compared to ZDV
monotherapy, ZDV and ddI62,63, ZDV and 3TC62,63 or ZDV and ddC64 showed to be
more effective in the increase of CD4+ count and decrease of viral load.
Two nonnucleoside reverse transcriptase inhibitors (NNRTI) became available
around 1996, which were, delaviridine (Rescriptor®, Pfizer), which was never
available in Portugal, and nevirapine (NVP, Viramune®, Boehringer Ingelheim). With
these new antiretroviral drugs, it was possible to treat HIV-infected patients with three
drugs. Combination of ZDV, ddI and NVP was found to outperform the efficacy of
therapy with two nucleosides65, 66.
Protease inhibitors (PIs), the third class of antiretroviral drugs, were on the market by
199557. The introduction of PIs represented one of the biggest breakthroughs in HIV
therapy. Highly active antiretroviral therapy (a term now being substituted by cART),
that was a combination of a PI and two or three other antiretroviral drugs, help to
transform HIV infection into a manageable chronic disease for the majority of patients
with access to these drugs57.
Nowadays, the situation regarding HIV-infection is completely different from 23 years
ago. Today there are more than 20 antiretroviral drugs available and life expectancy
of HIV-infected patients is measured in decades. Because of that, today the weighing
of antiretroviral drugs’ possible benefits of treatment against risk of drug toxicity is
extremely important.

40
5.1. cART associated kidney disease
Studies have confirmed a kidney function improvement in HIV-infected patient, when
cART is initiated67. However as previously mentioned, other studies have already
associated kidney complications with administration of specific antiretroviral
drugs68-95 (table 4).
Indinavir (IDV) (Crixivan®, Merch) seems to be the only PI with significant urinary
excretion. Nephrolithiasis is known as the most important side effect68 and also
pyuria associated with progressive loss of kidney function69. Ritonavir (RTV)
utilization as IDV booster (IDV/r) elevates the risk of nephrolithiasis70 and of
rhabdomyolysis with possible occurrence of kidney failure71.
Risk factors of IDV-associated kidney injury include: low body weight, IDV
administration in doses equal or greater than 1000mg, administration twice a day, co-
administration with cotrimoxazol72 and HCV or HBV co-infection73.
RTV (Norvir®, Abbot Laboratories) has also been associated with AKI74. Isolated
cases of nephrolithiasis have also been referenced as associated with administration
of saquinavir (Invirase® and Fortovase®, Roche)75 and nelfinavir (Viracept®, ViiV
Healthcare)76. More recently, there was also a published case of AKI associated with
atazanavir (ATV) (Reyataz®, Bristol-Myers Squibb) administration77.
Regarding NRTIs, dosages might have to be adjusted in patients with a GFR inferior
to 60 ml/min/m3, with exception of abacavir that does not need dosage adjustments4.
Tenofovir disoproxil fumarate (TDF) (Viread®, also present in Truvada®, Gilead
sciences, and Atripla®, Bristol-Myers Squibb & Gilead Sciences) shares its molecular
structure with adefovir which utilization is limited by its nephrotoxicity78

41
Table 4. Antiretroviral drug associated kidney injury
Antiretroviral drug Kidney injury Ref.
Nucleoside reverse transcriptase inhibitors
Abacavir Didanosine Lamivudine Stavudine Zalcitabine Zidovudine
AKI (acute interstitial nephritis) in hypersensitivity reaction Fanconi’s syndrome, AKI, lactic acidosis, nephrogenic diabetes insipidus Kidney tubular acidosis and hypophosphataemia Kidney tubular acidosis and hypophosphataemia Not reported Not reported
[88] [89,90]
[91] [91]
Non-nucleoside reverse transcriptase inhibitors
Nevirapine Delavirdine Efavirenz Etravirine
Not reported Not reported AKI (multiorgan hypersensitivity reaction) AKI
[94]
[95]
Nucleotide reverse transcriptase inhibitors
Tenofovir Proximal tubulopathy, nephrogenic diabetis insipidus, AKI [79-83]
Protease inhibitors
Amprenavir Indinavir Lopinavir Darunavir Fosamprenavir Tipranavir Nelfinavir Saquinavir Ritonavir Atazanavir
Not reported Intratubular precipitation, nephrolithiasis, kidney colic, AKI and CKD Not reported AKI, nephrolithiasis (in association with ritonavir) Not reported Not reported Nephrolithiasis AKI (in association with ritonavir) AKI, pancreatorenal syndrome, rhabdomyolysis Nephrolithiasis, AKI (interstitial nephritis)
[70,71]
[96]
[76] [75,93]
[74,92,93] [77]
Fusion inhibitors
Enfuvirtide Membranoproliferative glomerulonephritis in diabetic patients [97]
CCR5 inhibitors
Maraviroc Vicriviroc
Not reported Not reported
Integrase inhibitors
Raltegravir Rhabdomyolysis, mild impairment of a pre-existing kidney insufficiency, severe AKI
[98]
AKI – Acute Kidney Injury; CKD- Chronic kidney disease; Ref- Reference

42
Figure 5 - Proximal tubular cell transport pathway for tenofovir.
Tenofovir is delivered to the basolateral membrane of proximal tubular cells and is
transported into the cell by organic anion transporter-1 (OAT-1). Within the cell,
tenofovir is transported via carrier proteins and is subsequently secreted into the kidney
tubule by the apical efflux transporters multidrug resistance protein-2 (MRP-2) and
MRP-4. Disturbances in this secretory pathway (due to increased OAT-1 activity or
decreased MRP efflux transport activity) may lead to increased tenofovir
concentrations within the cell, which can cause mitochondrial DNA depletion and
dysfunction. Ultimately this can cause proximal tubulopathy (AKI or Fanconi
syndrome).
NaDC- sodium–dicarboxylate symporter; OCT- organic cation transporter; OAT-1-organic anion
transporter-1; MRP-multidrug resistance protein; Pgp- P-glycoprotein; TF- Tenofovir; AKI- acute
kidney injury.
From: Perazella MA. Kidney Int 2010;78:1060-3.

43
Although, initial studies did not show high rates of TDF associated with kidney
failure78 there are already a number of published cases of Fanconi's syndrome post-
TDF administration79-83. This suggests a possibility of specific risk factors in these
patients. On the other hand, in most of these cases, patients were on TDF and RTV,
including lopinavir/r, saquinavir/r, amprenavir/r and ATV/r79-83. In fact,
pharmacokinetics studies demonstrated that an elevation of approximately 32% on
TDF exposure occurs, when co-administrated with lopinavir/r and 37% when co-
administrated with ATV/r, compared with TDF administration without these PIs83.
The observation that around 93% of TDF-associated kidney impairment occurred in
individuals on PIs, have led to the idea that RTV mediated inhibition of the multidrug
resistance protein 2 (MRP-2) transporter, which mediates TDF excretion into urine in
the proximal tubule84, may lead to intracellular accumulation of this antiretroviral drug
(figure 5). For that reason, the higher TDF concentrations could cause proximal
tubule necrosis.
Finally, one must not forget that antiretroviral drugs, besides having a direct toxicity,
have been also associated with several metabolic complications that might lead to
CKD, including insulin resistance, dislipidemia and hypertension85-87.

44
6. Kidney function assessment: traditional methods versus new
biomarkers
Accurate measurement of GFR is costly and time-consuming. Therefore, clinical
routine monitoring of kidney function is based on urinalysis, proteinuria and/or
albuminuria determination and, most importantly, it is based on serum creatinine (Cr)
determination.
Cr is a by-product from the creatinine phosphate break-down of the muscle
catabolism and usually is produced at a relatively constant rate. Because there is
almost no tubular reabsortion of Cr, if the kidney filtration is affected, Cr blood levels
rise. The normal serum Cr level varies with the technique used to measure it. For an
adult, the normal range is between 0.6 to 1.2 mg/dl (53 to 106 μmol/L) by the kinetic
or enzymatic method and 0.8 to 1.5 mg/dl (70 to 133 μmol/L) by the Jaffé reaction99.
Cr is considered a reliable biomarker of kidney function. However its levels are
influenced by age, gender, diet type, low body mass, and the presence of hepatic
disease100-104.
To overcome some of these limitations, Cr levels are included in formulas that take
into account other factors such as, age and/or weight, in order to obtain an estimated
GFR (eGFR) or estimated creatinine clearance (eCrCl).
The two more commonly used formulae are the Cockcroft-Gault and the simplified
MDRD (Modified Diet in Renal Disease) equations.

45
Nevertheless, these formulas are still not validated for HIV-infected patients. As the
constant or slow production of Cr makes its rise too small and delayed for early
detection of a kidney insult, these formulas also have serum Cr limitations. In
addition, serum Cr concentration can remain relatively stable until approximately 50%
of kidney function has already been lost105,106. In these cases, kidney function
changes can be missed if only based on Cr levels.
Therefore, there remains the need for a reliable biomarker of kidney function that
allows the detection of mild kidney dysfunction, in order to enable the timely
diagnosis and intervention in the early stages of a kidney injury.
6.1 Cystatin C
Cystatin C (Cyst C) is a non-glicosilated protein, composed by a single amino acid
chain, with a molecular weight of 13.3 kDa (figure 6).
This protein is synthesized in the lisossomes of all nucleated cells107,108.

46
Cyst C functions like a cysteine protease inhibitor and is present in several biologic
fluids, such as serum or cerebrospinal fluid (CSF).
Cyst C is not secreted into the tubules and it is not reabsorbed back into the serum.
Consequently, Cyst C concentration is almost completely dependent of GFR107, 108
Studies have demonstrated that Cyst C has a strong negative correlation with
GFR109, 110 and seems to be an earlier87, 111 and superior marker than Cr, for GFR
estimation112, 113. Cyst C also appears to be superior to serum Cr in paediatric114-117,
elderly118 and diabetic patients119-121. On the other hand, the concept of Cyst C being
independent of body mass has become controversial over the last years108, 122 and
there are still no standardized methods for Cyst C measurement, nor validated
formulas for eGFR123-125.
Figure 6- Ribbon diagram of human cystatin C structure.
From: Janowski R et al. Nat Struct Biol 2001,8:316-20

47
Other factors mentioned as affecting Cyst C production are: thyroid dysfunction,
causing a significant decrease in Cyst C levels, as well as high doses of
corticosteroids that elevates Cyst C expression117, 126. Cyst C serum or plasma levels
can be determined by two commercial available, fully automated assays: the particle-
enhanced turbidimetric immunoassay and the particle-enhanced nephelometric
immunoassay.
6.2 Interleukin 18
Interleukin 18 (IL-18) is a pro-inflammatory cytokine, synthesized in the proximal
tubules, as an inactive precursor form of 24 kDa, suffering a later cleavage by
caspase-1 to originate its active form of 19 kDa127-129 (figure 7).
Figure 7 – Ribbon diagram of human Interleukin-18 structure.
From: Kato Z, et al. Nat Struct Biol 2003;10:966-71.

48
This protein is overexpressed in endogenous inflammatory processes, and seems to
have an important role in host defence against several infections130.
Pre-clinical trials have indicated that IL-18 mediates acute tubule necrosis in
mice131, 132 and a posterior study reported an IL-18 sensitivity superior to 99% for AKI
diagnosis133. In another study, it was shown that IL-18 was an earlier marker of AKI
in ICU patients, preceding serum Cr elevation in 1-2 days134. The elevation of IL-18
occurs approximately 12 hours post kidney injury and can be detected by enzyme-
linked immunosorbent assay (ELISA) in urine.
6.3 Kidney injury molecule 1
Kidney Injury molecule 1 (KIM-1) is a 100 kDa transmembranar glycoprotein, with an
immunoglobulin-like domain and a mucin domain on the extracellular fraction (figure
8)135.
Figure 8 – Ribbon diagram of kidney injury molecule 1 structure.
From: Santiago C, et al. Immunity 2007:26,299–310.

49
The basal expression of this protein in the kidney is very low, in both rodents and
humans136,137. Nevertheless, in animal models, KIM-1 is the main induced protein in
the proximal tubule after a kidney injury, and can be detected in urine. Increase of
KIM-1 occurs approximately 12 hours post kidney injury137.
In a recent study performed in mice with different mechanisms of injury in the
proximal tubule, using histopathology as the reference method, a good performance
of KIM-1 in nephrotoxicity identification was reported. Moreover, KIM-1 was the
urinary biomarker with higher sensitivity and specificity from the 21 used in the
study138. In research, KIM-1 is usually detected by ELISA or microbead. However
there are still no commercial methods available.
6.4 Liver fatty acid binding protein
Fatty acid binding proteins (FABPs) are small cytoplasmatic proteins of 15 kDa which
are expressed in all tissues with active metabolism of fatty acids139.
FABPs function as chaperons, facilitating free fatty acid chains transport from the
cytoplasmatic membrane to oxidation sites such as the mitochondria or
peroxissomes139,140.
Two types of FABPs were identified in the human kidney: a liver-type FABP (L-
FABP) (figure 9), expressed in the proximal tubule and a heart-type FABP (H-FABP),
expressed in the distal tubule141, 142.

50
Pre-clinical and clinical trials reported that urinary L-FABP can be a potential
biomarker for several pathologies, such as CKD, IgA nephropathy, contrast
nephropathy and diabetic nephropathy142-145. Besides that, clinical studies
demonstrated that L-FABP has a potential as biomarker for monitoring CKD
progression. In another study from Kamijio et al. L-FABP increase was shown to be
proportional to the kidney function deterioration in non-diabetic patients with CKD146.
A preliminary study from Ferguson et al. suggested L-FABP as an earlier biomarker
of AKI (compared with serum Cr), specifically in the case of aminoglicosides
administration147.
A different study revealed that L-FABP elevation can be detected approximately four
hours after a kidney injury148. Still, there seems to be some controversy around
L-FABP specificity.
Figure 9 – Ribbon diagram of liver fatty acid binding protein structure.
From: Protein Data Bank 2F72

51
6.5 Lipocalin-2 or Neutrophil gelatinase-associated lipocalin
Neutrophil gelatinase-associated lipocalin (NGAL) is a protein from the lipocalin
family with a molecular weight of 25 kDa. It is composed of eight β-strands
assembled in a β-barrel that encloses a calyx. This calyx binds and transports low
molecular weight substances149 (figure 10).
NGAL is expressed by neutrophils and epithelial cells150. Distinct NGAL expression
levels can be found in different tissues, such as uterus, prostate, lungs, salivary
glands, trachea, stomach, colon and kidneys151.
It is known that NGAL binds to siderophores and possibly has an antibacterial
action152-154. It is thought that this protein can also interact with specific cellular
receptors, as the cationic transporter 24p3R, extracellular kinases, hepatocyte
growth factors or the gelatinase B enzyme155-157.
This protein might also mediate kidney development158, 15 9 and act as a cellular
growth factor160-162.
NGAL is one of the most over expressed proteins in the initial stages of AKI. In the
kidney most of this protein is produced in the Loop of Henle and collecting duct163.
Studies have shown that NGAL increase can be detected in plasma, serum or urine,
just two to six hours after the occurrence of kidney injury164 and that this protein
constitutes a sensitive and specific biomarker of AKI164-166. Moreover it was also
demonstrated that it has a predictive ability for AKI167, 168 and CKD severity169-177.
In a large prospective study by Wagener et al .178, it was shown that elevation of
urinary NGAL (uNGAL) was correlated with cardio pulmonary bypass time and aortic-
clamp time, which are indices of hypoperfusion and are risk factors for AKI179-181.

52
a)
b)
Figure 10 - NGAL crystal structure with the bacterial enterochelin
ligand.
Bacterial enterochelin is composed of: a) a triserine lactone and b) three
catecholate groups. These groups, between them, chelate an iron atom or ion.
Enterochelin complex can be buried in the NGAL calyx, between three positively
charged amino acids (R81, K125 and K134, where R is arginine and K is lysine).
Adapted from: Fischbach MA, et al. PNAS 2006;103(44):16502-7

53
Several methods have been used for NGAL measurement. Initial studies used
Western blot assays182, while subsequent studies preferentially used immunoblotting
and ELISA assays. There are automated commercial methods available, for instance
Triage® NGAL (Biosite Incorporated, San Diego, USA) or ARCHITECT® (Abbott
Diagnostics, Amadora, Portugal).
Beside the potential biomarkers mentioned here, there are several others currently in
study. However, further studies are still necessary in this field, especially in the case
of HIV-infected patients, where studies of these new biomarkers performances are
still very limited.
7. Kidney dysfunction frequency in HIV patients of Hospital
Santa Maria
Hospital Santa Maria (HSM), Centro Hospitalar Lisboa Norte (CHLN) is one of the
largest teaching hospitals in the country. It is a 1,300-bed referral tertiary center and
serves a large proportion of the Lisbon population. Clínica Universitária de Doenças
Infecciosas (Director: Professor Doutor Franciso Antunes) has a large HIV outpatient
clinic. Around 3,000 HIV patients are in a regular follow-up, and most are on cART.

54
In a previous study at Clínica Universitária de Doenças Infecciosas, during a 20
month period (between January 2007 and August 2008), it was shown that 6%
(n=757) of 12,022 samples from 2,761 HIV-infected patients had a creatinine level
greater than 1.2 mg/dL (range 1.2-13.5 mg/dL) (unpublished results) (figure 11).
Using the CKD stages guidelines (Guidelines of HIV Medicine Association of the
Infectious Diseases Society of America)4 and eGFR, it was found that 4.1% had
moderate GFR reduction (30-59 mL/min/1.73m2), 0.6% had severe GFR reduction
(GFR 15-29 mL/min/1,73m2) and 0.7% had kidney failure (GFR<15mL/min/1,73m2)
(unpublished results).
Figure 11- Samples distribution per creatinine level.
Results refer to 12,022 samples from 2,761 HIV-infected patients.

55
Early identification of kidney injury is essential to promote initiation/adjustment of
cART, suspension of nephrotoxic drugs and control of co-morbid diseases such as
diabetes and hypertension. Still, to enable this, sensible (early stage detection) and
specific biomarkers of kidney function that can be associated with disease prognosis,
are necessary.
In spite of being influenced by several factors, serum Cr maintains a constant basal
expression, which makes its rise slowly.
Furthermore, CKD can be present with minimal or no change in Cr, due to its basal
reservoir and the raise of Cr tubular secretion. On the other hand, therapeutic
interventions that would allow the prevention or treatment of AKI must be introduced
in an early stage, before the rise of serum Cr can be detected181,182.
Early markers of kidney injury represent the only possibility for an in-time diagnostic
and intervention, allowing kidney protection from further injuries and from other risk
factors associated with HIV infection.
The HSM study mentioned above led us to study the kidney function obtained by
serum Cr in comparison with the one obtained by an apparently promising potential
biomarker, serum Cyst C, in HIV-infected patients attending the Infectious Diseases
Department of HSM, CHLN, and evaluate whether this marker could be a better
alternative than serum Cr for monitoring kidney function in HIV-infected patients
undergoing antiretroviral therapy.

Introduction
Objectives
Material and Methods
Results
Discussion
Concluding remarks
Bibliography

57
Study objectives
I. Cross-sectional observational analysis of kidney function obtained through
serum Cr and serum Cyst C determinations:
a) Analysis of kidney dysfunction associated risk factors for HIV-infected
patients;
b) Determination of kidney dysfunction rate using Cr and eCrCl (patients
on cART and without treatment);
c) Determination of kidney dysfunction rate based on serum Cyst C (same
patient group);
d) Correlations of Cyst C with Cr, eCrCl and associations with risk factors
of kidney injury.
II. Analysis of differences in kidney function between patients undergoing
different antiretroviral regimens (with/without TDF, ATV/r).
a) Comparison of serum Cyst C, serum Cr and eCrCl levels between
patients on cART with TDF, ATV/r and patients on cART that never
were on these antiretroviral drugs.

Introduction
Objectives
Material and Methods
Results
Discussion
Concluding remarks
Bibliography

59
Material and Methods
Study settings
Cross-sectional study with HIV-infected patients who currently attend the HIV
outpatient clinic, HSM, CHLN.
Inclusion criteria were: (a) HIV-1 infected patients; (b) age over 18 years; (c) capable
of having an informed consent.
Exclusion criteria were: (a) HIV-infected patients with known kidney disease;
(b) HIV-2 infection.
This study was approved by the Hospital’s Ethics Committee and Administration
board.
Sample size
The sample size (N) was calculated using the following equation:
N ≥ [Z 2*[P (1-P)/ (D2)], in which
Z-area under a normal curve corresponding to the desired confidence level (Z0.95);
P-expected frequency of an event in the population
D-maximum difference between the sample mean and the population mean

60
Assuming a kidney dysfunction frequency (CrCl<60 mL/min) of 5.4% in this
population (frequency obtained from the previously mentioned HSM study), the
inclusion of at least 218 patients as the sample size, will allow both the determination
of kidney dysfunction frequency and associated risk factors with a confidence level of
95% (α= 0.05) and a precision of ± 3%.
The sampling method used in this study was the method of convenience sampling.
Study population
Information on age, gender, ethnicity, country of birth medical history and tobacco
and alcohol use was retrieved.
Data on risk factors for HIV, duration and history of antiretroviral therapy were also
assessed. The length of HIV infection was considered as the time since the first
positive diagnosis.
CD4+ T cell nadir, current CD4+ T cell count and HIV RNA levels were also
assessed.
HBV co-infection was considered positive when the presence of the hepatitis B
surface antigen (HBsAg) was confirmed.
HCV co-infection was considered positive for RNA levels equal or higher than
43 IU/mL (COBAS® Ampliprep/TaqMan® HCV Test, Roche Diagnostics, Amadora,
Portugal).
Measurements of alanine transaminase (ALT) and aspartate transaminase (AST)
were collected in patients with HCV co-infection.

61
Height, weight, blood pressure and fasting glucose measurements were also
collected.
Hypertension was defined as systolic blood pressure higher than 140 mmHg, and/or
diastolic blood pressure greater than 90mmHg and/or use of antihypertensive
medication.
Diabetes was defined as fasting glucose levels equal to or higher than 126 mg/dL
and/or use of antidiabetic medication.
Kidney function markers measurements
Serum Cr level was determined using a modified Jaffé method (ADVIA® 2400
Chemistry System, Siemens, Portugal).
CrCl was estimated by the Cockroft-Gault equation:
eCrCl (mL/min) = [140 - age (years)] x weight (kg) x [0.85 if female]
/ 72 x serum Cr (mg/dL)
Increased Cr level was defined as a measurement greater than 1.2 mg/dL.
Serum Cyst C was determined with a particle-enhanced immunonephelomeric assay
(N Latex Cystatin C, Dade Behring, Portugal), according to the manufacturer.
Increased Cyst C was defined as levels greater than 0.96 mg/L.

62
Statistical analysis
Statistical analysis was performed using the software SPSS version 17.0 (SPSS Inc.,
Chicago, IL, USA).
Continuous data were summarized as mean (±SD, standard deviation) and median
(IQR, inter-quartile range) for parametric and non-parametric data respectively, while
categorical data were represented as proportions. Spearman’s and Pearson
correlation coefficients were used to evaluate associations between non-parametric
and parametric variables.
Pearson’s Chi Square (χ2) and Fisher’s exact test were used to compare categorical
data, while Student’s t-test and Mann-Whitney U test were used to analyse
parametric and non-parametric data respectively.
A multiple linear regression was also performed using age, gender, ethnicity, BMI as
predictor variables and log transformed cystatin C as the dependent variable.
Differences, associations and regression coefficients between variables were
considered significant for a p-value lower than 0.05.

Introduction
Objectives
Material and Methods
Results
Discussion
Concluding remarks
Bibliography
Annexes

64
Results
Demographic and laboratory description of the sample population
After the application of inclusion and exclusion criteria, 242 HIV-1 infected patients
were enrolled in this study (table 5). Most of them were Portuguese (85%; n=205)
and around a seventh of the patients (15%; n=37) were born in foreign countries,
mainly Portuguese speaking countries (Angola, Cape Verde, Mozambique, Brazil,
Guinea-Bissau), as well as in the United Kingdom, Switzerland and Zaire.
HIV infection was acquired, in most cases, by the sexual route (n=189), followed by
intravenous drug use (n=52), and blood transfusion (n=1).
Seventy percent of patients were male (n=169), and 90% were Caucasian (n=218).
The median age of the participants was 45 years old (range: 22-83 years; IQR=14).
BMI was 24 Kg/m2 (median; range: 16-33 Kg/m2; IQR=5.9). Hypertension was
present in 58 patients (24%) and diabetes in 27 patients (11%). Forty nine percent of
the patients (n=119) were current smokers and 7% (n=17) had a documented history
of alcohol abuse (table 5).
Overall, patients were infected for a median of 14 years (range 1-25 years, IQR=7).
Median CD4+ T cell nadir was 216/mm3 (IQR=267), median CD4+ T cell count, at the
time of the study, was 686/mm3 (IQR=509). From the patients on cART, most had
viral-RNA levels lower than 40 copies/mL (95%; n=214).

65
Table 5. Demographic and laboratory data of the study population (n=242)
Parameter
Gender (n, %)
Male
Female
169 (70%)
73 (30%)
Age (years) 45 (14)
Ethnicity (n, %)
Caucasian
Black
218 (90%)
24 (10%)
BMI (Kg/m2) 24 (6)
Hypertension (n, %) 58 (24%)
Diabetes (n, %) 27 (11%)
Current smoking (n, %) 119 (49%)
Alcohol abuse (n, %) 17 (7%)
Years of infection 14 (7)
Years on cART 12 (6)
On cART (n, %) 225 (93%)
HIV RNA>40copies/mL (n, %)
Treatment failure
Treatment naïve
Treatment interruption
28 (12%)
11 (5%)
7 (3%)
10 (4%)
CD4+ nadir (cell/mm3) 216 (267)
CD4+ count (cell/mm3) 686 (509)
HBV co-infection (n, %) 5 (2%)
HCV co-infection (n, %) 63 (26%)
Data are presented as mean (standard deviation) and median (inter-quartile range)
for parametric and non-parametric data and proportions (n, %) for categorical
variables. BMI- body mass index; HBV- hepatitis B virus; HCV- hepatitis C virus; Cr-
creatinine; eCrCl- estimated creatinine clearance; Cyst C- cystatin C

66
Most patients were on antiretroviral treatment (n=225, 93%), of which 5% (n=11) had
documented treatment failure. From those patients that were not on cART, seven
(3%) were treatment naïve patients and 10 (4%) had interrupted treatment (due to
patients’ own decision, a case of lupus and a case of lipodystrophy).
Among patients on antiretroviral treatment, the median duration of cART was 12
years (range: 5 months-24 years; IQR=6).
Table 6. Current cART regimens on 225 HIV-infected patients.
NRTI N(t)RTI (TDF) NNRTI PI/r
II (RAL)
N (%)
X X 65 (29%)
X X X 61 (27%)
X X 36 (16%)
X X X 55 (24%)
X X X 2 (1%)
X X X 2 (1%)
X X X 4 (2%)
NRTI- nucleoside reverse transcriptase inhibitors; N(t)RTI- nucleotide reverse transcriptase inhibitor;
NNRTI- non-nucleoside reverse transcriptase inhibitor; TDF-tenofovir disoproxil fumarate; ATV-
atazanavir; PI/r- ritonavir boosted protease inhibitor; II- integrase inhibitor; RAL- raltegravir.

67
Regarding current cART regimens on the 225 patients studied, it was possible to see
that several antiretroviral combinations were used (table 6). Most patients were on a
combination that included two NRTI and one NNRT (n=126). In almost half of those
(61/126) TDF was part of the combination. On the group of patients that were on a
combination that included PIs (n=99), 52 were on ATV/r. Among the ones that were
on TDF, 34 were also on ATV/r.
Regarding HCV and HBV co-infections, 26% (n=63) patients had detectable HCV
RNA levels and 2% (n=5) had a positive HBsAg determination. Also, one patient was
co-infected with both HCV and HBV. Among patients with HCV co-infection, the HIV
infection was acquired through sharing of drug injection materials in most of them
(89%; n=56).
Kidney function determination based on serum Cr and Cyst C
Overall, serum Cr level (median) was 0.84 mg/dL (range: 0.3-1.7 mg/dL; IQR=0.29),
mean CrCl, estimated by Cockroft-Gault equation, was 102.5 mL/min (mean, ±30.04)
and, for serum Cyst C levels, the median was 0.72 mg/L (range: 0.43-1.42 mg/L;
IQR=0.18).
These biomarkers were also compared between patients on antiretroviral therapy
(with or without TDF and ATV/r) and naïve patients (table 7). Regarding patients
without cART, median serum Cr was 0.84 mg/dL (IQR=0.17), mean eCrCl was 100.5
mL/min (SD ±34) and median serum Cyst C was 0.71mg/L (IQR=0.26). Among
patients on cART, median serum Cr was 0.85 mg/dL (IQR=0.28), mean eCrCl was
102.7 mL/min (SD ±19) and mean serum Cyst C was 0.72 mg/L (IQR=0.18).

68
Concerning patients on TDF and ATV/r, simultaneously, only Cyst C levels appeared
to be higher for cART with ATV/r and TDF+ATV/r when compared to the overall
group of patients on cART (table 7).
Table 7. Kidney function according to the type of antiretroviral therapy.
Biomarker All patients On cART On TDF On ATV/r On
TDF+ATV/r Not on cART
Cr 0.84(0.29) 0.85(0.28) 0.85(0.22) 0.90(0.25) 0.89(0.25) 0.84(0.17)
eCrCl 102.5(±30) 102.7(±19) 102.9(±29) 102(±18) 95.1(±34) 100.5(±34)
Cyst C 0.72(0.18) 0.72(0.19) 0.73 (0.16) 0.85(0.20) 0.82(0.23) 0.71(0.26)
Data are presented as mean (standard deviation) and median (inter-quartile range) for parametric and
non-parametric variables. Cr-creatinine (mg/mL); eCrCl-estimated creatinine clearance (mL/min); Cyst
C-cystatin C (mg/L); cART-combination antiretroviral therapy; TDF-tenofovir disoproxil fumarate;
ATV/r-ritonavir boosted atazanavir.
Table 8. Kidney function according to the duration of HIV infection.
Biomarker <5 years 5-10 years 11-15 years 16-20 years >20 years
Cr 0.85(0.23) 0.87(0.21) 0.86(0.20) 0.86(0.18) 0.88(0.21)
eCrCl 117(±42) 103(±34) 104(±31) 99(±23) 100(±31)
Cyst C 0.72(0.17) 0.75(0.16) 0.72(0.20) 0.75(0.21) 0.81(0.15)
Data are presented as mean (standard deviation) and median (inter-quartile range) for
parametric and non-parametric variables. Cr-creatinine (mg/mL); eCrCl-estimated creatinine
clearance (mL/min); Cyst C-cystatin C (mg/L).

69
When biomarker levels where analyzed, according to the number of years of HIV
infection, a statistically significant difference between the groups was not found
(p>0.05) (table 8). When analysis was performed according to the number of years
on cART, although it was also not found a statistically significant difference between
serum Cr and eCrCl levels and years on cART (p>0.05), when a comparison was
done based on serum Cyst, it was found that patients who were on cART for less
than five years had lower levels of Cyst C, comparing to the patients that were on
cART for five years or even for longer periods of time (p<0.05) (table 9).
Table 9. Kidney function according to the number of years on cART.
Biomarker <5 years 5-10 years 11-15 years >16 years
Cr 0.85(0.25) 0.85(0.19) 0.85(0.3) 0.90(0.22)
eCrCl 111(±31) 101(±39) 102(±29) 95(±26)
Cyst C 0.69(0.14) 0.72(0.16) 0.73(0.14) 0.77(0.24)
Data are presented as mean (standard deviation) and median (inter-quartile
range) for parametric and non-parametric variables. Cr-creatinine (mg/mL);
eCrCl-estimated creatinine clearance (mL/min); Cyst C-cystatin C (mg/L).
Biomarker levels were also analyzed according to the CD4+ T cell nadir (table 10).
Using the same three biomarkers, as before, patients with a CD4+ nadir count lower
than 200 cells/mm3 showed a slightly lower kidney function compared to patients that
present a CD4+ nadir count higher than 200 cell/mm3. However, differences found
did not reach a significant level (p>0.05).

70
Table 10. Kidney function according to CD4+ T cell nadir.
Biomarker >50 cell/mm3
51-200 cell/mm3
201-300 cell/mm3
301-400 cell/mm3
>401 cell/mm3
Cr 0.87(0.27) 0.87(0.2) 0.85(0.29) 0.84(0.11) 0.8(0.25)
eCrCl 97(±29) 102(±34) 104(29) 103(±28) 109(±28)
Cyst C 0.76(0.25) 0.74(0.31) 0.71(0.17) 0.7(0.16) 0.7(0.18)
Data are presented as mean (standard deviation) and median (inter-quartile range) for
parametric and non-parametric variables. Cr-creatinine (mg/mL); eCrCl-estimated
creatinine clearance (mL/min); Cyst C-cystatin C (mg/L).
Overall, ccorrelations between HIV RNA level and serum Cr was ρ=0.082, with eCrCl
was r2=0.22 and with serum Cyst C level was ρ= 0.085 (p>0.05). Concerning CD4+ T
cell count, the correlation with serum Cr was ρ=-0.021, with eCrCl was r2=0.101 and
with serum Cyst C was ρ=-0.106 (p>0.05).
Evaluation of Cyst C and associations with risk factors for kidney injury
In order to study the correlation among the overall results of serum Cyst C levels with
serum Cr and eCrCl determinations, a Spearmen’s rank correlation coefficient was
applied. It showed a positive correlation of serum Cyst C and serum Cr as well as
estimated CrCl (p<0.01) (figure 12).

71
Figure 12 – Correlation between Cr, Cyst C and estimated CrCl.
Overall Cyst C levels were plotted against Cr and estimated CrCl for each patient. CrCl was
estimated using the Cockcroft-Gault equation. Correlations were assessed with Spearman’s rank
correlation coefficient. Correlations were considered significant for a p< 0.01.
Cr- creatinine; Cyst C- cystatin C; CrCl- creatinine clearance.
To evaluate the variance of serum Cyst C with age, gender, ethnicity and BMI a
multiple linear regression with log transformed Cyst C as the dependent variable was
performed (table 11). The variance obtained was low (r2=0.079) and did not reach a
significant proportion (p>0.05). In comparison, for the same parameters, the variance
with serum Cr (r2=0.523) and with eCrCl (r2=0.178) as the dependent variable, was
higher and reached a significant proportion (p<0.05).
Associations among biomarkers and risk factor for kidney injury were also tested.
Associations between increased Cyst C levels (greater than 0.96 mg/L) with
hypertension, current smoking and HCV co-infection were found to be statistically

72
significant (p<0.05). In opposition, associations between decreased levels of eCrCl,
increased serum Cr (higher than 1.2 mg/mL) and the above mentioned risk factors
did not reach significance (p>0.05).
Table 11. Multiple linear regression model for age, gender, ethnicity and BMI.
Independent
variables
Unstandardized
coefficient
Standardized
coefficient p-value
Constant -0.139 ---- 0.225
Age 0.001 0.111 0.517
Gender -0.042 -0.231 0.349
Ethnicity 0.000 0.002 0.994
BMI 0.001 0.024 0.891
r2 =0.079; p=0.553
Predictor variables are constant, age, gender, ethnicity and BMI and the dependent
variable is Log transformed cystatin C.
BMI = body mass index.
Patients with discordant biomarkers determinations
Using serum Cr determinations, 10 patients (4%) were identified as having kidney
dysfunction (Cr levels were higher than 1.2 mg/mL). From these, five patients were
black, one had hypertension, one had diabetes, four patients were co-infected with
HCV and their ages were between 30-77 years old.

73
Using eCrCl, 12 patients (5%) were identified as having kidney dysfunction (levels
lower than 60 mL/min). When serum Cyst C levels were used, 27 patients (11%)
were identified as having kidney dysfunction (higher than 0.96 mg/L) (table 12).
Seventeen patients that had normal eCrCl showed increased levels of Cyst C. All
these patients were male, six had hypertension, six patients were co-infected with
HCV and 14 patients were current smokers.
Table 12. Results of eCrCl and cystatin C in 242 HIV-infected patients.
Normal eCrCl Reduced eCrCl Total
Normal cystatin C 213 2 215
High cystatin C 17 10 27
Total 230 12 242
Normal cystatin C is defined by serum levels below or equal to 0.96 mg/L and high
cystatin C by serum levels higher than 0.96 mg/L. Normal estimated creatinine
clearance (eCrCl) is defined by levels equal to or higher than 60 mL/min and
reduced eCrCl by levels below 60 mL/min.

74
Table 13. Comparison between two subgroups of patients: within normal range and
elevated cystatin C levels.
Cyst C>0,96 mg/L eCrCl>60 mL/min
n=17
Cyst C≤0,96 mg/dL eCrCl>60 mL/min
n=27
p-value
Age
Male gender
Years of infection
47±9.9
17
15.47±3.35
47.8±5.9
27
16.23±3.88 p>0.05
CD4+ T cell count (cells/mm3) 762.88±432.9 919.47±293.47
HIV RNA level (copies/mL) <40 <40
HIV non-related factors
Smoking
Hypertension
Diabetes
14
6
0
21
3
2
p>0.05
Antiretroviral therapy
TDF
ATV/r
TDF+ATV/r
w/o TDF, ATV/r
4
5
3
5
12
4
1
9
p>0.05
HBV co-infection 0 3 p>0.05
HCV co-infection 10 0 p<0.05
Cyst C- cystatin C; eCrCl- estimated creatinine clearance; TDF- tenofovir disoproxil
fumarate; ATV/r- atazanavir boosted with ritonavir; ART- antiretroviral therapy; HCV-
hepatitis C virus; w/o- without.

75
Regarding cART on this group (table 12), four patients were on TDF (range 2-5 years
of TDF), five patients were on ritonavir boosted atazanavir (ATV/r) (range 1-5 years
of ATV/r) and three patients were on cART with both TDF and ATV/r (5 years).
The above mentioned results were further analysed and compared to a matched
control group of 27 patients, who had normal Cyst C levels. These two groups were
not statistically different in terms of age, time of infection, viral load, or CD4+ T cell
count (table 13).
Of note, while ten patients with high Cyst C levels had HCV co-infection, none of
the patients in the matched control group did.
Figure 13- Box-plot of cystatin C levels in patients with HIV/HCV co-
infection, according with the levels of ALT.
ALT levels were considered normal when inferior or equal to 38 IU/L (n=21). The
remaining groups correspond to moderate ALT increase (n=31) and an increase
over three times the normal upper limit (n=11). ** p-value <0.05; ALT – Alanin transaminase
** **

76
To test if there was an association between high levels of Cyst C and increased
levels of alanin transaminase (ALT) and aspartate transaminase (AST), a
Mann-Whitney U test was performed with Cyst C and different levels (within normal
range, slightly elevated, and more than threefold the normal range) of ALT and AST,
in the patient group co-infected with HIV/HCV (figure 13). It was not found a
statistically significant association between increased levels of AST and high level of
Cyst C. On the other way, it was found a statistically significant association between
increased levels ALT and higher levels of Cyst C compared with the group with
ALT≤ 38 (p<0.05).
Analysis of kidney function in patients with different antiretroviral regimens
A possible association between high levels of Cyst C, Cr and decreased eCrCl and
patients currently on cART with TDF and/or ATV was also studied. Patients currently
on TDF, ATV or both drugs were compared to patients who were also on cART but
were never on these two antiretroviral drugs.
Statistically significant (p<0.05) associations were found between high levels of Cyst
C and cART with ATV/r, as well as cART with TDF and ATV/r (figure 14). However,
no statistically significant association was found between these antiretroviral drugs
and Cr or eCrCl levels.

77
Figure 14- Box-plot of Cyst C and eCrCl levels per cART group.
w/o TDF/ATV- without tenofovir and atazanavir (n=67); TDF- with tenofovir (n=92); ATV/r- with
atazanavir boosted with ritonavir (n=13); TDF+ATV/r- with tenofovir and atazanavir (n=29).Patients
with IDV in the past were excluded. Cyst C-cystatin C; eCrCl-estimated creatinine clearance; cART-
combination antiretroviral therapy.***p<0.05 (group w/o TDF/ATV has reference); •-outliers.
*** ***

78
Figure 16- Cr, eCrCl and Cyst C determinations per year on cART.
The dots represent individual measurements and the lines represent the mean value of those
measurement. The color blue represents patients on tenofovir, red patients on atazanavir and
green patients on both antiretroviral drugs. Patients with indinavir in the past were excluded from
the analysis. Cr-creatinine; eCrCl-estimated creatinine clearance; Cyst C-cystatin C

79
Finally, it was studied the kidney function levels of patients on cART with TDF, ATV/r
and both antiretroviral drugs (figure 15). Using Cr measurements, patients on ATV/r
appear to have higher levels in the first two years on this drug. For patients on TDF,
mean Cr levels seemed to remain constant, while for patients on TDF and ATV/r, Cr
levels appeared to be higher after the first year on these drugs (figure 16). Estimated
CrCl measurements gave similar results to Cr, with a difference on the group of
patients on TDF that appeared to have lower mean levels after five years on this
antiretroviral drug. Regarding Cyst C measurements, for patients on TDF, it
appeared to demonstrate a constant mild increase over the years. For patients on
ATV/r, Cyst C levels where higher in the first two years on this drug and also in those
who where on ATV/r for five or six years. Concerning the patients on TDF and ATV/r,
Cyst C levels demonstrated a variation similar to eCrCl and Cr.

Introduction
Objectives
Material and Methods
Results
Discussion
Concluding remarks
Bibliography
Annexes

81
Discussion
Since the introduction of effective cART, life expectancy of HIV-infected individuals
has increased dramatically183. With that, conditions such as kidney, cardiac and
hepatic diseases gained importance as causes of morbidity and mortality among this
population2.
As HIV-infected patients have a known increased risk of kidney disease when
compared to the general population6-8, a reliable biomarker that enables the detection
of mild kidney dysfunction is essential and much needed. Similarly to what was seen
with the discovery of troponin I, as an earlier biomarker of myocardial injury, in terms
of the impact on in-time decision making and institution of therapy, it is also needed
an earlier biomarker of kidney dysfunction, in order to protect the kidney from further
injury and prevent the evolution to CKD and end-stage kidney disease.
Previous studies seem to indicate that serum Cr levels are influenced by factors such
as body mass, age, gender and ethnicity. The estimation of CrCl or GFR enables the
reduction of this effect. However, it is still influenced by limitations associated with Cr
determination.
In the present study we tested a potentially alternative biomarker, serum Cyst C
against the biomarker most commonly used in clinical practice (serum Cr) in a
population of HIV infected patients, followed-up at an Outpatient Clinic, HSM, CHLN.
Our sample population was mostly composed by Portuguese, Caucasian males of 45
years old (median), and the majority of patients had acquired the infection through
the sexual route (78%) or by intravenous drug use (21%). This sample seem to be
representative of the general Portuguese HIV-positive population since, according

82
with data from the Instituto Nacional de Saúde Dr. Ricardo Jorge, in 2009, 81.4% of
the HIV-infected individuals were male, 83.3% had ages between 20-49 years, and
HIV-infection was acquired mainly by the sexual route (homo- and heterosexual:
72.7%) and intravenous drug use (23.6%)184.
In our study, patients also had a BMI within normal range (normal range: 19-25
Kg/m2; median BMI 24 Kg/m2), approximately half of the patients were smokers and
also 7% had documented history of alcohol abuse. The high rate of smokers was
expected, since it is known that a large fraction of HIV-patients smoke cigarettes185.
Comorbidity conditions that constitute risk factors for kidney disease were present,
such as hypertension and diabetes, in 24% and 11% of patients, respectively.
According to a study from the Portuguese Cardiology Society, the VALSIM study, the
Portuguese hypertension prevalence, for the adult population, was 42.6%186 which is
considerably higher than the levels obtained in our population. This was not expected
since our sample population was older than this population. In addition, a study from
the Portuguese Diabetes Society, the PREVADILAB study, which included 5,167
adults from different regions of the country, showed that 11.7% had diabetes187 which
is in accordance with our results.
Hypertension and diabetes constitute important risk factors for kidney disease,
especially hypertension, since kidney dysfunction can worsening hypertension which,
as a consequence, can lead to further kidney damage. The number of patients with
hypertension on our study was inferior to the general population numbers. This
seems to indicate that this risk factor does not constitute a major cause of kidney
disease on this population.

83
The patients included in our study had a long length of HIV infection (median 14
years) and median CD4+ T cell nadir was 216/mm3. It is known that HIV infection
induces a chronic immune activation and inflammation in patients successfully
treated with cART, possibly due to residual HIV replication below the level of
detection of standard plasma HIV RNA assays188. It also seems to be an association
between inflammation and kidney dysfunction. In a pilot study from Gupta et al .189,
HIV infected patients with proteinuria had higher urinary levels of two inflammatory
cytokines (MCP-1 and RANTES) when compared to HIV infected patients without
proteinuria. With this fact in mind, it was supposed that patients infected for longer
would have higher kidney dysfunction rates. However, this was not found in our
study. It should be noted that this study could have missed an eventual association
since confounding factors are present due to the retrospective characteristics of the
study. On the other hand, the mentioned study from Gupta et a l. did not fully
elucidated if the increase on inflammatory biomarkers reflected systemic or intrarenal
inflammation. In order to truly determine the association of systemic inflammation
and kidney dysfunction it would be necessary to analyze a representative sample of
patients with different lengths of untreated infection, which is extremely difficult.
Nevertheless, the CD4+ T cell nadir can give us some information on this matter,
assuming that a lower nadir represent longer lengths of infection. In our study,
although the three biomarkers seemed to indicate a slightly lower kidney function
with patients with a CD4+ nadir lower than 200/mm3, it was not found a statistically
significance difference between the biomarkers levels, which is in accordance with
the previous analysis with the length of infection. These results seem to indicate that

84
the time of exposure to HIV-infection is not the determinant factor on the occurrence
of kidney dysfunction.
The median CD4+ T cell was 686/mm3 which is above the levels generally
associated with HIV-related opportunistic infections (CD4+ T cell count lower than
500/mm3). Several opportunistic infections, such as, Pneumocystis j irovecii or
Cytomegalovirus infection, as well as therapies for these infections, can cause kidney
dysfunction. However nowadays, with the advent of cART, opportunistic infections do
not constitute an important cause of kidney disease of HIV-infected patients in the
developed World.
All patients that were on cART (n=225), with the exception of 11 patients with
documented treatment failure, had HIV-RNA levels below 40 copies/mL. Since our
patients had a long length of HIV infection, they also had a long duration of cART
(mean 12 years). The most used combination of antiretroviral drugs was two NRTI
and one NNRTI (n=126). This was expected since the two most used combinations
are two NRTI plus either one NRTI or one ritonavir boosted PI. Clinicians often
choose the NNRTI efavirenz instead of a PI/r, since it was demonstrated that this
drug is as effective as the PIs190 and allow the postponement of PI-associated
toxicity.
From the overall regimens, 118 patients were currently on TDF and 53 patients on
ATV/r, of which 34 were on a combination of both drugs. Therefore, these patients
not only have a potential risk associated with a long duration of infection, but also the
risk of nephrotoxicity associated with a long course with some antiretroviral drugs.
Twenty six percent of patients were co-infected with HCV, probably associated with
previous sharing of drug injection material, since among these patients almost 90%

85
acquired HIV-infection by the intravenous drug use route. This percentage is in
accordance with European data which estimates that 20-40% of HIV infected patients
are co-infected by HCV191. Only five patients were co-infected with HBV, mainly due
to the fact that the majority of our sample population was Portuguese, where the
vaccine against HBV is present on the vaccination plan since 1994192.
Concerning the analysis of kidney function through the different strategies,
comparisons were always performed between serum Cr, estimated CrCl and serum
Cyst C determination. It was not found any statistically significant difference in the
biomarkers levels, between patients without treatment and those currently on cART.
However, we only had seven treatment naïve patients and 10 in treatment
interruption in our sample population which limits the statistical analysis. In order to
take conclusions, it would be required a similar number of patients in this group. It
was also not found any significant difference between the biomarker levels and the
duration of infection. While when these levels were analyzed per year on cART,
although it was not found any difference with Cr and eCrCl, with serum Cyst C it was
found that patients who were on cART for less than five year had lower levels of Cyst
C when compared with patients that were on cART for more than five years. These
results seem to indicate that Cyst C may have detected mild kidney function changes
that the other biomarkers did not detect and, if that so, the length of exposure to
antiretroviral drugs may have a more important impact on kidney function than the
years exposed to the HIV-infection.
Correlations between the HIV-infection status (HIV-RNA levels and CD4+ T cell
count) and the three biomarkers was low (between 0.021 and 0.22; ±0.7-1.0 – highly
correlated; ±0.5-0.69- moderately correlated; 0-±0.49- poorly correlated) and did not

86
reach a significant proportion. Although it was already mentioned, in previous
studies, that Cyst C had a correlation with HIV-RNA levels and CD4+ T cell count,
this was not found in our study. However, it should be noted that our patient group
had a long course of antiretroviral therapy, maintaining suppression of viral
replication. In one study from Mauss et al.193, Cyst C levels correlated negatively with
CD4+ T cell count and positively with HIV RNA levels in treatment naïve patients,
while after antiretroviral therapy initiation, serum Cyst C levels decreased. On the
other hand, it is possible that high HIV RNA plasma levels might also correspond to
an increased HIV replication in kidney cells, resulting in local inflammation and injury
with increase of Cyst C levels194,195.
Correlations of serum Cyst C with Cr and eCrCl were performed in order to study the
congruence between determinations. Cyst C was positive correlated with both but
had a higher correlation with eCrCl.
In our study, as in other published studies113, 114 ,196 age, gender, ethnicity and BMI,
had no significant influence on Cyst C levels contrary in what was found with serum
Cr and eCrCl. This fact allows an increase in sensitivity when compared to serum Cr,
especially in patients with low BMI, where eGFR overestimation occurs when
assessed with Cr. In fact, studies have demonstrated that Cockroft-Gault and MDRD-
based GFR estimations can produce different results in patients with low BMI or
during weight changes197. This point raises a special concern in HIV-infected
patients, where the initiation of antiretroviral therapy might be accompanied of weight
gain and therefore, these eGFR alterations may be falsely attributed to new drug
regimens.

87
Kidney dysfunction rates obtained were different, and varied according to the
biomarker used. While using serum Cr, 4% (n=10) of patients were identified as
having kidney dysfunction, when eCrCl was used, 5% (n=24) were identified. These
results are in accordance with the previously mentioned HSM study, where the
kidney dysfunction rate, calculated with eCrCl, was 5.4%. Cyst C was the biomarker
that showed higher rates of kidney dysfunction with twice as much patients (n=27),
then when using eCrCl. Elevated Cyst C levels in normal eGFR settings have been
previously described as preclinical kidney disease and have been associated with an
increased risk of CKD, cardiovascular events and eventually death17, 1 98, 1 99. In the
present study, 7% of patients (n=17) were identified as having preclinical disease,
according to this concept. The majority of these patients (n=11) were in cART with
TDF, ATV/r or both antiretroviral drugs (for at least one year), which have been
occasionally referenced in the literature as causative agents of tubular dysfunction,
Fanconi’s syndrome and acute interstitial nephritis77, 200,201. Furthermore, in a recent
study with a large cohort of 6,843 patients, increasing exposure to both antiretroviral
drugs was associated with a higher incidence of CKD202.
On the other hand, in our study, 14 out of 17 patients were current smokers and the
majority had HCV co-infection (n=10). Moreover, this study showed that elevated
Cyst C levels were associated with current smoking and HCV co-infection besides
hypertension and diabetes. In comparison to the overall sample population, these 17
patients were two years older and had one more year of infection (mean) which is not
statistically significant. However, the smoking (71%) and hypertension (35%) rates
were considerably higher than the overall population rates (49% and 24%
respectively). In the matched control group (n=27), with Cyst C levels within normal

88
range, a major fraction of the patients also had cART with TDF, ATV/r or both.
However, none had HCV co-infection. In addition, a statistically significant
association was also demonstrated between higher levels of Cyst C and ALT in
patients co-infected with HCV.
These facts might indicate that Cyst C could be flagging inflammation rather than
kidney dysfunction.
More than two decades ago, Cyst C had already been referenced as a potent
regulator in inflammatory processes203. Posterior studies have reported increased
Cyst C levels in patients with several conditions such as autoimmune diseases204,
asthma205 and cigarette smoking206. Recently, it has been demonstrated that
elevated Cyst C levels are associated with high concentrations of inflammation
markers such as, C-reactive protein, tumour necrosis factor-α and Interleukin-6206, 207.
HCV infection is associated with persistent liver inflammation that can lead to
progressive fibrosis. In this process, several enzymes including cathepsins (cysteine
proteinases) have been found to be involved208.
As cathepsins’ activity is increased in the fibrotic liver209, Cyst C as a specific inhibitor
of these enzymes should also have increased levels. Actually, two previous studies
showed that serum Cyst C concentrations were significantly higher in patients with
hepatic diseases when compared to the control group. Both studies indicated that
Cyst C may be useful for monitoring progression of liver fibrosis210, 211.
Regarding the analysis of the kidney function of patients under different cART
regimens, although no statistically significant association was found with Cr nor with
eCrCl, elevated Cyst C was associated with cART with ATV/r and TDF+ATV/r. In
addition, for patients on antiretroviral combinations including either ATV/r, TDF or

89
TDF+ATV/r, kidney function changes were analyzed per years on these antiretroviral
drugs. Using the three biomarkers, patients on ATV/r appear to have lower kidney
function in the first two years on this drug, while with TDF, only Cyst C seemed to
demonstrate a mild gradual decrease on kidney function during the years. Therefore,
while with ATV/r kidney dysfunctions may emerge earlier, with TDF the decrease of
kidney function might be gradual and, therefore, be missed by determinations with
serum Cr and eCrCl. However, because this is a cross-sectional study, it cannot fully
evaluate the long-term impact of antiretroviral drugs. More studies are necessary to
assess the true impact of the more recent antiretroviral drugs on kidney function.

90
Introduction
Objectives
Material and Methods
Results
Discussion
Concluding remarks
Bibliography
Annexes

91
Concluding remarks
With the increasing life expectancy of HIV-infected patients and the toxicity to which
they are subjected due to the various drugs, it is well known the increasing
importance of monitoring kidney function in these patients, as AKI and CKD are
becoming commoner. Nevertheless, besides serum Cr determination, there are no
alternative biomarkers to assess early kidney dysfunction, nor there are validated
formulas for GFR estimation in this population.
In the last years, Cyst C has been referenced in several studies as a biomarker that
could replace Cr. However, in the present study, Cyst C levels, although not
influenced by age, gender, BMI and ethnicity, seemed to be influenced by other
factors besides kidney function.
As Cyst C seems to vary with inflammation markers in HIV-infected patients, where a
chronic systemic inflammation is present and often associated with other
inflammation sources, such as HCV co-infection, this biomarker might lead to an
overestimation of kidney impairment. Therefore, caution must be taken when
analysing kidney function using Cyst C levels alone.
In this current time of severe cost restrains, another aspect that deserves our
attention is the fact that serum Cyst C determination is around seven-fold more
expensive than serum Cr determination. Therefore the practical clinical benefits that
justify opting for the use of this tool, also need to be further analysed.
One limitation of this study was not having a reference method for GFR
determination, such as inulin or 51Cr-EDTA. Still, the aim of this study was to

92
compare two non-invasive kidney function biomarkers – the most widely used
method in clinical practice (Cr) and the alternative biomarker Cyst C, in the context of
HIV infection.
Another limitation was the fact that it was a cross-sectional study. Although it allowed
us to recognize some advantages and limitations of Cyst C as an alternative marker
of kidney function, still, to definitively acknowledge the ability of Cyst C to detect mild
kidney dysfunctions, earlier than Cr, it would be necessary to perform a prospective
analysis.
In addition, an initial objective of testing another promising biomarker –NGAL- was
not fulfilled in-time for this dissertation, due to time constrains.
In what concerns the nephrotoxicity associated with cART, an association was found
between increased levels of Cyst C and cART either with ATV/r or with TDF+ATV/r.
In addition, using Cyst C appears that patients on TDF show a mild kidney function
decrease over the years. Even though no statistically significant associations were
found with increased levels of serum Cr nor with decreased eCrCl, or associations
with cART with TDF, we believe that it is extremely important to continue the
development of prospective research projects, in order to assess the real long-time
impact of these antiretroviral drugs on kidney function. Until then, one should take in
consideration the benefits and risks of prescribing these recent antiretroviral drugs, in
comparison with those that are available for several years and that clinicians already
have the knowledge and experience on the possible complications associated with
their long-term use.

93
Unfortunately, it seems that Cyst C does not completely overcome the limitations
associated with serum Cr kidney function determination and does not seem to
constitute the final answer to this problematic.
It seems crucial to continue the research in this field, focusing in particular on the
development of potential novel biomarkers that could enable an earlier detection of a
kidney insult.

Introduction
Objectives
Material and Methods
Results
Discussion
Concluding remarks
Bibliography
Annexes

95
Bibliography
1. World Health Organization. Towards universal access: scaling up priority
HIV/AIDS interventions in the health sector: progress report 2010. WHO
Press, Genebra, Switzerland, 2010.
2. Selik RM, Byers RH Jr, Dworkin MS. Trends in diseases reported on U.S.
death certificates that mentioned HIV infection, 1987-1999. J Acquir Immune
Defic Syndr 2002;29(4):378-87.
3. Seney FD Jr, Burns DK, Silva FG. Acquired immunodeficiency syndrome and
the kidney. Am J Kidney Dies 1990; 16(1):1-13.
4. Gupta SK, Eustace JA, Winston JA, et al . Guidelines for management of
chronic kidney disease in HIV-infected patients: recommendations of the HIV
Medicine Association of the Infectious Diseases Society of America. Clin Infect
Dis 2005;40(11):1559-85.
5. Harris M. Nephrotoxicity associated with antiretroviral therapy in HIV-infected
patients. Expert Opin Drug Saf 2008;7(4):389-400.
6. Boccia RV, Gelmann EP, Baker CC, et al. A hemolytic uremic syndrome with
acquires immunodeficiency syndrome. Ann Intern Med 1984;101(5):716-7.
7. Bachmeyer C, Blanche P, Sereni D, et al. Thrombotic thrombocytopenic
purpura and hemolytic uremic syndrome in HIV-infected patients. AIDS 1995;
9(5):532-3.

96
8. D’Agati V, Appel GB. Renal pathology of human immunodeficiency virus
infection. Semin Nephrol 1998;18(4):406-21.
9. Wilson JD, Braunwald E, Isselbacher KJ, Petersdorf RG, Martin JB, Root RK.
Chapter eight: disorders of the kidney and urinary tract. Harrison’s principles of
internal medicine. McGraw-Hill Inc, United States of America, 1991.
10. Smart T. Kidney disease in people with HIV: a clinical review (part one).
HATIP 2011;171:1-9.
11. Lameire N, Van BW, Vanholder R. Acute Kidney Injury. Lancet 2005;365:417–
30.
12. Kellum JA, Levin N, Bouman C, Lameire N. Developing a consensus
classification system for acute renal failure. Curr Opin Crit Care 2002;
8(6):509-14.
13. Soni SS, Ronco C, Katz N, Cruz DN. Early diagnosis of acute kidney injury:
the promise of novel biomarkers. Blood Purif 2009;28(3):165-74.
14. Bellomo R, Ronco C, Kellum JA. Mehta RL, Palevsky P and the ADQI
workgroup. Acute renal failure – definition, outcome, measures, animal
models, fluid therapy and information technology needs: the second
international consensus conference of the Acute Dialysis Quality Initiative
(ADQI) Group. Crit Care 2004;8(4):R204-12.
15. Bell M, Liljestam E, Granath F, Fryckstedt J, Ekbom A, Martling CR. Optimal
follow-up time after continuous renal replacement therapy in actual renal
failure patients stratified with the RIFLE criteria. Nephrol Dial Transplant
2005;20(2):354-60.

97
16. Abosaif NY, Tolba YA, Heap M, Russell J, El Nahas AM. The outcome of
acute renal failure in the intensive care unit according to RIFLE: model
application, sensitivity, and predictability. Am J Kidney Dis 2005;46(6):1038-
48.
17. Kuitunen A, Vento A, Suojaranta-Ylinen R, Pettila V. Acute renal failure after
cardiac surgery: evaluation of the RIFLE classification. Ann Thorac Surg
2006;81(2):542-6.
18. Lopes JA, Fernandes J, Jorge S, Neves J, Antunes A, Prata MM. An
assessment of the RIFLE criteria for acute renal failure in critically ill patients.
Crit Care 2007;11(1):401-2.
19. Mehta RL, Kellum JA, Shah SV, Molitoris BA, Ronco C, Warnock DG, Levin A,
Acute Kidney Injury Network. Report of an initiative to improve outcomes in
acute kidney injury. Crit Care 2007;11(4):R31.
20. Lopes JA, Fernandes P, Jorge S, et al . Acute kidney injury in intensive care
unit patients: a comparison between the RIFLE and the Acute Kidney Injury
Network classifications. Crit Care 2008;12(4):R110.
21. Bagshaw SM, George C, Bellomo R. A comparison of the RIFLE and AKIN
criteria for acute kidney injury in critically ill patients. Nephrol Dial Transplant
2008;23(5):1569-74.
22. Valeri A, Neusy AJ. Acute and chronic renal failure in hospitalized AIDS
patients. Clin Nephrol 1991;35(3):110-8.
23. Rao TK. Acute renal failure syndromes in human immunodeficiency virus
infection. Semin Nephrol 1998;18(4):378-95.

98
24. Perazella MA, Brown E. Electrolyte and acid-base disorders associated with
AIDS: an etiologic review. J Gen Intern Med 1994;9(4):232-96.
25. Perazella MA. Acute renal failure in HIV-infected patients: a case-based
review. Hospital Physician 2001;4:30-41.
26. Joshi MK, Liu HH. Acute renal rhabdomyolisis and renal failure in HIV-infected
patients: risk factors, presentation, and pathophysiology. AIDS Patient Care
STDS 2000;14(10):541-8.
27. Perazella MA. HIV-associated crystal nephropathy. Res Staff Physician
2000;46:24-34.
28. Daudon M, Estépa L, Viard JP, Joly D, Jungers P. Urinary stones in HIV-1-
positive patients treated with indinavir. Lancet 1997;349(9061):1294-5.
29. Wyatt CM, Winston JA, Malvestutto CD, et al. Chronic kidney disease in HIV
infection: an urban epidemic. AIDS 2007;21(15):2101-3.
30. Weiner NJ, Goodman JW, Kimmel PL. The HIV-associated renal diseases:
current insight into pathogenesis and treatment. Kidney Int 2003;63(5):1618-
31.
31. Lopes JA, Abreu F, de Almeida E, et a l. Demographic and clinical
characteristics of human immunodeficiency virus-infected patients receiving
dialysis in Portugal: a Nationwide Multicentre Survey. Rev Port Nefrol Hipert
2006;20(3):201-8.
32. Rao TK, Filippone EJ, Nicastri AD, Landesman SH, Frank E, Chen CK,
Friedman EA. Associated focal and segmental glomerulosclerosis in the
acquired immunodeficiency syndrome. N Engl J Med 1984;310:669-73.

99
33. Betjes MG, Verhangen DW. Stable improvement of renal function after
initiation of highly active anti-retroviral therapy in patients with HIV-1-
associated nephropathy. Nephrol Dial Transplant 2002;17(10):1836-9.
34. Betjes MG, Weening J, Krediet RT. Diagnosis and treatment of HIV associated
nephropathy. Neth J Med 2001:59(3), 111-117.
35. Monhan M, Tanji N, Klotman PE. HIV-associated nephropathy: an urban
epidemic. Semin Nephrol 2001;21(4):394-402.
36. Kimmel PL. The nephropathies of HIV infection: pathogenesis and treatment.
Curr Opin Nephrol 2000;9(2):117-22.
37. Mitra D, Kim J, MacLow C, Karsan A, Laurence J. Role of caspases 1 and 3
and Bcl-2-related molecules in endothelial cell apoptosis associated with
thrombotic microangiopathies. Am J Hematol 1998;59(4):279-87.
38. Hymes KB, Karpatkin S. Human immunodeficiency virus infection and
thrombotic microangiopathies. Semin Hematol 1997;34:117-25.
39. Lista SF, Alonso SA, Morales OJ, Martul VE. Nephrotic syndrome due to
thrombotic microangiopathy (TMA) as the first manifestation of human
immunodeficiency virus infection: recovery before anti-retroviral therapy
without specific treatment against TMA. Clin Nephrol 2001;55:404-7.
40. Connolly JO, Weston CE, Hendry BM. HIV-associated renal disease in
London hospitals. QJM 1995;88:627-34.
41. Chidambaram M, Stigant CE, Sugar LM, Ramesh Prasad GV. Type I
membranoproliferative glomerulonephritis in an HIV-infected individual without
hepatitis C co-infection. Clin Nephrol 2002;57:154-7.

100
42. Alarcón-Zurita A, Salas A, Antón E, et al. Membranous glomerulonephritis with
nephrotic syndrome in a HIV positive patient – remarkable remission with triple
therapy [Letter]. Nephrol Dial Transplant 2000;15:1097-8.
43. Haas M, Rajaraman S, Ahuja T, Kittaka M, Cavallo T. Fibrillary/immunotactoid
glomerulonephritis in HIV-positive patients: a report of three cases. Nephrol
Dial Transplant 2000;15:1679-83.
44. Bodi I, Abraham AA, Kimmel PL. Macrophages in human immunodeficiency
virus-associated kidney diseases. Am J Kidney Dis. 1994; 24(5):762-767.
45. Kimmel PL, Barisoni L,Kopp JB. Pathogenesis and treatment of HIV-
associated renal diseases: lessons from clinical and animal studies, molecular
pathologic correlations, and genetic investigations. Ann Intern Med. 2003;
139(3):214-26.
46. Katz A, Bargman JM, Miller DC, Guo JW, Ghali VS, Schoeneman MJ. IgA
nephritis in HIV-positive patients: a new HIV-associated nephropathy? Clin
Nephrol. 1992;38(10):61-68.
47. Herget-Rosenthal S, Marggraf G, Hüsing J, et al. Early detection of acute renal
failure by serum cystatin C. Kidney Int 2004; 66:1115–22.
48. Donardio JV, Grande JP. IgA nephropathy. N Engl J Med 2002;347:738-48.
49. National Kidney Foundation. K/DOQI clinical practice guidelines for chronic
kidney disease: evaluation, classification and stratification. Am J Kidney Dis
2002;39:S1-266.

101
50. Johnston CI, Risvanis J, Naitoh M, Tikkanen I. Mechanism of progression of
renal disease: current hemodynamic concepts. J Hypertens Suppl 1998
16(4):S3-7.
51. Lopez-Novoa JM, Rodríguez-Peña AB, Ortiz A, Martínez-Salgado C, López
Hernández FJ. Etiopathology of chronic tubular, glomerular and renovascular
nephropathies: clinical implications. J Transl Med 2011;9:13.
52. Lodge R, Gottinger H, Gabuzda D, Cohen EA, Lemay G. The
intracytoplasmatic domain of gp41 mediates polarized budding of human
immunodeficiency virus type 1 in MDCK cells. J Vir 1994;68(8);4857-61.
53. Lodge R, Lalonde JP, Lemay G, Cohen EA. The membrane-proximal
intracytoplasmatic tyrosine residue of HIV-1 envelope glycoprotein is critical
for basolateral targeting of viral budding in MDCK cells. EMBO J; 1997;
16(4):695-705.
54. Cervantes-Acosta G, Welman M,Freund F, Cohen EA, Lemay G. CD4/CXCR4
co-expression allows productive HIV-1 infection in canine kidney MDCK cells.
Virus Res 2006;120(1-2):138-45.
55. Bomsel M. Transcytosis of infectious human immunodeficiency virus across a
tight human epithelial cell line barrier. Nat Med 1997;3(1):42-7.
56. Wu L, Kewal-Ramani VN. Dendritic-cell interactions with HIV: infection and
viral dissemination. Nat Rev Immunol 2006; 6(11):859-68.
57. Nelson R. AIDS treatment enters its 25th year. Lancet Infect Dis
2006;6(8):466-7 [letter].

102
58. Fischl MA, Richman DD, Hansen N, et al . The safety and efficacy of
zidovudine (AZT) in the treatment of subjects with mildly symptomatic human
immunodeficiency virus 1 (HIV) infection. A double-blind, placebo-controlled
trial. Ann Intern Med 1990;112:727-37.
59. Fischl MA, Richman DD, Grieco MH, et a l. The efficacy of azidothymidine
(AZT) in the treatment of patients with AIDS and AIDS-related complex. A
double-blind, placebo-controlled trial. The AIDS Clinical Trials Group. N Engl J
Med 1986;317;185-91.
60. Hammilton JD, Hartigan PM, Simberkoff MS, et al . A controlled trial of early
versus late treatment with zidovudine in symptomatic human
immunodeficiency virus infection. Results from Veterans Affairs Cooperative
Study. N Engl J Med 1992;326:437-43.
61. Cooper DA, Gatell JM, Kroon S, et al . Zidovoudine in persons with
asymptomatic HIV infection and CD4+ cell counts greater than 400 per cubic
milliliter. The European-Australian Collaborative Group. N Engl J Med
1993;329:297-303.
62. Hammer SM, Katzenstein DA, Hughes MD, et al. A trial comparing nucleoside
monotherapy with combination therapy in HIV-infected adults with CD4 cell
counts from 200 to 500 per cubic milliliter. N Engl J Med 1996;335:1081-90.
63. Delta Coordinating Committee. Delta: a randomized double-blind controlled
trial comparing combinations of zidovudine plus didanosine or zalcitabine with
zidovudine alone in HIV-infected individuals. Lancet 1996;348:283-91.

103
64. Eron JJ, Benoit SL, Jemsek J, et al. Treatment with lamivudine, zidovudine, or
both in HIV-positive patients with 200 to 500 CD4+ cells per cubic millilitre.
North America HIV Working Party. N Engl J Med 1995;333:1662-9.
65. Myers MW, Montaner JG, the INCAS Study Group. A randomized, double-
blind comparative trial of the effects of ZDV, ddI, and nevirapine combinations
in antiretroviral-naive, AIDS-free, HIV-infected patients with CD4 counts 300-
600/mm3 [Abstract Mo.B.294]. In: XI International Conference on AIDS, 1996,
Vancouver, British Columbia.
66. D’Aquila RT, Hughes MD, Johnson VA, et al . Nevirapine, zidovoudine, and
didanosine compared with zidovudine and didanosine in patients with HIV-1
infection. A eandomized, double-.blind, placebo-controlled trial. Ann Intern
Med 1996;124:1019-30.
67. Kirchner JT. Resolution of renal failure after initiation of HAART: 3 cases and a
discussion of the literature. AIDS Read 2002;12(3):103-5.
68. Tashima KT, Horowitz JD, Rosen S, Indinavir nephropathy. N Eng J Med
1997;336:138-9.
69. Dieleman JP, van Rossum AM, Stricker BC, et al. Persistent leukocyturia and
loss of renal function in a prospectively monitored cohort of HIV-infected
patients treated with indinavir. J Acquir Immune Defic Syndr 2003;32(2):135-
42.
70. Casado JL, Moreno A, Sabido R, et al . A clinical study of the comparison of
100 mg ritonavir plus 800mg indinavir as salvage therapy: Influence of

104
increased plasma drug levels in the rate of response. HIV Clin Trials
2000;1:13-9.
71. Benveniste O, Longuet P, Duval X, Le Moing V, Leport C, Vilde JL. Two
episodes of acute renal failure, rhabdomyolysis and severe hepatitis in an
AIDS patient successively treated with ritonavir and indinavir. Clin infect Dis
1999;28(5):1180-1.
72. Boubaker K, Sudre P, Bally F, et al. Changes in renal function associated with
indinavir. AIDS 1998;12:249-54.
73. Malavaud B, Dinh B, Bonnet E, Izopet J, Payer JL, Marchou B. Increased
incidence of indinavir nephrolithiasis in patients with hepatitis B or C virus
infection. Antivir Ther 2000;5:3-5.
74. Duong M, Sgro C, Grappin M, Biron F, Boibieux A. Renal failure after
treatment with ritonavir. Lancet 1996;348:693.
75. Green ST, Mckendrick MW, Schmid ML, Mohsen AH, Prakasam F. Renal
calculi developing de novo in a patient taking saquinavir. Int J STD AIDS
1998;9:555.
76. Engeler DS, John H, Rentsch KM, Ruef C, Oertle D, Suter S. Nelfinavir urinary
stones. J Urol 2002;167:1384-5.
77. Brewster UC, Perazella MA. Acute interstitial nephritis associated with
atazanavir, a new protease inhibitor. Am Kidney Dis 2004;44:e81-e84.
78. Schooley RT, Ruane P, Myers RA, et al . Tenofovir DF in antiretroviral
experienced patients: results from a 48-week, randomized, doubleblind study.
AIDS 2002;16:1257-63.

105
79. Verhelst D, Monge M, Meynard JL, et al. Fanconi syndrome and renal failure
induced by tenofovir: a first case report. Am J Kidney Dis 2002;40:1331-3.
80. Callens S, De Roo A, Colebunders R. Fanconi-like syndrome and
rhabdomyolisis in a person with HIV infection on highly active antiretroviral
treatment including tenofovir. J Infect 2003;47:262-3.
81. Creput C, Gonzalez-Canali G, Hill G, Piketty C, Kazatchkine M, Nochy D.
Renal lesions in HIV-1-positive patient treated with tenofovir. AIDS
2003;17(6):935-7.
82. Rollot F, Nazal EM, Chauvelot-Moachon L, et al . Tenofovir-related Fanconi
syndrome with nephrogenic diabetes insipidus in a patient with acquired
immunodeficiency syndrome: the role of Iopinavir ritonavir-didanosine. Clin
Infect Dis 2003;37:e174-6.
83. Peyriere H, Reynes J, Rounet I, et al . Renal tubular dysfunction associated
with tenofovir therapy: report of 7 cases. J Acquir Immune Defic Syndr
2004;35:269-73.
84. Kearney BP, Mitten A, Sayre J, et al . Pharmacokinetic drug interaction and
long term safety profile of tenofovir DF and Iopinavir/ritonavir [abstract 1617].
In: Program and abstracts of the Interscience Conference on Antimicrobial
Agents and Chemotherapy (Chicago, Illinois). Herndon, VA:ASM Press, 2003.
85. Seaberg EC, Munoz A, Lu M, et al . Association between highly active
antiretroviral therapy and hypertension in a large cohort of men followed from
1984 to 2003. AIDS 2005;19:953-60.

106
86. Thiebault R, El-Sadr MW, Friis-Moller N. Predictors of hypertension and
changes of blood pressure in HIV-infected patients. Antivi Ther 2005;10:811-
23.
87. Zappitelli M, Washburn KK, Arikan AA, Loftis L, Ma Q, Devarajan P, Parkh
CR, Goldstein SL. Urine neutrophil gelatinase-associated lipocalin is an early
marker of acute renal injury in critically ill children: a prospective cohort study.
Crit Care 2007;11:R84.
88. Krishnan M, Narai R, Haas M, Atta MG. Acute renal failure in an HIV positive
50-year-old man. Am J Kidney Dis 2000;36:1075-8.
89. Crowther MA, Callaghan W, Hodsman AB, Mackie ID. Dideoxyinosine-
associated nephrotoxicity. AIDS 1993;7:131-2.
90. Izzedine H, Launay-Vacher V, Deray G. Fanconi syndrome associated with
didanosine therapy. AIDS 2005;19:844-5.
91. Morris AA, Baudouin SV, Snow MH. Renal tubular acidosis and
hypophosphataemia after treatment with nucleoside reverse transcriptase
inhibitors. AIDS 2001;140-1.
92. Chugh S, Bird R, Alexander EA. Ritonavir and renal failure. N Engl J Med
1997;336:138.
93. Witzke O, Plentz A, Schafers RF, Reinhardt W, Heemann U, Philipp T. Side-
effects of ritonavir and its combination with saquinavir with special regard to
renal function. AIDS 1997;11:836-8.

107
94. Angel-Moreno-Maroto A, Suárez-Castellano L, Hernández-Cabrera M, Pérez-
Arellano JL. Severe efavirenz-induced hypersensitivity syndrome (not-DRESS)
with acute renal failure. J Infect 2006; 52, e39–e40.
95. Anonymous. Product information Intelence (etravirine). Tibotec Inc, New
Jersey, USA, 2008.
96. Anonymous. Product information Prezista (darunavir). Tibotec Inc, New
Jersey, USA, 2010.
97. Lalezari JP, Henry K, O’Hearn M, et al. Enfuvirtide, an HIV-1 fusion inhibitor,
for drug-resistant HIV infection in North and South America. N Engl J Med
2003;348:2175-85.
98. Masiá M, Enríquez R, Sirvent A, Gutiérrez F. Severe acute renal failure
associated with rhabdomyolysis during treatment with raltegravir. A call for
caution. J Infect 2010;61(2):189-90 [letter].
99. Hosten AO. Chapter 193-BUN and Creatinine. Clinical Methods: The History,
Physical, and Laboratory Examinations. 3rd edition. Editors Walker HK, Hall
WD, Hurst JW; Boston Butterworths; 1990.
100. Gault MH, Longerich LL, Harnet JD, Wesolowski C. Predicting glomerular
function from adjusted serum creatinine. Nephron 1992;62:249-56.
101. Levey AS, Bosch JP, Lewis JB, Greene T, Rogers N, Roth D. A more accurate
method to estimate glomerular filtration rate from serum creatinine: A new
prediction equation. Ann Intern Med 1999;130:461-70.

108
102. Gates GF. Creatinine clearance estimation from serum creatinine values: An
analysis of three mathematical models of glomerular function. Am J Kidney Dis
1985;5:199-205.
103. Lamb EJ, Tomson CR, Roderick PJ. Estimating kidney function in adults using
formulae. Ann Clin Biochem 2005;42:321-45.
104. Deinum J, Derkx F. Cystatin for estimation of glomerular filtration rate? Lancet
2000;356:1624-5.
105. Dworking LD. Serum cystatin C as a marker of glomerular filtration rate. Curr
Opin Nephrol Hypertens 2001;10:551-3.
106. Stevens LA, Levey AS. Measurement of kidney function. Med Clin N Am
2005;89:457–73.
107. Rosner MH, Bolton WK. Renal function testing. Am J Kidney Dis 2006;
47:174–83.
108. Laterza OF, Price CP, Scott M. Cystatin C: an improved estimator of
glomerular filtration rate? Clin Chem 2002; 48:699–707.
109. Koenig W, Twardella D, Brenner H, Rothenbacher D. Plasma concentrations
of cystatin C in patients with coronary heart disease and risk for secondary
cardiovascular events: more than simply a marker of glomerular filtration rate.
Clin Chem 2005;51:321–7.
110. Swan SK. The search continues—an ideal marker for GFR. Clin Chem
1997;43:913–4.
111. Newman D. Cystatin C. Ann Clin Biochem 2002;39:89–104.

109
112. Bökenkamp A, Domanetzki M, Zinck R, Schumann G, Byrd D, Brodehl J.
Cystatin C — A new marker of glomerular filtration rate in children
independent of age and height. Pediatrics 1998;101:875–81.
113. Dharnidharka VR, Kwon C, Stevens G.Serum cystatin C is superior to serum
creatinine as a marker of kidney function: a meta-analysis. Am J Kidney Dis
2002;40:221-6.
114. van Deventer HE, Paiker JE, Katz IJ, George JA. A comparison of cystatin C-
and creatinine-based prediction equations for the estimation of glomerular
filtration rate in black South Africans. Nephrol Dial Transplant 2010 [published
online].
115. Kilpatrick E, Keevil B, Addison G. Does adjustment of GFR to extracellular
fluid volume improve the clinical utility of cystatin-C? Arch Did Child
2000;82:499-502.
116. Pavicevic S, Peco-Antic A. Cystatin C: our experience. Pediatr Nephrol
2005;20:842-3.
117. Lankisch P, Wessalowski R, Maisonneuve P, Haghgu M, Hermsen D, Kramm
CM. Serum Cystatin C is a suitable marker for routine monitoring of renal
function in pediatric cancer patients, especially of very young age. Pediatr
Blood Cancer 2006;46:767–772.
118. Fliser D, Ritz E. Serum cystatin-C concentrations as a marker of renal
dysfunction in the elderly. Am J Kidney Dis 2001;37:79-83.

110
119. Tan GD, Lewis AV, James TJ, Altman P, Taylor RP, Levy JC. Clinical
usefulness of cystatin c for the estimation of glomerular filtration rate in type 1
diabetes. Diabetes Care 2002;25:2004-9.
120. Buysschaert M, Joudi P, Hermans MP. Comparative performance of serum
cystatin-c versus serum creatinine in diabetic subjects. Diabetes Metab
2003;29:377-83.
121. Zhang PP, Zhan JF, Xie HL, Li LS, Liu ZH. Evaluation of glomerular filtration
rate using cystatin C in diabetic patients analysed by multiple factors including
tubular function. J Int Med Res 2010;38(2):473-83.
122. MacDonald J, Marcora S, Jibani M, et al. GFR estimation using cystatin C is
not independent of body composition. Am J Kidney Dis 2006;48:712–9.
123. Keevil B, Kilpatrick E, Nichols S, Maylor P. Biological variation of cystatin C:
implications for the assessment of glomerular filtration rate. Clin Chem
1998;44:1535–9.
124. Gabutti L, Ferrari L, Ferrari N, Mombelli G, Marone C. Does cystatin C
improve the precision of Cockcroft and Gault's creatinine clearance
estimation? J Nephrol 2004;17:673–8.
125. Risch L, Drexel H, Huber A. Differences in glomerular filtration rate estimates
by 2 cystatin C-based equations. Clin Chem 2005;51:2211.
126. Madero M, Sarnak M, Stevens L. Serum cystatin C as a marker of glomerular
filtration rate. Curr Opin Nephrol Hypertens 2006;15:610–6.

111
127. Ghayur T, Banerjee S, Hugunin M, et al . Caspase-1 processes IFN-gamma-
inducing factor and regulates LPS-induced IFN-gamma production. Nature
1997;386: 619–23.
128. Gu Y, Kuida K, Tsutsui H, et al. Activation of interferon-gamma inducing factor
mediated by interleukin-1beta converting enzyme. Science 1997;275 (5297):206–9.
129. Gracie JA, Robertson SE, McInnes, IB. Interleukin-18. J. Leukoc Biol
2003;73:213–224.
130. Tschoeke SK, Oberholzer A, Moldawer LL. Interleukin-18: a novel prognostic
cytokine in bacteria-induced sepsis. Crit Care Med 2006; 34(4):1225–33.
131. Melnikov VY, Ecder T, Fantuzzi G, Siegmund B, Lucia MS, Dinarello CA,
Schrier RW, Edelstein CL. Impaired IL-18 processing protects caspase-1-
deficient mice from ischemic acute renal failure. J Clin Invest 2001;107:1145–
52.
132. Melnikov VY, Faubel S, Siegmund B, Lucia MS, Ljubanovic D, Edelstein CL.
Neutrophil-independent mechanisms of caspase-1 and IL-18–mediated
ischemic acute tubular necrosis in mice. J Clin Invest 2002;110:1083–91.
133. Parikh CR, Jani A, Melnikov VY, Faubel S, Edelstein CL. Urinary interleukin-
18 is a marker of human acute tubular necrosis. Am J Kidney Dis
2004;43(3):405–14.
134. Parikh CR, Abraham E, Ancukiewicz M, Edelstein CL. Urine IL-18 is an early
diagnostic marker for acute kidney injury and predicts mortality in the intensive
care unit. J Am Soc Nephrol 2005;16:3046–52.

112
135. Han WK, Waikar SS, Jonhson A, et al . Urinary biomarkers in the early
diagnosis of acute kidney injury. Kidney Int 2008;73:863-9.
136. Han WK, Bailly V, Abichandani R, Thadhani R, Bonventre JV. Kidney Injury
Molecule-1 (KIM-1): a novel biomarker for human renal proximal tubule injury.
Kidney Int 2002; 62:237–44.
137. Ichimura T, Bonventre J, Bailly V, Wei H, Hession C, Cate R, Sanicola M.
Kidney injury molecule-1 (KIM-1), a putative epithelial cell adhesion molecule
containing a novel immunoglobulin domain, is upregulated in renal cells after
injury. J Biol Chem 1998;273: 4135–42.
138. Dieterle F, Staedtler F, Grenet O, et al . Qualification of biomarkers for
regulatory decision making—a kidney safety biomarker project. Toxicol Off J
Soc Toxicol 2007;96:381.
139. Glatz JF, Van Der Vusse GJ. Cellular fatty acid-binding proteins: their function
and physiological significance. Prog Lipid Res 1996;35:243–82.
140. Oyama Y, Takeda T, Hama H, et al. Evidence for megalin-mediated proximal
tubular uptake of L-FABP, a carrier of potentially nephrotoxic molecules. Lab
Invest 2005;85:522–31.
141. Maatman RG, van de Westerlo EM, van Kuppevelt TH, Veerkamp JH.
Molecular identification of the liver- and the heart-type fatty acid-binding
proteins in human and rat kidney. Use of the reverse transcriptase polymerase
chain reaction. Biochem J 1992; 288:285–90.

113
142. Maatman RG, Van Kuppevelt TH, Veerkamp JH. Two types of fatty
acidbinding protein in human kidney. Isolation, characterization and
localization. Biochem J 1991;273:759–66.
143. Kamijo A, Kimura K, Sugaya T, et al . Urinary fatty acid binding protein as a
new clinical marker of the progression of chronic renal disease. J Lab Clin
Med 2004;143:23–30.
144. Kamijo-Ikemori A, Sugaya T, Kimura K. Urinary fatty acid binding protein in
renal disease. Clin Chim Acta 2006;374:1-7.
145. Nakamura T, Sugaya T, Node K, Ueda Y, Koide H. Urinary excretion of liver-
type fatty acid-binding protein in contrast medium-induced nephropathy. Am J
Kidney Dis 2006;47:439-44.
146. Kamijo A, Sugaya T, Hikawa A, et al . Urinary liver-type fatty acid binding
protein as a useful biomarker in chronic kidney disease. Mol Cell Biochem
2006;284:175–82.
147. Ferguson MA, Vaidya V, Waikar SS, Collings FB, Sunderland K, Gioules C,
Bonventre JV. Liver-type fatty acid binding protein (L-FABP): a novel urinary
biomarker of acute kidney injury. J Am Soc Nephrol 2007;18:41A–2A.
148. Portilla D, Dent C, Sugaya T, Nagothu KK, Kundi I, Moore P, Noiri E,
Devarajan P. Liver fatty acid-binding protein as a biomarker of acute kidney
injury after cardiac surgery. Kidney Int 2008;73:465-72.
149. Flower DR, North AC, Sansom CE. The lipocalin protein family: structural and
sequence overview. Biochim Biophys Acta 2000;1482:9–24.

114
150. Uttenthal O. NGAL: a marker molecule for the distressed kidney? Clin Lab
Internat 2005;29:39–41.
151. Cowland JB, Borregaard N. Molecular characterization and pattern of tissue
expression of the gene for neutrophil gelatinase-associated lipocalin from
humans. Genomics 1997;45:17–23.
152. Goetz DH, Holmes MA, Borregaard N et al. The neutrophil lipocalin NGAL is a
bacteriostatic agent that interferes with siderophore-mediated iron acquisition.
Mol Cell 2002;10:1033–43.
153. Flo TH, Smith KD, Sato S, et al . Lipocalin 2 mediates an innate immune
response to bacterial infection by sequestrating iron. Nature 2004;432:917–21.
154. Berger T, Togawa A, Duncan GS et al . Lipocalin 2-deficient mice exhibit
increased sensitivity to Escherichia coli infection but not to ischemia-
reperfusion injury. Proc Natl Acad Sci USA 2006;103:1834–9.
155. Devireddy LR, Gazin C, Zhu X, et al. A cell-surface receptor for lipocalin 24p3
selectively mediates apoptosis and iron uptake. Cell 2005;123(7):1293–305.
156. Kjeldsen L, Johnsen AH, Sengelov H, et al. Isolation and primary structure of
NGAL, a novel protein associated with human neutrophil gelatinase. J Biol
Chem 1993;268:10425–32.
157. Yan L, Borregaard N, Kjeldsen L, et al . The high molecular weight urinary
matrix metalloproteinase (MMP) activity is a complex of gelatinase B/MMP-9
and neutrophil gelatinase-associated lipocalin (NGAL). Modulation of MMP-9
activity by NGAL. J Biol Chem 2001;276:37258–65.

115
158. Gwira JA, Wei F, Ishibe S, et al . Expression of neutrophil gelatinase-
associated lipocalin regulates epithelial morphogenesis in vitro. J Biol Chem
2005;280:7875–82.
159. Yang J, Goetz D, Li JY, et al. An iron delivery pathway mediated by a lipocalin.
Mol Cell 2002;10:1045–56.
160. Nielsen BS, Borregaard N, Bundgaard JR, et al. Induction of NGAL synthesis
in epithelial cells of human colorectal neoplasia and inflammatory bowel
diseases. Gut 1996;38:414–20.
161. Carlson M, Raab Y, Seveus L, et a l. Human neutrophil lipocalin is a unique
marker of neutrophil inflammation in ulcerative colitis and proctitis. Gut
2002;50:501–6.
162. Xu SY, Pauksen K, Venge P. Serum measurements of human neutrophil
lipocalin (HNL) discriminates between acute bacterial and viral infections.
Scand J Clin Lab Invest 1995;55:125–31.
163. Schmidt-Ott KM, Mori K, Kalandadze A, et al. Neutrophil gelatinase-associated
lipocalin-mediated iron traffic in kidney epithelia. Curr Opin Nephrol Hypertens
2006;15:442–9.
164. Mishra J, Dent C, Tarabishi R, et al. Neutrophil gelatinase-associated lipocalin
(NGAL) as a biomarker for acute renal injury after cardiac surgery. Lancet
2005;365:1231–8.
165. Wagener G, Jan M, Kim M, et al . Association between increases in urinary
neutrophil gelatinase-associated lipocalin and acute renal dysfunction after
adult cardiac surgery. Anesthesiology 2006;105:485–91.

116
166. Bachorzewska-Gajewska H, Malyszko J, Sitniewska E, et al. Could neutrophil-
gelatinase-associated lipocalin and cystatin C predict the development of
contrast-induced nephropathy after percutaneous coronary interventions in
patients with stable angina and normal serum creatinine values? Kidney Blood
Press Res 2007;30:408-15.
167. Xin C, Yulong X, Yu C, et al . Urine neutrophil gelatinase-associated lipocalin
and interleukin-18 predict acute kidney injury after cardiac surgery. Ren Fail
2008;30:904–13.
168. Bennett M, Dent CL, Ma Q, et al. Urine NGAL predicts severity of acute kidney
injury after cardiac surgery: a prospective study. Clin J Am Soc Nephrol
2008;3:665-73.
169. Trachtman H, Christen E, Cnaan A, et al . Urinary neutrophil gelatinase-
associated lipocalcin in D+HUS: a novel marker of renal injury. Pediatr
Nephrol 2006;21:989–94.
170. 113-Bolignano D, Coppolino G, Campo S, et al . Neutrophil gelatinase-
associated lipocalin in patients with autosomal-dominant polycystic kidney
disease. Am J Nephrol 2007;27:373–8.
171. Wei F, Karihaloo A, Yu Z, et al . Neutrophil gelatinase-associated lipocalin
suppresses cyst growth by Pkd1 null cells in vitro and in vivo. Kidney Int
2008;74:1310–8.
172. Brunner HI, Mueller M, Rutherford C, et al . Urinary neutrophil gelatinase-
associated lipocalin as a biomarker of nephritis in childhood-onset systemic
lupus erythematosus. Arthritis Rheum 2006;54:2577–84.

117
173. Suzuki M, Wiers KM, Klein-Gitelman MS, et al . Neutrophil gelatinase-
associated lipocalin as a biomarker of disease activity in pediatric lupus
nephritis. Pediatr Nephrol 2008;23:403–12.
174. Ding H, He Y, Li K, et al . Urinary neutrophil gelatinase-associated lipocalin
(NGAL) is an early biomarker for renal tubulointerstitial injury in IgA
nephropathy. Clin Immunol 2007;123:227–34.
175. Bolignano D, Coppolino G, Campo S, et al . Urinary neutrophil gelatinase-
associated lipocalin (NGAL) is associated with severity of renal disease in
proteinuric patients. Nephrol Dial Transpl 2008;23:414-16.
176. Bolignano D, Coppolino G, Lacquaniti A, et a l. Pathological and prognostic
value of urinary neutrophil gelatinase-associated lipocalin in macroproteinuric
patients with worsening renal function. Kidney Blood Press Res 2008;31:274–
9.
177. Bolignano D, Coppolino G, Aloisi C et al . Effect of a single intravenous
immunoglobulin infusion on neutrophil gelatinase-associated lipocalin levels in
proteinuric patients with normal renal function. J Investig Med 2008;56(8):997–
1003.
178. Wagener G, Gubitosa G, Wang S, Borregaard N, Kim M, Lee HT. Urinary
neutrophil gelatinase-associated lipocalin and acute kidney injury after cardiac
surgery. Am J Kidney Dis 2008;52:425-33.
179. Fischer UM, Weissenberger WK Warters RD, Geissler HJ, Allen SJ, Mehlhorn
U. Impact of cardiopulmonary bypass management on prostatic surgery renal
function. Perfusion 2002;17:401-6.

118
180. Mishra J, Ma Q, Prada A et al . Identification of neutrophil gelatinase-
associated lipocalin as a novel early urinary biomarker for ischemic renal
injury. J Am Soc Nephrol 2003;14:2534–43.
181. Devarajan P. Neutrophil gelatinase associated lipocalin (NGAL): a new marker
of kidney disease. Scand J Clin Lab Invest Suppl 2008;241:89-94.
182. Devarajan P. NGAL in acute kidney injury: from serendipity to utility. Am J
Kidney Dis 2008;52:395-9.
183. The Antiretroviral Therapy Cohort Collaboration. Life expectancy of individuals
on combination antiretroviral therapy in high-income countries: a collaborative
analysis of 14 cohort studies. Lancet 2008;372:293-9.
184. Instituto Nacional de Saúde. Infecção VIH/SIDA. Situação de Portugal.
Doc.141. DDI-URVE, Lisbon, 2010.
185. Chaturvedi AK, Pfeiffer RM, Chang L, Goedert JJ, Biggar RJ, Engels EA.
Elevated risk of lung cancer among people with AIDS. AIDS 2007; 21:207–13.
186. Cortez-Dias N, Martins S, Belo A, Fiuza M; Investigadores do Estudo VALSIM.
Prevalence and management of hypertension in primary care in Portugal.
Insights from the VALSIM study. Rev Port Cardiol 2009;28(5):499-523.
187. Gardete-Correia L, Boavida JM, Raposo JF, Mesquita AC, Fona C, Carvalho
R, Massano-Cardoso S. First diabetes prevalence study in Portugal:
PREVADIAB study. Diabet Med 2010;27(8):879-81.
188. Shepp DH. Chronic Inflammation in HIV: CROI 2010. 17th Conference on
Retroviruses and Opportunistic Infections, San Francisco, USA, 2010.

119
189. Gupta S, Heeger P, Lai X, Shen C, Witzmann F, Lederman M. Intrarenal
inflammation contributes to HIV-related proteinuria. 17th Conference on
Retroviruses and Opportunistic Infections, Abstract 736, San Francisco, USA,
2010.
190. Antunes F. Manual sobre SIDA. Secção VII- Tratamento da infecção por VIH.
Permanyer Portugal, Portugal, 2008;304-5.
191. Tato Marinho R. A doença hepática na infecção VIH. Coordenação Nacional
para a Infecção VIH/sida, Lisboa, 2007.
192. Antunes H, Macedo M, Estrada A. Taxa de cobertura vacinal com imunização
para o vírus da hepatite B. Act Med Port 2004;17:303-8.
193. Mauss S, Berger F, Kushchak D, et al . Cystatin C as a marker of renal
function is affected by HIV replication leading to an underestimation of kidney
function in HIV patients. Antivir Ther 2008;13(8):1091-5.
194. Bruggeman LA, Ross MD, Tanji N, et al . Renal epithelium is a previously
unrecognized site of HIV-1 infection. J. Am. Soc. Nephrol 2000; 11(11):2079-
2087.
195. Ross MJ, Fan C, Ross MD, et al . HIV-1 infection initiates an inflammatory
cascade in human renal tubular epithelial cells. J Acquir Immune Defic Syndr
2006; 42(1):1-11.
196. Baxmann AC, Ahmed MS, Marques NC, et al. Influence of muscle mass and
physical activity on serum and urinary cystatin C. Clin. J. Am. Soc. Nephrol.,
2008; 3:348-354.

120
197. Stöhr W, Walker AS, Munderi P, et al . Estimating glomerular filtration rate in
HIV-infected adults in Africa: comparison of Cockcroft-Gault and Modification
of Diet in Renal Disease formulae. Antivir Ther 2008;13(6):761-70.
198. Shlipak MG, Katz R, Sarnak MJ, et a l. Cystatin C and prognosis for
cardiovascular and kidney outcomes in elderly persons without chronic kidney
disease. Ann Intern Med 2006;145(4):237-46.
199. Vasan RS, Larson MG, Leip EP, Kannel WB, Levy D. Assessment of
frequency of progression to hypertension in non-hypertensive participants in
the Framingham Heart Study: a cohort study. Lancet 2001;358:1682-6.
200. Labarga P, Barreiro P, Martin-Carbonero L, et al. Kidney tubular abnormalities
in the absent of impaired glomerular function in HIV patients treated with
tenofovir. AIDS 2009;23:689-96.
201. Gaspar G, Monereo A, Garcia-Reye A, de Guzman M. Fanconi syndrome and
acute renal failure in patients treated with tenofovir: a call for caution. AIDS
2004;18:351-2.
202. Mocroft A, Kirk O, Reiss P, et al . Estimated glomerular filtration rate, chronic
kidney disease and antiretroviral drug use in HIV-positive patients. AIDS
2010;24(11): 1667-78.
203. Warfel AH, Zucker-Frankklin D, Frangione B, Ghiso J. Constitutive secretion of
cystatin C (gamma-trace) by monocytes and macrophages and its
downregulation after stimulation. J Exp Med 1987;166:1912-7.
204. Bollengier F. Cystatin C, alias post-γ-globulin: a marker for multiple sclerosis?
J Clin Chem Clin Biochem 1987;25:589-93.

121
205. Cimerman N, Bruljian PM, Krašovec M, Šuškovnič S, Kos J. Serum cystatin C,
a potent inhibitor of cysteine proteinases, is elevated in asthmatic patients. Cin
Chim Acta 2000;291(1):89-95.
206. Knight EL, Verhave JC, Spiegelman D, et a l. Factors influencing serum
cystatin C levels other than renal function and the impact on renal function
measurement. Kidney Int 2004;65:1416-21.
207. Keller CR, Odden MC, Fried LF, et al . Kidney function and markers of
inflammation in elderly persons without chronic kidney disease: the health,
aging, and body composition study. Kidney Int 2008;71:239-44.
208. Robert RL, Adjei PN, Gores GJ. Cathepsins as effector proteases in
hepatocyte apoptosis. Cell Biochem Biophys 1999;30(1):71-88.
209. Muzillo DA, Imoto M, Fukuda Y, et al . Clinical evaluation of serum tissue
inhibitor of metalloproteinase-1 levels in patients with liver diseases. J
Gastroenterol Hepatol 1993;8: 437-441.
210. Chu S, Wang C, Chang Y, et al. Increased cystatin C serum concentrations in
patients with hepatic diseases of various severities. Clin Chim Acta
2004;341:133-8.
211. Takeuchi M, Fukuda Y, Nakano I, Katano Y, Hayakawa T. Elevation of cystatin
C serum concentrations in patients with chronic liver diseases. Eur J
Gastroenterol Hepatol 2001;13:951-5.

Introduction
Objectives
Material and Methods
Results
Discussion
Concluding remarks
Bibliography
Annexes

123
Annexes
Part of the present work was used to write an original paper that, at the moment of
elaboration of this dissertation, was ready to submit to the journal Clinical Infectious
Diseases.