uniuely cabot.dan o. dinges, chairman, president and chief executive officer cabot’s susquehanna...
TRANSCRIPT

UNIQUELY CABOT. 2012 ANNUAL REPORT
CABOT OIL & GAS CORPORATION

Cabot Oil & Gas Corporation, headquartered in Houston, Texas, is a leading independent
natural gas producer, with its entire resource base located in the continental United States.
The Company’s focused operations are centered around developing its natural gas resources
in Pennsylvania and West Virginia; and exploiting its oil, liquids and to a lesser extent, natural
gas reserves in Texas and Oklahoma.

IN DECEMBER, CABOT SURPASSED ONE BCFE OF NET PRODUCTION PER DAY FOR THE FIRST TIME IN ITS HISTORY – A MILESTONE THAT FURTHER HIGHLIGHTS THE UNIQUELY PROLIFIC NATURE OF ITS ASSETS.
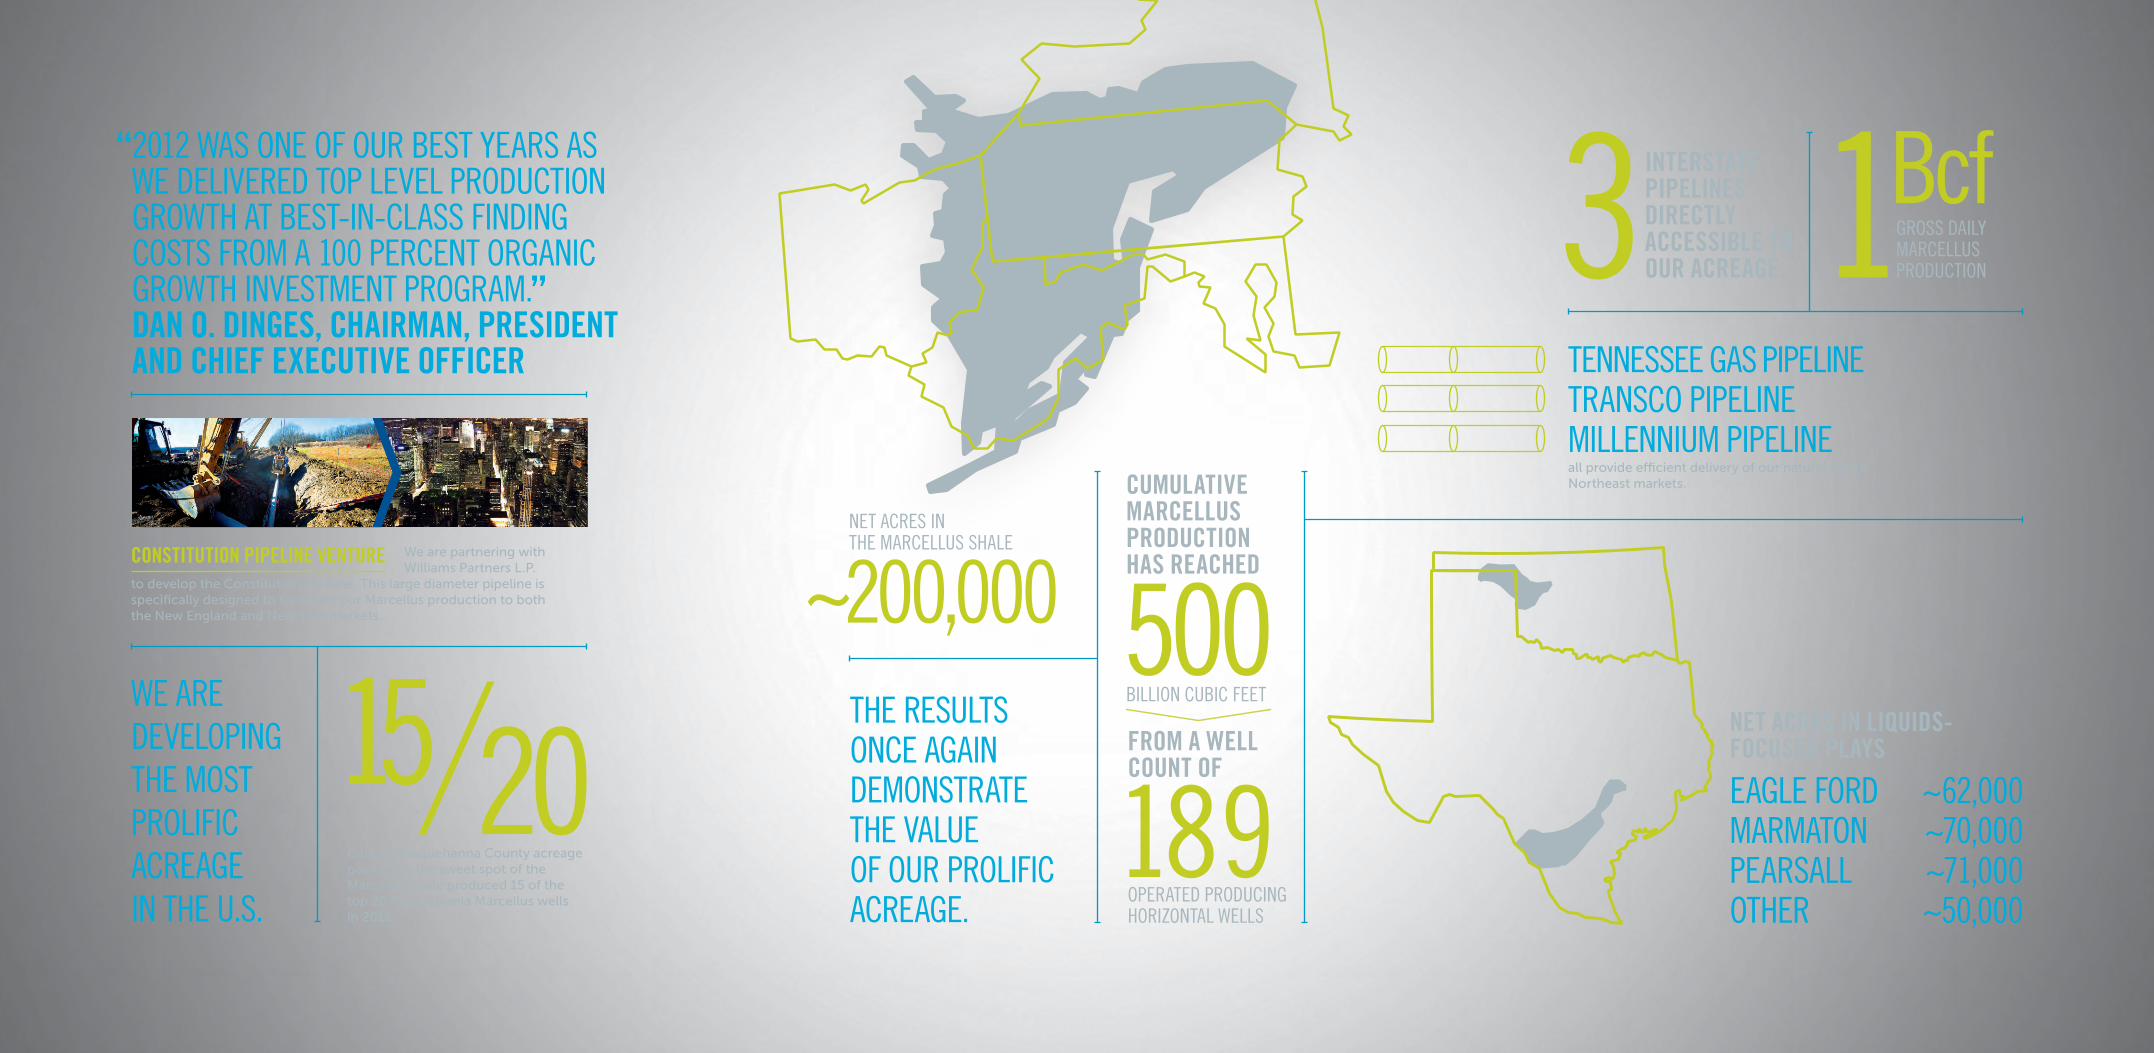
“ 2012 WAS ONE OF OUR BEST YEARS AS WE DELIVERED TOP LEVEL PRODUCTION GROWTH AT BEST-IN-CLASS FINDING COSTS FROM A 100 PERCENT ORGANIC GROWTH INVESTMENT PROGRAM.” DAN O. DINGES, CHAIRMAN, PRESIDENT AND CHIEF EXECUTIVE OFFICER
Cabot’s Susquehanna County acreage position in the sweet spot of the Marcellus Shale produced 15 of the top 20 Pennsylvania Marcellus wells in 2012.
WE ARE DEVELOPING THE MOST PROLIFIC ACREAGE IN THE U.S.
We are partnering with Williams Partners L.P.
to develop the Constitution Pipeline. This large diameter pipeline is specifically designed to transport our Marcellus production to both the New England and New York markets.
CONSTITUTION PIPELINE VENTURE
EAGLE FORD ~62,000MARMATON ~70,000PEARSALL ~71,000OTHER ~50,000
THE RESULTS ONCE AGAIN DEMONSTRATE THE VALUE OF OUR PROLIFIC ACREAGE.
NET ACRES IN THE MARCELLUS SHALE
~200,000
INTERSTATE PIPELINES DIRECTLY ACCESSIBLE TO OUR ACREAGE.3
TENNESSEE GAS PIPELINETRANSCO PIPELINE MILLENNIUM PIPELINE all provide efficient delivery of our natural gas to Northeast markets.
NET ACRES IN LIQUIDS-FOCUSED PLAYS
1GROSS DAILY MARCELLUS PRODUCTION
Bcf
CUMULATIVEMARCELLUS PRODUCTIONHAS REACHED
500BILLION CUBIC FEET
OPERATED PRODUCINGHORIZONTAL WELLS
189FROM A WELL COUNT OF

5 6 7
DURING 2012 CABOT OIL & GAS CORPORATION CONTINUED THE MOMENTUM STARTED IN 2011 BY ACHIEVING SEVERAL NEW MILESTONES FOR THE COMPANY.
To Our Shareholders
Our most important achievement was another strong
year of stock price appreciation with a 31 percent increase, even
in the face of stiff headwinds due to low natural gas prices. In
2011, we were the #1 performing stock in the S&P 500 and in
2012 we were the #1 performing stock in our peer group.
RECORD MILESTONES
2012 was another standout year for Cabot. Despite a
backdrop of macroeconomic uncertainty and depressed natural
gas prices, new company records were set for production, proved
reserves, revenues, cash flow from operations and discretionary
cash flow. We also achieved two new milestones by surpassing
one Bcf of daily gross production out of the Marcellus Shale
and one Bcfe of total daily net production for the Company.
These successes were a result of the exceptional efforts of our
dedicated employees; disciplined management and financial
prudence; and our unique, top-tier asset base. Our goal entering
the year was to generate outsized growth at the most efficient
finding costs while driving down overall costs. I am pleased to say
that we were successful on all fronts. Our 43 percent production
growth was best in class among our peers and generated entirely
through the drill bit. Our all sources finding and development cost
reached a low not seen in 15 years of $0.87 per Mcfe.

8
ACTIVE DRILLING PROGRAM
While most industry participants were forced to lay down
rigs in their natural gas plays in response to commodity price
declines, we were able to maintain an active drilling program in
the Marcellus Shale that provided attractive rates of return even
in a sub-$3.00 per Mmbtu natural gas price environment. As a
result, we exited 2012 with the same number of rigs operating in
the Marcellus as we had entering the year. Meanwhile, we were
able to capitalize on favorable oil prices by growing our liquids
production approximately 67 percent, primarily in the Eagle
Ford and Marmaton, while adding a new liquids-focused area of
operations to our portfolio in the Pearsall Shale.
Our operational efforts in 2012 were primarily focused on:
n Further de-risking of our Marcellus acreage position through
step-out drilling, allowing us to continue to capture primary
term acreage.
n Continued infrastructure build-out in the Marcellus through our
partnership with Williams to relieve infrastructure constraints
throughout the system and lower field pressures.

9
n Initial testing of down-spacing initiatives in our Eagle Ford
position to evaluate the concept of reduced spacing across
our acreage.
n Initial testing of extended lateral wells in our Marmaton position.
n Initial exploitation drilling of our Pearsall position.
The success of our drilling programs, coupled with disciplined
management, resulted in exceptional operational and financial
results for 2012, including:
n Record production of 267.7 Bcfe, a 43 percent increase
from 2011.
n Record year-end proved reserves of 3.8 Tcfe, a 27 percent
increase from 2011.
n Record cash flow from operations of $652.1 million, a
30 percent increase from 2011, despite an 18 percent
decrease in realized natural gas prices.

10
We achieved our second consecutive year of
production growth exceeding 40 percent, due primarily to
our drilling program in the Marcellus. We experienced proved
reserve growth exceeding 20 percent (pro forma for asset sales)
for the third consecutive year, which is particularly impressive
given the negative price revisions seen across the industry as
a result of lower natural gas prices. Our positive performance
revisions, primarily in the Marcellus, more than outweighed any
negative pricing effects experienced during 2012. The capital
efficiency of our portfolio resulted in a continued decrease in
our overall cost structure.
In our continued pursuit of opportunities to create value for
our shareholders, we made the following strategic decisions
during 2012 that we believe will provide long-term benefits
for the Company:
n In February, we announced a new joint venture with Williams
Partners L.P. to develop and construct a large-diameter pipeline,
specifically designed to transport our Marcellus production to
both the New England and New York markets. This joint venture
represents a further step in alleviating any future infrastructure
constraints affecting our Marcellus operations. We see this
pipeline playing an important role in the future development of
our world-class resource that will bring a reliable and dependable
long-term natural gas supply into an expanding premium market.
n In June, we announced a new joint venture with a wholly-
owned U.S. subsidiary of Osaka Gas Co., Ltd. for the sale of a
35 percent non-operated working interest in approximately
50,000 net acres in the Pearsall Shale for a total price of
$251 million. This deal provided us with $125 million of cash
that allowed us to maintain our drilling levels in the Marcellus
while the $126 million of drilling carry allowed us to accelerate
the exploitation of an operating area on which we had not
focused our efforts prior to this announcement.
LOOKING AHEAD
Our achievements in 2012 have positioned us well for continued
success in 2013 and beyond. While we expect to continue to see
pressure on natural gas prices for the foreseeable future, we do
not anticipate a return to the natural gas price environment we
experienced in early 2012. As a result we are optimistic about
the Company’s outlook for the year. Our 2013 capital program
of approximately $1 billion was established based on the
expectation of being fully funded through operating cash flows
while exceeding 40 percent production growth—at the mid-
point of our guidance—for the third consecutive year.
WE ACHIEVED OUR SECOND CONSECUTIVE YEAR OF PRODUCTION GROWTH EXCEEDING 40 PERCENT AND OUR THIRD CONSECUTIVE YEAR OF RESERVE GROWTH EXCEEDING 20 PERCENT (PRO FORMA FOR ASSET SALES).

11

12
Should commodity prices fall short of our expectations,
we believe the combination of our unique asset base in
the Marcellus, our strong balance sheet, and our hedging
program allow us to efficiently grow our production
in a low commodity price environment while still providing
attractive returns.
Operationally, we believe 2013 will be another
landmark year for the Company. In the Marcellus we anticipate
the addition of incremental infrastructure throughout the year
will relieve capacity constraints we have experienced in prior
years while increasing overall well performance throughout
our program. In our liquids-focused plays we will continue
to focus our efforts on providing high-margin liquids growth.
As with previous years, our technical teams will continue to
test new concepts across all of our operating areas in search
of new methods to drill and complete wells more efficiently.
Additionally, our goal is to continue to reduce lifting costs and
enhance margins.
I would like to recognize the hard work and dedication
of our employees as well as the commitment and guidance
of our Board of Directors. I would also like to thank our loyal
shareholders for their unwavering support. I believe we are
uniquely positioned for another successful year in 2013 and
anticipate this success will translate into continued value
creation for our shareholders.
Cheers,
Dan O. Dinges
Chairman, President and Chief Executive Officer
OUR MARCELLUS WELLS HAVE BEEN UNIQUELY ECONOMIC, YIELDING SUPERIOR RETURNS EVEN IN THE CURRENT NATURAL GAS MARKET.

13
Compressed Natural Gas Initiatives
In 2012, Cabot began an initiative to implement the usage of compressed natural gas (CNG) in its operations in the Marcellus Shale. CNG is natural gas that is compressed to a much smaller volume and stored and distributed in specially designed and tested containers at a high pressure. It can be used as a replacement for gasoline, diesel or propane. CNG not only costs much less than gasoline and diesel, but also releases fewer pollutants into the air.
Currently, one of Cabot’s drilling rigs in the Marcellus Shale has been converted to utilize CNG. Additionally, the Company is working toward converting its entire fleet of vehicles to run on CNG, making them cleaner and less expensive to operate. Cabot has constructed its own CNG facility in Susquehanna County, Pennsylvania, which will be used to supply the converted rig and vehicle fleet with CNG produced directly from its Marcellus operations. These initiatives will not only result in reduced energy costs for the Company, but they will also help the environment.

14

15
Since the inception of Cabot’s horizontal drilling
program in 2008, the Company’s Marcellus Shale position in
northeast Pennsylvania has developed into the cornerstone
asset of its portfolio and has been the primary driver of record
production and reserve growth during this period. Cabot’s
gross natural gas production from the play has grown from an
exit rate of 20 Mmcf per day in 2008 to over one Bcf per day
in 2012. Cabot’s milestone achievement of one Bcf per day of
gross Marcellus production was the result of only 185 operated
producing horizontal wells, further highlighting the superior
productivity of the wells the Company has drilled to date.
Meanwhile, the Company’s proved reserves in the play have also
risen at an extraordinary pace from 67 Bcf at year-end 2008 to
over 3 Tcf at year-end 2012.
CONTINUED PERFORMANCE IMPROVEMENTS
2012 was a landmark year for Cabot’s Marcellus
operations and the results further demonstrated the prolific
nature of this asset. Net Marcellus production for the year was
209.3 Bcf, up 75 percent from 119.3 Bcf in 2011. During the year
the Company drilled 69.7 net wells and completed 1,268 frac
stages, up from 64.7 net wells drilled and 904 frac stages
completed in 2011. Well performance continued to improve
across the play as the Company refined its completion and
production techniques. The average horizontal producing
Marcellus well for the 2012 program was drilled at a horizontal
lateral length of 4,087 feet and completed with 17.6 frac stages
for an estimated ultimate recovery (EUR) of 13.9 Bcf. This
compared favorably to the 2011 program where the average well
was drilled at a horizontal lateral length of 3,632 feet and
completed with 15.3 frac stages for an EUR of 11.0 Bcf at the time
of booking. Cabot’s rate of return on its typical Marcellus well
exceeds industry returns in all U.S. natural gas plays and most, if
not all, U.S. liquids plays at current commodity prices.
WE ARE DEVELOPING THE MOST PROLIFIC NATURAL GAS PLAY IN THE UNITED STATES.
Uniquely Cabot
MARCELLUS SHALE
MARCELLUS PROVED RESERVES (Bcf)
459.0
1,254.9
2,011.1
3,044.3
MARCELLUS NET PRODUCTION (Bcf)
11.5
49.5
119.3
209.3
MARCELLUS ALL SOURCES FINDING COST ($ per Mcf)
$0.73
$0.63$0.65
$0.49
2009 2010 2011 2012
2009 2010 2011 2012
2009 2010 2011 2012

16
The Company booked over 1 Tcf of new reserves
in the Marcellus during 2012 at an all sources finding and
development cost of $0.49 per Mcf, 25 percent lower than the
2011 all sources finding cost of $0.65 per Mcf. A significant
driver of this increase in reserves was a positive reserve revision
of 401.2 Bcf, primarily from increased reserve bookings on prior
program year producing wells and increased reserve bookings
on PUD locations from an EUR of 7.5 Bcf to 9 Bcf per well. Other
operational highlights for Cabot’s Marcellus program during
2012 include:
n Gross daily production record of 1,038 Mmcf.
n 15 of the top 20 producing horizontal Marcellus wells in
Pennsylvania in 2012.
n 6 wells turned in line with an EUR over 20 Bcf.
n Fastest well to 5 Bcf of cumulative production: accomplished in
205 days (previous record was 309 days).
n 4 wells turned in line reached 1 Bcf of cumulative production in
40 days or less.
n A two-well pad with a combined peak 24-hour production rate
of 72.2 Mmcf per day.
n 5 wells turned in line in with a peak 24-hour production rate
over 30 Mmcf per day.
n 4 wells achieved spud to TD in 10 days (2011 record was 11 days).
During the year the Company successfully tested several
other initiatives in the Marcellus including step-out drilling in
the eastern portion of its leasehold position to further de-risk
acreage, a pilot program to test optimal well spacing in the Upper
and Lower Marcellus formations, and a pilot program to test
optimal frac stage spacing in its Marcellus wells. The Company
has implemented the findings from these initiatives into its drilling
program for 2013 and anticipates they will have a positive impact
on the success of its Marcellus program going forward.
Cabot, in conjunction with its infrastructure provider,
made significant strides in its infrastructure efforts in the Marcellus
during the year. Throughout the year numerous projects and
upgrades were completed, which improved the pipeline system
operating efficiency and allowed the Company to reach its record
production volumes. The Company was able to secure 1.4 Bcf per
day of gross takeaway capacity by year-end—a tremendous
WE CAPITALIZE ON HAVING THREE INTERSTATE PIPELINES DIRECTLY ACCESSIBLE TO OUR ACREAGE.

17
feat given the delays in pipeline permitting experienced in
Pennsylvania this year. Cabot expects to reach 2.0 Bcf per day
of gross takeaway capacity by year-end 2013. Additionally, the
Company announced a joint venture with Williams Partners L.P.
to construct the Constitution Pipeline, a large diameter pipeline
designed to transport Cabot’s Marcellus production to both the
New England and New York markets beginning in 2015. Cabot
will be the foundation shipper on the pipeline and the Company
believes this project will be a key component of its long-term
marketing plan in the region.
While Cabot’s performance in the Marcellus to date
has been exceptional, the future appears even brighter as the
Company enters the sixth year of its horizontal drilling program
in the area. In 2013 the Company plans to drill approximately
85 net wells with five rigs operating for the majority of the year.
Approximately 65 percent of the Company’s capital program will
be allocated to Cabot’s high rate of return natural gas projects in
the Marcellus.
Pennsylvania Community Outreach
In early 2012, Cabot announced its partnership with Endless Mountains Health Systems (EMHS) in Montrose, Pennsylvania to fund a new, state-of-the-art healthcare facility that would greatly improve the quality of health care in the region. Cabot announced a leadership gift of $1 million in March and created the Cabot/EMHS Community Match Fund which pledged that the Company would match every $1 raised up to an additional million dollars. The community responded and in four months, $4.4 million was raised for the facility:
n $1 million leadership gift from Cabot
n $1 million donation from the Harry and Jeannette Weinberg Foundation
n $1.2 million raised by community organizations, local businesses, civic groups and companies in the natural gas industry
n $1.2 million matched by Cabot Construction is expected to near completion in the second half of
the year and the doors are scheduled to be open to patients in September 2013.
Cabot continues to partner with educational institutions including Junior Achievement, career and technology centers, area colleges and universities. Partnerships with local first responders and volunteer fire companies are also a focus and continue to be strengthened by the Company’s support.

18

19

20
EXPANDED LIQUIDS PORTFOLIO CONTINUES TO PROVIDE HIGH-MARGIN PRODUCTION GROWTH.
Uniquely Cabot
OIL INITIATIVES
In 2012 Cabot focused approximately 30 percent of its
capital program on the continued expansion of its oil initiatives
in Texas and Oklahoma. In a year where the ratio of oil to natural
gas prices reached a high of over 50 to 1, the Company’s liquids
production growth of 67 percent compared to 2011 allowed
the Company to capitalize on the significant price premium
for oil relative to natural gas. In addition to its active drilling
programs in the Eagle Ford and Marmaton plays, Cabot added
a third liquids-focused play to its portfolio during the year in the
Pearsall Shale, which is in the early stages of exploitation.
EAGLE FORD SHALE
A primary focus for the Company during 2012 was
the development of its 62,000 net acre position in the high
rate of return oil window of the Eagle Ford Shale in South
Texas. Cabot built on its momentum from 2011 by drilling
approximately 23 net Eagle Ford wells in 2012. The Company
continues to be encouraged by its results to date as the most
recently drilled wells had an average 24-hour peak production
rate over 800 Boepd and an average 30-day production rate
over 525 Boepd. Cabot expects results to continue to improve
as it optimizes its completion techniques in the play.
The Company’s economics in the Eagle Ford continue
to improve as a result of realized cost efficiencies and strategic
marketing efforts. Cabot recently began transporting its oil
production via pipeline to the Gulf Coast, which has resulted in
a significant uplift in oil price realizations.
During the year Cabot began a down-spacing pilot
program to test 400’ spacing between horizontal laterals and
was encouraged by the results. One of the pilot wells had the
best average 30-day production rate of any of the wells the

21
TOTAL COMPANY DAILY NET LIQUIDS PRODUCTION (Bbls/day)
Company has drilled to date in the play, while the second well
trended above the average 30-day production rate for the entire
Eagle Ford program. Cabot continues to see consistent results
from its subsequent down-spacing tests. Based on the success
of the down-spacing initiative, the Company has identified
over 550 mapped locations in the Buckhorn area of its acreage,
which represents approximately 65 percent of its total Eagle Ford
position, doubling its potential recoverable reserves in the area.
MARMATON OIL PLAY
Cabot entered the Marmaton oil play in the Oklahoma
and Texas panhandles in 2011 and has since grown its position
to over 70,000 net acres. The Company increased its activity in
this oil play from four net wells drilled in 2011 to approximately
18 net wells drilled in 2012. As the Company furthers its technical
effort to better understand the highly fractured nature of the
play, the well results continue to improve. Cabot drilled four
extended reach lateral wells during 2012 at an average lateral
length of almost 9,500’ per well. Three of these extended reach
lateral wells are currently producing and achieved an average
24-hour peak production rate of 792 Boepd comprised of 90
percent oil. Based on the positive results of these wells to date,
the Company plans to drill extended reach lateral wells for the
majority of its 2013 program.
PEARSALL SHALE
Cabot announced a new liquids-focused exploitation
play during 2012 with its entry into the Pearsall Shale via a joint
venture with a wholly-owned U.S. subsidiary of Osaka Gas Co.,
Ltd. While the play is still in its infancy, the Company continues
to move up the learning curve with each incremental well
drilled. Cabot drilled a total of four Pearsall wells in 2012 and as
the Company continues to test different drilling and completion
techniques, the results will be further assessed to determine
how the economics of the play compare to the rest of the
Company’s portfolio. Cabot currently has approximately
71,000 net acres in the Pearsall Shale.
For 2013 the Company plans to allocate approximately
30 percent of its capital program to its oil initiatives in Texas and
Oklahoma and will drill approximately 50 net wells between
these three liquids-rich plays.
2,352
3,955
6,577
2010 2011 2012
22
23

24

25
INCOME STATEMENT (In millions, except per share amounts) 2010 2011 2012
Operating Revenue $ 863.1 $ 979.9 $ 1,204.5
Operating Expenses 703.0 736.4 949.0
Operating Income 266.4 306.8 306.1
Net Income 103.4 122.4 131.7
Per Share 0.50 0.59 0.63
Common Dividend Per Share $ 0.06 $ 0.06 $ 0.08
Average Common Shares Outstanding (In thousands) 207,823 208,498 209,538
CASH FLOW (In millions) 2010 2011 2012
Discretionary Cash Flow $ 471.9 $ 549.2 $ 680.1
Cash Flows from Operations 484.9 501.8 652.1
Cash Flows from Investing (613.7) (487.6) (765.5)
Cash Flows from Financing $ 144.6 $ (40.3) $ 114.2
BALANCE SHEET (In millions) 2010 2011 2012
Current Assets $ 203.0 $ 345.8 $ 270.3
Current Liabilities 303.8 343.3 444.1
Short-Term Debt 0.0 0.0 75.0
Long-Term Debt 975.0 950.0 1,012.0
Equity $ 1,872.7 $ 2,104.8 $ 2,131.4
Financial Highlights
(1) Debt associated with Revolving Credit Facility
DEBT MATURITY SCHEDULE (In millions)
2018
2020
2021
2023
2026
2013 $75
$312
2017 $325(1)
2016 $20
$100
$88
$105
$62

26
WELLS DRILLED 2010 2011 2012
Total Gross 113 161 170
Total Net 87 96 118
% Gross Success Rate 98% 99% 98%
PROVED RESERVES 2010 2011 2012
Natural Gas (Bcf) 2,644.2 2,909.9 3,696.1
Oil, Condensate & Natural Gas Liquids (Mmbbl) 9.5 20.5 24.4
Total Proved (Bcfe) 2,701.1 3,032.7 3,842.4
Total Developed (Bcfe) 1,724.2 1,799.6 2,293.2
% Gas 98% 96% 96%
% Developed 64% 59% 60%
RESERVE ADDITIONS (Bcfe) 2010 2011 2012
Additions 650.6 710.0 926.8
Additions, Revisions & Purchases 788.0 731.5 1,115.4
Reserve Replacement 603% 390% 417%
FINDING & DEVELOPMENT COSTS ($/Mcfe) 2010 2011 2012
Additions $ 1.27 $ 1.25 $ 1.05
Additions & Revisions 1.05 1.21 0.87
All Sources $ 1.05 $ 1.21 $ 0.87
GAS (Bcf) LIQUIDS (Mbbl) TOTAL (Bcfe)
Operational Highlights
PRODUCTION
2010
125.5
253.2
2011
178.8
2010
130.6
20122011
187.5
2010
858
2012
2,407
2011
1,443
2012
267.7

27

28
Board of Directors
Dan O. Dinges
Chairman, President and
Chief Executive Officer
Rhys J. Best
Former Chairman and
Chief Executive Officer,
Lone Star Technologies, Inc.
James R. Gibbs
Former Chairman, President
and Chief Executive Officer,
Frontier Oil Corporation
Robert L. Keiser
Former Chairman and
Chief Executive Officer,
Oryx Energy Company
Robert Kelley
Former Chairman,
President and Chief Executive
Officer, Noble Affiliates, Inc.
(Subsequently renamed
Noble Energy Inc.)
P. Dexter Peacock (Lead Director)
Of Counsel, Andrews Kurth L.L.P.
Former Managing Partner,
Andrews Kurth L.L.P.
W. Matt Ralls
President, Chief Executive Officer
and Director, Rowan Companies, Inc.
DIRECTORS COMMITTEES
AUDIT COMMITTEE
Robert Kelley – Chairman
Rhys J. Best
Robert L. Keiser
COMPENSATION COMMITTEE
Rhys J. Best – Chairman
James R. Gibbs
P. Dexter Peacock
EXECUTIVE COMMITTEE
P. Dexter Peacock – Chairman
Dan O. Dinges
James R. Gibbs
CORPORATE GOVERNANCE
AND NOMINATIONS COMMITTEE
James R. Gibbs – Chairman
P. Dexter Peacock
W. Matt Ralls
SAFETY AND ENVIRONMENTAL
AFFAIRS COMMITTEE
Robert L. Keiser – Chairman
Robert Kelley
W. Matt Ralls

29
Officers
Dan O. Dinges
Chairman, President and
Chief Executive Officer
Scott C. Schroeder
Vice President,
Chief Financial Officer and Treasurer
G. Kevin Cunningham
Vice President,
General Counsel
Robert G. Drake
Vice President,
Information Services and
Operational Accounting
Jeffrey W. Hutton
Vice President, Marketing
Todd L. Liebl
Vice President,
Land and Business Development
Steven W. Lindeman
Vice President,
Engineering and Technology
James M. Reid
Vice President and
Regional Manager, South Region
Phillip L. Stalnaker
Vice President and
Regional Manager, North Region
Todd M. Roemer
Controller
Deidre L. Shearer
Corporate Secretary and
Managing Counsel

30
Corporate Information
ANNUAL MEETING
The annual meeting of the shareholders
will be held Thursday, May 2, 2013,
at 8:00 a.m. (Central) at the corporate office in
Houston, Texas.
CORPORATE OFFICE
Cabot Oil & Gas Corporation
Three Memorial City Plaza
840 Gessner, Suite 1400
Houston, TX 77024
P.O. Box 4544
Houston, Texas 77210-4544
(281) 589-4600
www.cabotog.com
INDEPENDENT REGISTERED
PUBLIC ACCOUNTING FIRM
PricewaterhouseCoopers LLP
1201 Louisiana, Suite 2900
Houston, Texas 77002
RESERVE ENGINEERS
Miller & Lents, Ltd
Oil & Gas Consultants
909 Fannin, Suite 1300
Houston, Texas 77010
INVESTOR RELATIONS
Additional copies of the Form 10-K are
available without charge. Shareholders,
securities analysts, portfolio managers and
others who have questions or need additional
information concerning the Company may
contact:
Scott C. Schroeder
Vice President,
Chief Financial Officer
and Treasurer
(281) 589-4993
TRANSFER AGENT/REGISTRAR
Wells Fargo Bank N.A.
Shareowner Services
1110 Centre Pointe Curve, Suite 101
Mendota Heights, MN 55120-4100
(800) 468-9716
www.shareowneronline.com
General Inquiries:
Wells Fargo Shareowner Services
P.O. Box 64854
St. Paul, MN 55164-0856
(800) 468-9716
Certified/Overnight Mail:
Wells Fargo Shareowner Services
1110 Centre Pointe Curve, Suite 101
Mendota Heights, MN 55120-4100
Telephone Number for
Foreign Shareholders:
(651) 450-4064
PERFORMANCE GRAPH
CR
OX
SO
N D
esi
gn
ww
w.c
roxs
on
de
sig
n.c
om
The following graph compares our common stock performance with the performance of the Standard & Poors’ 500 Stock Index and the Dow Jones U.S. Exploration & Production Index for the period December 2007 through December 2012. The graph assumes that the value of the investment in our common stock and in each index was $100 on December 31, 2007 and that all dividends were reinvested.
250
200
150
100
02007 2008 2009 2010 2011 2012
n CABOT OIL & GAS CORPORATION
n S&P 500
n DOW JONES U.S. EXPLORATION & PRODUCTION
250
109
100

CR
OX
SO
N D
esi
gn
ww
w.c
roxs
on
de
sig
n.c
om

Three Memorial City Plaza840 Gessner Road, Suite 1400 Houston, Texas 77024
(281) 589-4600
www.cabotog.com