united states securities and exchange commission washington, d.c. 20549 form 10 … · ·...
TRANSCRIPT

UNITED STATES
SECURITIES AND EXCHANGE COMMISSION
WASHINGTON, D.C. 20549
FORM 10-Q
[X] Quarterly Report Pursuant to Section 13 or 15(d) of the Securities Exchange Act of 1934
For the quarterly period ended September 30, 2017
or
[ ] Transition Report Pursuant to Section 13 or 15(d) of the Securities Exchange Act of 1934
For the transition period from ____________ to ____________.
Commission File Number: 001-33519
PUBLIC STORAGE (Exact name of registrant as specified in its charter)
Maryland 95-3551121
(State or other jurisdiction of
incorporation or organization)
(I.R.S. Employer Identification Number)
701 Western Avenue, Glendale, California 91201-2349
(Address of principal executive offices) (Zip Code)
Registrant’s telephone number, including area code: (818) 244-8080.
Indicate by check mark whether the registrant (1) has filed all reports required to be filed by Section 13 or 15(d) of the Securities Exchange Act of 1934 during the preceding 12 months (or for such shorter period that the registrant was required to file such reports), and (2) has been subject to such filing requirements for at least the past 90 days.
[X] Yes [ ] No
Indicate by check mark whether the registrant has submitted electronically and posted on its corporate Web site, if any, every Interactive Data File required to be submitted and posted pursuant to Rule 405 of Regulation S-T (§232.405 of this chapter) during the preceding 12 months (or for such shorter period that the registrant was required to submit and post such files).
[X] Yes [ ] No
Indicate by check mark whether the registrant is a large accelerated filer, an accelerated filer, a non-accelerated filer, a smaller reporting company, or an emerging growth company. See the definitions of “large accelerated filer,” “accelerated filer,” “smaller reporting company,” and “emerging growth company” in Rule 12b-2 of the Exchange Act.
Large accelerated filer
Accelerated filer
Non-accelerated filer
Smaller reporting company
Emerging growth company
[X] [ ] [ ] [ ] [ ]
If an emerging growth company, indicate by check mark if the registrant has elected not to use the extended transition period for complying with any new or revised financial accounting standards provided pursuant to Section 13(a) of the Exchange Act. [ ]
Indicate by check mark whether the registrant is a shell company (as defined in Rule 12b-2 of the Exchange Act).
[ ] Yes [X] No
Indicate the number of the registrant’s outstanding common shares of beneficial interest, as of October 30, 2017:
Common Shares of beneficial interest, $.10 par value per share – 174,041,219 shares

PUBLIC STORAGE
INDEX
PART I FINANCIAL INFORMATION Pages Item 1. Financial Statements (Unaudited) Balance Sheets at September 30, 2017 and December 31, 2016 1 Statements of Income for the Three and Nine Months Ended September 30, 2017 and
2016 2
Statements of Comprehensive Income for the Three and Nine Months Ended
September 30, 2017 and 2016 3 Statement of Equity for the Nine Months ended September 30, 2017 4 Statements of Cash Flows for the Nine Months ended September 30, 2017 and 2016 5-6 Condensed Notes to Financial Statements 7-28 Item 2. Management’s Discussion and Analysis of
Financial Condition and Results of Operations 29-54 Item 3. Quantitative and Qualitative Disclosures About Market Risk 54 Item 4. Controls and Procedures 54-55 PART II OTHER INFORMATION (Items 3, 4 and 5 are not applicable) Item 1. Legal Proceedings 56 Item 1A. Risk Factors 56 Item 2. Unregistered Sales of Equity Securities and Use of Proceeds 56 Item 6. Exhibits 56

See accompanying notes.
1
PUBLIC STORAGE
BALANCE SHEETS
(Amounts in thousands, except share data)
September 30, December 31,
2017 2016
ASSETS (Unaudited)
Cash and cash equivalents $ 694,233 $ 183,688
Real estate facilities, at cost:
Land 3,851,679 3,781,479
Buildings 10,518,224 10,181,750
14,369,903 13,963,229
Accumulated depreciation (5,585,825) (5,270,963)
8,784,078 8,692,266
Construction in process 221,970 230,310
9,006,048 8,922,576
Investments in unconsolidated real estate entities 726,168 689,207
Goodwill and other intangible assets, net 205,868 212,719
Other assets 133,377 122,148
Total assets $ 10,765,694 $ 10,130,338
LIABILITIES AND EQUITY
Notes payable $ 1,425,854 $ 390,749
Accrued and other liabilities 380,420 297,935
Total liabilities 1,806,274 688,684
Commitments and contingencies (Note 12)
Equity:
Public Storage shareholders’ equity:
Preferred Shares, $0.01 par value, 100,000,000 shares authorized,
161,000 shares issued (in series) and outstanding, (174,700 at
December 31, 2016), at liquidation preference 4,025,000 4,367,500
Common Shares, $0.10 par value, 650,000,000 shares authorized,
173,738,808 shares issued and outstanding (173,288,787 shares at
December 31, 2016) 17,374 17,329
Paid-in capital 5,631,049 5,609,768
Accumulated deficit (662,360) (487,581)
Accumulated other comprehensive loss (74,873) (95,106)
Total Public Storage shareholders’ equity 8,936,190 9,411,910
Noncontrolling interests 23,230 29,744
Total equity 8,959,420 9,441,654
Total liabilities and equity $ 10,765,694 $ 10,130,338

See accompanying notes.
2
PUBLIC STORAGE
STATEMENTS OF INCOME
(Amounts in thousands, except per share amounts)
(Unaudited)
Three Months Ended Nine Months Ended
September 30, September 30,
2017 2016 2017 2016
Revenues:
Self-storage facilities $ 646,238 $ 623,157 $ 1,878,215 $ 1,792,130
Ancillary operations 40,123 39,991 118,005 116,992
686,361 663,148 1,996,220 1,909,122
Expenses:
Self-storage cost of operations 173,315 165,905 516,488 483,455
Ancillary cost of operations 17,304 12,722 39,611 40,462
Depreciation and amortization 113,320 109,432 334,426 321,573
General and administrative 22,311 22,140 62,331 63,508
326,250 310,199 952,856 908,998
Operating income 360,111 352,949 1,043,364 1,000,124
Interest and other income 4,569 3,750 12,722 11,614
Interest expense (2,389) (1,221) (4,553) (3,310)
Equity in earnings of unconsolidated real estate entities 17,218 17,237 57,235 41,628
Foreign currency exchange loss (13,446) (3,665) (44,452) (5,987)
Casualty loss (7,789) - (7,789) -
Gain on real estate investment sales - - 975 689
Net income 358,274 369,050 1,057,502 1,044,758
Allocation to noncontrolling interests (1,600) (1,745) (4,684) (4,921)
Net income allocable to Public Storage shareholders 356,674 367,305 1,052,818 1,039,837
Allocation of net income to:
Preferred shareholders - distributions (61,055) (57,178) (182,457) (178,666)
Preferred shareholders - redemptions (Note 8) (14,692) - (29,330) (26,873)
Restricted share units (1,210) (1,170) (3,502) (3,231)
Net income allocable to common shareholders $ 279,717 $ 308,957 $ 837,529 $ 831,067
Net income per common share:
Basic $ 1.61 $ 1.78 $ 4.83 $ 4.80
Diluted $ 1.61 $ 1.78 $ 4.81 $ 4.78
Basic weighted average common shares outstanding 173,715 173,108 173,560 173,057
Diluted weighted average common shares outstanding 174,240 173,848 174,128 173,899

See accompanying notes.
3
PUBLIC STORAGE
STATEMENTS OF COMPREHENSIVE INCOME
(Amounts in thousands)
(Unaudited)
Three Months Ended September 30, Nine Months Ended September 30,
2017 2016 2017 2016
Net income $ 358,274 $ 369,050 $ 1,057,502 $ 1,044,758
Other comprehensive income (loss):
Aggregate foreign currency exchange loss (6,176) (8,341) (24,219) (20,165)
Adjust for aggregate foreign currency exchange
gain in equity in earnings of unconsolidated
real estate entities - - - (941)
Adjust for aggregate foreign currency exchange
loss included in net income 13,446 3,665 44,452 5,987
Other comprehensive income (loss) 7,270 (4,676) 20,233 (15,119)
Total comprehensive income 365,544 364,374 1,077,735 1,029,639
Allocation to noncontrolling interests (1,600) (1,745) (4,684) (4,921)
Comprehensive income allocable to
Public Storage shareholders $ 363,944 $ 362,629 $ 1,073,051 $ 1,024,718

See accompanying notes.
4
PUBLIC STORAGE
STATEMENT OF EQUITY
(Amounts in thousands, except share and per share amounts)
(Unaudited)
Accumulated Total
Cumulative Other Public Storage
Preferred Common Paid-in Accumulated Comprehensive Shareholders’ Noncontrolling Total
Shares Shares Capital Deficit Loss Equity Interests Equity
Balances at December 31, 2016 $ 4,367,500 $ 17,329 $ 5,609,768 $ (487,581) $ (95,106) $ 9,411,910 $ 29,744 $ 9,441,654
Issuance of 23,200 preferred shares (Note 8) 580,000 - (18,823) - - 561,177 - 561,177
Redemption of 36,900 preferred shares (Note 8) (922,500) - - - - (922,500) - (922,500)
Issuance of common shares in connection with
share-based compensation (450,021 shares) (Note 10) - 45 34,709 - - 34,754 - 34,754
Cash paid in lieu of common shares, net of
share-based compensation expense (Note 10) - - 13,096 - - 13,096 - 13,096
Acquisition of noncontrolling interests - - (7,701) - - (7,701) (6,724) (14,425)
Contributions by noncontrolling interests - - - - - - 1,066 1,066
Net income - - - 1,057,502 - 1,057,502 - 1,057,502
Net income allocated to noncontrolling interests - - - (4,684) - (4,684) 4,684 -
Distributions to equity holders:
Preferred shares (Note 8) - - - (182,457) - (182,457) - (182,457)
Noncontrolling interests - - - - - - (5,540) (5,540)
Common shares and restricted share units
($6.00 per share) - - - (1,045,140) - (1,045,140) - (1,045,140)
Other comprehensive income (Note 2) - - - - 20,233 20,233 - 20,233
Balances at September 30, 2017 $ 4,025,000 $ 17,374 $ 5,631,049 $ (662,360) $ (74,873) $ 8,936,190 $ 23,230 $ 8,959,420

See accompanying notes. 5
PUBLIC STORAGE
STATEMENTS OF CASH FLOWS
(Amounts in thousands)
(Unaudited)
Nine Months Ended September 30,
2017 2016
Cash flows from operating activities:
Net income $ 1,057,502 $ 1,044,758
Adjustments to reconcile net income to net cash provided
by operating activities:
Gain on real estate investment sales (975) (689)
Casualty loss 7,789 -
Depreciation and amortization 334,426 321,573
Equity in earnings of unconsolidated real estate entities (57,235) (41,628)
Distributions from retained earnings of unconsolidated
real estate entities 39,887 72,461
Foreign currency exchange loss 44,452 5,987
Share-based compensation expense 25,505 26,845
Other 51,168 50,733
Total adjustments 445,017 435,282
Net cash provided by operating activities 1,502,519 1,480,040
Cash flows from investing activities:
Capital expenditures to maintain real estate facilities (84,797) (62,032)
Construction in process (240,482) (190,412)
Acquisition of real estate facilities and intangible assets (81,676) (257,650)
Distributions in excess of retained earnings from
unconsolidated real estate entities - 67,420
Proceeds from sale of real estate investments 5,596 998
Other 4,162 (13,883)
Net cash used in investing activities (397,197) (455,559)
Cash flows from financing activities:
Repayments on notes payable (1,267) (19,995)
Issuance of notes payable 992,129 113,620
Issuance of preferred shares 561,177 798,128
Issuance of common shares 34,754 14,191
Redemption of preferred shares (922,500) (862,500)
Cash paid upon vesting of restricted share units (12,409) (13,604)
Acquisition of noncontrolling interests (14,425) -
Contributions by noncontrolling interests 1,066 3,177
Distributions paid to Public Storage shareholders (1,227,597) (1,098,763)
Distributions paid to noncontrolling interests (5,540) (5,608)
Net cash used in financing activities (594,612) (1,071,354)
Net increase (decrease) in cash and cash equivalents 510,710 (46,873)
Net effect of foreign exchange translation on cash and cash equivalents (165) (199)
Cash and cash equivalents at the beginning of the period 183,688 104,285
Cash and cash equivalents at the end of the period $ 694,233 $ 57,213

See accompanying notes. 6
PUBLIC STORAGE
STATEMENTS OF CASH FLOWS
(Amounts in thousands)
(Unaudited)
Nine Months Ended September 30,
2017 2016
Supplemental schedule of non-cash investing and
financing activities:
Foreign currency translation adjustment:
Real estate facilities, net of accumulated depreciation $ (595) $ 1,014
Investments in unconsolidated real estate entities (19,613) 13,074
Notes payable 44,262 5,878
Accumulated other comprehensive loss (24,219) (20,165)
Real estate acquired in exchange for assumption of notes payable - (12,945)
Notes payable assumed in connection with acquisition of real estate - 12,945
Accrued construction costs and capital expenditures:
Capital expenditures to maintain real estate facilities 2,272 (5,747)
Construction in process (10,527) (13,679)
Accrued and other liabilities 8,255 19,426
PUBLIC STORAGE
NOTES TO FINANCIAL STATEMENTS
September 30, 2017
(Unaudited)
7
1. Description of the Business
Public Storage (referred to herein as “the Company,” “we,” “us,” or “our”), a Maryland real estate investment trust (“REIT”), was organized in 1980. Our principal business activities include the ownership and operation of self-storage facilities which offer storage spaces for lease, generally on a month-to-month basis, for personal and business use, ancillary activities such as merchandise sales and tenant reinsurance to the tenants at our self-storage facilities, as well as the acquisition and development of additional self-storage space.
At September 30, 2017, we have direct and indirect equity interests in 2,374 self-storage facilities (with approximately 157 million net rentable square feet) located in 38 states in the United States (“U.S.”) operating under the “Public Storage” name. We also own one self-storage facility in London, England and we have a 49% interest in Shurgard Europe, which owns 219 self-storage facilities (with approximately 12 million net rentable square feet) located in seven Western European countries, all operating under the “Shurgard” name. We also have direct and indirect equity interests in approximately 29 million net rentable square feet of commercial space located in seven states in the U.S. primarily owned and operated by PS Business Parks, Inc. (“PSB”) under the “PS Business Parks” name. At September 30, 2017, we have an approximate 42% common equity interest in PSB.
Disclosures of the number and square footage of facilities, as well as the number and coverage of tenant reinsurance policies (Note 12) are unaudited and outside the scope of our independent registered public accounting firm’s review of our financial statements in accordance with the standards of the Public Company Accounting Oversight Board (U.S.).
2. Summary of Significant Accounting Policies
Basis of Presentation
We have prepared the accompanying interim financial statements in accordance with U.S. generally accepted accounting principles (“GAAP”) as set forth in the Accounting Standards Codification of the Financial Accounting Standards Board (“FASB”), and in conformity with the rules and regulations of the Securities and Exchange Commission (“SEC”). In our opinion, the interim financial statements presented herein reflect all adjustments, of a normal recurring nature, that are necessary to fairly present the interim financial statements. Because they do not include all of the disclosures required by GAAP for complete annual financial statements, these interim financial statements should be read together with the audited financial statements and related notes included in the Company’s Annual Report on Form 10-K for the year ended December 31, 2016.
Consolidation and Equity Method of Accounting
We consider entities to be Variable Interest Entities (“VIEs”) when they have insufficient equity to finance their activities without additional subordinated financial support provided by other parties, or the equity holders as a group do not have a controlling financial interest. We consolidate VIEs when we have (i) the power to direct the activities most significantly impacting economic performance, and (ii) either the obligation to absorb losses or the right to receive benefits from the VIE. We have no involvement with any material VIEs. We consolidate all other entities when we control them through voting shares or contractual rights. The entities we consolidate, for the period in which the reference applies, are referred to collectively as the “Subsidiaries,” and we eliminate intercompany transactions and balances.
We account for our investments in entities that we do not consolidate but have significant influence over using the equity method of accounting. These entities, for the periods in which the reference applies, are referred to collectively as the “Unconsolidated Real Estate Entities”, eliminating intra-entity profits and losses
PUBLIC STORAGE
NOTES TO FINANCIAL STATEMENTS
September 30, 2017
(Unaudited)
8
and amortizing any differences between the cost of our investment and the underlying equity in net assets against equity in earnings as if the Unconsolidated Real Estate Entity were a consolidated subsidiary. Equity in earnings of unconsolidated real estate entities represents our pro-rata share of the earnings of the Unconsolidated Real Estate Entities.
When we begin consolidating an entity, we record a gain or loss representing the differential between the book value and fair value of any preexisting equity interest. All changes in consolidation status are reflected prospectively.
Collectively, at September 30, 2017, the Company and the Subsidiaries own 2,362 self-storage facilities in the U.S., one self-storage facility in London, England and three commercial facilities in the U.S. At September 30, 2017, the Unconsolidated Real Estate Entities are comprised of PSB, Shurgard Europe, as well as limited partnerships that own an aggregate of 12 self-storage facilities in the U.S.
Use of Estimates
The financial statements and accompanying notes reflect our estimates and assumptions. Actual results could differ from those estimates and assumptions.
Income Taxes
We have elected to be treated as a REIT, as defined in the Internal Revenue Code of 1986, as amended (the “Code”). As a REIT, we do not incur federal income tax if we distribute 100% of our REIT taxable income each year, and if we meet certain organizational and operational rules. We believe we have met these REIT requirements for all periods presented herein. Accordingly, we have recorded no federal income tax expense related to our REIT taxable income.
Our merchandise and tenant reinsurance operations are subject to corporate income tax and such taxes are included in ancillary cost of operations. We also incur income and other taxes in certain states, which are included in general and administrative expense.
We recognize tax benefits of uncertain income tax positions that are subject to audit only if we believe it is more likely than not that the position would ultimately be sustained assuming the relevant taxing authorities had full knowledge of the relevant facts and circumstances of our positions. As of September 30, 2017, we had no tax benefits that were not recognized.
Real Estate Facilities
Real estate facilities are recorded at cost. We capitalize all costs incurred to acquire, develop, construct, renovate and improve facilities, including interest and property taxes incurred during the construction period and, effective October 1, 2016, the external transaction costs associated with acquisitions of real estate. Prior to October 1, 2016, transaction costs for acquisitions were included in general and administrative expense on our income statements. This change was made due to a change in GAAP, which results in real estate facility acquisitions generally being considered acquisitions of assets rather than business combinations. We allocate the net acquisition cost of acquired real estate facilities to the underlying land, buildings, and identified intangible assets based upon their respective individual estimated fair values.
Costs associated with dispositions of real estate, as well as repairs and maintenance costs, are expensed as incurred. We depreciate buildings and improvements on a straight-line basis over estimated useful lives ranging generally between 5 to 25 years.
PUBLIC STORAGE
NOTES TO FINANCIAL STATEMENTS
September 30, 2017
(Unaudited)
9
Other Assets
Other assets primarily consist of rents receivable from our tenants, prepaid expenses and restricted cash.
Accrued and Other Liabilities
Accrued and other liabilities consist primarily of rents prepaid by our tenants, trade payables, property tax accruals, accrued payroll, accrued tenant reinsurance losses, and contingent loss accruals when probable and estimable. We believe the fair value of our accrued and other liabilities approximates book value, due to the short period until repayment. We disclose the nature of significant unaccrued losses that are reasonably possible of occurring and, if estimable, a range of exposure.
Cash Equivalents, Marketable Securities and Other Financial Instruments
Cash equivalents represent highly liquid financial instruments such as money market funds with daily liquidity or short-term commercial paper or treasury securities maturing within three months of acquisition. Cash and cash equivalents which are restricted from general corporate use are included in other assets. We believe that the book value of all such financial instruments for all periods presented approximates fair value, due to the short period to maturity.
Fair Value
As used herein, the term “fair value” is the price that would be received to sell an asset or paid to transfer a liability in an orderly transaction between market participants. Our estimates of fair value involve considerable judgment and are not necessarily indicative of the amounts that could be realized in current market exchanges.
We estimate the fair value of our cash and cash equivalents, marketable securities, other assets, debt, and other liabilities by applying a discount rate to the future cash flows of the financial instrument. The discount rate is based upon quoted interest rates for securities that have similar characteristics such as credit quality and time to maturity; such quoted interest rates are referred to generally as “Level 2” inputs.
Currency and Credit Risk
Financial instruments that are exposed to credit risk consist primarily of cash and cash equivalents, certain portions of other assets including rents receivable from our tenants and restricted cash. Cash equivalents we invest in are either money market funds with a rating of at least AAA by Standard & Poor’s, commercial paper that is rated A1 by Standard & Poor’s or deposits with highly rated commercial banks.
At September 30, 2017, due primarily to our investment in Shurgard Europe (Note 4) and our notes payable denominated in Euros (Note 6), our operating results and financial position are affected by fluctuations in currency exchange rates between the Euro, and to a lesser extent, other European currencies, against the U.S. Dollar.
Goodwill and Other Intangible Assets
Intangible assets are comprised of goodwill, the “Shurgard” trade name, acquired customers in place, and leasehold interests in land.

PUBLIC STORAGE
NOTES TO FINANCIAL STATEMENTS
September 30, 2017
(Unaudited)
10
Goodwill totaled $174.6 million at September 30, 2017 and December 31, 2016. The “Shurgard” trade name, which is used by Shurgard Europe pursuant to a fee-based licensing agreement, has a book value of $18.8 million at September 30, 2017 and December 31, 2016. Goodwill and the “Shurgard” trade name have indefinite lives and are not amortized.
Acquired customers in place and leasehold interests in land are finite-lived assets and are amortized relative to the benefit of the customers in place or the benefit to land lease expense to each period. At September 30, 2017, these intangibles had a net book value of $12.5 million ($19.3 million at December 31, 2016). Accumulated amortization totaled $31.3 million at September 30, 2017 ($54.0 million at December 31, 2016), and amortization expense of $11.9 million and $15.8 million was recorded in the nine months ended September 30, 2017 and 2016, respectively. The estimated future amortization expense for our finite-lived intangible assets at September 30, 2017 is approximately $2.3 million in the remainder of 2017, $4.0 million in 2018 and $6.2 million thereafter. During the nine months ended September 30, 2017, intangibles increased $5.1 million in connection with the acquisition of self-storage facilities (Note 3).
Evaluation of Asset Impairment
We evaluate our real estate and finite-lived intangible assets for impairment each quarter. If there are indicators of impairment and we determine that the asset is not recoverable from future undiscounted cash flows to be received through the asset’s remaining life (or, if earlier, the expected disposal date), we record an impairment charge to the extent the carrying amount exceeds the asset’s estimated fair value or net proceeds from expected disposal.
We evaluate our investments in unconsolidated real estate entities for impairment on a quarterly basis. We record an impairment charge to the extent the carrying amount exceeds estimated fair value, when we believe any such shortfall is other than temporary.
We evaluate goodwill for impairment annually and whenever relevant events, circumstances and other related factors indicate that fair value of the related reporting unit may be less than the carrying amount. If we determine that the fair value of the reporting unit exceeds the aggregate carrying amount, no impairment charge is recorded. Otherwise, we record an impairment charge to the extent the carrying amount of the goodwill exceeds the amount that would be allocated to goodwill if the reporting unit were acquired for estimated fair value.
We evaluate other indefinite-lived intangible assets, such as the “Shurgard” trade name for impairment at least annually and whenever relevant events, circumstances and other related factors indicate that the fair value is less than the carrying amount. When we conclude that it is likely that the asset is not impaired, we do not record an impairment charge and no further analysis is performed. Otherwise, we record an impairment charge to the extent the carrying amount exceeds the asset’s estimated fair value.
No impairments were recorded in any of our evaluations for any period presented herein.
Casualty Loss
We record casualty losses for a) the book value of assets destroyed and b) incremental repair, clean-up, and other costs associated with the casualty. Insurance proceeds are recorded as a reduction in casualty loss when all uncertainties of collection are satisfied. During the three and nine months ended September 30, 2017, we incurred casualty losses totaling $7.8 million, comprised of $3.3 million in book value of assets damaged and $4.5 million in repairs and maintenance incurred in connection with Hurricanes Harvey and Irma.

PUBLIC STORAGE
NOTES TO FINANCIAL STATEMENTS
September 30, 2017
(Unaudited)
11
Revenue and Expense Recognition
Revenues from self-storage facilities, which are primarily composed of rental income earned pursuant to month-to-month leases, as well as associated late charges and administrative fees, are recognized as earned. Promotional discounts reduce rental income over the promotional period, which is generally one month. Ancillary revenues and interest and other income are recognized when earned.
We accrue for property tax expense based upon actual amounts billed and, in some circumstances, estimates when bills or assessments have not been received from the taxing authorities. If these estimates are incorrect, the timing and amount of expense recognition could be incorrect. Cost of operations (including advertising expenditures), general and administrative expense, and interest expense are expensed as incurred.
Foreign Currency Exchange Translation
The local currency (primarily the Euro) is the functional currency for our interests in foreign operations. The related balance sheet amounts are translated into U.S. Dollars at the exchange rates at the respective financial statement date, while amounts on our statements of income are translated at the average exchange rates during the respective period. When financial instruments denominated in a currency other than the U.S. Dollar are expected to be settled in cash in the foreseeable future, the impact of changes in the U.S. Dollar equivalent are reflected in current earnings. The Euro was translated at exchange rates of approximately 1.181 U.S. Dollars per Euro at September 30, 2017 (1.052 at December 31, 2016), and average exchange rates of 1.175 and 1.116 for the three months ended September 30, 2017 and 2016, respectively, and average exchange rates of 1.113 and 1.116 for the nine months ended September 30, 2017 and 2016, respectively. Cumulative translation adjustments, to the extent not included in cumulative net income, are included in equity as a component of accumulated other comprehensive income (loss).
Comprehensive Income
Total comprehensive income represents net income, adjusted for changes in other comprehensive income (loss) for the applicable period. The aggregate foreign currency exchange gains and losses reflected on our statements of comprehensive income are comprised primarily of foreign currency exchange gains and losses on our investment in Shurgard Europe and our unsecured notes denominated in Euros.
Recently Accounting Pronouncements and Guidance
In May 2014, the FASB issued Accounting Standards Update (“ASU”) 2014-09, Revenue from
Contracts with Customers (Topic 606), which requires revenue to be based upon the consideration expected from customers for promised goods or services. The FASB also added guidance with respect to the sale of our real estate facilities. The new standards, effective on January 1, 2018, permit either the retrospective or cumulative effects transition method and allowed for early adoption on January 1, 2017. We did not early adopt these new standards. We plan to adopt the new standards in the first quarter of 2018 utilizing the cumulative effects transition method. We do not believe the new standards will have a material impact on our results of operations or financial condition, primarily because most of our revenue is from rental revenue, which the new standards do not cover, and because we do not provide any material products and services to our customers or sell material amounts of our real estate facilities.
In February 2016, the FASB issued ASU 2016-02, Leases, which amends the existing accounting standards for lease accounting, including requiring lessees to recognize most leases on their balance sheets and making targeted changes to lessor accounting. The new standard, effective on January 1, 2019, requires a modified retrospective transition approach for all leases existing at, or entered into after, the date of initial application, with an option to use certain transition relief and allows for early adoption on January 1, 2016. We

PUBLIC STORAGE
NOTES TO FINANCIAL STATEMENTS
September 30, 2017
(Unaudited)
12
do not believe this standard will have a material impact on our results of operations or financial condition, because substantially all of our lease revenues are derived from month-to-month self-storage leases, and we do not have material amounts of lease expense.
In August 2016, the FASB issued ASU No. 2016-15, Statement of Cash Flows – Classification of
Certain Cash Receipts and Cash Payments. The new standard provides guidance on certain specific cash flow issues, including, but not limited to, debt prepayment or extinguishment costs and distributions received from equity method investees. The standard is effective for periods beginning after December 15, 2017, with early adoption permitted and shall be applied retrospectively where practicable. The Company adopted the new guidance effective January 1, 2017 and has elected to use the cumulative earnings approach to classify distributions received from equity method investees. Under the cumulative earnings approach, distributions up to the amount of cumulative equity in earnings recognized will be treated as returns on investment and those in excess of that amount will be treated as returns of investment. The adoption of the cumulative earnings approach had no impact on our consolidated financial statements for the periods presented.
In November 2016, the FASB issued ASU No. 2016-18, Statement of Cash Flows (Topic 230) -
Restricted Cash, which requires the statement of cash flows to explain the change during the period in the total of cash, cash equivalents, and amounts generally described as restricted cash or restricted cash equivalents. The new guidance also requires entities to reconcile such total to amounts on the balance sheet and disclose the nature of the restrictions. The standard is effective on January 1, 2018, with early adoption permitted. The standard requires the use of the retrospective transition method. We do not expect the adoption of this standard to have a material impact on our consolidated financial statements.
Net Income per Common Share
Net income is allocated to (i) noncontrolling interests based upon their share of the net income of the Subsidiaries, (ii) preferred shareholders, to the extent redemption cost exceeds the related original net issuance proceeds (an “EITF D-42 allocation”), and (iii) the remaining net income is allocated to each of our equity securities based upon the dividends declared or accumulated during the period, combined with participation rights in undistributed earnings.
Basic and diluted net income per common share are each calculated based upon net income allocable to common shareholders presented on the face of our income statement, divided by (i) in the case of basic net income per common share, weighted average common shares, and (ii) in the case of diluted income per share, weighted average common shares adjusted for the impact, if dilutive, of stock options outstanding (Note 10). The following table reconciles from basic to diluted common shares outstanding:

PUBLIC STORAGE
NOTES TO FINANCIAL STATEMENTS
September 30, 2017
(Unaudited)
13
Three Months Ended September 30,
Nine Months Ended September 30,
2017 2016 2017 2016
(Amounts in thousands)
Weighted average common shares and equivalents
outstanding:
Basic weighted average common
shares outstanding 173,715 173,108 173,560 173,057
Net effect of dilutive stock options -
based on treasury stock method 525 740 568 842
Diluted weighted average common
shares outstanding 174,240 173,848 174,128 173,899
3. Real Estate Facilities
Activity in real estate facilities during the nine months ended September 30, 2017 is as follows:
Nine Months Ended
September 30, 2017
(Amounts in thousands)
Operating facilities, at cost:
Beginning balance $ 13,963,229
Capital expenditures to maintain real estate facilities 82,525
Acquisitions 76,603
Dispositions (1,036)
Book value of assets damaged in casualty loss (8,226)
Developed or redeveloped facilities opened for operation 255,327
Impact of foreign exchange rate changes 1,481
Ending balance 14,369,903
Accumulated depreciation:
Beginning balance (5,270,963)
Depreciation expense (319,039)
Dispositions 123
Book value of assets damaged in casualty loss 4,940
Impact of foreign exchange rate changes (886)
Ending balance (5,585,825)
Construction in process:
Beginning balance 230,310
Current development 251,009
Developed or redeveloped facilities opened for operation (255,327)
Dispositions (4,022)
Ending balance 221,970
Total real estate facilities at September 30, 2017 $ 9,006,048

PUBLIC STORAGE
NOTES TO FINANCIAL STATEMENTS
September 30, 2017
(Unaudited)
14
During the nine months ended September 30, 2017, we acquired 14 self-storage facilities (830,000 net rentable square feet), for a total cost of $81.7 million, in cash. Approximately $5.1 million of the total cost was allocated to intangible assets. We completed development and redevelopment activities during the nine months ended September 30, 2017, adding 2.1 million net rentable square feet of self-storage space, at an aggregate cost of $255.3 million. Construction in process at September 30, 2017 consists of projects to develop new self-storage facilities and redevelop existing self-storage facilities, which will add a total of 4.7 million net rentable square feet of storage space at an aggregate estimated cost of approximately $600.2 million. During the nine months ended September 30, 2017, we sold a parcel of land held for development and other portions of real estate facilities in connection with eminent domain proceedings for a total of approximately $5.9 million in cash proceeds, of which $0.3 million was collected in 2016, and recorded a related gain on real estate investment sales of approximately $1.0 million in the nine months ended September 30, 2017.
4. Investments in Unconsolidated Real Estate Entities
The following table sets forth our investments in, and equity in earnings of, the Unconsolidated Real Estate Entities (amounts in thousands):
Investments in Unconsolidated Real Estate Entities at
September 30, 2017 December 31, 2016 PSB $ 401,577 $ 402,765
Shurgard Europe 318,162 280,019
Other Investments 6,429 6,423
Total $ 726,168 $ 689,207
Equity in Earnings of Unconsolidated Real Estate Entities for the
Three Months Ended September 30, Nine Months Ended September 30,
2017 2016 2017 2016 PSB $ 9,261 $ 10,118 $ 35,694 $ 25,318
Shurgard Europe 7,243 6,362 19,484 14,304
Other Investments 714 757 2,057 2,006
Total $ 17,218 $ 17,237 $ 57,235 $ 41,628
During the nine months ended September 30, 2017 and 2016, we received cash distributions from our
investments in the Unconsolidated Real Estate Entities totaling $39.9 million and $139.9 million, respectively. For the nine months ended September 30, 2016, $67.4 million of the distributions received exceeded the retained earnings of the Unconsolidated Real Estate Entities and are presented as an investing activity on our statement of cash flows. At September 30, 2017, the cost of our investment in the Unconsolidated Real Estate Entities exceeds our pro rata share of the underlying equity by approximately $51.0 million ($54.0 million at December 31, 2016). This differential is being amortized as a reduction in equity in earnings of the Unconsolidated Real Estate Entities based upon allocations to the underlying net assets. Such amortization was approximately $1.0 million and $1.3 million during the nine months ended September 30, 2017 and 2016, respectively.
Investment in PSB
PSB is a REIT traded on the New York Stock Exchange. We have an approximate 42% common equity interest in PSB as of September 30, 2017 and December 31, 2016, comprised of our ownership of
PUBLIC STORAGE
NOTES TO FINANCIAL STATEMENTS
September 30, 2017
(Unaudited)
15
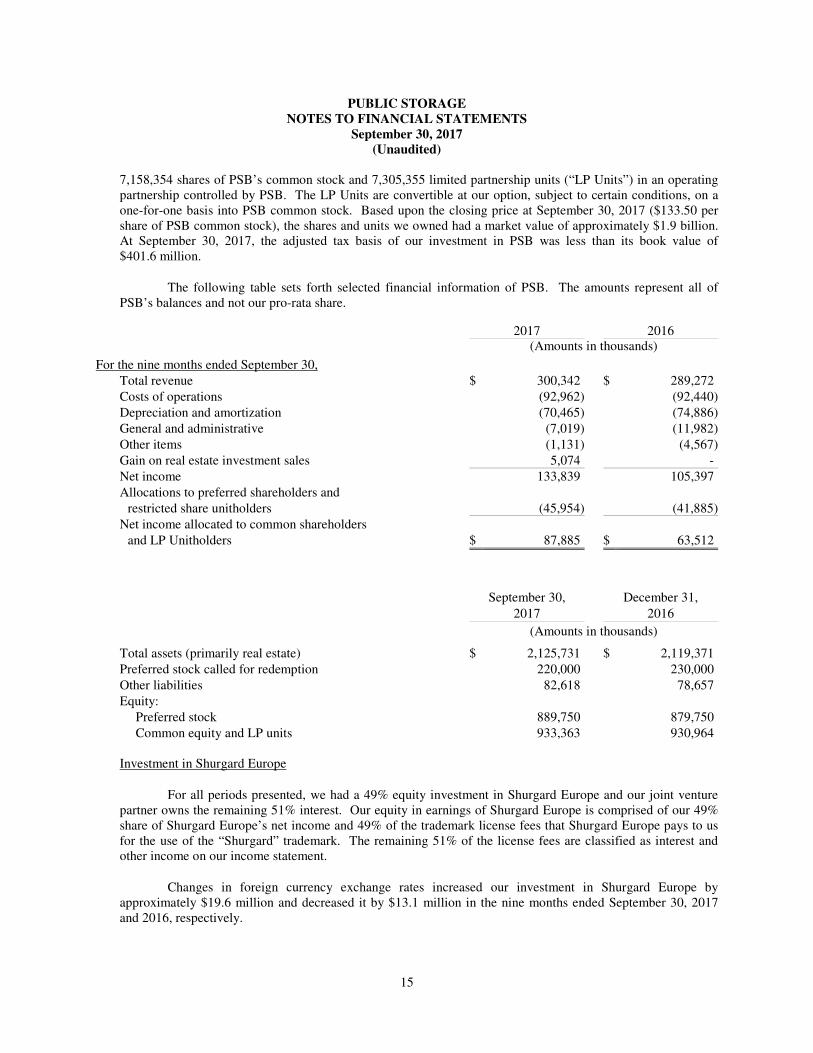
7,158,354 shares of PSB’s common stock and 7,305,355 limited partnership units (“LP Units”) in an operating partnership controlled by PSB. The LP Units are convertible at our option, subject to certain conditions, on a one-for-one basis into PSB common stock. Based upon the closing price at September 30, 2017 ($133.50 per share of PSB common stock), the shares and units we owned had a market value of approximately $1.9 billion. At September 30, 2017, the adjusted tax basis of our investment in PSB was less than its book value of $401.6 million.
The following table sets forth selected financial information of PSB. The amounts represent all of PSB’s balances and not our pro-rata share.
2017 2016
(Amounts in thousands)
For the nine months ended September 30,
Total revenue $ 300,342 $ 289,272
Costs of operations (92,962) (92,440)
Depreciation and amortization (70,465) (74,886)
General and administrative (7,019) (11,982)
Other items (1,131) (4,567)
Gain on real estate investment sales 5,074 -
Net income 133,839 105,397
Allocations to preferred shareholders and
restricted share unitholders (45,954) (41,885)
Net income allocated to common shareholders
and LP Unitholders $ 87,885 $ 63,512
September 30, December 31,
2017 2016
(Amounts in thousands)
Total assets (primarily real estate) $ 2,125,731 $ 2,119,371
Preferred stock called for redemption 220,000 230,000
Other liabilities 82,618 78,657
Equity:
Preferred stock 889,750 879,750
Common equity and LP units 933,363 930,964
Investment in Shurgard Europe
For all periods presented, we had a 49% equity investment in Shurgard Europe and our joint venture partner owns the remaining 51% interest. Our equity in earnings of Shurgard Europe is comprised of our 49% share of Shurgard Europe’s net income and 49% of the trademark license fees that Shurgard Europe pays to us for the use of the “Shurgard” trademark. The remaining 51% of the license fees are classified as interest and other income on our income statement.
Changes in foreign currency exchange rates increased our investment in Shurgard Europe by approximately $19.6 million and decreased it by $13.1 million in the nine months ended September 30, 2017 and 2016, respectively.

PUBLIC STORAGE
NOTES TO FINANCIAL STATEMENTS
September 30, 2017
(Unaudited)
16
The following table sets forth selected consolidated financial information of Shurgard Europe based upon all of Shurgard Europe’s balances for all periods, rather than our pro rata share. Such amounts are based upon our historical acquired book basis.
2017 2016
(Amounts in thousands)
For the nine months ended September 30,
Self-storage and ancillary revenues $ 194,973 $ 189,837
Self-storage and ancillary cost of operations (72,233) (73,456)
Depreciation and amortization (45,194) (49,933)
General and administrative (8,971) (10,951)
Interest expense on third party debt (15,465) (15,615)
Trademark license fee payable to Public Storage (1,947) (1,908)
Income tax expense (12,622) (8,807)
Foreign exchange loss (725) (1,883) Net income $ 37,816 $ 27,284
Average exchange rates of Euro to the U.S. Dollar 1.113 1.116
September 30, December 31,
2017 2016 (Amounts in thousands)
Total assets (primarily self-storage facilities) $ 1,424,695 $ 1,261,912
Total debt to third parties 719,082 666,926
Other liabilities 136,947 106,916
Equity 568,666 488,070
Exchange rate of Euro to U.S. Dollar 1.181 1.052
Other Investments
At September 30, 2017 and December 31, 2016, the “Other Investments” include an average 26% common equity ownership in limited partnerships that collectively own 12 self-storage facilities and have no debt. In the nine months ended September 30, 2016, we sold one of the Other Investments resulting in a $689,000 gain on real estate investment sales on our income statement. In the nine months ended September 30, 2017 and 2016, the Other Investments had $11.9 million and $11.8 million, respectively, in self-storage revenues, $3.7 million and $3.5 million, respectively, in self-storage operating expenses, $195,000 and $396,000, respectively, in depreciation expense, and $81,000 and $50,000, respectively, in general and administrative and other expenses (amounts represent 100% of the operations of these entities, not our pro rata share).
5. Credit Facility
We have a revolving credit agreement (the “Credit Facility”) with a $500 million borrowing limit, which expires on March 31, 2020. Amounts drawn on the Credit Facility bear annual interest at rates ranging from LIBOR plus 0.850% to LIBOR plus 1.450% depending upon the ratio of our Total Indebtedness to Gross

PUBLIC STORAGE
NOTES TO FINANCIAL STATEMENTS
September 30, 2017
(Unaudited)
17
Asset Value (as defined in the Credit Facility) (LIBOR plus 0.850% at September 30, 2017). We are also required to pay a quarterly facility fee ranging from 0.080% per annum to 0.250% per annum depending upon the ratio of our Total Indebtedness to our Gross Asset Value (0.080% per annum at September 30, 2017). At September 30, 2017 and October 31, 2017, we had no outstanding borrowings under this Credit Facility. We had undrawn standby letters of credit, which reduce our borrowing capacity, totaling $18.7 million at September 30, 2017 ($15.2 million at December 31, 2016). The Credit Facility has various customary restrictive covenants, all of which we were in compliance with at September 30, 2017.
6. Notes Payable
Our notes payable at September 30, 2017 and December 31, 2016 are set forth in the table below:
Amounts at September 30, 2017
Coupon Effective Unamortized Book Fair Book Value at
Rate Rate Principal Costs Value Value December 31, 2016
($ amounts in thousands)
U.S. Dollar Denominated Unsecured Debt
Notes due September 2022
issued September 2017 2.370% 2.483% $ 500,000 $ (2,607) $ 497,393 $ 498,604 $ -
Notes due September 2027
issued September 2017 3.094% 3.218% 500,000 (5,264) 494,736 498,042 -
1,000,000 (7,871) 992,129 996,646 -
Euro Denominated Unsecured Debt
Notes due April 2024
€100.0 million issued 4/2016 1.540% 1.540% 118,145 - 118,145 123,315 105,203
Notes due November 2025
€242.0 million issued 11/2015 2.175% 2.175% 285,927 - 285,927 302,822 254,607
404,072 - 404,072 426,137 359,810
Mortgage Debt, secured by 30 real estate
facilities with a net book value
of $119.0 million 4.064% 4.005% 29,653 - 29,653 30,618 30,939
$ 1,433,725 $ (7,871) $ 1,425,854 $ 1,453,401 $ 390,749

PUBLIC STORAGE
NOTES TO FINANCIAL STATEMENTS
September 30, 2017
(Unaudited)
18
U.S. Dollar Denominated Unsecured Debt
On September 18, 2017, we issued, in a public offering, two tranches each totaling $500.0 million of U.S. Dollar denominated unsecured notes (the “U.S. Dollar Notes”). In connection with the offering, we incurred a total of $7.9 million in costs, which is reflected as a reduction in the principal amount and amortized, using the effective interest method, over the term of each respective note. Interest on the U.S. Dollar Notes is payable semi-annually on March 15 and September 15 of each year, commencing March 15, 2018.
The U.S. Dollar Notes have various financial covenants, all of which we were in compliance with at September 30, 2017. Included in these covenants are a) a maximum Debt to Total Assets of 65% (4.4% at September 30, 2017) and b) a minimum ratio of Adjusted EBITDA to Interest Expense of 1.5x (361.3x for the twelve months ended September 30, 2017) as well as covenants limiting our ability to encumber our properties with mortgage debt. These terms and all of the covenants are defined more fully in the related prospectus.
Euro Denominated Unsecured Debt
Our euro denominated unsecured notes (the “Euro Notes”) is payable to institutional investors. €100.0 million of the Euro Notes were issued on April 12, 2016 for $113.6 million in net proceeds. Interest is payable semi-annually. The Euro Notes have various customary financial covenants, all of which we were in compliance with at September 30, 2017.
We reflect changes in the U.S. Dollar equivalent of the amount payable, as a result of changes in foreign exchange rates as “foreign currency exchange loss” on our income statement (losses of $13.4 million and $44.5 million for the three and nine months ended September 30, 2017, respectively, as compared to losses of $3.7 million and $6.0 million for the same periods in 2016, respectively).
Mortgage Debt
Our mortgage debt was assumed in connection with property acquisitions, and recorded at fair value with any premium or discount to the stated note balance amortized using the effective interest method. Our mortgage debt has fixed rates of interest and are non-recourse.
At September 30, 2017, approximate principal maturities of our Unsecured Debt and Mortgage Debt are (amounts in thousands):
Unsecured Mortgage
Debt Debt Total
Remainder of 2017 $ - $ 432 $ 432
2018 - 11,241 11,241
2019 - 1,505 1,505
2020 - 1,585 1,585
2021 - 1,503 1,503
2022 500,000 2,071 502,071
Thereafter 904,072 11,316 915,388
$ 1,404,072 $ 29,653 $ 1,433,725
Weighted average effective rate 2.6% 4.0% 2.6%
Cash paid for interest totaled $7.7 million and $7.2 million for the nine months ended September 30, 2017 and 2016, respectively. Interest capitalized as real estate totaled $3.1 million and $3.9 million for the nine months ended September 30, 2017 and 2016, respectively.

PUBLIC STORAGE
NOTES TO FINANCIAL STATEMENTS
September 30, 2017
(Unaudited)
19
7. Noncontrolling Interests
At September 30, 2017, the noncontrolling interests represent (i) third-party equity interests in subsidiaries owning 11 operating self-storage facilities and seven self-storage facilities that are under construction and (ii) 231,978 partnership units held by third-parties in a subsidiary that are convertible on a one-for-one basis (subject to certain limitations) into common shares of the Company at the option of the unitholder (collectively, the “Noncontrolling Interests”). At September 30, 2017, the Noncontrolling Interests cannot require us to redeem their interests, other than pursuant to a liquidation of the subsidiary. During the nine months ended September 30, 2017 and 2016, we allocated a total of $4.7 million and $4.9 million, respectively, of income to these interests; and we paid $5.5 million and $5.6 million, respectively, in distributions to these interests.
During the nine months ended September 30, 2017, we acquired Noncontrolling Interests for $14.4 million (none in the nine months ended September 30, 2016), in cash, of which $7.7 million was allocated to Paid-in capital and $6.7 million as a reduction to Noncontrolling Interests. During the nine months ended September 30, 2017 and 2016, Noncontrolling Interests contributed $1.1 million and $3.2 million, respectively.
8. Shareholders’ Equity
Preferred Shares
At September 30, 2017 and December 31, 2016, we had the following series of Cumulative Preferred Shares (“Preferred Shares”) outstanding:
At September 30, 2017 At December 31, 2016
Series
Earliest Redemption
Date
Dividend Rate
Shares Outstanding
Liquidation Preference
Shares Outstanding
Liquidation Preference
(Dollar amounts in thousands)
Series S 1/12/2017 5.900% - $ - 18,400 $ 460,000
Series T 3/13/2017 5.750% - - 18,500 462,500
Series U 6/15/2017 5.625% 11,500 287,500 11,500 287,500
Series V 9/20/2017 5.375% 19,800 495,000 19,800 495,000
Series W 1/16/2018 5.200% 20,000 500,000 20,000 500,000
Series X 3/13/2018 5.200% 9,000 225,000 9,000 225,000
Series Y 3/17/2019 6.375% 11,400 285,000 11,400 285,000
Series Z 6/4/2019 6.000% 11,500 287,500 11,500 287,500
Series A 12/2/2019 5.875% 7,600 190,000 7,600 190,000
Series B 1/20/2021 5.400% 12,000 300,000 12,000 300,000
Series C 5/17/2021 5.125% 8,000 200,000 8,000 200,000
Series D 7/20/2021 4.950% 13,000 325,000 13,000 325,000
Series E 10/14/2021 4.900% 14,000 350,000 14,000 350,000
Series F 6/2/2022 5.150% 11,200 280,000 - -
Series G 8/9/2022 5.050% 12,000 300,000 - -
Total Preferred Shares 161,000 $ 4,025,000 174,700 $ 4,367,500

PUBLIC STORAGE
NOTES TO FINANCIAL STATEMENTS
September 30, 2017
(Unaudited)
20
The holders of our Preferred Shares have general preference rights with respect to liquidation, quarterly distributions and any accumulated unpaid distributions. Except under certain conditions and as noted below, holders of the Preferred Shares will not be entitled to vote on most matters. In the event of a cumulative arrearage equal to six quarterly dividends, holders of all outstanding series of preferred shares (voting as a single class without regard to series) will have the right to elect two additional members to serve on our board of trustees (our “Board”) until the arrearage has been cured. At September 30, 2017, there were no dividends in arrears.
Except under certain conditions relating to the Company’s qualification as a REIT, the Preferred Shares are not redeemable prior to the dates indicated on the table above. On or after the respective dates, each of the series of Preferred Shares is redeemable at our option, in whole or in part, at $25.00 per depositary share, plus accrued and unpaid dividends. Holders of the Preferred Shares cannot require us to redeem such shares.
Upon issuance of our Preferred Shares, we classify the liquidation value as preferred equity on our balance sheet with any issuance costs recorded as a reduction to Paid-in capital.
On January 20, 2016, we issued 12.0 million depositary shares, each representing 1/1,000 of a share of our 5.40% Series B Preferred Shares, at an issuance price of $25.00 per depositary share, for a total of $300.0 million in gross proceeds, and we incurred $9.9 million in issuance costs.
On May 17, 2016, we issued 8.0 million depositary shares, each representing 1/1,000 of a share of our 5.125% Series C Preferred Shares, at an issuance price of $25.00 per depositary share, for a total of $200.0 million in gross proceeds, and we incurred $6.4 million in issuance costs.
On July 20, 2016, we issued 13.0 million depositary shares, each representing 1/1,000 of a share of our 4.95% Series D Preferred Shares, at an issuance price of $25.00 per depositary share, for a total of $325.0 million in gross proceeds, and we incurred $10.6 million in issuance costs.
On October 14, 2016, we issued 14.0 million depositary shares, each representing 1/1,000 of a share of our 4.90% Series E Preferred Shares, at an issuance price of $25.00 per depositary share, for a total of $350.0 million in gross proceeds, and we incurred $11.9 million in issuance costs.
During the nine months ended September 30, 2016, we redeemed our Series Q and Series R Preferred Shares at par, for a total of $862.5 million, before payment of accrued dividends. We recorded $26.9 million in allocation of income from our common shareholders to the holders of our Preferred Shares in the nine months ended September 30, 2016 in connection with these redemptions.
On June 2, 2017, we issued 11.2 million depositary shares, each representing 1/1,000 of a share of our 5.150% Series F Preferred Shares, at an issuance price of $25.00 per depositary share, for a total of $280.0 million in gross proceeds, and we incurred $8.9 million in issuance costs.
On August 9, 2017, we issued 12.0 million depositary shares, each representing 1/1,000 of a share of our 5.050% Series G Preferred Shares, at an issuance price of $25.00 per depositary share, for a total of $300.0 million in gross proceeds, and we incurred $9.9 million in issuance costs.
In June 2017, we called for redemption of, and on July 26, 2017, we redeemed our 5.900% Series S Preferred Shares, at par. We recorded a $14.6 million allocation of income from our common shareholders to the holders of our Preferred Shares in the nine months ended September 30, 2017 in connection with this redemption.

PUBLIC STORAGE
NOTES TO FINANCIAL STATEMENTS
September 30, 2017
(Unaudited)
21
In August 2017, we called for redemption of, and on September 28, 2017, we redeemed our 5.750% Series T Preferred Shares, at par. We recorded a $14.7 million allocation of income from our common shareholders to the holders of our Preferred Shares in the three and nine months ended September 30, 2017 in connection with this redemption.
Common Shares
Common share dividends, including amounts paid to our restricted share unitholders, totaled $348.6 million ($2.00 per share) and $312.5 million ($1.80 per share) for the three months ended September 30, 2017 and 2016, respectively, and $1.0 billion ($6.00 per share) and $920.1 million ($5.30 per share) for the nine months ended September 30, 2017 and 2016, respectively. Preferred share dividends totaled $61.1 million and $57.2 million for the three months ended September 30, 2017 and 2016, respectively, and $182.5 million and $178.7 million for the nine months ended September 30, 2017 and 2016, respectively.
9. Related Party Transactions
B. Wayne Hughes, our former Chairman and his family, including his daughter Tamara Hughes Gustavson and his son B. Wayne Hughes, Jr., who are both members of our Board, collectively own approximately 14.3% of our common shares outstanding at September 30, 2017.
At September 30, 2017, B. Wayne Hughes and Tamara Hughes Gustavson together owned and controlled 57 self-storage facilities in Canada. These facilities operate under the “Public Storage” tradename, which we license to the owners of these facilities for use in Canada on a royalty-free, non-exclusive basis. We have no ownership interest in these facilities and we do not own or operate any facilities in Canada. If we chose to acquire or develop our own facilities in Canada, we would have to share the use of the “Public Storage” name in Canada with the facilities’ owners. We have a right of first refusal, subject to limitations, to acquire the stock or assets of the corporation engaged in the operation of these facilities if their owners agree to sell them. Our subsidiaries reinsure risks relating to loss of goods stored by customers in these facilities, and have received approximately $752,000 and $606,000 for the nine months ended September 30, 2017 and 2016, respectively. Our right to continue receiving these premiums may be qualified.
10. Share-Based Compensation
Under various share-based compensation plans and under terms established by our Board or a committee thereof, we grant non-qualified options to purchase the Company’s common shares, as well as restricted share units (“RSUs”), to trustees, officers, and key employees.
Stock options and RSUs are considered “granted” and “outstanding” as the terms are used herein, when (i) the Company and the recipient reach a mutual understanding of the key terms of the award, (ii) the award has been authorized, (iii) the recipient is affected by changes in the market price of our stock, and (iv) it is probable that any performance conditions will be met.
We amortize the grant-date fair value of awards as compensation expense over the service period, which begins on the grant date and ends on the vesting date. For awards that are earned solely upon the passage of time and continued service, the entire cost of the award is amortized on a straight-line basis over the service period. For awards with performance conditions, the individual cost of each vesting is amortized separately over each individual service period (the “accelerated attribution” method).

PUBLIC STORAGE
NOTES TO FINANCIAL STATEMENTS
September 30, 2017
(Unaudited)
22
In amortizing share-based compensation expense, we do not estimate future forfeitures in advance. Instead, we reverse previously amortized share-based compensation expense with respect to grants that are forfeited in the period the employee terminates employment.
See also “net income per common share” in Note 2 for further discussion regarding the impact of RSUs and stock options on our net income per common share and income allocated to common shareholders.
Stock Options
Stock options vest over a three to five-year period, expire ten years after the grant date, and the exercise price is equal to the closing trading price of our common shares on the grant date. Employees cannot require the Company to settle their award in cash. We use the Black-Scholes option valuation model to estimate the fair value of our stock options.
Outstanding stock option grants are included on a one-for-one basis in our diluted weighted average shares, to the extent dilutive, after applying the treasury stock method (based upon the average common share price during the period) to assumed exercise proceeds and measured but unrecognized compensation.
For the three and nine months ended September 30, 2017, we recorded $2.3 million and $5.1 million, respectively, in compensation expense related to stock options, as compared to $1.3 million and $3.2 million, for the same periods in 2016. Amounts for the nine months ended September 30, 2017 reflect a reduction in compensation expense of $0.8 million related to stock options forfeited during the period.
During the nine months ended September 30, 2017, 1,076,000 stock options were granted, 386,643 options were exercised and 200,000 options were forfeited. A total of 2,484,797 stock options were outstanding at September 30, 2017 (1,995,440 at December 31, 2016).
Restricted Share Units
RSUs generally vest ratably over a five to eight-year period from the grant date. The grantee receives dividends for each outstanding RSU equal to the per-share dividends received by our common shareholders. We expense any dividends previously paid upon forfeiture of the related RSU. Upon vesting, the grantee receives common shares equal to the number of vested RSUs, less common shares withheld in exchange for tax deposits made by the Company to satisfy the grantee’s statutory tax liabilities arising from the vesting.
The fair value of our RSUs is determined based upon the applicable closing trading price of our common shares.
During the nine months ended September 30, 2017, 198,427 RSUs were granted, 77,138 RSUs were forfeited and 114,181 RSUs vested. This vesting resulted in the issuance of 63,378 common shares. In addition, tax deposits totaling $12.4 million ($13.6 million for the same period in 2016) were made on behalf of employees in exchange for 50,803 common shares withheld upon vesting. A total of 703,749 RSUs were outstanding at September 30, 2017 (696,641 at December 31, 2016).
A total of $10.7 million and $21.1 million in RSU expense was recorded for the three and nine months ended September 30, 2017, which includes approximately $0.1 million and $0.7 million in employer taxes incurred upon vesting, as compared to $10.2 million and $24.7 million for the same periods in 2016, which includes approximately $40,000 and $1.1 million, respectively, in employer taxes incurred upon vesting. Amounts for the nine months ended September 30, 2017 reflect a reduction in RSU expense of $4.6 million related to RSUs forfeited during the period.

PUBLIC STORAGE
NOTES TO FINANCIAL STATEMENTS
September 30, 2017
(Unaudited)
23
11. Segment Information
Our reportable segments reflect the significant components of our operations where discrete financial information is evaluated separately by our chief operating decision maker (“CODM”). We organize our segments based primarily upon the nature of the underlying products and services, as well as the drivers of profitability growth. The net income for each reportable segment included in the tables below are in conformity with GAAP and our significant accounting policies as denoted in Note 2. The amounts not attributable to reportable segments are aggregated under “other items not allocated to segments.”
Following is a description of and basis for presentation for each of our reportable segments.
Self-Storage Operations
The Self-Storage Operations segment reflects the rental operations from all self-storage facilities owned by the Company and the Subsidiaries. Our CODM reviews the net operating income (“NOI”) of this segment, which represents the related revenues less cost of operations (prior to depreciation expense), in assessing performance and making resource allocation decisions. The presentation in the tables below sets forth the NOI of this segment, as well as the depreciation expense for this segment, which while reviewed by our CODM and included in net income, is not considered by the CODM in assessing performance and decision making. For all periods presented, substantially all of our real estate facilities, goodwill and other intangible assets, other assets, and accrued and other liabilities are associated with the Self-Storage Operations segment.
Ancillary Operations
The Ancillary Operations segment reflects the sale of merchandise and reinsurance of policies against losses to goods stored by our self-storage tenants, activities which are incidental to our primary self-storage rental activities. Our CODM reviews the NOI of these operations in assessing performance and making resource allocation decisions.
Investment in PSB
This segment represents our 42% equity interest in PSB, a publicly-traded REIT that owns, operates, acquires and develops commercial properties, primarily multi-tenant flex, office, and industrial space. PSB has a separate management team that makes its financing, capital allocation, and other significant decisions. In making resource allocation decisions with respect to our investment in PSB, the CODM reviews PSB’s net income, which is detailed in PSB’s periodic filings with the SEC, and is included in Note 4. The segment presentation in the tables below includes our equity earnings from PSB.
Investment in Shurgard Europe
This segment represents our 49% equity interest in Shurgard Europe, which owns and operates self-storage facilities located in seven countries in Western Europe. Shurgard Europe has a separate management team reporting to our CODM and our joint venture partner. In making resource allocation decisions with respect to our investment in Shurgard Europe, the CODM reviews Shurgard Europe’s net income, which is detailed in Note 4. The segment presentation below includes our equity earnings from Shurgard Europe.
PUBLIC STORAGE
NOTES TO FINANCIAL STATEMENTS
September 30, 2017
(Unaudited)
24
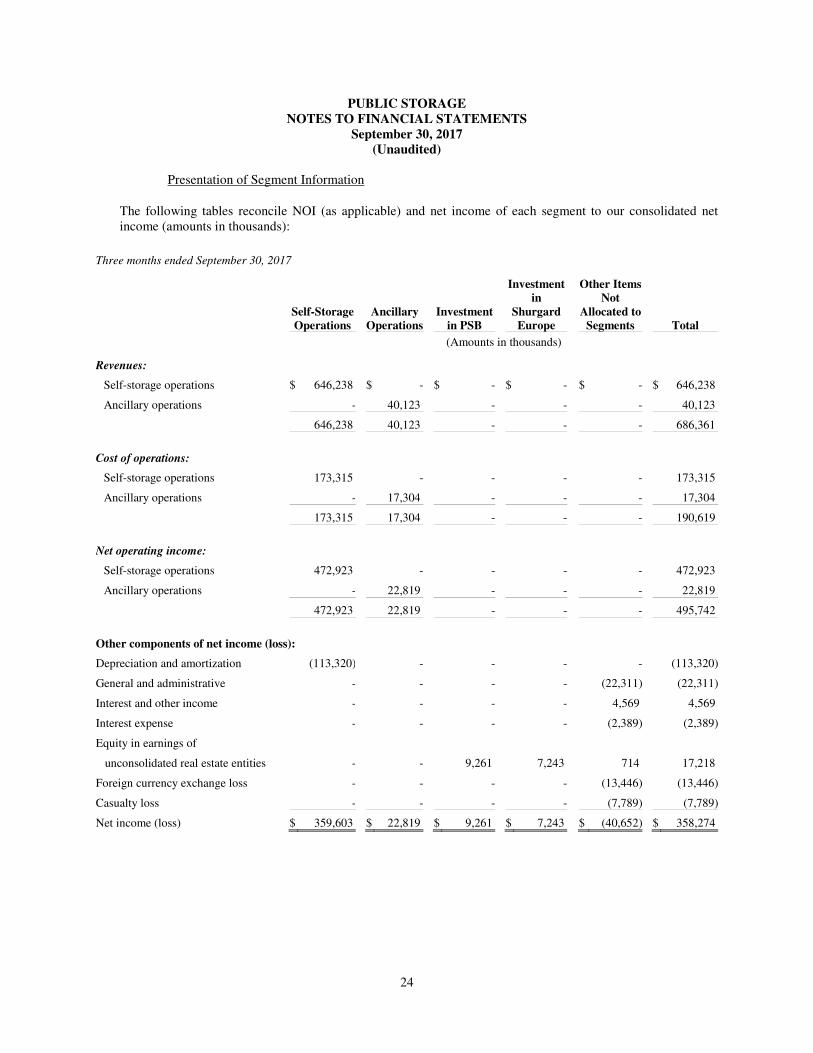
Presentation of Segment Information
The following tables reconcile NOI (as applicable) and net income of each segment to our consolidated net income (amounts in thousands):
Three months ended September 30, 2017
Self-Storage
Operations Ancillary
Operations Investment
in PSB
Investment
in
Shurgard
Europe
Other Items
Not
Allocated to
Segments Total
(Amounts in thousands)
Revenues:
Self-storage operations $ 646,238 $ - $ - $ - $ - $ 646,238
Ancillary operations - 40,123 - - - 40,123
646,238 40,123 - - - 686,361
Cost of operations:
Self-storage operations 173,315 - - - - 173,315
Ancillary operations - 17,304 - - - 17,304
173,315 17,304 - - - 190,619
Net operating income:
Self-storage operations 472,923 - - - - 472,923
Ancillary operations - 22,819 - - - 22,819
472,923 22,819 - - - 495,742
Other components of net income (loss):
Depreciation and amortization (113,320) - - - - (113,320)
General and administrative - - - - (22,311) (22,311)
Interest and other income - - - - 4,569 4,569
Interest expense - - - - (2,389) (2,389)
Equity in earnings of
unconsolidated real estate entities - - 9,261 7,243 714 17,218
Foreign currency exchange loss - - - - (13,446) (13,446)
Casualty loss - - - - (7,789) (7,789)
Net income (loss) $ 359,603 $ 22,819 $ 9,261 $ 7,243 $ (40,652) $ 358,274

PUBLIC STORAGE
NOTES TO FINANCIAL STATEMENTS
September 30, 2017
(Unaudited)
25
Three months ended September 30, 2016
Self-Storage
Operations Ancillary
Operations Investment
in PSB
Investment
in
Shurgard
Europe
Other Items
Not
Allocated to
Segments Total
(Amounts in thousands)
Revenues:
Self-storage operations $ 623,157 $ - $ - $ - $ - $ 623,157
Ancillary operations - 39,991 - - - 39,991
623,157 39,991 - - - 663,148
Cost of operations:
Self-storage operations 165,905 - - - - 165,905
Ancillary operations - 12,722 - - - 12,722
165,905 12,722 - - - 178,627
Net operating income:
Self-storage operations 457,252 - - - - 457,252
Ancillary operations - 27,269 - - - 27,269
457,252 27,269 - - - 484,521
Other components of net income (loss):
Depreciation and amortization (109,432) - - - - (109,432)
General and administrative - - - - (22,140) (22,140)
Interest and other income - - - - 3,750 3,750
Interest expense - - - - (1,221) (1,221)
Equity in earnings of
unconsolidated real estate entities - - 10,118 6,362 757 17,237
Foreign currency exchange loss - - - - (3,665) (3,665)
Net income (loss) $ 347,820 $ 27,269 $ 10,118 $ 6,362 $ (22,519) $ 369,050

PUBLIC STORAGE
NOTES TO FINANCIAL STATEMENTS
September 30, 2017
(Unaudited)
26
Nine months ended September 30, 2017
Self-Storage
Operations Ancillary
Operations Investment
in PSB
Investment
in
Shurgard
Europe
Other Items
Not
Allocated to
Segments Total
(Amounts in thousands)
Revenues:
Self-storage operations $ 1,878,215 $ - $ - $ - $ - $ 1,878,215
Ancillary operations - 118,005 - - - 118,005
1,878,215 118,005 - - - 1,996,220
Cost of operations:
Self-storage operations 516,488 - - - - 516,488
Ancillary operations - 39,611 - - - 39,611
516,488 39,611 - - - 556,099
Net operating income:
Self-storage operations 1,361,727 - - - - 1,361,727
Ancillary operations - 78,394 - - - 78,394
1,361,727 78,394 - - - 1,440,121
Other components of net income (loss):
Depreciation and amortization (334,426) - - - - (334,426)
General and administrative - - - - (62,331) (62,331)
Interest and other income - - - - 12,722 12,722
Interest expense - - - - (4,553) (4,553)
Equity in earnings of
unconsolidated real estate entities - - 35,694 19,484 2,057 57,235
Foreign currency exchange loss - - - - (44,452) (44,452)
Casualty loss - - - - (7,789) (7,789)
Gain on real estate investment sales - - - - 975 975
Net income (loss) $ 1,027,301 $ 78,394 $ 35,694 $ 19,484 $ (103,371) $ 1,057,502

PUBLIC STORAGE
NOTES TO FINANCIAL STATEMENTS
September 30, 2017
(Unaudited)
27
Nine months ended September 30, 2016
Self-Storage
Operations Ancillary
Operations Investment
in PSB
Investment
in
Shurgard
Europe
Other Items
Not
Allocated to
Segments Total
(Amounts in thousands)
Revenues:
Self-storage operations $ 1,792,130 $ - $ - $ - $ - $ 1,792,130
Ancillary operations - 116,992 - - - 116,992
1,792,130 116,992 - - - 1,909,122
Cost of operations:
Self-storage operations 483,455 - - - - 483,455
Ancillary operations - 40,462 - - - 40,462
483,455 40,462 - - - 523,917
Net operating income:
Self-storage operations 1,308,675 - - - - 1,308,675
Ancillary operations - 76,530 - - - 76,530
1,308,675 76,530 - - - 1,385,205
Other components of net income (loss):
Depreciation and amortization (321,573) - - - - (321,573)
General and administrative - - - - (63,508) (63,508)
Interest and other income - - - - 11,614 11,614
Interest expense - - - - (3,310) (3,310)
Equity in earnings of
unconsolidated real estate entities - - 25,318 14,304 2,006 41,628
Foreign currency exchange loss - - - - (5,987) (5,987)
Gain on real estate investment sales - - - - 689 689
Net income (loss) $ 987,102 $ 76,530 $ 25,318 $ 14,304 $ (58,496) $ 1,044,758

PUBLIC STORAGE
NOTES TO FINANCIAL STATEMENTS
September 30, 2017
(Unaudited)
28
12. Commitments and Contingencies
Contingent Losses
We are a party to various legal proceedings and subject to various claims and complaints; however, we believe that the likelihood of these contingencies resulting in a material loss to the Company, either individually or in the aggregate, is remote.
Insurance and Loss Exposure
We have historically carried property, earthquake, general liability, employee medical insurance and workers compensation coverage through internationally recognized insurance carriers, subject to deductibles. Our deductible for general liability is $2.0 million per occurrence. Our annual deductibles for property losses are $25.0 million for first occurrence with an aggregate of $35.0 million for two occurrences and $5.0 million per occurrence thereafter. Insurance carriers’ aggregate limits on these policies of $75.0 million for property losses and $102.0 million for general liability losses are higher than estimates of maximum probable losses that could occur from individual catastrophic events determined in recent engineering and actuarial studies; however, in case of multiple catastrophic events, these limits could be exceeded.
We reinsure a program that provides insurance to our customers from an independent third-party insurer. This program covers tenant claims for losses to goods stored at our facilities as a result of specific named perils (earthquakes are not covered by this program), up to a maximum limit of $5,000 per storage unit. We reinsure all risks in this program, but purchase insurance to cover this exposure for a limit of $15.0 million for losses in excess of $5.0 million per occurrence. We are subject to licensing requirements and regulations in several states. Customers participate in the program at their option. At September 30, 2017, there were approximately 914,000 certificates held by our self-storage customers, representing aggregate coverage of approximately $2.8 billion.
13. Subsequent Events
Subsequent to September 30, 2017, we acquired or were under contract to acquire (subject to customary closing conditions) eight self-storage facilities, with 534,000 net rentable square feet, for $67.8 million.

29
ITEM 2. Management’s Discussion and Analysis of Financial Condition and Results of Operations
Forward Looking Statements
This Quarterly Report on Form 10-Q contains forward-looking statements within the meaning of the Private Securities Litigation Reform Act of 1995. All statements in this document, other than statements of historical fact, are forward-looking statements which may be identified by the use of the words "expects," "believes," "anticipates," "should," "estimates" and similar expressions.
These forward-looking statements involve known and unknown risks and uncertainties, which may cause our actual results and performance to be materially different from those expressed or implied in the forward-looking statements. Factors and risks that may impact future results and performance include, but are not limited to, those described in Part 1, Item 1A, "Risk Factors" and in our most recent Annual Report on Form 10-K filed with the Securities and Exchange Commission (the “SEC”) on February 28, 2017 and in our other filings with the SEC including:
• general risks associated with the ownership and operation of real estate, including changes in demand, risk related to development of self-storage facilities, potential liability for environmental contamination, natural disasters and adverse changes in laws and regulations governing property tax, real estate and zoning;
• risks associated with downturns in the national and local economies in the markets in which we operate, including risks related to current economic conditions and the economic health of our customers;
• the impact of competition from new and existing self-storage and commercial facilities and other storage alternatives;
• difficulties in our ability to successfully evaluate, finance, integrate into our existing operations, and manage acquired and developed properties;
• risks associated with international operations including, but not limited to, unfavorable foreign currency rate fluctuations, changes in tax laws, and local and global economic uncertainty that could adversely affect our earnings and cash flows;
• risks related to our participation in joint ventures;
• the impact of the regulatory environment as well as national, state and local laws and regulations including, without limitation, those governing environmental, taxes, our tenant reinsurance business and labor, and risks related to the impact of new laws and regulations;
• risks of increased tax expense associated either with a possible failure by us to qualify as a real estate investment trust (“REIT”), or with challenges to the determination of taxable income for our taxable REIT subsidiaries;
• changes in federal or state tax laws related to the taxation of REITs and other corporations;
• security breaches or a failure of our networks, systems or technology could adversely impact our business, customer and employee relationships;
• risks associated with the self-insurance of certain business risks, including property and casualty insurance, employee health insurance and workers compensation liabilities;
• difficulties in raising capital at a reasonable cost;

30
• delays in the development process;
• ongoing litigation and other legal and regulatory actions which may divert management’s time and attention, require us to pay damages and expenses or restrict the operation of our business; and
• economic uncertainty due to the impact of war or terrorism.
These forward looking statements speak only as of the date of this report or as of the dates indicated in the statements. All of our forward-looking statements, including those in this report, are qualified in their entirety by this statement. We expressly disclaim any obligation to update publicly or otherwise revise any forward-looking statements, whether as a result of new information, new estimates, or other factors, events or circumstances after the date of these forward looking statements, except where expressly required by law. Given these risks and uncertainties, you should not rely on any forward-looking statements in this report, or which management may make orally or in writing from time to time, neither as predictions of future events nor guarantees of future performance.
Critical Accounting Policies
Our MD&A discusses our financial statements, which have been prepared in accordance with United States (“U.S.”) generally accepted accounting principles (“GAAP”), and are affected by our judgments, assumptions and estimates. The notes to our September 30, 2017 financial statements, primarily Note 2, summarize our significant accounting policies.
We believe the following are our critical accounting policies, because they have a material impact on the portrayal of our financial condition and results, and they require us to make judgments and estimates about matters that are inherently uncertain.
Income Tax Expense: We have elected to be treated as a REIT, as defined in the Internal Revenue Code of 1986, as amended (the “Code”). As a REIT, we do not incur federal income tax on our REIT taxable income that is fully distributed each year (for this purpose, certain distributions paid in a subsequent year may be considered), and if we meet certain organizational and operational rules. We believe we have met these REIT requirements for all periods presented herein. Accordingly, we have recorded no federal income tax expense related to our REIT taxable income.
Our evaluation that we have met the REIT requirements could be incorrect, because compliance with the tax rules requires factual determinations, and circumstances we have not identified could result in noncompliance with the tax requirements in current or prior years. For any taxable year that we fail to qualify as a REIT and for which applicable statutory relief provisions did not apply, we would be taxed at the regular corporate rates on all of our taxable income for at least that year and the ensuing four years, we could be subject to penalties and interest, and our net income would be materially different from the amounts estimated in our financial statements.
In addition, certain of our consolidated corporate subsidiaries have elected to be treated as “taxable REIT subsidiaries” for federal income tax purposes, which are taxable as regular corporations and subject to certain limitations on intercompany transactions. If tax authorities determine that amounts paid by our taxable REIT subsidiaries to us are not reasonable compared to similar arrangements among unrelated parties, we could be subject to a 100% penalty tax on the excess payments. Such a penalty tax could have a material adverse impact on our net income.
Impairment of Long-Lived Assets: The analysis of impairment of our long-lived assets involves identification of indicators of impairment, projections of future operating cash flows, and estimates of fair values, all of which require significant judgment and subjectivity. Others could come to materially different conclusions. In addition, we may not have identified all current facts and circumstances that may affect impairment. Any unidentified impairment loss, or change in conclusions, could have a material adverse impact on our net income.
Accrual for Uncertain and Contingent Liabilities: We accrue for certain contingent and other liabilities that have significant uncertain elements, such as property taxes, workers compensation claims, tenant reinsurance

31
claims, as well as other legal claims and disputes involving customers, employees, governmental agencies and other third parties. We estimate such liabilities based upon many factors such as assumptions of past and future trends and our evaluation of likely outcomes. However, the estimates of known liabilities could be incorrect or we may not be aware of all such liabilities, in which case our accrued liabilities and net income could be misstated.
Accounting for Acquired Real Estate Facilities: We estimate the fair values of the land, buildings and intangible assets acquired for purposes of allocating the purchase price. Such estimates are based upon many assumptions and judgments, including (i) market rates of return and capitalization rates on real estate and intangible assets, (ii) building and material cost levels, (iii) comparisons of the acquired underlying land parcels to recent land transactions, and (iv) future cash flows from the real estate and the existing tenant base. Others could come to materially different conclusions as to the estimated fair values, which would result in different depreciation and amortization expense, gains and losses on sale of real estate assets, and real estate and intangible assets.
Overview
Our self-storage operations generate most of our net income, and we believe that our earnings growth is most impacted by the level of organic growth in our existing self-storage portfolio. Accordingly, a significant portion of management’s time is devoted to maximizing cash flows from our existing self-storage facilities.
Most of our facilities compete with other well-managed and well-located competitors and we are subject to general economic conditions, particularly those that affect the spending habits of consumers and moving trends. We believe that our centralized information networks, national telephone and online reservation system, the brand name “Public Storage,” and our economies of scale enable us to meet such challenges effectively.
We plan on growing organically as well as through the acquisition and development of additional facilities. Since the beginning of 2015 through September 30, 2017, we acquired a total of 86 facilities with 6.2 million net rentable square feet from third parties for approximately $679.6 million, and since January 1, 2013, we opened newly developed and redeveloped self-storage space for a total cost of $831.2 million, adding approximately 7.5 million net rentable square feet.
Subsequent to September 30, 2017, we acquired or were under contract to acquire (subject to customary closing conditions) eight self-storage facilities for $67.8 million. We will continue to seek to acquire properties; however, there is significant competition to acquire existing facilities and there can be no assurance as to the level of facilities we may acquire.
As of September 30, 2017, we had additional development and redevelopment projects which will add approximately 4.7 million net rentable square feet at a total cost of approximately $600.2 million. We expect to continue to seek additional development projects; however, the level of such activity may be limited due to various constraints such as difficulty in finding available sites that meet our risk-adjusted yield expectations, as well as challenges in obtaining building permits for self-storage activities in certain municipalities.
We believe that our development and redevelopment activities are beneficial to our business over the long run. However, in the short run, such activities dilute our earnings due to the three to four year period that it takes to fill up newly developed and redeveloped storage facilities and reach a stabilized level of cash flows offset by the cost of capital to fund the cost, combined with related overhead expenses flowing through general and administrative expense. We believe this dilution will increase in the remainder of 2017 and beyond, because of an increased level of net rentable square feet being added to our portfolio due to continued development and redevelopment efforts.

32
On September 18, 2017, we completed a public offering of $1.0 billion in aggregate principal amount of unsecured notes in two tranches (collectively, the “U.S. Dollar Notes”). The first tranche of $500.0 million aggregate principal amount bears interest at an annual rate of 2.370%, was issued at par value and matures on September 15, 2022. The second tranche of $500.0 million aggregate principal amount bears interest at an annual rate of 3.094%, was issued at par value and matures on September 15, 2027.
As of September 30, 2017, our capital resources over the next year are expected to be approximately $1.4 billion which exceeds our current planned capital needs over the next year of approximately $447.8 million. Our capital resources include: (i) $694.2 million of cash as of September 30, 2017, (ii) $481.3 million of available borrowing capacity on our revolving line of credit, and (iii) approximately $250.0 million of expected retained operating cash flow for the next twelve months. Retained operating cash flow represents our expected cash flow provided by operating activities, less shareholder distributions and capital expenditures to maintain our real estate facilities.
Our planned capital needs over the next year consist of (i) $378.3 million of remaining spend on our current development pipeline, (ii) $67.8 million in property acquisitions currently under contract, and (iii) $1.7 million in principal repayments on existing debt. Our capital needs may increase significantly over the next year as we expect to increase our development pipeline and acquire additional properties. In addition to other investment activities, we may also redeem outstanding preferred securities or repurchase shares of our common stock in the future.
In August and September of 2017, due to Hurricanes Harvey and Irma, 115 properties in Houston and 125 properties in Florida were temporarily closed, and we removed 13 of these properties with significant disruptions in ongoing rental operations from our Same Store pool. We recorded a $7.8 million casualty loss due to damaged buildings and associated expenses, as well as $5.2 million in incremental ancillary cost of operations representing estimated claims costs resulting from the hurricanes with respect to tenants covered under our tenant reinsurance program. Current loss estimates (including business interruption) are less than our insurance deductibles, as a result, we do not expect to receive any insurance proceeds.
See Liquidity and Capital Resources for further information regarding our capital requirements and anticipated sources of capital to fund such requirements.
Results of Operations
Operating results for the three and nine months ended September 30, 2017 and 2016
For the three months ended September 30, 2017, net income allocable to our common shareholders was $279.7 million or $1.61 per diluted common share, compared to $309.0 million or $1.78 in 2016 representing a decrease of $29.3 million or $0.17. The decrease is due primarily to a $14.7 million increase in allocation to our preferred shareholders as a result of redemption activities in the three months ended September 30, 2017, a $7.8 million casualty loss and $5.2 million in incremental tenant reinsurance losses related to Hurricanes Harvey and Irma, and a $9.8 million increase in foreign exchange translation losses associated with our euro denominated debt as compared to the same period in 2016. These amounts were partially offset by a $15.7 million increase in self-storage net operating income (described below).
The $15.7 million increase in self-storage net operating income is a result of a $10.6 million increase in our Same Store Facilities (as defined below) and $5.1 million increase in our Non Same Store Facilities (as defined below). Revenues for the Same Store Facilities increased 2.4% or $13.0 million in the three months ended September 30, 2017 as compared to 2016, due primarily to higher realized annual rent per occupied square foot. Cost of operations for the Same Store Facilities increased by 1.6% or $2.4 million in the three months ended September 30, 2017 as compared to 2016, due primarily to increased property taxes, repairs and maintenance and payroll. The increase in net operating income for the Non Same Store Facilities is due primarily to the impact of 321 self-storage facilities acquired, developed or expanded since January 2015.
For the nine months ended September 30 2017, net income allocable to our common shareholders was $837.5 million or $4.81 per diluted common share, compared to $831.1 million or $4.78 in 2016 representing an

33
increase of $6.4 million or $0.03. The increase is due primarily to a $53.1 million increase in self-storage net operating income and a $15.6 million increase in equity in earnings of real estate entities, offset partially by a $38.5 million increase in foreign exchange translation losses associated with our euro denominated debt as well as a $7.8 million casualty loss and $5.2 million in incremental tenant reinsurance losses related to Hurricanes Harvey and Irma.
The $53.1 million increase in self-storage net operating income is a result of a $35.9 million increase in our Same Store Facilities and $17.2 million increase in our Non Same Store Facilities. Revenues for the Same Store Facilities increased 3.2% or $51.4 million in the nine months ended September 30, 2017 as compared to 2016, due primarily to higher realized annual rent per occupied square foot. Cost of operations for the Same Store Facilities increased by 3.6% or $15.5 million in the nine months ended September 30, 2017 as compared to 2016, due primarily to increased property taxes and advertising and selling costs. The increase in net operating income for the Non Same Store Facilities is due primarily to the impact of 321 self-storage facilities acquired, developed or expanded since January 2015.
Funds from Operations and Core Funds from Operations
Funds from Operations (“FFO”) and FFO per share are non-GAAP measures defined by the National Association of Real Estate Investment Trusts and are considered helpful measures of REIT performance by REITs and many REIT analysts. FFO represents net income before real estate depreciation, which is excluded because it is based upon historical real estate costs and assumes that building values diminish ratably over time, while we believe that real estate values fluctuate due to market conditions. FFO also excludes gains or losses on sale of real estate assets and real estate impairment charges, which are also based upon historical real estate costs and are impacted by historical depreciation. FFO and FFO per share are not a substitute for net income or earnings per share. FFO is not a substitute for GAAP net cash flow in evaluating our liquidity or ability to pay dividends, because it excludes investing and financing activities presented on our statements of cash flows. In addition, other REITs may compute these measures differently, so comparisons among REITs may not be helpful.
For the three months ended September 30, 2017, FFO was $2.35 per diluted common share, as compared to $2.51 for the same period in 2016, representing a decrease of 6.4%, or $0.16 per diluted common share.
For the nine months ended September 30, 2017, FFO was $7.00 per diluted common share, as compared to $6.94 for the same period in 2016, representing an increase of 0.9%, or $0.06 per diluted common share.
The following tables reconcile diluted earnings per share to FFO per share and set forth the computation of FFO per share:

34
Three Months Ended Nine Months Ended
September 30, September 30, 2017 2016 2017 2016
(Amounts in thousands, except per share data)
Reconciliation of Diluted Earnings per Share to
FFO per Share:
Diluted Earnings per Share $ 1.61 $ 1.78 $ 4.81 $ 4.78 Eliminate amounts per share excluded from FFO:
Depreciation and amortization allocable to
common shareholders 0.75 0.73 2.21 2.16
Gains on sale of real estate investments,
including our equity share from
investments, and other (0.01) - (0.02) - FFO per share $ 2.35 $ 2.51 $ 7.00 $ 6.94
Computation of FFO per Share:
Net income allocable to common shareholders $ 279,717 $ 308,957 $ 837,529 $ 831,067
Eliminate items excluded from FFO:
Depreciation and amortization 113,320 109,432 334,426 321,573
Depreciation from unconsolidated
real estate investments 18,054 18,328 52,635 57,319
Depreciation allocated to noncontrolling
interests and restricted share unitholders (858) (884) (2,657) (2,642)
Gains on sale of real estate investments,
including our equity share from
investments - (78) (3,077) (767)
FFO allocable to common shares $ 410,233 $ 435,755 $ 1,218,856 $ 1,206,550
Diluted weighted average common shares 174,240 173,848 174,128 173,899
FFO per share $ 2.35 $ 2.51 $ 7.00 $ 6.94
We also present “Core FFO per share,” a non-GAAP measure that represents FFO per share excluding the impact of (i) foreign currency exchange gains and losses, (ii) EITF D-42 charges related to the redemption of preferred securities, (iii) reversals of accruals with respect to share based awards forfeited by executive officers and (iv) certain other non-cash and/or nonrecurring income or expense items. We review Core FFO per share to evaluate our ongoing operating performance, and we believe it is used by investors and REIT analysts in a similar manner. However, Core FFO per share is not a substitute for net income per share. Because other REITs may not compute Core FFO per share in the same manner as we do, may not use the same terminology or may not present such a measure, Core FFO per share may not be comparable among REITs.

35
The following table reconciles FFO per share to Core FFO per share:
Three Months Ended September 30, Nine Months Ended September 30,
Percentage Percentage
2017 2016 Change 2017 2016 Change FFO per share $ 2.35 $ 2.51 (6.4)% $ 7.00 $ 6.94 0.9%
Eliminate the per share impact of items
excluded from Core FFO, including
our equity share from investments:
Foreign currency exchange loss 0.08 0.02 0.26 0.03
Application of EITF D-42 0.10 - 0.18 0.15
Casualty losses and tenant claims
due to hurricanes 0.07 - 0.07 -
Reversals of accruals on forfeited
executive share-based awards - - (0.03) -
Other items 0.01 - - 0.02
Core FFO per share $ 2.61 $ 2.53 3.2% $ 7.48 $ 7.14 4.8%
Analysis of Net Income by Reportable Segment
The following discussion and analysis is presented and organized in accordance with Note 11 to our September 30, 2017 financial statements, “Segment Information.” Accordingly, refer to the tables presented in Note 11 in order to reconcile such amounts to our total net income and for further information on our reportable segments.
Self-Storage Operations
Our self-storage operations are analyzed in two groups: (i) the 2,042 facilities that we have owned and operated on a stabilized basis since January 1, 2015 (the “Same Store Facilities”), and (ii) all other facilities, which are newly acquired, newly developed, or recently redeveloped (the “Non Same Store Facilities”). See Note 11 to our September 30, 2017 financial statements “Segment Information,” for a reconciliation of the amounts in the tables below to our total net income.

36
Self-Storage Operations
Summary Three Months Ended September 30, Nine Months Ended September 30,
Percentage Percentage
2017 2016 Change 2017 2016 Change
(Dollar amounts in thousands)
Revenues:
Same Store Facilities $ 564,394 $ 551,418 2.4% $ 1,644,643 $ 1,593,209 3.2%
Non Same Store Facilities 81,844 71,739 14.1% 233,572 198,921 17.4%
646,238 623,157 3.7% 1,878,215 1,792,130 4.8%
Cost of operations:
Same Store Facilities 147,498 145,145 1.6% 441,871 426,370 3.6%
Non Same Store Facilities 25,817 20,760 24.4% 74,617 57,085 30.7%
173,315 165,905 4.5% 516,488 483,455 6.8%
Net operating income (a):
Same Store Facilities 416,896 406,273 2.6% 1,202,772 1,166,839 3.1%
Non Same Store Facilities 56,027 50,979 9.9% 158,955 141,836 12.1%
Total net operating income 472,923 457,252 3.4% 1,361,727 1,308,675 4.1%
Depreciation and amortization expense:
Same Store Facilities (88,757) (89,379) (0.7)% (263,095) (268,124) (1.9)%
Non Same Store Facilities (24,563) (20,053) 22.5% (71,331) (53,449) 33.5%
Total depreciation and
amortization expense (113,320) (109,432) 3.6% (334,426) (321,573) 4.0%
Net income:
Same Store Facilities 328,139 316,894 3.5% 939,677 898,715 4.6%
Non Same Store Facilities 31,464 30,926 1.7% 87,624 88,387 (0.9)%
Total net income $ 359,603 $ 347,820 3.4% $ 1,027,301 $ 987,102 4.1%
Number of facilities at period end:
Same Store Facilities 2,042 2,042 -
Non Same Store Facilities 321 266 20.7%
Net rentable square footage at period end (in thousands):
Same Store Facilities 130,264 130,264 -
Non Same Store Facilities 26,463 20,859 26.9%
(a) Net operating income or “NOI” is a non-GAAP financial measure that excludes the impact of depreciation and amortization expense, which is based upon historical real estate costs and assumes that building values diminish ratably over time, while we believe that real estate values fluctuate due to market conditions. We utilize NOI in determining current property values, evaluating property performance, and in evaluating property operating trends. We believe that investors and analysts utilize NOI in a similar manner. NOI is not a substitute for net income, net operating cash flow, or other related GAAP financial measures, in evaluating our operating results. See Note 11 to our September 30, 2017 financial statements for a reconciliation of NOI to our total net income for all periods presented.
Net operating income from our self-storage operations has increased 3.4% and 4.1% in the three and nine months ended September 30, 2017 as compared to the same periods in 2016. These increases are due to higher revenues in our Same Store Facilities, as well as the acquisition and development of new facilities and the fill-up of unstabilized facilities.

37
Same Store Facilities
The Same Store Facilities represent those facilities that have been owned and operated at a stabilized level of occupancy, revenues and cost of operations since January 1, 2015. We review the operations of our Same Store Facilities, which excludes facilities whose operating trends are significantly affected by factors such as casualty events, as well as recently developed or acquired facilities, to more effectively evaluate the ongoing performance of our self-storage portfolio in 2015, 2016, and 2017. We believe the Same Store information is used by investors and analysts in a similar manner. The Same Store pool decreased from 2,055 facilities at June 30, 2017 to 2,042 facilities at September 30, 2017 as a result of damage caused by Hurricanes Harvey and Irma. The following table summarizes the historical operating results of these 2,042 facilities (130.3 million net rentable square feet) that represent approximately 83% of the aggregate net rentable square feet of our U.S. consolidated self-storage portfolio at September 30, 2017.
Selected Operating Data for the Same
Store Facilities (2,042 facilities)
Three Months Ended September 30, Nine Months Ended September 30, Percentage Percentage
2017 2016 Change 2017 2016 Change
(Dollar amounts in thousands, except weighted average amounts)
Revenues:
Rental income $ 539,165 $ 525,719 2.6% $ 1,571,769 $ 1,520,048 3.4%
Late charges and
administrative fees 25,229 25,699 (1.8)% 72,874 73,161 (0.4)%
Total revenues (a) 564,394 551,418 2.4% 1,644,643 1,593,209 3.2% Cost of operations:
Property taxes 55,874 53,479 4.5% 167,963 160,799 4.5%
On-site property manager
payroll 28,285 27,784 1.8% 82,828 83,022 (0.2)%
Supervisory payroll 9,586 9,449 1.4% 29,499 28,386 3.9%
Repairs and maintenance 11,380 11,042 3.1% 34,360 33,052 4.0%
Utilities 10,611 10,931 (2.9)% 29,973 30,266 (1.0)%
Advertising and selling
expense 6,901 7,693 (10.3)% 21,694 18,558 16.9%
Other direct property costs 14,296 13,917 2.7% 43,418 41,698 4.1%
Allocated overhead 10,565 10,850 (2.6)% 32,136 30,589 5.1%
Total cost of operations (a) 147,498 145,145 1.6% 441,871 426,370 3.6%
Net operating income 416,896 406,273 2.6% 1,202,772 1,166,839 3.1%
Depreciation and
amortization expense (88,757) (89,379) (0.7)% (263,095) (268,124) (1.9)%
Net income $ 328,139 $ 316,894 3.5% $ 939,677 $ 898,715 4.6%
Gross margin (before depreciation
and amortization expense) 73.9% 73.7% 0.3% 73.1% 73.2% (0.1)% Weighted average for the period:
Square foot occupancy 94.5% 95.3% (0.8)% 94.1% 94.8% (0.7)%
Realized annual rental income per (b):
Occupied square foot $ 17.52 $ 16.95 3.4% $ 17.12 $ 16.43 4.2%
Available square foot $ 16.56 $ 16.14 2.6% $ 16.09 $ 15.56 3.4%
At September 30:
Square foot occupancy 93.2% 94.2% (1.1)%
Annual contract rent per
occupied square foot (c) $ 18.07 $ 17.59 2.7%
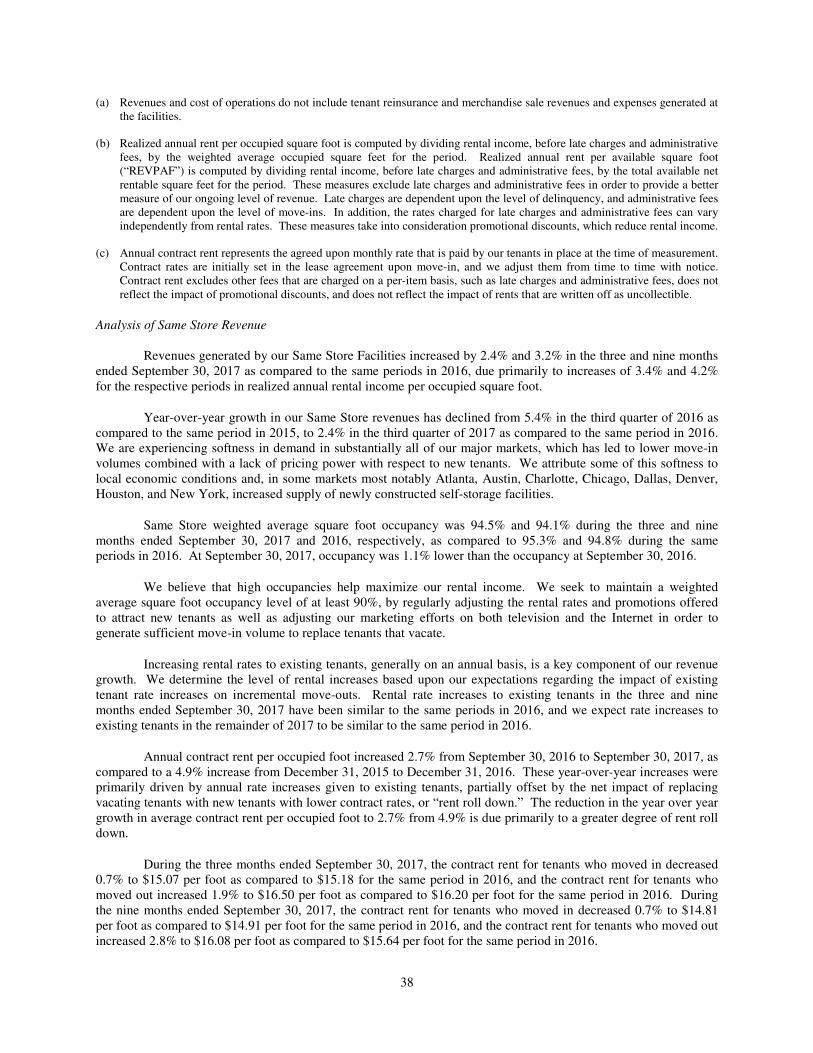
38
(a) Revenues and cost of operations do not include tenant reinsurance and merchandise sale revenues and expenses generated at the facilities.
(b) Realized annual rent per occupied square foot is computed by dividing rental income, before late charges and administrative fees, by the weighted average occupied square feet for the period. Realized annual rent per available square foot (“REVPAF”) is computed by dividing rental income, before late charges and administrative fees, by the total available net rentable square feet for the period. These measures exclude late charges and administrative fees in order to provide a better measure of our ongoing level of revenue. Late charges are dependent upon the level of delinquency, and administrative fees are dependent upon the level of move-ins. In addition, the rates charged for late charges and administrative fees can vary independently from rental rates. These measures take into consideration promotional discounts, which reduce rental income.
(c) Annual contract rent represents the agreed upon monthly rate that is paid by our tenants in place at the time of measurement. Contract rates are initially set in the lease agreement upon move-in, and we adjust them from time to time with notice. Contract rent excludes other fees that are charged on a per-item basis, such as late charges and administrative fees, does not reflect the impact of promotional discounts, and does not reflect the impact of rents that are written off as uncollectible.
Analysis of Same Store Revenue
Revenues generated by our Same Store Facilities increased by 2.4% and 3.2% in the three and nine months ended September 30, 2017 as compared to the same periods in 2016, due primarily to increases of 3.4% and 4.2% for the respective periods in realized annual rental income per occupied square foot.
Year-over-year growth in our Same Store revenues has declined from 5.4% in the third quarter of 2016 as compared to the same period in 2015, to 2.4% in the third quarter of 2017 as compared to the same period in 2016. We are experiencing softness in demand in substantially all of our major markets, which has led to lower move-in volumes combined with a lack of pricing power with respect to new tenants. We attribute some of this softness to local economic conditions and, in some markets most notably Atlanta, Austin, Charlotte, Chicago, Dallas, Denver, Houston, and New York, increased supply of newly constructed self-storage facilities.
Same Store weighted average square foot occupancy was 94.5% and 94.1% during the three and nine months ended September 30, 2017 and 2016, respectively, as compared to 95.3% and 94.8% during the same periods in 2016. At September 30, 2017, occupancy was 1.1% lower than the occupancy at September 30, 2016.
We believe that high occupancies help maximize our rental income. We seek to maintain a weighted average square foot occupancy level of at least 90%, by regularly adjusting the rental rates and promotions offered to attract new tenants as well as adjusting our marketing efforts on both television and the Internet in order to generate sufficient move-in volume to replace tenants that vacate.
Increasing rental rates to existing tenants, generally on an annual basis, is a key component of our revenue growth. We determine the level of rental increases based upon our expectations regarding the impact of existing tenant rate increases on incremental move-outs. Rental rate increases to existing tenants in the three and nine months ended September 30, 2017 have been similar to the same periods in 2016, and we expect rate increases to existing tenants in the remainder of 2017 to be similar to the same period in 2016.
Annual contract rent per occupied foot increased 2.7% from September 30, 2016 to September 30, 2017, as compared to a 4.9% increase from December 31, 2015 to December 31, 2016. These year-over-year increases were primarily driven by annual rate increases given to existing tenants, partially offset by the net impact of replacing vacating tenants with new tenants with lower contract rates, or “rent roll down.” The reduction in the year over year growth in average contract rent per occupied foot to 2.7% from 4.9% is due primarily to a greater degree of rent roll down.
During the three months ended September 30, 2017, the contract rent for tenants who moved in decreased 0.7% to $15.07 per foot as compared to $15.18 for the same period in 2016, and the contract rent for tenants who moved out increased 1.9% to $16.50 per foot as compared to $16.20 per foot for the same period in 2016. During the nine months ended September 30, 2017, the contract rent for tenants who moved in decreased 0.7% to $14.81 per foot as compared to $14.91 per foot for the same period in 2016, and the contract rent for tenants who moved out increased 2.8% to $16.08 per foot as compared to $15.64 per foot for the same period in 2016.

39
In order to stimulate move-in volume, we often give promotional discounts, generally in the form of a “$1.00 rent for the first month” offer. Promotional discounts, based upon the move-in contractual rates for the related promotional period, totaled $23.2 million and $64.6 million for the three and nine months ended September 30, 2017, respectively, as compared to $24.7 million and $66.8 million for the same periods in 2016.
Demand is higher in the summer months than in the winter months and, as a result, rental rates charged to new tenants are typically higher in the summer months than in the winter months. Demand fluctuates due to various local and regional factors, including the overall economy. Demand into our system is also impacted by new supply of self-storage space as well as alternatives to self-storage.
We believe rental growth in the remainder of 2017 will need to come primarily from continued annual rent increases to existing tenants. Our future rental growth will also be dependent upon many factors for each market that we operate in, including demand for self-storage space, the level of new supply of self-storage space and the average length of stay of our tenants.
We believe that the current trends in move-in, move-out, in place contractual rents and occupancy levels are consistent with our expectation of continued revenue growth in the remainder of 2017. However, such trends, when viewed in the short-run, are volatile and not necessarily predictive of our revenues going forward because they are subject to many short-term factors. Such factors include initial move-in rates, seasonal factors, the unit size and geographical mix of the specific tenants moving in or moving out, the length of stay of the tenants moving in or moving out, changes in our pricing strategies, and the degree and timing of rate increases previously passed to existing tenants.
We are taking a number of actions to improve demand into our system, including (i) increasing marketing spend on the Internet, and (ii) reducing rental rates and continuing to offer promotional discounts to new tenants. Even if these actions are successful in improving demand into our system, in at least the near term, we believe these actions may have a negative impact on our revenue trends due to less growth in initial rental rates and increased promotional discounts.
Analysis of Same Store Cost of Operations
Cost of operations (excluding depreciation and amortization) increased 1.6% and 3.6% in the three and nine months ended September 30, 2017, respectively, as compared to the same periods in 2016. The increase during the three month period is due primarily to increased property tax expense partially offset by a decrease in advertising and selling expense, while the increase for the nine month period is due primarily to increased property tax expense and advertising and selling expense.
Property tax expense increased 4.5% in each of the three and nine month periods ended September 30, 2017 as compared to the same periods in 2016, due primarily to higher assessed values. We expect property tax expense growth of approximately 4.5% in the remainder of 2017 due primarily to higher assessed values.
On-site property manager payroll expense increased 1.8% in the three months ended September 30, 2017, as compared to the same period in 2016, due primarily to higher wage rates. On-site property manager payroll expense was flat in the nine months ended September 30, 2017 as compared to the same period in 2016. We expect on-site property manager payroll expense to increase on an inflationary basis in the remainder of 2017.
Supervisory payroll expense, which represents compensation paid to the management personnel who directly and indirectly supervise the on-site property managers, increased 1.4% and 3.9% in the three and nine months ended September 30, 2017, respectively, as compared to the same periods in 2016, due primarily to wage rate increases and increased headcount. We expect greater than inflationary increases in wage rates and increased headcount for the remainder of 2017.
Repairs and maintenance expense increased 3.1% and 4.0% in the three and nine months ended September 30, 2017, respectively, as compared to the same periods in 2016. Repair and maintenance costs include snow removal expense totaling $2.2 million and $3.4 million in the nine months ended September 30, 2017 and

40
2016, respectively. Excluding snow removal costs, repairs and maintenance increased 8.2% in the nine months ended September 30, 2017, as compared to the same period in 2016.
Repairs and maintenance expense levels are dependent upon many factors such as weather conditions, which can impact repair and maintenance needs including snow removal, inflation in material and labor costs, and random events. We expect inflationary increases in repairs and maintenance expense in the remainder of 2017, excluding snow removal expense, which is primarily weather dependent and not predictable.
Our utility expenses are comprised primarily of electricity costs, which are dependent upon energy prices and usage levels. Changes in usage levels are driven primarily by weather and temperature. Utility expense decreased 2.9% and 1.0% in the three and nine months ended September 30, 2017, respectively, as compared to the same periods in 2016. It is difficult to estimate future utility costs, because weather, temperature, and energy prices are volatile and not predictable.
Advertising and selling expense is comprised principally of Internet advertising, television advertising and the operating costs of our telephone reservation center. Advertising and selling expense varies based upon demand, occupancy levels, and other factors. Television and Internet advertising, in particular, can increase or decrease significantly in the short term. Advertising and selling expenses decreased 10.3% in the three months ended September 30, 2017, as compared to the same period in 2016, due primarily to reduced television advertising offset partially by increased Internet marketing; and increased 16.9% in the nine months ended September 30, 2017, as compared to the same period in 2016, due primarily to increased Internet marketing and television advertising expenditures. We expect continued increases in advertising and selling expense in the remainder of 2017, with less emphasis on television and more on Internet advertising.
Other direct property costs include administrative expenses incurred at the self-storage facilities, such as property insurance, business license costs, bank charges related to processing the facilities’ cash receipts, credit card fees, and the cost of operating each property’s office. These costs increased 2.7% and 4.1% in the three and nine months ended September 30, 2017, respectively, as compared to the same periods in 2016. The increases were due primarily to higher credit card fees due to a higher proportion of collections being received from credit cards and higher revenues. We expect moderate increases in other direct property costs in the remainder of 2017.
Allocated overhead represents administrative expenses for shared general corporate functions, which are allocated to self-storage property operations to the extent their efforts are devoted to self-storage operations. Such functions include data processing, human resources, operational accounting and finance, marketing, and costs of senior executives (other than the Chief Executive Officer and Chief Financial Officer, which are included in general and administrative expense). Allocated overhead decreased 2.6% in the three months ended September 30, 2017, as compared to the same period in 2016, due primarily to the timing of our annual sales conference. The last sales conference occurred in the third quarter of 2016, while the next sales conference is not expected to occur until 2018. Allocated overhead increased 5.1% in the nine months ended September 30, 2017 as compared to the same period in 2016 due to increased headcount offset partially by the timing of our annual sales conference. We expect similar increases in allocated overhead in the remainder of 2017.
Analysis of Same Store Depreciation and Amortization
Depreciation and amortization for Same Store Facilities decreased 0.7% and 1.9% in the three and nine months ended September 30, 2017, respectively, as compared to the same periods in 2016. We expect depreciation to be flat in the remainder of 2017 as compared to the same period in 2016.
The following table summarizes selected quarterly financial data with respect to the Same Store Facilities:

41
For the Quarter Ended
March 31 June 30 September 30 December 31 Entire Year
(Amounts in thousands, except for per square foot amounts)
Total revenues:
2017 $ 533,706 $ 546,543 $ 564,394
2016 $ 512,971 $ 528,820 $ 551,418 $ 540,147 $ 2,133,356 Total cost of operations:
2017 $ 148,032 $ 146,341 $ 147,498
2016 $ 142,437 $ 138,788 $ 145,145 $ 114,154 $ 540,524 Property taxes:
2017 $ 55,889 $ 56,200 $ 55,874
2016 $ 53,555 $ 53,765 $ 53,479 $ 31,113 $ 191,912 Repairs and maintenance:
2017 $ 11,639 $ 11,341 $ 11,380
2016 $ 11,420 $ 10,590 $ 11,042 $ 11,126 $ 44,178 Advertising and selling expense:
2017 $ 6,741 $ 8,052 $ 6,901
2016 $ 5,187 $ 5,678 $ 7,693 $ 7,266 $ 25,824 REVPAF:
2017 $ 15.65 $ 16.05 $ 16.56
2016 $ 15.01 $ 15.52 $ 16.14 $ 15.83 $ 15.63 Weighted average realized annual rent per occupied square foot:
2017 $ 16.83 $ 17.00 $ 17.52
2016 $ 16.04 $ 16.29 $ 16.95 $ 16.89 $ 16.54 Weighted average occupancy levels for the period:
2017 93.1% 94.6% 94.5%
2016 93.6% 95.4% 95.3% 93.8% 94.5%

42
Analysis of Market Trends
The following table sets forth selected market trends in our Same Store Facilities:
Same Store Facilities Operating Trends by Market
Three Months Ended September 30, Nine Months Ended September 30,
2017 2016 Change 2017 2016 Change
(Amounts in thousands, except for weighted average data)
Revenues:
Los Angeles (201 facilities) $ 85,594 $ 81,285 5.3% $ 248,724 $ 235,249 5.7%
San Francisco (123 facilities) 47,366 45,710 3.6% 137,525 132,296 4.0%
New York (84 facilities) 36,415 35,505 2.6% 105,801 103,179 2.5%
Chicago (129 facilities) 30,872 31,134 (0.8)% 90,734 90,081 0.7%
Miami (76 facilities) 25,749 25,996 (1.0)% 76,724 75,657 1.4%
Washington DC (84 facilities) 27,657 27,404 0.9% 80,475 79,029 1.8%
Atlanta (98 facilities) 20,997 20,785 1.0% 61,299 59,550 2.9%
Seattle-Tacoma (69 facilities) 21,186 20,333 4.2% 60,821 57,817 5.2%
Houston (74 facilities) 16,978 17,587 (3.5)% 50,605 51,852 (2.4)%
Dallas-Ft. Worth (81 facilities) 17,206 17,171 0.2% 50,476 49,527 1.9%
Philadelphia (56 facilities) 13,987 13,474 3.8% 40,508 38,756 4.5%
West Palm Beach (41 facilities) 12,634 12,350 2.3% 37,361 35,753 4.5%
Orlando-Daytona (62 facilities) 13,060 12,540 4.1% 38,069 36,193 5.2%
Minneapolis-St Paul
(44 facilities) 11,625 11,357 2.4% 33,369 32,413 2.9%
Portland (40 facilities) 9,946 9,716 2.4% 28,975 27,989 3.5%
All other markets
(780 facilities) 173,122 169,071 2.4% 503,177 487,868 3.1%
Total revenues $ 564,394 $ 551,418 2.4% $ 1,644,643 $ 1,593,209 3.2%
Net operating income:
Los Angeles $ 71,049 $ 66,841 6.3% $ 205,512 $ 192,528 6.7%
San Francisco 38,759 37,161 4.3% 111,689 107,213 4.2%
New York 25,732 25,161 2.3% 73,843 72,594 1.7%
Chicago 17,517 17,997 (2.7)% 50,281 50,109 0.3%
Miami 18,115 18,693 (3.1)% 54,308 54,438 (0.2)%
Washington DC 20,929 20,948 (0.1)% 59,989 59,742 0.4%
Atlanta 15,447 15,217 1.5% 44,612 43,320 3.0%
Seattle-Tacoma 16,782 16,095 4.3% 47,536 45,291 5.0%
Houston 11,186 11,874 (5.8)% 33,709 35,487 (5.0)%
Dallas-Ft. Worth 11,565 11,776 (1.8)% 33,685 33,711 (0.1)%
Philadelphia 9,989 9,608 4.0% 28,663 27,359 4.8%
West Palm Beach 9,249 9,081 1.9% 27,279 26,186 4.2%
Orlando-Daytona 9,405 8,853 6.2% 27,291 25,469 7.2%
Minneapolis-St. Paul 8,143 7,901 3.1% 22,823 22,175 2.9%
Portland 7,822 7,575 3.3% 22,438 21,745 3.2%
All other markets 125,207 121,492 3.1% 359,114 349,472 2.8%
Total net operating income $ 416,896 $ 406,273 2.6% $ 1,202,772 $ 1,166,839 3.1%

43
Same Store Facilities Operating Trends by Market (Continued)
Three Months Ended September 30, Nine Months Ended September 30,
2017 2016 Change 2017 2016 Change Weighted average square foot occupancy:
Los Angeles 95.9% 96.4% (0.5)% 95.8% 96.0% (0.2)%
San Francisco 95.6% 96.4% (0.8)% 95.6% 96.3% (0.7)%
New York 95.2% 95.3% (0.1)% 94.4% 94.7% (0.3)%
Chicago 92.4% 94.0% (1.7)% 91.7% 92.6% (1.0)%
Miami 93.5% 95.3% (1.9)% 93.5% 95.2% (1.8)%
Washington DC 93.9% 94.6% (0.7)% 93.2% 93.6% (0.4)%
Atlanta 94.4% 95.9% (1.6)% 93.7% 95.1% (1.5)%
Seattle-Tacoma 96.0% 97.0% (1.0)% 95.2% 96.4% (1.2)%
Houston 92.2% 93.2% (1.1)% 90.8% 92.6% (1.9)%
Dallas-Ft. Worth 93.7% 95.3% (1.7)% 93.6% 95.1% (1.6)%
Philadelphia 95.3% 95.3% 0.0% 94.9% 94.7% 0.2%
West Palm Beach 94.6% 95.3% (0.7)% 94.6% 95.5% (0.9)%
Orlando-Daytona 95.4% 95.7% (0.3)% 95.2% 95.3% (0.1)%
Minneapolis-St. Paul 94.3% 94.4% (0.1)% 92.7% 93.2% (0.5)%
Portland 95.5% 97.1% (1.6)% 95.7% 97.0% (1.3)%
All other markets 94.5% 95.1% (0.6)% 94.0% 94.6% (0.6)%
Total weighted average square foot occupancy 94.5% 95.3% (0.8)% 94.1% 94.8% (0.7)%
Realized annual rent per
occupied square foot:
Los Angeles $ 25.32 $ 23.91 5.9% $ 24.57 $ 23.17 6.0%
San Francisco 26.04 24.97 4.3% 25.24 24.09 4.8%
New York 25.24 24.57 2.7% 24.68 23.98 2.9%
Chicago 15.70 15.56 0.9% 15.54 15.26 1.8%
Miami 20.11 19.77 1.7% 19.90 19.22 3.5%
Washington DC 21.56 21.16 1.9% 21.06 20.56 2.4%
Atlanta 13.03 12.68 2.8% 12.77 12.22 4.5%
Seattle-Tacoma 19.50 18.50 5.4% 18.82 17.64 6.7%
Houston 13.98 14.14 (1.1)% 14.02 14.00 0.1%
Dallas-Ft. Worth 13.60 13.36 1.8% 13.35 12.89 3.6%
Philadelphia 16.07 15.46 3.9% 15.60 14.95 4.3%
West Palm Beach 18.15 17.50 3.7% 17.84 16.86 5.8%
Orlando-Daytona 13.61 12.94 5.2% 13.22 12.52 5.6%
Minneapolis-St. Paul 14.98 14.58 2.7% 14.60 14.08 3.7%
Portland 19.09 18.32 4.2% 18.52 17.63 5.0%
All other markets 14.30 13.85 3.2% 13.94 13.41 4.0%
Total realized rent per
occupied square foot $ 17.52 $ 16.95 3.4% $ 17.12 $ 16.43 4.2%

44
Same Store Facilities Operating Trends by Market (Continued)
Three Months Ended September 30, Nine Months Ended September 30,
2017 2016 Change 2017 2016 Change
REVPAF:
Los Angeles $ 24.29 $ 23.06 5.3% $ 23.55 $ 22.24 5.9%
San Francisco 24.91 24.06 3.5% 24.13 23.19 4.1%
New York 24.02 23.42 2.6% 23.30 22.70 2.6%
Chicago 14.52 14.62 (0.7)% 14.24 14.12 0.8%
Miami 18.80 18.83 (0.2)% 18.61 18.29 1.7%
Washington DC 20.24 20.01 1.1% 19.63 19.24 2.0%
Atlanta 12.30 12.16 1.2% 11.96 11.62 2.9%
Seattle-Tacoma 18.71 17.94 4.3% 17.92 17.01 5.3%
Houston 12.89 13.18 (2.2)% 12.73 12.97 (1.9)%
Dallas-Ft. Worth 12.75 12.73 0.2% 12.49 12.26 1.9%
Philadelphia 15.31 14.74 3.9% 14.81 14.15 4.7%
West Palm Beach 17.17 16.68 2.9% 16.88 16.10 4.8%
Orlando-Daytona 12.98 12.38 4.8% 12.59 11.93 5.5%
Minneapolis-St. Paul 14.13 13.76 2.7% 13.53 13.12 3.1%
Portland 18.23 17.79 2.5% 17.73 17.11 3.6%
All other markets 13.52 13.18 2.6% 13.11 12.69 3.3%
Total REVPAF $ 16.56 $ 16.14 2.6% $ 16.09 $ 15.56 3.4%
We believe that our geographic diversification and scale provide some insulation from localized economic effects and add to the stability of our cash flows. It is difficult to predict localized trends in short-term self-storage demand and operating results. Over the long run, we believe that markets that experience population growth, high employment, and otherwise exhibit economic strength and consistency will outperform markets that do not exhibit these characteristics.
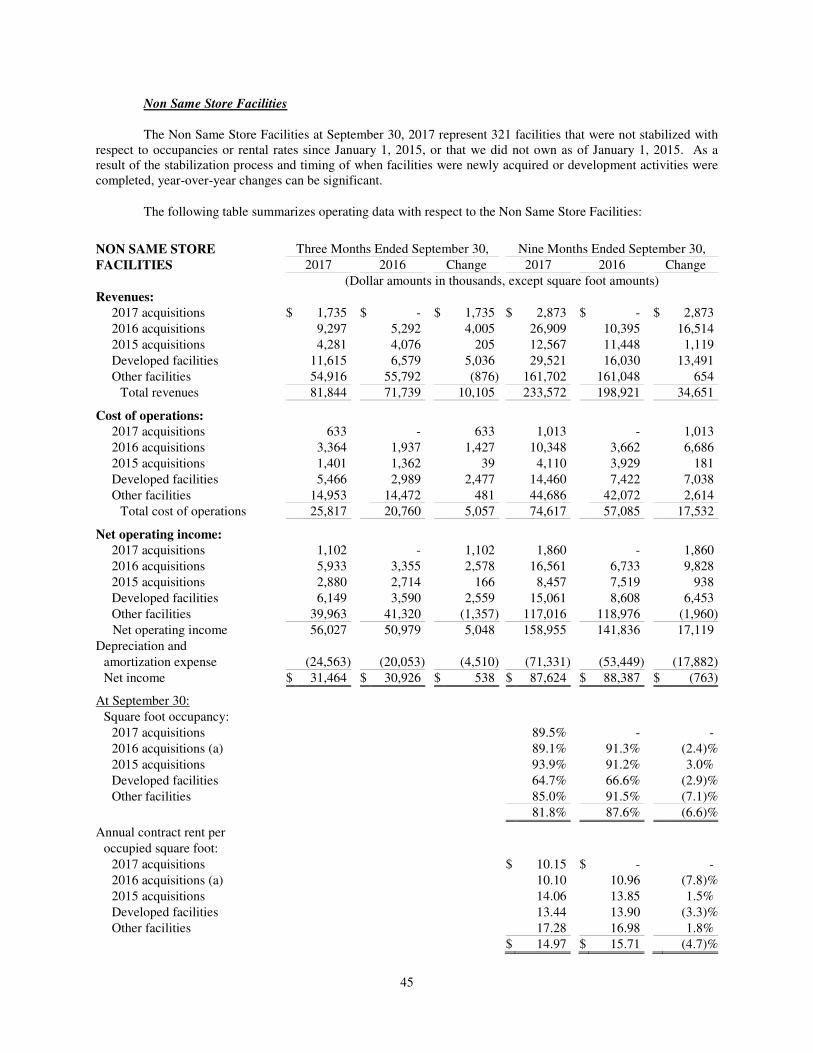
45
Non Same Store Facilities
The Non Same Store Facilities at September 30, 2017 represent 321 facilities that were not stabilized with respect to occupancies or rental rates since January 1, 2015, or that we did not own as of January 1, 2015. As a result of the stabilization process and timing of when facilities were newly acquired or development activities were completed, year-over-year changes can be significant.
The following table summarizes operating data with respect to the Non Same Store Facilities:
NON SAME STORE Three Months Ended September 30, Nine Months Ended September 30,
FACILITIES 2017 2016 Change 2017 2016 Change
(Dollar amounts in thousands, except square foot amounts)
Revenues:
2017 acquisitions $ 1,735 $ - $ 1,735 $ 2,873 $ - $ 2,873
2016 acquisitions 9,297 5,292 4,005 26,909 10,395 16,514
2015 acquisitions 4,281 4,076 205 12,567 11,448 1,119
Developed facilities 11,615 6,579 5,036 29,521 16,030 13,491
Other facilities 54,916 55,792 (876) 161,702 161,048 654
Total revenues 81,844 71,739 10,105 233,572 198,921 34,651 Cost of operations:
2017 acquisitions 633 - 633 1,013 - 1,013
2016 acquisitions 3,364 1,937 1,427 10,348 3,662 6,686
2015 acquisitions 1,401 1,362 39 4,110 3,929 181
Developed facilities 5,466 2,989 2,477 14,460 7,422 7,038
Other facilities 14,953 14,472 481 44,686 42,072 2,614
Total cost of operations 25,817 20,760 5,057 74,617 57,085 17,532 Net operating income:
2017 acquisitions 1,102 - 1,102 1,860 - 1,860
2016 acquisitions 5,933 3,355 2,578 16,561 6,733 9,828
2015 acquisitions 2,880 2,714 166 8,457 7,519 938
Developed facilities 6,149 3,590 2,559 15,061 8,608 6,453
Other facilities 39,963 41,320 (1,357) 117,016 118,976 (1,960)
Net operating income 56,027 50,979 5,048 158,955 141,836 17,119
Depreciation and
amortization expense (24,563) (20,053) (4,510) (71,331) (53,449) (17,882)
Net income $ 31,464 $ 30,926 $ 538 $ 87,624 $ 88,387 $ (763)
At September 30:
Square foot occupancy:
2017 acquisitions 89.5% - -
2016 acquisitions (a) 89.1% 91.3% (2.4)%
2015 acquisitions 93.9% 91.2% 3.0%
Developed facilities 64.7% 66.6% (2.9)%
Other facilities 85.0% 91.5% (7.1)%
81.8% 87.6% (6.6)%
Annual contract rent per
occupied square foot:
2017 acquisitions $ 10.15 $ - -
2016 acquisitions (a) 10.10 10.96 (7.8)%
2015 acquisitions 14.06 13.85 1.5%
Developed facilities 13.44 13.90 (3.3)%
Other facilities 17.28 16.98 1.8%
$ 14.97 $ 15.71 (4.7)%

46
NON SAME STORE Nine Months Ended September 30,
FACILITIES (Continued) 2017 2016 Change
Number of facilities:
2017 acquisitions 14 - 14
2016 acquisitions 55 32 23
2015 acquisitions 17 17 -
Developed facilities 48 30 18
Other facilities 187 187 -
321 266 55
Net rentable square feet (in thousands):
2017 acquisitions 830 - 830
2016 acquisitions 4,121 2,329 1,792
2015 acquisitions 1,285 1,285 -
Developed facilities 5,642 3,225 2,417
Other facilities 14,585 14,020 565
26,463 20,859 5,604
(a) Contract rents per foot and occupancies at September 30, 2016, representing amounts for the properties we acquired in the
first nine months of 2016, are higher than the amounts at September 30, 2017, representing amounts for the properties that we acquired throughout 2016, due primarily to the market mix of properties at each date.
The facilities included above under “2017 acquisitions,” “2016 acquisitions,” and “2015 acquisitions” were acquired at a cost of $81.7 million, $429.1 million, and $168.8 million, respectively.
For the nine months ended September 30, 2017, the weighted average annualized yield on cost, based upon net operating income, for the facilities acquired in each of 2016 and 2015 was 5.1% and 6.7%, respectively. The yields for the facilities acquired in the nine months ended September 30, 2017 were not meaningful due to our limited ownership period.
We believe that our management and operating infrastructure allows us to generate higher net operating income from newly acquired facilities than was achieved by the previous owners. However, it can take 24 or more months for us to fully achieve the higher net operating income, and the ultimate levels of net operating income to be achieved can be affected by changes in general economic conditions. As a result, there can be no assurance that we will achieve our expectations with respect to these newly acquired facilities.
Since the beginning of 2013, we have opened newly developed facilities with a total cost of $640.4 million and redeveloped existing facilities, expanding their square footage, for a total cost of $190.8 million. The newly developed facilities are included in “Developed facilities” and the redeveloped facilities are included in “Other facilities” in the table above. We believe that our real estate development activities are beneficial to our business over the long run. However, in the short run, development activities dilute our earnings due to the three to four year period to reach a stabilized level of cash flows and the cost of capital to fund development, combined with general and administrative expenses associated with development. We believe this dilution will increase in the remainder of 2017 and beyond, because of an increased level of net rentable square feet being added to our portfolio.
We expect the Non Same Store Facilities to continue to provide increased net operating income in 2017 as these facilities approach stabilized occupancy levels and the earnings of the 2017 and 2016 acquisitions are reflected in our operations for a longer period in 2017 as compared to 2016.
We also expect to increase the number and net rentable square feet of Non Same Store Facilities through development of new self-storage facilities, redevelopment of existing facilities and acquisitions of facilities.
As of September 30, 2017, we had development and redevelopment projects which will add approximately 4.7 million net rentable square feet of storage space at a total cost of approximately $600.2 million. Some of these

47
projects are subject to significant contingencies such as entitlement approval. We expect to continue to seek additional development projects; however, the level of future development may be limited due to various constraints such as difficulty in finding projects that meet our risk-adjusted yield expectations and challenges in obtaining building permits for self-storage activities in certain municipalities.
Subsequent to September 30, 2017, we acquired or were under contract to acquire (subject to customary closing conditions) eight self-storage facilities for $67.8 million. We will continue to seek to acquire properties; however, there is significant competition to acquire existing facilities and therefore the dollar value of acquisitions is unpredictable.
Depreciation and amortization with respect to the Non Same Store Facilities totaled $24.6 million and $71.3 million for the three and nine months ended September 30, 2017, respectively, as compared to $20.1 million and $53.4 million for the same periods in 2016. These amounts include i) depreciation of the buildings acquired or developed, which is recorded generally on a straight line basis, and ii) amortization of cost allocated to the tenants in place upon acquisition of a facility, which is recorded based upon the benefit of such existing tenants to each period and thus is highest when the facility is first acquired and declines as such tenants vacate. With respect to Non Same Store Facilities owned at September 30, 2017, depreciation of buildings and amortization of tenant intangibles is expected to total $19.9 million and $2.3 million, respectively, in the remainder of 2017. The level of future depreciation and amortization will also depend upon the level of acquisitions of facilities and the level of newly developed storage space.
Ancillary Operations
Ancillary revenues and expenses include amounts associated with the reinsurance of policies against losses to goods stored by tenants in our self-storage facilities in the U.S. and the sale of merchandise at our self-storage facilities. The following table sets forth our ancillary operations:
Three Months Ended September 30, Nine Months Ended September 30,
2017 2016 Change 2017 2016 Change (Amounts in thousands)
Revenues:
Tenant reinsurance premiums $ 31,175 $ 30,489 $ 686 $ 92,094 $ 88,960 $ 3,134
Merchandise 8,948 9,502 (554) 25,911 28,032 (2,121)
Total revenues 40,123 39,991 132 118,005 116,992 1,013 Cost of Operations:
Tenant reinsurance 11,916 6,939 4,977 24,179 23,371 808
Merchandise 5,388 5,783 (395) 15,432 17,091 (1,659)
Total cost of operations 17,304 12,722 4,582 39,611 40,462 (851) Net income
Tenant reinsurance 19,259 23,550 (4,291) 67,915 65,589 2,326
Merchandise 3,560 3,719 (159) 10,479 10,941 (462)
Total net income $ 22,819 $ 27,269 $ (4,450) $ 78,394 $ 76,530 $ 1,864
Tenant reinsurance operations: Our tenants have the option of purchasing insurance from a non-affiliated insurance company to cover certain losses to their goods stored at our facilities. A wholly-owned, consolidated subsidiary of Public Storage fully reinsures such policies, and thereby assumes all risk of losses under these policies from the insurance company. The subsidiary receives reinsurance premiums, substantially equal to the premiums collected from our tenants, from the non-affiliated insurance company. Such reinsurance premiums are shown as “Tenant reinsurance premiums” in the above table.

48
The subsidiary pays a fee to Public Storage to assist with the administration of the program and to allow the insurance to be marketed to our tenants. This fee represents a substantial amount of the reinsurance premiums received by our subsidiary. The fee is eliminated in consolidation and is therefore not shown in the above table.
Tenant reinsurance revenue increased $0.7 million and $3.1 million in the three and nine months ended September 30, 2017, respectively, as compared to the same periods in 2016, due primarily to an increase in our tenant base due to newly acquired and developed facilities.
Cost of operations primarily includes claims paid that are not covered by our outside third-party insurers, as well as claims adjustment expenses. Tenant reinsurance cost of operations for the three and nine month periods ended September 30, 2017 include $5.2 million in incremental tenant reinsurance losses related to Hurricanes Harvey and Irma. Excluding these incremental hurricane related losses, tenant reinsurance cost of operations decreased $0.2 million and $4.4 million in the three and nine months ended September 30, 2017, respectively, as compared to the same periods in 2016. These decreases are due primarily to lower claims, primarily water related claims which were elevated in the nine months ended September 30, 2016 due mostly to flooding in Houston and South Carolina.
Merchandise sales: We sell locks, boxes, and packing supplies at our self-storage facilities, and the level of sales of these items is primarily impacted by the level of move-ins and other customer traffic at our self-storage facilities. We do not expect any significant changes in revenues or profitability from our merchandise sales in the remainder of 2017.
Equity in earnings of unconsolidated real estate entities
At September 30, 2017, we have equity investments in PSB, Shurgard Europe and various limited partnerships. We account for such investments using the equity method and record our pro-rata share of the net income of these entities for each period. The following table, and the discussion below, sets forth the significant components of our equity in earnings of unconsolidated real estate entities:
Three Months Ended September 30, Nine Months Ended September 30,
2017 2016 Change 2017 2016 Change (Amounts in thousands)
Equity in earnings:
PSB $ 9,261 $ 10,118 $ (857) $ 35,694 $ 25,318 $ 10,376
Shurgard Europe 7,243 6,362 881 19,484 14,304 5,180
Other Investments 714 757 (43) 2,057 2,006 51
Total equity in earnings $ 17,218 $ 17,237 $ (19) $ 57,235 $ 41,628 $ 15,607
Investment in PSB: At September 30, 2017 and December 31, 2016, we had approximately a 42% common equity interest in PS Business Parks, Inc. (“PSB”), comprised of our ownership of 7,158,354 shares of PSB’s common stock and 7,305,355 limited partnership units in an operating partnership controlled by PSB. The limited partnership units are convertible at our option, subject to certain conditions, on a one-for-one basis into PSB common stock.
At September 30, 2017, PSB wholly-owned approximately 28 million rentable square feet of commercial space and had an interest in 395 apartments. PSB also manages commercial space that we own pursuant to property management agreements.
Equity in earnings from PSB decreased $0.9 million in the three months ended September 30, 2017, as compared to the same period in 2016, due primarily to our $2.9 million equity share of PSB’s allocation of income to its preferred stockholders in connection with the redemption of preferred stock in September 2017, offset partially by improved real estate facility operating results. Equity in earnings from PSB increased $10.4 million in the nine months ended September 30, 2017, as compared to the same period in 2016 due primarily to improved real estate facility operating results, reduced depreciation expense, a gain on sale of real estate in the nine month period in 2017, and lower interest expense due to the repayment of debt, offset partially by the allocation of income to

49
preferred stockholders in connection with the redemption of preferred stock as noted above. See Note 4 to our September 30, 2017 financial statements for selected financial information on PSB, as well as PSB’s filings and selected financial information that can be accessed through the SEC, and on PSB’s website, www.psbusinessparks.com.
Investment in Shurgard Europe: We have a 49% equity share in Shurgard Europe’s net income. At September 30, 2017, Shurgard Europe’s operations are comprised of 219 wholly-owned facilities with 12 million net rentable square feet. See Note 4 to our September 30, 2017 financial statements for selected financial data on Shurgard Europe for the nine months ended September 30, 2017 and 2016. As described in more detail in Note 4, we receive trademark license fees from Shurgard Europe.
Our equity in earnings from Shurgard Europe increased $0.9 million and $5.2 million in the three and nine months ended September 30, 2017, respectively, as compared to the same periods in 2016. The increases are due primarily to improved property operations; the increase for the nine month period also reflects decreased amortization expense associated with tenant intangibles on newly acquired facilities. For purposes of recording our equity in earnings from Shurgard Europe, the Euro was translated at exchange rates of approximately 1.181 U.S. Dollars per Euro at September 30, 2017 (1.052 at December 31, 2016), and average exchange rates of 1.175 and 1.116 for the three months ended September 30, 2017 and 2016, respectively, and average exchange rates of 1.113 and 1.116 for the nine months ended September 30, 2017 and 2016, respectively.
Our future earnings from Shurgard Europe will be affected primarily by the operating results of its existing facilities, the exchange rate between the U.S. Dollar and currencies in the countries in which Shurgard Europe conducts its business (principally the Euro), the impact of income taxes, and the degree to which Shurgard Europe reinvests the cash it generates from operations into real estate investments or distributes the amounts to its shareholders.
Unlike our operations in the United States, Shurgard Europe operates through taxable corporations in each of the countries in which it does business and incurs tax expense. Our equity share of such income tax expense was approximately $2.7 million and $6.2 million for the three and nine months ended September 30, 2017, respectively, as compared to $1.5 million and $4.3 million for the same periods in 2016.
Analysis of items not allocated to segments
General and administrative expense: The following table sets forth our general and administrative expense:
Three Months Ended September 30, Nine Months Ended September 30,
2017 2016 Change 2017 2016 Change (Amounts in thousands) Share-based compensation expense $ 12,991 $ 11,416 $ 1,575 $ 26,153 $ 27,899 $ (1,746)
Costs of senior executives 419 419 - 5,455 5,635 (180)
Development and acquisition costs 1,655 2,211 (556) 6,844 7,300 (456)
Tax compliance costs and taxes paid 1,063 847 216 3,510 3,052 458
Legal costs 1,500 2,051 (551) 5,181 5,859 (678)
Public company costs 981 916 65 3,129 2,839 290
Other costs 3,702 4,280 (578) 12,059 10,924 1,135
Total $ 22,311 $ 22,140 $ 171 $ 62,331 $ 63,508 $ (1,177)
Share-based compensation expense includes the amortization of restricted share units and stock options granted to employees and trustees, as well as related employer taxes. Share-based compensation expense varies based upon the level of grants and forfeitures as well as the Company’s common share price on the date of grant. Share-based compensation costs in the nine months ended September 30, 2017 include a $5.4 million reversal of previously amortized costs, due to the forfeiture of share-based compensation resulting from the retirement of
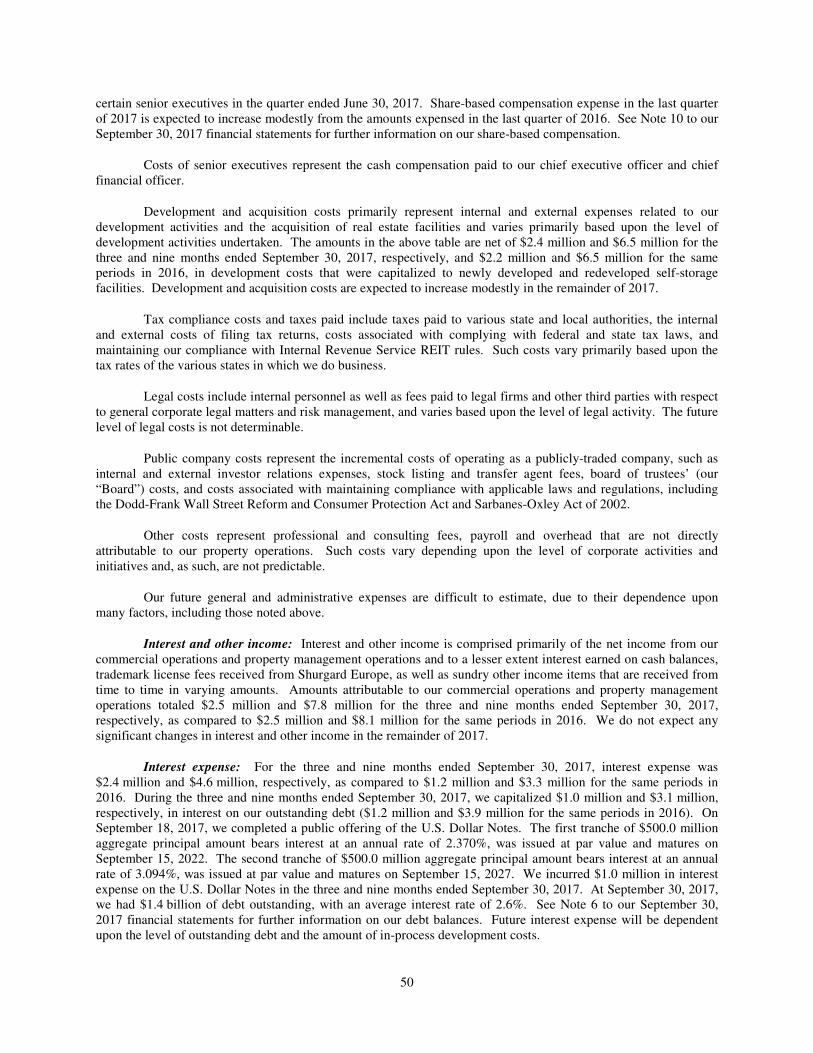
50
certain senior executives in the quarter ended June 30, 2017. Share-based compensation expense in the last quarter of 2017 is expected to increase modestly from the amounts expensed in the last quarter of 2016. See Note 10 to our September 30, 2017 financial statements for further information on our share-based compensation.
Costs of senior executives represent the cash compensation paid to our chief executive officer and chief financial officer.
Development and acquisition costs primarily represent internal and external expenses related to our development activities and the acquisition of real estate facilities and varies primarily based upon the level of development activities undertaken. The amounts in the above table are net of $2.4 million and $6.5 million for the three and nine months ended September 30, 2017, respectively, and $2.2 million and $6.5 million for the same periods in 2016, in development costs that were capitalized to newly developed and redeveloped self-storage facilities. Development and acquisition costs are expected to increase modestly in the remainder of 2017.
Tax compliance costs and taxes paid include taxes paid to various state and local authorities, the internal and external costs of filing tax returns, costs associated with complying with federal and state tax laws, and maintaining our compliance with Internal Revenue Service REIT rules. Such costs vary primarily based upon the tax rates of the various states in which we do business.
Legal costs include internal personnel as well as fees paid to legal firms and other third parties with respect to general corporate legal matters and risk management, and varies based upon the level of legal activity. The future level of legal costs is not determinable.
Public company costs represent the incremental costs of operating as a publicly-traded company, such as internal and external investor relations expenses, stock listing and transfer agent fees, board of trustees’ (our “Board”) costs, and costs associated with maintaining compliance with applicable laws and regulations, including the Dodd-Frank Wall Street Reform and Consumer Protection Act and Sarbanes-Oxley Act of 2002.
Other costs represent professional and consulting fees, payroll and overhead that are not directly attributable to our property operations. Such costs vary depending upon the level of corporate activities and initiatives and, as such, are not predictable.
Our future general and administrative expenses are difficult to estimate, due to their dependence upon many factors, including those noted above.
Interest and other income: Interest and other income is comprised primarily of the net income from our commercial operations and property management operations and to a lesser extent interest earned on cash balances, trademark license fees received from Shurgard Europe, as well as sundry other income items that are received from time to time in varying amounts. Amounts attributable to our commercial operations and property management operations totaled $2.5 million and $7.8 million for the three and nine months ended September 30, 2017, respectively, as compared to $2.5 million and $8.1 million for the same periods in 2016. We do not expect any significant changes in interest and other income in the remainder of 2017.
Interest expense: For the three and nine months ended September 30, 2017, interest expense was $2.4 million and $4.6 million, respectively, as compared to $1.2 million and $3.3 million for the same periods in 2016. During the three and nine months ended September 30, 2017, we capitalized $1.0 million and $3.1 million, respectively, in interest on our outstanding debt ($1.2 million and $3.9 million for the same periods in 2016). On September 18, 2017, we completed a public offering of the U.S. Dollar Notes. The first tranche of $500.0 million aggregate principal amount bears interest at an annual rate of 2.370%, was issued at par value and matures on September 15, 2022. The second tranche of $500.0 million aggregate principal amount bears interest at an annual rate of 3.094%, was issued at par value and matures on September 15, 2027. We incurred $1.0 million in interest expense on the U.S. Dollar Notes in the three and nine months ended September 30, 2017. At September 30, 2017, we had $1.4 billion of debt outstanding, with an average interest rate of 2.6%. See Note 6 to our September 30, 2017 financial statements for further information on our debt balances. Future interest expense will be dependent upon the level of outstanding debt and the amount of in-process development costs.

51
Foreign Exchange Gain Loss: For the three and nine months ended September 30, 2017, we recorded foreign currency translation losses of $13.4 million and $44.5 million, respectively, representing the change in the U.S. Dollar equivalent of our Euro-denominated unsecured notes due to fluctuations in exchange rates (losses of $3.7 million and $6.0 million for the same periods in 2016). The Euro was translated at exchange rates of approximately 1.181 U.S. Dollars per Euro at September 30, 2017, 1.142 at June 30, 2017 and 1.052 at December 31, 2016. Future gains and losses on foreign currency translation will be dependent upon changes in the relative value of the Euro to the U.S. Dollar, and the level of Euro-denominated debt outstanding.
Casualty Loss: The $7.8 million casualty loss on our income statements for the three and nine months ended September 30, 2017 represents $3.3 million resulting from physical damage to our facilities and $4.5 million incurred for repairs, cleanup, and disposal with respect to Hurricanes Harvey and Irma.
Net Income Allocable to Preferred Shareholders: Net income allocable to preferred shareholders based upon distributions increased in the three and nine months ended September 30, 2017 as compared to the same periods in 2016, due primarily to higher outstanding preferred shares offset partially by lower average rates. We also allocated $14.7 million and $29.3 million in the three and nine months ended September 30, 2017, and $26.9 million in the nine months ended September 30, 2016 (none in the three months ended September 30, 2016), of income from our common shareholders to the holders of our Preferred Shares due to redemptions of preferred securities. Based upon our preferred shares outstanding at September 30, 2017, our quarterly distribution to our preferred shareholders is expected to be approximately $54.1 million.
Liquidity and Capital Resources
Financing Strategy: As a REIT, we generally distribute 100% of our taxable income to our shareholders, which relative to a taxable C corporation, limits the amount of cash flow from operations that we can retain for investments. As a result, in order to grow our asset base, access to capital is important. Historically we have primarily financed our cash investment activities with retained operating cash flow combined with the proceeds from the issuance of preferred securities. Over the past eighteen months, we began to diversify our capital sources by issuing medium term debt.
Our financial profile is characterized by strong credit metrics, including low leverage relative to our total capitalization and operating cash flows. We are one of the highest rated REITs, as rated by major rating agencies Moody’s and Standard & Poor’s. Our unsecured debt has an “A” credit rating by Standard & Poor’s and “A2” by Moody’s. Our credit ratings on each of our series of preferred shares are “A3” by Moody’s and “BBB+” by Standard & Poor’s. Our credit profile and ratings enables us to effectively access both the public and private capital markets to raise capital.
We have a $500.0 million revolving line of credit which we occasionally use as temporary “bridge” financing until we are able to raise longer term capital. As of September 30, 2017 and October 31, 2017, there were no borrowings outstanding on the revolving line of credit, however, we do have approximately $18.7 million of outstanding letters of credit which limits our borrowing capacity to $481.3 million.
Over the long-term, we expect to fund our capital requirements with retained operating cash flow, the issuance of additional medium or long term debt, and proceeds from the issuance of common and preferred securities. We will select among these sources of capital based upon availability, relative cost, the desire for leverage, and considering potential constraints caused by certain features of capital sources, such as debt covenants.
Liquidity and Capital Resource Analysis: We believe that our net cash provided by our operating activities will continue to be sufficient to enable us to meet our ongoing requirements for principal payments on debt, maintenance capital expenditures, and distributions to our shareholders for the foreseeable future.
As of September 30, 2017, our capital resources over the next year are expected to be approximately $1.4 billion which exceeds our current planned capital needs over the next year of approximately $447.8 million. Our capital resources include: (i) $694.2 million of cash as of September 30, 2017, (ii) $481.3 million of available borrowing capacity on our revolving line of credit, and (iii) approximately $250.0 million of expected retained

52
operating cash flow for the next twelve months. Retained operating cash flow represents our expected cash flow provided by operating activities, less shareholder distributions and capital expenditures to maintain our real estate facilities.
Our planned capital needs over the next year consist of (i) $378.3 million of remaining spend on our current development pipeline, (ii) $67.8 million in property acquisitions currently under contract, and (iii) $1.7 million in principal repayments on existing debt. Our capital needs may increase significantly over the next year as we expect to increase our development pipeline and acquire additional properties. We may also redeem outstanding preferred securities or repurchase shares of our common stock in the future.
To the extent our retained operating cash flow and line of credit are insufficient to fund our activities, we believe we have a variety of possibilities to raise additional capital including issuing common or preferred securities, issuing debt, or entering into joint venture arrangements to acquire or develop facilities.
Required Debt Repayments: As of September 30, 2017, our outstanding debt totaled approximately $1.4 billion, consisting of $29.7 million of secured debt, $404.1 million of Euro-denominated unsecured debt and $1.0 billion of U.S. Dollar denominated unsecured debt. Approximate principal maturities are as follows (amounts in thousands):
Remainder of 2017 $ 432
2018 11,241
2019 1,505
2020 1,585
2021 1,503
2022 502,071
Thereafter 915,388
$ 1,433,725
The remaining maturities on our debt over at least the next five years are nominal compared to our expected annual retained operating cash flow.
Capital Expenditure Requirements: Capital expenditures include general maintenance, major repairs or replacements to elements of our facilities to keep our facilities in good operating condition and maintain their visual appeal. Capital expenditures do not include costs relating to the development of new facilities or redevelopment of existing facilities to increase their available rentable square footage.
Capital expenditures totaled $82.5 million in the nine months ended September 30, 2017 and are expected to be approximately $120 million for the year ending December 31, 2017. For the last four years, capital expenditures have ranged between approximately $0.45 and $0.56 per net rentable square foot per year.
Requirement to Pay Distributions: For all periods presented herein, we have elected to be treated as a REIT, as defined in the Code. As a REIT, we do not incur federal income tax on our REIT taxable income (generally, net rents and gains from real property, dividends, and interest) that is fully distributed each year (for this purpose, certain distributions paid in a subsequent year may be considered), and if we meet certain organizational and operational rules. We believe we have met these requirements in all periods presented herein, and we expect to continue to elect and qualify as a REIT.
Distributions paid during the nine months ended September 30, 2017 totaled $1.2 billion, consisting of $182.5 million to preferred shareholders and $1.0 billion to common shareholders and restricted share unitholders. All of these distributions were REIT qualifying distributions.
We estimate the annual distribution requirements with respect to our Preferred Shares outstanding at September 30, 2017, to be approximately $216.3 million per year.

53
On October 25, 2017, our Board declared a regular common quarterly dividend of $2.00 per common share. Our consistent, long-term dividend policy has been to distribute only our taxable income. Future quarterly distributions with respect to the common shares will continue to be determined based upon our REIT distribution requirements after taking into consideration distributions to the preferred shareholders and will be funded with cash provided by operating activities.
We estimate we will pay approximately $7.4 million per year in distributions to noncontrolling interests outstanding at September 30, 2017.
Real Estate Investment Activities: Subsequent to September 30, 2017, we acquired or were under contract to acquire (subject to customary closing conditions) eight self-storage facilities for $67.8 million. We will continue to seek to acquire properties; however, there is significant competition to acquire existing facilities and there can be no assurance as to the level of facilities we may acquire.
As of September 30, 2017 we had development and redevelopment projects at a total cost of approximately $600.2 million. A total of $221.9 million of these costs were incurred through September 30, 2017, with the remaining cost to complete of $378.3 million expected to be incurred primarily in the next 18 months. Some of these projects are subject to significant contingencies such as entitlement approval. We expect to continue to seek additional projects; however, the level of future development and redevelopment may be limited due to various constraints such as difficulty in finding projects that meet our risk-adjusted yield expectations and challenges in obtaining building permits for self-storage activities in certain municipalities.
Redemption of Preferred Securities: Historically, we have taken advantage of refinancing higher coupon preferred securities with lower coupon preferred securities. In the future, we may also elect to finance the redemption of preferred securities with proceeds from the issuance of debt. As of October 31, 2017, we have two series of preferred securities that are eligible for redemption, at our option and with 30 days’ notice; our 5.625% Series U Preferred Shares, with $287.5 million outstanding and our 5.375% Series V Preferred Shares with $495.0 million outstanding. Redemption of such preferred shares will depend upon many factors. None of our preferred securities are redeemable at the option of the holders.
Repurchases of Common Shares: Our Board has authorized management to repurchase up to 35,000,000 of our common shares on the open market or in privately negotiated transactions. During the three months ended September 30, 2017, we did not repurchase any of our common shares. From the inception of the repurchase program through October 31, 2017, we have repurchased a total of 23,721,916 common shares at an aggregate cost of approximately $679.1 million. Future levels of common share repurchases will be dependent upon our available capital, investment alternatives and the trading price of our common shares.
Contractual Obligations
Our significant contractual obligations at September 30, 2017 and their impact on our cash flows and liquidity are summarized below for the years ending December 31 (amounts in thousands):
Remainder
Total of 2017 2018 2019 2020 2021 2022 Thereafter
Interest and principal payments on debt (1) $ 1,713,911 $ 9,578 $ 47,965 $ 37,680 $ 37,680 $ 37,492 $ 535,101 $ 1,008,415
Operating leases (2) 86,344 1,107 4,401 4,338 4,331 4,384 3,718 64,065 Construction commitments (3) 186,720 149,376 37,344 - - - - - Total $ 1,986,975 $ 160,061 $ 89,710 $ 42,018 $ 42,011 $ 41,876 $ 538,819 $ 1,072,480
(1) Represents contractual principal and interest payments. Amounts with respect to certain Euro-denominated debt are based upon exchange rates at September 30, 2017. See Note 6 to our September 30, 2017 financial statements for further information.

54
(2) Represents future contractual payments on land, equipment and office space under various operating leases.
(3) Represents future expected development spending that was under contract at September 30, 2017.
We estimate the annual distribution requirements with respect to our Preferred Shares outstanding at September 30, 2017 to be approximately $216.3 million per year. Dividends are paid when and if declared by our Board and accumulate if not paid.
Off-Balance Sheet Arrangements: At September 30, 2017, we had no material off-balance sheet arrangements as defined under Regulation S-K 303(a)(4) and the instructions thereto.
ITEM 3. Quantitative and Qualitative Disclosures about Market Risk
To limit our exposure to market risk, we are capitalized primarily with preferred and common equity. Our preferred shares are redeemable at our option generally five years after issuance, but the holder has no redemption option. Our debt is our only market-risk sensitive portion of our capital structure, which totals approximately $1.4 billion and represents 16.0% of the book value of our equity at September 30, 2017.
We have foreign currency exposure at September 30, 2017 related to i) our investment in Shurgard Europe, with a book value of $318.2 million and ii) €342.0 million ($404.1 million) of Euro-denominated unsecured notes payable.
The fair value of our fixed rate debt at September 30, 2017 is approximately $1.4 billion. The table below summarizes the annual maturities of our fixed rate debt, which had a weighted average effective rate of 2.6% at September 30, 2017. See Note 6 to our September 30, 2017 financial statements for further information regarding our fixed rate debt (amounts in thousands).
Remainder
of
2017 2018 2019 2020 2021 2022 Thereafter Total Fixed rate debt $ 432 $ 11,241 $ 1,505 $ 1,585 $ 1,503 $ 502,071 $ 915,388 $ 1,433,725
ITEM 4. Controls and Procedures
Conclusion Regarding the Effectiveness of Disclosure Controls and Procedures
We maintain disclosure controls and procedures that are designed to ensure that information required to be disclosed in reports we file and submit under the Securities Exchange Act of 1934, as amended (the “Exchange Act”) is recorded, processed, summarized and reported within the time periods specified in accordance with SEC guidelines and that such information is communicated to our management, including our Chief Executive Officer and Chief Financial Officer, to allow timely decisions regarding required disclosure based on the definition of "disclosure controls and procedures" in Rules 13a-15(e) and 15d-15(e) of the Exchange Act. In designing and evaluating the disclosure controls and procedures, management recognized that any controls and procedures, no matter how well designed and operated, can provide only reasonable assurance of achieving the desired control objectives and management necessarily was required to apply its judgment in evaluating the cost-benefit relationship of possible controls and procedures in reaching that level of reasonable assurance. We also have investments in certain unconsolidated real estate entities and because we do not control these entities, our disclosure controls and procedures with respect to such entities are substantially more limited than those we maintain with respect to our consolidated subsidiaries.
Under the supervision and with the participation of our management, including our Chief Executive Officer and Chief Financial Officer, we evaluated the effectiveness of our disclosure controls and procedures, as required by Exchange Act Rule 13a-15(b), as of the end of the period covered by this report. Based on that evaluation, our

55
Chief Executive Officer and Chief Financial Officer concluded that our disclosure controls and procedures were effective, at a reasonable assurance level.
Internal Control Over Financial Reporting
There were no changes in our internal control over financial reporting during the quarter ended September 30, 2017 that have materially affected, or are reasonably likely to materially affect, our internal control over financial reporting.
56
Part II. OTHER INFORMATION
ITEM 1. Legal Proceedings
We are a party to various legal proceedings and subject to various claims and complaints; however, we
believe that the likelihood of these contingencies resulting in a material loss to the Company, either individually or in the aggregate, is remote.
ITEM 1A. Risk Factors
In addition to the other information in this Quarterly Report on Form 10-Q, you should carefully consider the risks described in our Annual Report on Form 10-K filed for the year ended December 31, 2016, in Part I, Item 1A, Risk Factors, and in our other filings with the SEC. These factors may materially affect our business, financial condition and operating results and could cause our actual results to differ materially from expectations. In addition, in considering the forward-looking statements contained in this Form 10-Q and elsewhere, you should refer to the qualifications and limitations on our forward-looking statements that are described in Forward Looking Statements at the beginning of Part I, Item 2 of this Form 10-Q.
ITEM 2. Unregistered Sales of Equity Securities and Use of Proceeds
Common Share Repurchases Our Board has authorized management to repurchase up to 35,000,000 of our common shares on the open
market or in privately negotiated transactions. From the inception of the repurchase program through October 31, 2017, we have repurchased a total of 23,721,916 common shares (all purchased prior to 2010) at an aggregate cost of approximately $679.1 million. Our common share repurchase program does not have an expiration date and there are 11,278,084 common shares that may yet be repurchased under our repurchase program as of September 30, 2017. We have no current plans to repurchase shares; however, future levels of common share repurchases will be dependent upon our available capital, investment alternatives, and the trading price of our common shares.
Preferred Share Redemptions We redeemed, pursuant to our option to redeem such shares, 18,400,000 of our Series S preferred shares in
July 2017 and 18,500,000 of our Series T preferred shares in September 2017, at $25.00 per share. No other preferred redemptions were made during the three months ended September 30, 2017.
ITEM 6. Exhibits
Exhibits required by Item 601 of Regulation S-K are filed herewith or incorporated herein by reference and are listed in the attached Exhibit Index which is incorporated herein by reference.
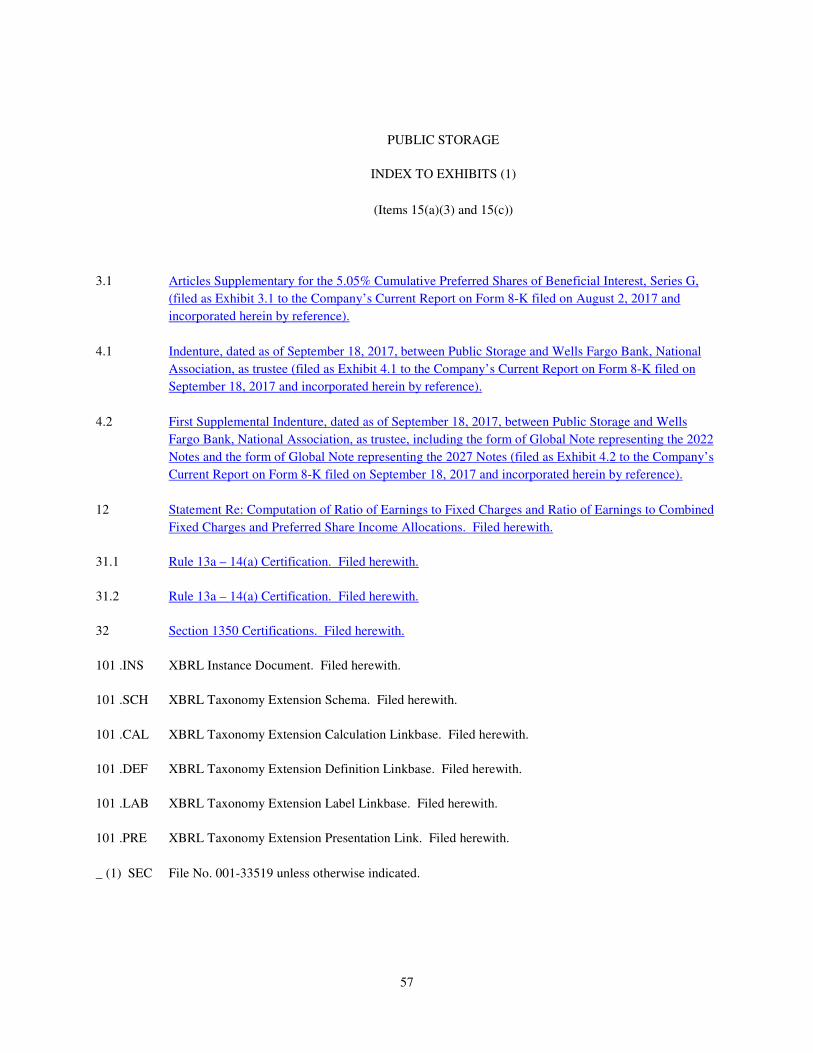
57
PUBLIC STORAGE
INDEX TO EXHIBITS (1)
(Items 15(a)(3) and 15(c))
3.1 Articles Supplementary for the 5.05% Cumulative Preferred Shares of Beneficial Interest, Series G,
(filed as Exhibit 3.1 to the Company’s Current Report on Form 8-K filed on August 2, 2017 and
incorporated herein by reference).
4.1 Indenture, dated as of September 18, 2017, between Public Storage and Wells Fargo Bank, National
Association, as trustee (filed as Exhibit 4.1 to the Company’s Current Report on Form 8-K filed on
September 18, 2017 and incorporated herein by reference).
4.2 First Supplemental Indenture, dated as of September 18, 2017, between Public Storage and Wells
Fargo Bank, National Association, as trustee, including the form of Global Note representing the 2022
Notes and the form of Global Note representing the 2027 Notes (filed as Exhibit 4.2 to the Company’s
Current Report on Form 8-K filed on September 18, 2017 and incorporated herein by reference).
12 Statement Re: Computation of Ratio of Earnings to Fixed Charges and Ratio of Earnings to Combined
Fixed Charges and Preferred Share Income Allocations. Filed herewith.
31.1 Rule 13a – 14(a) Certification. Filed herewith.
31.2 Rule 13a – 14(a) Certification. Filed herewith.
32 Section 1350 Certifications. Filed herewith.
101 .INS XBRL Instance Document. Filed herewith.
101 .SCH XBRL Taxonomy Extension Schema. Filed herewith.
101 .CAL XBRL Taxonomy Extension Calculation Linkbase. Filed herewith.
101 .DEF XBRL Taxonomy Extension Definition Linkbase. Filed herewith.
101 .LAB XBRL Taxonomy Extension Label Linkbase. Filed herewith.
101 .PRE XBRL Taxonomy Extension Presentation Link. Filed herewith.
_ (1) SEC File No. 001-33519 unless otherwise indicated.

58
SIGNATURES
Pursuant to the requirement of the Securities Exchange Act of 1934, the Registrant has duly caused this report to be signed on its behalf by the undersigned thereunto duly authorized.
4
DATED: October 31, 2017
PUBLIC STORAGE
By: /s/ John Reyes
John Reyes
Senior Vice President and Chief Financial Officer
(Principal financial officer and duly authorized officer)
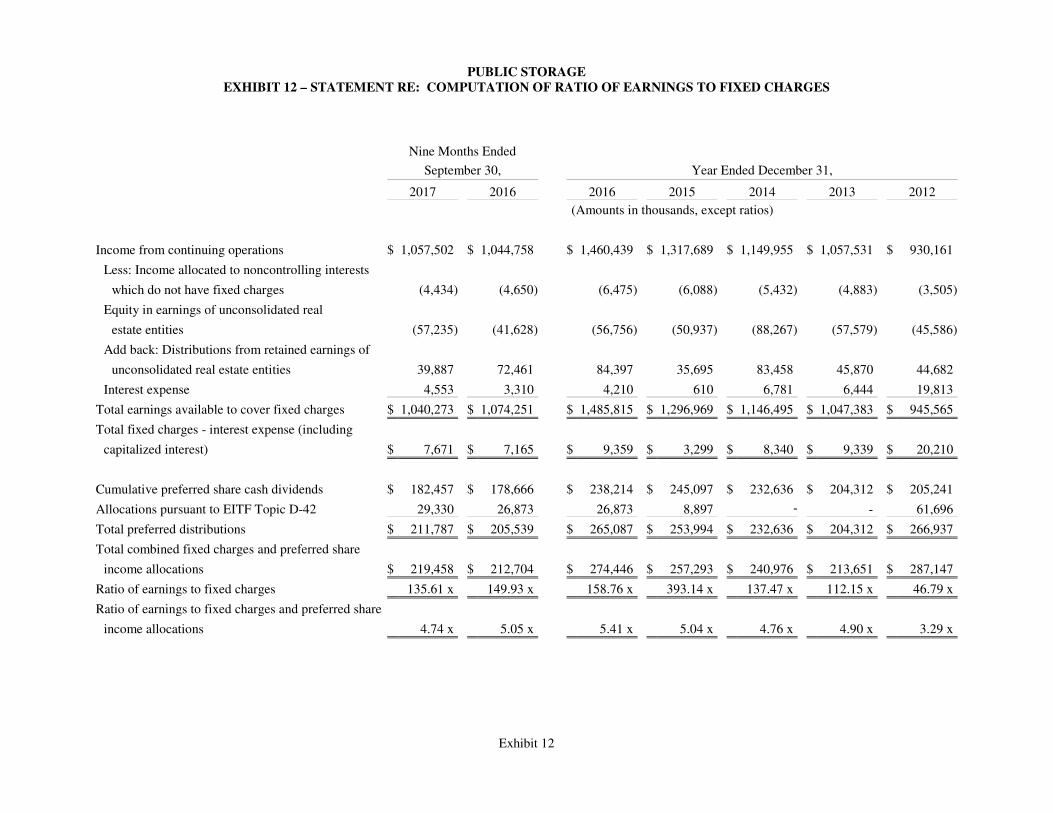
PUBLIC STORAGE
EXHIBIT 12 – STATEMENT RE: COMPUTATION OF RATIO OF EARNINGS TO FIXED CHARGES
Exhibit 12
Nine Months Ended
September 30, Year Ended December 31,
2017 2016 2016 2015 2014 2013 2012 (Amounts in thousands, except ratios)
Income from continuing operations $ 1,057,502 $ 1,044,758 $ 1,460,439 $ 1,317,689 $ 1,149,955 $ 1,057,531 $ 930,161
Less: Income allocated to noncontrolling interests
which do not have fixed charges (4,434) (4,650) (6,475) (6,088) (5,432) (4,883) (3,505)
Equity in earnings of unconsolidated real
estate entities (57,235) (41,628) (56,756) (50,937) (88,267) (57,579) (45,586)
Add back: Distributions from retained earnings of
unconsolidated real estate entities 39,887 72,461 84,397 35,695 83,458 45,870 44,682
Interest expense 4,553 3,310 4,210 610 6,781 6,444 19,813
Total earnings available to cover fixed charges $ 1,040,273 $ 1,074,251 $ 1,485,815 $ 1,296,969 $ 1,146,495 $ 1,047,383 $ 945,565
Total fixed charges - interest expense (including
capitalized interest) $ 7,671 $ 7,165 $ 9,359 $ 3,299 $ 8,340 $ 9,339 $ 20,210
Cumulative preferred share cash dividends $ 182,457 $ 178,666 $ 238,214 $ 245,097 $ 232,636 $ 204,312 $ 205,241
Allocations pursuant to EITF Topic D-42 29,330 26,873 26,873 8,897 - - 61,696
Total preferred distributions $ 211,787 $ 205,539 $ 265,087 $ 253,994 $ 232,636 $ 204,312 $ 266,937
Total combined fixed charges and preferred share
income allocations $ 219,458 $ 212,704 $ 274,446 $ 257,293 $ 240,976 $ 213,651 $ 287,147
Ratio of earnings to fixed charges 135.61 x 149.93 x 158.76 x 393.14 x 137.47 x 112.15 x 46.79 x
Ratio of earnings to fixed charges and preferred share
income allocations 4.74 x 5.05 x 5.41 x 5.04 x 4.76 x 4.90 x 3.29 x

RULE 13A – 14(a) CERTIFICATION
Exhibit 31.1
I, Ronald L. Havner, Jr., certify that:
1. I have reviewed this Quarterly Report on Form 10-Q of Public Storage;
2. Based on my knowledge, this report does not contain any untrue statement of a material fact or omit to state a material fact necessary to make the statements made, in light of the circumstances under which such statements were made, not misleading with respect to the period covered by this report;
3. Based on my knowledge, the financial statements, and other financial information included in this report, fairly present in all material respects the financial condition, results of operations and cash flows of the registrant as of, and for, the periods presented in this report;
4. The registrant's other certifying officers and I are responsible for establishing and maintaining disclosure controls and procedures (as defined in Exchange Act Rules 13a-15(e) and 15d-15(e)) and internal control over financial reporting (as defined in Exchange Act Rules 13a-15(f) and 15d-15(f)) for the registrant and have:
a) designed such disclosure controls and procedures, or caused such disclosure controls and procedures to be designed under our supervision, to ensure that material information relating to the registrant, including its consolidated subsidiaries, is made known to us by others within those entities, particularly during the period in which this report is being prepared;
b) designed such internal control over financial reporting, or caused such internal control over financial reporting to be designed under our supervision, to provide reasonable assurance regarding the reliability of financial reporting and the preparation of financial statements for external purposes in accordance with generally accepted accounting principles;
c) evaluated the effectiveness of the registrant's disclosure controls and procedures and presented in this report our conclusions about the effectiveness of the disclosure controls and procedures, as of the end of the period covered by this report based on such evaluation; and
d) disclosed in this report any change in the registrant’s internal control over financial reporting that occurred during the registrant’s most recent fiscal quarter (the registrant’s fourth fiscal quarter in the case of an annual report) that has materially affected, or is reasonably likely to materially affect, the registrant’s internal control over financial reporting; and
5. The registrant's other certifying officers and I have disclosed, based on our most recent evaluation of internal control over financial reporting, to the registrant's auditors and the audit committee of the registrant's board of directors (or persons performing the equivalent functions):
a) all significant deficiencies and material weaknesses in the design or operation of internal control over financial reporting which are reasonably likely to adversely affect the registrant's ability to record, process, summarize and report financial information; and
b) any fraud, whether or not material, that involves management or other employees who have a significant role in the registrant's internal control over financial reporting.
/s/ Ronald L. Havner, Jr. Name: Ronald L. Havner, Jr. Title: Chairman and Chief Executive Officer Date: October 31, 2017

RULE 13A – 14(a) CERTIFICATION
Exhibit 31.2
I, John Reyes, certify that:
1. I have reviewed this Quarterly Report on Form 10-Q of Public Storage;
2. Based on my knowledge, this report does not contain any untrue statement of a material fact or omit to state a material fact necessary to make the statements made, in light of the circumstances under which such statements were made, not misleading with respect to the period covered by this report;
3. Based on my knowledge, the financial statements, and other financial information included in this report, fairly present in all material respects the financial condition, results of operations and cash flows of the registrant as of, and for, the periods presented in this report;
4. The registrant's other certifying officers and I are responsible for establishing and maintaining disclosure controls and procedures (as defined in Exchange Act Rules 13a-15(e) and 15d-15(e)) and internal control over financial reporting (as defined in Exchange Act Rules 13a-15(f) and 15d-15(f)) for the registrant and have:
a) designed such disclosure controls and procedures, or caused such disclosure controls and procedures to be designed under our supervision, to ensure that material information relating to the registrant, including its consolidated subsidiaries, is made known to us by others within those entities, particularly during the period in which this report is being prepared;
b) designed such internal control over financial reporting, or caused such internal control over financial reporting to be designed under our supervision, to provide reasonable assurance regarding the reliability of financial reporting and the preparation of financial statements for external purposes in accordance with generally accepted accounting principles;
c) evaluated the effectiveness of the registrant's disclosure controls and procedures and presented in this report our conclusions about the effectiveness of the disclosure controls and procedures, as of the end of the period covered by this report based on such evaluation; and
d) disclosed in this report any change in the registrant’s internal control over financial reporting that occurred during the registrant’s most recent fiscal quarter (the registrant’s fourth fiscal quarter in the case of an annual report) that has materially affected, or is reasonably likely to materially affect, the registrant’s internal control over financial reporting; and
5. The registrant's other certifying officers and I have disclosed, based on our most recent evaluation of internal control over financial reporting, to the registrant's auditors and the audit committee of the registrant's board of directors (or persons performing the equivalent functions):
a) all significant deficiencies and material weaknesses in the design or operation of internal control over financial reporting which are reasonably likely to adversely affect the registrant's ability to record, process, summarize and report financial information; and
b) any fraud, whether or not material, that involves management or other employees who have a significant role in the registrant's internal control over financial reporting.
/s/ John Reyes Name: John Reyes Title: Chief Financial Officer Date: October 31, 2017
SECTION 1350 CERTIFICATION
Exhibit 32
In connection with the Quarterly Report on Form 10-Q of Public Storage (the “Company”) for the quarter ended September 30, 2017, as filed with the Securities and Exchange Commission (the “SEC”) on the date hereof (the “Report”), Ronald L. Havner, Jr., as Chairman and Chief Executive Officer of the Company and John Reyes, as Chief Financial Officer of the Company, each hereby certifies, pursuant to 18 U.S.C. §1350, as adopted pursuant to §906 of the Sarbanes-Oxley Act of 2002 (“Sarbanes-Oxley”), that:
(1) The Report fully complies with the requirements of Section 13(a) of the Securities Exchange Act of 1934, as amended (the “Exchange Act”); and
(2) The information contained in the Report fairly presents, in all material respects, the financial condition and results of operations of the Company.
/s/ Ronald L. Havner, Jr. Name: Ronald L. Havner, Jr. Title: Chairman and Chief Executive Officer Date: October 31, 2017
/s/ John Reyes Name: John Reyes Title: Chief Financial Officer Date: October 31, 2017
This certification accompanies the Report pursuant to §906 of Sarbanes-Oxley and shall not, except to the extent required by Sarbanes-Oxley, be deemed filed by the Company for purposes of §18 of the Exchange Act.
A signed original of this written statement required by §906 of Sarbanes-Oxley has been provided to the Company, and will be retained and furnished to the SEC or its staff upon request.