united states securities and exchange commission f...
TRANSCRIPT
UNITED STATES SECURITIES AND EXCHANGE COMMISSION
WASHINGTON, D.C. 20549
F ORM 10-K
FOR THE FISCAL YEAR ENDED DECEMBER 31, 2011 OR
FOR THE TRANSITION PERIOD FROM TO COMMISSION FILE NUMBER 1-134
CURTISS-WRIGHT CORPORATION (Exact name of Registrant as specified in its charter)
(973) 541-3700 Registrant’s telephone number, including area code:
Securities registered pursuant to Section 12(b) of the Act:
Securities registered pursuant to Section 12(g) of the Act: None
Indicate by check mark if the registrant is a well-known seasoned issuer, as defined in Rule 405 of the Securities Act. Yes S No £
Indicate by check mark if the registrant is not required to file reports pursuant to Section 13 or Section 15(d) of the Act. Yes £ No S
Indicate by check mark whether the Registrant (1) has filed all reports required to be filed by Section 13 or 15(d) of the Securities Exchange Act of 1934 during the preceding 12 months (or for such shorter period that the registrant was required to file such reports), and (2) has been subject to such filing requirements for the past 90 days. Yes S No £
Indicate by check mark whether the Registrant has submitted electronically and posted on its corporate Web site, if any, every Interactive Data File required to be submitted and posted pursuant to Rule 405 of Regulation S-T (§232.405 of this chapter) during the preceding 12 months (or for such shorter period that the registrant was required to submit and post such files). Yes S
S ANNUAL REPORT PURSUANT TO SECTION 13 OR 15(d) OF THE
SECURITIES EXCHANGE ACT OF 1934
£ TRANSITION REPORT PURSUANT TO SECTION 13 OR 15(d) OF THE
SECURITIES EXCHANGE ACT OF 1934
Delaware
(State or other jurisdiction of incorporation or organization)
13-0612970 (I.R.S. Employer Identification No.)
10 Waterview Blvd. Parsippany, NJ (Address of principal executive offices)
07054 (Zip Code)
Title of each class
Name of Each Exchange on Which Registered
Common stock, par value $1 per share New York Stock Exchange

No £
Indicate by check mark if disclosure of delinquent filers pursuant to Item 405 of Regulation S-K (§229.405 of this chapter) is not contained herein, and will not be contained, to the best of registrant’s knowledge, in definitive proxy or information statements incorporated by reference in Part III of this Form 10-K or any amendment to this Form 10-K. £
Indicate by check mark whether the registrant is a large accelerated filer, an accelerated filer, a non-accelerated filer, or a smaller reporting company. See the definitions of “large accelerated filer,” “accelerated filer” and “smaller reporting company” in Rule 12b-2 of the Exchange Act.
Indicate by check mark whether the registrant is a shell company (as defined in Rule 12b-2 of the Exchange Act). £ Yes S No
The aggregate market value of the voting and non-voting Common stock held by non-affiliates of the Registrant as of June 30, 2011 was approximately $1.5 billion.
The number of shares outstanding of the Registrant’s Common stock as of January 31, 2012:
Documents Incorporated by Reference
Portions of the Proxy Statement of the Registrant with respect to the 2012 Annual Meeting of Stockholders to be held on May 4, 2012 are incorporated by reference into Part III of this Form 10-K.
Large accelerated filer S Accelerated filer £ Non-accelerated filer £ Smaller reporting company £
(Do not check if a smaller reporting company)
Class
Number of shares
Common stock, par value $1 per share 46,689,759

INDEX TO FORM 10-K
PART I Item 1. Business 3 Item 1A. Risk Factors 18 Item 1B. Unresolved Staff Comments 27 Item 2. Properties 28 Item 3. Legal Proceedings 28 Item 4. Mine and Safety Disclosures 28
PART II Item 5. Market for the Registrant’s Common Equity and Related Stockholder Matters and Issuer Purchases of
Equity Securities
29 Item 6. Selected Financial Data 30 Item 7. Management’s Discussion and Analysis of Financial Condition and Results of Operations 31 Item 7A. Quantitative and Qualitative Disclosures About Market Risk 52 Item 8. Financial Statements and Supplementary Data 53 Item 9. Changes in and Disagreements with Accountants on Accounting and Financial Disclosure 104 Item 9A. Controls and Procedures 104 Item 9B. Other Information 104
PART III Item 10. Directors, Executive Officers and Corporate Governance 105 Item 11. Executive Compensation 105 Item 12. Security Ownership of Certain Beneficial Owners and Management and Related Stockholder Matters 105 Item 13. Certain Relationships and Related Transactions, and Director Independence 105 Item 14. Principal Accounting Fees and Services 105
PART IV Item 15. Exhibits, Financial Statement Schedules 105
Schedule II–Valuation and Qualifying Accounts 110
Signatures 111
PART I
Forward-Looking Statements
Except for historical information, this Annual Report on Form 10-K may be deemed to contain “forward-looking statements” within the meaning of the Private Litigation Reform Act of 1995. Examples of forward-looking statements include, but are not limited to: (a) projections of or statements regarding return on investment, future earnings, interest income, sales, volume, other income, earnings or loss per share, growth prospects, capital structure, and other financial terms, (b) statements of plans and objectives of management, (c) statements of future economic performance, and (d) statements of assumptions, such as economic conditions underlying other statements. Such forward-looking statements can be identified by the use of forward-looking terminology such as “anticipates,” “believes,” “continue,” “could,” “estimate,” “expects,” “intend,” “may,” “might,” “outlook,” “potential,” “predict,” “should, ” “will,” as well as the negative of any of the foregoing or variations of such terms or comparable terminology, or by discussion of strategy. No assurance may be given that the future results described by the forward-looking statements will be achieved. While we believe these forward-looking statements are reasonable, they are only predictions and are subject to known and unknown risks, uncertainties, and other factors, many of which are beyond our control, which could cause actual results, performance or achievement to differ materially from anticipated future results, performance or achievement expressed or implied by such forward-looking statements. In addition, other risks, uncertainties, assumptions, and factors that could affect the Company’s results and prospects are described in this report, including under the heading “Item 1A. Risk Factors” and elsewhere, and may further be described in the Company’s prior and future filings with the Securities and Exchange Commission and other written and oral statements made or released by the Company. Such forward-looking statements in this Annual Report on Form 10-K include, without limitation, those contained in Item 1. Business, Item 7. Management’s Discussion and Analysis of Financial Condition and Results of Operations, Item 8. Financial Statements and Supplementary Data including, without limitation, the Notes to Consolidated Financial Statements, and Item 11. Executive Compensation.
Given these risks and uncertainties, you are cautioned not to place undue reliance on such forward-looking statements. These forward-looking statements speak only as of the date they were made, and we assume no obligation to update forward-looking statements to reflect actual results or changes in or additions to the factors affecting such forward-looking statements.
Item 1. Business.
Business Description
Curtiss-Wright Corporation is a diversified, multinational provider of highly engineered, technologically advanced products and services. We are the corporate descendants of the Wright brothers, the fathers of flight, and Mr. Glenn Curtiss, the father of naval aviation. In 1929, the companies founded by these three great aviation pioneers merged to form the largest aircraft company at the time, Curtiss-Wright Corporation. Today, we design and manufacture highly engineered, advanced technologies that perform critical functions in demanding conditions in the defense, power generation, oil and gas, commercial aerospace, and general industrial markets, where safety, performance, and reliability are essential. The Company is incorporated under the laws of the State of Delaware.
Our strategy is to maintain a balanced portfolio to grow sales and profitability consistently through organic growth supplemented by acquisitions. We intend to accomplish this by utilizing our technical capabilities to maintain and expand our leading niche market positions with highly engineered products and services. Through our strategy, we have achieved this balance with revenues generated across our defense, energy, and commercial/industrial markets. In addition to maintaining a diversified business portfolio, we also continue to develop new core competencies, such as electronic and sensor technologies. We believe our ability to design and develop future generations of advanced electronics systems is a strategic growth area for the high performance platforms in our served markets, particularly in embedded computing and electronic systems. We intend to continue to execute our growth strategy that focuses on diversification in complementary markets that demand high performance and highly engineered products and services.
Our core competence is providing advanced technologies for customers operating in harsh environments. In addition to meeting demanding performance requirements, our technologies are intended to improve worker
3

safety, minimize impact on the environment, and improve operating efficiency. We compete globally based on technology and pricing; however, significant engineering expertise is a limiting factor to competition, particularly in the U.S. Government market. Our business challenges include price pressure, environmental impact, and geopolitical events, such as the global war on terrorism and diplomatic accords. Our ability to provide high-performance, advanced technologies on a cost-effective basis is fundamental to our strategy for meeting customer demand.
Business Segments
We manage and evaluate our operations based on the products we offer and the different markets we serve. Based on this approach, we operate through three segments: Flow Control, Motion Control, and Metal Treatment. Our principal manufacturing facilities are located in the United States in California, New York, North Carolina, Pennsylvania, and Texas, and internationally in Canada and the United Kingdom.
Flow Control
Our Flow Control segment primarily designs, manufactures, and distributes highly engineered, critical-function products including valves, pumps, motors, generators, instrumentation, shipboard systems, super vessels, and control electronics. These products manage the flow of liquids and gases, generate power, provide electronic operating systems, and monitor or provide critical functions. In 2011, net sales in our Flow Control segment of $1,061 million represented 52% of our total net sales.
This segment’s primary markets are power generation, naval defense, oil and gas, and general industrial.
In the naval defense market, we are a supplier to the U.S. Navy for a wide array of ship building programs including the nuclear aircraft carrier and submarine programs, offering power and propulsion technologies, instrumentation and control systems, auxiliary systems, and shipborne aircraft and helicopter landing systems. Government sales, primarily to the U.S. Navy as a subcontractor, comprised 31%, 34%, and 30% of segment sales in 2011, 2010, and 2009, respectively.
The Flow Control segment operates through four operating divisions: Electro-Mechanical Systems, Nuclear Group, Oil and Gas Systems, and Marine and Power Products. The segment has a global customer base with principal manufacturing operations in the United States, Canada, and the United Kingdom.
Electro-Mechanical Systems
Our Electro-Mechanical Systems division produces advanced electro-mechanical and pumping solutions for the naval defense, power generation, oil and gas, and other general industrial markets. The division designs and manufactures advanced critical function pumps, motors, generators, ship propulsors, mechanical seals, control rod drive mechanisms, power conditioning electronics, pulse power supplies, integrated motor controls, composite materials applications, and protection technologies solutions.
This division develops, designs, manufactures, and performs qualification testing of critical-function, electro-mechanical solutions for its primary customer, the U.S. Navy, including main coolant pumps, various other critical-function pumps, power-dense compact motors, main and ship service generators, secondary propulsion systems, and design engineering and testing services. The division has served the U.S. Navy for over 60 years and is a supplier or sole source provider of pumps that are used in the nuclear propulsion system. The division also overhauls and provides critical spares for units serving the fleet on operational platforms. Current platforms include the Nimitz and Ford class aircraft carriers and the Virginia, Los Angeles, Seawolf, and Ohio Class submarines. We have also received funding for engineering and component development on the next generation Ohio Class Replacement submarine program.
We expect to strengthen our relationship with the U.S. Navy by participating in the design and development of major subsystems for the U.S. Navy’s Advanced Arresting Gear aircraft retrieval system for installation on its future aircraft carrier fleet and the advanced propulsion, pump, and motor designs for the next generation submarine fleet. In addition, the division provides propulsion motors and main generators to the non-nuclear U.S. Navy, including the DDG 1000 destroyer program.
Electro-Mechanical Systems’ products are also sold to complementary commercial markets, primarily nuclear power generation and oil and gas. We have been a supplier to the nuclear power market since its
4

inception more than 50 years ago, including significant content on the first nuclear reactor at Shippingport, PA. We provide Reactor Coolant Pumps (RCPs), pump seals, and control rod drive mechanisms for commercial nuclear power plants. In 2008, we announced our first award for reactor coolant pumps for two new Westinghouse AP1000 nuclear power plants to be built in China and anticipate shipping the first four pumps in the second quarter of 2012. In 2009, we announced our first domestic new construction contract for three AP1000 power plants to be built in the United States. Each AP1000 reactor will hold four RCPs and each plant will have two reactors. The AP1000 reactor is the only Generation III+ reactor to receive Design Certification from the Nuclear Regulatory Commission (“NRC”).
Elsewhere, in the oil and gas market, we are utilizing our canned motor and pumping system expertise to partner with industry leaders to develop advanced systems for offshore recovery, production, and transmission. Current programs encompass sub-sea pumping and power-dense motors for compact, integrated compressor systems. This division also offers hazardous waste pumps for the U.S. Department of Energy (“DoE”) and in-line pumps for the hydrocarbon processing industry.
In the general industrial market, we design, develop, and manufacture integrated motor-controls and protection technology solutions for original equipment manufacturers (“OEMs”) and industrial customers. We engineer and manufacture a full range of rugged, reliable, and internationally compliant products that smoothly control the amount of electrical current provided to motors. Custom panel solutions include a variety of low and medium voltage components, such as starters, drives, contactors, breakers, and other related devices. While this is a highly competitive market, our installed base of over 100,000 control units with hundreds of custom designed systems supports customers in the industrial heating, ventilation, and air conditioning (“HVAC”) market, as well as in the municipal services and energy processing markets, including petrochemicals, power generation, mining, and transportation.
Nuclear Group
The Nuclear Group division designs, manufactures, distributes, and qualifies flow control products for nuclear power plants, nuclear equipment manufacturers, hydroelectric energy producers, the DoE, and the U.S. Department of Defense (“DoD”). This division offers a wide range of critical hardware, including pumps, valves, pressure vessels, fastening systems, specialized containment doors, airlock hatches, and electrical units. In addition, we provide a range of critical services including bolting solutions, nuclear storage solutions, spent fuel solutions, and enterprise resource planning. We provide diagnostic equipment, consulting, inspection, and testing services that help support plant-life extensions and power upgrades on all 104 operating reactors in the United States, as well as operating reactors located throughout the world.
We maintain all of the regulatory certifications (known as “N-stamps”) required to provide representations and certification and/or qualify value-added nuclear-grade products both domestically and internationally. N-stamp certification indicates nuclear-grade status as designated by the NRC. We compete in this market through an expanded array of nuclear technology, industry-benchmarked quality assurance programs, strategic alliances, resident expertise, and customer recognition for our long-term service commitment to solving the unique challenges of the nuclear market.
In 2011, the Nuclear Group division acquired the assets of Anatec International, Inc. and Lambert, MacGill, Thomas, Inc. (“Anatec and LMT”), both of which perform testing and inspection services for commercial nuclear power plants to ensure safety, operational soundness, and compliance with regulatory codes. Anatec and LMT provide technologies and techniques for non-destructive examination (“NDE”) and testing of systems and components in nuclear power plants. NDE services support both in-service inspections to satisfy regulatory requirements and decision-making by nuclear plant operators concerning the ongoing reliability, operability, and safety of nuclear systems and equipment. Anatec and LMT services also include quality control inspections, training and qualification of NDE technicians, and development of programs in support of compliance with the American Society of Mechanical Engineers (“ASME”) code.
Oil and Gas Systems
Our Oil and Gas Systems division designs and manufactures valves and vessel products for the oil and gas refining market. Primary products include coke unheading systems, fluidic catalytic cracking unit (“FCCU”) components, relief valves, pressure protection systems, super vessels, and engineering design tools for the
5

refining, chemical and process industries, and web-enabled control systems for refinery monitoring and process control.
Our coke unheading system, which includes top and bottom unheading valves, isolation valves, cutting tools, and valve automation, process control, and protection systems, enables safer coke drum operation during the refining process. Included in this portfolio of products is the coke-drum unheading valve, an advancement in coke- drum unheading technology. Our patented technology is remotely operated, therefore inherently safe, easy to operate, reliable, cost effective, and can be configured for any coke-drum application.
We also offer a delayed coker operations optimization system featuring process control, interlocks, valve control solutions, batch process data acquisition, interactive operator batch sequence procedures, batch scheduler, batch sequence editor, risk management, asset protection, and predictive maintenance capabilities.
Our FCCU product portfolio includes custom-designed valves, engineered pressure vessels, and complementary components that operate in industrial process applications including fluid, residual, and catalytic cracking units as well as power generation, steel manufacture, and ore reduction. We manufacture, repair, and modify orifice chambers, hydrotreaters, and ASME code pressure vessels. In addition, we provide a wide array of field services, including equipment repair, modification, or replacement; inspection of valves, controls, pipes, and refractory linings; maintenance planning and scheduling for valves or control systems; diagnostic assistance with troubleshooting problems in critical components; and on-site system training. In 2011, we opened a new state-of-the-art manufacturing facility to build large thick-walled vessels (called “super vessels” which include coke drums, fractionators, reactors, regenerators, hydrotreaters, and fluid catalytic cracking units) for the refining, petrochemical, and nuclear power industries. Due to the critical and severe service applications requiring highly engineered solutions, competition in the FCCU market is limited to a few major competitors.
Our safety relief valve and pressure protection system portfolio incorporates a broad range of valve sizes and ratings used in a wide range of chemical and process industry applications. The valves are marketed as individual components or at the subsystem/system level, with a global service and support network of Farris Authorized Service Team centers. The proprietary iPRSM provides a broad set of design and monitoring tools for process operators, incorporating the latest industry and regulatory standards.
In addition, we provide inspection, installation, repair and maintenance, and other field services for harsh environment flow control systems. Competition is mitigated by our technical expertise, proven technology, and extraordinary service.
Marine and Power Products
Our Marine and Power Products division produces high-performance, specialized valve solutions, designs and manufactures electro-mechanical systems, and develops, manufactures, and services specialized electronic instrumentation and control equipment.
Our valve solutions control the flow of liquids and gases for vessels, and equipment for the defense, power generation, and general industrial markets. We design, engineer, and manufacture spring-loaded, pilot-operated pressure relief valves and solenoid operated valves, as well as ball valves used in standard and advanced applications, including high-cycle, high-pressure, extreme temperature, and corrosive plant environments. Our products are highly engineered to meet stringent performance and reliability requirements. We provide engineering support, testing, repair, and consulting services globally.
Our valves are utilized in the nuclear propulsion system of virtually every nuclear submarine and aircraft carrier commissioned by the U.S. Navy. Current programs include the Virginia class submarine and Ford class aircraft carriers. In addition, we provide spares and repair work for various submarine classes, such as Los Angeles and Ohio, as well as the Nimitz class aircraft carriers.
The division also designs and manufactures electro-mechanical systems for securing and traversing military aircraft and helicopters aboard naval vessels. These shipboard aircraft and helicopter handling systems are used by the U.S. Navy, U.S. Coast Guard, and more than ten other navies around the world. In support of embarking helicopters onboard naval ships, we also produce aviation lighting and guidance systems and in-deck tie-downs and tracks. We also design and build shipboard specialized structures, including telescopic hangars and doors. Specialized cable handling systems are designed and manufactured for towing active and passive sonar systems for both submarines and surface ships.
6
For commercial markets, we provide specialized valves to commercial nuclear power plants, oil and gas refineries, production platforms and pipelines, and general processing industries worldwide. We also provide towbarless and conventional aircraft handling systems to the commercial aerospace industry. General industrial products include hydraulic power units and components primarily for the automotive and the entertainment industries and specialty hydraulic valves, air-driven pumps, gas boosters, and directional control valves used in industrial applications such as car transport carriers. Competition is based upon quality of technology, price, installed base, and delivery times.
The Marine and Power Products division also develops, manufactures, tests, and services specialized electronic instrumentation and control equipment, including instrumentation for primary and secondary controls, steam generator control equipment, valve actuators, and valve and heater controls. This division provides custom designed and commercial-off-the-shelf (“COTS”) electronic circuit boards and systems to the U.S. Navy. It also provides advanced valve controllers and predictive maintenance systems for the oil and gas and general industrial market. There is strong competition in the COTS market, but competition is limited by significant qualification and performance requirements. The division also provides engineering and support services.
In 2011, the Marine and Power Products division acquired the assets of Douglas Equipment Ltd., a supplier of commercial aviation ground support vehicles, including a range of towbarless and conventional aircraft tractors and runway friction measuring devices. The business sells its products to many of the world’s leading airlines, ground handling companies, the U.S. Navy, and foreign navies.
The following list defines our principal products and the markets served by the Flow Control segment.
Naval Defense
Valves (globe, gate, control, safety, relief, solenoid, hydraulic operated gate) Pumps Motors and generators Instrumentation and controls
Advanced electromagnetic systems Flight critical components (aircraft shuttle components, holdback bars, capacity selector valves)
Cable handling systems for towed arrays Sub-safe ball valves
Helicopter and military aircraft handling and traverse systems Tie-down components Valve actuation and control systems
Smart leakless valves Sub-safe ball valves Jet-fuel pumping valves Steam generator control equipment Air driven fluid pumps Engineering, inspection, and testing services
7
•
Nuclear propulsion system components
•
Instrumentation and control systems
•
Aircraft launch and retrieval equipment onboard carrier decks
•
Equipment for Submarines
•
Equipment for Surface ships
•
Non-nuclear products
Oil & Gas Processing
Coker unheading valves Boltless catalyst control slide valves Butterfly and triple offset butterfly valves Pilot-operated relief valves Pressure relief valves Safety valves Solenoid, gate, and globe valves Steam valves
Air grids and cyclones Risers, headers, and wye sections
Cat cracking reactors and regenerator heads Hydrotreators
Digital valve controller with redundant technology Signature recognition for fault and leak detection Integrated valve, automation, safety, and control systems
Power Generation
Reactor coolant pumps for Westinghouse AP1000 reactor
Solenoid, ball, butterfly, check, pressure relief, safety, and pilot-operated relief valves, and gate and globe (motor operated, air operated, pneumatically operated)
Pneumatic and hydraulic
8
•
Critical process valves
•
Fluidic catalytic cracking equipment
•
Engineered process vessels
•
Advanced valve controls and prognostics technology
•
Advanced motors, generators, and pumps
•
Valves
•
Control rod drive mechanisms
•
Design and fabrication of nuclear facility airlocks, doors, hatches
•
Instrumentation
•
Diagnostic and test equipment
•
Fluid sealing technologies
•
Actuators
•
Plate heat exchangers
•
Separation technologies
•
Fasteners
•
Advanced bolting technologies
•
Spent fuel management technologies
•
Equipment reliability services and software
•
Engineering services
•
Equipment qualification, commercial grade dedication
•
Inventory management systems

General Industrial
Directional control and pneumatic
Integrated motor-control systems Variable frequency drives Pump control panels Low voltage solid state starters Medium voltage controls Protective technology solutions
Commercial Aerospace
Customer Concentration and Backlog
Total backlog includes both funded (unfilled orders for which funding is authorized, appropriated, and contractually obligated by the customer) and unfunded backlog (firm orders for which funding has not been appropriated and/or contractually obligated by the customer). The corporation is a subcontractor to prime contractors for the vast majority of our government business; as such substantially all amounts in backlog are funded. Backlog excludes unexercised contract options and potential orders under ordering type contracts (e.g. Indefinite Delivery / Indefinite Quantity). Backlog is adjusted for changes in foreign exchange rates and is reduced for contract cancellations and terminations in the period in which they occur. There were no significant contract cancellations which affected backlog in 2011.
Backlog for this segment at December 31, 2011, was $1,151 million, of which 56% ($647 million) is expected to be shipped after one year, compared with backlog of $1,149 million at December 31, 2010. Sales to this segment’s largest commercial customer represented approximately 8%, 10%, and 13% of this segment’s sales in 2011, 2010, and 2009, respectively. Additionally, sales to our largest naval defense customer accounted for 10%, 10%, and 11% of this segment’s net sales in 2011, 2010, and 2009. The loss of either of these customers would have a material adverse effect on the business of this segment.
Motion Control
Our Motion Control segment designs, develops, manufactures, and maintains sophisticated, high-performance mechanical actuation and drive systems, specialized sensors, motors, and electronic controller units, and mission-critical embedded computing components and control systems. In 2011, net sales in our Motion Control segment of $710 million represented 34% of our total net sales.
This segment’s primary markets are commercial aerospace, aerospace defense, ground defense, and general industrial.
Our Motion Control segment is managed through three operating divisions: Embedded Computing, Flight Systems, and Integrated Sensing. The segment has a global customer base with principal manufacturing operations throughout the United States, Canada, and Europe.
Embedded Computing
Our Embedded Computing division designs, develops, and manufactures rugged embedded computing board-level modules and integrated subsystems, primarily for the aerospace and ground defense markets, and supports the U.S. Government’s Command, Control, Communications, Computers, Intelligence, Surveillance, and Reconnaissance (“C4ISR”) applications. Using standard, commercially available electronics technologies, coupled with application-domain specific knowledge, we offer COTS hardware and software modules based on open industry standards. We also offer high performance electronic packaging and thermal management systems using custom and standards-based enclosures.
9
•
Valves
•
Power Control Systems
•
Critical machinery fault detection and prognostics systems
•
Towbarless and conventional aircraft handling systems

Our advanced subsystems are integrated using standard modules and custom modules based on in-house intellectual property content as well as third-party technology. We also offer a broad array of support services that include life-cycle management, technical support, training, and custom engineering of modules and fully integrated subsystems. We are a single source supplier for high-density radar processing, data communications, digital signal processing, video and graphics, recording and network storage, analog acquisition and reconstruction, radar, and integrated subsystems. Our COTS modules and integrated subsystems are designed to perform in harsh conditions where space, weight, and power constraints are critical. Our rugged products are designed to perform in extreme temperatures and environments, enduring high shock and vibration, as well as in commercial environments for use in laboratory and benign environment applications.
Embedded Computing’s subsystem products are used in a wide variety of mission-critical applications for military ground vehicles, including fire control, aiming, and stabilization, munitions loading, and environmental processors. These products are used on combat platforms such as the Bradley Fighting Vehicle, the Abrams Tank, and the Stryker family of vehicles. Our modules, featuring commercial processors on open standard board architectures, are used in numerous active programs, including the Improved Bradley Acquisition System and the Improved Tow Acquisition System.
The division drafts and defines embedded standards, which address the more demanding performance and data bandwidth requirements of emerging applications. Embedded Computing supports technologically advanced military platforms including the F-35 JSF, P-8 Poseidon, and U.S. Marine Corps’ Ground/Air Task Orientation Radar program.
Embedded Computing also provides the advanced mission management system, flight control computers, and the sensor management units for advanced aerospace platforms including the Global Hawk, the U.S. Air Force’s high-altitude and high-endurance unmanned aerial vehicle, as well as the U.S. Navy’s Broad Area Maritime Surveillance (“BAMS”) variant of the Global Hawk platform.
This division’s products are manufactured at its operations located in North America and Europe. Our products are sold primarily to prime contractors and subsystem suppliers located principally in the United States, United Kingdom, and Canada, both directly and through a network of independent sales representatives. In recent years, competition in the embedded electronic systems market has migrated away from traditional board competitors toward fully integrated subsystem and system providers, selling to prime and second-tier defense and aerospace companies. Competition in this market is based on quality of technology, price, and delivery time to market.
Flight Systems
Our Flight Systems division’s product offerings to the commercial OEM and aerospace defense markets consist of electro-mechanical and hydro-mechanical actuation control components and systems that are designed to position aircraft control surfaces or operate flaps, slats, and utility systems such as canopies, cargo doors, weapons bay doors, or other moving devices used on aircraft. Aircraft applications include actuators and electro-mechanical control systems for the Boeing 737, 747, 747-8, 757, 767, 777, and 787 civil air transports, the Lockheed Martin F-16 Falcon fighter jet, the Boeing F/A-18 Hornet fighter jet, the P-8 Poseidon, the Bell Boeing V-22 Osprey, and the Sikorsky Black Hawk and Seahawk helicopters. The Flight Systems division is also developing flight control actuators and weapons handling systems for Lockheed Martin’s F-35 Lightning II Joint Strike Fighter (“F-35 JSF”) program. The F-35 JSF is the next-generation fighter aircraft being designed for use by all three branches of the U.S. military as well as by several foreign governments. This division also provides commercial airlines, the military and general aviation customers with component overhaul and repair of hydraulic, mechanical, and electro-mechanical components and component exchange services for a wide array of aircraft.
Flight Systems also designs, manufactures, and distributes electro-mechanical and electro-hydraulic actuation components and systems and electronic controls for military tracked and wheeled vehicles within the ground defense and commercial markets. These products include turret aiming and stabilization and weapons handling systems for armored military vehicles. In addition, we provide a range of general industrial products, such as fuel control valves for large commercial transport ships, stabilization systems, and a variety of commercial servo valves.
10

Flight Systems products are sold primarily through a direct domestic sales force and international network of independent sales representatives. Sales are made directly to OEMs, airlines, and government agencies.
Our Flight Systems products are sold in competition with a number of other suppliers, some of whom have broader product lines and greater financial, technical, and human resources. The competitive environment for these products is focused on a short list of companies, with recent strategic trends at the prime contractor level resulting in a smaller market of vertically integrated suppliers, while prime contractors specialize in integration and final assembly. Price, technical capability, performance, service, and investment are the primary forces of competition, together with an ability to offer solutions to perform control and actuation functions on new production programs.
In 2011, the Flight Systems division acquired all of the outstanding capital stock of Predator Systems Inc (“PSI”), which designs and manufactures motion control components and subsystems for ground defense, ordnance guidance, and aerospace applications through its proprietary electro-hydraulic technologies.
Integrated Sensing
Our Integrated Sensing division develops and manufactures a range of sensors, controllers, and electronic control units for commercial, aerospace defense, and general industrial markets. These products include position and smoke detection sensors, solenoids and solenoid valves, cooling fans and motors, torque sensing, ice detection and protection equipment, air data computers, flight data recorders, joysticks, and electronic signal conditioning and control equipment. The division also provides electric motors with controllers, rotary sensors, controllers, and smaller electro-mechanical actuation subsystems for flight, engine, and environmental control for aircraft and space applications. This division’s products are sold primarily to prime contractors and system integrators (both directly and through a network of independent sales representatives) on a worldwide basis. Position sensors are used on primary flight control systems and engine controls on Airbus and Boeing aircraft, most notably for the Airbus A320 single-aisle aircraft, as well as regional and business aircraft, and on many U.S. and European military aircraft. Air data, flight recorder, and ice detection and protection equipment are supplied to many helicopter applications, including the Apache, Blackhawk, Stallion, and Chinook platforms. We also sell our products for use in a wide range of industrial applications such as off-highway vehicles, powered mobility vehicles, process controls, and motorsports.
In 2011, the Integrated Sensing division acquired all the outstanding capital stock of ACRA Control, Ltd. (“ACRA”), a supplier of data acquisition systems and networks, data recorders, and telemetry ground stations for both defense and commercial aerospace markets. The combination of ACRA’s customizable modular products, engineering expertise, and advanced technologies along with our existing current data recording and avionics solutions are expected to enable us to provide aerospace and defense customers with a fully integrated system featuring enhanced data acquisition capabilities, airborne ethernet data transmission and synchronization and wireless download of data to ground stations.
In 2011, the Integrated Sensing division acquired the assets of South Bend Controls, a designer and manufacturer of highly engineered, solenoid-based components used in critical applications across multiple markets. The company’s expertise, experience, and long-standing customer relationships are expected to provide us with a competitive position in the aerospace and defense markets, along with further penetration into the industrial and medical markets.
Competitive differentiators for Integrating Sensing include technical leadership and support, product price, and customer service. Integrated Sensing products are marketed through facilities in the United Kingdom, Germany, and the United States. Manufacturing facilities have been established in Mexico and China.
The following list defines our principal products and the markets served by the Motion Control segment.
Commercial Aerospace
Secondary flight control actuation systems and electromechanical trim actuators Aircraft cargo door and utility actuation systems Fire detection and suppression control systems Data acquisition systems
11
•
Commercial Jet Transports, Business and Regional Jets

Flight data recorders Position sensors Pressure sensors Solenoids and solenoid valves Throttle quadrants Fans and motors
Rotor ice protection systems Flight data recorders Air data computers Logic control modules and utility control electronics Mission video displays, distribution systems, recorders and associated products
Component overhaul and logistics support services
Aerospace Defense
Weapons bay door actuation systems Weapons handling systems Secondary flight control actuation Rotary actuation for environmental control systems Video displays, recorders, and radar converters Position sensors Solenoids and solenoid valves Throttle quadrants Fans and motors Data acquisition systems Flight data recorders
Radar warning systems Acoustic processing systems Flight data recorders Air data computers Position sensors Logic control modules and utility control electronics Mission video displays, distribution systems, recorders, and associated products
Integrated mission management and flight control computers Sensor management systems Weapons handling systems Position sensors
Ground Defense
Digital electromechanical aiming and stabilization systems Fire control, sight head, and environmental control processors Single Board Computers for target acquisition systems Ammunition handling systems Mission computing systems
12
•
Helicopters
•
Repair and Overhaul Services
•
Transport and fighter aircraft
•
Helicopters
•
Unmanned aerial vehicles
•
Tanks and light armored vehicles

Power management systems Position sensors
Other Military & Government
Power conversion products
Control electronics and sensors
Perimeter intrusion detection equipment
Airport surface detection equipment radar video processing
General Industrial Markets
Air, sea, and ground simulation Fractional horse power specialty motors Force transducers Joysticks Sensors
Customer Concentration and Backlog
Sales by this segment to its largest commercial customer accounted for 10% of its net sales in 2011 and 2010, and 11% in 2009. The loss of this customer would have a material adverse effect on the Motion Control segment. Direct and end-use sales of this segment to government agencies, primarily the U.S. Government, in 2011, 2010, and 2009, accounted for 63%, 64%, and 70%, respectively, of total Motion Control net sales. Although the loss of this business would have a material adverse effect on the Motion Control segment, no single prime contractor to the U.S. Government to which we are a subcontractor provided greater than 10% of Motion Control revenue during any of the last three years.
Backlog for this segment at December 31, 2011, was $540 million, of which 73% ($397 million) is expected to be shipped after one year, compared with a backlog of $519 million at December 31, 2010. Substantially all amounts in backlog are funded and there were no significant contract cancellations which effected backlog in 2011. Raw materials are generally available in adequate quantities from a number of suppliers; however, we utilize sole-source suppliers in this segment. Thus, the failure and/or inability of a sole-source supplier to provide product to Motion Control could have an adverse impact on our financial performance. While alternatives could be identified to replace a sole source supplier, a transition could result in increased costs and manufacturing delays.
Metal Treatment
Our Metal Treatment segment provides unique and precise metallurgical processing services to enhance the performance and durability, extend the life, and prevent premature fatigue and failure on customer-supplied metal components. In 2011, net sales of our Metal Treatment segment of $283 million contributed 14% to our total net sales.
This segment’s primary markets are commercial and defense aerospace, oil and gas, power generation, and general industrial markets, including automotive, transportation, construction equipment, and miscellaneous metal working industries.
This segment provides five primary technical services on highly stressed, critical function metal parts: shot peening, specialty coatings, heat treating, laser peening, and analytical services.
13
•
High performance data communication products
•
Space programs
•
Security systems
•
FAA
•
Automated industrial equipment
Shot Peening
Shot peening is a process by which the durability of metal parts is enhanced by bombarding the part’s surface with spherical media, such as steel shot or ceramic or glass beads, to compress the outer layer of the metal. In addition, shot peen forming shapes metal panels with aerodynamic curvatures, which are assembled as wing skins of commercial and military aircraft. Currently, we conduct shot peen forming on wing panels and other components for Airbus, Boeing, and other aerospace OEMs.
Specialty Coatings
Specialty coatings primarily consist of the application of solid film lubricant and corrosion resistant protective coatings to metal components used in critical applications for a broad range of industries. The coatings are applied by either an air spray or a dipping and spinning process for bulk applications.
We recently entered the thermal spray coatings arena, adding a new offering in the area of high technology coatings to Curtiss-Wright’s existing portfolio of niche coating technologies. Thermal spray coatings are synergistic with our current offering of highly engineered surface technologies services. Our offering includes high velocity oxygen fuel, plasma spray, and flame spray coatings.
We also have diversified our capabilities into the growing medical market by the addition of a vapor deposition process to apply parylene coatings to medical devices, including rubber and silicone seals and wire forming mandrels used in the manufacture of catheters. Parylene coatings provide resistance to solvents and moisture and are biocompatible.
Heat Treating
Heat treating is a process of exposing metal parts to precisely controlled temperature cycles to change the mechanical and metallurgical properties of the metal.
Laser Peening
Laser peening is a metal surface treatment process that utilizes a proprietary high energy laser developed by the Lawrence Livermore National Laboratory and adapted for use by Metal Treatment engineers. The laser peening process is being used in production to extend the life of critical industrial and flight turbine engine components. Future applications include high value, extreme service components in aircraft structures, oil and gas, medical implant, and marine applications. We retain the exclusive worldwide rights to the intellectual property necessary for the use of this laser architecture on laser peening of commercial products.
Analytical Services
Analytical Services provides mechanical and metallurgical testing services to materials across a broad range of industries. This recent addition to our portfolio is the cornerstone of a new engineered service business and enables us to enter a highly technical service niche in the manufacturing value chain for components used in premium industrial markets. Material testing is utilized in the on-going quality assurance of raw materials for production manufacturing as well as for the validation of new component designs.
In addition to the aforementioned capabilities, other services that are provided by our Metal Treatment segment include nondestructive inspection, plating, and anodizing. To expand our capabilities in these areas, in 2011 the Metal Treatment segment acquired certain assets of both the BASF Corporation’s Surface Technologies business and IMR Test Labs Inc.
BASF’s Surface Technologies business is a supplier of metallic and ceramic thermal spray coatings which are utilized to protect and enhance a wide variety of critical components used in the aerospace, automotive, power generation, diesel, medical, and general industrial markets. These coatings provide thermal barrier protection, abrasion and erosion resistance, high temperature oxidation/corrosion resistance, and the capability to serve as a replacement of hard chrome plating. This business applies several different types of thermal spray coatings, including high velocity oxygen fuel, plasma spray, and flame spray coatings, which can all be tailored to the specific end use application.
14

The IMR Test Labs business is a provider of mechanical and metallurgical testing services for the aerospace, power generation, and medical markets. IMR’s complete range of testing capabilities includes fatigue testing, metallurgical analysis, chemical analysis, mechanical testing, failure analysis, and training.
Through a combination of acquisitions and new plant openings, we continue to increase Metal Treatment’s network of regional facilities. Metal Treatment operations are now conducted from 64 facilities located in the United States, Canada, United Kingdom, Western Europe, and Asia. Our Metal Treatment services are marketed directly by our employees. Although numerous companies compete in this field and many customers have the resources to perform such services themselves, we believe that our technical knowledge, quality of workmanship, and proximity to major customers provide a competitive advantage. We compete in this segment on the basis of quality, service, and price.
Customer Concentration and Backlog
Our largest customer in this segment accounted for approximately 8% of Metal Treatment’s sales during 2011, 10% of its sales during 2010, and 11% during 2009. Although the active customer base is in excess of 5,000, the loss of this customer would have a material adverse effect on the Metal Treatment segment.
The backlog of Metal Treatment was $3 million and $2 million, as of December 31, 2011 and 2010, respectively, substantially all of which is expected to be recognized in the first quarter of 2012. Due to the nature of our Metal Treatment services, we operate with a very limited backlog of orders and services that are provided primarily on new manufactured parts. Thus, the backlog of this segment is not indicative of our future sales, and as a result, this segment’s sales and profitability are closely aligned with general industrial economic conditions and, in particular, the commercial aerospace market.
The following list defines our principal products and the markets served by the Metal Treatment segment.
Commercial Aerospace
Wing skin
Aircraft structural components Landing gear components Turbine engine rotating components
Aluminum structural components
Turbine engine rotating components
Thermal spraying of metallic and ceramic coatings for turbine engines Fasteners Sliding components
Mechanical and metallurgical testing services Chemical testing services
General Industrial
Highly stressed metal components susceptible to fatigue Welded components subject to distortion Architectural structures Engine and transmission components
15
•
Peen Forming
•
Shot Peening
•
Heat Treating
•
Laser Peening
•
Coatings
•
Analytical Services
•
Shot Peening

Miscellaneous engine, transmission, and structural components Miscellaneous aluminum and steel components
Fasteners Brake and suspension components Sliding components Miscellaneous components subject to corrosion and sliding wear Silicone and rubber medical components
Mechanical and metallurgical testing services Chemical testing services
Aerospace Defense
Helicopter and fighter aircraft structural and turbine engine components
Fighter aircraft structural components
Power Generation
Thermal spraying of metallic and ceramic coatings for industrial gas turbines
Mechanical and metallurgical testing services Chemical testing services
Other Information
Certain Financial Information
For information regarding sales by geographic region, see Note 18 to the Consolidated Financial Statements contained in Part II, Item 8, of this Annual Report on Form 10-K.
In 2011, 2010, and 2009, our foreign operations generated 39%, 36%, and 35%, respectively, of our pre-tax earnings.
Government Sales
Our direct sales to the U.S. Government and sales for U.S. Government and foreign government end use represented 40%, 41%, and 42% of consolidated revenue during 2011, 2010, and 2009, respectively. U.S. Government sales, both direct and indirect, are generally made under standard types of government contracts, including fixed price, fixed price-redeterminable, and cost plus fixed or award fees.
In accordance with normal practice in the case of U.S. Government business, contracts and orders are subject to partial or complete termination at any time, at the option of the customer. In the event of a termination for convenience by the government, there generally are provisions for recovery of our allowable incurred costs and a proportionate share of the profit or fee on the work completed, consistent with regulations of the U.S. Government. Fixed-price redeterminable contracts, generally on naval programs, usually provide that we absorb the majority of any cost overrun. In the event that there is a cost underrun, the customer recoups a portion of the underrun based upon a formula in which the customer’s portion increases as the underrun exceeds certain established levels.
16
•
Heat Treating
•
Coatings
•
Analytical Services
•
Shot Peening
•
Laser Peening
•
Coatings
•
Analytical Services

Generally, long-term contracts with the U.S. Government require us to invest in and carry significant levels of inventory. However, where allowable, we utilize progress payments and other interim billing practices on nearly all of these contracts, thus reducing the overall working capital requirements. It is our policy to seek customary progress payments on certain of our contracts. Where we obtain such payments under U.S. Government prime contracts or subcontracts, the U.S. Government has either title to or a secured interest in the materials and work in process allocable or chargeable to the respective contracts. (See Notes 1.F, 3, and 4 to the Consolidated Financial Statements, contained in Part II, Item 8, of this Annual Report on Form 10-K).
Patents
We own and are licensed under a number of United States and foreign patents and patent applications, which have been obtained or filed over a period of years. We also license intellectual property to and from third parties. Specifically, the U.S. Government has licenses in our patents that are developed in performance of government contracts, and it may use or authorize others to use the inventions covered by such patents for government purposes. Additionally, unpatented research, development, and engineering skills, some of which have been acquired by us through business acquisitions, make an important contribution to our business. While our intellectual property rights in the aggregate are important to the operation of our business, we do not consider the successful conduct of our business or business segments to be materially dependent upon the timing of expiration or protection of any one or group of patents, patent applications, or patent license agreements under which we now operate.
Research and Development
We conduct research and development activities under customer-sponsored contracts, shared development contracts, and our own independent research and development activities. Customer-sponsored research and development costs are charged to costs of goods sold when the associated revenue is recognized. Funds received under shared development contracts are a reduction of the total development expenditures under the shared contract and are shown net as research and development costs. Company-sponsored research and development costs are charged to expense when incurred. Customer-sponsored research and development activity amounted to $30 million, $26 million, and $29 million, in 2011, 2010, and 2009, respectively, and were attributed to customers within our Flow Control and Motion Control segments. Research and development expenses amounted to $62 million in 2011, $54 million in 2010, and $55 million in 2009.
Environmental Protection
We are subject to federal, state, local, and foreign laws, regulations, and ordinances that govern activities or operations that may have adverse environmental effects, such as discharges to air and water. These laws, regulations, and ordinances may also apply to handling and disposal practices for solid and hazardous waste and impose liability for the costs of cleaning up and for certain damages resulting from sites of past spills, disposals, or other releases of hazardous substances.
At various times, we have been identified as a potentially responsible party pursuant to the Comprehensive Environmental Response, Compensation, and Liability Act of 1980 (“CERCLA”), and analogous state environmental laws, for the cleanup of contamination resulting from past disposals of hazardous wastes at certain current and former facilities and at sites to which we, among others, sent wastes in the past. CERCLA requires potentially responsible persons to pay for cleanup of sites from which there has been a release or threatened release of hazardous substances. Courts have interpreted CERCLA to impose strict joint and several liability on all persons liable for cleanup costs. As a practical matter, however, at sites where there are multiple potentially responsible persons, the costs of cleanup typically are allocated among the parties according to a volumetric or other standard.
Information concerning our specific environmental liabilities is described in Notes 1.N and 15 to the Consolidated Financial Statements contained in Part II, Item 8, of this Annual Report on Form 10-K.
Executive Officers
Martin R. Benante, age 59, has served as the Chairman of the Board of Directors and Chief Executive Officer of the Corporation since April 2000. He has been a Director of the Corporation since 1999.
17
David J. Linton, age 56, has served as Co-Chief Operating Officer of the Corporation since November 2008 and President of Curtiss-Wright Flow Control Corporation since May 2004; prior to his promotion to Co-Chief Operating Officer Mr. Linton served as Vice President of the Corporation from May 2004, Vice President of Program Management, Raytheon Network Centric Systems from November 2003 to April 2004; Chief Executive Officer, Cordiem, Inc. from April 2001 to March 2003; Vice President and General Manager of Electric Systems, Hamilton Sundstrand Corporation, June 1998 to April 2001.
David C. Adams, age 57, has served as Co-Chief Operating Officer since November 2008 and President of Curtiss-Wright Controls from June 2005; prior to his promotion to Co-Chief Operating Officer Mr. Adams served as Vice President of the Corporation from November 2005; Senior Vice President, Electronic Systems of Curtiss-Wright Controls from February 2004 to June 2005; Group Vice President, Integrated Sensing from April 2002 to February 2004.
Thomas P. Quinly, age 53, has served as Vice President of the Corporation since November 2010 and President of Curtiss-Wright Controls, Inc. since November 2008; Senior Vice President, Embedded Computing of Curtiss-Wright Controls, Inc. since 2004.
Glenn E. Tynan, age 53, has served as Vice President of Finance and Chief Financial Officer of the Corporation since June 2002; Controller of the Corporation from June 2000 to May 2002.
Michael J. Denton, age 56, has served as Vice President, Secretary, and General Counsel of the Corporation since August 2001.
Glenn G. Coleman, age 44, has served as Vice President and Corporate Controller of the Corporation since May 2008. Prior to his appointment, Mr. Coleman spent the preceding 10 years with Alcatel Lucent (formerly Lucent Technologies) in various positions, including Finance Vice President, Wireless Business Group from June 2007 to December 2007 and Finance Vice President, Americas Controller from January 2002 to May 2007.
Harry S. Jakubowitz, age 59, has served as Vice President of the Corporation since May 2007 and as Treasurer of the Corporation since September 2005; Director of Taxes of the Corporation from June 2002 to September 2005.
Paul J. Ferdenzi, age 44, has served as Vice President, Human Resources of the Corporation since November 2011 and has served as Associate General Counsel and Assistant Secretary of the Corporation since June 1999 and May 2001, respectively.
Employees
At the end of 2011, we had approximately 8,900 employees, 7% of which are represented by labor unions and covered by collective bargaining agreements.
Available information
We file annual reports on Form 10-K, quarterly reports on Form 10-Q, current reports on Form 8-K, and proxy statements for our annual stockholders’ meetings, as well as any amendments to those reports, with the Securities and Exchange Commission (“SEC”). The public may read and copy any of our materials filed with the SEC at the SEC’s Public Reference Room at 100 F Street, NE, Washington, DC 20549. The public may obtain information on the operation of the Public Reference Room by calling the SEC at 1-800-SEC-0330. The SEC also maintains an Internet site at www.sec.gov that contains reports, proxy and information statements, and other information regarding issuers that file electronically with the SEC, including our filings. These reports are also available free of charge through our web site at www.curtisswright.com as soon as reasonably practicable after we electronically file that material with, or furnish it to, the SEC.
Item 1A. Risk Factors.
We have summarized below the significant, known material risks to our business. Our business, financial condition, and results of operations and cash flows could be materially and adversely impacted if any of these risks materialize. Additional risk factors not currently known to us or that we believe are immaterial may also impair our business, financial condition, and results of operations. The risk factors below should be considered together with information included elsewhere in this Annual Report on Form 10-K as well as other required
18

filings by us to the Securities Exchange Commission, such as our Form 10-Q’s, Form 8-K’s, proxy statements for our annual shareholder meetings, and subsequent amendments, if any.
A substantial portion of our revenues and earnings depends upon the continued willingness of the U.S. Government and our other customers in the defense industry to buy our products and services.
In 2011, approximately 40% of our revenues were derived from or related to defense programs, with approximately 16% attributable to U.S. Navy procurements. U.S. defense spending has historically been cyclical, and defense budgets tend to rise when perceived threats to national security increase the level of concern over the country’s safety. At other times, spending by the military can decrease. While Department of Defense funding has grown rapidly over the past few years, the top-line DoD budget is expected to flatten or potentially decline over the next several years. Competing demands for federal funds can put pressure on all areas of discretionary spending, which could ultimately impact the defense budget. A decrease in U.S. Government defense spending or changes in spending allocation could result in one or more of our programs being reduced, delayed, or terminated. Reductions in defense industry spending may or may not have an adverse effect on programs for which we provide products and services. In the event expenditures are reduced for products we manufacture or services we provide and are not offset by revenues from foreign sales, new programs, or products or services that we currently manufacture or provide, we may experience a reduction in our revenues and earnings and a material adverse effect on our business, financial condition, and results of operations. Further, there can be no assurance that our significant customers will continue to buy our products and services at current or increased levels.
As a U.S. Government contractor, we are subject to a number of procurement rules and regulations.
We must comply with and are affected by laws and regulations relating to the award, administration, and performance of U.S. Government contracts. Government contract laws and regulations affect how we do business with our customers and, in some instances, impose added costs on our business. A violation of specific laws and regulations could result in the imposition of fines and penalties or the termination of our contracts or debarment from bidding on contracts. These fines and penalties could be imposed for failing to follow procurement integrity and bidding rules, employing improper billing practices or otherwise failing to follow cost accounting standards, receiving or paying kickbacks, or filing false claims. We have been, and expect to continue to be, subjected to audits and investigations by government agencies. The failure to comply with the terms of our government contracts could harm our business reputation. It could also result in our progress payments being withheld.
In some instances, these laws and regulations impose terms or rights that are more favorable to the government than those typically available to commercial parties in negotiated transactions. For example, the U.S. Government may terminate any of our government contracts and, in general, subcontracts, at its convenience as well as for default based on performance. Upon termination for convenience of a fixed-price type contract, we normally are entitled to receive the purchase price for delivered items, reimbursement for allowable costs for work-in-process, and an allowance for profit on work actually completed on the contract or adjustment for loss if completion of performance would have resulted in a loss. Upon termination for convenience of a cost reimbursement contract, we normally are entitled to reimbursement of allowable costs plus a portion of the fee. Such allowable costs would normally include our cost to terminate agreements with our suppliers and subcontractors. The amount of the fee recovered, if any, is related to the portion of the work accomplished prior to termination and is determined by negotiation.
A termination arising out of our default could expose us to liability and have a material adverse effect on our ability to compete for future contracts and orders. In addition, on those contracts for which we are teamed with others and are not the prime contractor, the U.S. Government could terminate a prime contract under which we are a subcontractor, irrespective of the quality of our services as a subcontractor.
In addition, our U.S. Government contracts typically span one or more base years and multiple option years. The U.S. Government generally has the right to not exercise option periods and may not exercise an option period if the agency is not satisfied with our performance on the contract or does not receive funding to continue the program. U.S. Government procurement may adversely affect our cash flow or program profitability.
19
A significant reduction in the purchase of our products by the U.S. government would have a material adverse effect on our business. The risk that governmental purchases of our products may decline stems from the nature of our business with the U.S. government, where it may:
In addition, as a defense contractor, we are subject to risks in connection with government contracts, including without limitation:
Our business could be adversely affected by a negative audit by the U.S. Government.
We operate in a highly regulated environment and have been, and expect to continue to be, routinely audited by the U.S. Government and others. On a regular basis, we monitor our policies and procedures with respect to our contracts to ensure consistent application under similar terms and conditions and to assess compliance with all applicable government regulations. Negative audit findings could result in termination of a contract, forfeiture of profits, or suspension of payments. From time to time, we are subject to U.S. Government investigations relating to our operations. Government contractors that are found to have violated the law, such as the False Claims Act or the Arms Export Control Act, or are indicted or convicted for violations of other federal laws, or are found not to have acted responsibly as defined by the law, may be subject to significant fines. Such convictions could also result in suspension or debarment from government contracting for some period of time. Given our dependence on government contracting, suspension or debarment could have a material adverse effect on our business.
Our operating results are subject to fluctuations.
Our business is subject to changes in economic cycles and fluctuations in the timing of government procurement activities. As a result, our annual and quarterly operating results may fluctuate. It is possible that our operating results may not meet the expectations of securities analysts or investors. Similarly, securities analysts may issue reports downgrading our common stock. These events could cause the market price of our common stock to decline.
The success of our growth strategy is dependent upon our ability to complete acquisitions and integrate acquired businesses.
Our strategy includes growth through acquisitions. As a result, our future growth depends in part on our ability to implement our acquisition strategy and successfully integrate acquired businesses into our existing operations. If we are unable to identify suitable candidates, negotiate appropriate acquisition terms, obtain financing, and successfully integrate acquired businesses into our existing operations, our growth strategy may not be successful. In addition, acquisitions involve numerous risks, including difficulties in the assimilation of the operations, technologies, services, and products of the acquired company, the potential loss of key employees of the acquired company, and the diversion of our management’s attention from other business concerns. This is the case particularly in the fiscal quarters immediately following the completion of an acquisition since the operations of the acquired business are integrated into the acquiring businesses’ operations
20
•
terminate, reduce, or modify contracts or subcontracts if its requirements or budgetary constraints change;
•
cancel multi-year contracts and related orders if funds become unavailable; and
•
shift its spending priorities.
•
the frequent need to bid on programs prior to completing the necessary design, which may result in unforeseen technological difficulties and/or cost overruns;
•
the difficulty in forecasting long-term costs and schedules and the potential obsolescence of products related to long-term, fixed price contracts;
•
contracts with varying fixed terms that may not be renewed or followed by follow-on contracts upon expiration;
•
cancellation of the follow-on production phase of contracts if program requirements are not met in the development phase;
•
the failure of a prime contractor customer to perform on a contract; and
•
the fact that government contract wins can be contested by other contractors.
during this period. We cannot be sure that we will accurately anticipate all of the changing demands that any future acquisition may impose on our management, our operational and management information systems, and our financial systems. Once integrated, acquired operations may not achieve levels of revenue, profitability, or productivity comparable to those of our existing operations or may otherwise not perform as we expected. We may fail to discover liabilities relating to a pending acquisition during the due diligence investigation, liabilities for which we, as the successor owner, might be responsible. Although we seek to minimize the impact of potential undiscovered liabilities by structuring acquisitions to minimize liabilities and obtaining indemnities and warranties from the selling party, these methods may not fully protect us from the impact of undiscovered liabilities. For example, indemnities or warranties are often limited in scope, amount, or duration, and may not fully cover the liabilities for which they were intended. If indemnities or warranties are limited, the liabilities that are not covered by the limited indemnities or warranties could have a material adverse effect on our business and financial condition.
We use estimates when accounting for long-term contracts. Changes in estimates could affect our profitability and overall financial position.
Long-term contract accounting requires judgment relative to assessing risks, estimating contract revenues and costs, and making assumptions for schedule and technical issues. Due to the size and nature of many of our contracts, the estimation of total revenues and costs at completion is complicated and subject to many variables. For example, assumptions have to be made regarding the length of time to complete the contract as costs also include expected increases in wages and prices for materials. Similarly, assumptions have to be made regarding the future impact of efficiency initiatives and cost reduction efforts. Incentives, awards, price escalations, or penalties related to performance on contracts are considered in estimating revenue and profit rates and are recorded when there is sufficient information to assess anticipated performance. It is possible that materially different amounts could be obtained, because of the significance of the judgments and estimation processes described above, if different assumptions were used or if the underlying circumstances were to change. Changes in underlying assumptions, circumstances, or estimates may have a material adverse effect upon future period financial reporting and performance. See “Critical Accounting Estimates and Policies” in Part II, Item 7.
If we fail to satisfy our contractual obligations or meet performance standards, our contracts may be terminated and we may incur significant costs or liabilities, including liquidated damages and penalties.
In general, our contracts may be terminated for our failure to satisfy our contractual obligations or to meet performance standards. In addition, some of our contracts contain substantial liquidated damages provisions and financial penalties related to our failure to satisfy our contractual obligations or performance failures. Consequently, as a result of the above matters, we may incur significant costs or liabilities, including penalties, which could have a material adverse effect on our financial condition and results of our operation.
Our earnings and margins may vary based on the mix of our contracts and programs.
At December 31, 2011, our backlog included both cost reimbursable and fixed-price contracts. Cost reimbursable contracts generally have lower profit margins than fixed-price contracts. Production contracts are mainly fixed-price contracts, and developmental contracts are generally cost reimbursable contracts. Our earnings and margins may vary materially depending on the types of long-term government and commercial contracts undertaken, the nature of the products produced or services performed under those contracts, the costs incurred in performing the work, the achievement of other performance objectives, and the stage of performance at which the right to receive fees, particularly under incentive and award fee contracts, is finally determined.
Under fixed-price contracts, we receive a fixed price irrespective of the actual costs we incur and, consequently, any costs in excess of the fixed price are generally absorbed by us. Under time-and-materials contracts, we are paid for labor at negotiated hourly billing rates and for certain expenses. Under cost-reimbursable contracts, subject to a contract-ceiling amount in certain cases, we are reimbursed for allowable costs and paid a fee, which may be fixed or performance based. However, if our costs exceed the contract ceiling or are not allowable under the provisions of the contract or applicable regulations, we may not be able to obtain reimbursement for all such costs and may have our fees reduced or eliminated. The failure to perform to customer expectations and contract requirements can result in reduced fees and may affect our financial performance for the affected period. Under each type of contract, if we are unable to control costs we incur in
21

performing under the contract, our financial condition and operating results could be materially adversely affected. Cost over-runs also may adversely affect our ability to sustain existing programs and obtain future contract awards.
Our backlog is subject to reduction and cancellation, which could negatively impact our revenues and results of operations.
Backlog represents products or services that our customers have committed by contract to purchase from us. Total backlog includes both funded (unfilled orders for which funding is authorized, appropriated and contractually obligated by the customer) and unfunded backlog (firm orders for which funding has not been appropriated and/or contractually obligated by the customer). The Corporation is a subcontractor to prime contractors for the vast majority of our government business; as such, substantially all amounts in backlog are funded. Backlog excludes unexercised contract options and potential orders under ordering type contracts (e.g. Indefinite Delivery / Indefinite Quantity). Backlog is adjusted for changes in foreign exchange rates and is reduced for contract cancellations and terminations in the period in which they occur. Backlog as of December 31, 2011 was $1.7 billion. Backlog is subject to fluctuations and is not necessarily indicative of future sales. The U.S. government may unilaterally modify or cancel its contracts. In addition, under certain of our commercial contracts, our customers may unilaterally modify or terminate their orders at any time for their convenience. Accordingly, certain portions of our backlog can be cancelled or reduced at the option of the U.S. government and commercial customers. Our failure to replace cancelled or reduced backlog could negatively impact our revenues and results of operations.
Our future financial results could be adversely impacted by asset impairment charges.
At December 31, 2011, we had goodwill and other intangible assets of approximately $1 billion, net of accumulated amortization, which represented approximately 40% of our total assets. Our goodwill is subject to an impairment test on an annual basis and is also tested whenever events and circumstances indicate that goodwill may be impaired. Any excess goodwill resulting from the impairment test must be written off in the period of determination. Intangible assets (other than goodwill) are generally amortized over the useful life of such assets. In addition, from time to time, we may acquire or make an investment in a business that will require us to record goodwill based on the purchase price and the value of the acquired assets. We may subsequently experience unforeseen issues with such business that adversely affect the anticipated returns of the business or value of the intangible assets and trigger an evaluation of the recoverability of the recorded goodwill and intangible assets for such business. Future determinations of significant write-offs of goodwill or intangible assets as a result of an impairment test or any accelerated amortization of other intangible assets could have a material adverse impact on our results of operations and financial condition.
We operate in highly competitive markets.
We compete against companies that often have greater sales volumes and financial, research, human, and marketing resources than we have. In addition, some of our largest customers could develop the capability to manufacture products or provide services similar to products that we manufacture or services that we provide. This would result in these customers supplying their own products or services and competing directly with us for sales of these products or services, all of which could significantly reduce our revenues. Furthermore, we are facing increased international competition and cross-border consolidation of competition. Our management believes that the principal points of competition in our markets are technology, product quality, performance, price, service, previous installation history, technical expertise, and timeliness of delivery. If we are unable to compete successfully with existing or new competitors in these areas, our business, financial condition, and results of operations could be materially and adversely impacted.
Our future growth and continued success is dependent upon our key personnel.
Our success is dependent upon the efforts of our senior management personnel and our ability to attract and retain other highly qualified management and technical personnel. We face competition for management and qualified technical personnel from other companies and organizations. Therefore, we may not be able to retain our existing management and technical personnel or fill new management or technical positions or vacancies created by expansion or turnover at our existing compensation levels. Although we have entered into change of control agreements with some members of senior management, we do not have employment
22

contracts with our key executives. We have made a concerted effort to reduce the effect of the loss of our senior management personnel through management succession planning. The loss of members of our senior management and qualified technical personnel could have a material and adverse effect on our business.
Our international operations are subject to risks and volatility.
During 2011, approximately 30% of our consolidated revenue was from customers outside of the United States, and we have operating facilities in foreign countries. Doing business in foreign countries is subject to numerous risks, including without limitation: political and economic instability; the uncertainty of the ability of non- U.S. customers to finance purchases; restrictive trade policies; and complying with foreign regulatory and tax requirements that are subject to change. While these factors or the impact of these factors are difficult to predict, any one or more of these factors could adversely affect our operations. To the extent that foreign sales are transacted in foreign currencies and we do not enter into currency hedge transactions, we are exposed to risk of losses due to fluctuations in foreign currency exchange rates, particularly for the Canadian dollar, the Euro, Swiss franc, and the British pound. Significant fluctuations in the value of the currencies of the countries in which we do business could have an adverse effect on our results of operations.
We may be unable to protect the value of our intellectual property.
Obtaining, maintaining, and enforcing our intellectual property rights and avoiding infringing on the intellectual property rights of others are important factors to the operation of our business. While we take precautionary steps to protect our technological advantages and intellectual property and rely in part on patent, trademark, trade secret, and copyright laws, we cannot assure that the precautionary steps we have taken will completely protect our intellectual property rights. Because patent applications in the United States are maintained in secrecy until either the patent application is published or a patent is issued, we may not be aware of third-party patents, patent applications, and other intellectual property relevant to our products that may block our use of our intellectual property or may be used in third-party products that compete with our products and processes. When others infringe on our intellectual property rights, the value of our products is diminished, and we may incur substantial litigation costs to enforce our rights. Similarly, we may incur substantial litigation costs and the obligation to pay royalties if others claim we infringed on their intellectual property rights. When we develop intellectual property and technologies with funding from U.S. Government contracts, the government has the royalty-free right to use that property.
In addition to our patent rights, we also rely on unpatented technology, trade secrets, and confidential information. Others may independently develop substantially equivalent information and techniques or otherwise gain access to or disclose our technology. We may not be able to protect our rights in unpatented technology, trade secrets, and confidential information effectively. We require each of our employees and consultants to execute a confidentiality agreement at the commencement of an employment or consulting relationship with us. There is no guarantee that we will succeed in obtaining and retaining executed agreements from all employees or consultants. Moreover, these agreements may not provide effective protection of our information or, in the event of unauthorized use or disclosure, they may not provide adequate remedies.
Our operations are subject to numerous domestic and international laws, regulations, and restrictions, and noncompliance with these laws, regulations, and restrictions could expose us to fines, penalties, suspension, or debarment, which could have a material adverse effect on our profitability and overall financial condition.
We have contracts and operations in many parts of the world subject to United States and foreign laws and regulations, including the False Claims Act, regulations relating to import-export control (including the International Traffic in Arms Regulation promulgated under the Arms Export Control Act), technology transfer restrictions, repatriation of earnings, exchange controls, the Foreign Corrupt Practices Act, the U.K. Anti-Bribery Act, and the anti-boycott provisions of the U.S. Export Administration Act. Although we have implemented policies and procedures and provided training that we believe are sufficient to address these risks, we cannot guarantee that our operations will never fail to comply with these laws and regulations. Failure by us or our sales representatives or consultants to comply with these laws and regulations could result in administrative, civil, or criminal liabilities and could, in the extreme case, result in suspension or debarment
23
from government contracts or suspension of our export privileges, which could have a material adverse effect on our business.
We are subject to liability under environmental laws.
Our business and facilities are subject to numerous federal, state, local, and foreign laws and regulations relating to the use, manufacture, storage, handling, and disposal of hazardous materials and other waste products. Environmental laws generally impose liability for investigation, remediation, and removal of hazardous materials and other waste products on property owners and those who dispose of materials at waste sites, whether or not the waste was disposed of legally at the time in question. We are currently addressing environmental remediation at certain current and former facilities, and we have been named as a potentially responsible party along with other organizations in a number of environmental clean-up sites and may be named in connection with future sites. We are required to contribute to the costs of the investigation and remediation and to establish reserves in our financial statements for future costs deemed probable and estimable. Although we have estimated and reserved for future environmental remediation costs, the final resolution of these liabilities may significantly vary from our estimates and could potentially have an adverse effect on our results of operations and financial position.
Unanticipated changes in our tax provisions or exposure to additional income tax liabilities could affect our profitability.
Our business operates in many locations under government jurisdictions that impose income taxes. Changes in domestic or foreign income tax laws and regulations, or their interpretation, could result in higher or lower income tax rates assessed or changes in the taxability of certain revenues or the deductibility of certain expenses, thereby affecting our income tax expense and profitability. In addition, audits by income tax authorities could result in unanticipated increases in our income tax expense.
Our current debt, and debt we may incur in the future, could adversely affect our business and financial position.
As of December 31, 2011, we had $586 million of debt outstanding, of which $584 million is long-term debt. Our debt consists primarily of principal payable under our fixed rate senior notes. Our level of debt could have significant consequences for our business including: requiring us to use our cash flow to pay principal and interest on our debt, reducing funds available for acquisitions and other investments in our business; making us vulnerable to economic downturns and increases in interest rates; limiting us from obtaining additional debt; and impacting our ability to pay dividends.
A percentage of our workforce is employed under collective bargaining agreements.
Approximately 7% of our workforce is employed under collective bargaining agreements, which from time to time are subject to renewal and negotiation. We cannot ensure that we will be successful in negotiating new collective bargaining agreements, that such negotiations will not result in significant increases in the cost of labor, or that a breakdown in such negotiations will not result in the disruption of our operations. Although we have generally enjoyed good relations with both our unionized and non-unionized employees, if we are subject to labor actions, we may experience an adverse impact on our operating results.
Substantial defaults by our customers related to accounts receivable or the loss of significant customers could have a significant negative impact on our business, results of operations, financial condition or liquidity.
A significant portion of our working capital consists of accounts receivable from customers. If customers responsible for a significant amount of accounts receivable were to become insolvent or otherwise unable to pay for products and services, or were to become unwilling or unable to make payments in a timely manner, our business, results of operations, financial condition or liquidity could be adversely affected. An economic or industry downturn could adversely and materially affect the servicing of these accounts receivable, which could result in longer payment cycles, increased collection costs, and defaults in excess of management’s expectations.
24
We rely on certain suppliers as a sole source of components for some of our products.
Our manufacturing processes for our products often consist of the assembly of purchased components that are generally available from a number of different suppliers, though several suppliers are our sole source of certain components. If a sole-source supplier should cease or otherwise be unable to deliver such components, our operating results could be adversely impacted. In addition, if our suppliers are unable to keep up with our demand for purchased components and we are unable to locate additional sources of supply, our operating results could be adversely impacted.
Our earnings and margins depend in part on subcontractor performance, as well as raw material and component availability and pricing.
Our businesses depend on suppliers and subcontractors for raw materials and components. At times subcontractors perform services that we provide to our customers. We depend on these subcontractors and vendors to meet their contractual obligations in full compliance with customer requirements. These supply networks can sometimes experience price fluctuations. Our ability to perform our obligations as a prime contractor may be adversely affected if one or more of these suppliers are unable to provide the agreed-upon supplies or perform the agreed-upon services in a timely and cost-effective manner. While we have attempted to mitigate the effects of increased costs through price increases, there are no assurances that higher prices can effectively be passed through to our customers or that we will be able to offset fully or on a timely basis the effects of higher raw materials costs through price increases.
Our business involves risks associated with complex manufacturing processes.
Our manufacturing processes depend on certain sophisticated and high-value equipment. Unexpected failures of this equipment may result in production delays, revenue loss, and significant repair costs. In addition, equipment failures could result in injuries to our employees. Moreover, the competitive nature of our businesses requires us to continuously implement process changes intended to achieve product improvements and manufacturing efficiencies. These process changes may at times result in production delays, quality concerns, and increased costs. Any disruption of operations at our facilities due to equipment failures or process interruptions could have a material adverse effect on our business.
The airline industry is heavily regulated, and if we fail to comply with applicable requirements, our results of operations could suffer.
Governmental agencies throughout the world, including the U.S. Federal Aviation Administration (“FAA”) and the European Aviation Safety Agency, prescribe standards and qualification requirements for aircraft components, including virtually all commercial airline and general aviation products. Specific regulations vary from country to country, although compliance with FAA requirements generally satisfies regulatory requirements in other countries. We include, with the products that we sell to our aircraft manufacturing customers, documentation certifying that each part complies with applicable regulatory requirements and meets applicable standards of airworthiness established by the FAA or the equivalent regulatory agencies in other countries. In order to sell our products, we and the products we manufacture must also be certified by our individual OEM customers. If any of the material authorizations or approvals qualifying us to supply our products is revoked or suspended, then the sale of the subject product would be prohibited by law, which would have an adverse effect on our business, financial condition, and results of operations.
From time to time, the FAA or equivalent regulatory agencies in other countries propose new regulations or changes to existing regulations, which are usually more stringent than existing regulations. If these proposed regulations are adopted and enacted, we may incur significant additional costs to achieve compliance, which could have a material adverse effect on our business, financial condition, and results of operations.
Our future success will depend, in part, on our ability to develop new technologies.
Virtually all of the products produced and sold by us are highly engineered and require sophisticated manufacturing and system-integration techniques and capabilities. The commercial and government markets in which we operate are characterized by rapidly changing technologies. The product and program needs of our government and commercial customers change and evolve regularly. Accordingly, our future performance depends in part on our ability to identify emerging technological trends, develop and manufacture competitive products, and bring those products to market quickly at cost-effective prices.
25

Potential product liability risks exist from the products that we sell.
Our businesses expose us to potential product liability risks that are inherent in the design, manufacture, and sale of our products and the products of third-party vendors that we use or resell. We currently maintain what we believe to be suitable and adequate product liability insurance. There can be no assurance, however, that we will be able to maintain our product liability insurance on acceptable terms or that our product liability insurance will provide adequate protection against potential liabilities. In the event of a claim against us, a lack of sufficient insurance coverage could have a material adverse effect on our business, financial condition, and results of operations. Moreover, even if we maintain adequate insurance, any successful claim could have a material adverse effect on our business, financial condition, results of operations, and on the ability to obtain suitable or adequate insurance.
Increasing costs of certain employee and retiree benefits could adversely affect our financial position, results of operations, or cash flows.
Our earnings may be positively or negatively impacted by the amount of income or expense we record for our pension and other postretirement benefit plans. U.S. GAAP requires that we calculate income or expense for the plans using actuarial valuations. These valuations reflect assumptions relating to financial market and other economic conditions. Changes in key economic indicators can change the assumptions. The most significant year-end assumptions used to estimate pension or other postretirement benefit expense for the following year are the discount rate, the expected long-term rate of return on plan assets, expected future medical cost inflation, and expected compensation increases. In addition, we are required to make an annual measurement of plan assets and liabilities, which may result in a significant change to equity through a reduction or increase to other comprehensive income. For a discussion regarding how our financial statements can be affected by pension and other postretirement benefit plans accounting policies, see “Management’s Discussion and Analysis—Critical Accounting Estimates and Policies—Pension and Other Postretirement Benefits” in Part II, Item 7. Although U.S. GAAP expense and pension or other postretirement contributions are not directly related, the key economic factors that affect U.S. GAAP expense would also likely affect the amount of cash the company would contribute to the pension or other postretirement plans. Potential pension contributions include both mandatory amounts required under federal law, Employee Retirement Income Security Act, and discretionary contributions to improve the plans’ funded status. An obligation to make contributions to pension plans could reduce the cash available for working capital and other corporate uses.
Our operating results and financial condition may be adversely impacted by the current worldwide economic conditions.
We currently generate significant operating cash flows, which combined with access to the credit markets provides us with significant discretionary funding capacity. However, financial markets in the United States, Europe, and Asia have been experiencing extreme disruption in recent years, including, among other things, extreme volatility in security prices, severely diminished liquidity and credit availability, rating downgrades of certain investments and declining valuations of others. While currently these conditions have not impaired our ability to operate our business, there can be no assurance that there will not be a further deterioration in financial markets and confidence in major economies, which could impact consumer and customer demand for our products, as well as our ability to manage normal commercial relationships with our customers, suppliers, and creditors. We are unable to predict the likely duration and severity of the current disruption in financial markets and adverse economic conditions, and the effects they will have on our business and financial condition.
Future terror attacks, war, natural disasters, or other events beyond our control could adversely impact our businesses.
Despite our concerted effort to minimize risk to our production capabilities and corporate information systems and to reduce the effect of unforeseen interruptions to us through business continuity planning and disaster recovery plans, terrorist attacks, war, natural disasters, such as hurricanes, floods, tornados, pandemic diseases, or other events such as strikes by a significant customer’s or supplier’s workforce could adversely impact demand for or supply of our products and could also cause disruption to our facilities or systems which could also interrupt operational processes and adversely impact our ability to manufacture our products and provide services and support to our customers. We operate facilities in areas of the world that are exposed to
26

natural disasters, such as but not limited to hurricanes, floods, tornados, and pandemic diseases. For example, Hurricanes Ike and Gustav in 2008 caused disruption to the oil and gas market for our products and services. Similarly, the terrorist attacks of September 11, 2001 and subsequent terrorist attacks worldwide caused decreased demand in the commercial aerospace market for our products and commercial overhaul and repair services. Financial difficulties of our customers, delays by our customers in production of their products, high fuel prices, the concern of another major terrorist attack, and the overall decreased demand for our customers’ products could adversely affect our operating results and financial position.
Intrusion on our systems could damage our business.
We store sensitive data, including intellectual property, proprietary business information, and confidential employee information, in our servers and on our databases. Despite our implementation of firewalls, switchgear, and other network security measures, our servers, databases, and other systems may be vulnerable to computer hackers, physical or electronic break-ins, sabotage, computer viruses, worms and similar disruptions from unauthorized tampering with our computer systems. We will continue to review and enhance our computer systems to try to prevent unauthorized and unlawful intrusions, but in the future it is possible that we may not be able to prevent all intrusions and such intrusions could result in our network security or computer systems being compromised and possibly result in the misappropriation or corruption of sensitive information or cause disruptions in our services. We might be required to expend significant capital and resources to protect against, remediate or alleviate problems caused by such intrusions. Any such intrusion could cause us to be non-compliant with applicable laws or regulations, subject us to legal claims or proceedings, disrupt our operations, damage our reputation, and cause a loss of confidence in our products and services, any of which could have a material adverse effect on our business, financial condition, and results of operations.
There are risks associated with owning our common stock.
Like any equity security, our common stock is subject to a number of risks that may adversely impact our share price including: there is a limited trading market in our common stock; we may not in the future be able to pay dividends on our common stock; we may issue common stock for acquisitions or other purposes that could be dilutive to current stockholders; and we have various anti-takeover defenses such as our rights plan and our ability to issue preferred stock that may discourage a potential acquirer.
Item 1B. Unresolved Staff Comments.
None.
27

Item 2. Properties.
Our corporate headquarters are located at a leased facility in Parsippany, New Jersey. As of December 31, 2011, we had 196 facilities worldwide. Approximately 65% of our facilities operate as manufacturing and engineering, metal treatment, or aerospace overhaul plants, while the remaining 35% operate as selling and administrative offices facilities. The number and type of facilities utilized by each of our reportable segments is summarized below:
Flow Control has principal manufacturing facilities located in Canada, New York, Pennsylvania, and Texas. Motion Control has principal manufacturing facilities located in California, Canada, Mexico, and North Carolina. Metal Treatment has principal manufacturing facilities located in England. The buildings on the properties referred to in this Item are well maintained, in good condition, and are suitable and adequate for the uses presently being made of them. Management believes the productive capacity of our properties is adequate to meet our anticipated volume for the foreseeable future.
Item 3. Legal Proceedings.
In the ordinary course of business, we and our subsidiaries are subject to various pending claims, lawsuits, and contingent liabilities. We do not believe that the disposition of any of these matters, individually or in the aggregate, will have a material adverse effect on our consolidated financial position or results of operations.
We have been named in approximately 177 pending lawsuits that allege injury from exposure to asbestos. In addition, to date, we have secured dismissals with prejudice and without prejudice in approximately 163 and 220 lawsuits, respectively, and are currently in discussions for similar dismissal of several other lawsuits, and have not been found liable or paid any material sum of money in settlement in any case. We believe that the minimal use of asbestos in our past and current operations and the relatively non-friable condition of asbestos in our products makes it unlikely that we will face material liability in any asbestos litigation, whether individually or in the aggregate. We do maintain insurance coverage for these potential liabilities and we believe adequate coverage exists to cover any unanticipated asbestos liability.
Item 4. Mine and Safety Disclosures.
Not applicable.
28
Owned Facilities
Location
Flow Control
Motion Control
Metal Treatment
Total
North America 14
2 18
34 Europe
1 1
11 13
Asia 1
— —
1
Total 16
3 29
48
Leased Facilities Location
Flow Control
Motion Control
Metal Treatment
Total
North America 51
23 35
109 Europe
4 15
13 32
Asia 2
2 2
6
Total 57
40 50
147
PART II
Item 5. Market for the Registrant’s Common Equity, Related Stockholder Matters and Issuer Purchases of Equity Securities.
MARKET INFORMATION
Our common stock is listed and traded on the New York Stock Exchange under the symbol CW.
As of January 1, 2012, we had approximately 5,347 registered shareholders of our common stock, $1.00 par value.
DIVIDENDS
Our quarterly dividend payments were constant in 2011 and 2010.
SECURITIES AUTHORIZED FOR ISSUANCE UNDER EQUITY COM PENSATION PLANS
The following table sets forth information regarding our equity compensation plans as of December 31, 2011, the end of our most recently completed fiscal year:
Stock Price Range
2011
2010
Common Stock
High
Low
High
Low
First Quarter $
38.92 $
32.34 $
36.48 $
28.32 Second Quarter
35.75 30.97
37.54 28.92
Third Quarter 33.15
25.67 31.49
26.11 Fourth Quarter
36.00 26.92
34.01 28.78
Common Stock
2011
2010
First Quarter $
0.08 $
0.08 Second Quarter
0.08 0.08
Third Quarter 0.08
0.08 Fourth Quarter
0.08 0.08
Plan category
Number of securities to be
issued upon exercise of outstanding options, warrants, and rights
Weighted average exercise price of
outstanding options, warrants, and rights
Number of securities remaining available for
future issuance under equity
compensation plans (excluding securities
reflected in the first column)
Equity compensation plans approved by security holders 4,917,164(a) $31.83 1,964,048(b)
Equity compensation plans not approved by security holders None Not applicable Not applicable
Issuer Purchases of Equity Securities
The following table provides information about our repurchases of equity securities that are registered by us pursuant to Section 12 of the Securities Exchange Act of 1934, as amended, during the quarter ended December 31, 2011.
29
(a)
Consists of 4,700,632 shares issuable upon exercise of outstanding options and vesting of performance shares, restricted shares, and restricted stock units under the 2005 Long-Term Incentive Plan, 142,515 shares issuable under the Employee Stock Purchase Plan, and 74,017 shares outstanding under the 2005 Stock Plan for Non- Employee Directors.
(b)
Consists of 505,010 shares available for future option grants under the 2005 Long-Term Incentive Plan, 1,424,322 shares remaining available for issuance under the Employee Stock Purchase Plan, and 34,716 shares remaining available for issuance under the 2005 Stock Plan for Non-Employee Directors.
Total Number of Maximum Number of
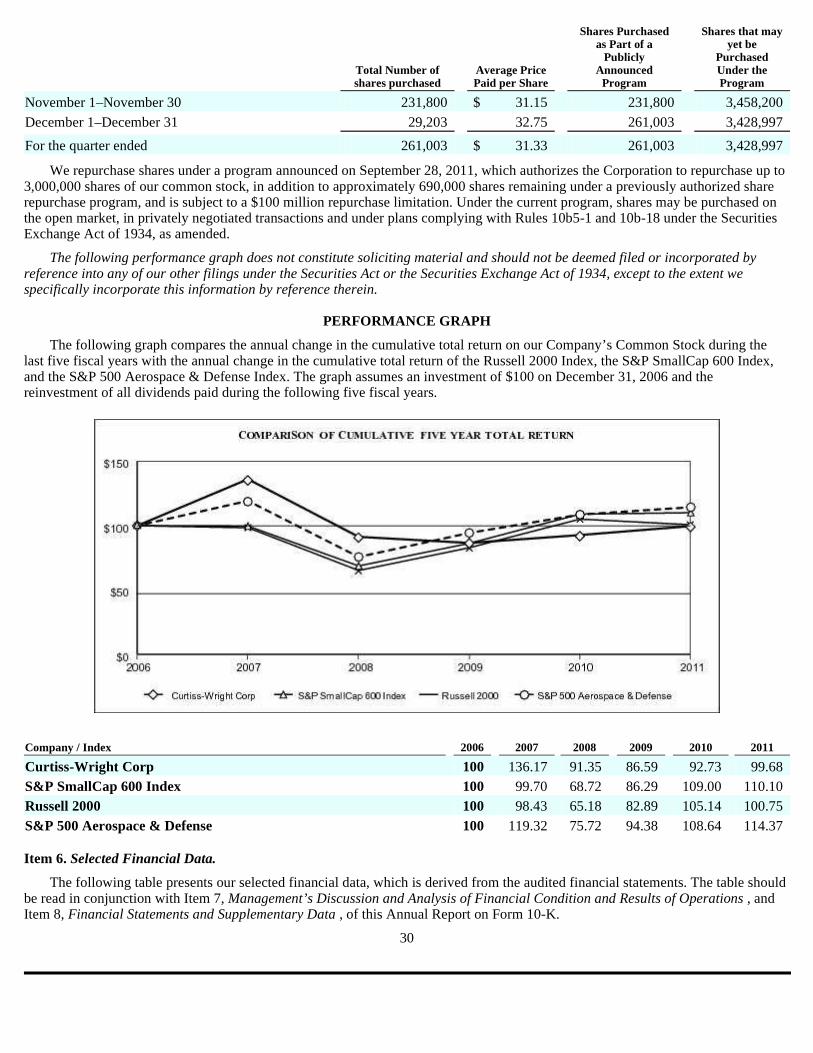
We repurchase shares under a program announced on September 28, 2011, which authorizes the Corporation to repurchase up to 3,000,000 shares of our common stock, in addition to approximately 690,000 shares remaining under a previously authorized share repurchase program, and is subject to a $100 million repurchase limitation. Under the current program, shares may be purchased on the open market, in privately negotiated transactions and under plans complying with Rules 10b5-1 and 10b-18 under the Securities Exchange Act of 1934, as amended.
The following performance graph does not constitute soliciting material and should not be deemed filed or incorporated by reference into any of our other filings under the Securities Act or the Securities Exchange Act of 1934, except to the extent we specifically incorporate this information by reference therein.
PERFORMANCE GRAPH
The following graph compares the annual change in the cumulative total return on our Company’s Common Stock during the last five fiscal years with the annual change in the cumulative total return of the Russell 2000 Index, the S&P SmallCap 600 Index, and the S&P 500 Aerospace & Defense Index. The graph assumes an investment of $100 on December 31, 2006 and the reinvestment of all dividends paid during the following five fiscal years.
Item 6. Selected Financial Data.
The following table presents our selected financial data, which is derived from the audited financial statements. The table should be read in conjunction with Item 7, Management’s Discussion and Analysis of Financial Condition and Results of Operations , and Item 8, Financial Statements and Supplementary Data , of this Annual Report on Form 10-K.
30
Total Number of shares purchased
Average Price Paid per Share
Shares Purchased as Part of a
Publicly Announced Program
Shares that may yet be
Purchased Under the Program
November 1–November 30 231,800
$ 31.15
231,800 3,458,200
December 1–December 31 29,203
32.75 261,003
3,428,997
For the quarter ended 261,003
$ 31.33
261,003 3,428,997
Company / Index
2006
2007
2008
2009
2010
2011
Curtiss-Wright Corp 100
136.17 91.35
86.59 92.73
99.68 S&P SmallCap 600 Index
100 99.70
68.72 86.29
109.00 110.10
Russell 2000 100
98.43 65.18
82.89 105.14
100.75 S&P 500 Aerospace & Defense
100 119.32
75.72 94.38
108.64 114.37

Five-Year Financial Highlights
CONSOLIDATED SELECTED FINANCIAL DATA
See notes to the consolidated financial statements for additional financial information.
Item 7. Management’s Discussion and Analysis of Financial Condition and Results of Operations.
Analytical Definitions
Throughout management’s discussion and analysis of financial condition and results of operations, the terms “incremental” and “organic” are used to explain changes from period to period. The term “incremental” is used to highlight the impact acquisitions had on the current year results, for which there was no comparable prior-year period. Therefore, the results of operations for acquisitions are incremental for the first twelve months from the date of acquisition. The remaining businesses are referred to as the “organic”. The definition of “organic” excludes the effect of foreign currency translation.
Company Organization
Our Management’s Discussion and Analysis of Financial Condition and Results of Operations begins with an overview of our company, followed by economic and industry-wide factors impacting our company and the markets we serve, a discussion of the overall results of operations, and finally a more detailed discussion of those results within each of our reportable operating segments.
We manage and evaluate our operations based on the products and services we offer and the different industries and markets we serve. Based on this approach, we have three reportable segments: Flow Control, Motion Control, and Metal Treatment. For further information on our products and services and the major markets served by our three segments, refer to the Business Description in Part I, Item I of this Annual Report on Form 10-K. The following charts represent our sales by market for 2011 and 2010:
Market Analysis and Economic Factors
In 2011, Curtiss-Wright produced solid sales and stronger profitability driven by robust demand for our unique and highly engineered products and services across most of our end markets. We have a diversified product portfolio, and our three reportable segments are solidly positioned in our core markets: defense, power generation, oil and gas, commercial aerospace, and general industrial. Furthermore, our technologies are relied
31
2011
2010
2009
2008
2007
(In thousands, except per share data) Net sales
$ 2,054,130
$ 1,893,134
$ 1,809,690
$ 1,830,140
$ 1,592,124
Net earnings 130,423
106,598 95,221
109,390 104,328
Total assets 2,652,837
2,242,018 2,142,041
2,042,030 1,985,560
Total debt 586,430
396,644 465,093
516,709 511,904
Basic earnings per share $
2.81 $
2.33 $
2.10 $
2.45 $
2.35 Diluted earnings per share
$ 2.77
$ 2.30
$ 2.08
$ 2.41
$ 2.32
Cash dividends per share $
0.32 $
0.32 $
0.32 $
0.32 $
0.28
upon to provide increased safety, reliability, and performance in the most demanding environments, serving numerous customers across a multitude of industries.
Modest overall defense sales growth of 4% was driven by increased demand for our technologies across several of the defense markets. In particular, we experienced 11% growth in our aerospace defense market, led by a strong surge in sales to various helicopters programs, most notably for the Black Hawk, as well as improved demand on various fighter aircraft programs. Elsewhere, sales to the naval defense market were mixed, dropping 1% overall, as the ramp-up in production on the Virginia class submarine program and CVN-79 Ford class aircraft carrier, along with the shift to full production on the Advanced Arresting Gear program, were not enough to offset the winding down in production-related sales on the CVN-78 aircraft carrier and the Electro-Mechanical Aircraft Launch System program. Sales to the ground defense market declined 3% due to continued reductions in reset and modernization opportunities on various ground vehicles, primarily due to reduced spending on the Bradley Fighting Vehicle, as well as the winding down on the Future Combat Systems (“FCS”) program. Sales to the international ground defense market were strong, led by increased demand for our turret drive stabilization systems. Across our defense businesses, we saw increased demand for our embedded computing technologies on new domestic programs and upgrades, which is in line with the U.S. Government’s continued focus on expanding ISR and unmanned applications, as well as a steady rise in sales to foreign military platforms.
Following a period of significant growth in the overall defense budget and related supplemental budgets seen in the previous decade, future defense spending is expected to moderate and eventually flatten out in the coming years, as several large development programs have been delayed or cancelled, and the current Administration looks to decrease troops stationed abroad.
Our commercial markets increased 12% in 2011, driven by solid organic sales in our commercial aerospace and power generation markets, along with general improvements to global economies which benefited our general industrial market. In particular, we experienced a strong increase of 30% in our commercial aerospace market due to increased production by both Boeing and Airbus, while our general industrial market, grew 17% over the prior year, led by strong sales to the automotive, transportation, and HVAC industries. Meanwhile, we experienced some weakness in our oil and gas markets, which declined 4% due to customer delays and reduced capital spending on larger projects, primarily from international customers, despite marked improvement in maintenance, repair, and overhaul (“MRO”) and super vessels sales.
Economic Factors Impacting Our Markets
Looking forward, we believe that most industries within our commercial markets will likely experience solid improvements as global economies continue to improve off of the recent lows, and our unique and highly engineered products and services, which are typically provided through long-term programs, will continue to generate demand. We expect the commercial aerospace market to increase in the near-term as ongoing demand for new aircraft deliveries drives production increases and the global economic recovery stimulates the travel and transportation industries. In addition, we expect continued growth in our power generation market, due to ongoing maintenance and upgrade requirements on operating nuclear plants, a renewed interest in products to aid safety and extend the reliability of existing reactors, and the continued emphasis on global nuclear power construction. We also expect a rebound in our oil and gas market, led by improved MRO activity as world economies continue to strengthen. We believe our performance in the energy markets will be aided by the ongoing focus on resource independence and environmental issues. U.S. defense spending levels are expected to slow considerably over the next few years with a repositioning of the U.S. defense budget, while higher costs for labor will likely reduce funding available for certain development and production programs.
General Economy
Many of our U.S industrial businesses are driven in large part by global economic growth. As the world economies continue to recover from the 2008-2009 global recession, as well as the aftermath of the earthquake and tsunami that struck Japan early in 2011, the pace of recovery has been slow compared to past recessions. In 2011, the U.S. economy, as measured by real gross domestic product (“GDP”), showed modest, sequential improvements throughout the year resulting in annual GDP growth of 1.7% according to the most recent estimate, compared with a 3% annual increase in 2010. Despite a slow start to the year, improvements in GDP reflected the ongoing turnaround from the previous global economic recession. Full year 2011 industrial
32
production improved 4.1% based on the most current estimates, building on the 5.3% gain in 2010. Through December 2011, industrial production figures posted ten consecutive quarterly gains, a positive sign for several of the markets in which we participate. Additionally, capacity utilization in 2011 reached the highest level in three years. Other general sectors of the economy such as: unemployment levels, real estate markets, and growth in household income, remain weak.
In 2012, the broader U.S. economy is expected to continue to recover, with world economies showing improvements off of recessionary lows. Current estimates for U.S. GDP growth range from 1.8% to 2.1%. However, world economies are likely to experience continued volatility due to the impact of Europe’s debt crisis and possible contagion effects that could undermine economic growth in Europe and the rest of the world. Overall, we remain cautiously optimistic that our commercial and industrial markets will continue to improve in 2012.
Defense
During 2011, approximately 40% of our business was attributed to the defense sector, predominantly in the United States, and characterized by long-term programs and contracts driven primarily by the DoD budgets and funding levels.
We have a well-diversified portfolio of products and services that supply all branches of the U.S. military, with content on many high performance defense platforms including: aircraft carriers, submarines, destroyers, and the F-18 Super Hornet for the U.S. Navy; the U.S. Coast Guard Deepwater program; the F-35 JSF, P-8 Poseidon, F-16 Falcon, V-22 Osprey, and Unmanned Aerial Vehicle programs, such as the Global Hawk, for the U.S. Air Force; and the UH-60 Black Hawk, AH-64 Apache and CH-47 Chinook helicopters, the Abrams Tank, the Bradley Fighting Vehicle, and the Stryker for the U.S. Army. In addition, we are involved in many of the future military systems that are currently in development, such as the U.S Army’s Ground Combat Vehicle, the U.S. Navy’s BAMS variant of the Global Hawk platform and the Navy’s next-generation Ohio Class replacement submarine program. We also provide a variety of products to non-U.S. military programs in Europe, the Asia Pacific region, the Middle East, South America, and Canada.
The U.S. Defense budget serves as a leading indicator of our defense market, and its future outlook has been marked with some uncertainty. In 2010 and 2011, U.S. defense spending levels, as measured by the DoD funding, began to slow after years of strong growth. However, increased C4ISR funding in 2011 was one of the key positives as it relates to our business, as our embedded computing products and electronics systems benefited from the increased focus and are expected to continue to receive solid funding in future years.
Fiscal year 2011 served as an active year for defense budget analysis, particularly in the fall of 2011 when the Congressional “Super Committee,” created from the Budget Control Act of 2011, failed to agree on necessary budget cuts and created further uncertainty within the DoD budgetary environment. The 12-member Super Committee failed to identify $1.2 trillion of savings in order to further reduce the country’s mounting deficit. The inability to reach a deal and produce additional savings means that sequestration, or automatic cuts of $1.2 trillion over 10 years, could take effect beginning in January 2013. As a result, the U.S. Defense budget is subject to additional cuts of $500 billion over the next 10 years.
Rather than operate under a continuing resolution for all of government fiscal year 2012, Congress passed a $1 trillion Omnibus spending bill in mid-December 2011 to fund the U.S. Government for the remainder of fiscal year 2012. The Omnibus package includes a $531 billion base budget (a slight increase compared to the base fiscal year 2011 budget) and $115 billion of wartime or Overseas Contingency Operations (“OCO”) funding, both lower than the President’s request. Both figures are in-line with Defense Secretary Panetta’s guidance to deliver approximately $487 billion in cuts over 10 years, which is relative to the previous (fiscal year 2012) Future Years Defense Plan (“FYDP”). OCO funding was lower, as a result of scaled down operations and reduced need for troops in Iraq and Afghanistan.
On January 5, 2012, President Obama and Defense Secretary Leon Panetta provided strategic guidance to serve as a precursor to the 2013 FYDP. The new strategic guidance is consistent with the “Defense Cap” scenario of the Budget Control Act, which implies positive nominal growth in the base budget. It does not include sequestration cuts that were triggered by the failure of the super committee (scheduled to go into effect in January 2013). Two areas in which we participate—C4ISR and unmanned systems—are likely to receive increased funding in the coming future years plan.
33

The release of the initial fiscal year 2013 DoD Budget Request will play a key role in shaping future military budgets, as it indicated a smaller and leaner structure moving forward, consistent with the President’s strategy. The Pentagon is requesting $525 billion for its base budget in fiscal year 2013, a $6 billion reduction from the prior year request, including a reduction of $88 billion in OCO funding. The outcome pointed to a reduction in certain underperforming military programs while slowing down production of others, as well as substantial force size reductions over the next five years. Some of the reductions and cancellations will impact programs in which we participate, although we do expect to benefit from the increased focus on new ISR, electronic warfare, and communications capabilities.
In naval defense, the fiscal year 2012 budget indicates continued support and funding for the U.S. Navy’s shipbuilding program, and includes construction of two Virginia class submarines in fiscal year 2012, as well as funding for the restart of the DDG 51 class destroyer construction program. While the fiscal year 2012 budget includes continued development of the Ohio Class SSBN submarine replacement program (“ORP”), the launch date was pushed out by two years to 2021 in the DoD Budget Request. The ORP program received $672 million of Research and Development (“R&D”) funding in fiscal year 2011 and has requested more than $1 billion in fiscal year 2012. The U.S. Navy is expected to procure 11 new ships in fiscal year 2012 and 56 ships through fiscal year 2016. In addition to the increase in production from one to two Virginia class submarines per year starting in fiscal year 2011, as part of an eight submarine multi-year contract, work on the new CVN-79 Ford class aircraft carrier is expected to ramp up significantly as part of the 5-year build cycle on aircraft carriers. Overall, the fiscal year 2012 budget includes increased funding for the U.S. Navy shipbuilding program, with plans to balance capability, affordability, and industrial base stability.
In aerospace defense, production-related funding is expected to be positive on programs such as the F-35, Global Hawk, and P-8, as well as modest demand for helicopters and other ISR applications. However, we expect our performance in this market to be impacted by reduced year-over-year funding levels and program restructuring, particularly on the F-35, as well as the winding down of development for the Air Force’s Global Hawk program and lower volumes on the F-16.
In ground defense, new production orders and resets on the Bradley Fighting Vehicle slowed as U.S. military ground forces shifted from Iraq to Afghanistan, lessening the need for an equivalent complement of wheeled vehicles given the mountainous terrain. While we anticipate ground vehicle upgrades and modernization programs will continue to be funded, the timing is uncertain following years of rapid growth from the supplemental defense budgets and the impending draw down of our forces from overseas operations. We anticipate future spending will include technology upgrades on current platforms, such as the Abrams, Bradley, and Stryker, programs, as well as the development of newer manned and unmanned platforms.
As the core defense budget is expected to moderate and eventually flatten over the next few years, reductions in supplemental spending, as well as the trimming of procurement and investment accounts, could negatively impact overall demand for some of our technologies. In the near-term, however, the global war on terror, emerging security challenges around the globe, and the need to replace worn-out equipment may provide some modest opportunities for our defense oriented products. Additionally, as is typical in an election year, the 2012 Presidential election is unlikely to result in near-term funding and force structure changes. While DoD funding fluctuates year-by-year and program-by-program, the primary risk facing Curtiss-Wright would be the termination of a Navy nuclear program, such as the aircraft carrier or submarine, which for the moment does not appear to be under consideration. Although we monitor the budget process as it relates to programs in which we participate, we cannot predict the ultimate impact of future DoD budgets.
Commercial Aerospace
Approximately 15% of our revenue is derived from the global commercial aerospace market. Our primary focus in this market is OEM products and services for commercial jets. We are expanding into the regional and business jet sectors with new content on the Cessna, Embraer, and Learjet platforms, and are providing increasing content to commercial helicopters. Our Motion Control segment primarily provides flight control and utility actuation systems, sensors, and other electronics to Boeing as well as electronic products to Airbus. The Metal Treatment segment uses shot peen forming on the majority of Airbus aircraft wing skins; and laser peen forming on certain wing skins of the Boeing 747-8. Shot and Laser Peening are also utilized on highly stressed components of turbine engines, landing gear, and aircraft structures. Demand for our commercial aerospace products and services is primarily driven by increased customer production levels, including new platforms for
34

both Boeing and Airbus, increased demand for Sikorsky helicopters, and our successful introduction of new products for existing programs.
The largest driver of the commercial aerospace business is OEM parts, which is highly dependent on new aircraft production. Industry data supports a modest increase in commercial aircraft deliveries over the next few years, as 2011 marked the first year in a multi-year production up-cycle for the commercial aerospace market. Over the next few years, OEM-oriented companies are expected to perform well, due to planned increases in production by Boeing and Airbus, on both legacy and new aircraft. As such, after a solid performance in 2011, the commercial aerospace business is expected to continue its strong growth in 2012. Industry experts also expect a solid outlook for both regional and business jets.
Oil and Gas
Approximately 12% of our revenue is derived from the oil and gas market. We provide critical-function valves, process vessels, and control electronics to this market through our Flow Control segment as well as various metal treatment services on highly stressed metal components through our Metal Treatment segment. Our significant portfolio of advanced technologies for this market includes integrated systems technologies developed for secondary refining processes such as delayed coking, catalytic cracking, and hydrotreating, as well as a large portfolio of safety-related valve and pressure protection technologies and digital process control electronics, which provide protection throughout the entire refinery, as well as in petrochemical and other processing plants. In 2011, we expanded our offering in this market through the development of a state-of-the-art manufacturing facility to build large, thick-walled super vessels such as coke drums, fractionators, fluid catalytic cracking units, and hydrotreaters for the refining, chemical, and nuclear power industries.
The most prevalent driver impacting this market is capital spending by refiners for maintenance, upgrades, capacity expansion, safety improvements, and compliance with environmental regulations, which is experienced by both our domestic and international customers. Refiner profitability and global crude oil prices in general will impact their capital spending levels. In 2011, the oil and gas market continued to be hampered by a reduction in new capital equipment orders due to a lack of capital spending, despite a rebound in MRO activity. Crude oil prices (based on West Texas Intermediate) increased approximately 20% in 2011, due to ongoing volatility, lingering concerns stemming from Libya, and uncertainty regarding Europe’s debt crisis. Prices are forecasted to continue to grow in 2012, albeit at a much slower pace, according to the Energy Information Administration (“EIA”), as world economies recover and demand continues to outpace supply. Meanwhile, despite somewhat improved refinery margins in 2011 compared to the prior year, the significant downward trend experienced over the past 6 months along with continued tight crack spreads (the spread between light and heavy crude) have led to modest uncertainty for future refinery margins for 2012. Furthermore, lower U.S. crude oil production in 2011 led to weaker capital expenditures for downstream refining, the key segment of the oil and gas market in which we participate, driving further market uncertainty for 2012.
Looking ahead, we believe a base level of maintenance capital spending will result in continued demand for our products, in particular for our pressure-relief valve technologies and field services, as refineries opportunistically service or upgrade equipment which has been operating at full capacity in recent years. We also expect solid sales related to our recently introduced super vessels, building on solid new order activity from the latter half of 2011. As global demand begins to rebound, we anticipate increased sales of our complete coker deheading system, which includes top and bottom unheading valves, isolation valves, cutting tools, and valve automation, process control, and protection systems, which enables safer coke drum operation during the refining process. Additionally, global environmental concerns will drive incremental spending to comply with more stringent emissions standards. Longer term, as global dependence on natural resources persists, oil exploration deepens, and transport requirements widen, we anticipate additional opportunities will arise for Flow Control products. We continue to take a long-term view that energy and energy production, transmission, and consumption will provide a foundation of economic strength.
Power Generation
Approximately 19% of our revenue is derived from the commercial nuclear power generation market, where we supply a variety of highly engineered products and services, including reactor coolant pumps, control rod drive mechanisms, valves, motors, spent fuel management, containment doors, bolting solutions, and enterprise resource planning and plant process controls through our Flow Control segment. We are one of a
35

small number of companies that provides N-stamp quality assurance certification necessary for supplying nuclear plant equipment. Many of the companies that originally participated in the nuclear power plant construction market years ago have since exited this market. We provide diagnostic equipment, consulting, inspection, and testing services that support plant life extensions and power uprates on all of the 104 operating reactors in the U.S., as well as operating reactors located throughout the world.
According to the NRC, nuclear power comprises approximately 20% of all the electric power produced in the United States, with 104 reactors operating across 65 nuclear power plants in 31 states. Our strong growth in recent years is a result of the U.S. plant recertification process. Nearly all of the operating U.S. nuclear power plants have applied for or will be applying for plant life extensions as they reach the end of their current 40-year operating lives. As of December 31, 2011, 71 reactors have received plant life extensions, applications from 15 additional reactors have been submitted and are pending approval, and letters of intent to apply have been submitted from 17 more reactors with expected application submittal dates from 2012 through 2017.
Additionally, as assessments and analysis from the events at Fukushima drive safety and reliability improvements, we expect to see increased opportunities worldwide for our vast portfolio of advanced nuclear technologies that are specifically designed to enhance plant safety, fire safety, seismic design and controls, spent fuel storage, backup site power, and also comply with other regulatory requirements on existing plants.
In addition to plant recertifications, there are several emerging factors that could precipitate an expansion in global commercial nuclear power demand over the next several years. The Energy Information Administration forecasts that worldwide total energy consumption is expected to grow by 53% between 2008 and 2035, increasing at an average annual rate of 1.6%. Continued growth in global demand for electricity, especially in developing countries with limited supply such as China and India, will require increased capacity. In addition, the continued supply constraints and environmental concerns attributed to the current dependence on fossil fuels have led to a reassessment of the value of nuclear technology as the most efficient and environmentally friendly source of energy available today. As a result, we expect growth opportunities in this market both domestically and internationally, although the timing of orders remains uncertain.
Domestically, applications for 28 new reactors at 19 power plants have been submitted to the NRC. Thus far, the Westinghouse AP1000 reactor design, for which we are the sole supplier of reactor coolant pumps, has been selected for 14 of the potential new reactors. Our Flow Control segment has significant content on the AP1000 reactor, the only Generation III+ advanced design certified by the NRC.
Internationally, new nuclear plant construction is active. Currently there are approximately 63 new reactors under construction in 15 countries, 156 more planned, and another 343 proposed. In particular, China intends to expand its nuclear power capabilities significantly through the construction of new nuclear power plants over the next several years. Looking ahead, worldwide nuclear energy consumption is expected to grow at an average annual rate of 2.4% through 2035, according to the EIA, including more than 10% annual growth in China and India.
As a result, we expect to see continued solid new order activity and increased sales for our vast array of nuclear technologies supporting our operating and new build nuclear power generation businesses.
General Industrial
Approximately 14% of our revenue is derived from the general industrial market, which consists primarily of metal treatment services, analytical services, industrial sensors, and motor and machine control systems for OEMs and industrial customers, including the HVAC, automotive, construction, transportation, entertainment, and medical industries. Our performance in this market is typically sensitive to the performance of the U.S. and global economies.
For 2011, we experienced a broad increase in our general industrial market, as we benefited from the early stages of a global economic recovery, particularly in the U.S. This demand was primarily related to improved performance in sensors, and controls systems, metal treatment services, and commercial HVAC products. In particular, we had strong sales in our automotive market to both domestic and international customers, due to the increase in global auto production. Looking ahead, based on expectations for improved global economic conditions in 2012, the general industrial market is likely to experience modest growth based on higher volumes across several industries in which we participate.
36

Results of Operations
Sales
Sales increased $161 million, or 9%, in 2011, as compared with 2010, and $83 million, or 5%, in 2010, as compared with 2009. The increase in sales in 2011 primarily reflects higher volume in all segments, with the largest percent increase occurring in the Metal Treatment segment. The increase in sales in 2010 is due to higher organic sales in our Flow Control and Metal Treatment segments as well as higher incremental sales in our Motion Control segment. The first table below further depicts our sales by market, while the second table depicts the components of our sales and operating income growth.
37
Year Ended December 31,
Percent changes
2011
2010
2009
2011 vs. 2010
2010 vs. 2009
(In thousands, except percentages) Sales:
Flow Control
$ 1,060,774
$ 1,024,828
$ 985,172
4 % 4 %
Motion Control
710,037 647,031
621,038 10 %
4 %
Metal Treatment 283,319
221,275 203,480
28 % 9 %
Total sales $
2,054,130 $
1,893,134 $
1,809,690 9 %
5 %
Operating income:
Flow Control $
103,421 $
104,391 $
92,721 (1 %)
13 %
Motion Control 81,009
80,410 80,949
1 % (1 %)
Metal Treatment
43,992 25,842
19,891 70 %
30 %
Corporate and eliminations (23,466 )
(30,820 ) (24,242 )
(24 %) 27 %
Total operating income $
204,956 $
179,823 $
169,319 14 %
6 %
Interest expense (20,834 )
(22,107 ) (25,066 )
(6 %) (12 %)
Other income, net
867 579
1,006 50 %
(42 %)
Earnings before income taxes 184,989
158,295 145,259
17 % 9 %
Provision for income taxes
(54,566 ) (51,697 )
(50,038 ) 6 %
3 %
Net earnings $
130,423 $
106,598 $
95,221 22 %
12 %
New orders $
2,065,997 $
1,918,536 $
1,730,477
Backlog $
1,695,419 $
1,669,964 $
1,626,895
Year Ended December 31,
Percent changes
2011
2010
2009
2011 vs. 2010
2010 vs. 2009
(In thousands, except percentages) Defense markets:
Aerospace
$ 305,430
$ 274,861
$ 241,874
11 % 14 %
Ground
119,675 123,998
172,288 (3 %)
(28 %)
Naval 362,828
365,012 319,282
(1 %) 14 %
Other
32,305 25,901
26,305 25 %
(2 %)
Total Defense $
820,238 $
789,772 $
759,749 4 %
4 %
Commercial markets:
Aerospace $
314,580 $
242,610 $
224,404 30 %
8 %
Oil and Gas 249,494
259,450 270,619
(4 %) (4 %)
Power Generation
383,364 356,560
347,745 8 %
3 %
General Industrial 286,454
244,742 207,173
17 % 18 %
Total Commercial $
1,233,892 $
1,103,362 $
1,049,941 12 %
5 %
Total Curtiss-Wright $
2,054,130 $
1,893,134 $
1,809,690 9 %
5 %

Components of sales and operating income growth (decrease):
Year ended December 31, 2011 compared to year ended December 31, 2010
Sales
Commercial sales increased $131 million, or 12%, as compared to the prior year period, primarily due to increased sales across most of our major markets. The higher sales in the commercial aerospace, general industrial, and power generation markets were primarily due to increased demand for our metal treatment services, increased sales of flight controls on Boeing aircraft as well as our Douglas acquisition, and higher sales in support of AP1000 and other operating reactor projects. The increases were partially offset by a decline in the oil and gas market, primarily due to the timing of new orders for international capital projects.
Defense sales increased $30 million, or 4%, as compared to the prior year period, primarily due to higher sales in the aerospace defense market. Sales in the aerospace defense market improved due to increases on the V-22 Osprey program and higher sales of our embedded computing and sensing products on the Blackhawk, offset by expected decreases on the F-22. The slight decrease in sales in the ground defense market is due to lower sales on the Bradley program somewhat offset by higher sales of turret drive servo systems and ammunition handling systems to international customers. The slight decrease in sales in the naval defense market is primarily due to declines in production cycles on certain aircraft carrier programs, particularly the CVN-78 and the Electromagnetic Aircraft Launching System. These decreases were somewhat offset by increased production on the Virginia class submarine.
Operating income
Operating income increased $25 million, or 14%, as compared to the prior year period, primarily due to higher sales volume in our Metal Treatment segment resulting in improved absorption of overhead costs, as well as contributions from our 2011 acquisitions of BASF Surface Technologies and IMR Test Labs. This increase was partially offset by lower operating income and operating margins in our Flow Control segment, largely driven by a decline in international capital projects in our oil and gas business. In our Motion Control segment, higher sales volume of our sensors and controls products and ammunition handling systems contributed to improved operating income, somewhat offset by the negative impacts of unfavorable foreign currency translation as well as purchase accounting and transaction costs of our ACRA acquisition.
Non-segment operating expense
The decrease in non-segment operating expense in 2011 of $7 million, as compared to the prior year period, is primarily due to anticipated lower legal and medical expenses in the current year period.
Interest expense
Interest expense decreased $1 million in 2011, as compared to the prior year period, primarily due to lower average debt levels and interest rates for the period. In December 2011, we completed a $300 million private placement offering, which was used, in part, to pay down our revolving credit facility. The December 2011 private placement offering, less the pay down of the revolving credit facility, increased our outstanding debt levels as of December 31, 2011. However, our debt levels were lower through most of 2011 than the prior year.
Effective tax rate
Our effective tax rates for 2011 and 2010, were 29.5%, and 32.7%, respectively. The decrease in the effective tax rate in 2011, as compared to 2010, is primarily due to a $4.1 million research and development tax
38
2011 vs. 2010
2010 vs. 2009
Sales
Operating Income
Sales
Operating Income
Organic
4 %
17 %
3 %
12 %
Acquisitions/divestitures 4 %
(1 %) 2 %
0 %
Foreign currency 1 %
(2 %) 0 %
(6 %)
Total 9 %
14 % 5 %
6 %
credit recognized in the current year that did not occur in the prior year. For further information on the changes in effective tax rates, see Note 11 to the Consolidated Financial Statements.
Net earnings
Net earnings increased $24 million in 2011, as compared to the prior year period, primarily due to the higher operating income, lower interest expense, and lower effective tax rates discussed above.
Backlog and new orders
Backlog increased 2% to $1,695 million at December 31, 2011 from $1,670 million at December 31, 2010. New orders increased $147 million in 2011 as compared to the prior year period, primarily due to an increase in new orders in the power generation market that support existing nuclear operating reactors, increased demand in the oil and gas market for MRO projects, strong demand in the commercial aerospace market due to production rate increases by the OEM’s, and increased orders in the naval defense market for the CVN-79 program. Acquisitions contributed incremental new orders of $92 million to the current year.
Year ended December 31, 2010 compared to year ended December 31, 2009
Sales
Commercial sales increased $53 million or 5%, as compared to the prior year period, primarily due to increased sales in our commercial aerospace and general industrial markets. Sales in our commercial aerospace market increased due to increased demand for our sensors and controls products used on various commercial aircraft as well as the ramp-up of production on the Boeing 787 program. In addition, sales increased in our general industrial market for our industrial control and embedded computing products as well as our shot peening, heating treating, and coating services, respectively.
Defense sales increased $30 million or 4%, as compared to the prior year period, primarily due to higher sales in the aerospace and naval markets. The improvements were driven by increased sales supporting ISR applications, including the Global Hawk Unmanned Aerial Vehicle and various helicopter programs, as well as the Virginia class submarine program. The increased sales were largely offset by declines in the ground defense market, due to lower sales of embedded computing products for tanks and light armored vehicles, such as the Stryker and Bradley Fighting Vehicles, as well as lower sales due to the cancellation of the FCS program.
Operating income
Operating income increased $11 million or 6%, as compared to the prior year period, primarily due to improvements in our Flow Control and Metal Treatment segment. The improvement in our Flow Control and Metal Treatment segments were driven by both improved absorption on increased sales volumes and benefits generated from our cost reduction and restructuring programs.
Non-segment operating expense
Non-segment operating expense increased $7 million in 2010, as compared to the prior year period, primarily due to higher medical and pension expenses.
Interest expense
Interest expense decreased $3 million in 2010, as compared to the prior year period, primarily due to a reduction in our average outstanding debt, which decreased 11%, mainly due to making additional payments on our revolver.
Effective tax rate
Our effective tax rates for 2010 and 2009 were 32.7%, and 34.4%, respectively. The lower effective tax rate in 2010, as compared to 2009, is primarily due to foreign tax credits that were generated by a repatriation
39

of cash from certain foreign locations in 2010. For further information on the changes in effective tax rates, see Note 11 to the Consolidated Financial Statements.
Net earnings
Net earnings increased $11 million in 2010, as compared to the prior year period, primarily due to higher operating income, lower interest expense, and lower effective tax rates discussed above.
Backlog and new orders
Backlog increased 3% to $1,670 million at December 31, 2010 from $1,627 million at December 31, 2009. New orders increased $188 million in 2010, as compared to the prior year period. The increase is attributable to a large number of orders, distributed across our ground defense, aerospace defense, commercial aerospace, and oil and gas markets, partially offset by the timing of new orders on long-term naval defense contracts. In 2010, acquisitions contributed incremental new orders of $34 million.
RESULTS BY BUSINESS SEGMENT
Flow Control
Components of sales and operating income growth (decrease):
Year ended December 31, 2011 compared to year ended December 31, 2010
Sales
Sales increased $36 million, or 4%, year-over-year, due to the incremental contributions from acquisitions as well as increased sales in the power generation, commercial aerospace, and general industrial markets. The increased sales in the power generation market was due to progress on the AP1000 domestic and China reactor projects as well as increased product demand on domestic operating reactors. In addition, higher sales of our commercial heating, ventilation, and air conditioning products contributed to the increase in our general industrial market. Our acquisition of Douglas, which expands our presence in the commercial aerospace market, contributed $22 million of sales to this market in 2011. These increases were partially offset by a decline in the oil and gas market due to delays in international spending on capital projects.
Sales in the defense market decreased slightly due to declines in production cycles on certain aircraft carrier programs, particularly the CVN-78 and the Electromagnetic Aircraft Launching System. These decreases were somewhat offset by increased production cycles on the Virginia class submarine, Advanced Arresting Gear, and CVN-79 aircraft carrier programs.
40
Year Ended December 31,
Percent Changes
2011
2010
2009
2011 vs. 2010
2010 vs. 2009
(In thousands, except percentages) Sales
$ 1,060,774
$ 1,024,828
$ 985,172
4 % 4 %
Operating income
103,421 104,391
92,721 (1 %)
13 %
Operating margin 9.7 %
10.2 % 9.4 %
(50 )bps 80 bps
New orders
$ 1,072,969
$ 987,544
$ 979,755
9 % 1 %
Backlog
$ 1,154,147
$ 1,148,712
$ 1,182,184
0 % (3 %)
2011 vs. 2010
2010 vs. 2009
Sales
Operating Income
Sales
Operating Income
Organic 1 %
0 % 4 %
15 %
Acquisitions/divestitures 3 %
(1 %) 0 %
0 %
Foreign currency 0 %
0 % 0 %
(2 %)
Total 4 %
(1 %) 4 %
13 %

Operating income
Operating income decreased $1 million, or 50 basis points, compared to the prior year. The decrease was mainly due to under absorption of fixed overhead costs in our oil and gas division, primarily the result of delays in new capital projects with international customers as well as start-up costs relative to our super vessel business. In addition, we had certain changes to our cost estimates on long-term contracts, which had an overall minimal effect on 2011 results. Included within these changes were net additional investments of $10 million to address a localized heating issue in the reactor coolant pump (“RCP”) that we are supplying for the Westinghouse AP1000 nuclear power plants in China. The net impact of the additional investments in the RCPs was offset by cost decreases on other long-term contracts; particularly for certain U.S. Naval and Aircraft carrier programs, as progressive improvements in production resulted in realized cost decreases. As the revenue related to long-term contracts is recorded on the percentage-of-completion method, the cumulative effect of changes to estimated total contract costs were recognized in the current year. In our other major markets, particularly nuclear power, operating income improved primarily due to higher sales volume and our cost containment efforts.
Backlog and new orders
Backlog was essentially flat as compared to the prior year period. New orders increased $85 million, as compared to the prior year period, primarily due to higher orders in the power generation market that support existing nuclear operating reactors as well as increased demand in the oil and gas market for MRO projects. Acquisitions contributed $35 million of incremental new orders to the current period.
Year ended December 31, 2010 compared to year ended December 31, 2009
Sales
Sales increased $40 million, or 4%, year-over year, largely due to increased sales in the defense, power generation, and general industrial markets, partially offset by a decrease in the oil and gas market.
The increase in sales in our defense markets was driven by increases in production on the Virginia class submarine programs due to the advanced procurement for the ramp up in production from one to two submarines per year. In addition, we had increases in production on the CVN-79 Ford class aircraft carrier programs, in particular pumps and generators, as well as increased sales of our helicopter handling systems. These increases in naval defense were partially offset by lower sales on the CVN-78 Ford class aircraft carrier program, as our efforts shift toward the CVN-79, and a reduction in production on the DDG1000 destroyer program as we completed the third and final ship in the fourth quarter of 2010.
Our commercial markets were relatively flat from the prior year period, as growth in our power generation and general industrial markets were offset by declines in the oil and gas market. In our power generation market, we continued to experience increased demand for upgrades and plant maintenance on domestic nuclear reactors as well as increases in our domestic sales of our next-generation reactor coolant pumps for the AP1000 nuclear reactors; however, these increases were largely offset by lower AP1000 sales in China. The growth in our general industrial market was mainly due to higher demand for our industrial control products due to the timing of order placement in the HVAC industry. Within our oil and gas market, we experienced a decrease in domestic sales of our engineered process vessels and continued to experience delays in new order placement for our traditional valve products; however, these declines were somewhat offset by an increase for our coker valve products in the international market.
Operating income
Operating income increased $12 million, or 13%, mainly due to improved absorption on increased sales volume and benefits generated by our cost reduction and restructuring programs. These improvements were somewhat offset by strategic investments in the AP1000 program and consolidation costs in our oil and gas business. Acquisitions had a minimal impact on our operating income in the current year, while foreign currency translation had an unfavorable impact of $2 million.
41
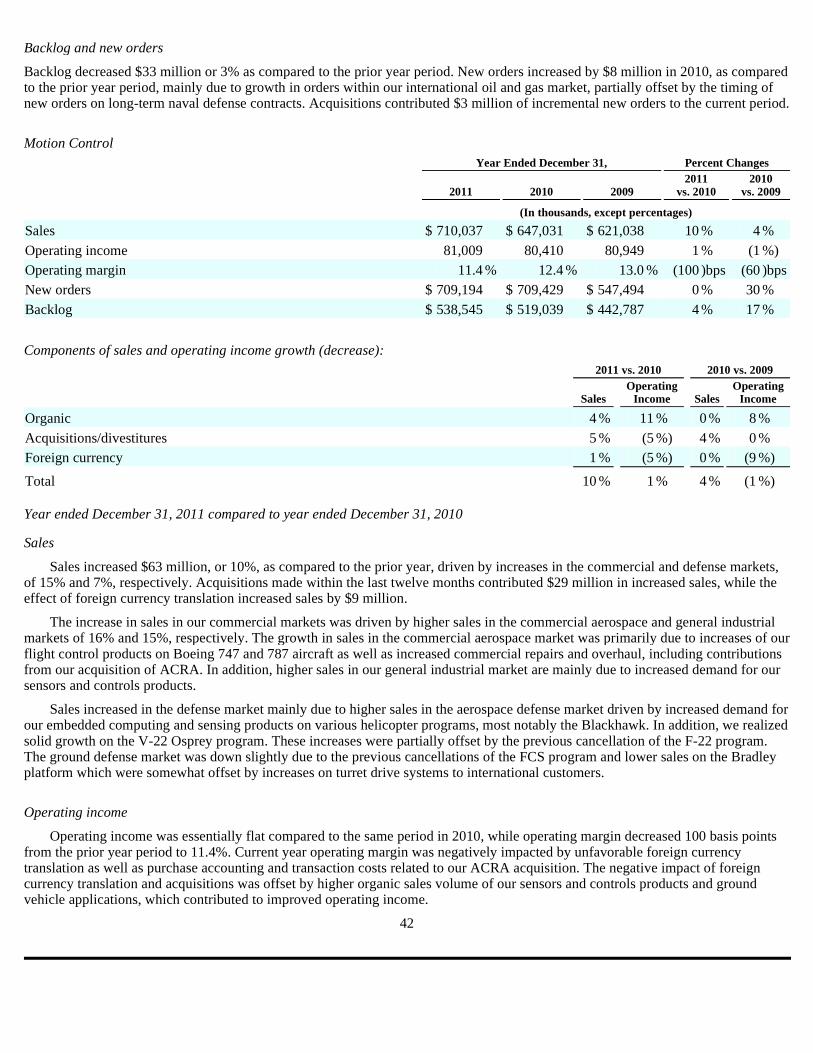
Backlog and new orders
Backlog decreased $33 million or 3% as compared to the prior year period. New orders increased by $8 million in 2010, as compared to the prior year period, mainly due to growth in orders within our international oil and gas market, partially offset by the timing of new orders on long-term naval defense contracts. Acquisitions contributed $3 million of incremental new orders to the current period.
Motion Control
Components of sales and operating income growth (decrease):
Year ended December 31, 2011 compared to year ended December 31, 2010
Sales
Sales increased $63 million, or 10%, as compared to the prior year, driven by increases in the commercial and defense markets, of 15% and 7%, respectively. Acquisitions made within the last twelve months contributed $29 million in increased sales, while the effect of foreign currency translation increased sales by $9 million.
The increase in sales in our commercial markets was driven by higher sales in the commercial aerospace and general industrial markets of 16% and 15%, respectively. The growth in sales in the commercial aerospace market was primarily due to increases of our flight control products on Boeing 747 and 787 aircraft as well as increased commercial repairs and overhaul, including contributions from our acquisition of ACRA. In addition, higher sales in our general industrial market are mainly due to increased demand for our sensors and controls products.
Sales increased in the defense market mainly due to higher sales in the aerospace defense market driven by increased demand for our embedded computing and sensing products on various helicopter programs, most notably the Blackhawk. In addition, we realized solid growth on the V-22 Osprey program. These increases were partially offset by the previous cancellation of the F-22 program. The ground defense market was down slightly due to the previous cancellations of the FCS program and lower sales on the Bradley platform which were somewhat offset by increases on turret drive systems to international customers.
Operating income
Operating income was essentially flat compared to the same period in 2010, while operating margin decreased 100 basis points from the prior year period to 11.4%. Current year operating margin was negatively impacted by unfavorable foreign currency translation as well as purchase accounting and transaction costs related to our ACRA acquisition. The negative impact of foreign currency translation and acquisitions was offset by higher organic sales volume of our sensors and controls products and ground vehicle applications, which contributed to improved operating income.
42
Year Ended December 31,
Percent Changes
2011
2010
2009
2011 vs. 2010
2010 vs. 2009
(In thousands, except percentages) Sales
$ 710,037
$ 647,031
$ 621,038
10 % 4 %
Operating income
81,009 80,410
80,949 1 %
(1 %)
Operating margin 11.4 %
12.4 % 13.0 %
(100 )bps (60 )bps
New orders
$ 709,194
$ 709,429
$ 547,494
0 % 30 %
Backlog
$ 538,545
$ 519,039
$ 442,787
4 % 17 %
2011 vs. 2010
2010 vs. 2009
Sales
Operating Income
Sales
Operating Income
Organic 4 %
11 % 0 %
8 %
Acquisitions/divestitures 5 %
(5 %) 4 %
0 %
Foreign currency 1 %
(5 %) 0 %
(9 %)
Total 10 %
1 % 4 %
(1 %)

Backlog and new orders
Backlog increased 4% to $539 million at December 31, 2011 from $519 million at December 31, 2010. New orders were flat, as compared to the prior year period, primarily due to incremental orders from acquisitions of $27 million, offset by the timing of new orders on our embedded computing products.
Year ended December 31, 2010 compared to year ended December 31, 2009
Sales
Sales increased $26 million, or 4%, as compared to the prior year, mainly due to the incremental effects of acquisitions of $24 million. Increased sales in our general industrial, commercial aerospace and aerospace defense market were largely offset by a decrease in our ground defense market.
The increase in sales in our general industrial market was due to demand for both embedded computing and controller products to a broad range of customers, while the increased sales in our commercial aerospace market is the result of increased demand for our sensors and controls products on commercial aircraft as well as higher sales of flight controls on the Boeing 787 series aircraft. Offsetting the positive performance in these commercial markets was a decline in sales in our defense markets, primarily due to a decrease in sales in our ground defense market. The decrease in the ground defense market was driven by both the cancellation of the FCS program and by lower sales of embedded computing products for tanks and light armored vehicles, such as the Stryker and Bradley Fighting Vehicles. This decrease was somewhat offset by an increase in the aerospace defense market driven primarily by higher sales for our embedded computing products on the Global Hawk Program as well as various integrated sensing products on international aircraft and helicopter programs.
Operating income
Operating income was essentially flat year-over-year as improved absorption on increased sales volume in our commercial markets and benefits generated from our cost reduction and restructuring programs were offset by unfavorable foreign currency translation. Our 2010 acquisitions had a minimal impact on current year operating income.
Backlog and new orders
Backlog increased 17% to $519 million at December 31, 2010 from $443 million at December 31, 2009. New orders increased by $162 million, as compared to the prior year period, primarily due to a large number of orders distributed across our commercial aerospace, ground defense, and aerospace defense markets. Acquisitions contributed $32 million of incremental new orders to the current period.
Metal Treatment
Components of sales and operating income growth (decrease):
43
Year Ended December 31,
Percent Changes
2011
2010
2009
2011 vs. 2010
2010 vs. 2009
(In thousands, except percentages) Sales
$ 283,319
$ 221,275
$ 203,480
28 % 9 %
Operating income
43,992 25,842
19,891 70 %
30 %
Operating margin 15.5 %
11.7 % 9.8 %
380 bps 190 bps
New orders
$ 283,834
$ 221,563
$ 203,228
28 % 9 %
2011 vs. 2010
2010 vs. 2009
Sales
Operating Income
Sales
Operating Income
Organic 13 %
57 % 9 %
32 %
Acquisitions 13 %
10 % 0 %
0 %
Foreign currency 2 %
3 % 0 %
(2 %)
Total 28 %
70 % 9 %
30 %

Year ended December 31, 2011 compared to year ended December 31, 2010
Sales
Sales increased $62 million, or 28%, from the prior year, due to increased demand across all of our major lines of business and markets, particularly for our shot peening and coatings services to commercial markets. Sales in the commercial aerospace and general industrial market increased 29% and 23%, respectively. Acquisitions and the effects of foreign currency translation contributed $30 million and $4 million, respectively, to current year sales, which accounted for over half of the sales increase.
Operating income
Operating income increased $18 million, or 70%, from the prior year and was favorably impacted by approximately $3 million from acquisitions and the effects of foreign currency translation. Excluding these items, operating margin increased to 16.2%, a 450 basis point improvement over the prior year. The improvement was driven primarily by increased sales volume resulting in favorable absorption of fixed overhead costs, mainly in our shot peening and coatings businesses.
New orders
New orders increased $62 million, from the prior year, due to increased orders for domestic and international shot peening services. Acquisitions contributed $30 million of new orders to the current period.
Year ended December 31, 2010 compared to year ended December 31, 2009
Sales increased $18 million, or 9%, from the prior year, mainly due to an increase in sales to the general industrial market of 22%. The increase in sales in the general industrial market was mainly the result of increases in demand for shot peening, heat treating, and coating services.
Operating income
Operating income increased $6 million, or 30%, compared to the same period in 2009, mainly due to benefits generated by our cost reduction and restructuring programs, which were partially offset by higher compensation expenses and start-up costs for expansion into international markets.
New orders
New orders increased $18 million, from the prior year, primarily due to increased orders for domestic and international shot peening services.
Liquidity and Capital Resources
Sources and Uses of Cash
We derive the majority of our operating cash inflow from receipts on the sale of goods and services and cash outflow for the procurement of materials and labor; cash flow is therefore subject to market fluctuations and conditions. A substantial portion of our business is in the defense sector, which is characterized by long-term contracts. Most of our long-term contracts allow for several billing points (progress or milestone) that provide us with cash receipts as costs are incurred throughout the project rather than upon contract completion, thereby reducing working capital requirements. In some cases, these payments can exceed the costs incurred on a project.
44

Operating Activities
Our working capital was $662 million at December 31, 2011, an increase of $190 million from the working capital at December 31, 2010, of $472 million. Excluding the impact of cash, acquisitions, and divestitures, our working capital increased $43 million. This increase, excluding the impact of working capital changes from our acquisitions and divestitures, was caused mainly by an increase in accounts receivable of $78 million and an increase in inventory of $23 million, offset by an increase in deferred revenue of $52 million. The increase in accounts receivable is the result of both higher trade receivables and unbilled receivables on long-term contracts. The increase in inventory is mainly due to a build up for future sales, stocking of new programs, and the purchase of long-lead time materials, while the increase in deferred revenue is primarily due to collection of advanced payments.
During the twelve months ended 2011, we contributed $35 million to the Curtiss-Wright Pension Plan. We expect to make contributions to the Curtiss-Wright Pension Plan of approximately $45 million in 2012.
Investing Activities
Capital Expenditures
Our capital expenditures were $85 million in 2011, $53 million in 2010, and $76 million in 2009. The increase in capital expenditures in 2011, as compared to 2010, was driven largely by our facility expansions within our oil and gas and commercial aerospace businesses. Capital expenditures relate primarily to new and replacement machinery and equipment, the expansion of new product lines within the business segments, and the construction of new facilities or upgrade of existing facilities.
Acquisitions of Businesses
During 2011, 2010, and 2009 we acquired eight, two, and five businesses, respectively, and expect to continue to seek acquisitions that are consistent with our long-term growth strategy. A combination of cash resources, funds available under our credit agreement, and proceeds from our Senior Notes were utilized to fund our acquisitions, which totaled $178 million and $42 million in 2011 and 2010, respectively. As indicated in Note 2 to the Consolidated Financial Statements, some of our acquisition agreements contain purchase price adjustments and contingent payments, such as potential earn-out payments and working capital adjustments. Additional acquisitions will depend, in part, on the availability of financial resources at a cost of capital that meet our stringent criteria. As such, future acquisitions, if any, may be funded through use of our cash and cash equivalents, through additional financing available under the credit agreement, or through new financing alternatives.
Financing Activities
Debt Issuances
On December 8, 2011, we issued $300 million of Senior Notes (the “2011 Notes”). The 2011 Notes consist of $100 million of 3.84% Senior Notes that mature on December 1, 2021 and $200 million of 4.24% Senior Series Notes that mature on December 1, 2026. The 2011 Notes are senior unsecured obligations, equal in right of payment to our existing senior indebtedness. We, at our option, can prepay at any time all or any part of our 2011 Notes, subject to a make-whole payment in accordance with the terms of the Note Purchase Agreement. In connection with our 2011 Notes, we paid customary fees that have been deferred and are being amortized over the term of our 2011 Notes. We are required under the Note Purchase Agreement to maintain certain financial ratios, the most restrictive of which is a debt to capitalization limit of 60%. The 2011 Notes
45
December 31, 2011
December 31,
2010
Working Capital $
661,750 $
472,088 Ratio of Current Assets to Current Liabilities
2.3 to 1 2.1 to 1
Cash and Cash Equivalents $
194,387 $
68,119 Days Sales Outstanding
54 days 44 days
Inventory Turns 4.6
4.5

also contain a cross default provision with our other senior indebtedness. As of December 31, 2011, we were in compliance with all covenants.
The proceeds of the 2011 Notes were used to reduce the outstanding indebtedness under the Company’s revolving credit facilities and for general corporate purposes. The remaining proceeds maybe used for funding working capital, capital expenditures, repurchases of stock, and acquisitions.
In January 2012, we entered into three fixed-to-floating interest rate swap agreements to convert the interest payments of the $200 million, 4.24% notes, due December 1, 2026, from a fixed rate to a floating interest rate based on 1-Month LIBOR plus a 2.02% spread. In addition, we entered into one fixed-to-floating interest rate swap agreement to convert $25 million of the $100 million, 3.84% notes, due December 1, 2021, from a fixed rate to a floating interest rate based on 1-month LIBOR plus a 1.9% spread.
On August 10, 2007, the Company and certain of its subsidiaries amended and refinanced its existing credit facility and entered into a Second Amended and Restated Credit Agreement (“Credit Agreement”). The proceeds available under the Credit Agreement are to be used for working capital, internal growth initiatives, funding of future acquisitions, and general corporate purposes. Our available credit under the credit facility increased from $400 million to $425 million from a syndicate of banks, led by Bank of America, N.A. and JP Morgan Chase Bank, N.A. as the co-arrangement banks. The Credit Agreement also contains an accordion feature that can expand the overall credit line to a maximum aggregate amount of $600 million. The consortium membership has remained relatively the same. The Credit Agreement extended the maturity from July 23, 2009 to August 10, 2012, at which time all amounts then outstanding under the Credit Agreement will be due and payable. In addition, the Credit Agreement provides for improved pricing and more favorable covenant terms, reduced facility fees, and increased availability of the facility for letters of credit. Borrowings under the Credit Agreement bear interest at a floating rate based on market conditions. In addition, our interest rate and level of facility fees are dependent on certain financial ratio levels, as defined in the Credit Agreement. We are subject to annual facility fees on the commitments under the Credit Agreement. In connection with the Credit Agreement, we paid customary transaction fees that have been deferred and are being amortized over the term of the Credit Agreement. We are required under the Credit Agreement to maintain certain financial ratios and meet certain financial tests, the most restrictive of which is a debt to capitalization limit of 60% and a cross default provision with our other senior indebtedness. As of December 31, 2011, we were in compliance with all covenants and had the flexibility to issue additional debt of approximately $1.2 billion without exceeding the covenant limit defined in the Credit Agreement. We had $0 and $110 million in borrowings outstanding (excluding letters of credit) under the Credit Agreement at December 31, 2011 and December 31, 2010, respectively. The unused credit available under the Credit Agreement at December 31, 2011 was $373 million. The Corporation believes that its Credit Agreement with the bank consortium provides sufficient short-term access to financing should our operating cash flows be insufficient to fund our operations.
On December 1, 2005, we issued $150 million of 5.51% Senior Series Notes (the “2005 Notes”). Our 2005 Notes mature on December 1, 2017 and are senior unsecured obligations, equal in right of payment to our existing senior indebtedness. We, at our option, can prepay at any time all or any part of our 2005 Notes, subject to a make-whole payment in accordance with the terms of the Note Purchase Agreement. In connection with our 2005 Notes, we paid customary fees that have been deferred and are being amortized over the term of our 2005 Notes. We are required under the Note Purchase Agreement to maintain certain financial ratios, the most restrictive of which is a debt to capitalization limit of 60%. The note also contains a cross default provision with our other senior indebtedness. As of December 31, 2011, we were in compliance with all covenants.
On September 25, 2003 we issued $200 million of Senior Notes (the “2003 Notes”). The 2003 Notes consist of $75 million of 5.13% Senior Notes that matured and were repaid on September 25, 2010 and $125 million of 5.74% Senior Notes that mature on September 25, 2013. Our 2003 Notes are senior unsecured obligations and are equal in right of payment to our existing senior indebtedness. We, at our option, can prepay at any time all or any part of our 2003 Notes, subject to a make-whole payment in accordance with the terms of the Note Purchase Agreement. In connection with our 2003 Notes, we paid customary fees that have been deferred and are being amortized over the terms of the 2003 Notes. We are required under the Note Purchase Agreement to maintain certain financial ratios, the most restrictive of which is a debt to capitalization limit of 60% and a cross default provision with our other senior indebtedness. As of December 31, 2011, we were in compliance with all covenants.
46
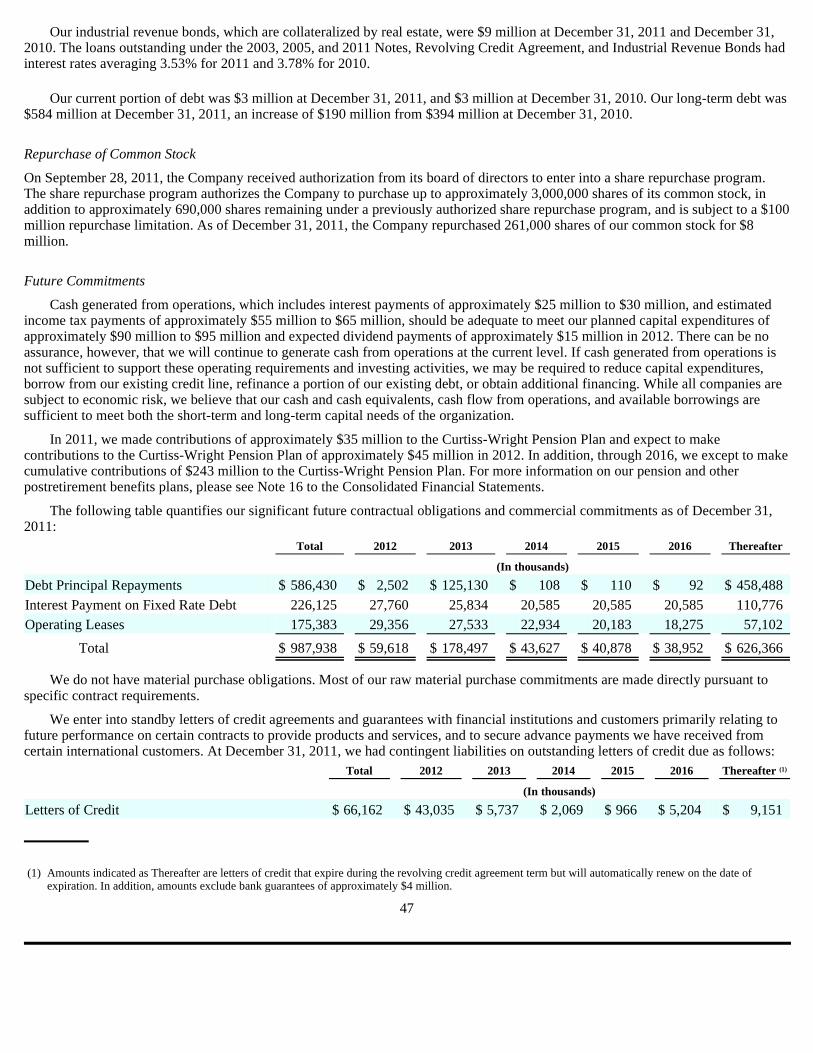
Our industrial revenue bonds, which are collateralized by real estate, were $9 million at December 31, 2011 and December 31, 2010. The loans outstanding under the 2003, 2005, and 2011 Notes, Revolving Credit Agreement, and Industrial Revenue Bonds had interest rates averaging 3.53% for 2011 and 3.78% for 2010.
Our current portion of debt was $3 million at December 31, 2011, and $3 million at December 31, 2010. Our long-term debt was $584 million at December 31, 2011, an increase of $190 million from $394 million at December 31, 2010.
Repurchase of Common Stock
On September 28, 2011, the Company received authorization from its board of directors to enter into a share repurchase program. The share repurchase program authorizes the Company to purchase up to approximately 3,000,000 shares of its common stock, in addition to approximately 690,000 shares remaining under a previously authorized share repurchase program, and is subject to a $100 million repurchase limitation. As of December 31, 2011, the Company repurchased 261,000 shares of our common stock for $8 million.
Future Commitments
Cash generated from operations, which includes interest payments of approximately $25 million to $30 million, and estimated income tax payments of approximately $55 million to $65 million, should be adequate to meet our planned capital expenditures of approximately $90 million to $95 million and expected dividend payments of approximately $15 million in 2012. There can be no assurance, however, that we will continue to generate cash from operations at the current level. If cash generated from operations is not sufficient to support these operating requirements and investing activities, we may be required to reduce capital expenditures, borrow from our existing credit line, refinance a portion of our existing debt, or obtain additional financing. While all companies are subject to economic risk, we believe that our cash and cash equivalents, cash flow from operations, and available borrowings are sufficient to meet both the short-term and long-term capital needs of the organization.
In 2011, we made contributions of approximately $35 million to the Curtiss-Wright Pension Plan and expect to make contributions to the Curtiss-Wright Pension Plan of approximately $45 million in 2012. In addition, through 2016, we except to make cumulative contributions of $243 million to the Curtiss-Wright Pension Plan. For more information on our pension and other postretirement benefits plans, please see Note 16 to the Consolidated Financial Statements.
The following table quantifies our significant future contractual obligations and commercial commitments as of December 31, 2011:
We do not have material purchase obligations. Most of our raw material purchase commitments are made directly pursuant to specific contract requirements.
We enter into standby letters of credit agreements and guarantees with financial institutions and customers primarily relating to future performance on certain contracts to provide products and services, and to secure advance payments we have received from certain international customers. At December 31, 2011, we had contingent liabilities on outstanding letters of credit due as follows:
Total
2012
2013
2014
2015
2016
Thereafter
(In thousands) Debt Principal Repayments
$ 586,430
$ 2,502
$ 125,130
$ 108
$ 110
$ 92
$ 458,488
Interest Payment on Fixed Rate Debt 226,125
27,760 25,834
20,585 20,585
20,585 110,776
Operating Leases 175,383
29,356 27,533
22,934 20,183
18,275 57,102
Total $
987,938 $
59,618 $
178,497 $
43,627 $
40,878 $
38,952 $
626,366
Total
2012
2013
2014
2015
2016
Thereafter (1)
(In thousands) Letters of Credit
$ 66,162
$ 43,035
$ 5,737
$ 2,069
$ 966
$ 5,204
$ 9,151
47
(1)
Amounts indicated as Thereafter are letters of credit that expire during the revolving credit agreement term but will automatically renew on the date of expiration. In addition, amounts exclude bank guarantees of approximately $4 million.
Critical Accounting Estimates and Policies
Our consolidated financial statements and accompanying notes are prepared in accordance with generally accepted accounting principles in the United States of America. Preparing consolidated financial statements requires us to make estimates and assumptions that affect the reported amounts of assets, liabilities, revenues, and expenses. These estimates and assumptions are affected by the application of our accounting policies. Critical accounting policies are those that require application of management’s most difficult, subjective, or complex judgments, often as a result of the need to make estimates about the effects of matters that are inherently uncertain and may change in subsequent periods. We believe that the following are some of the more critical judgment areas in the application of our accounting policies that affect our financial condition and results of operations:
Revenue Recognition
The realization of revenue refers to the timing of its recognition in our accounts and is generally considered realized or realizable and earned when the earnings process is substantially complete and all of the following criteria are met: 1) persuasive evidence of an arrangement exists; 2) delivery has occurred or services have been rendered; 3) our price to our customer is fixed or determinable; and 4) collectability is reasonably assured.
We record sales and related profits on production and service type contracts as units are shipped and title and risk of loss have transferred or as services are rendered. This method is used in our Metal Treatment segment and in some of the business units within the Motion Control and Flow Control segments that serve commercial markets.
For certain contracts in our Flow Control and Motion Control segments that require performance over an extended period before deliveries begin, sales and estimated profits are recorded by applying the percentage-of-completion method of accounting. The percentage-of-completion method of accounting is used primarily for our defense contracts and certain long-term commercial contracts. This method recognizes revenue and profit as the contracts progress towards completion. For certain contracts that contain a significant number of performance milestones, as defined by the customer, sales are recorded based upon achievement of these performance milestones. The performance milestone method is an output measure of progress towards completion made in terms of results achieved. For certain fixed price contracts, where none or a limited number of milestones exist, the cost-to-cost method is used, which is an input measure of progress toward completion. Under the cost-to-cost input method, sales and profits are recorded based on the ratio of costs incurred to an estimate of costs at completion. Under our percentage-of-completion methods of accounting, a single estimated total profit margin is used to recognize profit for each contract over its entire period of performance.
Application of percentage-of-completion methods of revenue recognition requires the use of reasonable and dependable estimates of the future material, labor, and overhead costs that will be incurred and a disciplined cost estimating system in which all functions of the business are integrally involved. These estimates are determined based upon industry knowledge and experience of our engineers, project managers, and financial staff. These estimates are significant and reflect changes in cost and operating performance throughout the contract and could have a significant impact on our operating performance. Adjustments to original estimates for contract revenue, estimated costs at completion, and the estimated total profit are often required as work progresses throughout the contract and more information is obtained, even though the scope of work under the contract may not change. These changes are recorded on a cumulative basis in the period they are determined to be necessary.
Under the percentage-of-completion method of accounting, provisions for estimated losses on uncompleted contracts are recognized in the period in which the likelihood of such losses are determined. However, costs associated with costs deferred in anticipation of future contract sales and certain loss development contracts may be deferred if follow-on production orders are deemed probable. Amounts representing contract change orders are included in revenue only when they can be estimated reliably and their realization is reasonably assured. Certain contracts contain provisions for the redetermination of price and, as such, management defers a portion of the revenue from those contracts until such time as the price has been finalized.
48

Inventory
Inventory costs include materials, direct labor, and purchasing and manufacturing overhead costs, which are stated at the lower of cost or market, where market is limited to the net realizable value. We estimate the net realizable value of our inventories and establish reserves to reduce the carrying amount of these inventories to net realizable value, as necessary. We continually evaluate the adequacy of the inventory reserves by reviewing historical scrap rates, on-hand quantities as compared with historical and projected usage levels, and other anticipated contractual requirements. The stated inventory costs are also reflective of the estimates used in applying the percentage-of-completion revenue recognition method.
We purchase materials for the manufacture of components for sale. The decision to purchase a set quantity of a particular item is influenced by several factors including: current and projected price, future estimated availability, existing and projected contracts to produce certain items, and the estimated needs for our businesses.
For certain of our long-term contracts, we utilize progress billings, which represent amounts billed to customers prior to the delivery of goods and services and are recorded as a reduction to inventory and receivables. Amounts are first applied to unbilled receivables and any remainder is then applied to inventory. Progress billings are generally based on costs incurred, including direct costs, overhead, and general and administrative costs.
Pension and Other Postretirement Benefits
In consultation with our actuaries, we determine the appropriate assumptions for use in determining the liability for future pension and other postretirement benefits. The most significant of these assumptions include the number of employees who will receive benefits, their tenure, their salary levels, their projected mortality, expected return on plan assets, the discount rates used to determine plan obligations, and the trends in the costs of medical and other health care benefits in the case of the postretirement benefit obligations. Changes in these assumptions, if significant in future years, may have an effect on our pension and postretirement expense, associated pension and postretirement assets and liabilities, and our annual cash requirements to fund these plans.
The discount rate used to determine the plan benefit obligations as of December 31, 2011, and the annual periodic costs for 2012, was reduced from 5.25% to 4.5% for the Curtiss-Wright Pension Plan and the EMD postretirement benefit plan to reflect current economic conditions. The rate reflects the hypothetical rate at which the projected benefit obligations could be effectively settled or paid out to participants on that date. We determine our discount rate utilizing selected bond yield curves developed by our actuaries, by using the rates of return on high-quality, fixed-income corporate bonds available at the measurement date with maturities that match the plan’s expected cash outflows for benefit payments. The discount rate for the Curtiss-Wright Restoration and postretirement benefit plans decreased to 4.5% and 3.75%, respectively, in 2011 to reflect the shorter duration of liabilities of these plans. These changes caused an increase to the benefit obligation. The rate of compensation increase for the pension plans remained at a weighted 4.0% based upon a graded scale of 5.0% to 3.0% that decrements as pay increases, which reflects the experience over the past years and the Company’s expectation of future salary increases. We also utilized the RP 2000 mortality tables updated with generational projections, which assumes mortality improvements into the future for the U.S. pension and postretirement benefit plans.
The overall expected return on assets assumption is based primarily on the expectations of future performance. Expected future performance is determined by weighting the expected returns for each asset class by the plan’s asset allocation. The expected returns are based on long-term capital market assumptions provided by our investment consultants. We have consistently used the 8.5% rate as a long-term overall average return, and consider this rate to be a reasonable assumption of the future long-term investment returns.
The long-term medical trend assumptions start with a current rate that is in line with expectations for the near future. The trend’s rate is then graded down over time until it reaches an ultimate rate that is close to expectations for growth in GDP. The reasoning is that medical trends cannot continue to be higher than the rate of GDP growth in the long term. The health care cost trend rates used to determine the benefit obligations of the plans as of December 31, 2011, and the annual periodic costs for 2012 were on an initial trend of 8.0% grading down to an ultimate trend of 5.5% in 2019. In 2010 we modified the EMD postretirement benefit
49

design for post-65 retirees, effectively capping the plan to future medical inflation. As a result, any change in the expectation of these rates to return to a normal level should not have a material impact on the amount of expense we recognize.
The timing and amount of future pension income or expense to be recognized each year is dependent on the demographics and expected compensation of the plan participants, the expected interest rates in effect in future years, inflation, and the actual and expected investment returns of the assets in the pension trust.
The funded status of our domestic qualified pension plan decreased by $69 million in 2011, primarily due to the decline in the discount rate used to value plan obligations at December 31, 2011. To a lesser extent, negative asset returns of 1.1% in 2011 also contributed to the decrease in funded status. Recent financial market underperformance and the lower interest rate environment have increased our future cash funding requirements and future pension expense. We contributed $35 million to this plan in 2011, and expect to contribute approximately $243 million more over a five year period beginning in 2012. Additionally, we expect pension expense of $36 million associated with this plan in 2012.
The following table reflects the impact of changes in selected assumptions used to determine the funded status of the Company’s U.S. qualified and nonqualified pension plans as of December 31, 2011 (in thousands, except for percentage point change):
See Note 16 to the Consolidated Financial Statements for further information on our pension and postretirement plans.
Environmental Reserves
We provide for environmental reserves on a site-by-site basis when, in conjunction with internal and external legal counsel, it is determined that a liability is both probable and estimable. In many cases, the liability is not fixed or capped when we first record a liability for a particular site. If only a range of potential liability can be estimated and no amount within the range is more probable than another, a reserve will be established at the low end of that range. At sites involving multiple parties, we accrue environmental liabilities based upon our expected share of the liability, taking into account the financial viability of our other jointly liable partners. Judgment is required when we make assumptions and estimate costs expected to be incurred for environmental remediation activities because of, among other factors, difficulties in assessing the extent and type of environmental remediation to be performed, the impact of complex environmental regulations and remediation technologies, and agreements between potentially responsible parties to share in the cost of remediation. In estimating the future liability and continually evaluating the sufficiency of such liabilities, we weigh certain factors including our participation percentage due to a settlement by or bankruptcy of other potentially responsible parties, a change in the environmental laws requiring more stringent requirements, an increase or decrease in the estimated time required to remediate, a change in the estimate of future costs that will be incurred to remediate the site, and changes in technology related to environmental remediation. We do not believe that continued compliance with environmental laws applicable to our operations will have a material adverse effect on our financial condition or results of operation. However, given the level of judgment and estimation used in the recording of environmental reserves, it is reasonably possible that materially different amounts could be recorded if different assumptions were used or if circumstances were to change, such as environmental regulations or remediation solution remedies.
As of December 31, 2011, our environmental reserves totaled $20.5 million, the majority of which is long term. Approximately 40.8% of the environmental reserves represent the current value of our anticipated remediation costs and are not discounted primarily due to the uncertainty of timing of expenditures. The remaining environmental reserves are discounted to reflect the time value of money since the amount and timing of cash payments for the liability are reasonably determinable. All environmental reserves exclude any potential recovery from insurance carriers or third-party contribution legal actions.
50
Assumption
Percentage Point Change
Increase in Benefit
Obligation
Increase in
Expense
Discount rate (0.25 %)
$ 13,901
$ 1,835
Rate of compensation increase 0.25 %
2,663 705
Expected return on assets (0.25 %)
— 862

Purchase Accounting
We apply the purchase method of accounting to our acquisitions. Under this method, we allocate the cost of business acquisitions to the assets acquired and liabilities assumed based on their estimated fair values at the date of acquisition, commonly referred to as the purchase price allocation. As part of the purchase price allocations for our business acquisitions, identifiable intangible assets are recognized as assets apart from goodwill if they arise from contractual or other legal rights, or if they are capable of being separated or divided from the acquired business and sold, transferred, licensed, rented, or exchanged. The purchase price is allocated to the underlying tangible and intangible assets acquired and liabilities assumed based on their respective fair market values, with any excess recorded as goodwill. We determine the fair values of such assets and liabilities, generally in consultation with third-party valuation advisors. Such fair value assessments require significant judgments and estimates such as projected cash flows, discount rates, royalty rates, and remaining useful lives that can differ materially from actual results. The analysis, while substantially complete, is finalized no later than twelve months from the date of acquisition. The fair value of assets acquired (net of cash) and liabilities assumed of our 2011 acquisitions were estimated to be $199 million and $21 million, respectively.
Goodwill
We have $759 million in goodwill as of December 31, 2011. Generally, the largest separately identifiable asset from the businesses that we acquire is the value of their assembled workforces, which includes the additional benefit received from management, administrative, marketing, business development, scientific, engineering, and technical employees of the acquired businesses. The success of our acquisitions, including the ability to retain existing business and to successfully compete for and win new business, is based on the additional benefit received from management, administrative, marketing, and business development, scientific, engineering, and technical skills and knowledge of our employees rather than on productive capital (plant and equipment, technology, and intellectual property). Therefore, since intangible assets for assembled workforces are part of goodwill, the substantial majority of the intangible assets for our acquired business acquisitions are recognized as goodwill.
The recoverability of goodwill is subject to an annual impairment test based on the estimated fair value of the underlying businesses. The test is performed in the fourth quarter, which coincides with the completion of our five-year strategic operating plan. Additionally, goodwill is tested for impairment when an event occurs or if circumstances change that would more likely than not reduce the fair value of a reporting unit below its carrying amount.
In our approach, we estimate the fair value of our reporting units considering both comparative market multiples as well as estimated discounted cash flows for the reporting units. The first step is to identify any potential impairment by comparing the carrying value of the reporting unit to its fair value. As a supplement, we conduct additional sensitivity analysis to assess the risk for potential impairment based upon changes in the key assumptions such as the discount rate, expected long-term growth rate, and cash flow projections. If an impairment is identified, the second step is to measure the impairment loss by comparing the implied fair value of goodwill with the carrying value of the goodwill on the reporting unit. Based upon the completion of our annual test, we determined that that there was no impairment of value and that all reporting units’ fair values were substantially in excess of their carrying amounts.
Other Intangible Assets
Other intangible assets are generally the result of acquisitions and consist primarily of purchased technology, customer related intangibles, and trademarks. Intangible assets are recorded at their fair values as determined through purchase accounting, based on estimates and judgments regarding expectations for the estimated future after-tax earnings and cash flows arising from follow on sales. Definite-lived intangible assets are amortized on a straight-line basis over their estimated useful lives, which range from 1 to 20 years, while indefinite-lived intangible assets are not amortized. Indefinite-lived intangible assets are reviewed for impairment annually based on the discounted future cash flows. Additionally, we review the recoverability of all intangible assets, including the related useful lives, whenever events or changes in circumstances indicate that the carrying amount might not be recoverable. We would record any impairment in the reporting period in which it has been identified. Based upon the completion of our annual impairment review, we determined that there was no impairment of value.
51

Recently Issued Accounting Pronouncements
New accounting pronouncements have been issued which are not effective until after December 31, 2011. For further discussion of new accounting standards, see Note 1 to the Consolidated Financial Statements.
Item 7A. Quantitative and Qualitative Disclosures about Market Risk.
We are exposed to certain market risks from changes in interest rates and foreign currency exchange rates as a result of our global operating and financing activities. We seek to minimize any material risks from foreign currency exchange rate fluctuations through our normal operating and financing activities and, when deemed appropriate, through the use of derivative financial instruments. We used forward foreign currency contracts to manage our currency rate exposures during the year ended December 31, 2011. In addition, in order to manage our interest rate risk, we may, from time to time, enter into interest rate swaps to balance the ratio of fixed to floating rate debt. We do not use such instruments for trading or other speculative purposes. Information regarding our accounting policy on financial instruments is contained in Note 1-L to the Consolidated Financial Statements.
The market risk for a change in interest rates relates primarily to our debt obligations. Our interest rate exposure was 98% and 70% fixed at December 31, 2011 and December 31, 2010, respectively. In order to manage our interest rate exposure we entered into three interest rate swap agreements in January 2012 to convert the interest payments of the $200 million, 4.24% notes, due December 1, 2026, from a fixed interest rate to a floating interest rate based on 1-Month LIBOR plus a 2.02% spread, and one interest rate swap agreement to convert the interest payments of $25 million of the $100 million, 3.84% notes, due December 1, 2021, from a fixed interest rate to a floating interest rate based on 1-Month LIBOR plus a 1.9% spread. The variable rates on the Industrial Revenue Bonds are based on market rates. As of December 31, 2011, a change in interest rates of 1% would have an impact on consolidated interest expense of less than $1 million. Information regarding our 2011, 2005 and 2003 Notes, Revolving Credit Agreement, and Interest Rates Swaps is contained in Note 12 to the Consolidated Financial Statements.
Although the majority of our sales, expenses, and cash flows are transacted in U.S. dollars, we do have market risk exposure to changes in foreign currency exchange rates, primarily as it relates to the value of the U.S. dollar versus the Canadian dollar, the British pound, the Euro, the Norwegian kroner, and the Swiss franc. Any significant change against the U.S. dollar in the value of the currencies of those countries in which we do business could have an effect on our business, financial condition, and results of operations. If foreign exchange rates were to collectively weaken or strengthen against the dollar by 10%, net earnings would have been reduced or increased, respectively, by approximately $5 million as it relates exclusively to foreign currency exchange rate exposures.
Financial instruments expose us to counter-party credit risk for non-performance and to market risk for changes in interest and foreign currency rates. We manage exposure to counter-party credit risk through specific minimum credit standards, diversification of counter-parties, and procedures to monitor concentrations of credit risk. We monitor the impact of market risk on the fair value and cash flows of our investments by investing primarily in investment grade interest-bearing securities, which have short-term maturities. We attempt to minimize possible changes in interest and currency exchange rates to amounts that are not material to our consolidated results of operations and cash flows.
52

Item 8. Financial Statements and Supplementary Data.
CONSOLIDATED STATEMENTS OF EARNINGS
See notes to consolidated financial statements.
53
For the years ended December 31,
2011
2010
2009
(In thousands, except per share data) Net sales
$ 2,054,130
$ 1,893,134
$ 1,809,690
Cost of sales 1,378,012
1,271,381 1,214,159
Gross profit 676,118
621,753 595,531
Research and development expenses (62,115 )
(54,131 ) (54,645 )
Selling expenses
(119,438 ) (111,773 )
(106,187 )
General and administrative expenses (289,609 )
(276,026 ) (265,380 )
Operating income 204,956
179,823 169,319
Interest expense (20,834 )
(22,107 ) (25,066 )
Other income, net
867 579
1,006
Earnings before income taxes 184,989
158,295 145,259
Provision for income taxes (54,566 )
(51,697 ) (50,038 )
Net earnings $
130,423 $
106,598 $
95,221
Net earnings per share:
Basic earnings per share $
2.81 $
2.33 $
2.10
Diluted earnings per share $
2.77 $
2.30 $
2.08
Dividends per share $
0.32 $
0.32 $
0.32
Weighted average shares outstanding:
Basic 46,372
45,823 45,237
Diluted 47,013
46,322 45,695
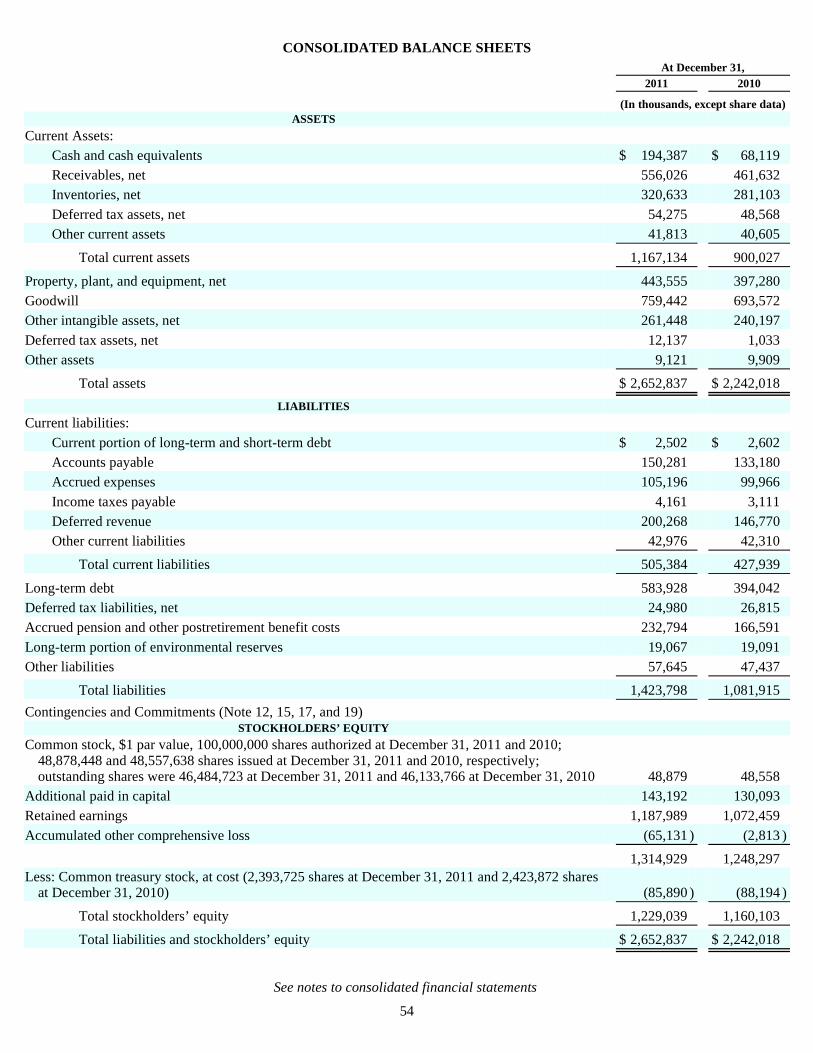
CONSOLIDATED BALANCE SHEETS
See notes to consolidated financial statements
54
At December 31,
2011
2010
(In thousands, except share data) ASSETS
Current Assets:
Cash and cash equivalents
$ 194,387
$ 68,119
Receivables, net 556,026
461,632 Inventories, net
320,633 281,103
Deferred tax assets, net 54,275
48,568 Other current assets
41,813 40,605
Total current assets 1,167,134
900,027
Property, plant, and equipment, net 443,555
397,280 Goodwill
759,442 693,572
Other intangible assets, net 261,448
240,197 Deferred tax assets, net
12,137 1,033
Other assets 9,121
9,909
Total assets $
2,652,837 $
2,242,018
LIABILITIES
Current liabilities:
Current portion of long-term and short-term debt $
2,502 $
2,602 Accounts payable
150,281 133,180
Accrued expenses 105,196
99,966 Income taxes payable
4,161 3,111
Deferred revenue 200,268
146,770 Other current liabilities
42,976 42,310
Total current liabilities 505,384
427,939
Long-term debt 583,928
394,042 Deferred tax liabilities, net
24,980 26,815
Accrued pension and other postretirement benefit costs 232,794
166,591 Long-term portion of environmental reserves
19,067 19,091
Other liabilities 57,645
47,437
Total liabilities 1,423,798
1,081,915
Contingencies and Commitments (Note 12, 15, 17, and 19)
STOCKHOLDERS’ EQUITY
Common stock, $1 par value, 100,000,000 shares authorized at December 31, 2011 and 2010; 48,878,448 and 48,557,638 shares issued at December 31, 2011 and 2010, respectively; outstanding shares were 46,484,723 at December 31, 2011 and 46,133,766 at December 31, 2010
48,879 48,558
Additional paid in capital 143,192
130,093 Retained earnings
1,187,989 1,072,459
Accumulated other comprehensive loss (65,131 )
(2,813 )
1,314,929 1,248,297
Less: Common treasury stock, at cost (2,393,725 shares at December 31, 2011 and 2,423,872 shares at December 31, 2010)
(85,890 ) (88,194 )
Total stockholders’ equity 1,229,039
1,160,103
Total liabilities and stockholders’ equity $
2,652,837 $
2,242,018


CONSOLIDATED STATEMENTS OF CASH FLOWS
For the years ended December 31,
2011
2010
2009
(In thousands) Cash flows from operating activities:
Net earnings
$ 130,423
$ 106,598
$ 95,221
Adjustments to reconcile net earnings to net cash provided by operating activities:
Depreciation and amortization 88,300
79,946 76,480
Net (gain) loss on sales and disposals or impairments of long-lived assets (670 )
1,446 1,917
Gain on bargain purchase —
— (1,937 )
Gain on divestiture
(1,298 ) —
— Deferred income taxes
3,345 2,828
(6,470 )
Share-based compensation 9,621
13,378 15,264
Changes in operating assets and liabilities, net of businesses acquired and disposed of:
Accounts receivable, net
(86,000 ) (60,208 )
9,250 Inventories, net
(23,429 ) 10,640
17,819 Progress payments
11,264 6,493
(8,573 )
Accounts payable and accrued expenses 15,628
9,925 (30,565 )
Deferred revenue
53,498 (20,913 )
28,724 Income taxes
3,917 (1,122 )
(11,326 )
Net pension and postretirement liabilities (4,234 )
24,528 19,654
Other current and long-term assets and liabilities 1,997
(1,829 ) (8,879 )
Total adjustments 71,939
65,112 101,358
Net cash provided by operating activities 202,362
171,710 196,579
Cash flows from investing activities:
Proceeds from sales and disposals of long-lived assets 2,497
744 3,789
Acquisitions of intangible assets (22 )
(1,608 ) (673 )
Additions to property, plant, and equipment
(84,831 ) (52,980 )
(75,643 )
Acquisition of businesses, net of cash acquired (178,080 )
(42,200 ) (68,623 )
Disposition of businesses
8,100 —
—
Net cash used for investing activities (252,336 )
(96,044 ) (141,150 )
Cash flows from financing activities:
Borrowings of debt 1,302,600
513,100 711,059
Principal payments on debt (1,112,814 )
(581,771 ) (762,759 )
Repurchases of company stock
(8,178 ) —
— Proceeds from exercise of share-based payments
11,746 10,560
10,557 Dividends paid
(14,893 ) (14,729 )
(14,559 )
Excess tax benefits from share-based compensation 1,343
985 378
Net cash provided by (used for) financing activities 179,804
(71,855 ) (55,324 )
Effect of exchange-rate changes on cash (3,562 )
(702 ) 4,200
Net increase in cash and cash equivalents 126,268
3,109 4,305
Cash and cash equivalents at beginning of year 68,119
65,010 60,705
Cash and cash equivalents at end of year $
194,387 $
68,119 $
65,010
Supplemental disclosure of investing activities:
Fair value of assets acquired from current year acquisitions $
204,363 $
49,939 $
81,103 Additional consideration paid on prior year acquisitions
— 1,153
1,835 Liabilities assumed from current year acquisitions
(20,501 ) (8,206 )
(12,102 )
Cash acquired (5,782 )
(686 ) (276 )

See notes to consolidated financial statements
55
Gain on bargain purchase —
— (1,937 )
Acquisition of businesses, net of cash acquired $
178,080 $
42,200 $
68,623
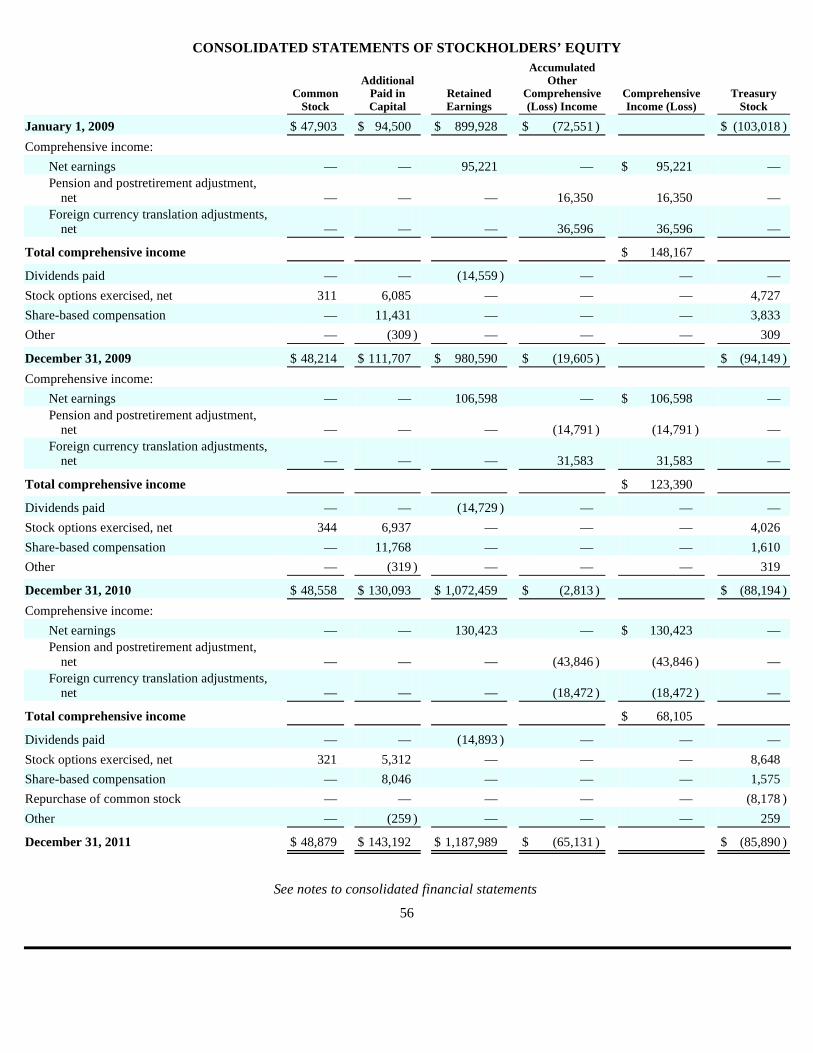
CONSOLIDATED STATEMENTS OF STOCKHOLDERS’ EQUITY
See notes to consolidated financial statements
56
Common Stock
Additional Paid in Capital
Retained Earnings
Accumulated Other
Comprehensive (Loss) Income
Comprehensive Income (Loss)
Treasury Stock
January 1, 2009 $
47,903 $
94,500 $
899,928 $
(72,551 ) $
(103,018 )
Comprehensive income:
Net earnings —
— 95,221
— $
95,221 —
Pension and postretirement adjustment, net
— —
— 16,350
16,350 —
Foreign currency translation adjustments, net
— —
— 36,596
36,596 —
Total comprehensive income $
148,167
Dividends paid —
— (14,559 )
— —
— Stock options exercised, net
311 6,085
— —
— 4,727
Share-based compensation —
11,431 —
— —
3,833 Other
— (309 )
— —
— 309
December 31, 2009 $
48,214 $
111,707 $
980,590 $
(19,605 ) $
(94,149 )
Comprehensive income:
Net earnings —
— 106,598
— $
106,598 —
Pension and postretirement adjustment, net
— —
— (14,791 )
(14,791 ) —
Foreign currency translation adjustments, net
— —
— 31,583
31,583 —
Total comprehensive income $
123,390
Dividends paid —
— (14,729 )
— —
— Stock options exercised, net
344 6,937
— —
— 4,026
Share-based compensation —
11,768 —
— —
1,610 Other
— (319 )
— —
— 319
December 31, 2010 $
48,558 $
130,093 $
1,072,459 $
(2,813 ) $
(88,194 )
Comprehensive income:
Net earnings —
— 130,423
— $
130,423 —
Pension and postretirement adjustment, net
— —
— (43,846 )
(43,846 ) —
Foreign currency translation adjustments, net
— —
— (18,472 )
(18,472 ) —
Total comprehensive income $
68,105
Dividends paid —
— (14,893 )
— —
— Stock options exercised, net
321 5,312
— —
— 8,648
Share-based compensation —
8,046 —
— —
1,575 Repurchase of common stock
— —
— —
— (8,178 )
Other
— (259 )
— —
— 259
December 31, 2011 $
48,879 $
143,192 $
1,187,989 $
(65,131 ) $
(85,890 )

NOTES TO CONSOLIDATED FINANCIAL STATEMENTS
1. SUMMARY OF SIGNIFICANT ACCOUNTING POLICIES
Curtiss-Wright Corporation and its subsidiaries (the “Corporation” or “the Company”) is a diversified multinational manufacturing and service company that designs, manufactures, and overhauls precision components and systems and provides highly engineered products and services to the aerospace, defense, automotive, shipbuilding, processing, oil, petrochemical, agricultural equipment, railroad, power generation, security, and metalworking industries. Operations are conducted through 64 manufacturing facilities and 64 metal treatment service facilities.
A. Principles of Consolidation
The consolidated financial statements include the accounts of Curtiss-Wright and its majority-owned subsidiaries. All intercompany transactions and accounts have been eliminated.
B. Use of Estimates
The financial statements of the Corporation have been prepared in conformity with accounting principles generally accepted in the United States of America (“U.S. GAAP”), which requires management to make estimates and judgments that affect the reported amount of assets, liabilities, revenue, and expenses and disclosure of contingent assets and liabilities in the accompanying financial statements. The most significant of these estimates includes the estimate of costs to complete long-term contracts under the percentage-of-completion accounting methods, the estimate of useful lives for property, plant, and equipment, cash flow estimates used for testing the recoverability of assets, pension plan and postretirement obligation assumptions, estimates for inventory obsolescence, estimates for the valuation and useful lives of intangible assets, warranty reserves, legal reserves, and the estimate of future environmental costs. Actual results may differ from these estimates.
C. Revenue Recognition
The realization of revenue refers to the timing of its recognition in the accounts of the Corporation and is generally considered realized or realizable and earned when the earnings process is substantially complete and all of the following criteria are met: 1) persuasive evidence of an arrangement exists; 2) delivery has occurred or services have been rendered; 3) the Corporation’s price to its customer is fixed or determinable; and 4) collectability is reasonably assured.
The Corporation records sales and related profits on production and service type contracts as units are shipped and title and risk of loss have transferred or as services are rendered, net of estimated returns and allowances. Sales and estimated profits under certain long-term contracts are recognized primarily under the cost-to-cost or units-of-delivery percentage-of-completion methods of accounting. Under the cost-to-cost percentage-of-completion method of accounting, profits are recorded pro rata, based upon current estimates of direct and indirect costs to complete such contracts. Under the units-of-delivery percentage-of-completion method of accounting, revenue is recognized as units are delivered to the customer. In addition, the Corporation also records sales under certain long-term government fixed price contracts upon achievement of performance milestones as specified in the related contracts. Changes in estimates of contract sales, costs, and profits are recognized using the cumulative catch- up method of accounting. This method recognizes in the current period the cumulative effect of the changes on current and prior periods. Hence, the effect of the changes on future periods of contract performance is recognized as if the revised estimate had been the original estimate. A significant change in an estimate on one or more contracts could have a material effect on the company’s consolidated financial position or results of operations. Aggregate net changes in contract estimates for 2011, 2010, or 2009 recognized using the cumulative catch-up method of accounting were not material to the consolidated statement of operations for such annual period. No discrete event or adjustments to an individual contract within the aggregate net changes in contract estimates for 2010 or 2009 was material to the consolidated statement of operations for such annual period. In 2011, the Corporation incurred unanticipated additional costs to address a localized heating issue in the reactor coolant pump (“RCP”) that we are supplying for the Westinghouse AP1000 nuclear power plants in China. The additional costs increased the estimated costs at completion which decreased consolidated operating income by $9.7 million. There were no other individual
57

significant changes in estimated contract costs at completion. Losses on contracts are provided for in the period in which the losses become determinable. The excess of the billings over cost and estimated earnings on long-term contracts is included in deferred revenue.
D. Cash and Cash Equivalents
Cash equivalents consist of money market funds and commercial paper that are readily convertible into cash, all with original maturity dates of three months or less.
E. Inventory
Inventories are stated at lower of production cost (principally average cost) or market. Production costs are comprised of direct material and labor and applicable manufacturing overhead.
F. Progress Payments
Certain long-term contracts provide for interim billings as costs are incurred on the respective contracts. Pursuant to contract provisions, agencies of the U.S. Government and other customers are granted title or a secured interest for materials and work-in-process included in inventory to the extent progress payments are received. Accordingly, these receipts have been reported as a reduction of unbilled receivables and inventories, as presented in Notes 3 and 4 to the Consolidated Financial Statements.
G. Property, Plant, and Equipment
Property, plant, and equipment are carried at cost less accumulated depreciation. Major renewals and betterments are capitalized, while maintenance and repairs that do not improve or extend the life of the asset are expensed in the period they are incurred. Depreciation is computed using the straight-line method based upon the estimated useful lives of the respective assets.
Average useful lives for property, plant, and equipment are as follows:
H. Intangible Assets
Intangible assets are generally the result of acquisitions and consist primarily of purchased technology, customer related intangibles, trademarks and service marks, and technology licenses. Definite lived intangible assets are amortized on a straight-line basis over their estimated useful lives, which range from 1 to 20 years, while indefinite lived intangible assets are not amortized. Indefinite lived intangible assets are reviewed for impairment annually based on the discounted future cash flows. See Note 7 to the Consolidated Financial Statements for further information on other intangible assets.
I. Impairment of Long-Lived Assets
The Corporation reviews the recoverability of all long-lived assets, including the related useful lives, whenever events or changes in circumstances indicate that the carrying amount of a long-lived asset might not be recoverable. If required, the Corporation compares the estimated fair value determined by either the undiscounted future net cash flows, or appraised value, to the related asset’s carrying value to determine whether there has been an impairment. If an asset is considered impaired, the asset is written down to fair value, which is based either on discounted cash flows or appraised values in the period the impairment becomes known. In 2011, the Corporation recognized a $0.2 million impairment related to one facility where it was determined that the carrying value exceeded the estimated fair value. In 2010, the Corporation recognized a $1.5 million impairment related to two facilities where it was determined that their carrying value exceeded their estimated fair value. In 2009, the Corporation recognized a $1.1 million impairment related to two facilities that were associated with a business restructuring plan.
58
Buildings and improvements
5 to 40 years Machinery, equipment, and other
3 to 15 years
J. Goodwill
Goodwill results from business acquisitions. The Corporation accounts for business acquisitions by allocating the purchase price to tangible and intangible assets and liabilities. Assets acquired and liabilities assumed are recorded at their fair values, and the excess of the purchase price over the amounts allocated is recorded as goodwill. The recoverability of goodwill is subject to an annual impairment test or whenever an event occurs or circumstances change that would more likely than not result in an impairment. The impairment test is based on the estimated fair value of the underlying businesses. Goodwill impairment tests performed as of October 31, 2011, 2010, and 2009 concluded that no impairment charges were required as of those dates. See Note 6 to the Consolidated Financial Statements for further information on goodwill.
K. Pre-Contract Costs
The Corporation, from time to time, incurs costs to begin fulfilling the statement of work under a specific anticipated contract that has yet to be obtained from a customer. If it is determined that the recoveries of these costs are probable, the costs will be capitalized, excluding any start-up costs which are expensed as incurred. When circumstances change and the contract is no longer deemed probable, the capitalized costs will be recognized in earnings. There were no costs written off in 2011, 2010, and 2009. Capitalized pre-contract costs were $0.3 million and $0.7 million at December 31, 2011 and 2010, respectively.
L. Fair Value of Financial Instruments
Accounting guidance requires certain disclosures regarding the fair value of financial instruments. Due to the short maturities of cash and cash equivalents, accounts receivable, accounts payable, and accrued expenses, the net book value of these financial instruments is deemed to approximate fair value. See Notes 8 and 12 to the Consolidated Financial Statements for further information.
M. Research and Development
The Corporation funds research and development programs for commercial products and independent research and development and bid and proposal work related to government contracts. Development costs include engineering and field support for new customer requirements. Corporation-sponsored research and development costs are expensed as incurred.
Research and development costs associated with customer-sponsored programs are capitalized to inventory and are recorded in cost of sales when products are delivered or services performed. Funds received under shared development contracts are a reduction of the total development expenditures under the shared contract and are shown net as research and development costs.
N. Environmental Costs
The Corporation establishes a reserve for a potential environmental remediation liability on a site by site basis when it concludes that a determination of legal liability is probable and the amount of the liability can be reasonably estimated based on current law and existing technologies. Such amounts, if quantifiable, reflect the Corporation’s estimate of the amount of that liability. If only a range of potential liability can be estimated and no amount within the range is more probable than another, a reserve will be established at the low end of that range. At sites involving multiple parties, the Corporation accrues environmental liabilities based upon its expected share of the liability, taking into account the financial viability of other jointly liable partners. Such reserves, which are reviewed quarterly, are adjusted as assessment and remediation efforts progress or as additional information becomes available. Approximately 41% of the Corporation’s environmental reserves as of December 31, 2011, represent the current value of anticipated remediation costs and are not discounted primarily due to the uncertainty of timing of expenditures. The remaining environmental reserves are discounted to reflect the time value of money since the amount and timing of cash payments for the liability are reliably determinable. All environmental reserves exclude any potential recovery from insurance carriers or third-party legal actions. See Note 15 to the Consolidated Financial Statements for additional information.
59
O. Accounting for Share-Based Payments
The Corporation follows the fair value based method of accounting for share-based employee compensation, which requires the Corporation to expense all share-based employee compensation. Share-based employee compensation is primarily a non-cash expense since the Corporation settles these obligations by issuing the shares of Curtiss-Wright Corporation instead of settling such obligations with cash payments.
Compensation expense for all non-qualified share options, performance shares, performance-based restricted shares, time-based restricted stock, and performance-based restricted stock units is recognized on a graded schedule over the requisite service period for the entire award based on the grant date fair value.
P. Common Stock
The Corporation is authorized to repurchase up to approximately 3,000,000 shares of its common stock, under the repurchase plan approved on September 28, 2011, in addition to approximately 690,000 shares remaining under a previously authorized share repurchase program, and is subject to a $100 million repurchase limitation. Purchases are authorized to be made from time to time in the open market or through privately negotiated transactions depending on market and other conditions, whenever management believes that the market price of the stock does not adequately reflect the true value of the Corporation and, therefore, represents an attractive investment opportunity. The shares are held at cost and reissuance is recorded at the weighted-average cost. Through December 31, 2011, the Corporation had repurchased 261,003 shares under this program at a cost of $8.2 million. There was no stock repurchased during 2010 and 2009.
Q. Earnings Per Share
The Corporation is required to report both basic earnings per share (“EPS”), based on the weighted-average number of Common shares outstanding, and diluted earnings per share, based on the basic EPS adjusted for all potentially dilutive shares issuable. The calculation of EPS is disclosed in Note 13 to the Consolidated Financial Statements.
R. Income Taxes
The Corporation accounts for income taxes using the asset and liability method. Under the asset and liability method, deferred tax assets and liabilities are recognized for future tax consequences attributable to differences between the financial statement carrying amounts of existing assets and liabilities and their respective tax bases. The effect on deferred tax assets and liabilities of a change in tax laws is recognized in the results of operations in the period the new laws are enacted. A valuation allowance is recorded to reduce the carrying amounts of deferred tax assets unless it is more likely than not that such assets will be realized.
The Corporation records amounts related to uncertain income tax positions by 1) prescribing a minimum recognition threshold a tax position is required to meet before being recognized in the financial statements and 2) the measurement of the income tax benefits recognized from such positions. The Corporation’s accounting policy is to classify uncertain income tax positions that are not expected to be resolved in one year as a non-current income tax liability and to classify interest and penalties as a component of Interest expense and General and administrative expenses, respectively. See Note 11 to the Consolidated Financial Statements for further information.
S. Foreign Currency
For operations outside the United States of America that prepare financial statements in currencies other than the U.S. dollar, the Corporation translates assets and liabilities at period-end exchange rates and income statement amounts using weighted-average exchange rates for the period. The cumulative effect of translation adjustments is presented as a component of accumulated other comprehensive income within stockholders’ equity. This balance is affected by foreign currency exchange rate fluctuations and by the acquisition of foreign entities. Gains and (losses) from foreign currency transactions are included in General and administrative expenses within the results of operations, which amounted to $(0.8) million, $(4.2) million, and $(4.7) million for the years ended December 31, 2011, 2010, and 2009, respectively.
60

T. Derivatives
Forward Foreign Exchange and Currency Option Contracts
The Corporation uses financial instruments, such as forward exchange and currency option contracts, to hedge a portion of existing and anticipated foreign currency denominated transactions. The purpose of the Corporation’s foreign currency risk management program is to reduce volatility in earnings caused by exchange rate fluctuations. All of the derivative financial instruments are recorded at fair value based upon quoted market prices for comparable instruments, with the gain or loss on these transactions recorded into earnings in the period in which they occur. These gains and (losses) are classified as General and administrative expenses in the Consolidated Statements of Earnings and amounted to $(0.7) million, $3.1 million, and $2.5 million for the years ended December 31, 2011, 2010 and 2009, respectively. The Corporation does not use derivative financial instruments for trading or speculative purposes.
Interest Rate Risks and Related Strategies
The Corporation’s primary interest rate exposure results from changes in U.S. dollar interest rates. The Corporation’s policy is to manage interest cost using a mix of fixed and variable rate debt. The Corporation periodically uses interest rate swaps to manage such exposures. Under these interest rate swaps, the Corporation exchanges, at specified intervals, the difference between fixed and floating interest amounts calculated by reference to an agreed-upon notional principal amount.
For interest rate swaps designated as fair value hedges (i.e., hedges against the exposure to changes in the fair value of an asset or a liability or an identified portion thereof that is attributable to a particular risk), changes in the fair value of the interest rate swaps offset changes in the fair value of the fixed rate debt due to changes in market interest rates.
In January 2012, the Company entered into three fixed-to-floating interest rate swap agreements to convert the interest payments of the $200 million, 4.24% notes, due December 1, 2026, and one fixed-to-floating rate interest swap agreement to convert the interest payments of the $25 million of the $100 million, 3.84% notes, due December 1, 2021, from fixed rates to a floating interest rate based on 1-month LIBOR plus a 2.02% and 1-month LIBOR plus a 1.90% spread, respectively.
U. Recently Issued Accounting Standards
Adoption of New Standards
Revenue Recognition—Milestone Method
In April 2010, new guidance was issued that provides the criteria that should be met for determining whether the milestone method of revenue recognition is appropriate, as well as the associated disclosure requirements. The new guidance clarifies that a vendor can recognize consideration that is contingent on achieving a milestone as revenue in the period in which the milestone is achieved only if the milestone meets all criteria to be considered substantive. The new guidance is effective for fiscal years beginning after June 15, 2010. The adoption of this guidance did not have a material impact on the Corporation’s results of operations or financial condition.
Revenue Arrangements with Multiple Deliverables
In September 2009, new guidance was issued on revenue arrangements with multiple deliverables. The new guidance modifies the requirements for determining whether a deliverable can be treated as a separate unit of accounting by removing the criteria that verifiable and objective evidence of fair value exists for undelivered items, establishes a selling price hierarchy to help entities allocate arrangement consideration to separate units of account, requires the relative selling price allocation method for all arrangements, and expands required disclosures. The new guidance is effective for fiscal years beginning after June 15, 2010. The adoption of this guidance did not have a material impact on the Corporation’s results of operations or financial condition.
61
Certain Revenue Arrangements That Include Software Elements
In September 2009, new guidance was issued on certain revenue arrangements that include software elements. The new guidance amended past guidance on software revenue recognition to exclude from scope all tangible products containing both software and non-software elements that function together to interdependently deliver the product’s essential functionality. The new guidance is effective for fiscal years beginning after June 15, 2010. The adoption of this guidance did not have a material impact on the Corporation’s results of operations or financial condition.
Standards Issued But Not Yet Effective
Fair Value Measurement: Amendments to Achieve Common Fair Value Measurement and Disclosure Requirements in United States of America generally accepted accounting principles (“U.S. GAAP”) and International Financial Reporting Standards (“IFRS”)
In May 2011, new guidance was issued that amends the current fair value measurement and disclosure guidance to increase transparency around valuation inputs and investment categorization. The new guidance does not extend the use of fair value accounting, but provides guidance on how it should be applied where its use is already required or permitted by other standards within U.S. GAAP or IFRS. The new guidance is effective for annual and interim reporting periods beginning on or after December 15, 2011 and is to be adopted prospectively as early adoption is not permitted. The adoption of this guidance is not expected to have a material impact on the Corporation’s results of operations or financial condition.
Other Comprehensive Income: Presentation of Comprehensive Income
In June 2011, new guidance was issued that amends the current comprehensive income guidance. The new guidance allows the option to present the total of comprehensive income, the components of net income, and the components of other comprehensive income either in a single or continuous statement of comprehensive income or in two separate but consecutive statements. The amendments in this update do not change the items that must be reported in other comprehensive income or when an item of other comprehensive income must be reclassified to net income. The new guidance is to be applied retrospectively and is effective for fiscal years, and interim periods, beginning after December 15, 2011. In December 2011, the FASB issued authoritative guidance to defer the effective date for those aspects of the guidance relating to the presentation of reclassification adjustments out of accumulated other comprehensive income. The adoption of this new guidance will not have an impact on the Corporation’s consolidated financial position, results of operations or cash flows as it only requires a change in the format of the current presentation of other comprehensive income.
Intangibles—Goodwill and Other: Testing Goodwill for Impairment
In September 2011, new guidance was issued that amends the current testing requirements of goodwill for impairment purposes. The new guidance gives companies the option to perform a qualitative assessment to first assess whether the fair value of a reporting unit is less than its carrying amount. If an entity determines it is not more likely than not that the fair value of the reporting unit is less than its carrying amount, then performing the two-step impairment test is unnecessary. The new guidance is to be applied prospectively effective for annual and interim goodwill impairment tests beginning after December 15, 2011, with early adoption permitted. The adoption of this standard is not expected to have a material impact on the Corporation’s results of operations or financial condition.
2. ACQUISITIONS AND DISPOSITIONS
The Corporation continually evaluates potential acquisitions that either strategically fit within the Corporation’s existing portfolio or expand the Corporation’s portfolio into new product lines or adjacent markets. The Corporation has completed a number of acquisitions that have been accounted for as business combinations and have resulted in the recognition of goodwill in the Corporation’s financial statements. This goodwill arises because the purchase prices for these businesses reflect the future earnings and cash flow potential in excess of the earnings and cash flows attributable to the current product and customer set at the time of acquisition. Thus, goodwill inherently includes the know-how of the assembled workforce, the ability of
62

the workforce to further improve the technology and product offerings, and the expected cash flows resulting from these efforts. Goodwill also includes the expected synergies resulting from the complementary strategic fit these businesses bring to existing operations.
In 2011, the Corporation acquired eight businesses and sold the assets of two businesses, all of which are described in more detail below. The disposition of a product line in our Motion Control segment for $3.5 million and the sale of the assets of our legacy distribution in our Flow Control segment business for $4.6 million were not reported as discontinued operations as the amounts were not considered significant. In 2010, the Corporation acquired two businesses; both of which are described in more detail below. In 2009, the Corporation acquired five businesses and disposed of one product line, with three of the acquired businesses described in more detail below. The two remaining acquisitions in 2009 had an aggregate purchase price of $5.5 million and were purchased by the Flow Control segment. The disposition of a product line in the Flow Control segment for $2.5 million was not reported as discontinued operations as the amount was not considered significant. The Corporation allocates the purchase price, including the value of identifiable intangibles with a finite life based upon analysis, including input from third party appraisals. The analysis, while substantially complete, is finalized no later than twelve months from acquisition.
The results of the acquired businesses have been included in the consolidated financial results of the Corporation from the date of acquisition in the segment indicated as follows:
FLOW CONTROL
Anatec International, Inc. and Lambert, MacGill, Thomas, Inc. (LMT)
On December 2, 2011, the Corporation acquired the assets of Anatec International, Inc, and Lambert, MacGill, Thomas, Inc.(“Anatec and LMT”) for $34.0 million in cash. The Asset Purchase Agreement contains customary representations and warranties, including a portion of the purchase price deposited into escrow as security for potential indemnification claims against the seller. Management funded the purchase from the Corporation’s revolving credit facility.
Anatec and LMT perform testing and inspection services for commercial nuclear power plants to ensure safety, operational soundness and compliance with regulatory codes. Anatec and LMT will operate within the Nuclear Group of the Corporation’s Flow Control segment. Anatec and LMT have 50 full-time personnel and manage an additional seasonal workforce of approximately 150 during nuclear plant maintenance outages. Anatec and LMT are headquartered in San Clemente, CA, with four additional facilities to support nuclear plant operations in the U.S. Revenues of the acquired business were approximately $20 million for the year ended 2010.
Legacy Distribution Business
On July 29, 2011, the Corporation sold the assets of the legacy distribution business within in its oil and gas division to McJunkin Red Man Corporation for $4.6 million in cash, including an adjustment based on closing inventory values. Working capital, exclusive of inventory, was retained by the Corporation. The determination was made to divest the business, as it was not considered a core business of the Corporation. The disposal resulted in a loss of less than $0.1 million and was not reported as a discontinued operation as the amounts are not considered significant. The business contributed $13.7 million in sales and a pretax loss of $0.3 million for the year ended December 31, 2010.
Douglas Equipment Ltd.
On April 6, 2011, the Corporation acquired the assets of Douglas Equipment Ltd. (“Douglas”) for £12.3 million ($20.1 million) in cash. The Business Transfer Agreement contains customary representations and warranties, including a portion of the purchase price deposited into escrow as security for potential indemnification claims against the seller. Management funded the purchase from the Corporation’s revolving credit facility.
Douglas designs and manufactures aircraft handling systems for the defense and commercial aerospace markets and will operate within the Marine & Power Products division of the Corporation’s Flow Control
63

segment. Douglas has approximately 135 employees and is headquartered in Cheltenham, U.K. Revenues of the acquired business were approximately $28 million for the year ended 2010.
The purchase price of the acquisitions has been allocated to the net tangible and intangible assets acquired with the remainder recorded as goodwill on the basis of estimated fair values, as follows:
EST Group, Inc.
On March 5, 2009, the Corporation acquired all the issued and outstanding stock of EST Group, Inc. (“EST”), and certain assets and liabilities from Township Line Realty, L.P. for $40.0 million in cash. Under the terms of the Stock Purchase Agreement, the Corporation deposited a portion of the purchase price into escrow as security for potential indemnification claims against the seller. As of December 31, 2011, all amounts under the general escrow have been released. An escrow of $0.9 million was established to indemnify the Corporation for a pending product warranty claim outstanding at the time of acquisition. This holdback remains outstanding and will be released either upon the sooner of the resolution of the warranty claim or June 2013. Management funded the purchase from the Corporation’s revolving credit facility.
EST provides engineered products and comprehensive repair services for heat management and cooling systems utilized in the energy and defense markets. EST had 99 employees as of the date of the acquisition and is headquartered in Hatfield, PA with an additional location in Baytown, TX, and a sales office in the Netherlands. Revenues of the acquired business were $19.6 million for the fiscal year ended September 30, 2008.
Nu-Torque
On January 16, 2009, the Corporation acquired certain assets of the Nu-Torque division (“Nu-Torque”) of Tyco Valves & Controls LP. The purchase price of the acquisition was $5.3 million in cash after giving effect to post-closing customary adjustments as provided for in the Asset Purchase Agreement and the assumption of certain liabilities of Nu-Torque. Management funded the purchase from the Corporation’s revolving credit facility.
The acquisition has been accounted for as a bargain purchase under the guidance for business combinations. The purchase price of the acquisition has been allocated to the net tangible and intangible assets acquired, with the excess of the fair value of assets acquired over the purchase price recorded as a gain and reported in General and administrative expenses in the Consolidated Statement of Earnings. The Corporation has estimated that $0.8 million of the acquired intangible assets will be tax deductible.
Nu-Torque is a designer and manufacturer of electric and hydraulic valve actuation and control devices primarily for Navy ships. Nu-Torque is located in Redmond, WA and had 37 employees as of the date of the acquisition. Revenues of the acquired business were $7.9 million for the fiscal year ended September 30, 2008.
64
Anatec
Douglas
Total
(US dollars in thousands) Accounts receivable
$ 4,685
$ 945
$ 5,630
Inventory —
10,914 10,914
Property, plant, and equipment 1,689
619 2,308
Other current assets 203
309 512
Intangible assets 14,936
6,697 21,633
Current liabilities (790 )
(5,038 ) (5,828 )
Due to seller
(1,022 ) —
(1,022 )
Net tangible and intangible assets 19,701
14,446 34,147
Purchase price 34,049
20,094 54,143
Goodwill $
14,348 $
5,648 $
19,996
Goodwill tax deductible Yes
Yes

The purchase price of the acquisitions has been allocated to the net tangible and intangible assets acquired with the remainder recorded as goodwill on the basis of estimated fair values, as follows:
MOTION CONTROL
South Bend Controls
On October 11, 2011, the Corporation acquired the assets of South Bend Controls (“SBC”) for $10.9 million in cash. The Asset Purchase Agreement contains customary representations and warranties, including a portion of the purchase price deposited into escrow as security for potential indemnification claims against the seller. Management funded the purchase primarily from the Corporation’s revolving credit facility and available cash on hand.
SBC is a designer and manufacturer of highly engineered, solenoid-based components used in critical applications serving the aerospace, defense, industrial and medical markets. Based in South Bend, Indiana, SBC has 63 employees, with union representation for 36 members of the workforce. Revenues of the acquired business were approximately $8.0 million in 2010. The business will operate within the Integrated Sensing division of the Corporation’s Motion Control segment.
Hydro-pneumatic (“Hydrop”) product line
On September 29, 2011, the Corporation sold the assets of the Hydrop suspension business, a product line of Curtiss-Wright Antriebstechnik GmbH (CWAT) in Switzerland, to Stromsholmen AB, a subsidiary of the Barnes Group for CHF 3.1 million ($3.5 million) in cash. Trade accounts receivable and payable were retained by the Corporation. The determination was made to divest the business as it was not considered a core business of the Corporation. The disposal resulted in a $1.3 million pre-tax gain and was not reported as discontinued operations as the amounts are not considered significant. This business contributed $0.8 million in sales for the year ended December 31, 2010.
ACRA Control Ltd.
On July 28, 2011, the Corporation acquired all of the issued and outstanding capital stock of ACRA Control Ltd. (“ACRA”) for € 42.6 million (approximately $61.1 million) in cash, net of cash acquired. The Share Purchase Agreement contains customary representations and warranties, including a portion of the purchase price deposited into escrow as security for potential indemnification claims against the seller. Management funded the purchase primarily from the Corporation’s revolving credit facility and cash generated from foreign operations.
ACRA is a supplier of data acquisition systems and networks, data recorders, and telemetry ground stations for both defense and commercial aerospace markets and will operate within the Integrated Sensing division of the Corporation’s Motion Control segment. ACRA had 128 employees on the date of acquisition, and operates from a leased facility in Dublin, Ireland. ACRA had revenues of approximately € 20.5 million ($27.1 million) for its fiscal year ended March 31, 2011.
65
EST
Nu-Torque
Total
(US dollars in thousands) Accounts receivable
$ 3,244
$ 853
$ 4,097
Inventory 4,208
4,329 8,537
Property, plant, and equipment 7,325
161 7,486
Other current assets 1,109
47 1,156
Intangible assets 12,500
2,900 15,400
Current and non-current liabilities (2,758 )
(1,021 ) (3,779 )
Net tangible and intangible assets 25,628
7,269 32,897
Purchase price 40,000
5,332 45,332
Goodwill/(Gain on Bargain Purchase) $
14,372 $
(1,937 ) $
12,435
Goodwill tax deductible Yes
N/A

Predator Systems, Inc.
On January 7, 2011, the Corporation acquired all the issued and outstanding capital stock of Predator Systems, Inc. (“PSI”), for $13.5 million in cash. The Stock Purchase Agreement contains customary representations and warranties, including a portion of the purchase price deposited into escrow as security for potential indemnification claims against the seller. Management funded the purchase from the Corporation’s revolving credit facility.
PSI designs and manufactures motion control components and subsystems for ground defense, ordnance guidance, and aerospace applications and will operate within the Flight Systems division of the Corporation’s Motion Control segment. PSI had 45 employees as of the date of the acquisition and is headquartered in Boca Raton, FL. Revenues of the acquired business were approximately $8.0 million for the year ended December 31, 2010.
The purchase price of the acquisitions has been allocated to the net tangible and intangible assets acquired with the remainder recorded as goodwill on the basis of estimated fair values, as follows:
Specialist Electronics Services Limited
On June 21, 2010, the Corporation acquired all the issued and outstanding stock of Specialist Electronics Services Ltd. (“SES”) for £14.3 million ($21.2 million), net of cash acquired. Under the terms of the Share Purchase Agreement, the Corporation deposited a portion of the purchase price into escrow as security for potential indemnification claims against the seller. In accordance with the terms of the Share Purchase Agreement, in June 2011, one-half of the escrow was released with no holdback for pending claims. Management funded the purchase from a combination of cash generated from foreign operations and the Corporation’s revolving credit facility.
The goodwill of £10.0 million ($14.8 million) consists largely of synergies achieved through the introduction of SES products to the Corporation’s distribution channels as well as synergies achieved from combining the operations of SES with the Corporation’s United Kingdom based operations.
SES provides a range of rugged products for airborne and other severe environments, with particular expertise in solid state data recording, computing and control display units. Key platforms include fixed-wing, rotary-wing, and unmanned aircraft, tactical vehicles, and navy vessels. SES is located in Camberley, U.K. and had 41 employees as of the date of the acquisition. Revenues of the acquired business were £4.7 million ($7.5 million) for the fiscal year ended May 31, 2010.
Hybricon Corporation
On June 1, 2010, the Corporation acquired all the issued and outstanding stock of Hybricon Corporation (“Hybricon”) for $19.0 million in cash. Under the terms of the Stock Purchase Agreement, the Corporation deposited a portion of the purchase price into escrow as security for potential indemnification claims against the seller. As of December 31, 2011, all funds held in escrow have been released to the seller with no claims outstanding. Management funded the purchase from the Corporation’s revolving credit facility.
66
South Bend
ACRA
PSI
Total
(US dollars in thousands) Accounts receivable
$ 1,635
$ 8,901
$ 862
$ 11,398
Inventory 2,929
6,539 1,856
11,324 Property, plant, and equipment
727 1,600
2,100 4,427
Other current assets 32
456 67
555 Intangible assets
3,500 17,054
4,700 25,254
Current and non-current liabilities (648 )
(6,048 ) (190 )
(6,886 )
Deferred income taxes —
(2,303 ) —
(2,303 )
Net tangible and intangible assets 8,175
26,199 9,395
43,769 Purchase price
10,880 61,053
13,503 85,436
Goodwill $
2,705 $
34,854 $
4,108 $
41,667
Goodwill tax deductible Yes
No Yes

The goodwill of $11.4 million consists largely of synergies from combining the operations of Hybricon with the Corporation’s Electronic Systems business in Littleton, MA as well as value associated with the acquisition’s assembled workforce.
Hybricon designs and manufactures custom and standards-based enclosures and electronic backplanes for defense and commercial applications, and is a leading supplier for predominant embedded commercial-off-the-shelf system architectures. Hybricon had 72 employees as of the date of the acquisition and was located in Ayer, MA prior to their relocation to the existing Curtiss-Wright facility in Littleton, MA in December 2010. Revenues of the acquired business were $16.8 million for the fiscal year ended June 30, 2009.
The purchase price of the acquisitions has been allocated to the net tangible and intangible assets acquired with the remainder recorded as goodwill on the basis of estimated fair values, as follows:
Skyquest Systems Limited
On December 18, 2009, the Corporation acquired all of the issued and outstanding capital stock of Skyquest Systems Limited (“SSL” or “Skyquest”). The purchase price of the acquisition, subsequent to customary adjustments provided for in the Stock Purchase Agreement, was £9.8 million ($15.8 million) in cash and the assumption of certain liabilities.
In addition, the Stock Purchase Agreement provides for additional consideration to the selling shareholders contingent upon SSL exceeding certain sales targets over a two-year period. Based on the estimated amount of sales over the two-year measurement period, the Corporation recorded a liability of the estimated fair value of the contingent consideration in the amount of £1.8 million ($2.9 million). Based on fiscal 2010 and 2011 sales results, Skyquest did not attain the contingent consideration targets for either measurement period, resulting in a gain from operations of £0.4 million ($0.7 million) in 2010 and £1.4 million ($2.2 million) in 2011.
Under the terms of the Stock Purchase Agreement, the Corporation deposited a portion of the purchase price into escrow as security for potential indemnification claims against the seller. Since no claims were raised during the contractually agreed upon escrow period following the closing, all funds held in escrow were released to the seller. Management funded the acquisition from the Corporation’s available cash.
Skyquest is a supplier of aircraft video displays, recorders, and video/radar converters for surveillance aircraft applications in the aerospace and defense markets. Skyquest’s display and recorder technology supports demanding airborne surveillance missions with proven reliability in harsh environments. Key products include the Video Management System, which provides fully integrated systems that enable observers and pilots to independently select, view, and record images with maximum fidelity. Skyquest also develops lightweight, airworthy standard and High Definition video recorders for airborne surveillance.
Located in Basildon, United Kingdom, SSL was formed from two businesses, Skyquest Ltd. and Real-Time Vision Ltd., founded in 1996 and 1998, respectively. SSL is a part of the Corporation’s Motion Control segment within the Embedded Computing division. Revenues of the acquired business were £5.0 million ($8.0 million) for the year ended December 31, 2009.
67
SES
Hybricon
Total
(US dollars in thousands) Accounts receivable
$ 1,683
$ 2,273
$ 3,956
Inventory 977
2,075 3,052
Property, plant, and equipment 74
151 225
Other current assets 25
68 93
Intangible assets 8,115
6,677 14,792
Current and non-current liabilities (2,251 )
(1,420 ) (3,671 )
Deferred income taxes
(2,255 ) (2,287 )
(4,542 )
Net tangible and intangible assets 6,368
7,537 13,905
Purchase price 21,163
18,976 40,139
Goodwill $
14,795 $
11,439 $
26,234
Goodwill tax deductible No
No
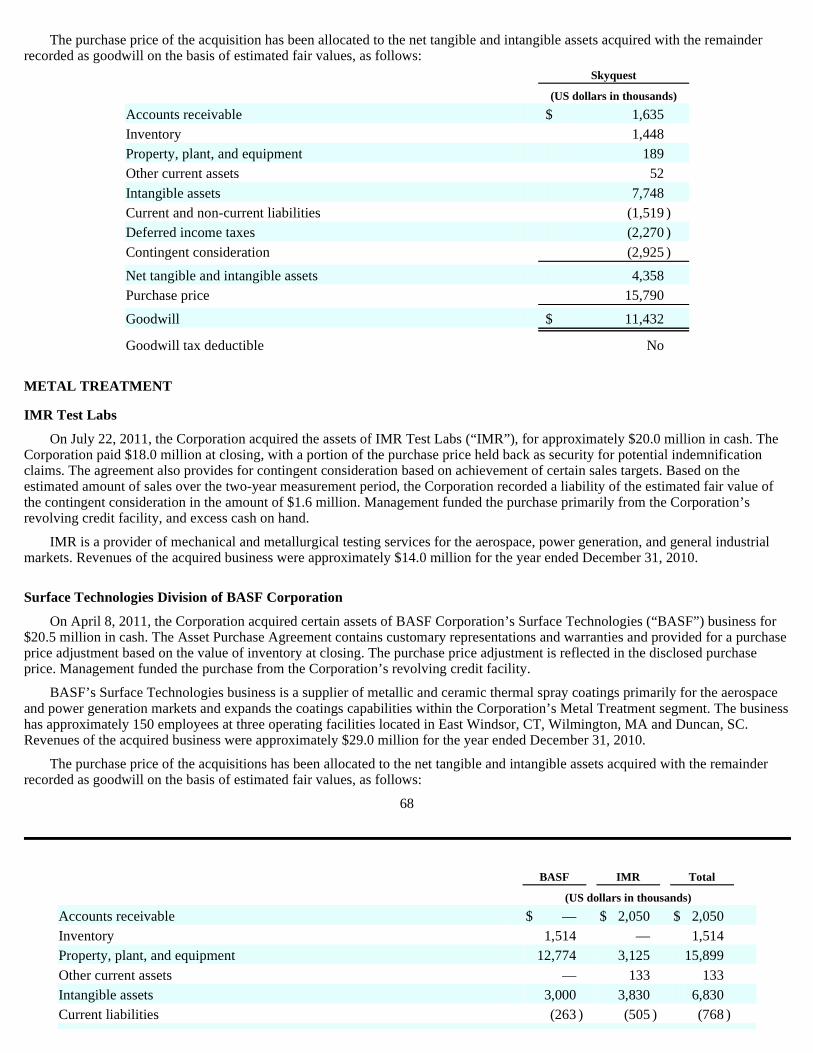
The purchase price of the acquisition has been allocated to the net tangible and intangible assets acquired with the remainder recorded as goodwill on the basis of estimated fair values, as follows:
METAL TREATMENT
IMR Test Labs
On July 22, 2011, the Corporation acquired the assets of IMR Test Labs (“IMR”), for approximately $20.0 million in cash. The Corporation paid $18.0 million at closing, with a portion of the purchase price held back as security for potential indemnification claims. The agreement also provides for contingent consideration based on achievement of certain sales targets. Based on the estimated amount of sales over the two-year measurement period, the Corporation recorded a liability of the estimated fair value of the contingent consideration in the amount of $1.6 million. Management funded the purchase primarily from the Corporation’s revolving credit facility, and excess cash on hand.
IMR is a provider of mechanical and metallurgical testing services for the aerospace, power generation, and general industrial markets. Revenues of the acquired business were approximately $14.0 million for the year ended December 31, 2010.
Surface Technologies Division of BASF Corporation
On April 8, 2011, the Corporation acquired certain assets of BASF Corporation’s Surface Technologies (“BASF”) business for $20.5 million in cash. The Asset Purchase Agreement contains customary representations and warranties and provided for a purchase price adjustment based on the value of inventory at closing. The purchase price adjustment is reflected in the disclosed purchase price. Management funded the purchase from the Corporation’s revolving credit facility.
BASF’s Surface Technologies business is a supplier of metallic and ceramic thermal spray coatings primarily for the aerospace and power generation markets and expands the coatings capabilities within the Corporation’s Metal Treatment segment. The business has approximately 150 employees at three operating facilities located in East Windsor, CT, Wilmington, MA and Duncan, SC. Revenues of the acquired business were approximately $29.0 million for the year ended December 31, 2010.
The purchase price of the acquisitions has been allocated to the net tangible and intangible assets acquired with the remainder recorded as goodwill on the basis of estimated fair values, as follows:
68
Skyquest
(US dollars in thousands) Accounts receivable
$ 1,635
Inventory 1,448
Property, plant, and equipment 189
Other current assets 52
Intangible assets 7,748
Current and non-current liabilities (1,519 )
Deferred income taxes
(2,270 )
Contingent consideration (2,925 )
Net tangible and intangible assets 4,358
Purchase price 15,790
Goodwill $
11,432
Goodwill tax deductible No
BASF
IMR
Total
(US dollars in thousands)
Accounts receivable $
— $
2,050 $
2,050
Inventory 1,514
— 1,514
Property, plant, and equipment
12,774 3,125
15,899
Other current assets —
133 133
Intangible assets
3,000 3,830
6,830
Current liabilities (263 )
(505 ) (768 )
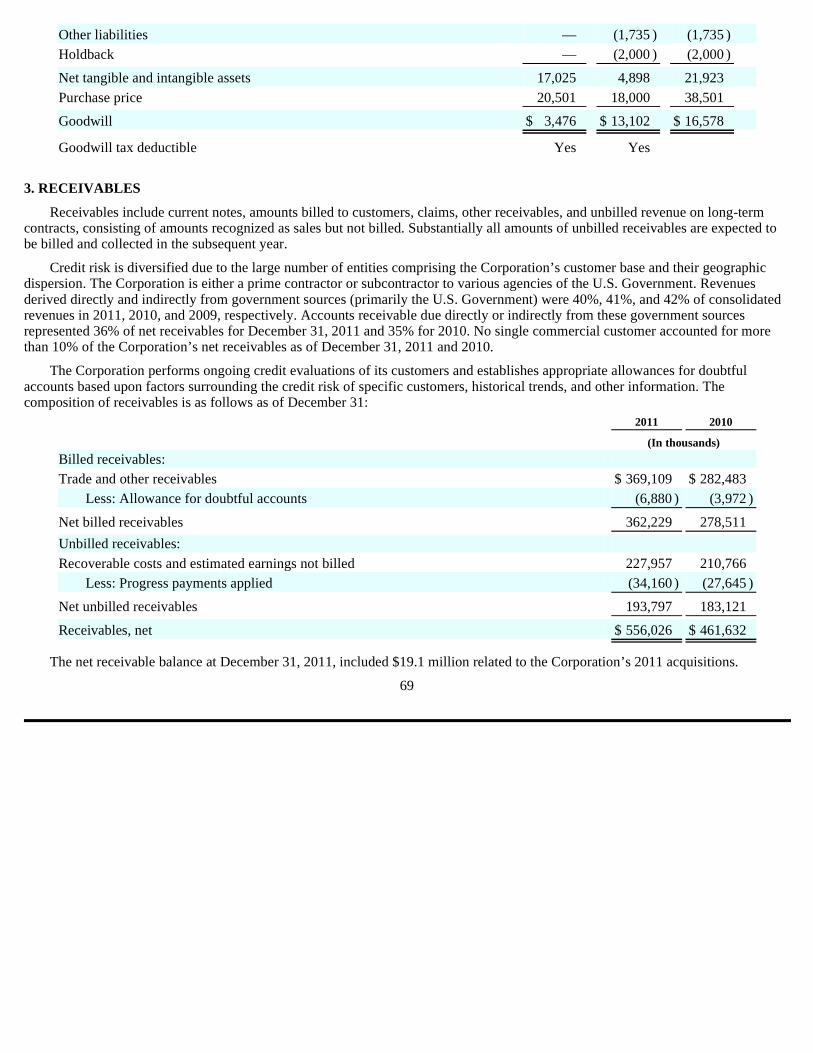
3. RECEIVABLES
Receivables include current notes, amounts billed to customers, claims, other receivables, and unbilled revenue on long-term contracts, consisting of amounts recognized as sales but not billed. Substantially all amounts of unbilled receivables are expected to be billed and collected in the subsequent year.
Credit risk is diversified due to the large number of entities comprising the Corporation’s customer base and their geographic dispersion. The Corporation is either a prime contractor or subcontractor to various agencies of the U.S. Government. Revenues derived directly and indirectly from government sources (primarily the U.S. Government) were 40%, 41%, and 42% of consolidated revenues in 2011, 2010, and 2009, respectively. Accounts receivable due directly or indirectly from these government sources represented 36% of net receivables for December 31, 2011 and 35% for 2010. No single commercial customer accounted for more than 10% of the Corporation’s net receivables as of December 31, 2011 and 2010.
The Corporation performs ongoing credit evaluations of its customers and establishes appropriate allowances for doubtful accounts based upon factors surrounding the credit risk of specific customers, historical trends, and other information. The composition of receivables is as follows as of December 31:
The net receivable balance at December 31, 2011, included $19.1 million related to the Corporation’s 2011 acquisitions.
69
Other liabilities —
(1,735 ) (1,735 )
Holdback
— (2,000 )
(2,000 )
Net tangible and intangible assets 17,025
4,898 21,923
Purchase price
20,501 18,000
38,501
Goodwill $
3,476 $
13,102 $
16,578
Goodwill tax deductible Yes
Yes
2011
2010
(In thousands) Billed receivables:
Trade and other receivables
$ 369,109
$ 282,483
Less: Allowance for doubtful accounts (6,880 )
(3,972 )
Net billed receivables 362,229
278,511
Unbilled receivables:
Recoverable costs and estimated earnings not billed 227,957
210,766 Less: Progress payments applied
(34,160 ) (27,645 )
Net unbilled receivables 193,797
183,121
Receivables, net $
556,026 $
461,632
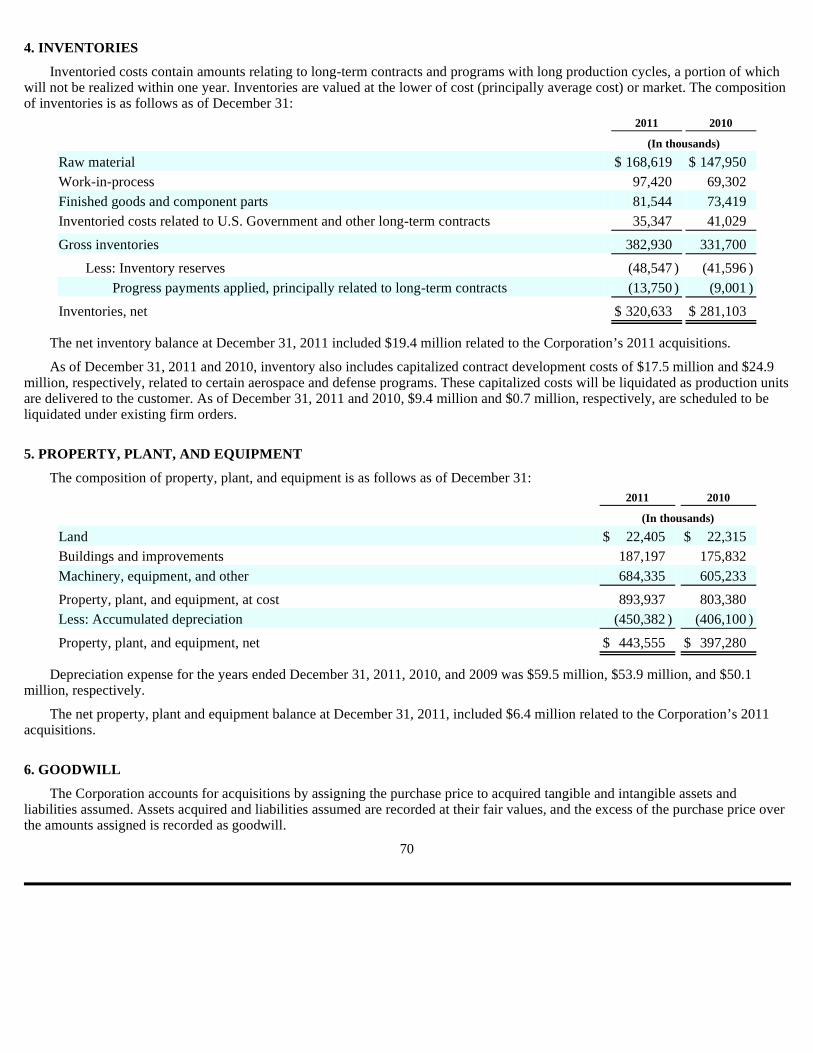
4. INVENTORIES
Inventoried costs contain amounts relating to long-term contracts and programs with long production cycles, a portion of which will not be realized within one year. Inventories are valued at the lower of cost (principally average cost) or market. The composition of inventories is as follows as of December 31:
The net inventory balance at December 31, 2011 included $19.4 million related to the Corporation’s 2011 acquisitions.
As of December 31, 2011 and 2010, inventory also includes capitalized contract development costs of $17.5 million and $24.9 million, respectively, related to certain aerospace and defense programs. These capitalized costs will be liquidated as production units are delivered to the customer. As of December 31, 2011 and 2010, $9.4 million and $0.7 million, respectively, are scheduled to be liquidated under existing firm orders.
5. PROPERTY, PLANT, AND EQUIPMENT
The composition of property, plant, and equipment is as follows as of December 31:
Depreciation expense for the years ended December 31, 2011, 2010, and 2009 was $59.5 million, $53.9 million, and $50.1 million, respectively.
The net property, plant and equipment balance at December 31, 2011, included $6.4 million related to the Corporation’s 2011 acquisitions.
6. GOODWILL
The Corporation accounts for acquisitions by assigning the purchase price to acquired tangible and intangible assets and liabilities assumed. Assets acquired and liabilities assumed are recorded at their fair values, and the excess of the purchase price over the amounts assigned is recorded as goodwill.
70
2011
2010
(In thousands) Raw material
$ 168,619
$ 147,950
Work-in-process 97,420
69,302 Finished goods and component parts
81,544 73,419
Inventoried costs related to U.S. Government and other long-term contracts 35,347
41,029
Gross inventories 382,930
331,700
Less: Inventory reserves (48,547 )
(41,596 )
Progress payments applied, principally related to long-term contracts (13,750 )
(9,001 )
Inventories, net $
320,633 $
281,103
2011
2010
(In thousands) Land
$ 22,405
$ 22,315
Buildings and improvements 187,197
175,832 Machinery, equipment, and other
684,335 605,233
Property, plant, and equipment, at cost 893,937
803,380 Less: Accumulated depreciation
(450,382 ) (406,100 )
Property, plant, and equipment, net $
443,555 $
397,280

The changes in the carrying amount of goodwill for 2011 and 2010 are as follows:
The purchase price allocations relating to the businesses acquired are initially based on estimates. The Corporation adjusts these estimates based upon final analysis including input from third party appraisals, when deemed appropriate. The determination of fair value is finalized no later than twelve months from acquisition. Goodwill adjustments represent subsequent adjustments to the purchase price allocation for acquisitions as determined by the respective accounting guidance requirements based on the date of acquisition. The goodwill adjustments during 2011 primarily reflect the reversal of a liability, which under the legacy accounting guidance for business combinations, was reversed against goodwill.
During 2011, the Corporation finalized the allocation of the purchase price for all businesses acquired prior to 2011. In 2011, $43.4 million of the goodwill on acquisitions made is deductible for tax purposes. None of the goodwill on the 2010 acquisitions is deductible for tax purposes.
The Corporation completed its annual goodwill impairment testing as of October 31, 2011, 2010, and 2009 and concluded that there was no impairment of value.
As of January 1, 2010, one of the Corporation’s Canadian entities changed its functional currency from the U.S. dollar to the Canadian dollar. The nature of this operation’s cash flow changed from predominantly U.S. dollar to the Canadian dollar, therefore requiring the change in functional currency. In accordance with the guidance on foreign currency translation, an adjustment of $13.4 million, attributable to current-rate translation, was recorded to goodwill. This adjustment resulted in an increase to goodwill and is reported within the “Foreign currency translation adjustment” caption above.
7. OTHER INTANGIBLE ASSETS, NET
Intangible assets are generally the result of acquisitions and consist primarily of purchased technology, customer related intangibles, and trademarks. Intangible assets are amortized over useful lives that range between 1 and 20 years.
The following table summarizes the intangible assets acquired (including their weighted-average useful lives) by the Corporation during 2011 and 2010. No indefinite lived intangible assets were purchased in 2011 or 2010.
71
Flow Control
Motion Control
Metal Treatment
Consolidated
(In thousands) December 31, 2009
$ 308,051
$ 311,546
$ 28,855
$ 648,452
Goodwill from 2010 acquisitions —
27,139 —
27,139 Goodwill adjustments
16 (1,968 )
— (1,952 )
Foreign currency translation adjustment
1,980 17,890
63 19,933
December 31, 2010 $
310,047 $
354,607 $
28,918 $
693,572
Goodwill from 2011 acquisitions $
19,996 $
41,667 $
16,578 $
78,241 Divestitures
(540 ) (1,170 )
— (1,710 )
Goodwill adjustments
— (3,955 )
— (3,955 )
Foreign currency translation adjustment
(1,284 ) (5,365 )
(57 ) (6,706 )
December 31, 2011 $
328,219 $
385,784 $
45,439 $
759,442
2011
2010
Amount
Years
Amount
Years
(In thousands, except years data) Technology
$ 12,555
10.9 $
5,384 7.0
Customer related intangibles 36,776
7.5 10,721
11.9 Other intangible assets
5,849 7.1
295 3.0
Total $
55,180 8.2
$ 16,400
10.1
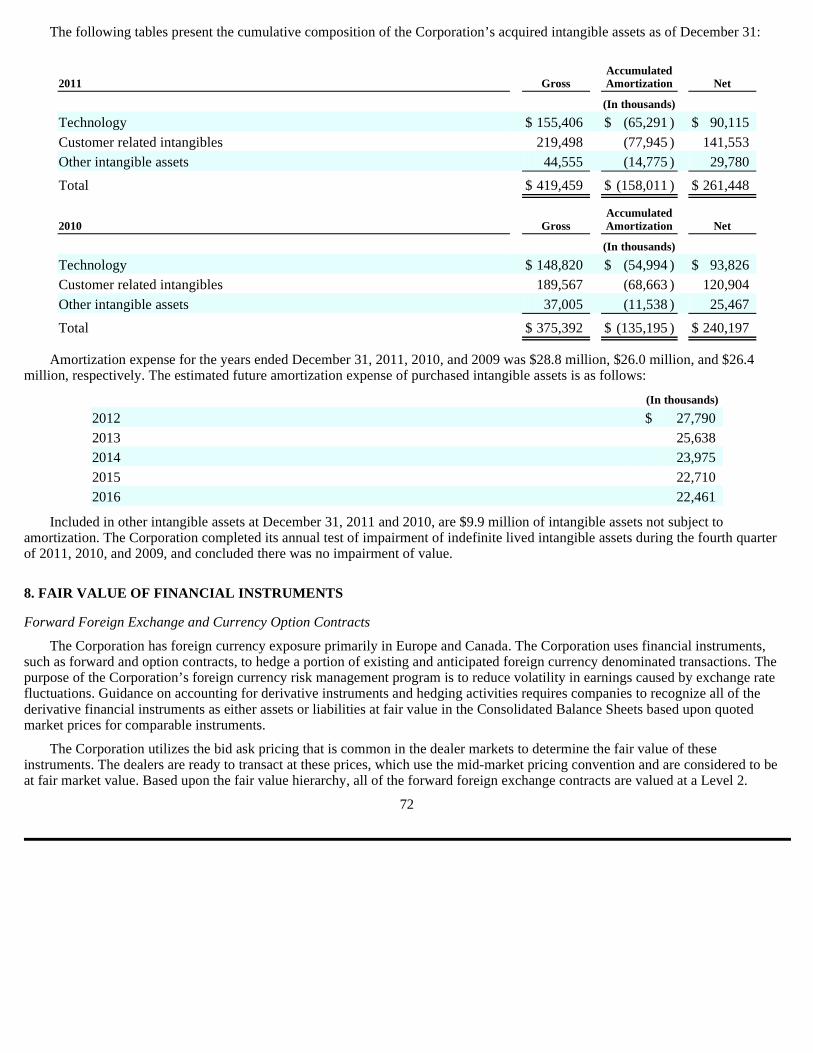
The following tables present the cumulative composition of the Corporation’s acquired intangible assets as of December 31:
Amortization expense for the years ended December 31, 2011, 2010, and 2009 was $28.8 million, $26.0 million, and $26.4 million, respectively. The estimated future amortization expense of purchased intangible assets is as follows:
Included in other intangible assets at December 31, 2011 and 2010, are $9.9 million of intangible assets not subject to amortization. The Corporation completed its annual test of impairment of indefinite lived intangible assets during the fourth quarter of 2011, 2010, and 2009, and concluded there was no impairment of value.
8. FAIR VALUE OF FINANCIAL INSTRUMENTS
Forward Foreign Exchange and Currency Option Contracts
The Corporation has foreign currency exposure primarily in Europe and Canada. The Corporation uses financial instruments, such as forward and option contracts, to hedge a portion of existing and anticipated foreign currency denominated transactions. The purpose of the Corporation’s foreign currency risk management program is to reduce volatility in earnings caused by exchange rate fluctuations. Guidance on accounting for derivative instruments and hedging activities requires companies to recognize all of the derivative financial instruments as either assets or liabilities at fair value in the Consolidated Balance Sheets based upon quoted market prices for comparable instruments.
The Corporation utilizes the bid ask pricing that is common in the dealer markets to determine the fair value of these instruments. The dealers are ready to transact at these prices, which use the mid-market pricing convention and are considered to be at fair market value. Based upon the fair value hierarchy, all of the forward foreign exchange contracts are valued at a Level 2.
72
2011
Gross
Accumulated Amortization
Net
(In thousands) Technology
$ 155,406
$ (65,291 )
$ 90,115
Customer related intangibles 219,498
(77,945 ) 141,553
Other intangible assets 44,555
(14,775 ) 29,780
Total $
419,459 $
(158,011 ) $
261,448
2010
Gross
Accumulated Amortization
Net
(In thousands) Technology
$ 148,820
$ (54,994 )
$ 93,826
Customer related intangibles 189,567
(68,663 ) 120,904
Other intangible assets 37,005
(11,538 ) 25,467
Total $
375,392 $
(135,195 ) $
240,197
(In thousands)
2012 $
27,790 2013
25,638 2014
23,975 2015
22,710 2016
22,461

Effects on Consolidated Balance Sheets
The location and amounts of derivative instrument fair values in the consolidated balance sheet are below.
Effects on Consolidated Statements of Earnings
The location and amount of gains and (losses) recognized in income on derivatives not designated for hedge accounting for the years ended December 31 were as follows:
Debt
The estimated fair value amounts were determined by the Corporation using available market information, which is primarily based on quoted market prices for the same or similar issues as of December 31, 2011. The estimated fair values of the Corporation’s fixed rate debt instruments at December 31, 2011, aggregated $614.7 million compared to a carrying value of $575.0 million. The estimated fair values of the Corporation’s fixed rate debt instruments at December 31, 2010, aggregated $301.6 million compared to a carrying value of $275.0 million.
The carrying amount of the variable interest rate debt approximates fair value because the interest rates are reset periodically to reflect current market conditions.
The fair values described above may not be indicative of net realizable value or reflective of future fair values. Furthermore, the use of different methodologies to determine the fair value of certain financial instruments could result in a different estimate of fair value at the reporting date.
9. ACCRUED EXPENSES AND OTHER CURRENT LIABILITIES
Accrued expenses consist of the following as of December 31:
73
December 31,
2011
2010
(In thousands) Forward exchange contracts:
Other current assets
$ 13 $ 532
Other current liabilities $ 356
$ 309
December 31,
2011
2010
2009
(In thousands) Forward exchange contracts:
General and administrative expenses
$ (654 )
$ 3,114
$ 2,026
2011
2010
(In thousands) Accrued compensation
$ 65,983
$ 67,249
Accrued commissions 9,122
7,568 Accrued interest
4,282 3,231
Accrued taxes other than income taxes 4,088
2,163 Accrued insurance
5,817 5,108
Other 15,904
14,647
Total accrued expenses $
105,196 $
99,966
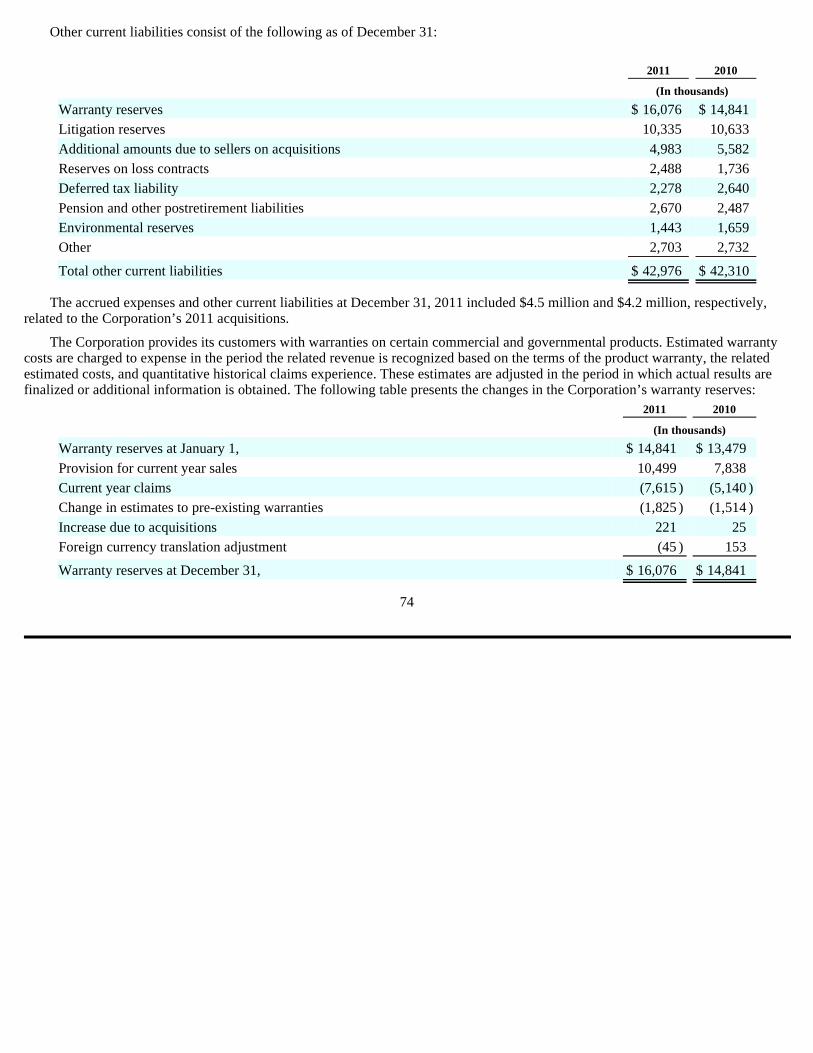
Other current liabilities consist of the following as of December 31:
The accrued expenses and other current liabilities at December 31, 2011 included $4.5 million and $4.2 million, respectively, related to the Corporation’s 2011 acquisitions.
The Corporation provides its customers with warranties on certain commercial and governmental products. Estimated warranty costs are charged to expense in the period the related revenue is recognized based on the terms of the product warranty, the related estimated costs, and quantitative historical claims experience. These estimates are adjusted in the period in which actual results are finalized or additional information is obtained. The following table presents the changes in the Corporation’s warranty reserves:
74
2011
2010
(In thousands) Warranty reserves
$ 16,076
$ 14,841
Litigation reserves 10,335
10,633 Additional amounts due to sellers on acquisitions
4,983 5,582
Reserves on loss contracts 2,488
1,736 Deferred tax liability
2,278 2,640
Pension and other postretirement liabilities 2,670
2,487 Environmental reserves
1,443 1,659
Other 2,703
2,732
Total other current liabilities $
42,976 $
42,310
2011
2010
(In thousands) Warranty reserves at January 1,
$ 14,841
$ 13,479
Provision for current year sales 10,499
7,838 Current year claims
(7,615 ) (5,140 )
Change in estimates to pre-existing warranties
(1,825 ) (1,514 )
Increase due to acquisitions
221 25
Foreign currency translation adjustment (45 )
153
Warranty reserves at December 31, $
16,076 $
14,841

10. FACILITIES RELOCATION AND RESTRUCTURING
In connection with the acquisitions of VMETRO and Mechetronics in 2008, the Corporation established a restructuring accrual of $7.6 million that was recorded against goodwill in accordance with the guidance on Business Combinations. These acquisitions are consolidated into the Motion Control segment. The accrual was established as of December 31, 2008 for $7.1 million. Based upon further analysis of the restructuring activities an additional $0.5 million was recorded in 2009. The restructuring accrual consisted of costs to exit the activities of certain facilities, including lease cancellation costs and external legal and consulting fees, as well as costs to relocate or involuntarily terminate certain employees of the acquired business. As of December 31, 2010, the Corporation completed its actions under the VMETRO and Mechetronics restructuring plans.
During 2009, the Corporation committed to a plan to restructure existing operations through a reduction in workforce and consolidation of operating locations both domestically and internationally. The decision was based on a review of various cost savings initiatives undertaken in connection with the development of the Corporation’s budget and operating plan. This plan impacted all three of the Corporation’s operating segments and resulted in costs incurred of $5.6 million. During 2010, the Corporation continued its restructuring initiatives and incurred an additional $3.0 million consisting of severance costs to involuntarily terminate certain employees; relocation costs; exit activities of certain facilities, including lease cancellation costs; and external legal and consulting fees. These costs were recorded in the Consolidated Statement of Earnings with the majority of the costs affecting the General and administrative expenses, Cost of sales, and Selling expenses for $1.7 million, $1.2 million, $0.1 million, respectively. The liability is included within Other current liabilities. As of December 31, 2011, the Corporation completed its actions under this restructuring plan.
A summary by segment of the components of facilities relocation and corporate restructuring charges for acquisitions and ongoing operations and an analysis of related activity in the accrual as of December 31, 2011 is as follows:
75
Severance and Benefits
Facility Closing Costs
Relocation Costs
Total
(In thousands) Flow Control
December 31, 2009
$ 57
$ —
$ —
$ 57
Provisions 895
732 352
1,979 Payments
(900 ) (522 )
(352 ) (1,774 )
Adjustments
— —
— —
Net currency translation adjustment —
— —
—
December 31, 2010 $
52 $
210 $
— $
262
Provisions —
— —
— Payments
(52 ) (210 )
— (262 )
Adjustments
— —
— —
Net currency translation adjustment —
— —
—
December 31, 2011 $
— $
— $
— $
—
Motion Control
December 31, 2009 $
1,545 $
1,080 $
125 $
2,750
Provisions 668
71 103
842 Payments
(1,714 ) (621 )
(228 ) (2,563 )
Adjustments
(358 ) (497 )
— (855 )
Net currency translation adjustment
(23 ) (28 )
— (51 )
December 31, 2010 $
118 $
5 $
— $
123
Provisions —
— —
— Payments
(118 ) (5 )
— (123 )
Adjustments
— —
— —
Net currency translation adjustment —
— —
—
December 31, 2011 $
— $
— $
— $
—

Oil and Gas Restructuring Initiative
During the fourth quarter of 2010, the Corporation initiated a restructuring plan within its Oil and Gas division, of the Flow Control segment. The objective of this initiative was to streamline the division’s workflow and consolidate existing facilities. In the fourth quarter of 2010 and during the year ended December 31, 2011, the Corporation recorded charges of $0.5 million and $0.2 million, respectively, related to severance and benefit costs as part of this initiative. These costs are recorded within General and administrative expenses in the Consolidated Statement of Earnings. As of December 30, 2011, substantially all payments have been made against the reserve.
The Corporation does not anticipate incurring any additional significant costs associated with this plan. However, the Corporation is currently evaluating additional restructuring activities within the Oil and Gas division. In addition, in 2012 we will continue to strategically identify potential facilities and personnel reductions as part of our ongoing efforts to streamline our workflow.
11. INCOME TAXES
Earnings before income taxes for the years ended December 31 consist of:
76
Severance and Benefits
Facility Closing Costs
Relocation Costs
Total
(In thousands) Metal Treatment
December 31, 2009
$ —
$ —
$ —
$ —
Provisions —
66 153
219 Payments
— (66 )
(153 ) (219 )
Adjustments
— —
— —
Net currency translation adjustment —
— —
—
December 31, 2010 $
— $
— $
— $
—
Provisions —
— —
— Payments
— —
— —
Adjustments —
— —
— Net currency translation adjustment
— —
— —
December 31, 2011 $
— $
— $
— $
—
Total Curtiss-Wright
December 31, 2009 $
1,602 $
1,080 $
125 $
2,807
Provisions 1,563
869 608
3,040 Payments
(2,614 ) (1,209 )
(733 ) (4,556 )
Adjustments
(358 ) (497 )
— (855 )
Net currency translation adjustment
(23 ) (28 )
— (51 )
December 31, 2010 $
170 $
215 $
— $
385
Provisions —
— —
— Payments
(170 ) (215 )
— (385 )
Adjustments
— —
— —
Net currency translation adjustment —
— —
—
December 31, 2011 $
— $
— $
— $
—
2011
2010
2009
(In thousands) Domestic
$ 112,912
$ 100,948
$ 94,695
Foreign 72,077
57,347 50,564
$ 184,989
$ 158,295
$ 145,259


The provision for income taxes for the years ended December 31 consists of:
The effective tax rate varies from the U.S. federal statutory tax rate for the years ended December 31, principally:
During 2011, a $4.1 million U.S. research and development tax credit was recognized in the current year that did not occur in the prior year. The 2011 rate change is primarily due to the U.K. decreasing it’s statutory rate from 27% to 25%. The 2010 effective tax rate included a tax benefit of $4.2 million due to foreign cash repatriation. This was offset by a $0.8 million charge to write off a portion of deferred tax assets related to postretirement health care obligations. New health care legislation impacting the tax deductible prescription drug costs related to Medicare Part D will reduce the amount of the federal subsidy beginning in 2013 and reduce the deductible temporary difference relating to the benefit obligation. There was also a favorable impact as a result of a U.K. tax rate change which was offset by an unfavorable change in state tax rates. During 2010, the Company recorded a decrease of $1.0 million in the valuation allowance primarily related to the utilization of net operating loss carryforwards. The 2009 effective tax rate included a tax benefit of $1.4 million principally due to a Canadian tax rate change which was offset by $2.0 million increase in the state tax expense, net of federal benefit, principally as a result of a reduction in state rates thereby reducing the state deferred tax assets. The 2009 effective tax rate was also favorably impacted by an increase in research and development tax credits from the Canadian and U.K. operations.
77
2011
2010
2009
(In thousands) Current:
Federal
$ 25,448
$ 25,856
$ 33,046
State 6,141
7,357 6,486
Foreign 19,632
15,663 16,974
51,221 48,876
56,506
Deferred:
Federal 6,845
5,517 (4,324 )
State
(697 ) (208 )
1,600 Foreign
(3,235 ) (1,630 )
(3,799 )
2,913 3,679
(6,523 )
Valuation allowance 432
(858 ) 55
Provision for income taxes $
54,566 $
51,697 $
50,038
2011
2010
2009
U.S. federal statutory tax rate 35.0 %
35.0 % 35.0 %
Add (deduct):
State and local taxes, net of federal benefit
2.1 2.5
2.7 Rate changes
(0.2 ) —
0.4 R&D tax credits
(4.2 ) (3.3 )
(1.7 )
Foreign rate differential (2.9 )
(1.8 ) (0.8 )
All other, net
(0.3 ) 0.3
(1.2 )
Effective tax rate 29.5 %
32.7 % 34.4 %
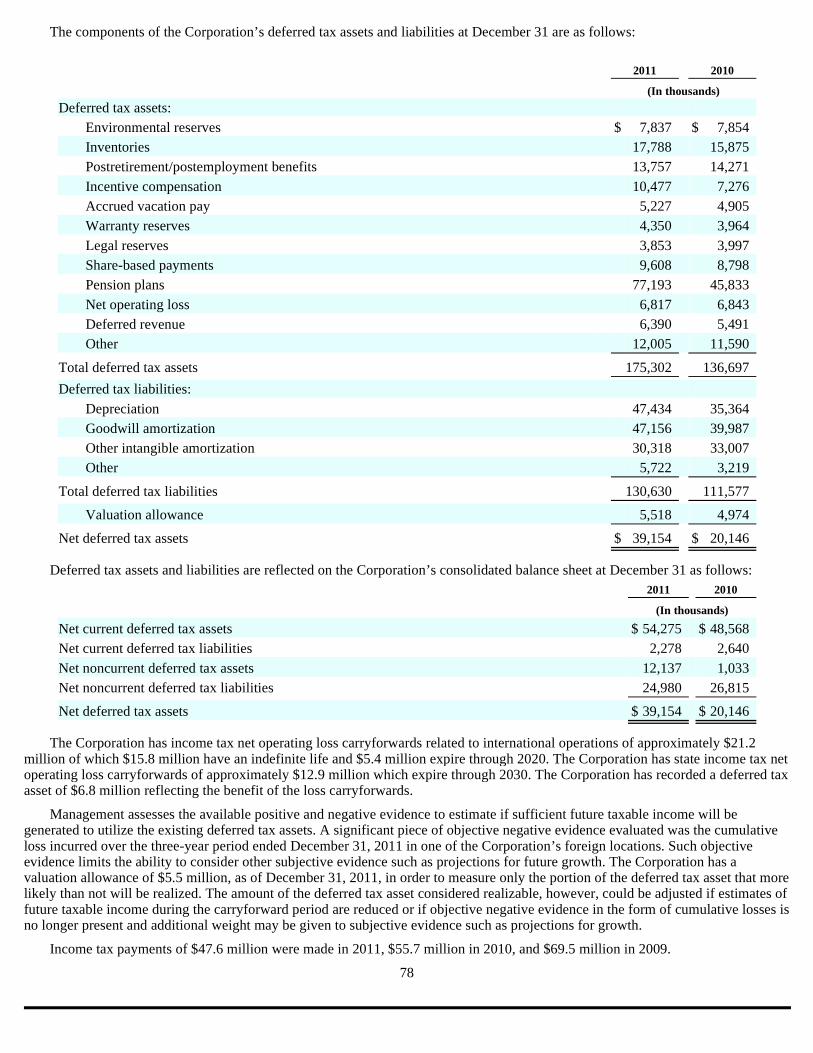
The components of the Corporation’s deferred tax assets and liabilities at December 31 are as follows:
Deferred tax assets and liabilities are reflected on the Corporation’s consolidated balance sheet at December 31 as follows:
The Corporation has income tax net operating loss carryforwards related to international operations of approximately $21.2 million of which $15.8 million have an indefinite life and $5.4 million expire through 2020. The Corporation has state income tax net operating loss carryforwards of approximately $12.9 million which expire through 2030. The Corporation has recorded a deferred tax asset of $6.8 million reflecting the benefit of the loss carryforwards.
Management assesses the available positive and negative evidence to estimate if sufficient future taxable income will be generated to utilize the existing deferred tax assets. A significant piece of objective negative evidence evaluated was the cumulative loss incurred over the three-year period ended December 31, 2011 in one of the Corporation’s foreign locations. Such objective evidence limits the ability to consider other subjective evidence such as projections for future growth. The Corporation has a valuation allowance of $5.5 million, as of December 31, 2011, in order to measure only the portion of the deferred tax asset that more likely than not will be realized. The amount of the deferred tax asset considered realizable, however, could be adjusted if estimates of future taxable income during the carryforward period are reduced or if objective negative evidence in the form of cumulative losses is no longer present and additional weight may be given to subjective evidence such as projections for growth.
Income tax payments of $47.6 million were made in 2011, $55.7 million in 2010, and $69.5 million in 2009.
78
2011
2010
(In thousands) Deferred tax assets:
Environmental reserves
$ 7,837
$ 7,854
Inventories 17,788
15,875 Postretirement/postemployment benefits
13,757 14,271
Incentive compensation 10,477
7,276 Accrued vacation pay
5,227 4,905
Warranty reserves 4,350
3,964 Legal reserves
3,853 3,997
Share-based payments 9,608
8,798 Pension plans
77,193 45,833
Net operating loss 6,817
6,843 Deferred revenue
6,390 5,491
Other 12,005
11,590
Total deferred tax assets 175,302
136,697
Deferred tax liabilities:
Depreciation 47,434
35,364 Goodwill amortization
47,156 39,987
Other intangible amortization 30,318
33,007 Other
5,722 3,219
Total deferred tax liabilities 130,630
111,577
Valuation allowance 5,518
4,974
Net deferred tax assets $
39,154 $
20,146
2011
2010
(In thousands) Net current deferred tax assets
$ 54,275
$ 48,568
Net current deferred tax liabilities 2,278
2,640 Net noncurrent deferred tax assets
12,137 1,033
Net noncurrent deferred tax liabilities 24,980
26,815
Net deferred tax assets $
39,154 $
20,146
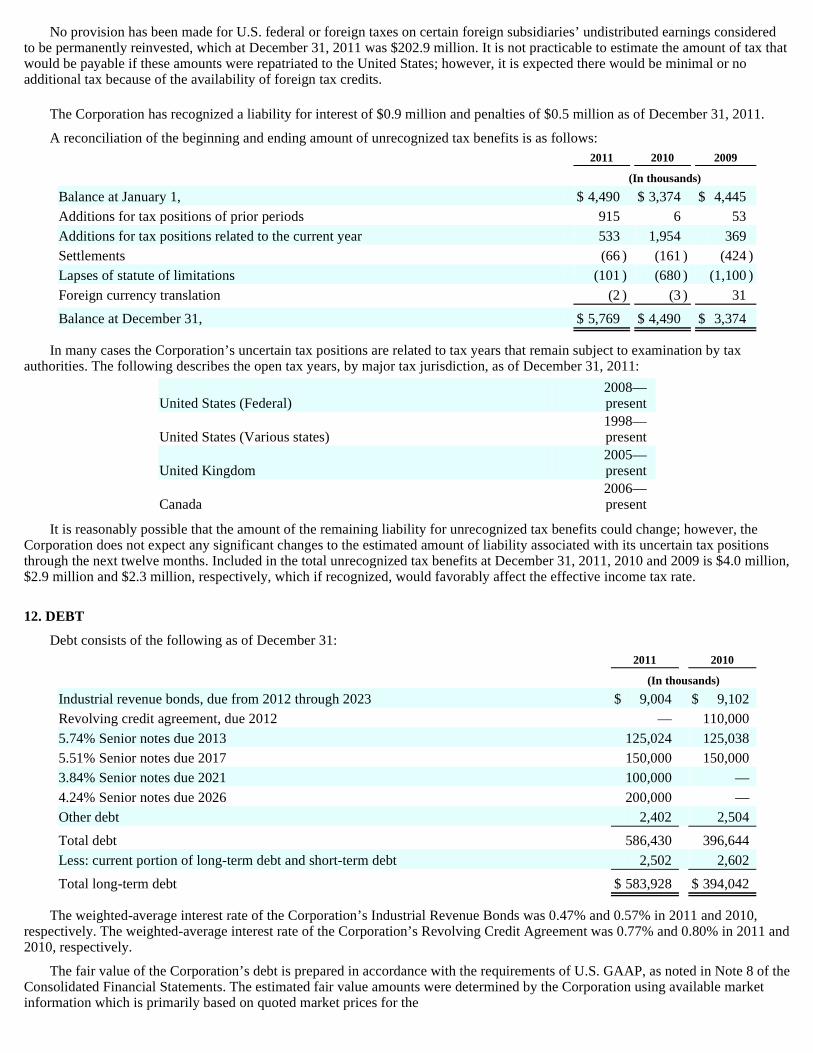
No provision has been made for U.S. federal or foreign taxes on certain foreign subsidiaries’ undistributed earnings considered to be permanently reinvested, which at December 31, 2011 was $202.9 million. It is not practicable to estimate the amount of tax that would be payable if these amounts were repatriated to the United States; however, it is expected there would be minimal or no additional tax because of the availability of foreign tax credits.
The Corporation has recognized a liability for interest of $0.9 million and penalties of $0.5 million as of December 31, 2011.
A reconciliation of the beginning and ending amount of unrecognized tax benefits is as follows:
In many cases the Corporation’s uncertain tax positions are related to tax years that remain subject to examination by tax authorities. The following describes the open tax years, by major tax jurisdiction, as of December 31, 2011:
It is reasonably possible that the amount of the remaining liability for unrecognized tax benefits could change; however, the Corporation does not expect any significant changes to the estimated amount of liability associated with its uncertain tax positions through the next twelve months. Included in the total unrecognized tax benefits at December 31, 2011, 2010 and 2009 is $4.0 million, $2.9 million and $2.3 million, respectively, which if recognized, would favorably affect the effective income tax rate.
12. DEBT
Debt consists of the following as of December 31:
The weighted-average interest rate of the Corporation’s Industrial Revenue Bonds was 0.47% and 0.57% in 2011 and 2010, respectively. The weighted-average interest rate of the Corporation’s Revolving Credit Agreement was 0.77% and 0.80% in 2011 and 2010, respectively.
The fair value of the Corporation’s debt is prepared in accordance with the requirements of U.S. GAAP, as noted in Note 8 of the Consolidated Financial Statements. The estimated fair value amounts were determined by the Corporation using available market information which is primarily based on quoted market prices for the
2011
2010
2009
(In thousands) Balance at January 1,
$ 4,490
$ 3,374
$ 4,445
Additions for tax positions of prior periods 915
6 53
Additions for tax positions related to the current year 533
1,954 369
Settlements (66 )
(161 ) (424 )
Lapses of statute of limitations
(101 ) (680 )
(1,100 )
Foreign currency translation (2 )
(3 ) 31
Balance at December 31, $
5,769 $
4,490 $
3,374
United States (Federal)
2008—present
United States (Various states)
1998—present
United Kingdom
2005—present
Canada
2006—present
2011
2010
(In thousands) Industrial revenue bonds, due from 2012 through 2023
$ 9,004
$ 9,102
Revolving credit agreement, due 2012 —
110,000 5.74% Senior notes due 2013
125,024 125,038
5.51% Senior notes due 2017 150,000
150,000 3.84% Senior notes due 2021
100,000 —
4.24% Senior notes due 2026 200,000
— Other debt
2,402 2,504
Total debt 586,430
396,644 Less: current portion of long-term debt and short-term debt
2,502 2,602
Total long-term debt $
583,928 $
394,042

79
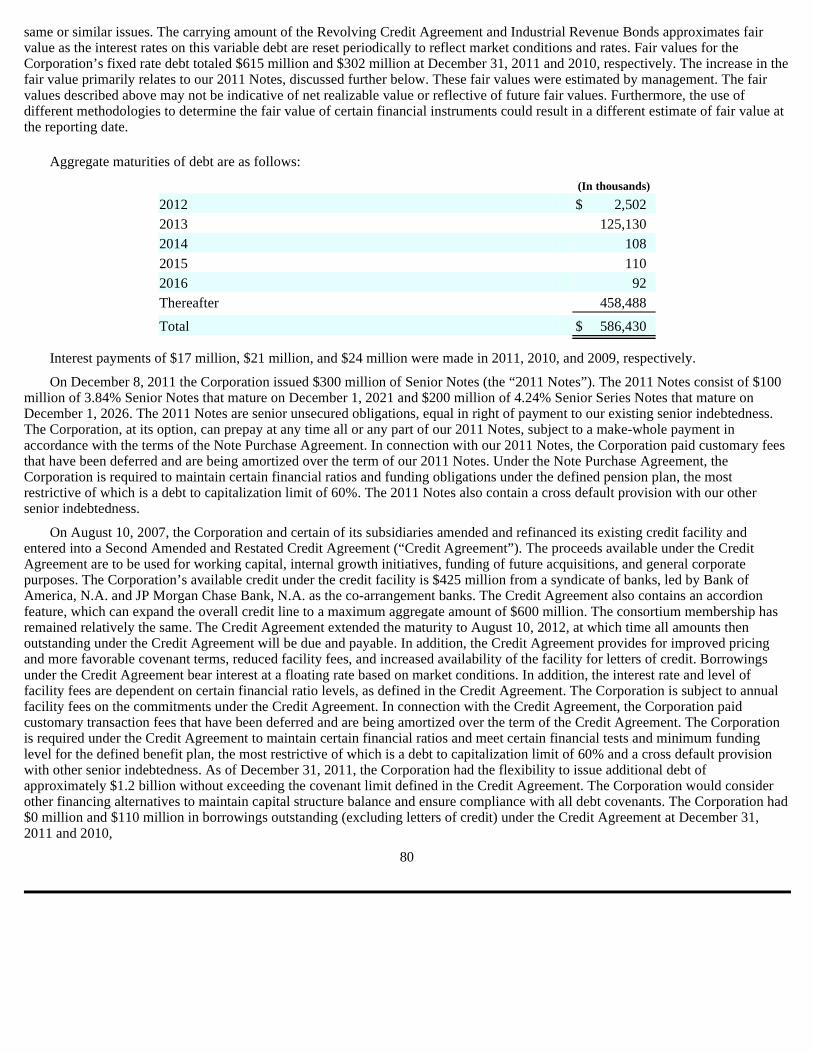
same or similar issues. The carrying amount of the Revolving Credit Agreement and Industrial Revenue Bonds approximates fair value as the interest rates on this variable debt are reset periodically to reflect market conditions and rates. Fair values for the Corporation’s fixed rate debt totaled $615 million and $302 million at December 31, 2011 and 2010, respectively. The increase in the fair value primarily relates to our 2011 Notes, discussed further below. These fair values were estimated by management. The fair values described above may not be indicative of net realizable value or reflective of future fair values. Furthermore, the use of different methodologies to determine the fair value of certain financial instruments could result in a different estimate of fair value at the reporting date.
Aggregate maturities of debt are as follows:
Interest payments of $17 million, $21 million, and $24 million were made in 2011, 2010, and 2009, respectively.
On December 8, 2011 the Corporation issued $300 million of Senior Notes (the “2011 Notes”). The 2011 Notes consist of $100 million of 3.84% Senior Notes that mature on December 1, 2021 and $200 million of 4.24% Senior Series Notes that mature on December 1, 2026. The 2011 Notes are senior unsecured obligations, equal in right of payment to our existing senior indebtedness. The Corporation, at its option, can prepay at any time all or any part of our 2011 Notes, subject to a make-whole payment in accordance with the terms of the Note Purchase Agreement. In connection with our 2011 Notes, the Corporation paid customary fees that have been deferred and are being amortized over the term of our 2011 Notes. Under the Note Purchase Agreement, the Corporation is required to maintain certain financial ratios and funding obligations under the defined pension plan, the most restrictive of which is a debt to capitalization limit of 60%. The 2011 Notes also contain a cross default provision with our other senior indebtedness.
On August 10, 2007, the Corporation and certain of its subsidiaries amended and refinanced its existing credit facility and entered into a Second Amended and Restated Credit Agreement (“Credit Agreement”). The proceeds available under the Credit Agreement are to be used for working capital, internal growth initiatives, funding of future acquisitions, and general corporate purposes. The Corporation’s available credit under the credit facility is $425 million from a syndicate of banks, led by Bank of America, N.A. and JP Morgan Chase Bank, N.A. as the co-arrangement banks. The Credit Agreement also contains an accordion feature, which can expand the overall credit line to a maximum aggregate amount of $600 million. The consortium membership has remained relatively the same. The Credit Agreement extended the maturity to August 10, 2012, at which time all amounts then outstanding under the Credit Agreement will be due and payable. In addition, the Credit Agreement provides for improved pricing and more favorable covenant terms, reduced facility fees, and increased availability of the facility for letters of credit. Borrowings under the Credit Agreement bear interest at a floating rate based on market conditions. In addition, the interest rate and level of facility fees are dependent on certain financial ratio levels, as defined in the Credit Agreement. The Corporation is subject to annual facility fees on the commitments under the Credit Agreement. In connection with the Credit Agreement, the Corporation paid customary transaction fees that have been deferred and are being amortized over the term of the Credit Agreement. The Corporation is required under the Credit Agreement to maintain certain financial ratios and meet certain financial tests and minimum funding level for the defined benefit plan, the most restrictive of which is a debt to capitalization limit of 60% and a cross default provision with other senior indebtedness. As of December 31, 2011, the Corporation had the flexibility to issue additional debt of approximately $1.2 billion without exceeding the covenant limit defined in the Credit Agreement. The Corporation would consider other financing alternatives to maintain capital structure balance and ensure compliance with all debt covenants. The Corporation had $0 million and $110 million in borrowings outstanding (excluding letters of credit) under the Credit Agreement at December 31, 2011 and 2010,
80
(In thousands)
2012 $
2,502 2013
125,130 2014
108 2015
110 2016
92 Thereafter
458,488
Total $
586,430
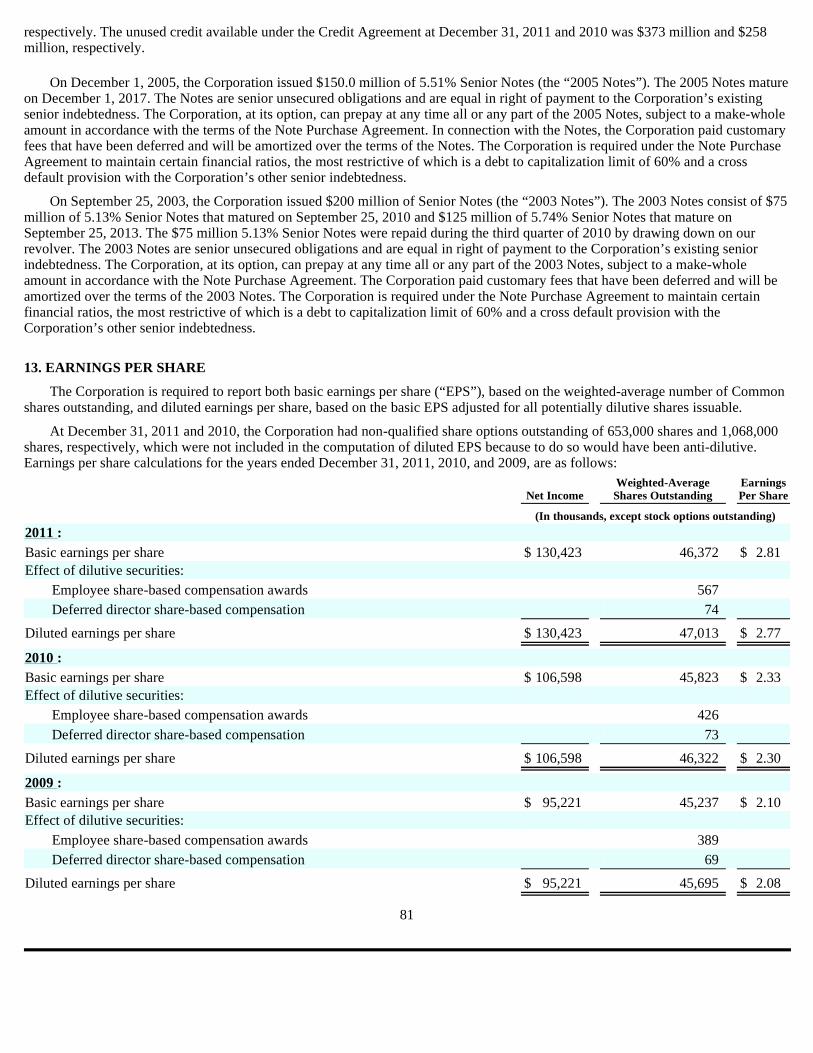
respectively. The unused credit available under the Credit Agreement at December 31, 2011 and 2010 was $373 million and $258 million, respectively.
On December 1, 2005, the Corporation issued $150.0 million of 5.51% Senior Notes (the “2005 Notes”). The 2005 Notes mature on December 1, 2017. The Notes are senior unsecured obligations and are equal in right of payment to the Corporation’s existing senior indebtedness. The Corporation, at its option, can prepay at any time all or any part of the 2005 Notes, subject to a make-whole amount in accordance with the terms of the Note Purchase Agreement. In connection with the Notes, the Corporation paid customary fees that have been deferred and will be amortized over the terms of the Notes. The Corporation is required under the Note Purchase Agreement to maintain certain financial ratios, the most restrictive of which is a debt to capitalization limit of 60% and a cross default provision with the Corporation’s other senior indebtedness.
On September 25, 2003, the Corporation issued $200 million of Senior Notes (the “2003 Notes”). The 2003 Notes consist of $75 million of 5.13% Senior Notes that matured on September 25, 2010 and $125 million of 5.74% Senior Notes that mature on September 25, 2013. The $75 million 5.13% Senior Notes were repaid during the third quarter of 2010 by drawing down on our revolver. The 2003 Notes are senior unsecured obligations and are equal in right of payment to the Corporation’s existing senior indebtedness. The Corporation, at its option, can prepay at any time all or any part of the 2003 Notes, subject to a make-whole amount in accordance with the Note Purchase Agreement. The Corporation paid customary fees that have been deferred and will be amortized over the terms of the 2003 Notes. The Corporation is required under the Note Purchase Agreement to maintain certain financial ratios, the most restrictive of which is a debt to capitalization limit of 60% and a cross default provision with the Corporation’s other senior indebtedness.
13. EARNINGS PER SHARE
The Corporation is required to report both basic earnings per share (“EPS”), based on the weighted-average number of Common shares outstanding, and diluted earnings per share, based on the basic EPS adjusted for all potentially dilutive shares issuable.
At December 31, 2011 and 2010, the Corporation had non-qualified share options outstanding of 653,000 shares and 1,068,000 shares, respectively, which were not included in the computation of diluted EPS because to do so would have been anti-dilutive. Earnings per share calculations for the years ended December 31, 2011, 2010, and 2009, are as follows:
81
Net Income
Weighted-Average Shares Outstanding
Earnings Per Share
(In thousands, except stock options outstanding) 2011 :
Basic earnings per share
$ 130,423
46,372 $
2.81 Effect of dilutive securities:
Employee share-based compensation awards
567
Deferred director share-based compensation 74
Diluted earnings per share $
130,423 47,013
$ 2.77
2010 :
Basic earnings per share $
106,598 45,823
$ 2.33
Effect of dilutive securities:
Employee share-based compensation awards 426
Deferred director share-based compensation
73
Diluted earnings per share $
106,598 46,322
$ 2.30
2009 :
Basic earnings per share $
95,221 45,237
$ 2.10
Effect of dilutive securities:
Employee share-based compensation awards 389
Deferred director share-based compensation
69
Diluted earnings per share $
95,221 45,695
$ 2.08
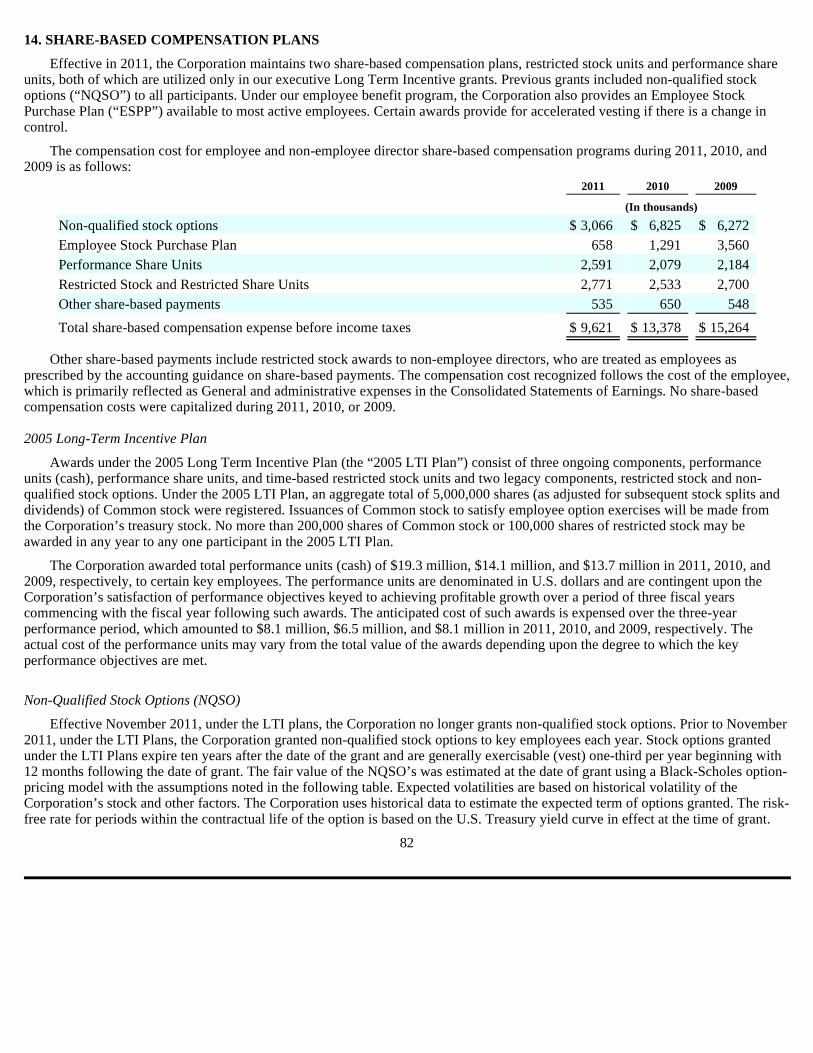
14. SHARE-BASED COMPENSATION PLANS
Effective in 2011, the Corporation maintains two share-based compensation plans, restricted stock units and performance share units, both of which are utilized only in our executive Long Term Incentive grants. Previous grants included non-qualified stock options (“NQSO”) to all participants. Under our employee benefit program, the Corporation also provides an Employee Stock Purchase Plan (“ESPP”) available to most active employees. Certain awards provide for accelerated vesting if there is a change in control.
The compensation cost for employee and non-employee director share-based compensation programs during 2011, 2010, and 2009 is as follows:
Other share-based payments include restricted stock awards to non-employee directors, who are treated as employees as prescribed by the accounting guidance on share-based payments. The compensation cost recognized follows the cost of the employee, which is primarily reflected as General and administrative expenses in the Consolidated Statements of Earnings. No share-based compensation costs were capitalized during 2011, 2010, or 2009.
2005 Long-Term Incentive Plan
Awards under the 2005 Long Term Incentive Plan (the “2005 LTI Plan”) consist of three ongoing components, performance units (cash), performance share units, and time-based restricted stock units and two legacy components, restricted stock and non-qualified stock options. Under the 2005 LTI Plan, an aggregate total of 5,000,000 shares (as adjusted for subsequent stock splits and dividends) of Common stock were registered. Issuances of Common stock to satisfy employee option exercises will be made from the Corporation’s treasury stock. No more than 200,000 shares of Common stock or 100,000 shares of restricted stock may be awarded in any year to any one participant in the 2005 LTI Plan.
The Corporation awarded total performance units (cash) of $19.3 million, $14.1 million, and $13.7 million in 2011, 2010, and 2009, respectively, to certain key employees. The performance units are denominated in U.S. dollars and are contingent upon the Corporation’s satisfaction of performance objectives keyed to achieving profitable growth over a period of three fiscal years commencing with the fiscal year following such awards. The anticipated cost of such awards is expensed over the three-year performance period, which amounted to $8.1 million, $6.5 million, and $8.1 million in 2011, 2010, and 2009, respectively. The actual cost of the performance units may vary from the total value of the awards depending upon the degree to which the key performance objectives are met.
Non-Qualified Stock Options (NQSO)
Effective November 2011, under the LTI plans, the Corporation no longer grants non-qualified stock options. Prior to November 2011, under the LTI Plans, the Corporation granted non-qualified stock options to key employees each year. Stock options granted under the LTI Plans expire ten years after the date of the grant and are generally exercisable (vest) one-third per year beginning with 12 months following the date of grant. The fair value of the NQSO’s was estimated at the date of grant using a Black-Scholes option-pricing model with the assumptions noted in the following table. Expected volatilities are based on historical volatility of the Corporation’s stock and other factors. The Corporation uses historical data to estimate the expected term of options granted. The risk-free rate for periods within the contractual life of the option is based on the U.S. Treasury yield curve in effect at the time of grant.
82
2011
2010
2009
(In thousands) Non-qualified stock options
$ 3,066
$ 6,825
$ 6,272
Employee Stock Purchase Plan 658
1,291 3,560
Performance Share Units 2,591
2,079 2,184
Restricted Stock and Restricted Share Units 2,771
2,533 2,700
Other share-based payments 535
650 548
Total share-based compensation expense before income taxes $
9,621 $
13,378 $
15,264

A summary of employee stock option activity under the LTI Plans is as follows:
The total intrinsic value of stock options exercised during 2011, 2010, and 2009 was $3.9 million, $1.8 million, and $1.9 million, respectively. The above table represents the Corporation’s estimate of options fully vested and/or expected to vest. Expected forfeitures are not material and therefore are not reflected in the above table.
NQSO grants vest over three years and compensation cost is recognized over the requisite service period for each separately vesting portion of each award as if each award, was in substance, multiple awards. During 2011, 2010, and 2009, compensation cost associated with NQSO’s was $3.1 million, $6.8 million, and $6.3 million respectively, which was charged to expense. As of December 31, 2011, there was $1.5 million of unrecognized compensation cost related to non-vested stock options, which is expected to be recognized over a weighted-average period of 1.3 years.
Cash received from option exercises during 2011, 2010, and 2009 was $4.2 million, $1.8 million, and $2.3 million, respectively. The total tax benefit generated from options exercised during 2011, 2010, and 2009, was $1.1 million, $0.6 million, and $0.5 million, respectively. Tax benefits received on exercised options, which were subject to expense under U.S. GAAP, have been credited to deferred taxes up to the amount of benefit recorded in the income statement, with the difference charged to additional paid in capital, while tax benefits received on exercised options that were not subject to expense have been credited to additional paid in capital.
Performance Share Units
Since 2005, the Corporation granted performance share units to certain employees under the 2005 LTI Plan, whose vesting is contingent upon meeting various company-wide, three-year performance goals around net income targets, both against budget and as a percentage of sales against a peer group. The non-vested shares are subject to forfeiture if established performance goals are not met, or employment is terminated other than due to death, disability, or retirement. Share plans are denominated in share-based units based on the fair market value of the Corporation’s Common stock on the date of grant.
83
2011
2010
2009
Risk-free rate 2.45 %
1.68 % 2.53 %
Expected volatility
30.20 % 30.50 %
29.67 %
Expected dividends 0.92 %
1.07 % 1.22 %
Expected term (in years)
6 6
6 Weighted-average grant-date fair value of options
$ 10.57
$ 8.52
$ 9.19
Shares (000’s)
Weighted- Average
Exercise Price
Weighted- Average
Remaining Contractual Term
in Years
Aggregate Intrinsic
Value (000’s)
Outstanding at December 31, 2010 3,743
$ 30.87
Granted
13 34.86
Exercised
(241 ) 17.42
Forfeited
(108 ) 31.06
Outstanding at December 31, 2011 3,407
$ 31.83
6.4 $
11,924
Exercisable at December 31, 2011 2,653
$ 32.30
5.8 $
8,044

A summary of the Corporation’s performance-share units for 2011 is as follows:
Shares/ Units
(000’s)
Weighted- Average
Fair Value
Weighted-Average Remaining
Contractual Term in Years
Aggregate Intrinsic
Value (000’s)
Non-vested at December 31, 2010 876
$ 32.13
Granted
184 32.97
Vested
(33 ) 54.00
Forfeited
(101 ) 30.65
Non-vested at December 31, 2011 926
$ 31.67
2.0 $
32,711
Expected to vest at December 31, 2011(A) 382
$ 33.00
2.4 $
13,488
The performance share unit’s compensation cost is amortized to expense on a straight-line basis over the three-year requisite service period. As forfeiture and performance assumptions change, compensation cost will be adjusted on a cumulative basis in the period of the assumption change. As of December 31, 2011, the weighted average remaining vesting term of performance based share units is 2.4 years.
Time Based Restricted Stock and Restricted Share Units
Time based restricted stock and share units cliff vest three years after the date of grant.
The restricted stock and restricted share units contain only a service condition, and thus compensation cost is amortized to expense on a straight-line basis over the requisite service period, which ranged from 3.0 years to 10.1 years. The non-vested restricted stock is subject to forfeiture if employment is terminated other than due to death or disability. The restricted units and restricted share units are subject to forfeiture if employment is terminated and are nontransferable.
A summary of the Corporation’s time-based restricted stock and restricted share units for 2011 is as follows:
As of December 31, 2011, there was $7.4 million of unrecognized compensation cost, which is expected to be recognized over a period of 2.9 years related to non-vested restricted stock and restricted share units.
Employee Stock Purchase Plan
The Corporation’s Employee Stock Purchase Plan (“ESPP”) enables eligible employees to purchase the Corporation’s Common stock at a price per share equal to 85% of the fair market value at the end of each offering period. Each offering period of the ESPP lasts six months, commencing on January 1st and July 1st of each year. Participation in the offering is limited to 10% of an employee’s base salary (not to exceed amounts allowed under Section 423 of the Internal Revenue Code), participation may be terminated at any time by the employee, and automatically ends on termination of employment with the Corporation. Effective January 1, 2011, the Corporation increased the number of shares authorized for issuance under the ESPP by an additional 1,200,000 shares, from 2,000,000 to 3,200,000, and extended the term of the ESPP by an additional two years through October 1, 2015. The Common stock to satisfy the stock purchases under the ESPP were originally designated as newly issued shares of Common stock; however, the Company has reserved the additional
84
(A)
– Based on 200% of target payout.
Shares/ Units
(000’s)
Weighted- Average
Fair Value
Weighted-Average Remaining
Contractual Term in Years
Aggregate Intrinsic
Value (000’s)
Non-vested at December 31, 2010 340
$ 32.51
Granted
105 33.00
Vested
(73 ) 30.12
Forfeited
(4 ) 29.99
Non-vested at December 31, 2011 368
$ 33.15
2.9 $
13,006
Expected to vest at December 31, 2011 368
$ 33.15
2.9 $
13,006

1,200,000 shares from Treasury. During 2011, there were 320,810 shares purchased under the ESPP. As of December 31, 2011, there were 1,424,322 million shares available for future offerings, and the Corporation has withheld $4.3 million from employees, the equivalent of 142,515 shares. Compensation cost is recognized on a straight- line basis over the six-month vesting period during which employees perform related services. The Corporation recognized $0.3 million of tax benefit associated with disqualifying dispositions during 2011, all of which was credited to additional paid in capital. Effective as of January 1, 2010, the plan’s look-back feature was eliminated from the ESPP.
2005 Stock Plan for Non-Employee Directors
The 2005 Stock Plan for Non-Employee Directors (“2005 Stock Plan”), approved by the stockholders in 2005, provided for the grant of stock awards and, at the option of the non-employee directors, the deferred payment of regular stipulated compensation and meeting fees in equivalent shares. Under the 2005 Stock Plan, the Corporation’s non-employee directors each receive an annual restricted stock award, which is subject to a three-year restriction period commencing on the date of the grant. For 2011, 2010 and 2009, the value of the award granted was $70,000 per director, respectively. These restricted stock awards are subject to forfeiture if the non- employee director resigns or retires by reason of his or her decision not to stand for re-election prior to the lapsing of all restrictions, unless the restrictions are otherwise removed by the Committee on Directors and Governance. The cost of the restricted stock awards will be amortized over the three year restriction period from the date of grant, or such shorter restriction period as determined by the removal of such restrictions. Newly elected non-employee directors also receive a one-time five year restricted stock award of $ 35,000. The total number of shares of Common stock available for grant under the 2005 Stock Plan may not exceed 100,000 shares. During 2011, 2010 and 2009, the Corporation awarded 16,680, 18,456, and 18,168, respectively, shares of restricted stock under the 2005 Stock Plan, of which 7,820, 9,228, and 12,490 shares, respectively, have been deferred by certain directors.
Pursuant to election by non-employee directors to receive shares in lieu of payment for earned and deferred compensation under the 2005 Stock Plan, the Corporation had provided for an aggregate additional 74,017 and 72,955 shares at an average price of $30.26 and $29.00, respectively, as of December 31, 2011 and 2010. During 2011 and 2010, the Corporation issued 12,687 and 10,836 shares, respectively, in compensation pursuant to such elections.
15. ENVIRONMENTAL COSTS
The Corporation has been named as a potentially responsible party (“PRP”), as have many other corporations and municipalities, in a number of environmental clean-up sites. The Corporation continues to make progress in resolving these claims through settlement discussions and payments from established reserves. The superfund sites remaining open at the end of the year are: Caldwell Trucking landfill superfund site, located in Fairfield, New Jersey; Sharkey landfill superfund site, located in Parsippany, New Jersey; and Chemsol, Inc. superfund site, located in Piscataway, New Jersey. The Corporation believes that the outcome for any of these remaining sites will not have a materially adverse effect on the Corporation’s results of operations or financial condition.
The Corporation has continued the operation of the ground water and soil remediation activities at the Wood-Ridge, New Jersey, site through 2011. The cost of constructing and operating this site was provided for in 1990 when the Corporation established a reserve to remediate the property. Even though this property was sold in December 2001, the Corporation retained the responsibility for this remediation in accordance with the sale agreement. The reserve balance as of December 31, 2011, was $7.3 million, which is essentially unchanged from the prior year.
In 2005, the Corporation sold its Fairfield, New Jersey, property, which was formerly an operating facility for the Corporation’s Motion Control segment. Under the sale agreement, the Corporation has retained the responsibility to continue the ongoing environmental remediation on the property. As of December 31, 2011, the Corporation’s reserve balance was $0.6 million.
In 1992, the Corporation was named as a PRP in the Caldwell Trucking superfund site. The majority of the costs for this site have been for soil and groundwater remediation. As of December 31, 2011, the Corporation’s reserve balance was $4.6 million, which largely represents continuing operation and maintenance costs, system performance monitoring efforts, and assessment sampling.
85

The Corporation maintains several NRC licenses necessary for the continued operation of the EMD facility in Cheswick, Pennsylvania. In connection with these licenses, the NRC requires financial assurance from the Corporation in the form of a parent company guarantee representing estimated environmental decommissioning and remediation costs associated with the commercial operations covered by the licenses. In addition, the Corporation has obligations for additional environmental remediation costs at this facility, which are ongoing. The Corporation has partial environmental insurance coverage specifically for this facility. The policy provides coverage for losses due to on or off-site pollution conditions, which are pre-existing and unknown. As of December 31, 2011, the Corporation’s reserve balance was $7.7 million.
The Corporation’s aggregate environmental obligation at December 31, 2011 was $20.5 million compared to $20.8 million at December 31, 2010. Approximately 40.8% of the Corporation’s environmental reserves as of December 31, 2011, represent the current value of anticipated remediation costs and are not discounted primarily due to the uncertainty of timing of expenditures. The remaining environmental reserves are discounted using an appropriate discount rate to reflect the time value of money since the amount and timing of cash payments for the liability are reliably determinable. All environmental reserves exclude any potential recovery from insurance carriers or third-party legal actions. As of December 31, 2011, the undiscounted cash flows associated with the discounted reserves were $19.9 million and are anticipated to be paid over the next 30 years.
16. PENSION AND OTHER POSTRETIREMENT BENEFIT PLANS
The Corporation maintains eleven separate and distinct pension and other postretirement defined benefit plans, consisting of four domestic pensions and other postretirement benefit plans and seven separate foreign pension plans. The Corporation maintains the following domestic plans: a qualified pension plan, a non-qualified pension plan, and a postretirement health-benefits plan (the “Curtiss-Wright Plans”), and a postretirement health benefits plan for EMD employees.
The foreign plans consist of three defined benefit pension plans in the United Kingdom, two in Mexico, and one plan each in Canada and Switzerland. In 2010, a defined benefit plan in Norway was terminated and replaced with a defined contribution plan. The total projected benefit obligation related to all foreign plans is $74.0 million as of December 31, 2011. Each plan and further information on the Norway plan termination is described below.
Domestic Plans
The Curtiss-Wright Plans
The Corporation maintains a defined benefit pension plan (the “CW Pension Plan”) covering all employees under four benefit formulas: a non-contributory non-union and union formula for all Curtiss-Wright (“CW”) employees and a contributory union and non-union benefit formula for employees at the EMD business unit.
The formula for CW non-union employees is composed of a “traditional” benefit based on years of credited service, the five highest consecutive years’ compensation during the last ten years of service, and a “cash balance” benefit. CW union employees who have negotiated a benefit under the CW Pension Plan are entitled to a benefit based on years of service multiplied by a monthly pension rate. Employees become participants under the CW Pension Plan after one year of service and are vested after three years of service. The formula for EMD employees covers both union and non-union employees and is designed to satisfy the requirements of relevant collective bargaining agreements. Employee contributions are withheld each pay period and are equal to 1.5% of salary. The benefits for the EMD employees are based on years of service and compensation.
Effective February 1, 2010, the Corporation amended the CW Pension Plan to close the traditional benefit to new entrants. All new employees hired on or after the effective date will be eligible for the cash balance benefit. The amendment does not affect CW employees that are subject to collective bargaining agreements or employees of EMD.
At December 31, 2011 and 2010, the Corporation had a noncurrent pension liability of $180.8 million and $112.1 million, respectively. The Corporation made $34.5 million of contributions to the CW Pension Plan in
86
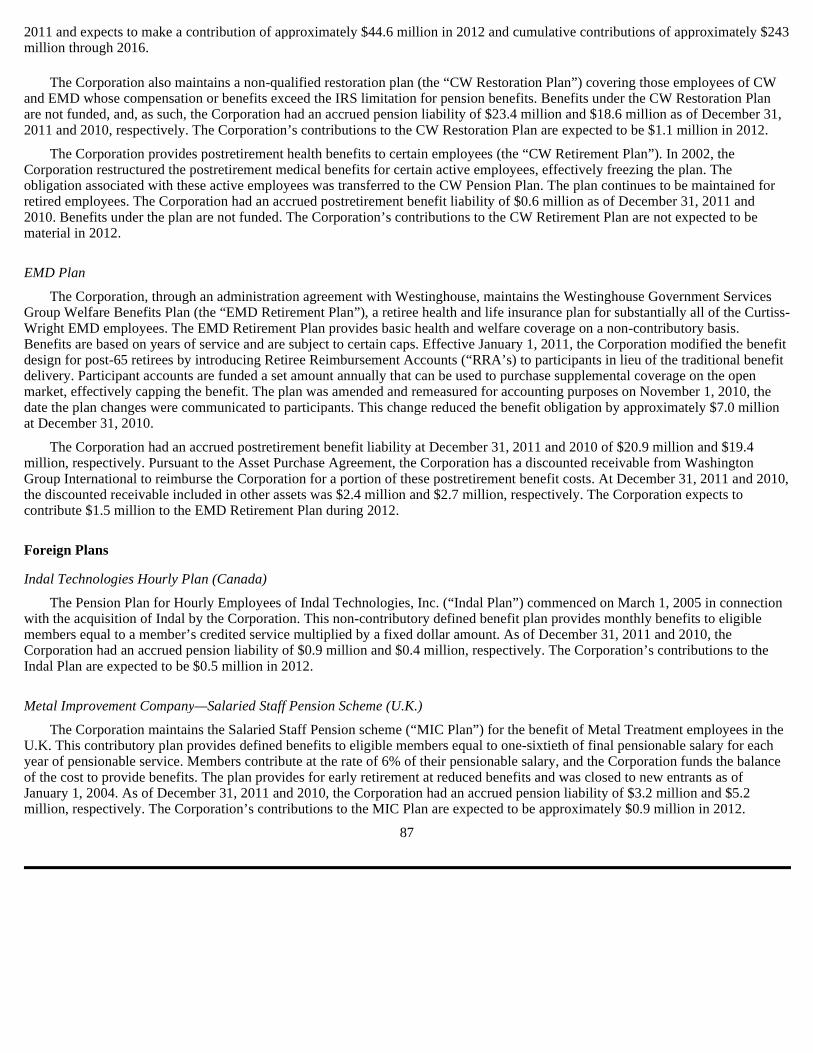
2011 and expects to make a contribution of approximately $44.6 million in 2012 and cumulative contributions of approximately $243 million through 2016.
The Corporation also maintains a non-qualified restoration plan (the “CW Restoration Plan”) covering those employees of CW and EMD whose compensation or benefits exceed the IRS limitation for pension benefits. Benefits under the CW Restoration Plan are not funded, and, as such, the Corporation had an accrued pension liability of $23.4 million and $18.6 million as of December 31, 2011 and 2010, respectively. The Corporation’s contributions to the CW Restoration Plan are expected to be $1.1 million in 2012.
The Corporation provides postretirement health benefits to certain employees (the “CW Retirement Plan”). In 2002, the Corporation restructured the postretirement medical benefits for certain active employees, effectively freezing the plan. The obligation associated with these active employees was transferred to the CW Pension Plan. The plan continues to be maintained for retired employees. The Corporation had an accrued postretirement benefit liability of $0.6 million as of December 31, 2011 and 2010. Benefits under the plan are not funded. The Corporation’s contributions to the CW Retirement Plan are not expected to be material in 2012.
EMD Plan
The Corporation, through an administration agreement with Westinghouse, maintains the Westinghouse Government Services Group Welfare Benefits Plan (the “EMD Retirement Plan”), a retiree health and life insurance plan for substantially all of the Curtiss-Wright EMD employees. The EMD Retirement Plan provides basic health and welfare coverage on a non-contributory basis. Benefits are based on years of service and are subject to certain caps. Effective January 1, 2011, the Corporation modified the benefit design for post-65 retirees by introducing Retiree Reimbursement Accounts (“RRA’s) to participants in lieu of the traditional benefit delivery. Participant accounts are funded a set amount annually that can be used to purchase supplemental coverage on the open market, effectively capping the benefit. The plan was amended and remeasured for accounting purposes on November 1, 2010, the date the plan changes were communicated to participants. This change reduced the benefit obligation by approximately $7.0 million at December 31, 2010.
The Corporation had an accrued postretirement benefit liability at December 31, 2011 and 2010 of $20.9 million and $19.4 million, respectively. Pursuant to the Asset Purchase Agreement, the Corporation has a discounted receivable from Washington Group International to reimburse the Corporation for a portion of these postretirement benefit costs. At December 31, 2011 and 2010, the discounted receivable included in other assets was $2.4 million and $2.7 million, respectively. The Corporation expects to contribute $1.5 million to the EMD Retirement Plan during 2012.
Foreign Plans
Indal Technologies Hourly Plan (Canada)
The Pension Plan for Hourly Employees of Indal Technologies, Inc. (“Indal Plan”) commenced on March 1, 2005 in connection with the acquisition of Indal by the Corporation. This non-contributory defined benefit plan provides monthly benefits to eligible members equal to a member’s credited service multiplied by a fixed dollar amount. As of December 31, 2011 and 2010, the Corporation had an accrued pension liability of $0.9 million and $0.4 million, respectively. The Corporation’s contributions to the Indal Plan are expected to be $0.5 million in 2012.
Metal Improvement Company—Salaried Staff Pension Scheme (U.K.)
The Corporation maintains the Salaried Staff Pension scheme (“MIC Plan”) for the benefit of Metal Treatment employees in the U.K. This contributory plan provides defined benefits to eligible members equal to one-sixtieth of final pensionable salary for each year of pensionable service. Members contribute at the rate of 6% of their pensionable salary, and the Corporation funds the balance of the cost to provide benefits. The plan provides for early retirement at reduced benefits and was closed to new entrants as of January 1, 2004. As of December 31, 2011 and 2010, the Corporation had an accrued pension liability of $3.2 million and $5.2 million, respectively. The Corporation’s contributions to the MIC Plan are expected to be approximately $0.9 million in 2012.
87

Penny & Giles Pension Plan (U.K.)
The Penny & Giles Pension Plan (“P&G Plan”) is a contributory plan that provides for both defined benefit and defined contribution benefits. Defined benefit members are entitled to final salary related benefits equal to one-sixtieth of final pensionable salary for each year of pensionable service. The P&G Plan provides for early retirement at reduced benefits and was closed to new entrants at time of acquisition in 2002. The following disclosures include information for the Penny & Giles defined benefit section only, which represents the majority of the P&G Plan’s costs. As of December 31, 2011 and 2010, the Corporation had an accrued pension liability of $2.0 million and $5.3 million, respectively. The Corporation’s contributions to the P&G Plan are expected to be approximately $1.9 million in 2012.
Mechetronics Limited Retirement Benefits Scheme (U.K.)
The Corporation assumed defined benefit obligations as a result of our Mechetronics acquisition on October 1, 2009. The plan is based on final pensionable salary and years of service. As a result of the restructuring of Mechetronics and the consolidation of U.K. operations, there are no active employees in the pension plan as of December 31, 2010 as the employees became deferred vested participants. See Note 10 to the Consolidated Financial Statements for further information regarding the restructuring. As of December 31, 2011 and 2010, the Corporation had an accrued pension liability of $3.0 million and $4.8 million, respectively. The Corporation’s contributions to the plans are expected to be $0.4 million in 2012.
Curtiss Wright Antriebstechnik GmbH (“CWAT”) Pension Plan (Switzerland)
CWAT sponsors a defined contribution plan covering 85 employees as of December 31, 2011. Under Swiss Law, there is a guaranteed minimum benefit requirement which must be valued as a defined benefit obligation for U.S. GAAP purposes. As of December 31, 2011 and 2010, the Corporation had an accrued pension liability of $0.3 million and $2.4 million, respectively. The Corporation’s contributions to the plan are expected to be immaterial in 2012.
VMETRO ASA Pension Plan
The Corporation assumed defined benefit obligations as a result of our VMETRO acquisition on October 15, 2008. The group pension plan entitles the employees of the Norwegian companies with future benefits based on years of service, the wage level at time of retirement, and benefits from the national insurance plan. Effective December 31, 2010, the Corporation terminated the existing defined benefit plan and replaced it with a defined contribution plan covering employee service beginning on January 1, 2011. The plan termination resulted in one-time curtailment and settlement gains of approximately $1.6 million in 2010. The Corporation did not have an accrued pension liability as of December 31, 2010.
The following table details the components of net periodic pension expense for all Pension Plans:
Net periodic benefit cost, specifically service and interest cost, has increased over the reported periods due to growth in headcount and service accruals related to existing employees under the age and service-based formula in the plan.
The Cost of settlements/curtailments indicated above represent events that are accounted for under guidance on employers’ accounting for settlements and curtailments of defined benefit pension plans. The settlement charge in 2011 is resulting from the retirement of employees in Switzerland and Mexico. In 2010, the gain resulted from the termination of the defined benefit plan in Norway, offset by settlement charges due
88
Components of net periodic benefit expense:
2011
2010
2009
(In thousands) Service cost
$ 36,276
$ 33,332
$ 27,067
Interest cost 26,361
25,248 24,234
Expected return on plan assets (31,635 )
(28,904 ) (29,039 )
Amortization of prior service cost
1,210 1,111
646 Recognized net actuarial loss
5,464 1,815
2,287 Cost of settlements/curtailments
194 (1,245 )
1,418
Net periodic benefit cost $
37,870 $
31,357 $
26,613
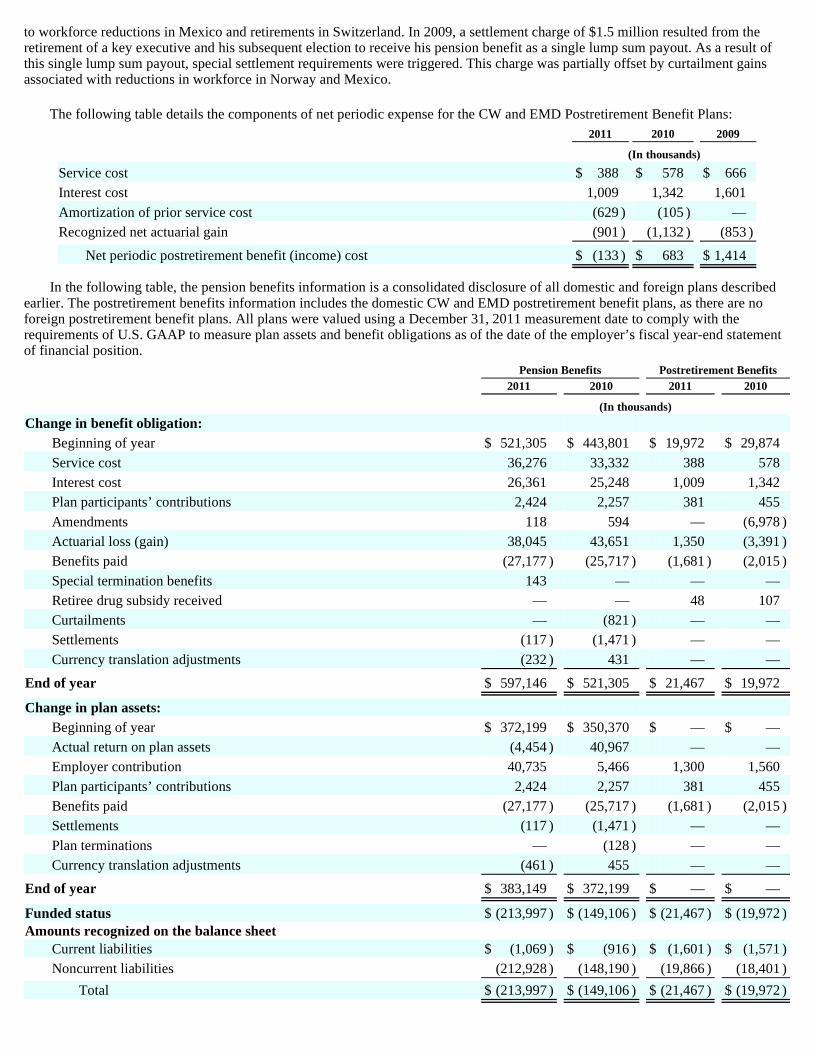
to workforce reductions in Mexico and retirements in Switzerland. In 2009, a settlement charge of $1.5 million resulted from the retirement of a key executive and his subsequent election to receive his pension benefit as a single lump sum payout. As a result of this single lump sum payout, special settlement requirements were triggered. This charge was partially offset by curtailment gains associated with reductions in workforce in Norway and Mexico.
The following table details the components of net periodic expense for the CW and EMD Postretirement Benefit Plans:
In the following table, the pension benefits information is a consolidated disclosure of all domestic and foreign plans described earlier. The postretirement benefits information includes the domestic CW and EMD postretirement benefit plans, as there are no foreign postretirement benefit plans. All plans were valued using a December 31, 2011 measurement date to comply with the requirements of U.S. GAAP to measure plan assets and benefit obligations as of the date of the employer’s fiscal year-end statement of financial position.
2011
2010
2009
(In thousands) Service cost
$ 388
$ 578
$ 666
Interest cost 1,009
1,342 1,601
Amortization of prior service cost (629 )
(105 ) —
Recognized net actuarial gain (901 )
(1,132 ) (853 )
Net periodic postretirement benefit (income) cost $
(133 ) $
683 $
1,414
Pension Benefits
Postretirement Benefits
2011
2010
2011
2010
(In thousands) Change in benefit obligation:
Beginning of year
$ 521,305
$ 443,801
$ 19,972
$ 29,874
Service cost 36,276
33,332 388
578 Interest cost
26,361 25,248
1,009 1,342
Plan participants’ contributions 2,424
2,257 381
455 Amendments
118 594
— (6,978 )
Actuarial loss (gain)
38,045 43,651
1,350 (3,391 )
Benefits paid
(27,177 ) (25,717 )
(1,681 ) (2,015 )
Special termination benefits
143 —
— —
Retiree drug subsidy received —
— 48
107 Curtailments
— (821 )
— —
Settlements (117 )
(1,471 ) —
— Currency translation adjustments
(232 ) 431
— —
End of year $
597,146 $
521,305 $
21,467 $
19,972
Change in plan assets:
Beginning of year $
372,199 $
350,370 $
— $
— Actual return on plan assets
(4,454 ) 40,967
— —
Employer contribution 40,735
5,466 1,300
1,560 Plan participants’ contributions
2,424 2,257
381 455
Benefits paid (27,177 )
(25,717 ) (1,681 )
(2,015 )
Settlements (117 )
(1,471 ) —
— Plan terminations
— (128 )
— —
Currency translation adjustments (461 )
455 —
—
End of year $
383,149 $
372,199 $
— $
—
Funded status $
(213,997 ) $
(149,106 ) $
(21,467 ) $
(19,972 )
Amounts recognized on the balance sheet
Current liabilities $
(1,069 ) $
(916 ) $
(1,601 ) $
(1,571 )
Noncurrent liabilities (212,928 )
(148,190 ) (19,866 )
(18,401 )
Total $
(213,997 ) $
(149,106 ) $
(21,467 ) $
(19,972 )

89

Plan Assumptions
The discount rate for each plan is determined by discounting the plan’s expected future benefit payments using a yield curve developed from high quality bonds that are rated Aa or better by Moody’s as of the measurement date. The yield curve calculation matches the notional cash inflows of the hypothetical bond portfolio with the expected benefit payments to arrive at one effective rate for each plan.
The overall expected return on assets assumption is based on a combination of historical performance of the pension fund and expectations of future performance. Expected future performance is determined by weighting the expected returns for each asset class by the plan’s asset allocation. The expected returns are based on long- term capital market assumptions utilizing a ten-year time horizon through consultation with investment advisors. While consideration is given to recent performance and historical returns, the assumption represents a long-term prospective return.
The effect on the CW and EMD Retirement Plans of a 1% change in the health care cost trend is as follows:
90
Pension Benefits
Postretirement Benefits
2011
2010
2011
2010
(In thousands) Amounts recognized in accumulated other comprehensive income (AOCI)
Net actuarial loss (gain)
$ 175,524
$ 106,752
$ (10,516 )
$ (12,768 )
Prior service cost
6,791 7,889
(6,244 ) (6,873 )
Total $
182,315 $
114,641 $
(16,760 ) $
(19,641 )
Amounts in AOCI expected to be recognized in net periodic cost in the coming year:
Loss (gain) recognition
$ 9,979
$ 4,948
$ (719 )
$ (925 )
Prior service cost recognition
$ 1,200
$ 1,196
$ (629 )
$ (629 )
Accumulated benefit obligation
$ 546,635
$ 476,792
N/A N/A
Information for pension plans with an accumulated benefit obligation in excess of plan assets:
Projected benefit obligation
$ 557,316
$ 497,237
N/A N/A
Accumulated benefit obligation 516,115
462,416 N/A
N/A Fair value of plan assets
345,640 353,473
N/A N/A
Pension Benefits
Postretirement Benefits
2011
2010
2011
2010
(In thousands) Weighted-average assumptions in determination of benefit obligation:
Discount rate
4.46 % 5.16 %
4.48 % 5.21 %
Rate of compensation increase
3.96 % 3.99 %
N/A N/A
Health care cost trends:
Rate assumed for subsequent year N/A
N/A 8.00 %
8.50 %
Ultimate rate reached in 2019 and 2014, respectively N/A
N/A 5.50 %
5.50 %
Weighted-average assumptions in determination of net periodic benefit cost:
Discount rate 5.16 %
5.89 % 5.21 %
5.98 %
Expected return on plan assets 8.14 %
8.09 % N/A
N/A Rate of compensation increase
3.99 % 4.04 %
N/A N/A
Health care cost trends:
Rate assumed for subsequent year N/A
N/A 8.50 %
9.50 %
Ultimate rate reached in 2019 and 2014, respectively N/A
N/A 5.50 %
5.50 %
1% Increase
1% Decrease
(In thousands) Total service and interest cost components
$ 1
$ (1 )
Postretirement benefit obligation
$ 31
$ (32 )

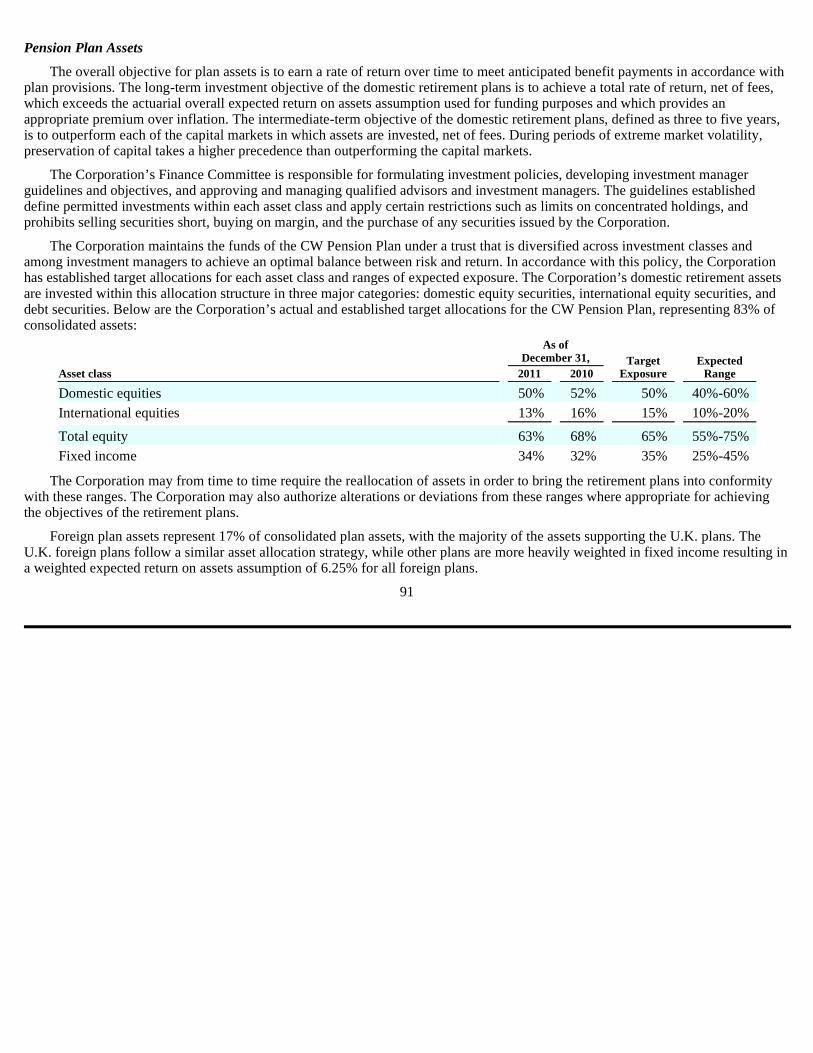
Pension Plan Assets
The overall objective for plan assets is to earn a rate of return over time to meet anticipated benefit payments in accordance with plan provisions. The long-term investment objective of the domestic retirement plans is to achieve a total rate of return, net of fees, which exceeds the actuarial overall expected return on assets assumption used for funding purposes and which provides an appropriate premium over inflation. The intermediate-term objective of the domestic retirement plans, defined as three to five years, is to outperform each of the capital markets in which assets are invested, net of fees. During periods of extreme market volatility, preservation of capital takes a higher precedence than outperforming the capital markets.
The Corporation’s Finance Committee is responsible for formulating investment policies, developing investment manager guidelines and objectives, and approving and managing qualified advisors and investment managers. The guidelines established define permitted investments within each asset class and apply certain restrictions such as limits on concentrated holdings, and prohibits selling securities short, buying on margin, and the purchase of any securities issued by the Corporation.
The Corporation maintains the funds of the CW Pension Plan under a trust that is diversified across investment classes and among investment managers to achieve an optimal balance between risk and return. In accordance with this policy, the Corporation has established target allocations for each asset class and ranges of expected exposure. The Corporation’s domestic retirement assets are invested within this allocation structure in three major categories: domestic equity securities, international equity securities, and debt securities. Below are the Corporation’s actual and established target allocations for the CW Pension Plan, representing 83% of consolidated assets:
The Corporation may from time to time require the reallocation of assets in order to bring the retirement plans into conformity with these ranges. The Corporation may also authorize alterations or deviations from these ranges where appropriate for achieving the objectives of the retirement plans.
Foreign plan assets represent 17% of consolidated plan assets, with the majority of the assets supporting the U.K. plans. The U.K. foreign plans follow a similar asset allocation strategy, while other plans are more heavily weighted in fixed income resulting in a weighted expected return on assets assumption of 6.25% for all foreign plans.
91
Asset class
As of December 31,
Target Exposure
Expected Range
2011
2010
Domestic equities 50%
52% 50%
40%-60% International equities
13% 16%
15% 10%-20%
Total equity 63%
68% 65%
55%-75% Fixed income
34% 32%
35% 25%-45%

Fair Value Measurements
The following table presents consolidated plan assets using the fair value hierarchy as of December 31, 2011:
92
Asset Category
Total
Quoted Prices in Active
Markets for Identical
Assets (Level 1)
Significant Observable
Inputs (Level 2)
Significant Unobservable
Inputs (Level 3)
Cash $
16,628 $
1,932 $
14,696 $
— Equity Securities:
U.S. Large Cap (a)
116,277 116,084
193 —
U.S. Small Cap (b) 28,726
28,726 —
— Foreign Large Cap (c)
53,311 53,311
— —
Foreign Mid Cap 222
222 —
— Foreign Index Funds (d)
24,612 2,219
22,393 —
Balanced Funds (e) 10,472
— 10,472
—
Total Equities $
233,620 $
200,562 $
33,058 $
— Fixed Income Securities:
U.S. Corporate Bonds (f)
19,472 —
19,472 —
U.S. Government Bonds 700
700 —
— U.S. Fixed Income Mutual Fund (g)
59,791 59,791
— —
US Other Fixed Income (h) 23,062
23,062 —
— Foreign Government Bonds (i)
3,996 1,410
2,586 —
Foreign Corporate Bonds (i) 4,306
1,745 2,561
— Foreign Government Index Funds (j)
1,616 —
1,616 —
Foreign Corporate Bond Index Funds (j) 9,265
— 9,265
—
Total Fixed Income Securities $
122,208 $
86,708 $
35,500 $
— Alternative Investments:
Insurance Contracts (k)
10,081 —
— 10,081
Total Alternative Investments $
10,081 $
— $
— $
10,081 Real Estate:
Foreign Real Estate (l)
612 —
— 612
Total Real Estate $
612 $
— $
— $
612 Total Assets
$ 383,149
$ 289,202
$ 83,254
$ 10,693

The following table presents consolidated plan assets using the fair value hierarchy as of December 31, 2010:
Asset Category
Total
Quoted Prices in Active
Markets for Identical Assets
(Level 1)
Significant Observable
Inputs (Level 2)
Significant Unobservable
Inputs (Level 3)
Cash $
7,354 $
989 $
6,365 $
— Equity Securities:
U.S. Large Cap (a)
120,865 120,475
390 —
U.S. Small Cap (b) 28,048
28,048 —
— Foreign Large Cap (c)
60,355 60,355
— —
Foreign Mid Cap 116
116 —
— Foreign Index Funds (d)
26,062 68
25,994 —
Balanced Funds (e) 5,432
— 5,432
—
Total Equities $
240,878 $
209,062 $
31,816 $
— Fixed Income Securities:
U.S. Corporate Bonds (f)
18,120 —
18,120 —
U.S Government Bonds 1,427
1,427 —
— U.S. Fixed Income Mutual Fund (g)
54,808 54,808
— —
U.S. Other Fixed Income (h) 21,658
— 21,658
— Foreign Government Bonds (i)
4,788 1,509
3,279 —
Foreign Corporate Bonds (i) 3,215
1,494 1,721
— Foreign Government Index Funds (j)
1,449 —
1,449 —
Foreign Corporate Bond Index Funds (j) 8,802
— 8,802
—
Total Fixed Income Securities $
114,267 $
59,238 $
55,029 $
— Alternative Investments:
Insurance Contracts (k)
8,903 —
— 8,903
Total Alternative Investments $
8,903 $
— $
— $
8,903 Real Estate:
Foreign Real Estate (l)
797 —
— 797
Total Real Estate $
797 $
— $
— $
797 Total Assets
$ 372,199
$ 269,289
$ 93,210
$ 9,700
93
(a)
This category comprised of two growth and two value-oriented portfolios of U.S. securities benchmarked against the S&P 500 index. 2010 also includes a minor holding of a U.S. equity index fund in Switzerland.
(b)
This category consists of a portfolio of U.S. securities benchmarked against the Russell 2000 index.
(c)
This category consists of two international mutual funds benchmarked against the MSCI EAFE index. This category also includes individual foreign equity holdings in the CW Pension Plan.
(d)
This category is comprised primarily of global equity index mutual funds associated with the U.K. based pension plans.
(e)
This category consists of three balanced funds associated with the Canadian and U.K. based pension plans composed, in aggregate, of approximately 50% equities and 50% fixed income/cash.
(f)
This category consists of a portfolio of domestic fixed income securities benchmarked against the Barclays Capital Aggregate Bond Index, with the majority of the portfolio comprised of corporate bonds.
(g)
This category consists of an actively-managed bond mutual fund comprised of domestic investment-grade debt, fixed-income derivatives, and below investment-grade issues.
(h)
This category consists of U.S. mortgage backed securities, asset backed securities, municipal bonds, and convertible debt.


Valuation
Equity securities and exchange-traded equity and bond mutual funds are valued using a market approach based on the quoted market prices of identical instruments. Pooled institutional funds are valued at their net asset values and are calculated by the sponsor of the fund.
Fixed income securities are primarily valued using a market approach utilizing various underlying pricing sources and methodologies. Real estate investment trusts are priced at net asset value based on valuations of the underlying real estate holdings using inputs such as discounted cash flows, independent appraisals, and market- based comparable data.
Cash balances in the United States are held in a pooled fund and classified as a Level 2 asset. Non-U.S. cash is valued using a market approach based on quoted market prices of identical instruments.
The following table presents a reconciliation of Level 3 assets held during the year ended December 31, 2011 and 2010:
94
(i)
These categories consist of bond mutual funds for institutional investors associated with the CW Pension Plan as well as our Switzerland and U.K. based pension plans.
(j)
These categories consist of bond index mutual funds for institutional investors in the U.K. aiming to capture the returns of the iBoxx and Non-Gilt indices for corporates and the FTSE A index for government bonds (gilts).
(k)
This category consists of a guaranteed investment contract (GIC) in Switzerland. Amounts contributed to the plan are guaranteed by a foundation for occupational benefits that in turn entered into a group insurance contract and the foundation pays a guaranteed rate of interest that is reset annually.
(l)
This category consists of real estate investment trusts in Switzerland.
Insurance Contracts
Corporate Bonds
Real Estate
Total
December 31, 2009 $
8,162 $
482 $
1,066 $
9,710 Actual return on plan assets:
Relating to assets still held at the reporting date
163 —
31 194
Relating to assets sold during the period —
12 —
12 Purchases, sales, and settlements
(290 ) —
(365 ) (655 )
Transfers in and/or out of Level 3
— (494 )
— (494 )
Foreign currency translation adjustment
868 —
65 933
December 31, 2010 $
8,903 $
— $
797 $
9,700
Actual return on plan assets:
Relating to assets still held at the reporting date 188
— 33
221 Relating to assets sold during the period
— —
3 3
Purchases, sales, and settlements 1,092
— (230 )
862 Transfers in and/or out of Level 3
— —
— —
Foreign currency translation adjustment (102 )
— 9
(93 )
December 31, 2011 $
10,081 $
— $
612 $
10,693

Benefit Payments
The following benefit payments, which reflect expected future service, as appropriate, are expected to be paid from the plans:
Other Pension and Postretirement Plans
The Corporation offers all of its domestic employees the opportunity to participate in a defined contribution plan. Costs incurred by the Corporation in the administration and record keeping of the defined contribution plan are paid for by the Corporation and are not considered material.
In addition, the Corporation had foreign pension costs under various defined contribution plans of $3.7 million, $2.8 million, and $2.6 million in 2011, 2010, and 2009, respectively.
17. LEASES
The Corporation conducts a portion of its operations from leased facilities, which include manufacturing and service facilities, administrative offices, and warehouses. In addition, the Corporation leases vehicles, machinery, and office equipment under operating leases. The leases expire at various dates and may include renewals and escalations. Rental expenses for all operating leases amounted to $33.6 million in 2011, $31.2 million in 2010, and $29.2 million in 2009.
At December 31, 2011, the approximate future minimum rental commitments under operating leases that have initial or remaining non-cancelable lease terms in excess of one year are as follows:
18. SEGMENT INFORMATION
The Corporation manages and evaluates its operations based on the products and services it offers and the different markets it serves. Based on this approach, the Corporation has three reportable segments: Flow Control, Motion Control, and Metal Treatment. The Flow Control segment primarily designs, manufactures, distributes, and services a broad range of highly engineered flow control products including valves, pumps, motors, generators, instrumentation, and control electronics for severe service military and commercial applications. The Motion Control segment primarily designs, develops, and manufactures mechanical systems, drive systems, and mission- critical embedded computing products and sensors mainly for the aerospace and defense industries. Metal Treatment provides various metallurgical services, principally shot peening, laser peening, coatings, anodizing, heat treating and analytical services. The segment provides these services to a broad spectrum of customers in various industries, including aerospace, automotive, construction equipment, oil and gas, petrochemical, and metal working.
95
Pension Plans
Postretirement Plans
Total
(In thousands) 2012
$ 38,138
$ 1,604
$ 39,742
2013 39,090
1,575 40,665
2014 42,081
1,579 43,660
2015 43,094
1,579 44,673
2016 44,291
1,567 45,858
2017 - 2021 244,713
7,797 252,510
Rental Commitments
(In thousands) 2012
$ 29,356
2013 27,533
2014 22,934
2015 20,183
2016 18,275
Thereafter 57,102
Total $
175,383
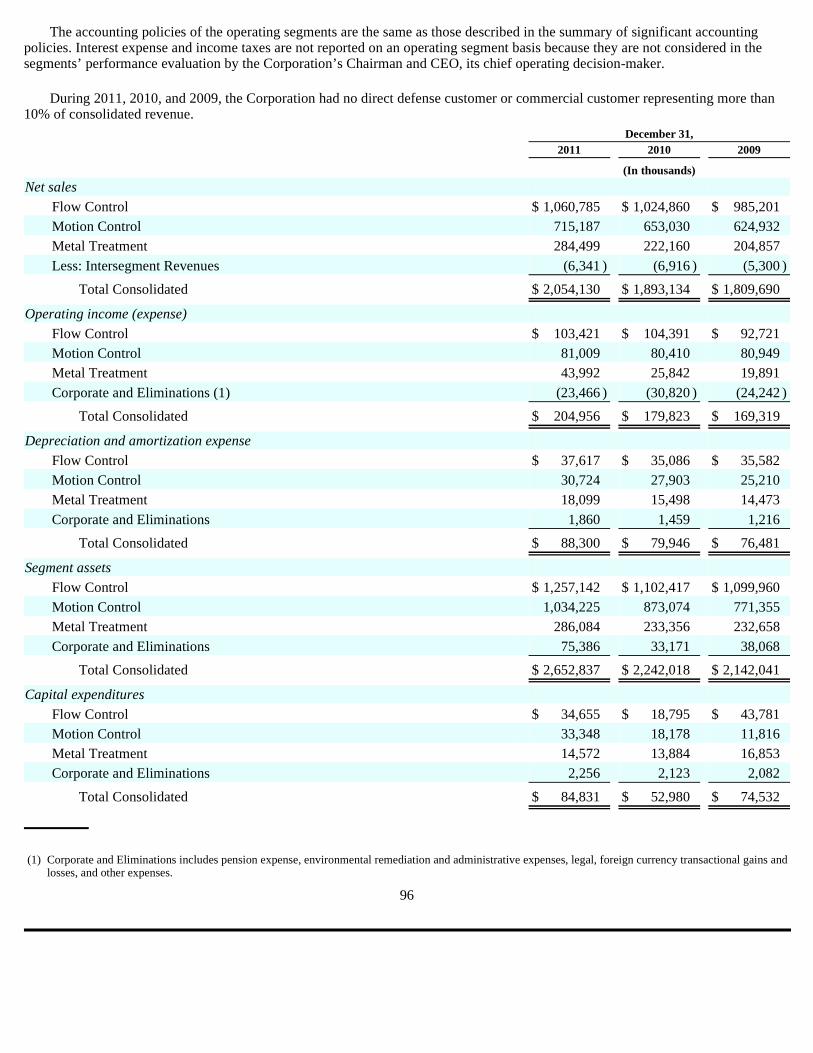
The accounting policies of the operating segments are the same as those described in the summary of significant accounting policies. Interest expense and income taxes are not reported on an operating segment basis because they are not considered in the segments’ performance evaluation by the Corporation’s Chairman and CEO, its chief operating decision-maker.
During 2011, 2010, and 2009, the Corporation had no direct defense customer or commercial customer representing more than 10% of consolidated revenue.
December 31,
2011
2010
2009
(In thousands) Net sales
Flow Control
$ 1,060,785
$ 1,024,860
$ 985,201
Motion Control 715,187
653,030 624,932
Metal Treatment 284,499
222,160 204,857
Less: Intersegment Revenues (6,341 )
(6,916 ) (5,300 )
Total Consolidated $
2,054,130 $
1,893,134 $
1,809,690
Operating income (expense)
Flow Control $
103,421 $
104,391 $
92,721 Motion Control
81,009 80,410
80,949 Metal Treatment
43,992 25,842
19,891 Corporate and Eliminations (1)
(23,466 ) (30,820 )
(24,242 )
Total Consolidated $
204,956 $
179,823 $
169,319
Depreciation and amortization expense
Flow Control $
37,617 $
35,086 $
35,582 Motion Control
30,724 27,903
25,210 Metal Treatment
18,099 15,498
14,473 Corporate and Eliminations
1,860 1,459
1,216
Total Consolidated $
88,300 $
79,946 $
76,481
Segment assets
Flow Control $
1,257,142 $
1,102,417 $
1,099,960 Motion Control
1,034,225 873,074
771,355 Metal Treatment
286,084 233,356
232,658 Corporate and Eliminations
75,386 33,171
38,068
Total Consolidated $
2,652,837 $
2,242,018 $
2,142,041
Capital expenditures
Flow Control $
34,655 $
18,795 $
43,781 Motion Control
33,348 18,178
11,816 Metal Treatment
14,572 13,884
16,853 Corporate and Eliminations
2,256 2,123
2,082
Total Consolidated $
84,831 $
52,980 $
74,532
96
(1)
Corporate and Eliminations includes pension expense, environmental remediation and administrative expenses, legal, foreign currency transactional gains and losses, and other expenses.

Reconciliations
Geographic Information
19. CONTINGENCIES AND COMMITMENTS
Legal Proceedings
In January 2007, a former executive was awarded approximately $9.0 million in punitive and compensatory damages plus legal costs related to a gender bias lawsuit filed in 2003. The Corporation recorded a $6.5 million reserve related to the lawsuit. In August of 2009, the New Jersey Appellate Division reversed in part and affirmed in part the judgment of the trial court, resulting in the setting aside of the punitive damage award and the front pay award of the Plaintiff’s compensatory damages award. The Plaintiff filed a Petition for Certification with the Supreme Court of New Jersey requesting review of the Appellate Division’s decision. In December 2010, the Supreme Court of New Jersey issued an opinion reversing the Appellate Division’s decision, and reinstated the judgment rendered by the trial court. The Corporation filed a Motion for Reconsideration with the Supreme Court of New Jersey. In the motion, the Corporation requested that the Supreme Court of New Jersey remand the case back to the lower Appellate Division to resolve certain arguments raised by the Corporation regarding the appropriateness of damages. The Supreme Court of New Jersey has granted the Corporation’s request for reconsideration and remanded the case back to the lower Appellate Division to decide the remaining undecided arguments raised by the Corporation. In September 2011, the Appellate Court heard argument on the remaining unresolved issues in the case. To date, there has been no
97
December 31,
2011
2010
2009
(In thousands) Earnings before taxes:
Total segment operating income
$ 228,422
$ 210,643
$ 193,561
Corporate and administrative (23,466 )
(30,820 ) (24,242 )
Interest expense
(20,834 ) (22,107 )
(25,066 )
Other income, net 867
579 1,006
Total consolidated earnings before tax $
184,989 $
158,295 $
145,259
Assets:
Total assets for reportable segments $
2,577,451 $
2,208,847 $
2,103,973 Non-segment cash
227 299
4,460 Other assets
75,159 32,872
33,608
Total consolidated assets $
2,652,837 $
2,242,018 $
2,142,041
December 31,
2011
2010
2009
(In thousands) Revenues
United States of America
$ 1,446,741
$ 1,340,754
$ 1,283,174
United Kingdom 139,002
115,331 104,606
Canada 81,498
58,855 63,644
Other foreign countries 386,889
378,194 358,266
Consolidated total $
2,054,130 $
1,893,134 $
1,809,690
Long-Lived Assets
United States of America $
328,816 $
285,035 $
285,392 United Kingdom
38,859 39,479
46,384 Canada
31,914 33,578
32,405 Other foreign countries
43,966 39,188
36,968
Consolidated total $
443,555 $
397,280 $
401,149
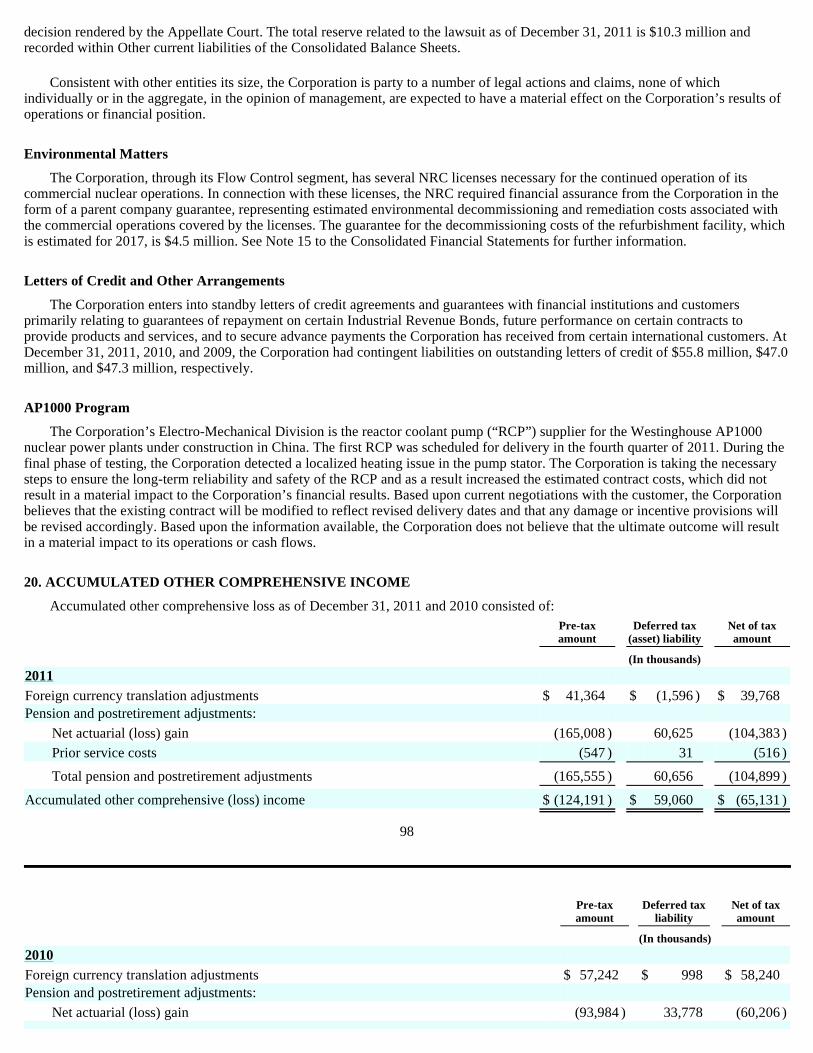
decision rendered by the Appellate Court. The total reserve related to the lawsuit as of December 31, 2011 is $10.3 million and recorded within Other current liabilities of the Consolidated Balance Sheets.
Consistent with other entities its size, the Corporation is party to a number of legal actions and claims, none of which individually or in the aggregate, in the opinion of management, are expected to have a material effect on the Corporation’s results of operations or financial position.
Environmental Matters
The Corporation, through its Flow Control segment, has several NRC licenses necessary for the continued operation of its commercial nuclear operations. In connection with these licenses, the NRC required financial assurance from the Corporation in the form of a parent company guarantee, representing estimated environmental decommissioning and remediation costs associated with the commercial operations covered by the licenses. The guarantee for the decommissioning costs of the refurbishment facility, which is estimated for 2017, is $4.5 million. See Note 15 to the Consolidated Financial Statements for further information.
Letters of Credit and Other Arrangements
The Corporation enters into standby letters of credit agreements and guarantees with financial institutions and customers primarily relating to guarantees of repayment on certain Industrial Revenue Bonds, future performance on certain contracts to provide products and services, and to secure advance payments the Corporation has received from certain international customers. At December 31, 2011, 2010, and 2009, the Corporation had contingent liabilities on outstanding letters of credit of $55.8 million, $47.0 million, and $47.3 million, respectively.
AP1000 Program
The Corporation’s Electro-Mechanical Division is the reactor coolant pump (“RCP”) supplier for the Westinghouse AP1000 nuclear power plants under construction in China. The first RCP was scheduled for delivery in the fourth quarter of 2011. During the final phase of testing, the Corporation detected a localized heating issue in the pump stator. The Corporation is taking the necessary steps to ensure the long-term reliability and safety of the RCP and as a result increased the estimated contract costs, which did not result in a material impact to the Corporation’s financial results. Based upon current negotiations with the customer, the Corporation believes that the existing contract will be modified to reflect revised delivery dates and that any damage or incentive provisions will be revised accordingly. Based upon the information available, the Corporation does not believe that the ultimate outcome will result in a material impact to its operations or cash flows.
20. ACCUMULATED OTHER COMPREHENSIVE INCOME
Accumulated other comprehensive loss as of December 31, 2011 and 2010 consisted of:
98
Pre-tax amount
Deferred tax (asset) liability
Net of tax amount
(In thousands) 2011
Foreign currency translation adjustments
$ 41,364
$ (1,596 )
$ 39,768
Pension and postretirement adjustments:
Net actuarial (loss) gain (165,008 )
60,625 (104,383 )
Prior service costs
(547 ) 31
(516 )
Total pension and postretirement adjustments (165,555 )
60,656 (104,899 )
Accumulated other comprehensive (loss) income $
(124,191 ) $
59,060 $
(65,131 )
Pre-tax amount
Deferred tax liability
Net of tax amount
(In thousands) 2010
Foreign currency translation adjustments
$ 57,242
$ 998
$ 58,240
Pension and postretirement adjustments:
Net actuarial (loss) gain (93,984 )
33,778 (60,206 )

Other comprehensive income (loss) for the periods ending December 31, 2011, 2010 and 2009 were as follows:
As of January 1, 2010, one of the Corporation’s Canadian entities changed its functional currency from the U.S. dollar to the Canadian dollar. The nature of this operation’s cash flow changed from predominantly U.S. dollar to the Canadian dollar, therefore requiring the change in functional currency. In accordance with the guidance on foreign currency translation, an adjustment of $18.6 million, attributable to current-rate translation of non-monetary assets, was recorded in the first quarter of 2010 to the currency translation account. This adjustment resulted in an increase to total comprehensive income and is reported within the “Foreign currency translation adjustments” caption above.
99
Prior service costs (1,016 )
169 (847 )
Total pension and postretirement adjustments (95,000 )
33,947 (61,053 )
Accumulated other comprehensive (loss) income $
(37,758 ) $
34,945 $
(2,813 )
Pre-tax amount
Tax (expense) benefit
Net of tax amount
(In thousands) 2011
Foreign currency translation adjustments
$ (15,838 )
$ (2,634 )
$ (18,472 )
Pension and postretirement adjustments:
Net actuarial (loss) gain
(71,024 ) 26,847
(44,177 )
Prior service cost 469
(138 ) 331
Total pension and postretirement adjustments (70,555 )
26,709 (43,846 )
Other comprehensive (loss) income $
(86,393 ) $
24,075 $
(62,318 )
Pre-tax amount
Tax benefit
(expense)
Net of tax amount
(In thousands) 2010
Foreign currency translation adjustments
$ 28,716
$ 2,867
$ 31,583
Pension and postretirement adjustments:
Net actuarial (loss) gain (28,110 )
8,908 (19,202 )
Prior service cost
7,306 (2,895 )
4,411
Total pension and postretirement adjustments (20,804 )
6,013 (14,791 )
Other comprehensive income $
7,912 $
8,880 $
16,792
Pre-tax amount
Tax (expense)
benefit
Net of tax amount
(In thousands) 2009
Foreign currency translation adjustments
$ 40,586
$ (3,990 )
$ 36,596
Pension and postretirement adjustments:
Net actuarial gain (loss) 29,712
(10,855 ) 18,857
Prior service cost (3,937 )
1,430 (2,507 )
Total pension and postretirement adjustments 25,775
(9,425 ) 16,350
Other comprehensive income (loss) $
66,361 $
(13,415 ) $
52,946

21. SUBSEQUENT EVENTS
In January 2012, the Company entered into three fixed-to-floating interest rate swap agreements to convert the interest payments of the $200 million, 4.24% notes, due December 1, 2026, from a fixed rate to a floating interest rate based on 1-Month LIBOR plus a 2.02% spread, and one fixed-to-floating interest rate swap agreement to convert the interest payments of $25 million of the $100 million, 3.84% notes, due December 1, 2021, from a fixed rate to a floating interest rate based on 1-Month LIBOR plus a 1.90% spread.
Additional information regarding our interest rate swaps is included in Item 7, Management’s Discussion and Analysis of Financial Condition and Results of Operations, Item 7A. Quantitative and Qualitative Disclosures About Market Risk, and in Notes 1 to the consolidated financial statements contained in Item 8, Financial Statements and Supplementary Data.
22. QUARTERLY RESULTS OF OPERATIONS (UNAUDITED)
See notes to the consolidated financial statements for additional financial information.
100
First
Second
Third
Fourth
(In thousands, except per share data) 2011
Net sales
$ 461,850
$ 514,905
$ 515,996
$ 561,379
Gross profit 148,969
168,957 170,637
187,555 Net earnings
24,516 31,796
34,360 39,751
Earnings per share:
Basic earnings per share $
0.53 $
0.69 $
0.74 $
0.85 Diluted earnings per share
0.52 0.68
0.73 0.84
Dividends per share 0.08
0.08 0.08
0.08 2010
Net sales
$ 441,775
$ 462,165
$ 465,813
$ 523,381
Gross profit 137,984
154,383 155,717
173,669 Net earnings
16,335 25,898
27,784 36,581
Earnings per share:
Basic earnings per share $
0.36 $
0.57 $
0.61 $
0.80 Diluted earnings per share
0.35 0.56
0.60 0.79
Dividends per share 0.08
0.08 0.08
0.08
REPORT OF THE CORPORATION
The consolidated financial statements appearing in Item 8 of this Annual Report on Form 10-K have been prepared by the Corporation in conformity with accounting principles generally accepted in the United States of America. The financial statements necessarily include some amounts that are based on the best estimates and judgments of the Corporation. Other financial information in this Annual Report on Form 10-K is consistent with that in the financial statements.
The Corporation maintains accounting systems, procedures, and internal accounting controls designed to provide reasonable assurance that assets are safeguarded and that transactions are executed in accordance with the appropriate corporate authorization and are properly recorded. The accounting systems and internal accounting controls are augmented by written policies and procedures, organizational structure providing for a division of responsibilities, selection and training of qualified personnel, and an internal audit program. The design, monitoring, and revision of internal accounting control systems involve, among other things, management’s judgment with respect to the relative cost and expected benefits of specific control measures. Management of the Corporation has completed an assessment of the Corporation’s internal controls over financial reporting and has included “Management’s Annual Report on Internal Control Over Financial Reporting” in Item 9A of this Annual Report on Form 10-K.
Deloitte & Touche LLP, our independent registered public accounting firm, performed an integrated audit of the Corporation’s financial statements that also included forming an opinion on the internal controls over financial reporting of the Corporation for the year ended December 31, 2011. An audit includes examining, on a test basis, evidence supporting the amounts and disclosures in the financial statements. An audit also includes assessing the accounting principles used and significant estimates made by management, as well as evaluating the overall financial statement presentation. The objective of their audit is the expression of an opinion on the fairness of the Corporation’s financial statements in conformity with accounting principles generally accepted in the United States of America, in all material respects, and on the internal controls over financial reporting as of December 31, 2011.
The Audit Committee of the Board of Directors, composed entirely of directors who are independent of the Corporation, appoints the independent registered public accounting firm for ratification by stockholders and, among other things, considers the scope of the independent registered public accounting firm’s examination, the audit results, and the adequacy of internal accounting controls of the Corporation. The independent registered public accounting firm and the internal auditor have direct access to the Audit Committee, and they meet with the committee from time to time, with and without management present, to discuss accounting, auditing, non audit consulting services, internal control, and financial reporting matters.
101

REPORT OF INDEPENDENT REGISTERED PUBLIC ACCOUNTING FIRM
To the Board of Directors and Stockholders of Curtiss-Wright Corporation Parsippany, New Jersey
We have audited the accompanying consolidated balance sheets of Curtiss-Wright Corporation and subsidiaries (the “Company”) as of December 31, 2011 and 2010, and the related consolidated statements of earnings, stockholders’ equity, and cash flows for each of the three years in the period ended December 31, 2011. Our audits also included the financial statement schedule listed in the Index at Item 15. These financial statements and financial statement schedule are the responsibility of the Company’s management. Our responsibility is to express an opinion on these financial statements and financial statement schedule based on our audits.
We conducted our audits in accordance with the standards of the Public Company Accounting Oversight Board (United States). Those standards require that we plan and perform the audit to obtain reasonable assurance about whether the financial statements are free of material misstatement. An audit includes examining, on a test basis, evidence supporting the amounts and disclosures in the financial statements. An audit also includes assessing the accounting principles used and significant estimates made by management, as well as evaluating the overall financial statement presentation. We believe that our audits provide a reasonable basis for our opinion.
In our opinion, such consolidated financial statements present fairly, in all material respects, the financial position of the Company at December 31, 2011 and 2010, and the results of their operations and their cash flows for each of the three years in the period ended December 31, 2011, in conformity with accounting principles generally accepted in the United States of America. Also, in our opinion, such financial statement schedule, when considered in relation to the basic consolidated financial statements taken as a whole, presents fairly, in all material respects, the information set forth therein.
We have also audited, in accordance with the standards of the Public Company Accounting Oversight Board (United States), the Company’s internal control over financial reporting as of December 31, 2011, based on the criteria established in Internal Control—Integrated Framework issued by the Committee of Sponsoring Organizations of the Treadway Commission and our report dated February 24, 2012 expressed an unqualified opinion on the Company’s internal control over financial reporting.
/s/ Deloitte & Touche LLP
Parsippany, New Jersey February 24, 2012
102

REPORT OF INDEPENDENT REGISTERED PUBLIC ACCOUNTING FIRM
To the Board of Directors and Stockholders of Curtiss-Wright Corporation Parsippany, New Jersey
We have audited the internal control over financial reporting of Curtiss-Wright Corporation and subsidiaries (the “Company”) as of December 31, 2011, based on criteria established in Internal Control—Integrated Framework issued by the Committee of Sponsoring Organizations of the Treadway Commission. The Company’s management is responsible for maintaining effective internal control over financial reporting and for its assessment of the effectiveness of internal control over financial reporting, included in the accompanying Management’s Annual Report on Internal Control Over Financial Reporting. Our responsibility is to express an opinion on the Company’s internal control over financial reporting based on our audit.
We conducted our audit in accordance with the standards of the Public Company Accounting Oversight Board (United States). Those standards require that we plan and perform the audit to obtain reasonable assurance about whether effective internal control over financial reporting was maintained in all material respects. Our audit included obtaining an understanding of internal control over financial reporting, assessing the risk that a material weakness exists, testing and evaluating the design and operating effectiveness of internal control based on the assessed risk, and performing such other procedures as we considered necessary in the circumstances. We believe that our audit provides a reasonable basis for our opinion.
A company’s internal control over financial reporting is a process designed by, or under the supervision of, the company’s principal executive and principal financial officers, or persons performing similar functions, and effected by the company’s board of directors, management, and other personnel to provide reasonable assurance regarding the reliability of financial reporting and the preparation of financial statements for external purposes in accordance with generally accepted accounting principles. A company’s internal control over financial reporting includes those policies and procedures that (1) pertain to the maintenance of records that, in reasonable detail, accurately and fairly reflect the transactions and dispositions of the assets of the company; (2) provide reasonable assurance that transactions are recorded as necessary to permit preparation of financial statements in accordance with generally accepted accounting principles, and that receipts and expenditures of the company are being made only in accordance with authorizations of management and directors of the company; and (3) provide reasonable assurance regarding prevention or timely detection of unauthorized acquisition, use, or disposition of the company’s assets that could have a material effect on the financial statements.
Because of the inherent limitations of internal control over financial reporting, including the possibility of collusion or improper management override of controls, material misstatements due to error or fraud may not be prevented or detected on a timely basis. Also, projections of any evaluation of the effectiveness of the internal control over financial reporting to future periods are subject to the risk that the controls may become inadequate because of changes in conditions, or that the degree of compliance with the policies or procedures may deteriorate.
In our opinion, the Company maintained, in all material respects, effective internal control over financial reporting as of December 31, 2011, based on the criteria established in Internal Control—Integrated Framework issued by the Committee of Sponsoring Organizations of the Treadway Commission.
We have also audited, in accordance with the standards of the Public Company Accounting Oversight Board (United States), the consolidated financial statements and financial statement schedule as of and for the year ended December 31, 2011 of the Company and our report dated February 24, 2012 expressed an unqualified opinion on those financial statements and financial statement schedule.
/s/Deloitte & Touche LLP
Parsippany, New Jersey February 24, 2012
103
Item 9. Changes in and Disagreements with Accountants on Accounting and Financial Disclosure.
None.
Item 9A. Controls And Procedures.
Disclosure Controls and Procedures
As of December 31, 2011, the Corporation’s management, including the Corporation’s Chief Executive Officer and Chief Financial Officer, conducted an evaluation of the Corporation’s disclosure controls and procedures, as such term is defined in Rules 13a-15(e) and 15d-15(e) under the Securities Exchange Act of 1934, as amended (the “Exchange Act”). Based on such evaluation, the Corporation’s Chief Executive Officer and Chief Financial Officer concluded that the Corporation’s disclosure controls and procedures are effective as of December 31, 2011 insofar as they are designed to ensure that information required to be disclosed by us in the reports that we file or submit under the Exchange Act is recorded, processed, summarized and reported, within the time periods specified in the Commission’s rules and forms, and they include, without limitation, controls and procedures designed to ensure that information required to be disclosed by us in the reports we file or submit under the Exchange Act is accumulated and communicated to our management, including our principal executive and principal financial officers, or persons performing similar functions, as appropriate to allow timely decisions regarding required disclosure.
Management’s Annual Report On Internal Control Over Financial Reporting
The Corporation’s management is responsible for establishing and maintaining adequate internal control over financial reporting, as defined in Rules 13a-15(f) and 15d-15(f) under the Securities Exchange Act of 1934, as amended.
Because of its inherent limitations, internal control over financial reporting may not prevent or detect misstatements. Also, projections of the future effectiveness of controls currently deemed effective are subject to the risk that controls may become inadequate because of changes in conditions or deterioration in the degree of compliance with the policies or procedures.
The Corporation’s management assessed the effectiveness of the Corporation’s internal control over financial reporting as of December 31, 2011. In making this assessment, the Corporation’s management used the criteria established by the Committee of Sponsoring Organizations of the Treadway Commission in Internal Control- Integrated Framework.
Based on management’s assessment, management believes that as of December 31, 2011, the Corporation’s internal control over financial reporting is effective based on the established criteria.
The Corporation’s internal controls over financial reporting as of December 31, 2011 have been audited by Deloitte & Touche LLP, an independent registered public accounting firm, and their report thereon is included in Item 8 of this Annual Report on Form 10-K.
Changes in Internal Control over Financial Reporting
There were no changes in the Corporation’s internal control over financial reporting during the most recently completed fiscal quarter that materially affected, or are reasonably likely to materially affect, our internal control over financial reporting.
Item 9B. Other Information.
None.
104

PART III
The information required by Items 10, 11, 12, 13, and 14 of Part III of this Annual Report on Form 10-K, to the extent not set forth herein, is incorporated herein by reference from the registrant’s definitive proxy statement relating to the annual meeting of stockholders to be held on May 4, 2012 which definitive proxy statement shall be filed with the Securities and Exchange Commission within 120 days after the end of the fiscal year to which this report relates. Information required by Item 401(b) of Regulation S-K is included in Part I of this report under the caption “Executive Officers” and information required by Item 201(d) of Regulation S-K is included in Part II of this report under the caption “Securities Authorized For Issuance Under Equity Compensation Plans”.
PART IV
Item 15. Exhibits, Financial Statement Schedules.
(a) Financial Statements and Footnotes
(b) Exhibits
105
Page
1. The following are documents filed as part of this report in Part II, Item 8:
Consolidated Statements of Earnings 53
Consolidated Balance Sheets 54
Consolidated Statements of Cash Flows 55
Consolidated Statements of Stockholders’ Equity 56
Notes to Consolidated Financial Statements 57
2. Financial Statement Schedule
Schedule II–Valuation and Qualifying Accounts 110
All other financial statement schedules have been omitted because they are either not required, not applicable or the required information is shown in the Consolidated Financial Statements or Notes thereto.
Exhibit
No.
Exhibit Description
Incorporated by Reference
Filed Herewith
Form
Filing Date
2.1 Agreement and Plan of Merger and Recapitalization, dated as of February 1, 2005, by and between the Registrant and CW Merger Sub, Inc. (incorporated by reference to Exhibit 2.1 to Form 8-K filed February 3, 2005).
8-K February 3, 2005
3.1 Amended and Restated Certificate of Incorporation (incorporated by reference to Form 8-A/A filed May 24, 2005).
8-A/A
May 24, 2005
3.2 Amended and Restated By-Laws (incorporated by reference to Form 8-K filed May 13, 2011).
8-K May 13, 2011
3.3 Form of stock certificate for Common Stock (incorporated by reference to Form 8-K filed November 17, 2008).
8-K November 17, 2008
4.1 Agreement to furnish to the Commission upon request a copy of any long-term debt instrument where the amount of the securities authorized thereunder does not exceed 10% of the total assets of the Registrant and its subsidiaries on a consolidated basis (incorporated by reference to Exhibit 4 to Form 10- K for the year ended December 31, 1985).
10-K December 31, 1985
Exhibit
No.
Exhibit Description
Incorporated by Reference
Filed Herewith
Form
Filing Date
10.1 Curtiss-Wright Corporation 2005 Omnibus Long- Term Incentive Plan, amended and restated effective January 1, 2010 (incorporated by reference to Appendix B to Definitive Proxy Statement on Schedule 14A filed March 19, 2010).*
14A March 19, 2010
10.2 Form of Long Term Incentive Award Agreement, between the Registrant and the executive officers of the Registrant (incorporated by reference to Exhibit 10.3 to Form 10-K for the
10-K March 7, 2006

106
year ended December 31, 2005).* 10.3 Revised Standard Employment Severance Agreement with
Senior Management of the Registrant (incorporated by reference to Exhibit 10 to Form 10-Q for the quarter ended June 30, 2001).*
10-Q August 15, 2001
10.4 Amended and Restated Retirement Benefits Restoration Plan as amended January 1, 2009 (incorporated by reference to Exhibit 10 to Form 10-K for the year ended December 31, 2010).*
10-K February 25, 2011
10.5 Instrument of Amendment No. 1 to Amended and Restated Retirement Benefits Restoration Plan as amended January 1, 2009.*
X
10.6 Amended and Restated Curtiss-Wright Corporation Retirement Plan and Instrument of Amendment No. 1, as amended through January 1, 2010 (incorporated by reference to Exhibit 10 to Form 10-K for the year ended December 31, 2010).*
10-K February 25, 2011
10.7 Instrument of Amendment No. 2 to the Amended and Restated Curtiss-Wright Corporation Retirement Plan, as amended January 1, 2010.*
X
10.8 Restated and Amended Curtiss-Wright Corporation Savings and Investment Plan, dated January 1, 2010 (incorporated by reference to Exhibit 10 to Form 10-K for the year ended December 31, 2010).*
10-K February 25, 2011
10.9 Instrument of Amendment No. 1 to the Restated and Amended Curtiss-Wright Corporation Savings and Investment Plan, dated January 1, 2010 (incorporated by reference to Exhibit 10 to Form 10-K for the year ended December 31, 2010).*
10-K February 25, 2011
10.10 Instrument of Amendment No. 2 to the Restated and Amended Curtiss-Wright Corporation Savings and Investment Plan, dated January 1, 2010.*
X
10.11 Instrument of Amendment No. 3 to the Restated and Amended Curtiss-Wright Corporation Savings and Investment Plan, dated January 1, 2010.*
X
10.12 Form of indemnification Agreement entered into by the Registrant with each of its directors (incorporated by reference to Exhibit 10 to Form 10-K for the year ended December 31, 2008).
10-K March 2, 2009
Exhibit
No.
Exhibit Description
Incorporated by Reference
Filed Herewith
Form
Filing Date
10.13 Amended and Restated Curtiss-Wright Electro- Mechanical Corporation Savings Plan, dated January 1, 2010 (incorporated by reference to Exhibit 10 to Form 10-K for the year ended December 31, 2010)*
10-K February 25, 2011
10.14 Instrument of Amendment No.1 to the Amended and Restated Curtiss-Wright Electro-Mechanical Corporation Savings Plan, dated January 1, 2010, dated January 1, 2010.*
X
10.15 Curtiss-Wright Corporation 2005 Stock Plan for Non- Employee Directors (incorporated by reference to Appendix C to Definitive Proxy Statement on Schedule 14A filed April 5, 2005).*
14A April 5, 2005
10.16 Amended and Revised Curtiss-Wright Corporation Executive Deferred Compensation Plan, as amended November 2006 (incorporated by reference to Exhibit 10 to Form 10-K for the year ended December 31, 2006)*
10-K February 27, 2007
10.17 Instrument of Amendment No. 1 to the Amended and Revised Curtiss-Wright Corporation Executive Deferred Compensation Plan, as amended August 2008.*
X

107
10.18 Change In Control Severance Protection Agreement, dated July 9, 2001, between the Registrant and Chief Executive Officer of the Registrant (incorporated by reference to Exhibit 10.1 to Form 10-Q for the quarter ended September 30, 2001).*
10-Q November 15, 2001
10.19 Standard Change In Control Severance Protection Agreement, dated July 9, 2001, between the Registrant and Key Executives of the Registrant (incorporated by reference to Form 10-Q for the quarter ended September 30, 2001).*
10-Q November 15, 2001
10.20 Trust Agreement, dated January 20, 1998, between the Registrant and PNC Bank, National Association (incorporated by reference to Exhibit 10(a) to Form 10-Q for the quarter ended March 31, 1998).*
10-Q May 13, 1998
10.21 Consulting Agreement, dated April 30, 2010, between the Registrant and Edward Bloom (incorporated by reference to Exhibit 10 to Form 10-Q for the quarter ended March 31, 2009).*
10-Q May 8, 2009
10.22 Curtiss-Wright Corporation Employee Stock Purchase Plan (incorporated by reference to Appendix C to Proxy Statement filed March 24, 2011).*
14A March 24, 2011
10.23 Note Purchase Agreement between the Registrant and certain Institutional Investors, dated September 25, 2003 (incorporated by reference to Exhibit 10.1 to Form 8-K filed October 3, 2003).
8-K October 3, 2003
Exhibit
No.
Exhibit Description
Incorporated by Reference
Filed Herewith
Form
Filing Date
10.24 Restrictive Legends on Notes subject to Note Purchase Agreement between the Registrant and certain Institutional Investors, dated September 25, 2003 (incorporated by reference to Exhibit 10.2 to Form 8-K filed October 3, 2003).
8-K October 3, 2003
10.25 Note Purchase Agreement between the Registrant and certain Institutional Investors, dated December 1, 2005 (incorporated by reference to Exhibit 10.1 to Form 8-K filed December 5, 2005).
8-K December 5, 2005
10.26 Restrictive Legends on Notes subject to Note Purchase Agreement between the Registrant and certain Institutional Investors, dated December 1, 2005 (incorporated by reference to Exhibit 10.2 to Form 8-K filed December 5, 2005).
8-K December 5, 2005
10.27 Note Purchase Agreement between the Registrant and certain Institutional Investors, dated December 8, 2011 (incorporated by reference to Exhibit 10.1 to Form 8-K filed December 13, 2011).
8-K December 13, 2011
10.28 Restrictive Legends on Notes subject to Note Purchase Agreement between the Registrant and certain Institutional Investors, dated December 8, 2011 (incorporated by reference to Exhibit 10.2 to Form 8-K filed December 13, 2011).
8-K December 13, 2011
10.29 Incentive Compensation Plan, as amended November 15, 2010 (incorporated by reference to Appendix B to Definitive Proxy Statement on Schedule 14A filed March 24, 2011).*
14A March 24, 2011
10.30 Restricted Stock Unit Agreement, dated October 9, 2006, by and between the Registrant and David Linton (incorporated by reference to Exhibit 10 to Form 8-K filed October 11, 2006).*
8-K October 11, 2006
10.31 Restricted Stock Unit Agreement, dated October 23, 2007, by and between the Registrant and David Linton (incorporated by reference to Exhibit 10 to Form 8-K filed October 25, 2007).*
8-K October 25, 2007
10.32 Restricted Stock Unit Agreement, dated October 9, 2006, by and between the Registrant and David Adams (incorporated by
8-K October 16, 2006

108
reference to Exhibit 10 to Form 8-K filed October 16, 2006).* 10.33 Restricted Stock Unit Agreement, dated October 23, 2007, by
and between the Registrant and David Adams (incorporated by reference to Exhibit 10 to Form 8-K filed October 25, 2007).*
8-K October 25, 2007

Exhibit
No.
Exhibit Description
Incorporated by Reference
Filed Herewith
Form
Filing Date
10.34 Second Amended and Restated Credit Agreement dated as of August 10, 2008 among the Registrant, and Certain Subsidiaries as Borrowers; the Lenders parties thereto; Bank of America, N.A., as Administrative Agent; Swingline Lender, and L/C Issuer; J.P. Morgan Chase Bank, N.A., as Syndication Agent; and Sun Trust Bank and Citibank N.A., as Co- Documentation Agents (incorporated by reference to Exhibit 10 to Form 10-K/A for the year ended December 31, 2008)
10-K March 19, 2010
21 Subsidiaries of the Registrant (filed herewith).
X 23 Consent of Independent Registered Public Accounting Firm
(filed herewith).
X
31.1 Certification of Martin R. Benante, Chairman and CEO, Pursuant to Rule 13a-14(a) (filed herewith).
X
31.2 Certification of Glenn E. Tynan, Chief Financial Officer, Pursuant to Rule 13a-14(a) (filed herewith).
X
32 Certification of Martin R. Benante, Chairman and CEO and Glenn E. Tynan, Chief Financial Officer, Pursuant to 18 U.S.C. Section 1350 (filed herewith).
X
* Indicates contract or compensatory plan or arrangement
101.INS XBRL instance document**
101.SCH XBRL Taxonomy Extension Schema Document**
101.CAL XBRL Taxonomy Extension Calculation Linkbase Document**
101.DEF XBRL Taxonomy Extension Definition Linkbase Document**
101.LAB XBRL Taxonomy Extension Label Linkbase Document**
101.PRE XBRL Taxonomy Extension Presentation Linkbase Document**
109
**
In accordance with Rule 406T of Regulation S-T, the XBRL related information in Exhibit 101 to this Annual Report on Form 10-K shall not be deemed “filed” for purposes of Section 18 of the Securities Exchange Act of 1934, as amended (the “Exchange Act”), or otherwise subject to liability of that section and shall not be incorporated by reference into any filing or other document filed under the Securities Act of 1933, as amended, or the Exchange Act, except as shall be expressly set forth by specific reference in such filing or document.
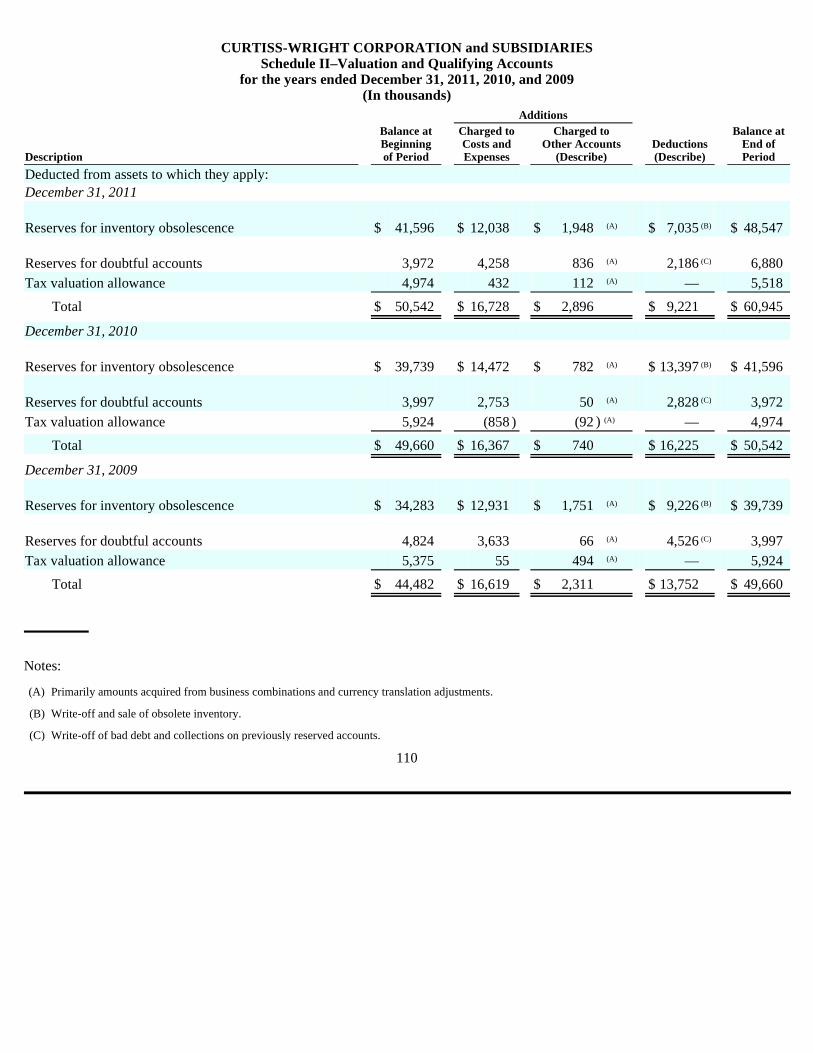
CURTISS-WRIGHT CORPORATION and SUBSIDIARIES Schedule II–Valuation and Qualifying Accounts
for the years ended December 31, 2011, 2010, and 2009 (In thousands)
Notes:
110
Description
Balance at Beginning of Period
Additions
Deductions (Describe)
Balance at End of Period
Charged to Costs and Expenses
Charged to Other Accounts
(Describe)
Deducted from assets to which they apply:
December 31, 2011
Reserves for inventory obsolescence $
41,596 $
12,038 $
1,948 (A) $
7,035 (B)
$ 48,547
Reserves for doubtful accounts 3,972
4,258 836 (A)
2,186 (C)
6,880 Tax valuation allowance
4,974 432
112 (A) —
5,518
Total $
50,542 $
16,728 $
2,896 $
9,221 $
60,945
December 31, 2010
Reserves for inventory obsolescence $
39,739 $
14,472 $
782 (A) $
13,397 (B)
$ 41,596
Reserves for doubtful accounts 3,997
2,753 50 (A)
2,828 (C)
3,972 Tax valuation allowance
5,924 (858 )
(92 ) (A) —
4,974
Total $
49,660 $
16,367 $
740 $
16,225 $
50,542
December 31, 2009
Reserves for inventory obsolescence $
34,283 $
12,931 $
1,751 (A) $
9,226 (B)
$ 39,739
Reserves for doubtful accounts 4,824
3,633 66 (A)
4,526 (C)
3,997 Tax valuation allowance
5,375 55
494 (A) —
5,924
Total $
44,482 $
16,619 $
2,311 $
13,752 $
49,660
(A)
Primarily amounts acquired from business combinations and currency translation adjustments.
(B)
Write-off and sale of obsolete inventory.
(C)
Write-off of bad debt and collections on previously reserved accounts.

SIGNATURES
Pursuant to the requirements of Section 13 or 15(d) of the Securities Exchange Act of 1934, the Registrant has duly caused this report to be signed on its behalf by the undersigned, thereunto duly authorized.
URTISS -W RIGHT C ORPORATION (Registrant)
Pursuant to the requirements of the Securities Exchange Act of 1934, this report has been signed below by the following persons on behalf of the Registrant and in the capacities and on the dates indicated.
111
Date: February 24, 2012 By: /s/ M ARTIN R. B ENANTE
Martin R. Benante Chairman and CEO
Date: February 24, 2012 By: /s/ G LENN E. T YNAN
Glenn E. Tynan Chief Financial Officer
Date: February 24, 2012 By: /s/ G LENN C OLEMAN Glenn Coleman Controller
Date: February 24, 2012 By: /s/ M ARTIN R. B ENANTE Martin R. Benante Director
Date: February 24, 2012 By: /s/ D EAN M. F LATT Dean M. Flatt Director
Date: February 24, 2012 By: /s/ S. M ARCE F ULLER S. Marce Fuller Director
Date: February 24, 2012 By: /s/ A LLEN A. K OZINSKI Allen A. Kozinski Director
Date: February 24, 2012 By: /s/ W ILLIAM B. M ITCHELL William B. Mitchell Director
Date: February 24, 2012 By: /s/ J OHN R. M YERS John R. Myers Director
Date: February 24, 2012 By: /s/ J OHN B. N ATHMAN John B. Nathman Director
Date: February 24, 2012 By: /s/ R OBERT J. R IVET Robert J. Rivet Director
Date: February 24, 2012 By: /s/ W ILLIAM W. S IHLER William W. Sihler Director
Date: February 24, 2012 By: /s/ A LBERT E. S MITH Albert E. Smith Director

Exhibit 10.5
CURTISS-WRIGHT CORPORATION RETIREMENT BENEFITS RESTORATION PLAN
As Amended and Restated effective January 1, 2009
FIRST INSTRUMENT OF AMENDMENT
Recitals:
Amendment to the Plan:
For the reasons set forth in the Recitals to this Instrument of Amendment, the Plan is hereby amended, effective as of January 1, 2011, in the following respects.
1
1. Curtiss-Wright Corporation (the “Company”) has heretofore adopted the Curtiss-Wright Corporation Retirement Benefits Restoration Plan (the “Plan”) and has caused the Plan to be amended and restated in its entirety, effective as of January 1, 2009.
2. Subsequent to the most recent amendment and restatement of the Plan, the Company has decided to amend the Plan to
provide for adding interest to a distribution that is delayed because the participant is a specified employee within the meaning of Section 409A(a)(2)(B)(i) of the Internal Revenue Code.
3. Article IX(a) of the Plan permits the Board of Directors of the Company to amend the Plan, by written instrument, at any time
and from time to time. 4. The Board of Directors has delegated to the Curtiss-Wright Corporation Administrative Committee the authority to adopt
amendments that do not materially increase the costs of the Plan.
1. Article VII(h) is amended by adding a new paragraph to read as follows: In any case where this Paragraph (h) requires a delay in making a payment to a Participant, the amount of such payment
shall be increased with interest for the period extending from the date when the payment would otherwise have been made in accordance with the Participant’s election until the last day of the sixth month following the Participant’s Separation from Service. Interest shall be credited at the interest crediting rate or rates used to increase participants’ cash balance accounts under the C-W Retirement Plan during the period when the payment is delayed in accordance with this Paragraph (h).
2. Section 10(f) of Appendix A is amended by adding a new paragraph to read as follows: In any case where this Paragraph (f) requires a delay in making a payment to a Participant, the amount of such payment
shall be increased with interest for the period extending from the date when the payment would otherwise have been made in accordance with the Participant’s election until the last day of the sixth month following the Participant’s Separation from Service. Interest shall be credited at the interest crediting rate or rates used to increase participants’ cash balance accounts under the C-W Retirement Plan during the period when the payment is delayed in accordance with this Paragraph (f).

Except to the extent amended by this Instrument of Amendment, the Plan shall remain in full force and effect.
IN WITNESS WHEREOF, this amendment has been executed on this ____ day of __________________, 2011.
2
3. Section 4(f) of Appendix B is amended by adding a new paragraph to read as follows: In any case where this Paragraph (f) requires a delay in making a payment to a Participant, the amount of such payment
shall be increased with interest for the period extending from the date when the payment would otherwise have been made in accordance with the Participant’s election until the last day of the sixth month following the Participant’s Separation from Service. Interest shall be credited at the interest crediting rate or rates used to increase participants’ cash balance accounts under the C-W Retirement Plan during the period when the payment is delayed in accordance with this Paragraph (f).
Curtiss-Wright Corporation Administrative Committee By:
Date:

Exhibit 10.7
CURTISS-WRIGHT CORPORATION RETIREMENT PLAN
As Amended and Restated effective January 1, 2010
SECOND INSTRUMENT OF AMENDMENT
Recitals:
1
1. Curtiss-Wright Corporation (the “Company”) has heretofore adopted the Curtiss-Wright Corporation Retirement Plan (the “Plan”) and has caused the Plan to be amended and restated in its entirety, effective as of January 1, 2010.
2. The Plan consists of two separate components: the EMD Component, which applies to eligible employees of Curtiss-Wright
Electro-Mechanical Corporation as provided in the EMD appendix to the Plan, and the CWC Component, which applies to other employees eligible to participate in the Plan.
3. Subsequent to the most recent amendment of the Plan, the Company has decided to amend the CWC Component of the
Plan for the following reasons: a. To provide that employees are not eligible to participate in the Plan if they are participating in a retirement plan
maintained mainly for the benefit of employees working outside the United States; b. To clarify the provisions regarding the payment of benefits to participants who remain employed after reaching normal
retirement age; c. To clarify the provisions of Article 8 regarding the payment of death benefits to a beneficiary other than an individual; d. To reflect the terms of a new collective bargaining agreement covering employees of Metal Improvement Company, Inc.
– Long Island Division that increases their benefit formula with respect to credited service earned on or after January 1, 2012;
e. To reflect the terms of a new collective bargaining agreement covering employees of Metal Improvement Company –
Lynwood Division that increases their benefit formula with respect to credited service earned on or after January 1, 2013; and
f. To provide for the participation of former employees of Predator Systems, Inc., Douglas Equipment Ltd., the Surface
Technologies business of BASF Corporation, IMR Test Labs, ACRA Control, Inc., South Bend Controls Holdings, LLC., Anatec International, Inc. and Lambert, MacGill, Thomas, Inc. following the acquisition of these businesses.
4. Articles 12.01 and 12.02 of the CWC Component permit the Company to amend the Plan, by written instrument, at any time
and from time to time. 5. Article 11.02(b) of the CWC Component authorizes the Curtiss-Wright Corporation Administrative Committee to adopt certain
Plan amendments on behalf of the Company.

Amendment:
For the reasons set forth in the Recitals to this Instrument of Amendment, the Plan is hereby amended, effective as of the dates indicated below, in the following respects.
The CWC Component of the Plan is amended as follows:
2
1. Effective January 1, 2011, Article 2.01(a)(ii) of the CWC Component is amended by adding the following sentence to read as follows:
Notwithstanding the foregoing, an Employee shall not be eligible to participate in this Plan during any period when he
participates in a retirement plan or program sponsored by the Company or an Affiliated Company mainly for the purpose of providing retirement benefits to individuals employed outside the United States of America.
2. Effective January 1, 2011, Article 6.13 of the CWC Component is amended in its entirety to read as follows: 6.13 Payment of Benefits Upon Reemployment or Employment After Normal Retirement Age. Notwithstanding any provisions of the Plan to the contrary, in the event a Participant who is in receipt of annuity payments is
reemployed by the Company or an Affiliated Company, payment of such benefit payments shall continue. Upon the Participant’s subsequent termination of employment with the Company and all Affiliated Companies, the Participant shall be entitled to an additional benefit based on the formula then in effect and his Years of Credited Service and Compensation earned after his date of reemployment, and such additional benefit shall be subject to and payable in accordance with the provisions of Article 7. In the event a Participant dies while in active service, the additional benefit shall be payable in accordance with Article 4.06 or Article 8 or 9, as applicable.
If any Participant continues to be employed by the Company or an Affiliated Company after his Normal Retirement Age, the
following provisions shall apply, except with respect to the benefit determined in accordance with Article 4. (a) No benefits shall be paid for any month in which the Participant is credited with 40 or more Hours of Service. (b) Department of Labor Regulation section 2530.203-3, including the notice procedures referred to in that section,
shall be followed for any period beginning on or after the Participant’s Normal Retirement Age in which the Participant is credited with 40 or more Hours of Service.
(c) Benefits shall be subject to and payable in accordance with the provisions of Article 7.
3
3. Effective January 1, 2011, Article 8.03 of the CWC Component is amended in its entirety to read as follows: 8.03 Payment to Beneficiary. Subject to Article 8.04, the Beneficiary entitled to a benefit pursuant to Article 8.01(a) may elect to receive the benefit in a
lump sum, payable at the election of the Beneficiary, at any time following the Participant’s death. In the event the Beneficiary is the Participant’s estate or any other legal entity other than an individual, the death benefit shall automatically be paid in one lump sum.
The death benefit payable to a Beneficiary pursuant to Article 8.02 shall be paid in a lump sum as soon as practicable after
the date of the Participant’s death. 4. Effective January 1, 2012, Article 9.02(a)(ix) of the CWC Component is amended by adding the following subparagraph (F)
to read as follows: (F) With benefits commencing on or after January 1, 2012, $18.00 multiplied by his Years of Credited Service on or after
January 1, 2012 for any pension payments due for months commencing on or after January 1, 2012. 5. Effective January 1, 2012, Article 9.02(a)(xi) of the CWC Component is amended by adding the following subparagraph (D)
to read as follows: (D) With benefits commencing on or after January 1, 2013, $16.00 multiplied by his Years of Credited Service on or after
January 1, 2013 for any pension payments due for months commencing on or after January 1, 2013. 6. Effective January 7, 2011, Schedule J of the CWC Component is amended by adding the following paragraphs to read as
follows: 39. Predator Systems, Inc. (a) Notwithstanding any provision in this Plan to the contrary, the following rules shall apply to an Employee hired on
January 7, 2011 whose immediate prior service was with Predator Systems, Inc. and who was employed by such entity on such date:
(i) Such an Employee shall be eligible to participate in the Plan following the date he or she completes a Year of
Eligibility Service, which Year of Eligibility Service shall include such prior service, and shall remain eligible so long as he or she continues to satisfy the eligibility requirements in Article 2.01(a), provided, however, that such an Employee shall not accrue any benefits under the Plan, except for benefits determined in accordance with Article 4.
(ii) For purposes of determining Vesting Years of Service, vesting service shall commence with his or her most
recent date of hire with Predator Systems, Inc. immediately prior to its acquisition by the Company.

4
(b) Notwithstanding any provision in this Plan to the contrary, an Employee at the operations and facilities acquired by the Company in its acquisition of Predator Systems, Inc., who is not an Employee described in paragraph (a), shall be eligible to become a Participant in accordance with Article 2.01(a), but shall not accrue any benefits under the Plan, except for benefits determined in accordance with Article 4.
40. Douglas Equipment Ltd. (a) Notwithstanding any provision in this Plan to the contrary, the following rules shall apply to an Employee hired on
April 6, 2011 whose immediate prior service was with Douglas Equipment Ltd. and who was employed by such entity on such date:
(i) Such an Employee shall be eligible to participate in the Plan following the date he or she completes a Year of
Eligibility Service, which Year of Eligibility Service shall include such prior service, and shall remain eligible so long as he or she continues to satisfy the requirements of Article 2.01(a), provided, however, that such an Employee shall not accrue any benefits under the Plan, except for benefits determined in accordance with Article 4.
(ii) For purposes of determining Vesting Years of Service, vesting service shall commence with his or her most
recent date of hire with Douglas Equipment Ltd. immediately prior to the acquisition of its assets by the Company.
(b) Notwithstanding any provision in this Plan to the contrary, an Employee at the operations and facilities acquired by
the Company in its acquisition of the assets of Douglas Equipment Ltd., who is not an Employee described in paragraph (a), shall be eligible to become a Participant in accordance with Article 2.01(a), but shall not accrue any benefits under the Plan, except for benefits determined in accordance with Article 4.
41. BASF Surface Technologies (a) Notwithstanding any provision in this Plan to the contrary, the following rules shall apply to an Employee hired on
April 8, 2011 whose immediate prior service was with the Surface Technologies business of BASF Corporation and who was employed by such entity on such date:
(i) Such an Employee shall be eligible to participate in the Plan following the date he or she completes a Year of
Eligibility Service, which Year of Eligibility Service shall include such prior service, and shall remain eligible so long as he or she continues to satisfy the requirements of Article 2.01(a), provided, however, that such an Employee shall not accrue any benefits under the Plan, except for benefits determined in accordance with Article 4.

5
(ii) For purposes of determining Vesting Years of Service, vesting service shall commence with his or her most recent date of hire with BASF Corporation immediately prior to the acquisition of the assets of its Surface Technologies business by the Company.
(b) Notwithstanding any provision in this Plan to the contrary, an Employee at the operations and facilities acquired by
the Company in its acquisition of the assets of the Surface Technologies business of BASF Corporation, who is not an Employee described in paragraph (a), shall be eligible to become a Participant in accordance with Article 2.01(a), but shall not accrue any benefits under the Plan, except for benefits determined in accordance with Article 4.
42. IMR Test Labs (a) Notwithstanding any provision in this Plan to the contrary, the following rules shall apply to an Employee hired on
July 25, 2011 whose immediate prior service was with IMR Test Labs and who was employed by such entity on such date:
(i) Such an Employee shall be eligible to participate in the Plan following the date he or she completes a Year of
Eligibility Service, which Year of Eligibility Service shall include such prior service, and shall remain eligible so long as he or she continues to satisfy the requirements of Article 2.01(a), provided, however, that such an Employee shall not accrue any benefits under the Plan, except for benefits determined in accordance with Article 4.
(ii) For purposes of determining Vesting Years of Service, vesting service shall commence with his or her most
recent date of hire with IMR Test Labs immediately prior to the acquisition of its assets by the Company. (b) Notwithstanding any provision in this Plan to the contrary, an Employee at the operations and facilities acquired by
the Company in its acquisition of the assets of IMR Test Labs, who is not an Employee described in paragraph (a), shall be eligible to become a Participant in accordance with Article 2.01(a), but shall not accrue any benefits under the Plan, except for benefits determined in accordance with Article 4.
43. ACRA Control, Inc. (a) Notwithstanding any provision in this Plan to the contrary, the following rules shall apply to an Employee hired on
July 28, 2011 whose immediate prior service was with ACRA Control, Inc. and who was employed by such entity on such date:
(i) Such an Employee shall be eligible to participate in the Plan as of the later of January 1, 2012, or the date he
or she completes a Year of Eligibility Service, which Year of Eligibility Service shall
6
include such prior service, and shall remain eligible so long as he or she continues to satisfy the requirements of Article 2.01(a), provided, however, that such an Employee shall not accrue any benefits under the Plan, except for benefits determined in accordance with Article 4.
(ii) For purposes of determining Vesting Years of Service, vesting service shall commence with his or her most
recent date of hire with ACRA Control, Inc. immediately prior to its acquisition by the Company. (b) Notwithstanding any provision in this Plan to the contrary, an Employee at the operations and facilities acquired by
the Company in its acquisition of ACRA Control, Inc., who is not an Employee described in paragraph (a), shall be eligible to become a Participant in accordance with Article 2.01(a), but shall not accrue any benefits under the Plan, except for benefits determined in accordance with Article 4.
44. South Bend Controls Holdings, LLC (a) Notwithstanding any provision in this Plan to the contrary, the following rules shall apply to an Employee hired on
October 11, 2011 whose immediate prior service was with South Bend Controls Holdings, LLC and who was employed by such entity on such date:
(i) Such an Employee shall be eligible to participate in the Plan following the date he or she completes a Year of
Eligibility Service, which Year of Eligibility Service shall include such prior service, and shall remain eligible so long as he or she continues to satisfy the requirements of Article 2.01(a), provided, however, that such an Employee shall not accrue any benefits under the Plan, except for benefits determined in accordance with Article 4.
(ii) For purposes of determining Vesting Years of Service, vesting service shall commence with his or her most
recent date of hire with South Bend Controls Holdings, LLC immediately prior to the acquisition of its assets by the Company.
(b) Notwithstanding any provision in this Plan to the contrary, an Employee at the operations and facilities acquired by
the Company in its acquisition of the assets of South Bend Controls Holdings, LLC, who is not an Employee described in paragraph (a), shall be eligible to become a Participant in accordance with Article 2.01(a), but shall not accrue any benefits under the Plan, except for benefits determined in accordance with Article 4.
45. Anatec International, Inc. (a) Notwithstanding any provision in this Plan to the contrary, the following rules shall apply to an Employee hired on
December 5, 2011 whose

7
immediate prior service was with Anatec International, Inc. and who was employed by such entity on such date: (i) Such an Employee shall be eligible to participate in the Plan following the date he or she completes a Year of
Eligibility Service, which Year of Eligibility Service shall include such prior service, and shall remain eligible so long as he or she continues to satisfy the requirements of Article 2.01(a), provided, however, that such an Employee shall not accrue any benefits under the Plan, except for benefits determined in accordance with Article 4.
(ii) For purposes of determining Vesting Years of Service, vesting service shall commence with his or her most
recent date of hire with Anatec International, Inc. immediately prior to the acquisition of its assets by the Company.
(b) Notwithstanding any provision in this Plan to the contrary, an Employee at the operations and facilities acquired by
the Company in its acquisition of the assets of Anatec International, Inc., who is not an Employee described in paragraph (a), shall be eligible to become a Participant in accordance with Article 2.01(a), but shall not accrue any benefits under the Plan, except for benefits determined in accordance with Article 4.
46. Lambert, MacGill, Thomas, Inc. (a) Notwithstanding any provision in this Plan to the contrary, the following rules shall apply to an Employee hired on
December 5, 2011 whose immediate prior service was with Lambert, MacGill, Thomas, Inc. and who was employed by such entity on such date:
(i) Such an Employee shall be eligible to participate in the Plan following the date he or she completes a Year of
Eligibility Service, which Year of Eligibility Service shall include such prior service, and shall remain eligible so long as he or she continues to satisfy the requirements of Article 2.01(a), provided, however, that such an Employee shall not accrue any benefits under the Plan, except for benefits determined in accordance with Article 4.
(ii) For purposes of determining Vesting Years of Service, vesting service shall commence with his or her most
recent date of hire with Lambert, MacGill, Thomas, Inc. immediately prior to the acquisition of its assets by the Company.
(b) Notwithstanding any provision in this Plan to the contrary, an Employee at the operations and facilities acquired by
the Company in its acquisition of the assets of Lambert, MacGill, Thomas, Inc., who is not an Employee described in paragraph (a), shall be eligible to become a Participant in accordance with Article 2.01(a), but shall not accrue any benefits under the Plan, except for benefits determined in accordance with Article 4.

Except to the extent amended by this Instrument of Amendment, the Plan shall remain in full force and effect.
IN WITNESS WHEREOF, this amendment has been executed on this _____ day of December, 2011.
8
Curtiss-Wright Corporation Administrative Committee
By:
Date:
Exhibit 10.10
CURTISS-WRIGHT CORPORATION SAVINGS AND INVESTMENT PLAN
As Amended and Restated effective January 1, 2010
SECOND INSTRUMENT OF AMENDMENT
Recitals:
1
1. Curtiss-Wright Corporation (the “Company”) has heretofore adopted the Curtiss-Wright Corporation Savings and Investment Plan (the “Plan”) and has caused the Plan to be amended and restated in its entirety, effective as of January 1, 2010.
2. Subsequent to the most recent amendment and restatement of the Plan, the Company has decided to amend the Plan for
the following reasons: a. To provide for the automatic enrollment of certain employees of Curtiss-Wright Controls, Inc. and Metal Improvement
Company; b. To allow participants to elect a rollover of eligible distributions from their Plan accounts into their Roth Deferred Cash
Contribution Account; c. To allow participants to elect a rollover of an outstanding loan if their employment is terminated as a result of the sale of
a business unit and they continue employment with the buyer; d. To provide for special employer contributions for the 2011 and 2012 plan years for eligible former employees of the
Surface Technologies business of BASF Corporation who became Employees as of April 8, 2011; e. To provide for the participation of employees of ACRA Control, Inc. in the Plan; and f. To merge the Predator Systems, Inc. 401(k) Profit Sharing Plan (the “Predator Systems Plan”) into the Plan. 3. Section 12.01(a) of the Plan permits the Company to amend the Plan, by written instrument, at any time and from time to
time. 4. Section 12.01(b) authorizes the Administrative Committee to adopt Plan amendments on behalf of the Company if they are
required for administrative purposes and do not have a material impact on costs or benefit levels or if they reflect acquisitions.

Amendments to the Plan:
2
1. Article 2, Section 2.06(c)(i) is amended, effective March 2, 2011, to read as follows: Notwithstanding any provision of the Plan to the contrary, any eligible Employee of Curtiss-Wright Controls, Inc. whose date
of hire, rehire, or acquisition was on or before December 31, 2008 and who has not affirmatively elected to become a Member (or affirmatively declined to become a Member) pursuant to Section 2.02 shall become a Covered Member as of March 2, 2011.
2. Article 2, Section 2.06(c)(ii) is amended, effective November 30, 2011, by deleting the last sentence and replacing it with the
following sentence: Any eligible Employee of Metal Improvement Company whose date of hire, rehire, or acquisition was on or before December
31, 2009 and who has not affirmatively elected to become a Member (or affirmatively declined to become a Member) pursuant to Section 2.02 shall become a Covered Member as of November 30, 2011.
3. Article 3, Section 3.08 is amended, effective December 1, 2010, by adding a paragraph at the end of this Section to read as
follows: Effective December 1, 2010, a Member who is then an Employee may elect to roll over a distribution from one or more of his
Accounts to his Roth Deferred Cash Contribution Account (an “in-plan Roth rollover”) that (1) is otherwise eligible for distribution from the Plan; (2) qualifies as an eligible rollover distribution pursuant to Section 402(c)(4) of the Code; and (3) is not a distribution from the Member’s Roth Deferred Cash Contribution Account. Any such in-plan Roth rollover shall be made in accordance with, and treated as a taxable distribution to the extent required by, Section 402A(c)(4) of the Code and any regulations and other guidance issued under that provision.
4. Article 8, Section 8.05(a) is amended, effective January 1, 2011, by adding a new paragraph (ix) to read as follows: (ix) Except as otherwise required by law or as provided in this paragraph (ix), if a Member has an outstanding loan balance
at the time his employment terminates, the remaining balance shall become immediately due and payable as of the date specified in the loan procedures applicable to the Plan, which shall be described in the applicable Plan administration manual or set forth in a separate document adopted by the Plan Administrator. If the Member does not repay the full loan balance at this time in a manner acceptable to the Trustee, the Member’s Accounts shall be offset by the unpaid loan balance in accordance with subsection (b). The loan shall be considered fully repaid as of the date of this reduction.
Notwithstanding the foregoing, if a Member with an outstanding loan balance terminates employment with the Employer
and all Affiliated Employers as a result of the Employer’s sale to an unrelated entity of assets used in a trade or business or its interest in a subsidiary and the Member continues employment with the buyer following such sale, the Member may elect, within 60 days of such termination, to roll over the outstanding loan note to an eligible retirement plan (as defined in

3
Section 9.08(b)) maintained by the buyer that accepts such rollovers. This paragraph shall apply to sales occurring on or after July 29, 2011.
5. Appendix A is amended, effective April 8, 2011, by adding the following paragraph 22 to read as follows: 22. BASF Surface Technologies For the Plan Years beginning on January 1, 2011 and January 1, 2012, the Employer shall make special contributions
on behalf of each former employee of the Surface Technologies business of BASF Corporation who became an Employee as of April 8, 2011 (a “BASF Employee”), subject to the following terms:
(a) For the 2011 Plan Year, the Employer shall make matching contributions on behalf of each BASF Employee for
each payroll period ending after April 8, 2011 equal to 100% of the first 5% of Compensation elected as Deferred Cash Contributions, Roth Deferred Cash Contributions, and/or After-Tax Contributions for the payroll period. The total amount of matching contributions made for any BASF Employee for any payroll period during the 2011 Plan Year shall not exceed 5% of Compensation.
For the 2012 Plan Year, the Employer shall make matching contributions on behalf of each BASF Employee for
each payroll period ending during 2012 equal to 100% of the first 3% of Compensation elected as Deferred Cash Contributions, Roth Deferred Cash Contributions, and/or After-Tax Contributions for the payroll period. The total amount of matching contributions made for any BASF Employee for any payroll period during the 2012 Plan Year shall not exceed 3% of Compensation.
If for any payroll period a BASF Employee elects more than one type of contribution that is eligible to be matched,
the matching contributions shall be made first with respect to his Deferred Cash Contributions. To the extent that the Deferred Cash Contributions are less than the applicable percentage of Compensation subject to matching contributions, any additional matching contributions shall be made with respect to the BASF Employee’s Roth Deferred Cash Contributions and then with respect to his After-Tax Contributions.
From and after January 1, 2013, no matching contributions shall be made to the Plan for BASF Employees. (b) For the 2011 Plan Year, the Employer shall make a nonelective contribution for each of the following BASF
Employees:

4
Harolton Alexander Jesse Martin Kasall Thomas Bacon Son V. Lam Bonny Barthelemy Lorrie Langan Paul Boiselle Richard Anton LaPointe John H. Bottomley Cynthia Elizabeth Litton William H. Budlong Luke Minnifield Hoang Van Bui Vernon Pecker Lawrence D. Casey Michael Quigley Paul J. Cunningham David Reynolds Joanne Deschaine Peter F. Ruggiero Michael J. Deyo Jeffrey B. Schools Thomas Dombroski Scott M. Sheehan Elizabeth A. Falardeau April M. Sinnock Robert C. Ferro Janet B. Smith Marc J. Froning Richard M. Starbird Wilner Glaudin Monica T. Suon Ronald J. Golden Christopher Tanner David A. Goodhue Huwerl Thorton Barbara Goodhue Keith A. Warnock Jonathan James Harrington Sharon Warnock Timothy P. Hudson Gloria Watkins Danny L. Johnston Anthony Wolf Daniel J. Kane Vue Pao Xiong
The amount of the special nonelective contribution shall be equal to 5% of the eligible BASF Employee’s Compensation for each payroll period ending after April 8, 2011 and on or before December 31, 2011.
From and after January 1, 2012, no nonelective contributions shall be made to the Plan for any BASF Employees. (c) The Administrative Committee shall establish such separate accounts within the Employer Account as may be necessary to
account for the special contributions made pursuant to this paragraph 22. (d) BASF Employees shall at all times be 100% vested in the special contribution subaccounts within his Employer Account. (e) Matching contributions made pursuant to this paragraph 22 shall be included in performing the contribution percentage test
under Section 3.12 in accordance with applicable law. In addition, any matching contributions made with respect to Deferred Cash Contributions or Roth Deferred Cash Contributions refunded pursuant to Section 3.11 or After-Tax Contributions refunded pursuant to Section 3.12 shall be treated as a forfeiture. Any refund of excess aggregate contributions under Section 3.12 shall be coordinated with any refund required under Section 3.11 and shall not discriminate in favor of any Highly Compensated Employees receiving such distributions.
5
(f) The Administrative Committee shall adopt such rules of administration uniformly applicable to all employees similarly situated as it deems necessary to administer the provisions of this paragraph 22 in accordance with applicable law.
6. Appendix A is amended, effective January 1, 2012, by adding the following paragraph 23 to read as follows: 23. ACRA Control, Inc. Each employee of ACRA Control, Inc. who became an Employee as of July 28, 2011, shall be eligible to become a
Member on January 1, 2012, and shall be subject to the provisions of Section 2.06(a) as of such date. Any such Employee shall remain eligible for the Plan so long as he continues to satisfy the eligibility requirements.
7. The Predator Systems Plan shall be and hereby is merged into the Plan, effective July 1, 2011, with the surviving plan being
this Plan. Accounts transferred to the Plan from the Predator Systems Plan shall initially be invested in the Investment Fund designated by the Administrative Committee, which shall be the Fidelity Freedom Fund selected on the basis of the Member’s age. Any Member may thereafter change the investment of his Account, including the transferred amounts, in accordance with the Plan’s provisions relating to the investment of Members’ Accounts.
Except to the extent amended by this Instrument of Amendment, the Plan shall remain in full force and effect. IN WITNESS WHEREOF, this amendment has been executed on this ____ day of __________________, 2011.
Curtiss-Wright Corporation Administrative Committee By:
Date:

Exhibit 10.11
CURTISS-WRIGHT CORPORATION SAVINGS AND INVESTMENT PLAN
As Amended and Restated effective January 1, 2010
THIRD INSTRUMENT OF AMENDMENT
Recitals:
Amendments to the Plan:
Appendix A is amended, effective October 11, 2011, by adding a new paragraph 24 to read as follows:
Except to the extent amended by this Instrument of Amendment, the Plan shall remain in full force and effect.
IN WITNESS WHEREOF, this amendment has been executed on this _____ day of _________________, 2011.
1. Curtiss-Wright Corporation (the “Company”) has heretofore adopted the Curtiss-Wright Corporation Savings and Investment Plan (the “Plan”) and has caused the Plan to be amended and restated in its entirety, effective as of January 1, 2010.
2. Subsequent to the most recent amendment and restatement of the Plan, the Company has decided to amend the Plan to
provide for the participation of certain former employees of South Bend Controls Holdings, LLC following the Company’s acquisition of the assets of that company.
3. Section 12.01(a) of the Plan permits the Company to amend the Plan, by written instrument, at any time and from time to
time. 4. Section 12.01(b) authorizes the Administrative Committee to adopt Plan amendments on behalf of the Company if they
reflect acquisitions.
24. South Bend Controls Holdings, LLC Notwithstanding any provision in this Plan to the contrary, each former employee of South Bend Controls Holdings, LLC who
became an Employee as of October 11, 2011, and who is a member of the collective bargaining unit represented by IBEW Local Union 1392 shall be eligible to become a Member on October 11, 2011, and shall remain eligible so long as he continues to satisfy the eligibility requirements.
Curtiss-Wright Corporation Administrative Committee By:
Date:

Exhibit 10.14
CURTISS-WRIGHT ELECTRO-MECHANICAL CORPORATION SAVINGS PLAN
As Amended and Restated effective January 1, 2010
FIRST INSTRUMENT OF AMENDMENT
Recitals:
Amendment to the Plan:
1
1. Curtiss-Wright Corporation (the “Company”) has heretofore adopted the Curtiss-Wright Electro-Mechanical Corporation Savings Plan (the “Plan”) and has caused the Plan to be amended and restated in its entirety, effective as of January 1, 2010.
2. Subsequent to the most recent amendment and restatement of the Plan, the Company has decided to amend the Plan for
the following reasons: a. To allow participants to elect a rollover of eligible distributions from their Plan accounts into their Roth Contribution
Account; and b. To allow participants to elect a rollover of an outstanding loan if their employment is terminated as a result of the sale of
a business unit and they continue employment with the buyer. 3. Article XII.1 of the Plan permits the Company to amend the Plan, by written instrument, at any time and from time to time. 4. Article XIV.2 authorizes the Administrative Committee to adopt Plan amendments on behalf of the Company if they are
necessary for Plan administration and do not materially increase costs or if they implement special rules for sales.
1. Article IV.4 is amended, effective December 1, 2010, by adding a paragraph to read as follows: Effective December 1, 2010, a Participant who is then an Employee may elect to roll over a distribution from one or more of
his Accounts to his Roth Contribution Account (an “in-plan Roth rollover”) that (1) is otherwise eligible for distribution from the Plan; (2) qualifies as an eligible rollover distribution pursuant to Section 402(c)(4) of the Code; and (3) is not a distribution from the Participant’s Roth Contribution Account. Any such in-plan Roth rollover shall be made in accordance with, and treated as a taxable distribution to the extent required by, Section 402A(c)(4) of the Code and any regulations and other guidance issued under that provision.

Except to the extent amended by this Instrument of Amendment, the Plan shall remain in full force and effect.
IN WITNESS WHEREOF, this amendment has been executed on this ______ day of __________________, 2011.
2
2. Article IX.1.g.(2) is amended in its entirety, effective January 1, 2011, to read as follows: (2) A Participant who (i) becomes a Retired Participant or a Totally Disabled Participant, or (ii) transfers employment from
an Employer to an Affiliated Employer or an Excluded Unit may elect to continue to make repayments by check or money order following his date of retirement or disability or while employed by such entity (as applicable).
Except as otherwise required by law or as provided in the following paragraph, if a Terminated Participant has an
outstanding loan balance at the time his employment terminates, the remaining balance shall become immediately due and payable as of the date specified in the loan procedures applicable to the Plan, which shall be described in the applicable Plan administration manual or set forth in a separate document adopted by the Plan Administrator. If the Terminated Participant (or his Surviving Spouse, in the case of a termination that results from the Participant’s death) does not repay the full loan balance at this time in a manner acceptable to the Trustee, the Terminated Participant’s Accounts shall be offset by the unpaid loan balance. The loan shall be considered fully repaid as of the date of this reduction.
Notwithstanding the foregoing, if a Participant with an outstanding loan balance terminates employment with the
Employer and all Affiliated Entities as a result of the Employer’s sale to an unrelated entity of assets used in a trade or business or its interest in a subsidiary and the Participant continues employment with the buyer following such sale, the Participant may elect, within 60 days of such termination, to roll over the outstanding loan note to an eligible retirement plan (as defined in Article VII.12) maintained by the buyer that accepts such rollovers. This paragraph shall apply to sales occurring on or after July 29, 2011.
Curtiss-Wright Corporation Administrative Committee By:
Date:

Exhibit 10.17
CURTISS-WRIGHT CORPORATION EXECUTIVE DEFERRED COMPENSATION PLAN
As Amended Through August 29, 2008
FIRST INSTRUMENT OF AMENDMENT
Recitals:
1
1. Curtiss-Wright Corporation (the “Company”) has heretofore adopted the Curtiss-Wright Corporation Executive Deferred Compensation Plan (the “Plan”) and has caused the Plan to be amended and restated with respect to compensation earned after December 31, 2004, including amendments adopted through August 29, 2008.
2. Subsequent to the most recent amendment, the Company has decided to amend the Plan to provide for adding interest to a
distribution that is delayed because the participant is a specified employee within the meaning of Section 409A(a)(2)(B)(i) of the Internal Revenue Code.
3. Section 7.01 of the Plan permits the Company to amend the Plan, by written instrument, at any time and from time to time. 4. Section 7.02 authorizes the Administrative Committee to adopt Plan amendments on behalf of the Company if they are
administrative in nature or have no material financial impact on the Company. Amendment to the Plan: 1. Section 1.21 is amended, effective January 1, 2011, by adding a new sentence to read as follows: Notwithstanding the foregoing, in any case where Section 4.06 requires a delay in making a single sum payment to a
Participant who has retired or terminated from employment, the Valuation Date for determining the amount of such payment shall be the last day of the sixth month following the month in which the retirement or termination occurs.
2. Section 4.06 is amended, effective January 1, 2011, by adding a paragraph to read as follows: In any case where this Section 4.06 requires a delay in making a single sum payment to a Participant, the amount of such
payment shall be determined as of the applicable Valuation Date under Section 1.21. In any case where this Section 4.06 requires a delay in making an installment payment to a Participant, the amount of such installment payment shall be calculated as provided in Section 4.02(c) or 4.03(d) (as applicable) and then increased with interest at the rate specified under Section 3.03 for the period extending from the last day of the calendar year preceding the year of payment until the last day of the sixth month following the month in which the Participant’s retirement or termination occurs.

Except to the extent amended by this Instrument of Amendment, the Plan shall remain in full force and effect.
IN WITNESS WHEREOF, this amendment has been executed on this ____ day of __________________, 2011.
2
Curtiss-Wright Corporation Administrative Committee By: Date:

Exhibit 21
Subsidiaries of the Registrant
The information below is provided, as of December 31, 2011 with respect to the subsidiaries of the Registrant, all of which are wholly owned by the Corporation, directly or indirectly. The names of certain inactive subsidiaries and other consolidated subsidiaries of the Registrant have been omitted because such subsidiaries would not constitute a significant subsidiary, individually or in the aggregate.
Name Organized Under
the Laws of
Curtiss Wright Controls (UK) Ltd United Kingdom Curtiss-Wright Antriebstechnik GmbH Switzerland Curtiss-Wright Controls Electronic Systems Inc. California Curtiss-Wright Controls Integrated Sensing, Inc. Delaware Curtiss-Wright Controls, Inc. Delaware Curtiss-Wright Electro-Mechanical Corporation Delaware Curtiss-Wright Flow Control Company Canada Nova Scotia Curtiss-Wright Flow Control Corporation New York Dy4 Inc Delaware Dy4 Systems, Inc. Ontario Indal Technologies, Inc. Canada Metal Improvement Company, LLC Delaware Novatronics, Inc. Ontario Peerless Instrument Co., Inc. New York Penny & Giles Controls Limited United Kingdom Primagraphics (Holdings) Limited United Kingdom

Exhibit 23
CONSENT OF INDEPENDENT REGISTERED PUBLIC ACCOUNTING FIRM
We consent to the incorporation by reference in Registration Statement Nos. 33-65073, 333-116195, 333-126541, 333-126543, and 333-177739 on Form S-8, of our reports dated February 24, 2012, relating to the consolidated financial statements and financial statement schedule of Curtiss-Wright Corporation and subsidiaries, and the effectiveness of internal control over financial reporting, appearing in this Annual Report on Form 10-K of Curtiss-Wright Corporation and subsidiaries for the year ended December 31, 2011.
/s/ Deloitte & Touche LLP
Parsippany, New Jersey February 24, 2012

Exhibit 31.1
Certifications
I, Martin R. Benante, certify that:
February 24, 2012
/s/ Martin R. Benante Martin R. Benante Chairman and Chief Executive Officer
1.
I have reviewed this Annual Report on Form 10-K of Curtiss-Wright Corporation;
2.
Based on my knowledge, this report does not contain any untrue statement of a material fact or omit to state a material fact necessary to make the statements made, in light of the circumstances under which such statements were made, not misleading with respect to the period covered by this report;
3.
Based on my knowledge, the financial statements, and other financial information included in this report, fairly present in all material respects the financial condition, results of operations and cash flows of the registrant as of, and for, the periods presented in this report;
4.
The registrant’s other certifying officer(s) and I are responsible for establishing and maintaining disclosure controls and procedures (as defined in Exchange Act Rules 13a-15(e) and 15d-15(e)) and internal control over financial reporting (as defined in Exchange Act Rules 13a-15(f) and 15d-15(f)) for the registrant and have:
(a)
Designed such disclosure controls and procedures, or caused such disclosure controls and procedures to be designed under our supervision, to ensure that material information relating to the registrant, including its consolidated subsidiaries, is made known to us by others within those entities, particularly during the period in which this report is being prepared;
(b)
Designed such internal control over financial reporting, or caused such internal control over financial reporting to be designed under our supervision, to provide reasonable assurance regarding the reliability of financial reporting and the preparation of financial statements for external purposes in accordance with generally accepted accounting principles;
(c)
Evaluated the effectiveness of the registrant’s disclosure controls and procedures and presented in this report our conclusions about the effectiveness of the disclosure controls and procedures, as of the end of the period covered by this report based on such evaluation; and
(d)
Disclosed in this report any change in the registrant’s internal control over financial reporting that occurred during the registrant’s most recent fiscal quarter (the registrant’s fourth fiscal quarter in the case of an annual report) that has materially affected, or is reasonably likely to materially affect, the registrant’s internal control over financial reporting; and
5.
The registrant’s other certifying officer(s) and I have disclosed, based on our most recent evaluation of internal control over financial reporting, to the registrant’s auditors and the audit committee of the registrant’s board of directors (or persons performing the equivalent functions):
(a)
All significant deficiencies and material weaknesses in the design or operation of internal control over financial reporting which are reasonably likely to adversely affect the registrant’s ability to record, process, summarize and report financial information; and
(b)
Any fraud, whether or not material, that involves management or other employees who have a significant role in the registrant’s internal control over financial reporting.

Exhibit 31.2
Certifications
I, Glenn E. Tynan, certify that:
February 24, 2012
/s/ Glenn E. Tynan Glenn E. Tynan Chief Financial Officer
1.
I have reviewed this Annual Report on Form 10-K of Curtiss-Wright Corporation;
2.
Based on my knowledge, this report does not contain any untrue statement of a material fact or omit to state a material fact necessary to make the statements made, in light of the circumstances under which such statements were made, not misleading with respect to the period covered by this report;
3.
Based on my knowledge, the financial statements, and other financial information included in this report, fairly present in all material respects the financial condition, results of operations and cash flows of the registrant as of, and for, the periods presented in this report;
4.
The registrant’s other certifying officer(s) and I are responsible for establishing and maintaining disclosure controls and procedures (as defined in Exchange Act Rules 13a-15(e) and 15d-15(e)) and internal control over financial reporting (as defined in Exchange Act Rules 13a-15(f) and 15d-15(f)) for the registrant and have:
(a)
Designed such disclosure controls and procedures, or caused such disclosure controls and procedures to be designed under our supervision, to ensure that material information relating to the registrant, including its consolidated subsidiaries, is made known to us by others within those entities, particularly during the period in which this report is being prepared;
(b)
Designed such internal control over financial reporting, or caused such internal control over financial reporting to be designed under our supervision, to provide reasonable assurance regarding the reliability of financial reporting and the preparation of financial statements for external purposes in accordance with generally accepted accounting principles;
(c)
Evaluated the effectiveness of the registrant’s disclosure controls and procedures and presented in this report our conclusions about the effectiveness of the disclosure controls and procedures, as of the end of the period covered by this report based on such evaluation; and
(d)
Disclosed in this report any change in the registrant’s internal control over financial reporting that occurred during the registrant’s most recent fiscal quarter (the registrant’s fourth fiscal quarter in the case of an annual report) that has materially affected, or is reasonably likely to materially affect, the registrant’s internal control over financial reporting; and
5.
The registrant’s other certifying officer(s) and I have disclosed, based on our most recent evaluation of internal control over financial reporting, to the registrant’s auditors and the audit committee of the registrant’s board of directors (or persons performing the equivalent functions):
(a)
All significant deficiencies and material weaknesses in the design or operation of internal control over financial reporting which are reasonably likely to adversely affect the registrant’s ability to record, process, summarize and report financial information; and
(b)
Any fraud, whether or not material, that involves management or other employees who have a significant role in the registrant’s internal control over financial reporting.
Exhibit 32
CERTIFICATION PURSUANT TO 18 U.S.C. SECTION 1350
In connection with the Annual Report of Curtiss-Wright Corporation (the “Company”) on Form 10-K for the period ended December 31, 2011 as filed with the Securities and Exchange Commission on the date hereof (the “Report”), Martin R. Benante, as Chairman and Chief Executive Officer of the Company, and Glenn E. Tynan, as Chief Financial Officer of the Company, each hereby certifies, pursuant to 18 U.S.C. section 1350, that to the best of his knowledge:
/s/ Martin R. Benante Martin R. Benante Chairman and Chief Executive Officer February 24, 2012
/s/ Glenn E. Tynan Glenn E. Tynan Chief Financial Officer February 24, 2012
(1)
The Report fully complies with the requirements of section 13(a) or 15(d) of the Securities Exchange Act of 1934; and
(2)
The information contained in the Report fairly presents, in all material respects, the financial condition and results of operations of the Company.