united states securities and exchange commission … · 2017-07-07 · united states securities and...
TRANSCRIPT

UNITED STATES SECURITIES AND EXCHANGE COMMISSION
Washington, D.C. 20549
Form 6-K
REPORT OF FOREIGN PRIVATE ISSUER PURSUANT TO RULE 13a-16 OR 15d-16 UNDER THE SECURITIES EXCHANGE ACT OF 1934
July 22, 2014
Commission File Number 001-33434
CREDIT SUISSE AG(Translation of registrant’s name into English)
Paradeplatz 8, CH 8001 Zurich, Switzerland (Address of principal executive office)
Indicate by check mark whether the registrant files or will file annual reports under cover of Form 20-F or Form 40-F.
Form 20-F x Form 40-F o
Indicate by check mark if the registrant is submitting the Form 6-K in paper as permitted by Regulation S-T Rule 101(b)(1):
Note: Regulation S-T Rule 101(b)(1) only permits the submission in paper of a Form 6-K if submitted solely to provide an attached annual report to security holders.
Indicate by check mark if the registrant is submitting the Form 6-K in paper as permitted by Regulation S-T Rule 101(b)(7):
Note: Regulation S-T Rule 101(b)(7) only permits the submission in paper of a Form 6-K if submitted to furnish a report or other document that the registrant foreign private issuer must furnish and make public under the laws of the jurisdiction in which the registrant is incorporated, domiciled or legally organized (the registrant’s “home country”), or under the rules of the home country exchange on which the registrant’s securities are traded, as long as the report or other document is not a press release, is not required to be and has not been distributed to the registrant’s security holders, and, if discussing a material event, has already been the subject of a Form 6-K submission or other Commission filing on EDGAR.

2
IntroductionThis report filed on Form 6-K contains certain information about Credit Suisse AG (Bank) relating to its results as of and for the three and six months ended June 30, 2014. On July 22, 2014, Credit Suisse Group AG (Group) announced its results for such three and six month period. A copy of the related Earnings Release is attached as an exhibit to this Form 6-K.
This Form 6-K (including the exhibit hereto) is hereby (i) incorporated by reference into the Registration Statement on Form F-3 (file no. 333-180300) and (ii) shall be deemed to be “filed” for purposes of the Securities Exchange Act of 1934, as amended except, in the case of both (i) and (ii), the information on page 3 of the Earnings Release.
The 2Q14 Credit Suisse Financial Report as of and for the three and six months ended June 30, 2014 will be published on or about July 31, 2014.
Credit Suisse AG is a Swiss bank and joint stock corporation established under Swiss law, and is a wholly-owned subsidiary of the Group. The Bank’s registered head office is in Zurich, and it has additional executive offices and principal branches in London, New York, Hong Kong, Singapore and Tokyo.
References herein to “CHF” are to Swiss francs.
3
Key information
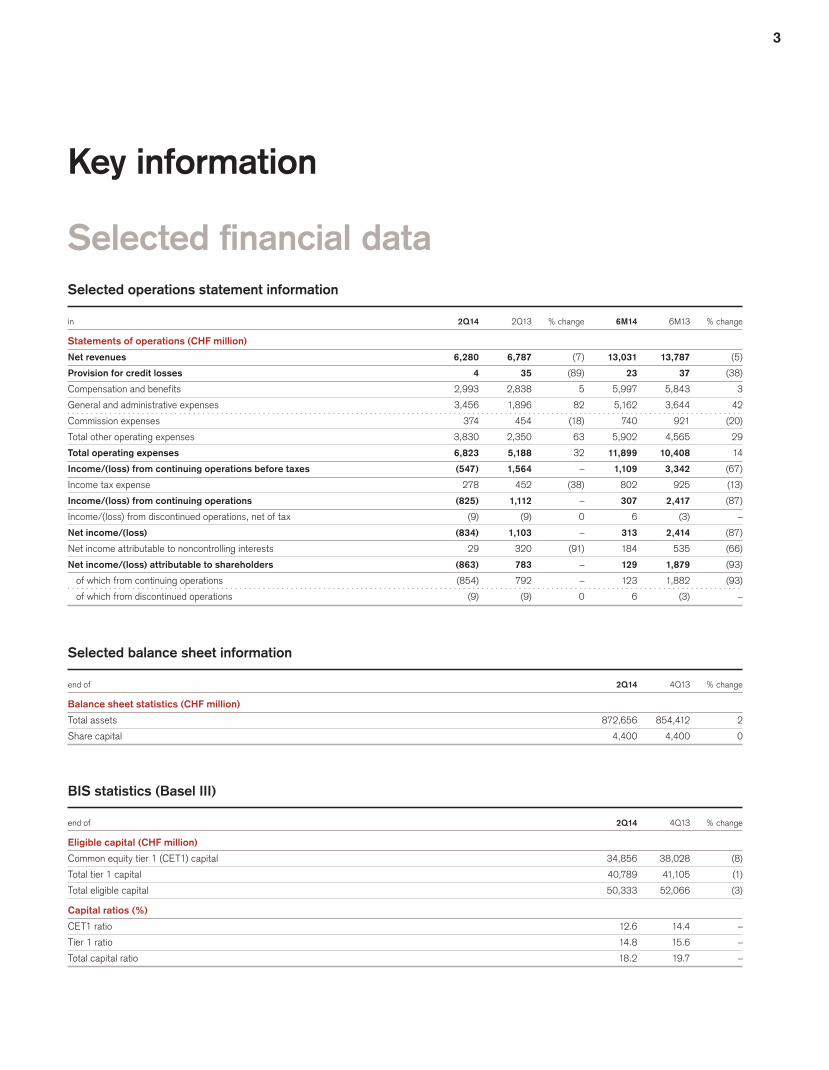
Selected financial dataSelected operations statement information
in 2Q14 2Q13 % change 6M14 6M13 % change
Statements of operations (CHF million)
Net revenues 6,280 6,787 (7) 13,031 13,787 (5)
Provision for credit losses 4 35 (89) 23 37 (38)
Compensation and benefits 2,993 2,838 5 5,997 5,843 3
General and administrative expenses 3,456 1,896 82 5,162 3,644 42
Commission expenses 374 454 (18) 740 921 (20)
Total other operating expenses 3,830 2,350 63 5,902 4,565 29
Total operating expenses 6,823 5,188 32 11,899 10,408 14
Income/(loss) from continuing operations before taxes (547) 1,564 – 1,109 3,342 (67)
Income tax expense 278 452 (38) 802 925 (13)
Income/(loss) from continuing operations (825) 1,112 – 307 2,417 (87)
Income/(loss) from discontinued operations, net of tax (9) (9) 0 6 (3) –
Net income/(loss) (834) 1,103 – 313 2,414 (87)
Net income attributable to noncontrolling interests 29 320 (91) 184 535 (66)
Net income/(loss) attributable to shareholders (863) 783 – 129 1,879 (93)
of which from continuing operations (854) 792 – 123 1,882 (93)
of which from discontinued operations (9) (9) 0 6 (3) –
Selected balance sheet information
end of 2Q14 4Q13 % change
Balance sheet statistics (CHF million)
Total assets 872,656 854,412 2
Share capital 4,400 4,400 0
BIS statistics (Basel III)
end of 2Q14 4Q13 % change
Eligible capital (CHF million)
Common equity tier 1 (CET1) capital 34,856 38,028 (8)
Total tier 1 capital 40,789 41,105 (1)
Total eligible capital 50,333 52,066 (3)
Capital ratios (%)
CET1 ratio 12.6 14.4 –
Tier 1 ratio 14.8 15.6 –
Total capital ratio 18.2 19.7 –

4
Operating and financial review and prospectsExcept where noted, the business of the Bank is substantially the same as the business of the Group, and substantially all of the Bank’s operations are conducted through the Private Banking & Wealth Management and Investment Banking segments. These segment results are included in Core Results. Certain other assets, liabilities and results of operations are managed as part of the activities of the two segments. However, since they are legally owned by the Group, they are not included in the Bank’s consolidated financial state-ments. These relate principally to the activities of Neue Aargauer Bank and BANK-now, which are managed as part of Private Banking & Wealth Management. Core Results also includes certain Corporate Center activities of the Group that are not applicable to the Bank.
These operations and activities vary from period to period and give rise to differences between the Bank’s consolidated assets, liabilities, revenues and expenses, including pensions and taxes, and those of the Group.
Differences between the Group and the Bank businesses
Entity Principal business activity
Neue Aargauer Bank Banking (in the Swiss canton of Aargau)
BANK-now Private credit and car leasing (in Switzerland)
Special purpose vehicles for various funding activities
Financing vehicles of the Group of the Group, including for purposes of raising consolidated capital
Comparison of selected operations statement information
Bank Group
in 2Q14 2Q13 2Q14 2Q13
Statements of operations (CHF million)
Net revenues 6,280 6,787 6,463 6,952
Total operating expenses 6,823 5,188 6,791 5,256
Income/(loss) from continuing operations before taxes (547) 1,564 (346) 1,645
Income/(loss) from continuing operations (825) 1,112 (653) 1,173
Net income/(loss) attributable to shareholders (863) 783 (700) 1,045
of which from continuing operations (854) 792 (691) 1,054
Comparison of selected operations statement information
Bank Group
in 6M14 6M13 6M14 6M13
Statements of operations (CHF million)
Net revenues 13,031 13,787 13,292 14,041
Total operating expenses 11,899 10,408 11,843 10,449
Income from continuing operations before taxes 1,109 3,342 1,397 3,519
Income from continuing operations 307 2,417 547 2,548
Net income attributable to shareholders 129 1,879 159 2,348
of which from continuing operations 123 1,882 153 2,351
5
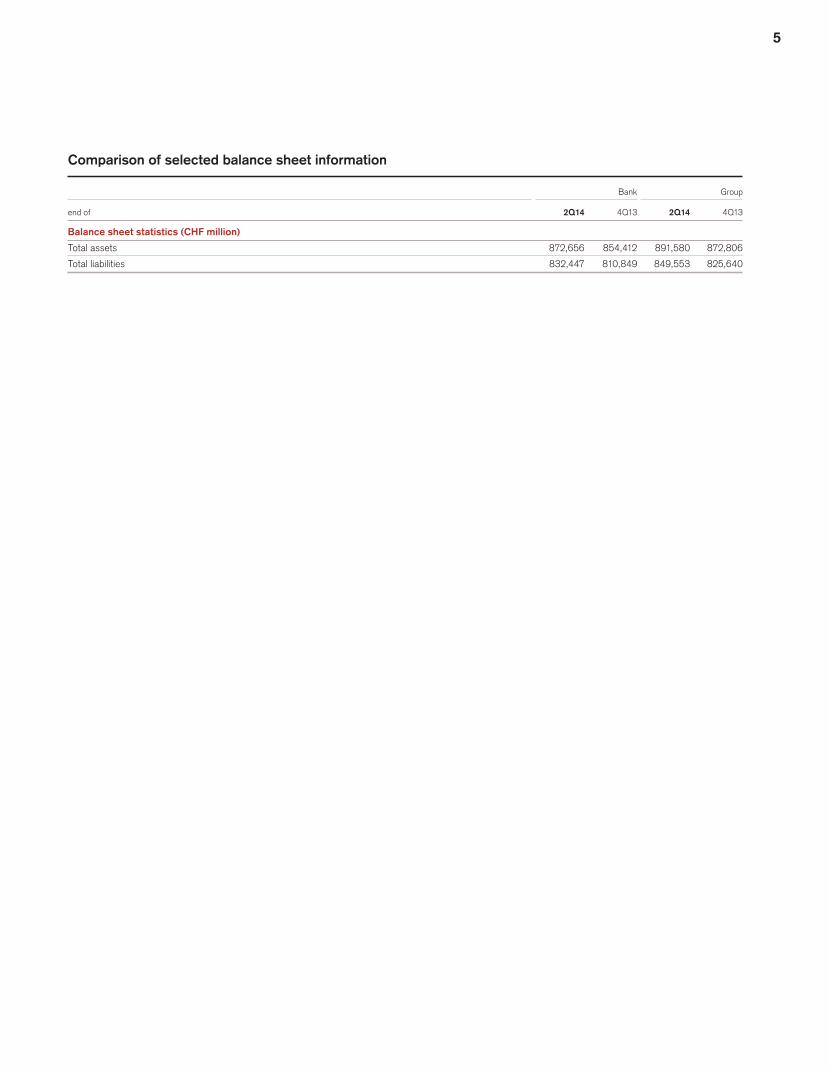
Comparison of selected balance sheet information
Bank Group
end of 2Q14 4Q13 2Q14 4Q13
Balance sheet statistics (CHF million)
Total assets 872,656 854,412 891,580 872,806
Total liabilities 832,447 810,849 849,553 825,640

6
ExhibitsNo. Description
99.1 Credit Suisse Earnings Release 2Q14

7
SignaturesPursuant to the requirements of the Securities Exchange Act of 1934, the registrant has duly caused this report to be signed on its behalf by the undersigned, thereunto duly authorized.
CREDIT SUISSE AG (Registrant) Date: July 22, 2014
By:/s/ Brady W. Dougan Brady W. Dougan Chief Executive Officer
By:/s/ David R. Mathers David R. Mathers Chief Financial Officer

CREDIT SUISSE GROUP AGParadeplatz 8P.O. BoxCH-8070 ZurichSwitzerland
Telephone +41 844 33 88 44Fax +41 44 333 88 [email protected]
Earnings Release
Credit Suisse 2Q14 results: Core pre-tax income of CHF 1,767 million for strategic businesses and return on equity of 13%; reported Core pre-tax loss of CHF 370 million, reflecting the previously announced CHF 1,618 million charge relating to the final settlement of all outstanding US cross-border matters
Credit Suisse 6M14 results: Core pre-tax income of CHF 3,707 million for strategic businesses and return on equity of 13%; reported Core pre-tax income of CHF 1,030 million
Look-through CET1 ratio of 9.5% as of the end of 2Q14; on track to exceed 10% by year-end 2014
Resilient 2Q14 performance of Private Banking & Wealth Management’s strategic businesses with strong net new assets of CHF 11.8 billion
2Q14 Investment Banking results reflect strong origination activity, continued strong performance in credit and securitized products and improved capital efficiency
Private Banking & Wealth Management strategic performance reflecting lower revenues but continued efficiency gains:p 2Q14resilientprofitabilityinstrategicbusinesseswithpre-taxincomeofCHF 882million,down13%froma
verystrong2Q13,andareturnoncapitalof28%p 2Q14totalreportedpre-taxlossofCHF 749million,includingthepreviouslyannouncedCHF 1,618million
charge relating to the final settlement of all outstanding US cross-border mattersp Furtherincreasedcostefficiencyofstrategicbusinessesin6M14withcost/incomeratioof68%,improved
from71%in6M13p IncreasedWealthManagementClientsnetmarginto28basispointsfor6M14,supportedbysignificant
progress on cost reductionp WealthManagementClients2Q14grossmarginat99basispoints,downfivebasispointscomparedto1Q14,
reflectinganincreaseinassetsundermanagement,achangeinclientmix,lowerfee-basedrevenuesandslightly lower net interest income
p Strong2Q14netnewassetsfromstrategicbusinessesofCHF 11.8billionwithannualizedgrowthrateof4%,notwithstandingcontinuedoutflowsofCHF 2.9billionfromWesternEuropeancross-borderbusinessduetosubstantialprogressonregularizationofassetbase;totalnetnewassetsofCHF 10.1billionwithtotalWesternEuropeancross-borderoutflowsofCHF 4.1billion

Earnings ReleaseJuly22,2014
Page 2
Investment Banking performance reflecting stability of diversified strategic franchise:p Strategicbusinesseswithpre-taxincomeofCHF 1,034millionandreturnoncapitalof18%;strong
performancefromfixedincomeyieldfranchisesandunderwritingbusinesses,partlyoffsetbylessfavorabletrading conditions for equity sales and trading and continued weakness in global macro products
p Totalreportedpre-taxincomeofCHF 752millionwithstrongperformanceinkeybusinessesandaccelerationin the wind-down of the non-strategic unit
p Strong6M14returnoncapitalinInvestmentBanking,with20%fromstrategicbusinessesandsolid13%intotal reported results
p Restructuringofmacrobusiness,includingexitfromcommoditiestrading,tofurtherenhancecapitalandoperatingefficienciestargetingapproximatelyUSD 200millioninexpensesavings,USD 8billioninrisk-weightedassetreductionandUSD 25billioninleverageexposurereductionbytheend-state
Resilient capital base and leverage ratio as of the end of 2Q14, notwithstanding the settlement of the US cross-border matter:p Look-throughBISCET1ratioof9.5%,progressinexecutingcapitalmeasuresexpectedtofullymitigateimpact
oflitigationsettlementandontracktoexceed10%CET1ratiobyyear-end,includingcontinuedaccrualofcashdividendfor2014;Look-throughSwisstotalcapitalratioat15.3%
p LeverageexposureatCHF 1,156billion;Phase-inSwissleverageratioof4.8%;Look-throughSwissleverageratioof3.7%withinreachofthe2019requirementof4%
On track to reach cost reduction targets:p DeliveredCHF 3.4billionofadjustedannualizedsavingscomparedtotheannualizedexpenserunratefor
6M11;maintainingmomentumtowardstargetofoverCHF 4.5billionbyend-2015
Wind-down of non-strategic units and progress in resolving legacy litigation issues:p Wind-downaheadofschedulewithSwissleverageexposurereductionofUSD 3billionandrisk-weightedasset
reductionofUSD 6billionintheInvestmentBankingnon-strategicunitp Significant progress in resolving key legacy litigation issues in 2014 to date

Earnings ReleaseJuly22,2014
Page 3
July22,2014Credit Suisse Group reports 2Q14 and 6M14 results
BradyW.Dougan,ChiefExecutiveOfficer,said:“Ourreportedresultsforthesecondquarterandthefirsthalfof2014wereimpactedbytheresolutionofourmostsignificantlegacylitigationissue.Duringthequarter,wecontinuedtoseegoodmomentumwithclients,whileatthesametimemakingfurtherprogressinwinding-downournon-strategicunits.Ourstrategicresultsweresolid,demonstratingtheresilienceofourbusinessmodel,notwithstanding subdued client trading activity in certain areas which impacted both Private Banking & Wealth ManagementandInvestmentBanking.”
Hecontinued:“WiththefinalsettlementofalloutstandingUScross-bordermattersasannouncedinMay,webrought to a close the most significant and longstanding litigation issue for Credit Suisse. I want to reiterate that we deeply regret the past misconduct that led to this settlement and that we take full responsibility for it. The continued trust and support of our clients helped us mitigate the impact of the settlement on our business. We areexecutingourcapitalmeasuresandareontracktoimproveourLook-throughCET1ratiotoabove10%bytheendoftheyear.Thisincludesthecontinuedaccrualforacashdividendfor2014.Oncewereach10%,andaswecontinuetoaccretecapitaltowardsour11%long-termtarget,weintendtoreturnapproximatelyhalfofourearningstoshareholdersthroughourannualdistributions.”
CommentingonPrivateBanking&WealthManagement,hesaid:“WegeneratedstrongnetnewassetsofCHF 11.8billioninthesecondquarterfromourstrategicbusinesses,drivenbygrowthinAsiaPacificandSwitzerland–twoofourkeymarkets.ThisstronggrowthmorethanoffsetoutflowsfromourWesternEuropeancrossborderbusiness,wherewearetakingproactivestepstoregularizeourassetbase.Thisispartoftheseculartransformationofthecrossborderwealthmanagementbusiness.Duringthequarter,wefurtherimprovedtheefficiencyofourstrategicbusinesseswithloweroperatingexpenses,whichhelpedusmitigatetheimpactofthesubduedtransactionactivityandthecontinuedlowinterestrateenvironmentonourresults.”
CommentingonInvestmentBanking,hesaid:“InvestmentBankingdeliveredsolidresultsforthesecondquarterof2014,reflectingstrongoriginationactivity,continuedmomentuminouryieldfranchisesandimprovedcapitalefficiencycomparedtothefirstquarter.Therestructuringofourmacrobusiness,includingtheexitfromcommoditiestrading,isexpectedtodrivefurthercapital,leverageandexpensereductions.Ourstrategicbusinessesreportedareturnoncapitalof18%forthesecondquarterand20%forthefirsthalfof2014,demonstratingthestabilityofourdiversifiedstrategicfranchise.”

Earnings ReleaseJuly 22, 2014
Page 4
Core Results summary
For additional information on financial information presented in this Earnings Release, including references to return on equity and return on capital, refer to the tabular disclosures in the Appendix and other explanatory disclosures regarding capital and leverage metrics in the section titled “Important information” on page 18.
Core Results highlights
in / end of % change in / end of % change
2Q14 1Q14 2Q13 QoQ YoY 6M14 6M13 YoY
Reported results (CHF million)
Net revenues 6,433 6,469 6,830 (1) (6) 12,902 13,848 (7)
Provision for credit losses 18 34 51 (47) (65) 52 73 (29)
Total operating expenses 6,785 5,035 5,239 35 30 11,820 10,430 13
Income/(loss) from continuing operations before taxes (370) 1,400 1,540 – – 1,030 3,345 (69)
Net income/(loss) attributable to shareholders (700) 859 1,045 – – 159 2,348 (93)
Metrics (%)
Return on capital – 14.4 14.6 – – 5.3 16.5 –
Cost/income ratio 105.5 77.8 76.7 – – 91.6 75.3 –
Strategic results (CHF million)
Net revenues 6,324 6,553 6,795 (3) (7) 12,877 13,813 (7)
Provision for credit losses 25 18 23 39 9 43 39 10
Total operating expenses 4,532 4,595 4,685 (1) (3) 9,127 9,480 (4)
Income from continuing operations before taxes 1,767 1,940 2,087 (9) (15) 3,707 4,294 (14)
Net income attributable to shareholders 1,282 1,398 1,455 (8) (12) 2,680 3,034 (12)
Metrics (%)
Return on capital 19.2 21.7 21.7 – – 20.5 23.3 –
Cost/income ratio 71.7 70.1 68.9 – – 70.9 68.6 –
Non-strategic results (CHF million)
Net revenues 109 (84) 35 – 211 25 35 (29)
Provision for credit losses (7) 16 28 – – 9 34 (74)
Total operating expenses 2,253 440 554 412 307 2,693 950 183
Loss from continuing operations before taxes (2,137) (540) (547) 296 291 (2,677) (949) 182
Net loss attributable to shareholders (1,982) (539) (410) 268 383 (2,521) (686) 267
Core Results do not include noncontrolling interests without significant economic interests.
Net loss attributable to shareholders was CHF 700 million in 2Q14.
Loss before taxes of CHF 370 million in 2Q14 compared to income before taxes of CHF 1,540 million in 2Q13, reflecting a 30% increase in total operating expenses, primarily driven by the CHF 1,618 million charge relating to the final settlement of all outstanding US cross-border matters. In strategic businesses, pre-tax income of CHF 1,767 million decreased 15% compared to 2Q13, and in non-strategic businesses the pre-tax loss was CHF 2,137 million.
Net revenues of CHF 6,433 million decreased 6% compared to 2Q13. In the strategic businesses, net revenues declined 7% to CHF 6,324 million compared to 2Q13, with lower revenues in Private Banking & Wealth Management and Investment Banking. In the non-strategic businesses, net revenues increased 211% to CHF 109 million compared to 2Q13.

Earnings ReleaseJuly 22, 2014
Page 5
Provision for credit losses of CHF 18 million in 2Q14, reflected net provisions in Private Banking & Wealth Management, partially offset by a release of provisions in Investment Banking.
Total operating expenses of CHF 6,785 million were up 30% compared to 2Q13, primarily reflecting 84% higher general and administrative expenses. In strategic businesses, total operating expenses of CHF 4,532 million decreased 3% compared to 2Q13, mainly reflecting an 18% decrease in commission expenses and a 5% decline in general and administrative expenses. In non-strategic businesses total operating expenses of CHF 2,253 million increased 307% compared to 2Q13, reflecting the litigation settlement charge of CHF 1,618 million recognized in the non-strategic results of the Private Banking & Wealth Management division. Business realignment costs in 2Q14 were CHF 153 million.
Income tax expense of CHF 307 million recorded in 2Q14 reflected the impact of the geographical mix of results, the recognition of additional Swiss deferred tax assets relating to timing differences following certain changes in Swiss GAAP and the re-assessment of UK deferred tax assets resulting in a reduction of deferred tax assets on net operating losses. Overall, net deferred tax assets decreased CHF 122 million to CHF 5,134 million as of the end of 2Q14 compared to 1Q14. Deferred tax assets on net operating losses decreased CHF 678 million to CHF 758 million during 2Q14. The Core Results effective tax rate was (83.0)% in 2Q14, compared to 38.8% in 1Q14. The effective tax rate reflects that the majority of the litigation settlement charge was non-deductible. Excluding this impact, the Core Results effective tax rate for 2Q14 would have been 26.2%.
Significant litigation matter in 2Q14. In May 2014, Credit Suisse entered into a comprehensive and final settlement regarding all outstanding US cross-border matters, including agreements with the US Department of Justice, the New York State Department of Financial Services, the Board of Governors of the US Federal Reserve System and, as previously announced, the US Securities and Exchange Commission (SEC). The final settlement amount was USD 2,815 million (CHF 2,510 million). In prior quarters, Credit Suisse had taken litigation provisions totaling CHF 892 million related to this matter. As a result, a pre-tax litigation settlement charge of CHF 1,618 million was recognized in 2Q14 in the non-strategic results of the Private Banking & Wealth Management division. The settlement included a guilty plea entered into by the Group’s Swiss banking entity, Credit Suisse AG.
Other litigation matters. The Group’s estimate of the aggregate range of reasonably possible losses that are not covered by existing provisions for certain proceedings for which the Group believes an estimate is possible decreased from a range of zero to CHF 2.4 billion at the end of 1Q14 to a range of zero to CHF 1.0 billion at the end 2Q14.
Diluted loss per share from continuing operations was CHF 0.45 for 2Q14 compared to diluted earnings per share of CHF 0.53 in 2Q13 and of CHF 0.47 in 1Q14.
Capital and leverage. As of the end of 2Q14, Credit Suisse reported a Look-through BIS common equity tier 1 (CET1) ratio of 9.5%, compared to 10.0% as of the end of 1Q14. As of the end of 2Q14, the Look-through Swiss total capital ratio was 15.3%, compared to 15.0% as of the end of 1Q14.
The BIS CET1 ratio as of the end of 2Q14 was 13.8%, compared to 14.3% as of the end of 1Q14, reflecting a decrease in CET1 capital. Basel III risk-weighted assets for the Group were stable at CHF 285.4 billion as of the end of 2Q14, reflecting a decrease in credit risk related to credit valuation adjustments (CVA) and market risk largely offset by increases in credit risk (excluding CVA) and operational risk and an increase resulting from foreign exchange translation.

Earnings ReleaseJuly 22, 2014
Page 6
As of the end of 2Q14, Credit Suisse’s Swiss leverage exposure amounted to CHF 1,156 billion, compared to an updated long-term target of approximately CHF 1,000 billion. The Look-through Swiss leverage ratio was 3.7%, compared to the 4% requirement for 2019.
Benefits of the integrated bank. In 2Q14, Credit Suisse generated CHF 1.0 billion of collaboration revenues from the integrated bank. This corresponds to 15.4% of Core net revenues in 2Q14.
Private Banking & Wealth Management
In 2Q14, Private Banking & Wealth Management reported a loss before taxes of CHF 749 million and net revenues of CHF 3,046 million. In its strategic businesses, Private Banking & Wealth Management reported income before taxes of CHF 882 million and net revenues of CHF 2,932 million. Compared to 2Q13, income before taxes in strategic businesses decreased 13%, mainly driven by lower transaction- and performance-based revenues and lower net interest income, partially offset by lower operating expenses. Net revenues were slightly lower compared to 1Q14 mainly due to lower transaction- and performance-based revenues and lower other revenues. In its non-strategic businesses, Private Banking & Wealth Management reported a loss before taxes of CHF 1,631 million, driven by the litigation settlement charge of CHF 1,618 million relating to the final settlement of all outstanding US cross-border matters. In 2Q14, assets under management for the division were CHF 1,329.7 billion and the division attracted net new assets of CHF 10.1 billion.
Private Banking & Wealth Management
in / end of % change in / end of % change
2Q14 1Q14 2Q13 QoQ YoY 6M14 6M13 YoY
Reported results (CHF million)
Net revenues 3,046 3,240 3,419 (6) (11) 6,286 6,697 (6)
Provision for credit losses 23 33 46 (30) (50) 56 74 (24)
Compensation and benefits 1,235 1,290 1,353 (4) (9) 2,525 2,732 (8)
Total other operating expenses 2,537 905 1,103 180 130 3,442 2,093 64
Total operating expenses 3,772 2,195 2,456 72 54 5,967 4,825 24
Income/(loss) before taxes (749) 1,012 917 – – 263 1,798 (85)
Metrics (%)
Return on capital – 31.0 28.0 – – 4.0 28.6 –
Cost/income ratio 123.8 67.7 71.8 – – 94.9 72.0 –

Earnings ReleaseJuly 22, 2014
Page 7
Strategic results
Private Banking & Wealth Management’s strategic results comprise businesses from Wealth Management Clients, Corporate & Institutional Clients and Asset Management.
Private Banking & Wealth Management – strategic results
in / end of % change in / end of % change
2Q14 1Q14 2Q13 QoQ YoY 6M14 6M13 YoY
Strategic results (CHF million)
Net interest income 954 963 1,054 (1) (9) 1,917 2,073 (8)
Recurring commissions and fees 1,136 1,139 1,155 0 (2) 2,275 2,256 1
Transaction- and performance-based revenues 865 919 1,033 (6) (16) 1,784 1,907 (6)
Other revenues (23) 10 (10) – 130 (13) 4 –
Net revenues 2,932 3,031 3,232 (3) (9) 5,963 6,240 (4)
Provision for credit losses 30 17 19 76 58 47 42 12
Total operating expenses 2,020 2,049 2,198 (1) (8) 4,069 4,427 (8)
Income before taxes 882 965 1,015 (9) (13) 1,847 1,771 4
Metrics (%)
Return on capital 28.0 31.6 33.5 – – 29.8 30.3 –
Cost/income ratio 68.9 67.6 68.0 – – 68.2 70.9 –
In 2Q14, the strategic businesses for Private Banking & Wealth Management reported income before taxes of CHF 882 million and net revenues of CHF 2,932 million.
Compared to 2Q13, net revenues decreased 9% primarily reflecting lower transaction- and performance-based revenues and decreased net interest income. The decrease in transaction- and performance-based revenues reflected lower revenues across most major revenue categories, primarily from foreign exchange client business, carried interest on realized private equity gains and semi-annual performance fees from Hedging-Griffo. In a low interest rate environment, net interest income decreased due to significantly lower deposit margins on stable average deposit volumes and slightly lower loan margins on higher average loan volumes. Slightly lower recurring commissions and fees reflected decreased investment product management fees, partially offset by higher discre-tionary mandate management fees and slightly higher asset management fees.
Compared to 1Q14, net revenues decreased 3%, primarily reflecting lower transaction- and performance-based revenues and lower other revenues. The decrease in transaction- and performance-based revenues reflected lower brokerage and product issuing fees, lower performance fees and carried interest, lower placement and transaction fees and lower foreign exchange client business, partially offset by higher equity participations income. Lower other revenues mainly reflected a fair value decrease on Clock Finance, a credit securitization transaction. Stable net interest income reflected lower deposit margins on stable average deposit volumes and stable loan margins on slightly higher average loan volumes. Stable recurring commissions and fees mainly reflected lower banking services fees and lower investment product management fees, largely offset by slightly higher asset management fees and slightly higher discretionary mandate management fees.
Provision for credit losses was CHF 30 million, compared to CHF 19 million in 2Q13 and CHF 17 million in 1Q14.
Total operating expenses were lower compared to 2Q13 and stable compared to 1Q14. Compared to 2Q13, compensation and benefits decreased 7%, mainly reflecting lower salary expenses, driven by lower headcount, and general and administrative expenses decreased 7%, primarily reflecting the results of the ongoing efficiency

Earnings ReleaseJuly 22, 2014
Page 8
measures and lower expense provisions. Compared to 1Q14, compensation and benefits decreased 3% due to lower discretionary performance-related compensation. Slightly higher general and administrative expenses primarily reflected higher travel and entertainment expenses and slightly higher professional services fees.
The cost/income ratio for strategic results was 69% in 2Q14, up one percentage point compared to 2Q13 and 1Q14.
Wealth Management Clients
in / end of % change in / end of % change
2Q14 1Q14 2Q13 QoQ YoY 6M14 6M13 YoY
Strategic results (CHF million)
Net interest income 688 706 778 (3) (12) 1,394 1,524 (9)
Recurring commissions and fees 728 730 750 0 (3) 1,458 1,467 (1)
Transaction- and performance-based revenues 601 638 711 (6) (15) 1,239 1,335 (7)
Net revenues 2,017 2,074 2,239 (3) (10) 4,091 4,326 (5)
Provision for credit losses 17 16 20 6 (15) 33 39 (15)
Total operating expenses 1,431 1,480 1,598 (3) (10) 2,911 3,212 (9)
Income before taxes 569 578 621 (2) (8) 1,147 1,075 7
Metrics (%)
Cost/income ratio 70.9 71.4 71.4 – – 71.2 74.2 –
The Wealth Management Clients business in 2Q14 reported pre-tax income of CHF 569 million and net revenues of CHF 2,017 million. Net revenues decreased 10% compared to 2Q13, with lower transaction- and performance-based revenues, lower net interest income and slightly lower recurring commissions and fees. Transaction- and performance-based revenues decreased, mainly reflecting lower market activity adversely impacting foreign exchange client business and brokerage and product issuing fees, as well as lower equity participations income, due to an increased dividend in 2Q13 related to an ownership interest in SIX Group AG, and lower performance fees from Hedging-Griffo. Lower net interest income reflected the low interest rate environment, significantly lower deposit margins on stable average deposit volumes and lower loan margins on higher average loan volumes and lower levels of deposits eligible as stable funding. Recurring commissions and fees decreased slightly, driven by lower investment product management fees and slightly lower investment account and services fees, partially offset by higher discretionary mandate management fees and slightly higher banking services fees.
Compared to 1Q14, net revenues decreased 3%, driven by lower transaction- and performance-based revenues and slightly lower net interest income. Transaction- and performance-based revenues decreased, mainly driven by lower brokerage and product issuing fees and lower placement and transaction fees, partially offset by higher equity participations income. Slightly lower net interest income reflected lower deposit margins on stable average deposit volumes and lower loan margins on slightly higher loan volumes. Recurring commissions and fees were stable with lower investment product management fees and lower banking services fees, reflecting lower account statement fees, offset by increases across other categories.
In 2Q14, the gross margin was 99 basis points, 13 basis points lower compared to 2Q13, mainly reflecting lower transaction- and performance-based revenues, a continued adverse interest rate environment and a 2.5% increase in average assets under management. Compared to 1Q14, the gross margin was down five basis points, driven by a 2.7% increase in average assets under management, a change in client mix, lower fee-based revenues and slightly lower net interest income.
Wealth Management Clients net margin was 28 basis points in 2Q14, three basis points lower compared to 2Q13, reflecting lower transaction- and performance-based revenues and lower net interest income, partially offset by lower operating expenses. Compared to 1Q14, the net margin was one basis point lower, driven by slightly lower income before taxes.

Earnings ReleaseJuly 22, 2014
Page 9
Corporate & Institutional Clients
in / end of % change in / end of % change
2Q14 1Q14 2Q13 QoQ YoY 6M14 6M13 YoY
Strategic results (CHF million)
Net interest income 266 257 276 4 (4) 523 549 (5)
Recurring commissions and fees 113 122 115 (7) (2) 235 226 4
Transaction- and performance-based revenues 118 117 127 1 (7) 235 248 (5)
Other revenues (22) (4) (6) 450 267 (26) (11) 136
Net revenues 475 492 512 (3) (7) 967 1,012 (4)
Provision for credit losses 13 1 (1) – – 14 3 367
Total operating expenses 251 245 251 2 0 496 508 (2)
Income before taxes 211 246 262 (14) (19) 457 501 (9)
Metrics (%)
Cost/income ratio 52.8 49.8 49.0 – – 51.3 50.2 –
The Corporate & Institutional Clients business reported pre-tax income of CHF 211 million in 2Q14 and net revenues of CHF 475 million. Net revenues decreased 7% compared to 2Q13, mainly driven by decreased other revenues, lower net interest income and lower transaction- and performance-based revenues. Lower other revenues reflected a fair value decrease on the Clock Finance transaction. The decrease in net interest income reflected the low interest rate environment, significantly lower deposit margins on higher average deposit volumes and lower levels of deposits eligible as stable funding, partially offset by slightly higher loan margins on higher average loan volumes. The decrease in transaction- and performance-based revenues reflected lower sales and trading revenues, lower brokerage and product issuing fees and slightly lower foreign exchange client business. Slightly lower recurring commissions and fees reflected lower investment product management fees and lower banking services fees, partially offset by higher discretionary mandate management fees.
Compared to 1Q14, net revenues decreased 3%, with lower other revenues and lower recurring commissions and fees, partially offset by higher net interest income. Lower other revenues reflected a fair value decrease on the Clock Finance transaction. The decrease in recurring commissions and fees primarily reflected lower banking services fees. The increase in net interest income reflected higher loan margins on slightly higher average loan volumes, partially offset by lower deposit margins on stable average deposit volumes. Stable transaction- and performance-based revenues reflected higher equity participations income, offset by slightly lower foreign exchange client business.
Asset Management
in / end of % change in / end of % change
2Q14 1Q14 2Q13 QoQ YoY 6M14 6M13 YoY
Strategic results (CHF million)
Recurring commissions and fees 295 287 290 3 2 582 563 3
Transaction- and performance-based revenues 146 164 195 (11) (25) 310 324 (4)
Other revenues (1) 14 (4) – (75) 13 15 (13)
Net revenues 440 465 481 (5) (9) 905 902 0
of which fee-based revenues 428 438 467 (2) (8) 866 854 1
Provision for credit losses 0 0 0 – – 0 0 –
Total operating expenses 338 324 349 4 (3) 662 707 (6)
Income before taxes 102 141 132 (28) (23) 243 195 25
Metrics (%)
Cost/income ratio 76.8 69.7 72.6 – – 73.1 78.4 –

Earnings ReleaseJuly 22, 2014
Page 10
The Asset Management business reported pre-tax income of CHF 102 million in 2Q14, with net revenues of CHF 440 million. Net revenues decreased 9% compared to 2Q13, with fee-based revenues decreasing 8%, reflecting lower carried interest on realized private equity gains and the absence of performance fees from Hedging-Griffo due to year-to-date returns performing below their respective high-water marks, partially offset by higher placement fees and slightly higher asset management fees due to higher average assets under management. Net revenues declined 5% compared to 1Q14, with slightly lower fee-based revenues reflecting lower carried interest on realized private equity gains and lower real estate transaction fees, partially offset by slightly higher asset management fees and higher placement fees.
The fee-based margin was 46 basis points in 2Q14, compared to 53 basis points in 2Q13 and 49 basis points in 1Q14. The movements reflected both the lower fee-based revenues and the higher average assets under management, which increased 5.8% and 3.5% compared to 2Q13 and 1Q14, respectively.
Non-strategic results
The non-strategic results for Private Banking & Wealth Management include positions relating to the restructuring of the former Asset Management division, run-off operations relating to the small markets exit initiative and certain legacy cross-border related run-off operations, litigation costs, primarily related to US cross-border matters, the impact of restructuring of the German onshore operations, other smaller non-strategic positions formerly in the Corporate & Institutional Clients business and the run-off and active reduction of selected products.
Private Banking & Wealth Management – non-strategic results
in / end of % change in / end of % change
2Q14 1Q14 2Q13 QoQ YoY 6M14 6M13 YoY
Non-strategic results (CHF million)
Net revenues 114 209 187 (45) (39) 323 457 (29)
Provision for credit losses (7) 16 27 – – 9 32 (72)
Total operating expenses 1,752 146 258 – – 1,898 398 377
Income/(loss) before taxes (1,631) 47 (98) – – (1,584) 27 –
Metrics (%)
Cost/income ratio – 69.9 138.0 – – – 87.1 –
In 2Q14, the non-strategic businesses reported a loss before taxes of CHF 1,631 million, reflecting the litigation settlement charge of CHF 1,618 million relating to the final settlement of all outstanding US cross-border matters. In 1Q14, Private Banking & Wealth Management’s non-strategic businesses reported income before taxes of CHF 47 million, including an equity participation gain of CHF 91 million from the sale in January 2014 of Customized Fund Investment Group, a private equity fund of funds and co-investment business.

Earnings ReleaseJuly 22, 2014
Page 11
Assets under management – Private Banking & Wealth Management
Assets under management of CHF 1,329.7 billion increased CHF 37.2 billion compared to the end of 1Q14, driven mainly by positive market movements, net new assets and favorable foreign exchange-related movements.
Net new assets: Private Banking & Wealth Management recorded net new assets of CHF 10.1 billion in 2Q14. In the strategic portfolio, Wealth Management Clients contributed net new assets of CHF 7.4 billion in 2Q14 with continued strong inflows from emerging markets, particularly in Asia Pacific, and Switzerland, partially offset by Western European cross-border outflows. Corporate & Institutional Clients in Switzerland reported net new assets of CHF 0.6 billion in 2Q14. Asset Management reported net new assets of CHF 4.1 billion in 2Q14, driven by inflows in traditional products, with substantial contributions from index strategies, and inflows from hedge funds and credit products. In the non-strategic portfolio, net asset outflows of CHF 1.7 billion reflected the exit of certain businesses.
Assets under management – Private Banking & Wealth Management
in / end of % change in / end of % change
2Q14 1Q14 2Q13 QoQ YoY 6M14 6M13 YoY
Assets under management by business (CHF billion)
Wealth Management Clients 829.7 804.9 782.3 3.1 6.1 829.7 782.3 6.1
Corporate & Institutional Clients 261.4 254.4 238.3 2.8 9.7 261.4 238.3 9.7
Asset Management 377.1 363.4 346.1 3.8 9.0 377.1 346.1 9.0
Non-strategic 25.9 25.9 83.8 0.0 (69.1) 25.9 83.8 (69.1)
Assets managed across businesses (164.4) (156.1) (153.9) 5.3 6.8 (164.4) (153.9) 6.8
Assets under management 1,329.7 1,292.5 1,296.6 2.9 2.6 1,329.7 1,296.6 2.6
Average assets under management (CHF billion)
Average assets under management 1,311.6 1,282.1 1,318.9 2.3 (0.6) 1,296.8 1,302.2 (0.4)
Net new assets by business (CHF billion)
Wealth Management Clients 7.4 10.6 7.7 (30.2) (3.9) 18.0 13.4 34.3
Corporate & Institutional Clients 0.6 0.4 (0.2) 50.0 – 1.0 4.3 (76.7)
Asset Management 4.1 6.9 2.6 (40.6) 57.7 11.0 11.1 (0.9)
Non-strategic (1.7) (2.3) (1.4) (26.1) 21.4 (4.0) (3.7) 8.1
Assets managed across businesses (0.3) (1.9) (1.1) (84.2) (72.7) (2.2) (5.5) (60.0)
Net new assets 10.1 13.7 7.6 (26.3) 32.9 23.8 19.6 21.4
Net new asset growth rate (annualized) (%)
Net new asset growth rate – Wealth Management Clients 3.7 5.4 3.9 – – 4.6 3.5 –
Net new asset growth rate – Asset Management 4.5 7.8 3.0 – – 6.3 6.8 –

Earnings ReleaseJuly 22, 2014
Page 12
Investment Banking
In 2Q14, Investment Banking reported income before taxes of CHF 752 million and net revenues of CHF 3,342 million. Investment Banking delivered solid results, driven by the strength of the diversified strategic franchise and an accelerated wind-down of risk-weighted assets and leverage exposure in the non-strategic unit. In strategic businesses, net revenues declined 6% compared to 2Q13, primarily driven by less favorable trading conditions in equity sales and trading businesses and continued weakness in global macro products, particularly in foreign exchange and commodities. Compared to 1Q14, net revenues declined 5% in strategic businesses as less favorable trading conditions in certain fixed income businesses and equity sales and trading offset strong results in underwriting and advisory. In 2Q14, Investment Banking accelerated the wind-down of the non-strategic unit, reducing Swiss leverage exposure by USD 3 billion, or 4%, and Basel III risk-weighted assets by USD 6 billion, or 32%, compared to 1Q14.
With respect to the global macro products business, Credit Suisse decided to exit its small commodities trading business and the results during the wind-down period will be reflected in the non-strategic unit beginning in 3Q14. Credit Suisse will also re-focus its foreign exchange business towards a combination of electronic trading and voice offering for larger and more complex trades and will further simplify its rates product offering to focus primarily on satisfying client liquidity needs in cash products and derivatives.
Investment Banking
in / end of % change in / end of % change
2Q14 1Q14 2Q13 QoQ YoY 6M14 6M13 YoY
Reported results (CHF million)
Net revenues 3,342 3,416 3,400 (2) (2) 6,758 7,345 (8)
Provision for credit losses (5) 0 4 – – (5) (2) 150
Compensation and benefits 1,499 1,521 1,466 (1) 2 3,020 2,951 2
Total other operating expenses 1,096 1,068 1,176 3 (7) 2,164 2,342 (8)
Total operating expenses 2,595 2,589 2,642 0 (2) 5,184 5,293 (2)
Income before taxes 752 827 754 (9) 0 1,579 2,054 (23)
Metrics (%)
Return on capital 12.3 13.6 11.0 – – 13.0 15.8 –
Cost/income ratio 77.6 75.8 77.7 – – 76.7 72.1 –
Strategic results
In 2Q14, the strategic businesses reported income before taxes of CHF 1,034 million and net revenues of CHF 3,395 million. Compared to 2Q13, results were impacted by the weakening of the average rate of the US dollar against the Swiss franc, which negatively impacted revenues and favorably impacted expenses. Fixed income sales and trading revenues were higher compared to 2Q13, reflecting continued investor demand for yield products, but were partially offset by challenging trading conditions in global macro products. Revenues decreased compared to 1Q14, as lower global credit products and securitized products results, following a seasonally stronger 1Q14 for these businesses, more than offset a rebound in emerging markets revenues. Equities sales and trading results declined from strong 2Q13 levels, driven by less favorable trading conditions, specifically a low volatility and low volume environment, resulting in reduced client activity. Revenues were lower than 1Q14, primarily driven by weak client activity in our equity derivatives business. Underwriting and advisory results were higher compared to 2Q13 and 1Q14, reflecting significantly higher equity underwriting revenues, as origination remained robust.

Earnings ReleaseJuly 22, 2014
Page 13
Fixed income sales and trading Fixed income results reflected continued investor demand for yield products, specifically credit and securitized products in a low rate environment. 2Q13 performance was adversely impacted by a significant decline in trading activity due to rising rates and widening credit spreads from the US Federal Reserve’s announcement to reduce its bond buying program. Emerging markets revenues improved substan-tially, primarily driven by strong financing activity. Results also reflected higher revenues from corporate lending. Securitized products revenues increased, driven by higher revenues in agency securities and mortgage servicing and consistent performance in asset finance. Global credit products had a solid performance, as strong origination activity led to higher secondary trading in investment grade and leveraged finance franchises. Global macro products had significantly lower revenues, as a low volatility environment resulted in subdued client activity, partic-ularly in foreign exchange and commodities businesses. Rates revenues were lower, driven by declines in Japan and the US. Revenues decreased compared to 1Q14, as lower global credit products and securitized products results, following a seasonally stronger 1Q14 for these businesses, more than offset a rebound in emerging markets revenues.
Equities sales and trading Equity sales and trading revenues declined, driven by less favorable trading conditions specifically a low volatility and low volume environment, resulting in reduced client activity. Equity sales and trading revenues decreased compared to 2Q13, due to substantially lower revenues from systematic market making, reflecting significantly less favorable trading conditions compared to 2Q13 which included the positive impact of quantitative easing in Japan. Derivatives revenues were lower, as a significant decline in volatility resulted in weaker client activity, particularly in the US flow businesses, and 2Q13 results benefitted from strong performance in Asia and the US. Cash equities revenues declined significantly as reduced commission revenues, reflecting lower global market volumes, more than offset market share gains in the US. Prime services results were solid, reflecting continued market leadership, increased activity in Europe and growth in client clearing services. Compared to 1Q14, revenues declined primarily driven by weak client activity in our equity derivatives business.
Underwriting and advisory results were higher compared to 2Q13 and 1Q14, reflecting significantly higher equity underwriting revenues, as origination remained robust.
Investment Banking – strategic results
in / end of % change in / end of % change
2Q14 1Q14 2Q13 QoQ YoY 6M14 6M13 YoY
Strategic results (CHF million)
Debt underwriting 483 468 534 3 (10) 951 995 (4)
Equity underwriting 268 183 206 46 30 451 363 24
Total underwriting 751 651 740 15 1 1,402 1,358 3
Advisory and other fees 161 180 167 (11) (4) 341 312 9
Total underwriting and advisory 912 831 907 10 1 1,743 1,670 4
Fixed income sales and trading 1,485 1,609 1,434 (8) 4 3,094 3,462 (11)
Equity sales and trading 1,119 1,207 1,368 (7) (18) 2,326 2,684 (13)
Total sales and trading 2,604 2,816 2,802 (8) (7) 5,420 6,146 (12)
Other (121) (84) (105) 44 15 (205) (195) 5
Net revenues 3,395 3,563 3,604 (5) (6) 6,958 7,621 (9)
Provision for credit losses (5) 0 3 – – (5) (4) 25
Total operating expenses 2,366 2,439 2,434 (3) (3) 4,805 4,911 (2)
Income before taxes 1,034 1,124 1,167 (8) (11) 2,158 2,714 (20)
Metrics (%)
Return on capital 18.5 20.5 19.1 – – 19.5 23.3 –
Cost/income ratio 69.7 68.5 67.5 – – 69.1 64.4 –
Earnings ReleaseJuly 22, 2014
Page 14
Total operating expenses of CHF 2,366 million decreased 3% in Swiss francs compared 2Q13. In US dollars operating expenses increased 4%, driven by higher deferred compensation expense, as new award accruals more than offset roll-offs from prior year awards. Investment Banking strategic businesses also had higher discretionary compensation expense reflecting a change in the variable compensation accrual methodology. The increases were partially offset by lower general and administrative expenses, driven by lower technology costs and lower UK bank levy expenses. Compared to 1Q14, total operating expenses decreased 3% in Swiss francs, reflecting lower deferred compensation expense from prior-year awards and lower discretionary compensation expense. Additionally, we had lower general and administrative expenses reflecting lower technology costs and lower UK bank levy expenses.
Capital metrics As of the end of 2Q14, Investment Banking strategic businesses reported Basel III risk-weighted assets of USD 168 billion, up USD 2 billion from 1Q14. Swiss leverage exposure in strategic businesses of USD 781 billion, reflected an increase of USD 5 billion from 1Q14.
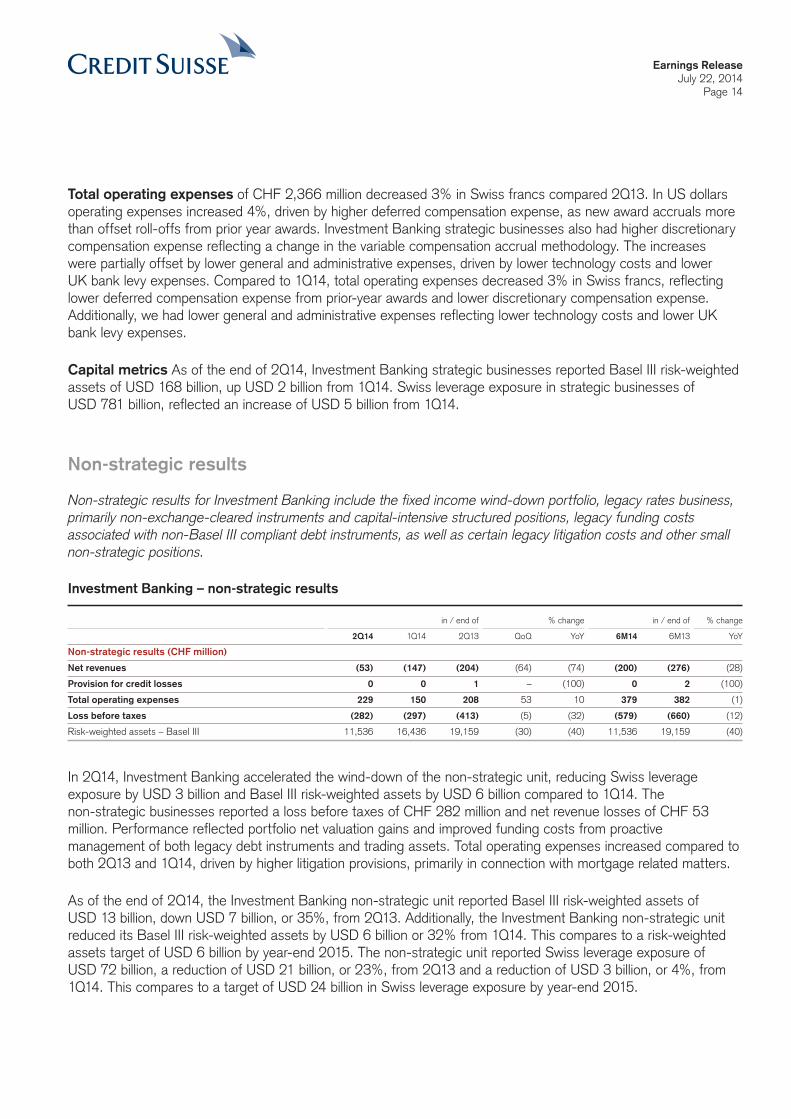
Non-strategic results
Non-strategic results for Investment Banking include the fixed income wind-down portfolio, legacy rates business, primarily non-exchange-cleared instruments and capital-intensive structured positions, legacy funding costs associated with non-Basel III compliant debt instruments, as well as certain legacy litigation costs and other small non-strategic positions.
Investment Banking – non-strategic results
in / end of % change in / end of % change
2Q14 1Q14 2Q13 QoQ YoY 6M14 6M13 YoY
Non-strategic results (CHF million)
Net revenues (53) (147) (204) (64) (74) (200) (276) (28)
Provision for credit losses 0 0 1 – (100) 0 2 (100)
Total operating expenses 229 150 208 53 10 379 382 (1)
Loss before taxes (282) (297) (413) (5) (32) (579) (660) (12)
Risk-weighted assets – Basel III 11,536 16,436 19,159 (30) (40) 11,536 19,159 (40)
In 2Q14, Investment Banking accelerated the wind-down of the non-strategic unit, reducing Swiss leverage exposure by USD 3 billion and Basel III risk-weighted assets by USD 6 billion compared to 1Q14. The non-strategic businesses reported a loss before taxes of CHF 282 million and net revenue losses of CHF 53 million. Performance reflected portfolio net valuation gains and improved funding costs from proactive management of both legacy debt instruments and trading assets. Total operating expenses increased compared to both 2Q13 and 1Q14, driven by higher litigation provisions, primarily in connection with mortgage related matters.
As of the end of 2Q14, the Investment Banking non-strategic unit reported Basel III risk-weighted assets of USD 13 billion, down USD 7 billion, or 35%, from 2Q13. Additionally, the Investment Banking non-strategic unit reduced its Basel III risk-weighted assets by USD 6 billion or 32% from 1Q14. This compares to a risk-weighted assets target of USD 6 billion by year-end 2015. The non-strategic unit reported Swiss leverage exposure of USD 72 billion, a reduction of USD 21 billion, or 23%, from 2Q13 and a reduction of USD 3 billion, or 4%, from 1Q14. This compares to a target of USD 24 billion in Swiss leverage exposure by year-end 2015.

Earnings ReleaseJuly 22, 2014
Page 15
Corporate Center
Corporate Center includes parent company operations such as Group financing, expenses for projects sponsored by the Group and certain expenses and revenues that have not been allocated to the segments. It also includes consolidation and elimination adjustments required to eliminate intercompany revenues and expenses.
Corporate Center
in / end of % change in / end of % change
2Q14 1Q14 2Q13 QoQ YoY 6M14 6M13 YoY
Reported results (CHF million)
Net revenues 45 (187) 11 – 309 (142) (194) (27)
Provision for credit losses 0 1 1 (100) (100) 1 1 0
Compensation and benefits 235 166 95 42 147 401 221 81
Total other operating expenses 183 85 46 115 298 268 91 195
Total operating expenses 418 251 141 67 196 669 312 114
Loss before taxes (373) (439) (131) (15) 185 (812) (507) 60
Non-strategic results (CHF million)
Net revenues 48 (146) 52 – (8) (98) (146) (33)
Provision for credit losses 0 0 0 – – 0 0 –
Total operating expenses 272 144 88 89 209 416 170 145
Loss before taxes (224) (290) (36) (23) – (514) (316) 63
The Corporate Center recorded a loss before taxes of CHF 373 million in 2Q14, including business realignment costs of CHF 136 million and IT architecture simplification expenses of CHF 81 million. 2Q14 results also included fair value losses on own debt of CHF 29 million, fair value gains on stand-alone derivatives of CHF 15 million and debit valuation adjustment gains on certain structured notes liabilities of CHF 4 million, resulting in overall fair value losses on own credit spreads of CHF 10 million in 2Q14. This compares to a loss before taxes of CHF 131 million in 2Q13 and a loss before taxes of CHF 439 million in 1Q14.
Balance sheet, shareholders’ equity and regulatory capital
Balance sheetAs of the end of 2Q14, total assets of CHF 891.6 billion increased 2% compared to 1Q14, reflecting an increase in operating activities and the foreign exchange translation impact. Excluding the foreign exchange translation impact, total assets increased CHF 10.3 billion.
Total shareholders’ equityCredit Suisse’s total shareholders’ equity decreased to CHF 40.9 billion as of the end of 2Q14 compared to CHF 43.2 billion as of the end of 1Q14. Total shareholders’ equity was negatively impacted by dividend payments, transactions relating to the settlement of share-based compensation awards and the net loss. These movements were partially offset by the increases to the share-based compensation obligation and the impact of foreign exchange-related movements on cumulative translation adjustments. As of the end of 2Q14, Credit Suisse had 1,607.2 million shares issued.
Earnings ReleaseJuly 22, 2014
Page 16
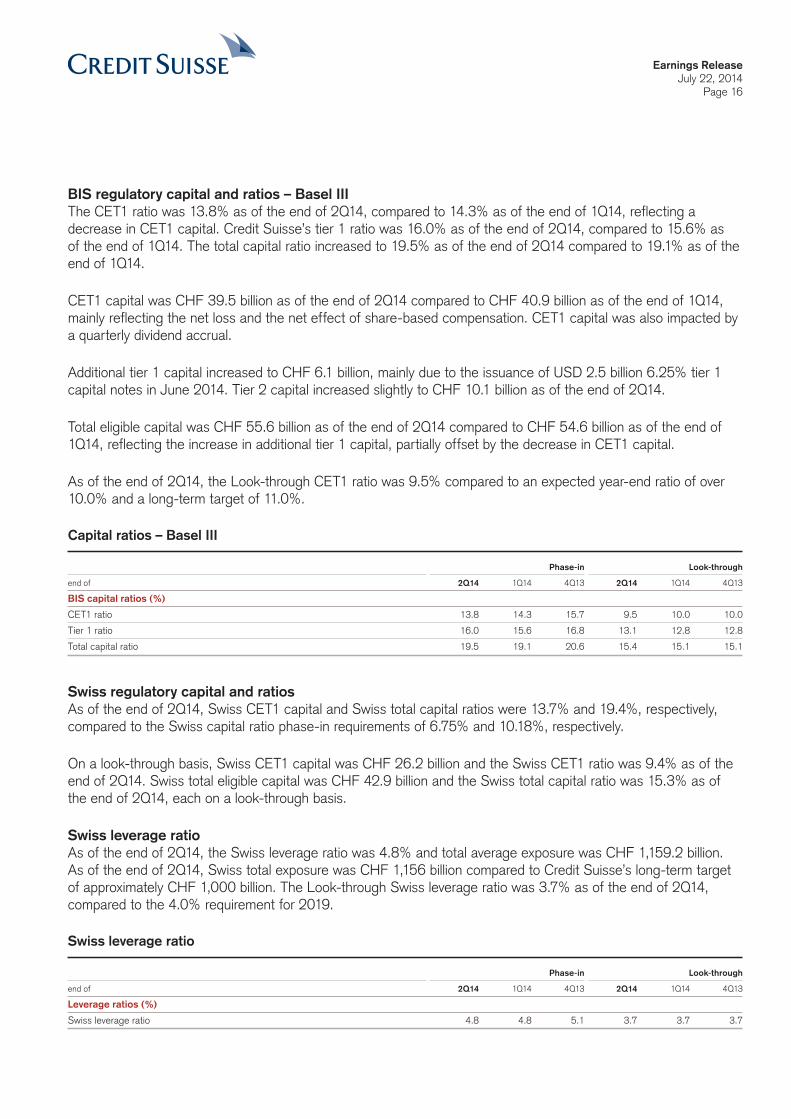
BIS regulatory capital and ratios – Basel IIIThe CET1 ratio was 13.8% as of the end of 2Q14, compared to 14.3% as of the end of 1Q14, reflecting a decrease in CET1 capital. Credit Suisse’s tier 1 ratio was 16.0% as of the end of 2Q14, compared to 15.6% as of the end of 1Q14. The total capital ratio increased to 19.5% as of the end of 2Q14 compared to 19.1% as of the end of 1Q14.
CET1 capital was CHF 39.5 billion as of the end of 2Q14 compared to CHF 40.9 billion as of the end of 1Q14, mainly reflecting the net loss and the net effect of share-based compensation. CET1 capital was also impacted by a quarterly dividend accrual.
Additional tier 1 capital increased to CHF 6.1 billion, mainly due to the issuance of USD 2.5 billion 6.25% tier 1 capital notes in June 2014. Tier 2 capital increased slightly to CHF 10.1 billion as of the end of 2Q14.
Total eligible capital was CHF 55.6 billion as of the end of 2Q14 compared to CHF 54.6 billion as of the end of 1Q14, reflecting the increase in additional tier 1 capital, partially offset by the decrease in CET1 capital.
As of the end of 2Q14, the Look-through CET1 ratio was 9.5% compared to an expected year-end ratio of over 10.0% and a long-term target of 11.0%.
Capital ratios – Basel III
Phase-in Look-through
end of 2Q14 1Q14 4Q13 2Q14 1Q14 4Q13
BIS capital ratios (%)
CET1 ratio 13.8 14.3 15.7 9.5 10.0 10.0
Tier 1 ratio 16.0 15.6 16.8 13.1 12.8 12.8
Total capital ratio 19.5 19.1 20.6 15.4 15.1 15.1
Swiss regulatory capital and ratiosAs of the end of 2Q14, Swiss CET1 capital and Swiss total capital ratios were 13.7% and 19.4%, respectively, compared to the Swiss capital ratio phase-in requirements of 6.75% and 10.18%, respectively.
On a look-through basis, Swiss CET1 capital was CHF 26.2 billion and the Swiss CET1 ratio was 9.4% as of the end of 2Q14. Swiss total eligible capital was CHF 42.9 billion and the Swiss total capital ratio was 15.3% as of the end of 2Q14, each on a look-through basis.
Swiss leverage ratioAs of the end of 2Q14, the Swiss leverage ratio was 4.8% and total average exposure was CHF 1,159.2 billion. As of the end of 2Q14, Swiss total exposure was CHF 1,156 billion compared to Credit Suisse’s long-term target of approximately CHF 1,000 billion. The Look-through Swiss leverage ratio was 3.7% as of the end of 2Q14, compared to the 4.0% requirement for 2019.
Swiss leverage ratio
Phase-in Look-through
end of 2Q14 1Q14 4Q13 2Q14 1Q14 4Q13
Leverage ratios (%)
Swiss leverage ratio 4.8 4.8 5.1 3.7 3.7 3.7

Earnings ReleaseJuly 22, 2014
Page 17
Quarterly results documentation
The Results Presentation Slides and the Results Summary are available for download from 06:30 CEST today at: https://www.credit-suisse.com/results
The 2Q14 Financial Report will be available for download on or about July 31, 2014 at:https://www.credit-suisse.com/results
Hard copies of the 2Q14 Financial Report may be ordered free of charge at: https://publications.credit-suisse.com/index.cfm/publikationen-shop/quarterly-reports/
Presentation of 2Q14 – Tuesday, July 22, 2014
Event Analyst and investor presentation Media conference
Time 08:30 Zurich 11:00 Zurich
07:30 London 10:00 London
02:30 New York 05:00 New York
Credit Suisse Forum St. Peter, St. Peterstrasse 19, Zurich
Speakers Brady W. Dougan, Chief Executive Officer Brady W. Dougan, Chief Executive Officer David Mathers, Chief Financial Officer David Mathers, Chief Financial Officer
Language The presentation will be held in English. The presentation will be held in English. Simultaneous interpreting (English/German)
Access via Audio webcast: www.credit-suisse.com/results Live webcast: www.credit-suisse.com/results
Internet Audio playback available Video playback available
Access via +41 44 580 40 01 (Switzerland) +41 44 580 40 01 (Switzerland)
Telephone +44 1452 565 510 (Europe) +44 1452 565 510 (Europe) +1 866 389 9771 (US) +1 866 389 9771 (US) Reference: Credit Suisse Group quarterly results Reference: Credit Suisse Group quarterly results
Please dial in 10-15 minutes before the start Please dial in 10-15 minutes before the start of the presentation. of the presentation.
Q&A Session Opportunity to ask questions via the Opportunity to ask questions via the telephone conference. telephone conference.
Playback Replay available approximately two hours Replay available approximately two hours after the event: after the event: +41 44 580 34 56 (Switzerland) +41 44 580 34 56 (Switzerland) +44 1452 550 000 (Europe) +44 1452 550 000 (Europe) +1 866 247 4222 (US) +1 866 247 4222 (US) Conference ID: 71293897# Conference ID English: 71362658#
Conference ID German: 71371762#
Contacts
Media Relations Credit Suisse, telephone +41 844 33 88 44, [email protected] Relations Credit Suisse, telephone +41 44 333 71 49, [email protected]
Earnings ReleaseJuly 22, 2014
Page 18
Important informationThe Group has not finalized its 2Q14 Financial Report and the Group’s independent registered public accounting firm has not completed its review of the condensed consolidated financial statements (unaudited) for the period. Accordingly, the financial information contained in this Earnings Release is subject to completion of quarter-end procedures, which may result in changes to that information. Certain reclassifications have been made to prior periods to conform to the current presentation.
For purposes of this Earnings Release, unless the context otherwise requires, the terms “Credit Suisse” and “the Group” mean Credit Suisse Group AG and its consolidated subsidiaries. The business of Credit Suisse AG, the Swiss bank subsidiary of the Group, is substantially similar to the Group, and these terms are used to refer to both when the subject is the same or substantially similar. The term “the Bank” is used when referring to Credit Suisse AG, the Swiss bank subsidiary of the Group, and its consolidated subsidiaries.
Information referenced in this Earnings Release, whether via website links or otherwise, is not incorporated into this Earnings Release.
As of January 1, 2013, Basel III was implemented in Switzerland along with the Swiss “Too Big to Fail” legislation and regulations thereunder. The related disclosures are in accordance with Credit Suisse’s current interpretation of such requirements, including relevant assumptions. Changes in the interpretation of these requirements in Switzerland or in any of Credit Suisse’s assumptions or estimates could result in different numbers from those shown herein.
References to phase-in and look-through included herein refer to Basel III requirements. Phase-in reflects that for the years 2014 – 2018, there will be a five-year (20% per annum) phase in of goodwill and other intangible assets and other capital deductions (e.g., certain deferred tax assets and partici-pations in financial institutions) and for the years 2013 – 2022, there will be a phase out of certain capital instruments. Look-through assumes the full phase-in of goodwill and other intangible assets and other regulatory adjustments and the full phase out of certain capital instruments.
Unless otherwise noted, leverage ratio, leverage exposure and total capital amounts included herein are based on the current FINMA framework. The Swiss leverage ratio is calculated as Swiss total eligible capital, divided by a three-month average leverage exposure, which consists of balance sheet assets, off-balance sheet exposures, which consist of guarantees and commitments, and regulatory adjustments, which include cash collateral netting reversals and derivative add-ons.
Following a revision to the Swiss Liquidity Ordinance in June 2014 implementing Basel III Liquidity Coverage Ratio (LCR) rules, beginning in 2Q14, the majority of a portfolio of high-quality liquid assets previously recorded in the Corporate Center and managed by our Treasury function have been allo-cated to the business divisions. This allows for a more efficient management of their business activities from an overall Group perspective with respect to LCR and Swiss leverage requirements arising from the portfolio of assets. Prior periods have been restated for the related impact on assets and Swiss leverage exposures.
Return on equity for strategic results is calculated by dividing annualized strategic net income by average strategic shareholders’ equity (derived by deducting 10% of non-strategic risk-weighted assets from reported shareholders’ equity). Return on capital is calculated using income after tax and capital allocated based on the average of 10% of average risk-weighted assets and 2.4% of average leverage exposure.
Adjusted cost run-rates are non-GAAP financial measures. All expense reduction metrics against 6M11 annualized total expenses are measured at con-stant foreign exchange rates and exclude realignment and other significant expense items and variable compensation expenses. For further information regarding these measures, see the 2Q14 Results Presentation Slides.
The Group’s estimate of the aggregate range of reasonably possible losses that are not covered by existing provisions which is discussed above relates only to those proceedings for which the Group believes an estimate is possible and which are discussed in Note 38 to the Consolidated Financial State-ments in the Group’s Annual Report on Form 20-F and updated in its quarterly reports (including the 2Q14 Financial Report that is scheduled to be released on July 31). It is inherently difficult to determine whether a loss is probable or even reasonably possible or to estimate the amount of any loss or loss range for many of the Group’s legal proceedings. The Group’s aggregate litigation provisions include estimates of losses, additional losses or ranges of loss for proceedings for which such losses are probable and can be reasonably estimated. The Group does not believe that it can estimate an aggregate range of reasonably possible losses for certain of its proceedings because of their complexity, the novelty of some of the claims, the early stage of the proceedings, the limited amount of discovery that has occurred and/or other factors. For additional details, see Note 38 to the Consolidated Financial Statements in the Group’s Annual Report on Form 20-F and the litigation note in each of its quarterly Financial Reports.
Investors and others should note that we announce material information (including quarterly earnings releases and financial reports) to the investing public using press releases, SEC and Swiss ad hoc filings, our investor relations website and public conference calls and webcasts. We intend to also use our investor relations Twitter account @creditsuisse (https://twitter.com/creditsuisse) to excerpt key messages from our public disclosures, includ-ing earnings releases. We may retweet such messages through certain of our regional Twitter accounts, including @csschweiz (https://twitter.com/csschweiz) and @csapac (https://twitter.com/csapac). Investors and others should take care to consider such abbreviated messages in the context of the disclosures from which they are excerpted. The information we post on these Twitter accounts is not a part of this Earnings Release.
In various tables, use of “–” indicates not meaningful or not applicable.
Earnings ReleaseJuly 22, 2014
Page A-1
Appendix
Key metrics
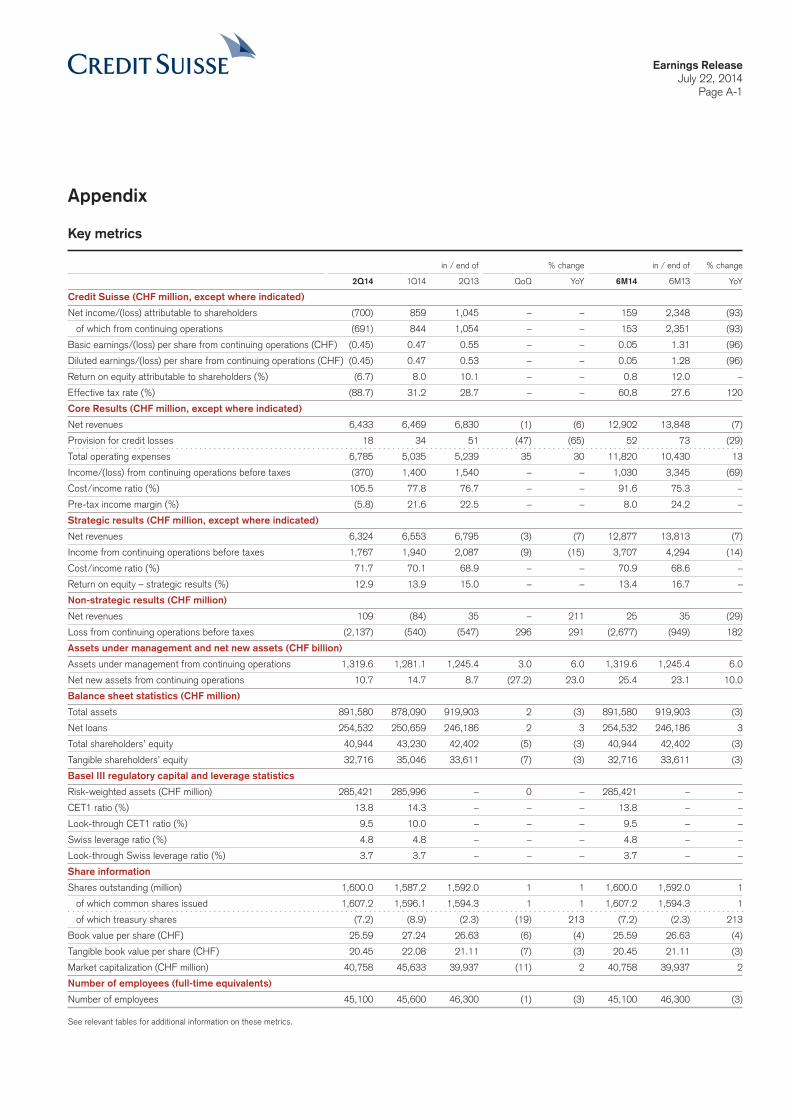
in / end of % change in / end of % change
2Q14 1Q14 2Q13 QoQ YoY 6M14 6M13 YoY
Credit Suisse (CHF million, except where indicated)
Net income/(loss) attributable to shareholders (700) 859 1,045 – – 159 2,348 (93)
of which from continuing operations (691) 844 1,054 – – 153 2,351 (93)
Basic earnings/(loss) per share from continuing operations (CHF) (0.45) 0.47 0.55 – – 0.05 1.31 (96)
Diluted earnings/(loss) per share from continuing operations (CHF) (0.45) 0.47 0.53 – – 0.05 1.28 (96)
Return on equity attributable to shareholders (%) (6.7) 8.0 10.1 – – 0.8 12.0 –
Effective tax rate (%) (88.7) 31.2 28.7 – – 60.8 27.6 120
Core Results (CHF million, except where indicated)
Net revenues 6,433 6,469 6,830 (1) (6) 12,902 13,848 (7)
Provision for credit losses 18 34 51 (47) (65) 52 73 (29)
Total operating expenses 6,785 5,035 5,239 35 30 11,820 10,430 13
Income/(loss) from continuing operations before taxes (370) 1,400 1,540 – – 1,030 3,345 (69)
Cost/income ratio (%) 105.5 77.8 76.7 – – 91.6 75.3 –
Pre-tax income margin (%) (5.8) 21.6 22.5 – – 8.0 24.2 –
Strategic results (CHF million, except where indicated)
Net revenues 6,324 6,553 6,795 (3) (7) 12,877 13,813 (7)
Income from continuing operations before taxes 1,767 1,940 2,087 (9) (15) 3,707 4,294 (14)
Cost/income ratio (%) 71.7 70.1 68.9 – – 70.9 68.6 –
Return on equity – strategic results (%) 12.9 13.9 15.0 – – 13.4 16.7 –
Non-strategic results (CHF million)
Net revenues 109 (84) 35 – 211 25 35 (29)
Loss from continuing operations before taxes (2,137) (540) (547) 296 291 (2,677) (949) 182
Assets under management and net new assets (CHF billion)
Assets under management from continuing operations 1,319.6 1,281.1 1,245.4 3.0 6.0 1,319.6 1,245.4 6.0
Net new assets from continuing operations 10.7 14.7 8.7 (27.2) 23.0 25.4 23.1 10.0
Balance sheet statistics (CHF million)
Total assets 891,580 878,090 919,903 2 (3) 891,580 919,903 (3)
Net loans 254,532 250,659 246,186 2 3 254,532 246,186 3
Total shareholders’ equity 40,944 43,230 42,402 (5) (3) 40,944 42,402 (3)
Tangible shareholders’ equity 32,716 35,046 33,611 (7) (3) 32,716 33,611 (3)
Basel III regulatory capital and leverage statistics
Risk-weighted assets (CHF million) 285,421 285,996 – 0 – 285,421 – –
CET1 ratio (%) 13.8 14.3 – – – 13.8 – –
Look-through CET1 ratio (%) 9.5 10.0 – – – 9.5 – –
Swiss leverage ratio (%) 4.8 4.8 – – – 4.8 – –
Look-through Swiss leverage ratio (%) 3.7 3.7 – – – 3.7 – –
Share information
Shares outstanding (million) 1,600.0 1,587.2 1,592.0 1 1 1,600.0 1,592.0 1
of which common shares issued 1,607.2 1,596.1 1,594.3 1 1 1,607.2 1,594.3 1
of which treasury shares (7.2) (8.9) (2.3) (19) 213 (7.2) (2.3) 213
Book value per share (CHF) 25.59 27.24 26.63 (6) (4) 25.59 26.63 (4)
Tangible book value per share (CHF) 20.45 22.08 21.11 (7) (3) 20.45 21.11 (3)
Market capitalization (CHF million) 40,758 45,633 39,937 (11) 2 40,758 39,937 2
Number of employees (full-time equivalents)
Number of employees 45,100 45,600 46,300 (1) (3) 45,100 46,300 (3)
See relevant tables for additional information on these metrics.

Earnings ReleaseJuly 22, 2014
Page A-2
Credit Suisse
in / end of % change in / end of % change
2Q14 1Q14 2Q13 QoQ YoY 6M14 6M13 YoY
Statements of operations (CHF million)
Net revenues 6,463 6,829 6,952 (5) (7) 13,292 14,041 (5)
Provision for credit losses 18 34 51 (47) (65) 52 73 (29)
Compensation and benefits 2,973 2,993 2,926 (1) 2 5,966 5,917 1
General and administrative expenses 3,441 1,690 1,873 104 84 5,131 3,605 42
Commission expenses 377 369 457 2 (18) 746 927 (20)
Total other operating expenses 3,818 2,059 2,330 85 64 5,877 4,532 30
Total operating expenses 6,791 5,052 5,256 34 29 11,843 10,449 13
Income/(loss) from continuing operations before taxes (346) 1,743 1,645 – – 1,397 3,519 (60)
Income tax expense 307 543 472 (43) (35) 850 971 (12)
Income/(loss) from continuing operations (653) 1,200 1,173 – – 547 2,548 (79)
Income/(loss) from discontinued operations (9) 15 (9) – 0 6 (3) –
Net income/(loss) (662) 1,215 1,164 – – 553 2,545 (78)
Net income attributable to noncontrolling interests 38 356 119 (89) (68) 394 197 100
Net income/(loss) attributable to shareholders (700) 859 1,045 – – 159 2,348 (93)
of which from continuing operations (691) 844 1,054 – – 153 2,351 (93)
of which from discontinued operations (9) 15 (9) – 0 6 (3) –
Earnings per share (CHF)
Basic earnings/(loss) per share from continuing operations (0.45) 0.47 0.55 – – 0.05 1.31 (96)
Basic earnings/(loss) per share (0.46) 0.48 0.54 – – 0.05 1.31 (96)
Diluted earnings/(loss) per share from continuing operations (0.45) 0.47 0.53 – – 0.05 1.28 (96)
Diluted earnings/(loss) per share (0.46) 0.48 0.52 – – 0.05 1.28 (96)
Return on equity (%, annualized)
Return on equity attributable to shareholders (6.7) 8.0 10.1 – – 0.8 12.0 –
Return on tangible equity attributable to shareholders 1 (8.3) 10.0 12.8 – – 0.9 15.5 –
Number of employees (full-time equivalents)
Number of employees 45,100 45,600 46,300 (1) (3) 45,100 46,300 (3)
1 Based on tangible shareholders’ equity attributable to shareholders, a non-GAAP financial measure, which is calculated by deducting goodwill and other intangible assets from total shareholders’ equity attributable to shareholders. Management believes that the return on tangible shareholders’ equity attributable to shareholders is meaningful as it allows consistent measurement of the performance of businesses without regard to whether the businesses were acquired.

Earnings ReleaseJuly 22, 2014
Page A-3
Private Banking & Wealth Management
Investment Banking
Non- controlling interest without significant economic interest
Corporate Center
Credit Suisse
Core Results
Strategic results
Non- strategic results
Credit Suisse reporting structure
Wealth Management Clients
Corporate & Institutional Clients
Asset Management
Non-strategic unit Private Banking & Wealth Management
Non-strategic unit Investment Banking
Non-strategic items
Credit Suisse and Core Results
Core Results Noncontrolling interests without SEI Credit Suisse
in 2Q14 1Q14 2Q13 2Q14 1Q14 2Q13 2Q14 1Q14 2Q13
Statements of operations (CHF million)
Net revenues 6,433 6,469 6,830 30 360 122 6,463 6,829 6,952
Provision for credit losses 18 34 51 0 0 0 18 34 51
Compensation and benefits 2,969 2,977 2,914 4 16 12 2,973 2,993 2,926
General and administrative expenses 3,439 1,689 1,868 2 1 5 3,441 1,690 1,873
Commission expenses 377 369 457 0 0 0 377 369 457
Total other operating expenses 3,816 2,058 2,325 2 1 5 3,818 2,059 2,330
Total operating expenses 6,785 5,035 5,239 6 17 17 6,791 5,052 5,256
Income/(loss) from continuing operations
before taxes (370) 1,400 1,540 24 343 105 (346) 1,743 1,645
Income tax expense 307 543 472 0 0 0 307 543 472
Income/(loss) from continuing operations (677) 857 1,068 24 343 105 (653) 1,200 1,173
Income/(loss) from discontinued operations (9) 15 (9) 0 0 0 (9) 15 (9)
Net income/(loss) (686) 872 1,059 24 343 105 (662) 1,215 1,164
Net income attributable to noncontrolling interests 14 13 14 24 343 105 38 356 119
Net income/(loss) attributable to shareholders (700) 859 1,045 – – – (700) 859 1,045
of which from continuing operations (691) 844 1,054 – – – (691) 844 1,054
of which from discontinued operations (9) 15 (9) – – – (9) 15 (9)
Statement of operations metrics (%)
Cost/income ratio 105.5 77.8 76.7 – – – 105.1 74.0 75.6
Pre-tax income margin (5.8) 21.6 22.5 – – – (5.4) 25.5 23.7
Effective tax rate (83.0) 38.8 30.6 – – – (88.7) 31.2 28.7
Net income margin 1 (10.9) 13.3 15.3 – – – (10.8) 12.6 15.0
1 Based on amounts attributable to shareholders.
Credit Suisse results include revenues and expenses from the consolidation of certain private equity funds and other entities in which we have noncontrolling interests without significant economic interest (SEI) in such revenues and expenses. Core Results include the results of our two segments and the Corporate Center and discontinued operations, but do not include noncontrolling interests without SEI.

Earnings ReleaseJuly 22, 2014
Page A-4
Core Results
in / end of % change in / end of % change
2Q14 1Q14 2Q13 QoQ YoY 6M14 6M13 YoY
Statements of operations (CHF million)
Net interest income 2,590 2,183 2,638 19 (2) 4,773 4,439 8
Commissions and fees 3,311 3,276 3,544 1 (7) 6,587 6,798 (3)
Trading revenues 186 630 383 (70) (51) 816 2,190 (63)
Other revenues 346 380 265 (9) 31 726 421 72
Net revenues 6,433 6,469 6,830 (1) (6) 12,902 13,848 (7)
of which strategic results 6,324 6,553 6,795 (3) (7) 12,877 13,813 (7)
of which non-strategic results 109 (84) 35 – 211 25 35 (29)
Provision for credit losses 18 34 51 (47) (65) 52 73 (29)
Compensation and benefits 2,969 2,977 2,914 0 2 5,946 5,904 1
General and administrative expenses 3,439 1,689 1,868 104 84 5,128 3,599 42
Commission expenses 377 369 457 2 (18) 746 927 (20)
Total other operating expenses 3,816 2,058 2,325 85 64 5,874 4,526 30
Total operating expenses 6,785 5,035 5,239 35 30 11,820 10,430 13
of which strategic results 4,532 4,595 4,685 (1) (3) 9,127 9,480 (4)
of which non-strategic results 2,253 440 554 412 307 2,693 950 183
Income/(loss) from continuing operations before taxes (370) 1,400 1,540 – – 1,030 3,345 (69)
of which strategic results 1,767 1,940 2,087 (9) (15) 3,707 4,294 (14)
of which non-strategic results (2,137) (540) (547) 296 291 (2,677) (949) 182
Income tax expense 307 543 472 (43) (35) 850 971 (12)
Income/(loss) from continuing operations (677) 857 1,068 – – 180 2,374 (92)
Income/(loss) from discontinued operations (9) 15 (9) – 0 6 (3) –
Net income/(loss) (686) 872 1,059 – – 186 2,371 (92)
Net income attributable to noncontrolling interests 14 13 14 8 0 27 23 17
Net income/(loss) attributable to shareholders (700) 859 1,045 – – 159 2,348 (93)
of which strategic results 1,282 1,398 1,455 (8) (12) 2,680 3,034 (12)
of which non-strategic results (1,982) (539) (410) 268 383 (2,521) (686) 267
Statement of operations metrics (%)
Return on capital 1 – 14.4 14.6 – – 5.3 16.5 –
Cost/income ratio 105.5 77.8 76.7 – – 91.6 75.3 –
Pre-tax income margin (5.8) 21.6 22.5 – – 8.0 24.2 –
Effective tax rate (83.0) 38.8 30.6 – – 82.5 29.0 –
Net income margin 2 (10.9) 13.3 15.3 – – 1.2 17.0 –
Return on equity (%, annualized)
Return on equity – strategic results 12.9 13.9 15.0 – – 13.4 16.7 –
Number of employees (full-time equivalents)
Number of employees 45,100 45,600 46,300 (1) (3) 45,100 46,300 (3)
1 Calculated using income after tax denominated in CHF; assumes tax rate of 30% in 2Q14, 1Q14, 2Q13, 6M14 and 27% in 6M13 and capital allocated based on average of 10% of average risk-weighted assets and 2.4% of average leverage exposure.
2 Based on amounts attributable to shareholders.

Earnings ReleaseJuly 22, 2014
Page A-5
Core Results – strategic and non-strategic results
Strategic results Non-strategic results Core Results
in / end of 2Q14 1Q14 2Q13 2Q14 1Q14 2Q13 2Q14 1Q14 2Q13
Statements of operations (CHF million)
Net revenues 6,324 6,553 6,795 109 (84) 35 6,433 6,469 6,830
Provision for credit losses 25 18 23 (7) 16 28 18 34 51
Compensation and benefits 2,730 2,797 2,729 239 180 185 2,969 2,977 2,914
Total other operating expenses 1,802 1,798 1,956 2,014 260 369 3,816 2,058 2,325
Total operating expenses 4,532 4,595 4,685 2,253 440 554 6,785 5,035 5,239
Income/(loss) from continuing operations
before taxes 1,767 1,940 2,087 (2,137) (540) (547) (370) 1,400 1,540
Income tax expense/(benefit) 471 529 618 (164) 14 (146) 307 543 472
Income/(loss) from continuing operations 1,296 1,411 1,469 (1,973) (554) (401) (677) 857 1,068
Income/(loss) from discontinued operations 0 0 0 (9) 15 (9) (9) 15 (9)
Net income/(loss) 1,296 1,411 1,469 (1,982) (539) (410) (686) 872 1,059
Net income attributable to noncontrolling interests 14 13 14 0 0 0 14 13 14
Net income/(loss) attributable to shareholders 1,282 1,398 1,455 (1,982) (539) (410) (700) 859 1,045
Balance sheet statistics (CHF million)
Risk-weighted assets – Basel III 1 260,901 255,697 254,826 18,268 23,997 26,517 279,169 279,694 281,343
Total assets 850,815 835,281 863,110 39,464 41,518 52,526 890,279 876,799 915,636
Swiss leverage exposure 1,075,558 1,054,487 1,146,478 80,476 85,130 111,975 1,156,034 1,139,617 1,258,453
1 Represents risk-weighted assets on a fully phased-in “look-through” basis.
Private Banking & Wealth Management
in / end of % change in / end of % change
2Q14 1Q14 2Q13 QoQ YoY 6M14 6M13 YoY
Statements of operations (CHF million)
Net revenues 3,046 3,240 3,419 (6) (11) 6,286 6,697 (6)
of which strategic results 2,932 3,031 3,232 (3) (9) 5,963 6,240 (4)
of which non-strategic results 114 209 187 (45) (39) 323 457 (29)
Provision for credit losses 23 33 46 (30) (50) 56 74 (24)
Compensation and benefits 1,235 1,290 1,353 (4) (9) 2,525 2,732 (8)
General and administrative expenses 2,367 736 893 222 165 3,103 1,684 84
Commission expenses 170 169 210 1 (19) 339 409 (17)
Total other operating expenses 2,537 905 1,103 180 130 3,442 2,093 64
Total operating expenses 3,772 2,195 2,456 72 54 5,967 4,825 24
of which strategic results 2,020 2,049 2,198 (1) (8) 4,069 4,427 (8)
of which non-strategic results 1,752 146 258 – – 1,898 398 377
Income/(loss) before taxes (749) 1,012 917 – – 263 1,798 (85)
of which strategic results 882 965 1,015 (9) (13) 1,847 1,771 4
of which non-strategic results (1,631) 47 (98) – – (1,584) 27 –
Statement of operations metrics (%)
Return on capital 1 – 31.0 28.0 – – 4.0 28.6 –
Cost/income ratio 123.8 67.7 71.8 – – 94.9 72.0 –
Pre-tax income margin (24.6) 31.2 26.8 – – 4.2 26.8 –
Assets under management (CHF billion)
Assets under management 1,329.7 1,292.5 1,296.6 2.9 2.6 1,329.7 1,296.6 2.6
Net new assets 10.1 13.7 7.6 (26.3) 32.9 23.8 19.6 21.4
Number of employees and relationship managers
Number of employees (full-time equivalents) 25,800 26,100 26,500 (1) (3) 25,800 26,500 (3)
Number of relationship managers 4,340 4,410 4,490 (2) (3) 4,340 4,490 (3)
1 Calculated using income after tax denominated in CHF; assumes tax rate of 30% in 2Q14, 1Q14, 2Q13, 6M14 and 28% in 6M13 and capital allocated on average of 10% of average risk-weighted assets and 2.4% of average leverage exposure.

Earnings ReleaseJuly 22, 2014
Page A-6
Private Banking & Wealth Management (continued)
in / end of % change in / end of % change
2Q14 1Q14 2Q13 QoQ YoY 6M14 6M13 YoY
Net revenue detail (CHF million)
Net interest income 970 979 1,079 (1) (10) 1,949 2,124 (8)
Recurring commissions and fees 1,184 1,189 1,270 0 (7) 2,373 2,489 (5)
Transaction- and performance-based revenues 885 937 1,064 (6) (17) 1,822 1,983 (8)
Other revenues 1 7 135 6 (95) 17 142 101 41
Net revenues 3,046 3,240 3,419 (6) (11) 6,286 6,697 (6)
Provision for credit losses (CHF million)
New provisions 59 53 88 11 (33) 112 140 (20)
Releases of provisions (36) (20) (42) 80 (14) (56) (66) (15)
Provision for credit losses 23 33 46 (30) (50) 56 74 (24)
1 Includes investment-related gains/(losses), equity participations and other gains/(losses) and fair value gains/(losses) on the Clock Finance transaction.
Private Banking & Wealth Management – strategic results
in / end of % change in / end of % change
2Q14 1Q14 2Q13 QoQ YoY 6M14 6M13 YoY
Statements of operations (CHF million)
Net interest income 954 963 1,054 (1) (9) 1,917 2,073 (8)
Recurring commissions and fees 1,136 1,139 1,155 0 (2) 2,275 2,256 1
Transaction- and performance-based revenues 865 919 1,033 (6) (16) 1,784 1,907 (6)
Other revenues (23) 10 (10) – 130 (13) 4 –
Net revenues 2,932 3,031 3,232 (3) (9) 5,963 6,240 (4)
New provisions 49 36 61 36 (20) 85 108 (21)
Releases of provisions (19) (19) (42) 0 (55) (38) (66) (42)
Provision for credit losses 30 17 19 76 58 47 42 12
Compensation and benefits 1,184 1,225 1,273 (3) (7) 2,409 2,580 (7)
General and administrative expenses 672 660 726 2 (7) 1,332 1,462 (9)
Commission expenses 164 164 199 0 (18) 328 385 (15)
Total other operating expenses 836 824 925 1 (10) 1,660 1,847 (10)
Total operating expenses 2,020 2,049 2,198 (1) (8) 4,069 4,427 (8)
Income before taxes 882 965 1,015 (9) (13) 1,847 1,771 4
of which Wealth Management Clients 569 578 621 (2) (8) 1,147 1,075 7
of which Corporate & Institutional Clients 211 246 262 (14) (19) 457 501 (9)
of which Asset Management 102 141 132 (28) (23) 243 195 25
Statement of operations metrics (%)
Return on capital 1 28.0 31.6 33.5 – – 29.8 30.3 –
Cost/income ratio 68.9 67.6 68.0 – – 68.2 70.9 –
Pre-tax income margin 30.1 31.8 31.4 – – 31.0 28.4 –
Balance sheet statistics (CHF million)
Risk-weighted assets – Basel III 96,805 93,522 2 91,479 4 6 96,805 2 91,479 6
Total assets 306,919 306,228 285,786 0 7 306,919 285,786 7
Swiss leverage exposure 340,047 337,005 321,395 1 6 340,047 321,395 6
1 Calculated using income after tax denominated in CHF; assumes tax rate of 30% in 2Q14, 1Q14, 2Q13, 6M14 and 28% in 6M13 and capital allocated on average of 10% of average risk-weighted assets and 2.4% of average leverage exposure.
2 Includes the impact from external methodology changes in operational risk of CHF 2.2 billion in 1Q14.

Earnings ReleaseJuly 22, 2014
Page A-7
Wealth Management Clients
in / end of % change in / end of % change
2Q14 1Q14 2Q13 QoQ YoY 6M14 6M13 YoY
Statements of operations (CHF million)
Net revenues 2,017 2,074 2,239 (3) (10) 4,091 4,326 (5)
Provision for credit losses 17 16 20 6 (15) 33 39 (15)
Total operating expenses 1,431 1,480 1,598 (3) (10) 2,911 3,212 (9)
Income before taxes 569 578 621 (2) (8) 1,147 1,075 7
Statement of operations metrics (%)
Cost/income ratio 70.9 71.4 71.4 – – 71.2 74.2 –
Pre-tax income margin 28.2 27.9 27.7 – – 28.0 24.8 –
Net revenue detail (CHF million)
Net interest income 688 706 778 (3) (12) 1,394 1,524 (9)
Recurring commissions and fees 728 730 750 0 (3) 1,458 1,467 (1)
Transaction- and performance-based revenues 601 638 711 (6) (15) 1,239 1,335 (7)
Net revenues 2,017 2,074 2,239 (3) (10) 4,091 4,326 (5)
Gross and net margin (annualized) (bp)
Net interest income 34 35 39 – – 34 39 –
Recurring commissions and fees 36 37 37 – – 36 37 –
Transaction- and performance-based revenues 29 32 36 – – 31 34 –
Gross margin 1 99 104 112 – – 101 110 –
Net margin 2 28 29 31 – – 28 27 –
Number of relationship managers
Switzerland 1,680 1,690 1,600 (1) 5 1,680 1,600 5
EMEA 1,110 1,150 1,260 (3) (12) 1,110 1,260 (12)
Americas 540 560 610 (4) (11) 540 610 (11)
Asia Pacific 470 460 450 2 4 470 450 4
Number of relationship managers 3,800 3,860 3,920 (2) (3) 3,800 3,920 (3)
Beginning in 2Q13, fees collected in an agent role in connection with certain customized fund services we provide to clients where those fees are passed on directly to a third-party investment manager are now presented on a net basis per the applicable accounting standards. These fees were previously recorded on a gross basis as fee income and commission expense. Prior periods have been restated to conform to the current presentation.1 Net revenues divided by average assets under management.2 Income before taxes divided by average assets under management.

Earnings ReleaseJuly 22, 2014
Page A-8
Corporate & Institutional Clients
in / end of % change in / end of % change
2Q14 1Q14 2Q13 QoQ YoY 6M14 6M13 YoY
Statements of operations (CHF million)
Net revenues 475 492 512 (3) (7) 967 1,012 (4)
Provision for credit losses 13 1 (1) – – 14 3 367
Total operating expenses 251 245 251 2 0 496 508 (2)
Income before taxes 211 246 262 (14) (19) 457 501 (9)
Statement of operations metrics (%)
Cost/income ratio 52.8 49.8 49.0 – – 51.3 50.2 –
Pre-tax income margin 44.4 50.0 51.2 – – 47.3 49.5 –
Net revenue detail (CHF million)
Net interest income 266 257 276 4 (4) 523 549 (5)
Recurring commissions and fees 113 122 115 (7) (2) 235 226 4
Transaction- and performance-based revenues 118 117 127 1 (7) 235 248 (5)
Other revenues 1 (22) (4) (6) 450 267 (26) (11) 136
Net revenues 475 492 512 (3) (7) 967 1,012 (4)
Number of relationship managers
Number of relationship managers (Switzerland) 540 550 570 (2) (5) 540 570 (5)
1 Reflects fair value gains/(losses) on the Clock Finance transaction.
Asset Management
in / end of % change in / end of % change
2Q14 1Q14 2Q13 QoQ YoY 6M14 6M13 YoY
Statements of operations (CHF million)
Net revenues 440 465 481 (5) (9) 905 902 0
Provision for credit losses 0 0 0 – – 0 0 –
Total operating expenses 338 324 349 4 (3) 662 707 (6)
Income before taxes 102 141 132 (28) (23) 243 195 25
Statement of operations metrics (%)
Cost/income ratio 76.8 69.7 72.6 – – 73.1 78.4 –
Pre-tax income margin 23.2 30.3 27.4 – – 26.9 21.6 –
Net revenue detail (CHF million)
Recurring commissions and fees 295 287 290 3 2 582 563 3
Transaction- and performance-based revenues 146 164 195 (11) (25) 310 324 (4)
Other revenues (1) 14 (4) – (75) 13 15 (13)
Net revenues 440 465 481 (5) (9) 905 902 0
Net revenue detail by type (CHF million)
Asset management fees 295 287 290 3 2 582 563 3
Placement, transaction and other fees 59 56 47 5 26 115 107 7
Performance fees and carried interest 59 80 120 (26) (51) 139 164 (15)
Equity participations income 15 15 10 0 50 30 20 50
Fee-based revenues 428 438 467 (2) (8) 866 854 1
Investment-related gains/(losses) 6 19 2 (68) 200 25 35 (29)
Equity participations and other gains/(losses) 3 0 0 – – 3 0 –
Other revenues 1 3 8 12 (63) (75) 11 13 (15)
Net revenues 440 465 481 (5) (9) 905 902 0
Fee-based margin on assets under management (annualized) (bp)
Fee-based margin 2 46 49 53 – – 48 50 –
1 Includes allocated funding costs.2 Fee-based revenues divided by average assets under management.
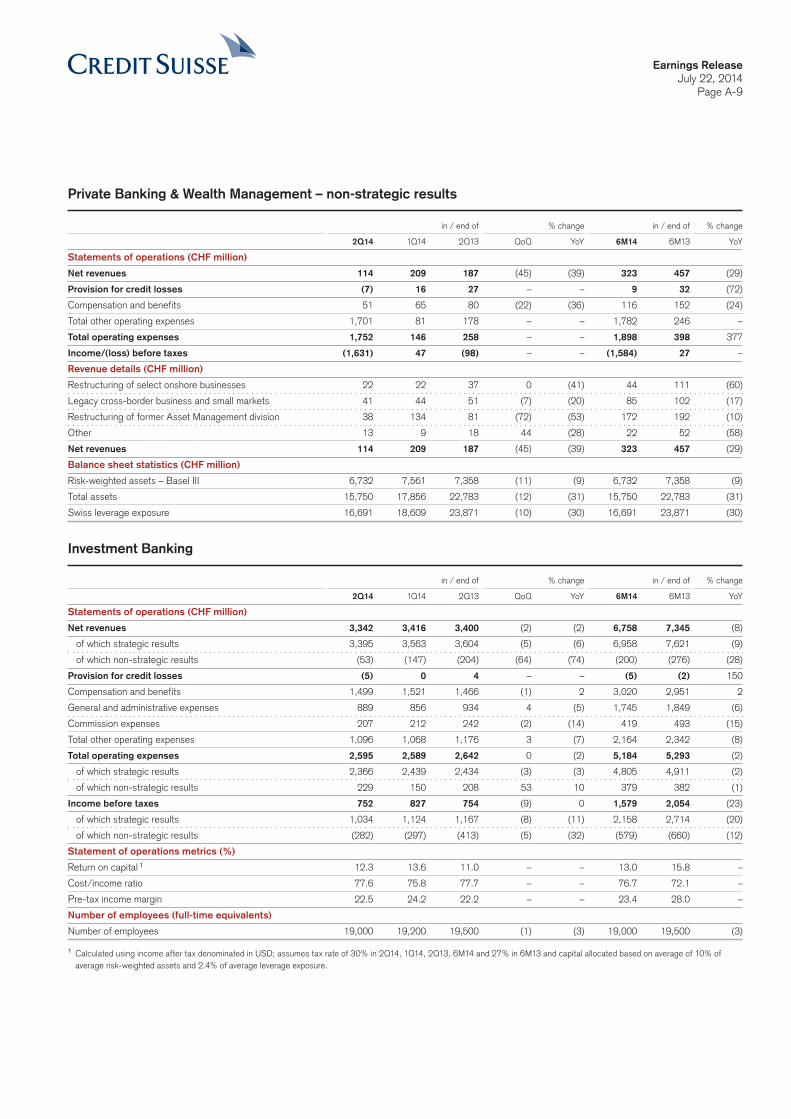
Earnings ReleaseJuly 22, 2014
Page A-9
Private Banking & Wealth Management – non-strategic results
in / end of % change in / end of % change
2Q14 1Q14 2Q13 QoQ YoY 6M14 6M13 YoY
Statements of operations (CHF million)
Net revenues 114 209 187 (45) (39) 323 457 (29)
Provision for credit losses (7) 16 27 – – 9 32 (72)
Compensation and benefits 51 65 80 (22) (36) 116 152 (24)
Total other operating expenses 1,701 81 178 – – 1,782 246 –
Total operating expenses 1,752 146 258 – – 1,898 398 377
Income/(loss) before taxes (1,631) 47 (98) – – (1,584) 27 –
Revenue details (CHF million)
Restructuring of select onshore businesses 22 22 37 0 (41) 44 111 (60)
Legacy cross-border business and small markets 41 44 51 (7) (20) 85 102 (17)
Restructuring of former Asset Management division 38 134 81 (72) (53) 172 192 (10)
Other 13 9 18 44 (28) 22 52 (58)
Net revenues 114 209 187 (45) (39) 323 457 (29)
Balance sheet statistics (CHF million)
Risk-weighted assets – Basel III 6,732 7,561 7,358 (11) (9) 6,732 7,358 (9)
Total assets 15,750 17,856 22,783 (12) (31) 15,750 22,783 (31)
Swiss leverage exposure 16,691 18,609 23,871 (10) (30) 16,691 23,871 (30)
Investment Banking
in / end of % change in / end of % change
2Q14 1Q14 2Q13 QoQ YoY 6M14 6M13 YoY
Statements of operations (CHF million)
Net revenues 3,342 3,416 3,400 (2) (2) 6,758 7,345 (8)
of which strategic results 3,395 3,563 3,604 (5) (6) 6,958 7,621 (9)
of which non-strategic results (53) (147) (204) (64) (74) (200) (276) (28)
Provision for credit losses (5) 0 4 – – (5) (2) 150
Compensation and benefits 1,499 1,521 1,466 (1) 2 3,020 2,951 2
General and administrative expenses 889 856 934 4 (5) 1,745 1,849 (6)
Commission expenses 207 212 242 (2) (14) 419 493 (15)
Total other operating expenses 1,096 1,068 1,176 3 (7) 2,164 2,342 (8)
Total operating expenses 2,595 2,589 2,642 0 (2) 5,184 5,293 (2)
of which strategic results 2,366 2,439 2,434 (3) (3) 4,805 4,911 (2)
of which non-strategic results 229 150 208 53 10 379 382 (1)
Income before taxes 752 827 754 (9) 0 1,579 2,054 (23)
of which strategic results 1,034 1,124 1,167 (8) (11) 2,158 2,714 (20)
of which non-strategic results (282) (297) (413) (5) (32) (579) (660) (12)
Statement of operations metrics (%)
Return on capital 1 12.3 13.6 11.0 – – 13.0 15.8 –
Cost/income ratio 77.6 75.8 77.7 – – 76.7 72.1 –
Pre-tax income margin 22.5 24.2 22.2 – – 23.4 28.0 –
Number of employees (full-time equivalents)
Number of employees 19,000 19,200 19,500 (1) (3) 19,000 19,500 (3)
1 Calculated using income after tax denominated in USD; assumes tax rate of 30% in 2Q14, 1Q14, 2Q13, 6M14 and 27% in 6M13 and capital allocated based on average of 10% of average risk-weighted assets and 2.4% of average leverage exposure.

Earnings ReleaseJuly 22, 2014
Page A-10
Investment Banking (continued)
in / end of % change in / end of % change
2Q14 1Q14 2Q13 QoQ YoY 6M14 6M13 YoY
Net revenue detail (CHF million)
Debt underwriting 483 468 535 3 (10) 951 996 (5)
Equity underwriting 268 183 207 46 29 451 364 24
Total underwriting 751 651 742 15 1 1,402 1,360 3
Advisory and other fees 161 180 167 (11) (4) 341 312 9
Total underwriting and advisory 912 831 909 10 0 1,743 1,672 4
Fixed income sales and trading 1,428 1,489 1,257 (4) 14 2,917 3,244 (10)
Equity sales and trading 1,134 1,201 1,338 (6) (15) 2,335 2,635 (11)
Total sales and trading 2,562 2,690 2,595 (5) (1) 5,252 5,879 (11)
Other (132) (105) (104) 26 27 (237) (206) 15
Net revenues 3,342 3,416 3,400 (2) (2) 6,758 7,345 –
Investment Banking – strategic results
in / end of % change in / end of % change
2Q14 1Q14 2Q13 QoQ YoY 6M14 6M13 YoY
Statements of operations (CHF million)
Debt underwriting 483 468 534 3 (10) 951 995 (4)
Equity underwriting 268 183 206 46 30 451 363 24
Total underwriting 751 651 740 15 1 1,402 1,358 3
Advisory and other fees 161 180 167 (11) (4) 341 312 9
Total underwriting and advisory 912 831 907 10 1 1,743 1,670 4
Fixed income sales and trading 1,485 1,609 1,434 (8) 4 3,094 3,462 (11)
Equity sales and trading 1,119 1,207 1,368 (7) (18) 2,326 2,684 (13)
Total sales and trading 2,604 2,816 2,802 (8) (7) 5,420 6,146 (12)
Other (121) (84) (105) 44 15 (205) (195) 5
Net revenues 3,395 3,563 3,604 (5) (6) 6,958 7,621 (9)
Provision for credit losses (5) 0 3 – – (5) (4) 25
Compensation and benefits 1,476 1,495 1,438 (1) 3 2,971 2,897 3
General and administrative expenses 688 735 758 (6) (9) 1,423 1,534 (7)
Commission expenses 202 209 238 (3) (15) 411 480 (14)
Total other operating expenses 890 944 996 (6) (11) 1,834 2,014 (9)
Total operating expenses 2,366 2,439 2,434 (3) (3) 4,805 4,911 (2)
Income before taxes 1,034 1,124 1,167 (8) (11) 2,158 2,714 (20)
Statement of operations metrics (%)
Return on capital 1 18.5 20.5 19.1 – – 19.5 23.3 –
Cost/income ratio 69.7 68.5 67.5 – – 69.1 64.4 –
Pre-tax income margin 30.5 31.5 32.4 – – 31.0 35.6 –
Balance sheet statistics (CHF million, except where indicated)
Risk-weighted assets – Basel III 148,663 146,276 147,028 2 1 148,663 147,028 1
Risk-weighted assets – Basel III (USD) 167,639 165,592 155,397 1 8 167,639 155,397 8
Total assets 501,387 497,833 545,472 1 (8) 501,387 545,472 (8)
Swiss leverage exposure 692,836 685,298 780,563 1 (11) 692,836 780,563 (11)
1 Calculated using income after tax denominated in USD; assumes tax rate of 30% in 2Q14, 1Q14, 2Q13, 6M14 and 27% in 6M13 and capital allocated based on average of 10% of average risk-weighted assets and 2.4% of average leverage exposure.
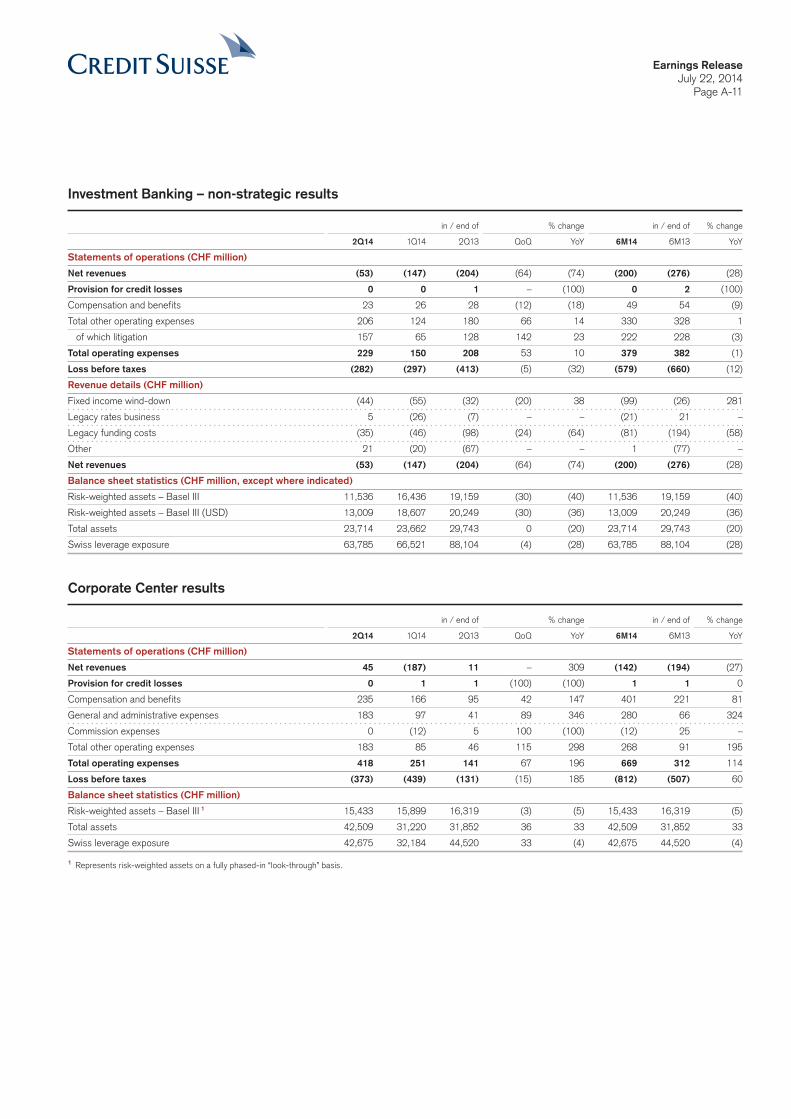
Earnings ReleaseJuly 22, 2014
Page A-11
Investment Banking – non-strategic results
in / end of % change in / end of % change
2Q14 1Q14 2Q13 QoQ YoY 6M14 6M13 YoY
Statements of operations (CHF million)
Net revenues (53) (147) (204) (64) (74) (200) (276) (28)
Provision for credit losses 0 0 1 – (100) 0 2 (100)
Compensation and benefits 23 26 28 (12) (18) 49 54 (9)
Total other operating expenses 206 124 180 66 14 330 328 1
of which litigation 157 65 128 142 23 222 228 (3)
Total operating expenses 229 150 208 53 10 379 382 (1)
Loss before taxes (282) (297) (413) (5) (32) (579) (660) (12)
Revenue details (CHF million)
Fixed income wind-down (44) (55) (32) (20) 38 (99) (26) 281
Legacy rates business 5 (26) (7) – – (21) 21 –
Legacy funding costs (35) (46) (98) (24) (64) (81) (194) (58)
Other 21 (20) (67) – – 1 (77) –
Net revenues (53) (147) (204) (64) (74) (200) (276) (28)
Balance sheet statistics (CHF million, except where indicated)
Risk-weighted assets – Basel III 11,536 16,436 19,159 (30) (40) 11,536 19,159 (40)
Risk-weighted assets – Basel III (USD) 13,009 18,607 20,249 (30) (36) 13,009 20,249 (36)
Total assets 23,714 23,662 29,743 0 (20) 23,714 29,743 (20)
Swiss leverage exposure 63,785 66,521 88,104 (4) (28) 63,785 88,104 (28)
Corporate Center results
in / end of % change in / end of % change
2Q14 1Q14 2Q13 QoQ YoY 6M14 6M13 YoY
Statements of operations (CHF million)
Net revenues 45 (187) 11 – 309 (142) (194) (27)
Provision for credit losses 0 1 1 (100) (100) 1 1 0
Compensation and benefits 235 166 95 42 147 401 221 81
General and administrative expenses 183 97 41 89 346 280 66 324
Commission expenses 0 (12) 5 100 (100) (12) 25 –
Total other operating expenses 183 85 46 115 298 268 91 195
Total operating expenses 418 251 141 67 196 669 312 114
Loss before taxes (373) (439) (131) (15) 185 (812) (507) 60
Balance sheet statistics (CHF million)
Risk-weighted assets – Basel III 1 15,433 15,899 16,319 (3) (5) 15,433 16,319 (5)
Total assets 42,509 31,220 31,852 36 33 42,509 31,852 33
Swiss leverage exposure 42,675 32,184 44,520 33 (4) 42,675 44,520 (4)
1 Represents risk-weighted assets on a fully phased-in “look-through” basis.

Earnings ReleaseJuly 22, 2014
Page A-12
Corporate Center – non-strategic results
in / end of % change in / end of % change
2Q14 1Q14 2Q13 QoQ YoY 6M14 6M13 YoY
Statements of operations (CHF million)
Net revenues 48 (146) 52 – (8) (98) (146) (33)
Provision for credit losses 0 0 0 – – 0 0 –
Total operating expenses 272 144 88 89 209 416 170 145
Loss before taxes (224) (290) (36) (23) – (514) (316) 63
of which fair value impact from movements in own credit spreads (10) (120) 130 (92) – (130) 50 –
of which realignment costs 1 (136) (62) (133) 119 2 (198) (225) (12)
of which IT architecture simplification expenses (81) (61) (19) 33 326 (142) (19) –
of which real estate sales 5 34 – (85) – 39 – –
of which legacy funding costs 2 (22) (6) (22) 267 – (28) (43) (35)
of which reclassifications to discontinued operations 3 10 (56) 5 – 100 (46) (12) 283
of which other non-strategic items 10 (19) 3 – 233 (9) (67) (87)
1 Business realignment costs relating to divisional realignment costs are prospectively presented in the relevant divisional non-strategic results beginning in 4Q13.2 Represents legacy funding costs associated with non-Basel III compliant debt instruments.3 Includes reclassifications to discontinued operations of revenues and expenses arising from the sale of ETF, secondary private equity and CFIG businesses and the announced sale of
domestic private banking business booked in Germany.
Impact from movements in own credit spreads
Core Results revenues are impacted by changes in credit spreads on fair-valued Credit Suisse long-term vanilla debt and debit valuation adjustments (DVA) relating to certain structured notes liabilities carried at fair value. Core Results are also impacted by fair value gains/(losses) on stand-alone derivatives relating to certain of our funding liabilities and reflect the volatility of cross-currency swaps and yield curve volatility and, over the life of the derivatives, will result in no net gains/(losses). These fair value gains/(losses) are recorded in the Corporate Center.
in 2Q14 1Q14 2Q13 6M14 6M13
Impact from movements in own credit spreads (CHF million)
Fair value gains/(losses) from movements in own credit spreads (10) (120) 130 (130) 50
of which fair value gains/(losses) on own long-term vanilla debt (29) (92) 17 (121) (20)
of which fair value gains/(losses) from DVA on structured notes 4 (4) 79 0 38
of which fair value gains/(losses) on stand-alone derivatives 15 (24) 34 (9) 32
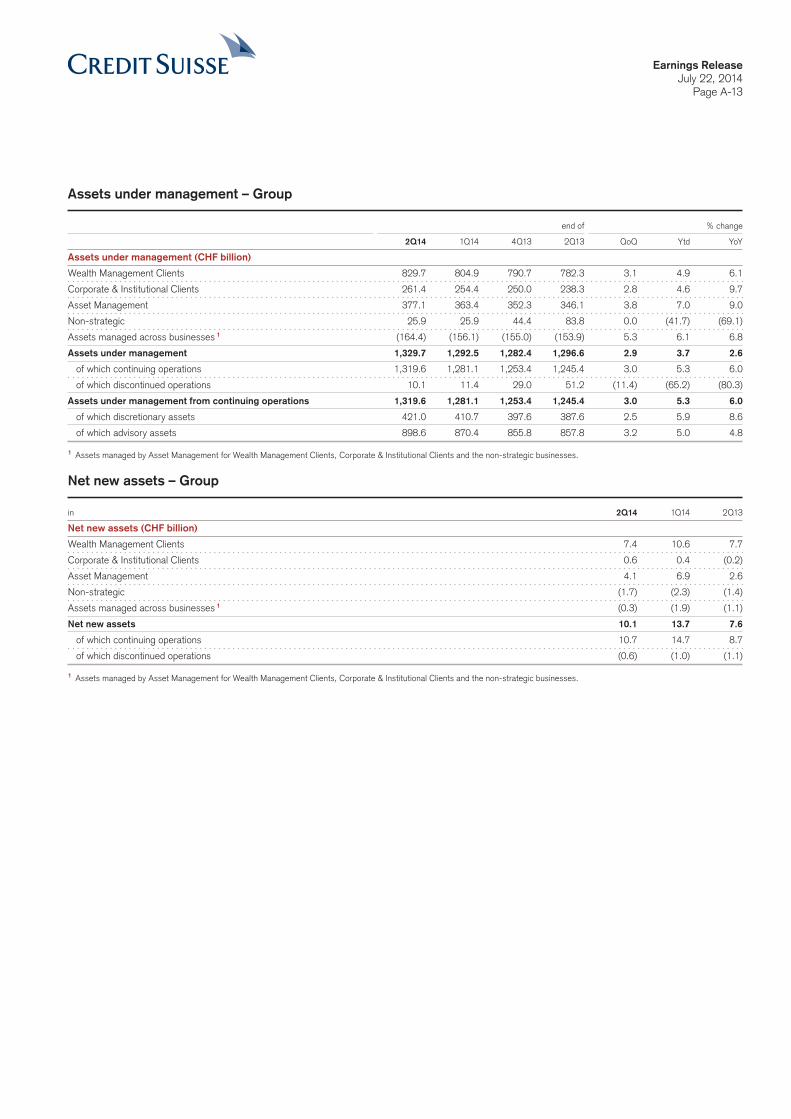
Earnings ReleaseJuly 22, 2014
Page A-13
Assets under management – Group
end of % change
2Q14 1Q14 4Q13 2Q13 QoQ Ytd YoY
Assets under management (CHF billion)
Wealth Management Clients 829.7 804.9 790.7 782.3 3.1 4.9 6.1
Corporate & Institutional Clients 261.4 254.4 250.0 238.3 2.8 4.6 9.7
Asset Management 377.1 363.4 352.3 346.1 3.8 7.0 9.0
Non-strategic 25.9 25.9 44.4 83.8 0.0 (41.7) (69.1)
Assets managed across businesses 1 (164.4) (156.1) (155.0) (153.9) 5.3 6.1 6.8
Assets under management 1,329.7 1,292.5 1,282.4 1,296.6 2.9 3.7 2.6
of which continuing operations 1,319.6 1,281.1 1,253.4 1,245.4 3.0 5.3 6.0
of which discontinued operations 10.1 11.4 29.0 51.2 (11.4) (65.2) (80.3)
Assets under management from continuing operations 1,319.6 1,281.1 1,253.4 1,245.4 3.0 5.3 6.0
of which discretionary assets 421.0 410.7 397.6 387.6 2.5 5.9 8.6
of which advisory assets 898.6 870.4 855.8 857.8 3.2 5.0 4.8
1 Assets managed by Asset Management for Wealth Management Clients, Corporate & Institutional Clients and the non-strategic businesses.
Net new assets – Group
in 2Q14 1Q14 2Q13
Net new assets (CHF billion)
Wealth Management Clients 7.4 10.6 7.7
Corporate & Institutional Clients 0.6 0.4 (0.2)
Asset Management 4.1 6.9 2.6
Non-strategic (1.7) (2.3) (1.4)
Assets managed across businesses 1 (0.3) (1.9) (1.1)
Net new assets 10.1 13.7 7.6
of which continuing operations 10.7 14.7 8.7
of which discontinued operations (0.6) (1.0) (1.1)
1 Assets managed by Asset Management for Wealth Management Clients, Corporate & Institutional Clients and the non-strategic businesses.

Earnings ReleaseJuly 22, 2014
Page A-14
BIS statistics – Basel III – Group
Phase-in Look-through
% change % change
end of 2Q14 1Q14 4Q13 QoQ 2Q14 1Q14 4Q13 QoQ
Eligible capital (CHF million)
Total shareholders’ equity 40,944 43,230 42,164 (5) 40,944 43,230 42,164 (5)
Regulatory adjustments 1 (362) (1,213) (1,069) (70) (362) (1,213) (1,069) (70)
Adjustments subject to phase-in (1,129) 2 (1,114) 1,894 3 1 (14,163) (14,159) (14,615) 0
CET1 capital 39,453 40,903 42,989 (4) 26,419 27,858 26,480 (5)
Additional tier 1 instruments 10,282 4 8,000 7,484 29 10,282 8,000 7,484 29
Additional tier 1 instruments subject to phase-out 5 2,138 2,088 3,652 2 – – – –
Deductions from additional tier 1 capital (6,336) 6 (6,414) (8,064) (1) – – – –
Additional tier 1 capital 6,084 3,674 3,072 66 10,282 8,000 7,484 29
Total tier 1 capital 45,537 44,577 46,061 2 36,701 35,858 33,964 2
Tier 2 instruments 6,409 7 6,340 6,263 1 6,409 6,340 6,263 1
Tier 2 instruments subject to phase-out 3,944 3,924 4,321 1 – – – –
Deductions from tier 2 capital (253) (263) (357) (4) (1) (2) (18) (50)
Tier 2 capital 10,100 10,001 10,227 1 6,408 6,338 6,245 1
Total eligible capital 55,637 54,578 56,288 2 43,109 42,196 40,209 2
Risk-weighted assets (CHF million)
Credit risk 187,967 187,609 175,631 0 181,715 181,307 167,888 0
Market risk 32,704 34,143 39,133 (4) 32,704 34,143 39,133 (4)
Operational risk 59,050 58,400 53,075 1 59,050 58,400 53,075 1
Non-counterparty risk 5,700 5,844 6,007 (2) 5,700 5,844 6,007 (2)
Risk-weighted assets 285,421 285,996 273,846 0 279,169 279,694 266,103 0
Capital ratios (%)
CET1 ratio 13.8 14.3 15.7 – 9.5 10.0 10.0 –
Tier 1 ratio 16.0 15.6 16.8 – 13.1 12.8 12.8 –
Total capital ratio 19.5 19.1 20.6 – 15.4 15.1 15.1 –
1 Includes regulatory adjustments not subject to phase-in, including a cumulative dividend accrual.2 Reflects 20% phase-in deductions including goodwill, other intangible assets, certain deferred tax assets and 80% of an adjustment for the accounting treatment of pension plans
pursuant to phase-in requirements.3 Includes an adjustment for the accounting treatment of pension plans pursuant to phase-in requirements and other regulatory adjustments.4 Consists of high-trigger and low-trigger capital instruments. Of this amount, CHF 5.8 billion consists of capital instruments with a capital ratio write-down trigger of 7% and CHF 4.5
billion consists of capital instruments with a capital ratio write-down trigger of 5.125%.5 Includes hybrid capital instruments that are subject to phase-out.6 Includes 80% of goodwill and other intangible assets (CHF 6.5 billion) and other capital deductions, including gains/(losses) due to changes in own credit risks on fair valued financial
liabilities, that will be deducted from CET1 once Basel III is fully implemented.7 Consists of high-trigger and low-trigger capital instruments. Of this amount, CHF 2.5 billion consists of capital instruments with a capital ratio write-down trigger of 7% and CHF 3.9
billion consists of capital instruments with a capital ratio write-down trigger of 5%.
CET1 capital movement – Basel III
2Q14 1Q14
CET1 capital (CHF million)
Balance at beginning of period 40,903 42,989
Net income/(loss) (700) 859
Foreign exchange impact 44 (233)
Impact of phase-in requirements – (3,015)
Other 1 (794) 303
Balance at end of period 39,453 40,903
1 Reflects the net effect of share-based compensation, a dividend accrual and a change in other regulatory adjustments.

Earnings ReleaseJuly 22, 2014
Page A-15
Risk-weighted assets by division – Basel III
end of % change
2Q14 1Q14 4Q13 QoQ
Risk-weighted assets by division (CHF million)
Private Banking & Wealth Management 103,537 101,083 95,507 2
Investment Banking 160,199 162,712 155,290 (2)
Corporate Center 21,685 22,201 23,049 (2)
Risk-weighted assets 285,421 285,996 273,846 0
Risk-weighted asset movement by risk type – Basel III
Non- Total risk-
Credit risk Credit risk Operational counterparty weighted
(excluding CVA) (CVA) Market risk risk risk assets
2Q14 (CHF million)
Balance at beginning of period 171,067 16,542 34,143 58,400 5,844 285,996
Foreign exchange impact 615 97 263 0 0 975
Movements in risk levels (1,168) (2,518) (406) 0 (144) (4,236)
Model and parameter updates 1 376 (565) (853) 3,337 0 2,295
Methodology and policy – internal 2 3,167 354 (443) (2,062) 0 1,016
Methodology and policy – external 3 0 0 0 (625) 0 (625)
Balance at end of period 174,057 13,910 32,704 59,050 5,700 285,421
1 Represents movements arising from updates to models and recalibrations of parameters.2 Represents internal changes impacting how exposures are treated.3 Represents externally prescribed regulatory changes impacting how exposures are treated.
Swiss statistics – Basel III – Group
Phase-in Look-through
% change % change
end of 2Q14 1Q14 4Q13 QoQ 2Q14 1Q14 4Q13 QoQ
Capital development (CHF million)
CET1 capital 39,453 40,903 42,989 (4) 26,419 27,858 26,480 (5)
Swiss regulatory adjustments 1 (161) (151) 1,658 7 (175) (163) 1,824 7
Swiss CET1 capital 2 39,292 40,752 44,647 (4) 26,244 27,695 28,304 (5)
High-trigger capital instruments 8,259 3 8,231 7,743 0 8,259 8,231 7,743 0
Low-trigger capital instruments 8,432 4 6,109 6,005 38 8,432 6,109 6,005 38
Additional tier 1 and tier 2 instruments subject to phase-out 5 6,082 6,012 – 1 – – – –
Deductions from additional tier 1 and tier 2 capital 5 (6,589) (6,677) – (1) (1) (2) – (50)
Swiss total eligible capital 2 55,476 54,427 58,395 2 42,934 42,033 42,052 2
Risk-weighted assets (CHF million)
Risk-weighted assets – Basel III 285,421 285,996 273,846 0 279,169 279,694 266,103 0
Swiss regulatory adjustments 6 787 737 1,015 7 786 736 1,031 7
Swiss risk-weighted assets 286,208 286,733 274,861 0 279,955 280,430 267,134 0
Capital ratios (%)
Swiss CET1 ratio 13.7 14.2 16.2 – 9.4 9.9 10.6 –
Swiss total capital ratio 19.4 19.0 21.2 – 15.3 15.0 15.7 –
1 Includes adjustments for certain unrealized gains outside the trading book and, in 4Q13, also included tier 1 participation securities, which were redeemed in 1Q14.2 Previously referred to as Swiss Core Capital and Swiss Total Capital, respectively.3 Consists of CHF 5.8 billion additional tier 1 instruments and CHF 2.5 billion tier 2 instruments.4 Consists of CHF 4.5 billion additional tier 1 instruments and CHF 3.9 billion tier 2 instruments.5 Reflects the FINMA Decree, which was effective in 1Q14.6 Primarily includes differences in the credit risk multiplier.
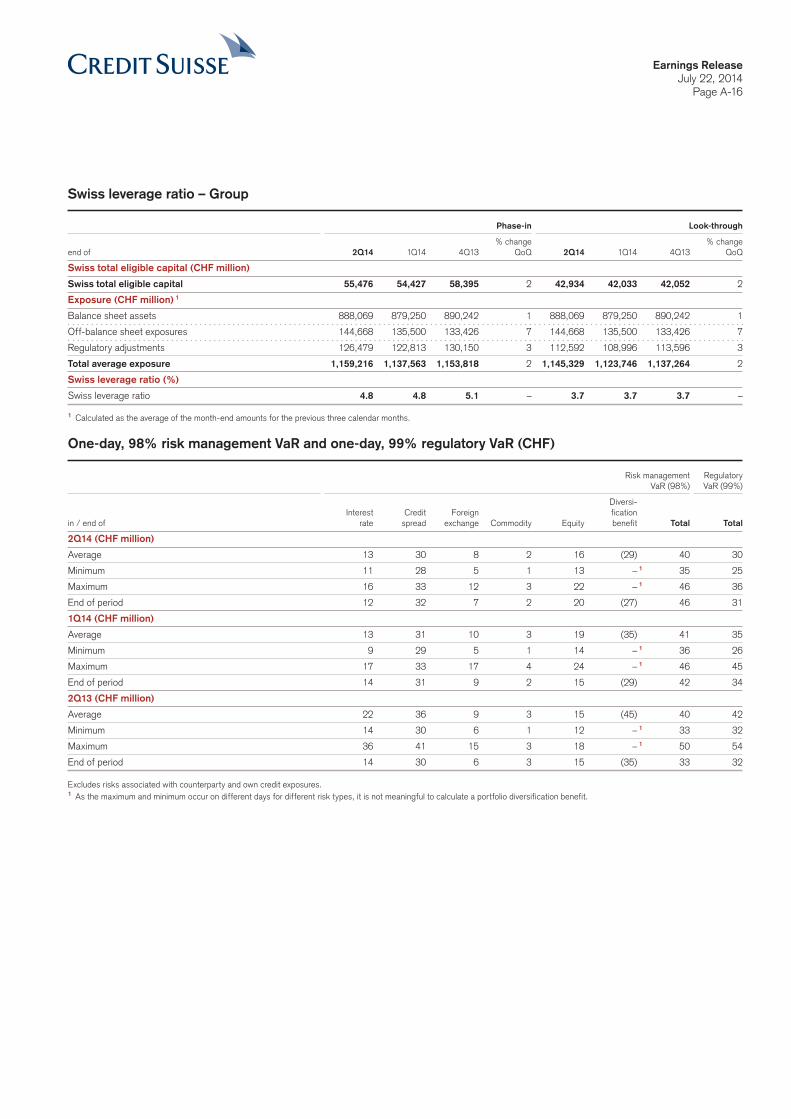
Earnings ReleaseJuly 22, 2014
Page A-16
Swiss leverage ratio – Group
Phase-in Look-through
% change % change
end of 2Q14 1Q14 4Q13 QoQ 2Q14 1Q14 4Q13 QoQ
Swiss total eligible capital (CHF million)
Swiss total eligible capital 55,476 54,427 58,395 2 42,934 42,033 42,052 2
Exposure (CHF million) 1
Balance sheet assets 888,069 879,250 890,242 1 888,069 879,250 890,242 1
Off-balance sheet exposures 144,668 135,500 133,426 7 144,668 135,500 133,426 7
Regulatory adjustments 126,479 122,813 130,150 3 112,592 108,996 113,596 3
Total average exposure 1,159,216 1,137,563 1,153,818 2 1,145,329 1,123,746 1,137,264 2
Swiss leverage ratio (%)
Swiss leverage ratio 4.8 4.8 5.1 – 3.7 3.7 3.7 –
1 Calculated as the average of the month-end amounts for the previous three calendar months.
One-day, 98% risk management VaR and one-day, 99% regulatory VaR (CHF)
Risk management Regulatory
VaR (98%) VaR (99%)
Diversi-
Interest Credit Foreign fication
in / end of rate spread exchange Commodity Equity benefit Total Total
2Q14 (CHF million)
Average 13 30 8 2 16 (29) 40 30
Minimum 11 28 5 1 13 – 1 35 25
Maximum 16 33 12 3 22 – 1 46 36
End of period 12 32 7 2 20 (27) 46 31
1Q14 (CHF million)
Average 13 31 10 3 19 (35) 41 35
Minimum 9 29 5 1 14 – 1 36 26
Maximum 17 33 17 4 24 – 1 46 45
End of period 14 31 9 2 15 (29) 42 34
2Q13 (CHF million)
Average 22 36 9 3 15 (45) 40 42
Minimum 14 30 6 1 12 – 1 33 32
Maximum 36 41 15 3 18 – 1 50 54
End of period 14 30 6 3 15 (35) 33 32
Excludes risks associated with counterparty and own credit exposures.1 As the maximum and minimum occur on different days for different risk types, it is not meaningful to calculate a portfolio diversification benefit.

Earnings ReleaseJuly 22, 2014
Page A-17
Consolidated statements of operations
in 2Q14 1Q14 2Q13 6M14 6M13
Consolidated statements of operations (CHF million)
Interest and dividend income 5,690 4,445 6,220 10,135 11,042
Interest expense (3,104) (2,267) (3,580) (5,371) (6,596)
Net interest income 2,586 2,178 2,640 4,764 4,446
Commissions and fees 3,309 3,275 3,538 6,584 6,786
Trading revenues 197 638 357 835 2,172
Other revenues 371 738 417 1,109 637
Net revenues 6,463 6,829 6,952 13,292 14,041
Provision for credit losses 18 34 51 52 73
Compensation and benefits 2,973 2,993 2,926 5,966 5,917
General and administrative expenses 3,441 1,690 1,873 5,131 3,605
Commission expenses 377 369 457 746 927
Total other operating expenses 3,818 2,059 2,330 5,877 4,532
Total operating expenses 6,791 5,052 5,256 11,843 10,449
Income/(loss) from continuing operations before taxes (346) 1,743 1,645 1,397 3,519
Income tax expense 307 543 472 850 971
Income/(loss) from continuing operations (653) 1,200 1,173 547 2,548
Income/(loss) from discontinued operations, net of tax (9) 15 (9) 6 (3)
Net income/(loss) (662) 1,215 1,164 553 2,545
Net income attributable to noncontrolling interests 38 356 119 394 197
Net income/(loss) attributable to shareholders (700) 859 1,045 159 2,348
of which from continuing operations (691) 844 1,054 153 2,351
of which from discontinued operations (9) 15 (9) 6 (3)
Basic earnings per share (CHF)
Basic earnings/(loss) per share from continuing operations (0.45) 0.47 0.55 0.05 1.31
Basic earnings/(loss) per share from discontinued operations (0.01) 0.01 (0.01) 0.00 0.00
Basic earnings/(loss) per share (0.46) 0.48 0.54 0.05 1.31
Diluted earnings per share (CHF)
Diluted earnings/(loss) per share from continuing operations (0.45) 0.47 0.53 0.05 1.28
Diluted earnings/(loss) per share from discontinued operations (0.01) 0.01 (0.01) 0.00 0.00
Diluted earnings/(loss) per share (0.46) 0.48 0.52 0.05 1.28
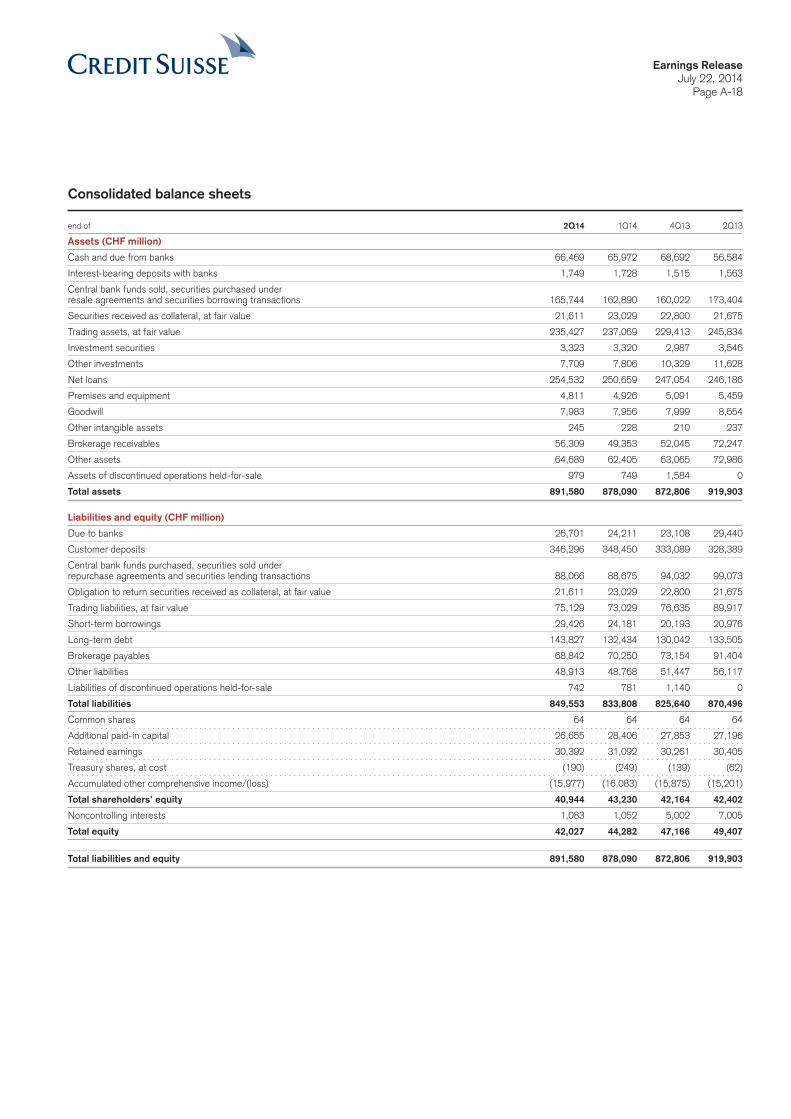
Earnings ReleaseJuly 22, 2014
Page A-18
Consolidated balance sheets
end of 2Q14 1Q14 4Q13 2Q13
Assets (CHF million)
Cash and due from banks 66,469 65,972 68,692 56,584
Interest-bearing deposits with banks 1,749 1,728 1,515 1,563
Central bank funds sold, securities purchased under
resale agreements and securities borrowing transactions 165,744 162,890 160,022 173,404
Securities received as collateral, at fair value 21,611 23,029 22,800 21,675
Trading assets, at fair value 235,427 237,069 229,413 245,834
Investment securities 3,323 3,320 2,987 3,546
Other investments 7,709 7,806 10,329 11,628
Net loans 254,532 250,659 247,054 246,186
Premises and equipment 4,811 4,926 5,091 5,459
Goodwill 7,983 7,956 7,999 8,554
Other intangible assets 245 228 210 237
Brokerage receivables 56,309 49,353 52,045 72,247
Other assets 64,689 62,405 63,065 72,986
Assets of discontinued operations held-for-sale 979 749 1,584 0
Total assets 891,580 878,090 872,806 919,903
Liabilities and equity (CHF million)
Due to banks 26,701 24,211 23,108 29,440
Customer deposits 346,296 348,450 333,089 328,389
Central bank funds purchased, securities sold under
repurchase agreements and securities lending transactions 88,066 88,675 94,032 99,073
Obligation to return securities received as collateral, at fair value 21,611 23,029 22,800 21,675
Trading liabilities, at fair value 75,129 73,029 76,635 89,917
Short-term borrowings 29,426 24,181 20,193 20,976
Long-term debt 143,827 132,434 130,042 133,505
Brokerage payables 68,842 70,250 73,154 91,404
Other liabilities 48,913 48,768 51,447 56,117
Liabilities of discontinued operations held-for-sale 742 781 1,140 0
Total liabilities 849,553 833,808 825,640 870,496
Common shares 64 64 64 64
Additional paid-in capital 26,655 28,406 27,853 27,196
Retained earnings 30,392 31,092 30,261 30,405
Treasury shares, at cost (190) (249) (139) (62)
Accumulated other comprehensive income/(loss) (15,977) (16,083) (15,875) (15,201)
Total shareholders’ equity 40,944 43,230 42,164 42,402
Noncontrolling interests 1,083 1,052 5,002 7,005
Total equity 42,027 44,282 47,166 49,407
Total liabilities and equity 891,580 878,090 872,806 919,903
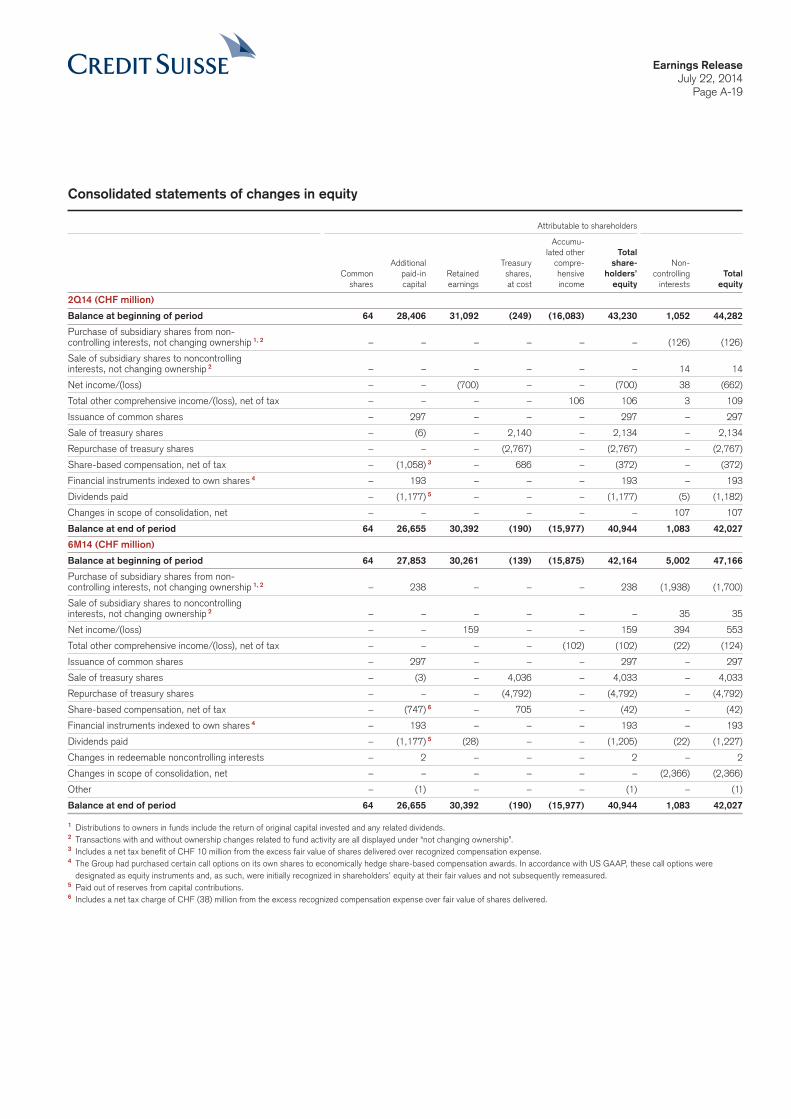
Earnings ReleaseJuly 22, 2014
Page A-19
Consolidated statements of changes in equity
Attributable to shareholders
Accumu-
lated other Total
Additional Treasury compre- share- Non-
Common paid-in Retained shares, hensive holders’ controlling Total shares capital earnings at cost income equity interests equity
2Q14 (CHF million)
Balance at beginning of period 64 28,406 31,092 (249) (16,083) 43,230 1,052 44,282
Purchase of subsidiary shares from non-
controlling interests, not changing ownership 1,2 – – – – – – (126) (126)
Sale of subsidiary shares to noncontrolling
interests, not changing ownership 2 – – – – – – 14 14
Net income/(loss) – – (700) – – (700) 38 (662)
Total other comprehensive income/(loss), net of tax – – – – 106 106 3 109
Issuance of common shares – 297 – – – 297 – 297
Sale of treasury shares – (6) – 2,140 – 2,134 – 2,134
Repurchase of treasury shares – – – (2,767) – (2,767) – (2,767)
Share-based compensation, net of tax – (1,058) 3 – 686 – (372) – (372)
Financial instruments indexed to own shares 4 – 193 – – – 193 – 193
Dividends paid – (1,177) 5 – – – (1,177) (5) (1,182)
Changes in scope of consolidation, net – – – – – – 107 107
Balance at end of period 64 26,655 30,392 (190) (15,977) 40,944 1,083 42,027
6M14 (CHF million)
Balance at beginning of period 64 27,853 30,261 (139) (15,875) 42,164 5,002 47,166
Purchase of subsidiary shares from non-
controlling interests, not changing ownership 1,2 – 238 – – – 238 (1,938) (1,700)
Sale of subsidiary shares to noncontrolling
interests, not changing ownership 2 – – – – – – 35 35
Net income/(loss) – – 159 – – 159 394 553
Total other comprehensive income/(loss), net of tax – – – – (102) (102) (22) (124)
Issuance of common shares – 297 – – – 297 – 297
Sale of treasury shares – (3) – 4,036 – 4,033 – 4,033
Repurchase of treasury shares – – – (4,792) – (4,792) – (4,792)
Share-based compensation, net of tax – (747) 6 – 705 – (42) – (42)
Financial instruments indexed to own shares 4 – 193 – – – 193 – 193
Dividends paid – (1,177) 5 (28) – – (1,205) (22) (1,227)
Changes in redeemable noncontrolling interests – 2 – – – 2 – 2
Changes in scope of consolidation, net – – – – – – (2,366) (2,366)
Other – (1) – – – (1) – (1)
Balance at end of period 64 26,655 30,392 (190) (15,977) 40,944 1,083 42,027
1 Distributions to owners in funds include the return of original capital invested and any related dividends.2 Transactions with and without ownership changes related to fund activity are all displayed under “not changing ownership”.3 Includes a net tax benefit of CHF 10 million from the excess fair value of shares delivered over recognized compensation expense.4 The Group had purchased certain call options on its own shares to economically hedge share-based compensation awards. In accordance with US GAAP, these call options were
designated as equity instruments and, as such, were initially recognized in shareholders’ equity at their fair values and not subsequently remeasured.5 Paid out of reserves from capital contributions.6 Includes a net tax charge of CHF (38) million from the excess recognized compensation expense over fair value of shares delivered.

Earnings ReleaseJuly 22, 2014
Page A-20
Earnings per share
in 2Q14 1Q14 2Q13 6M14 6M13
Basic net income/(loss) attributable to shareholders (CHF million)
Income/(loss) from continuing operations (691) 844 1,054 153 2,351
Income/(loss) from discontinued operations, net of tax (9) 15 (9) 6 (3)
Net income/(loss) attributable to shareholders (700) 859 1,045 159 2,348
Preferred securities dividends – (28) (114) (28) (114)
Net income/(loss) attributable to shareholders for basic earnings per share (700) 831 931 131 2,234
Available for common shares (752) 785 852 79 1,918
Available for unvested share-based payment awards 52 46 70 52 164
Available for mandatory convertible securities 1 – – 9 – 152
Diluted net income/(loss) attributable to shareholders (CHF million)
Net income/(loss) attributable to shareholders for basic earnings per share (700) 831 931 131 2,234
Income impact of assumed conversion on contracts that
may be settled in shares or cash 2 – – (17) – (22)
Net income/(loss) attributable to shareholders for diluted earnings per share (700) 831 914 131 2,212
Available for common shares (752) 785 838 79 1,904
Available for unvested share-based payment awards 52 46 67 52 160
Available for mandatory convertible securities 1 – – 9 – 148
Weighted-average shares outstanding (million)
Weighted-average shares outstanding for basic
earnings per share available for common shares 1,625.0 1,621.2 1,574.9 1,623.1 1,464.8
Dilutive contracts that may be settled in shares or cash 3 – – 23.1 – 23.5
Dilutive share options and warrants 0.0 1.4 1.9 0.7 1.9
Dilutive share awards 0.0 5.2 1.5 2.6 1.7
Weighted-average shares outstanding for diluted
earnings per share available for common shares 4 1,625.0 5 1,627.8 1,601.4 1,626.4 1,491.9
Weighted-average shares outstanding for basic/diluted earnings
per share available for unvested share-based payment awards 68.3 95.5 130.0 81.9 126.3
Weighted-average shares outstanding for basic/diluted earnings
per share available for mandatory convertible securities 1 – – 20.4 – 126.1
Basic earnings/(loss) per share available for common shares (CHF)
Basic earnings/(loss) per share from continuing operations (0.45) 0.47 0.55 0.05 1.31
Basic earnings/(loss) per share from discontinued operations (0.01) 0.01 (0.01) 0.00 0.00
Basic earnings/(loss) per share available for common shares (0.46) 0.48 0.54 0.05 1.31
Diluted earnings/(loss) per share available for common shares (CHF)
Diluted earnings/(loss) per share from continuing operations (0.45) 0.47 0.53 0.05 1.28
Diluted earnings/(loss) per share from discontinued operations (0.01) 0.01 (0.01) 0.00 0.00
Diluted earnings/(loss) per share available for common shares (0.46) 0.48 0.52 0.05 1.28
1 Reflects MACCS issued in July 2012 that were mandatorily convertible into shares on March 29, 2013, which shares were settled and delivered on April 8, 2013.2 Reflects changes in the fair value of the PAF2 units which were reflected in the net results of the Group until the awards were finally settled. In 1Q14, the Group restructured the PAF2
awards as due to regulatory changes the capital relief provided by PAF2 awards was no longer available under Basel III. The PAF2 units were converted into other capital eligible compensation instruments and will no longer be settleable in Credit Suisse Group shares.
3 Reflects weighted-average shares outstanding on PAF2 units. In 1Q14, the Group restructured the PAF2 awards as due to regulatory changes the capital relief provided by PAF2 awards was no longer available under Basel III. The PAF2 units were converted into other capital eligible compensation instruments and will no longer be settleable in Credit Suisse Group shares.
4 Weighted-average potential common shares relating to instruments that were not dilutive for the respective periods (and therefore not included in the diluted earnings per share calculation above) but could potentially dilute earnings per share in the future were 8.8 million, 9.1 million, 12.1 million, 8.9 million and 12.9 million for 2Q14, 1Q14, 2Q13, 6M14 and 6M13, respectively.
5 Due to the net loss in 2Q14, 1.3 million weighted-average share options and warrants outstanding and 12.2 million weighted-average share awards outstanding were excluded from the diluted earnings per share calculation, as the effect would be antidilutive.
Earnings ReleaseJuly 22, 2014
Page A-21
Cautionary statement regarding forward-looking information This press release contains statements that constitute forward-looking statements. In addition, in the future we, and others on our behalf, may make statements that constitute forward-looking statements. Such forward-looking statements may include, without limitation, statements relating to the following:p our plans, objectives or goals;p our future economic performance or prospects;p the potential effect on our future performance of certain contingencies; andp assumptions underlying any such statements.
Words such as “believes,” “anticipates,” “expects,” “intends” and “plans” and similar expressions are intended to identify forward-looking statements but are not the exclusive means of identifying such statements. We do not intend to update these forward-looking statements except as may be required by applicable securities laws.
By their very nature, forward-looking statements involve inherent risks and uncertainties, both general and specific, and risks exist that predictions, forecasts, projections and other outcomes described or implied in forward-looking statements will not be achieved. We caution you that a number of important factors could cause results to differ materially from the plans, objectives, expectations, estimates and intentions expressed in such forward-looking statements. These factors include:p the ability to maintain sufficient liquidity and access capital markets;p market and interest rate fluctuations and interest rate levels;p the strength of the global economy in general and the strength of the economies of the countries in which we conduct our operations, in particular
the risk of continued slow economic recovery or downturn in the US or other developed countries in 2014 and beyond;p the direct and indirect impacts of continuing deterioration or slow recovery in residential and commercial real estate markets;p adverse rating actions by agencies in respect of sovereign issuers, structured credit products or other credit-related exposures;p the ability to achieve our objectives, including improved performance, reduced risks, lower costs, and more efficient use of capital;p the ability of counterparties to meet their obligations to us;p the effects of, and changes in, fiscal, monetary, trade and tax policies, and currency fluctuations;p political and social developments, including war, civil unrest or terrorist activity;p the possibility of foreign exchange controls, expropriation, nationalizations or confiscations in countries where we conduct operations;p operational factors such as systems failure, human error, or the failure to implement procedures properly;p actions taken by regulators with respect to our business and practices in one or more of the countries where we conduct operations;p the effects of changes in laws, regulations or accounting policies or practices;p competition in geographic and business areas in which we conduct our operations;p the ability to retain and recruit qualified personnel;p the ability to maintain our reputation and promote our brand;p the ability to increase market share and control expenses;p technological changes;p the timely development and acceptance of our new products and services and the perceived overall value of these products and services by users;p acquisitions, including the ability to integrate businesses successfully, and divestitures, including the ability to sell non-core assets;p the adverse resolution of litigation and other contingencies;p the ability to achieve our cost efficiency goals and cost targets; andp our success at managing the risks involved in the foregoing.
We caution you that the foregoing list of important factors is not exclusive. When evaluating forward-looking statements, you should carefully consider the foregoing factors and other uncertainties and events, including the information set forth in “Risk Factors” in I – Information on the company in our Annual Report 2013.