united states recycling and agriculture long-range ... · recycling and long-range timber outlook...
TRANSCRIPT
Recycling andLong-RangeTimber OutlookBackground Research Report1993 RPA Assessment UpdateUSDA Forest ServicePeter J. Ince
United StatesDepartment ofAgriculture
Forest Service
ForestProductsLaboratory
ResearchPaperFPL–RP–534
115
Abstract
This research report presents an economic analysis of theU.S. and Canadian pulp and paper sector, and addresses theissue of paper recycling and its projected impact on the long-range timber outlook. The report describes the structure,data, and assumptions of a comprehensive economic modeldeveloped to simulate competitive future evolution oftechnology and markets for all products and fiber inputs ofthe U.S. and Canadian pulp and paper sector. The model waslinked by iterative solution to the USDA Forest ServiceTAMM/ATLAS model, which encompasses the lumber andplywood sectors, timber stumpage markets, and timbergrowth and inventory. Thus, results are based on a compre-hensive economic assessment of future trends in paperrecycling and future impacts on timber markets throughoutthe forest and forest product sectors of the United States.Projections extend five decades into the future, to the year2040. The results lead to the conclusion that rapid increaseswill occur in U.S. paper recycling rates in the 1990s,followed by more gradual increases in subsequent decades.Increased recycling will expand fiber supply and extendtimber resources in the United States. Pulpwood prices areprojected to remain relatively stable in the decades ahead,while pulp, paper, and paperboard production in the UnitedStates is projected to increase substantially. The U.S. balanceof trade in pulp, paper, and paperboard commodities isprojected to swing strongly in favor of U.S. exports.
October 1994
Ince, Peter J. 1994. Recycling and long-range timber outlook: backgroundresearch report 1993 RPA Assessment update USDA Forest Service.Res. Pap. FPL–RP–534. Madison, WI: U.S. Department of Agriculture,Forest Service, Forest Products Laboratory. 110 p.
A limited number of free copies of this publication are available to thepublic from the Forest Products Laboratory, One Gifford Pinchot Drive,Madison, WI 53705–2398. Laboratory publications are sent to more than1,000 libraries in the United States and elsewhere.
The Forest Products Laboratory is maintained in cooperation with theUniversity of Wisconsin.
The United States Department of Agriculture (USDA) Forest Service is adiverse organization committed to equal opportunity in employment andprogram delivery. USDA prohibits discrimination on the basis of race, color,national origin, sex, religion, age, disability, political affiliation, and familialstatus. Persons believing they have been discriminated against shouldcontact the Secretary, U.S. Department of Agriculture, Washington, DC20250, or call (202) 720–7327 (voice), or (202) 720–1127 (TTY).
However, contrary to earlier findings based on the 1989 RPAAssessment, results indicate that the United States still facesserious timber supply problems for softwood sawtimberdespite projected increases in recycling rates. National Foresttimber harvest levels are projected to decline to levels muchlower than those predicted in the 1989 Assessment. Otheradjustments since the 1989 Assessment include higherdemand for softwood lumber and plywood in the UnitedStates, lower Canadian lumber production, lower privateindustrial sawtimber harvests in the U.S. West, increasedimports of softwood lumber, and reduced softwood logexports from the Pacific Northwest. The net economicimpact of the adjustments is that softwood sawtimber pricesin the United States are projected to increase substantially inthe future. Consequently, earlier conclusions that increasedrecycling could stabilize softwood sawtimber prices are nolonger warranted.
The NAPAP Model data and projections presented in thisreport were derived from the 3/5/93 NAPAP Model data set,with exogenous timber supply projections from TAMM/ATLAS run LR123. The TAMM/ATLAS projectionspresented in this report were obtained from the draft TAMM/ATLAS run for the 1993 RPA Update, which incorporatedpulpwood projections from the NAPAP Model run datedMarch 5, 1993.
Keywords: RPA, NAPAP, economics, paper
116
Acknowledgments
The author gratefully acknowledges coauthors of the NorthAmerican Pulp And Paper Model (NAPAP Model) and othercontributors, including Dr. Dali Zhang, postdoctoral researchassociate, Department of Foresty, University of Wisconsin–Madison (UW); Romain Jacques, Economist, ForestryCanada, Policy and Economics Directorate (PED), Ottawa;and Professor Joseph Buongiorno, Department of Forestry,UW. This report would not have been possible withoutdevelopment of the NAPAP Model and the work of manycontributors. Dali Zhang and Joseph Buongiorno werechiefly responsible for programming and testing the latestversion of the price-endogenous linear programming system(PELPS III), which was the general modeling system used inthe NAPAP Model. The following persons also contributedsubstantially to development of the model: Don G. Roberts(formerly with PED), who together with the author initiatedresearch that led to development of the NAPAP Model database; Susan Phelps, computer programmer with PED,developed a system for tabulating NAPAP Model input dataand output information; Irene Durbak, Research Forester,USDA Forest Service, Forest Products Laboratory (FPL),obtained U.S. trade data and developed estimates of U.S.import trade functions; Dr. Hsien-Chi Lu (formerly agraduate student at UW–Madison), who developed econo-metric estimates of U.S. demand functions; Ken Skog,Jill Bickelhaupt, and James Howard, FPL, who assisted inestimating the U.S. recovered paper supply functions;Professor Darius Adams, University of Montana (formerly atUniversity of Washington), and Richard Haynes, USDAForest Service, Pacific Northwest Experiment Station,Portland, Oregon, who assisted in estimating the U.S.pulpwood supply functions for the NAPAP Model and madeiterative runs with the TAMM/ATLAS model; H. FredKaiser and David Darr, USDA Forest Service RPA Assess-ment staff in Washington DC, William J. Lange, FPL, andDoug Ketchison and Dave Boulter, PED, who helpedprovide arrangements and funding that facilitated theinternational research effort leading to development of theNAPAP Model; former graduate students at the UW–Madison, J. Keith Gilless (now Professor at the University ofCalifornia–Berkely), who developed the original version ofPELPS), and Patrice Calmels, who helped develop theoriginal microcomputer version of PELPS II. Others whohelped in compiling data, developing estimates, or providingother contributions to the NAPAP Model included graduatestudent Togu Manurung, the UW–Madison; Joanne Alig,Mary Reuter, Dena Luze, Denise Ingram, Dietrich Earnhardt,Catherine Ausloos, Ted King, and John Hagerty, FPL;Barbara Baker, Robert G. Prins, and Harry Jaaskelainen,PED; and Stig Anderson, Forestry Canada, Sault Ste. Marie,Ontario. Special thanks are given to Lloyd Davidson of FPLwho not only compiled U.S. trade data and other informationfor the NAPAP Model, but also helped prepare all the chartsshowing NAPAP Model projections in this report.
Disclaimer
Projections shown in this report are the result of long-rangeeconomic modeling based on supply and demand theory.The projections are intended only to provide a professionalopinion about directional trends of the future. Theprojections should not be viewed as official endorsement ofspecific outcomes or events, and they do not representoutcomes that are certain to occur in the future. Ongoingchanges in markets and technology will certainly renderthese projections obsolete, and reasonable variation in dataand assumptions can lead to a wide range of projected futureoutcomes apart from the projections shown in this report.The data and projections are presented here solely for thepurpose of explaining the assumptions and detailed analysisof paper recycling and long-range timber outlook that wasdeveloped for the Forest Service 1993 RPA AssessmentUpdate.
117
Contents
Page
Emergence of the Issue ................................................ 1Landfill Crisis and Solid Waste
Management Dilemma ....................................... 1Relevance to RPA Assessment ............................... 5Questions Addressed in This Report ...................... 7Previous Studies...................................................... 7
RPA Assessment Studies ............................................. 8Definition of Issue .................................................. 9Objectives of 1993 Update ..................................... 10Methods and Approach ........................................... 10
NAPAP Model ............................................................. 11Development of NAPAP Model ............................. 12Previous Pulp and Paper Sector Models ................. 14Methodology of NAPAP Model ............................. 15Long-range Projections by NAPAP Model ............ 17NAPAP Model Structure and Data Base ................ 18
Regional Structure ............................................. 18Product Categories, Processes, and Base-year Capacity ......................................... 19Process Data ....................................................... 19Pulpwood Supply ............................................... 46Linkage to TAMM/ATLAS Model ................... 48Recovered Paper Supply .................................... 50Maximum Feasible Recovery Constraints ......... 51U.S. and Canadian Domestic Product Demand.............................................. 51Export Demand .................................................. 55U.S. Import Supply ............................................ 58Energy and Labor Input Supply ......................... 58Transportation Costs, Exchange Rates, and Ad-valorum Import Taxes............................... 59Capacity Change, Capital Costs, and Capacity Depreciation Assumptions ............... 60
NAPAP Study Results ............................................ 61Projected Consumption (Demand) for Paper and Paperboard ..................................... 61Projected Production and Technological Trends...................................... 61U.S. Trade Flow Projections .............................. 83Projected Paper Recycling Rates ....................... 83Projected Supply and Price Trends .................... 90Projected Lumber, Plywood, and OSB Production .............................................. 96Projected Timber Trends.................................... 97Projected Employment Trends of Pulp and Paper Sector ............................................. 102
Conclusions ................................................................ 102 Implications of Results .......................................... 102Alternative Scenarios .............................................. 104
References ................................................................... 105Additional Sources of Information .............................. 108Glossary ....................................................................... 109
ii
1
Recycling andLong-RangeTimber OutlookBackground Research Report1993 RPA Assessment UpdateUSDA Forest Service
Peter J. Ince, Research ForesterForest Products Laboratory, Madison, Wisconsin
products in steadily increasing volumes, rising from22 million tonnes annually in 1949 to over 75 million tonnesin 1990 (API 1960–1992). Although some organized meansof trash collection and disposal was provided in industrial-ized countries throughout this period, the approach to wastemanagement evolved. In some instances, waste disposalcreated significant environmental and economic problems.To a greater or lesser extent, depending on degree ofurbanization and waste management techniques, the sameproblems are now recognized throughout the industrializedand commercially developed regions of the world.
Since the mid-1980s, there has been a significant andcontinuous upward shift in paper recycling rates in theUnited States. While paper recycling may be extolled as ameans of conserving forest resources, concern about forestresources is not the real economic reason for the shift inpaper recycling. The shift upward in recycling is primarily aresponse by the paper industry to increased supplies of paperbeing recovered for recycling. Recovery of paper forrecycling has been increased substantially in recent years asa result of widespread expansion of paper collection andsorting programs (e.g., community-based curbside collection,sorting, and office wastepaper collection). Such programsthemselves have been directly or indirectly a response tolong-term environmental, economic, and human healthproblems associated with landfills, waste incineration, andsolid waste management. In economic terms, the expansionof collection and sorting programs has led to cheaper andmore abundant supplies of recovered paper, and this marketphenomenon has provided the economic incentive forindustrial expansion of paper recycling. Thus, while paperrecycling technology and concern about forest resources havecoexisted in North America for many decades, the landfillcrisis and solid waste management dilemma actually precipi-tated the departure from historical trends in paper recycling.
Emergence of the IssueThe issue of recycling and long-range timber outlook hastwo basic elements. First, the issue concerns paper recy-cling—specifically, what is the future of paper recycling?Second, the issue concerns the use and adequacy of forestresources— what is the future of supply and demand forvirgin timber and recycled wood fiber resources in NorthAmerica? Assuming that competitive markets will determinethe allocation of resources in North America, the twoelements merge into a single economic issue: what will bethe market allocation of resources in the forest productssector in the future, considering both the short-run allocationof wood and fiber resources and the long-run allocation oftechnological and capital resources? Although this issue issingular when framed in the context of resource economics,it is necessary to note how both elements of the issue haveemerged separately in recent years as a result of theirsignificant externalities and potential government policydimensions. Government policies designed for broader socialbenefits in the 1990s, related to recycling and use of forestresources, could alter the allocation of resources that wouldotherwise be obtained optimally only among market partici-pants. Thus, potential for change in government policies isan important part of the issue.
Landfill Crisis and Solid WasteManagement Dilemma
In industrialized countries of North America, Europe, andEast Asia, the latter half of the 20th century has beencharacterized by sustained economic growth, rapid expan-sion of consumer goods markets, and increased urbanization.In the United States for example, a growing and moreurbanized economy has consumed paper and paperboard

2
In North America, particularly the United States and Canada,the approach to municipal solid waste (MSW) disposalfollowed an evolutionary path that gradually led to thecurrent landfill crisis and solid waste management dilemma.Several decades ago, it was not uncommon for trash to bediscarded in local “dumps.” Dumps were usually in rural orremote locations, often managed rather minimally by localgovernments. Trash would be dumped and commonlyburned at such sites. In some locations, trash was also usedas a fill material for landscaping or land recovery projects.In part in response to growing concerns about air qualityassociated with open incineration and nuisance concernsassociated with open dumps, the practice of landfillingbecame increasingly the more common approach (buryingtrash in layers, with intervening layers of soil). It has beenestimated that throughout the 1960s and 1970s, roughly90 percent of MSW generated in the United States waslandfilled (Franklin Associates 1988). By the early 1970s,approximately 300 to 400 new municipal landfills werebeing built in the United States each year ((NSWMA 1992).However, as environmental, economic, and human healthproblems associated with landfilling became more widelyappreciated, installation of new landfills declined dramati-cally to less than half their previous number by the late1980s (NSWMA 1992).
In 1978, approximately 20,000 MSW landfills were operat-ing in the United States, but more than 14,000 were closed insubsequent years due to environmental risks, operating costs,or limits on capacity. By 1990, only about 6,000 MSWlandfills were in operation (Denison and Ruston 1990).More than half of the United States are now projected tohave less than 10 years of remaining landfill capacity(NSWMA 1992). In the meantime, trash volumes haveincreased to 178 million tonnes per year in the United States(EPA 1992), roughly doubling over a 30-year period(NSWMA 1992).
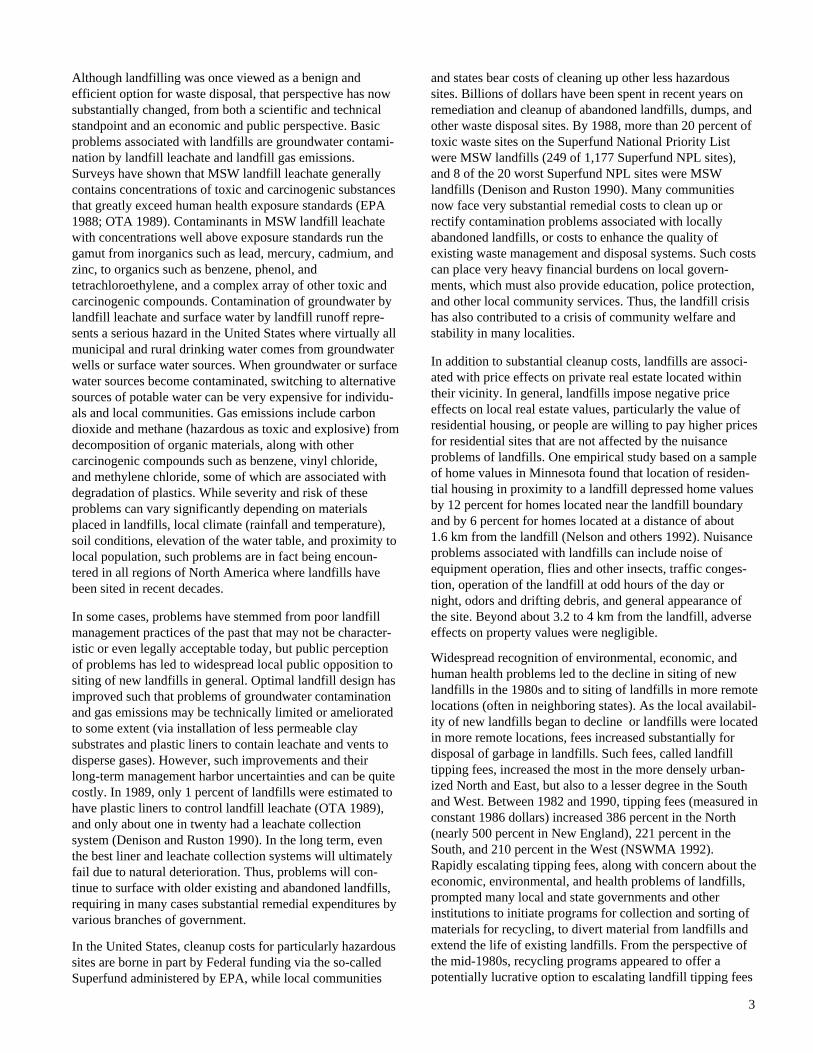
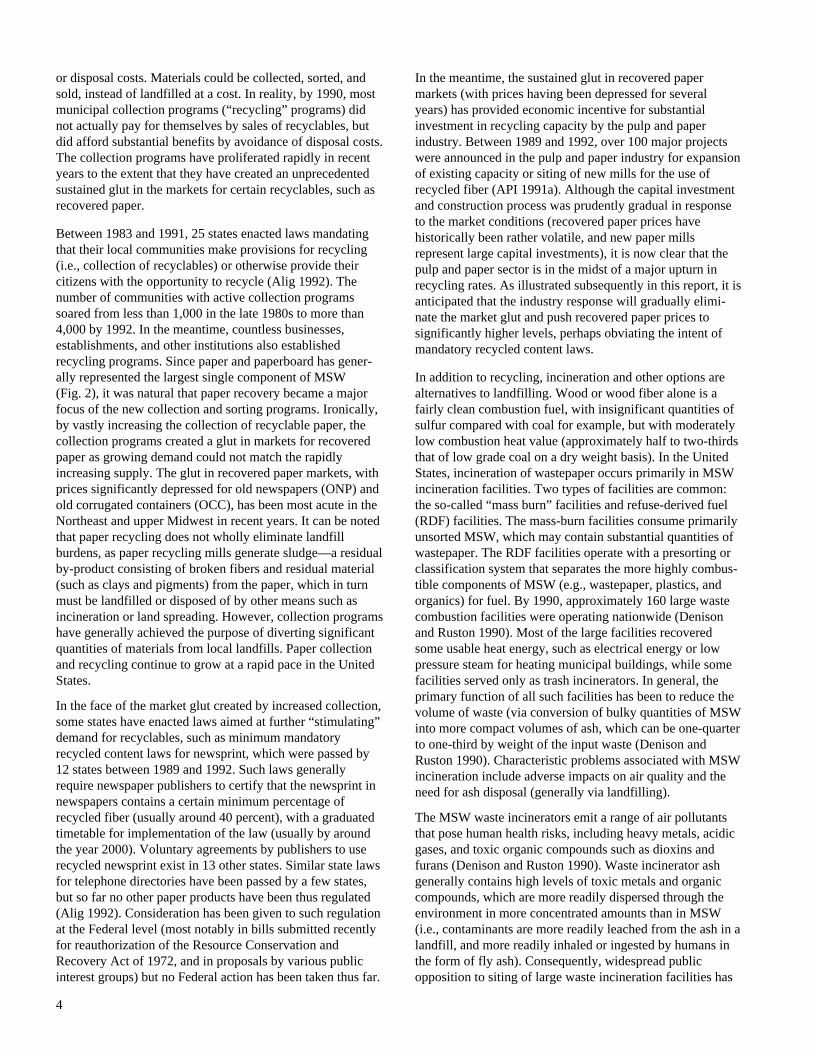
The volumes of MSW generated in the United States havebeen projected to increase substantially in the years ahead(Fig. 1). A recent report by the U.S. Environmental Protec-tion Agency (EPA) projected that the amount of MSWgenerated will reach 202 million metric tonnes by the year2000, without additional source reduction (EPA 1992). Itwas estimated that in 1990, 37.5 percent (by weight) of allMSW generated in the United States was paper and paper-board (Fig. 2). Paper and paperboard is by far the largestsingle component of MSW. These circumstances led to thepresent solid waste management dilemma: what to do aboutincreasing volumes of garbage, including substantialvolumes of wastepaper, against a backdrop of limited landfillspace and availability.
Current systems for MSW disposal in the United States arebased on three principal approaches: landfilling, recycling,and incineration. While waste volumes have increased,recycling and incineration have increased proportionatelyfaster than landfilling in recent years. In 1992, the EPA
Figure 1—Historical and projected trends in wastematerials generated annually in MSW(Source: EPA 1992).
Figure 2—Estimated proportions of materials generatedin MSW, 1990 (Source: EPA 1992).
estimated that 17 percent of MSW was recovered forrecycling or composting, 16 percent was incinerated, and67 percent was landfilled or otherwise disposed of (EPA1992). The percentages vary by type of waste material (e.g.,higher proportions of wastepaper are recycled—roughly one-third). Landfilling remains the primary disposal mechanismdespite the fact that landfill space and availability aredeclining. Recognizing environmental, economic, andhuman health problems associated with each option, the EPArecommended a hierarchy for evaluating components ofintegrated waste management programs. The EPA hierarchyplaced source reduction (simply reducing consumption anddisposal of materials) at the top of the hierarchy along withrecycling (including composting), while waste combustionand landfilling were placed lower in the hierarchy (EPA1989). To understand this hierarchy and potential policychoices, it is necessary to understand the root environmental,economic, and human health problems associated with eachdisposal option.
Was
te (
x10
6t)
Year1960 1970 1980 1988 2000 2010
0
Paper Glass/Metal Food/YardOther Plastics
50
100
150
200
250
Total Weight =
Metals8%
Glass7%
Paper & Paperboard37%
Yard Wastes18%
Wood6%
Food Wastes7%
Other8%
Plastics8%
178 x 10 t6
3
Although landfilling was once viewed as a benign andefficient option for waste disposal, that perspective has nowsubstantially changed, from both a scientific and technicalstandpoint and an economic and public perspective. Basicproblems associated with landfills are groundwater contami-nation by landfill leachate and landfill gas emissions.Surveys have shown that MSW landfill leachate generallycontains concentrations of toxic and carcinogenic substancesthat greatly exceed human health exposure standards (EPA1988; OTA 1989). Contaminants in MSW landfill leachatewith concentrations well above exposure standards run thegamut from inorganics such as lead, mercury, cadmium, andzinc, to organics such as benzene, phenol, andtetrachloroethylene, and a complex array of other toxic andcarcinogenic compounds. Contamination of groundwater bylandfill leachate and surface water by landfill runoff repre-sents a serious hazard in the United States where virtually allmunicipal and rural drinking water comes from groundwaterwells or surface water sources. When groundwater or surfacewater sources become contaminated, switching to alternativesources of potable water can be very expensive for individu-als and local communities. Gas emissions include carbondioxide and methane (hazardous as toxic and explosive) fromdecomposition of organic materials, along with othercarcinogenic compounds such as benzene, vinyl chloride,and methylene chloride, some of which are associated withdegradation of plastics. While severity and risk of theseproblems can vary significantly depending on materialsplaced in landfills, local climate (rainfall and temperature),soil conditions, elevation of the water table, and proximity tolocal population, such problems are in fact being encoun-tered in all regions of North America where landfills havebeen sited in recent decades.
In some cases, problems have stemmed from poor landfillmanagement practices of the past that may not be character-istic or even legally acceptable today, but public perceptionof problems has led to widespread local public opposition tositing of new landfills in general. Optimal landfill design hasimproved such that problems of groundwater contaminationand gas emissions may be technically limited or amelioratedto some extent (via installation of less permeable claysubstrates and plastic liners to contain leachate and vents todisperse gases). However, such improvements and theirlong-term management harbor uncertainties and can be quitecostly. In 1989, only 1 percent of landfills were estimated tohave plastic liners to control landfill leachate (OTA 1989),and only about one in twenty had a leachate collectionsystem (Denison and Ruston 1990). In the long term, eventhe best liner and leachate collection systems will ultimatelyfail due to natural deterioration. Thus, problems will con-tinue to surface with older existing and abandoned landfills,requiring in many cases substantial remedial expenditures byvarious branches of government.
In the United States, cleanup costs for particularly hazardoussites are borne in part by Federal funding via the so-calledSuperfund administered by EPA, while local communities
and states bear costs of cleaning up other less hazardoussites. Billions of dollars have been spent in recent years onremediation and cleanup of abandoned landfills, dumps, andother waste disposal sites. By 1988, more than 20 percent oftoxic waste sites on the Superfund National Priority Listwere MSW landfills (249 of 1,177 Superfund NPL sites),and 8 of the 20 worst Superfund NPL sites were MSWlandfills (Denison and Ruston 1990). Many communitiesnow face very substantial remedial costs to clean up orrectify contamination problems associated with locallyabandoned landfills, or costs to enhance the quality ofexisting waste management and disposal systems. Such costscan place very heavy financial burdens on local govern-ments, which must also provide education, police protection,and other local community services. Thus, the landfill crisishas also contributed to a crisis of community welfare andstability in many localities.
In addition to substantial cleanup costs, landfills are associ-ated with price effects on private real estate located withintheir vicinity. In general, landfills impose negative priceeffects on local real estate values, particularly the value ofresidential housing, or people are willing to pay higher pricesfor residential sites that are not affected by the nuisanceproblems of landfills. One empirical study based on a sampleof home values in Minnesota found that location of residen-tial housing in proximity to a landfill depressed home valuesby 12 percent for homes located near the landfill boundaryand by 6 percent for homes located at a distance of about1.6 km from the landfill (Nelson and others 1992). Nuisanceproblems associated with landfills can include noise ofequipment operation, flies and other insects, traffic conges-tion, operation of the landfill at odd hours of the day ornight, odors and drifting debris, and general appearance ofthe site. Beyond about 3.2 to 4 km from the landfill, adverseeffects on property values were negligible.
Widespread recognition of environmental, economic, andhuman health problems led to the decline in siting of newlandfills in the 1980s and to siting of landfills in more remotelocations (often in neighboring states). As the local availabil-ity of new landfills began to decline or landfills were locatedin more remote locations, fees increased substantially fordisposal of garbage in landfills. Such fees, called landfilltipping fees, increased the most in the more densely urban-ized North and East, but also to a lesser degree in the Southand West. Between 1982 and 1990, tipping fees (measured inconstant 1986 dollars) increased 386 percent in the North(nearly 500 percent in New England), 221 percent in theSouth, and 210 percent in the West (NSWMA 1992).Rapidly escalating tipping fees, along with concern about theeconomic, environmental, and health problems of landfills,prompted many local and state governments and otherinstitutions to initiate programs for collection and sorting ofmaterials for recycling, to divert material from landfills andextend the life of existing landfills. From the perspective ofthe mid-1980s, recycling programs appeared to offer apotentially lucrative option to escalating landfill tipping fees
4
or disposal costs. Materials could be collected, sorted, andsold, instead of landfilled at a cost. In reality, by 1990, mostmunicipal collection programs (“recycling” programs) didnot actually pay for themselves by sales of recyclables, butdid afford substantial benefits by avoidance of disposal costs.The collection programs have proliferated rapidly in recentyears to the extent that they have created an unprecedentedsustained glut in the markets for certain recyclables, such asrecovered paper.
Between 1983 and 1991, 25 states enacted laws mandatingthat their local communities make provisions for recycling(i.e., collection of recyclables) or otherwise provide theircitizens with the opportunity to recycle (Alig 1992). Thenumber of communities with active collection programssoared from less than 1,000 in the late 1980s to more than4,000 by 1992. In the meantime, countless businesses,establishments, and other institutions also establishedrecycling programs. Since paper and paperboard has gener-ally represented the largest single component of MSW(Fig. 2), it was natural that paper recovery became a majorfocus of the new collection and sorting programs. Ironically,by vastly increasing the collection of recyclable paper, thecollection programs created a glut in markets for recoveredpaper as growing demand could not match the rapidlyincreasing supply. The glut in recovered paper markets, withprices significantly depressed for old newspapers (ONP) andold corrugated containers (OCC), has been most acute in theNortheast and upper Midwest in recent years. It can be notedthat paper recycling does not wholly eliminate landfillburdens, as paper recycling mills generate sludge—a residualby-product consisting of broken fibers and residual material(such as clays and pigments) from the paper, which in turnmust be landfilled or disposed of by other means such asincineration or land spreading. However, collection programshave generally achieved the purpose of diverting significantquantities of materials from local landfills. Paper collectionand recycling continue to grow at a rapid pace in the UnitedStates.
In the face of the market glut created by increased collection,some states have enacted laws aimed at further “stimulating”demand for recyclables, such as minimum mandatoryrecycled content laws for newsprint, which were passed by12 states between 1989 and 1992. Such laws generallyrequire newspaper publishers to certify that the newsprint innewspapers contains a certain minimum percentage ofrecycled fiber (usually around 40 percent), with a graduatedtimetable for implementation of the law (usually by aroundthe year 2000). Voluntary agreements by publishers to userecycled newsprint exist in 13 other states. Similar state lawsfor telephone directories have been passed by a few states,but so far no other paper products have been thus regulated(Alig 1992). Consideration has been given to such regulationat the Federal level (most notably in bills submitted recentlyfor reauthorization of the Resource Conservation andRecovery Act of 1972, and in proposals by various publicinterest groups) but no Federal action has been taken thus far.
In the meantime, the sustained glut in recovered papermarkets (with prices having been depressed for severalyears) has provided economic incentive for substantialinvestment in recycling capacity by the pulp and paperindustry. Between 1989 and 1992, over 100 major projectswere announced in the pulp and paper industry for expansionof existing capacity or siting of new mills for the use ofrecycled fiber (API 1991a). Although the capital investmentand construction process was prudently gradual in responseto the market conditions (recovered paper prices havehistorically been rather volatile, and new paper millsrepresent large capital investments), it is now clear that thepulp and paper sector is in the midst of a major upturn inrecycling rates. As illustrated subsequently in this report, it isanticipated that the industry response will gradually elimi-nate the market glut and push recovered paper prices tosignificantly higher levels, perhaps obviating the intent ofmandatory recycled content laws.
In addition to recycling, incineration and other options arealternatives to landfilling. Wood or wood fiber alone is afairly clean combustion fuel, with insignificant quantities ofsulfur compared with coal for example, but with moderatelylow combustion heat value (approximately half to two-thirdsthat of low grade coal on a dry weight basis). In the UnitedStates, incineration of wastepaper occurs primarily in MSWincineration facilities. Two types of facilities are common:the so-called “mass burn” facilities and refuse-derived fuel(RDF) facilities. The mass-burn facilities consume primarilyunsorted MSW, which may contain substantial quantities ofwastepaper. The RDF facilities operate with a presorting orclassification system that separates the more highly combus-tible components of MSW (e.g., wastepaper, plastics, andorganics) for fuel. By 1990, approximately 160 large wastecombustion facilities were operating nationwide (Denisonand Ruston 1990). Most of the large facilities recoveredsome usable heat energy, such as electrical energy or lowpressure steam for heating municipal buildings, while somefacilities served only as trash incinerators. In general, theprimary function of all such facilities has been to reduce thevolume of waste (via conversion of bulky quantities of MSWinto more compact volumes of ash, which can be one-quarterto one-third by weight of the input waste (Denison andRuston 1990). Characteristic problems associated with MSWincineration include adverse impacts on air quality and theneed for ash disposal (generally via landfilling).
The MSW waste incinerators emit a range of air pollutantsthat pose human health risks, including heavy metals, acidicgases, and toxic organic compounds such as dioxins andfurans (Denison and Ruston 1990). Waste incinerator ashgenerally contains high levels of toxic metals and organiccompounds, which are more readily dispersed through theenvironment in more concentrated amounts than in MSW(i.e., contaminants are more readily leached from the ash in alandfill, and more readily inhaled or ingested by humans inthe form of fly ash). Consequently, widespread publicopposition to siting of large waste incineration facilities has

5
appeared, akin to public oppostion to siting of new landfills.Depending on the type of waste material being incineratedand the type of combustion process, the capital cost ofensuring compliance with air quality standards can be veryhigh; devices such as flue gas scrubbers, precipitators, andbaghouses are required to reduce air emissions and fly ashparticulates. Such equipment requirements lead to significanteconomies of scale, where only very large facilities areeconomical. Such facilities generally require enormouscapital investments, generally in the range of hundreds ofmillions of dollars each (Denison and Ruston 1990). Theprimary source of revenue at MSW incineration facilities arepayments received for accepting garbage (tipping feerevenues), while revenues from sale of energy generallycover only a small fraction of costs. A higher degree of fuelpresorting can help remove the more hazardous materialsprior to combustion, but sorting can be costly and mayapproach the cost of sorting required for recycling. Thus,waste incineration can remain economical in the future onlyto the extent that MSW or RDF have low or negative values(i.e., if payment is received for accepting such materials). Ifprices for sorted recovered paper increase substantially in thefuture, use of recovered paper as fuel may become highlyuneconomical. However, use of certain categories ofnonrecyclable wastepaper (i.e., wastepaper that has no highervalue because of contaminants, low fiber quality, etc.) mayremain a viable option. This report includes projections ofrecovered paper prices and further discussion of the eco-nomic potential for wastepaper incineration versus recycling.
Composting and various other uses are other alternatives tolandfilling and conventional paper recycling. In manycommunities, MSW or sorted organic material from MSW iscomposted, producing a relatively inert soil amendment ormulching material. Composting can be applied to waste-paper. The MSW is composted most efficiently incomposting facilities, which commonly feature a largecomposting vessel or digester that can reduce organicmaterial to acceptable compost in a matter of weeks or days.An economic drawback to the composting option forwastepaper is the relatively low potential value of the endproduct, at most having the value of a gardening soil ormulching material. As with incineration, composting willremain economically viable only as long as the input wastematerials have little or no value, or if payment is received foraccepting such materials. To the extent that prices forrecovered paper increase in the future with increasedrecycling, only the disposal of low-value nonrecyclablewastepaper via composting will remain economical. Otherutilization options that have been applied commercially towastepaper include cellulose insulation, molded pulpproducts, animal bedding, paper mulch, packaging cushion-ing material, and wallboard panels (API 1991b). Actual useof recovered paper for molded pulp products (egg cartons,containers), cellulose insulation, and other uses is estimatedto have nearly doubled between 1986 and 1991, but the totalquantity is still estimated to be only around 1 million metric
tonnes per year. Generally, such products have low value,either because the recovered paper is used as a substitute forlow-value materials (e.g., animal bedding straw, gardenmulch) or it competes against materials with better-perceivedproduct performance (e.g., insulating materials such as foamor fiber glass, or plastics used in lightweight containers). Oneexample of an exception to this rule is composite plaster-board wall panels, introduced recently as a substitute forconventional gypsum wallboard. The new panels are acomposite of recycled fiber (from old newspapers) andgypsum, and are reputed to have advantages of lighter weightand better nail-holding performance. Thus, recycling paperinto higher value composite products might represent aneconomically viable alternative for use of recovered paper,even if recovered paper prices increase in the future.
In summary, to understand the issue of recycling and thelong-range timber market outlook, it is essential to under-stand the landfill crisis and solid waste managementdilemma. Management of solid waste is a growing concernof industrialized nations throughout the world. In the UnitedStates, the concern is manifested by efforts to find alterna-tives to landfilling as the principal means of waste disposaland to extend the life of existing landfills. Concern isprompted by serious environmental, economic, and humanhealth problems associated with landfills, principallygroundwater contamination and gas emissions, and their highremedial costs. Awareness of problems has led to a signifi-cant decline in siting of new landfills, shortages of locallandfill capacity, and escalating landfill tipping fees.Principal alternatives to landfilling include source reduction,sorting and collection of material for recycling, wasteincineration, and composting. Preferred options, according toEPA, include source reduction, recycling, and composting.Landfilling and incineration are least preferred. Each optionhas its drawbacks. Collection and sorting for recycling facechallenges due to the glut in markets for recyclables, createdironically by increased collection and sorting nationwide.Incineration faces environmental and economic problemsassociated primarily with air emissions and ash disposal, andeconomics may limit the competitiveness of waste-to-energyversus recycling if the value of recovered paper increases inthe years ahead. Likewise, composting produces a productwith relatively low value. Potential exists for strongergovernment policies related to waste reduction, recycling,and increased collection of materials for recycling. Thisanalysis may provide the basis for examining potentialimpacts of such policies in the context of projected evolutionof markets and technology.
Relevance to RPA Assessment
The Forest and Rangeland Renewable Resources PlanningAct of 1974 (RPA), the National Forest Management Act of1976 (NFMA), and the Forest and Rangeland RenewableResources Research Act of 1978 require the USDA Forest

6
Service to develop comprehensive long-range assessments ofsupply and demand for timber and other forest resources inthe United States. A new RPA Assessment report is providedevery 10 years, with interim updates every 5 years. Thedecennial Assessment reports and their interim updatesinclude detailed analyses of the prospective timber supplyand demand situation in the United States. The reportsinclude long-range projections of timber market trends(regional supply, demand, and prices), forest productdemand, domestic production, and technological changes inmajor forest product sectors of the U.S. economy (includingthe pulp and paper sector). The RPA Assessment reportshave been prepared since the 1970s. The timber analysiscomponent of the RPA Assessment follows a much longertradition of Federal timber outlook studies, dating back to thelate 19th century (for bibliography of such studies, see thepreface to Forest Resource Report 23, USDA Forest Service,1982). The most recent RPA Assessment report was com-pleted in 1989 (USDA Forest Service 1989a), accompaniedby publication of a more detailed long-range analysis of thetimber situation in the United States (Haynes 1990). Thenext scheduled report is the 1993 RPA Assessment Update,which will assess key forest resource issues that havesurfaced in recent years. The RPA Assessment and interimupdates provide a factual and analytical basis for the RPAProgram of the Forest Service, a program of recommendedagency activities that is revised and submitted to Congressevery 5 years under the provisions of RPA. Forestryprofessionals in both the public and private sectors alsofrequently use the long-range RPA timber analysis andprojections as benchmarks for discussion of forest policyand timber supply and demand issues.
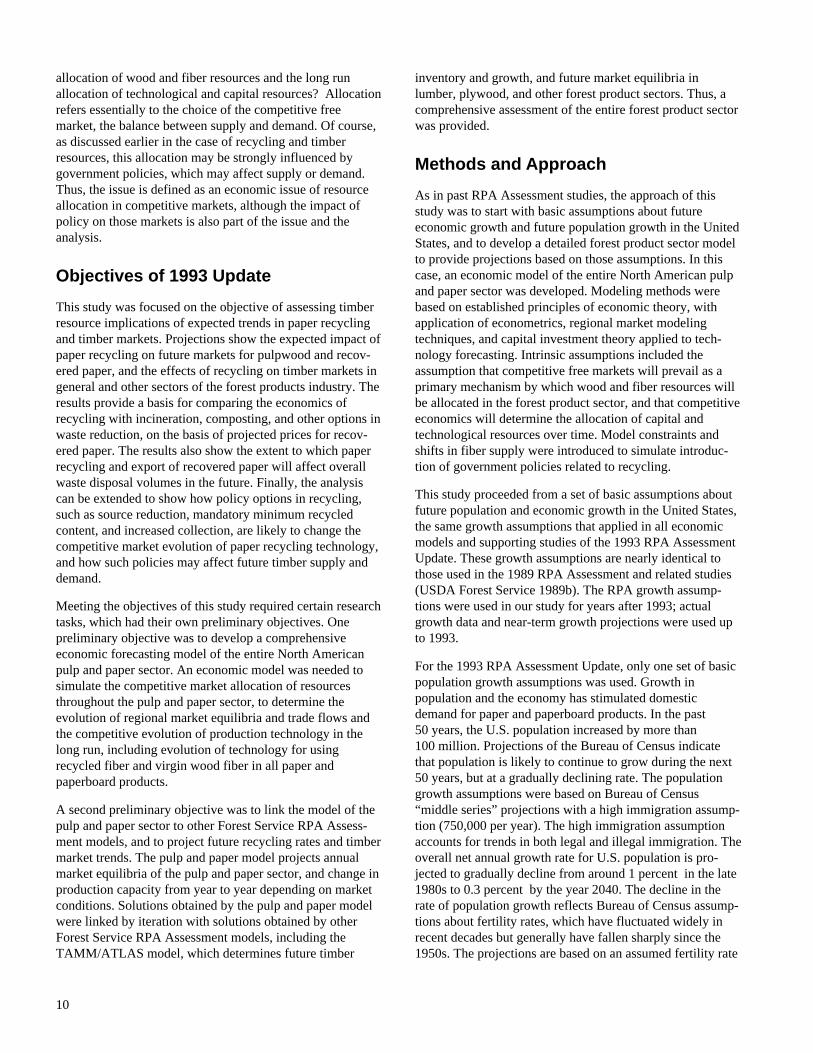
Looking at data and projections from the most recent timberanalysis (Haynes 1990), it is apparent that demand for timberhas grown substantially in recent decades and is expected togrow substantially in the future. Figure 3 shows historicaldata on timber consumption in the United States by timberproduct category since 1952, along with 1989 RPA Baseprojections to the year 2040. The pulpwood share of totaltimber consumption has grown in recent decades, and hasbeen projected to grow substantially in the decades ahead.However, the 1989 RPA Base projections assumed a veryconservative trend in paper recycling rates. Figure 4 showshistorical data on timber demand from U.S. forest lands, withimports and exports, along with 1989 RPA Base projectionsto the year 2040. Of approximately 500 million m3 ofcommercial timber supplied annually from timberland in thelate 1980s, approximately one-fourth was pulpwood supplieddirectly to pulp mills. In addition, by the late 1980s, timbercoming directly from the forest represented only about60 percent of pulpwood input to pulp mills; around40 percent of pulpwood was obtained indirectly as woodresidues (wood chips) from sawmills and veneer mills.Therefore, total pulpwood consumption, including timberharvest and mill residues, amounted to over 200 million m3
annually by the late 1980s, or over 40 percent of the timber
Figure 3—U.S. roundwood consumption, specifiedyears 1952–1986, with 1989 RPA Base projectionsof demand to 2040.
Figure 4—U.S. timber demand, specified years1952–1986, with 1989 RPA Base projections ofdemand to 2040.
supplied from U.S. timberlands. In the 1989 RPA Base case,this percentage was projected to grow to over 50 percent inthe decades ahead. Thus, in the 1989 RPA Assessmentreport, projected growth in pulpwood consumption was amajor element in projections of substantially increasedtimber consumption in the United States.
Although net annual growth and inventory of timber growingstock have been steadily increasing in recent decades, andalthough timber supply is expected to increase in the future,the 1989 RPA Assessment Base projections showed thatoverall growth in timber demand would generally exceedgrowth in timber supply. This resulted in projected increasesin timber prices, particularly increases in softwood timberstumpage prices in the U.S. West and U.S. South (Haynes1990). This general assessment of the future, that timberprices would increase substantially over the long term, wasnot dissimilar to conclusions of other recent timber analysis
Year
19521962
19701976
19861990
20002010
20202030
20400
200
400
600
800
1000Sawlogs Veneer logs PulpwoodMisc. products Fuelwood
Rou
ndw
ood
(x10
m )
6
3
Year19521962197019761986199020002010202020302040
0
200
400
600
800
1000
Tim
ber
(x10
m )
6
3Exports Imports Demand on Forest Land

7
studies (e.g., USDA Forest Service 1982, 1988). Further-more, forest policy developments of the past few yearsrelated to mandatory preservation of habitat for endangeredspecies (most notably actions taken on Federal lands in thePacific Northwest to preserve old-growth forest habitat forthe Northern spotted owl, effectively constraining timbersupply) have given greater weight to a conclusion that timberprices will rise substantially in the future. Adding futureconstraints on timber supply, such as preservation of old-growth forests, resulted in greater timber scarcity and evenhigher projected timber price trends when extrapolated fromthe 1989 RPA Assessment Base (see Schallau and Goetzl1992). However, such conclusions were based on a timbersupply and demand scenario that assumed very low futurepaper recycling rates. The 1989 RPA Base, for example,assumed no increase in paper recycling rates nationwidebetween the years 1986 and 2000, and only very smallincreases thereafter. In reality, the United States in the shortperiod since the mid-1980s has experienced the most dra-matic increase in paper recycling rates since World War II.
Questions Addressed in This Report
The methodology and analysis presented in this report weredesigned to address specific questions related to the issue ofrecycling and the long-range timber outlook. As we havestated, the fundamental question was what will be the marketallocation of resources in the forest products sector in thefuture, considering both the short-run allocation of wood andfiber resources and the long-run allocation of technologicaland capital resources? To answer that question, the method-ology and analysis answered the following questions: whatwill be the likely competitive evolution of technology in thepulp and paper sector of North America, consideringsimultaneously the evolution of product demand and trade,pulpwood markets, and recovered paper markets, and whatwill be the future competititve evolution of paper recyclingin North America? With linkage to a comprehensive eco-nomic model of timber growth, inventory, and the solid-wood product sector (i.e., the Forest Service TAMM/ATLASmodel, which includes lumber and plywood sectors), theanalysis also answered the question of what will be the likelytrends in sawtimber markets, lumber production, plywoodproduction, timber harvest, and timber inventory levels in theUnited States.
In addition, the analysis looked at the overall question ofwhether projected trends present an “acceptable” or “im-paired” future, in terms of resource conditions and resourceuse. Thus, the analysis provided specific answers to thefollowing policy-related questions (discussed in the Conclu-sions):
• Will increased paper recycling extend timber resources?
• Will paper recycling eliminate future U.S. timber supplyproblems?
• What aspects of the future timber supply and demandsituation will remain problematic?
• What are the implications for forest management?
• Will increased paper recovery (for recycling and export)either eliminate or reduce the disposal burden associatedwith wastepaper?
• Will paper recycling be offset by alternative disposaloptions such as wastepaper incineration?
• Will increased recycling and economic growth in thepulp and paper sector contribute to increased regionalemployment in pulp and paper mills or to a betterbalance of trade?
• What are the implications for forestry research and forestproducts research, associated with projected trends inrecycling and timber markets?
• Considering paper recycling and policy options, whatalternative future scenarios are possible, and how wouldpolicy changes affect the projected trends?
Previous StudiesMuch public attention has been brought to bear in recentyears on the separate issues of waste management and thelong-range timber market outlook, but most publishedstudies have not focused on their relationship as a singleissue. Studies focused primarily on solid waste managementhave been sponsored by state and local governments, Federalagencies, and environmental public interest groups. Studiesfocused more narrowly on paper recycling have beensponsored by the pulp and paper industry, states, andconsultants or advisors to policymakers at the Federal level.Studies focused on timber issues have been sponsored morecommonly by the forest products industry, USDA ForestService, and various public interest groups. Few studies havesynthesized trends in recycling and long-range timbermarkets (or recycling and long-range materials policy ingeneral).
Recycling has become a top issue on state legislativeagendas because of public concern over problems such assolid waste management and environmental pollution, and toa lesser extent energy conservation and resource manage-ment. The National Conference of State Legislatures, forexample, sponsored a report that examined different ap-proaches to developing recycling markets and industries(Thurner and Ashley 1990). The report noted that in recentyears state recycling efforts have encouraged the collectionof recyclable materials, but have largely ignored the marketdemand for such materials; consequently, state efforts havenot always been successful and have sometimes producedgluts of recyclable materials. Likewise, the United States

8
Conference of Mayors has focused primarily on resourcerecovery and options to landfilling, sponsoring work such asan annual report on the status of energy and materialsrecovery facilities in the United States (see National Re-source Recovery Association 1990). Similar data on wastecombustion facilities are also compiled (but not published)by the U.S. Department of Energy. Public interest groups,such as the Environmental Defense Fund, have sponsored in-depth studies that evaluate economic and environmentalaspects of choices that must be made by state and localgovernments in developing recycling programs and wasteincineration facilities (Denison and Ruston 1990). Inaddition, Federal agencies such as the EPA and the Office ofTechnology Assessment have sponsored major studies thathave provided substantial data on the status of waste man-agement and waste materials generated in the United States(see, for example, EPA 1988, 1989, 1990; OTA 1989). Ingeneral, such studies have provided useful information aboutthe current landfill crisis and solid waste managementdilemma. However, such studies generally have not exam-ined future consequences or expected outcomes of thecurrent dilemma from a national perspective. Thus, the focusof most broad studies has been on the dimension andcharacter of waste management problems from a staticperspective, rather than on dynamic factors, such as thelikely evolution of competitive markets or technology inresponse to the solid waste management dilemma.
On the other hand, studies focused more narrowly on paperrecycling have generally emphasized the dynamic characterof markets or the development of recycling as a marketresponse to the solid waste management dilemma. Perhapsthe classic example is the 1982 report for the Solid WasteCouncil of the Paper Industry (Franklin and others 1982).This study heavily relied on historical industry data from theAmerican Paper Institute (API). It discussed in great detailthe historical evolution of paper recycling, recovered paperexports, and other uses of wastepaper such as energyrecovery. Among the conclusions were the predictions thatrecovery and utilization rates would likely increase faster inthe 1980s and 1990s than they did in the 1970s, that waste-to-energy facilities would expand with increased collectionprograms in response to emerging solid waste problems, andthat increased utilization could eventually have significantimpacts on prices for recovered paper if supply limits werereached. A similarly detailed study, describing current trendsand the outlook for newspaper recycling, was recentlyprepared for the Canadian government (Hatch Associates1989). In 1990, the API sponsored a study by FranklinAssociates to develop projections of paper recycling levels tothe year 1995 (Franklin Associates 1990). This reportprovided the basis for a view that recyclable paper recoveryrates would reach 40 percent by 1995. Subsequently, theAPI announced their national goal of 40 percent paperrecovery for recycling by 1995. A more recent study byFranklin Associates examined supply and demand for officewastepaper, with projections to 1995 (Franklin Associates
1991). The report was sponsored by the National OfficePaper Recycling Project, managed by the United StatesConference of Mayors with principal support from a numberof leading paper companies. The report concluded that bothrecovery and demand for office wastepaper were likely tomore than double between 1990 and 1995. Among variousmulti-client studies of recycling trends are those of ResourceInformation Systems, Inc., which have projected that paperrecycling will continue to expand in the 1990s, and thatpaper recovery rates in the United States are likely to exceedthe 1995 industry goal of 40 percent and reach a level of55 percent by the year 2005 (Young 1991).
Despite rapid acceleration in paper recycling rates andgrowing concerns about the adequacy of timber resources,few studies have sought to synthesize projections of paperrecycling and timber markets. This is not unexpected giventhat trends in recycling have emerged from the landfill crisisand solid waste management dilemma rather than fromconcern about future adequacy of forest resources. However,given public awareness that paper recycling can extend forestresources, and awareness that timber resource adequacy isrelated to preservation issues, it is surprising that the twoelements have not been linked in past studies. Awareness ofbroader dimensions of recycling policies related to materialswas reflected clearly in a report by William Kovacs, formerChief Counsel, U.S. House of Representatives, Subcommit-tee on Transportation and Commerce, describing the history,challenges, and opportunities of solid waste management andrecycling (Kovacs 1988). The title of this report, “TheComing Era of Conservation and Industrial Utilization ofRecyclable Materials,” as well as its contents, certainlyreflected awareness that the nation stood on the brink of anew era in materials policy. However, although the Kovacsreport became a landmark for discussion of recycling policyoptions, it is noteworthy that the report did not actuallyexamine broad consequences of new recycling policies,except by pointing to the likelihood that such policies couldsubstantially alter waste disposal and recycling patterns inthe United States. For example, little consideration wasgiven to the question of how increased paper recycling orincreased incineration would affect the future of forestry orforest product markets in the United States. It is preciselythat analysis of the forestry and forest product marketimplications of recycling that this study provides, thusincreasing the understanding of how new recycling policieswill affect society on a broader level.
RPA Assessment StudiesVarious approaches lend themselves to analysis of long-range issues in resource economics and agricultural econom-ics. In recent decades, techniques have evolved frominvestigation of temporal resource conditions and simpletrend extrapolation toward development of more sophisti-cated mathematical or computer models that simulate

9
dynamic responses or behavioral adjustments over time.Recent experiences in resource economics have providedimportant lessons on application of modeling techniques. Forexample, gloomy forecasts of energy shortages in the early1970s and optimistic forecasts of agricultural commodityexport demands in the late 1970s both proved to be incorrectby the 1980s, for similar reasons. In both cases, analysesdepended primarily on trend extrapolation and failed toaccount for significant behavioral adjustments, which tendedto offset earlier trends. Projections of energy shortages basedon supply constraints in the early 1970s failed to consider therapid evolution of more energy-efficient technology anddevelopment of new energy sources. Projections of boomingU.S. agricultural exports made in the late 1970s, based on thehistorical position of the United States in satisfying growingworld food needs, failed to appreciate the widespreadapplication of improved agricultural techniques worldwide,particularly in developing countries. The adaptiveness ofcompetitive free markets coupled with technological changehas contributed to a remarkable ability to adjust and capital-ize on changing resource conditions. One important conclu-sion is warranted: Assuming that competitive free marketswill prevail in North America, analysis of future resourceconditions must take into account mechanisms by whichmarkets adjust to resource conditions and, in turn, the effectsof such adjustments on resource markets. Thus, accurateanalysis requires appropriate economic modeling techniques.
Definition of Issue
The 1993 RPA Assessment Update was intended to reflectanalysis of important issues currently related to long-rangeforest resource trends, particularly issues that have continuedto be important since the 1989 Assessment. Certainly, trendsin paper recycling have remained an important issue giventhe significant upward trend in paper recycling. Figure 5shows the historical trend in the U.S. recyclable paperutilization rate since 1970 (API 1991). The recyclable paperutilization rate is the ratio of the tonnage of recyclable paperused as fiber input in domestic paper and paperboard mills tototal tonnage of paper and paperboard produced. Figure 6shows the historical trend in U.S. recyclable paper recoveryrate for the same period (API 1960–1992). The recyclablepaper recovery rate is the ratio of the tonnage of recyclablepaper recovered for both domestic use and for export to thetotal tonnage of paper and paperboard consumed in theU.S. economy. Note that a substantial historical upturn inrecycling rates occurred, beginning in the mid-1980s (Figs. 5and 6). Also note that by 1992, U.S. recycling rates actuallyreached levels that were not forecast to occur until the year2040, according to the 1989 RPA Base projections. Thus, theForest Service recognized that scenarios such as the 1989RPA Base should not be viewed in isolation from alternativescenarios that show more realistic trends in paper recycling.
Consequently, in the 1989 RPA Assessment report (USDAForest Service 1989a), in the supporting timber analysis
Figure 5—Historical trend of U.S. recyclable paperutilization rate (API 1991). Estimate for 1992.
Figure 6—Historical trend of U.S. recyclable paperrecovery rate (API 1991).
report (Haynes 1990), and in subsequent reports (Ince 1990,Adams and Haynes 1991), alternative scenarios examinedprojected impacts on timber markets of increased paperrecycling. Generally, such scenarios showed that increasedrecycling would extend timber supplies and would tend tomitigate projected timber supply shortages and timber priceincreases to some extent. Thus, one of the more significantconclusions of the 1989 RPA Assessment and subsequentstudies was that likely increases in paper recycling couldhave significant impacts on U.S. timber supply and demandin the decades ahead. For that reason, in 1990 the ForestService identified recycling and its impact on the long-rangetimber market outlook as a key issue requiring furtherin-depth analysis for the 1993 RPA Assessment Update.
As stated previously, assuming that competitive free marketsprevail, the future of paper recycling and the long-rangetimber market outlook devolve to a singular economic issue:what will be the market allocation of resources in the forestproducts sector in the future, considering both the short run
Year
Util
izat
ion
(per
cent
)
19701972197419761978198019821984198619881990199220
22
24
26
28
30
32
Year
Rec
over
y (p
erce
nt)
1970197219741976197819801982198419861988199020
22
24
26
28
30
32
34
36
38
10
allocation of wood and fiber resources and the long runallocation of technological and capital resources? Allocationrefers essentially to the choice of the competitive freemarket, the balance between supply and demand. Of course,as discussed earlier in the case of recycling and timberresources, this allocation may be strongly influenced bygovernment policies, which may affect supply or demand.Thus, the issue is defined as an economic issue of resourceallocation in competitive markets, although the impact ofpolicy on those markets is also part of the issue and theanalysis.
Objectives of 1993 Update
This study was focused on the objective of assessing timberresource implications of expected trends in paper recyclingand timber markets. Projections show the expected impact ofpaper recycling on future markets for pulpwood and recov-ered paper, and the effects of recycling on timber markets ingeneral and other sectors of the forest products industry. Theresults provide a basis for comparing the economics ofrecycling with incineration, composting, and other options inwaste reduction, on the basis of projected prices for recov-ered paper. The results also show the extent to which paperrecycling and export of recovered paper will affect overallwaste disposal volumes in the future. Finally, the analysiscan be extended to show how policy options in recycling,such as source reduction, mandatory minimum recycledcontent, and increased collection, are likely to change thecompetitive market evolution of paper recycling technology,and how such policies may affect future timber supply anddemand.
Meeting the objectives of this study required certain researchtasks, which had their own preliminary objectives. Onepreliminary objective was to develop a comprehensiveeconomic forecasting model of the entire North Americanpulp and paper sector. An economic model was needed tosimulate the competitive market allocation of resourcesthroughout the pulp and paper sector, to determine theevolution of regional market equilibria and trade flows andthe competitive evolution of production technology in thelong run, including evolution of technology for usingrecycled fiber and virgin wood fiber in all paper andpaperboard products.
A second preliminary objective was to link the model of thepulp and paper sector to other Forest Service RPA Assess-ment models, and to project future recycling rates and timbermarket trends. The pulp and paper model projects annualmarket equilibria of the pulp and paper sector, and change inproduction capacity from year to year depending on marketconditions. Solutions obtained by the pulp and paper modelwere linked by iteration with solutions obtained by otherForest Service RPA Assessment models, including theTAMM/ATLAS model, which determines future timber
inventory and growth, and future market equilibria inlumber, plywood, and other forest product sectors. Thus, acomprehensive assessment of the entire forest product sectorwas provided.
Methods and Approach
As in past RPA Assessment studies, the approach of thisstudy was to start with basic assumptions about futureeconomic growth and future population growth in the UnitedStates, and to develop a detailed forest product sector modelto provide projections based on those assumptions. In thiscase, an economic model of the entire North American pulpand paper sector was developed. Modeling methods werebased on established principles of economic theory, withapplication of econometrics, regional market modelingtechniques, and capital investment theory applied to tech-nology forecasting. Intrinsic assumptions included theassumption that competitive free markets will prevail as aprimary mechanism by which wood and fiber resources willbe allocated in the forest product sector, and that competitiveeconomics will determine the allocation of capital andtechnological resources over time. Model constraints andshifts in fiber supply were introduced to simulate introduc-tion of government policies related to recycling.
This study proceeded from a set of basic assumptions aboutfuture population and economic growth in the United States,the same growth assumptions that applied in all economicmodels and supporting studies of the 1993 RPA AssessmentUpdate. These growth assumptions are nearly identical tothose used in the 1989 RPA Assessment and related studies(USDA Forest Service 1989b). The RPA growth assump-tions were used in our study for years after 1993; actualgrowth data and near-term growth projections were used upto 1993.
For the 1993 RPA Assessment Update, only one set of basicpopulation growth assumptions was used. Growth inpopulation and the economy has stimulated domesticdemand for paper and paperboard products. In the past50 years, the U.S. population increased by more than100 million. Projections of the Bureau of Census indicatethat population is likely to continue to grow during the next50 years, but at a gradually declining rate. The populationgrowth assumptions were based on Bureau of Census“middle series” projections with a high immigration assump-tion (750,000 per year). The high immigration assumptionaccounts for trends in both legal and illegal immigration. Theoverall net annual growth rate for U.S. population is pro-jected to gradually decline from around 1 percent in the late1980s to 0.3 percent by the year 2040. The decline in therate of population growth reflects Bureau of Census assump-tions about fertility rates, which have fluctuated widely inrecent decades but generally have fallen sharply since the1950s. The projections are based on an assumed fertility rate

11
of 1.9, a level close to current birth expectations of femalesof child-bearing age. The current fertility rate is actuallybelow 1.9, and it is at a level that may lead to approximatelyzero population growth in the early part of the 21st century.However, immigration amounts to a significant part of U.S.population growth.
The age distribution of the population is another relevantfactor in considering future product demands. Bureau ofCensus projections by age classes indicate a substantialincrease during most of the 50-year projection period in thenumber and proportion of people in the middle-age classes,which have the highest income levels and largest demandsfor goods and services. It can be noted that the populationgrowth assumptions are somewhat higher than the 1979RPA Assessment assumptions (population is projected to beroughly 8 percent higher by the year 2030 than the mediumlevel assumptions of the 1979 RPA Assessment) mainly dueto the higher immigration assumption. Figure 7 illustratesthe basic assumption for net annual growth in U.S. popula-tion that was applied in this study. The population is pro-jected to reach 327 million by the year 2040 under theseassumptions; the population was estimated to be254.8 million in 1991.
Likewise, for the 1993 RPA Assessment Update, only oneset of basic economic growth assumptions was used. TheU.S. demand for paper and paperboard products has beenclosely associated with historical changes in real grossnational product (GNP; expressed in constant dollars), aswell as increases in population. Figure 8 illustrates the basicassumptions for annual growth in per capita real GNP. Theeconomic growth assumptions indicate rising affluence ofthe U.S. population, with a roughly threefold increase in percapita real GNP assumed between the years 1986 and 2040.Annual changes in real GNP since 1929 have fluctuatedwidely in a range from -19 percent to +19 percent; thedecade with the highest sustained growth was the 1960s,when the change in real GNP averaged 4.2 percent per year.Fluctuations in annual GNP growth have reflected factorssuch as differences in rates of change in the labor force, ratesof unemployment, hours worked per year, and productivity.Fluctuations are likely to continue to occur. Projections ofGNP growth were obtained from Wharton EconometricForecasting Associates (WEFA; see USDA Forest Service1989b). The WEFA projections have business cycles witheconomic downturns occurring in 1990, 1998, and 2003.After 2003, no attempt was made to project business cyclesand economic growth occurs smoothly throughout theremainder of the projection period. In constant dollars, theprojected rates of GNP growth lead to a greater than fourfoldincrease in U.S. GNP between 1986 and 2040. Projectionsassume that services will account for an increasing share ofGNP, although manufacturing and construction activities areexpected to increase in absolute terms as well with largeincreases in the quantities of physical goods produced in theU.S. economy.
Figure 7—Projections of net annual growth inU.S. population.
Figure 8—Projections of U.S. annual growth inreal GNP per capita.
NAPAP ModelA spatial equilibrium and dynamic process economic modelof the North American pulp and paper sector was developedand applied in this study. The model is known as the NorthAmerican Pulp and Paper (NAPAP) Model (Ince and others1993). It was developed to project future technologicalchanges, production, capacity, imports and exports, andrelated market equilibria for the United States and Canadianpulp and paper sector. It incorporates basic RPA assumptionsof economic growth and population growth, and includesfive North American production or supply regions (CanadaEast and West, U.S. North, South, and West) and two NorthAmerican demand regions (United States and Canada).The model combines regional information on supply anddemand, manufacturing processes, and transportation coststo compute future market equilibria year to year, using aprice-endogenous linear programming system. The model
Year
Cha
nge
(per
cent
)
1990 2000 2010 2020 2030 20400
0.2
0.4
0.6
0.8
1.0
1.2
1.4
Year
Cha
nge
(per
cent
)
1990 2000 2010 2020 2030 2040
0
1
2
3
4
-1
-2
12
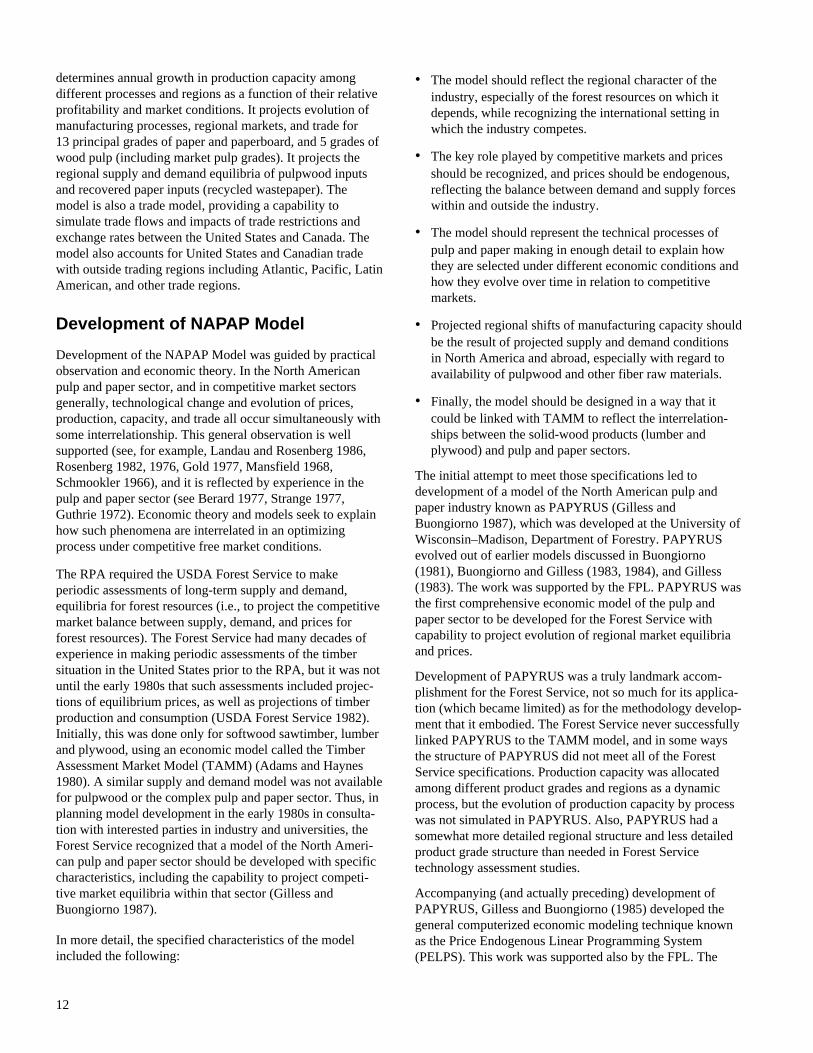
determines annual growth in production capacity amongdifferent processes and regions as a function of their relativeprofitability and market conditions. It projects evolution ofmanufacturing processes, regional markets, and trade for13 principal grades of paper and paperboard, and 5 grades ofwood pulp (including market pulp grades). It projects theregional supply and demand equilibria of pulpwood inputsand recovered paper inputs (recycled wastepaper). Themodel is also a trade model, providing a capability tosimulate trade flows and impacts of trade restrictions andexchange rates between the United States and Canada. Themodel also accounts for United States and Canadian tradewith outside trading regions including Atlantic, Pacific, LatinAmerican, and other trade regions.
Development of NAPAP Model
Development of the NAPAP Model was guided by practicalobservation and economic theory. In the North Americanpulp and paper sector, and in competitive market sectorsgenerally, technological change and evolution of prices,production, capacity, and trade all occur simultaneously withsome interrelationship. This general observation is wellsupported (see, for example, Landau and Rosenberg 1986,Rosenberg 1982, 1976, Gold 1977, Mansfield 1968,Schmookler 1966), and it is reflected by experience in thepulp and paper sector (see Berard 1977, Strange 1977,Guthrie 1972). Economic theory and models seek to explainhow such phenomena are interrelated in an optimizingprocess under competitive free market conditions.
The RPA required the USDA Forest Service to makeperiodic assessments of long-term supply and demand,equilibria for forest resources (i.e., to project the competitivemarket balance between supply, demand, and prices forforest resources). The Forest Service had many decades ofexperience in making periodic assessments of the timbersituation in the United States prior to the RPA, but it was notuntil the early 1980s that such assessments included projec-tions of equilibrium prices, as well as projections of timberproduction and consumption (USDA Forest Service 1982).Initially, this was done only for softwood sawtimber, lumberand plywood, using an economic model called the TimberAssessment Market Model (TAMM) (Adams and Haynes1980). A similar supply and demand model was not availablefor pulpwood or the complex pulp and paper sector. Thus, inplanning model development in the early 1980s in consulta-tion with interested parties in industry and universities, theForest Service recognized that a model of the North Ameri-can pulp and paper sector should be developed with specificcharacteristics, including the capability to project competi-tive market equilibria within that sector (Gilless andBuongiorno 1987).
In more detail, the specified characteristics of the modelincluded the following:
• The model should reflect the regional character of theindustry, especially of the forest resources on which itdepends, while recognizing the international setting inwhich the industry competes.
• The key role played by competitive markets and pricesshould be recognized, and prices should be endogenous,reflecting the balance between demand and supply forceswithin and outside the industry.
• The model should represent the technical processes ofpulp and paper making in enough detail to explain howthey are selected under different economic conditions andhow they evolve over time in relation to competitivemarkets.
• Projected regional shifts of manufacturing capacity shouldbe the result of projected supply and demand conditionsin North America and abroad, especially with regard toavailability of pulpwood and other fiber raw materials.
• Finally, the model should be designed in a way that itcould be linked with TAMM to reflect the interrelation-ships between the solid-wood products (lumber andplywood) and pulp and paper sectors.
The initial attempt to meet those specifications led todevelopment of a model of the North American pulp andpaper industry known as PAPYRUS (Gilless andBuongiorno 1987), which was developed at the University ofWisconsin–Madison, Department of Forestry. PAPYRUSevolved out of earlier models discussed in Buongiorno(1981), Buongiorno and Gilless (1983, 1984), and Gilless(1983). The work was supported by the FPL. PAPYRUS wasthe first comprehensive economic model of the pulp andpaper sector to be developed for the Forest Service withcapability to project evolution of regional market equilibriaand prices.
Development of PAPYRUS was a truly landmark accom-plishment for the Forest Service, not so much for its applica-tion (which became limited) as for the methodology develop-ment that it embodied. The Forest Service never successfullylinked PAPYRUS to the TAMM model, and in some waysthe structure of PAPYRUS did not meet all of the ForestService specifications. Production capacity was allocatedamong different product grades and regions as a dynamicprocess, but the evolution of production capacity by processwas not simulated in PAPYRUS. Also, PAPYRUS had asomewhat more detailed regional structure and less detailedproduct grade structure than needed in Forest Servicetechnology assessment studies.
Accompanying (and actually preceding) development ofPAPYRUS, Gilless and Buongiorno (1985) developed thegeneral computerized economic modeling technique knownas the Price Endogenous Linear Programming System(PELPS). This work was supported also by the FPL. The
13
PAPYRUS model was a first-generation application ofPELPS methodology. Gilless and Buongiorno separatelypublished and presented PELPS as a general system foreconomic modeling based on regional market modelingtheory (Gilless and Buongiorno 1985). Thus, by the mid-1980s, the FPL had supported development of a generalmethodology for economic modelling of large industrialsectors, with demonstrated application of the technique inthe PAPYRUS model and earlier models of the pulp andpaper sector.
In anticipation of the 1989 RPA Assessment report, theForest Service recognized that further analysis would beneeded to project significant technological changes takingplace or likely to occur in the pulp and paper sector, such asincreased use of hardwood in kraft linerboard in the Southand increased use of recycled fiber in various product grades.In 1985, FPL researchers were detailed to develop projec-tions of those technological changes, and it was decided todevelop an improved economic model for that purpose basedon PELPS methodology. The result was the so-called FPLPulpwood Model (unpublished), which was used to provideeconomic projections of the pulp and paper sector for the1989 RPA Assessment (USDA Forest Service 1989).
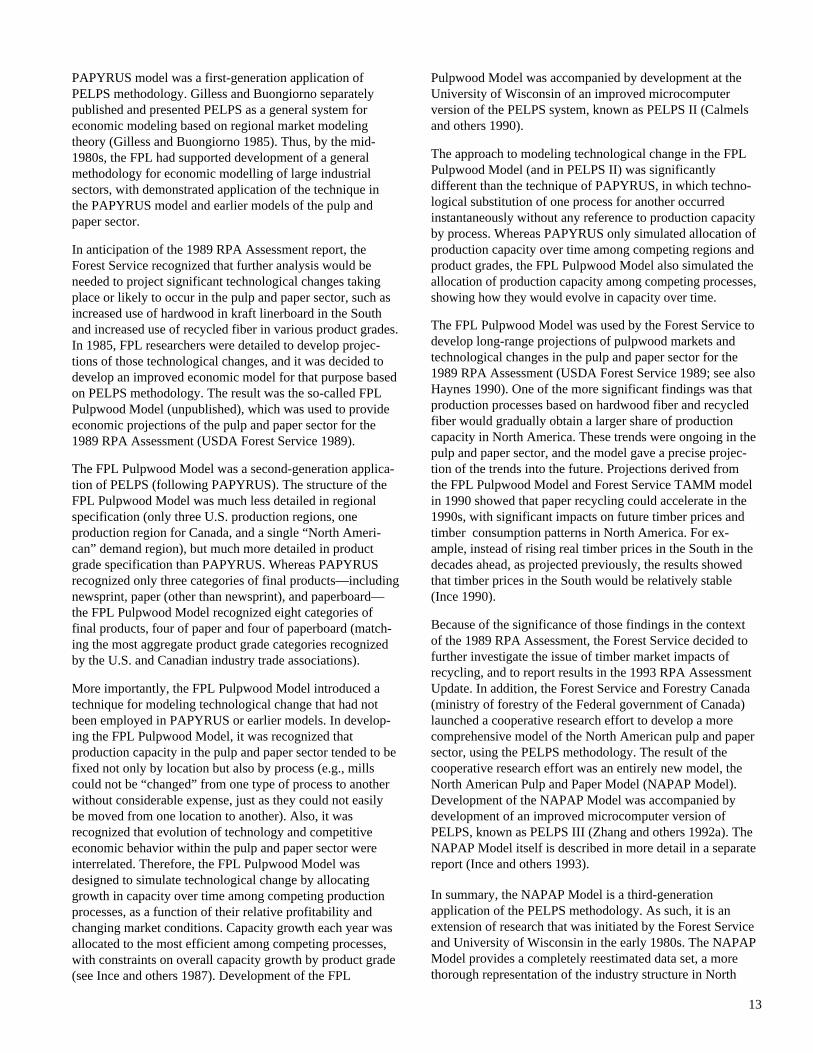
The FPL Pulpwood Model was a second-generation applica-tion of PELPS (following PAPYRUS). The structure of theFPL Pulpwood Model was much less detailed in regionalspecification (only three U.S. production regions, oneproduction region for Canada, and a single “North Ameri-can” demand region), but much more detailed in productgrade specification than PAPYRUS. Whereas PAPYRUSrecognized only three categories of final products—includingnewsprint, paper (other than newsprint), and paperboard—the FPL Pulpwood Model recognized eight categories offinal products, four of paper and four of paperboard (match-ing the most aggregate product grade categories recognizedby the U.S. and Canadian industry trade associations).
More importantly, the FPL Pulpwood Model introduced atechnique for modeling technological change that had notbeen employed in PAPYRUS or earlier models. In develop-ing the FPL Pulpwood Model, it was recognized thatproduction capacity in the pulp and paper sector tended to befixed not only by location but also by process (e.g., millscould not be “changed” from one type of process to anotherwithout considerable expense, just as they could not easilybe moved from one location to another). Also, it wasrecognized that evolution of technology and competitiveeconomic behavior within the pulp and paper sector wereinterrelated. Therefore, the FPL Pulpwood Model wasdesigned to simulate technological change by allocatinggrowth in capacity over time among competing productionprocesses, as a function of their relative profitability andchanging market conditions. Capacity growth each year wasallocated to the most efficient among competing processes,with constraints on overall capacity growth by product grade(see Ince and others 1987). Development of the FPL
Pulpwood Model was accompanied by development at theUniversity of Wisconsin of an improved microcomputerversion of the PELPS system, known as PELPS II (Calmelsand others 1990).
The approach to modeling technological change in the FPLPulpwood Model (and in PELPS II) was significantlydifferent than the technique of PAPYRUS, in which techno-logical substitution of one process for another occurredinstantaneously without any reference to production capacityby process. Whereas PAPYRUS only simulated allocation ofproduction capacity over time among competing regions andproduct grades, the FPL Pulpwood Model also simulated theallocation of production capacity among competing processes,showing how they would evolve in capacity over time.
The FPL Pulpwood Model was used by the Forest Service todevelop long-range projections of pulpwood markets andtechnological changes in the pulp and paper sector for the1989 RPA Assessment (USDA Forest Service 1989; see alsoHaynes 1990). One of the more significant findings was thatproduction processes based on hardwood fiber and recycledfiber would gradually obtain a larger share of productioncapacity in North America. These trends were ongoing in thepulp and paper sector, and the model gave a precise projec-tion of the trends into the future. Projections derived fromthe FPL Pulpwood Model and Forest Service TAMM modelin 1990 showed that paper recycling could accelerate in the1990s, with significant impacts on future timber prices andtimber consumption patterns in North America. For ex-ample, instead of rising real timber prices in the South in thedecades ahead, as projected previously, the results showedthat timber prices in the South would be relatively stable(Ince 1990).
Because of the significance of those findings in the contextof the 1989 RPA Assessment, the Forest Service decided tofurther investigate the issue of timber market impacts ofrecycling, and to report results in the 1993 RPA AssessmentUpdate. In addition, the Forest Service and Forestry Canada(ministry of forestry of the Federal government of Canada)launched a cooperative research effort to develop a morecomprehensive model of the North American pulp and papersector, using the PELPS methodology. The result of thecooperative research effort was an entirely new model, theNorth American Pulp and Paper Model (NAPAP Model).Development of the NAPAP Model was accompanied bydevelopment of an improved microcomputer version ofPELPS, known as PELPS III (Zhang and others 1992a). TheNAPAP Model itself is described in more detail in a separatereport (Ince and others 1993).
In summary, the NAPAP Model is a third-generationapplication of the PELPS methodology. As such, it is anextension of research that was initiated by the Forest Serviceand University of Wisconsin in the early 1980s. The NAPAPModel provides a completely reestimated data set, a morethorough representation of the industry structure in North

14
America, and additional methodological improvements (seeInce and others 1993). It includes all of the principal pulp,paper, and paperboard grades produced in the United Statesand Canada. The NAPAP Model meets all of the originalForest Service specifications for an economic model of thepulp and paper sector. From a broader perspective, the modelrepresents a tool that can serve many potential applicationsin the United States and Canada, ranging from technologyforecasting to assessment of resource, technology, trade, orenvironmental policy impacts.
Previous Pulp and PaperSector Models
Prior to the recent modeling experience (development ofPELPS, PAPYRUS, FPL Pulpwood Model, and NAPAPModel), there were few published examples of large orcomprehensive economic forecasting models of the pulp andpaper sector, and none published in North America for thepurpose of investigating long-range trends in pulpwoodmarkets (see Gilless and Buongiorno 1987). Generaleconomists seldom dealt with the pulp and paper sector as awhole, and specialized forest economists concentrated onmodeling the solid wood sector (lumber and plywood). Ingeneral, earlier attempts to comprehend the overall dynamicbehavior of the North American pulp and paper sector eithertook a more general approach than economic modelling(such as synoptic books on the industry structure by Guthrie(1972) or Strange (1977) or they involved models intendedto examine issues other than timber supply and demand, suchas energy consumption in the 1970s.
From a forestry perspective, the focus on lumber andplywood may have made sense at times in the past. Com-pared with prices for pulpwood, higher prices have alwaysbeen paid for larger diameter sawtimber (used for lumber orplywood). Only in recent decades did pulpwood consump-tion grow to such proportions that many foresters in NorthAmerica began to view pulpwood and sawtimber as equallyimportant elements in the forest economy. Also, in recentdecades technological developments in forest products haveincreased the ability of industry to substitute smaller “pulp-wood-quality” logs for larger diameter logs in products suchas oriented strandboard, which substitutes for softwoodplywood, and in “small-log” lumber and plywood millsgeared to utilize smaller diameter timber. In addition, withthe advent of timber supply and demand models that simu-lated dynamics of changing timber growth and inventory, itbecame apparent that trends in pulpwood consumption couldhave a large bearing on the long-run timber supply and de-mand situation in North America (Adams and Haynes 1980).
One example of a comprehensive model of resource use andcompetitive behavior in the pulp and paper sector was themodel developed for analysis of energy use by the NationalCenter for Analysis of Energy Systems at BrookhavenNational Laboratory (Pilati and others 1980). The model wasdesigned to project future regional energy consumption
patterns in the U.S. pulp and paper sector. The Brookhavenmodel was a “process model” based on linear programming,described as “a regional dynamic mathematical programmingmodel.” The model determined annually the selection ofinvestments and process options of the industry that mini-mized total discounted costs. It considered the energyrequirements and costs of processing of three sources of fiberinto various pulps and the processing of these pulps intoseven different paper and paperboard products. Regionaldemands for paper products were specified exogenously overa 25-year time horizon. The model was validated for a baseyear (1975) and examples were provided to show how themodel could be used for making energy demand projections,technology assessments, or energy policy studies.
In some respects, the Brookhaven model was similar to theNAPAP Model and may be viewed to some extent as aforerunner of the NAPAP approach. The Brookhaven modelwas based on dynamic regional optimization with linearprogramming. It selected the optimal allocation of capacitygrowth among competing processes (as an annual optimizinginvestment decision, using cost-minimizing criteria), and itprojected simultaneously the evolution of productiontechnology and input requirements over time. In otherrespects, the Brookhaven model was quite different than theNAPAP Model. It was not a regional market model (it didnot solve for the supply and demand equilibria or prices inany markets, and it did not determine how the evolution ofproduction technology would affect markets or vice versa.
Another example of research in modeling the energy sectorwas provided by the ETA-MACRO model (Manne 1981).ETA-MACRO was designed to estimate the extent of two-way linkages between the energy sector and the balance ofthe economy. It represented a merger between ETA (a process analysis model for energy technology assessment)and a macroeconomic growth model providing for substitu-tion among capital, labor, and energy inputs. The modelsimulated a market economy over time. Supplies, demands,and prices were matched through a dynamic nonlinearprogramming model. In the model, the higher that energyprices rose, the greater were the future amounts of energythat became available and the greater were the inducementsfor consumers to conserve energy. Although this type ofmodel is not reproduced per se, the NAPAP Model doesincorporate some important features that provide similarcapabilities, particularly in simulating how technologicalsubstitution will affect supply in fiber markets and vice versa.
As discussed by Gilless and Buongiorno (1987), the originaldevelopment of PELPS and the earlier PAPYRUS modelwere significantly influenced by the extensive earliermodeling work done for the energy sector by Manne (1979)and Kennedy (1974). Also, many of the same techniqueswere considered in an earlier model of the entire forestsector (Haynes and others 1978). The PELPS methodology(and hence the NAPAP Model) drew three basic conceptsfrom these earlier works: spatial equilibrium modeling,
15
price-endogenous linear programming, and technologyforecasting based on recursive programming. Other earlierstudies, described by Gilless and Buongiorno (1987), for themost part were examples of single-equation or multiple-equation econometric models, designed to develop predic-tions based on historical relationships, rather than a compre-hensive behavioral modeling approach.
In addition, in the past decade a number of comprehensive“forest sector” models or forest resource supply and demandanalyses have been developed. Such models or analysesserve to project markets of industry sectors that rely on forestresources within large geographic regions. Recent examplesinclude the forest sector model developed for Sweden(Lonner 1991) and the wood supply and demand analysisdeveloped for the United Kingdom (Whiteman 1991). In the1980s, a highly generalized global forest sector model wasdeveloped by the Forest Sector Project at the InternationalInstitute for Applied Systems Analysis (IIASA) inLaxenburg, Austria, with research contributions fromnumerous forest sector modeling specialists around the world(Kallio and others 1987). The IIASA global forest sectormodel was a spatial equilibrium model, which primarily usedrecursive programming.
Generally, recent forest sector models, such as the IIASAmodel, have represented production technology and com-modities at relatively aggregate or generalized levels.However, the mathematical formulation of the IIASA globalforest sector model was similar to that of the PAPYRUSmodel, and hence similar to that of the NAPAP Model(Kallio and others 1987). In essence, when the NAPAPModel is linked to a model of the North American timberand wood product sector (such as TAMM; Adams andHaynes 1980) the result is a comprehensive North Americanforest sector model, providing a very detailed simulation ofhow forest sector technology and markets will evolve inNorth America.
Methodology of NAPAP Model
The NAPAP Model is an application of spatial equilibriummodeling methods, based on price-endogenous linearprogramming, using PELPS III (see Zhang and others 1993).The model represents technological options as economicchoices via activity analysis, with production capacitymodeled for many different production processes. Recursiveprogramming is used to provide for adjustment in capacityand shifts in supply and demand from year to year.
Nobel Laureate Paul Samuelson (1952) described a spatialequilibrium model as one for which
. . we are given at each of two or more localities adomestic demand and supply curve for a given product(e.g. wheat) in terms of its market price at that locality.We are also given constant transport costs (shipping,insurance, duties, etc.) for carrying one unit of theproduct between any two of the specified localities.
From this information, we wish to know
What then will be the final competitive equilibrium ofprices in all the markets, of amounts supplied anddemanded at each place, and of exports and imports?
Thus, spatial equilibrium models simulate interregionaleconomies by finding the balance of supply, demand, andtrade that results in a competitive market equilibrium amongvarious regions.
Samuelson (1952) showed that the spatial equilibrium for aneconomic sector was the solution to a mathematical program-ming problem. He called the corresponding objectivefunction (to be maximized) the “net social payoff” of thesector. This payoff is the sum of producer and consumersurplus for each region in a sector, minus transportation costsbetween and within regions.
Iterative procedures to solve this maximization problem weredeveloped by Fox (1953), Judge and Wallace (1958), Trameland Seale (1959), Schrader and King (1962), and Yaron(1967). A quadratic programming solution was used byTakayama and Judge (1964a) for the special case of linearsupply and demand curves.
A linear programming formulation of the spatial equilibriumproblem (price-endogenous linear programming) wasdeveloped by Duloy and Norton (1975). Variants have beenused to model a number of agricultural and natural resourcesectors (Kennedy 1974; McCarl and Spreen 1980). TheNAPAP Model is based on price-endogenous linear pro-gramming, using the generalized PELPS (price-endogenouslinear programming system (Gilless and Buongiorno 1985).The NAPAP Model utilizes the most recent version of thissystem, PELPS III (Zhang and others 1993). The system is ageneral microcomputer system for modeling economicsectors percent. It is the successor of PELPS (Gilless andBuongiorno 1985), PELPS II (Calmels and others 1989), andPELPS II PLUS (Zhang and others1990).
It is worth noting that maximizing Samuelson’s net socialpayoff has no normative implications beyond that of identi-fying the regional market equilibria for a sector described interms of regional supply and demand curves, and transporta-tion costs between and within these regions. The realjustification for its use, other than efficiency in calculating anequilibrium, is therefore that
. . . its behavioral implications are consistent withtheoretical economic behavior of the sectoral partici-pants. Thus a model with this objective function can beused to simulate producer response to policy (McCarland Spreen 1980).
This ability to simulate producer and consumer responses tochanges in the economic environment is important whenmodeling long-range evolution of technology and marketconditions. In the long run, where economic conditions andtechnological change may occur, the historical data base and

16
conventional econometric approach are not fully adequate.Historical data reflect only historical technological trendsand historical conditions, whereas the behavioral modelreflects an understanding of the interrelationship betweentechnological change and economic conditions over time(see Landau and Rosenberg 1986; Gold 1977; Rosenberg1976, 1982).
Takayama and Judge (1964b, 1970, 1971) introduced anextension of this concept by representing manufacturingactivities in a spatial equilibrium model with activityanalysis. Thus, they conceptualized the idea of finding thecompetitive equilibrium not only among regions but alsoamong various manufacturing processes, which wereseparately described in terms of inputs required per unit ofoutput, unit cost of manufacturing net of inputs, and regionalmanufacturing capacities.
PELPS incorporated spatial equilibrium modeling conceptsand provided a general framework for constructing spatialequilibrium models with production choices determined byactivity analysis (Gilless and Buongiorno 1985), but theoriginal version of PELPS (and also the PAPYRUS model)did not incorporate separate capacity constraints for compet-ing processes. Nevertheless, it was observed that productioncapacity at pulp and paper mills in North America washighly differentiated by type of manufacturing process aswell as by product grade (mainly by type of pulping processor by distinction between recycled-fiber and virgin-fiberprocesses; see Guthrie 1972 or Strange 1977). Differenttypes of processes required different combinations ofmaterial, energy, labor, and capital inputs, and conversion ofcapacity from one process to another generally requiredcapital investment. Thus, it was recognized that the evolutionof production capacity by process would be modeled moreappropriately as a long-run behavioral phenomenon ratherthan a short-run phenomenon, while existing processcapacity acted as a short-run constraint on economic substi-tution among production inputs.
Given that existing processes in the pulp and paper sectorconstrain production in the short run, it was logical to modelcapacity constraints by process and capacity growth byprocess over time (as well as by region) using the spatialequilibrium framework. In effect, the NAPAP Model wasdesigned to address issues beyond the original spatialequilibrium problem considered by Samuelson (1952). TheNAPAP Model finds the competitive production equilibriaamong regional manufacturing processes in the short run,and it forecasts the competitive evolution of capacity byprocess in the long run. Thus, the NAPAP Model is de-scribed more aptly as a “techno-spatial equilibrium model,”or one that solves the technology forecasting problem as wellas the classical spatial and production equilibrium problem.
The earlier FPL Pulpwood Model was the first application ofPELPS in which the activity analysis suggested byTakayama and Judge was fully extended to deal with the
problem of finding the competitive equilibrium amongcompeting manufacturing processes, with capacity con-straints and capacity growth simulated separately for eachmanufacturing process within various commodity categories.Subsequently PELPS was modified to fully reflect thatextension and other improvements (see PELPS II; Calmelsand others 1990). The NAPAP Model likewise incorporatedthe fully extended activity analysis, and a further update ofPELPS was developed accordingly (see Zhang et al. 1993).Thus, the NAPAP Model applied the activity analysisapproach conceptualized originally by Takayama and Judge(Zhang et al. 1993). The adaptability of the classical spatialequilibrium framework to the problem of technologyforecasting was a major consideration in the decision to usethis approach. This technique has been validated as anaccurate technology forecasting technique (Zhang 1992).
Dividing a multiyear spatial equilibrium problem into asequence of problems, one for each year, is known as“recursive programming.” Originally developed by Day(1973), the concept was applied to model agricultural andindustrial sectors (Abe 1973; Nelson 1973). Recursiveprogramming combines the theory of short-run optimization(finding the market equilibrium via maximization of con-sumer and producer surplus) with long-run imperfectforesight. Long-run decisions, such as capacity expansiondecisions in the pulp and paper sector, are made withoutperfect foresight (i.e., there is generally a lack of perfectknowledge about future market conditions). Given anunderstanding of imperfect foresight, it can be deduced thatcapacity expansion decisions in the pulp and paper sector aremade primarily in reference to current market conditions.Thus, in the NAPAP Model (as well as previous PELPS-based models) it has been assumed that projected capacityexpansion for the next year is always made in reference tomarket conditions in the current year (e.g., current prices).Prices are computed endogenously for each year in solvingthe supply and demand equilibria.
A single linear program could have been used to calculate amultiyear (intertemporal) equilibrium for the pulp and papersector. However, this would have assumed perfect foresighton the part of decision makers. Therefore, such a modelwould have been unrealistic, inasmuch as long-run decisionsare inevitably based on temporal information. The recursiveapproach reduces the size of the linear program that other-wise must be solved, breaking up the multiyear problem intoa sequence of smaller problems, one for each year. This alsoaffords a model that includes more detail on the pulp andpaper sector—detail that enhances the usefulness of themodel in examining implications of policy recommendationsand other exogenous changes related to the pulp and papersector.
In summary, the NAPAP Model can be conceived assimulating the rational economic behavior of suboptimizingdecision makers who must rely on temporal economic data tomake long-run decisions, in a generally competitive free

17
market environment. Reflecting the reality of decision-making in the North American pulp and paper sector, themodel simulates the behavior of decision makers who facean economic environment each year that has been deter-mined in part by their past decisions (e.g., decisions on pastcapacity expansion), and in part by prevailing economicconditions also shaped by exogenous forces (such asgovernment policies, which have increased supplies ofrecovered paper in recent years). The realism of recursiveprogramming was a major consideration in the decision touse this methodology in simulating pulp and paper sectorbehavior and responses to change.
Long-Range Projectionsby NAPAP Model
The NAPAP Model has two elements or computationalphases: a linear program that describes the pulp and papersector in a given year, and a set of recursive relationshipsthat update the data in the linear program to reflect changesin the economic environment from year to year. The NAPAPModel makes multiyear forecasts iteratively. The market andproduction equilibrium for the base year (1986) is found bysolving the linear program with relevant data describing thepulp and paper sector in 1986. Recursive relationships areused to update the linear program to account for changes inthe industry’s economic environment between 1986 and1987. The updated (1987) linear program is then solved toobtain the market and production equilibrium for 1987. Thisiterative process of solution and update is repeated over theforecast period, which extends to the year 2040, providing aforecast of annual market equilibria over the entire period.
The linear program data describe the pulp and paper sector insufficient detail to solve the techno-spatial equilibriumproblem for all principal commodities of the pulp and papersector in North America (United States and Canada).Included in the linear program data are estimates of regionalsupply functions for manufacturing inputs; regional demandfunctions for commodity outputs; technological coefficientsdescribing production possibilities in terms of inputs per unitof product output in various production processes for eachcommodity; other (net) manufacturing costs by process;transportation costs for various commodities and regions;regional production capacities for the various processes;regional constraints on recovery of paper for recycling;import and export ad-valorum taxes; and monetary exchangerate assumptions (for United States and Canada). Asdiscussed previously, the objective function of the linearprogram is maximization of consumer plus producer surplus(the net social payoff for the pulp and paper sector;Samuelson 1952). Its solution approximates the spatialmarket and production equilibrium of the sector in a givenyear. The quantities supplied, transported, manufactured, anddemanded match consumer willingness to pay and producermarginal costs of procurement, production, and delivery. Thesolution prices and quantities of commodities demanded and
supplied correspond to market equilibrium prices andquantities, under the assumption of competitive economicbehavior (Samuelson 1952).
The recursive relationships used to update the linear programfrom year to year reflect exogenous changes in the economicenvironment of the pulp and paper sector, and also changesinfluenced by previous market equilibria (e.g., changes intechnology and capacity expansion). Changes to the linearprogram data include shifts in product demand curves, shiftsin input supply curves or input prices, changes in import andexport ad-valorum taxes, changes in monetary exchangerates (between United States and Canada), introduction andavailability of new (future) production processes at specifiedpoints in time, and changes in regional manufacturingcapacities of various processes determined endogenously bycapacity growth and depreciation formulas.
The model includes other static elements. Manufacturingcost of a commodity using a specific process and in aspecific region is the sum of the net production cost and theshipping cost within the region. The transportation cost of acommodity between two regions is defined as the freightcost, to which may be added any import ad-valorem taxes. Ineach region, the amount of a commodity received, supplied,and manufactured must be equal to the sum of the quantityused in the manufacturing of other commodities in the sameregion and of the amount demanded and shipped to otherregions (material balancing constraint). Thus, the inflow of acommodity must balance the outflow for each region. In eachregion, the production of a commodity by each process islimited by the existing manufacturing capacity for thatprocess in the specified region. In addition, several cate-gories of recycling constraints can be introduced in theNAPAP Model, including constraints on recycling capacity,product demand, and recovered paper supply. For the supplyof recovered paper, an upper bound and a lower bound on thesupply may be imposed to reflect maximum and minimumrecovery rates. Maximum recovery rates by region arespecified in the NAPAP Model to reflect maximum feasiblerecovery of paper for recycling, as limited by collectionprograms and infrastructure in North America. Minimumrecovery rates may also be specified, but are not included inthe NAPAP Model data set. Demand and capacity con-straints are specified to reflect reaction to governmentpolicies, such as policies that require minimum recycledcontent in newsprint. In the 1993 Assessment base scenario,such constraints are applied only to capacity in the historicaland near-term projection period.
Dynamic elements of the model include the following.Demand functions are updated between periods to reflectchanges in up to three demand-shift variables (independentvariables such as population and per capita GNP, derivedfrom the RPA Base assumptions). Supply functions areupdated between periods to reflect changes in up to threesupply-shift variables (such as projected timber inventoryand sawtimber prices from the TAMM model, which are

18
used to shift pulpwood supply, and projected tipping feesand paper consumption levels, which are used to shiftrecovered paper supply). Because all prices and costs in theNAPAP Model are expressed in a common currency (1986U.S. dollars), any changes in the value of a region’s currencycan change these prices and costs. The U.S.–Canadaexchange rate adjustments are made for each year from 1986to 1992, according to historical data. Exchange rates are thenheld constant for the remainder of the projection period.Manufacturing costs are updated annually to reflect projectedchanges in wage rates and energy costs. Transportation costsare updated annually to reflect projected changes inad valorum import tariffs. The NAPAP Model assumes fullimplementation of the U.S.–Canada Free Trade Agreementwith a graduated phase-out of all U.S.–Canada import tariffsbetween 1987 and 1993. Changes in capacity from oneperiod to the next are determined endogenously by theNAPAP Model, or they can be imposed exogenously by theuser. The user also specifies rates of depreciation or retire-ment for existing capacity.
Changes in capacity are computed by a “q-theory” ofcapacity expansion, based on the q-theory of capitalinvestment pioneered by Nobel Laureate James Tobin(1969):
The rate of investment—the speed at which investorswish to increase capital stock—should be related, if toanything, to q, the value of capital relative to itsreplacement cost.
Following Tobin’s q theory, the change in capacity for eachproduction process is determined as an increasing function ofthe q ratio, the shadow price (marginal profitability) ofcurrent capacity to the cost of new capacity. Empiricalresults with data of the U.S. pulp and paper industry suggestthat gross change in capacity of the pulp and paper sector is afunction of the current q ratio, the q ratio lagged one period,and the gross change in capacity lagged one period (Zhangand Buongiorno 1992a).
The interaction between demand functions and productsupply determines the equilibrium solution for productmarkets each year. The model also includes an endogenoussolution of the regional supply and demand equilibrium forpulpwood and wastepaper, with regional demand determinedby raw material requirements of production processes andthe simultaneous equilibrium solution for paper and paper-board production. Capacity growth by process is determinedby the Tobin q model. As markets and production capacityevolve from year to year, and as new production processesare introduced, the regions and processes that experience themost capacity growth are projected to change. Over time, themodel shows how recovered paper and pulpwood marketsare expected to respond to shifting demand and changingtechnology, and in turn how technology is expected toevolve in response to market conditions (i.e., supply,demand, and prices for fiber inputs and pulp, paper, andpaperboard products).
NAPAP Model Structureand Data Base
The NAPAP Model includes regional supply functions forpulpwood and recovered paper, and a highly detailed repre-sentation of production capacity and supply for all principalgrades of market pulp, paper, and paperboard, in five NorthAmerican production regions. It also includes demandfunctions for all end products, with separate demand func-tions for U.S. domestic demand, Canadian domestic demand,and demand from various trading regions for export from theUnited States and Canada. Regional production capacity foreach product is divided among one or more competingprocesses (such as recycled-fiber and virgin-fiber processes,or chemical pulping and mechanical pulping processes).The processes in the model include all current principalmanufacturing processes, plus processes expected to becomeavailable for production at assumed future dates in themodel. The aggregate product supply function is definedeach year by the production capacity among the variousprocesses and the production costs of each process amongthe various regions, combined with overseas import supply.
Empirical data for econometric estimates and technicalassumptions in the NAPAP Model were obtained from manysources. Principal sources included the American PaperInstitute (API), the Canadian Pulp and Paper Association(CPPA), the U.S. Commerce Department, Statistics Canada,Forestry Canada, and USDA Forest Service. In developingthe data base we obtained substantial advice from experts inindustry and from trade associations and industry researchorganizations, including API, CPPA, Pulp and PaperResearch Institute of Canada (PAPRICAN), USDA ForestService, Forest Products Laboratory (FPL), and TechnicalAssociation of the Pulp and Paper Industry (TAPPI).
Regional Structure
On the demand side, functions representing eight demandregions were included in the NAPAP Model (Table 1) for14 categories of final products. On the supply side, functionsrepresenting pulpwood and recovered paper supply wereincluded for five North American supply regions (Table 1).Price-responsive supply functions were included for hard-wood and softwood pulpwood (roundwood and residues) andfor four principal grades of recovered paper. Supply func-tions with predetermined prices (assuming price-takingbehavior) were specified in each supply region for purchasedfuel, purchased electric power, and labor wage rates.
Trade with regions outside of the United States and Canadawas represented in the NAPAP Model by including exportdemand functions and import supply functions for principaltrading regions (Table 1). Export demand functions forregions outside of the United States and Canada wereincluded for all products that were exported recently insignificant quantities from these countries. Import supplyfunctions were included for all products that were imported
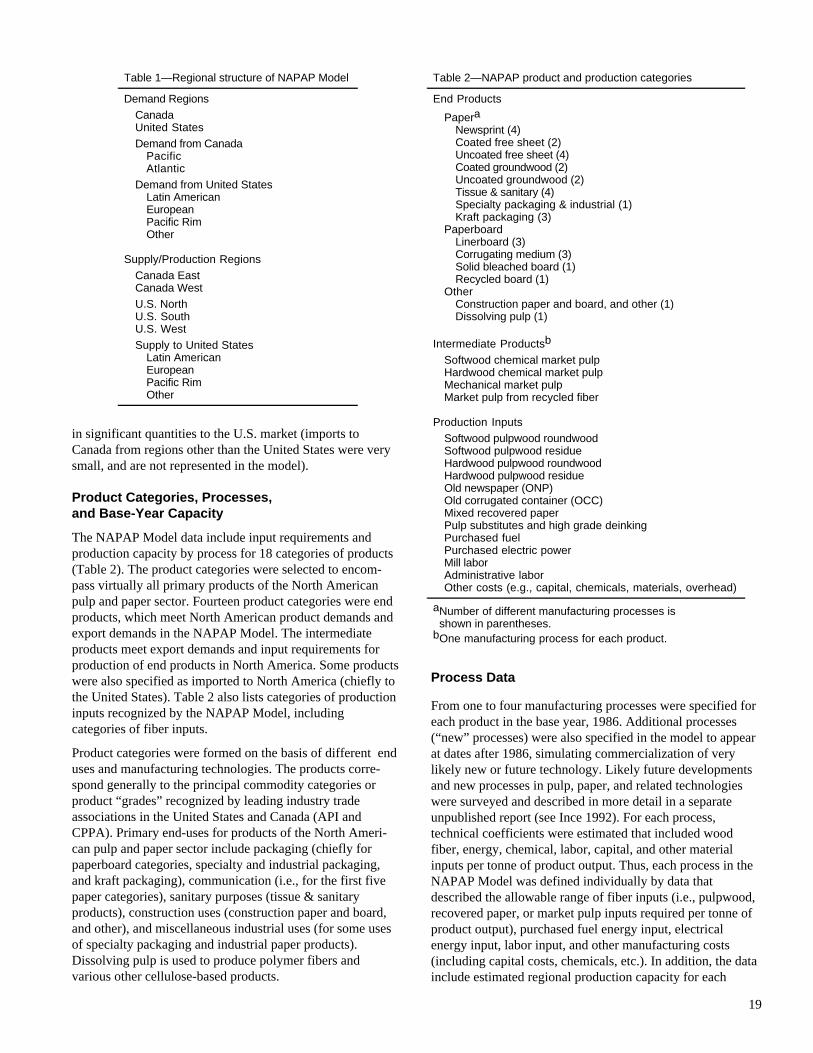
19
in significant quantities to the U.S. market (imports toCanada from regions other than the United States were verysmall, and are not represented in the model).
Product Categories, Processes,and Base-Year Capacity
The NAPAP Model data include input requirements andproduction capacity by process for 18 categories of products(Table 2). The product categories were selected to encom-pass virtually all primary products of the North Americanpulp and paper sector. Fourteen product categories were endproducts, which meet North American product demands andexport demands in the NAPAP Model. The intermediateproducts meet export demands and input requirements forproduction of end products in North America. Some productswere also specified as imported to North America (chiefly tothe United States). Table 2 also lists categories of productioninputs recognized by the NAPAP Model, includingcategories of fiber inputs.
Product categories were formed on the basis of different enduses and manufacturing technologies. The products corre-spond generally to the principal commodity categories orproduct “grades” recognized by leading industry tradeassociations in the United States and Canada (API andCPPA). Primary end-uses for products of the North Ameri-can pulp and paper sector include packaging (chiefly forpaperboard categories, specialty and industrial packaging,and kraft packaging), communication (i.e., for the first fivepaper categories), sanitary purposes (tissue & sanitaryproducts), construction uses (construction paper and board,and other), and miscellaneous industrial uses (for some usesof specialty packaging and industrial paper products).Dissolving pulp is used to produce polymer fibers andvarious other cellulose-based products.
Process Data
From one to four manufacturing processes were specified foreach product in the base year, 1986. Additional processes(“new” processes) were also specified in the model to appearat dates after 1986, simulating commercialization of verylikely new or future technology. Likely future developmentsand new processes in pulp, paper, and related technologieswere surveyed and described in more detail in a separateunpublished report (see Ince 1992). For each process,technical coefficients were estimated that included woodfiber, energy, chemical, labor, capital, and other materialinputs per tonne of product output. Thus, each process in theNAPAP Model was defined individually by data thatdescribed the allowable range of fiber inputs (i.e., pulpwood,recovered paper, or market pulp inputs required per tonne ofproduct output), purchased fuel energy input, electricalenergy input, labor input, and other manufacturing costs(including capital costs, chemicals, etc.). In addition, the datainclude estimated regional production capacity for each
Table 1—Regional structure of NAPAP Model
Demand RegionsCanadaUnited StatesDemand from Canada
PacificAtlantic
Demand from United StatesLatin American European Pacific Rim Other
Supply/Production RegionsCanada EastCanada WestU.S. NorthU.S. SouthU.S. WestSupply to United States
Latin AmericanEuropean Pacific Rim Other
Table 2—NAPAP product and production categories
End Products
PaperaNewsprint (4) Coated free sheet (2)Uncoated free sheet (4) Coated groundwood (2) Uncoated groundwood (2)Tissue & sanitary (4) Specialty packaging & industrial (1)Kraft packaging (3)
Paperboard Linerboard (3)
Corrugating medium (3)Solid bleached board (1) Recycled board (1)
OtherConstruction paper and board, and other (1)Dissolving pulp (1)
Intermediate Productsb
Softwood chemical market pulpHardwood chemical market pulpMechanical market pulpMarket pulp from recycled fiber
Production InputsSoftwood pulpwood roundwood Softwood pulpwood residueHardwood pulpwood roundwoodHardwood pulpwood residueOld newspaper (ONP)Old corrugated container (OCC)Mixed recovered paperPulp substitutes and high grade deinkingPurchased fuelPurchased electric powerMill laborAdministrative laborOther costs (e.g., capital, chemicals, materials, overhead)
aNumber of different manufacturing processes is shown in parentheses.bOne manufacturing process for each product.

20
purpose of the NAPAP Model, the four processes werecharacterized as follows:
Process 1: Based on integrated mechanical andchemical pulping facilities. On average, Process 1 useda furnish mix of approximately 75 percent mechanicalpulp and 25 percent chemical pulp. The mechanicalpulp was mostly stone groundwood. The chemical pulpwas mostly sulfite pulp in Canada and bleached kraftin the United States.
Process 2: Based on integrated mechanical pulpingfacilities, with no integrated chemical pulping. Process 2used mostly thermomechanical pulp (TMP), with about10 percent bleached chemical pulp. Generally, mills hadto mix the TMP with about 10 percent bleached kraftmarket pulp to produce newsprint.
Process 3: Based entirely on secondary (recycled)fiber, using primarily old newspapers (ONP).
Process 4: Based on integrated mechanical pulpingfacilities in Canada, using 100 percent TMP or chemi-thermomechanical pulp (CTMP), with no chemicalpulp furnish. Process 4 was confined to Canada in1986 (TMP mills in the United States used 10 percentbleached chemical pulp, as indicated by Process 2).
In many cases, newsprint mills used more than one process.For example, some newsprint mills used a combination of50 percent TMP and 50 percent recycled fiber in 1986. Thenewsprint industry in North America was examined in detail,using industry directories and other published sources ofinformation (Post’s and Lockwood’s directories, andcompany profiles). Mill data were used to infer regionaldistribution of production capacity by process for newsprintin 1986, using capacity data published by API and CPPA asthe measure of overall capacity by region. Newsprint base-year capacity data are shown in Table 3.
In addition to newsprint manufacturing processes that existedin 1986, two newsprint processes were introduced in theNAPAP Model to simulate new process technologies that
process in 1986, the base year of the NAPAP Model. Themodel projects evolution of production capacity by processand region over time.
The following sections describe NAPAP Model process dataand input assumptions separately for each product category.Fiber inputs are shown in tonnes of fiber input per tonne ofproduct output with the following moisture content conven-tions: pulpwood inputs are expressed in cubic meters of solidwood equivalent, market pulp inputs are in “air-dry” tonnes(at 10 percent moisture content, total weight basis), andrecovered paper inputs are in “tonnes as purchased” (gen-erally at ambient moisture content of around 15 percent).Many processes were defined with an allowable range offiber inputs, which permits the process to accept more thanone combination or “mix” of fiber inputs. This feature of themodel simulates technological substitution possibilities andshows the maximum ranges of hardwood, softwood, orrecycled fiber inputs allowed for each process (generally theallowable types of fiber inputs in each process are limitedbecause of inherent fiber quality requirements of products,such as requirements for product strength, printability,opacity, smoothness, and sanitary considerations).
Regional differences in data for each process were estimatedto account for differences in regional heat energy require-ments and wood density. Higher energy inputs in the U.S.North and Canada were associated with operation in colderclimates. Pulpwood and recovered paper input requirementstake into account pulp yield and fiber recovery factors.Substantial differences exist in wood density (specificgravity) for pulpwood consumed in different regions, whichaccount for differences in wood volume input requirementsby region. Wage rates and energy price data varied byregion. Capital costs and chemical costs were also adjustedby small amounts for Canada.
Newsprint
This commodity category includes the newsprint graderecognized by the API in the United States and the newsprintgrade recognized by the CPPA in Canada. It includes bothnewsprint produced from recycled fiber and newsprintproduced from virgin fiber. It is used chiefly in printing dailynewspapers. Newspapers account for three-fourths ofnewsprint consumed in North America. Smaller quantitiesare used by government printers, and by commercial printersfor uses such as newspaper inserts and advertising pam-phlets. Newsprint is made largely from mechanical woodpulp with some chemical wood pulp and recycled fiber. Thiscommodity category excludes uncoated groundwood printingand writing paper (such as directory paper). Productioncapacity for newsprint in 1986 was 9,885,000 tonnes inCanada (Source: CPPA) and 5,276,000 tonnes in the UnitedStates (Source: API). In 1986, there were generally fourtypes of manufacturing processes for producing newsprint inNorth America, as identified by review of mill listings andtechnical literature of the pulp and paper industry. For the
Table 3—Regional distribution of newsprint productioncapacity by process in North America, 1986
Distribution (×103 t/year)
Region Process
1Process
2Process
3Process
4 Total
U.S. North
275 — 349 — 624
U.S. South
1,514 1,336 119 — 2,969
U.S. West
168 1,010 505 — 1,683
Canada East
4,410 1,764 98 1,764 8,036
Canada West
980 — — 784 1,764

21
will become commercially available after 1986. Technologi-cal developments will be facilitated by continued expansionof twin-wire forming technology (enabling better utilizationof lower quality fiber), improved methods for removing inrecycled fiber contaminants, improved bleaching technolo-gies, further development of improved mechanical pulpingmethods, improved pressing and drying technology, im-proved printability, advances in biological effluent treatmentsystems, environmental responses, and market demand forproducts that contain substantial fractions of recycled fiber.The two new manufacturing processes for newsprint weredefined as follows:
Process 5: This new process represents the NorthAmerican application of flotation deinking technologyto produce newsprint from recycled fiber, with30 percent of fiber furnished from coated mixed paper,such as old magazines (and 70 percent of fiberfurnished from ONP). Process 5 affords somewhathigher efficiency than the conventional recyclednewsprint process (Process 3). This type of processactually began to be introduced in North Americaaround 1988, and it is introduced in the NAPAP Modeldata base at that point in time.
Process 6: This new process represents anticipatedNorth American development of a newsprint processutilizing advanced pressing technology (such as pressdrying, impulse drying, or related technology) and100 percent mechanical pulp (TMP or CTMP). Thetechnology has been demonstrated in laboratorystudies and represents a likely future advance innewsprint technology. The technology affords processcost savings and a higher proportion of hardwood fiberin newsprint. In the NAPAP Model data base, it is
assumed that Process 6 becomes available for commer-cial adoption in the year 2000.
Table 4 summarizes NAPAP Model base-level fiber inputassumptions for the six newsprint manufacturing processes.Fillers and coatings are assumed to constitute less than1 percent of the final product by weight.
Table 5 summarizes NAPAP Model base-level inputcoefficients and costs by region for the six newsprintmanufacturing processes.
Coated Free Sheet
This commodity category includes the coated free sheet cate-gory recognized by API in the United States and a smallportion of the book, fine & miscellaneous fine paper cate-gory recognized by CPPA in Canada. Included are heavilyclay-coated woodfree papers containing generally less than10 percent mechanical pulp. Coated free sheet is used pri-marily for high quality printing paper, mainly by commercialprinters. Primary end-uses include annual reports, specialtycatalogs, advertising or promotional materials, and maga-zines. Most of the product is made with a glossy finish(about two-thirds) while some is produced with dull finish(about one-third) and small amounts are produced with matteor embossed finishes. Production capacity in 1986 was2,676,000 tonnes in the United States (API) and 140,000tonnes in Canada (estimated as a small fraction of capacityfor Book, Fine & Miscellaneous Fine Papers as reported byCPPA). In 1986, there were generally two types of manufac-turing processes for producing coated free sheet in NorthAmerica, as identified by review of mill listings and techni-cal literature of the pulp and paper industry. For the purposeof the NAPAP Model, the two processes were characterizedas follows:
Table 4—Base-level fiber input assumptions for newsprint manufacturing processes in the NAPAP Model
Fiber input (percent)
Fiber source Process 1 Process 2 Process 3 Process 4 Process 5 Process 6
Integrated pulp Groundwood 75 — — — — — Bleached chemical 25 — — — — — TMP/CTMP — 90 — 100 — 100Market pulp Softwood chemical — 10 — — — — Recycled fiber Old newspapers — — 100 — 70 — Mixed paper — — — — 30 —
Maximum softwood fibera Groundwood 100 — — — — — Bleached chemical 100 — — — — — TMP/CTMP — 100 — 100 — 100
Maximum hardwood fibera
Groundwood 10 — — — — — Bleached chemical 20 — — — — — TMP/CTMP — 10 — 10 — 30
aMaximum amount allowed in pulp.
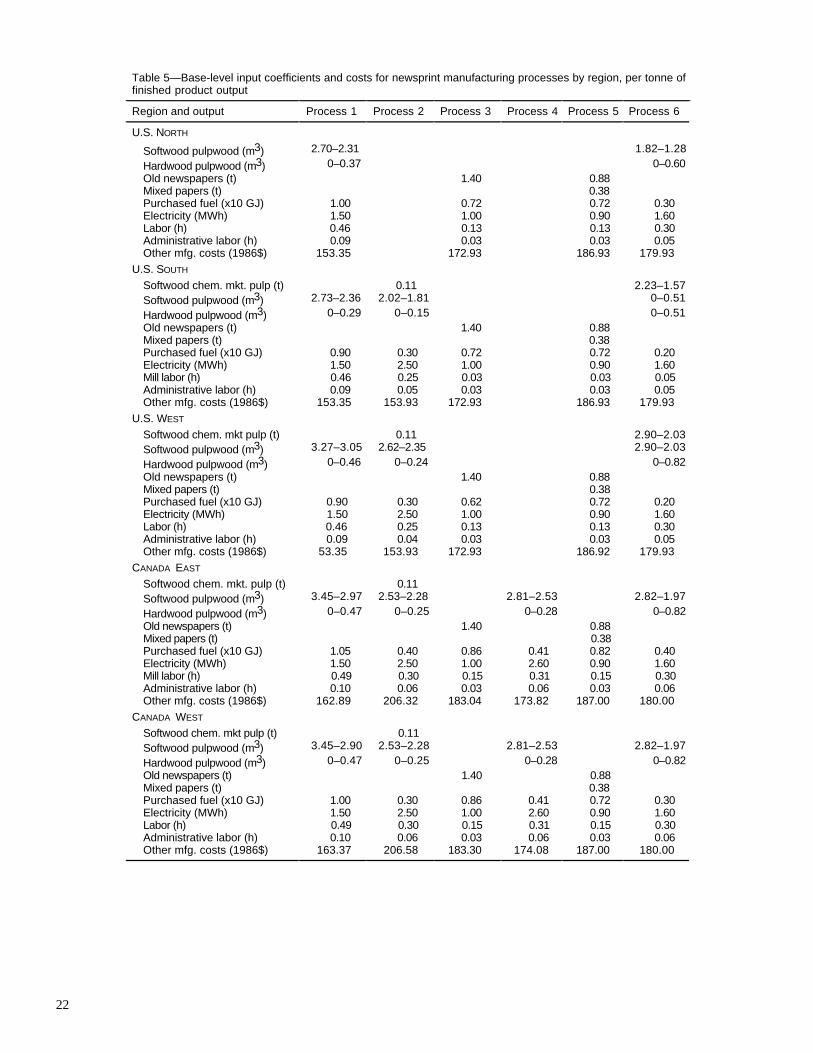
22
Table 5—Base-level input coefficients and costs for newsprint manufacturing processes by region, per tonne of finished product output
Region and output Process 1 Process 2 Process 3 Process 4 Process 5 Process 6
U.S. NORTH
Softwood pulpwood (m3) 2.70–2.31 1.82–1.28
Hardwood pulpwood (m3) 0–0.37 0–0.60Old newspapers (t) 1.40 0.88Mixed papers (t) 0.38Purchased fuel (x10 GJ) 1.00 0.72 0.72 0.30Electricity (MWh) 1.50 1.00 0.90 1.60Labor (h) 0.46 0.13 0.13 0.30Administrative labor (h) 0.09 0.03 0.03 0.05Other mfg. costs (1986$) 153.35 172.93 186.93 179.93
U.S. SOUTH Softwood chem. mkt. pulp (t) 0.11 2.23–1.57Softwood pulpwood (m3) 2.73–2.36 2.02–1.81 0–0.51
Hardwood pulpwood (m3) 0–0.29 0–0.15 0–0.51Old newspapers (t) 1.40 0.88Mixed papers (t) 0.38Purchased fuel (x10 GJ) 0.90 0.30 0.72 0.72 0.20Electricity (MWh) 1.50 2.50 1.00 0.90 1.60Mill labor (h) 0.46 0.25 0.03 0.03 0.05Administrative labor (h) 0.09 0.05 0.03 0.03 0.05Other mfg. costs (1986$) 153.35 153.93 172.93 186.93 179.93
U.S. WEST Softwood chem. mkt pulp (t) 0.11 2.90–2.03Softwood pulpwood (m3) 3.27–3.05 2.62–2.35 2.90–2.03
Hardwood pulpwood (m3) 0–0.46 0–0.24 0–0.82Old newspapers (t) 1.40 0.88Mixed papers (t) 0.38Purchased fuel (x10 GJ) 0.90 0.30 0.62 0.72 0.20Electricity (MWh) 1.50 2.50 1.00 0.90 1.60Labor (h) 0.46 0.25 0.13 0.13 0.30Administrative labor (h) 0.09 0.04 0.03 0.03 0.05Other mfg. costs (1986$) 53.35 153.93 172.93 186.92 179.93
CANADA EAST
Softwood chem. mkt. pulp (t) 0.11Softwood pulpwood (m3) 3.45–2.97 2.53–2.28 2.81–2.53 2.82–1.97
Hardwood pulpwood (m3) 0–0.47 0–0.25 0–0.28 0–0.82Old newspapers (t) 1.40 0.88Mixed papers (t) 0.38Purchased fuel (x10 GJ) 1.05 0.40 0.86 0.41 0.82 0.40Electricity (MWh) 1.50 2.50 1.00 2.60 0.90 1.60Mill labor (h) 0.49 0.30 0.15 0.31 0.15 0.30Administrative labor (h) 0.10 0.06 0.03 0.06 0.03 0.06Other mfg. costs (1986$) 162.89 206.32 183.04 173.82 187.00 180.00
CANADA WEST Softwood chem. mkt pulp (t) 0.11Softwood pulpwood (m3) 3.45–2.90 2.53–2.28 2.81–2.53 2.82–1.97
Hardwood pulpwood (m3) 0–0.47 0–0.25 0–0.28 0–0.82Old newspapers (t) 1.40 0.88Mixed papers (t) 0.38Purchased fuel (x10 GJ) 1.00 0.30 0.86 0.41 0.72 0.30Electricity (MWh) 1.50 2.50 1.00 2.60 0.90 1.60Labor (h) 0.49 0.30 0.15 0.31 0.15 0.30Administrative labor (h) 0.10 0.06 0.03 0.06 0.03 0.06Other mfg. costs (1986$) 163.37 206.58 183.30 174.08 187.00 180.00
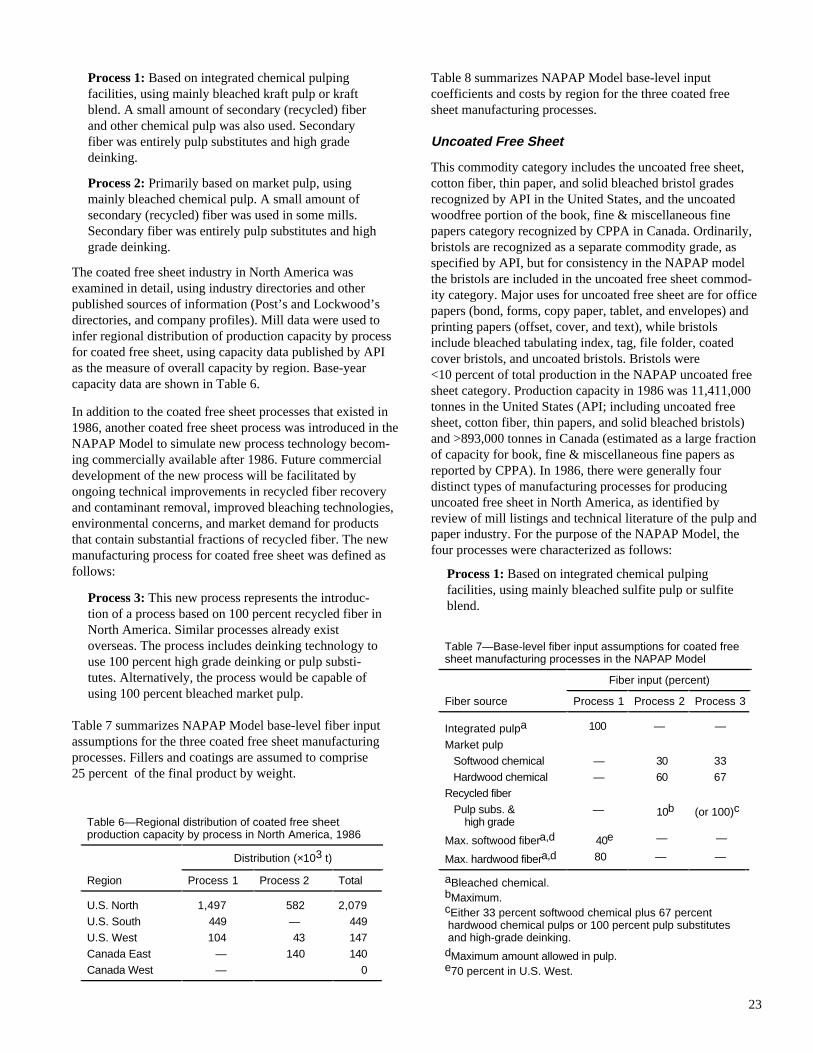
23
Process 1: Based on integrated chemical pulpingfacilities, using mainly bleached kraft pulp or kraftblend. A small amount of secondary (recycled) fiberand other chemical pulp was also used. Secondaryfiber was entirely pulp substitutes and high gradedeinking.
Process 2: Primarily based on market pulp, usingmainly bleached chemical pulp. A small amount ofsecondary (recycled) fiber was used in some mills.Secondary fiber was entirely pulp substitutes and highgrade deinking.
The coated free sheet industry in North America wasexamined in detail, using industry directories and otherpublished sources of information (Post’s and Lockwood’sdirectories, and company profiles). Mill data were used toinfer regional distribution of production capacity by processfor coated free sheet, using capacity data published by APIas the measure of overall capacity by region. Base-yearcapacity data are shown in Table 6.
In addition to the coated free sheet processes that existed in1986, another coated free sheet process was introduced in theNAPAP Model to simulate new process technology becom-ing commercially available after 1986. Future commercialdevelopment of the new process will be facilitated byongoing technical improvements in recycled fiber recoveryand contaminant removal, improved bleaching technologies,environmental concerns, and market demand for productsthat contain substantial fractions of recycled fiber. The newmanufacturing process for coated free sheet was defined asfollows:
Process 3: This new process represents the introduc-tion of a process based on 100 percent recycled fiber inNorth America. Similar processes already existoverseas. The process includes deinking technology touse 100 percent high grade deinking or pulp substi-tutes. Alternatively, the process would be capable ofusing 100 percent bleached market pulp.
Table 7 summarizes NAPAP Model base-level fiber inputassumptions for the three coated free sheet manufacturingprocesses. Fillers and coatings are assumed to comprise25 percent of the final product by weight.
Table 8 summarizes NAPAP Model base-level inputcoefficients and costs by region for the three coated freesheet manufacturing processes.
Uncoated Free Sheet
This commodity category includes the uncoated free sheet,cotton fiber, thin paper, and solid bleached bristol gradesrecognized by API in the United States, and the uncoatedwoodfree portion of the book, fine & miscellaneous finepapers category recognized by CPPA in Canada. Ordinarily,bristols are recognized as a separate commodity grade, asspecified by API, but for consistency in the NAPAP modelthe bristols are included in the uncoated free sheet commod-ity category. Major uses for uncoated free sheet are for officepapers (bond, forms, copy paper, tablet, and envelopes) andprinting papers (offset, cover, and text), while bristolsinclude bleached tabulating index, tag, file folder, coatedcover bristols, and uncoated bristols. Bristols were<10 percent of total production in the NAPAP uncoated freesheet category. Production capacity in 1986 was 11,411,000tonnes in the United States (API; including uncoated freesheet, cotton fiber, thin papers, and solid bleached bristols)and >893,000 tonnes in Canada (estimated as a large fractionof capacity for book, fine & miscellaneous fine papers asreported by CPPA). In 1986, there were generally fourdistinct types of manufacturing processes for producinguncoated free sheet in North America, as identified byreview of mill listings and technical literature of the pulp andpaper industry. For the purpose of the NAPAP Model, thefour processes were characterized as follows:
Process 1: Based on integrated chemical pulpingfacilities, using mainly bleached sulfite pulp or sulfiteblend.
Table 6—Regional distribution of coated free sheetproduction capacity by process in North America, 1986
Distribution (×103 t)
Region Process 1 Process 2 Total
U.S. North 1,497 582 2,079U.S. South 449 — 449U.S. West 104 43 147Canada East — 140 140Canada West — 0
Table 7—Base-level fiber input assumptions for coated free sheet manufacturing processes in the NAPAP Model
Fiber input (percent)
Fiber source Process 1 Process 2 Process 3
Integrated pulpa 100 — —
Market pulp Softwood chemical — 30 33 Hardwood chemical — 60 67Recycled fiber Pulp subs. & high grade
— 10b (or 100)c
Max. softwood fibera,d 40e — —
Max. hardwood fibera,d 80 — —
aBleached chemical.bMaximum.cEither 33 percent softwood chemical plus 67 percent hardwood chemical pulps or 100 percent pulp substitutes and high-grade deinking.dMaximum amount allowed in pulp.e70 percent in U.S. West.

24
Table 9—Regional distribution of uncoated free sheet productioncapacity by process in North America, 1986
Distribution (×103 t)
Region Process 1 Process 2 Process 3 Process 4 Total
U.S. North 922 1,573 2,170 760 5,425U.S. South — 4,425 282 — 4,707U.S.West — 881 166 230 1,277Canada East — 372 34 64 779Canada West — — 114 — 114
Table 8—Base-level input coefficients and costs for coated free sheetmanufacturing processes by region, per tonne of finished product output
Region and output Process 1a Process 2 Process 3
U.S. NORTH
Softwood chem. mkt. pulp (t) 0.27–0.24 0–0.27Hardwood chem. mkt. pulp (t) 0.53–0.48 0–0.53Softwood pulpwood (m3) 1.30–0.65 (or 1.17)
Hardwood pulpwood (m3) 1.85–2.48 (or 1.67)Pulp subs. & high grade (t) (+0.09) 0–0.09 1.05–0Purchased fuel (x10 GJ) 1.13 0.74 0.90Electricity (MWh) 1.20 1.00 1.10Labor (h) 0.28 0.19 0.28Administrative labor (h) 0.11 0.11 0.11Other mfg. costs (1986$) 274.63 185.08 185.00
U.S. SOUTH Softwood chem. mkt. pulp (t) 0–0.27Hardwood chem. mkt. pulp (t) 0–0.53Softwood pulpwood (m3) 1.32–0.65 (or 1.19)
Hardwood pulpwood (m3) 1.49–1.98 (or 1.34)Pulp subs. & high grade (t) (+0.09) 1.05–0Purchased fuel (x10 GJ) 1.03 0.80Electricity (MWh) 1.20 1.10Labor (h) 0.28 0.28Administrative labor (h) 0.11 0.11Other mfg. costs (1986$) 274.63 185.00
U.S. WESTSoftwood chem. mkt. pulp (t) 0.27–0.24 0–0.27Hardwood chem. mkt. pulp (t) 0.53–0.48 0–0.53Softwood pulpwood (m3) 2.98–0.86 (or 1.54)
Hardwood pulpwood (m3) 1.18–3.15 (or 2.13)Pulp subs. & high grade (t) (+0.09) 0–0.09 1.05–0Purchased fuel (x10 GJ) 1.03 0.64 0.80Electricity (MWh) 1.20 1.00 1.10Labor (h) 0.28 0.19 0.28Administrative labor (h) 0.11 0.11 0.11Other mfg. costs (1986$) 274.63 185.08 185.00
CANADA EASTSoftwood chem. mkt. pulp (t) 0.27–0.24 0–0.27Hardwood chem. mkt. pulp (t) 0.53–0.48 0–0.53Pulp subs. & high grade (t) 0–0.09 1.05–0Purchased fuel (x10 GJ) 0.84 1.00Electricity (MWh) 1.00 1.10Labor (h) 0.19 0.28Administrative labor (h) 0.11 0.11Other mfg. costs (1986$) 203.38 185.00
CANADA WESTSoftwood chem. mkt. pulp (t) 0.27–0.24 0–0.27Hardwood chem. mkt. pulp (t) 0.53–0.48 0–0.53Pulp subs. & high grade (t) 0–0.09 1.05–0Purchased fuel (x10 GJ) 0.74 0.90Electricity (MWh) 1.00 .10Labor (h) 0.19 0.28Administrative labor (h) 0.11 0.11Other mfg. costs (1986$) 203.45 185.00
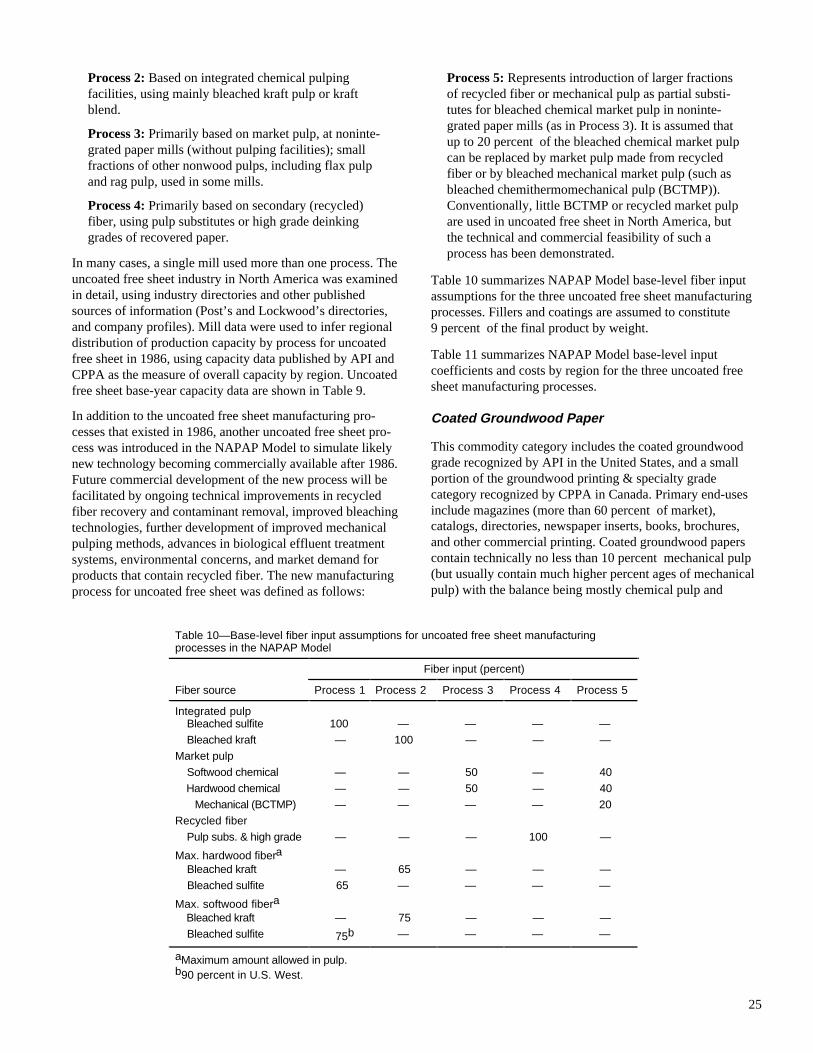
25
Process 2: Based on integrated chemical pulpingfacilities, using mainly bleached kraft pulp or kraftblend.
Process 3: Primarily based on market pulp, at noninte-grated paper mills (without pulping facilities); smallfractions of other nonwood pulps, including flax pulpand rag pulp, used in some mills.
Process 4: Primarily based on secondary (recycled)fiber, using pulp substitutes or high grade deinkinggrades of recovered paper.
In many cases, a single mill used more than one process. Theuncoated free sheet industry in North America was examinedin detail, using industry directories and other publishedsources of information (Post’s and Lockwood’s directories,and company profiles). Mill data were used to infer regionaldistribution of production capacity by process for uncoatedfree sheet in 1986, using capacity data published by API andCPPA as the measure of overall capacity by region. Uncoatedfree sheet base-year capacity data are shown in Table 9.
In addition to the uncoated free sheet manufacturing pro-cesses that existed in 1986, another uncoated free sheet pro-cess was introduced in the NAPAP Model to simulate likelynew technology becoming commercially available after 1986.Future commercial development of the new process will befacilitated by ongoing technical improvements in recycledfiber recovery and contaminant removal, improved bleachingtechnologies, further development of improved mechanicalpulping methods, advances in biological effluent treatmentsystems, environmental concerns, and market demand forproducts that contain recycled fiber. The new manufacturingprocess for uncoated free sheet was defined as follows:
Process 5: Represents introduction of larger fractionsof recycled fiber or mechanical pulp as partial substi-tutes for bleached chemical market pulp in noninte-grated paper mills (as in Process 3). It is assumed thatup to 20 percent of the bleached chemical market pulpcan be replaced by market pulp made from recycledfiber or by bleached mechanical market pulp (such asbleached chemithermomechanical pulp (BCTMP)).Conventionally, little BCTMP or recycled market pulpare used in uncoated free sheet in North America, butthe technical and commercial feasibility of such aprocess has been demonstrated.
Table 10 summarizes NAPAP Model base-level fiber inputassumptions for the three uncoated free sheet manufacturingprocesses. Fillers and coatings are assumed to constitute9 percent of the final product by weight.
Table 11 summarizes NAPAP Model base-level inputcoefficients and costs by region for the three uncoated freesheet manufacturing processes.
Coated Groundwood Paper
This commodity category includes the coated groundwoodgrade recognized by API in the United States, and a smallportion of the groundwood printing & specialty gradecategory recognized by CPPA in Canada. Primary end-usesinclude magazines (more than 60 percent of market),catalogs, directories, newspaper inserts, books, brochures,and other commercial printing. Coated groundwood paperscontain technically no less than 10 percent mechanical pulp(but usually contain much higher percent ages of mechanicalpulp) with the balance being mostly chemical pulp and
Table 10—Base-level fiber input assumptions for uncoated free sheet manufacturingprocesses in the NAPAP Model
Fiber input (percent)
Fiber source Process 1 Process 2 Process 3 Process 4 Process 5
Integrated pulp Bleached sulfite 100 — — — — Bleached kraft — 100 — — —Market pulp Softwood chemical — — 50 — 40 Hardwood chemical — — 50 — 40 Mechanical (BCTMP) — — — — 20Recycled fiber Pulp subs. & high grade — — — 100 —
Max. hardwood fibera
Bleached kraft — 65 — — — Bleached sulfite 65 — — — —
Max. softwood fibera
Bleached kraft — 75 — — — Bleached sulfite 75b — — — —
aMaximum amount allowed in pulp.b90 percent in U.S. West.

26
Table 11—Base-level input coefficients and costs for uncoated free sheet manufacturingprocesses per tonne of finished product
Region and output Process 1 Process 2 Process 3 Process 4 Process 5
U.S. NORTHSoftwood chem. mkt. pulp (t) 0.48 0.39Hardwood chem. mkt. pulp (t) 0.48 0.39Mechanical market pulp (t) 0.19Softwood pulpwood (m3) 3.15–1.47 3.02–1.41
Hardwood pulpwood (m3) 1.01–2.61 0.96–2.49Pulp subs. & high grade (t) 1.20Purchased fuel (x10 GJ) 1.50 1.39 0.90 0.80 0.80Electricity (MWh) 1.20 1.00 0.80 1.10 0.80Labor (h) 0.25 0.21 0.19 0.42 0.17Administrative labor (h) 0.12 0.11 0.11 0.13 0.10Other mfg. costs (1986$) 271.60 253.35 210.37 280.15 183.03
U.S. SOUTHSoftwood chem. mkt. pulp (t) 0.48 0.39Hardwood chem. mkt. pulp (t) 0.48 0.39Mechanical market pulp (t) 0.19Softwood pulpwood (m3) 3.06–1.43
Hardwood pulpwood (m3) 0.77–2.00Purchased fuel (x10 GJ) 1.29 0.80 0.80Electricity (MWh) 1.00 0.80 0.80Labor (h) 0.21 0.19 0.17Administrative labor (h) 0.11 0.11 0.10Other mfg. costs (1986$) 253.35 210.37 83.03
U.S. WEST Softwood chem. mkt. pulp (t) 0.48 0.39Hardwood chem. mkt. pulp (t) 0.48 0.39Mechanical market pulp (t) 0.19Softwood pulpwood (m3) 4.74–1.85
Hardwood pulpwood (m3 0.49–3.17Pulp subs. & high grade (t) 1.20Purchased fuel (x10 GJ) 1.29 0.80 0.80 0.80Electricity (MWh) 1.00 0.80 1.10 0.80Labor (h) 0.21 0.19 0.42 0.17Administrative labor (h) 0.11 0.11 0.13 0.10Other mfg. costs (1986$) 253.35 210.37 280.15 183.03
CANADA EASTSoftwood chem. mkt. pulp (t) 0.48 0.39Hardwood chem. mkt. pulp (t) 0.48 0.39Mechanical market pulp (t) 0.19Softwood pulpwood (m3) 4.03–1.89 3.86–1.81
Hardwood pulpwood (m3) 1.33–3.47 1.28–3.33Pulp subs. & high grade (t) 1.20Purchased fuel (x10 GJ) 1.60 1.49 1.00 1.00 0.90Electricity (MWh) 1.20 1.00 0.80 1.10 0.80Labor (h) 0.32 0.30 0.19 0.34 0.17Administrative labor (h) 0.15 0.15 0.11 0.10 0.10Other mfg. costs (1986$) 272.89 268.95 195.59 295.29 211.17
CANADA WEST Softwood chem. mkt. pulp (t) 0.48 0.39Hardwood chem. mkt. pulp (t) 0.48 0.39Mechanical market pulp (t) 0.19Softwood pulpwood (m3) 3.86–1.81
Hardwood pulpwood (m3) 1.28–3.33Pulp subs. & high grade (t) Purchased fuel (x10 GJ) 1.39 0.90 0.80Electricity (MWh) 1.00 0.80 0.80Labor (h) 0.30 0.19 0.17Administrative labor (h) 0.15 0.11 0.10Other mfg. costs (1986$) 269.34 195.68 211.19
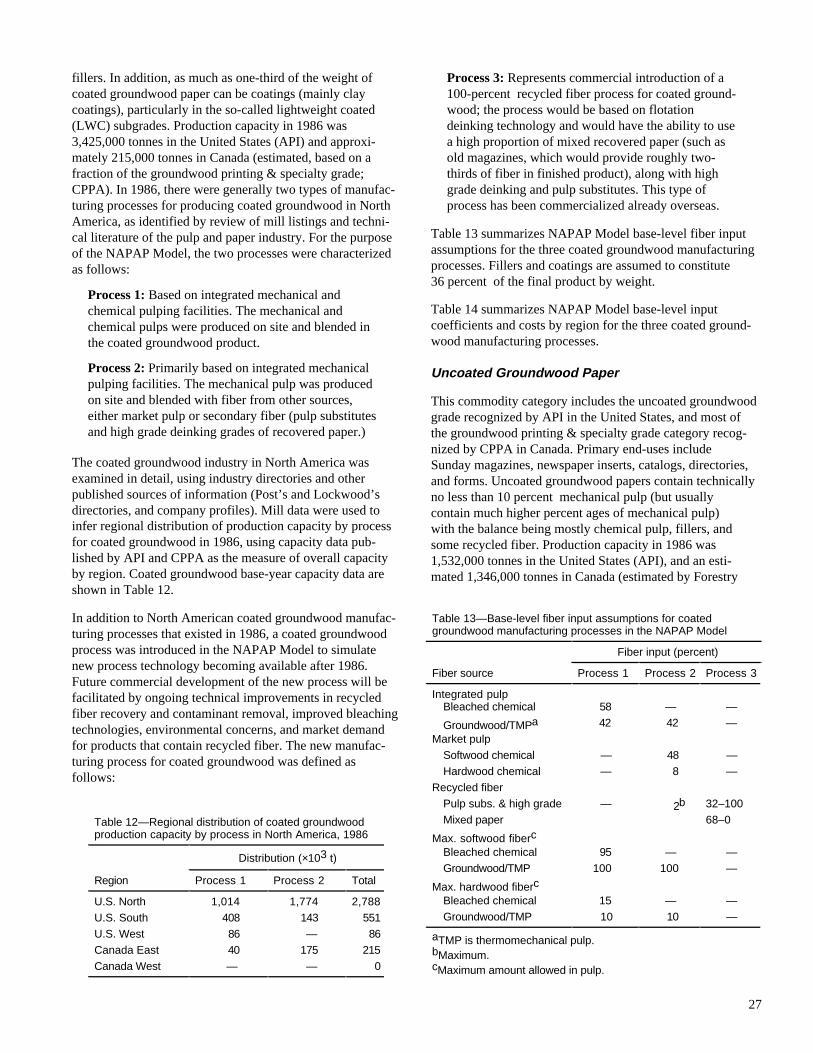
27
fillers. In addition, as much as one-third of the weight ofcoated groundwood paper can be coatings (mainly claycoatings), particularly in the so-called lightweight coated(LWC) subgrades. Production capacity in 1986 was3,425,000 tonnes in the United States (API) and approxi-mately 215,000 tonnes in Canada (estimated, based on afraction of the groundwood printing & specialty grade;CPPA). In 1986, there were generally two types of manufac-turing processes for producing coated groundwood in NorthAmerica, as identified by review of mill listings and techni-cal literature of the pulp and paper industry. For the purposeof the NAPAP Model, the two processes were characterizedas follows:
Process 1: Based on integrated mechanical andchemical pulping facilities. The mechanical andchemical pulps were produced on site and blended inthe coated groundwood product.
Process 2: Primarily based on integrated mechanicalpulping facilities. The mechanical pulp was producedon site and blended with fiber from other sources,either market pulp or secondary fiber (pulp substitutesand high grade deinking grades of recovered paper.)
The coated groundwood industry in North America wasexamined in detail, using industry directories and otherpublished sources of information (Post’s and Lockwood’sdirectories, and company profiles). Mill data were used toinfer regional distribution of production capacity by processfor coated groundwood in 1986, using capacity data pub-lished by API and CPPA as the measure of overall capacityby region. Coated groundwood base-year capacity data areshown in Table 12.
In addition to North American coated groundwood manufac-turing processes that existed in 1986, a coated groundwoodprocess was introduced in the NAPAP Model to simulatenew process technology becoming available after 1986.Future commercial development of the new process will befacilitated by ongoing technical improvements in recycledfiber recovery and contaminant removal, improved bleachingtechnologies, environmental concerns, and market demandfor products that contain recycled fiber. The new manufac-turing process for coated groundwood was defined asfollows:
Process 3: Represents commercial introduction of a100-percent recycled fiber process for coated ground-wood; the process would be based on flotationdeinking technology and would have the ability to usea high proportion of mixed recovered paper (such asold magazines, which would provide roughly two-thirds of fiber in finished product), along with highgrade deinking and pulp substitutes. This type ofprocess has been commercialized already overseas.
Table 13 summarizes NAPAP Model base-level fiber inputassumptions for the three coated groundwood manufacturingprocesses. Fillers and coatings are assumed to constitute36 percent of the final product by weight.
Table 14 summarizes NAPAP Model base-level inputcoefficients and costs by region for the three coated ground-wood manufacturing processes.
Uncoated Groundwood Paper
This commodity category includes the uncoated groundwoodgrade recognized by API in the United States, and most ofthe groundwood printing & specialty grade category recog-nized by CPPA in Canada. Primary end-uses includeSunday magazines, newspaper inserts, catalogs, directories,and forms. Uncoated groundwood papers contain technicallyno less than 10 percent mechanical pulp (but usuallycontain much higher percent ages of mechanical pulp)with the balance being mostly chemical pulp, fillers, andsome recycled fiber. Production capacity in 1986 was1,532,000 tonnes in the United States (API), and an esti-mated 1,346,000 tonnes in Canada (estimated by Forestry
Table 12—Regional distribution of coated groundwoodproduction capacity by process in North America, 1986
Distribution (×103 t)
Region Process 1 Process 2 Total
U.S. North 1,014 1,774 2,788U.S. South 408 143 551U.S. West 86 — 86Canada East 40 175 215Canada West — — 0
Table 13—Base-level fiber input assumptions for coatedgroundwood manufacturing processes in the NAPAP Model
Fiber input (percent)
Fiber source Process 1 Process 2 Process 3
Integrated pulpBleached chemical 58 — —
Groundwood/TMPa 42 42 —Market pulp
Softwood chemical — 48 —Hardwood chemical — 8 —
Recycled fiber Pulp subs. & high grade — 2b 32–100Mixed paper 68–0
Max. softwood fiberc
Bleached chemical 95 — — Groundwood/TMP 100 100 —
Max. hardwood fiberc
Bleached chemical 15 — —Groundwood/TMP 10 10 —
aTMP is thermomechanical pulp.bMaximum.cMaximum amount allowed in pulp.
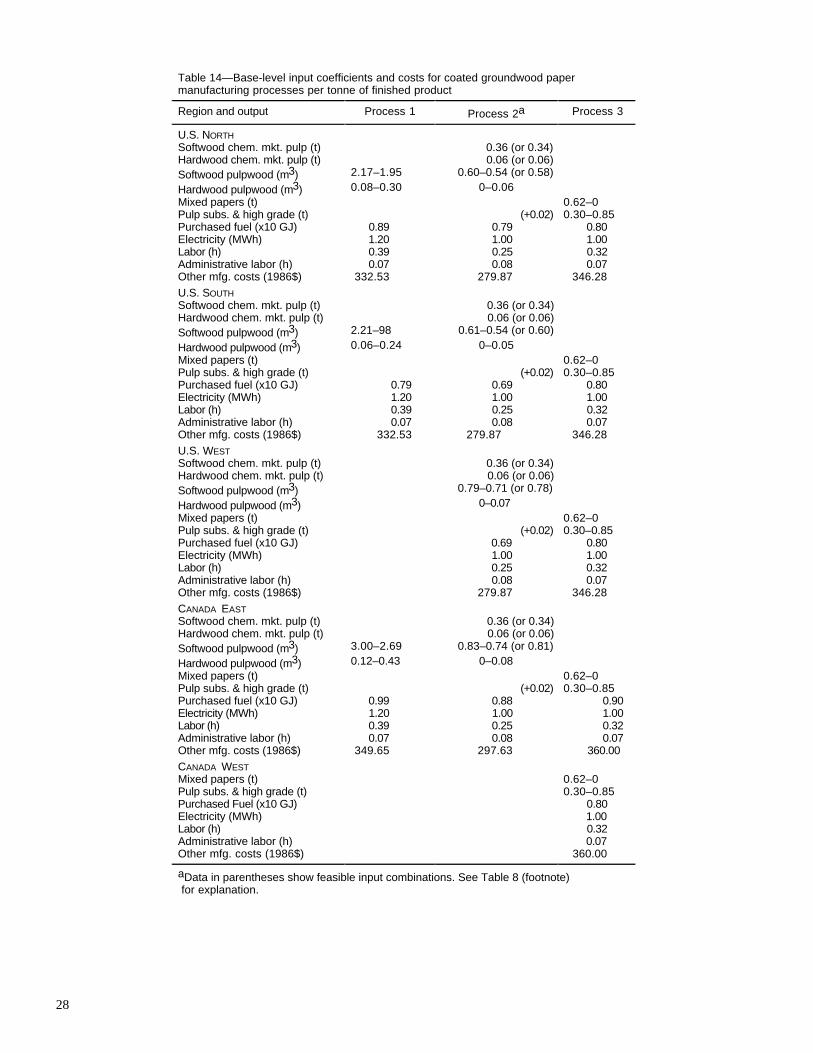
28
Table 14—Base-level input coefficients and costs for coated groundwood papermanufacturing processes per tonne of finished product
Region and output Process 1 Process 2a Process 3
U.S. NORTHSoftwood chem. mkt. pulp (t) 0.36 (or 0.34) Hardwood chem. mkt. pulp (t) 0.06 (or 0.06)Softwood pulpwood (m3) 2.17–1.95 0.60–0.54 (or 0.58)
Hardwood pulpwood (m3) 0.08–0.30 0–0.06Mixed papers (t) 0.62–0Pulp subs. & high grade (t) (+0.02) 0.30–0.85Purchased fuel (x10 GJ) 0.89 0.79 0.80Electricity (MWh) 1.20 1.00 1.00Labor (h) 0.39 0.25 0.32Administrative labor (h) 0.07 0.08 0.07Other mfg. costs (1986$) 332.53 279.87 346.28U.S. SOUTH Softwood chem. mkt. pulp (t) 0.36 (or 0.34)Hardwood chem. mkt. pulp (t) 0.06 (or 0.06)Softwood pulpwood (m3) 2.21–98 0.61–0.54 (or 0.60)
Hardwood pulpwood (m3) 0.06–0.24 0–0.05Mixed papers (t) 0.62–0Pulp subs. & high grade (t) (+0.02) 0.30–0.85Purchased fuel (x10 GJ) 0.79 0.69 0.80Electricity (MWh) 1.20 1.00 1.00Labor (h) 0.39 0.25 0.32Administrative labor (h) 0.07 0.08 0.07Other mfg. costs (1986$) 332.53 279.87 346.28U.S. WESTSoftwood chem. mkt. pulp (t) 0.36 (or 0.34)Hardwood chem. mkt. pulp (t) 0.06 (or 0.06)Softwood pulpwood (m3) 0.79–0.71 (or 0.78)
Hardwood pulpwood (m3) 0–0.07 Mixed papers (t) 0.62–0Pulp subs. & high grade (t) (+0.02) 0.30–0.85 Purchased fuel (x10 GJ) 0.69 0.80Electricity (MWh) 1.00 1.00Labor (h) 0.25 0.32Administrative labor (h) 0.08 0.07Other mfg. costs (1986$) 279.87 346.28CANADA EASTSoftwood chem. mkt. pulp (t) 0.36 (or 0.34)Hardwood chem. mkt. pulp (t) 0.06 (or 0.06)Softwood pulpwood (m3) 3.00–2.69 0.83–0.74 (or 0.81)
Hardwood pulpwood (m3) 0.12–0.43 0–0.08 Mixed papers (t) 0.62–0Pulp subs. & high grade (t) (+0.02) 0.30–0.85Purchased fuel (x10 GJ) 0.99 0.88 0.90Electricity (MWh) 1.20 1.00 1.00 Labor (h) 0.39 0.25 0.32Administrative labor (h) 0.07 0.08 0.07Other mfg. costs (1986$) 349.65 297.63 360.00 CANADA WEST Mixed papers (t) 0.62–0Pulp subs. & high grade (t) 0.30–0.85Purchased Fuel (x10 GJ) 0.80Electricity (MWh) 1.00Labor (h) 0.32Administrative labor (h) 0.07Other mfg. costs (1986$) 360.00
aData in parentheses show feasible input combinations. See Table 8 (footnote) for explanation.
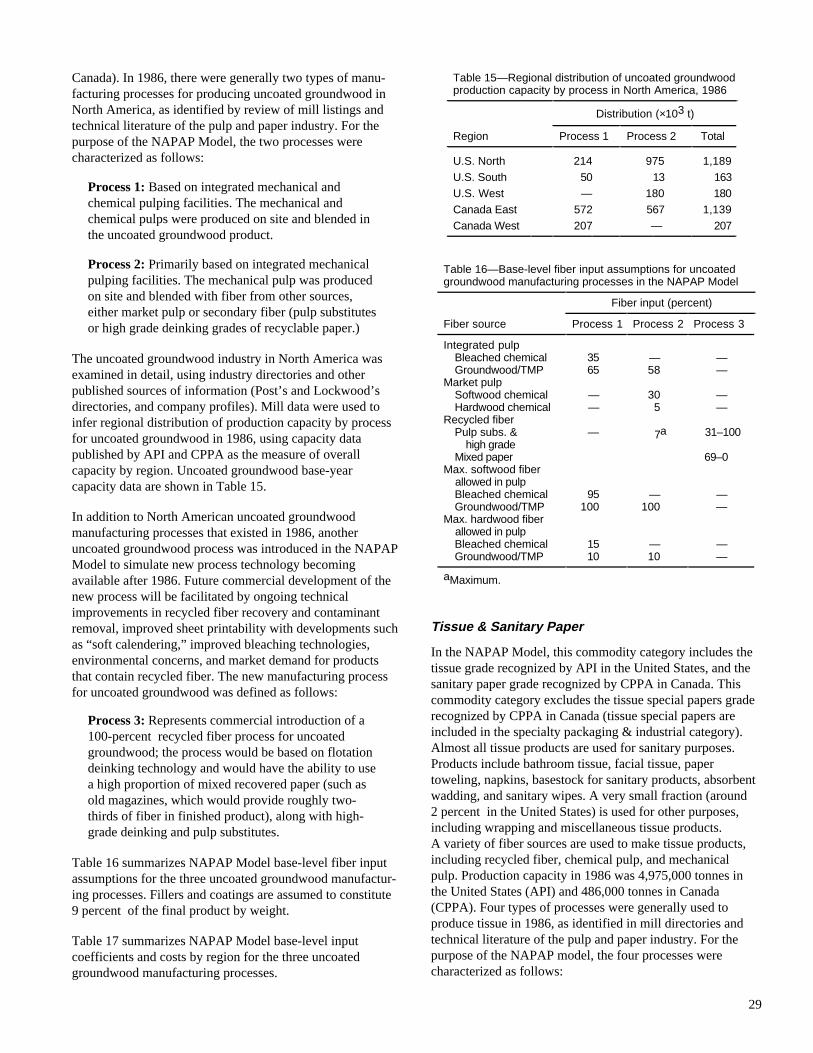
29
Tissue & Sanitary Paper
In the NAPAP Model, this commodity category includes thetissue grade recognized by API in the United States, and thesanitary paper grade recognized by CPPA in Canada. Thiscommodity category excludes the tissue special papers graderecognized by CPPA in Canada (tissue special papers areincluded in the specialty packaging & industrial category).Almost all tissue products are used for sanitary purposes.Products include bathroom tissue, facial tissue, papertoweling, napkins, basestock for sanitary products, absorbentwadding, and sanitary wipes. A very small fraction (around2 percent in the United States) is used for other purposes,including wrapping and miscellaneous tissue products.A variety of fiber sources are used to make tissue products,including recycled fiber, chemical pulp, and mechanicalpulp. Production capacity in 1986 was 4,975,000 tonnes inthe United States (API) and 486,000 tonnes in Canada(CPPA). Four types of processes were generally used toproduce tissue in 1986, as identified in mill directories andtechnical literature of the pulp and paper industry. For thepurpose of the NAPAP model, the four processes werecharacterized as follows:
Canada). In 1986, there were generally two types of manu-facturing processes for producing uncoated groundwood inNorth America, as identified by review of mill listings andtechnical literature of the pulp and paper industry. For thepurpose of the NAPAP Model, the two processes werecharacterized as follows:
Process 1: Based on integrated mechanical andchemical pulping facilities. The mechanical andchemical pulps were produced on site and blended inthe uncoated groundwood product.
Process 2: Primarily based on integrated mechanicalpulping facilities. The mechanical pulp was producedon site and blended with fiber from other sources,either market pulp or secondary fiber (pulp substitutesor high grade deinking grades of recyclable paper.)
The uncoated groundwood industry in North America wasexamined in detail, using industry directories and otherpublished sources of information (Post’s and Lockwood’sdirectories, and company profiles). Mill data were used toinfer regional distribution of production capacity by processfor uncoated groundwood in 1986, using capacity datapublished by API and CPPA as the measure of overallcapacity by region. Uncoated groundwood base-yearcapacity data are shown in Table 15.
In addition to North American uncoated groundwoodmanufacturing processes that existed in 1986, anotheruncoated groundwood process was introduced in the NAPAPModel to simulate new process technology becomingavailable after 1986. Future commercial development of thenew process will be facilitated by ongoing technicalimprovements in recycled fiber recovery and contaminantremoval, improved sheet printability with developments suchas “soft calendering,” improved bleaching technologies,environmental concerns, and market demand for productsthat contain recycled fiber. The new manufacturing processfor uncoated groundwood was defined as follows:
Process 3: Represents commercial introduction of a100-percent recycled fiber process for uncoatedgroundwood; the process would be based on flotationdeinking technology and would have the ability to usea high proportion of mixed recovered paper (such asold magazines, which would provide roughly two-thirds of fiber in finished product), along with high-grade deinking and pulp substitutes.
Table 16 summarizes NAPAP Model base-level fiber inputassumptions for the three uncoated groundwood manufactur-ing processes. Fillers and coatings are assumed to constitute9 percent of the final product by weight.
Table 17 summarizes NAPAP Model base-level inputcoefficients and costs by region for the three uncoatedgroundwood manufacturing processes.
Table 15—Regional distribution of uncoated groundwoodproduction capacity by process in North America, 1986
Distribution (×103 t)
Region Process 1 Process 2 Total
U.S. North 214 975 1,189U.S. South 50 13 163U.S. West — 180 180Canada East 572 567 1,139Canada West 207 — 207
Table 16—Base-level fiber input assumptions for uncoatedgroundwood manufacturing processes in the NAPAP Model
Fiber input (percent)
Fiber source Process 1 Process 2 Process 3
Integrated pulpBleached chemical 35 — —Groundwood/TMP 65 58 —
Market pulpSoftwood chemical — 30 —Hardwood chemical — 5 —
Recycled fiber Pulp subs. &
high grade — 7a 31–100
Mixed paper 69–0 Max. softwood fiber allowed in pulp
Bleached chemical 95 — —Groundwood/TMP 100 100 —
Max. hardwood fiber allowed in pulp
Bleached chemical 15 — —Groundwood/TMP 10 10 —
aMaximum.

30
Table 17–Base-level input coefficients and costs for uncoated groundwood papermanufacturing processes per tonne of finished product
Region and output Process 1 Process 2a Process 3
U.S. NORTHSoftwood chem. mkt. pulp (t) 0.30 (or 0.28)Hardwood chem. mkt. pulp (t) 0.05 (or 0.05)Softwood pulpwood (m3) 2.65–2.38 1.17–1.06 (or 1.16)
Hardwood pulpwood (m3) 0.06–0.33 0–0.11Mixed papers (t) 0.89–0Pulp subs. & high grade (t) (+0.08) 0.40–1.13Purchased fuel (x10 GJ) 1.09 0.89 0.80Electricity (MWh) 1.70 1.40 1.00Labor (h) 0.40 0.28 0.29Administrative labor (h) 0.11 0.10 0.10Other mfg. costs (1986$) 263.23 205.49 287.15
U.S. SOUTH Softwood chem. mkt. pulp (t) 0.30 (or 0.28) Hardwood chem. mkt. pulp (t) 0.05 (or 0.05)Softwood pulpwood (m3) 2.69–2.42 1.20–1.08 (or 1.18)
Hardwood pulpwood (m3) 0.06–0.26 0–0.09Mixed papers (t) 0.89–0Pulp subs. & high grade (t) (+0.08) 0.40–1.13Purchased fuel (x10 GJ) 0.99 0.79 0.80Electricity (MWh) 1.70 1.40 1.00Labor (h) 0.40 0.28 0.29Administrative labor (h) 0.11 0.10 0.10Other mfg. costs (1986$) 263.23 205.49 287.15
U.S. WESTSoftwood chem. mkt. pulp (t) 0.30 (or 0.28) Hardwood chem. mkt. pulp (t) 0.05 (or 0.05)Softwood pulpwood (m3) 1.55–1.39 (or 1.52)
Hardwood pulpwood (m3) 0–0.14Mixed papers (t) 0.89–0Pulp subs. & high grade (t) (+0.08) 0.40–1.13Purchased fuel (x10 GJ) 0.79 0.80Electricity (MWh) 1.40 1.00Labor (h) 0.28 0.29Administrative labor (h) 0.10 0.10Other mfg. costs (1986$) 205.49 287.15
CANADA EASTSoftwood chem. mkt. pulp (t) 0.30 (or 0.28)Hardwood chem. mkt. pulp (t) 0.05 (or 0.05) Softwood pulpwood (m3) 3.39–3.06 1.50–1.36 (or 1.47)
Hardwood pulpwood (m3) 0.08–0.44 0–0.14Mixed papers (t) 0.89–0Pulp subs. & high grade (t) (+0.08) 0.40–1.13Purchased fuel (x10 GJ) 1.19 0.99 0.90Electricity (MWh) 1.70 1.40 1.00Labor (h) 0.40 0.28 0.29Administrative labor (h) 0.11 0.10 0.10Other mfg. costs (1986$) 272.59 216.62 295.00
CANADA WEST
Softwood pulpwood (m3) 3.39–3.06
Hardwood pulpwood (m3) 0.08–0.44 Mixed papers (t) 0.89–0Pulp subs. & high grade (t) 0.40–1.13Purchased fuel ( GJ) 1.09 0.80 Electricity (MWh) 1.70 1.00Labor (h) 0.40 0.29Administrative labor (h) 0.11 0.10Other mfg. costs (1986$) 272.94 295.00
aData in parentheses show feasible input combinations.

31
Process 1: Based on a combination of market pulp andsome recycled fiber; found in tissue mills withoutintegrated pulping facilities. Information on actualfiber furnish was sketchy for those mills. We assumedthat most fiber furnish was market pulp, and thatrecycled fiber could make up 30 percent of fiberfurnish. This process existed only in the United Statesand Eastern Canada in 1986.
Process 2: Based exclusively on recycled fiber; foundin tissue mills without any integrated pulping facilitiesand where the reported consumption of recycled fiberusually matched the mill production of tissue paper.This process existed only in the United States andEastern Canada in 1986.
Process 3: Based primarily on integrated chemicalpulping facilities, with some recycled fiber input(assumed to be 25 percent of fiber furnish at most);represented by tissue mills in which reported produc-tion of chemical pulp was not significantly less thanreported production of tissue products. This processexisted only in the United States in 1986.
Process 4: Based primarily on integrated mechanicalpulping facilities. Other pulps or recycled fiber wereblended with the mechanical pulp in some mills, butadditional fiber furnish information by mill wassketchy. This process existed only in Canada and theU.S. West in 1986.
The tissue & sanitary paper industry in North America wasexamined in detail, using industry directories and otherpublished sources of information (Post’s and Lockwood’sdirectories, and company profiles). Mill data were used toinfer regional distribution of production capacity by processfor tissue & sanitary paper in 1986, using capacity datapublished by API and CPPA as the measure of overallcapacity by region. Tissue & sanitary base-year capacity dataare shown in Table 18.
In addition to the tissue & sanitary manufacturing processesthat existed in 1986, two processes were introduced in the
NAPAP Model to simulate new process technologiesbecoming commercially available after 1986. Future com-mercial development of the new processes will be facilitatedby ongoing technical improvements in recycled fiberrecovery and contaminant removal, improvedbleaching technologies, further development of improvedmechanical pulping methods and bleached mechanical pulpsthat can displace chemical pulps, advances in biologicaleffluent treatment systems, environmental concerns, andmarket demand for products that contain substantial fractionsof recycled fiber. The two new manufacturing processes fortissue & sanitary paper were defined as follows:
Process 5: Represents the introduction of a100 percent recycled fiber process that can use mixedpaper for up to half the fiber input. The process woulduse higher grade pulp substitutes and high gradedeinking gades for the remainder of fiber input. In1986, some North American tissue mills used recycledfiber exclusively, but generally mixed paper accountedfor only a small fraction of fiber input. This processsimulates the evolution of technology that willincorporate higher proportions of lower grade recycledfiber (mixed paper) in response to increased demandfor recycled products and likely changes in consumerpreferences. Such technology is already used toproduce tissue paper in regions outside of NorthAmerica.
Process 6: Represents the introduction of bleachedmechanical market pulp (e.g., BCTMP) for up to halfthe fiber input in nonintegrated tissue mills.
Table 19 summarizes NAPAP Model base-level fiber inputassumptions for tissue & sanitary manufacturing processes.Fillers and coatings are assumed to constitute less than1 percent of the final product by weight in tissue & sanitaryproducts.
Table 20 summarizes NAPAP Model base-level inputcoefficients and costs by region for the tissue & sanitarymanufacturing processes.
Specialty Packaging & Industrial Paper
This NAPAP commodity category includes the bleachedpackaging and industrial converting, specialty packaging,and special industrial grades recognized by API in theUnited States (within the packaging & industrial convertingcategory defined by API); specialty packaging and industrialalso includes the tissue special papers grade recognized byCPPA in Canada. The construction paper and board gradesare included in a separate category. As defined here,specialty packaging & industrial papers are products thatserve a wide variety of end-uses in industrial and packagingapplications; for example, paper and board commodities ofvarious weights and furnishes used as protective packagingfor food and other consumer products, such as bakery bags,
Table 18—Regional distribution of tissue & sanitary paperproduction capacity by process in North America, 1986
Distribution (×103 t)
RegionProcess
1 Process
2 Process
3Process
4 Total
U.S. North 1,044 1,044 587 — 2,676U.S. South 331 402 764 — 1,497U.S.West 305 24 433 40 802Canada East
267 102 — 34 403
Canada West
83 — — — 83

32
fast food and frozen food wraps, glassine paper, andgreaseproof paper. The category also includes specialtypaper and board products designed for specialized end-usesand generally manufactured to exact customer specifications,such as abrasive paper, electrical insulation paper, and filterpaper. In 1986, production capacity in this general categorywas 2,273,000 tonnes in the United States (API) and 23,000tonnes in Canada (CPPA). The functional requirements ofvarious products in this category are so different that manyspecialized processes are required. Because of the widevariety of processes and because of the relatively smalloverall production capacity in this category (approximately2 percent of North American paper and paperboard capac-ity), we decided to develop a simplified representation oftechnology for this product category in the NAPAP Model.Therefore, a single generic “process” is defined for specialtypackaging & industrial paper. This process represents ageneric composite of the various processes used in specialtypackaging & industrial paper mills in 1986.
Process 1: Production is based primarily on integratedpulping facilities (mostly kraft pulp in the UnitedStates and mechanical pulp in Canada).
Table 21 shows the regional distribution of specialtypackaging & industrial paper production capacity in 1986based on capacity data published by API and CPPA.
Some improvements in energy efficiency and labor produc-tivity were anticipated to occur over time for all processes inthe model, but entirely new or future processes for specialtypackaging & industrial paper were not included in the base-level data of the NAPAP Model. Table 22 summarizesNAPAP Model base-level fiber input assumptions for theone specialty packaging & industrial manufacturing process
included in the model. Fillers and coatings are assumed toconstitute 5 percent of the final product by weight inspecialty packaging & industrial products.
Table 23 summarizes NAPAP Model base-level inputcoefficients and costs by region for the specialty packaging& industrial manufacturing process.
Kraft Packaging & Industrial Paper
Kraft packaging includes the unbleached kraft paper graderecognized by API in the United States (within the packaging& industrial converting category) and also the kraft papersgrade category (multiwall sack and other kraft papers)recognized by CPPA in Canada. The unbleached kraft gradein the United States contains more than 80 percent un-bleached kraft pulp. Specialty packaging & special industrialgrades are not included in this category. As defined here,kraft packaging paper includes products such as kraftwrapping paper, shipping sack, grocers sack, and otherbrown bag or converting paper. Production capacity for kraftpackaging paper in 1986 was 3,254,000 tonnes in the UnitedStates (API) and 579,000 tonnes in Canada (CPPA). In NorthAmerica, there were essentially three distinct productionprocesses for kraft packaging paper in 1986:
Process 1: Based entirely on integrated chemicalpulping facilities, primarily unbleached kraft, withsome bleached kraft, semibleached kraft, and sulfite orsemichemical pulping facilities. Except for mill brokeand cuttings, no recycled fiber was used in thisprocess. This was the dominant process in NorthAmerica in 1986, used in about 20 mills in the UnitedStates and Canada.
Table 19—Base-level fiber input assumptions for tissue & sanitary paper manufacturing processes in theNAPAP Model
Fiber input (percent)
Fiber source Process 1 Process 2 Process 3 Process 4 Process 5 Process 6
Integrated pulpBleached chemical — — 75–100 — — —Groundwood/TMP — — — 90–100 — —
Market pulpSoftwood chemical 50 — — — — 25Hardwood chemical 20 — — — — 25Mech. mkt. pulp (BCTMP) — — — — — 50
Recycled fiberOld newspapers (ONP) — 10 — — — —Old corrugated (OCC) — 15 — — — —Mixed paper — 15 — — 52–0 —Pulp subs. & high grade 30 60 25–0 10–0 48–100 —
Max. softwood fiber in pulpBleached chemical — — 50a — — —Groundwood/TMP — — — 100 10 —
Max. hardwood fiber in pulpBleached chemical — — 60 — — —Groundwood/TMP — — — 10 — —
a100 percent in U.S. West and Canada.

33
1,373,000 tonnes in Canada (estimates based on data fromCPPA). In 1986, the production processes for manufacturinglinerboard in North America were as follows:
Process 1: Based on integrated unbleached kraftpulping facilities, using pre-1980 papermakingtechnology (i.e., without wide-nip or high-impulsepress sections and related mill improvements, whichfirst became common in the 1980s). Because oftechnological limitations of the papermaking processin achieving adequate product performance (i.e.,strength), fiber furnish was primarily limited tolong-fiber softwood pulpwood, with less than10 percent hardwood or secondary (recycled) fiberinput.
Process 2: Also based on integrated unbleached kraftpulping facilities, but used modernized papermakingtechnology (i.e., specifically wide-nip or high-impulsepress sections and related mill improvements under-taken at many linerboard mills beginning around1980). Fiber furnish was primarily softwood pulp-wood, but the process was capable of utilizing up to30 percent hardwood fiber or secondary (recycled)fiber input, mainly OCC. The process was also capableof using slightly higher yield kraft pulp than didProcess 1 and of increased mill throughput (15 to20 percent higher than that of Process 1) with corre-spondingly lower capital costs. Process 2 also affordedenergy savings relative to Process 1, as a result ofbetter water removal in the press prior to sheet drying.
Process 3: Based exclusively on secondary (recycled)fiber. The process used mostly OCC and a smallamount of pulp substitutes to produce recycledlinerboard (also known as testliner).
The linerboard industry in North America was examined indetail, using industry directories and other published sourcesof information (Post’s and Lockwood’s directories, companyprofiles, and publications describing application of new presstechnology in linerboard mills). Data were available onwhich mills had installed wide-nip or high-impulse presssections by 1986. The mill data were used to infer theregional distribution of production capacity by process, asshown in Table 27 (the capacity data were calibrated toindustry capacity data reported by API and CPPA).
In addition to linerboard manufacturing processes thatexisted in 1986, two processes were introduced in theNAPAP Model to simulate new technologies being adoptedcommercially after 1986. New linerboard technology willreflect adjustments to recently revised shipping rules forcorrugated boxes, with emphasis on compressive strengthrather than basis weight and burst test. Changes in shippingrules will facilitate greater use of short-fiber furnish (i.e.,hardwood fiber) and recycled fiber as substitutes for long-fiber softwood (which was needed to meet burst test underthe old shipping rules). Improved pressing and drying
Process 2: Also based on integrated chemical pulpingfacilities, primarily unbleached kraft, with somesemichemical pulping; in addition, the process usedsome secondary fiber (primarily OCC). Recycled fiberwas approximately 10 to 25 percent of the fiberfurnish. This process existed in only a few mills in theUnited States in 1986.
Process 3: Based entirely on secondary (recycled)fiber, primarily OCC. This process existed in only acouple of mills in the United States in 1986.
Table 24 shows the regional distribution of kraft packagingpaper production capacity in 1986 based on capacity datapublished by API and CPPA.
Some improvements in energy efficiency and labor produc-tivity were anticipated to occur over time for all processes inthe model, but entirely new or future processes for kraftpackaging paper were not included in the base-level data ofthe NAPAP Model. Table 25 summarizes NAPAP Modelbase-level fiber input assumptions for the three kraft packag-ing manufacturing processes included in the model. Fillersand coatings are assumed to constitute less than 1 percent ofthe final product by weight in specialty packaging &industrial products.
Table 26 summarizes NAPAP Model base-level inputcoefficients and costs by region for the kraft packagingmanufacturing processes.
Linerboard
In the NAPAP Model, this commodity category includes allunbleached kraft paperboard and the linerboard fraction ofrecycled paperboard (approximately 5 percent of recycledpaperboard capacity) as recognized by API in the UnitedStates. It also includes the kraft linerboard and recycledlinerboard grades recognized by CPPA in Canada, and anyunbleached kraft paperboard in the boxboard categoryrecognized by CPPA in Canada. In the United States,approximately 93 percent of unbleached kraft paperboardwas actually used as linerboard, as the surface facingmaterial in corrugated boxes or containers, while theremaining 7 percent was used for folding paperboardbacking (folding cartons and beverage containers) andpaperboard backing (such as file folders). The NAPAPModel linerboard category excludes solid bleached paper-board (3 percent of which was actually used as linerboardaccording to API; in the NAPAP Model, this paperboard isincluded in the solid bleached board commodity category).As such, the linerboard commodity category in the NAPAPModel refers generally to unbleached paperboard usedprimarily as linerboard. It is combined with corrugatingmedium when converted into corrugated boxboard andcontainers. It is used also for folding cartons, containers, andother folders. As defined here, linerboard capacity in 1986was 17,355,000 tonnes in the United States (API) and

34
Table 20—Base-level input coefficients and costs for tissue & sanitary paper manufacturing processes per tonne offinished product
Region and output Process 1 Process 2 Process 3 Process 4 Process 5 Process 6
U.S. NORTH Softwood chem. mkt. pulp (t) 0.53 0.27Hardwood chem. mkt. pulp (t) 0.21 0.27Mechanical mkt. pulp (t) 0.53Softwood pulpwood (m3) 2.42–1.94
(or 1.70)Hardwood pulpwood (m3) 0.62–2.78
(or 1.14)Old newspapers (t) 0.14Old corrugated (t) 0.20Mixed papers (t) 0.21 0.70–0 Pulp subs. & high grade (t) 0.40 0.79 (+33) 0.66–1.32Purchased fuel (×10 GJ) 1.00 1.04 1.36 0.90 0.90
Electricity (MWh) 0.40 0.70 0.80 0.70 0.40Labor (h) 0.82 1.00 1.16 0.75 0.75Administrative labor (h) 0.42 0.47 0.45 0.42 0.42Other mfg. costs (1986$) 193.57 283.42 306.25 331.42 276.57
U.S. SOUTH Softwood chem. mkt. pulp (t) 0.53 0.27Hardwood chem. mkt. pulp (t) 0.21 0.27Mechanical mkt. pulp (t) 0.53Softwood pulpwood (m3) 2.46–1.96
(or 1.72)Hardwood pulpwood (m3) 1.30–2.22
(or 0.91) Old newspapers (t) 0.14Old corrugated (t) 0.20Mixed papers (t) 0.21 0.70–0 Pulp subs. & high grade (t) 0.40 0.79 (+0.33) 0.66–1.32Purchased fuel (×10 GJ) 0.90 0.94 1.26 0.90 0.90
Electricity (MWh) 0.40 0.70 0.80 0.70 0.40Labor (h) 0.82 1.00 1.16 0.75 0.75 Administrative labor (h) 0.42 0.47 0.45 0.42 0.42 Other mfg. costs (1986$) 193.57 283.42 306.25 331.42 276.57
U.S. WEST
Softwood chem. mkt. pulp (t) 0.53 0.27Hardwood chem. mkt. pulp (t) 0.21 0.27Mechanical mkt. pulp (t) 0.53Softwood pulpwood (m3) 5.41–2.55
(or 2.23)3.75–3.37 (or 2.63)
Hardwood pulpwood (m3) 0–3.53 (or 1.44)
0–0.24 0.27
Mixed papers (t) 0.70–0Old newspapers (t) 0.14Old corrugated (t) 0.20 0.70–0Mixed papers (t) 0.21 Pulp subs. & high grade (t) 0.40 0.79 (+0.33) (+0.13) 0.66–1.32Purchased fuel (×10 GJ) 0.90 0.94 1.26 0.81 0.90 0.90
Electricity (MWh) 0.40 0.70 0.80 2.70 0.70 0.40Labor (h) 0.82 1.00 1.16 0.90 0.75 0.75Administrative labor (h) 0.42 0.47 0.45 0.48 0.41 0.42Other mfg. costs (1986$) 193.57 283.42 306.25 296.44 331.42 276.57

35
Table 20—Base-level input coefficients and costs for tissue & sanitary paper manufacturing processes per tonne offinished product—con.
Region and output Process 1 Process 2 Process 3 Process 4 Process 5 Process 6
CANADA EAST
Softwood chem. mkt. pulp (t) 0.53 0.27Hardwood chem. mkt. pulp (t) 0.21 0.27Mechanical market pulp (t) 0.53Softwood pulpwood (m3) 3.64–3.28
(or 2.56)Hardwood pulpwood (m3) 0–0.25Old newspapers (t) 0.14Old corrugated (t) 0.20Mixed papers (t) 0.21 0.70–0Pulp subs. & high grade (t) 0.40 0.79 (+0.13) 0.66–1.32
Purchased fuel (×10 GJ) 1.10 1.14 1.01 1.00 1.00
Electricity (MWh) 0.40 0.70 2.70 0.70 0.40Labor (h) 0.82 1.00 0.90 0.75 0.75Administrative labor (h) 0.42 0.47 0.48 0.42 0.42 Other mfg. costs (1986$) 198.83 293.22 306.49 340.00 285.00
CANADA WEST Softwood chem. mkt. pulp (t) 0.27Hardwood chem. mkt. pulp (t) 0.27Mechanical market pulp (t) 0.53Softwood pulpwood (m3) 3.64–3.28
(or 2.56)Hardwood pulpwood (m3) 0–0.25Old newspapers (t) Old corrugated (t) Mixed papers (t) 0–0.7Pulp subs. & high grade (t) (+0.13) 0.66–1.32
Purchased fuel (×10 GJ) 0.91 0.90 0.90
Electricity (MWh) 2.70 0.70 0.40Labor (h) 0.90 0.75 0.75Administrative labor (h) 0.48 0.42 0.42Other mfg. costs (1986$) 306.49 340.00 285.00
Table 22—Base-level fiber input assumptions for specialtypackaging & industrial paper manufacturing process in theNAPAP Model
Fiber source Fiber input (percent)
Integrated pulpa 93–100
Recycled fiber Mixed paper 2–0
Pulp subs. & high grade 5–0
Max. softwood fiber a,b 80
Max. hardwood fiber a,b 25
aChemical and mechanical pulp.bMaximum amount allowed in pulp.
Table 21—Regional distribution of specialty packaging & industrial paper production capacity in North America, 1986
Region Total (×103 t)
U.S. North 1,124U.S. South 846U.S. West 303Canada East 23Canada West —
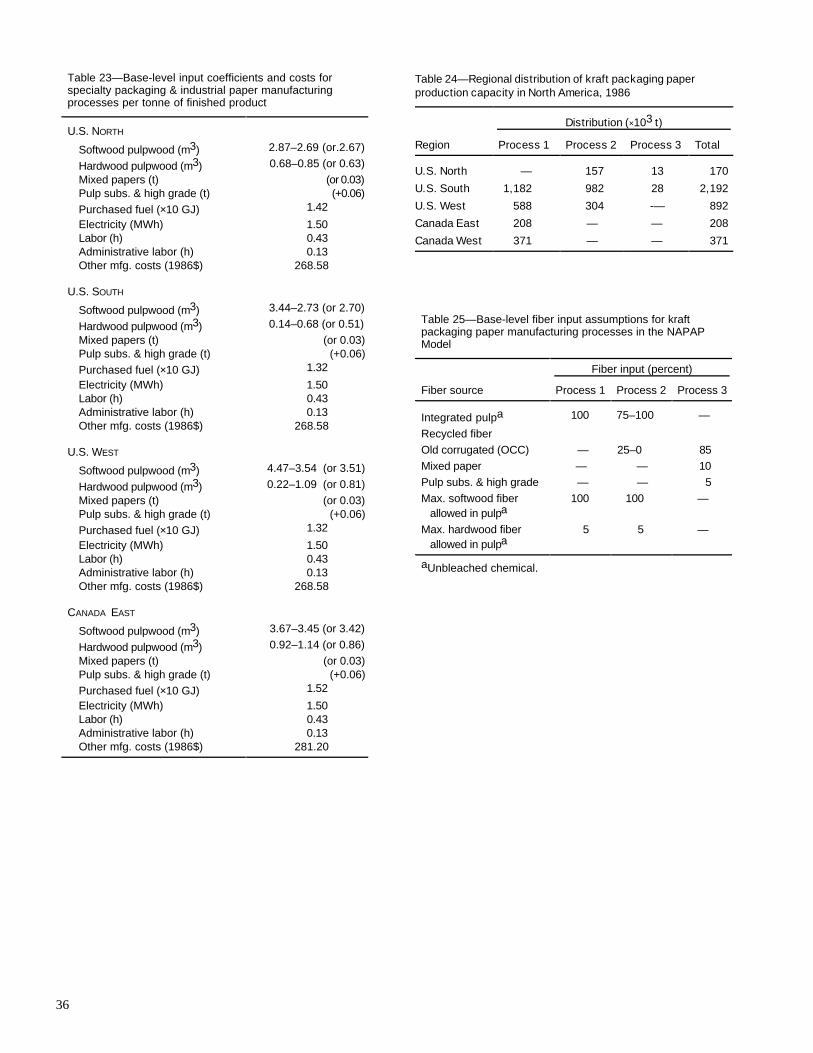
36
Table 23—Base-level input coefficients and costs forspecialty packaging & industrial paper manufacturingprocesses per tonne of finished product
U.S. NORTH
Softwood pulpwood (m3) 2.87–2.69 (or.2.67)
Hardwood pulpwood (m3) 0.68–0.85 (or 0.63)Mixed papers (t) (or 0.03)Pulp subs. & high grade (t) (+0.06)Purchased fuel (×10 GJ) 1.42
Electricity (MWh) 1.50 Labor (h) 0.43 Administrative labor (h) 0.13 Other mfg. costs (1986$) 268.58
U.S. SOUTH
Softwood pulpwood (m3) 3.44–2.73 (or 2.70)
Hardwood pulpwood (m3) 0.14–0.68 (or 0.51) Mixed papers (t) (or 0.03)Pulp subs. & high grade (t) (+0.06)Purchased fuel (×10 GJ) 1.32
Electricity (MWh) 1.50 Labor (h) 0.43 Administrative labor (h) 0.13 Other mfg. costs (1986$) 268.58
U.S. WEST
Softwood pulpwood (m3) 4.47–3.54 (or 3.51)
Hardwood pulpwood (m3) 0.22–1.09 (or 0.81)Mixed papers (t) (or 0.03)Pulp subs. & high grade (t) (+0.06)Purchased fuel (×10 GJ) 1.32
Electricity (MWh) 1.50 Labor (h) 0.43 Administrative labor (h) 0.13 Other mfg. costs (1986$) 268.58
CANADA EAST
Softwood pulpwood (m3) 3.67–3.45 (or 3.42)
Hardwood pulpwood (m3) 0.92–1.14 (or 0.86)Mixed papers (t) (or 0.03)Pulp subs. & high grade (t) (+0.06)Purchased fuel (×10 GJ) 1.52
Electricity (MWh) 1.50 Labor (h) 0.43 Administrative labor (h) 0.13 Other mfg. costs (1986$) 281.20
Table 25—Base-level fiber input assumptions for kraftpackaging paper manufacturing processes in the NAPAPModel
Fiber input (percent)
Fiber source Process 1 Process 2 Process 3
Integrated pulpa 100 75–100 —
Recycled fiber Old corrugated (OCC) — 25–0 85Mixed paper — — 10Pulp subs. & high grade — — 5 Max. softwood fiber allowed in pulpa
100 100 —
Max. hardwood fiber allowed in pulpa
5 5 —
aUnbleached chemical.
Table 24—Regional distribution of kraft packaging paperproduction capacity in North America, 1986
Distribution (×103 t)
Region Process 1 Process 2 Process 3 Total
U.S. North — 157 13 170
U.S. South 1,182 982 28 2,192
U.S. West 588 304 -— 892
Canada East 208 — — 208
Canada West 371 — — 371

37
technology enables production of high-performancelinerboard with hardwood and recycled fiber furnish.Environmental concerns and market demand for productsthat contain substantial fractions of recycled fiber will alsopromote greater use of recycled fiber in linerboard. Within adecade, it is likely also that unbleached high-yield mechani-cal pulp in linerboard will be used commercially as asubstitute for conventional unbleached kraft (this potentialhas been demonstrated in laboratory studies, facilitated alsoby improved pressing and drying techniques). The two newmanufacturing processes for linerboard in the NAPAP Modelwere defined as follows:
Process 4: Represents the commercial application ofmore advanced pressing and drying technology inNorth America, using techniques known as impulsedrying or press drying. Under the new shipping rulesfor corrugated containers, the process will be capableof using hardwood pulp as a substitute for softwoodkraft.
Process 5: Represents the commercial application of aprocess based on high-yield mechanical orchemimechanical pulp, such as unbleached CTMP,neutral-sulfite chemimechanical pulp (NSCM), orchemimechanical pulp (CMP) along with advancedpressing and drying technology.
Table 28 summarizes NAPAP Model base-level fiber inputassumptions for the five linerboard manufacturing processes.Fillers and coatings are assumed to constitute approximately1 percent of the final product by weight in linerboard.
Table 29 summarizes NAPAP Model base-level inputcoefficients and costs by region for the five linerboardmanufacturing processes.
Corrugating Medium
In the NAPAP Model, this commodity category includessemichemical paperboard and the corrugating mediumportion of recycled paperboard grades recognized by API inthe United States. The corrugating medium portion ofrecycled paperboard represented about 18 percent of totalrecycled paperboard capacity in 1986. For Canada, corrugat-ing medium includes the semichemical corrugating medium
Table 26—Base-level input coefficients and costs for unbleachedkraft paper manufacturing processes per tonne of finished product
Region and output Process 1 Process 2 Process 3
U.S. NORTH
Softwood pulpwood (m3) 3.97–3.78(or 2.99)
Hardwood pulpwood (m3) 0–0.18 Old corrugated (OCC) (t) (+0.31) 1.06Mixed papers (t) 0.14Pulp subs. & high grade (t) 0.07Purchased fuel (×10 GJ) 1.16 1.03
Electricity (MWh) 1.00 0.50Labor (h) 0.40 0.30Administrative labor (h) 0.09 0.15Other mfg. costs (1986$) 140.21 107.06
U.S. SOUTH
Softwood pulpwood (m3) 4.04–3.84 4.04–3.84(or 3.03)
Hardwood pulpwood (m3) 0–0.15 0–0.15 Old corrugated (OCC) (t) (+0.31) 1.06Mixed papers (t) 0.14Pulp subs. & high grade (t) 0.07Purchased fuel (×10 GJ) 1.16 1.06 0.93
Electricity (MWh) 1.00 1.00 0.50Labor (h) 0.43 0.40 0.30Administrative labor (h) 0.09 0.09 0.15Other mfg. costs (1986$) 134.29 140.21 107.06
U.S. WEST
Softwood pulpwood (m3) 5.25–4.98 5.25–4.98 (or 3.93)
Hardwood pulpwood (m3) 0–0.24 0–0.24 Old corrugated (OCC) (t) (+0.31)Purchased fuel (×10 GJ) 1.16 1.06
Electricity (MWh) 1.00 1.00 Labor (h) 0.43 0.40 Administrative labor (h) 0.09 0.09 Other mfg. costs (1986$) 134.29 140.21
CANADA EAST
Softwood pulpwood (m3) 5.09–4.84
Hardwood pulpwood (m3) 0–0.25
Purchased fuel (×10 GJ) 1.36
Electricity (MWh) 1.00 Labor (h) 0.43 Administrative labor (h) 0.09 Other mfg. costs (1986$) 139.25
CANADA WEST
Softwood pulpwood (m3) 5.09–4.84
Hardwood pulpwood (m3) 0–0.25
Purchased fuel (×10 GJ) 1.26
Electricity (MWh) 1.00 Labor (h) 0.43 Administrative labor (h) 0.09 Other mfg. costs (1986$) 139.36
Table 27—Regional distribution of linerboard productioncapacity in North America, 1986
Distribution (×103 t)
Region Process 1 Process 2 Process 3 Total
U.S. North — — 276 276
U.S. South 8,454 5,636 68 14,158
U.S. West 568 2,272 81 2,921
Canada East 259 412 290 961
Canada West 371 — — 371
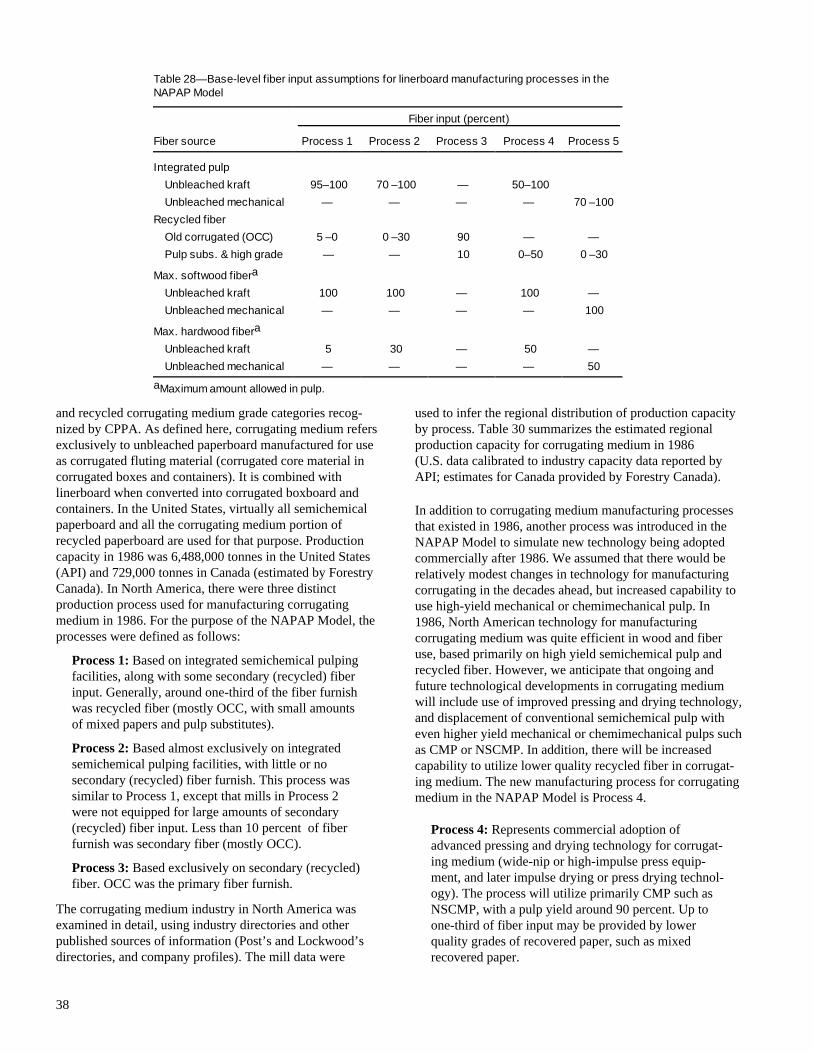
38
and recycled corrugating medium grade categories recog-nized by CPPA. As defined here, corrugating medium refersexclusively to unbleached paperboard manufactured for useas corrugated fluting material (corrugated core material incorrugated boxes and containers). It is combined withlinerboard when converted into corrugated boxboard andcontainers. In the United States, virtually all semichemicalpaperboard and all the corrugating medium portion ofrecycled paperboard are used for that purpose. Productioncapacity in 1986 was 6,488,000 tonnes in the United States(API) and 729,000 tonnes in Canada (estimated by ForestryCanada). In North America, there were three distinctproduction process used for manufacturing corrugatingmedium in 1986. For the purpose of the NAPAP Model, theprocesses were defined as follows:
Process 1: Based on integrated semichemical pulpingfacilities, along with some secondary (recycled) fiberinput. Generally, around one-third of the fiber furnishwas recycled fiber (mostly OCC, with small amountsof mixed papers and pulp substitutes).
Process 2: Based almost exclusively on integratedsemichemical pulping facilities, with little or nosecondary (recycled) fiber furnish. This process wassimilar to Process 1, except that mills in Process 2were not equipped for large amounts of secondary(recycled) fiber input. Less than 10 percent of fiberfurnish was secondary fiber (mostly OCC).
Process 3: Based exclusively on secondary (recycled)fiber. OCC was the primary fiber furnish.
The corrugating medium industry in North America wasexamined in detail, using industry directories and otherpublished sources of information (Post’s and Lockwood’sdirectories, and company profiles). The mill data were
used to infer the regional distribution of production capacityby process. Table 30 summarizes the estimated regionalproduction capacity for corrugating medium in 1986(U.S. data calibrated to industry capacity data reported byAPI; estimates for Canada provided by Forestry Canada).
In addition to corrugating medium manufacturing processesthat existed in 1986, another process was introduced in theNAPAP Model to simulate new technology being adoptedcommercially after 1986. We assumed that there would berelatively modest changes in technology for manufacturingcorrugating in the decades ahead, but increased capability touse high-yield mechanical or chemimechanical pulp. In1986, North American technology for manufacturingcorrugating medium was quite efficient in wood and fiberuse, based primarily on high yield semichemical pulp andrecycled fiber. However, we anticipate that ongoing andfuture technological developments in corrugating mediumwill include use of improved pressing and drying technology,and displacement of conventional semichemical pulp witheven higher yield mechanical or chemimechanical pulps suchas CMP or NSCMP. In addition, there will be increasedcapability to utilize lower quality recycled fiber in corrugat-ing medium. The new manufacturing process for corrugatingmedium in the NAPAP Model is Process 4.
Process 4: Represents commercial adoption ofadvanced pressing and drying technology for corrugat-ing medium (wide-nip or high-impulse press equip-ment, and later impulse drying or press drying technol-ogy). The process will utilize primarily CMP such asNSCMP, with a pulp yield around 90 percent. Up toone-third of fiber input may be provided by lowerquality grades of recovered paper, such as mixedrecovered paper.
Table 28—Base-level fiber input assumptions for linerboard manufacturing processes in theNAPAP Model
Fiber input (percent)
Fiber source Process 1 Process 2 Process 3 Process 4 Process 5
Integrated pulp
Unbleached kraft 95–100 70 –100 — 50–100
Unbleached mechanical — — — — 70 –100
Recycled fiber
Old corrugated (OCC) 5 –0 0 –30 90 — —
Pulp subs. & high grade — — 10 0–50 0 –30
Max. softwood fibera
Unbleached kraft 100 100 — 100 —
Unbleached mechanical — — — — 100
Max. hardwood fibera
Unbleached kraft 5 30 — 50 —
Unbleached mechanical — — — — 50
aMaximum amount allowed in pulp.
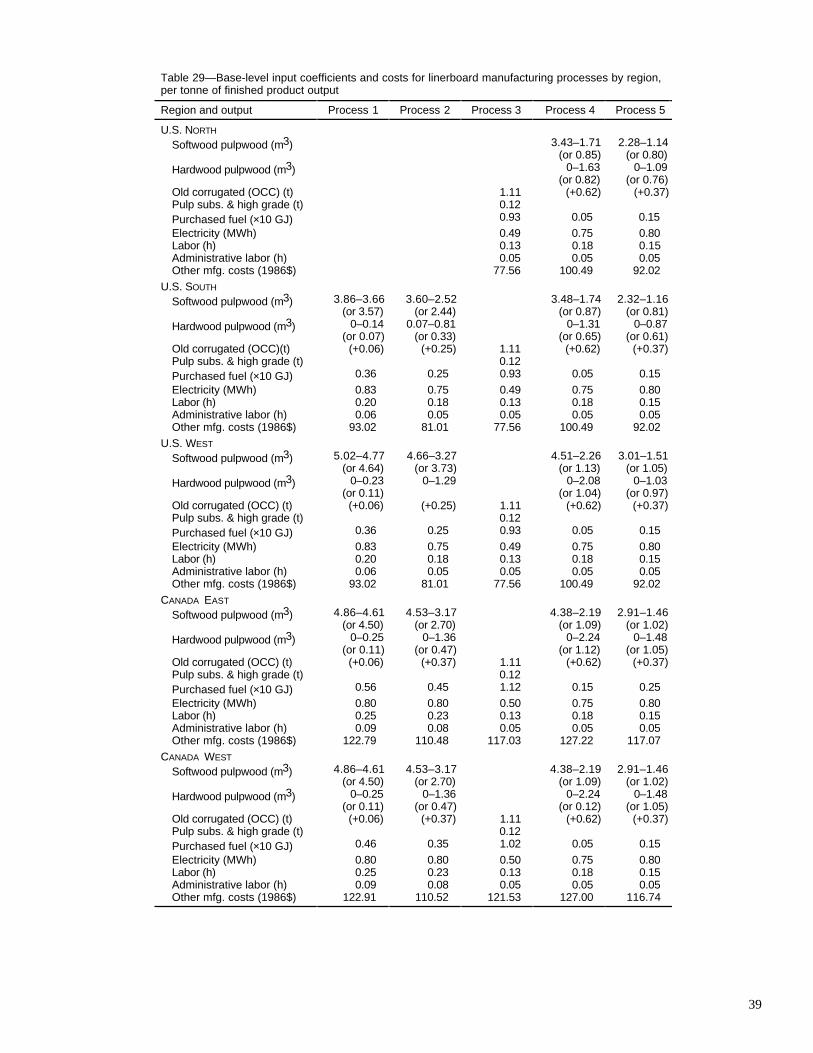
39
Table 29—Base-level input coefficients and costs for linerboard manufacturing processes by region,per tonne of finished product output
Region and output Process 1 Process 2 Process 3 Process 4 Process 5
U.S. NORTH Softwood pulpwood (m3) 3.43–1.71
(or 0.85) 2.28–1.14
(or 0.80) Hardwood pulpwood (m3) 0–1.63
(or 0.82) 0–1.09
(or 0.76)Old corrugated (OCC) (t) 1.11 (+0.62) (+0.37)Pulp subs. & high grade (t) 0.12 Purchased fuel (×10 GJ) 0.93 0.05 0.15 Electricity (MWh) 0.49 0.75 0.80 Labor (h) 0.13 0.18 0.15Administrative labor (h) 0.05 0.05 0.05 Other mfg. costs (1986$) 77.56 100.49 92.02
U.S. SOUTH
Softwood pulpwood (m3) 3.86–3.66(or 3.57)
3.60–2.52(or 2.44)
3.48–1.74(or 0.87)
2.32–1.16(or 0.81)
Hardwood pulpwood (m3) 0–0.14 (or 0.07)
0.07–0.81 (or 0.33)
0–1.31 (or 0.65)
0–0.87 (or 0.61)
Old corrugated (OCC)(t) (+0.06) (+0.25) 1.11 (+0.62) (+0.37)Pulp subs. & high grade (t) 0.12 Purchased fuel (×10 GJ) 0.36 0.25 0.93 0.05 0.15 Electricity (MWh) 0.83 0.75 0.49 0.75 0.80 Labor (h) 0.20 0.18 0.13 0.18 0.15 Administrative labor (h) 0.06 0.05 0.05 0.05 0.05 Other mfg. costs (1986$) 93.02 81.01 77.56 100.49 92.02
U.S. WEST
Softwood pulpwood (m3) 5.02–4.77(or 4.64)
4.66–3.27(or 3.73)
4.51–2.26(or 1.13)
3.01–1.51(or 1.05)
Hardwood pulpwood (m3) 0–0.23 (or 0.11)
0–1.29 0–2.08 (or 1.04)
0–1.03 (or 0.97)
Old corrugated (OCC) (t) (+0.06) (+0.25) 1.11 (+0.62) (+0.37)Pulp subs. & high grade (t) 0.12 Purchased fuel (×10 GJ) 0.36 0.25 0.93 0.05 0.15 Electricity (MWh) 0.83 0.75 0.49 0.75 0.80 Labor (h) 0.20 0.18 0.13 0.18 0.15 Administrative labor (h) 0.06 0.05 0.05 0.05 0.05 Other mfg. costs (1986$) 93.02 81.01 77.56 100.49 92.02
CANADA EAST
Softwood pulpwood (m3) 4.86–4.61(or 4.50)
4.53–3.17(or 2.70)
4.38–2.19(or 1.09)
2.91–1.46(or 1.02)
Hardwood pulpwood (m3) 0–0.25 (or 0.11)
0–1.36 (or 0.47)
0–2.24 (or 1.12)
0–1.48 (or 1.05)
Old corrugated (OCC) (t) (+0.06) (+0.37) 1.11 (+0.62) (+0.37)Pulp subs. & high grade (t) 0.12 Purchased fuel (×10 GJ) 0.56 0.45 1.12 0.15 0.25 Electricity (MWh) 0.80 0.80 0.50 0.75 0.80 Labor (h) 0.25 0.23 0.13 0.18 0.15 Administrative labor (h) 0.09 0.08 0.05 0.05 0.05 Other mfg. costs (1986$) 122.79 110.48 117.03 127.22 117.07
CANADA WEST Softwood pulpwood (m3) 4.86–4.61
(or 4.50) 4.53–3.17
(or 2.70) 4.38–2.19
(or 1.09)2.91–1.46
(or 1.02)Hardwood pulpwood (m3) 0–0.25
(or 0.11) 0–1.36
(or 0.47) 0–2.24
(or 0.12) 0–1.48
(or 1.05)Old corrugated (OCC) (t) (+0.06) (+0.37) 1.11 (+0.62) (+0.37)Pulp subs. & high grade (t) 0.12 Purchased fuel (×10 GJ) 0.46 0.35 1.02 0.05 0.15 Electricity (MWh) 0.80 0.80 0.50 0.75 0.80 Labor (h) 0.25 0.23 0.13 0.18 0.15 Administrative labor (h) 0.09 0.08 0.05 0.05 0.05 Other mfg. costs (1986$) 122.91 110.52 121.53 127.00 116.74

40
Table 31 summarizes NAPAP Model base-level fiber inputassumptions for the four corrugating medium manufacturingprocesses. Fillers and coatings are assumed to constitute anegligible fraction of the final product by weight in corrugat-ing medium.
Table 32 summarizes NAPAP Model base-level inputcoefficients and costs by region for the four corrugatingmedium manufacturing processes.
Solid Bleached Board
In the NAPAP Model, this commodity category includes thesolid bleached packaging paperboard grade recognized byAPI in the United States and the solid bleached boxboardcategory recognized by CPPA in Canada. Solid bleachedboard includes folding paperboards used for conversion intofolding cartons, such as cartons for ice cream, frozen foods,butter, and bakery products; paperboards used for conversioninto milk cartons, paper plates, food trays, cups, and foodpackaging; and other solid bleached linerboard and packag-ing paperboards. Thus solid bleached paperboard refersgenerally to bleached (white) paperboard used primarily infood packaging or food service products. Production capacityof solid bleached board in 1986 was 4,160,000 tonnes in theUnited States (API) and 73,000 tonnes in Canada (CPPA). InNorth America, essentially only one production process wasused for solid bleached board in 1986. For the purpose of theNAPAP Model, the process was defined as follows:
Process 1: Based almost entirely on integratedbleached kraft pulping facilities. Almost all of the fiberfurnish (more than 97 percent ) was bleached kraftpulp, with only a very small fraction derived fromTMP or secondary fiber (OCC). Solid bleached boardwas generally limited by the market to use of virginbleached kraft pulp because of the general food contactapplications and sanitary requirements of the product.
The solid bleached board industry in North America wasexamined in detail, using industry directories and otherpublished sources of information (Post’s and Lockwood’sdirectories, and company profiles). Table 33 summarizes theestimated regional production capacity for solid bleachedboard in 1986 (based on capacity data reported by API andCPPA).
In addition to the conventional solid bleached board manu-facturing process that existed in 1986, another process wasintroduced in the NAPAP Model to simulate new technologybeing adopted commercially after 1986. It was assumed thattechnology would be commercially developed to use somehigh-yield mechanical or chemimechanical pulp, such asbleached CTMP, in solid bleached board (in the range of 10to 50 percent of total fiber furnish, as suggested by researchstudies, or around 30 percent on average). The technologywould be facilitated by improved multiply sheet formingtechniques (e.g., using the mechanical pulp furnish as fillerin multiply paperboard). In addition, efforts to replacechlorine-based bleaching technology because of trace dioxincontamination may also tend to favor use of mechanicalpulps (which are generally bleached without chlorine) insolid bleached paperboard. The new manufacturing processfor solid bleached board in the NAPAP Model was thereforedefined as follows:
Process 4: Represents commercial adoption oftechnology that will incorporate up to 30 percentmechanical pulp (e.g., CTMP), using multiply formingand other techniques.
Table 34 summarizes NAPAP Model base-level fiber inputassumptions for the solid bleached board manufacturingprocesses included in the model. Fillers and coatings wereassumed to constitute 8 percent of the final product byweight in solid bleached board.
Table 30—Regional distribution of corrugating mediumproduction capacity in North America
Distribution (×103 t)
Region Process 1 Process 2 Process 3 Total
U.S. North 1,325 442 1,026 2,793U.S. South 1,533 1,022 60 2,615U.S. West 292 438 350 1,080Canada East 309 239 107 655Canada West 24 — 50 74
Table 31—Base-level fiber input assumptions for corrugatingmedium manufacturing processes in the NAPAP Model
Fiber input (percent)
Fiber source Process1
Process2
Process3
Process4
Integrated pulpSemichemical
pulp 67–100 90–100 — —
Mechanical pulp (CMP)
— — — 67–100
Recycled fiberOld corru-
gated (OCC) 33–0 10–0 95 —
Mixed paper — — 5 33–0
Max. softwood fibera
Semichemical pulp
95 95 — —
Mechanical pulp (CMP)
— — — 100
Max. hardwood fibera
Semichemical pulp
95 95 — —
Mechanical pulp (CMP)
— — — 100
aMaximum amount allowed in pulp.

41
Table 32—Base-level input coefficients and costs for corrugating medium manufacturingprocesses by region, per tonne of finished product output
Region and output Process 1 Process 2 Process 3 Process 4
U.S. NORTH Softwood pulpwood (m3) 2.31–0.12
(or 0.08) 2.31–0.12 (or 0.10)
2.30–0
Hardwood pulpwood (m3) 0.11–2.21(or 1.49)
0.11–2.21 (or 1.98)
0–2.20 (or 1.48)
Old corrugated (OCC) (t) (+0.41) (+0.12) 1.18 Mixed papers (t) 0.06 (+0.43)Purchased fuel (×10 GJ) 0.86 0.90 0.92 0.15 Electricity (MWh) 0.62 0.75 0.55 1.00 Labor (h) 0.24 0.24 0.16 0.15 Administrative labor (h) 0.04 0.04 0.05 0.04 Other mfg. costs (1986$) 88.79 90.27 62.28 89.02
U.S. SOUTH Softwood pulpwood (m3) 2.35–0.12
(or 0.08) 2.35–0.12 (or 0.11)
2.33–0
Hardwood pulpwood (m3) 0.10–1.77 (or 1.19)
0.10–1.77(or 1.59)
0–1.76 (or 1.18)
Old corrugated (OCC) (t) (+0.41) (+0.12) 1.18 Mixed papers (t) 0.06 (+0.43)Purchased fuel (×10 GJ) 0.76 0.80 0.82 0.15 Electricity (MWh) 0.62 0.75 0.55 1.00 Labor (h) 0.24 0.24 0.16 0.15 Administrative labor (h) 0.04 0.04 0.05 0.04 Other mfg. costs (1986$) 88.79 90.27 62.28 89.02
U.S. WEST Softwood pulpwood (m3) 3.21–0.16
(or 2.15) 3.05–0.16 (or 2.89)
3.03–0 (or 2.14)
Hardwood pulpwood (m3) 0–2.81 (or 0.09)
0.15–2.8 (or 0.13)
0–2.79
Old corrugated (OCC) (t) (+0.41) (+0.12) 1.18 Mixed papers (t) 0.06 (+0.43)Purchased fuel (×10 GJ) 0.76 0.80 0.82 0.15 Electricity (MWh) 0.62 0.75 0.55 1.00 Labor (h) 0.24 0.24 0.16 0.15 Administrative labor (h) 0.04 0.04 0.05 0.04 Other mfg. costs (1986$) 88.79 90.27 62.28 89.02
CANADA EAST Softwood pulpwood (m3) 2.95–0.17
(or 0.11) 2.95–0.17(or 0.14)
2.94–0 (or 2.02)
Hardwood pulpwood (m3) 0.17–2.95 (or 1.97)
0.17–2.95 (or 2.67)
0–3.01
Old corrugated (OCC) (t) (+0.41) (+ 0.12) 1.18 Mixed papers (t) 0.06 (+0.43)Purchased fuel (×10 GJ) 0.96 1.00 1.02 0.25 Electricity (MWh) 0.62 0.75 0.55 1.00 Labor (h) 0.24 0.24 0.16 0.15 Administrative labor (h) 0.04 0.04 0.05 0.04 Other mfg. costs (1986$) 91.01 92.31 64.15 95.00
CANADA WEST Softwood pulpwood (m3) 2.95–0.17
(or 0.11) 2.94–0 (or 2.02)
Hardwood pulpwood (m3) 0.17–2.95 (or 1.97)
0–3.01
Old corrugated (OCC) (t) (+0.41) 1.18 Mixed papers (t) 0.06 (+0.43)Purchased fuel (×10 GJ) 0.86 0.92 0.15 Electricity (MWh) 0.62 0.55 1.00 Labor (h) 0.24 0.16 0.15 Administrative labor (h) 0.04 0.05 0.04 Other mfg. costs (1986$) 91.14 64.58 95.00

42
Table 35 summarizes NAPAP Model base-level inputcoefficients and costs by region for the solid bleached boardmanufacturing process.
Recycled Board
This commodity category includes about two-thirds of therecycled paperboard grade recognized by API in the UnitedStates. For the purpose of the NAPAP Model, this categoryexcludes the linerboard and corrugating medium productswithin the API recycled paperboard grade (linerboard andcorrugating medium are included in separate commoditycategories in the NAPAP Model, as explained previously).Recycled board also includes the recycled paperboardportions of the folding boxboard and other boxboard gradecategories recognized by CPPA in Canada. As defined here,the recycled board category includes paperboard productsthat are made entirely from secondary (recycled) fiber andthat include folding boxboard, container chip and fillerboard, set-up board, gypsum wallboard facing, and otherrecycled paperboard products, such as file folders, tabletbacks, tubes, and can and drum stock. As defined here,recycled board production capacity in 1986 was 6,328,000tonnes in the United States (API) and upwards of 502,000tonnes in Canada (estimated by Forestry Canada based on
Table 33—Regional distribution of solid bleachedboard production capacity in North America, 1986
Region Total (×103 t)
U.S. North 21U.S. South 3,678U.S. West 461Canada East 73Canada West —
Table 35—Base-level input coefficients and costs for solidbleached board manufacturing processes by region, pertonne of finished product output
Region and output Process 1 Process 2
U.S. NORTH
Softwood pulpwood (m3) 2.75–1.21 (or 2.70–1.18)
2.57–0.85
Hardwood pulpwood (m3) 0.88–2.35 (or 0.85–2.30)
0.61–2.25
Old corrugated (OCC) (t) (+ 0.02) Purchased fuel (×10 GJ) 0.98 0.70 Electricity (MWh) 1.23 1.50 Labor (h) 0.44 0.35 Administrative labor (h) 0.06 0.05 Other mfg. costs (1986$) 224.56 221.88
U.S. SOUTH
Softwood pulpwood (m3) 2.80–1.22 (or 2.75–1.21)
2.60–0.86
Hardwood pulpwood (m3) 0.70–1.88 (or 0.68–1.85)
0.49–1.80
Old corrugated (OCC) (t) (+0.02) Purchased fuel (×10 GJ) 0.88 0.60 Electricity (MWh) 1.23 1.50 Labor (h) 0.44 0.35 Administrative labor (h) 0.06 0.05 Other mfg. costs (1986$) 224.56 221.88
U.S. WEST
Softwood pulpwood (m3) 4.82–1.60 (or 3.55–1.57 )
3.37–1.12
Hardwood pulpwood (m3) 0–2.99(or 1.09–2.93)
0.78–2.86
Old corrugated (OCC) (t) (+0.02) Purchased fuel (×10 GJ) 0.88 0.60 Electricity (MWh) 1.23 1.50 Labor (h) 0.44 0.35 Administrative labor (h) 0.06 0.05 Other mfg. costs (1986$) 224.56 221.88
CANADA EAST
Softwood pulpwood (m3) 3.53–1.56 (or 3.45–1.53)
3.27–1.08
Hardwood pulpwood (m3) 1.17–3.14 (or 1.14–3.08)
0.84–3.08
Old corrugated (OCC) (t) (+0.02) Purchased fuel (×10 GJ) 1.08 0.80 Electricity (MWh) 1.23 1.50 Labor (h) 0.44 0.35 Administrative labor (h) 0.06 0.05 Other mfg. costs (1986$) 251.45 245.00
CANADA WEST
Softwood pulpwood (m3) 3.27–1.08
Hardwood pulpwood (m3) 0.84–3.08 Old corrugated (OCC) (t) Purchased fuel (×10 GJ) 0.70 Electricity (MWh) 1.50 Labor (h) 0.35 Administrative labor (h) 0.05 Other mfg. costs (1986$) 245.00
Table 34—Base-level fiber input assumptions for solidbleached board manufacturing process in the NAPAP Model
Fiber input (percent)
Fiber source Process 1 Process 2
Integrated pulp
Bleached kraft pulp 98–100 70
Mechanical pulp (CTMP) 30
Recycled fiber
Old corrugated (OCC) 2–0
Max. softwood fibera
Bleached kraft pulp 75b 75
Mechanical pulp (CTMP) 100
Max. hardwood fibera
Bleached kraft pulp 67 67
Mechanical pulp (CTMP) 100
aMaximum amount allowed in pulp.b100 percent in U.S. West.

43
information from CPPA). In 1986, there was essentially onlyone production process for recycled board in North Americain terms of fiber inputs since all fiber input was recycledfiber. For the purpose of the NAPAP Model, the process wasdefined as follows:
Process 1: Based exclusively on secondary (recycled)fiber, with no integrated pulping facilities and nomarket pulp input. Fiber furnish included variousgrades of recovered paper, including ONP, OCC,mixed papers, pulp substitutes, and some high-gradedeinking grades of recovered paper.
The recycled board industry in North America was examinedin detail, using industry directories and other publishedsources of information (Post’s and Lockwood’s directories,and company profiles). Table 36 summarizes the estimatedregional production capacity for recycled board in 1986(based on capacity data reported by API and CPPA).
Some improvements in energy efficiency and labor produc-tivity were anticipated to occur over time for all processes inthe model, but entirely new or future processes for recycledboard were not included in the base-level data of the NAPAPModel. Fiber input data for recycled board were developedseparately for each region of the NAPAP Model, based onunpublished fiber furnish survey data from API and CPPA.Table 37 summarizes NAPAP Model base-level inputcoefficients and costs by region for the recycled boardmanufacturing process.
Construction Paper & Board
The NAPAP commodity category of construction paper &board (and other) includes four product categories recog-nized by the U.S. Department of Commerce in 1986, wetmachine board, insulating board, construction paper, andhardboard products. It also includes the building & othercommodity category recognized by CPPA in Canada.Generally, construction paper & board (and other) includesproducts such as sheathing paper and felt (including roofingfelt), binders board, shoe board, automotive board, furniturebacking, insulating board, acoustical tile, standard andtempered hardboard, and laminated and coated hardboard.Regional production capacity data for the United States werenot directly available from the U.S. Department of Com-merce for products in this category, but were estimated basedon Commerce Department data and other sources. The data
Table 36—Regional distribution of recycled board production capacity in North America, 1986
Region Total (×103 t)
U.S. North 3,682 U.S. South 1,714 U.S. West 932 Canada East 445 Canada West 57
Table 37—Base-level input coefficients and costsfor recycled board manufacturing process by region,per tonne of finished product output
Region and output Process 1
U.S. NORTH
Old newspapers (ONP) (t) 0.19 Old corrugated (OCC) (t) 0.57 Mixed papers (t) 0.18 Pulp subs. & high grade (t) 0.13 Purchased fuel (×10 GJ) 0.81 Electricity (MWh) 0.49 Labor (h) 0.46 Administrative labor (h) 0.06 Other mfg. costs (1986$) 87.80
U.S. SOUTH
Old newspapers (ONP) (t) 0.15 Old corrugated (OCC) (t) 0.58 Mixed papers (t) 0.26 Pulp subs. & high grade (t) 0.10 Purchased fuel (×10 GJ) 0.81 Electricity (MWh) 0.49 Labor (h) 0.46 Administrative labor (h) 0.06 Other mfg. costs (1986$) 87.80
U.S. WEST
Old newspapers (ONP) (t) 0.11 Old corrugated (OCC) (t) 0.83 Mixed papers (t) 0.09 Pulp subs. & high grade (t) 0.06 Purchased fuel (×10 GJ) 0.81 Electricity (MWh) 0.49 Labor (h) 0.46 Administrative labor (h) 0.06 Other mfg. costs (1986$) 87.80
CANADA EAST
Old newspapers (ONP) (t) 0.19 Old corrugated (OCC) (t) 0.57 Mixed papers (t) 0.18 Pulp subs. & high grade (t) 0.13 Purchased fuel (×10 GJ) 0.81 Electricity (MWh) 0.49 Labor (h) 0.46 Administrative labor (h) 0.06 Other mfg. costs (1986$) 90.68
Canada WestOld newspapers (ONP) (t) 0.19 Old corrugated (OCC) (t) 0.57 Mixed papers (t) 0.18 Pulp subs. & high grade (t) 0.13 Purchased fuel (×10 GJ) 0.71 Electricity (MWh) 0.49 Labor (h) 0.46 Administrative labor (h) 0.06 Other mfg. costs (1986$) 91.82
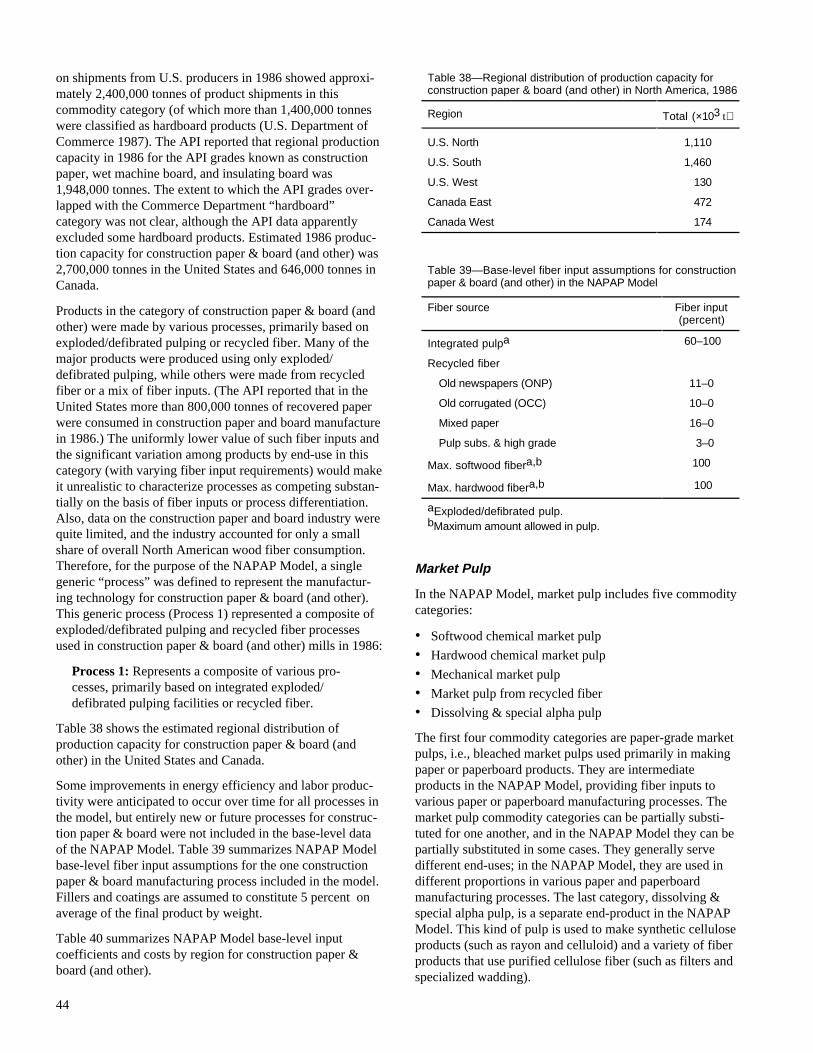
44
on shipments from U.S. producers in 1986 showed approxi-mately 2,400,000 tonnes of product shipments in thiscommodity category (of which more than 1,400,000 tonneswere classified as hardboard products (U.S. Department ofCommerce 1987). The API reported that regional productioncapacity in 1986 for the API grades known as constructionpaper, wet machine board, and insulating board was1,948,000 tonnes. The extent to which the API grades over-lapped with the Commerce Department “hardboard”category was not clear, although the API data apparentlyexcluded some hardboard products. Estimated 1986 produc-tion capacity for construction paper & board (and other) was2,700,000 tonnes in the United States and 646,000 tonnes inCanada.
Products in the category of construction paper & board (andother) were made by various processes, primarily based onexploded/defibrated pulping or recycled fiber. Many of themajor products were produced using only exploded/defibrated pulping, while others were made from recycledfiber or a mix of fiber inputs. (The API reported that in theUnited States more than 800,000 tonnes of recovered paperwere consumed in construction paper and board manufacturein 1986.) The uniformly lower value of such fiber inputs andthe significant variation among products by end-use in thiscategory (with varying fiber input requirements) would makeit unrealistic to characterize processes as competing substan-tially on the basis of fiber inputs or process differentiation.Also, data on the construction paper and board industry werequite limited, and the industry accounted for only a smallshare of overall North American wood fiber consumption.Therefore, for the purpose of the NAPAP Model, a singlegeneric “process” was defined to represent the manufactur-ing technology for construction paper & board (and other).This generic process (Process 1) represented a composite ofexploded/defibrated pulping and recycled fiber processesused in construction paper & board (and other) mills in 1986:
Process 1: Represents a composite of various pro-cesses, primarily based on integrated exploded/defibrated pulping facilities or recycled fiber.
Table 38 shows the estimated regional distribution ofproduction capacity for construction paper & board (andother) in the United States and Canada.
Some improvements in energy efficiency and labor produc-tivity were anticipated to occur over time for all processes inthe model, but entirely new or future processes for construc-tion paper & board were not included in the base-level dataof the NAPAP Model. Table 39 summarizes NAPAP Modelbase-level fiber input assumptions for the one constructionpaper & board manufacturing process included in the model.Fillers and coatings are assumed to constitute 5 percent onaverage of the final product by weight.
Table 40 summarizes NAPAP Model base-level inputcoefficients and costs by region for construction paper &board (and other).
Market Pulp
In the NAPAP Model, market pulp includes five commoditycategories:
• Softwood chemical market pulp
• Hardwood chemical market pulp
• Mechanical market pulp
• Market pulp from recycled fiber
• Dissolving & special alpha pulp
The first four commodity categories are paper-grade marketpulps, i.e., bleached market pulps used primarily in makingpaper or paperboard products. They are intermediateproducts in the NAPAP Model, providing fiber inputs tovarious paper or paperboard manufacturing processes. Themarket pulp commodity categories can be partially substi-tuted for one another, and in the NAPAP Model they can bepartially substituted in some cases. They generally servedifferent end-uses; in the NAPAP Model, they are used indifferent proportions in various paper and paperboardmanufacturing processes. The last category, dissolving &special alpha pulp, is a separate end-product in the NAPAPModel. This kind of pulp is used to make synthetic celluloseproducts (such as rayon and celluloid) and a variety of fiberproducts that use purified cellulose fiber (such as filters andspecialized wadding).
Table 38—Regional distribution of production capacity forconstruction paper & board (and other) in North America, 1986
Region Total (×103 t)
U.S. North 1,110
U.S. South 1,460
U.S. West 130
Canada East 472
Canada West 174
Table 39—Base-level fiber input assumptions for constructionpaper & board (and other) in the NAPAP Model
Fiber source Fiber input(percent)
Integrated pulpa 60–100
Recycled fiber
Old newspapers (ONP) 11–0
Old corrugated (OCC) 10–0
Mixed paper 16–0
Pulp subs. & high grade 3–0
Max. softwood fibera,b 100
Max. hardwood fibera,b 100
aExploded/defibrated pulp.bMaximum amount allowed in pulp.
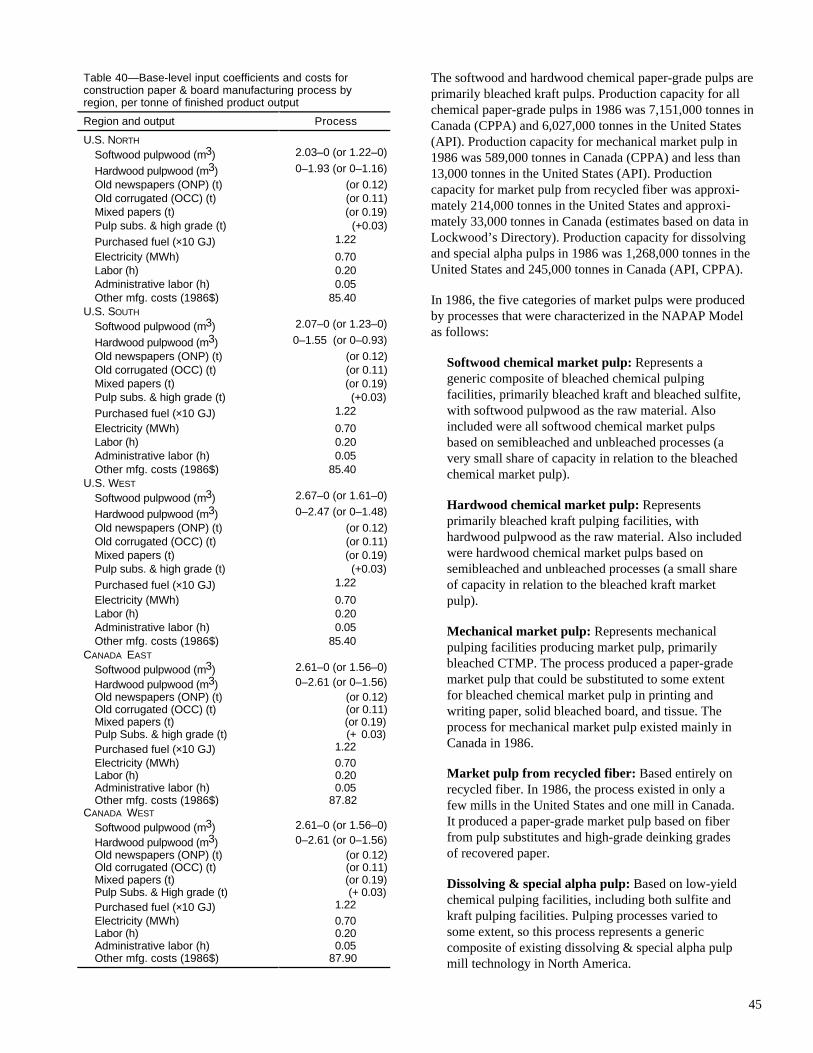
45
The softwood and hardwood chemical paper-grade pulps areprimarily bleached kraft pulps. Production capacity for allchemical paper-grade pulps in 1986 was 7,151,000 tonnes inCanada (CPPA) and 6,027,000 tonnes in the United States(API). Production capacity for mechanical market pulp in1986 was 589,000 tonnes in Canada (CPPA) and less than13,000 tonnes in the United States (API). Productioncapacity for market pulp from recycled fiber was approxi-mately 214,000 tonnes in the United States and approxi-mately 33,000 tonnes in Canada (estimates based on data inLockwood’s Directory). Production capacity for dissolvingand special alpha pulps in 1986 was 1,268,000 tonnes in theUnited States and 245,000 tonnes in Canada (API, CPPA).
In 1986, the five categories of market pulps were producedby processes that were characterized in the NAPAP Modelas follows:
Softwood chemical market pulp: Represents ageneric composite of bleached chemical pulpingfacilities, primarily bleached kraft and bleached sulfite,with softwood pulpwood as the raw material. Alsoincluded were all softwood chemical market pulpsbased on semibleached and unbleached processes (avery small share of capacity in relation to the bleachedchemical market pulp).
Hardwood chemical market pulp: Representsprimarily bleached kraft pulping facilities, withhardwood pulpwood as the raw material. Also includedwere hardwood chemical market pulps based onsemibleached and unbleached processes (a small shareof capacity in relation to the bleached kraft marketpulp).
Mechanical market pulp: Represents mechanicalpulping facilities producing market pulp, primarilybleached CTMP. The process produced a paper-grademarket pulp that could be substituted to some extentfor bleached chemical market pulp in printing andwriting paper, solid bleached board, and tissue. Theprocess for mechanical market pulp existed mainly inCanada in 1986.
Market pulp from recycled fiber: Based entirely onrecycled fiber. In 1986, the process existed in only afew mills in the United States and one mill in Canada.It produced a paper-grade market pulp based on fiberfrom pulp substitutes and high-grade deinking gradesof recovered paper.
Dissolving & special alpha pulp: Based on low-yieldchemical pulping facilities, including both sulfite andkraft pulping facilities. Pulping processes varied tosome extent, so this process represents a genericcomposite of existing dissolving & special alpha pulpmill technology in North America.
Table 40—Base-level input coefficients and costs forconstruction paper & board manufacturing process byregion, per tonne of finished product output
Region and output Process
U.S. NORTH
Softwood pulpwood (m3) 2.03–0 (or 1.22–0)
Hardwood pulpwood (m3) 0–1.93 (or 0–1.16)Old newspapers (ONP) (t) (or 0.12)Old corrugated (OCC) (t) (or 0.11)Mixed papers (t) (or 0.19)Pulp subs. & high grade (t) (+0.03)Purchased fuel (×10 GJ) 1.22
Electricity (MWh) 0.70 Labor (h) 0.20 Administrative labor (h) 0.05 Other mfg. costs (1986$) 85.40
U.S. SOUTH
Softwood pulpwood (m3) 2.07–0 (or 1.23–0)
Hardwood pulpwood (m3) 0–1.55 (or 0–0.93)Old newspapers (ONP) (t) (or 0.12)Old corrugated (OCC) (t) (or 0.11)Mixed papers (t) (or 0.19)Pulp subs. & high grade (t) (+0.03) Purchased fuel (×10 GJ) 1.22
Electricity (MWh) 0.70 Labor (h) 0.20 Administrative labor (h) 0.05 Other mfg. costs (1986$) 85.40
U.S. WEST
Softwood pulpwood (m3) 2.67–0 (or 1.61–0)
Hardwood pulpwood (m3) 0–2.47 (or 0–1.48)Old newspapers (ONP) (t) (or 0.12)Old corrugated (OCC) (t) (or 0.11)Mixed papers (t) (or 0.19)Pulp subs. & high grade (t) (+0.03) Purchased fuel (×10 GJ) 1.22
Electricity (MWh) 0.70 Labor (h) 0.20 Administrative labor (h) 0.05 Other mfg. costs (1986$) 85.40
CANADA EAST
Softwood pulpwood (m3) 2.61–0 (or 1.56–0)
Hardwood pulpwood (m3) 0–2.61 (or 0–1.56)Old newspapers (ONP) (t) (or 0.12)Old corrugated (OCC) (t) (or 0.11)Mixed papers (t) (or 0.19) Pulp Subs. & high grade (t) (+ 0.03) Purchased fuel (×10 GJ) 1.22 Electricity (MWh) 0.70 Labor (h) 0.20 Administrative labor (h) 0.05 Other mfg. costs (1986$) 87.82
CANADA WEST
Softwood pulpwood (m3) 2.61–0 (or 1.56–0)
Hardwood pulpwood (m3) 0–2.61 (or 0–1.56)Old newspapers (ONP) (t) (or 0.12)Old corrugated (OCC) (t) (or 0.11)Mixed papers (t) (or 0.19)Pulp Subs. & High grade (t) (+ 0.03) Purchased fuel (×10 GJ) 1.22 Electricity (MWh) 0.70 Labor (h) 0.20 Administrative labor (h) 0.05 Other mfg. costs (1986$) 87.90
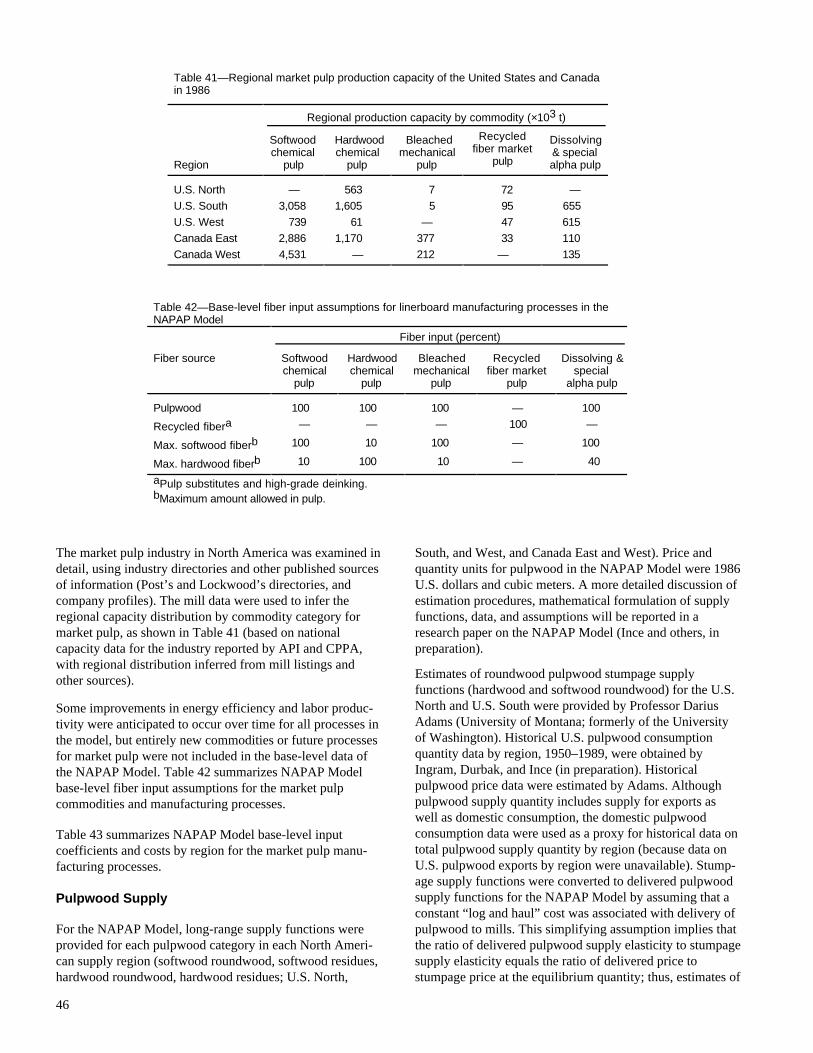
46
The market pulp industry in North America was examined indetail, using industry directories and other published sourcesof information (Post’s and Lockwood’s directories, andcompany profiles). The mill data were used to infer theregional capacity distribution by commodity category formarket pulp, as shown in Table 41 (based on nationalcapacity data for the industry reported by API and CPPA,with regional distribution inferred from mill listings andother sources).
Some improvements in energy efficiency and labor produc-tivity were anticipated to occur over time for all processes inthe model, but entirely new commodities or future processesfor market pulp were not included in the base-level data ofthe NAPAP Model. Table 42 summarizes NAPAP Modelbase-level fiber input assumptions for the market pulpcommodities and manufacturing processes.
Table 43 summarizes NAPAP Model base-level inputcoefficients and costs by region for the market pulp manu-facturing processes.
Pulpwood Supply
For the NAPAP Model, long-range supply functions wereprovided for each pulpwood category in each North Ameri-can supply region (softwood roundwood, softwood residues,hardwood roundwood, hardwood residues; U.S. North,
South, and West, and Canada East and West). Price andquantity units for pulpwood in the NAPAP Model were 1986U.S. dollars and cubic meters. A more detailed discussion ofestimation procedures, mathematical formulation of supplyfunctions, data, and assumptions will be reported in aresearch paper on the NAPAP Model (Ince and others, inpreparation).
Estimates of roundwood pulpwood stumpage supplyfunctions (hardwood and softwood roundwood) for the U.S.North and U.S. South were provided by Professor DariusAdams (University of Montana; formerly of the Universityof Washington). Historical U.S. pulpwood consumptionquantity data by region, 1950–1989, were obtained byIngram, Durbak, and Ince (in preparation). Historicalpulpwood price data were estimated by Adams. Althoughpulpwood supply quantity includes supply for exports aswell as domestic consumption, the domestic pulpwoodconsumption data were used as a proxy for historical data ontotal pulpwood supply quantity by region (because data onU.S. pulpwood exports by region were unavailable). Stump-age supply functions were converted to delivered pulpwoodsupply functions for the NAPAP Model by assuming that aconstant “log and haul” cost was associated with delivery ofpulpwood to mills. This simplifying assumption implies thatthe ratio of delivered pulpwood supply elasticity to stumpagesupply elasticity equals the ratio of delivered price tostumpage price at the equilibrium quantity; thus, estimates of
Table 42—Base-level fiber input assumptions for linerboard manufacturing processes in theNAPAP Model
Fiber input (percent)
Fiber source Softwood chemical
pulp
Hardwoodchemical
pulp
Bleachedmechanical
pulp
Recycledfiber market
pulp
Dissolving &special
alpha pulp
Pulpwood 100 100 100 — 100
Recycled fibera — — — 100 —
Max. softwood fiberb 100 10 100 — 100
Max. hardwood fiberb 10 100 10 — 40
aPulp substitutes and high-grade deinking.bMaximum amount allowed in pulp.
Table 41—Regional market pulp production capacity of the United States and Canadain 1986
Regional production capacity by commodity (×103 t)
Region
Softwood chemical
pulp
Hardwoodchemical
pulp
Bleachedmechanical
pulp
Recycledfiber market
pulp
Dissolving& special alpha pulp
U.S. North — 563 7 72 —U.S. South 3,058 1,605 5 95 655U.S. West 739 61 — 47 615 Canada East 2,886 1,170 377 33 110 Canada West 4,531 — 212 — 135

47
Table 43—Base-level input coefficients and costs for market pulp manufacturing processes by region,per air-dry tonne of finished product output
Region and outputDissolving
pulpSoftwoodchemical
Hardwoodchemical
Mechanical(BCTMP)
Market pulpfrom recycled
fibers
U.S. NORTH
Softwood pulpwood (m3) 0.42–0 .00 2.12–2.00
Hardwood pulpwood (m3) 3.58–3.98 0–0.20 Pulp subs. & high grade (t) 1.25Purchased fuel (×10 GJ) 1.08 0.62 0.96Electricity (MWh) 0.70 2.50 0.50 Labor (h) 0.19 0.06 0.11Administrative labor (h) 0.06 0.03 0.05 Other mfg. costs (1986$) 260.08 191.18 153.65
U.S. SOUTH
Softwood pulpwood (m3) 4.96–2.97 4.23–3.80 0.42–0.00 2.16–1.94
Hardwood pulpwood (m3) 0–1.50 0–0.32 2.86–3.18 0–0.16 Pulp subs. & high grade (t) 1.25 Purchased fuel (×10 GJ) 0.90 5.00 5.00 0.52 0.96Electricity (MWh) 0.70 0.15 0.15 2.50 0.50 Labor (h) 0.40 0.19 0.19 0.06 0.11Administrative labor (h) 0.09 0.06 0.06 0.03 0.05 Other mfg. costs (1986$) 222.62 290.24 264.34 195.44 157.91
U.S. WEST
Softwood pulpwood (m3) 6.45–3.86 5.49–4.94 0.55–0.00
Hardwood pulpwood (m3) 0–2.37 0–0.51 4.55–5.05 Pulp subs. & high grade (t) 1.25 Purchased fuel (×10 GJ) 0.90 5.30 5.30 0.96Electricity (MWh) 0.70 0.70 0.70 0.50 Labor (h) 0.40 0.19 0.19 0.11Administrative labor (h) 0.09 0.05 0.05 0.05 Other mfg. costs (1986$) 222.62 294.71 268.81 162.38
CANADA EAST
Softwood pulpwood (m3) 6.25–3.75 5.31–4.78 0.53–0.00 2.72–2.45
Hardwood pulpwood (m3) 0–2.50 0–0.53 4.78–5.31 0–0.28Pulp subs. & high grade (t) 1.25Purchased fuel (×10 GJ) 1.09 6.70 6.70 0.71 0.96 Electricity (MWh) 0.70 0.32 0.32 2.50 0.50 Labor (h) 0.40 0.24 0.24 0.06 0.11Administrative labor (h) 0.09 0.08 0.08 0.03 0.05Other mfg. costs (1986$) 232.44 293.44 267.08 186.92 143.05
CANADA WEST
Softwood pulpwood (m3) 6.25–3.75 5.31–4.78 2.72–2.45
Hardwood pulpwood (m3) 0–2.50 0–0.53 0–0.28Pulp subs. & high grade (t) Purchased fuel (× 10 GJ) 1.00 1.08 0.61 Electricity (MWh) 0.70 0.41 2.50 Labor (h) 0.40 0.22 0.06 Administrative labor (h) 0.09 0.08 0.03 Other mfg. costs (1986$) 233.88 296.83 188.22

48
delivered pulpwood price elasticities were derived fromstumpage supply functions estimated by Adams. In addition,the price elasticity for hardwood pulpwood in the South wasgradually reduced to 1.0 in the period between 2005 and2015, to simulate a supply response to projected declines inhardwood timber inventory in the South (as projected by theForest Service TAMM/ATLAS model). The hardwoodroundwood pulpwood price elasticity was reduced from2.98 to 2.3 in 2005, 1.5 in 2010, and 1.0 in 2015.
In the pulpwood stumpage supply equations estimated byAdams, pulpwood supply was related to regional timberinventory (timber growing stock volume), sawtimberstumpage price, and the discount rate (a determinant oftimberland investment). Since the delivered pulpwoodsupply curves were derived by shifting stumpage supplycurves only in the price dimension and not in any otherdimension, the delivered pulpwood supply equations havethe same elasticities with respect to exogenous shiftervariables as the stumpage supply equations. Long-rangeprojections of the first two shifters were obtained from theForest Service TAMM/ATLAS model (which projectstimber growth and inventory, stumpage markets, and outputsof the solid wood product sector). The exogenous projectionswere obtained from TAMM/ATLAS run number LR123(dated January 29, 1993). The discount rate projection wasobtained exogenously from the basic RPA assumptions.
Delivered pulpwood supply equations for residues in theUnited States (North, South, and West) and roundwoodpulpwood supply in the West were all specified in a moresimplified manner for the NAPAP Model. The “L-shaped”supply curves were specified (defining supply functions thatare flat in the price dimension, with a vertical upper boundon supply). The flat portion of the supply curve represents a“reservation price” for the commodity (a price that must bepaid to cover ordinary procurement and delivery costs),while the vertical portion of the supply curve represents anabsolute upper bound on the supply of the commodity.Illustrative examples and discussion of techniques forspecifying such functions are provided in the PELPS IIImanual (Zhang and others, in preparation ). Upper boundsfor residues and roundwood in the West were specified forthe base period (1986) as equivalent to the base-yearproduction quantity in each case.
Both the reservation price and upper bound were projected tochange over time in the NAPAP Model, to reflect exogenouschanges in supply. It was assumed that projected log andhaul cost is an appropriate shifter of the reservation price forresidues generally and for roundwood in the West. The ideawas that all the residue material (including residue materialsuch as chips, sawmill slabs, and edgings) must be initiallylogged as sawtimber and hauled to a mill (such as a sawmillor plywood mill), and therefore this cost establishes aminimum price that must be paid for the material. Thevertical portion of the supply curves, or upper bounds onsupply, were assumed to be equivalent to a certain fraction ofregional sawmill and plywood mill residue output (a variable
projected by the TAMM/ATLAS model). Similar conceptswere used to specify delivered roundwood pulpwood supplyequations for the U.S. West (i.e., L-shaped supply curves),except that the upper bound was regarded as determined by aregional timber harvest (largely influenced in the West bygovernment timber policies on public lands). The projectedchanges in upper bounds on supply thus reflect projectedlimits on the physical quantities of mill residues available forpulpwood and projected limits on the quantity of roundwoodavailable in the West (as determined by projected timberharvest in the West).
Canadian pulpwood roundwood supply functions for theNAPAP Model were estimated by the Economics and PolicyDirectorate of Forestry Canada (Ottawa, Ontario). ForCanada, historical timber inventory data comparable tonational data were not available, although it was known thatCanadian inventories of timber are quite large and lessdynamic than U.S. timber inventories. Delivered pulpwoodsupply in Canada was believed to be related primarily tolabor costs, timber stumpage prices, and U.S./Canadaexchange rates. Thus, delivered roundwood pulpwoodsupply functions included the shifter variables of labor costs,overall stumpage prices in Canada, and exchange rates.Delivered pulpwood residue supply functions included theshifter variables of regional lumber production and exchangerates. Canadian regional lumber production volumes pro-jected by the TAMM/ATLAS model were used to shiftresidue pulpwood supply functions. Growth rates for otherCanadian pulpwood supply shifter variables were projectedexogenously by Forestry Canada.
Tables 44 and 45 summarize the pulpwood supply functionelasticities, along with base-period prices and quantities.Base-period pulpwood supply quantity data were approxi-mated based on data published by the U.S. Department ofCommerce, API, Statistics Canada, and Forestry Canada.Base-period pulpwood price data were approximated basedon USDA Forest Service data and other sources.
Linkage to TAMM/ATLAS Model
Linkage between the NAPAP Model and the USDA ForestService TAMM/ATLAS system was established by obtainingconvergent timber supply and demand equilibria throughiterative solutions of the NAPAP and TAMM models.Revised timber projections from one model were used asdata input for the other model on each iteration, untilconvergent solutions were obtained. Pulpwood marketprojections from the NAPAP Model were used as data inputto the TAMM model. The pulpwood projections includedregional supply quantities of pulpwood roundwood andresidues, hardwoood and softwood, and projected pulpwoodprices. In turn, timber projections from the TAMM modelwere used as data input to the NAPAP Model. Theseincluded projected timber inventory, sawtimber prices,lumber production and residue output by region, which wereused to shift pulpwood supply functions in the NAPAPModel.
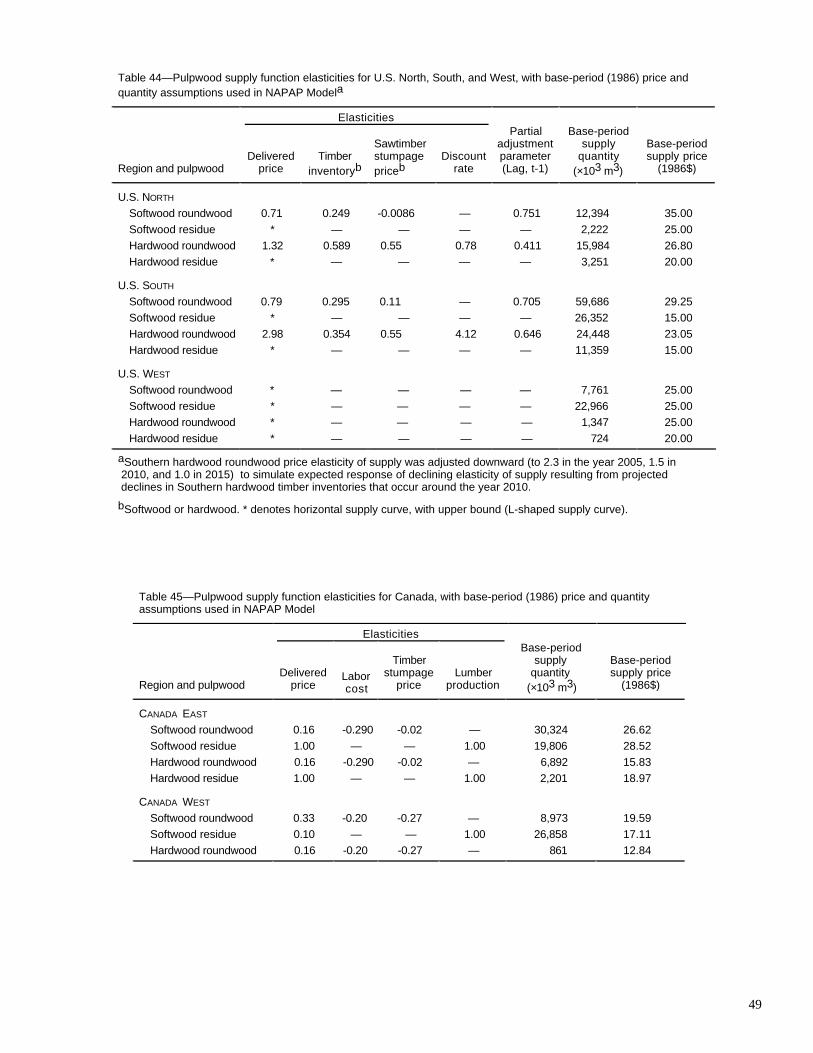
49
Table 45—Pulpwood supply function elasticities for Canada, with base-period (1986) price and quantityassumptions used in NAPAP Model
Elasticities
Region and pulpwoodDelivered
priceLaborcost
Timberstumpage
priceLumber
production
Base-periodsupply
quantity (×103 m3)
Base-periodsupply price
(1986$)
CANADA EAST
Softwood roundwood 0.16 -0.290 -0.02 — 30,324 26.62Softwood residue 1.00 — — 1.00 19,806 28.52Hardwood roundwood 0.16 -0.290 -0.02 — 6,892 15.83Hardwood residue 1.00 — — 1.00 2,201 18.97
CANADA WEST
Softwood roundwood 0.33 -0.20 -0.27 — 8,973 19.59Softwood residue 0.10 — — 1.00 26,858 17.11Hardwood roundwood 0.16 -0.20 -0.27 — 861 12.84
Table 44—Pulpwood supply function elasticities for U.S. North, South, and West, with base-period (1986) price andquantity assumptions used in NAPAP Modela
Elasticities
Region and pulpwoodDelivered
priceTimber
inventoryb
Sawtimberstumpagepriceb
Discountrate
Partialadjustmentparameter(Lag, t-1)
Base-periodsupply
quantity(×103 m3)
Base-periodsupply price
(1986$)
U.S. NORTH
Softwood roundwood 0.71 0.249 -0.0086 — 0.751 12,394 35.00Softwood residue * — — — — 2,222 25.00Hardwood roundwood 1.32 0.589 0.55 0.78 0.411 15,984 26.80Hardwood residue * — — — — 3,251 20.00
U.S. SOUTH
Softwood roundwood 0.79 0.295 0.11 — 0.705 59,686 29.25Softwood residue * — — — — 26,352 15.00Hardwood roundwood 2.98 0.354 0.55 4.12 0.646 24,448 23.05Hardwood residue * — — — — 11,359 15.00
U.S. WEST
Softwood roundwood * — — — — 7,761 25.00Softwood residue * — — — — 22,966 25.00Hardwood roundwood * — — — — 1,347 25.00Hardwood residue * — — — — 724 20.00
aSouthern hardwood roundwood price elasticity of supply was adjusted downward (to 2.3 in the year 2005, 1.5 in 2010, and 1.0 in 2015) to simulate expected response of declining elasticity of supply resulting from projected declines in Southern hardwood timber inventories that occur around the year 2010.
bSoftwood or hardwood. * denotes horizontal supply curve, with upper bound (L-shaped supply curve).
50
landfills). Annual surveys of tipping fees conducted by theNational Solid Waste Management Association (NSWMA)during the 1980s show clearly that landfill tipping fees haveincreased the most in northern and eastern regions of thecountry where the glut in recovered paper markets has beenthe most pronounced (as reflected by depressed prices forrecovered paper). Thus, rising tipping fees appear to havebeen a causal factor in the expansion of collection programsand increased supply of recovered paper in recent years.Therefore, in estimating regional recovered paper supplyfunctions for the United States, regional landfill tipping feeswere used as a primary shifter variable for recovered papersupply. Future growth in tipping fees was projected throughthe 1990s by extrapolation of regional growth rates observedin the period from 1981 to 1991. A relatively modest long-run real tipping fee growth of 4 percent per year wasassumed in the 21st century. Although 4 percent per year isa much more moderate rate of increase than the average realincrease in tipping fees observed over the past decade, it isreasonable to assume that tipping fees will increase at themore moderate pace in the long run. This is because highertipping fees should provide incentive for siting new landfillcapacity using improved but more costly landfill technology.Although the environmental and health problems of landfillsare never likely to be “solved” in the ultimate sense, themore modest increase in tipping fees over the long run isexpected. An additional shifter variable for recovered papersupply in the United States was regional consumption ofparent commodities from which recovered paper commodi-ties are obtained. As the consumption of the parent com-modities changes over time, recovery and supply of recov-ered paper commodities are likely to change proportionately.Paper and paperboard parent commodity consumption isprojected by the NAPAP Model.
Finally, it was found that to accurately simulate the recov-ered paper glut of recent years (i.e., the depressed prices forrecovered paper commodities), it was necessary to shift U.S.recovered paper supply functions by additional amounts thatcan be attributed to increased collection efforts (beyond whatwould be predicted by historical relationships to tipping feesalone). It may be assumed that the additional increase incollection reflects awareness or anticipation of broaderexternalities associated with waste disposal (e.g., humanhealth effects, effects on local property values) that are notentirely represented by the increase in landfill tipping feesalone. Or, it may simply reflect a “bandwagon” phenomenon(a broad public and institutional desire to collaborate inrecycling programs for environmental or political reasonsthat are not entirely explained by the increase in tippingfees).
For Canada, domestic recovered paper supply functions weredeveloped using three shifter variables for each commodity.These shifter variables generally included consumption ofthe end products from which recovered paper commoditieswere obtained, time, and the Canada/U.S. exchange rate. Forpulp substitutes & high grade deinking, price of chemical
The concept of iterative solutions is simply the concept ofrunning one model to obtain projections, then running theother model based on projections from the first, repeating theprocess several times. This iterative process was crucial toobtaining results that were consistent between both modelsand that linked the NAPAP Model and TAMM/ATLASresults to a comprehensive analysis of overall timberstumpage supply and demand, and timber growth andinventory in North America.
The TAMM/ATLAS model also required projections ofpulpwood consumption from the NAPAP Model in greaterregional detail, since the TAMM/ATLAS regional structureis more detailed than that of the NAPAP Model. TAMM/ATLAS regions of the United States are subregions of thethree U.S. supply regions recognized by the NAPAP Model.Historical trends in pulpwood consumption by TAMM/ATLAS subregion were used to allocate projected U.S.pulpwood consumption quantities of the NAPAP Model(North, South, and West) to the TAMM/ATLAS subregions.The NAPAP Model also provided projected equilibriumprices for pulpwood residues, which were needed to deter-mine profit margins for solid wood product manufacturingactivities simulated in the TAMM/ATLAS model.
Recovered Paper Supply
For the NAPAP Model, long-range supply functions wereestimated for each recovered paper commodity in each NorthAmerican supply region. Supply functions for the UnitedStates were estimated at the Forest Products Laboratory;supply functions for Canada were estimated at the Econ-omics and Policy Directorate of Forestry Canada, Ottawa.The four recovered paper commodities included old newspa-pers (ONP), old corrugated containers (OCC), mixed papers,and pulp substitutes & high grade deinking. All four of therecovered paper commodities are fiber input commodities inNorth America, and they are also exported in significantquantities (as export demand commodities) from the UnitedStates to Latin America, Europe, the Pacific Rim, and otherregions. Price and quantity units for recovered paper in theNAPAP Model were 1986 U.S. dollars and metric tonnes “aspurchased” (this is equivalent to tonnage as reported by theleading industry trade associations and government agencies;recovered paper tonnages reported “as purchased” aregenerally assumed to have an ambient moisture content ofaround 15 percent on a total weight basis). The estimationprocedures, mathematical formulations of supply functions,data, and assumptions will be reported in detail in theNAPAP Model monograph report (Ince and others, inpreparation).
As discussed previously, supplies of recovered paper in theUnited States have increased substantially in recent years dueto increased collection efforts aimed at diverting materialsaway from landfills and into recycling. A primary economicincentive for increased collection has been rising landfilltipping fees (fees charged for disposal of waste materials in

51
grade market pulp (a substitute product) was used instead oftime as a shifter variable. Canadian domestic supply ofrecovered paper is much smaller than U.S. supply. TheNAPAP Model allows for transportation of recovered papercommodities from the U.S. supply regions to Canada, and asubstantial share of Canadian recovered paper inputs wereprojected to be obtained from the United States.
Table 46 summarizes recovered paper supply functionelasticities for the United States and Canada, along withbase-period prices and quantities. Base-period supplyquantity data for the United States were obtained from API(using regional consumption plus exports as a proxy forregional supply). Base-period delivered price data wereobtained by adding estimated within-region transportationcosts to wastepaper prices reported in the Official BoardMarkets price reporter. Quantity and price estimates forCanada were provided by Forestry Canada.
Maximum Feasible Recovery Constraints
Recovered paper commodities are obtained from manydifferent sources, including preconsumer and postconsumersources, but all recovered paper commodities are derivedultimately from recognized categories of paper or paperboardcommodities (called parent commodities). For example,ONP is recovered from sources that range from households(via curbside collection) to newspaper publishers (in returnsof overissue copies), but ultimately all ONP is derived fromone parent commodity, newsprint. Therefore, newsprintconsumption levels and recovery infrastructure limit themaximum feasible supply of ONP.
For the purpose of the NAPAP Model, it was assumed thatONP is derived only from newsprint; OCC is derived fromlinerboard and corrugating medium (used to make corrugatedcontainers); mixed papers are derived from coated ground-wood, uncoated groundwood, specialty packaging & indus-trial, kraft packaging & industrial, and solid bleached board;and pulp substitutes and high grade deinking are derivedfrom coated free sheet, uncoated free sheet, tissue & sanitary,kraft packaging & industrial, solid bleached board, and con-struction paper & board. Maximum feasible recovery ratiosand patterns of recovery vary substantially among thesecommodities. For example, whereas ONP is recoveredlargely from postconsumer sources (i.e., discarded news-papers), most pulp substitutes are recovered as fractional by-products from converting operations (e.g., cutting and trimwaste from paper converting operations), and thus there aresubstantial differences in maximum feasible recovery ratios.Some paper and paperboard products are largely unrecover-able for recycling due to sewage disposal (e.g., tissue & sani-tary) or long-term use and storage (e.g., printing & writingpaper used for books). Even where most of the parent com-modity is available for recovery, maximum potential recoveryis less than 100 percent due to geographic dispersal ofproducts in distribution, limitations on collection and sortinginfrastructure, and disposal of products in waste streams.
For the NAPAP Model, maximum feasible recovery rateswere applied as upper limits or constraints on supplies ofrecovered paper commodities. Table 47 reports the maxi-mum feasible recovery rates. The U.S. data were based inpart on estimates by Franklin Associates (1990) and byJaakko Poyry Consulting (1992). Canadian data wereestimated by Forestry Canada. In the NAPAP Model, themaximum feasible recovery rates limit the possible supply ofeach category of recovered paper throughout the projectionperiod. For example, the maximum quantity of OCC thatcan be supplied from U.S. supply regions cannot exceed75 percent of U.S. linerboard and corrugating mediumconsumption (see Table 47 for percentages for the variouscommodities in the U.S. and Canada). As consumption of theparent commodities are projected to increase over time in theNAPAP Model, the supply of recovered paper for recyclingcan increase, but it cannot exceed the specified maximumfeasible recovery rates. Although it is possible to changemaximum feasible recovery rates over time in the NAPAPModel, such changes were not programmed into the basedata set. Thus, the recovery rate constraints (Table 47) wereapplied throughout the projection period in the base scenario.
U.S. and Canadian Domestic Product Demand
The U.S. and Canadian domestic demand functions wereprovided in the NAPAP Model for each of 13 principalcategories of paper and paperboard commodities, and alsofor dissolving & special alpha pulp. Price and quantity unitsfor paper and paperboard commodities were 1986 U.S.dollars and metric tonnes of paper or paperboard at finishedproduct weight (generally assumed to be at 5 percentmoisture content, total weight basis). Price and quantity unitsfor pulp were 1986 U.S. dollars and metric tonnes at air-dryweight (generally assumed to be 15 percent moisturecontent, total weight basis). The estimation procedures,mathematical formulation of demand functions, data, andassumptions will be reported in detail in a forthcomingresearch paper (Ince and others, in preparation).
Estimates of U.S. domestic demand functions for paper,board, and dissolving pulp were provided by Dr. Hsien ChiLu (Louisiana State University; formerly graduate student atUniversity of Wisconsin–Madison) and Professor JosephBuongiorno (University of Wisconsin–Madison), working incooperation with the Forest Products Laboratory. Theunderlying theory of factor demand, the estimation proce-dures, and the econometric results were described in anunpublished research note (Lu and others 1991). It wasrecognized that most commodities are actually demanded byvarious secondary or converting industries, which utilize thecommodities as inputs to make consumer products or toprovide consumer services, rather than being demandeddirectly by consumers or households. Since various con-sumer products and consumer services are provided usingpaper and board commodities as primary inputs, the demandsfor the NAPAP product commodities are actually demandsfor input factors. According to the theory of input factor

52
demand, the optimal factor demand is affected by price ofthe input factor, along with the production level and price ofthe final products. Since a broad array of final consumerproducts and consumer services is derived from use of paperand paperboard in the U.S. economy (e.g., ranging fromadvertising in newspapers and magazines to delivery ofgoods in paperboard packaging and provision of health careservices using sanitary paper products), it was appropriate toassume that the relationship between factor demand and finalproduct production level and prices could be approximatedby the relationship between factor demand and per-capitagross national product (GNP) and population (as proxies forthe consumption level and prices of the many goods andservices derived from use of paper and paperboard commodi-ties throughout the economy). Thus, for the United States,
demand functions for the thirteen paper and board productsand special alpha & dissolving pulp were estimated asfunctions of price along with the independent variables ofU.S. population and U.S. per-capita GNP. As discussedearlier, the RPA basic assumptions for U.S. population andGNP (or gross domestic product (GDP)) trends were used toproject population and per-capita GNP into the future.
For the United States, historical data for demand quantitieswere obtained from the API (1960–1992; consumption datawere approximated by “new supply” data—production plusimports minus exports). Price data were derived from theU.S. Department of Commerce Current Industry Reportseries on Pulp, Paper, and Board (U.S. Department ofCommerce 1990), and earlier data were derived by applying
Table 46—Recovered paper supply function elasticities, with base-period (1986) price and quantityassumptions used in the NAPAP Model
Elasticities
Region and paper supplyDelivered
price
Landfilltipping
fees
Parentcommodity
consumptionTime(year)
Base-periodsupply
quantity (×103 t)
Base-periodsupply price
(1986$)
U.S. NORTH Old newspapers (ONP) 0.109 0.093 1.00 1,552 39.23Old corrugated (OCC) 0.076 0.191 1.00 4,013 53.79Mixed papers 0.140 0.136 1.00 1,282 20.58High grade deinking & pulp substitutes
0.220 0.062 1.00 2,863 176.25
U.S. SOUTH
Old newspapers (ONP) 0.185 0.589 1.00 848 38.39Old corrugated (OCC) 0.118 0.304 1.00 3,317 56.22Mixed papers 0.093 0.176 1.00 748 16.35High grade deinking & pulp substitutes
0.578 0.062 1.00 1,211 177.60
U.S. WEST Old newspapers (ONP) 0.331 0.188 1.00 1,155 45.00Old corrugated (OCC) 0.070 0.098 1.00 2,078 60.00Mixed papers 0.524 0.226 1.00 442 20.00High grade deinking & pulp substitutes
0.667 0.062 1.00 647 188.99
CANADA EAST Old newspapers (ONP) 0.080 1.430 0.07 121 60.06Old corrugated (OCC) 0.470 0.630 0.05 413 69.35Mixed papers 0.080 0.500 0.02 126 60.00High grade deinking & pulp substitutes
0.390 0.900 1.17 149 154.13
CANADA WEST
Old newspapers (ONP) 0.080 1.430 0.07 40 49.16Old corrugated (OCC) 0.470 0.630 0.05 137 58.45Mixed papers 0.080 0.500 0.02 42 55.00High grade deinking & pulp substitutes
0.390 0.900 1.17 49 143.23

53
the historical producer price indexes published by the Bureauof Labor Statistics (BLS), U.S. Department of Labor, for theperiod 1960–1980. The BLS wholesale producer priceindexes of 1960–1989 were used also to convert prices toconstant U.S. dollars. Historical population data wereobtained from the Bureau of the Census (U.S. Department ofCommerce 1990). The GNP data and deflators were obtainedfrom the Bureau of Economic Analysis, U.S. Department ofCommerce (1960–1989).
In addition, U.S. demand functions were adjusted so thatdemand trends would correspond to aggregate demand trends.An aggregate demand function was estimated for all paperand paperboard commodities combined (along with dissolv-ing & special alpha pulp). It was found that the aggregatedemand function was more stable and provided morereasonable long-range projections than demand functionsestimated separately for individual commodities. Therefore,the individual growth elasticities were adjusted proportion-ately such that the sum of individual demand projections
matched projections obtained with the aggregate demandfunction (for details, see Lu and others 1991). Additionaladjustments were imposed to provide overall per-capitaconsumption levels that were deemed reasonable in light ofper-capita consumption trends of recent decades (specifically,an additional 0.6 percent per year negative shift on demandgrowth was imposed for all commodities beyond the year2000). Table 48 summarizes adjusted demand functionelasticities for the United States, along with base-perioddemand quantities and prices. In all cases, base-period priceswere set within the bounds of price data reported in industryreferences for the year 1986 (e.g., see Miller Freeman 1992).In some cases, elasticities were adjusted (generally down-ward) to obtain more accurate projections over the historicalperiod (1986–1992), or to reflect anticipated long-runsubstitution of other products or services for products andservices provided with paper and paperboard (such as adver-tising in electronic media substituting for advertising in printmedia, or use of plastics in food packaging). Table 48 noteswhich adjustments were made to the estimated elasticities.
Table 47—Maximum feasible recovery constraints on supply of recovered paper commoditiesin the NAPAP Modela
Supply regionRecovered paper
commodity Parent commodity
Maximum feasiblerecovery of recoveredpaper commodity from
parent commodity(percent)
U.S. (North, South, West) ONP Newsprint 65OCC Linerboard 75
Corrugating medium 75Mixed papers Coated groundwood 50
Uncoated groundwood 50Specialty pkg. & industrial 50Kraft pkg. & industrial 50Solid bleached board 50
Pulp substitutes & high grade deinking
Coated free sheet 60
Uncoated free sheet 60Kraft pkg. & industrial 10Solid bleached board 10
Canada (East, West) ONP Newsprint 45OCC Linerboard 60
Corrugating medium 60Mixed papers Coated groundwood 24
Uncoated groundwood 24Specialty pkg. & industrial 9
Pulp substitutes & high grade deinking
Coated free sheet 24
Uncoated free sheet 24Tissue & sanitary 5Kraft pkg. & industrial 9Solid bleached board 20 (Canada East only)Construction paper & board 7
aU.S. data based in part on estimates by Franklin Associates (1990) and Jaakko Poyry Consulting (1992).

54
Table 48—Product demand function elasticities for the United States, with base-period (1986) price andquantity data used in NAPAP Modela
Elasticities
ProductCommodity
priceU.S. per
capita GNPU.S.
population
Base perioddemandquantity (×103 t)
Base perioddemand price
(1986$)
Newsprint -0.54 0.50 * (0.57) 0.35 11,813 472.00Coated free sheet -1.16 0.28 1.00 * (2.02) 2,675 955.00Uncoated free sheet -1.05 0.50 (0.58) 0.45 11,229 825.00Coated groundwood -0.54 0.38 1.00 * (1.50) 3,402 730.00Uncoated groundwood -0.53 0.28 1.80 * (2.04) 2,813 620.00Tissue & sanitary -0.26 0.48 0.92 4,676 1,015.00Specialty pkg. & industrial -1.18 0.21 2.25 1,847 700.00Kraft pkg. & industrial -1.01 0.36 -5.0 * (1.08) 2,865 460.00Linerboard -0.31 0.50 * (0.60) 0.30 * (0.31) 14,485 325.00Corrugating medium -0.18 0.50 * (0.52) 0.30 * 0.74) 6,101 290.00 Solid bleached board -0.33 0.33 * (0.42) 0.66 * (1.14) 3,308 550.00Recycled board -0.40 0.50 0.62 5,619 300.00Construction paper & board -0.58 -0.26 1.31 1,674 275.00Dissolving & special alpha pulp -0.26 -0.73 1.0 * (3.81) 686 600.00
aElasticities were generally derived from econometric analysis of demand over the historical period from 1960 to 1989. In some cases (noted by asterisk) elasticities were adjusted downward to provide more accurate projections in the period from 1986–1992, to account for anticipated future reduction in demand, via product substitution (i.e., advertising in electronic media substituting for advertising in print media). Unadjusted elasticities based on historical relationships are shown in parentheses in cases where elasticities were adjusted. In addition, a -0.6-percent annual adjustment in demand growth for all commodities was imposed beyond the year 2000, to provide a reasonable growth trend in aggregate per capita paper and board consumption.
Table 49—Product demand function elasticities for Canada, with base-period (1986) priceand quantity data used in the NAPAP Model
Elasticities
ProductCommodity
priceCanadian
GDP
Base-perioddemandquantity (×103 t)
Base-perioddemand price
(1986$)
Newsprint sheet -0.20 0.50 252 1,080.00Uncoated free sheet -0.20 0.50 657 865.00Coated groundwood -0.20 0.60 263 730.00Uncoated groundwood -0.20 0.60 212 620.00Tissue & sanitary -0.60 0.40 385 1,043.00Specialty pkg. & industrial -0.60 -0.10 27 650.00Kraft pkg. & industrial -0.60 -0.20 324 475.00Linerboard -0.70 0.80 913 325.00Corrugating medium -0.70 0.80 422 280.00Solid bleached board -0.70 -0.10 262 550.00Recycled board -0.70 -0.10 612 400.00Construction paper & board -0.70 0.20 126 275.00Dissolving & special alpha pulp -1.40 -0.10 55 600.00
55
For U.S. exports of paper and paperboard commodities,the primary independent variable was the historical trend intotal U.S. paper and paperboard exports. Total U.S. paperand paperboard exports have shown a declining averageannual growth rate in recent decades (from nearly12-percent annual growth in the 1960s to 6-percent in the1970s and 2.7-percent in the 1980s). It was assumed thatthis rate of growth would continue to follow the historicaltrend, until a projected 1-percent annual growth factor isreached in the year 2000, at which point the growth factorwas held constant at that rate. Depending on elasticitiesestimated with respect to the growth factor, U.S. exports ofindividual commodities to certain regions were projected tobe somewhat higher than the growth factor itself (e.g., withan estimated elasticity of 3.09, the export demand growthwould be 3.09 percent per year after 2000). In addition, a1-percent per year negative shift was imposed on exportdemand for linerboard to provide a more modest long-rangegrowth in linerboard exports. The declining underlyingtrend in total export growth reflects a view that a growingshare of world demand will be satisfied by production incountries other than the United States. Historically, thepercentage of total world paper and paperboard productionproduced in the United States actually declined from around37 percent in 1970 to around 31 percent in 1990 (based oncomparison of data published by API and Food andAgriculture Organization (FAO)). Others have noted thatNorth America (the United States and Canada) currentlyhas a declining share of world paper and paperboardproduction capacity, expected to decline from 37 percentin 1991 to 35.5 percent in 1994 (Slinn 1992). As statedin a recent report by FAO (1986) on the outlook for pulpand paper, “the developed world may continue significantnet exports to the developing world but the developingworld may also continue to increase production faster thanconsumption, thus diminishing its dependence on imports.”Other shifter variables were introduced in some U.S.export demand functions and, in some cases, a partialadjustment parameter was also used. Table 50 summa-rizes export demand function elasticities for the UnitedStates, along with base-period demand quantities andprices.
Export demand functions for Canada were estimated by theEconomics and Policy Directorate of Forestry Canada. ForCanada, export demand functions were specified for onlytwo trading regions, Pacific Rim and Europe, whichtogether account for all Canadian exports outside of exportsto the United States. Growth shifter variables for Canadianexport demand functions were real GDP of Japan (forPacific Rim export demand) and real GDP of the UnitedKingdom (for European export demand). Table 51 summa-rizes export demand functions for Canada, along with base-period export demand quantities and prices.
Estimates of demand functions for Canada were provided bythe Economics and Policy Directorate of Forestry Canada,Ottawa. Canadian domestic demand functions were specifiedas functions of price along with shifter variables of CanadianGDP and Canada/U.S. exchange rate. Projections of CanadianGDP and exchange rates were provided by Forestry Canada(in this study, all exchange rates were held constant at 1992levels for the entire projection period). Table 49 summarizesthe demand function elasticities for Canada, along with base-period demand quantities and prices.
Export Demand
The U.S. and Canadian export demand functions wereprovided in the NAPAP Model for commodities exportedfrom the United States or Canada to other regions. Tradeflows between the United States and Canada are simulatedendogenously by the NAPAP Model (in relation to domesticdemand functions discussed previously and comparativeadvantage of production in the two countries). Therefore,export demand functions were needed only for exports toregions outside the United States and Canada. Exportdemands were estimated separately for the United States andCanada. Price and quantity units were 1986 U.S. dollars, andmetric tonnes at finished product weight for paper andpaperboard, metric tonnes at air-dry weight for pulp, metrictonnes as purchased for recovered paper, and cubic metersfor pulpwood. The export demand functions are described indetail in a research paper on the NAPAP Model (Ince andothers, in preparation).
Export demand functions for the United States were devel-oped at the Forest Products Laboratory to simulate demandfor U.S. product exports to four trading regions: LatinAmerica, Europe, Pacific Rim, and other world demand(outside the United States and Canada). Export demandfunctions were estimated only for significant export com-modities (i.e., those exported to the trading regions insignificant quantities in recent decades, or for which signifi-cant exports were expected in the near future). Commoditieswith less significant export flows were added to the principalcommodities to balance overall trade flows in the base year.
The independent variables used in U.S. export demandequations depended on the type of export commodity. Forfiber raw material commodities, including pulpwood,woodpulp, and recovered paper exports, the independentvariables were intended to reflect overseas demand for fiberinputs in overseas production of paper and paperboard.Therefore, the primary shifter variable was paper andpaperboard production of a primary importing country withinthe trading region (such as Japan for the Pacific Rim). For allexport demand regions, the long-range growth factor forforeign paper and paperboard production was assumed to be2 percent per year.

56
Table 50—Export demand function elasticities for the United States by export demand region, with base-period (1986) price and quantity dataused in NAPAP Model
Elasticities
Demand from U.S. and product
Com-modityprice
TotalU.S.
paper &paper-boardexport Other
Partialadjust-mentpara-meter
Base-period
demandquantity
(×103 t)
Base-period
demandprice
(1986$)
LATIN AMERICAN DEMAND
Newsprint -1.00 1.00 — — — 78.4 542Coated free sheet -1.00 2.00 — — — 10.5 955Uncoated free sheet -1.00 2.00 — — — 20.4a 825
Coated groundwood -1.00 2.00 — — — 0.8 780Uncoated groundwood -1.00 2.00 — — — 3.8 670
Per-capita GDPof Costa Rica
Linerboard -0.33 0.72 1.02 — -0.04 606.8b 350
Solid bleached board -1.00 1.00 — — — 53.1c 625
Per-capita GDPof Mexico
Export price ofU.S. vs. Norway
Dissolving & special alpha pulp -0.35 — -1.24 -0.47 — 49.1 615Paper & boardproduction inVenezuela
Softwood chemical market pulp -0.14 — 0.12 — 0.37 210.9 640Paper & boardproduction in Mexico
Hardwood chemical market pulp -0.40 — -0.05 — 0.38 160.1 610Old newspapers (ONP) -0.44 — 1.42 — — 197.6 60
Per-capita GDPof Mexico
Old corrugated (OCC) -1.45 — 0.50 — — 190.6 75Per-capita GDPof Venezuela
Mixed recovered paper -1.56 — 0.50 — 0.33 47.5 45Per-capita GDPof Mexico
Pulp substitutes & high grade deinking
-2.57 — 0.67 — — 170.3 180
EUROPEAN DEMAND Per-capita paper &board production inU.S. vs. Brazil
Linerboard -0.60 1.01 1.24 — — 662.8b 350
Solid bleached board -0.69 1.00 — — — 59.6c 625
U.S./Canadaexchange rate
Export price ofU.S. vs Norway
Dissolving & special alpha pulp -0.15 — 1.33 -0.20 — 258.6 615Paper & boardproduction in Italy
Softwood chemical market pulp -0.12 — 0.10 — 0.68 1,058.9 640Paper & boardproduction in Ger-many
Hardwood chemical market pulp -0.20 — 0.10 — — 464.8 610Paper & boardproduction in U.K.
Old corrugated (OCC) -0.42 — 0.50 — 0.49 178.0 75Mixed recovered paper -0.22 — 0.50 — — 77.7 45
Paper & boardproduction in Italy
Pulp substitutes & high grade deinking
-1.03 — 0.50 — 0.70 62.8 180

57
Table 50—Export demand function elasticities for the United States by export demand region, with base-period (1986) price andquantity data used in NAPAP Model—con.
Elasticities
Demand from U.S. and product
Com-modityprice
TotalU.S.
paper &paper-boardexport Other
Partialadjust-ment para-meter
Base-period
demandquantity(×103 t)
Base-period
demandprice
(1986$)
PACIFIC RIM DEMANDNewsprint -0.96 3.09 — — — 272.0 542Coated free sheet -0.96 3.09 — — — 3.5 955 Uncoated free sheet -0.96 3.09 — — — 23.0a 825Coated groundwood -0.96 3.09 — — — 0.8 780Uncoated groundwood -0.96 3.09 — — — 11.2 670Linerboard -1.20 1.33 — — 0.46 882.3b 350Solid bleached board -0.37 1.00 — — — 290.3c 625
Per-capita GNP in Japan
U.S./S. Africaexchange rate
Dissolving & special alpha pulp -0.26 0.20 0.41 0.27 — 318.9 555 Paper & boardproduction in Japan
Softwood chemical market pulp -0.18 — 0.59 — 0.47 666.0 640Hardwood chemical market pulp -0.37 — 0.65 — 0.55 593.4 610Softwood pulpwood -0.30 — 0.28 — — 3461.7d 39.20dHardwood pulpwood -0.30 — 0.28 — — 496.7d 43.70d
Paper & boardproduction in Korea
Old newspapers (ONP) -0.20 — 1.21 — — 485.1 60Old corrugated (OCC) -0.50 — 1.18 — — 895.4 75Mixed recovered paper -2.54 — 0.29 — — 477.9 45Pulp substitutes & high grade deinking
-0.38 — 0.50 — 0.30 412.1 180
OTHER DEMAND Per-capita paper &board production inUS vs Sweden
Linerboard -0.28 1.22 2.15 — 0.25 220.6b 350Solid bleached board -0.63 1.00 — — — 53.3c 625
World paper & boardproduction
Softwood chemical market pulp -0.26 — 1.22 — — 79.0 640
aIncludes small quantities of tissue & sanitary paper.bIncludes small quantities of kraft packaging & industrial, specialty packaging & industrial, corrugating medium, recycled board, and construction paper & board.cIncludes small quantities of kraft packaging & industrial paper.dPulpwood quantities in 1000 m3. Pulpwood prices in $1986/m3. Conversion factors: 2.051 m3 per metric ton softwood; 1.795 m3 per metric ton hardwood. In this case, pulpwood refers to wood chips.

58
NOTE: A revised set of U.S. export demand equations weredeveloped for the NAPAP Model since the draft results weredeveloped for this report. The revised equations are notincluded in this report, but they may be introduced in thefinal draft. The revised U.S. export demand equations have amuch more parsimonious structure. They are based only onexport relationships to Atlantic region and Pacific regionGDP trends (similar to the Canadian export demand equa-tions). Projections derived from the revised U.S. exportdemand equations are similar in aggregate quantity to theprojections shown subsequently in this report.
U.S. Import Supply
For the NAPAP Model, long-range supply functions wereprovided for pulp and paper commodities that are importedin significant quantities into the United States from regionsother than Canada. Those commodities include variousgrades of printing and writing paper and market pulp,imported from Latin America, Europe, Pacific Rim, andother regions. Import supply functions were providedseparately for each principal commodity and supply region.Estimates were developed at the Forest Products Laboratory.Supply shifter variables in all cases were measures of
production in the source regions (such as total production ofbleached sulphate pulp in Latin America, used as the shifterfor supply of chemical market pulp from Latin America).Table 52 summarizes the import supply function elasticitiesby import supply region and commodity. Price and quantityunits were 1986 U.S. dollars, and metric tonnes at finishedproduct weight for paper and paperboard, metric tonnes atair-dry weight for pulp. The estimation procedures, math-ematical formulation of import supply functions, data, andassumptions will be reported in detail in the NAPAP Modelmonograph report (Ince and others, in preparation).
Energy and Labor Input Supply
Supplies of energy and labor inputs were represented in theNAPAP Model by horizontal supply curves. This assumesthat the pulp and paper sector exhibits price-taking behaviorin energy and labor markets (i.e., the pulp and paper sector inNorth America, although quite large, accounts for a smallfraction of total North American labor and energy demands,and therefore changes in labor and energy inputs of the pulpand paper sector alone have negligible impacts on overallmarket prices for labor or energy in North America).However, changes in regional labor costs (wage rates) and
Table 51—Export demand function elasticities for Canada by export demand region, with base-period (1986) price and quantity data used in NAPAP Model
Elasticities
Demand from Canada and productCommodity
price Other
Base perioddemandquantity (×103 t)
Base perioddemand
price(1986$)
PACIFIC DEMAND GDP of JapanNewsprint -4.13 0.09 657 520Kraft pkg. & industrial -1.30 2.60 82 466Linerboard -1.30 2.60 122 307Corrugating medium -1.30 2.60 32 48Dissolving & special alpha pulp -0.20 1.50 68 543Softwood chemical market pulp -0.37 1.25 1,398 623Hardwood chemical market pulp -0.37 1.25 125 626Mechanical market pulp -0.37 1.25 162 415Softwood pulpwood (residue) -1.00 1.70 1,295a 26a
ATLANTIC DEMAND GDP of U.K.Newsprint -1.03 0.10 930 520Kraft pkg. & industrial -1.30 2.60 65 482Linerboard -1.30 2.60 137 403Corrugating medium -1.30 2.60 83 405Dissolving & special alpha pulp -0.20 1.00 87 566Softwood chemical market pulp -0.75 0.91 1,892 638Hardwood chemical market pulp -0.75 0.91 247 611Mechanical market pulp -0.75 0.91 19 403Softwood pulpwood (roundwood) -1.00 1.00 312a 22a
aPulpwood quantities in 1000 m3. Pulpwood prices in $1986 per cubic meter.
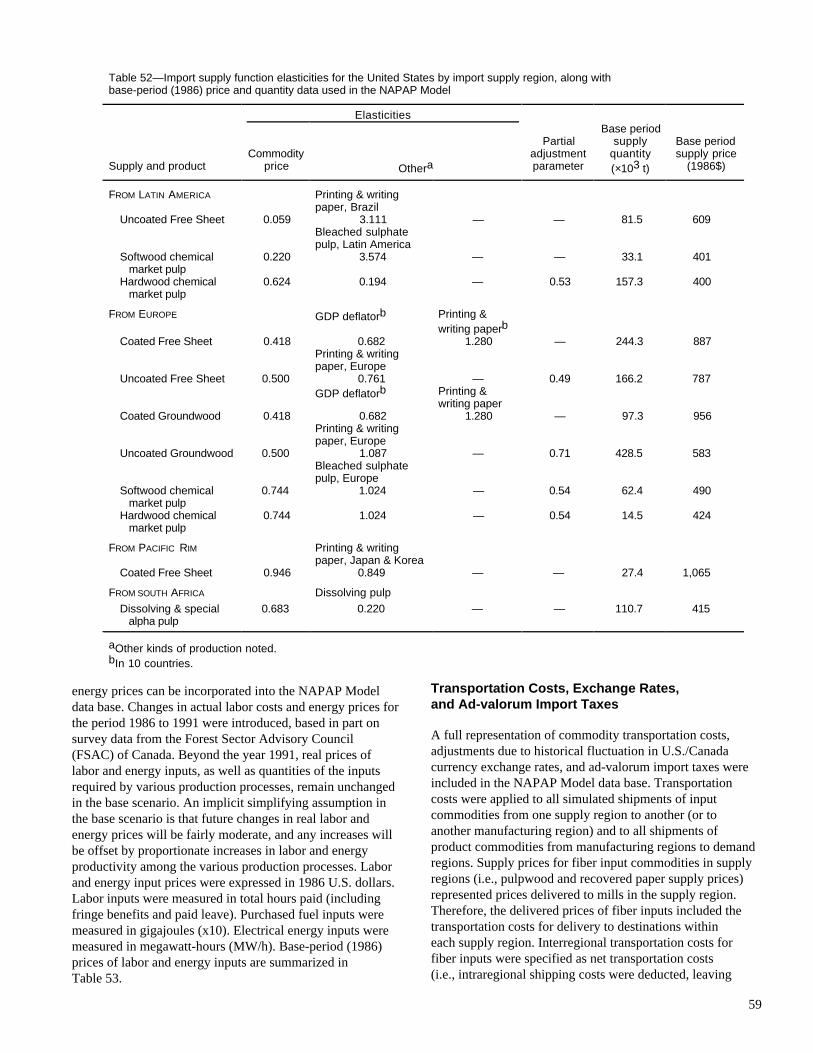
59
energy prices can be incorporated into the NAPAP Modeldata base. Changes in actual labor costs and energy prices forthe period 1986 to 1991 were introduced, based in part onsurvey data from the Forest Sector Advisory Council(FSAC) of Canada. Beyond the year 1991, real prices oflabor and energy inputs, as well as quantities of the inputsrequired by various production processes, remain unchangedin the base scenario. An implicit simplifying assumption inthe base scenario is that future changes in real labor andenergy prices will be fairly moderate, and any increases willbe offset by proportionate increases in labor and energyproductivity among the various production processes. Laborand energy input prices were expressed in 1986 U.S. dollars.Labor inputs were measured in total hours paid (includingfringe benefits and paid leave). Purchased fuel inputs weremeasured in gigajoules (x10). Electrical energy inputs weremeasured in megawatt-hours (MW/h). Base-period (1986)prices of labor and energy inputs are summarized inTable 53.
Transportation Costs, Exchange Rates,and Ad-valorum Import Taxes
A full representation of commodity transportation costs,adjustments due to historical fluctuation in U.S./Canadacurrency exchange rates, and ad-valorum import taxes wereincluded in the NAPAP Model data base. Transportationcosts were applied to all simulated shipments of inputcommodities from one supply region to another (or toanother manufacturing region) and to all shipments ofproduct commodities from manufacturing regions to demandregions. Supply prices for fiber input commodities in supplyregions (i.e., pulpwood and recovered paper supply prices)represented prices delivered to mills in the supply region.Therefore, the delivered prices of fiber inputs included thetransportation costs for delivery to destinations withineach supply region. Interregional transportation costs forfiber inputs were specified as net transportation costs(i.e., intraregional shipping costs were deducted, leaving
Table 52—Import supply function elasticities for the United States by import supply region, along withbase-period (1986) price and quantity data used in the NAPAP Model
Elasticities
Supply and productCommodity
price Othera
Partialadjustmentparameter
Base periodsupply
quantity(×103 t)
Base periodsupply price
(1986$)
FROM LATIN AMERICA Printing & writingpaper, Brazil
Uncoated Free Sheet 0.059 3.111 — — 81.5 609Bleached sulphatepulp, Latin America
Softwood chemical market pulp
0.220 3.574 — — 33.1 401
Hardwood chemical market pulp
0.624 0.194 — 0.53 157.3 400
FROM EUROPE GDP deflatorb Printing &writing paperb
Coated Free Sheet 0.418 0.682 1.280 — 244.3 887Printing & writingpaper, Europe
Uncoated Free Sheet 0.500 0.761 — 0.49 166.2 787GDP deflatorb Printing &
writing paperCoated Groundwood 0.418 0.682 1.280 — 97.3 956
Printing & writingpaper, Europe
Uncoated Groundwood 0.500 1.087 — 0.71 428.5 583Bleached sulphatepulp, Europe
Softwood chemical market pulp
0.744 1.024 — 0.54 62.4 490
Hardwood chemical market pulp
0.744 1.024 — 0.54 14.5 424
FROM PACIFIC RIM Printing & writingpaper, Japan & Korea
Coated Free Sheet 0.946 0.849 — — 27.4 1,065
FROM SOUTH AFRICA Dissolving pulpDissolving & special alpha pulp
0.683 0.220 — — 110.7 415
aOther kinds of production noted.bIn 10 countries.

60
only the net additional transportation cost to move commodi-ties from one supply region to another). Transportation costsfor intermediate and final products (e.g., pulp, paper, andpaperboard) were specified as total shipping costs (not netcosts). Table 54 summarizes the transportation cost data forthe NAPAP Model. Transportation costs for the UnitedStates were estimated and compiled by Zhang of the Univer-sity of Wisconsin–Madison (Zhang and Ince 1991). Trans-portation costs for Canada were estimated by the Economicsand Policy Directorate of Forestry Canada, Ottawa.
Although all prices in the NAPAP Model were expressed inconstant 1986 U.S. dollars, adjustments in Canadian supplyand demand functions were necessary to account for theeffects of actual fluctuations in U.S./Canada monetaryexchange rates during the historical period from 1986 to1992. The Canadian/U.S. dollar exchange rate assumption inthe NAPAP Model was set at 1.3895 in the base year (1986)and adjusted as follows in subsequent years: 1.3260 in 1987,1.2307 in 1988, 1.1840 in 1989, 1.1668 in 1990, 1.1460 in1991, and 1.1905 in 1992 (data reflect actual exchange ratesas reported in the Federal Reserve Bulletin). After 1992, theU.S./Canada exchange rate was assumed to remain constant
for the remainder of the projection period in the basescenario (a simplifying assumption, which can be adjustedfor alternate scenarios).
Finally, full implementation of the U.S./Canada Free TradeAgreement, insofar as it affects pulp and paper commodities,was incorporated into the NAPAP Model data base. Inparticular, various U.S. and Canadian import ad-valorumtaxes on pulp and paper commodities shipped between thetwo countries were included in the base-period (1986).However, in accordance with the Free Trade Agreementprovisions, all such tariffs were incrementally eliminatedbetween 1987 and 1993. Thus, in the NAPAP Model, there isa programmed phase-out of all import ad-valorum taxes onpulp and paper commodities between the United States andCanada, with phase-out completed by 1993. No additionaltariffs are assumed to be imposed in the future in the basescenario. [The complete schedule of import tariffs for allpulp and paper commodities and annual tariff reductions forboth the United States and Canada are tabulated in the 1992Pulp & Paper North American Factbook (Miller Freeman1992.) The same data were used in the NAPAP Model.]
Capacity Change, Capital Costs, andCapacity Depreciation Assumptions
Projected change in capacity for each production process wascomputed by the NAPAP Model using methods based onTobin’s q theory of investment behavior. The methodsdescribed in Zhang and Buongiorno (1992a) were employedin PELPS III (Zhang and others, in preparation). Themethods were validated by producing accurate simulations ofhistorical capacity trends in the North American pulp andpaper sector, using historical models that covered the periodfrom 1970 to 1990 (Zhang and Buongiorno 1992b).
The q theory of investment behavior was pioneered by NobelLaureate James Tobin (1969). Following Tobin’s q theory,gross change in production capacity was specified as anincreasing function of the q ratio, the shadow price of currentcapacity to the cost of new capacity. Empirical results withdata of the U.S. pulp and paper industry suggested that therelative gross change in capacity each year was accuratelyrepresented as a function of the current q ratio, the q ratiolagged 1 year, and the relative gross change in capacitylagged 1year (Zhang and Buongiorno 1992a), with coeffi-cients of 0.20, -0.11, and 0.54, respectively. The sameformula was used in the NAPAP model to compute changein capacity for each production process. The numerator in theq ratio (shadow price) measures profitability of marginallyadding additional capacity. The unique shadow price of eachproduction process in each region was computed as part ofthe linear programming solution obtained each year by theNAPAP Model. As market conditions were projected by themodel to change over time, the shadow price (i.e., profit-ability of new capacity) for each production process was alsoprojected to change, and hence capacity growth for eachproduction process changed in relation to projected market
Table 53—NAPAP Model base-period (1986) labor andenergy input prices by region
Region and labor/energy supplyInput price
(1986 U.S. dollars)
U.S. NORTH
Purchased fuel (×10 GJ) 25.87
Electricity (MW/h) 48.40Labor (h) 14.70 Administrative labor (h) 18.50U.S. SOUTH
Purchased fuel (×10 GJ) 27.06
Electricity (MWh) 40.10Labor (h) 16.51 Administrative labor (h) 20.14
U.S. WEST
Purchased fuel (×10 GJ) 27.07
Electricity (MWh) 32.16Labor (h) 19.62 Administrative labor (h) 22.51
CANADA EAST
Purchased fuel (×10 GJ) 21.70
Electricity (MWh) 20.61Labor (h) 15.77 Administrative labor (h) 18.36
CANADA WEST
Purchased fuel (×10 GJ) 20.20
Electricity (MWh) 23.13Labor (h) 18.35 Administrative labor (h) 21.49

61
conditions. The denominator in the q ratio (the cost of newcapacity) was estimated for each production process, basedon estimated capital costs of new capacity, expressed on anannual average basis (per tonne of product output). Table 55summarizes the estimated costs of new capacity for eachprocess in the NAPAP Model. Cost estimates reflecteddifferences in facility and equipment requirements of variousprocesses, estimated scale of production facilities, anddifferences in capital costs between the United States andCanada.
In addition to gross capacity change computed by the Tobinq formula, a capacity “depreciation” or retirement factor wasalso used in the NAPAP Model. Capacity was assumed to beretired at a fixed rate each year for each production process.The retirement rate was specified at 2 to 6 percent per year,depending on whether the process was a relatively new orold technology (the higher rate was specified for olderprocesses). Each year the net change in capacity for eachprocess was computed as the gross change (based on Tobin qformula) minus capacity retired at the specified annual rate.Thus, in the NAPAP Model, capacity growth occurred forproduction processes that were projected to be relativelyprofitable (i.e., with relatively high shadow prices) and forwhich the gross change in capacity computed by the Tobin qformula exceeded the annual capacity retirement. Capacity ofany production process that was relatively unprofitable wasgradually retired. In summary, the projected evolution ofcapacity for each production process (and the evolution oftechnology in general) was simulated as a competitiveeconomic process, influenced by projected market condi-tions; in turn, projected market conditions were influencedby the competitive evolution of technology.
NAPAP Study Results
Projections for the pulp and paper sector of the United Statesand Canada were provided by the NAPAP Model from thebase year 1986 to the year 2040. This section of the reportillustrates many key result with charts that show long-rangeprojections of NAPAP Model variables plotted over time.Many charts include actual historical data showing thehistorical trends for the same variables in recent decades.The NAPAP projections over the recent historical period,1986–1992, serve as additional validation of the modelingmethods, to the extent that results match recent historicaltrends. All results were obtained through an iterative solutionprocess, linking NAPAP and TAMM/ATLAS models. Asnoted on some charts, some results include projections fromthe TAMM/ATLAS model.
Projected Consumption (Demand)for Paper and Paperboard
The NAPAP Model projected consumption (demandquantity) of principal commodities in the United States and
Canada. Figure 9 illustrates projected consumption of paperand board for the United States, along with the historicaltrend of recent decades. The projected trend is generally inline with the historical trend. Figure 10 illustrates projectedtotal consumption of paper and board for both the UnitedStates and Canada. Canadian and U.S. paper and boardconsumption were projected to grow continuously in thedecades ahead, with Canadian consumption remaininggenerally less than 10 percent of the total.
Whereas total U.S. paper and board consumption wasprojected to increase by more than 70 percent in the next50 years, per capita consumption of paper and paperboardwas projected to increase by roughly one-third, from around315 kg in 1990 to around 410 kg in 2040. Historically, percapita paper and board consumption in the United States hasincreased, from around 150 kg in 1950 and approximately250 kg in 1970 (API 1960–1992). Thus, projections indicatea modest decline in the growth of per capita paper andpaperboard consumption. Historically, U.S. growth in percapita consumption did decline from around 2.8 percent peryear in the 1950s and 1960s to around 1 percent per year inthe 1970s and 1980s. In fact, per capita consumption hasbeen on a relative plateau since 1986 (gaining only1.4 percent in the 5-year period from 1986 to 1991 (API1960–1992).
Figures 11 to 22 illustrate projected U.S. consumption of theprincipal paper and paperboard commodities; Figure 23illustrates projected U.S. consumption of dissolving &special alpha pulp. All charts include actual historical trendsin the data series from 1960 to 1990, for comparison toprojected trends. For the most part, projections indicate acontinuation of historical growth trends. Note that theNAPAP Model provides fairly close tracking of historicaltrends in the period from 1986 to 1992. Notable declines inconsumption were projected only for construction paper &board and dissolving & special alpha pulp.
Projected Production and Technological Trends
Figures 24 to 85 illustrate production and technologicaltrends for newsprint, printing & writing paper, tissue &sanitary paper, specialty packaging & industrial paper,paperboard, construction paper & board, and market pulp.
Newsprint
The U.S. share of total newsprint production was projectedto gradually increase. (Fig. 24). Historically, the U.S. sharehas been increasing, rising from 23 percent in 1965 to33 percent in 1980 and 40 percent in 1990 (Miller Freeman1992). Canadian newsprint production has actually declinedsince 1988, while U.S. newsprint production has increased(Miller Freeman 1992). Projections indicated that the U.S.share should reach two-thirds of the total by 2040.

62
Tab
le 5
4—N
AP
AP
Mod
el r
eal t
rans
port
atio
n co
sts
by c
omm
odity
bet
wee
n so
urce
and
des
tinat
ion
regi
onsa
Tra
nspo
rtat
ion
cost
($1
986/
t) b
y de
stin
atio
n re
gion
Com
mod
ity a
nd s
ourc
e re
gion
C
anad
a
U.S
.P
aci
ficA
tlant
ic
Latin
Am
eric
aE
urop
eP
aci
ficR
imC
anad
aE
ast
Can
ada
Wes
tU
.S.
Nor
thU
.S.
Sou
thU
.S.
Wes
tO
ther
New
sprin
tC
anad
a E
ast
22
47
1
08
93
—
——
——
——
——
Can
ada
Wes
t 3
4 5
3
93
1
07
—
——
——
——
——
U.S
. Nor
th
63
23
—
— 9
0
— 9
0—
——
——
—U
.S. S
outh
9
4 2
8
—
— 9
0
— 9
0—
——
——
—U
.S. W
est
60
45
—
— —
— 9
0—
——
——
—
Coa
ted
free
she
et p
aper
Can
ada
Eas
t 2
1 7
3—
——
——
—
——
——
—C
anad
a W
est
42
73
—
——
——
——
——
——
U.S
. Nor
th
161
42
—
— 9
0
— 9
0
——
——
——
U.S
. Sou
th
154
33
—
— 9
0
— 9
0
——
——
——
U.S
. Wes
t 1
40 4
0
——
90
—
90
—
——
——
—E
urop
e
— 9
3
——
——
——
——
——
—P
acifi
c R
im
— 9
3
——
——
——
——
——
—
Unc
oate
d fr
ee s
heet
pap
er
Can
ada
Eas
t 2
1 6
1
——
——
——
——
——
—C
anad
a W
est
42
61
—
— —
— —
——
——
——
U.S
. Nor
th
107
33
—
— 9
0
— 9
0
——
——
——
U.S
. Sou
th
154
34
—
— 9
0
— 9
0
——
——
——
U.S
. Wes
t 1
46 4
0
——
90
—
90
—
——
——
—La
tin A
mer
ica
— 9
0
——
——
——
——
——
—E
urop
e
— 9
3
——
——
——
——
——
—
Coa
ted
grou
ndw
ood
pape
r
Can
ada
Eas
t 2
6 7
1
——
——
——
——
——
—C
anad
a W
est
60
75
—
— —
— —
——
——
——
U.S
. Nor
th
112
42
—
— 9
0
— 9
0
——
——
——
U.S
. Sou
th
106
33
—
— 9
0
— 9
0
——
——
——
U.S
. Wes
t 9
2 4
0
——
90
—
90
——
——
——
Latin
Am
eric
a —
——
— —
——
——
——
——
Eur
ope
—
93
——
——
——
——
——
—
Unc
oate
d gr
ound
woo
d pa
per
C
anad
a E
ast
26
49
—
——
— —
——
——
——
Can
ada
Wes
t 6
0 5
3
——
——
——
——
——
—U
.S. N
orth
6
1 4
4
——
90
—
90
—
——
——
—U
.S. S
outh
8
5 2
8
——
90
—
90
—
——
——
—U
.S. W
est
53
38
—
— 9
0
— 9
0
——
——
——
Latin
Am
eric
a
— —
——
—
— —
—
——
——
—E
urop
e
— 9
3
——
—
——
—
——
——
—

63
Tis
sue
and
sani
tary
pap
er
Can
ada
Eas
t 5
7
85
—
——
——
——
——
——
Can
ada
Wes
t 8
3
90
—
——
——
——
——
——
U.S
. Nor
th
168
6
3
——
——
——
——
——
—U
.S. S
outh
1
68
63
—
——
——
——
——
——
U.S
. Wes
t 1
68
65
—
——
——
——
——
——
Spe
cial
ty p
acka
ging
& in
dust
rial
Can
ada
Eas
t 2
6
70
—
——
——
——
——
——
Can
ada
Wes
t 4
1
75
—
——
——
——
——
——
U.S
. Nor
th
77
4
9
——
——
——
——
——
—U
.S. S
outh
4
7
47
—
——
——
——
——
——
U.S
. Wes
t 1
00
70
—
——
——
——
——
——
Kra
ft pa
ckag
ing
& in
dust
rial
Can
ada
Eas
t 26
5
5
— —
——
——
——
——
—C
anad
a W
est
41
6
0
72
86
—
——
——
——
——
U.S
. Nor
th
121
4
9
— —
——
——
——
——
—U
.S. S
outh
9
1
47
—
——
——
——
——
——
U.S
. Wes
t 1
44
70
—
—
——
——
——
——
—
Line
rboa
rd
Can
ada
Eas
t 2
6
44
—
72
—
— —
——
——
——
Can
ada
Wes
t 3
3
54
7
2 8
6
— —
— —
——
——
—U
.S. N
orth
8
5
34
—
— 9
0 9
0
90
—
——
——
90
U
.S. S
outh
9
7
33
—
— 9
0 9
0
90
—
——
——
90
U
.S. W
est
78
3
5
——
90
90
9
0
——
——
— 9
0
Cor
ruga
ting
med
ium
Can
ada
Eas
t 2
6
46
8
6 7
2
——
——
——
——
—C
anad
a W
est
33
5
6
— —
——
——
——
——
—U
.S. N
orth
7
5
34
—
——
——
——
——
——
U.S
. Sou
th
87
3
3
— —
——
——
——
——
—U
.S. W
est
68
3
5
— —
——
——
——
——
—
Sol
id b
leac
hed
boar
d
Can
ada
Eas
t 2
6
44
—
— —
——
——
——
——
Can
ada
Wes
t 3
3
54
—
— —
——
——
——
——
U.S
. Nor
th
100
3
4
— —
100
100
1
00
— —
— —
——
U.S
. Sou
th
112
3
3
— —
100
100
1
00
——
— —
—
100
U.S
. Wes
t 9
2
35
—
—
100
100
1
00
——
— —
—10
0
Rec
ycle
d bo
ard
C
anad
a E
ast
26
4
4
— —
——
——
——
——
—C
anad
a W
est
33
5
4
— —
——
——
——
——
—U
.S. N
orth
1
01
34
—
——
——
——
——
——
U.S
. Sou
th
113
3
3
— —
——
——
——
——
—U
.S. W
est
93
3
5
— —
——
——
——
——
—

64
Tab
le 5
4—N
AP
AP
Mod
el r
eal t
rans
port
atio
n co
sts
by c
omm
odity
bet
wee
n so
urce
and
des
tinat
ion
regi
onsa
—co
n.
Tra
nspo
rtat
ion
cost
($1
986/
t) b
y de
stin
atio
n re
gion
Com
mod
ity a
nd s
ourc
e re
gion
C
anad
a
U.S
.P
aci
ficA
tlant
ic
Latin
Am
eric
aE
urop
eP
aci
ficR
imC
anad
aE
ast
Can
ada
Wes
tU
.S.
Nor
thU
.S.
Sou
thU
.S.
Wes
tO
ther
Con
stru
ctio
n pa
per
& b
oard
and
othe
rC
anad
a E
ast
17
8
0
— —
——
——
——
——
—C
anad
a W
est
30
8
5
— —
——
——
——
——
—U
.S. N
orth
1
34
57
—
——
——
——
——
——
U.S
. Sou
th
99
4
9
— —
——
——
——
——
—U
.S. W
est
99
4
9
— —
——
——
——
——
—
Dis
solv
ing
& s
peci
al a
lpha
pul
pC
anad
a E
ast
22
6
0
86 7
2
— —
——
——
——
—C
anad
a W
est
40
6
5
40
4
0
— —
——
——
——
—U
.S. N
orth
—
——
——
——
——
——
——
U.S
. Sou
th
78
3
9
— —
60
6
0
——
——
——
—U
.S. W
est
58
5
5
— —
60
7
0
40
—
——
——
—O
ther
to U
.S.
-— 6
0
——
——
——
——
——
—
Sof
twoo
d ch
emic
al m
arke
t pul
p
Can
ada
Eas
t —
— 6
6
52
—
—
——
20
1215
20—
Can
ada
Wes
t —
—49
6
4
— —
—20
—20
2012
—U
.S. N
orth
—
——
——
——
——
——
——
U.S
. Sou
th
—
——
—
60
60
7
0
—
—19
—37
60U
.S. W
est
— —
—
—70
7
060
— —
2025
—60
Latin
Am
eric
a—
——
——
——
——
3030
30—
Eur
ope
——
——
——
——
—30
30—
—
Har
dwoo
d ch
emic
al m
arke
t pul
p
Can
ada
Eas
t —
— 6
6
52
—
—
——
20
1
2
15
2
0—
Can
ada
Wes
t
— —
——
——
—20
—20
2012
—U
.S. N
orth
—
——
—60
6
0
70
—
——
3155
—U
.S. S
outh
—
——
—60
6
0
70
—
—19
—37
—U
.S. W
est
— —
——
70—
——
—20
25—
—La
tin A
mer
ica
— —
——
——
——
—30
3030
—E
urop
e —
——
——
——
——
3030
——
Mec
hani
cal m
arke
t pul
p
Can
ada
Eas
t—
— 6
6
52
—
——
—20
1
2
15
2
0—
Can
ada
Wes
t —
— 4
9
—
—
— —
20
— 2
0
20
12—
U.S
. Nor
th
— —
——
——
——
——
3155
—U
.S. S
outh
—
——
——
——
——
19—
37—

65
Mar
ket p
ulp
from
rec
ycle
d fib
er
Can
ada
Eas
t
——
——
——
——
2040
5050
—C
anad
a W
est
—
——
——
——
20—
5050
40—
U.S
. Nor
th
——
——
——
——
——
3155
—U
.S. S
outh
—
——
——
——
——
19—
37—
U.S
. Wes
t
——
——
——
——
—20
25—
—
Sof
twoo
d pu
lpw
oodb
Can
ada
Eas
t—
—31
12—
——
——
——
——
Can
ada
Wes
t—
—13
15—
——
——
——
——
U.S
. W
est
——
——
——
12—
——
——
—
Har
dwoo
d pu
lpw
oodb
U.S
. S
outh
——
——
——
15—
——
——
—O
ld n
ewsp
aper
s (O
NP
)C
anad
a E
ast
——
——
——
——
8310
2025
—C
anad
a W
est
——
——
——
—14
—20
2015
—U
.S. N
orth
——
——
25—
3012
15—
1215
—U
.S.
Sou
th —
——
—25
—25
1315
12—
15—
U.S
. W
est
——
——
25—
2516
1215
15—
—
Old
cor
ruga
ted
cont
aine
rs (
OC
C)b
C
anad
a E
ast
— —
——
——
——
8310
2025
—C
anad
a W
est
— —
——
——
—14
—20
2015
—U
.S. N
orth
—
——
— 2
5
25
2
5
12
1
5
—12
15
—U
.S. S
outh
—
——
— 2
5
25
2
5
13
1
5
12
—
15
—U
.S. W
est
— —
——
25
25
2
5
16
1
2
15
1
5
——
Mix
ed p
aper
sb
Can
ada
Eas
t —
——
——
——
—83
1020
25—
Can
ada
Wes
t —
——
——
——
14—
2020
15—
U.S
. Nor
th
— —
——
25
2
5
25
1
2
15
—
12
15—
U.S
. Sou
th
— —
——
25
2
5
25
1
3
15
1
2
— 1
5—
U.S
. Wes
t —
——
—25
25
2
5
16
1
2
15
1
5
——
Pul
p su
bstit
utes
& h
igh
grad
e
dein
king
b
Can
ada
Eas
t —
——
——
——
—83
1020
25—
Can
ada
Wes
t —
——
——
——
14—
2020
15—
U.S
. Nor
th
—25
c—
——
——
1215
—12
15—
U.S
. Sou
th
—25
c—
——
—
—
13
15
12
—
15—
U.S
. Wes
t —
25c
——
——
— 1
6
12
1
5
15
—
—
a Tra
nspo
rtat
ion
cost
s fo
r fib
er in
puts
, pu
lpw
ood,
and
rec
over
ed p
aper
are
onl
y ne
t tr
ansp
orta
tion
cost
s (a
fter
dedu
ctin
g co
st o
f de
liver
y
w
ithin
sup
ply
regi
on o
f orig
in);
all
cost
s ar
e $1
986
/t, e
xcep
t for
pul
pwoo
d tr
ansp
orta
tion
cost
s, w
hich
are
$19
86/m
3 .b N
et tr
ansp
ort c
osts
from
sup
ply
regi
ons.
c F
rom
Lat
in A
mer
ica,
Eur
ope,
and
Pac
ific.

66
aCosts used by NAPAP Model in formula that calculates annual capacity change, as denominator in Tobin “q” ratio, for each process.bBCTMP is bleached chemithermomechical pulp; CHEM, chemical pulp; GWD is groundwood; MECH, mechanical; MKT, market; OCC, old corrugated container; ONP, old newspaper; REC, recycled; TMP, thermomechanical pulp.
Product and processbCost ($1986/t)
Newsprint—Canada Process (1) 75% GWD+25% CHEM 222.60Process (2) 90% TMP+10% CHEM 173.25Process (3) 100% ONP 172.73Process (4) 100% TMP/CTMP 173.25Process (5) 70% ONP+30% MIXED 165.00Process (6) PRESS+100% TMP 175.00
Coated free sheet paper—Canada Process (2) 90% MKT+10% REC 189.00 Process (3) 100% REC 315.00
Uncoated free sheet paper - CanadaProcess (1) 100% SULPHITE 273.00 Process (2) 100% KRAFT 252.00 Process (3) 100% MKT PULP 168.00 Process (4) 100% REC 220.50Process (5) 20% MECH/REC+80% CHEM 105.00
Coated groundwood paper —CanadaProcess (1) 58% CHEM+42% MECH 252.00Process (2) 56% MKT+MECH+2% REC 220.50Process (3) 100% REC 252.00
Uncoated groundwood paper —CanadaProcess (1) 35% CHEM+65% MECH 220.50Process (2) 58% MECH+35% MKT+7% REC 173.25 Process (3) 100% REC 210.00
Tissue and sanitary paper—CanadaProcess (1) 70% MKT+30% REC 194.25 Process (2) 100% REC 236.25Process (4) 90% MECH+10% REC 220.50Process (5) 50% MIX+50% ONP 236.00Process (6) 50% BCTMP+50% MKT 195.00
Specialty packaging and industrial paper—CanadaProcess (1) 273.00
Kraft Pkg. & Industrial converting paper—CanadaProcess (1) 100% CHEM 126.00
Linerboard—CanadaProcess (1) 95% KRAFT+5% OCC 94.50 Process (2) 70% KRAFT+30% OCC 81.90Process (3) 100% REC 78.75Process (4) 50% KRAFT+50% OCC 79.00Process (5) 70% MECH+30% OCC 64.00
Corrugating medium—CanadaProcess (1) 67% SCHEM+33% OCC 100.80 Process (2) 90% SCHEM+10% OCC 102.90Process (3) 100% REC 57.75Process (4) 67% MECH+33% MIX 62.75
Solid bleached board—CanadaProcess (1) 100% KRAFT 258.30 Process (2) 70% KRAFT+30% MECH 200.00
Recycled board—CanadaProcess (1) 81.90
Construction paper and board, and other—CanadaProcess (1) 70.35
Market pulp processes—CanadaDissolving & special alpha pulp 252.00 Softwood chemical market pulp 241.50Hardwood chemical market pulp 231.00Mechanical market pulp (BCTMP) 123.90Market pulp from recycled fiber 126.00
Table 55—Estimated costs of new capacity for production processes per tonne of product outputa
Product and processbCost ($1986/t)
Newsprint—U.S.Process (1) 75% GWD+25% CHEM 212.00Process (2) 90% TMP+10% CHEM 165.00Process (3) 100% ONP 164.50Process (5) 70% ONP+30% MIXED 155.00Process (6) PRESS+100% TMP 165.00
Coated free sheet paper—U.S.Process (1) 90% CHEM+10% REC 275.00Process (2) 90% MKT+10% REC 180.00Process (3) 100% REC 300.00
Uncoated free sheet paper—U.S.Process (1) 100% SULPHITE 350.00 Process (2) 100% KRAFT 240.00 Process (3) 100% MKT PULP 160.00 Process (4) 100% REC 210.00Process (5) 20% MECH/REC+80% CHEM 100.00
Coated groundwood paper—U.S.Process (1) 58% CHEM+42% MECH 240.00Process (2) 56% MKT+MECH+2% REC 210.50Process (3) 100% REC 240.00
Uncoated groundwood paper—U.S.Process (1) 35% CHEM+65% MECH 210.00Process (2) 58% MECH+35% MKT+7% REC 165.00 Process (3) 100% REC 200.00
Tissue and sanitary paper— U.S.Process (1) 70% MKT+30% REC 185.00 Process (2) 100% REC 225.00Process (3) 75% CHEM+25% REC 255.00Process (4) 90% MECH+10% REC 210.00Process (5) 50% MIX+50% ONP 225.00Process (6) 50% BCTMP+50% MKT 185.00
Specialty packaging & industrial paper—U.S.Process (1) 260.00
Kraft pkg. & industrial converting paper—U.S.Process (1) 100% CHEM 120.00Process (2) 75% CHEM+25% REC 125.00Process (3) 100% REC 85.00
Linerboard—U.S.Process (1) 95% KRAFT+5% OCC 110.00 Process (2) 70% KRAFT+30% OCC 88.00Process (3) 100% REC 85.00Process (4) 50% KRAFT+50% OCC 75.00 Process (5) 70% MECH+30% OCC 60.00
Corrugating medium—U.S.Process (1) 67% SCHEM+33% OCC 96.00 Process (2) 90% SCHEM+10% OCC 98.00Process (3) 100 REC 55.00Process (4) 67% MECH+33% MIX 60.00
Solid bleached board—U.S.Process (1) 100% KRAFT 246.30 Process (2) 70% KRAFT+30% MECH 190.00Recycled board—U.S.Process (1) 78.00
Construction paper and board, and other —U.S.Process (1) 67.00
Market pulp processes—U.S.Dissolving & special alpha pulp 240.00Softwood chemical market pulp 230.00Hardwood chemical market pulp 220.00Mechanical market pulp (BCTMP) 118.00Market pulp from recycled fiber 120.00

67
Figure 9—U.S. paper and board consumption.
Figure 10—U.S. and Canadian paper and boardconsumption.
Figure 11—U.S. newsprint consumption.
Year1970 1980 1990 2000 2010 2020 2030 2040
0
15
30
45
60
75
90
105
120
135Paper and board
Con
sum
ptio
n (x
10 t
)6
API; new supply
150
HistoricalNAPAP Projections
Figure 12—U.S. coated free sheet consumption.
Figure 13—U.S. uncoated free sheet consumption.
Figure 14—U.S. coated groundwood consumption.
Year1960 1970 1980 1990 2000 2010 2020 2030 2040
0
3
6
9
12
15
18
Con
sum
ptio
n (x
10 t
)6
New supply
Newsprint
HistoricalNAPAP Projections
21
Year1990 2000 2010 2020 2030 2040
0
153045
6075
90105
120
135
150
Con
sum
ptio
n (x
10 t
)6
United StatesCanada
Year1960 1970 1980 19902000 2010 2020 2030 2040
0
1
2
3
4
5
6
7
8Coated free sheet
New supply
Con
sum
ptio
n (x
10 t
)6 Historical
NAPAP Projections
Year1960 1970 1980 1990 2000 2010 2020 2030 2040
0
5
10
15
20
25
30
New supply
Uncoated free sheet
Con
sum
ptio
n (x
10 t
)6
HistoricalNAPAP Projections
Year1960 1970 1980 1990 2000 2010 2020 2030 2040
0
1
2
3
4
5
6
7
New supply
Coated groundwood
Con
sum
ptio
n (x
10 t
)6
HistoricalNAPAP Projections
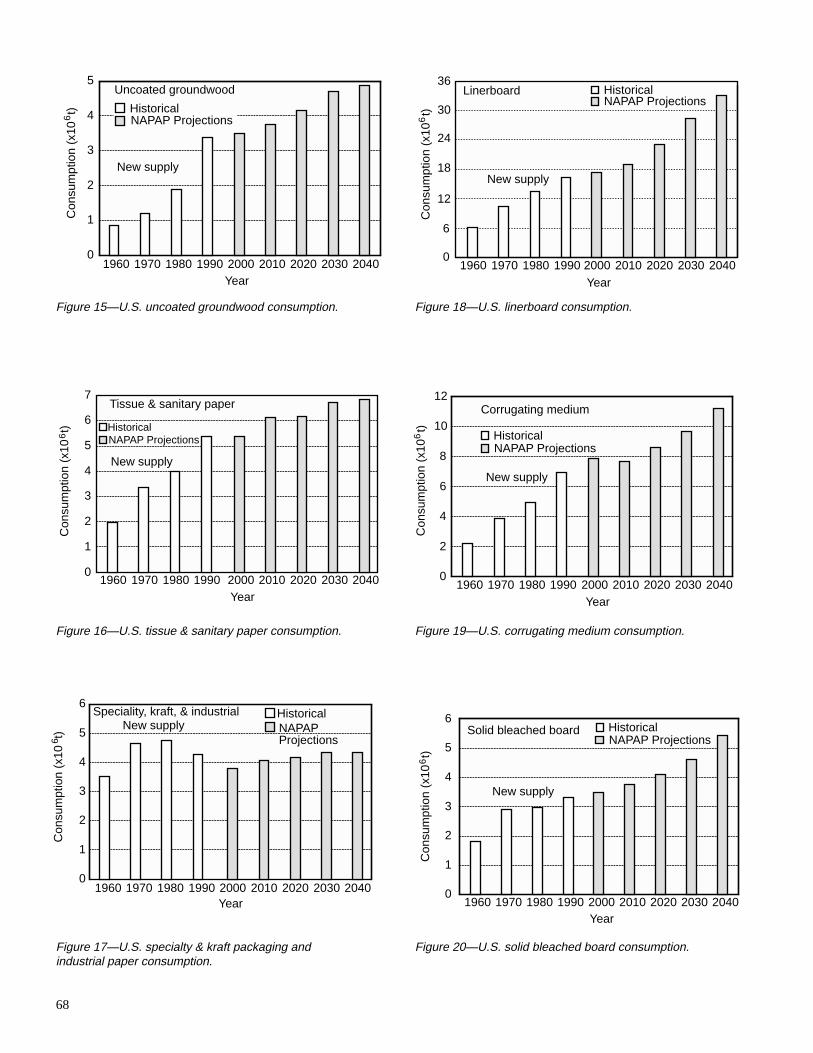
68
Figure 15—U.S. uncoated groundwood consumption.
Figure 16—U.S. tissue & sanitary paper consumption.
Figure 17—U.S. specialty & kraft packaging andindustrial paper consumption.
Figure 18—U.S. linerboard consumption.
Figure 19—U.S. corrugating medium consumption.
Figure 20—U.S. solid bleached board consumption.
Year1960 1970 1980 1990 2000 2010 2020 2030 2040
0
1
2
3
4
5
New supply
Uncoated groundwood
Con
sum
ptio
n (x
10 t
)6
HistoricalNAPAP Projections
Year1960 1970 1980 1990 2000 2010 2020 2030 2040
0
6
12
18
24
30
New supply
Con
sum
ptio
n (x
10 t
)6
36Linerboard Historical
NAPAP Projections
Year1960 1970 1980 1990 2000 2010 2020 2030 2040
0
1
2
3
4
5
6
New supply
Solid bleached board HistoricalNAPAP Projections
Con
sum
ptio
n (x
10 t
)6
Year1960 1970 1980 1990 2000 2010 2020 2030 2040
0
2
4
6
8
10
12
New supply
Corrugating mediumC
onsu
mpt
ion
(x10
t)
6
HistoricalNAPAP Projections
Year1960 1970 1980 1990 2000 2010 2020 2030 2040
0
1
2
3
4
5
6
7
New supply
Tissue & sanitary paper
HistoricalNAPAP Projections
Con
sum
ptio
n (x
10 t
)6
Year1960 1970 1980 1990 2000 2010 2020 2030 2040
0
1
2
3
4
5
6Speciality, kraft, & industrial
New supply
Con
sum
ptio
n (x
10 t
)6
HistoricalNAPAP Projections

69
Figure 21—U.S. recycled board consumption.
Figure 22—U.S. construction paper and board consumption.
Figure 23—U.S. dissolving & special alpha pulpconsumption.
Figure 24—Newsprint production in United States andCanada.
Figure 25—U.S. newsprint production.
Figure 26—Newsprint production in U.S. North, by process.GWD is groundwood; ONP, old newspapers; OMG, oldmagazine grade; and TMP thermomechanical pulp.
Year1960 1970 1980 1990 2000 2010 2020 2030 2040
0
0.5
1.0
1.5
2.0
2.5
3.0
3.5
New supply
Construction paper & board
6
Con
sum
ptio
n (x
10 t
)
HistoricalNAPAP Projections
Year1980 1990 2000 2010 2020 2030 2040
0
5
10
15
20
25
30U.S. and Canada newsprint
Pro
duct
ion
(x10
t)
6 Historical United States
Canada
Year
1970 1980 1990 2000 2010 2020 2030 20400
4
8
12
16
20U.S. newsprint
Pro
duct
ion
(x10
t)
6
Historical NorthSouth West
Year1990 2000 2010 2020 2030 2040
0
1
2
3
4U.S. North newsprint
6
Pro
duct
ion
(x10
t)
P1(75%Gwd+25%Chem)
P3(100%ONP)P5(70%ONP+30%OMG)
P6(Press+100%TMP)
Year1960 1970 1980 1990 2000 2010 2020 2030 2040
0
200
400
600
800
1000
1200
New supply
Dissolving & alpha pulp
Con
sum
ptio
n (x
10 t
)3
HistoricalNAPAP Projections
Year
1970 1980 1990 2000 2010 2020 2030 20400
1
2
3
4
5
6
7
8
9
New supply
Recycled boardC
onsu
mpt
ion
(x10
t)
6
HistoricalNAPAP Projections
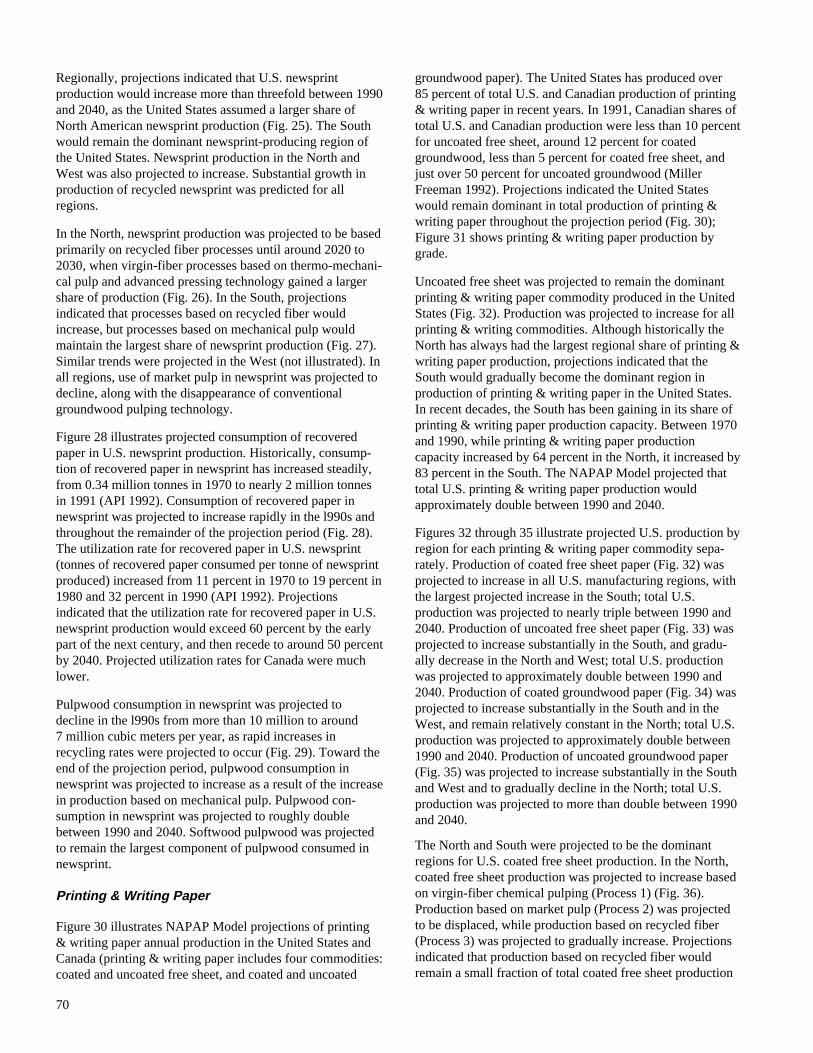
70
Regionally, projections indicated that U.S. newsprintproduction would increase more than threefold between 1990and 2040, as the United States assumed a larger share ofNorth American newsprint production (Fig. 25). The Southwould remain the dominant newsprint-producing region ofthe United States. Newsprint production in the North andWest was also projected to increase. Substantial growth inproduction of recycled newsprint was predicted for allregions.
In the North, newsprint production was projected to be basedprimarily on recycled fiber processes until around 2020 to2030, when virgin-fiber processes based on thermo-mechani-cal pulp and advanced pressing technology gained a largershare of production (Fig. 26). In the South, projectionsindicated that processes based on recycled fiber wouldincrease, but processes based on mechanical pulp wouldmaintain the largest share of newsprint production (Fig. 27).Similar trends were projected in the West (not illustrated). Inall regions, use of market pulp in newsprint was projected todecline, along with the disappearance of conventionalgroundwood pulping technology.
Figure 28 illustrates projected consumption of recoveredpaper in U.S. newsprint production. Historically, consump-tion of recovered paper in newsprint has increased steadily,from 0.34 million tonnes in 1970 to nearly 2 million tonnesin 1991 (API 1992). Consumption of recovered paper innewsprint was projected to increase rapidly in the l990s andthroughout the remainder of the projection period (Fig. 28).The utilization rate for recovered paper in U.S. newsprint(tonnes of recovered paper consumed per tonne of newsprintproduced) increased from 11 percent in 1970 to 19 percent in1980 and 32 percent in 1990 (API 1992). Projectionsindicated that the utilization rate for recovered paper in U.S.newsprint production would exceed 60 percent by the earlypart of the next century, and then recede to around 50 percentby 2040. Projected utilization rates for Canada were muchlower.
Pulpwood consumption in newsprint was projected todecline in the l990s from more than 10 million to around7 million cubic meters per year, as rapid increases inrecycling rates were projected to occur (Fig. 29). Toward theend of the projection period, pulpwood consumption innewsprint was projected to increase as a result of the increasein production based on mechanical pulp. Pulpwood con-sumption in newsprint was projected to roughly doublebetween 1990 and 2040. Softwood pulpwood was projectedto remain the largest component of pulpwood consumed innewsprint.
Printing & Writing Paper
Figure 30 illustrates NAPAP Model projections of printing& writing paper annual production in the United States andCanada (printing & writing paper includes four commodities:coated and uncoated free sheet, and coated and uncoated
groundwood paper). The United States has produced over85 percent of total U.S. and Canadian production of printing& writing paper in recent years. In 1991, Canadian shares oftotal U.S. and Canadian production were less than 10 percentfor uncoated free sheet, around 12 percent for coatedgroundwood, less than 5 percent for coated free sheet, andjust over 50 percent for uncoated groundwood (MillerFreeman 1992). Projections indicated the United Stateswould remain dominant in total production of printing &writing paper throughout the projection period (Fig. 30);Figure 31 shows printing & writing paper production bygrade.
Uncoated free sheet was projected to remain the dominantprinting & writing paper commodity produced in the UnitedStates (Fig. 32). Production was projected to increase for allprinting & writing commodities. Although historically theNorth has always had the largest regional share of printing &writing paper production, projections indicated that theSouth would gradually become the dominant region inproduction of printing & writing paper in the United States.In recent decades, the South has been gaining in its share ofprinting & writing paper production capacity. Between 1970and 1990, while printing & writing paper productioncapacity increased by 64 percent in the North, it increased by83 percent in the South. The NAPAP Model projected thattotal U.S. printing & writing paper production wouldapproximately double between 1990 and 2040.
Figures 32 through 35 illustrate projected U.S. production byregion for each printing & writing paper commodity sepa-rately. Production of coated free sheet paper (Fig. 32) wasprojected to increase in all U.S. manufacturing regions, withthe largest projected increase in the South; total U.S.production was projected to nearly triple between 1990 and2040. Production of uncoated free sheet paper (Fig. 33) wasprojected to increase substantially in the South, and gradu-ally decrease in the North and West; total U.S. productionwas projected to approximately double between 1990 and2040. Production of coated groundwood paper (Fig. 34) wasprojected to increase substantially in the South and in theWest, and remain relatively constant in the North; total U.S.production was projected to approximately double between1990 and 2040. Production of uncoated groundwood paper(Fig. 35) was projected to increase substantially in the Southand West and to gradually decline in the North; total U.S.production was projected to more than double between 1990and 2040.
The North and South were projected to be the dominantregions for U.S. coated free sheet production. In the North,coated free sheet production was projected to increase basedon virgin-fiber chemical pulping (Process 1) (Fig. 36).Production based on market pulp (Process 2) was projectedto be displaced, while production based on recycled fiber(Process 3) was projected to gradually increase. Projectionsindicated that production based on recycled fiber wouldremain a small fraction of total coated free sheet production
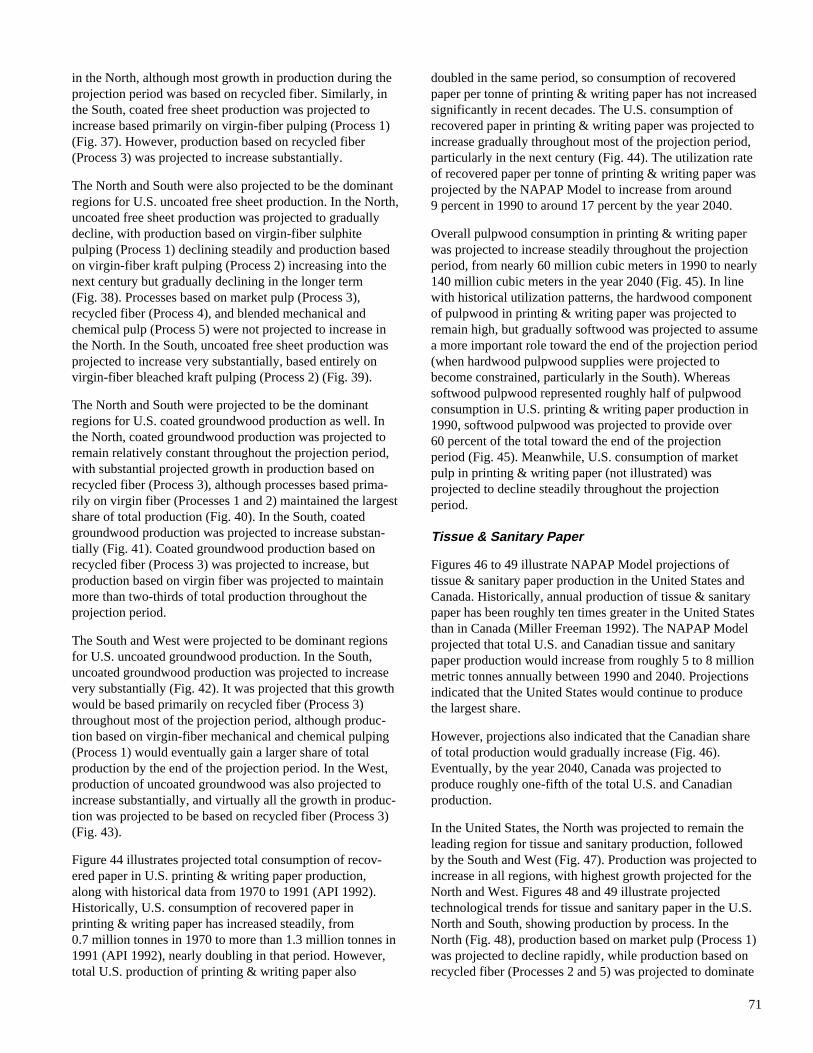
71
in the North, although most growth in production during theprojection period was based on recycled fiber. Similarly, inthe South, coated free sheet production was projected toincrease based primarily on virgin-fiber pulping (Process 1)(Fig. 37). However, production based on recycled fiber(Process 3) was projected to increase substantially.
The North and South were also projected to be the dominantregions for U.S. uncoated free sheet production. In the North,uncoated free sheet production was projected to graduallydecline, with production based on virgin-fiber sulphitepulping (Process 1) declining steadily and production basedon virgin-fiber kraft pulping (Process 2) increasing into thenext century but gradually declining in the longer term(Fig. 38). Processes based on market pulp (Process 3),recycled fiber (Process 4), and blended mechanical andchemical pulp (Process 5) were not projected to increase inthe North. In the South, uncoated free sheet production wasprojected to increase very substantially, based entirely onvirgin-fiber bleached kraft pulping (Process 2) (Fig. 39).
The North and South were projected to be the dominantregions for U.S. coated groundwood production as well. Inthe North, coated groundwood production was projected toremain relatively constant throughout the projection period,with substantial projected growth in production based onrecycled fiber (Process 3), although processes based prima-rily on virgin fiber (Processes 1 and 2) maintained the largestshare of total production (Fig. 40). In the South, coatedgroundwood production was projected to increase substan-tially (Fig. 41). Coated groundwood production based onrecycled fiber (Process 3) was projected to increase, butproduction based on virgin fiber was projected to maintainmore than two-thirds of total production throughout theprojection period.
The South and West were projected to be dominant regionsfor U.S. uncoated groundwood production. In the South,uncoated groundwood production was projected to increasevery substantially (Fig. 42). It was projected that this growthwould be based primarily on recycled fiber (Process 3)throughout most of the projection period, although produc-tion based on virgin-fiber mechanical and chemical pulping(Process 1) would eventually gain a larger share of totalproduction by the end of the projection period. In the West,production of uncoated groundwood was also projected toincrease substantially, and virtually all the growth in produc-tion was projected to be based on recycled fiber (Process 3)(Fig. 43).
Figure 44 illustrates projected total consumption of recov-ered paper in U.S. printing & writing paper production,along with historical data from 1970 to 1991 (API 1992).Historically, U.S. consumption of recovered paper inprinting & writing paper has increased steadily, from0.7 million tonnes in 1970 to more than 1.3 million tonnes in1991 (API 1992), nearly doubling in that period. However,total U.S. production of printing & writing paper also
doubled in the same period, so consumption of recoveredpaper per tonne of printing & writing paper has not increasedsignificantly in recent decades. The U.S. consumption ofrecovered paper in printing & writing paper was projected toincrease gradually throughout most of the projection period,particularly in the next century (Fig. 44). The utilization rateof recovered paper per tonne of printing & writing paper wasprojected by the NAPAP Model to increase from around9 percent in 1990 to around 17 percent by the year 2040.
Overall pulpwood consumption in printing & writing paperwas projected to increase steadily throughout the projectionperiod, from nearly 60 million cubic meters in 1990 to nearly140 million cubic meters in the year 2040 (Fig. 45). In linewith historical utilization patterns, the hardwood componentof pulpwood in printing & writing paper was projected toremain high, but gradually softwood was projected to assumea more important role toward the end of the projection period(when hardwood pulpwood supplies were projected tobecome constrained, particularly in the South). Whereassoftwood pulpwood represented roughly half of pulpwoodconsumption in U.S. printing & writing paper production in1990, softwood pulpwood was projected to provide over60 percent of the total toward the end of the projectionperiod (Fig. 45). Meanwhile, U.S. consumption of marketpulp in printing & writing paper (not illustrated) wasprojected to decline steadily throughout the projectionperiod.
Tissue & Sanitary Paper
Figures 46 to 49 illustrate NAPAP Model projections oftissue & sanitary paper production in the United States andCanada. Historically, annual production of tissue & sanitarypaper has been roughly ten times greater in the United Statesthan in Canada (Miller Freeman 1992). The NAPAP Modelprojected that total U.S. and Canadian tissue and sanitarypaper production would increase from roughly 5 to 8 millionmetric tonnes annually between 1990 and 2040. Projectionsindicated that the United States would continue to producethe largest share.
However, projections also indicated that the Canadian shareof total production would gradually increase (Fig. 46).Eventually, by the year 2040, Canada was projected toproduce roughly one-fifth of the total U.S. and Canadianproduction.
In the United States, the North was projected to remain theleading region for tissue and sanitary production, followedby the South and West (Fig. 47). Production was projected toincrease in all regions, with highest growth projected for theNorth and West. Figures 48 and 49 illustrate projectedtechnological trends for tissue and sanitary paper in the U.S.North and South, showing production by process. In theNorth (Fig. 48), production based on market pulp (Process 1)was projected to decline rapidly, while production based onrecycled fiber (Processes 2 and 5) was projected to dominate

72
Figure 27—Newsprint production in U.S. South,by process.
Figure 28—Recovered paper consumed inU.S. newsprint production.
Figure 29—Pulpwood consumed in U.S. newsprintproduction.
Figure 30—Printing & writing paper productionin United States and Canada.
Figure 31—U.S. printing & writing paper productionby grade.
Figure 32—U.S. coated free sheet production.
Year
1990 2000 2010 2020 2030 20400
10
20
30
40
50
Pro
duct
ion
(x10
t)
6
Ctd Free SheetUnctd Free SheetCtd GroundwoodUnctd Groundwood
Year1970 1980 1990 2000 2010 2020 2030 2040
0
2
4
6
8
10
Con
sum
ptio
n (x
10 t
)6
Historical Data (API)
NAPAP Projections
Year1990 2000 2010 2020 2030 2040
0
4
8
12P
rodu
ctio
n (x
10 t
)6
U.S. South newsprintP1(75%Gwd+25%Chem)
P2(90%TMP+10%Chem)
P3(100%ONP)
P5(70%ONP+30%OMG)
P6(Press+100%TMP)
Year1990 2000 2010 2020 2030 2040
0
10
20
30
40
50United StatesCanada
Pro
duct
ion
(x10
t)
6
Year
1990 2000 2010 2020 2030 20400
6
12
18
24
Con
sum
ptio
n (x
10 m
)6
3
TotalSoftwood
30
Pro
duct
ion
(x10
t)
6
Year
1980 1990 2000 2010 2020 2030 20400
2
4
6
8
10Coated free sheet
HistoricalNorthSouthWest
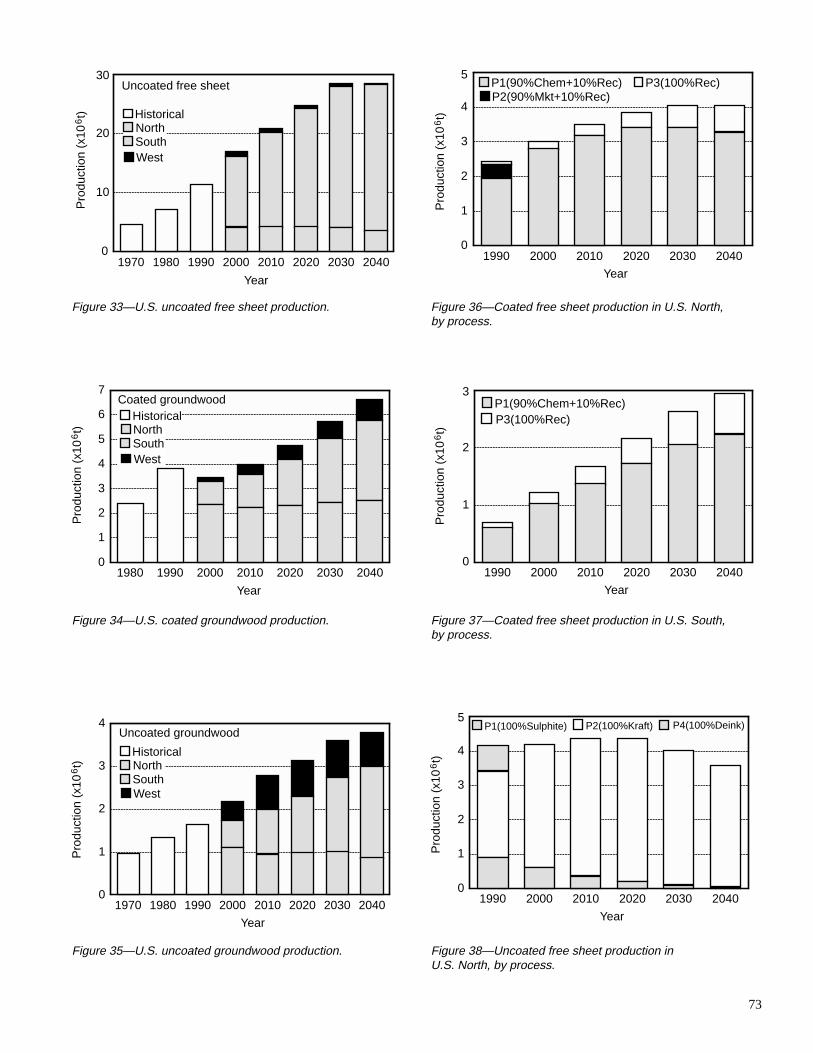
73
Figure 36—Coated free sheet production in U.S. North,by process.
Figure 37—Coated free sheet production in U.S. South,by process.
Figure 38—Uncoated free sheet production inU.S. North, by process.
Pro
duct
ion
(x10
t)
6
Year
1970 1980 1990 2000 2010 2020 2030 20400
10
20
30Uncoated free sheet
HistoricalNorthSouthWest
Pro
duct
ion
(x10
t)
6
Year
1980 1990 2000 2010 2020 2030 20400
1
2
3
4
5
6
7Coated groundwood
HistoricalNorthSouthWest
Figure 33—U.S. uncoated free sheet production.
Figure 34—U.S. coated groundwood production.
Figure 35—U.S. uncoated groundwood production.
Pro
duct
ion
(x10
t)
6
Year
1970 1980 1990 2000 2010 2020 2030 20400
1
2
3
4Uncoated groundwood
HistoricalNorthSouthWest
Pro
duct
ion
(x10
t)
6
Year
1990 2000 2010 2020 2030 20400
1
2
3
4
5P1(90%Chem+10%Rec)P2(90%Mkt+10%Rec)
P3(100%Rec)
Pro
duct
ion
(x10
t)
6
Year
1990 2000 2010 2020 2030 20400
1
2
3P1(90%Chem+10%Rec)P3(100%Rec)
Pro
duct
ion
(x10
t)
6
Year
1990 2000 2010 2020 2030 20400
1
2
3
4
5P1(100%Sulphite) P2(100%Kraft) P4(100%Deink)

74
Figure 39—Uncoated free sheet production inU.S. South, by process.
Figure 40—Coated groundwood production inU.S. North, by process.
Figure 41—Coated groundwood production inU.S. South, by process.
Figure 42—Uncoated groundwood production inU.S. South, by process.
Figure 43—Uncoated groundwood production inU.S. West, by process.
Figure 44—Recovered paper consumed inU.S. printing & writing paper production.
Year
1990 2000 2010 2020 2030 20400
10
20
30
P2(100%Kraft)
Pro
duct
ion
(x10
t)
6
Pro
duct
ion
(x10
t)
6
Year
1990 2000 2010 2020 2030 20400
0.5
1.0
1.5
2.0
2.5P1(58%Chem+42%Mech) P3(100%Rec)
P2(58%Mkt+Mech+7%Rec)
Pro
duct
ion
(x10
t)
3
Year
1990 2000 2010 2020 2030 20400
200
400
600
800
1000P2(58%Mech+35%Mkt+7%Rec)P3(100%Rec)
Year
1970 1980 1990 2000 2010 2020 2030 20400
2
4
6
8Historical Data (API)NAPAP Projections
Con
sum
ptio
n (x
10 t
)6
Pro
duct
ion
(x10
t)
6
Year
1990 2000 2010 2020 2030 20400
1
2
3P1(58%Chem+42%Mech) P3(100%Rec)
P2(58%Mkt+Mech+7%Rec)
Pro
duct
ion
(x10
t)
6
Year
1990 2000 2010 2020 2030 20400
0.5
1.0
1.5
2.0
2.5
3.0
3.5P1(58%Chem+42%Mech) P3(100%Rec)
P2(58%Mkt+Mech+7%Rec)

75
Figure 45—Pulpwood consumed in U.S. printing& writing paper production.
Figure 46—Tissue & sanitary paper productionin United States and Canada.
Figure 47—U.S. tissue & sanitary paper production.
Figure 48—Tissue & sanitary paper productionin U.S. North, by process.
Figure 49—Tissue & sanitary paper productionin U.S. South, by process.
Figure 50—Recovered paper consumed in U.S. tissue& sanitary paper production.
Year
1990 2000 2010 2020 2030 20400
40
80
120
Con
sum
ptio
n (x
10 m
)6
3
Total Softwood160
Year
1990 2000 2010 2020 2030 20400
2
4
6
8United States Canada
Pro
duct
ion
(x10
t)
6
P
rodu
ctio
n (x
10 t
)6
Year
1970 1980 1990 2000 2010 2020 2030 20400
1
2
3
4
5
6
7Historical DataNorthSouthWest
Pro
duct
ion
(x10
t)
6
Year1990 2000 2010 2020 2030 2040
0
1
2
3
4
5P1(70%Mkt+30%Rec) P2(100%Rec)P3(75%Chem+25%Rec)P5(50%Mix+50%ONP)
Pro
duct
ion
(x10
t)
6
Year
1990 2000 2010 2020 2030 20400
0.5
1.0
1.5
2.0
2.5P2(100%Rec) P3(75%Chem+25%Rec)P5(50%Mix+50%ONP)
Year
1970 1980 1990 2000 2010 2020 2030 20400
2
4
6
8Historical Data (API)NAPAP Projections
Con
sum
ptio
n (x
10 t
)6
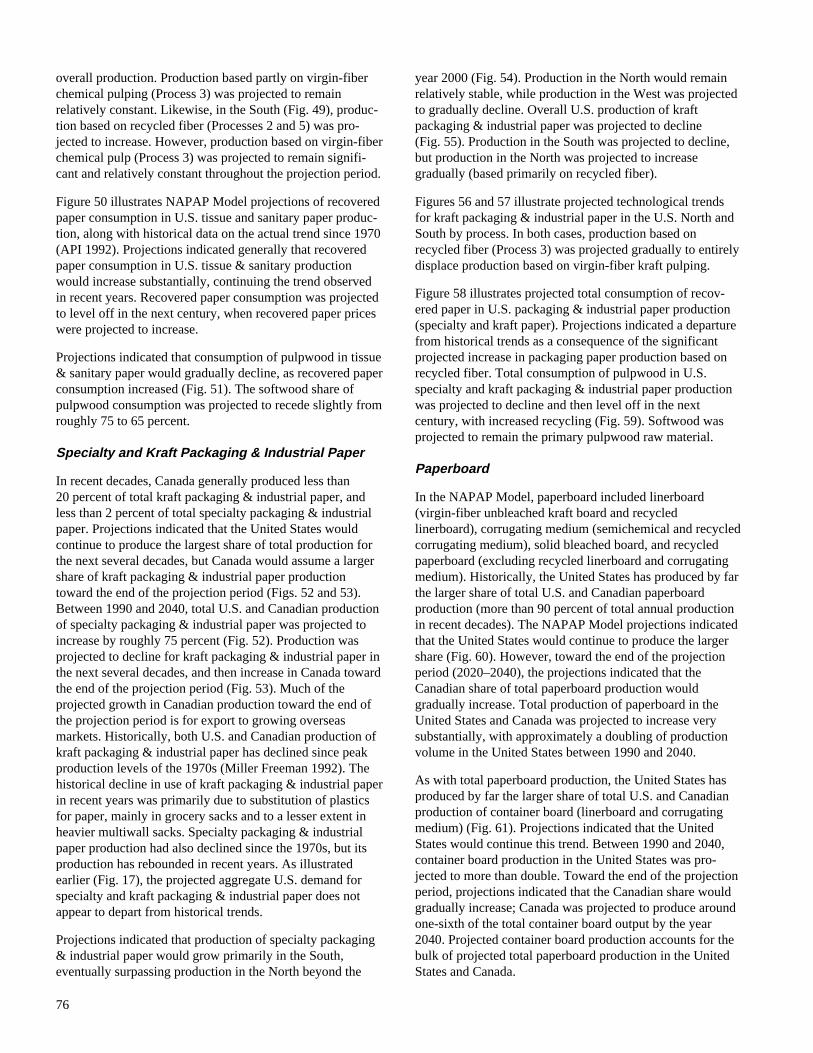
76
overall production. Production based partly on virgin-fiberchemical pulping (Process 3) was projected to remainrelatively constant. Likewise, in the South (Fig. 49), produc-tion based on recycled fiber (Processes 2 and 5) was pro-jected to increase. However, production based on virgin-fiberchemical pulp (Process 3) was projected to remain signifi-cant and relatively constant throughout the projection period.
Figure 50 illustrates NAPAP Model projections of recoveredpaper consumption in U.S. tissue and sanitary paper produc-tion, along with historical data on the actual trend since 1970(API 1992). Projections indicated generally that recoveredpaper consumption in U.S. tissue & sanitary productionwould increase substantially, continuing the trend observedin recent years. Recovered paper consumption was projectedto level off in the next century, when recovered paper priceswere projected to increase.
Projections indicated that consumption of pulpwood in tissue& sanitary paper would gradually decline, as recovered paperconsumption increased (Fig. 51). The softwood share ofpulpwood consumption was projected to recede slightly fromroughly 75 to 65 percent.
Specialty and Kraft Packaging & Industrial Paper
In recent decades, Canada generally produced less than20 percent of total kraft packaging & industrial paper, andless than 2 percent of total specialty packaging & industrialpaper. Projections indicated that the United States wouldcontinue to produce the largest share of total production forthe next several decades, but Canada would assume a largershare of kraft packaging & industrial paper productiontoward the end of the projection period (Figs. 52 and 53).Between 1990 and 2040, total U.S. and Canadian productionof specialty packaging & industrial paper was projected toincrease by roughly 75 percent (Fig. 52). Production wasprojected to decline for kraft packaging & industrial paper inthe next several decades, and then increase in Canada towardthe end of the projection period (Fig. 53). Much of theprojected growth in Canadian production toward the end ofthe projection period is for export to growing overseasmarkets. Historically, both U.S. and Canadian production ofkraft packaging & industrial paper has declined since peakproduction levels of the 1970s (Miller Freeman 1992). Thehistorical decline in use of kraft packaging & industrial paperin recent years was primarily due to substitution of plasticsfor paper, mainly in grocery sacks and to a lesser extent inheavier multiwall sacks. Specialty packaging & industrialpaper production had also declined since the 1970s, but itsproduction has rebounded in recent years. As illustratedearlier (Fig. 17), the projected aggregate U.S. demand forspecialty and kraft packaging & industrial paper does notappear to depart from historical trends.
Projections indicated that production of specialty packaging& industrial paper would grow primarily in the South,eventually surpassing production in the North beyond the
year 2000 (Fig. 54). Production in the North would remainrelatively stable, while production in the West was projectedto gradually decline. Overall U.S. production of kraftpackaging & industrial paper was projected to decline(Fig. 55). Production in the South was projected to decline,but production in the North was projected to increasegradually (based primarily on recycled fiber).
Figures 56 and 57 illustrate projected technological trendsfor kraft packaging & industrial paper in the U.S. North andSouth by process. In both cases, production based onrecycled fiber (Process 3) was projected gradually to entirelydisplace production based on virgin-fiber kraft pulping.
Figure 58 illustrates projected total consumption of recov-ered paper in U.S. packaging & industrial paper production(specialty and kraft paper). Projections indicated a departurefrom historical trends as a consequence of the significantprojected increase in packaging paper production based onrecycled fiber. Total consumption of pulpwood in U.S.specialty and kraft packaging & industrial paper productionwas projected to decline and then level off in the nextcentury, with increased recycling (Fig. 59). Softwood wasprojected to remain the primary pulpwood raw material.
Paperboard
In the NAPAP Model, paperboard included linerboard(virgin-fiber unbleached kraft board and recycledlinerboard), corrugating medium (semichemical and recycledcorrugating medium), solid bleached board, and recycledpaperboard (excluding recycled linerboard and corrugatingmedium). Historically, the United States has produced by farthe larger share of total U.S. and Canadian paperboardproduction (more than 90 percent of total annual productionin recent decades). The NAPAP Model projections indicatedthat the United States would continue to produce the largershare (Fig. 60). However, toward the end of the projectionperiod (2020–2040), the projections indicated that theCanadian share of total paperboard production wouldgradually increase. Total production of paperboard in theUnited States and Canada was projected to increase verysubstantially, with approximately a doubling of productionvolume in the United States between 1990 and 2040.
As with total paperboard production, the United States hasproduced by far the larger share of total U.S. and Canadianproduction of container board (linerboard and corrugatingmedium) (Fig. 61). Projections indicated that the UnitedStates would continue this trend. Between 1990 and 2040,container board production in the United States was pro-jected to more than double. Toward the end of the projectionperiod, projections indicated that the Canadian share wouldgradually increase; Canada was projected to produce aroundone-sixth of the total container board output by the year2040. Projected container board production accounts for thebulk of projected total paperboard production in the UnitedStates and Canada.

77
Figure 51—Pulpwood consumed in U.S. tissue& sanitary paper production.
Figure 52—Specialty packaging & industrial paperproduction in United States and Canada.
Figure 53—Kraft packaging & industrial paper productionin United States and Canada.
Figure 54—U.S. specialty packaging & industrial paperproduction.
Figure 55—U.S. kraft packaging & industrial paperproduction.
Figure 56—Kraft packaging & industrial paper productionin U.S. North, by process.
Year
1990 2000 2010 2020 2030 20400
2
4
6
8Total Softwood
Con
sum
ptio
n (x
10 m
)6
3
Year
1990 2000 2010 2020 2030 20400
1
2
3
4United States Canada
Pro
duct
ion
(x10
t)
6
Pro
duct
ion
(x10
t)
6
Year
1990 2000 2010 2020 2030 20400
1
2
3
4
United States Canada
Pro
duct
ion
(x10
t)
6
Year
1970 1980 1990 2000 2010 2020 2030 20400
1
2
3
4NAPAP Projections
Historical (API) NorthSouth West
Pro
duct
ion
(x10
t)
6
Year
1970 1980 1990 2000 2010 2020 2030 20400
1
2
3
4
NAPAP Projections
Historical (API) NorthSouth
Pro
duct
ion
(x10
t)
3
Year
1990 2000 2010 2020 2030 20400
100
200
300
400
500P2(75%Chem+25%Rec) P3(100%Rec)

78
Figure 57—Kraft packaging & industrial paper productionin U.S. South, by process.
Figure 58—Consumption of recovered paper in U.S.specialty and kraft packaging & industrial paper production.
Figure 59—Consumption of pulpwood in U.S. specialtyand kraft packaging & industrial paper.
Figure 60—Paperboard production in United Statesand Canada.
Figure 61—Linerboard and corrugating medium(containerboard) production in United States and Canada.
Figure 62—U.S. linerboard production.
Year
1990 2000 2010 2020 2030 20400
0.5
1.0
1.5
2.0
2.5P
rodu
ctio
n (x
10 t
)6
P1(100%Chem)P2(75%Chem+25%Rec)P3(100%Rec)
Year
1970 1980 1990 2000 2010 2020 2030 20400
0.5
1.0
1.5
2.0Historical Data (API)NAPAP Projections
Con
sum
ptio
n (x
10 t
)6
Year
1990 2000 2010 2020 2030 20400
6
12
18
Total Softwood
Con
sum
ptio
n (x
10 m
)6
3
Year
1990 2000 2010 2020 2030 20400
20
40
60
80United States Canada
Pro
duct
ion
(x10
t)
6
Pro
duct
ion
(x10
t)
6
Year
1990 2000 2010 2020 2030 20400
10
20
30
40
50
60
70United States Canada
Pro
duct
ion
(x10
t)
6
Year
1980 1990 2000 2010 2020 2030 20400
10
20
30
40
50Historical North South West

79
Figure 62 illustrates projected linerboard production in theUnited States by region; linerboard production was projectedto approximately double between 1990 and 2040, with thebulk of that increase projected to occur in the South.Linerboard production in the South was projected to increaseto approximately 30 million metric tonnes per year by 2040.Linerboard production was also projected to increase in theWest, but production in the West was projected to remainsubstantially lower than production in the South. Althoughtraditionally the North has produced only a very smallproportion of total U.S. linerboard production, the projec-tions indicated that linerboard production in the North wouldincrease very substantially (based primarily on recycled fiberin the next several decades).
Figures 63 to 65 illustrate projected technological evolutionin linerboard production by process for each region of theUnited States. For the next several decades, linerboardproduction in the North was projected to increase substan-tially, based primarily on recycled fiber (Process 3) (Fig. 63).However, toward the latter end of the projection period, alarger share of linerboard production in the North wasprojected to be based on virgin-fiber kraft pulp with highproportions of recycled fiber (Process 4) and virgin-fibermechanical pulp with high proportions of recycled fiber(Process 5). Processes 4 and 5 were assumed to use advancedforming, pressing, and drying technology (i.e., technologiesincorporating impulse drying, press drying, or similarconcepts). It was projected that eventually such processeswould displace production based solely on recycled fiber(Process 3).
Linerboard production in the U.S. South was projected to bebased primarily on virgin-fiber unbleached kraft pulp(Processes 1 and 2) for at least the next several decades(Fig. 64). Of the two conventional virgin-fiber kraftlinerboard processes used in the South, production based onimproved press technology (Process 2) was projected toeclipse production based on older (pre-1980) press technol-ogy (Process 1) by the early part of the next century.Production based entirely on recycled fiber (Process 3) wasprojected also to increase for several decades in the South.However, toward the end of the projection period, a largershare of linerboard production was projected to be based onvirgin-fiber kraft or mechanical pulp with high proportionsof recycled fiber (Processes 4 and 5), using advancedforming, pressing, and drying technology.
Linerboard production in the West was projected to followtechnological trends similar to those in the North and South(Fig. 65). The West was projected to experience a decline inlinerboard production volume in the next decade (due in partto projected near-term constraints on fiber supply in theWest). Subsequently, linerboard production was projected toincrease and eventually exceed current production levels,based largely on technology using recycled fiber (Process 3)and technology using mechanical pulp with high proportionsof recycled fiber (Process 5).
Figure 66 illustrates projected production of corrugatingmedium in the United States, by region. Production ofcorrugating medium was projected to increase substantiallybetween 1990 and 2040. Production was projected toincrease primarily in the North and in the West, and togradually decline in the South.
Figures 67 and 68 illustrate projected technological evolutionfor corrugating medium production in the U.S. North andWest, by process. In both regions, production based onrecycled fiber (Process 3) was projected to predominate. Inthe North, production based on recycled fiber was projectedto generally displace production based on virgin-fibersemichemical pulping technology (Processes 1 and 2) withinthe next couple of decades. Production based on virgin-fibermechanical pulping (Process 4) was not projected to obtain asignificant share of total production volume. Similar techno-logical trends were projected for the South, where corrugat-ing medium production was projected to gradually decline;however, production based on virgin-fiber semichemicalpulping was projected to retain a large share of total produc-tion for several decades into the future.
Figure 69 illustrates projected production of solid bleachedboard in the United States, by region. Between 1990 and2040, production was projected to increase by more than60 percent, increasing in all regions by the end of theprojection period. The South was projected to remain thedominant region for production of solid bleached board.However, production in the North was projected to increasesubstantially and to reach a volume nearly one-fourth aslarge as projected production in the South by the year 2040.Production in the West was also projected to increase,particularly beyond the year 2020.
Figures 70 to 72 illustrate projected technological evolutionin solid bleached board production in the U.S. North, South,and West. In all regions, the use of bleached mechanical pulpwas projected to increase; production based on a 30-percentblend of high-yield bleached mechanical pulp (Process 2)was projected to increase in all regions. Process 2 wasprojected to be the primary production technology in theNorth beyond the year 1995 (the year in which such technol-ogy was assumed to be introduced in the NAPAP Model)(Fig. 70). In the South, conventional solid bleached boardtechnology based on 100-percent bleached kraft pulp(Process 1) was projected to remain the dominant productiontechnology throughout most of the projection period, but itwas projected to decline toward the end of the projectionperiod, being replaced by Process 2 in the period 2020–2040(Fig. 71). Technological trends were projected to be similarin the West (Fig. 72). However, production based on30-percent high-yield mechanical pulp (Process 2) wasprojected to eclipse production based on conventional100-percent bleached kraft pulp (Process 1) somewhat earlierin the West than in the South (by around 2010–2020). Near-term constraints on pulpwood supply in the West contribute tothe decline in production based on conventional kraft pulping,and favor earlier substitution of higher yield mechanical pulp.

80
Figure 63—Linerboard production in U.S. North.
Figure 64—Linerboard production in U.S. South.
Figure 65—Linerboard production in U.S. West.
Figure 66—U.S. corrugating medium production.
Figure 67—Corrugating medium production in U.S. North.
Figure 68—Corrugating medium production in U.S. West.
Pro
duct
ion
(x10
t)
6
Year
1990 2000 2010 2020 2030 20400
1
2
3
4
5
6P3(100%Rec)P4(50%Kraft+50%OCC)P5(70%Mech+30%OCC)
Pro
duct
ion
(x10
t)
6
Year1990 2000 2010 2020 2030 2040
0
10
20
30
P1(95%Kraft+5%OCC) P2(70%Kraft+30%OCC)P3(100%Rec) P4(50%Kraft+50%OCC)P5(70%Mech+30%OCC)
40
Pro
duct
ion
(x10
t)
6
Year1990 2000 2010 2020 2030 2040
0
1
2
3
4
P1(95%Kraft+5%OCC) P2(70%Kraft+30%OCC)P3(100%Rec) P4(50%Kraft+50%OCC)P5(70%Mech+30%OCC)
5
Pro
duct
ion
(x10
t)
6
Year
1980 1990 2000 2010 2020 2030 20400
4
8
12Historical North South West
Year
1990 2000 2010 2020 2030 20400
2
4
6
8P
rodu
ctio
n (x
10 t
)6
P1(67%Schem+33%OCC) P2(90%Schem+10%OCC)P3(100%Rec) P4(67%Mech+33%Mix)
Pro
duct
ion
(x10
t)
6
Year
1990 2000 2010 2020 2030 20400
0.5
1.0
1.5
2.0
2.5
3.0
3.5P3(100%Rec) P4(67%Mech+33%Mix)

81
Figure 69—U.S. solid bleached board production.
Figure 70—Solid bleached board production in U.S. North.
Figure 71—Solid bleached board production in U.S. South.
Figure 72—Solid bleached board production in U.S. West.
Figure 73—U.S. recycled board production.
Figure 74—Recovered paper consumption inU.S. paperboard production.
Pro
duct
ion
(x10
t)
6
Year
1960 1970 1980 1990 2000 2010 2020 2030 20400
1
2
3
4
5
6
7
Historical North South West
NAPAP ProjectionsP
rodu
ctio
n (x
10 t
)6
Year
1990 2000 2010 2020 2030 20400
0.4
0.8
1.2
1.6P1(100%Kraft)P2(70%Kraft+30%Mech)
Pro
duct
ion
(x10
t)
6
Year
1990 2000 2010 2020 2030 20400
1
2
3
4
5P1(100%Kraft) P2(70%Kraft+30%Mech)
Year
1990 2000 2010 2020 2030 20400
100
200
300
400
500P1(100%Kraft)P2(70%Kraft+30%Mech)
Pro
duct
ion
(x10
t)
3
Pro
duct
ion
(x10
t)
6
Year
1980 1990 2000 2010 2020 2030 20400
2
4
6
8
10Historical NorthSouth West NAPAP Projections
Year
1970 1980 1990 2000 2010 2020 2030 20400
10
20
30
40
Historical Data NAPAP Projections
Con
sum
ptio
n (x
10 t
)6

82
Figure 73 illustrates projected recycled board production inthe United States, by region. As defined in the NAPAPModel, recycled board excludes recycled linerboard andrecycled corrugating medium. The NAPAP Model projec-tions indicated that production of recycled board wouldincrease by over 40 percent between 1990 and 2040, with theNorth maintaining the largest share of total U.S. production(Fig. 73). Production in the South was projected to graduallydecline, while production in the West was projected toincrease.
Consumption of recovered (recycled) paper in paperboardwas projected to increase steadily throughout the projectionperiod (Fig. 74). The overall utilization rate for recoveredpaper in U.S. paperboard production (tonnes of recoveredpaper consumed per tonne of paperboard output) wasprojected to increase from approximately 30 percent in thelate 1980s to nearly 50 percent in the early part of the 21stcentury and 55 percent by the year 2040.
With projected increased use of recycled fiber and higheryield pulp in U.S. linerboard production, total pulpwoodconsumption in linerboard was projected to increase verygradually in the decades ahead (Fig. 75), with roughly a25-percent projected increase between 1990 and 2020.Pulpwood consumption in linerboard was projected togradually decline toward the end of the projection period.Softwood pulpwood consumption in U.S. linerboard produc-tion was projected to remain relatively constant to the year2010, but then gradually decline. Whereas softwood pulp-wood represented more than 90 percent of pulpwoodconsumed in U.S. linerboard production in 1990, thesoftwood share was projected to decline to roughly half bythe end of the projection period. The decline in the softwoodcomponent reflects projected technological advances inlinerboard production along with adoption of corrugated boxperformance standards based on compression strength, whichwill favor greater use of hardwood.
With very substantial projected increases in recycled fiberuse in corrugating medium (Figs. 67–68), total pulpwoodconsumption in corrugating medium was projected to declinesubstantially in the decades ahead (Fig. 76). Eventually,recycled fiber (mainly OCC) was projected to become theprimary source of fiber in U.S. corrugating medium produc-tion, similar to corrugating medium production in Europeand elsewhere.
Pulpwood consumption in U.S. solid bleached boardproduction was projected to generally increase over theprojection period (Fig. 77), although pulpwood consumptionand production of solid bleached board were both projectedto remain relatively constant for the next two decades.
Construction Paper & Board Production
Figure 78 illustrates NAPAP Model projections of U.S.construction paper & board production, by region. The South
was projected to remain the dominant region for productionof construction paper & board throughout the projectionperiod. Production of construction paper & board in theUnited States was projected to gradually decline, in line withprojected declines in consumption of this product (Fig. 22).
Pulpwood consumption in U.S. construction paper & boardproduction was likewise projected to gradually decline overthe projection period (Fig. 79). Variation in pulpwoodconsumption projections between 1990 and 2000 was due toprojected shifting of production from the South (with higherdensity pulpwood species) to the North (with lower densityspecies).
Market Pulp
Generally, production of bleached softwood chemical marketpulp was projected to decline in both the South and West(Fig. 80); the estimate for 1990 was based on an assumptionof 3 million metric tonnes total production—the actualproduction was probably somewhat higher. The South wasprojected to remain the dominant region in the United Statesfor production of virgin-fiber bleached softwood marketpulp. The projected decline in production of softwoodmarket pulp reflects increased projected use of recycled fiberin paper products, which have traditionally depended onmarket pulp. Production of bleached hardwood chemicalmarket pulp was projected to more than double between1990 and 2040, with production volume in the Northprojected to gradually reach levels in excess of productionvolume in the South (Fig. 81). Most of projected increases indomestic production were for export.
A very substantial increase was projected for production ofrecycled market pulp, with very substantial volumes pro-jected for export (Fig. 82). Projections indicated thatproduction of recycled market pulp would expand in allregions, but primarily in the South. In the NAPAP Model, itwas assumed that recycled market pulp (made from high-grade deinking and pulp substitutes) could be substituted forbleached hardwood or softwood chemical market pulp withappropriate discounts (added costs for the recycled marketpulp substitute). Discounts were set at $55 per tonne tosubstitute for softwood chemical market pulp, and $25 pertonne to substitute for hardwood chemical market pulp(discounts were based on recently reported price differentialsbetween virgin-fiber chemical grade market pulps andrecycled market pulp in the United States; Miller Freeman1992). Figure 83 illustrates projected U.S. production ofdissolving & special alpha pulp, by region. Projectionsindicated that production in the South would increase, butgenerally U.S. production was projected to decline through-out most of the projection period.
Following the projected trend in production of recycledmarket pulp (Fig. 82), a very substantial increase wasprojected in consumption of recovered paper for market pulp
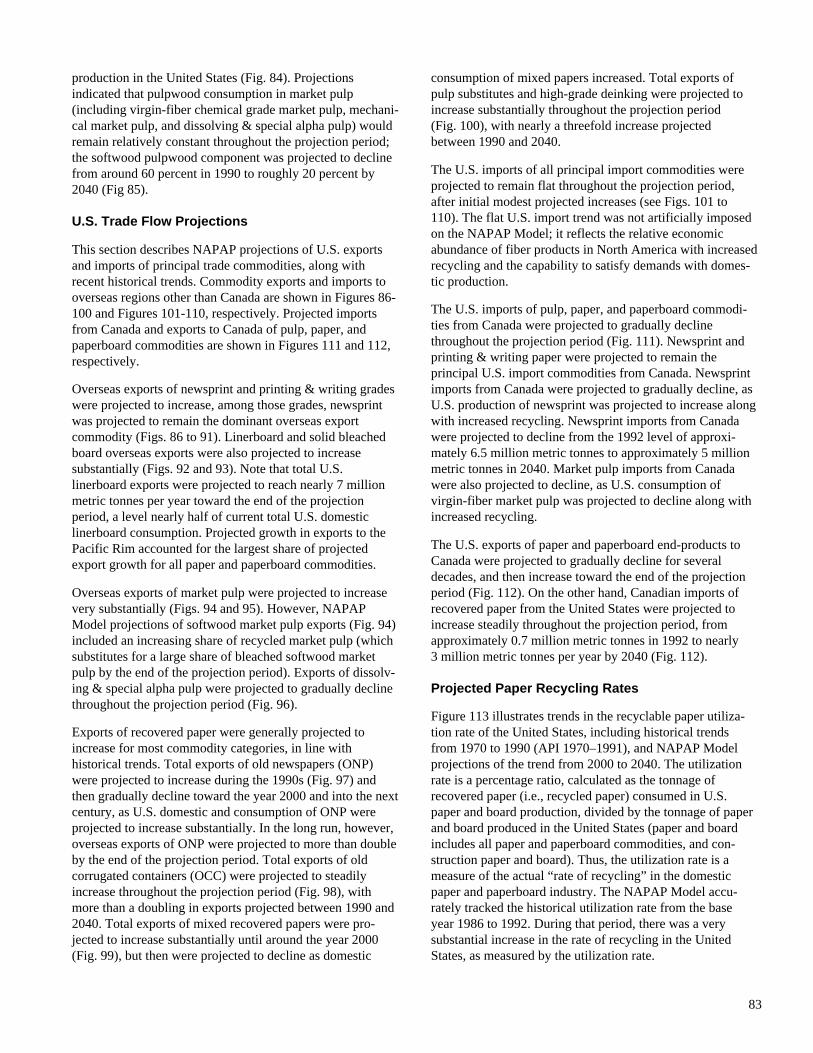
83
production in the United States (Fig. 84). Projectionsindicated that pulpwood consumption in market pulp(including virgin-fiber chemical grade market pulp, mechani-cal market pulp, and dissolving & special alpha pulp) wouldremain relatively constant throughout the projection period;the softwood pulpwood component was projected to declinefrom around 60 percent in 1990 to roughly 20 percent by2040 (Fig 85).
U.S. Trade Flow Projections
This section describes NAPAP projections of U.S. exportsand imports of principal trade commodities, along withrecent historical trends. Commodity exports and imports tooverseas regions other than Canada are shown in Figures 86-100 and Figures 101-110, respectively. Projected importsfrom Canada and exports to Canada of pulp, paper, andpaperboard commodities are shown in Figures 111 and 112,respectively.
Overseas exports of newsprint and printing & writing gradeswere projected to increase, among those grades, newsprintwas projected to remain the dominant overseas exportcommodity (Figs. 86 to 91). Linerboard and solid bleachedboard overseas exports were also projected to increasesubstantially (Figs. 92 and 93). Note that total U.S.linerboard exports were projected to reach nearly 7 millionmetric tonnes per year toward the end of the projectionperiod, a level nearly half of current total U.S. domesticlinerboard consumption. Projected growth in exports to thePacific Rim accounted for the largest share of projectedexport growth for all paper and paperboard commodities.
Overseas exports of market pulp were projected to increasevery substantially (Figs. 94 and 95). However, NAPAPModel projections of softwood market pulp exports (Fig. 94)included an increasing share of recycled market pulp (whichsubstitutes for a large share of bleached softwood marketpulp by the end of the projection period). Exports of dissolv-ing & special alpha pulp were projected to gradually declinethroughout the projection period (Fig. 96).
Exports of recovered paper were generally projected toincrease for most commodity categories, in line withhistorical trends. Total exports of old newspapers (ONP)were projected to increase during the 1990s (Fig. 97) andthen gradually decline toward the year 2000 and into the nextcentury, as U.S. domestic and consumption of ONP wereprojected to increase substantially. In the long run, however,overseas exports of ONP were projected to more than doubleby the end of the projection period. Total exports of oldcorrugated containers (OCC) were projected to steadilyincrease throughout the projection period (Fig. 98), withmore than a doubling in exports projected between 1990 and2040. Total exports of mixed recovered papers were pro-jected to increase substantially until around the year 2000(Fig. 99), but then were projected to decline as domestic
consumption of mixed papers increased. Total exports ofpulp substitutes and high-grade deinking were projected toincrease substantially throughout the projection period(Fig. 100), with nearly a threefold increase projectedbetween 1990 and 2040.
The U.S. imports of all principal import commodities wereprojected to remain flat throughout the projection period,after initial modest projected increases (see Figs. 101 to110). The flat U.S. import trend was not artificially imposedon the NAPAP Model; it reflects the relative economicabundance of fiber products in North America with increasedrecycling and the capability to satisfy demands with domes-tic production.
The U.S. imports of pulp, paper, and paperboard commodi-ties from Canada were projected to gradually declinethroughout the projection period (Fig. 111). Newsprint andprinting & writing paper were projected to remain theprincipal U.S. import commodities from Canada. Newsprintimports from Canada were projected to gradually decline, asU.S. production of newsprint was projected to increase alongwith increased recycling. Newsprint imports from Canadawere projected to decline from the 1992 level of approxi-mately 6.5 million metric tonnes to approximately 5 millionmetric tonnes in 2040. Market pulp imports from Canadawere also projected to decline, as U.S. consumption ofvirgin-fiber market pulp was projected to decline along withincreased recycling.
The U.S. exports of paper and paperboard end-products toCanada were projected to gradually decline for severaldecades, and then increase toward the end of the projectionperiod (Fig. 112). On the other hand, Canadian imports ofrecovered paper from the United States were projected toincrease steadily throughout the projection period, fromapproximately 0.7 million metric tonnes in 1992 to nearly3 million metric tonnes per year by 2040 (Fig. 112).
Projected Paper Recycling Rates
Figure 113 illustrates trends in the recyclable paper utiliza-tion rate of the United States, including historical trendsfrom 1970 to 1990 (API 1970–1991), and NAPAP Modelprojections of the trend from 2000 to 2040. The utilizationrate is a percentage ratio, calculated as the tonnage ofrecovered paper (i.e., recycled paper) consumed in U.S.paper and board production, divided by the tonnage of paperand board produced in the United States (paper and boardincludes all paper and paperboard commodities, and con-struction paper and board). Thus, the utilization rate is ameasure of the actual “rate of recycling” in the domesticpaper and paperboard industry. The NAPAP Model accu-rately tracked the historical utilization rate from the baseyear 1986 to 1992. During that period, there was a verysubstantial increase in the rate of recycling in the UnitedStates, as measured by the utilization rate.
84
Figure 75—Pulpwood consumption inU.S. linerboard production.
Figure 76—Pulpwood consumption inU.S. corrugating medium production.
Figure 77—Pulpwood consumption inU.S. solid bleached board production.
Figure 78—U.S. construction paper & board production.
Figure 79—Pulpwood consumption in U.S.construction paper & board production.
Figure 80—U.S. production of softwoodchemical market pulp, by region.
Year
1990 2000 2010 2020 2030 20400
20
40
60
Con
sum
ptio
n (x
10 m
)6
3 80
100TotalSoftwood
Con
sum
ptio
n (x
10 m
)6
3
Year
1990 2000 2010 2020 2030 20400
3
6
9
Total Softwood
Con
sum
ptio
n (x
10 m
)6
3
Year
1990 2000 2010 2020 2030 20400
5
10
15
20Total Softwood
Year
1990 2000 2010 2020 2030 20400
0.5
1.0
1.5
2.0
North South West
Pro
duct
ion
(x10
t)
6
Year
1990 2000 2010 2020 2030 20400
1
2
3
Con
sum
ptio
n (x
10 m
)6
3
Year
1990 2000 2010 2020 2030 20400
0.5
1.0
1.5
2.0
2.5
3.0
3.5South West1990 estimate
NAPAP Projections
Pro
duct
ion
(x10
t)
6

85
Figure 81—U.S. production of hardwoodchemical market pulp, by region.
Figure 82—U.S. production of market pulpfrom recycled fiber, by region.
Figure 83—U.S. dissolving & special alphapulp production, by region.
Figure 84—Recovered paper consumptionin U.S. market pulp production.
Figure 85—Pulpwood consumption inU.S. market pulp production.
Figure 86—U.S. exports of newsprint,excluding exports to Canada.
Pro
duct
ion
(x10
t)
6
Year
1990 2000 2010 2020 2030 20400
1
2
3
4
5North South West
Year
1990 2000 2010 2020 2030 20400
1
2
3
4
5
6North South West
Pro
duct
ion
(x10
t)
6
Pro
duct
ion
(x10
t)
6
Year
1990 2000 2010 2020 2030 20400
0.2
0.4
0.6
0.8
1.0
1.2South West
Year
1990 2000 2010 2020 2030 20400
2
4
6
8
Con
sum
ptio
n (x
10 t
)6
Year
1990 2000 2010 2020 2030 20400
6
12
18
24Total Softwood
Con
sum
ptio
n (x
10 m
)6
3
Year
1970 1980 1990 2000 2010 2020 2030 20400
1
2
3
4
5Historical Data NAPAP Projections
Exp
orts
(x1
0 t)6

86
Figure 87—U.S. exports of printing & writing paper,excluding exports to Canada.
Figure 88—U.S. exports of coated free sheet paper,excluding exports to Canada.
Figure 89—U.S. exports of uncoated free sheet paper,excluding exports to Canada.
Figure 90—U.S. exports of coated groundwood paper,excluding exports to Canada.
Figure 91—U.S. exports of uncoated groundwood paper,excluding exports to Canada.
Figure 92—U.S. exports of linerboard & othercommodities, excluding exports to Canada.
Exp
orts
(x1
0 t)6
Year
1990 2000 2010 2020 2030 20400
0.4
0.8
1.2Ctd Free Sheet
Unctd Free SheetCtd Groundwood
Unctd Groundwood
Exp
orts
(x1
0 t)3
Year
1980 1990 2000 2010 2020 2030 20400
10
20
30
40
50
60
70
Historical DataNAPAP Projections
Coated free sheet
Year
1980 1990 2000 2010 2020 2030 20400
300
600
900
Historical DataNAPAP Projections
Uncoated free sheet
Exp
orts
(x1
0 t)3
Exp
orts
(x1
0 t)3
Year
1980 1990 2000 2010 2020 2030 20400
40
80
120
Historical Data
NAPAP Projections
Coated groundwood
Exp
orts
(x1
0 t)3
Year
1980 1990 2000 2010 2020 2030 20400
40
80
120
Historical DataNAPAP Projections
Uncoated groundwoodE
xpor
ts (
x10
t)6
Year
1972 1980 1990 2000 2010 2020 2030 20400
1
2
3
4
5
6
7Linerboard and other
Historical DataNAPAP Projections

87
Figure 93—U.S. exports of solid bleached board,excluding exports to Canada.
Figure 94—U.S. exports of softwood chemicalmarket pulp, excluding exports to Canada.
Figure 95—U.S. exports of hardwood chemicalmarket pulp, excluding exports to Canada.
Figure 96—U.S. exports of dissolving & specialalpha pulp, excluding exports to Canada.
Figure 97—U.S. exports of old newspapersincluding exports to Canada.
Figure 98—U.S. exports of old corrugatedcontainers, including exports to Canada.
Exp
orts
(x1
0 t)6
Year
1970 1980 1990 2000 2010 2020 2030 20400
2
4
6
Historica DataNAPAP Projections
Softwood chem mkt pulp
Exp
orts
(x1
0 t)3
Year
1970 1980 1990 2000 2010 2020 2030 2040300
400
500
600
700
800
900
Historical DataNAPAP Projections
Dissolving & alpha pulp
Exp
orts
(x1
0 t)6
Year
1980 1990 2000 2010 2020 2030 20400
1
2
3Historical DataNAPAP Projections
Old newspapers
Exp
orts
(x1
0 t)6
Year
1980 1990 2000 2010 2020 2030 20400
1
2
3
4
5
6
7Old corrugated containers
Historical DataNAPAP Projections
Year
1970 1980 1990 2000 2010 2020 2030 20400
0.5
1.0
1.5
2.0
Historical DataNAPAP Projections
Solid bleached boardE
xpor
ts (
x10
t)6
E
xpor
ts (
x10
t)6
Year
1970 1980 1990 2000 2010 2020 2030 20400
1
2
3
4
5
Historical DataNAPAP Projections
Hardwood chem mkt pulp
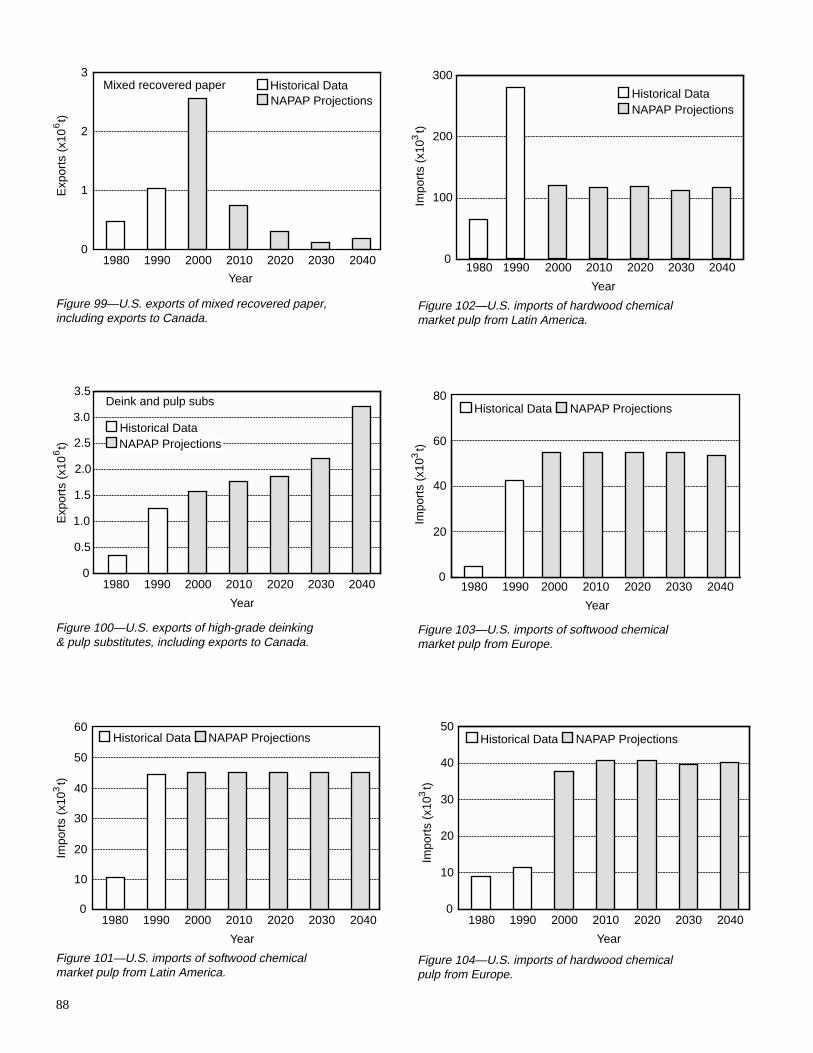
88
Figure 99—U.S. exports of mixed recovered paper,including exports to Canada.
Figure 100—U.S. exports of high-grade deinking& pulp substitutes, including exports to Canada.
Figure 101—U.S. imports of softwood chemicalmarket pulp from Latin America.
Figure 102—U.S. imports of hardwood chemicalmarket pulp from Latin America.
Figure 103—U.S. imports of softwood chemicalmarket pulp from Europe.
Figure 104—U.S. imports of hardwood chemicalpulp from Europe.
Year
1980 1990 2000 2010 2020 2030 20400
1
2
3Historical DataNAPAP Projections
Mixed recovered paper
Exp
orts
(x1
0 t)6
Year
1980 1990 2000 2010 2020 2030 20400
10
20
30
40
50
Impo
rts
(x10
t)
3
Historical Data NAPAP Projections60
Impo
rts
(x10
t)
3
Year
1980 1990 2000 2010 2020 2030 20400
100
200
300
Historical DataNAPAP Projections
Impo
rts
(x10
t)
3
Year
1980 1990 2000 2010 2020 2030 20400
20
40
60
80Historical Data NAPAP Projections
Impo
rts
(x10
t)
3
Year
1980 1990 2000 2010 2020 2030 20400
10
20
30
40
50Historical Data NAPAP Projections
Exp
orts
(x1
0 t)6
Year
1980 1990 2000 2010 2020 2030 20400
0.5
1.0
1.5
2.0
2.5
3.0
3.5Deink and pulp subs
Historical DataNAPAP Projections

89
Figure 105—U.S. imports of uncoated free sheetfrom Latin America.
Figure 106—U.S. imports of coated groundwoodpaper from Europe.
Figure 107—U.S. imports of coated free sheetfrom Pacific Rim.
Figure 108—U.S. imports of uncoated groundwoodpaper from Europe.
Figure 109—U.S. imports of coated free sheetfrom Europe.
Figure 110—U.S. imports of uncoated free sheetfrom Europe.
Impo
rts
(x10
t)
3
Year
1980 1990 2000 2010 2020 2030 20400
20
40
60
80
120 Historical Data NAPAP Projections
100
Impo
rts
(x10
t)
3
Year
1980 1990 2000 2010 2020 2030 2040100
200
300
400
Historical DataNAPAP Projections
500
Impo
rts
(x10
t)
3
Year
1980 1990 2000 2010 2020 2030 20400
100
200
300
400
Historical Data NAPAP Projections500
Impo
rts
(x10
t)
3
Year
1980 1990 2000 2010 2020 2030 20400
50
100
150
200Historical Data NAPAP Projections
Impo
rts
(x10
t)
3
Year
1990 2000 2010 2020 2030 204010
20
30
40
50Historical Data NAPAP Projections
Impo
rts
(x10
t)
3
Year
1980 1990 2000 2010 2020 2030 20400
50
100
150
200
250
300
350Historical DataNAPAP Projections
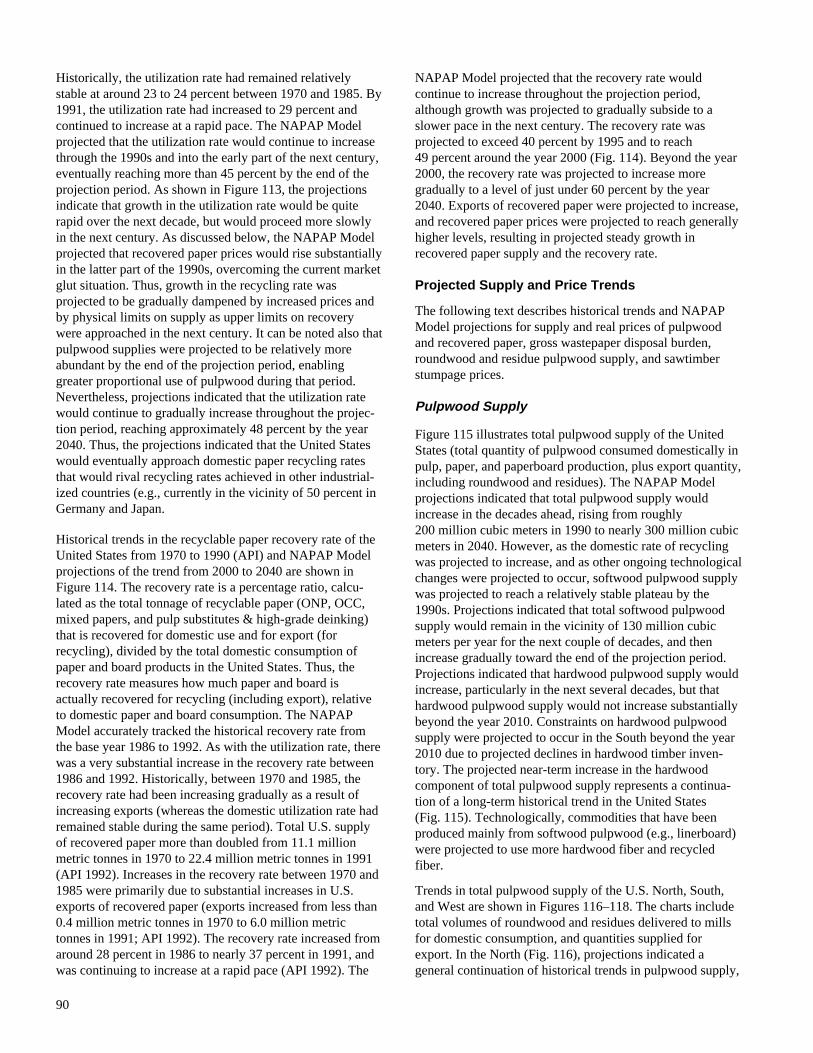
90
Historically, the utilization rate had remained relativelystable at around 23 to 24 percent between 1970 and 1985. By1991, the utilization rate had increased to 29 percent andcontinued to increase at a rapid pace. The NAPAP Modelprojected that the utilization rate would continue to increasethrough the 1990s and into the early part of the next century,eventually reaching more than 45 percent by the end of theprojection period. As shown in Figure 113, the projectionsindicate that growth in the utilization rate would be quiterapid over the next decade, but would proceed more slowlyin the next century. As discussed below, the NAPAP Modelprojected that recovered paper prices would rise substantiallyin the latter part of the 1990s, overcoming the current marketglut situation. Thus, growth in the recycling rate wasprojected to be gradually dampened by increased prices andby physical limits on supply as upper limits on recoverywere approached in the next century. It can be noted also thatpulpwood supplies were projected to be relatively moreabundant by the end of the projection period, enablinggreater proportional use of pulpwood during that period.Nevertheless, projections indicated that the utilization ratewould continue to gradually increase throughout the projec-tion period, reaching approximately 48 percent by the year2040. Thus, the projections indicated that the United Stateswould eventually approach domestic paper recycling ratesthat would rival recycling rates achieved in other industrial-ized countries (e.g., currently in the vicinity of 50 percent inGermany and Japan.
Historical trends in the recyclable paper recovery rate of theUnited States from 1970 to 1990 (API) and NAPAP Modelprojections of the trend from 2000 to 2040 are shown inFigure 114. The recovery rate is a percentage ratio, calcu-lated as the total tonnage of recyclable paper (ONP, OCC,mixed papers, and pulp substitutes & high-grade deinking)that is recovered for domestic use and for export (forrecycling), divided by the total domestic consumption ofpaper and board products in the United States. Thus, therecovery rate measures how much paper and board isactually recovered for recycling (including export), relativeto domestic paper and board consumption. The NAPAPModel accurately tracked the historical recovery rate fromthe base year 1986 to 1992. As with the utilization rate, therewas a very substantial increase in the recovery rate between1986 and 1992. Historically, between 1970 and 1985, therecovery rate had been increasing gradually as a result ofincreasing exports (whereas the domestic utilization rate hadremained stable during the same period). Total U.S. supplyof recovered paper more than doubled from 11.1 millionmetric tonnes in 1970 to 22.4 million metric tonnes in 1991(API 1992). Increases in the recovery rate between 1970 and1985 were primarily due to substantial increases in U.S.exports of recovered paper (exports increased from less than0.4 million metric tonnes in 1970 to 6.0 million metrictonnes in 1991; API 1992). The recovery rate increased fromaround 28 percent in 1986 to nearly 37 percent in 1991, andwas continuing to increase at a rapid pace (API 1992). The
NAPAP Model projected that the recovery rate wouldcontinue to increase throughout the projection period,although growth was projected to gradually subside to aslower pace in the next century. The recovery rate wasprojected to exceed 40 percent by 1995 and to reach49 percent around the year 2000 (Fig. 114). Beyond the year2000, the recovery rate was projected to increase moregradually to a level of just under 60 percent by the year2040. Exports of recovered paper were projected to increase,and recovered paper prices were projected to reach generallyhigher levels, resulting in projected steady growth inrecovered paper supply and the recovery rate.
Projected Supply and Price Trends
The following text describes historical trends and NAPAPModel projections for supply and real prices of pulpwoodand recovered paper, gross wastepaper disposal burden,roundwood and residue pulpwood supply, and sawtimberstumpage prices.
Pulpwood Supply
Figure 115 illustrates total pulpwood supply of the UnitedStates (total quantity of pulpwood consumed domestically inpulp, paper, and paperboard production, plus export quantity,including roundwood and residues). The NAPAP Modelprojections indicated that total pulpwood supply wouldincrease in the decades ahead, rising from roughly200 million cubic meters in 1990 to nearly 300 million cubicmeters in 2040. However, as the domestic rate of recyclingwas projected to increase, and as other ongoing technologicalchanges were projected to occur, softwood pulpwood supplywas projected to reach a relatively stable plateau by the1990s. Projections indicated that total softwood pulpwoodsupply would remain in the vicinity of 130 million cubicmeters per year for the next couple of decades, and thenincrease gradually toward the end of the projection period.Projections indicated that hardwood pulpwood supply wouldincrease, particularly in the next several decades, but thathardwood pulpwood supply would not increase substantiallybeyond the year 2010. Constraints on hardwood pulpwoodsupply were projected to occur in the South beyond the year2010 due to projected declines in hardwood timber inven-tory. The projected near-term increase in the hardwoodcomponent of total pulpwood supply represents a continua-tion of a long-term historical trend in the United States(Fig. 115). Technologically, commodities that have beenproduced mainly from softwood pulpwood (e.g., linerboard)were projected to use more hardwood fiber and recycledfiber.
Trends in total pulpwood supply of the U.S. North, South,and West are shown in Figures 116–118. The charts includetotal volumes of roundwood and residues delivered to millsfor domestic consumption, and quantities supplied forexport. In the North (Fig. 116), projections indicated ageneral continuation of historical trends in pulpwood supply,

91
with projected increases in both softwood and hardwoodpulpwood supply. Likewise, in the South (Fig. 117), projec-tions indicated a continuation of historical growth trends forat least the next couple of decades, although growth inhardwood pulpwood supply was projected to be constrainedbeyond the year 2010. Softwood pulpwood supply wasprojected to increase beyond the year 2010, a period that willcoincide with maturation of extensive pine plantations nowbeing established in the South. In the West (Fig. 118),beginning around 1990, pulpwood supply was projected todecline for the next several decades, reaching a stable leveljust over 20 million cubic meters per year beyond the year2010. The decline in projected pulpwood supply is associ-ated with projected declines in National Forest timberharvest levels (discussed below) and corresponding reduc-tions in volumes of sawmill and plywood mill residues forpulpwood in the West.
Recovered Paper Supply
Figure 119 illustrates trends in total recovered paper supplyof the United States (i.e., total quantity consumed in domes-tic pulp, paper, and paperboard production, plus exportquantity). The supply of all four categories of recoveredpaper (ONP, OCC, mixed recovered papers, and pulpsubstitutes & high-grade deinking [DPS]) has beenincreasing historically; the NAPAP Model projected substan-tial future increases in supply, in line with historical trends.Projections indicated a very rapid continued increase insupply from the late 1980s into the 1990s, until projectedincreases in recovered paper prices dampen domesticdemand in the late 1990s. After rapidly increasing up to theyear 2000, recovered paper supply was projected to increaseat a more gradual pace in the early part of the next centuryand then to increase substantially again toward the end of theprojection period when pulpwood prices were projected toincrease. Thus, by the year 2040, total U.S. recovered papersupply was projected to exceed 80 million metric tonnes peryear (at a recovery rate of nearly 60 percent; see Fig. 114).As has been the case historically, the largest element of U.S.recovered paper supply will continue to be OCC.
Figure 120 shows trends in U.S. domestic consumption andexports of recovered paper. In line with historical trends,projections indicated that exports would account for agrowing share of total U.S. recovered paper supply, particu-larly in the 1990s, when U.S. recovered paper prices wereprojected to remain depressed in the current market glut.Beyond 2000, however, exports of recovered paper wereprojected to recede somewhat as prices were projected toincrease and exports were projected to face stronger competi-tion from U.S. mills for recycled fiber. Domestic consump-tion was projected to continue to increase throughout theprojection period.
Projected trends in domestic consumption of recovered paperwere similar to projected trends in total U.S. supply; Figure
121 shows recovered paper trends by grade (compare Figs.121 and 119). Projected trends in U.S. exports of recoveredpaper were also similar to projected trends in total U.S.supply (compare Figs. 122 and 119), except that exports ofmixed paper were projected to decline in the next centurydue to increased prices and increased domestic consumption.
Projected trends in U.S. supply of each principal category ofrecovered paper by supply region are shown in Figures 123to 126. The NAPAP Model projections tracked the historicaltotal supply trends quite accurately over the 7-year historicalperiod from 1986 to 1992. Projections indicated that supplywould continue to increase for each principal commoditycategory, in line with recent historical trends; the U.S. Northwas generally projected to provide the largest regional shareof total supply. The patterns of projected growth in recoveredpaper supply varied somewhat depending on commoditycategory. Supply of ONP was projected to increase rapidly inline with recent trends until the late 1990s, and then increaseat a more modest pace into the next century (Fig. 123).Similar trends were projected for supply of mixed recoveredpaper (Fig. 125), but with less abrupt inflections in supplygrowth for OCC (Fig. 124) and pulp substitutes and high-grade deinking (Fig. 126).
Real Price Trends for Delivered Pulpwood
Real price trends for delivered pulpwood in U.S. manufactur-ing regions include hardwood and softwood deliveredpulpwood prices in the U.S. North and South, and deliveredsoftwood residue prices in the West. All prices were expressedin constant 1986 dollars per cubic meter of pulpwood.
In the North (Fig. 127), the projections indicated that thedifferential between softwood and hardwood deliveredpulpwood prices would expand for the next two decades,and then gradually narrow beyond the year 2010 and for theremainder of the projection period, as hardwood pulpwoodprices were projected to increase. In the South (Fig. 128), theprojections indicated that the differential between softwoodand hardwood delivered pulpwood prices would disappearby the year 2010, and that on a cubic meter basis, the price ofdelivered hardwood pulpwood would exceed the price ofsoftwood beyond the year 2010. This projection was due toincreased consumption of hardwood pulpwood and projectedconstraints on hardwood pulpwood supply in the Southbeyond the year 2010 due to projected declines in hardwoodtimber inventory in the South during that period. Theprojected relatively low price for softwood pulpwood in theSouth resulted in projected growth in Southern softwoodpulpwood consumption (and supply) toward the end of theprojection period (see Fig. 117).
In the West (Fig. 129), softwood pulpwood prices wereprojected to remain relatively stable, but the projecteddecline of pulpwood supply (Fig. 118) was associated withrelatively small projected growth in paper and paperboardproduction in that region.
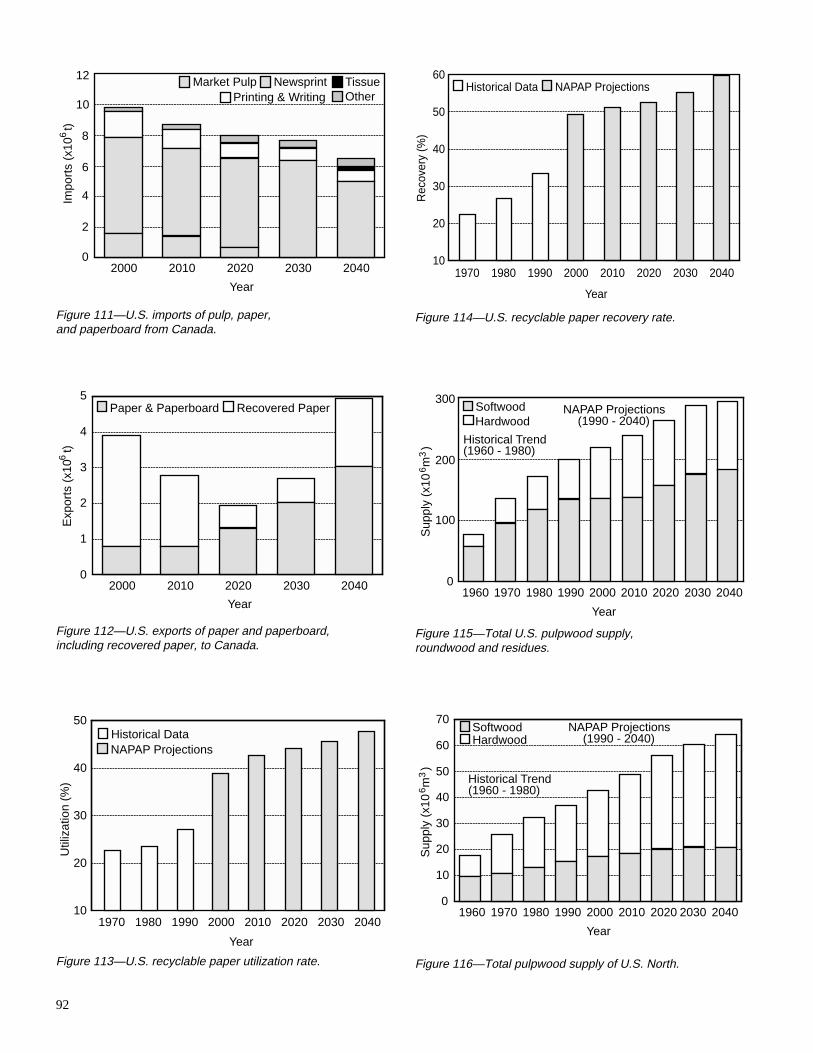
92
Figure 111—U.S. imports of pulp, paper,and paperboard from Canada.
Figure 112—U.S. exports of paper and paperboard,including recovered paper, to Canada.
Figure 113—U.S. recyclable paper utilization rate.
Figure 114—U.S. recyclable paper recovery rate.
Figure 115—Total U.S. pulpwood supply,roundwood and residues.
Figure 116—Total pulpwood supply of U.S. North.
Year
2000 2010 2020 2030 20400
2
4
6
8
10
Impo
rts
(x10
t)
6
Market Pulp Newsprint
Printing & WritingTissueOther
12E
xpor
ts (
x10
t)6
Year
2000 2010 2020 2030 20400
1
2
3
4
5Paper & Paperboard Recovered Paper
Year
1960 1970 1980 1990 2000 2010 2020 2030 20400
100
200
300NAPAP Projections
(1990 - 2040)S
uppl
y (x
10 m
)6
3
Historical Trend(1960 - 1980)
SoftwoodHardwood
Sup
ply
(x10
m )
6
3
Year
1960 1970 1980 1990 2000 2010 2020 2030 20400
10
20
30
40
50
60
70SoftwoodHardwood
NAPAP Projections(1990 - 2040)
Historical Trend(1960 - 1980)
Year
Util
izat
ion
(%)
1970 1980 1990 2000 2010 2020 2030 204010
20
30
40
50Historical DataNAPAP Projections
Year
Rec
over
y (%
)
1970 1980 1990 2000 2010 2020 2030 204010
20
30
40
50
60Historical Data NAPAP Projections
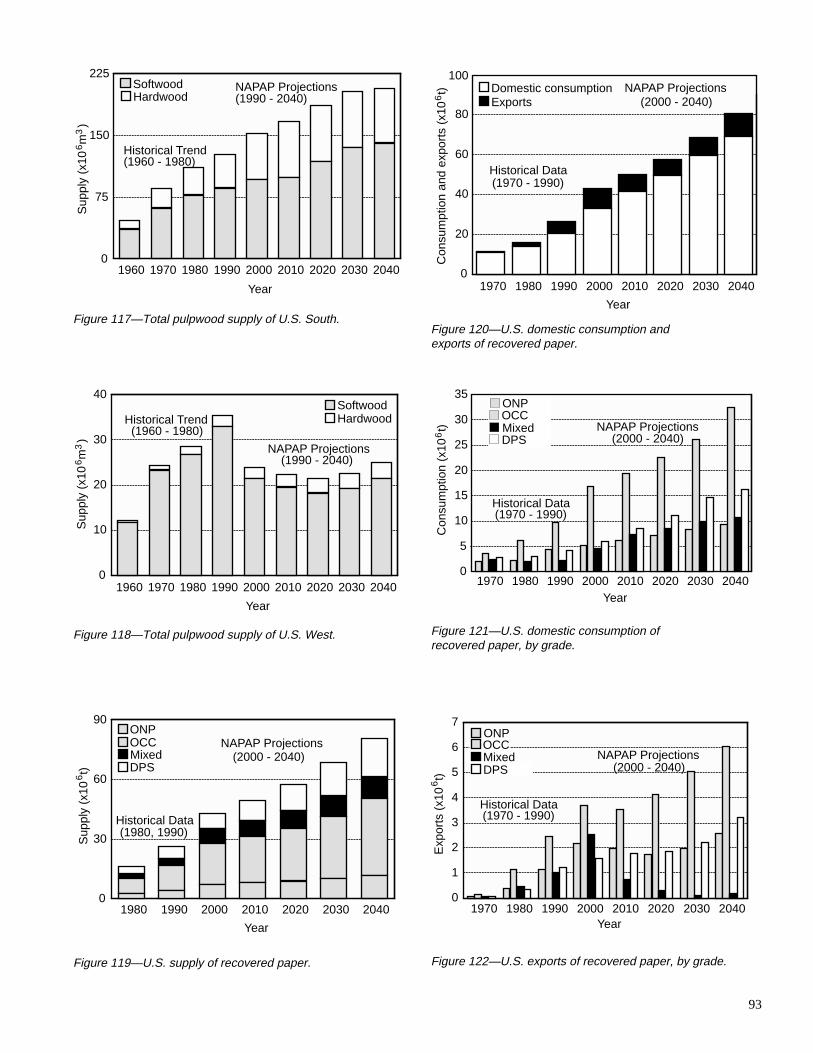
93
Figure 120—U.S. domestic consumption andexports of recovered paper.
Figure 121—U.S. domestic consumption ofrecovered paper, by grade.
Figure 122—U.S. exports of recovered paper, by grade.
Sup
ply
(x10
m )
6
3
Year
1960 1970 1980 1990 2000 2010 2020 2030 20400
75
150
225SoftwoodHardwood
Historical Trend(1960 - 1980)
NAPAP Projections(1990 - 2040)
Sup
ply
(x10
m )
6
3
Year
1960 1970 1980 1990 2000 2010 2020 2030 20400
10
20
30
40SoftwoodHardwood
NAPAP Projections(1990 - 2040)
Historical Trend(1960 - 1980)
2030 2040
Year
1980 1990 2000 2010 20200
30
60
90ONPOCCMixedDPS
Sup
ply
(x10
t)
6
NAPAP Projections(2000 - 2040)
Historical Data(1980, 1990)
Figure 117—Total pulpwood supply of U.S. South.
Figure 118—Total pulpwood supply of U.S. West.
Figure 119—U.S. supply of recovered paper.
Year
1970 1980 1990 2000 2010 2020 2030 20400
20
40
60
80
Domestic consumptionExports
Historical Data(1970 - 1990)
NAPAP Projections(2000 - 2040)
Con
sum
ptio
n an
d ex
port
s (x
10 t
)6
100
Year1970 1980 1990 2000 2010 2020 2030 2040
0
5
10
15
20
25
30
35
Historical Data(1970 - 1990)
NAPAP Projections(2000 - 2040)
Con
sum
ptio
n (x
10 t
)6
OCCONP
MixedDPS
Year1970 1980 1990 2000 2010 2020 2030 2040
0
1
2
3
4
5
6
7
Historical Data(1970 - 1990)
NAPAP Projections(2000 - 2040)
Exp
orts
(x1
0 t)6
ONPOCCMixedDPS

94
Figure 123—U.S. supply of old newspaper, by region.
Figure 124—U.S. supply of old corrugated containers,by region.
Figure 125—U.S. supply of mixed papers, by region.
Year
1980 1990 2000 2010 2020 2030 20400
4
8
12Historical NorthSouth West
NAPAP Projections
HistoricalData (API)
Sup
ply
(x10
t)
6
Sup
ply
(x10
t)
6
Year
1980 1990 2000 2010 2020 2030 20400
10
20
30
40Historical NorthSouth West NAPAP Projections
HistoricalData (API)
Sup
ply
(x10
t)
6
Year
1980 1990 2000 2010 2020 2030 20400
5
10
15
20NAPAP Projections
HistoricalData (API)
Historical NorthSouth West
Figure 126—U.S. supply of high-grade deinking & pulpsubstitutes, by region.
Figure 127—Real prices for pulpwood roundwoodfor U.S. North.
Figure 128—Real prices for pulpwood roundwoodfor U.S. South.
Year
1970 1980 1990 2000 2010 2020 2030 20400
10
20
30
40
50
Historical Trend(1970 - 1990)
NAPAP Projections(2000 - 2040)
Rea
l pric
e ($
/m )3
SoftwoodHardwood
Sup
ply
(x10
t)
6
Year
1980 1990 2000 2010 2020 2030 20400
4
8
12NAPAP Projections
HistoricalData (API)
Historical NorthSouth West
Year
1970 1980 1990 2000 2010 2020 2030 20400
10
20
30
50
Rea
l pric
e ($
/m )3
Historical Trend(1970 - 1990)
NAPAP Projections(2000 - 2040)
SoftwoodHardwood
40

95
In general terms, pulpwood prices were projected to remainrelatively stable well into the next century, particularly forsoftwood pulpwood in the South. The projected relativestability in pulpwood prices is due in large part to theprojected impact of increased paper recycling and corre-sponding modest growth rates for pulpwood consumption.
Real Prices for Recovered Paper
Trends for real prices for recovered paper by region areshown for ONP (Fig. 130), OCC (Fig. 131), mixed recoveredpapers (Fig. 132), and pulp substitutes & high-gradedeinking Fig. 133). All prices were expressed in constant1986 dollars per metric tonne. The projections generallyindicated that although the current glut in recovered papermarkets may last for a number of years, eventually prices forall recovered paper commodities will rebound, with signifi-cant upturns projected for most commodity prices in thedecades ahead. Projected increases in recovered paper pricesare expected to occur, given the substantial ongoing in-creases in consumption of recovered paper (i.e., increasingdemand) and the fact that supplies of recovered paperresources are ultimately limited (e.g., by paper and paper-board consumption levels and by maximum feasible recov-ery rates, as defined in the NAPAP Model).
In the case of ONP, for example, the projections indicatedthat a substantial increase in ONP prices would occur duringthe 1990s (Fig. 130). Prices were projected to reach levelshigher than historical real price levels. Prices for OCC werealso projected to increase in the mid-1990s and into the nextcentury, reaching levels above the peaks of historical OCCprices (Fig. 131). Mixed recovered paper prices wereprojected to remain in a glut market for the next couple ofdecades, with very low prices, but then eventually reboundbeyond the year 2005 (Fig. 132). A stable trend was pro-jected for the prices of pulp substitutes & high-gradedeinking, at levels somewhat lower than historical levels(Fig. 133).
The projected trends in prices for recovered paper commodi-ties help to explain many of the technological changesprojected by the NAPAP Model. For example, the ongoingmarket glut (depressed prices due to oversupply) favorsexpansion of recycling capacity to utilize relatively cheapand abundant recovered paper resources. In the long runhowever, the projected upturn in recovered paper pricesresults in less economic incentive for expansion of recyclingcapacity, which explains the projected leveling of thedomestic recyclable paper utilization rate later in theprojection period (see Fig. 113); in turn, this helps to explainthe projected long-run growth in domestic pulpwoodconsumption (e.g., see Fig. 117, Southern pulpwood supply).As recovered paper prices were projected to eventually reachhigher levels, the economic incentive for expansion ofrecycling capacity was reduced, resulting in projected long-run expansion of production capacity using processes basedon virgin-fiber resources (discussed previously).
Gross Wastepaper Disposal Burden
The gross wastepaper disposal burden is calculated as thetotal tonnage of domestic paper and board consumptionminus the tonnage of paper and board recovered for recy-cling (for domestic use and export). The actual net discardvolume of wastepaper (e.g., that which must be landfilled orincinerated) is somewhat less than the gross disposal burdenbecause some domestic paper and board consumption goesinto long-term storage (e.g., paper in books) and some isdisposed of by other means (e.g., flushed into sewagesystems). However, the gross wastepaper disposal burdenprovides a measure of the total volume of paper and paper-board that must be ultimately discarded; it is equivalent tothe volume of paper and board consumption that is notrecovered for recycling.
The projected increase in the domestic utilization of recov-ered paper (Fig. 113), along with the increased export ofrecovered paper (Fig. 122), would be expected to result in adecrease in the wastepaper disposal burden. The historicaldata show that the gross wastepaper disposal burden hasbeen increasing over the past two decades (Fig. 134).However, in the past few years, it has declined slightly fromthe peak level reached just before 1990. The NAPAP Modelprojections indicated that the gross wastepaper disposalburden would continue to decline through the mid-1990s,and then level off. The wastepaper disposal burden was thenprojected to gradually increase beyond the year 2000.Generally, the gross wastepaper disposal burden wasprojected to remain in the range of roughly 45 to 55 millionmetric tonnes per year, throughout most of the projectionperiod, climbing to approximately 55 million metric tonnesper year toward the end of the projection period.
In the future, it is likely that the growing wastepaper disposalburden will be managed much more efficiently than it istoday. Increased incineration and derivation of fuels fromnonrecoverable (or nonrecyclable) categories of wastepaper,and increased use of low-quality wastepaper in newnonpaper products, are likely to become important elementsof waste reduction strategies in the future, reducing burdenson landfills. As discussed previously, paper that can berecovered and recycled into paper products (recyclablepaper) is likely to increase substantially in use and value,and will therefore contribute substantially to amelioratinga large share of the future paper disposal burden in theUnited States.
Roundwood and Residue Pulpwood Supply
Figure 135 illustrates NAPAP Model projections of round-wood and residue pulpwood supply for the United States(total quantity of pulpwood consumed domestically in pulp,paper, and paperboard production, plus export quantity);projections for the U.S. North, South, and West are shown inFigures 136, 137, and 138, respectively.

96
Historically, wood residues from lumber and plywood millshave provided an increasing share of total pulpwood supplyin the United States, reaching approximately 40 percent oftotal supply by the late 1980s. Several decades ago, residuesaccounted for less than 20 percent of total pulpwood supply.As shown in Figure 135, projections indicated that mostfuture growth in U.S. pulpwood supply would be providedby roundwood (i.e., timber harvest). The pulpwood residuesupply was projected to remain relatively constant through-out the projection period, while roundwood pulpwood supplywas projected to increase. Residue output of the lumber andplywood sectors, along with lumber and plywood produc-tion, were projected by the TAMM/ATLAS model (projec-tions discussed below). Although total lumber and plywoodproduction was projected to grow in the future, improve-ments in product recovery were projected to result in lessresidue output per unit of lumber and plywood produced.
Likewise, the residue component of pulpwood supply in theU.S. North was projected to remain relatively constantthroughout the projection period (Fig. 136); roundwoodpulpwood supply was projected to increase. In the South,roundwood pulpwood supply was projected to increasethroughout the projection period, although modest increasesin residue supply were also projected (Fig. 137). In the West,roundwood pulpwood supply was projected to remainrelatively constant, but residue supply was projected todecline for several decades (Fig. 138). Improvements inlumber and plywood production efficiency, coupled withprojected declines in National Forest timber harvests, wereprojected to substantially reduce the volumes of woodresidues available for pulpwood in the West. Pulpwoodsupply was projected to increase again only toward the endof the projection period.
Sawtimber Stumpage Prices
The TAMM/ATLAS model (linked to NAPAP Model)provided projections of real prices for softwood sawtimberstumpage (in constant 1982 dollars per thousand board feet,log scale). Figure 139 illustrates the projected softwoodsawtimber stumpage prices for the U.S. North, South, andWest (TAMM run LR125).
Projections indicated that very substantial increases wouldoccur in softwood sawtimber stumpage prices during thenext two decades in the South and West, followed by relativestability in stumpage prices toward the end of the projectionperiod. In the North, softwood sawtimber stumpage priceswere projected to increase steadily throughout the projectionperiod, eventually reaching levels close to stumpage prices inthe West.
Real prices for softwood sawtimber stumpage were projectedto nearly double in the South between 1990 and 2010. Amore rapid initial increase in sawtimber stumpage prices wasprojected in the West, although stumpage prices wereprojected to begin leveling out in the West beyond the year2010 (Fig. 139).
Since the 1989 RPA Assessment, adjustments were made tothe TAMM/ATLAS model, including introduction of anassumption that National Forest timber harvest levels in allregions would decline very substantially in the decadesahead. Other TAMM/ATLAS adjustments since the Assess-ment included higher volumes of softwood lumber andplywood demand in the United States (due to adjustment ofend-use factors in housing), lower Canadian lumber produc-tion (due to constraints on lumber production in BritishColumbia and Interior Canadian region, reflecting a move tolower allowable cuts in those regions, lower private indus-trial sawtimber harvests in the U.S. West (Pacific Southwestand Northern Rockies, reflecting limits on regional timberinventories), increased imports of softwood lumber tosecondary processing facilities in the Northwest, and lowerprojections of softwood log exports from the Pacific North-west. The net effect of the TAMM/ATLAS adjustments wasto project a more constrained timber supply and demandsituation, particularly for softwood sawtimber in the UnitedStates. Although the current analysis projected very substan-tial increases in recycling, which will extend pulpwoodsupplies, the other adjustments (particularly the set-aside oftimber on National Forests) have an offsetting impact onprojected sawtimber markets. Thus, a very substantialincrease in softwood sawtimber stumpage prices wasprojected to occur, particularly in the South and the West,during the next two decades, despite the benefits of increasedrecycling.
Projected Lumber, Plywood, and OSB Production
Imports of softwood lumber are mainly from Canada (around99 percent of total (Fig. 140)). The projections indicated thatgrowth in U.S. softwood lumber production would beconstrained in the next two decades, partly due to projectedincreases in sawtimber stumpage prices in the West andSouth. Total U.S. softwood lumber production was projectedto remain relatively flat for the next two decades, and thengradually increase through the remainder of the projectionperiod (Fig. 140). Imports of softwood lumber (mainly fromCanada) were projected to increase for the next two decades,but eventually decline in the latter half of the projectionperiod.
Figure 141 illustrates TAMM/ATLAS projections of U.S.production of softwood plywood and oriented strandboard(OSB). In recent decades, softwood plywood has been thedominant category of structural wood panel product pro-duced in the United States. However, in the last decade, OSBhas gained a substantial share of the market, as a substitutefor softwood plywood. Technologically, softwood plywoodproduction generally requires softwood sawtimber, whereasOSB can be made from a wider range of species (includinghardwoods) and from pulpwood-quality logs. Thus, assoftwood sawtimber prices were projected to increasesubstantially in the decades ahead, U.S. structural panelproduction was projected to shift toward greater OSBproduction. The projections were in line with historical

97
trends of the past decade. Projections indicated that OSBproduction in the United States would eventually account fora larger share of total structural panel production than doessoftwood plywood.
Projected Timber Trends
Trends were projected for both timber harvest (Figs. 142–150) and timber inventory (Figs. 151 and 152).
Timber Harvest
Figures 142 to 147 illustrate TAMM/ATLAS projections oftimber harvest trends for softwood and hardwood timber inthe U.S. North, South, and West, including sawtimber andnon-sawtimber harvest. The non-sawtimber componentincludes pulpwood roundwood harvest. The sawtimbercomponent is timber used primarily for lumber or plywoodproduction, although a substantial share of that wood is alsorecovered as pulpwood residues from lumber and plywoodproduction. In the North, for both softwood and hardwood,the non-sawtimber component of timber harvest wasprojected to remain larger and to grow more substantiallythan the sawtimber component (Figs. 142 and 143). Hard-wood timber harvest was projected to remain much greaterthan softwood timber harvest in the North, reflecting therelative abundance and greater utilization of hardwoodtimber in the North (note that Figures 142 and 143 usedifferent scales).
Softwood sawtimber harvest was projected to increasesubstantially in the South, with the largest projected increasebetween 2010 and 2030 (Fig. 144). Modest growth wasprojected for softwood non-sawtimber harvest in the South.In contrast, hardwood non-sawtimber harvest was projectedto increase substantially in the South for the next couple ofdecades, largely due to projected increases in hardwoodpulpwood consumption (Fig. 145). However, beyond theyear 2010, hardwood non-sawtimber harvest was projectedto remain relatively constant due to projected constraints onhardwood pulpwood supply in the South (associated withprojected declines in hardwood timber inventory in theSouth). Hardwood sawtimber harvest was projected toincrease gradually in the South.
In the West, sawtimber was projected to remain the largestcomponent of softwood timber harvest. However, softwoodnon-sawtimber harvest was projected to gradually increasethroughout the projection period, while softwood sawtimberharvest was projected to decrease for several decades(Fig. 146). The decline in softwood sawtimber harvest in theWest reflects a projected decline in National Forest timberharvest levels. Hardwood represents a much smaller compo-nent of timber harvest than does softwood in the West.Hardwood timber harvest in the West was projected toincrease gradually, primarily in the non-sawtimber compo-nent (Fig. 147).
Figure 148 illustrates TAMM/ATLAS projections of totalU.S. timber harvest, including softwood and hardwood. Bothsoftwood and hardwood timber harvest levels were projectedto increase, although the level of softwood timber harvestwas projected to remain relatively flat until around 2010, andthen gradually increase. Hardwood timber harvest wasprojected to increase steadily throughout the projectionperiod, but remain less than softwood timber harvest.
Figure 149 illustrates TAMM/ATLAS projections of totalU.S. timber harvest by region. Total timber harvest wasprojected to increase substantially in both the North and theSouth between 1990 and 2040. In the West, timber harvestwas projected to decline by about one-fifth in the nextdecade, but then gradually return to current levels toward theend of the projection period. Generally, the projectionsindicated a substantial shift in the geographic proportions oftimber harvest, from the West to the North and South. Thepattern of this shift follows recent historical trends.
Figure 150 illustrates TAMM/ATLAS projections of totalU.S. timber harvest by timberland ownership category. Theanalysis currently assumes that National Forest timberharvest levels in all regions will decline over the nextdecade, and then stabilize at lower levels for the remainderof the projection period. Those assumptions reflect a viewthat timber harvesting on the National Forests will besignificantly reduced to preserve habitat for endangeredspecies, to preserve integrity of forest ecosystems, and tosatisfy public demands for maintenance of scenic andrecreational areas on the National Forests. The projecteddecline in National Forest timber harvests is part of anongoing trend that can be traced to the last decade. Timberharvest on other public timberlands (state and Federal) wasassumed to remain fairly constant throughout the projectionperiod. Whereas public timberlands provided nearly20 percent of total U.S. timber harvest in 1990, projectionsindicated that public timberlands would provide closer to10 percent toward the end of the projection period. Theprojections indicated that increases in timber harvest willoccur primarily on privately owned timberland and forestindustry lands. The largest share of U.S. timber harvest, andthe largest growth in timber harvest, was projected to occuron “other private” (nonindustrial) timberlands. Timberharvest on forest industry land was projected to declineslightly until around 2010, and then increase gradually.
Timber Inventory
Figures 151 and 152 illustrate TAMM/ATLAS projections oftimber growing stock inventory on private timberland in theUnited States (public timberlands and other noncommercialforest lands are excluded from the figures). Timber growingstock inventory on private timberland was projected toincrease gradually throughout the projection period. Inventoryon private timberland was projected to increase in the Westand the North, and to remain relatively constant in the South.

98
Figure 132—Mixed recovered paper prices, by region.
Figure 133—Pulp substitutes & high gradedeinking prices, by region.
Figure 134—U.S. gross wastepaper disposal burden (paperand board consumption minus recyclable paper recovery).
Figure 129—Real prices for softwood residuesfor U.S. West.
Figure 130—Old newspaper prices, by region.
Figure 131—Old corrugated container prices, by region.
Rea
l pric
e ($
/m )3
Year
1980 1990 2000 2010 2020 2030 20400
10
20
30
40
50
60
Historical TrendNAPAP Projections
Pric
e ($
/t)
Year
1980 1990 2000 2010 2020 2030 2040100
200
300
Historical Trend(1980 - 1990)
NAPAP Projections(2000 - 2040)
400
NorthSouthWest
Year
Pric
e ($
/t)
1980 1990 2000 2010 2020 2030 20400
25
50
75
100
125
150
175
Historical Trend(1980 - 1990)
NAPAP Projections(2000 - 2040)
NorthSouthWest
Pric
e ($
/t)
Year
1980 1990 2000 2010 2020 2030 204010
40
70
100NAPAP Projections(2000 - 2040)
Historical Trend(1980 - 1990)
NorthSouthWest
Year
Pric
e ($
/t)
1980 1990 2000 2010 2020 2030 20400
75
150
225NorthSouthWest
Historical Trend(1980 - 1990)
NAPAP Projections(2000 - 2040)
Year
1970 1980 1990 2000 2010 2020 2030 204020
30
40
50
60Historical DataNAPAP Projections
Was
tepa
per
(x10
t)
6

99
Figure 135—Projected U.S. pulpwood supply,roundwood and residues.
Figure 136—Projected pulpwood supply, roundwoodand residues, for U.S. North.
Figure 137—Projected pulpwood supply, roundwoodand residues, for U.S. South.
Figure 138—Projected pulpwood supply, roundwoodand residues, for U.S. West.
Figure 139—Projected softwood sawtimber stumpageprices (constant 1982 dollars per thousand board feet),by region (TAMM/ATLAS projections).
Figure 140—Projected U.S. softwood lumber production andimports, mainly from Canada (TAMM/ATLAS projections).
Year
1990 2000 2010 2020 2030 20400
100
200
300Residues Roundwood
Sup
ply
(x10
m )
6
3S
uppl
y (x
10 m
)6
3
Year
1990 2000 2010 2020 2030 20400
10
20
30
40
50
60
70Residues Roundwood
Sup
ply
(x10
m )
6
3
Year
1990 2000 2010 2020 2030 20400
10
20
30
40Residues Roundwood
Sup
ply
(x10
m )
6
3
Year1990 2000 2010 2020 2030 2040
0
75
150
225Residues Roundwood
Year
Pric
e (1
982
$)
1990 2000 2010 2020 2030 20400
100
200
300North South West
Year
Lum
ber
(x10
9 bo
ard
feet
)
1990 2000 2010 2020 2030 20400
20
40
60Production Imports

100
Figure 141—Projected U.S. softwood plywood andoriented strandboard (OSB) production (3/8-in. basis)(TAMM/ATLAS projections).
Figure 142—Projected softwood timber harvest ofU.S. North (TAMM/ATLAS projections).
Figure 143—Projected hardwood timber harvest ofU.S. North (TAMM/ATLAS projections).
Figure 144—Projected softwood timber harvestof U.S. South (TAMM/ATLAS projections).
Figure 145—Projected hardwood timber harvestof U.S. South (TAMM/ATLAS projections).
Figure 146—Projected softwood timber harvestof U.S. West (TAMM/ATLAS projections).
Year
Pro
duct
ion
(x10
9 ft2
)
1990 2000 2010 2020 2030 20400
5
10
15
20
25Softwood Plywood OSB
Year
1990 2000 2010 2020 2030 20400
5
10
15
20
25
30
35Sawtimber Non-sawtimberSoftwood
Tim
ber
(x10
m )
6
3T
imbe
r (x
10 m
)6
3
Year
1990 2000 2010 2020 2030 20400
20
40
60
80
100
120
140
Sawtimber Non-sawtimber
Hardwood
Tim
ber
(x10
m )
6
3
Year
1990 2000 2010 2020 2030 204040
60
80
100
120
140
Softwood160
SawtimberNon-sawtimber
Tim
ber
(x10
m )
6
3
Year
1990 2000 2010 2020 2030 204010
20
30
40
50
60
70
80Hardwood
SawtimberNon-sawtimber
Tim
ber
(x10
m )
6
3
Year
1990 2000 2010 2020 2030 20400
20
40
60
80
100
120
140Sawtimber Non-sawtimberSoftwood
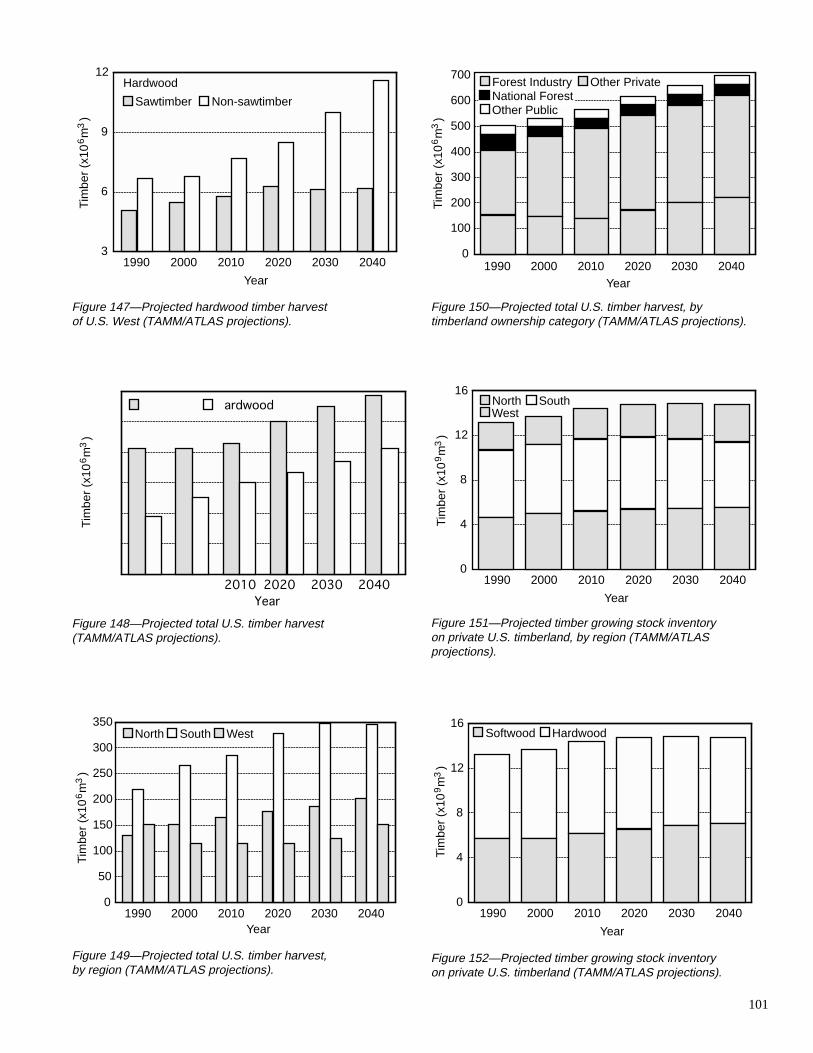
101
Figure 150—Projected total U.S. timber harvest, bytimberland ownership category (TAMM/ATLAS projections).
Figure 151—Projected timber growing stock inventoryon private U.S. timberland, by region (TAMM/ATLASprojections).
Figure 152—Projected timber growing stock inventoryon private U.S. timberland (TAMM/ATLAS projections).
Figure 147—Projected hardwood timber harvestof U.S. West (TAMM/ATLAS projections).
Figure 148—Projected total U.S. timber harvest(TAMM/ATLAS projections).
Figure 149—Projected total U.S. timber harvest,by region (TAMM/ATLAS projections).
Tim
ber
(x10
m )
6
3
Year
1990 2000 2010 2020 2030 20403
6
9
12
Sawtimber Non-sawtimber
HardwoodT
imbe
r (x
10 m
)6
3
Year2010 2020 2030 2040
ardwoodT
imbe
r (x
10 m
)6
3
Year1990 2000 2010 2020 2030 2040
0
100
200
300
400
500
600
700Forest Industry Other PrivateNational ForestOther Public
Year
1990 2000 2010 2020 2030 20400
4
8
12
16North SouthWest
Tim
ber
(x10
m )
9
3T
imbe
r (x
10 m
)9
3
Year
1990 2000 2010 2020 2030 20400
4
8
12
16Softwood Hardwood
Tim
ber
(x10
m )
6
3
Year1990 2000 2010 2020 2030 2040
0
50
100
150
200
250
300
350North South West

102
Hardwood timber inventory on private timberland wasprojected to remain relatively constant, while softwoodtimber inventory was projected to gradually increase.
Projected Employment Trendsof Pulp and Paper Sector
Figure 153 illustrates employment trends in U.S. pulp, paper,and paperboard mills, showing historical data on totalemployment from the 1970s to 1985, and NAPAP Modelprojections of employment by region from 2000 to 2040.The projections were derived by applying an assumption of2 percent annual growth in labor productivity and real wagerates to NAPAP Model labor input projections. In line withhistorical trends, the projections indicated that employmentlevels will gradually decline in the decades ahead, despiteprojected increases in pulp, paper, and paperboard produc-tion. Regionally, employment levels were projected togradually decline in the North and West, and remain rela-tively stable in the South. The projections indicated that theSouth will gradually gain in its share of total employment inthe pulp and paper sector.
ConclusionsIn general, results of this analysis led to the conclusion thatrapid increases will occur in U.S. paper recycling rates in the1990s, in line with current trends, followed by more gradualincreases in subsequent decades, as a result of the competi-tive evolution of fiber markets and pulp and paper technol-ogy. Rapid increases in recycling rates and export ofrecovered paper in the 1990s will result in recovery from thecurrent market glut, with projected increases in mostrecovered paper commodity prices, particularly for oldnewspaper and old corrugated containers. The utilization rateof recyclable paper in the United States will eventuallyexceed 45 percent toward the end of the projection period.The recovery rate will increase to around 49 percent by theyear 2000 and climb to nearly 60 percent by the year 2040.
With more abundant fiber resources (due to increasedrecycling), paper and paperboard consumption in the UnitedStates and production of pulp, paper, and paperboardcommodities were projected to increase very substantially inthe decades ahead. Exports of paper and paperboard productswere also projected to grow very substantially, while importswere projected to generally decline (particularly importsfrom Canada). Thus, although recycling rates were projectedto increase, total consumption and export of pulpwood(pulpwood supply) was projected to increase in the decadesahead. Delivered pulpwood prices were projected to remainfairly stable in both the U.S. North and South. Technologicalchanges and market conditions will favor more use ofhardwood pulpwood, but use of softwood pulpwood will alsoincrease toward the end of the projection period.
In the context of increased paper recycling, lumber produc-tion and structural wood panel production will increase.However, increased demand for sawtimber, coupled withprojected declines in timber harvest on National Forests willresult in substantial increases in softwood sawtimberstumpage prices, with roughly a doubling (in constantdollars) of real stumpage prices in the South and Westbetween 1990 and 2010. Timber harvest in the United Stateswill continue to shift from the West to the South and North.The bulk of timber harvest in the future will be on privatenonindustrial timberland. Overall timber growing stockinventory on private timberland in the United States willremain relatively stable, although some declines in inventorywill occur in the South for hardwoods.
Implications of Results
The implications of results are discussed in the context ofquestions about specific timber resources.
Will increased paper recycling extend timber resources?
Yes, results indicate that increased recycling will extend thetimber resources of the United States, particularly pulpwood.In comparison with results of the 1989 RPA Assessment, thisanalysis projected slower growth in overall timber harvestand less increase in pulpwood prices, primarily as a result ofhigher projections of paper recycling rates.
Will paper recycling eliminate future U.S. timber supplyproblems?
No, although increased recycling will improve the situation,the United States faces serious timber supply problems in thedecades ahead, particularly for softwood sawtimber. Figures154 and 155 illustrate current projections of National Foresttimber harvest levels, and compares these projections tothose of the 1989 RPA Assessment Base scenario. The 1989RPA Assessment Base scenario had assumed much higherfuture harvest levels on the National Forests; most harvestreduction was at the expense of projected softwood sawtim-ber harvest in the West. Other adjustments in data assump-tions since the 1989 RPA included higher volumes ofsoftwood lumber and plywood consumption in the UnitedStates per unit of new housing, lower Canadian lumberproduction, lower private industrial sawtimber harvests in theU.S. West, increased imports of softwood lumber, andreduced softwood log exports from the Pacific Northwest.Consequently, although projected U.S. recycling rates werehigher and growth in timber harvest lower than earlierprojections, the conclusion that increased recycling willcause a stabilization in softwood sawtimber markets is nolonger warranted (cf. Ince 1990). Although deliveredpulpwood prices will increase somewhat in the North andSouth, particularly for hardwoods, the rate of increase inpulpwood prices is not nearly as substantial as the projectedrate of increase in softwood sawtimber stumpage prices.

103
Increased paper recycling will extend fiber resources, andwill contribute to stabilization of pulpwood prices andgrowth in the pulp and paper sector, but increased paperrecycling will not be sufficient to compensate for projectedreductions in National Forest timber harvest levels and otherrecent adjustments to the analysis.
What aspects of the future timber supply and demandsituation will remain problematic?
Supplies of softwood sawtimber will remain constrained andprices will increase, limiting growth and competitiveness forsoftwood lumber and plywood. Technology of the solid-wood products sector will likely continue to shift fromtraditional “solid-wood” products such as softwood dimen-sion lumber and softwood plywood toward alternativeproducts such as oriented strandboard (OSB) or othercomposite materials that can be made from pulpwood-typeraw material. Production capacity will also continue to shiftfrom the West to the South and North. The pulpwood supplyand demand situation is quite stable, with projected increasesin pulpwood prices not likely to seriously impair historicalgrowth trends of the pulp and paper sector. Increasedrecycled fiber supply will augment the fiber resource needsof the pulp and paper sector. Some reductions will occur inhardwood timber inventories, particularly in the South.
What are some implications for forest management?
Projected increases in softwood sawtimber stumpage pricesmay enhance future timberland investment returns andprovide incentive for more intensive forest managementpractices, such as conversion of natural forest stands toplantations, more intensive application of herbicides andpesticides, and generally more intensive silviculturalpractices. In this context, the need for policies designed tostimulate timberland investment could decline, givensubstantial private sector investment in response to highersawtimber prices. However, such an investment response bythe private sector is not certain to occur. Also, other publicpolicy concerns, such as sequestration of atmospheric carbonin growing trees, may continue to require public investmentin timber management. Timber policies may need to focuson resolving conflicts between more intensive silviculture onprivate timberlands and concern about forest ecology. Theprojected escalation in sawtimber prices would substantiallyincrease timber sale revenues per unit of timber sold onNational Forests as well as on private lands. Thus, althoughthe quantity of timber sold on the National Forests maydecline in the decades ahead, timber sale revenues may notnecessarily decline in direct proportion to declining harvestvolume.
Will increased paper recovery (for recycling and export)either eliminate or reduce the disposal burden associatedwith wastepaper in the United States?
No. The gross wastepaper disposal burden of the UnitedStates will remain in the range of 45 to 55 million metric
Figure 153—Employment in U.S. pulp, paper, andpaperboard mills (NAPAP Model projections, assuming2-percent annual growth in labor productivity and realwages @1,800 h/year).
Year
1975 1980 1985 2000 2010 2020 2030 20400
50
100
150
200Historical (Total U.S)North South West
3
Em
ploy
men
t (x1
0 )
Year
1980 1990 2000 2010 2020 2030 20400
20
40
60
80
100
Tim
ber
(x10
m )
6
3
Softwood Sawtimber Other Timber 1989 RPA
Figure 154—Trend in National Forest timber harvestfrom 1977–2040, comparing current TAMM/ATLASprojections to 1989 RPA projections.
Figure 155—Trend in National Forest timber harvest from1977–2040, by region, comparing current TAMM/ATLASprojections to 1989 RPA projections.
Tim
ber
(x10
m )
6
3
Year
1980 1990 2000 2010 2020 2030 20400
20
40
60
80
100North South West 1989 RPA

104
tonnes per year well into the 21st century. Although thecompetitive evolution of recycling technology will result in adecreased wastepaper disposal burden in the 1990s, andalthough recovery of paper for recycling and export willcontinue to grow, domestic demand and consumption ofpaper and paperboard products will also continue to grow inthe future. Thus, the United States will continue to face agross wastepaper disposal burden in the decades ahead,which will be similar in magnitude to the current disposalburden.
Will paper recycling be offset by alternative disposal optionsin the United States, such as wastepaper incineration?
No. For economic and environmental reasons, incineration ofwastepaper will probably not offset supplies of recoveredpaper for recycling or export. Incineration of wastepaper willcontinue to be an important element of waste management inthe United States, but paper that can be recovered andrecycled into paper or paperboard products will likely havemuch higher value in the future. Public policy favorsrecycling over incineration in waste management, forenvironmental reasons. In addition, energy conserved byrecycling of paper has been estimated to be more than twicethe energy generated by incineration (Jaakko Poyry 1992).At present, energy can be generated economically only ifwastepaper fuel is not much more than $50 per tonne. Withprojected higher prices for recyclable paper, only incinera-tion of nonrecyclable wastepaper will be likely in the future.
Will increased recycling and economic growth in the pulpand paper sector contribute to increased regional employ-ment in pulp and paper mills or to a better balance of trade?
Despite projected increases in production of pulp, paper, andpaperboard products, and projected increases in recycling,total U.S. employment in pulp, paper, and paperboard millsis not likely to increase substantially. This prognosis is inline with historical trends. This projection assumes continuedincreases in labor productivity at the modest rate of 2 percentper year (historical productivity increases have actually beenslightly higher). However, although the numbers of employ-ees are likely to decline in the North and West, and to remainrelatively constant in the South, increasing productivity willbe associated with increasing wage rates. In real terms, totalwages of the pulp and paper sector are likely to more thandouble during the projection period. Thus, the pulp and papersector of the United States will continue to make an enor-mous and growing contribution to the economic stability ofregional and local communities. In addition, increased exportand decreased import of pulp, paper, and paperboardcommodities will signficantly improve the U.S. balance oftrade.
What are the implications for forestry research and forestproducts research, associated with projected trends inrecycling and timber markets?
Although many elements of the current analysis are substan-tially different from the analysis presented in the 1989 RPAAssessment (e.g., much higher recycling rates and muchlower future National Forest timber harvest levels), many ofthe same conclusions will remain valid. Forestry researchshould continue to focus on the need to sustain forestproductivity while maintaining the integrity of forestecosystems. Forest productivity and management practiceson private timberlands will be important areas of research asprivate timberland harvesting intensifies. Management offorest ecosystems, ecosystem integrity, new forms ofmanagement, and new timber harvesting techniques will beimportant areas of research related to public lands. Forestproducts research will need to maintain a focus on extendingtimber resources, particularly in extending sawtimbersupplies and finding alternative technologies for producingsolid-wood products from non-sawtimber resources. Re-search related to the pulp and paper sector will need to focuson producing quality products from recycled fiber.
In addition to general areas of foresty and forest productresearch, results of this study suggest specific topics thatrequire additional research related to economics, recycling,and future timber markets. One area concerns emergingissues of the pulp and paper sector, including environmentalissues, product demand, and trade. This study focusedmainly on recycling, but other emerging environmentalconcerns are also important in the pulp and paper sector,such as the role of forest management and product use inrelation to global carbon cycling. Pulpwood supply, recov-ered paper supply, export demand, and trade also remainareas of uncertainty, requiring further investigation orupdating of current estimates. The modeling methodsdeveloped in this study can be further improved and appliedin analyses of these and related issues.
Alternative Scenarios
A final question concerns alternative future scenarios inpaper recycling and related policy options. Such analyses canbe developed using the methods applied in this study, such asthe NAPAP Model. One plausible future scenario could bedeveloped to represent the possiblity of significant govern-ment policy changes related to paper recycling. As notedpreviously, most states have adopted some form of legisla-tive or policy approach to encourage paper recycling. Statelegislative trends in paper recycling have been extensivelydocumented. Federal policies or programs might be enactedto encourage or stimulate paper recycling, or to reduce thedisposal burden associated with wastepaper. Such policies orprograms could subsume one or more of the followingobjectives:
1. to increase collection, sorting, and processing of recy-clable wastepaper so as to recover larger volumes ofpaper for recycling or export
105
2. to increase recycling by offering incentives (e.g., taxcredits) for investment in processes that use recycled fiber
3. to reduce the wastepaper disposal burden by way ofsource reduction
Even though the specific policies that might accomplishthese objectives are not yet mandated at the Federal level, themethods developed in this study could be employed toexamine their potential economic implications. The NAPAPModel can be adjusted easily to simulate the effects of(1) increased recovered paper supply resulting from in-creased collection, (2) application of credits for recycledfiber processes, and (3) decreased product demand caused by“source reduction.” One or more alternative future scenariosmay be developed to simulate potential effects of such policyoptions.
ReferencesAbe, M. 1973. Dynamic microeconomic models of produc-tion, investment, and technological change of the UnitedStates and Japanese iron and steel industries. In: Judge, G.G.;Takayama T., (eds.). Studies in economic planning overspace and time; North Holland, Amsterdam:189–196.
Adams, D.M.; Haynes, R.W. 1980. The 1980 Softwoodtimber assessment market model: structure, projections, andpolicy simulation. Monograph No. 22. Bethesda, MD:Society of American Foresters. Forest Science. 65 p.Supplement to Forest Science 26(3).
Adams, Darius M.; Haynes, Richard W. 1991. Softwoodtimber supply and the future of the southern forest economy.Bethesda, MD: Society of American Foresters. SouthernJournal of Applied Forestry. 5(1): 31–37.
Alig, Joanne T. 1992. Legislative trends in paper recycling.Recycled Paper News. 3(3): 9.
API. 1960–1992. Statistics of paper, paperboard and woodpulp. New York: American Paper Institute.
API. 1970–1991. Paper, paperboard and wood pulp capacity.New York: American Paper Institute.
API 1991a. Publicly announced expansion plans for in-creased use of recovered paper. New York: American PaperInstitute. 12 p.
API. 1991b. Additional markets and uses for recoveredpaper. New York: American Paper Institute. 25 p.
API. 1992. 1991 Annual statistical summary, recoveredpaper utilization. New York: American Paper Institute. 90 p.
Berard, P. 1977. The changing structure of the paperindustry. Translated by R. A. F. Whitbread. Grenoble,France: Presses Universitaires De Grenoble. 160 p.
Buongiorno, J. 1981. Outline of a world model of the pulpand paper industry. In: Proceedings, Analysis of world tradein forest products; 1981 June 2–4; Laxenburg, Austria.Laxenburg, Austria: International Institute for AppliedSystems Analysis.
Buongiorno, J.; Gilless, J.K. 1983. Concepts used in aregionalized model of pulp and paper production and trade.In: Seppala, R.; Row, C.; Morgan, A. (eds.). Forest sectormodels. Berkhamsted, England: A.B. Academic Publishers:57-90.
Buongiorno, J.; Gilless, J.K. 1984. A model of interna-tional trade of forest products, with an application tonewsprint. Journal of World Forest Resource Management.1(1): 65–80.
Calmels, P.; Buongiorno, J.; Zhang, D. 1990. PELPS II: Amicrocomputer price-endogenous linear programmingsystem for economic modeling. Report R3477. Madison, WI:University of Wisconsin. 40 p.
Day, R.H. 1973. Recursive programming models: a briefintroduction. In: Judge, G.G.; Takayama, T., eds. Studies ineconomic planning over space and time: Contributions toeconomic analysis. New York: American Elsevier: 329–344.
Denison, Richard A.; Ruston, John. 1990. Recycling &incineration, evaluating the choices. Washington DC: IslandPress. 322 p.
Duloy, J.H.; Norton, R.D. 1975. Prices and incomes inlinear programming models. American Journal of Agricul-tural Economics. 57(4): 591–600.
EPA. 1988. Summary of data on municipal solid wastelandfill leachate characteristics, criteria for municipal solidwaste landfills. 40 CFR Part 258, EPA/530–SW–88–038.Washington, DC: U.S. Environmental Protection Agency,Office of Solid Waste.
EPA. 1989. The solid waste dilemma: an agenda for action.EPA/530–SW–89–019. Washington, DC: U.S. Environmen-tal Protection Agency, Office of Solid Waste. 70 p.
EPA. 1990. Characterization of municipal solid waste in theUnited States, executive summary. EPA/530–SW–90–042A.Washington, DC: U.S. Environmental Protection Agency,Office of Solid Waste. 15 p.
EPA. 1992. Characterization of municipal solid waste in theUnited States: 1992 update, executive summary. EPA/530–S–92–019. Washington, DC: U.S. Environmental ProtectionAgency, Office of Solid Waste, Municipal and IndustrialSolid Waste Division. 10 p.
FAO. 1983.Yearbook of Forest Products (for year 1981).Rome, Italy: United Nations, Food and Agriculture Organi-zation.
FAO. 1992. Yearbook of Forest Products (for year 1990).Rome, Italy: United Nations, Food and Agriculture Organi-zation.

106
Fox, K.A. 1953. A spatial equilibrium model of the livestockfeed economy in the United States. Econometrica. 21(4):547–566.
Franklin Associates. 1988. Characterization of municipalsolid waste in the United States, 1960 to 2000. PrairieVillage, KS: Franklin Associates, Ltd. 31 p.
Franklin Associates. 1990. Paper recycling: the view to1995, summary report. Prairie Village, KS: Franklin Associ-ates, Ltd. 19 p.
Franklin Associates. 1991. National office paper recyclingproject: supply of and demand for office waste paper, 1990to 1995. Prairie Village, KS: Franklin Associates, Ltd. 89 p.
Franklin, William E.; Franklin, Margorie A.; Hunt,Robert G. 1982. Waste paper, the future of a resource 1980–2000. New York: American Paper Institute. 245 p.
Gilles, J. K. 1983. A regionalized model of pulp and paperproduction and trade. Ph.D. Dissertation. Madison, WI:University of Wisconsin.
Gilless, J.K.; Buongiorno, J. 1985. PELPS: Price–endog-enous linear programming system for economic modeling.Report R3329. Madison, WI: University of Wisconsin. 34 p.
Gilless, J.K.; Buongiorno, J. 1987. PAPYRUS: A model ofthe North American pulp and paper industry. Forest ScienceMonogr. 28. Supplement to Forest Science 33(1): 37.
Gold, B. 1977. Research, technological change, and eco-nomic analysis. Lexington, MA: Lexington Books. 240 p.
Guthrie, J.A. 1972. An economic analysis of the pulp andpaper industry. Pullman, WA: Washington State UniversityPress. 235 p.
Hatch Associates, Ltd. 1989. Waste paper recycling.Toronto, Ontario: Hatch Associates.
Haynes, Richard W. 1990. An analysis of the timbersituation in the United States: 1989-2040: a technicaldocument supporting the 1989 USDA Forest Service RPAassessment. Gen. Tech. Rep. RM–199. Fort Collins, CO:U.S. Department of Agriculture Forest Service, RockyMountain Forest and Range Experiment Station. 268 p.
Haynes, R.W.; Holley, L.; King, R.A. 1978. A recursivespatial equilibrium model of the softwood timber sector.Tech. Rep. 57. Raleigh, NC: North Carolina State Univer-sity, School of Forest Resources. 71 p.
Ince, Peter J. 1990. Timber market implications of acceler-ated wastepaper recycling in the 1990s. In: Proceedings ofthe 1990 Society of American Foresters (SAF) Convention;1990 July 29–August 1; Washington DC. Bethesda, MD:Society of American Foresters: 438–445.
Ince, Peter J. 1992. Likely developments and new processesin pulp, paper and paperboard. Madison, WI: U.S. Depart-ment of Agriculture Forest Service, Forest Products Labora-tory. 147 p. (unpublished).
Ince, P.J.; Skog, K.E.; Spelter, H. [and others]. 1987.Modeling technological change in wood products processing.In: Cardellichio, P.A. and others, eds. Forest sector and trademodels: theory and applications. Proceedings of an interna-tional symposium; 1987 November 3–4; Seattle, WA.Seattle, WA: Center for International Trade in ForestProducts, University of Washington.
Ince, Peter J.; Jacques, Romain; Zhang, Dali [andothers]. (in preparation). The North American Pulp andPaper (NAPAP) Model. Madison, WI: U.S. Department ofAgriculture Forest Service, Forest Products Laboratory andOttawa, Ontario: Forestry Canada and Forestry CanadaEconomics and Policy Directorate.
Ingram, C. D.; Durbak, I.; Ince, P. 1993. United Statespulpwood receipts: softwood and hardwood, roundwood andresidues, 1950-1989. Gen. Tech. Rep. FPL–GTR-73.Madison, WI: U.S. Department of Agriculture ForestService, Forest Products Laboratory. 40 p.
Jaakko Poyry Consulting. 1992. Resource recycling,January, 59 p.
Judge, G.G.; Wallace, T.D. 1958. Estimation of spatialprice equilibrium models. Journal of Farm Econonics 40(4):801–820.
Kallio, M.; Dykstra, D.P.; Binkley, C.S. (eds.). 1987. Theglobal forest sector: an analytical perspective. New York:John Wiley & Sons. 706 p.
Kennedy, M. 1974. An economic model of the world oilmarket. Bell Journal of Economics. 5: 540–577.
Kovacs, William L. 1988. The coming era of conservationand industrial utilization of recyclable materials. EcologyLaw Quarterly. 15(4): 537–625.
Landau, R.; Rosenberg, N. (eds.). 1986. The positive sumstrategy: harnessing technology for economic growth.Washington, DC: National Academic Press. 640 p.
Lockwood–Post’s Directory of the Pulp, Paper and AlliedTrades. 1992 and 1989. San Francisco, CA: Miller FreemanPublications.
Lonner, G. 1991. Modelling the Swedish forest sector.Report 20. Uppsala, Sweden: The Swedish University ofAgricultural Sciences, Department of Forest-Industry-MarketStudies (SIMS). 94 p.
Manne, A.S. 1979. Energy policy modeling: A survey.Operations Research. 27(1): 1–35.
Manne, A.S. 1981. ETA–MACRO: A user’s guide. ReportEPRI EA-1724. Stanford, CA: Stanford University, Depart-ment of Operations Research.
Mansfield, E. 1968. The economics of technological change.New York: W. W. Norton & Co. 257 p.

107
McCarl, B.A.; Spreen, T.H. 1980. Price endogenousmathematical programming as a tool for sector analysis.American Journal of Agricultural Economics. 62(1): 87–102.
Miller Freeman. 1990 and 1992. Pulp & paper NorthAmerican factbook. San Francisco, CA: Miller Freeman.426 p.
National Resource Recovery Association. 1990. Annualreport on status of energy and materials recovery facilities inthe United States. Washington, DC: U.S. Conference ofMayors. City Currents 8(3).
Nelson, C.A.; Genereux, J.; Genereux, M. 1992. Priceeffects of landfills on house values. Land Economics. 68(4):359–365.
Nelson, J.R. 1973. An interregional recursive programmingmodel of the United States iron and steel industry. In: Judge,G.G.; Takayama, T. (eds.). Studies in economic planningover space and time; North Holland, Amsterdam: 197–212.
NSWMA. 1992. Waste age. National Solid Waste Manage-ment Association. May.
OTA. 1989. Facing America’s trash: what’s next formunicipal solid waste. O-424. Office of Technology Assess-ment, Congress of the United States. Washington DC: U.S.Government Printing Office. 377 p.
Pilati, D.A.; Chang, J.; Sparrow, F.T. [and others]. 1980.A process model of the U.S. pulp and paper industry.Economic Analysis Division, National Center for Analysisof Energy Systems, Department of Energy and Environment,Brookhaven National Laboratory, Associated Universities,Inc. Available from National Technical Information Service:Springfield, VA. Report BNL 51142, UC-95f. 104 p.
Post’s Pulp & Paper Directory. 1987. San Francisco, CA:Miller Freeman Publications. 704 p.
Rosenberg, N. 1976. Perspectives on technology. Cam-bridge, England: Cambridge University Press. 353 p.
Rosenberg, N. 1982. Inside the black box: technology andeconomics. Cambridge, England: Cambridge UniversityPress. 304 p.
Samuelson, P.A. 1952. Spatial price equilibrium and linearprogramming. American Economics Review. 42(3): 283–303.
Schallau, Con H.; Goetzl, Alberto. 1992. Effects ofconstraining U.S. timber supplies. Journal of Forestry. 90(7):22–27.
Schmookler, J. 1966. Invention and economic growth.Cambridge, MA: Harvard University Press. 332 p.
Schrader, L.F.; King, G.A. 1962. Regional location of beefcattle feeding. Journal of Farm Economics. 44(1): 68–81.
Slinn, Ronald J. 1992. Pulp and paper industry trends in theUnited States and the world. In: Proceedings, PAPFOR 92international technical conference; 1992 September 20;St. Petersburg, Russia. New York: American Paper Institute.15 p.
Strange, J.G. 1977. The paper industry, a clinical study.Appleton, WI: Graphic Communications Center, Inc. 394 p.
Takayama, T.; Judge, G.G. 1964a. Equilibrium amongspatially separated markets: A reformulation. Econometrica.32(4): 510–524.
Takayama, T.; Judge, G.G. 1964b. An interregionalactivity analysis model of the agriculture sector. Journal ofFarm Economics. 46(2): 349–365.
Takayama, T.; Judge, G.G. 1970. Alternative spatialequilibrium models. Journal of Regional Science 10: 1–12.
Takayama, T.; Judge, G.G. 1971. Spatial and temporalprice and allocation models. Amsterdam: North-HollandPress.
Thurner, Christian; Ashle, Dayna. 1990. Developingrecycling markets and industries. Denver, CO: EconomicDevelopment Program, National Conference of StateLegislatures. 41 p.
Tobin, J. 1969. A general equilibrium approach to monetarytheory. Journal of Money, Credit and Banking. 1: 15–29.
Tramel, T.E.; Seale, A.D., Jr. 1959. Reactive programmingof supply and demand relationships—application to freshvegetables. Journal of Farm Economics. 41(5): 1012–1022.
USDA Forest Service. 1982. An analysis of the timbersituation in the United States, 1952–2030. Forest Res. Rep.23. Washington, DC: U.S. Department of Agriculture ForestService. 499 p.
USDA Forest Service. 1988. The South’s fourth forest:alternatives for the future. Forest Res. Rep. 24. Washington,DC: U.S. Department of Agriculture Forest Service. 512 p.
USDA Forest Service. 1989a. RPA assessment of the forestand rangeland situation in the United States, 1989. ForestRes. Rep. 26. Washington, DC: U.S. Department of Agricul-ture Forest Service. 72 p.
USDA Forest Service. 1989b. Basic assumptions, a techni-cal document supporting the 1989 USDA Forest ServiceRPA assessment. Gen. Tech. Rep. RM–174. Fort Collins,CO: U.S. Department of Agriculture Forest Service, RockyMountain Forest and Range Experiment Station. 11 p.
U.S. Department of Commerce. 1980–1990. Economicindicators. Washington, DC: U.S. Department of Commerce,Bureau of Economic Analysis.

108
U.S. Department of Commerce. 1987. Current industrialreports: pulp, paper, and board. Rep. MA26A(87)–1.Washington, DC: U.S. Department of Commerce, Bureau ofthe Census. 19 p.
U.S. Department of Commerce. 1990. 1987 census ofmanufactures: pulp, paper, and board mills. Rep. MC87–I–26A. Washington, DC: U.S. Department of Commerce,Bureau of the Census. 19 p.
Whiteman, A. 1991. The supply and demand for wood inthe United Kingdom. Occasional Pap. 29. Edinburgh, UK:Forestry Commission. 52 p.
Yaron, D. 1967. Incorporation of income effects intomathematical programming models. Metroeconomica.19(3): 141–164.
Young, Rodney L. 1991. Fiber balance: the dynamics ofrecycling. In: FOCUS ’95+, Landmark Paper RecyclingSymposium; 1991 March 19–21; Atlanta, GA. Atlanta, GA:TAPPI Press: 13–49.
Zhang, D. 1992. Modeling the impact of increased wastepa-per recycling on the North American pulp and paper indus-try. PhD. Dissertation. Madison, WI: University of Wiscon-sin, Department of Forestry. 167 p.
Zhang, D.; Buongiorno, J. 1992a. Capacity changes in theU.S. paper and paperboard industries: “q” theory andempirical models. Madison, WI: University of Wisconsin–Madison, Department of Forestry. Unpublished report. [Draftcopy available upon request from the U.S. Department ofAgriculture Forest Service, Forest Products Laboratory.] 26 p.
Zhang, D.; Buongiorno, J. 1992b. Modeling technologicalchanges and capacity expansions in the North American pulpand paper industry. In: Proceedings, CINTRAFOR Confer-ence; 1992 April 29–May 1; Seattle, WA. Seattle, WA:CINTRAFOR: University of Washington–Seattle. [Draftcopy available upon request from U.S. Department ofAgriculture Forest Service, Forest Products Laboratory.] 8 p.
Zhang, D.; Ince, P. 1991. Transportation cost analysis ofthe U.S. pulp and paper industry. Madison, WI: U.S.Department of Agriculture Forest Service, Forest ProductsLaboratory. Unpublished report.. [Draft copy available uponrequest from the U.S. Department of Agriculture ForestService, Forest Products Laboratory.] 22 p.
Zhang, D.; Buongiorno, J.; Calmels, P. 1990. PELPS IIPLUS: A microcomputer price-endogenous linear program-ming system for economic modeling. Staff Pap. Ser. 41.Madison, WI: University of Wisconsin. 48 p.
Zhang, D.; Buongiorno, J.; Ince, P.J. (in preparation).PELPS III: A microcomputer price-endogenous linearprogramming system for economic modeling. Madison, WI:U.S. Department of Agriculture Forest Service, ForestProducts Laboratory. [Draft copy available upon requestfrom the U.S. Department of Agriculture Forest Service,Forest Products Laboratory.]
Additional Sourcesof InformationAndover International Associates. 1988. Cost report:newsprint manufacture. AIA–3011. Danvers, MA: AndoverInternational Associates. 19 p.
Arthur D. Little, Inc. 1975. Analysis of demand and supplyfor secondary fiber in the U.S. Paper and paperboardindustry. 3 vol. Reports PB–250 905 (vol. 2, ProcessEconomics) and PB–250 802 (vol. 3). Washington, DC:U.S. Department of Commerce, National Technical Informa-tion Service.
Arthur D. Little, Inc.; Pulp and Paper International(PPI). 1980. North America in the 80s; pulp, paper andpaperboard: The competitive position and its implications.San Fransisco, CA: Miller Freeman Publications. 100 p.
Buongiorno, J. 1977. Long-term forecasting of major forestproducts consumption in developed and developing econo-mies. Forest Science. 23: 13–25.
Buongiorno, J. 1978. Income and price elasticities in theworld demand for paper and paperboard. Forest Science. 24:231–246.
Buongiorno, J. 1979. Income and price elasticities ofdemand for sawnwood and wood-based panels: a pooledcross-section and time series analysis. Canadian Journal ofForestry Research. 9: 141–148.
Clark, J. M. 1917. Business acceleration and the law ofdemand: a technical factor in economic cycles. Journal ofPolitical Economy. 25: 217–235.
CPPA. 1988. Canadian pulp and paper capacity. Montreal,Quebec: Canadian Pulp and Paper Association. 22 p.
CPPA. 1989. Reference tables. 43rd ed. Montreal, Quebec:Canadian Pulp and Paper Association. 36 p.
Energy Information Association. 1990. State energy priceand expenditure report. September. 346 p.
FAO. 1986. The outlook for pulp and paper to 1995.Executive summary. Rome, Italy: United Nations, Food andAgriculture Organization.
FSAC. 1987. The market pulp industry. Canada: ForestSector Advisory Council. 5 p.
FSAC. 1987. Newsprint cost study. Canada: Forest SectorAdvisory Council. 29 p
Hazell, P.B.R.; Norton, R.D. 1986. Mathematical program-ming for economic analysis in agriculture. New York:MacMillan. 400 p.
Howard, J.L.; Ince, P.J.; Durbak, I.; Lange, W.J. 1988.Modeling technology change and fiber consumption in theU.S. pulp and paper industry. In: Abt, R. ed. Proceedings of
109
the 1988 Southern Forest Economists Workshop; 1988 May4–6; Orlando, FL. Gainesville, FL: Department of Forestry,University of Florida: 211–219.
Intriligator, M.D. 1971. Mathematical optimization andeconomic theory. Englewood Cliffs, NJ: Prentice-Hall, Inc.
Lu, H.C.; Alig, J.T.; Ince, P.J. 1991. Demand estimates forpulp, paper and paperboard. Madison, WI: U.S. Departmentof Agriculture Forest Service, Forest Products Laboratory.Unpublished report. [Copies available upon request.]
McCarl, B.A.; Tice, T. 1982. Should quadratic program-ming problems be approximated? American Journal ofAgricultural Economics. 64(8): 585–589.
PPI. 1985. Market pulp. In: Proceedings, 4th pulp & paperinternational symposium; 1985 May; Brussels, Belgium. SanFrancisco, CA: Miller Freeman Publications: 111 p.
Pulp & Paper. 1987. Uncoated groundwood papers confer-ence. In: Proceedings, 3rd pulp & paper internationalconference;1987 November 9–10; Montreal, Quebec. SanFrancisco, CA: Miller Freeman Publications.
Pulp & Paper Magazine. 1986–1990. San Francisco, CA:Miller Freeman Publications.
RISI. 1987. Pulp & paper review. Bedford, MA: ResourceInformation Systems Inc. 246 p.
RISI. 1990. Pulp & paper yearbook. Bedford, MA: ResourceInformation Systems Inc. 190 p.
RISI. 1990. Production costs and profitability for a NorthAmerican recycled newsprint mill. Special Study Series16.Bedford, MA: Resource Information Systems, Inc. 182 p.
Rust Engineering Company. 1981. Scope of work andcapital cost estimate for a 1400 ton/day linerboard mill. RustContract 21–2276. Birmingham, AL: The Rust EngineeringCo.
Schrage, L. 1986. Linear, integer and quadratic program-ming with Lindo. 3rd ed. Palo Alto, CA: The ScientificPress.
Sirrine Company. 1982. Extended nip press economicanalysis. Research Triangle Park, NJ: J. E. Sirrine Co. 22 p.
Sittig, Marshall. 1977. Pulp and paper manufacture: energyconservation and pollution prevention. Park Ridge, NJ:Noyes Data Corporation. 430 p.
Slinn, Ronald J. 1986. Energy efficiency in the U.S. pulpand paper industry. PIMA Magazine. 68(9): 27–33.
TAPPI. 1991. “Focus ’95+.” In: Proceedings of landmarkpaper recycling symposium; 1991 March 19-21; Atlanta,GA. Atlanta, GA: TAPPI Press. 415 p.
U.S. Department of Commerce. 1978–1988. Statisticalabstract of the United States. Washington, DC: U.S. Govern-ment Printing Office.
U.S. Department of Energy. 1985. Manufacturing energyconsumption survey: consumption of energy. Washington,DC: U.S. Department of Energy. 102 p.
Varian, H.R. 1984. Microeconomic analysis. 2nd ed. NewYork: W. W. Norton & Company, Inc. 348 p.
Zhang, D.; Buongiorno, J. 1990. Econometric models ofcapacity changes in the U.S. pulp and paper industry:acceleration and capacity principle approaches. Madison,WI: University of Wisconsin, Department of Forestry.Unpublished report.
Zhang, D.; Buongiorno, J. 1991. PELPS III: A microcom-puter price-endogenous linear programming system foreconomic modeling. Supplement programmer’s guide andsource code. Madison, WI: University of Wisconsin,Department of Forestry. 37 p.
GlossaryDemand function. A mathematical relationship defining thequantity of a commodity that will be consumed in a particu-lar demand region as a function of the market equilibriumprice and other shifter variables, such as population andgross domestic product; shifter variables are projectedexogenously to change over time in each demand region,causing change in regional commodity demands. Mostdemand functions in the NAPAP Model were estimatedusing statistical (econometric) techniques based on long-termhistorical data relationships.
Demand region. A region in which market equilibria forend products are modeled, and for which consumption of endproducts are modeled by demand functions.
Delivered pulpwood. Pulpwood delivered to manufacturingfacilities (i.e., pulp, paper, or paperboard mills) or deliveredto port for export. Delivered pulpwood has a substantiallyhigher price than does stumpage, reflecting costs of pulp-wood harvesting and transportation; delivered pulpwoodmarkets may follow somewhat different trends than stump-age markets.
Elasticity (coefficients). Mathematical coefficients insupply or demand functions that specify how much thesupply or demand quantity will change or “shift” given achange in price or shifter variables.
End product. Commodity that satisfies product demand, asrepresented by demand functions for various demand regionsin the NAPAP Model. End products include all paper andpaperboard commodities and dissolving pulp; also includecommodities that satisfy export demands, including exportsof market pulp, recovered paper, and pulpwood.
Growing stock. Classification of timber inventory thatincludes live trees of commercial species meeting specifiedstandards of quality or vigor. Cull trees are excluded. Whenassociated with timber volume, growing stock includes only

110
trees 5.0 in. (12.7 cm.) diameter-at-breast-height (dbh) andlarger.
Import ad-valorem tax. Tariff imposed by a demandregion (importer) on a commodity imported to the region.
Input. Commodity that must be entered into manufacturingprocesses for end products or intermediate products. Inputsinclude pulpwood commodities, recovered paper commodi-ties, labor, purchased fuel, and electrical energy.
Intermediate product. Commodity that is manufactured inNorth America or imported to North America and thatsatisfies input requirements of manufacturing processes forend products. Intermediate products include paper-grademarket pulp commodities.
Manufacturing cost. Cost of producing a product (pertonne of output) using a particular manufacturing process,including the cost of inputs plus “other manufacturing costs,”including capital, chemicals, supplies, and other factors. Costestimates used in the NAPAP Model were approximations,intended to represent aggregate averages by type of process,and do not represent actual costs for any particular mill inNorth America.
Manufacturing region. A region in which the productionof a commodity takes place and in which the supply marketsfor input commodities are modeled.
Process. A production technique used to produce intermedi-ate or final products (pulp, paper or paperboard) in a particu-lar manufacturing region; a process is defined completely byits manufacturing input requirements, other manufacturingcosts, and production capacity; each process generallyrepresents an approximation or average of actual technolo-gies used in the pulp and paper sector. (In reality, many millshave used more than one process, so the process definitionsdo not necessarily correspond to the technology of anyindividual mill in North America.)
Production capacity. Upper limit on annual production of aparticular process in a particular manufacturing region. In theNAPAP Model, capacity was estimated for each process andregion in 1986, and projected to change over time in relation-ship to market conditions and comparative advantages ofregions and processes.
Pulpwood. Roundwood (including whole-tree chips) andwood residues used for the production of pulp, paper, orpaperboard. Pulpwood is the primary virgin-fiber rawmaterial input in U.S. production of pulp, paper, or paper-board products. It includes wood obtained directly fromtimber harvesting (so-called roundwood, including whole-tree chips) and wood residues (usually in the form of chipsobtained as by-products from lumber or plywood mills.
Recovered paper. Recyclable paper recovered for recyclingor export; includes paper or paperboard recovered from pre-or post-consumer sources, but excludes mill broke. The fourprincipal commodity categories include old newspapers
(ONP), old corrugated containers (OCC), mixed papers, andhigh grade deinking & pulp substitutes.
Residues. Category of pulpwood that consists of wood by-products (primarily chips, but also including slabs, edgings,trims, and veneer cores) generated primarily by sawmill orplywood mill operations and used as pulpwood.
Roundwood. Category of pulpwood (or timber generally)obtained directly from timber harvest operations, as opposedto mill residues; roundwood actually consists of pulpwoodlogs and whole-tree chips from on-site harvesting operations.
Sawtimber. Live trees of commercial species containing atleast one 12-ft (3.66-m) log or two 8-ft (2.44-m) logs, andmeeting regional specifications for freedom from defect.Softwood trees must be at least 9.0 in. (22.85 cm) diameter-at-breast-height (dbh), and hardwood trees at least 11.0 in.(27.94 cm) dbh.
Stumpage. Standing timber (trees) in the forest. The valueof timber sold “on the stump” (stumpage price) representsthe market value of timber prior to harvesting and delivery tomills; generally, pulpwood stumpage prices are much lowerthan delivered prices and may follow somewhat differenttrends.
Supply function. A mathematical relationship that definesthe quantity of a commodity that will be supplied by aparticular supply region, as a function of the market equilib-rium price and other shifter variables, such as timberinventory for pulpwood supply or landfill tipping fees forrecovered paper supply. Shifter variables are projectedexogenously to change over time for each supply region,causing projected changes in regional supply of inputcommodities. (Most supply functions in the NAPAP Modelwere estimated using statistical (econometric) techniquesbased on long-term historical data relationships.)
Supply region. A region in which market equilibria forinput commodities are modeled, and for which the supply ofeach input commodity is modeled by a supply function,giving quantity supplied as a function of price and othershifter variables. In the NAPAP Model, all manufacturingregions are supply regions, and additionally some overseassupply regions are represented only by supply functions (with-out a detailed representation of manufacturing technology).
Timberland. Forest land producing or capable of producingcrops of industrial wood and not withdrawn from timberutilization or timber harvesting by statute or administrativeregulation.
Timber inventory. Volume of timber growing stock ontimberland.
Transportation cost. Shipping cost of a commodity fromone region to the other.
Virgin wood fiber. Wood fiber obtained directly frompulpwood, either roundwood or residues, as opposed torecycled fiber.