united states production, prices, employment, and trade in ... · abstract warren, debra d. 2007....
TRANSCRIPT

United StatesDepartment ofAgriculture
Forest Service
Pacific NorthwestResearch Station
Resource BulletinPNW-RB-254October 2007
Production, Prices, Employment,and Trade in Northwest ForestIndustries, All Quarters 2005Debra D. Warren

ABSTRACT
Warren, Debra D. 2007. Production, prices, employment, and trade in Northwest forest industries,
all quarters of 2005. Resour. Bull. PNW-RB-254. Portland, OR: U.S. Department of Agriculture,
Forest Service, Pacific Northwest Research Station. 165 p.
Provides current information on lumber and plywood production and prices; employment in the forest
industries; international trade in logs, lumber, and plywood; volume and average prices of stumpage
sold by public agencies; and other related items.
Keywords: Forestry business economics, lumber prices, plywood prices, timber volume,
stumpage prices, employment (forest products industries), marketing (forest products), imports
and exports (forest products).
PREFACE
Due to temporary unavailability of trade data, this report was delayed. In the interest of efficiency and timeliness,
all four quarters of 2005 are being published in one book. This report presents current information on the timber
situation in Alaska, Washington, Oregon, California, Montana, Idaho, and British Columbia, including data on lumber
and plywood production and prices; timber harvest; employment in forest products industries; international trade in
logs, pulpwood, chips, lumber, and plywood; log prices in the Pacific Northwest; volume and average prices of
stumpage sold by public agencies; and other related items.
Cooperation in supplying data has been received from the following sources: U.S. Department of Agriculture, Forest
Service, Forest Inventory and Economics Research Staff in Washington, DC; Washington State Department of
Natural Resources and Employment Security Department; Oregon State Department of Forestry and Department of
Employment; California State Department of Employment and Department of Conservation; Montana State Forester
and State Employment Service; Idaho State Department of Public Lands and Department of Employment; Alaska
State Department of Labor and Department of Natural Resources of the Division of Lands; U.S. Department of
Commerce; U.S. Department of the Interior, Bureau of Land Management and Bureau of Indian Affairs; British
Columbia Department of Industrial Development, Trade, and Commerce; and a number of private industry
associations, firms, and individuals. A special “thank-you” goes to Judy Mikowski at the PNW Research Station for
her assistance in the Washington and Oregon employment tables (25 and 26), the Western Wood Products
Association tables (9-13), and all of the graphs.
The valuation definition used in the export statistics is the value at the seaport or border port of exportation.
It is based on the selling price (or cost if not sold) and includes inland freight, insurance, and other charges
to the port of exportation. Seattle Customs District includes all coastal and inland ports in the State of Washington,
except Longview and Vancouver. Columbia-Snake Customs District includes all Oregon ports and Longview and
Vancouver, Washington. Anchorage Customs District is the State of Alaska. San Francisco Customs District
includes Monterey and all ports north of Monterey, California.
The statistical data are from secondary sources and are brought together to make such information more readily
available. Sources are indicated for each table and can be contacted directly for means used in data collection.
Readers are cautioned that unit values should not be interpreted as accurate indicators of prices. Unit values
for individual trade flows, especially those involving small volumes, frequently vary widely within a year, across origins
or destinations, and through time.
AUTHOR
DEBRA D. WARREN is an economist, Pacific Northwest Research Station, Suite 400, 620 SW Main,
Portland, OR. The mailing address is P.O. Box 3890, Portland, OR 97208-3890. The phone number is
503/808-2001, and the FAX number is 503/808-2033. This report is also available online in portable document
format (pdf) at the following address: http://www.fs.fed.us/pnw/pubs/rb254.pdf.

Tables Included in This Series of Reports
and Frequency of Updates
TABLE FREQUENCY
NUMBER TABLE TITLE OF UPDATE
Lumber and Plywood Production and Prices
1 U.S. softwood lumber and structural panel board Quarterly
production, 1994-2005
2 Lumber production in Northwest States, 1995-2005 Annually, second quarter
3 Softwood lumber production in the inland region, Annually, second quarter
by species, 1995-2005
4 Lumber production in the coast region, by species, Annually, second quarter
1995-2005
5 Softwood structural panel board production in the Annually, fourth quarter
United States, by State, 1995-2005
6 Softwood lumber and plywood production in British Annually, second quarter
Columbia, 1995-2005
7 Wholesale prices of selected lumber products, 1994-2005 Quarterly
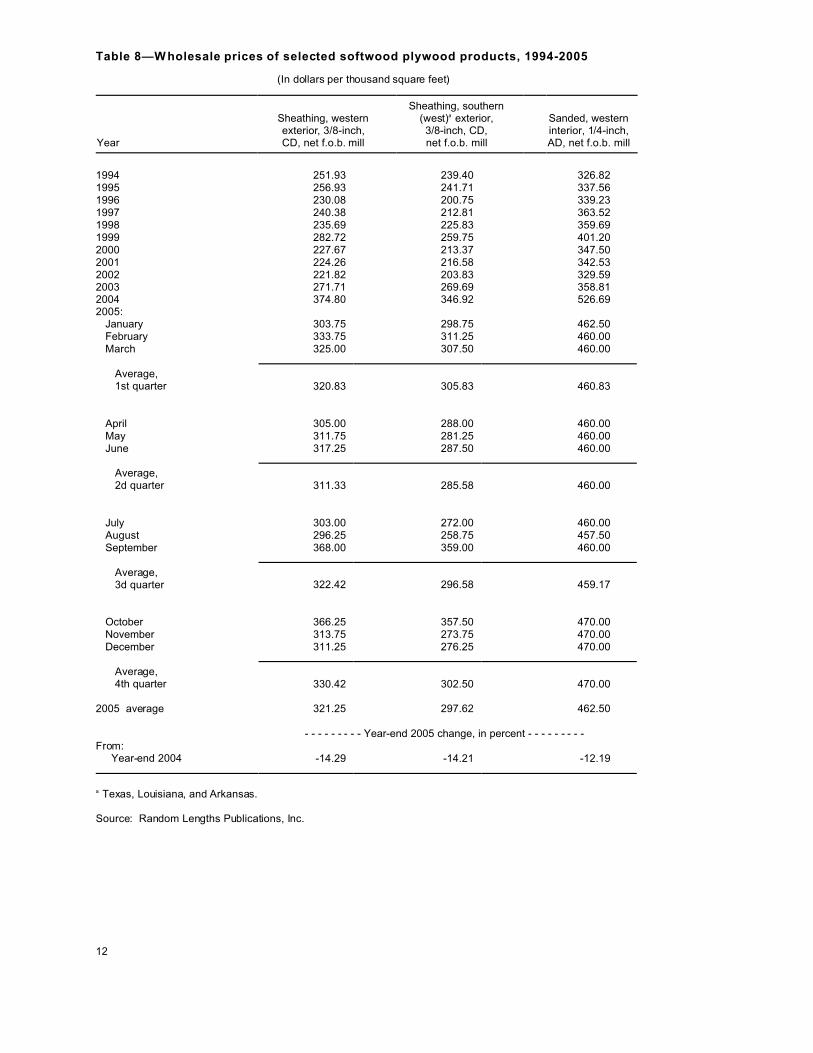
8 Wholesale prices of selected softwood plywood Quarterly
products, 1994-2005
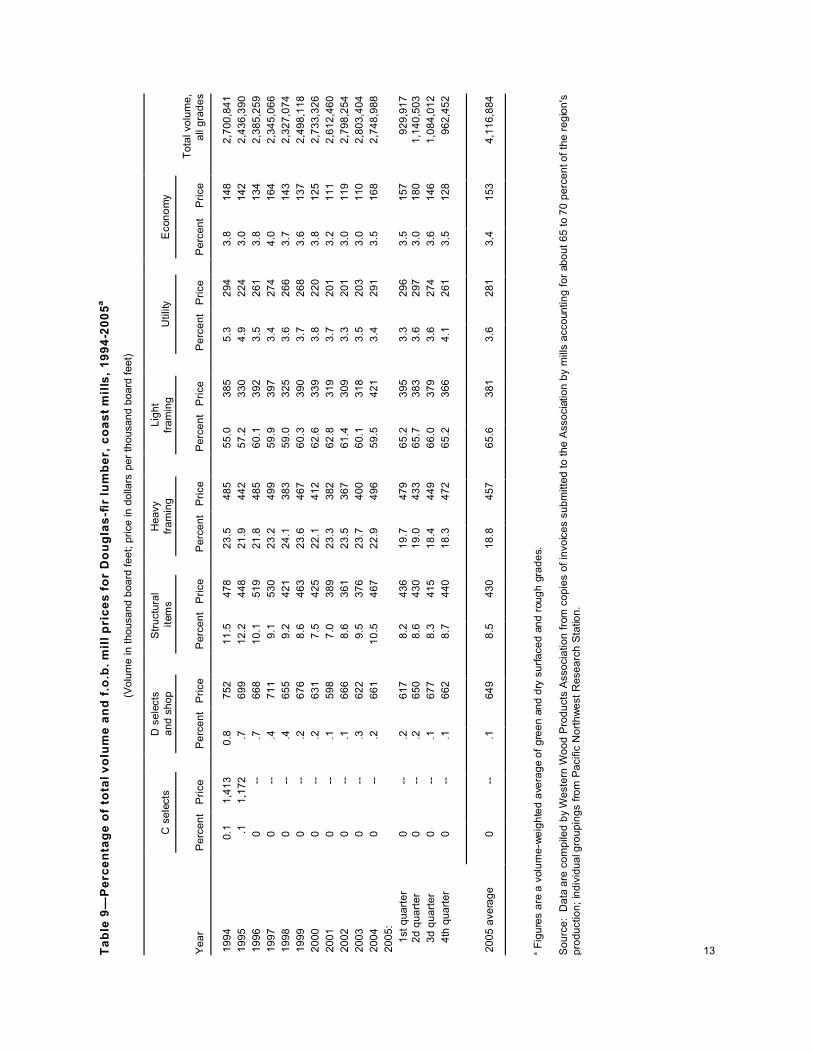
9 Percentage of total volume and f.o.b. mill prices for Quarterly
Douglas-fir lumber, coast mills, 1994-2005
10 Percentage of total volume for ponderosa pine lumber, Quarterly
inland mills, 1994-2005
11 F.O.B. mill prices for ponderosa pine lumber, inland Quarterly
mills, 1994-2005
12 Percentage of total volume and f.o.b. mill prices for Quarterly
hem-fir lumber, inland mills, 1994-2005
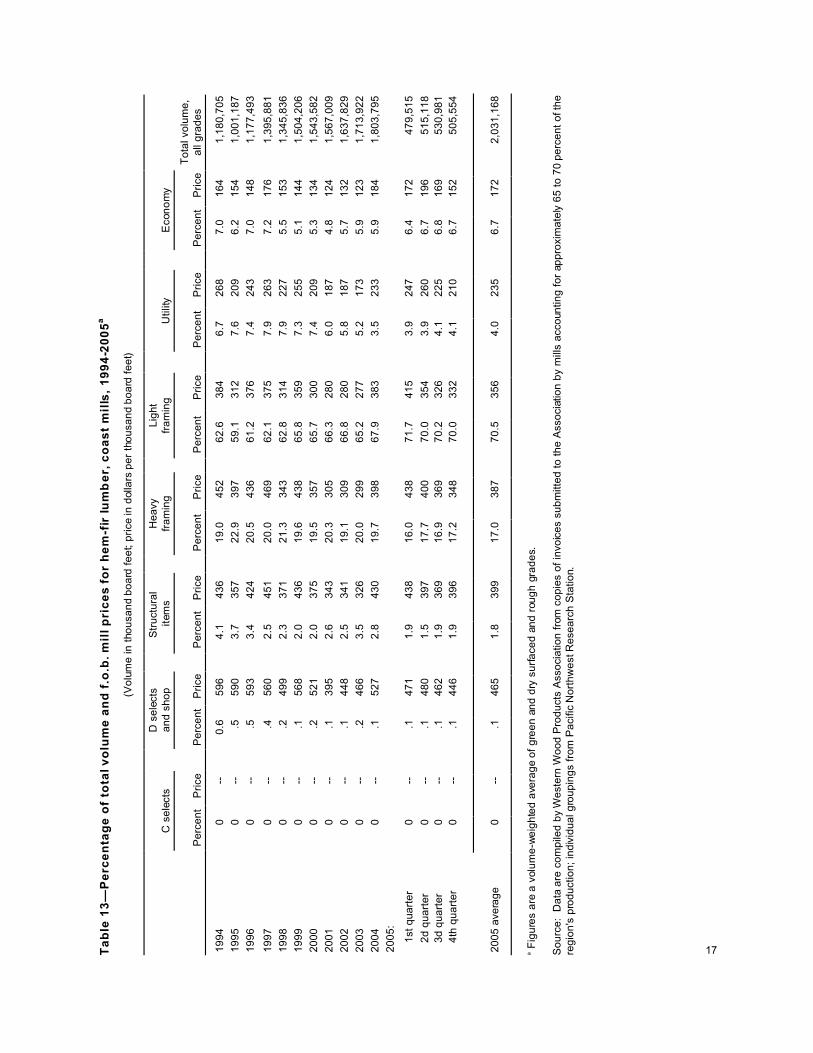
13 Percentage of total volume and f.o.b. mill prices for Quarterly
hem-fir lumber, coast mills, 1994-2005
14 Weighted average f.o.b. mill prices for coast and Quarterly
inland lumber, 1994-2005
15 Average prices for domestic and exported alder, Quarterly
western region, 1994-2005
Timber Harvest
16 Washington and Oregon timber harvest by ownership, Annually, third quarter
1995-2005

Tables Included in This Series of Reports (continued)
TABLE FREQUENCY
NUMBER TABLE TITLE OF UPDATE
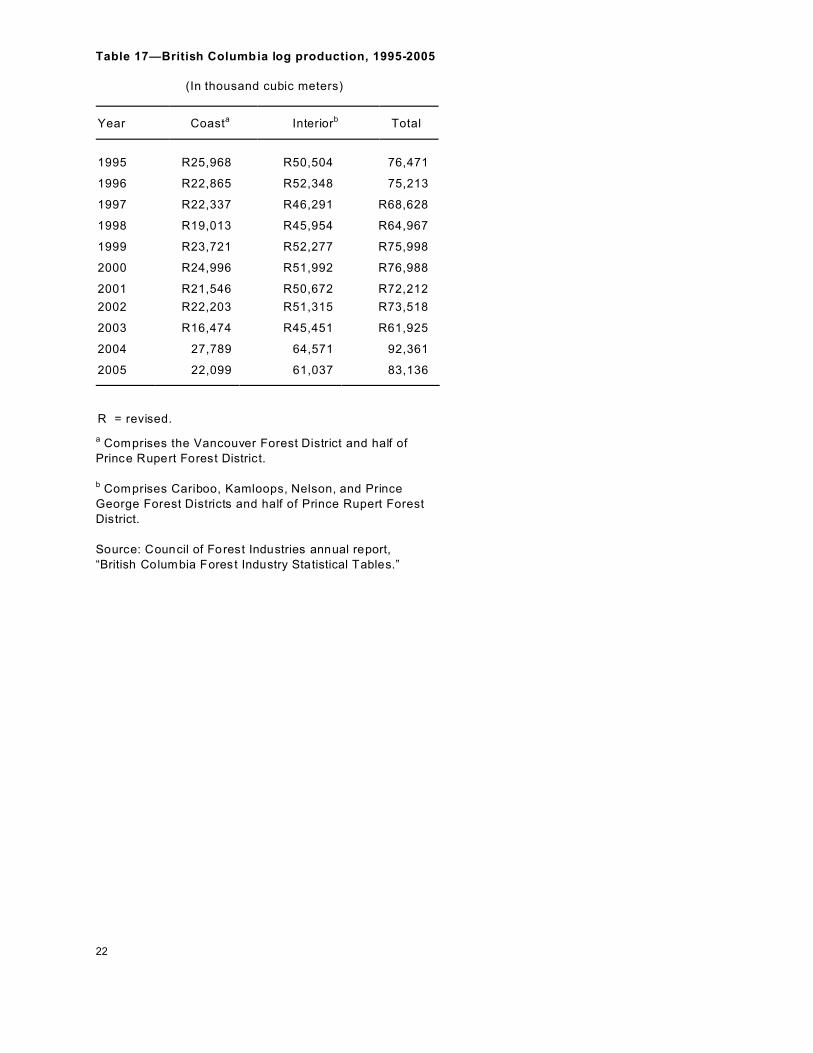
17 British Columbia log production, 1995-2005 Annually, third quarter
18 Montana and Idaho timber harvest by ownership , Annually, third quarter
1995-2005
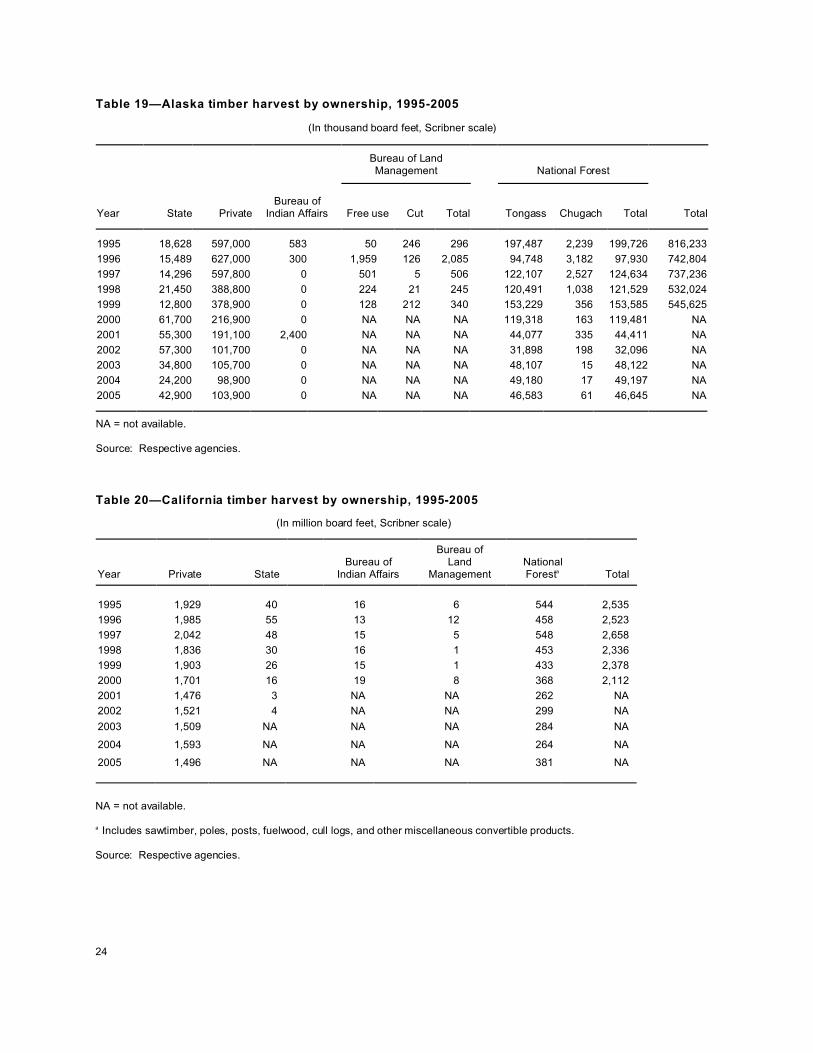
19 Alaska timber harvest by ownership, 1995-2005 Annually, third quarter
20 California timber harvest by ownership, 1995-2005 Annually, third quarter
Employment in Forest Products Industries
21 Employment in forest products industries in Quarterly
Washington and Oregon, 1994-2005
22 Total nonagricultural employment and employment Quarterly
in forest products industries in Washington and
Oregon, 1995-2005
23 Employment in forest products industries in Quarterly
California and Alaska, 1994-2005
24 Employment in forest products industries in Quarterly
Montana and Idaho, 1994-2005
25 Employment, wages, unemployment, and Annually
population for the State of Oregon, by county
26 Employment, wages, unemployment, and Annually
population for the State of Washington, by county
Log, Pulpwood, and Chip Exports and Imports
27 Volume of softwood log exports from Seattle and Quarterly
Columbia-Snake Customs Districts by species and
destination, 1994-2005
28 Value of softwood log exports from Seattle and Quarterly
Columbia-Snake Customs Districts by species
and destination, 1994-2005
29 Average value of softwood logs exported from Quarterly
Seattle and Columbia-Snake Customs Districts
by species and destination, 1994-2005
30 Volume and average value of softwood log exports Quarterly
from the San Francisco Customs District by
species and destination, 1994-2005
31 Volume and average value of softwood log exports Quarterly
from Anchorage Customs District by species and
destination, 1994-2005
32 Volume and average value of log exports by port, Annually, fourth quarter
species, and destination, Seattle Customs
District, 2005
Tables Included in This Series of Reports (continued)
TABLE FREQUENCY
NUMBER TABLE TITLE OF UPDATE
33a-d Volume and average value of log exports by port, Quarterly
species, and destination, Seattle Customs
District, all quarters 2005
34 Volume and average value of log exports by port, Annually, fourth quarter
species, and destination, Columbia-Snake Customs
District, 2005
35a-d Volume and average value of log exports by Quarterly
port, species, and destination, Columbia-
Snake Customs District, all quarters 2005
36 Volume and average value of log exports by Annually, fourth quarter
port, species, and destination, San Francisco
Customs District, 2005
37a-d Volume and average value of log exports by Quarterly
port, species, and destination, San Francisco
Customs District, all quarters 2005
38 Volume and average value of log exports by Annually, fourth quarter
port, species, and destination, Anchorage
Customs District, 2005
39a-d Volume and average value of log exports by Quarterly
port, species, and destination, Anchorage
Customs District, all quarters 2005
40 Volume and average value of hardwood log Quarterly
exports from Seattle, Columbia-Snake, Anchorage,
and San Francisco Customs Districts, 1994-2005
41 Volume and average value of alder log exports Quarterly
from the Seattle Customs District, 1995-2005
42 Volume and average value of log exports from Quarterly
southern California ports by species, 1994-2005
43 Volume and average value of softwood log exports Quarterly
to Canada from the Great Falls Customs District,
1994-2005
44 Volume of log exports from British Columbia ports Annually, fourth quarter
by species and destination, 1995-2005
45 Average value of log exports from British Columbia Annually, fourth quarter
ports by species and destination, 1995-2005
46 Volume and average value of softwood log imports of Quarterly
all species from Canada into Washington and Oregon,
1994-2005

Tables Included in This Series of Reports (continued)
TABLE FREQUENCY
NUMBER TABLE TITLE OF UPDATE
47 Volume and average value of pulpwood imports from Quarterly
Canada into the Seattle Customs District, 1994-2005
48 Volume of pulp exports by selected grades from Quarterly
Seattle, Columbia-Snake, Anchorage, and San
Francisco Customs Districts, 1994-2005
49 Average value of pulp exports by selected grades Quarterly
from Seattle, Columbia-Snake, Anchorage, and San
Francisco Customs Districts, 1994-2005
50 Volume and average value of all chips exported Quarterly
from the Seattle, Columbia-Snake, San Francisco,
and Anchorage Customs Districts, 1995-2005
51 Volume and average value of softwood chips exported Quarterly
from the Seattle, Columbia-Snake, San Francisco,
and Anchorage Customs Districts, 1995-2005
Lumber, Plywood, and Veneer Exports
52 Volume of softwood lumber exports from Seattle and Quarterly
Columbia-Snake Customs Districts by species and
destination, 1994-2005
53 Value of softwood lumber exports from Seattle Quarterly
and Columbia-Snake Customs Districts by species
and destination, 1994-2005
54 Average value of softwood lumber exports from Quarterly
Seattle and Columbia-Snake Customs Districts by
species and destination, 1994-2005
55 Volume and average value of softwood lumber Quarterly
exports from southern California ports by species
and destination, 1994-2005
56 Volume and average value of softwood lumber exports Quarterly
from northern California ports by species and
destination, 1994-2005
57 Volume and average value of softwood lumber exports Quarterly
from Anchorage Customs District by species and
destination, 1994-2005
58 Volume and average value of lumber exports by port, Annually, fourth quarter
species, and destination, Seattle Customs District,
2005

Tables Included in This Series of Reports (continued)
TABLE FREQUENCY
NUMBER TABLE TITLE OF UPDATE
59a-d Volume and average value of lumber exports by port, Quarterly
species, and destination, Seattle Customs District,
all quarters 2005
60 Volume and average value of lumber exports by port, Annually, fourth quarter
species, and destination, Columbia-Snake Customs
District, 2005
61a-d Volume and average value of lumber exports by port, Quarterly
species, and destination, Columbia-Snake Customs
District, all quarters 2005
62 Volume and average value of lumber exports by port, Annually, fourth quarter
species, and destination, San Francisco Customs
District, 2005
63a-d Volume and average value of lumber exports by port, Quarterly
species, and destination, San Francisco Customs
District, all quarters 2005
64 Volume and average value of lumber exports by port, Annually, fourth quarter
species, and destination, Anchorage Customs District,
2005
65 Volume and average value of lumber exports by port, Quarterly
species, and destination, Anchorage Customs District,
all quarters 2005
66 Volume and average value of softwood lumber exports Quarterly
to Canada from the Great Falls Customs District,
1994-2005
67 Volume and average value of hardwood lumber exports Quarterly
from Seattle, Columbia-Snake, Anchorage, and San
Francisco Customs Districts, 1994-2005
68 Volume of lumber exports from British Columbia Annually, fourth quarter
ports by species and destination, 1995-2005
69 Average value of lumber exports from British Annually, fourth quarter
Columbia ports by species and destination, 1995-2005
70 Volume of all species of softwood lumber imports Quarterly
into the Seattle Customs District, 1995-2005
71 Average value of all species of softwood lumber imports Quarterly
into the Seattle Customs District, 1995-2005
72 Volume of all species of softwood lumber imports Quarterly
into the Columbia-Snake Customs District, 1995-2005

Tables Included in This Series of Reports (continued)
TABLE FREQUENCY
NUMBER TABLE TITLE OF UPDATE
73 Average value of all species of softwood lumber imports Quarterly
into the Columbia-Snake Customs District, 1995-2005
74 Volume and average value of plywood exports from Quarterly
Seattle and Columbia-Snake Customs Districts by
destination, 1994-2005
75 Volume and average value of plywood exports from Quarterly
California, 1994-2005
76 Volume and average value of veneer exports from Quarterly
Seattle and Columbia-Snake Customs Districts by
destination, 1994-2005
Timber Cut and Sold by Public Agencies
77 Volume of timber sold on publicly owned or managed Quarterly
lands, Montana and Idaho, 2000-2005
78 Average stumpage prices of timber sold on publicly Quarterly
owned or managed lands, Montana and Idaho, 2000-2005
79 Volume of sawtimber sold on National Forests by Quarterly
selected species, Northern Region, 1995-2005
80 Average stumpage prices for sawtimber sold on Quarterly
National Forests by selected species, Northern
Region, 1995-2005
81 Volume and average value of timber harvested on Quarterly
the National Forests of the Northern Region, 2005
82 Volume of sawtimber sold on National Forests by Quarterly
selected species, Intermountain Region, 1995-2005
83 Average stumpage prices for sawtimber sold on Quarterly
National Forests by selected species, Intermountain
Region, 1995-2005
84 Volume and average value of timber harvested on the Quarterly
National Forests of the Intermountain Region, 2005
85 Volume of timber sold on publicly owned or managed Quarterly
lands in California, 2000-2005
86 Average stumpage prices of timber sold on publicly Quarterly
owned or managed lands in California, 2000-2005
87 Volume of sawtimber sold on National Forests by Quarterly
selected species, Pacific Southwest Region, 1995-2005
Tables Included in This Series of Reports (continued)
TABLE FREQUENCY
NUMBER TABLE TITLE OF UPDATE
88 Average stumpage prices for sawtimber sold on Quarterly
National Forests by selected species, Pacific
Southwest Region, 1995-2005
89 Volume and average value of timber harvested on the Quarterly
National Forests of the Pacific Southwest Region, 2005
90 Monthly stumpage volume and average value of timber Quarterly
sold on National Forest lands in Washington and
Oregon, 2003-2005
91 Volume of timber sold on publicly owned or managed Quarterly
lands, Washington and Oregon, 2001-2005
92 Average stumpage prices of timber sold on publicly Quarterly
owned or managed lands, Washington and Oregon,
2001-2005
93 Volume of sawtimber sold on National Forests by Quarterly
selected species, Pacific Northwest Region, 1994-2005
94 Average stumpage prices for sawtimber sold on Quarterly
National Forests by selected species, Pacific
Northwest Region, 1994-2005
95 Volume and average value of timber harvested on the Quarterly
National Forests of the Pacific Northwest Region, 2005
96 Volume and average stumpage price of selected species Quarterly
sold on the National Forests of the Pacific Northwest
Region, 2005
97 Volume of timber sold on publicly owned or managed Quarterly
lands in Alaska, 2000-2005
98 Average stumpage prices of timber sold on publicly Quarterly
owned or managed lands in Alaska, 2000-2005
99 Volume of sawtimber sold on National Forests by Quarterly
selected species, Alaska Region, 1994-2005
100 Average stumpage prices for sawtimber sold on Quarterly
National Forests by selected species, Alaska
Region, 1994-2005
101 Volume and average value of all species of all Quarterly
timber products sold from the USDA Forest Service
Regions of the Western United States, 1994-2005

Tables Included in This Series of Reports (continued)
TABLE FREQUENCY
NUMBER TABLE TITLE OF UPDATE
102 Volume and average value of all species of timber Quarterly
harvested from the USDA Forest Service Regions of
the Western United States, 1994-2005
Uncut Volume Under Contract
103 Uncut volume under contract on National Forest Annually, second quarter
lands in Montana, Idaho, California, Oregon, and
Washington, 1995-2005
104 Sale quantity and unyarded volume under contract Annually, second quarter
on Bureau of Land Management lands in Western
Oregon, 1995-2005
105 Allowable annual cut and uncut volume under Annually, third quarter
contract on Oregon State lands, 1995-2005
106 Sustainable harvest and uncut volume under Annually, second quarter
contract on Washington State lands, 1995-2005
Small Business Set-Aside Sales
107 Small business set-aside sales and total sales on Quarterly
the National Forests, Pacific Northwest Region,
2000-2005
108 Volume and average value of timber sold on set-aside Quarterly
sales on the National Forests, Pacific Northwest
Region, 2000-2005

Figures Included in This Series of Reports
and Frequency of Updates
PAGE FREQUENCY
NUMBER FIGURE TITLE OF UPDATE
19 Figure 1--Weighted average f.o.b. mill prices for Annually, fourth quarter
coast and inland lumber, 1995-2005, in dollars per
thousand board feet
26 Figure 2--Employment in forest products industry, Annually, fourth quarter
Washington and Oregon, 1995-2005, in thousands of
persons
42 Figure 3--Log exports from Seattle and Columbia-Snake Annually, fourth quarter
Customs Districts, 1995-2005, in million board feet
48 Figure 4--Log exports from San Francisco and Anchorage Annually, fourth quarter
Customs Districts, 1995-2005, in million board feet
89 Figure 5--Lumber exports from Seattle and Columbia- Annually, fourth quarter
Snake Customs Districts, 1995-2005, in million board feet
96 Figure 6--Lumber exports from San Francisco and Annually, fourth quarter
Anchorage Customs Districts, 1995-2005, in million board
feet
149 Figure 7--Average stumpage prices for sawtimber sold Annually, fourth quarter
on National Forests, Pacific Northwest Region, in dollars
per thousand board feet
159 Figure 8--Average value of all timber products sold Annually, fourth quarter
from Forest Service Regions of the Western United
States, in dollars per thousand board feet
Conversion Factors Used in This Report
For logs: 4.53 cubic meters equals 1 thousand board feet
For lumber: 2.36 cubic meters equals 1 thousand board feet
For veneer: 92.9 square meters equals 1 thousand square feet
For plywood: .885 cubic meters equals 1 thousand square feet (3/8-inch basis)
For chips and pulpwood: .907 metric tons equals 1 short ton

This Page Left Blank Intentionally

5
TABLES AND FIGURES

6
Table 1—U.S. softwood lumber and structural panel board production, 1994-2005
U.S. softwood lumber production
Year
Totalsoftwoodlumber
Westernregiona
Southernpine
regionOther
softwoods
U.S. softwoodstructural
panel boardproduction
Million feet,3/8-inch basis - - - - - - - - - - - - - - - - Million board feet - - - - - - - - - - - - - - - - -
1994 33,936 17,550 14,770 1,616 26,7881995 31,915 15,665 14,731 1,519 26,7661996 33,812 16,811 15,163 1,838 27,7871997 34,720 16,818 16,013 1,889 27,1511998 34,740 16,782 16,057 1,901 29,1281999 36,534 17,744 16,642 2,150 29,0342000 35,884 17,154 16,619 2,111 29,3812001 34,206 16,765 15,428 2,013 27,6532002 35,832 17,039 16,685 2,108 28,6262003 35,879 17,146 16,624 2,110 R28,3212004 R38,314 R18,762 17,306 2,246 28,9362005:
January 3,233 1,641 1,402 190 NAFebruary 3,220 1,579 1,451 189 NAMarch 3,596 1,781 1,603 212 NA
Total, 1st quarter 10,049 5,001 4,456 591 NA
April 3,486 1,643 1,638 205 NAMay 3,339 1,596 1,547 196 NAJune 3,534 1,663 1,663 208 NA
Total,2d quarter 10,359 4,902 4,848 609 NA
July 3,247 1,492 1,565 191 NAAugust 3,491 1,724 1,561 205 NASeptember 3,385 1,641 1,545 199 NA
Total,3d quarter 10,123 4,857 4,671 595 NA
October 3,574 1,686 1,678 210 NANovember 3,180 1,522 1,471 187 NADecember 3,051 1,432 1,440 179 NA
Total,4th quarter 9,805 4,640 4,589 576 NA
2005 total 40,336 19,400 18,564 2,371 29,315
R = revised.
NA = not available.
a Includes western, inland, and California redwood regions.
Note: As of November 2004, monthly statistics were no longer available from the American Plywood Association. This is the final issue for the last column. Source: Western Wood Products Association, Portland, Oregon, and American Plywood Association, Tacoma, Washington.

7
Table 2—Lum ber production in Northwest States, 1995-2005
(In m illion board feet)
Year W ashington Oregon Californiaa Montana Idaho
1995 4,095 4,953 3,169 1,191 1,662
1996 3,917 5,374 3,257 1,170 1,802
1997b 3,851 5,589 3,432 1,234 1,859
1998 3,913 5,486 3,188 1,304 1,908
1999 4,224 6,056 3,216 1,345 1,975
2000 4,384 5,927 3,173 1,177 1,896
2001 4,257 6,056 2,731 1,080 1,833
2002 4,625 6,177 2,634 1,143 1,906
2003 4,898 6,532 2,654 1,078 1,949
2004 5,455 7,126 2,763 985 1,964
2005 5,729 7,433 2,688 1,001 2,026
a Includes 1 mill in Nevada.
b Beginning in 1997, Oregon and W ashington figures reflect the elimination of hardwood production.
Source: W estern W ood Products Association, Portland, Oregon.
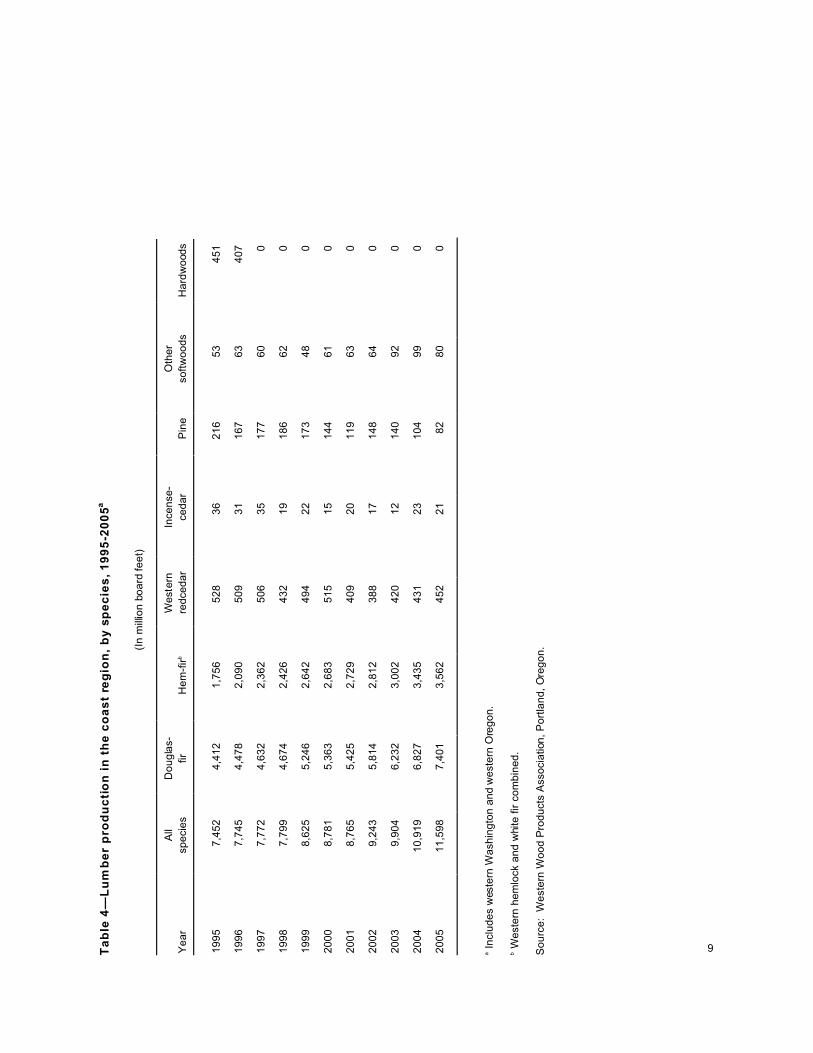
Ta
ble
4—
Lu
mb
er
pro
du
cti
on
in
th
e c
oa
st
reg
ion
, b
y s
pe
cie
s,
19
95
-20
05
a
(In
mill
ion
bo
ard
fe
et)
Ye
ar
All
sp
ecie
s
Do
ug
las-
fir
He
m-f
irb
West
ern
red
ce
da
r
Ince
nse
-
ce
da
rP
ine
Oth
er
so
ftw
oo
ds
Ha
rdw
ood
s
19
95
7,4
52
4,4
12
1,7
56
52
83
62
16
53
45
1
19
96
7,7
45
4,4
78
2,0
90
50
93
11
67
63
40
7
19
97
7,7
72
4,6
32
2,3
62
50
63
51
77
60
0
19
98
7,7
99
4,6
74
2,4
26
43
21
91
86
62
0
19
99
8,6
25
5,2
46
2,6
42
49
42
21
73
48
0
20
00
8,7
81
5,3
63
2,6
83
51
51
51
44
61
0
20
01
8,7
65
5,4
25
2,7
29
40
92
01
19
63
0
20
02
9,2
43
5,8
14
2,8
12
38
81
71
48
64
0
20
03
9,9
04
6,2
32
3,0
02
42
01
21
40
92
0
20
04
10
,91
96
,82
73
,43
54
31
23
10
49
90
20
05
11
,59
87
,40
13
,56
24
52
21
82
80
0
a I
nclu
de
s w
este
rn W
ash
ing
ton
an
d w
este
rn O
reg
on
.
b W
este
rn h
em
lock a
nd
whi
te f
ir c
om
bin
ed
.
So
urc
e:
We
ste
rn W
oo
d P
rod
ucts
Asso
cia
tion
, P
ort
lan
d,
Ore
go
n.
9

Ta
ble
3—
So
ftw
oo
d l
um
be
r p
rod
uc
tio
n i
n t
he
in
lan
d r
eg
ion
, b
y s
pe
cie
s,
19
95
-20
05
a
(In
mill
ion
bo
ard
fe
et)
Ye
ar
All
so
ftw
oo
ds
Po
nd
ero
sa
pin
e
Ida
ho
wh
ite
pin
e
Su
ga
r
pin
e
Do
ug
las-f
ir
an
d
larc
hH
em
-fir
b
En
ge
lma
nn
sp
ruce
Lo
dg
ep
ole
pin
e
Oth
er
so
ftw
oo
ds
19
95
7,0
15
2,2
04
40
98
1,7
45
1,6
49
30
65
83
39
0
19
96
7,0
79
2,1
46
33
12
21
,82
51
,59
73
35
61
24
09
19
97
7,3
82
2,0
77
31
13
82
,05
51
,70
83
34
65
23
87
19
98
7,2
97
1,8
32
33
10
22
,13
61
,76
63
44
72
23
62
19
99
7,5
76
1,8
03
36
12
22
,13
81
,89
14
30
76
53
91
20
00
7,0
76
1,7
37
36
11
02
,10
11
,76
13
45
58
24
04
20
01
6,5
63
1,5
55
32
13
31
,99
11
,66
52
73
60
03
14
20
02
6,7
60
1,5
50
36
10
92
,04
71
,76
12
60
64
53
52
20
03
6,7
17
1,5
22
23
10
52
,05
41
,91
22
42
54
43
15
20
04
6,7
77
1,5
99
25
99
2,0
65
1,9
57
22
54
65
34
3
20
05
6,6
87
1,5
46
33
87
2,1
65
1,8
18
28
13
63
39
4
a I
nclu
des e
aste
rn W
ash
ing
ton,
ea
ste
rn O
reg
on
, C
alif
orn
ia (
exc
ep
t re
dw
ood
reg
ion
), N
eva
da
, Id
ah
o, M
on
tan
a,
Wyo
min
g,
Uta
h,
Co
lora
do,
Ari
zon
a,
Ne
w M
exic
o,
an
d a
po
rtio
n o
f S
ou
th D
ako
ta.
b W
este
rn h
em
lock a
nd w
hite
fir.
So
urc
e:
We
ste
rn W
oo
d P
rod
ucts
Asso
cia
tion
, P
ort
lan
d,
Ore
go
n.
8

10
Table 5—Softwood structural panel board production in the United States, by State, 1995-2005a
(In million square feet, 3/8-inch basis)
Year Total Oregon Washington
Oklahoma, NewYork, Colorado,and Tennessee
Montanaand
Idahob
SouthernStatesc
NorthernStatesd
1995 27,270 3,824 1,140 NA 1,351 17,202 3,752
1996 28,495 3,773 1,045 1,180 1,262 18,747 3,668
1997 28,497 3,471 986 1,162 1,024 18,367 3,487
1998 29,003 3,492 978 1,323 980 18,496 3,733
1999 29,428 3,510 1,152 1,385 1,031 18,463 3,887
2000 29,441 3,696 989 1,558 918 18,446 3,834
2001 27,653 3,348 836 1,818 562 17,164 3,925
2002 28,626 3,058 1,133 1,905 553 17,833 4,144
2003 28,321 3,214 969 1,907 438 17,571 4,222
2004 28,936 3,143 1,063 2,305 444 17,786 4,196
2005 29,315 3,033 1,092 2,757 408 17,819 4,206
a Structural panel board includes plywood, waferboard, and oriented strand board (OSB).
b Since 2001, these figures are Montana only. Idaho has been combined with the previous column “Oklahoma, New York,Colorado, and Tennessee” since 2001.
C Southern states include Alabama, Arkansas, Florida, Georgia, Louisiana, Maryland, Mississippi, North Carolina,South Carolina, Texas, Virginia, and West Virginia.
d Northern states include Maine, Michigan, Minnesota, New Hampshire, and Wisconsin.
Source: American Plywood Association.
Table 6—Softwood lumber and plywood production in British Columbia, 1995-2005
Year
Softwood lumber production Softwoodplywood
productionTotal Coast Interior
- - - - - - - - - - - - - Million board feet - - - - - - - - - - - - - Million ft2,
3/8-inch basis
1995 13,820 3,313 10,507 1,722
1996 13,845 3,387 10,458 1,671
1997 13,376 3,032 10,344 1,668
1998 12,814 2,684 10,130 1,574
1999 13,490 2,809 10,681 1,739
2000 13,627 2,851 10,776 1,737
2001 13,770 3,141 10,629 1,770
2002 15,112 3,096 12,015 1,893
2003 15,292 3,302 11,990 1,958
2004 R16,898 R2,664 R14,234 NA
2005 17,381 2,500 14,881 NA
R = revised.
NA = not available.
Source: Statistics Canada, Ottawa, Canada, and Council of Forest Industries.

11
Table 7—W holesale prices of selected lumber products, 1994-2005
(In dollars per thousand board feet)
Year
Douglas-firstd. and btr.,2 by 4 RL,8/20', KD,
net, f.o.b. mill
Ponderosa pineboards, no. 3,
1 by 12 RL, KD,net, f.o.b. mill
Ponderosa pine,no. 2 shop,
6/4 RWRL, S2S,net, f.o.b. mill
Fir-larchstd. and btr.,2 by 4 RL,8/20', KD,
net, f.o.b. mill
Spruce-pine-firstd. and btr.,2 by 4 RL,8/20', KD,
net, f.o.b. mill
1994 408.92 533.06 1,028.79 398.65 344.251995 332.49 468.38 970.40 325.92 250.881996 421.77 461.58 919.19 420.28 350.801997 417.49 545.96 1,008.33 408.08 354.471998 339.98 384.92 879.90 340.07 288.311999 409.33 464.06 903.33 406.37 342.992000 340.33 364.71 876.02 341.37 257.582001 333.72 346.92 921.09 333.07 250.332002 328.18 331.87 953.88 326.68 236.352003 347.25 360.98 866.75 345.73 261.232004 458.67 471.46 1,051.58 461.57 386.722005:
January 400.00 413.75 1,025.00 406.75 360.25February 445.00 447.25 1,025.00 441.00 407.25March 453.75 447.50 1,020.00 451.25 408.50
Average,1st quarter 432.92 436.17 1,023.33 433.00 392.00
April 405.00 437.00 1,018.00 430.40 373.40May 371.25 358.75 988.75 385.50 343.00June 402.50 348.75 963.75 400.00 348.00
Average,2d quarter 392.92 381.50 990.17 405.30 354.80
July 389.00 340.00 896.00 392.60 328.40August 390.00 305.75 826.25 382.50 298.50September 428.40 347.00 815.00 421.60 335.40
Average,3d quarter 402.47 330.92 845.75 398.90 320.77
October 392.50 413.75 815.00 402.00 306.25November 388.50 435.00 830.00 388.25 320.00December 402.00 415.00 865.00 400.00 333.25
Average,4th quarter 394.33 421.25 836.67 396.75 319.83
2005 average 405.66 392.46 923.98 408.49 346.85
- - - - - - - - - - - - - - - - - - - - - - - - - Year-end 2005 change, in percent - - - - - - - - - - - - - - - - - - - - - -
From:Year-end 2004 -11.56 -16.76 -12.13 -11.50 -10.31
Source: Random Lengths Publications, Inc.
12
Table 8—W holesale prices of selected softwood plywood products, 1994-2005
(In dollars per thousand square feet)
Year
Sheathing, westernexterior, 3/8-inch,CD, net f.o.b. mill
Sheathing, southern(west)a exterior,3/8-inch, CD,net f.o.b. mill
Sanded, westerninterior, 1/4-inch,AD, net f.o.b. mill
1994 251.93 239.40 326.821995 256.93 241.71 337.561996 230.08 200.75 339.231997 240.38 212.81 363.521998 235.69 225.83 359.691999 282.72 259.75 401.202000 227.67 213.37 347.502001 224.26 216.58 342.532002 221.82 203.83 329.592003 271.71 269.69 358.812004 374.80 346.92 526.692005:
January 303.75 298.75 462.50February 333.75 311.25 460.00March 325.00 307.50 460.00
Average,1st quarter 320.83 305.83 460.83
April 305.00 288.00 460.00May 311.75 281.25 460.00June 317.25 287.50 460.00
Average,2d quarter 311.33 285.58 460.00
July 303.00 272.00 460.00August 296.25 258.75 457.50September 368.00 359.00 460.00
Average, 3d quarter 322.42 296.58 459.17
October 366.25 357.50 470.00November 313.75 273.75 470.00December 311.25 276.25 470.00
Average, 4th quarter 330.42 302.50 470.00
2005 average 321.25 297.62 462.50
- - - - - - - - - Year-end 2005 change, in percent - - - - - - - - - From: Year-end 2004 -14.29 -14.21 -12.19
a Texas, Louisiana, and Arkansas.
Source: Random Lengths Publications, Inc.
Ta
ble
9—
Pe
rce
nta
ge
of
tota
l v
olu
me
an
d f
.o.b
. m
ill
pri
ce
s f
or
Do
ug
las
-fir
lu
mb
er,
co
as
t m
ills
, 1
99
4-2
00
5a
(Volu
me in t
housa
nd b
oard
feet; p
rice
in d
olla
rs p
er
thousa
nd b
oard
feet)
C s
ele
cts
D s
ele
cts
an
d s
ho
pS
tru
ctu
ral
item
sH
eavy
fra
min
gL
igh
tfr
am
ing
Utilit
yE
con
om
y
Ye
ar
Pe
rce
nt
Pri
ce
Pe
rce
nt
Pri
ce
Pe
rce
nt
Pri
ce
Pe
rce
nt
Pri
ce
Pe
rce
nt
Pri
ce
Pe
rce
nt
Pri
ce
Pe
rce
nt
Pri
ce
To
tal vo
lum
e,
all
gra
de
s
19
94
0.1
1,4
13
0.8
75
21
1.5
47
82
3.5
48
55
5.0
38
55
.32
94
3.8
14
82
,70
0,8
41
19
95
.11
,17
2.7
69
91
2.2
44
82
1.9
44
25
7.2
33
04
.92
24
3.0
14
22
,43
6,3
90
19
96
0
--.7
66
81
0.1
51
92
1.8
48
56
0.1
39
23
.52
61
3.8
13
42
,38
5,2
59
19
97
0
--.4
71
19
.15
30
23
.24
99
59
.93
97
3.4
27
44
.01
64
2,3
45
,06
6
19
98
0
--.4
65
59
.24
21
24
.13
83
59
.03
25
3.6
26
63
.71
43
2,3
27
,07
4
19
99
0
--.2
67
68
.64
63
23
.64
67
60
.33
90
3.7
26
83
.61
37
2,4
98
,11
8
20
00
0
--.2
63
17
.54
25
22
.14
12
62
.63
39
3.8
22
03
.81
25
2,7
33
,32
6
20
01
0
--.1
59
87
.03
89
23
.33
82
62
.83
19
3.7
20
13
.21
11
2,6
12
,46
0
20
02
0
--.1
66
68
.63
61
23
.53
67
61
.43
09
3.3
20
13
.01
19
2,7
98
,25
4
20
03
0
--.3
62
29
.53
76
23
.74
00
60
.13
18
3.5
20
33
.01
10
2,8
03
,40
4
20
04
0
--.2
66
11
0.5
46
72
2.9
49
65
9.5
42
13
.42
91
3.5
16
82
,74
8,9
88
20
05
:
1st
qu
art
er
0
--.2
61
78
.24
36
19
.74
79
65
.23
95
3.3
29
63
.51
57
92
9,9
17
2d
qu
art
er
0
--.2
65
08
.64
30
19
.04
33
65
.73
83
3.6
29
73
.01
80
1,1
40
,50
3
3d
qu
art
er
0
--.1
67
78
.34
15
18
.44
49
66
.03
79
3.6
27
43
.61
46
1,0
84
,01
2
4th
quart
er
0
--.1
66
28
.74
40
18
.34
72
65
.23
66
4.1
26
13
.51
28
96
2,4
52
20
05
ave
rag
e0
--
.16
49
8.5
43
01
8.8
45
76
5.6
38
13
.62
81
3.4
15
34
,11
6,8
84
a F
igu
res a
re a
volu
me
-we
igh
ted
ave
rag
e o
f g
ree
n a
nd
dry
su
rfa
ce
d a
nd
rou
gh
gra
de
s.
So
urc
e:
Da
ta a
re c
om
pile
d b
y W
este
rn W
oo
d P
rod
ucts
Asso
cia
tio
n f
rom
co
pie
s o
f in
vo
ice
s s
ub
mitte
d t
o t
he
Asso
cia
tio
n b
y m
ills a
cco
untin
g f
or
abo
ut
65
to
70
pe
rce
nt o
f th
e r
eg
ion
'sp
rod
uctio
n;
ind
ivid
ua
l gro
up
ing
s f
rom
Pa
cific
No
rth
we
st
Re
se
arc
h S
tatio
n.
13

Ta
ble
10
—P
erc
en
tag
e o
f to
tal
vo
lum
e f
or
po
nd
ero
sa
pin
e l
um
be
r, i
nla
nd
mil
ls,
19
94
-20
05
a
(In
tho
usa
nd
bo
ard
fe
et)
4/4
se
lects
an
d 1
sh
op
5/4
an
d t
hic
ke
r m
ou
ldin
g a
nd s
ho
ps
4/4
com
mons
and 8
/4 s
td.
& b
tr.
Lo
w v
alu
e
Ye
ar
C a
nd
btr
.6
-12
in.
D
12
in
.
C a
nd b
tr.
4 in.
D
6-1
0 in
.D
4 in
.1
sh
op
Mld
g.
an
d
btr
.1
sh
op
2sh
op
3sh
op
Sh
op
ou
t2
com
.1
2 in
.
2 c
om
.4
-10
in.
3 c
om
.6
-12
in
.8
/4d
im.
3 c
om
.4
in
.4
com
.4
-12
in
.
No
. 3
an
du
til
5 c
om
.a
nd
eco
n.
To
tal
vo
lum
e,
all
gra
de
s
19
94
0.3
0.1
0.2
0.5
1.4
4.1
1.5
10
.82
0.8
14
.73
.41
0.4
23
.55
.51
.31
.51
,71
2,9
68
19
95
.3.1
.2.4
1.5
3.8
1.3
10
.22
1.0
15
.04
.01
1.9
22
.15
.81
.31
.11
,51
9,0
49
19
96
.3.1
.2.4
1.5
3.3
1.2
9.4
20
.81
7.7
3.5
12
.12
1.2
6.2
1.1
1.1
1,4
21
,09
0
19
97
.2.1
.2.4
1.5
2.4
1.0
7.8
19
.61
6.0
4.0
14
.62
3.5
6.7
1.0
1.2
1,3
04
,34
9
19
98
.20
.2.5
1.1
2.7
1.1
8.3
21
.21
5.0
3.9
14
.82
2.8
6.5
.81
.01
,28
1,0
67
19
99
.20
.1.4
1.2
2.4
.98
.32
1.9
15
.34
.01
4.0
23
.26
.11
.0.9
1,2
77
,16
4
20
00
.20
.1.4
1.1
2.4
.77
.42
0.3
12
.64
.51
5.6
25
.96
.61
.1.9
1,1
59
,78
6
20
01
.20
.2.4
1.2
1.8
.77
.01
9.0
11
.44
.11
6.0
28
.77
.31
.11
.01
,07
0,0
41
20
02
.20
.1.5
1.2
1.6
.77
.01
8.7
9.6
4.5
17
.22
9.0
7.9
.91
.09
83
,26
1
20
03
.20
.2.5
1.1
1.9
.55
.61
7.4
5.8
5.2
19
.93
1.1
7.7
1.6
1.4
88
6,5
01
20
04
.20
.2.5
1.2
1.8
.66
.11
9.2
7.3
4.6
18
.23
0.1
7.0
1.3
1.5
96
4,7
83
20
05
:
1st
qu
art
er
.20
.2.4
1.2
1.7
.77
.72
2.3
7.1
4.2
15
.82
8.4
6.5
1.8
1.6
25
7,3
53
2d
qu
art
er
.20
.2.4
1.2
1.3
.56
.42
0.8
7.1
5.2
17
.33
0.7
6.0
1.0
1.5
26
6,1
24
3d
qu
art
er
.20
.2.4
1.0
1.2
.66
.72
0.0
5.7
3.9
13
.43
8.1
6.0
1.1
1.6
27
2,6
55
4th
qu
art
er
.2.1
.2.4
1.3
1.4
.98
.02
1.8
6.6
4.5
16
.42
7.9
6.9
2.1
1.3
22
1,7
35
20
05
ave
rag
e.2
0.2
.41
.21
.4.7
7.3
21
.76
.84
.61
6.0
30
.06
.51
.51
.59
96
,12
6
a F
igu
res a
re a
volu
me
-we
igh
ted
ave
rag
e o
f g
ree
n a
nd
dry
su
rfa
ce
d a
nd
rou
gh
gra
de
s.
So
urc
e:
Da
ta a
re c
om
pile
d b
y W
este
rn W
oo
d P
rod
ucts
Asso
cia
tio
n f
rom
co
pie
s o
f in
vo
ice
s s
ub
mitte
d t
o t
he
asso
cia
tio
n b
y m
ills a
cco
un
tin
g f
or
ab
ou
t 8
0 p
erc
en
t o
f th
e r
eg
ion
'sp
rod
uctio
n;
ind
ivid
ua
l gro
up
ing
s f
rom
Pa
cific
No
rth
we
st
Re
se
arc
h S
tatio
n.
14

Ta
ble
11
—F
.O.B
. m
ill
pri
ce
s f
or
po
nd
ero
sa
pin
e l
um
be
r, i
nla
nd
mil
ls,
19
94
-20
05
(In
do
lla
rs p
er
tho
usa
nd
bo
ard
fe
et)
4/4
se
lects
an
d 1
sh
op
5/4
an
d t
hic
ke
r m
ou
ldin
g a
nd
sh
op
s4
/4 c
om
mo
ns a
nd
8/4
std
. &
btr
.L
ow
va
lue
Ye
ar
C a
nd
btr
.6
-12
in.
D1
2 in
.
C a
nd
btr
.4
in
D6
-10
in
.D
4 in
.1
sh
op
Mld
g.
an
db
tr.
1sh
op
2sh
op
3sh
op
Sh
op
ou
t2
co
m.
12
in
.2 c
om
.4
-10
in.
3 c
om
.6
-12
in
.8
/4d
im.
3 c
om
.4
in
.4
co
m.
4-1
2 in
.
No
. 3
an
d
util.
5 c
om
.a
nd
eco
n.
19
94
2,3
47
2,3
43
1,3
16
88
08
00
1,7
53
1,1
45
1,0
17
70
14
48
80
35
69
41
33
02
25
41
57
19
95
1,8
87
1,9
82
1,0
95
73
75
50
1,4
91
1,0
89
97
26
61
41
06
95
50
73
67
25
12
15
15
8
19
96
1,5
69
1,2
51
1,0
71
80
25
85
1,3
81
1,0
05
89
96
92
42
76
83
54
43
61
25
02
24
14
1
19
97
2,1
23
1,5
71
1,3
66
90
66
72
1,6
59
1,1
41
1,0
24
76
64
82
82
56
02
42
73
02
24
81
69
19
98
2,1
16
1,6
08
1,2
02
71
14
62
1,4
80
1,0
06
89
26
15
41
46
85
51
53
37
27
82
13
15
5
19
99
2,1
29
1,6
15
1,2
66
79
65
62
1,5
79
1,0
36
91
36
95
45
88
08
54
83
85
27
52
19
14
3
20
00
1,9
08
1,4
80
1,1
06
70
55
06
1,4
28
1,0
24
89
36
11
37
66
76
49
43
28
24
21
87
13
6
20
01
1,6
91
1,4
40
1,0
00
68
74
84
1,6
77
1,0
47
92
26
02
32
56
84
45
32
83
20
11
64
11
0
20
02
2,0
76
1,5
00
1,0
59
61
84
36
1,7
10
1,0
92
95
46
20
35
57
20
49
22
94
22
81
67
12
6
20
03
1,6
51
1,2
91
78
66
50
45
31
,39
31
,01
58
83
48
32
61
56
94
68
30
02
36
15
71
20
20
04
1,7
01
1,5
13
93
56
76
61
21
,62
41
,17
31
,04
96
87
37
87
56
53
73
81
31
62
43
17
9
20
05
:
1st
qu
art
er
1,7
23
1,5
99
1,0
06
66
85
67
1,4
58
1,1
52
1,0
28
59
13
05
80
35
35
37
52
99
22
31
59
2d q
uart
er
1,8
39
1,7
46
1,0
59
69
15
77
1,4
68
1,1
26
1,0
07
57
83
33
64
94
87
34
83
15
25
11
89
3d
qu
art
er
1,8
65
1,8
41
1,0
76
70
45
77
1,3
85
1,0
23
89
94
93
31
45
38
50
92
47
32
92
26
16
6
4th
qu
art
er
1,6
29
1,5
63
1,0
05
68
65
75
1,3
71
1,0
20
90
75
40
35
05
44
51
13
45
33
02
02
16
2
20
05
ave
rag
e1
,76
51
,66
51
,03
76
88
57
41
,42
61
,07
69
61
55
23
25
63
75
10
34
43
18
22
21
69
So
urc
e:
Da
ta a
re c
om
pile
d b
y W
este
rn W
oo
d P
rod
ucts
Asso
cia
tio
n f
rom
co
pie
s o
f in
vo
ice
s s
ub
mitte
d t
o t
he
asso
cia
tio
n b
y m
ills a
cco
un
tin
g f
or
ab
ou
t 8
0 p
erc
en
t o
f th
e r
eg
ion
'sp
rod
uctio
n;
ind
ivid
ua
l gro
up
ing
s f
rom
Pa
cific
No
rth
we
st
Re
se
arc
h S
tatio
n.
15

Ta
ble
12
—P
erc
en
tag
e o
f to
tal
vo
lum
e a
nd
f.o
.b.
mil
l p
ric
es
fo
r h
em
-fir
lu
mb
er,
in
lan
d m
ills
, 1
99
4-2
00
5a
(Vo
lum
e in
tho
usa
nd
bo
ard
fe
et; p
rice
in d
olla
rs p
er
tho
usa
nd
bo
ard
fe
et)
Mo
uld
ing
Sh
op
Str
uctu
ral
item
sH
eavy
fra
min
gL
igh
tfr
am
ing
Utilit
yE
con
om
y
Ye
ar
Pe
rce
nt
Pri
ce
Pe
rce
nt
Pri
ce
Pe
rce
nt
Pri
ce
Pe
rce
nt
Pri
ce
Pe
rce
nt
Pri
ce
Pe
rce
nt
Pri
ce
Pe
rce
nt
Pri
ce
To
tal
vo
lum
e,
all
gra
de
s
19
94
1.0
1,1
11
3.8
65
03
.94
69
29
.34
51
48
.43
98
9.1
30
04
.51
53
1,3
05
,57
2
19
95
.81
,13
33
.96
02
3.8
40
72
9.1
39
94
8.1
32
51
0.1
24
44
.31
40
1,1
03
,31
5
19
96
.81
,14
94
.25
84
3.5
45
42
5.6
43
15
3.7
39
27
.42
41
4.9
14
01
,08
7,9
99
19
97
.89
55
3.6
64
13
.44
89
30
.04
79
50
.13
96
7.5
26
24
.71
74
1,1
76
,94
8
19
98
.69
56
2.8
49
54
.33
71
26
.23
35
54
.93
32
6.9
22
44
.31
50
1,2
37
,28
2
19
99
.61
,06
42
.16
03
5.2
44
82
8.0
44
05
3.3
37
96
.82
38
4.1
14
21
,36
2,7
60
20
00
.61
,02
62
.15
62
5.6
38
72
6.8
35
25
4.6
32
36
.02
06
4.3
13
51
,26
0,8
07
20
01
.57
32
1.6
43
86
.43
47
25
.73
11
55
.53
02
5.8
18
94
.51
15
1,1
65
,61
0
20
02
.38
58
2.0
53
76
.63
51
22
.73
13
58
.32
99
5.2
19
14
.91
24
1,1
38
,73
1
20
03
.39
86
1.1
45
47
.73
37
23
.92
89
56
.42
85
5.5
17
45
.11
17
1,2
72
,94
9
20
04
.31
,11
11
.16
89
8.3
44
92
3.7
39
65
6.3
40
15
.52
47
4.9
18
41
,39
9,5
51
20
05
:
1st
qu
art
er
.19
51
.16
61
9.8
44
72
2.3
42
85
5.4
40
66
.42
32
5.8
16
03
18
,58
3
2d
qu
art
er
.18
97
.76
86
10
.04
22
22
.74
11
56
.03
88
5.7
26
84
.81
91
27
4,5
83
3d
qu
art
er
.19
92
.36
08
9.2
40
02
5.2
37
35
3.4
33
65
.92
25
5.9
16
53
18
,60
44
th q
ua
rte
r.1
78
6.4
58
68
.44
03
19
.73
39
60
.33
42
5.8
20
75
.31
52
33
5,2
91
20
05
ave
rag
e.1
88
5.4
63
79
.34
19
22
.43
87
56
.33
67
6.0
23
15
.51
65
1,2
47
,06
1
a F
igu
res a
re a
volu
me
-we
igh
ted
ave
rag
e o
f g
ree
n a
nd
dry
su
rfa
ce
d a
nd
rou
gh
gra
de
s.
So
urc
e:
Da
ta a
re c
om
pile
d b
y W
este
rn W
oo
d P
rod
ucts
Asso
cia
tio
n fr
om
co
pie
s o
f in
vo
ice
s s
ubm
itte
d to
the A
sso
cia
tio
n b
y m
ills a
cco
un
tin
g fo
r ab
ou
t 80
pe
rce
nt o
f th
e re
gio
n's
pro
du
ctio
n;
ind
ivid
ua
l gro
up
ings
fro
m P
acific
No
rth
we
st
Re
se
arc
h S
tatio
n.
16
Ta
ble
13
—P
erc
en
tag
e o
f to
tal
vo
lum
e a
nd
f.o
.b.
mil
l p
ric
es
fo
r h
em
-fir
lu
mb
er,
co
as
t m
ills
, 1
99
4-2
00
5a
(Vo
lum
e in
tho
usa
nd
bo
ard
fe
et; p
rice
in d
olla
rs p
er
tho
usa
nd
bo
ard
fe
et)
C s
ele
cts
D s
ele
cts
an
d s
ho
pS
tru
ctu
ral
item
sH
eavy
fra
min
gL
igh
tfr
am
ing
Utilit
yE
con
om
y
Pe
rce
nt
Pri
ce
Pe
rce
nt
Pri
ce
Pe
rce
nt
Pri
ce
Pe
rce
nt
Pri
ce
Pe
rce
nt
Pri
ce
Pe
rce
nt
Pri
ce
Pe
rce
nt
Pri
ce
To
tal vo
lum
e,
all
gra
de
s
19
94
0--
0.6
59
64
.14
36
19
.04
52
62
.63
84
6.7
26
87
.01
64
1,1
80
,70
5
19
95
0--
.55
90
3.7
35
72
2.9
39
75
9.1
31
27
.62
09
6.2
15
41
,00
1,1
87
19
96
0--
.55
93
3.4
42
42
0.5
43
66
1.2
37
67
.42
43
7.0
14
81
,17
7,4
93
19
97
0--
.45
60
2.5
45
12
0.0
46
96
2.1
37
57
.92
63
7.2
17
61
,39
5,8
81
19
98
0--
.24
99
2.3
37
12
1.3
34
36
2.8
31
47
.92
27
5.5
15
31
,34
5,8
36
19
99
0--
.15
68
2.0
43
61
9.6
43
86
5.8
35
97
.32
55
5.1
14
41
,50
4,2
06
20
00
0--
.25
21
2.0
37
51
9.5
35
76
5.7
30
07
.42
09
5.3
13
41
,54
3,5
82
20
01
0--
.13
95
2.6
34
32
0.3
30
56
6.3
28
06
.01
87
4.8
12
41
,56
7,0
09
20
02
0--
.14
48
2.5
34
11
9.1
30
96
6.8
28
05
.81
87
5.7
13
21
,63
7,8
29
20
03
0--
.24
66
3.5
32
62
0.0
29
96
5.2
27
75
.21
73
5.9
12
31
,71
3,9
22
20
04
0--
.15
27
2.8
43
01
9.7
39
86
7.9
38
33
.52
33
5.9
18
41
,80
3,7
95
20
05
:
1st
qu
art
er
0--
.14
71
1.9
43
81
6.0
43
87
1.7
41
53
.92
47
6.4
17
24
79
,51
5
2d
qu
art
er
0--
.14
80
1.5
39
71
7.7
40
07
0.0
35
43
.92
60
6.7
19
65
15
,11
8
3d
qu
art
er
0--
.14
62
1.9
36
91
6.9
36
97
0.2
32
64
.12
25
6.8
16
95
30
,98
1
4th
qu
art
er
0--
.14
46
1.9
39
61
7.2
34
87
0.0
33
24
.12
10
6.7
15
25
05
,55
4
20
05
ave
rag
e0
--.1
46
51
.83
99
17
.03
87
70
.53
56
4.0
23
56
.71
72
2,0
31
,16
8
a F
igu
res a
re a
volu
me
-we
igh
ted
ave
rag
e o
f g
ree
n a
nd
dry
su
rfa
ce
d a
nd
rou
gh
gra
de
s.
So
urc
e:
Da
ta a
re c
om
pile
d b
y W
este
rn W
oo
d P
rod
ucts
Asso
cia
tio
n f
rom
co
pie
s o
f in
vo
ice
s s
ub
mitte
d t
o t
he
Asso
cia
tio
n b
y m
ills a
cco
untin
g f
or
app
roxim
ate
ly 6
5 t
o 7
0 p
erc
en
t o
f th
ere
gio
n's
pro
du
ctio
n;
ind
ivid
ua
l g
rou
pin
gs f
rom
Pa
cific
No
rth
we
st R
ese
arc
h S
tatio
n.
17

18
Table 14—W eighted average f.o.b. mill prices for coast and inland lumber, 1994-2005
(In dollars per thousand board feet)
Coast Inland
Year Douglas-fir Hem-firWeightedaverage
Ponderosapine Hem-fir
Weightedaverage
1994 409 377 399 645 413 545
1995 361 317 348 580 351 483
1996 413 365 397 568 395 493
1997 420 373 403 627 417 527
1998 340 306 328 536 327 433
1999 402 357 385 579 389 487
2000 350 298 331 504 328 420
2001 328 274 308 468 297 379
2002 318 274 302 490 298 387
2003 334 269 309 432 279 342
2004:
1st quarter 383 324 360 525 337 407
2d quarter 468 388 438 569 413 476
3d quarter 486 424 460 542 446 489
4th quarter 380 346 366 530 359 430
2004 average 430 370 406 551 390 456
2005:
1st quarter 404 397 401 531 390 453
2d quarter 388 349 376 498 383 440
3d quarter 383 320 362 422 336 376
4th quarter 379 319 358 492 330 395
2005 average 388 346 374 495 359 419
Note: Weighted averages are based on the volume of all grades combined.
Source: Western Wood Products Association.
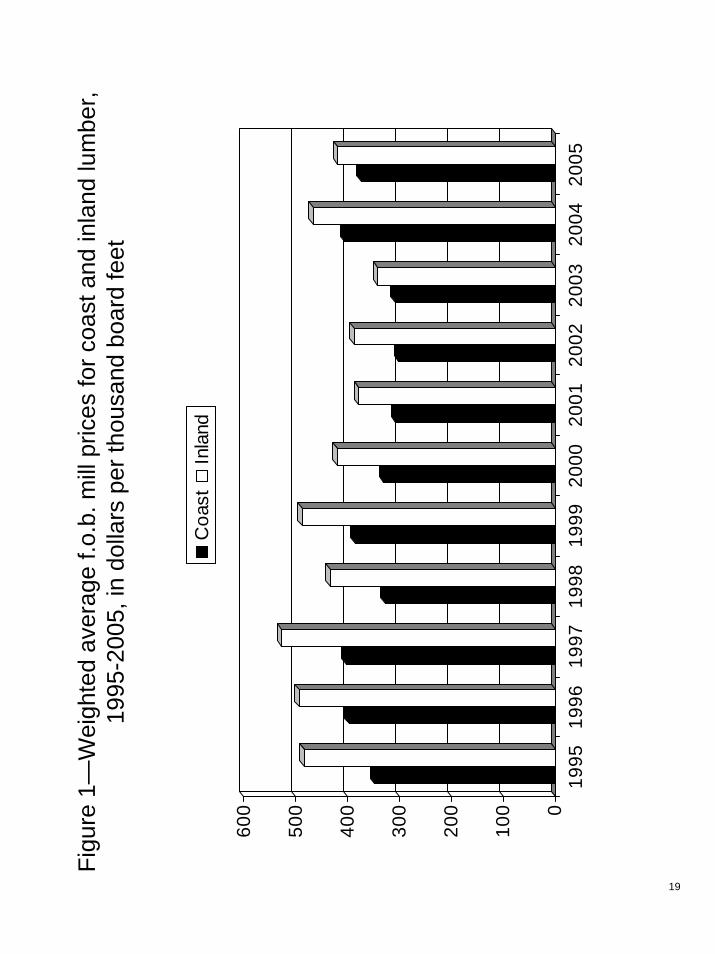
Figu
re 1
—W
eigh
ted
aver
age
f.o.b
. mill
pric
es fo
r coa
st a
nd in
land
lum
ber,
1995
-200
5, in
dol
lars
per
thou
sand
boa
rd fe
et
0
100
200
300
400
500
600
1995
1996
1997
1998
1999
2000
2001
2002
2003
2004
2005
Coa
stIn
land
19

20
Table 15—Average prices for domestic and exported alder, western
region, 1994-2005
(Prices in dollars per thousand board feet, f.o.b. mill)
Domestic alder Exported alder
Year and
quarter
1 by 4 green
pallet stock
4/4 select
and better Logs Lumber
1994 268.80 1,236.06 1,651.04 1,249.99
1995 260.00 1,210.00 536.43 1,098.04
1996 NA NA 513.97 1,139.34
1997 NA NA 669.27 1,127.64
1998 NA NA 978.17 1,007.67
1999 NA NA 668.05 1,026.34
2000 NA NA 1,268.19 958.74
2001 NA NA 1,523.69 881.48
2002 NA NA 1,488.35 839.24
2003 NA NA 1,463.33 862.47
2004:
1st quarter NA NA 1,595.40 859.04
2d quarter NA NA 1,515.85 827.96
3d quarter NA NA 1,574.07 794.90
4th quarter NA NA 1,606.44 807.47
2004 average NA NA 1,567.08 820.17
2005:
1st quarter NA NA 1,636.08 909.30
2d quarter NA NA 1,536.08 940.87
3d quarter NA NA 1,300.79 966.74
4th quarter NA NA 1,414.63 921.58
2005 average NA NA 1,486.05 934.77
NA = no longer available.
Source: W eekly Hardwood Review and U.S. Department of Commerce.

21
Table 16—W ashington and Oregon timber harvest by ownership, 1995-2005
(In million board feet, Scribner scale)
State andyear Private State
NationalForest
Bureauof Land
Management
Bureauof IndianAffairs
Otherpublic Total
Washington:
1995 3,490 496 150 a 230 26 4,393
1996 3,274 600 182 a 270 40 4,366
1997 3,139 645 166 a 226 44 4,221
1998 3,044 546 111 a 275 46 4,022
1999 3,246 662 117 a 334 24 4,383
2000 3,131 559 81 a 334 24 4,130
2001 2,818 496 68 a 324 11 3,716
2002 2,722 457 72 a 319 12 3,582
2003 2,697 567 80 a 161 34 3,539
2004 2,754 NA 119 NA NA NA 3,489
2005 2,609 NA 95 NA NA NA 3,316
Oregon:
1995 3,432 109 515 139 79 30 4,304
1996 3,018 115 401 289 71 29 3,923
1997 3,133 176 523 136 79 35 4,081
1998 2,840 141 333 122 71 25 3,532
1999 3,014 246 233 150 68 49 3,759
2000 3,167 255 245 83 62 42 3,854
2001 2,905 268 135 38 63 30 3,440
2002 3,319 269 166 55 71 42 3,922
2003 3,313 293 203 78 63 52 4,002
2004 3,606 291 337 96 79 42 4,451
2005 3,495 341 275 121 61 61 4,355
NA = not available.
a Less than 1 million board feet.
Source: Washington Department of Natural Resources and Oregon Department of Forestry.
22
Table 17—British Columbia log production, 1995-2005
(In thousand cubic meters)
Year Coasta Interiorb Total
1995 R25,968 R50,504 76,471
1996 R22,865 R52,348 75,213
1997 R22,337 R46,291 R68,628
1998 R19,013 R45,954 R64,967
1999 R23,721 R52,277 R75,998
2000 R24,996 R51,992 R76,988
2001 R21,546 R50,672 R72,212
2002 R22,203 R51,315 R73,518
2003 R16,474 R45,451 R61,925
2004 27,789 64,571 92,361
2005 22,099 61,037 83,136
R = revised.
a Comprises the Vancouver Forest District and half of
Prince Rupert Forest District.
b Comprises Cariboo, Kamloops, Nelson, and Prince
George Forest Districts and half of Prince Rupert Forest
District.
Source: Council of Forest Industries annual report,
“British Columbia Forest Industry Statistical Tables.”

23
Table 18—M ontana and Idaho timber harvest by ownership, 1995-2005
(In million board feet, Scribner scale)
State and
year Private State
Bureau of
Indian
Affairs
Bureau of
Land
Management
National
Forest Total
Montana:
1995 693.2 14.6 41.8 2.9 165.4 917.9
1996 612.3 25.2 28.9 3.0 209.0 878.4
1997 624.7 27.9 29.4 10.7 208.9 901.6
1998 587.5 30.5 23.4 2.8 201.0 845.1
1999 624.1 38.1 32.0 3.6 156.2 853.9
2000 574.3 35.9 24.2 .8 120.4 755.6
2001 555.6 43.1 9.0 7.6 110.0 725.4
2002 550.4 45.8 15.8 1.8 159.5 773.1
2003 469.6 34.7 42.7 1.4 149.1 697.6
2004 517.9 59.5 49.2 5.6 134.7 766.9
2005 429.2 54.3 11.2 7.2 161.6 663.4
Idaho:1995 809.8 230.2 12.7 5.4 322.5 1,380.6
1996 822.4 228.9 13.3 11.4 338.3 1,414.4
1997 878.7 180.9 17.2 8.4 283.2 1,368.5
1998 753.3 258.0 12.9 8.3 239.8 1,272.2
1999 888.0 269.3 4.8 2.5 172.0 1,336.6
2000 792.2 239.3 11.7 2.6 166.7 1,212.6
2001 726.4 209.6 10.8 5.4 102.3 1,054.6
2002 760.9 191.0 4.2 8.8 136.6 1,101.5
2003 720.5 138.1 6.6 4.7 123.2 993.2
2004 849.9 163.5 3.2 R5.5 143.3 R1,165.4
2005 804.4 178.9 7.1 6.9 161.5 1,158.7
R = revised,
Source: Respective agencies.
24
Table 19—Alaska timber harvest by ownership, 1995-2005
(In thousand board feet, Scribner scale)
Bureau of LandManagement National Forest
Year State PrivateBureau of
Indian Affairs Free use Cut Total Tongass Chugach Total Total
1995 18,628 597,000 583 50 246 296 197,487 2,239 199,726 816,233
1996 15,489 627,000 300 1,959 126 2,085 94,748 3,182 97,930 742,804
1997 14,296 597,800 0 501 5 506 122,107 2,527 124,634 737,236
1998 21,450 388,800 0 224 21 245 120,491 1,038 121,529 532,024
1999 12,800 378,900 0 128 212 340 153,229 356 153,585 545,625
2000 61,700 216,900 0 NA NA NA 119,318 163 119,481 NA
2001 55,300 191,100 2,400 NA NA NA 44,077 335 44,411 NA
2002 57,300 101,700 0 NA NA NA 31,898 198 32,096 NA
2003 34,800 105,700 0 NA NA NA 48,107 15 48,122 NA
2004 24,200 98,900 0 NA NA NA 49,180 17 49,197 NA
2005 42,900 103,900 0 NA NA NA 46,583 61 46,645 NA
NA = not available.
Source: Respective agencies.
Table 20—California timber harvest by ownership, 1995-2005
(In million board feet, Scribner scale)
Year Private StateBureau of
Indian Affairs
Bureau ofLand
ManagementNationalForesta Total
1995 1,929 40 16 6 544 2,535
1996 1,985 55 13 12 458 2,523
1997 2,042 48 15 5 548 2,658
1998 1,836 30 16 1 453 2,336
1999 1,903 26 15 1 433 2,378
2000 1,701 16 19 8 368 2,112
2001 1,476 3 NA NA 262 NA
2002 1,521 4 NA NA 299 NA
2003 1,509 NA NA NA 284 NA
2004 1,593 NA NA NA 264 NA
2005 1,496 NA NA NA 381 NA
NA = not available.
a Includes sawtimber, poles, posts, fuelwood, cull logs, and other miscellaneous convertible products.
Source: Respective agencies.

25
Table 21—Employment in forest products industries in Washington and Oregon, 1994-2005
(In thousands of persons)
Washington and Oregon Washington Oregon
Year Total
Lumber andwood
products
Paper andallied
products Total
Lumber andwood
products
Paper andallied
products Total
Lumber andwood
products
Paper andallied
products
1994 117.5 91.1 26.3 53.9 36.7 17.2 63.6 54.5 9.11995 116.1 89.7 26.4 52.8 35.5 17.4 63.3 54.2 9.11996 111.6 86.0 25.6 52.3 35.5 16.9 59.3 50.6 8.71997 112.0 87.3 24.7 51.7 35.4 16.3 60.3 51.9 8.41998 110.4 85.9 24.5 51.9 35.6 16.3 58.5 50.3 8.21999 107.0 83.0 24.0 49.8 34.0 15.7 57.3 49.0 8.32000 105.9 82.4 23.5 49.0 33.4 15.6 56.9 49.0 7.92001 99.9 77.5 22.4 46.4 31.5 14.9 53.5 46.0 7.52002 98.7 78.2 20.5 45.5 32.3 13.2 53.2 45.9 7.32003 69.2 62.4 6.8 23.5 23.5 a 45.7 38.9 6.82004 68.9 61.9 7.0 23.0 23.0 a 45.9 38.9 7.02005:
January 71.3 64.8 6.5 25.1 25.1 a 46.2 39.7 6.5February 71.6 65.1 6.5 25.3 25.3 a 46.3 39.8 6.5March 71.5 65.0 6.5 25.1 25.1 a 46.4 39.9 6.5
Average,1st quarter 71.5 65.0 6.5 25.2 25.2 a 46.3 39.8 6.5
April 71.4 64.9 6.5 25.1 25.1 a 46.3 39.8 6.5May 71.8 65.3 6.5 25.5 25.5 a 46.3 39.8 6.5June 73.2 66.6 6.6 25.8 25.8 a 47.4 40.8 6.6
Average,2d quarter 72.1 65.6 6.5 25.5 25.5 a 46.7 40.1 6.5
July 74.1 67.4 6.7 26.1 26.1 a 48.0 41.3 6.7August 73.5 66.9 6.6 26.1 26.1 a 47.4 40.8 6.6September 73.1 66.6 6.5 26.0 26.0 a 47.1 40.6 6.5
Average,3d quarter 73.6 67.0 6.6 26.1 26.1 a 47.5 40.9 6.6
October 71.8 65.1 6.7 24.3 24.3 a 47.5 40.8 6.7November 70.2 63.6 6.6 23.8 23.8 a 46.4 39.8 6.6December 70.5 64.0 6.5 24.9 24.9 a 45.6 39.1 6.5
Average,4th quarter 70.8 64.2 6.6 24.3 24.3 a 46.5 39.9 6.6
2005 average 72.0 65.5 6.6 25.3 25.3 a 46.8 40.2 6.6
a Category lost under the new North American Industry Classification System (NAICS).
Note: "Lumber and wood products" category was changed in 2003 and now includes logging and wood product manufacturing.. Source: State employment agencies. Includes both covered and noncovered employment.
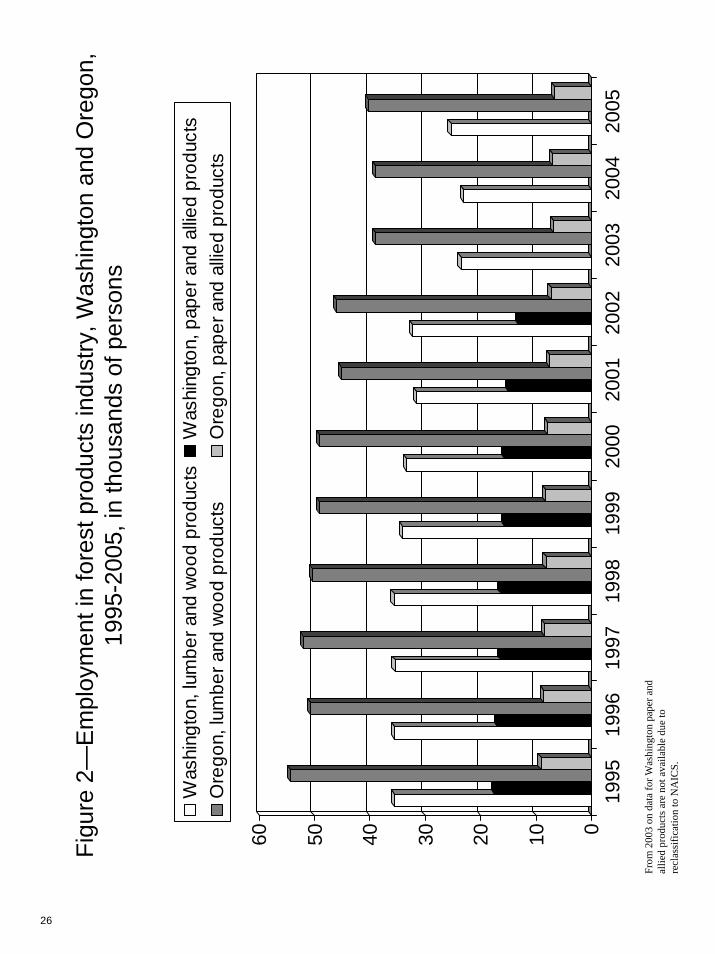
Figu
re 2
—E
mpl
oym
ent i
n fo
rest
pro
duct
s in
dust
ry, W
ashi
ngto
n an
d O
rego
n,19
95-2
005,
in th
ousa
nds
of p
erso
ns
0102030405060
1995
1996
1997
1998
1999
2000
2001
2002
2003
2004
2005
Was
hing
ton,
lum
ber a
nd w
ood
prod
ucts
Was
hing
ton,
pap
er a
nd a
llied
prod
ucts
Ore
gon,
lum
ber a
nd w
ood
prod
ucts
Ore
gon,
pap
er a
nd a
llied
prod
ucts
From
200
3 on
dat
a fo
r Was
hing
ton
pape
r and
al
lied
prod
ucts
are
not
ava
ilabl
e du
e to
re
clas
sific
atio
n to
NA
ICS.
26

27
Table 22—Total nonagricultural employment and employment in forest products
industries in Washington and Oregon, 1995-2005
(In thousands of persons)
Washington and Oregon Washington Oregon
Year TotalForest
industries TotalForest
industries TotalForest
industries
1995 3,765.5 116.1 2,348.5 52.8 1,417.0 63.31996 3,888.6 111.6 2,411.8 52.3 1,476.8 59.31997 4,034.9 112.0 2,512.0 51.7 1,522.9 60.31998 4,070.8 110.4 2,514.2 51.9 1,556.6 58.51999 4,215.0 107.0 2,642.6 49.8 1,572.4 57.32000 4,320.1 105.9 2,716.8 49.0 1,603.3 56.92001 4,294.0 99.9 2,697.8 46.4 1,596.1 53.52002 4,236.5 98.7 2,656.9 45.5 1,579.6 53.22003 4,221.9 69.2 2,659.9 23.5 1,562.0 45.72004 4,315.7 68.9 2,707.3 23.0 1,591.1 45.92005:
January 4,271.0 71.3 2,677.1 25.1 1,593.9 46.2February 4,303.9 71.6 2,692.7 25.3 1,611.2 46.3March 4,346.6 71.5 2,718.2 25.1 1,628.4 46.4
Average,1st quarter 4,307.2 71.5 2,696.0 25.2 1,611.2 46.3
April 4,371.0 71.4 2,737.5 25.1 1,633.5 46.3May 4,404.3 71.8 2,761.4 25.5 1,642.9 46.3June 4,446.2 73.2 2,787.6 25.8 1,658.6 47.4
Average,2d quarter
4,407.2 72.1 2,762.2 25.5 1,645.0 46.7
July 4,421.6 74.1 2,777.4 26.1 1,644.2 48.0August 4,427.3 73.5 2,778.3 26.1 1,649.0 47.4September 4,447.5 73.1 2,782.3 26.0 1,665.2 47.1
Average,3d quarter 4,432.1 73.6 2,779.3 26.1 1,652.8 47.5
October 4,493.3 71.8 2,812.8 24.3 1,680.5 47.5November 4,506.4 70.2 2,821.3 23.8 1,685.1 46.4December 4,531.5 70.5 2,834.3 24.9 1,697.2 45.6
Average,4th quarter 4,510.4 70.8 2,822.8 24.3 1,687.6 46.5
2005 average 4,414.2 72.0 2,765.1 25.3 1,649.1 46.8
Note: Starting in 2003, some categories were lost under the new North American Industry Classification System (NAICS).
Source: State employment agencies. Includes both covered and noncovered employment. Data are based on place of employment.

28
Table 23—Employment in forest products industries in California and Alaska, 1994-2005
(In thousands of persons)
California Alaska
Year TotalLumber and
wood productsPaper and
allied products TotalLumber and
wood productsPaper and
allied products
1994 89.1 49.8 39.3 2.6 2.1 .51995 89.4 50.0 39.4 2.6 2.1 .51996 92.5 52.6 39.8 2.5 2.0 .51997 97.1 56.5 40.6 2.1 1.9 .2
1998 98.2 58.3 40.0 1.7 1.6 .11999 100.5 61.3 39.2 1.7 1.7 a2000 100.1 61.6 38.5 1.5 1.5 a2001 98.1 60.7 37.4 1.1 1.1 a2002 75.0 43.5 31.5 1.1 1.1 a2003 72.4 42.3 30.1 0.8 0.8 a2004 82.3 41.7 40.6 0.8 0.8 a2005:
January 81.4 40.4 41.0 0.5 0.5 aFebruary 81.1 40.0 41.1 0.6 0.6 aMarch 81.9 40.3 41.6 0.7 0.7 a
Average,1st quarter 81.5 40.2 41.2 0.6 0.6 a
April 81.9 40.4 41.5 0.8 0.8 aMay 82.5 40.8 41.7 0.8 0.8 aJune 83.6 41.8 41.8 0.9 0.9 a
Average,2d quarter 82.7 41.0 41.7 0.8 0.8 a
July 84.7 42.6 42.1 0.9 0.9 aAugust 84.6 42.5 42.1 0.9 0.9 aSeptember 85.0 42.8 42.2 0.9 0.9 a
Average,3d quarter 84.8 42.6 42.1 0.9 0.9 a
October 84.2 41.9 42.3 0.9 0.9 aNovember 84.1 41.5 42.6 0.9 0.9 aDecember 84.2 40.8 43.4 0.7 0.7 a
Average,4th quarter 84.2 41.4 42.8 0.8 0.8 a
2005 average 83.3 41.3 42.0 0.8 0.8 a
- - - - - - - - - - - - - - - - - - - - - 2005 change in employment - - - - - - - - - - - - - - - - - - - - - -From:
Year-end 2004 1.0 (0.4) 1.4 0.0 0.0 a
Note: In 2002, there was a change in reporting from the Standard Industry Classification (SIC) system to the North American IndustryClassification System (NAICS).
a Less than 10 persons.
Source: State employment agencies. Data are based on place of residence.

29
Table 24—Employment in forest products industries in Montana and Idaho, 1994-2005
(In thousands of persons)
Montana Idaho
YearLumber and
wood productsPaper and
allied products TotalLumber and
wood productsPaper and
allied products
1994 7.6 a 17.2 14.8 2.41995 7.3 a 17.1 14.9 2.21996 7.0 a 17.0 15.0 2.01997 7.1 a 15.7 13.6 2.11998 7.1 a 15.7 13.5 2.31999 7.2 a 15.7 13.4 2.32000 7.2 a 14.6 12.4 2.22001 6.7 a 13.2 11.0 2.22002 6.5 a 12.8 10.7 2.12003 5.9 a 10.7 9.0 1.72004 5.8 0.5 NA NA NA2005:
January 5.8 a 10.7 9.1 1.6February 5.7 a 10.5 8.9 1.6March 5.6 a 10.4 8.8 1.6
Average,1st quarter 5.7 a 10.5 8.9 1.6
April 5.4 a 10.1 8.5 1.6May 5.5 a 10.9 9.3 1.6June 5.8 a 11.6 10.0 1.6
Average,2d quarter 5.6 a 10.9 9.3 1.6
July 5.9 a 11.9 10.3 1.6August 5.9 a 12.0 10.4 1.6September 5.8 a 11.8 10.2 1.6
Average,3d quarter 5.9 a 11.9 10.3 1.6
October 5.7 a 11.7 10.1 1.6November 5.8 a 11.5 10.0 1.5December 5.7 a 11.5 10.0 1.5
Average,4th quarter 5.7 a 11.5 10.0 1.5
2005 average 5.7 a 11.2 9.6 1.6
- - - - - - - - - - - - - - - - - - - -2005 change in employment - - - - - - - - - - - - - - - - - - - - -From:
Year-end 2004 (0.1) a NA NA NA
NA = not available.
Note: "Lumber and wood products" and "Paper and allied products" columns for Idaho may not add to "Total" becauseof rounding. a Withheld to avoid disclosing figures for individual companies, but permission was granted to publish an annual number as of 2004.
Source: State employment agencies. Data are based on place of residence.

30
Table 25—Employment, wages, unemployment and population for the State of Oregon, by county
(Employment and population in number of people, wages in dollars per week, unemployment in percent)
Average annualcovered employment
Average weeklywages
County TotalNAICS321a
NAICS113b Total
NAICS321a
NAICS113b Unemployment Population
Baker 2001 5,148 0 46 465.19 0 435.68 8.4 16,743 2002 5,090 0 47 479.15 0 486.41 9.0 16,496 2003 5,040 0 31 497.72 0 448.99 9.5 16,375 2004 5,066 0 0 505.36 0 0 9.1 16,470
2005 5,171 D D 519.46 D D 7.5 16,287Benton 2001 34,549 516 209 683.17 706.64 647.29 4.5 77,926 2002 34,116 480 206 707.03 738.19 647.53 5.2 78,618 2003 34,012 478 262 716.14 753.90 691.99 5.7 79,335 2004 34,516 433 300 716.28 768.18 709.88 5.4 79,357
2005 34,886 405 300 755.37 803.25 692.73 4.8 78,640Clackamas 2001 133,998 1,156 156 648.06 612.15 573.24 5.3 346,558 2002 133,957 1,075 163 660.23 589.33 577.76 6.9 351,815 2003 131,779 1,093 171 682.43 605.36 572.70 7.5 357,453 2004 137,870 1,256 168 703.15 668.04 601.05 6.8 363,276 2005 143,625 1,241 D 726.52 676.13 D 5.4 368,470Clatsop 2001 15,338 236 275 487.16 740.04 678.23 5.7 35,586 2002 14,999 236 248 505.55 763.06 710.89 7.0 35,791 2003 15,421 247 247 515.59 826.79 694.89 7.5 35,820 2004 15,729 268 252 533.33 835.52 731.15 6.9 36,340 2005 16,295 276 272 544.62 845.68 793.99 5.7 36,798Columbia 2001 9,991 513 297 570.93 692.40 692.11 7.8 44,547 2002 9,873 487 289 587.09 732.99 683.38 9.4 45,313 2003 9,689 441 241 595.57 731.52 688.00 10.3 46,261 2004 9,977 456 236 605.46 760.63 711.74 9.2 46,971 2005 10,320 447 237 614.54 807.27 742.66 7.3 48,065Coos 2001 20,821 832 728 493.01 687.04 674.21 8.4 62,459 2002 20,873 868 700 514.05 719.65 704.97 8.8 62,670 2003 22,303 876 665 509.90 762.47 702.48 9.1 63,019 2004 22,257 922 636 524.62 784.76 742.27 9.1 63,739 2005 23,533 902 648 527.31 779.79 795.93 7.3 64,711Crook 2001 6,157 1,189 128 527.97 552.51 639.72 8.4 20,062 2002 6,005 1,084 129 541.18 525.03 643.05 9.2 19,999 2003 5,903 1,007 127 564.83 563.54 705.84 9.5 20,600 2004 6,310 1,071 134 591.91 591.79 766.81 8.2 21,424 2005 6,685 1,149 135 608.97 600.94 858.54 6.7 22,067Curry 2001 6,342 478 114 438.01 756.32 451.32 6.9 21,118 2002 6,240 486 103 458.52 791.95 472.67 7.8 21,294 2003 6,464 470 111 458.05 814.19 507.75 8.1 21,813 2004 6,761 478 103 475.09 849.46 583.55 7.3 22,100 2005 7,047 468 104 499.10 899.98 577.28 6.5 22,427Deschutes 2001 52,515 1,987 122 525.86 648.57 734.45 6.4 121,949 2002 53,057 1,920 165 543.33 557.25 707.88 7.6 125,258 2003 54,651 1,794 155 559.82 597.20 792.00 7.6 129,492 2004 58,487 1,790 120 578.47 647.34 710.58 6.7 134,479 2005 63,037 1,834 95 605.43 660.42 739.69 5.5 141,382
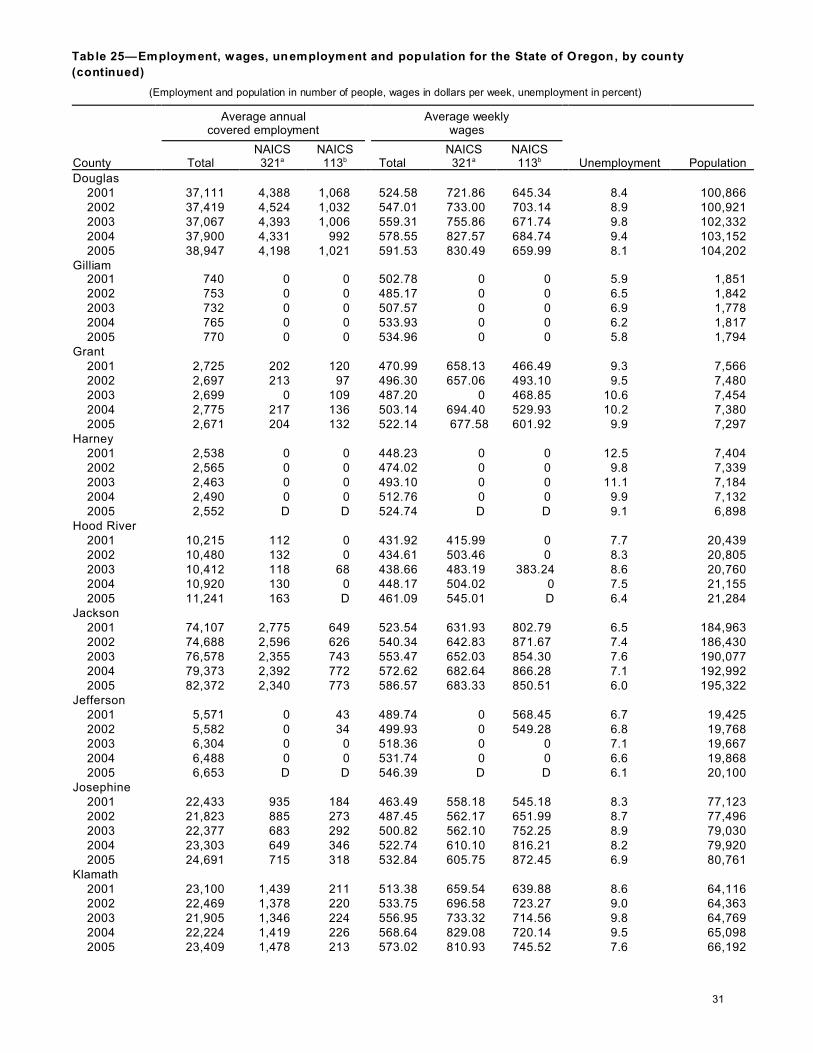
Table 25—Employment, wages, unemployment and population for the State of Oregon, by county
(continued)
(Employment and population in number of people, wages in dollars per week, unemployment in percent)
Average annualcovered employment
Average weeklywages
County TotalNAICS321a
NAICS113b Total
NAICS321a
NAICS113b Unemployment Population
31
Douglas 2001 37,111 4,388 1,068 524.58 721.86 645.34 8.4 100,866 2002 37,419 4,524 1,032 547.01 733.00 703.14 8.9 100,921 2003 37,067 4,393 1,006 559.31 755.86 671.74 9.8 102,332 2004 37,900 4,331 992 578.55 827.57 684.74 9.4 103,152 2005 38,947 4,198 1,021 591.53 830.49 659.99 8.1 104,202Gilliam 2001 740 0 0 502.78 0 0 5.9 1,851 2002 753 0 0 485.17 0 0 6.5 1,842 2003 732 0 0 507.57 0 0 6.9 1,778 2004 765 0 0 533.93 0 0 6.2 1,817 2005 770 0 0 534.96 0 0 5.8 1,794Grant 2001 2,725 202 120 470.99 658.13 466.49 9.3 7,566 2002 2,697 213 97 496.30 657.06 493.10 9.5 7,480 2003 2,699 0 109 487.20 0 468.85 10.6 7,454 2004 2,775 217 136 503.14 694.40 529.93 10.2 7,380 2005 2,671 204 132 522.14 677.58 601.92 9.9 7,297Harney 2001 2,538 0 0 448.23 0 0 12.5 7,404 2002 2,565 0 0 474.02 0 0 9.8 7,339 2003 2,463 0 0 493.10 0 0 11.1 7,184 2004 2,490 0 0 512.76 0 0 9.9 7,132 2005 2,552 D D 524.74 D D 9.1 6,898Hood River 2001 10,215 112 0 431.92 415.99 0 7.7 20,439 2002 10,480 132 0 434.61 503.46 0 8.3 20,805 2003 10,412 118 68 438.66 483.19 383.24 8.6 20,760 2004 10,920 130 0 448.17 504.02 0 7.5 21,155 2005 11,241 163 D 461.09 545.01 D 6.4 21,284Jackson 2001 74,107 2,775 649 523.54 631.93 802.79 6.5 184,963 2002 74,688 2,596 626 540.34 642.83 871.67 7.4 186,430 2003 76,578 2,355 743 553.47 652.03 854.30 7.6 190,077 2004 79,373 2,392 772 572.62 682.64 866.28 7.1 192,992 2005 82,372 2,340 773 586.57 683.33 850.51 6.0 195,322Jefferson 2001 5,571 0 43 489.74 0 568.45 6.7 19,425 2002 5,582 0 34 499.93 0 549.28 6.8 19,768 2003 6,304 0 0 518.36 0 0 7.1 19,667 2004 6,488 0 0 531.74 0 0 6.6 19,868 2005 6,653 D D 546.39 D D 6.1 20,100Josephine 2001 22,433 935 184 463.49 558.18 545.18 8.3 77,123 2002 21,823 885 273 487.45 562.17 651.99 8.7 77,496 2003 22,377 683 292 500.82 562.10 752.25 8.9 79,030 2004 23,303 649 346 522.74 610.10 816.21 8.2 79,920 2005 24,691 715 318 532.84 605.75 872.45 6.9 80,761Klamath 2001 23,100 1,439 211 513.38 659.54 639.88 8.6 64,116 2002 22,469 1,378 220 533.75 696.58 723.27 9.0 64,363 2003 21,905 1,346 224 556.95 733.32 714.56 9.8 64,769 2004 22,224 1,419 226 568.64 829.08 720.14 9.5 65,098 2005 23,409 1,478 213 573.02 810.93 745.52 7.6 66,192

Table 25—Employment, wages, unemployment and population for the State of Oregon, by county
(continued)
(Employment and population in number of people, wages in dollars per week, unemployment in percent)
Average annualcovered employment
Average weeklywages
County TotalNAICS321a
NAICS113b Total
NAICS321a
NAICS113b Unemployment Population
32
Lake 2001 2,317 248 29 490.09 551.40 646.06 9.2 7,470 2002 2,287 236 29 478.59 587.44 636.08 8.8 7,444 2003 2,306 251 27 488.79 570.12 652.35 9.6 7,440 2004 2,335 278 26 520.98 692.37 659.17 9.9 7,382 2005 2,402 253 D 532.25 625.26 D 8.5 7,313Lane 2001 137,583 5,218 927 557.35 695.18 685.31 6.9 324,316 2002 137,969 5,023 932 565.89 722.01 630.65 7.1 326,666 2003 136,533 4,698 851 582.90 757.55 620.99 8.0 330,527 2004 139,599 4,711 808 602.65 817.25 650.50 7.4 331,594 2005 145,269 4,916 782 621.18 818.90 945.34 6.1 335,180Lincoln 2001 16,672 47 149 458.68 494.67 541.48 7.2 44,264 2002 16,664 51 138 470.17 518.99 595.72 8.1 44,644 2003 16,597 62 146 483.61 560.97 671.99 9.0 44,667 2004 17,162 0 149 500.25 0 634.11 8.3 45,277 2005 17,862 63 131 515.66 617.62 698.96 6.7 45,994Linn 2001 40,721 2,259 542 558.75 691.59 729.46 7.7 103,974 2002 39,644 2,234 539 578.80 716.68 786.97 9.0 104,941 2003 38,632 2,175 474 589.36 763.17 722.42 10.1 106,121 2004 39,200 2,300 492 603.86 769.72 732.73 9.3 107,410 2005 41,440 2,342 481 613.57 769.34 738.40 7.4 108,914Malheur 2001 13,128 0 0 445.44 0 0 8.3 31,456 2002 12,660 0 0 464.69 0 0 9.1 31,248 2003 12,427 0 0 481.25 0 0 9.9 31,239 2004 12,596 0 0 492.04 0 0 10.1 31,425 2005 12,656 D 0 498.64 D 0 8.8 31,330Marion 2001 127,001 1,862 0 553.56 566.86 0 6.4 288,269 2002 127,320 1,845 0 569.71 575.27 0 7.3 293,155 2003 128,073 1,680 0 582.48 598.99 0 8.0 296,995 2004 129,975 1,938 0 595.87 617.60 0 7.6 301,841 2005 135,107 2,206 D 611.95 635.67 D 6.4 305,265Morrow 2001 3,372 0 34 524.91 0 629.31 7.6 11,339 2002 3,494 0 41 545.65 0 713.60 7.6 11,585 2003 3,752 0 39 557.25 0 674.82 8.1 11,627 2004 3,690 0 40 583.92 0 701.50 8.2 11,681 2005 3,903 0 56 592.39 0 877.15 7.5 11,666Multnomah 2001 444,397 814 49 724.37 519.15 684.26 6.3 665,810 2002 428,919 679 0 735.36 564.81 0 8.1 677,626 2003 419,917 650 0 748.28 608.73 0 8.6 677,813 2004 420,325 643 0 773.08 587.66 0 7.6 672,161 2005 428,250 612 15 793.15 633.77 261.83 6.2 672,906Polk 2001 15,689 407 230 474.96 676.33 676.11 5.7 63,679 2002 16,145 376 179 498.74 706.61 669.69 6.2 64,657 2003 16,224 394 212 499.18 743.51 605.47 6.7 65,995 2004 16,611 354 216 511.04 764.66 654.81 6.6 67,565 2005 17,286 359 229 521.94 740.98 702.66 5.5 70,295

Table 25—Employment, wages, unemployment and population for the State of Oregon, by county
(continued)
(Employment and population in number of people, wages in dollars per week, unemployment in percent)
Average annualcovered employment
Average weeklywages
County TotalNAICS321a
NAICS113b Total
NAICS321a
NAICS113b Unemployment Population
33
Sherman 2001 627 0 0 449.92 0 0 10.1 1,827 2002 636 0 0 475.37 0 0 10.1 1,784 2003 630 0 0 502.63 0 0 10.9 1,754 2004 605 0 0 538.79 0 0 9.7 1,712 2005 643 0 0 562.16 0 0 7.2 1,749Tillamook 2001 8,078 395 174 471.28 699.93 642.55 6.1 24,308 2002 8,094 413 244 488.50 746.09 654.26 6.6 24,613 2003 8,034 412 255 510.11 832.28 687.98 7.3 24,590 2004 8,242 439 264 533.18 871.30 696.55 7.1 24,922 2005 8,566 453 277 541.94 888.33 729.37 6.0 25,277Umatilla 2001 28,631 509 60 514.07 580.33 494.48 7.1 70,751 2002 29,205 484 52 531.84 581.90 574.55 7.9 71,428 2003 29,112 464 40 545.21 614.31 634.95 8.3 72,008 2004 29,052 543 0 564.29 632.07 0 8.2 73,436 2005 28,975 543 D 570.52 654.77 D 7.9 73,878Union 2001 9,644 640 82 476.20 660.74 684.17 6.3 24,327 2002 9,632 660 0 500.64 674.78 0 6.5 24,484 2003 9,580 736 0 521.69 783.38 0 7.4 24,561 2004 9,546 730 0 536.22 859.88 0 7.4 24,406 2005 9,518 689 107 545.20 808.28 829 6.9 24,540Wallowa 2001 2,212 0 53 439.60 0 630.61 9.1 7,207 2002 2,331 0 57 493.64 0 604.13 8.5 7,025 2003 2,254 0 64 446.69 0 583.00 9.8 7,082 2004 2,266 0 67 457.85 0 644.51 9.1 6,976 2005 2,369 D 71 477.93 D 660.40 7.6 7,014Wasco 2001 10,660 112 0 486.32 613.03 0 8.7 23,895 2002 10,463 113 0 484.94 767.39 0 9.1 23,667 2003 9,619 122 48 491.66 686.49 654.19 9.8 23,591 2004 9,800 0 55 498.00 0 688.03 8.9 23,669 2005 10,066 D D 513.58 D D 7.1 23,593Washington 2001 228,509 1,613 124 811.74 731.18 592.66 5.5 461,119 2002 221,543 1,617 112 807.01 796.09 641.44 6.9 473,263 2003 219,257 1,614 164 830.79 768.01 668.03 7.4 479,496 2004 224,216 1,630 192 879.94 797.07 669.37 6.3 488,253 2005 235,074 1,681 160 899.70 842.63 689.88 5.2 499,794Wheeler 2001 281 0 0 392.12 0 0 7.9 1,513 2002 310 0 0 394.42 0 0 7.6 1,532 2003 309 0 0 409.21 0 0 7.5 1,505 2004 284 0 0 441.00 0 0 7.9 1,483 2005 289 0 D 447.96 0 D 6.4 1,455Yamhill 2001 28,081 840 212 535.69 671.80 578.94 6.2 86,642 2002 28,051 796 214 552.30 706.95 600.57 7.4 88,055 2003 28,652 842 184 573.29 741.27 609.68 8.2 89,384 2004 29,577 885 206 586.69 766.51 634.75 7.4 90,723 2005 31,081 953 191 603.79 757.41 670.31 6.1 92,196

Table 25—Employment, wages, unemployment and population for the State of Oregon, by county
(continued)
(Employment and population in number of people, wages in dollars per week, unemployment in percent)
Average annualcovered employment
Average weeklywages
County TotalNAICS321a
NAICS113b Total
NAICS321a
NAICS113b Unemployment Population
34
Oregon 2001 1,596,943 33,323 7,992 638.49 655.61 680.25 6.4 3,472,867 2002 1,573,083 32,405 7,984 647.78 670.87 707.90 7.6 3,521,515 2003 1,563,282 31,111 7,984 662.62 700.90 713.75 8.1 3,559,596 2004 1,595,683 32,089 8,104 685.01 740.77 729.04 7.4 3,594,586 2005 1,652,874 32,639 7,925 703.65 744.83 758.75 6.1 3,641,056
Note: D = data is not shown to avoid disclosure of data for individual employers.
a NAICS 321 = North America Industry Classification System for lumber and wood products.
b NAICS 113 = North America Industry Classification System for forestry services and logging.
Source: 2001 Oregon Employment Department, Oregon Covered Employment and Payrolls by Industry and County for Covered
Employment and Wage for covered employment and weekly wages data 2002 - 2005 are from Web site
http://www.qualityinfo.org/olmisj.
Unemployment rates are from U.S. Department of Agriculture, Economic Research Service. Web site
http//:www.ers.usda.gov/Data/Unemployment.
U.S. Department of Commerce, Bureau of the Census, Current Population estimates are from Web site
http//:www.ers.usda.gov/Data/Population.

35
Table 26—Employment, wages, unemployment and population for the State of W ashington, by county
(Employment and population in number of people, wages in dollars per week, unemployment in percent)
Average annualcovered employment
Average weeklywages
County TotalNAICS321a
NAICS113b Total
NAICS321a
NAICS113b Unemployment Population
Adams
2001 7,101 D 0 417.18 D 0 8.6 16,286 2002 7,001 D 0 439.54 D 0 9.2 16,434
2003 6,953 0 0 459.45 0 0 8.9 16,602 2004 6,890 D 0 477.09 D 0 7.9 16,596 2005 6,894 D 0 507.10 D 0 7.0 16,803
Asotin
2001 5,225 D 0 444.04 D 0 5.5 20,560
2002 5,149 D D 466.31 D D 7.3 20,453 2003 5,348 D 5 471.66 D 193.35 7.6 20,625 2004 5,346 D 6 484.01 D 400.96 6.6 20,831
2005 5,373 D D 505.40 D D 6.2 21,178
Benton
2001 64,479 D 0 699.27 0 0 5.7 146,634 2002 66,203 0 0 737.20 0 0 6.3 150,366 2003 68,130 0 0 755.79 0 0 6.8 153,660 2004 69,424 0 0 786.84 0 0 5.9 155,991
2005 69,968 0 0 807.88 0 0 5.7 157,950
Chelan
2001 35,180 241 D 486.86 595.55 D 8.1 67,133 2002 34,938 160 77 506.90 625.73 491.42 8.7 67,050 2003 35,125 135 77 517.08 662.38 469.79 8.5 67,973 2004 36,598 151 70 517.77 648.49 547.67 6.9 68,987
2005 37,500 174 65 535.36 649.62 534.93 5.9 69,791
Clallam
2001 20,412 870 75 486.14 576.59 599.78 7.8 65,759 2002 20,480 492 347 500.58 559.37 651.95 8.5 66,302 2003 20,751 466 358 518.64 585.97 656.00 8.3 66,892 2004 21,586 452 399 536.06 651.19 692.78 6.9 67,867 2005 22,548 631 391 554.47 737.64 720.15 6.1 69,689
Clark
2001 114,707 930 D 637.04 634.45 D 6.8 360,760 2002 114,062 732 84 650.66 578.84 953.55 9.1 370,236 2003 115,870 710 99 661.55 616.36 895.79 9.4 379,577 2004 120,634 766 111 680.20 674.10 938.62 7.5 392,403 2005 125,552 806 D 705.19 750.71 D 6.2 403,766
Columbia
2001 1,564 0 0 464.45 0 0 9.1 4,113 2002 1,473 D D 468.05 D D 10.1 4,103 2003 1,465 D D 476.19 D D 9.4 4,093 2004 1,427 D D 513.72 D D 8.0 4,187 2005 1,403 D D 531.37 D D 7.7 4,129
Cowlitz 2001 37,844 1,987 210 597.50 833.77 420.32 9.4 93,716 2002 36,081 1,174 748 612.87 790.56 783.40 10.6 94,514 2003 35,949 1,199 739 615.64 761.24 874.55 9.9 95,146 2004 36,023 887 488 628.11 748.63 641.39 8.5 96,189 2005 36,505 1,275 703 654.03 836.55 922.43 7.2 97,325
Douglas
2001 8,565 D D 422.76 D D 7.3 32,967 2002 8,753 D D 438.57 D D 7.6 33,409 2003 9,196 0 D 439.06 0 D 7.7 33,753 2004 9,820 0 D 465.27 0 D 6.3 34,427 2005 10,203 D D 471.67 D D 5.5 34,977

Table 26—Employment, wages, unemployment and population for the State of Washington, by county (continued)
(Employment and population in number of people, wages in dollars per week, unemployment in percent)
Average annualcovered employment
Average weeklywages
County TotalNAICS321a
NAICS113b Total
NAICS321a
NAICS113b Unemployment Population
36
Ferry
2001 1,695 148 D 463.88 629.42 D 11.2 7,296 2002 1,743 D D 474.03 D D 10.7 7,268 2003 1,673 199 D 480.22 143.28 D 13.5 7,417 2004 1,711 D 69 510.24 D 544.53 10.7 7,565 2005 1,729 0 D 534.87 0 D 9.1 7,542
Franklin
2001 21,591 105 0 469.86 395.81 0 8.0 51,015 2002 21,881 106 0 491.53 437.84 0 8.6 52,745 2003 22,396 123 0 505.34 475.06 0 8.7 56,126 2004 23,136 115 0 524.67 536.80 0 7.5 59,472 2005 23,750 130 0 538.19 567.94 0 6.9 63,011
Garfield
2001 874 0 0 484.17 0 0 5.0 2,342 2002 864 0 0 522.68 0 0 6.1 2,327 2003 880 0 0 535.01 0 0 6.4 2,371 2004 894 0 0 545.81 0 0 5.2 2,311 2005 844 0 0 574.98 0 0 5.5 2,344
Grant
2001 30,978 D 0 451.61 D 0 8.8 76,221 2002 30,909 19 0 464.32 263.34 0 9.4 77,983 2003 31,378 21 0 473.93 253.59 0 9.2 78,691 2004 31,958 18 0 494.30 260.21 0 8.1 79,981 2005 31,948 21 0 512.44 287.59 0 7.4 81,229
Grays Harbor
2001 23,197 2,080 0 525.21 710.19 0 9.1 68,331 2002 23,084 1,306 672 546.82 728.03 757.72 9.4 68,470 2003 23,422 1,354 667 560.53 753.54 803.67 9.4 69,406 2004 24,222 1,428 724 571.33 782.69 756.73 8.3 70,338 2005 24,708 1,757 608 588.92 809.81 761.05 7.4 70,900
Island
2001 14,324 D 0 475.54 D 0 6.1 74,114 2002 14,753 D D 498.11 D D 7.2 75,050 2003 14,814 D D 511.05 D D 7.4 76,384 2004 15,084 D D 527.82 D D 6.6 79,293 2005 15,150 D D 540.12 D D 5.8 79,252
Jefferson
2001 8,282 65 D 461.11 449.14 D 6.4 26,584 2002 8,203 32 25 482.78 608.88 454.58 7.5 26,761 2003 8,520 25 24 497.60 629.54 560.15 7.1 27,716 2004 8,931 D 23 511.86 D 609.47 5.9 28,110 2005 9,016 D 31 536.35 D 591.11 5.3 28,666
King
2001 1,146,074 5,490 150 907.45 1,221.49 1,483.55 5.1 1,741,785 2002 1,103,281 1,276 650 921.43 676.99 1,236.20 6.2 1,759,604 2003 1,088,637 1,305 398 942.30 690.84 2,092.97 6.2 1,761,411 2004 1,096,076 1,290 330 941.77 680.40 2,019.60 5.1 1,777,143 2005 1,116,434 1,534 233 964.21 760.03 2,448.47 4.8 1,793,583
Kitsap
2001 73,505 152 82 604.55 558.37 776.14 6.0 233,372 2002 76,043 39 48 649.47 600.31 381.12 6.8 236,174
2003 77,501 48 45 665.58 573.21 664.71 6.8 240,719
2004 80,443 43 52 682.98 637.56 687.39 5.9 239,138 2005 82,245 29 58 701.11 715.56 817.81 5.1 240,661

Table 26—Employment, wages, unemployment and population for the State of Washington, by county (continued)
(Employment and population in number of people, wages in dollars per week, unemployment in percent)
Average annualcovered employment
Average weeklywages
County TotalNAICS321a
NAICS113b Total
NAICS321a
NAICS113b Unemployment Population
37
Kittitas
2001 11,903 90 D 447.99 575.99 D 6.5 33,875 2002 12,331 D 64 466.39 D 569.66 7.0 34,370 2003 12,497 D 40 475.31 D 522.74 7.4 35,206 2004 12,549 D 36 502.38 D 632.05 6.5 35,721 2005 12,621 D 36 529.44 D 639.92 5.6 36,841
Klickitat
2001 5,842 D D 486.98 D D 11.1 19,339 2002 5,997 D D 489.48 D D 11.4 19,381 2003 5,861 D D 495.57 D D 11.9 19,547 2004 5,951 211 165 507.98 624.70 682.35 9.2 19,855 2005 5,838 D D 535.19 D D 7.8 19,839
Lewis
2001 24,728 2,099 367 518.48 741.07 430.96 8.6 69,273 2002 24,671 1,549 650 540.13 793.30 753.90 9.2 69,710 2003 24,418 1,353 590 551.82 884.10 819.08 9.4 70,404 2004 24,637 1,439 640 574.04 920.25 814.15 8.3 71,539 2005 24,979 1,608 621 595.87 921.87 817.91 7.4 72,449
Lincoln
2001 2,966 D 0 439.50 D 0 5.7 10,257 2002 2,910 D D 468.61 D D 6.8 10,096 2003 2,972 D D 475.45 D D 6.9 10,201 2004 3,027 D D 488.74 D D 6.4 10,412 2005 2,909 D D 508.75 D D 5.9 10,381
Mason
2001 11,973 1,195 76 507.82 736.52 283.60 7.7 50,425 2002 12,360 890 258 524.75 725.61 764.19 8.3 51,008 2003 12,683 863 252 527.05 748.38 722.95 8.6 52,129 2004 13,208 889 239 544.76 818.30 789.21 7.4 53,637 2005 13,815 1,016 200 562.72 811.44 862.26 6.1 54,359
Okanogan
2001 15,900 164 D 384.41 539.53 D 9.9 39,543 2002 15,404 69 56 403.30 476.33 603.38 10.1 39,186 2003 16,533 52 68 398.14 457.69 569.00 9.5 39,134 2004 16,921 249 119 422.14 556.69 657.59 7.8 39,444 2005 17,249 93 65 431.27 447.21 555.91 7.2 39,782
Pacific
2001 6,066 385 D 422.81 771.07 D 8.4 20,844 2002 5,991 D 120 439.89 D 743.34 9.2 20,778 2003 6,138 264 122 447.50 814.23 755.03 9.2 21,103 2004 6,277 278 123 456.71 860.66 720.87 7.6 21,246 2005 6,302 280 111 481.97 865.90 766.84 6.6 21,579
Pend Oreille
2001 2,864 123 D 526.70 643.86 D 8.9 11,965 2002 2,906 D 56 538.29 D 563.01 9.6 12,008 2003 2,923 D 53 550.07 D 538.83 10.3 12,254 2004 2,976 D 65 595.99 D 615.17 8.7 12,474 2005 2,973 D 65 624.63 D 610.20 7.9 12,673
Pierce 2001 238,569 3,490 214 601.22 642.18 805.32 6.5 719,407 2002 238,158 2,589 398 625.89 671.07 735.94 8.1 732,282 2003 243,411 2,450 403 646.59 721.14 779.19 8.2 740,957 2004 249,998 2,730 232 691.01 739.63 727.52 7.1 745,411
2005 257,732 2,863 211 697.09 765.70 634.16 5.9 753,787

Table 26—Employment, wages, unemployment and population for the State of Washington, by county (continued)
(Employment and population in number of people, wages in dollars per week, unemployment in percent)
Average annualcovered employment
Average weeklywages
County TotalNAICS321a
NAICS113b Total
NAICS321a
NAICS113b Unemployment Population
38
San Juan
2001 5,027 53 D 449.41 541.39 D 4.8 14,515 2002 4,954 D D 465.80 D D 5.7 14,565 2003 5,100 18 D 477.26 234.67 D 5.5 14,761 2004 5,343 55 D 488.10 616.93 D 4.5 15,190 2005 5,314 50 D 502.46 649.20 D 4.1 15,274
Skagit 2001 43,970 685 D 527.35 604.68 D 7.1 105,247 2002 43,642 456 340 550.89 660.41 685.92 8.2 106,906 2003 44,507 406 343 565.60 729.44 689.50 8.0 109,234 2004 45,499 261 355 575.22 916.35 734.05 6.8 111,064 2005 46,708 321 189 603.63 926.76 670.46 5.8 113,171
Skamania
2001 1,862 161 D 475.65 624.58 D 11.0 10,027 2002 1,887 111 21 483.56 683.05 732.40 10.0 10,049 2003 1,963 112 21 496.83 753.45 761.10 10.1 10,292 2004 2,025 140 27 515.72 787.48 680.09 8.6 10,549
2005 2,059 D 28 527.56 D 713.03 7.5 10,664
Snohomish 2001 209,643 2,954 32 699.80 635.01 343.89 5.3 622,900 2002 205,511 1,801 288 725.80 663.80 618.38 7.0 633,947 2003 207,114 2,045 256 743.65 694.83 608.95 7.0 639,409 2004 211,198 2,195 271 752.01 734.74 679.87 5.6 644,274 2005 221,081 2,160 261 788.68 747.53 689.09 5.1 655,944
Spokane
2001 190,097 948 44 563.21 439.78 387.70 6.6 423,261 2002 187,611 452 D 577.61 455.67 D 7.6 427,506 2003 190,292 494 D 587.54 422.78 D 7.5 431,027 2004 192,971 571 29 604.26 430.14 571.36 6.5 435,644 2005 197,469 629 D 626.46 453.81 D 5.6 440,706
Stevens
2001 9,929 1,190 45 494.11 658.98 558.97 9.1 40,641 2002 9,879 887 275 494.30 730.53 610.55 10.0 40,556 2003 10,041 838 255 506.58 746.78 606.51 9.6 40,776 2004 10,207 851 257 524.24 796.68 647.09 8.3 41,310 2005 10,022 803 255 539.29 784.49 584.15 7.7 42,013
Thurston
2001 85,086 662 125 630.21 657.33 463.26 5.8 213,546 2002 86,283 282 394 650.21 598.70 753.93 6.4 217,641 2003 89,129 309 386 659.95 613.16 810.39 6.4 221,950 2004 91,286 317 447 672.15 685.96 831.67 5.7 224,673 2005 93,813 303 470 695.12 769.98 821.12 5.0 228,867
Wahkiakum
2001 798 D D 486.50 D D 8.2 3,787 2002 776 D D 492.45 D D 9.6 3,793 2003 795 D 135 494.41 D 347.53 9.4 3,748 2004 818 D 145 499.61 D 666.81 7.5 3,755 2005 825 D D 507.58 D D 7.0 3,849
Walla Walla
2001 24,356 49 D 513.46 525.87 D 6.5 55,519
2002 24,687 D D 526.98 D D 6.8 56,149
2003 25,121 26 D 542.41 523.08 D 6.9 56,751
2004 25,278 27 27 558.41 546.54 672.28 6.1 57,354 2005 24,879 27 20 574.55 558.61 476.90 5.7 57,558

Table 26—Employment, wages, unemployment and population for the State of Washington, by county (continued)
(Employment and population in number of people, wages in dollars per week, unemployment in percent)
Average annualcovered employment
Average weeklywages
County TotalNAICS321a
NAICS113b Total
NAICS321a
NAICS113b Unemployment Population
39
Whatcom
2001 68,843 1,398 40 533.15 580.87 671.92 6.5 170,849
2002 70,286 1,058 268 544.08 600.10 662.09 6.8 174,362
2003 72,461 1,187 310 559.98 611.98 619.44 6.6 176,571
2004 75,282 1,271 309 577.45 631.45 649.89 5.7 180,167 2005 78,477 1,365 258 598.53 646.41 673.12 4.9 183,471
Whitman
2001 14,903 D D 540.70 D D 4.4 39,879
2002 14,985 D D 571.17 D D 4.6 40,631
2003 15,189 D 0 588.69 D 0 4.9 40,702
2004 15,611 D 0 605.22 D 0 4.4 40,146 2005 15,789 D 0 607.01 D 0 4.2 40,170
Yakima
2001 92,153 1,563 D 465.43 614.85 D 9.4 223,886
2002 92,100 1,259 D 480.21 615.14 D 9.7 224,823
2003 93,474 1,139 160 496.76 637.40 675.81 9.7 226,727
2004 94,331 1,416 161 508.16 631.35 757.33 8.6 229,094 2005 95,246 1,075 155 525.59 619.63 734.92 7.6 231,586
Washington 2001 2,689,366 30,318 2,004 720.32 764.11 604.76 6.2 5,987,973 2002 2,643,952 17,691 6,495 735.68 673.78 761.47 7.3 6,068,996 2003 2,656,604 17,573 6,087 750.68 700.01 823.76 7.4 6,131,445 2004 2,701,878 18,505 5,930 760.99 724.38 795.36 6.2 6,203,788 2005 2,766,867 19,716 5,614 782.78 756.84 825.12 5.5 6,287,759
Note: D = data is not shown to avoid disclosure of data for individual employers.
a NAICS 321 = North America Industry Classification System for lumber and wood products.
b NAICS 113 = North America Industry Classification System for forestry services and logging.
Source: 2001 Employment and payrolls in Washington State by county and industry for covered employment and wage. Washington
Employment Security Department for employment rates 2002 - 2005 are from Web site
www.workforceexplorer.com
Unemployment rates are from U.S. Department of Agriculture, Economic Research Service. Web site
http//:www.ers.usda.gov/Data/Unemployment. Data updated to reflect June 13 2006 numbers.
U.S. Department of Commerce, Bureau of the Census, current population estimates are from Web site
http//:www.ers.usda.gov/Data/Population.

40
Table 27—Volum e of softw ood log exports from Seattle and Colum bia-Snake Customs Districts by
species and destination, 1994-2005
(In million board feet, Scribner scale)
From both customs districts From Seattle Customs District From Columbia-Snake Customs District
Year andquarter Total
Douglas-fir
Westernhemlock
Othersoftwoods Total
Douglas-fir
Westernhemlock
Othersoftwoods Total
Douglas-fir
Westernhemlock
Port-Orford-cedar
Othersoftwoods
To All Countr ies
1994 1,572.0 1,168.6 334.7 68.7 891.1 584.0 262.6 44.5 680.8 584.6 72.1 3.4 20.81995 1,604.8 1,114.3 403.9 86.7 999.1 573.8 353.9 71.4 605.7 540.4 50.0 2.0 13.21996 1,502.9 1,190.4 258.8 53.6 916.7 643.8 233.1 39.9 586.1 546.6 25.7 1.3 12.51997 1,042.2 789.5 212.4 40.2 599.1 376.7 191.8 30.7 443.1 412.9 20.6 1.8 8.01998 867.1 718.8 100.0 48.3 476.6 346.6 90.5 39.5 390.5 372.2 9.5 .4 8.41999 793.7 668.7 91.4 33.6 434.9 322.2 85.1 27.6 358.8 346.5 6.4 .8 5.12000 759.2 668.8 56.2 34.2 360.2 280.1 51.3 28.7 399.0 388.7 4.9 .8 4.72001 642.1 553.7 46.3 42.1 289.7 207.5 41.4 40.9 352.3 346.3 4.9 .3 .92002 599.4 533.4 41.7 24.4 239.2 176.6 39.6 23.0 360.1 356.8 2.0 .5 .82003 561.6 487.4 37.6 36.7 176.7 120.7 36.1 20.1 385.0 366.7 1.6 .4 16.32004:
1st qtr. 170.6 149.0 11.0 10.6 64.9 45.7 10.6 8.6 105.7 103.3 .4 a 2.02d qtr. 175.1 148.6 13.4 13.2 69.2 46.5 12.0 10.7 105.9 102.1 1.3 a 2.53d qtr. 116.2 103.8 5.2 7.2 38.3 27.0 4.9 6.4 77.9 76.8 .3 a .84th qtr. 160.0 139.5 10.8 9.7 53.5 34.3 10.6 8.6 106.5 105.3 .2 a 1.0
2004 total 621.9 540.9 40.4 40.6 225.9 153.5 38.2 34.2 396.0 387.4 2.2 a 6.3 2005:
1st qtr. 143.8 126.6 8.6 8.6 55.8 39.3 8.5 8.0 88.1 87.4 .1 .1 .52d qtr. 130.4 116.6 5.3 8.5 41.8 28.5 5.2 8.1 88.6 88.1 .1 .1 .43d qtr. 124.6 111.6 4.4 8.6 39.2 26.5 4.3 8.4 85.4 85.1 .1 a .14th qtr. 136.4 119.3 6.5 10.6 57.9 41.0 6.5 10.4 78.5 78.4 0 a .1
2005 total 535.2 474.2 24.8 36.2 194.7 135.3 24.5 34.9 340.6 338.9 .3 .2 1.1
To Japan
1994 1,389.5 1,114.5 230.6 44.4 740.2 532.4 182.3 25.5 649.3 582.1 48.4 2.9 16.01995 1,328.5 1,088.5 202.9 37.1 742.0 549.7 169.7 22.6 586.5 538.8 33.2 1.9 12.61996 1,373.8 1,160.8 175.6 37.4 791.8 614.7 153.1 24.0 582.0 546.1 22.5 1.2 12.21997 953.9 757.4 168.7 27.7 515.7 348.4 148.2 19.2 438.1 409.0 20.5 1.5 7.01998 811.0 704.2 85.0 21.8 422.5 333.1 75.5 13.8 388.5 371.1 9.5 .2 7.71999 751.2 660.7 69.2 21.3 393.2 314.4 62.9 15.8 358.0 346.2 6.3 .8 4.72000 706.1 658.7 39.0 8.4 310.9 270.4 34.2 6.3 395.3 388.3 4.9 .7 1.32001 571.0 539.0 24.0 8.0 222.6 195.1 20.4 7.0 348.4 344.1 3.5 .3 .62002 535.7 514.8 14.6 6.3 176.8 159.2 12.6 5.0 358.9 355.6 2.0 .5 .82003 506.1 479.3 8.1 18.7 122.9 111.7 6.5 4.7 383.2 367.6 1.6 .4 13.52004:
1st qtr. 153.0 144.9 2.2 5.8 47.3 41.7 1.9 3.6 105.6 103.2 .3 a 2.02d qtr. 152.9 147.0 2.4 3.6 47.4 45.0 1.0 1.4 105.5 102.0 1.3 a 2.13d qtr. 103.0 101.4 .7 .9 25.4 24.7 .5 .2 77.6 76.7 .2 a .74th qtr. 138.7 136.9 .7 1.2 32.3 31.7 .4 .2 106.4 105.2 .2 a 1.0
2004 total 547.6 530.1 6.0 11.5 152.4 143.1 3.9 5.4 395.1 387.0 2.0 a 5.8 2005:
1st qtr. 126.0 124.1 .2 1.7 38.4 37.2 .1 1.1 87.6 86.9 .1 .1 .52d qtr. 115.8 115.0 .1 .7 27.3 27.0 0 .3 88.5 88.0 .1 0 .43d qtr. 110.1 109.6 .2 .2 24.9 24.6 .2 .1 85.2 85.0 .1 0 .14th qtr. 119.2 117.8 .1 1.4 40.9 39.6 .1 1.2 78.3 78.2 0 .1 .1
2005 total 471.1 466.5 .7 4.0 131.5 128.3 .3 2.8 339.6 338.1 .3 .1 1.1
To Canada
1994 8.3 .5 6.3 1.5 8.3 .5 6.3 1.5 0 0 0 0 0 1995 133.9 6.7 93.5 33.7 133.9 6.7 93.5 33.7 0 0 0 0 0 1996 40.0 15.5 22.6 1.9 40 15.5 22.6 1.9 0 0 0 0 0 1997 11.1 5.3 1.7 4.1 11.1 5.3 1.7 4.1 0 0 0 0 0 1998 28.3 .9 2.2 25.2 28.3 .9 2.2 25.2 0 0 0 0 0 1999 8.4 .6 .6 7.3 8.4 .6 .6 7.3 0 0 0 0 0 2000 18.0 1.5 .3 16.2 18.0 1.5 .3 16.2 0 0 0 0 0 2001 28.9 1.4 1.0 26.5 28.9 1.4 1.0 26.5 0 0 0 0 0 2002 6.6 .5 .7 5.4 6.6 .5 .7 5.4 0 0 0 0 0 2003 8.8 .7 0 8.1 8.8 .7 0 8.1 0 0 0 0 0 2004:
1st qtr. .9 .2 0 .7 .9 .2 0 .7 0 0 0 0 0 2d qtr. 1.5 0 0 1.5 1.5 0 0 1.5 0 0 0 0 0 3d qtr. .7 a 0 .7 .7 a 0 .7 0 0 0 0 0 4th qtr. .2 a 0 .2 .2 a 0 .2 0 0 0 0 0
2004 total 3.4 .2 0 3.1 3.4 .2 0 3.1 0 0 0 0 0 2005:
1st qtr. .1 0 a a .1 0 a a 0 0 0 0 0 2d qtr. .1 0 0 .1 .1 0 0 .1 0 0 0 0 0 3d qtr. .2 a 0 .2 .2 a 0 .2 0 0 0 0 0 4th qtr. .2 0 0 .2 .2 0 0 .2 0 0 0 0 0
2005 total .6 a a .5 .6 a a .5 0 0 0 0 0

41
Table 27--Volume of softwood log exports from Seattle and Columbia-Snake Customs Districts
by species and destination, 1994-2005 (continued)
(In million board feet, Scribner scale)
From both customs districts From Seattle Customs District From Columbia-Snake Customs District
Year andquarter Total
Douglas-fir
Westernhemlock
Othersoftwoods Total
Douglas-fir
Westernhemlock
Othersoftwoods Total
Douglas-fir
Westernhemlock
Port-Orford-cedar
Othersoftwoods
To South Korea
1994 110.3 6.8 87.4 16.1 82.2 6.0 64.4 11.8 28.1 .8 23.0 0 4.31995 125.8 8.2 105.5 12.1 107.6 7.0 88.8 11.9 18.2 1.2 16.7 .1 .31996 74.2 10.6 52.5 11.1 70.8 10.4 49.3 11.0 3.4 .1 3.2 .1 .11997 59.9 12.9 41.4 5.6 59.4 12.7 41.4 5.3 .5 .2 0 .1 .21998 11.3 3.5 7.3 .7 11.3 3.5 7.3 .7 0 0 0 0 0 1999 30.3 7.1 19.9 3.3 29.8 7.0 19.8 3.0 .5 .1 .1 0 .32000 25.3 6.1 15.6 3.5 24.8 6.1 15.6 3.1 .5 .1 0 0 .42001 29.5 7.2 18.6 3.7 27.7 6.8 17.3 3.6 1.8 .4 1.3 0 .12002 42.0 13.1 24.2 4.8 41.7 12.7 24.2 4.8 .3 .3 0 0 0 2003 42.2 8.2 29.6 4.4 42.2 8.2 29.6 4.4 a a 0 a 02004:
1st qtr. 16.5 3.7 8.7 4.0 16.4 3.7 8.7 4.0 .1 0 .1 0 02d qtr. 17.1 1.5 11.0 4.6 16.9 1.5 11.0 4.4 .2 0 0 0 .23d qtr. 12.0 2.3 4.4 5.3 11.9 2.3 4.4 5.2 .1 0 0 0 .14th qtr. 20.5 2.5 10.2 7.8 20.5 2.5 10.2 7.8 0 0 0 0 0
2004 total 66.0 10.0 34.2 21.8 65.7 10.0 34.2 21.5 .3 0 .1 0 .2 2005:
1st qtr. 15.6 1.8 8.4 5.4 15.6 1.8 8.4 5.4 0 0 0 0 02d qtr. 11.7 .8 4.6 6.4 11.7 .8 4.6 6.4 0 0 0 0 03d qtr. 12.1 1.6 3.9 6.7 12.1 1.6 3.9 6.7 0 0 0 0 04th qtr. 16.2 1.3 6.5 8.4 16.2 1.3 6.5 8.4 0 0 0 0 0
2005 total 55.7 5.5 23.3 26.9 55.7 5.5 23.3 26.9 0 0 0 0 0
To People’s Republic of China
1994 60.5 46.3 9.6 4.6 58.1 44.7 8.9 4.5 2.4 1.6 .8 0 .11995 13.9 9.8 1.5 2.7 13.9 9.8 1.5 2.6 .1 0 0 .1 0 1996 11.9 3.0 7.7 1.2 11.9 3.0 7.7 1.2 0 0 0 0 0 1997 14.2 12.3 .4 1.5 11.8 9.8 .4 1.5 2.5 2.5 0 0 0 1998 12.4 6.4 4.2 1.8 12.4 6.4 4.2 1.8 0 0 0 0 0 1999 1.3 0 1.3 a 1.3 0 1.3 a 0 0 0 0 0 2000 5.9 2.1 .9 2.9 5.3 2.1 .9 2.2 .6 0 0 0 .62001 8.2 3.4 2.7 2.0 8.2 3.4 2.7 2.0 0 0 0 0 0 2002 9.7 3.5 2.1 4.1 9.4 3.5 2.1 3.8 .3 0 0 .3 0 2003 .2 a 0 .2 .1 a 0 a .2 0 0 0 .22004:
1st qtr. a 0 0 a a 0 0 a 0 0 0 0 0 2d qtr. 1.1 a a 1.1 1.0 a a 1.0 .1 0 0 0 .13d qtr. 0 0 0 0 0 0 0 0 0 0 0 0 0 4th qtr. .1 a 0 .1 .1 a 0 .1 0 0 0 0 0
2004 total 1.2 a a 1.1 1.1 a a 1.1 .1 0 0 0 .1 2005:
1st qtr. .5 0 0 .5 .5 0 0 .5 a 0 0 a 02d qtr. .6 0 0 .6 .6 0 0 .6 a 0 0 0 a3d qtr. .3 0 0 .3 .3 0 0 .3 0 0 0 0 04th qtr. .3 a 0 .3 .3 a 0 .3 a 0 0 a a
2005 total 1.7 a 0 1.6 1.7 a 0 1.6 a 0 0 a a
a Less than 1,000 board feet.
Source: U.S. Department of Commerce. Columbia-Snake Customs District includes al l Oregon ports and Longview and Vancouver, Washington. Seattle Customs District includes all coastal and inland ports in the State of Washington, except Longview and Vancouver. Data are compiled from Department of Commerce records at the end of each quarter.
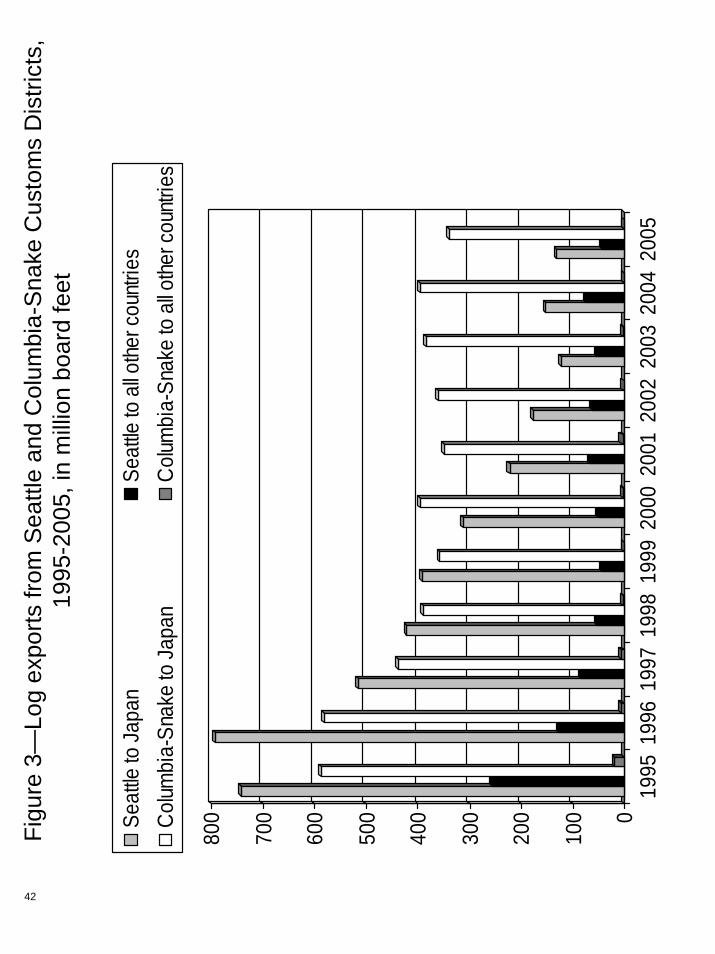
Figu
re 3
—Lo
g ex
ports
from
Sea
ttle
and
Col
umbi
a-S
nake
Cus
tom
s D
istri
cts,
19
95-2
005,
in m
illio
n bo
ard
feet
0
100
200
300
400
500
600
700
800
1995
1996
1997
1998
1999
2000
2001
2002
2003
2004
2005
Seat
tle to
Japa
nSe
attle
to a
ll oth
er c
ount
ries
Colu
mbi
a-Sn
ake
to J
apan
Colu
mbi
a-Sn
ake
to a
ll oth
er c
ount
ries
42

43
Table 28—Value of softwood log exports from Seattle and Columbia-Snake Customs Districts by species
and destination, 1994-2005
(In thousand dollars)
From both customs districts From Seattle Customs District From Columbia-Snake Customs District
Year andquarter Total
Douglas-fir
Westernhemlock
Othersoftwoods Total
Douglas-fir
Westernhemlock
Othersoftwoods Total
Douglas-fir
Westernhemlock
Port-Orford-cedar
Othersoftwoods
To All Countr ies
1994 1,524,134 1,203,435 247,101 73,598 813,109 587,557 190,893 34,657 711,025 615,878 56,208 19,193 19,7471995 1,509,920 1,190,580 255,683 63,657 855,512 593,612 219,301 42,599 654,408 596,968 36,382 8,911 12,1471996 1,392,521 1,189,498 156,743 46,280 777,395 608,735 138,673 29,988 615,127 580,764 18,069 4,252 12,0401997 888,150 718,678 134,057 35,415 483,974 339,617 120,281 24,076 404,176 379,061 13,776 5,337 6,0021998 617,495 540,795 52,697 24,003 327,121 264,230 47,215 15,676 290,374 276,565 5,482 1,386 6,9411999 585,715 515,483 47,623 22,608 300,985 241,244 43,889 15,853 284,729 274,240 3,734 2,869 3,8872000 614,613 563,575 30,828 20,210 275,684 234,219 27,962 13,503 338,929 329,356 2,866 2,525 4,1822001 446,953 410,181 20,417 16,355 183,295 150,749 18,063 14,482 263,658 259,432 2,354 1,115 7562002 395,261 360,137 18,898 16,254 145,617 113,760 17,658 14,198 249,644 246,377 1,239 1,341 7162003 369,591 336,272 14,812 18,507 103,785 81,742 14,058 7,985 265,806 254,531 755 1,117 9,4032004:
1st qtr. 127,441 116,566 4,850 6,025 44,584 34,777 4,672 5,135 82,857 81,789 178 46 8442d qtr. 139,727 124,798 6,054 8,875 52,623 40,484 5,491 6,648 87,104 84,314 563 239 1,9863d qtr. 95,569 88,751 2,561 4,257 29,377 23,367 2,427 3,583 66,192 65,384 134 95 5794th qtr. 124,504 113,446 5,138 5,908 39,830 29,768 5,022 5,040 84,674 83,678 116 52 828
2004 total 487,238 443,561 18,603 25,064 166,414 128,396 17,612 20,406 320,824 315,165 991 433 4,236 2005:
1st qtr. 117,363 105,863 4,763 6,737 44,219 33,463 4,706 6,050 73,145 72,400 57 310 3782d qtr. 104,933 98,788 2,720 3,425 32,777 27,152 2,624 3,001 72,156 71,636 96 120 3043d qtr. 103,396 95,963 2,428 5,005 30,321 23,148 2,370 4,803 73,075 72,815 58 108 944th qtr. 112,689 103,108 3,887 5,694 45,847 36,522 3,887 5,438 66,841 66,586 -- 115 140
2005 total 438,381 403,722 13,798 20,861 153,164 120,285 13,587 19,292 285,217 283,437 211 653 916
To Japan
1994 1,395,644 1,159,702 180,753 55,189 707,419 545,898 141,385 20,136 688,225 613,804 39,368 18,306 16,7471995 1,363,250 1,173,467 151,450 38,333 721,805 578,156 124,873 18,776 641,445 595,311 26,577 7,817 11,7401996 1,320,534 1,173,404 111,437 35,693 708,513 593,058 95,435 20,020 612,021 580,345 16,022 3,968 11,7051997 829,133 695,639 107,942 25,552 429,246 319,600 94,201 15,445 399,887 376,039 13,741 4,886 5,2211998 595,825 533,370 46,355 16,100 306,793 257,739 40,873 8,181 289,032 275,631 5,482 1,216 6,7031999 564,446 510,115 37,490 16,841 280,510 236,202 33,852 10,456 283,936 273,913 3,639 2,709 3,6762000 588,650 557,063 23,182 8,405 253,304 228,336 20,316 4,652 335,346 328,728 2,866 2,456 1,2962001 417,217 400,017 11,718 5,482 157,441 143,720 9,874 3,846 259,776 256,297 1,844 1,115 5212002 361,606 348,488 7,928 5,191 113,846 103,874 6,716 3,256 247,761 244,614 1,212 1,289 6462003 346,662 330,248 3,570 12,844 82,682 77,027 2,815 2,840 263,980 253,221 755 999 9,0052004:
1st qtr. 118,591 114,098 1,166 3,327 36,095 32,580 1,015 2,500 82,496 81,518 151 17 8102d qtr. 127,732 123,618 1,102 3,012 41,206 39,452 539 1,215 86,526 84,166 563 127 1,6703d qtr. 87,993 86,826 405 762 22,188 21,742 301 145 65,805 65,084 104 95 5224th qtr. 112,494 111,024 308 1,162 28,163 27,574 192 397 84,331 83,450 116 7 759
2004 total 446,811 435,566 2,981 8,263 127,652 121,348 2,047 4,257 319,159 314,217 934 247 3,761 2005:
1st qtr. 105,594 104,073 115 1,406 32,860 32,023 58 779 72,734 72,050 57 249 3782d qtr. 95,430 94,756 96 578 23,644 23,324 -- 320 71,786 71,432 96 -- 258
3d qtr. 94,348 93,852 148 348 21,767 21,400 90 277 72,581 72,452 58 -- 714th qtr. 102,235 101,722 25 488 35,798 35,499 25 274 66,437 66,223 -- 82 132
2005 total 397,607 394,402 384 2,820 114,069 112,245 173 1,650 283,538 282,157 211 330 839
To Canada
1994 2,832 246 1,822 763 2,832 246 1,822 763 -- -- -- -- --1995 51,693 2,376 37,180 12,137 51,693 2,376 37,180 12,137 -- -- -- -- --1996 16,716 5,555 10,535 625 16,716 5,555 10,535 625 -- -- -- -- --1997 3,651 1,626 554 1,471 3,651 1,626 554 1,471 -- -- -- -- --1998 5,997 291 374 5,332 5,997 291 374 5,332 -- -- -- -- --1999 2,035 246 88 1,702 2,035 246 88 1,702 -- -- -- -- --2000 5,402 710 78 4,615 5,402 710 78 4,615 -- -- -- -- --2001 6,830 592 681 5,556 6,830 592 681 5,556 -- -- -- -- --2002 2,245 186 514 1,545 2,245 186 514 1,545 -- -- -- -- --2003 1,881 301 -- 1,580 1,881 301 -- 1,580 -- -- -- -- --2004:
1st qtr. 345 125 -- 220 345 125 -- 220 -- -- -- -- --2d qtr. 183 -- -- 183 183 -- -- 183 -- -- -- -- --3d qtr. 286 11 -- 275 286 11 -- 275 -- -- -- -- --4th qtr. 70 10 -- 60 70 10 -- 60 -- -- -- -- --
2004 total 884 14 -- 739 884 145 -- 739 -- -- -- -- -- 2005:
1st qtr. 22 -- 5 17 22 -- 5 17 -- -- -- -- --2d qtr. 36 -- -- 36 36 -- -- 36 -- -- -- -- --3d qtr. 86 27 -- 59 86 27 -- 59 -- -- -- -- --4th qtr. 70 -- -- 70 70 -- -- 70 -- -- -- -- --
2005 total 213 27 5 182 213 27 5 182 -- -- -- -- --

44
Table 28—Value of softwood log exports from Seattle and Columbia-Snake Customs Districts by species
and destination, 1994-2005 (continued)
(In thousand dollars)
From both customs districts From Seattle Customs District From Columbia-Snake Customs District
Year andquarter Total
Douglas-fir
Westernhemlock
Othersoftwoods Total
Douglas-fir
Westernhemlock
Othersoftwoods Total
Douglas-fir
Westernhemlock
Port-Orford-cedar
Othersoftwoods
To South Korea
1994 74,869 5,897 56,459 12,513 56,496 4,935 41,696 9,865 18,373 962 14,763 -- 2,6481995 81,733 6,197 66,067 9,469 70,663 5,103 56,262 9,298 11,070 1,094 9,805 14 1571996 46,061 7,878 29,834 8,350 43,729 7,786 27,765 8,179 2,332 92 2,069 117 541997 42,496 11,374 25,290 5,832 42,016 11,140 25,290 5,586 480 234 -- 14 2321998 6,296 2,405 3,367 524 6,296 2,405 3,367 524 -- -- -- -- --1999 16,447 4,822 9,288 2,337 16,094 4,699 9,192 2,203 353 123 95 -- 1352000 13,636 4,088 7,122 2,426 13,247 4,056 7,122 2,069 389 32 -- -- 3572001 13,257 4,405 7,052 1,800 12,370 4,099 6,582 1,689 887 306 470 -- 1112002 19,732 7,379 9,708 2,645 19,717 7,364 9,708 2,645 15 15 -- -- --2003 17,597 4,279 11,243 2,075 17,568 4,277 11,243 2,048 29 2 -- 27 --2004:
1st qtr. 8,032 2,072 3,649 2,311 8,010 2,072 3,627 2,311 22 -- 22 -- --2d qtr. 9,578 960 4,927 3,691 9,419 960 4,927 3,532 159 -- -- -- 1593d qtr. 6,698 1,599 2,127 3,562 6,668 1,599 2,127 2,942 30 -- -- -- 304th qtr. 11,320 2,145 4,826 4,349 11,320 2,145 4,826 4,349 -- -- -- -- --
2004 total 35,630 6,777 15,529 13,323 35,418 6,777 15,507 13,134 212 -- 22 -- 189 2005:
1st qtr. 10,221 1,171 4,641 4,409 10,221 1,171 4,641 4,409 -- -- -- -- --2d qtr. 6,706 557 2,261 3,888 6,706 557 2,261 3,888 -- -- -- -- --3d qtr. 7,183 1,411 2,164 3,608 7,183 1,411 2,164 3,608 -- -- -- -- --4th qtr. 8,960 969 3,862 4,129 8,960 969 3,862 4,129 -- -- -- -- --
2005 total 33,069 4,107 12,928 16,034 33,069 4,107 12,928 16,034 -- -- -- -- --
To People’s Republic of China
1994 47,547 37,259 7,419 2,869 44,437 36,247 5,341 2,849 3,110 1,012 2,078 -- 201995 9,772 7,218 813 1,741 9,734 7,218 813 1,703 38 -- -- 38 --1996 7,564 2,193 4,792 579 7,564 2,193 4,792 579 -- -- -- -- --1997 9,623 8,808 234 581 7,781 6,966 234 581 1,842 1,842 -- -- --1998 6,429 3,644 1,962 823 6,429 3,644 1,962 823 -- -- -- -- --1999 1,011 -- 582 430 1,011 -- 582 430 -- -- -- -- --2000 2,878 1,091 325 1,462 2,525 1,091 325 1,109 353 -- -- -- 3532001 4,508 1,544 926 2,038 4,508 1,544 926 2,038 -- -- -- -- --2002 6,651 1,599 720 4,332 6,614 1,599 720 4,295 37 -- -- 37 --2003 303 9 -- 294 150 9 -- 141 152 -- -- -- 1522004:
1st qtr. 40 -- -- 40 40 -- -- 40 -- -- -- -- --2d qtr. 538 17 25 496 436 17 25 394 102 -- -- -- 1023d qtr. -- -- -- -- -- -- -- -- -- -- -- -- --4th qtr. 52 5 -- 47 52 5 -- 47 -- -- -- -- --
2004 total 630 21 25 584 528 21 25 482 102 -- -- -- 102 2005:
1st qtr. 485 -- -- 485 445 -- -- 445 40 -- -- 40 --2d qtr. 691 -- -- 691 667 -- -- 667 24 -- -- -- 243d qtr. 211 -- -- 211 211 -- -- 211 -- -- -- -- --4th qtr. 178 24 -- 154 146 24 -- 122 32 -- -- 24 8
2005 total 1,564 24 -- 1,540 1,468 24 -- 1,444 96 -- -- 64 32
Note: Individual columns may not add to totals because of rounding.
Source: U.S. Department of Commerce. The valuation definition used in the export statistics is the value at the seaport or border port of exportation. It is based on the selling price (or cost if not sold) and includes inland freight, insurance, and other charges to the port of exportation. Data are compiled from Department of Commerce records at the end of each quarter.

45
Table 29—Average value of softwood logs exported from Seattle and Columbia-Snake Customs
Districts by species and destination, 1994-2005
(In dollars per thousand board feet, Scribner scale)
From both customs districts From Seattle Customs District From Columbia-Snake Customs District
Year andquarter Total
Douglas-fir
Westernhemlock
Othersoftwoods Total
Douglas-fir
Westernhemlock
Othersoftwoods Total
Douglasfir
Westernhemlock
Port-Orford-cedar
Othersoftwoods
To All Countr ies
1994 969.56 1,029.82 738.21 1,071.97 912.42 1,006.03 726.97 778.21 1,044.36 1,053.58 779.12 5,719.01 950.881995 940.89 1,068.49 633.11 734.55 856.28 1,034.48 619.71 596.66 1,080.47 1,104.61 728.06 4,355.33 918.901996 926.59 999.21 605.75 862.64 848.00 945.52 595.03 752.06 1,049.50 1,062.44 702.94 3,306.63 964.061997 852.19 910.30 631.15 880.97 807.84 901.56 627.12 784.23 912.16 918.05 668.74 2,965.00 750.301998 712.13 752.40 526.97 496.47 686.36 762.40 521.67 396.70 743.58 743.09 577.54 3,135.75 827.391999 737.98 770.89 520.92 673.45 692.07 748.75 515.93 573.47 793.62 792.89 587.74 3,388.06 764.962000 809.54 842.62 548.39 591.66 765.44 836.08 544.73 470.60 849.34 847.33 586.81 3,196.20 894.552001 696.08 740.80 440.97 388.48 632.60 726.31 436.18 354.08 748.44 749.21 483.92 3,915.17 889.412002 659.48 675.17 453.19 666.15 608.71 644.00 445.39 617.30 693.21 690.48 611.30 2,737.06 904.132003 658.05 689.93 393.94 504.28 587.23 667.34 389.33 397.26 690.55 690.33 458.51 2,944.31 576.872004: 1st qtr. 747.22 782.44 441.79 568.50 687.44 761.36 437.05 603.60 783.90 791.75 497.93 2,226.06 417.83 2d qtr. 797.87 839.87 452.87 674.14 760.05 869.94 456.12 623.60 822.58 826.16 423.88 4,175.91 809.01 3d qtr. 822.56 855.05 493.92 590.92 767.41 865.49 495.04 561.61 849.65 851.39 474.12 3,225.90 726.38 4th qtr. 778.15 813.13 474.69 611.78 744.38 869.05 473.48 558.74 795.12 794.93 532.42 3,150.22 834.28 2004 avg. 783.51 820.07 460.98 616.98 736.74 836.64 460.64 590.67 810.20 813.50 453.27 3,486.38 676.50 2005: 1st qtr. 816.04 835.98 552.68 786.21 793.12 851.93 552.79 759.86 830.55 828.79 539.40 2,838.75 759.04 2d qtr. 804.46 847.30 512.14 401.15 784.00 881.43 506.82 370.68 814.11 813.53 716.12 4,181.54 734.30 3d qtr. 830.02 859.60 555.61 584.42 773.37 873.44 554.95 569.55 856.02 855.28 578.83 4,484.33 870.37 4th qtr. 826.13 864.04 596.22 539.51 791.75 891.17 596.22 522.68 851.49 849.86 -- 4,274.61 1,147.54 2005 avg. 819.04 851.39 555.90 575.87 786.77 874.25 555.01 552.86 837.49 836.35 620.80 3,456.86 802.10
To Japan
1994 1,004.42 1,040.55 783.73 1,244.40 955.75 1,025.28 775.66 791.11 1,059.90 1,054.51 814.15 6,262.74 1,048.391995 1,026.17 1,078.09 746.27 1,034.13 972.76 1,051.76 735.85 830.39 1,093.74 1,104.95 799.43 4,193.67 932.261996 961.19 1,010.84 634.44 954.79 894.77 964.76 623.32 833.87 1,051.57 1,062.70 709.97 3,314.68 961.221997 869.20 918.46 639.85 922.44 832.36 917.34 635.63 804.43 912.77 919.41 670.29 3,257.33 745.791998 734.70 757.42 545.43 738.67 726.21 773.73 541.39 590.73 743.93 742.78 577.54 5,502.26 867.591999 751.41 772.13 541.79 789.49 713.49 751.25 537.88 661.55 793.04 791.09 581.06 3,433.62 776.302000 833.63 845.66 593.82 1,005.27 814.83 844.34 594.82 740.66 848.41 846.58 586.81 3,314.44 967.892001 730.68 742.15 488.25 685.25 707.37 736.77 483.83 549.43 745.63 744.91 534.17 3,915.17 930.362002 675.02 676.94 543.01 823.97 643.98 652.35 531.96 651.20 690.39 687.81 602.68 2,893.62 837.022003 684.97 689.02 440.74 686.84 672.46 689.67 431.20 604.26 688.71 688.77 458.51 2,947.33 667.042004: 1st qtr. 775.31 787.44 523.57 570.18 763.06 780.63 525.62 687.57 780.79 790.19 509.63 1,283.50 403.99 2d qtr. 835.53 841.14 467.15 848.21 869.50 877.19 523.62 876.52 820.27 825.24 423.88 4,575.30 781.00 3d qtr. 854.09 856.44 544.35 844.79 873.79 880.57 555.08 906.25 847.67 848.68 513.46 3,225.90 731.60 4th qtr. 810.96 811.25 468.09 965.12 870.66 870.55 436.14 1,711.21 792.81 793.39 532.42 1,525.10 784.89 2004 avg. 815.98 821.67 497.91 719.02 837.43 848.14 519.14 786.15 807.70 811.89 456.69 3,277.99 645.74 2005: 1st qtr. 838.04 838.83 483.19 829.99 855.42 861.44 438.81 703.07 830.42 829.16 539.40 2,814.26 759.04 2d qtr. 824.12 824.09 716.12 850.00 865.98 864.57 -- 981.60 811.21 811.69 716.12 -- 730.88 3d qtr. 856.88 856.04 594.38 1,560.54 874.49 869.39 598.55 2,198.41 851.73 852.18 578.83 -- 731.96 4th qtr. 857.75 863.62 597.84 358.30 876.28 897.06 597.84 221.50 848.09 846.71 -- 7,714.12 1,157.89 2005 avg. 844.01 845.50 578.31 712.66 867.71 874.60 533.22 589.92 834.84 834.46 620.80 3,339.25 790.76
To Canada
1994 340.14 466.79 287.93 518.69 340.14 466.79 287.93 518.69 -- -- -- -- --1995 386.07 355.80 397.70 359.84 386.07 355.80 397.70 359.84 -- -- -- -- --1996 417.89 357.79 466.19 333.01 417.89 357.79 466.19 333.01 -- -- -- -- --1997 328.92 306.79 325.88 358.78 328.92 306.79 325.88 358.78 -- -- -- -- --1998 212.24 329.56 169.38 211.88 212.24 329.56 169.38 211.88 -- -- -- -- --1999 241.35 431.15 155.27 233.19 241.35 431.15 155.27 233.19 -- -- -- -- --2000 300.18 469.71 269.18 284.92 300.18 469.71 269.18 284.92 -- -- -- -- --2001 236.68 412.49 705.03 209.67 236.68 412.49 705.03 209.67 -- -- -- -- --2002 339.81 412.44 769.96 286.11 339.81 412.44 769.96 286.11 -- -- -- -- --2003 213.12 436.75 -- 195.06 213.12 436.75 -- 195.062004: 1st qtr. 372.54 581.95 -- 308.56 372.54 581.95 -- 308.56 -- -- -- -- -- 2d qtr. 120.37 -- -- 120.37 120.37 -- -- 120.37 -- -- -- -- -- 3d qtr. 393.26 581.94 -- 392.86 393.26 581.94 -- 392.86 -- -- -- -- -- 4th qtr. 338.65 612.73 -- 300.00 338.65 612.73 -- 300.00 -- -- -- -- -- 2004 avg. 261.52 583.94 -- 235.95 261.52 583.94 -- 235.95 -- -- -- -- -- 2005: 1st qtr. 409.23 -- 473.54 389.02 409.23 -- 473.54 389.02 -- -- -- -- -- 2d qtr. 334.38 -- -- 338.35 334.38 -- -- 338.35 -- -- -- -- -- 3d qtr. 433.47 627.91 -- 382.25 433.47 627.91 -- 382.25 -- -- -- -- -- 4th qtr. 324.20 -- -- 323.91 324.20 -- -- 323.91 -- -- -- -- --
2005 avg. 371.63 627.91 473.54 349.62 371.63 627.91 473.54 349.62 -- -- -- -- --
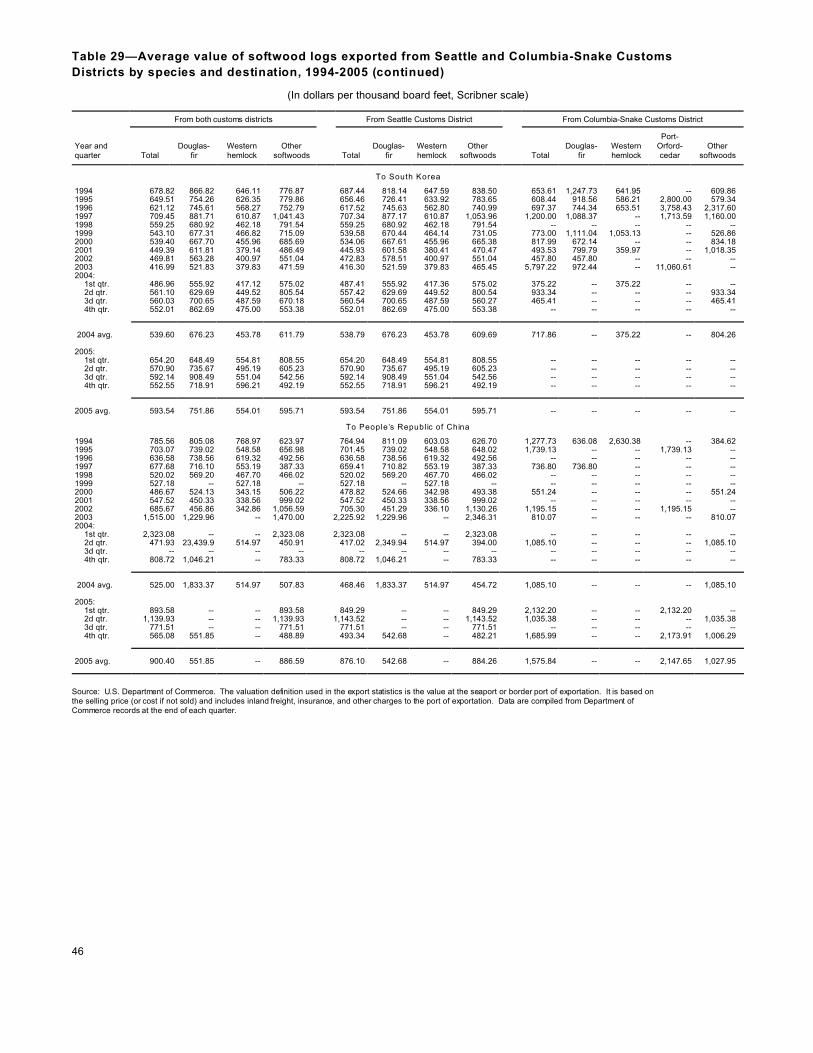
46
Table 29—Average value of softwood logs exported from Seattle and Columbia-Snake Customs
Districts by species and destination, 1994-2005 (continued)
(In dollars per thousand board feet, Scribner scale)
From both customs districts From Seattle Customs District From Columbia-Snake Customs District
Year andquarter Total
Douglas-fir
Westernhemlock
Othersoftwoods Total
Douglas-fir
Westernhemlock
Othersoftwoods Total
Douglas-fir
Westernhemlock
Port-Orford-cedar
Othersoftwoods
To South Korea
1994 678.82 866.82 646.11 776.87 687.44 818.14 647.59 838.50 653.61 1,247.73 641.95 -- 609.861995 649.51 754.26 626.35 779.86 656.46 726.41 633.92 783.65 608.44 918.56 586.21 2,800.00 579.341996 621.12 745.61 568.27 752.79 617.52 745.63 562.80 740.99 697.37 744.34 653.51 3,758.43 2,317.601997 709.45 881.71 610.87 1,041.43 707.34 877.17 610.87 1,053.96 1,200.00 1,088.37 -- 1,713.59 1,160.001998 559.25 680.92 462.18 791.54 559.25 680.92 462.18 791.54 -- -- -- -- --1999 543.10 677.31 466.82 715.09 539.58 670.44 464.14 731.05 773.00 1,111.04 1,053.13 -- 526.862000 539.40 667.70 455.96 685.69 534.06 667.61 455.96 665.38 817.99 672.14 -- -- 834.182001 449.39 611.81 379.14 486.49 445.93 601.58 380.41 470.47 493.53 799.79 359.97 -- 1,018.352002 469.81 563.28 400.97 551.04 472.83 578.51 400.97 551.04 457.80 457.80 -- -- --2003 416.99 521.83 379.83 471.59 416.30 521.59 379.83 465.45 5,797.22 972.44 -- 11,060.61 --2004:
1st qtr. 486.96 555.92 417.12 575.02 487.41 555.92 417.36 575.02 375.22 -- 375.22 -- --2d qtr. 561.10 629.69 449.52 805.54 557.42 629.69 449.52 800.54 933.34 -- -- -- 933.343d qtr. 560.03 700.65 487.59 670.18 560.54 700.65 487.59 560.27 465.41 -- -- -- 465.414th qtr. 552.01 862.69 475.00 553.38 552.01 862.69 475.00 553.38 -- -- -- -- --
2004 avg. 539.60 676.23 453.78 611.79 538.79 676.23 453.78 609.69 717.86 -- 375.22 -- 804.26 2005:
1st qtr. 654.20 648.49 554.81 808.55 654.20 648.49 554.81 808.55 -- -- -- -- --2d qtr. 570.90 735.67 495.19 605.23 570.90 735.67 495.19 605.23 -- -- -- -- --3d qtr. 592.14 908.49 551.04 542.56 592.14 908.49 551.04 542.56 -- -- -- -- --4th qtr. 552.55 718.91 596.21 492.19 552.55 718.91 596.21 492.19 -- -- -- -- --
2005 avg. 593.54 751.86 554.01 595.71 593.54 751.86 554.01 595.71 -- -- -- -- --
To People’s Republic of China
1994 785.56 805.08 768.97 623.97 764.94 811.09 603.03 626.70 1,277.73 636.08 2,630.38 -- 384.621995 703.07 739.02 548.58 656.98 701.45 739.02 548.58 648.02 1,739.13 -- -- 1,739.13 --1996 636.58 738.56 619.32 492.56 636.58 738.56 619.32 492.56 -- -- -- -- --1997 677.68 716.10 553.19 387.33 659.41 710.82 553.19 387.33 736.80 736.80 -- -- --1998 520.02 569.20 467.70 466.02 520.02 569.20 467.70 466.02 -- -- -- -- --1999 527.18 -- 527.18 -- 527.18 -- 527.18 -- -- -- -- -- --2000 486.67 524.13 343.15 506.22 478.82 524.66 342.98 493.38 551.24 -- -- -- 551.242001 547.52 450.33 338.56 999.02 547.52 450.33 338.56 999.02 -- -- -- -- --2002 685.67 456.86 342.86 1,056.59 705.30 451.29 336.10 1,130.26 1,195.15 -- -- 1,195.15 --2003 1,515.00 1,229.96 -- 1,470.00 2,225.92 1,229.96 -- 2,346.31 810.07 -- -- -- 810.072004:
1st qtr. 2,323.08 -- -- 2,323.08 2,323.08 -- -- 2,323.08 -- -- -- -- --2d qtr. 471.93 23,439.9 514.97 450.91 417.02 2,349.94 514.97 394.00 1,085.10 -- -- -- 1,085.103d qtr. -- -- -- -- -- -- -- -- -- -- -- -- --4th qtr. 808.72 1,046.21 -- 783.33 808.72 1,046.21 -- 783.33 -- -- -- -- --
2004 avg. 525.00 1,833.37 514.97 507.83 468.46 1,833.37 514.97 454.72 1,085.10 -- -- -- 1,085.10 2005:
1st qtr. 893.58 -- -- 893.58 849.29 -- -- 849.29 2,132.20 -- -- 2,132.20 --2d qtr. 1,139.93 -- -- 1,139.93 1,143.52 -- -- 1,143.52 1,035.38 -- -- -- 1,035.383d qtr. 771.51 -- -- 771.51 771.51 -- -- 771.51 -- -- -- -- --4th qtr. 565.08 551.85 -- 488.89 493.34 542.68 -- 482.21 1,685.99 -- -- 2,173.91 1,006.29
2005 avg. 900.40 551.85 -- 886.59 876.10 542.68 -- 884.26 1,575.84 -- -- 2,147.65 1,027.95
Source: U.S. Department of Commerce. The valuation definition used in the export statistics is the value at the seaport or border port of exportation. It is based on the selling price (or cost if not sold) and includes inland freight, insurance, and other charges to the port of exportation. Data are compiled from Department of Commerce records at the end of each quarter.

47
Table 30--Volume and average value of softwood log exports from the San Francisco
Customs District by species and destination, 1994-2005
(In thousand board feet, Scribner scale)
Total Doug las-firPort-Orford-
cedar
Other
softwoods
Year and
quarter Volume
Average
value Volume
Average
value Volume
Average
value Volume
Average
value
To All Countries
1994 19,045 728.22 4,506 892.37 132 2,272.73 14,407 662.731995 21,602 808.44 7,661 1,049.47 225 5,626.67 13,716 594.781996 23,006 875.41 18,173 917.91 124 2,003.54 4,709 681.631997 15,600 823.51 13,255 788.50 377 2,296.58 1,967 776.871998 15,828 775.38 12,145 780.60 44 1,545.45 3,639 748.631999 4,266 627.12 925 699.15 0 -- 3,341 607.182000 6,659 585.66 1,507 814.14 0 -- 5,151 518.812001 5,766 503.37 31 2,042.33 0 -- 5,735 495.122002 1,436 856.20 600 646.87 94 4,972.54 741 504.672003 76 2,033.86 10 1,996.06 0 -- 66 2,039.722004 307 762.90 187 952.66 0 -- 120 465.282005:
1st quarter 45 882.02 45 882.02 0 -- 0 --2d quarter 57 1,493.33 6 1,472.59 0 -- 51 1,495.773d quarter 23 1,964.22 23 1,964.22 0 -- 0 --4th quarter 15 296.46 0 -- 0 -- 15 296.46
2005 total andaverage value 140 1,240.42 74 1,262.36 0 -- 66 1,220.08
To Japan
1994 10,392 905.70 3,863 936.06 132 2,272.73 6,397 859.151995 14,514 955.56 7,603 1,044.72 225 5,626.67 6,686 696.981996 21,155 890.73 18,026 920.84 42 2,503.58 3,087 693.001997 15,470 823.33 13,249 787.96 377 2,296.58 1,843 776.071998 13,686 811.34 11,492 797.96 44 1,545.45 2,150 867.801999 1,454 885.41 576 815.57 0 -- 877 931.272000 2,007 779.69 1,325 830.50 0 -- 682 681.062001 784 456.58 0 -- 0 -- 784 456.582002 535 646.13 530 613.35 0 -- 5 4,172.402003 9 1,875.19 0 -- 0 -- 9 1,875.192004 26 463.15 0 -- 0 -- 26 463.152005:
1st quarter 0 -- 0 -- 0 -- 0 --2d quarter 0 -- 0 -- 0 -- 0 --3d quarter 0 -- 0 -- 0 -- 0 --4th quarter 15 296.46 0 -- 0 -- 15 296.46
2005 total andaverage value 15 296.46 0 -- 0 -- 15 296.46
To People’s Republic of China1994 0 -- 0 -- 0 -- 0 --1995 0 -- 0 -- 0 -- 0 --1996 0 -- 0 -- 0 -- 0 --1997 0 -- 0 -- 0 -- 0 --1998 340 494.81 0 -- 0 -- 340 494.811999 603 478.44 0 -- 0 -- 603 478.442000 908 500.70 0 -- 0 -- 908 500.702001 836 465.31 0 -- 0 -- 836 465.312002 94 5,026.42 0 -- 88 5,200.98 6 2,466.212003 26 3,659.99 0 -- 0 -- 26 3,649.992004 0 -- 0 -- 0 -- 0 --2005:
1st quarter 0 -- 0 -- 0 – 0 --2d quarter 0 -- 0 – 0 -- 0 --3d quarter 0 -- 0 – 0 -- 0 --4th quarter 0 -- 0 -- 0 -- 0 --
2005 total andaverage value 0 -- 0 -- 0 -- 0 --
Source: U.S. Department of Commerce. Data are compiled from Department of Commerce records at the end of each quarter.

Figu
re 4
—Lo
g ex
ports
from
San
Fra
ncis
co a
nd A
ncho
rage
Cus
tom
s D
istri
cts,
19
95-2
005,
in m
illio
n bo
ard
feet
050100
150
200
250
300
350
400
1995
1996
1997
1998
1999
2000
2001
2002
2003
2004
2005
San
Fran
cisc
o to
Jap
anSa
n Fr
anci
sco
to a
ll oth
er c
ount
ries
Anch
orag
e to
Jap
anAn
chor
age
to a
ll oth
er c
ount
ries
48

49
Table 31—Volume and average value of softwood log exports from Anchorage Customs
District by species and destination, 1994-2005
(Volume in thousand board feet, Scribner scale; value in dollars per thousand board feet)
All species Hemlock Redcedar Spruce
Year and
quarter Volume
Average
value Volume
Average
value Volume
Average
value Volume
Average
value
To All Countr ies
1994 525,404 739.45 200,129 579.34 39,563 647.25 240,323 811.57
1995 561,550 695.12 250,659 539.02 40,685 652.43 228,615 779.98
1996 530,147 705.98 223,519 537.02 22,632 678.28 257,254 817.34
1997 541,667 642.25 202,517 480.10 37,305 806.85 259,601 733.15
1998 325,386 473.55 72,186 443.51 15,232 791.62 133,334 626.71
1999 427,970 455.70 125,779 408.47 17,687 684.56 172,435 552.20
2000 436,178 426.35 127,861 403.79 22,246 766.73 148,906 541.69
2001 320,615 424.03 108,563 355.95 11,389 694.51 119,288 547.01
2002 286,976 409.70 79,406 398.67 10,820 726.22 153,548 434.34
2003 305,588 456.62 85,094 438.80 12,936 763.28 190,003 430.18
2004 175,281 552.35 50,637 490.39 7,785 804.62 104,117 576.07
2005:
1st quarter 29,864 512.32 2,703 458.24 652 710.87 24,412 471.55
2d quarter 62,373 567.34 17,122 514.37 2,756 851.93 38,412 556.30
3d quarter 57,601 547.18 15,419 490.43 2,451 691.95 37,652 550.00
4th quarter 66,183 591.42 16,804 488.15 4,103 790.89 41,032 617.31
2005 total and
average value 216,021 561.74 52,048 495.90 9,962 778.20 141,508 557.69
To Japan
1994 396,290 798.81 116,970 641.77 23,994 658.75 213,207 826.66
1995 356,928 798.61 116,903 633.41 18,880 679.45 189,840 815.27
1996 383,056 771.64 129,788 562.49 13,042 668.13 218,545 851.47
1997 351,497 721.67 114,246 525.60 20,198 769.29 194,755 780.93
1998 161,369 619.35 45,034 473.75 6,402 719.31 97,351 656.50
1999 257,472 565.86 78,738 435.76 8,657 767.28 124,811 594.75
2000 201,753 585.47 69,045 457.79 11,407 780.63 100,628 608.68
2001 149,923 555.73 49,441 396.11 4,359 756.08 81,800 594.93
2002 108,822 574.78 37,511 412.54 4,172 823.49 58,572 624.34
2003 120,113 624.98 37,524 446.03 7,816 820.26 65,319 662.33
2004 80,614 660.69 20,927 513.17 3,090 845.07 50,974 689.30
2005:
1st quarter 13,794 632.15 1,663 434.52 652 710.87 9,389 580.74
2d quarter 27,990 665.01 9,766 515.30 948 804.36 14,866 723.66
3d quarter 23,923 555.51 4,845 466.66 1,453 594.04 15,645 554.70
4th quarter 22,874 756.77 6,505 525.50 211 887.39 13,524 857.19
2005 total and
average va lue 88,581 654.02 22,778 501.97 3,263 697.43 53,424 682.86
To People’s Republic of China
1994 13,434 543.32 4,232 300.33 0 -- 9,202 655.18
1995 5,426 477.10 0 -- 0 -- 5,426 477.10
1996 3,062 587.89 0 -- 0 -- 3,062 587.89
1997 2,256 543.00 0 -- 0 -- 2,256 543.00
1998 2,870 652.96 1,987 604.43 0 -- 883 762.17
1999 2,653 326.44 0 -- 0 -- 2,653 326.44
2000 6,324 408.30 507 380.71 0 -- 5,817 410.73
2001 4,325 1,401.67 1,190 320.89 0 -- 3,135 1,812.00
2002 5,562 658.83 129 496.36 0 -- 5,433 662.69
2003 4,272 581.38 269 428.45 670 746.05 2,957 530.46
2004 3,947 644.47 944 453.07 0 -- 2,928 722.73
2005:
1st quarter 3,535 582.98 247 577.27 0 -- 3,288 583.41
2d quarter 0 -- 0 -- 0 -- 0 --
3d quarter 3,301 861.63 277 562.36 68 936.87 2,956 887.93
4th quarter 2,683 825.49 0 -- 0 -- 2,683 825.49
2005 total and
average va lue 9,519 747.96 524 569.39 68 936.87 8,927 757.00
Note: The three columns (hemlock, redcedar, and spruce) will not necessarily total the “all species” column because thereis often “other softwood” included. The log export numbers include pulpwood volumes.
Source: U.S. Department of Commerce. Data are compiled from Department of Commerce records at the end of eachquarter.
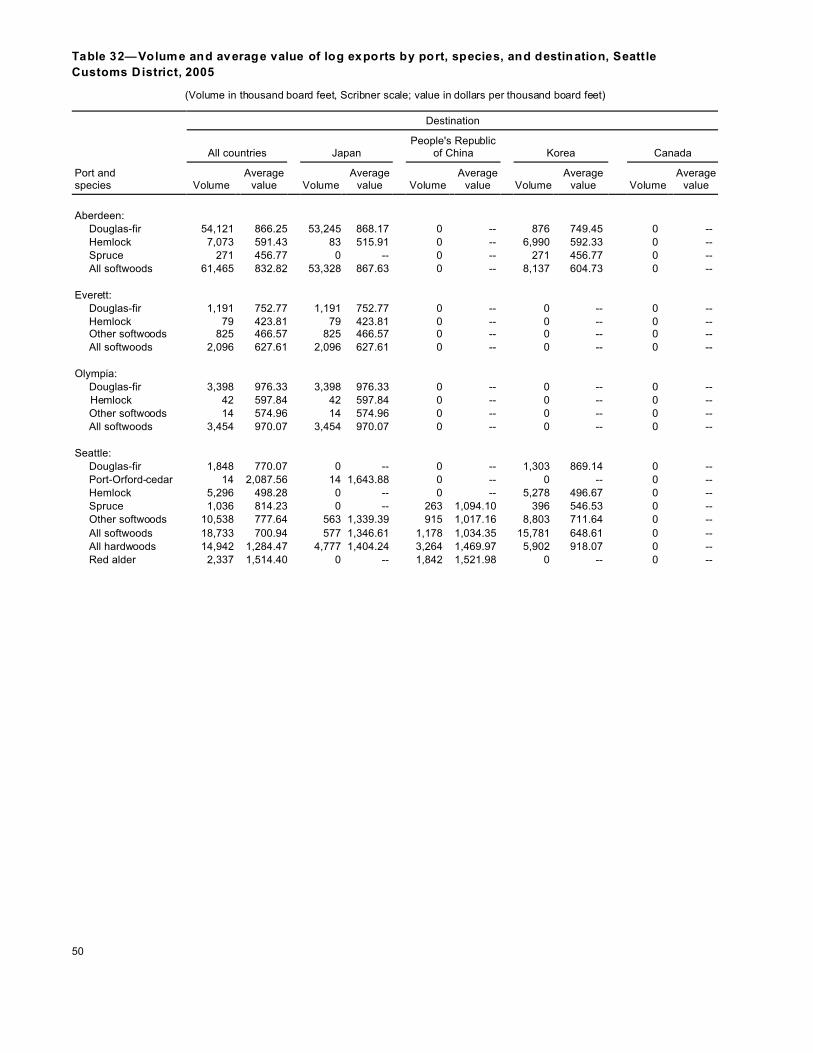
50
Table 32—Volume and average value of log exports by port, species, and destination, Seattle
Customs District, 2005
(Volume in thousand board feet, Scribner scale; value in dollars per thousand board feet)
Destination
All countries JapanPeople's Republic
of China Korea Canada
Port andspecies Volume
Averagevalue Volume
Averagevalue Volume
Averagevalue Volume
Averagevalue Volume
Averagevalue
Aberdeen:Douglas-fir 54,121 866.25 53,245 868.17 0 -- 876 749.45 0 --Hemlock 7,073 591.43 83 515.91 0 -- 6,990 592.33 0 --Spruce 271 456.77 0 -- 0 -- 271 456.77 0 --All softwoods 61,465 832.82 53,328 867.63 0 -- 8,137 604.73 0 --
Everett:Douglas-fir 1,191 752.77 1,191 752.77 0 -- 0 -- 0 --Hemlock 79 423.81 79 423.81 0 -- 0 -- 0 --Other softwoods 825 466.57 825 466.57 0 -- 0 -- 0 --All softwoods 2,096 627.61 2,096 627.61 0 -- 0 -- 0 --
Olympia:Douglas-fir 3,398 976.33 3,398 976.33 0 -- 0 -- 0 --
Hemlock 42 597.84 42 597.84 0 -- 0 -- 0 --Other softwoods 14 574.96 14 574.96 0 -- 0 -- 0 --All softwoods 3,454 970.07 3,454 970.07 0 -- 0 -- 0 --
Seattle:Douglas-fir 1,848 770.07 0 -- 0 -- 1,303 869.14 0 --Port-Orford-cedar 14 2,087.56 14 1,643.88 0 -- 0 -- 0 --Hemlock 5,296 498.28 0 -- 0 -- 5,278 496.67 0 --Spruce 1,036 814.23 0 -- 263 1,094.10 396 546.53 0 --Other softwoods 10,538 777.64 563 1,339.39 915 1,017.16 8,803 711.64 0 --
All softwoods 18,733 700.94 577 1,346.61 1,178 1,034.35 15,781 648.61 0 --All hardwoods 14,942 1,284.47 4,777 1,404.24 3,264 1,469.97 5,902 918.07 0 --Red alder 2,337 1,514.40 0 -- 1,842 1,521.98 0 -- 0 --

51
Table 32—Volume and average value of log exports by port, species, and destination, Seattle
Customs District, 2005 (continued)
(Volume in thousand board feet, Scribner scale; value in dollars per thousand board feet)
Destination
All countries JapanPeople's Republic
of China Korea Canada
Port andspecies Volume
Averagevalue Volume
Averagevalue Volume
Averagevalue Volume
Averagevalue Volume
Averagevalue
Tacoma:Douglas-fir 74,536 872.67 70,504 876.63 43 542.68 3,283 706.02 0 --
Port-Orford-cedar 102 1,570.41 59 1,846.91 0 -- 0 -- 0 -- Redcedar 257 660.86 0 -- 230 544.60 28 1,620.48 0 --
Hemlock 11,452 559.44 120 594.98 0 -- 10,543 557.01 0 -- Spruce 2,902 592.89 0 -- 0 -- 2,697 465.43 0 --
Other softwoods 14,802 553.36 188 922.55 0 -- 14,511 546.15 0 --All softwoods 104,051 785.13 70,872 877.08 273 544.30 31,062 560.69 0 --All hardwoods 3,259 2,664.44 625 2,240.47 461 2,304.88 632 2,665.02 0 --Red alder 348 1,751.80 0 -- 285 1,848.69 0 -- 0 --
Other ports:a
Douglas-fir 204 1,585.79 0 -- 0 -- 0 -- 43 628.60Redcedar 87 512.10 0 -- 0 -- 0 -- 87 512.10
Hemlock 15 1,435.00 0 -- 0 -- 0 -- 10 473.54 Spruce 121 296.77 0 -- 0 -- 0 -- 121 296.77
Other softwoods 44 574.65 0 -- 0 -- 0 -- 44 574.65All softwoods 471 957.72 0 -- 0 -- 0 -- 305 450.82All hardwoods 619 810.48 0 -- 45 1,768.19 0 -- 540 724.44Red alder 34 907.25 0 -- 0 -- 0 -- 0 --
Total:Douglas-fir 135,299 871.33 128,339 874.61 43 542.68 5,463 751.90 43 628.60Port-Orford-cedar 117 1,634.08 73 1,808.76 0 -- 0 -- 0 --Redcedar 344 623.36 0 -- 230 544.60 28 1,620.48 87 512.10Hemlock 23,957 555.52 324 533.22 0 -- 22,811 553.87 10 473.54Spruce 4,331 629.07 0 -- 263 1,094.10 3,364 474.28 121 296.77Other softwoods 26,223 640.80 1,591 830.44 915 1,017.16 23,314 608.64 44 574.65All softwoods 190,270 794.30 130,326 873.75 1,451 942.12 54,980 592.44 305 450.82All hardwoods 18,821 1,507.84 5,402 1,501.02 3,770 1,575.61 6,534 1,086.93 540 724.44Red alder 2,719 1,537.08 0 -- 2,128 1,565.78 0 -- 0 --
a Blaine and Sumas.
Source: U.S. Department of Commerce.
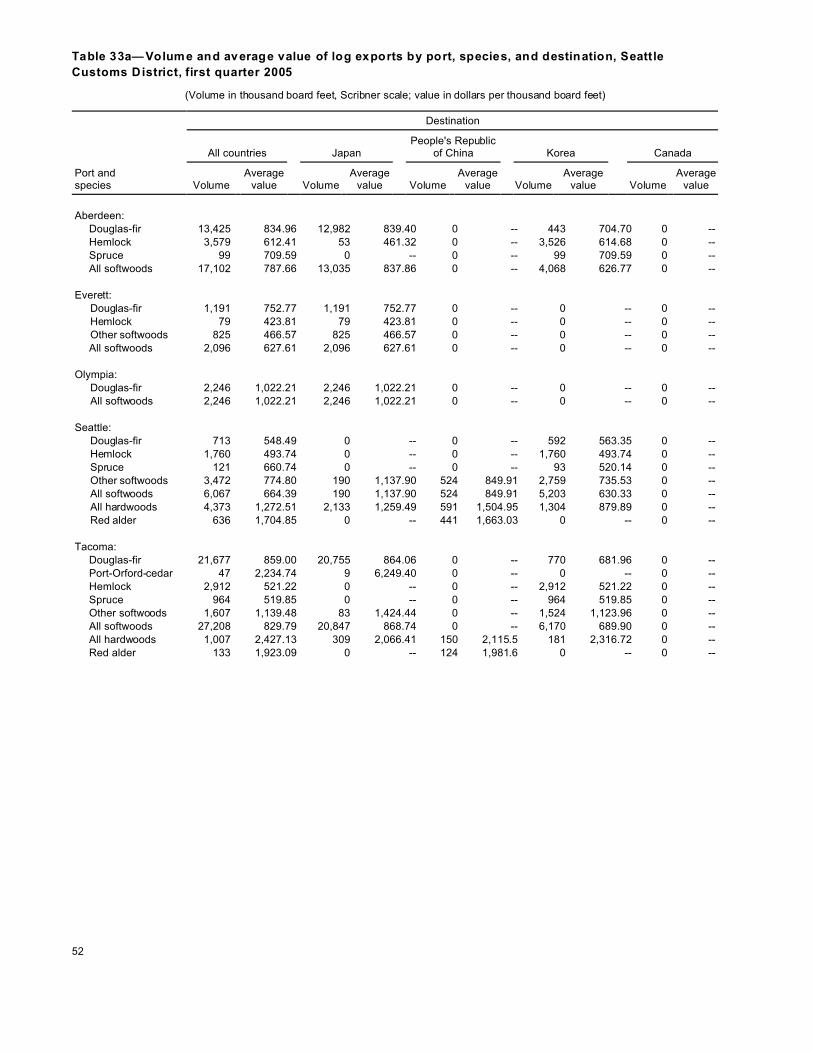
52
Table 33a— Volume and average value of log exports by port, species, and destination, Seattle
Customs District, first quarter 2005
(Volume in thousand board feet, Scribner scale; value in dollars per thousand board feet)
Destination
All countries JapanPeople's Republic
of China Korea Canada
Port andspecies Volume
Averagevalue Volume
Averagevalue Volume
Averagevalue Volume
Averagevalue Volume
Averagevalue
Aberdeen:Douglas-fir 13,425 834.96 12,982 839.40 0 -- 443 704.70 0 --Hemlock 3,579 612.41 53 461.32 0 -- 3,526 614.68 0 --Spruce 99 709.59 0 -- 0 -- 99 709.59 0 --All softwoods 17,102 787.66 13,035 837.86 0 -- 4,068 626.77 0 --
Everett: Douglas-fir 1,191 752.77 1,191 752.77 0 -- 0 -- 0 -- Hemlock 79 423.81 79 423.81 0 -- 0 -- 0 -- Other softwoods 825 466.57 825 466.57 0 -- 0 -- 0 --
All softwoods 2,096 627.61 2,096 627.61 0 -- 0 -- 0 --
Olympia: Douglas-fir 2,246 1,022.21 2,246 1,022.21 0 -- 0 -- 0 -- All softwoods 2,246 1,022.21 2,246 1,022.21 0 -- 0 -- 0 --
Seattle: Douglas-fir 713 548.49 0 -- 0 -- 592 563.35 0 -- Hemlock 1,760 493.74 0 -- 0 -- 1,760 493.74 0 -- Spruce 121 660.74 0 -- 0 -- 93 520.14 0 -- Other softwoods 3,472 774.80 190 1,137.90 524 849.91 2,759 735.53 0 -- All softwoods 6,067 664.39 190 1,137.90 524 849.91 5,203 630.33 0 -- All hardwoods 4,373 1,272.51 2,133 1,259.49 591 1,504.95 1,304 879.89 0 -- Red alder 636 1,704.85 0 -- 441 1,663.03 0 -- 0 --
Tacoma:Douglas-fir 21,677 859.00 20,755 864.06 0 -- 770 681.96 0 --Port-Orford-cedar 47 2,234.74 9 6,249.40 0 -- 0 -- 0 --Hemlock 2,912 521.22 0 -- 0 -- 2,912 521.22 0 --Spruce 964 519.85 0 -- 0 -- 964 519.85 0 --Other softwoods 1,607 1,139.48 83 1,424.44 0 -- 1,524 1,123.96 0 --All softwoods 27,208 829.79 20,847 868.74 0 -- 6,170 689.90 0 --All hardwoods 1,007 2,427.13 309 2,066.41 150 2,115.5 181 2,316.72 0 --Red alder 133 1,923.09 0 -- 124 1,981.6 0 -- 0 --

53
Table 33a—Volume and average value of log exports by port, species, and destination, Seattle Customs
District, first quarter 2005 (continued)
(Volume in thousand board feet, Scribner scale; value in dollars per thousand board feet)
Destination
All countries JapanPeople's Republic
of China Korea Canada
Port andspecies Volume
Averagevalue Volume
Averagevalue Volume
Averagevalue Volume
Averagevalue Volume
Averagevalue
Other ports:a
Douglas-fir 27 1,834.10 0 -- 0 -- 0 -- 0 -- Hemlock 15 1,435.00 0 -- 0 -- 0 -- 10 473.54
Spruce 30 295.05 0 -- 0 -- 0 -- 30 295.05 Other softwoods 14 607.88 0 -- 0 -- 0 -- 14 607.88
All softwoods 86 1,030.59 0 -- 0 -- 0 -- 54 409.21 All hardwoods 93 1,581.92 0 -- 0 -- 0 -- 59 1,977.58
Red alder 34 907.25 0 -- 0 -- 0 -- 0 --
Total:Douglas-fir 39,279 851.93 37,174 861.44 0 -- 1,805 648.62 0 --Port-Orford cedar 47 2,234.74 9 6,249.40 0 -- 0 -- 0 --Hemlock 8,345 555.22 132 438.81 0 -- 8,198 555.52 10 473.54Spruce 1,214 543.85 0 -- 0 -- 1,155 536.08 30 295.05Other softwoods 5,918 830.43 1,098 655.15 524 849.91 4,282 873.73 14 607.88All softwoods 54,804 798.80 38,414 855.42 524 849.91 15,441 653.20 54 409.21All hardwoods 5,473 1,490.22 2,442 1,361.55 741 1,628.65 1,485 1,055.25 59 1,977.58Red alder 804 1,706.88 0 -- 565 1,732.77 0 -- 0 --
a Blaine and Sumas.
Source: U.S. Department of Commerce.

54
Table 33b—Volume and average value of log exports by port, species, and destination, Seattle
Customs District, second quarter 2005
(Volume in thousand board feet, Scribner scale; value in dollars per thousand board feet)
Destination
All countries JapanPeople's Republic
of China Korea Canada
Port andspecies Volume
Averagevalue Volume
Averagevalue Volume
Averagevalue Volume
Averagevalue Volume
Averagevalue
Aberdeen:Douglas-fir 11,292 864.02 11,292 864.02 0 -- 0 -- 0 --
Seattle: Douglas-fir 295 556.81 0 -- 0 -- 0 -- 0 -- Hemlock 1,747 524.86 0 -- 0 -- 1,742 523.70 0 -- Spruce 716 827.31 0 -- 263 1,094.10 303 554.60 0 --
Other softwoods 3,048 866.66 263 1,074.89 320 1,184.16 2,436 786.42 0 --All softwoods 5,806 743.23 263 1,074.89 583 1,143.51 4,481 668.61 0 --All hardwoods 4,105 1,430.91 1,314 1,414.68 1,056 1,534.80 1,505 1,135.62 0 --Red alder 737 1,550.39 0 -- 675 1,533.96 0 -- 0 --
Tacoma:Douglas-fir 16,913 873.67 15,685 865.03 0 -- 757 736.15 0 --
Port-Orford-cedar 8 1,108.66 8 1,108.66 0 -- 0 -- 0 --Hemlock 3,431 497.63 0 -- 0 -- 2,823 477.61 0 --
Spruce 845 566.24 0 -- 0 -- 792 452.20 0 -- Other softwoods 2,994 507.42 61 526.10 0 -- 2,894 498.06 0 --
All softwoods 24,191 764.35 15,755 863.84 0 -- 7,266 509.90 0 --All hardwoods 977 3,080.05 219 1,893.53 107 3,455.95 186 3,440.93 0 --Red alder 48 1,364.44 0 -- 9 2,718.32 0 -- 0 --

55
Table 33b—Volume and average value of log exports by port, species, and destination, Seattle Customs
District, second quarter 2005 (continued)
(Volume in thousand board feet, Scribner scale; value in dollars per thousand board feet)
Destination
All countries JapanPeople's Republic
of China Korea Canada
Port andspecies Volume
Averagevalue Volume
Averagevalue Volume
Averagevalue Volume
Averagevalue Volume
Averagevalue
Other ports:a
Douglas-fir 36 1,671.32 0 -- 0 -- 0 -- 0 -- Spruce 91 297.33 0 -- 0 -- 0 -- 91 297.33 Other softwoods 15 556.07 0 -- 0 -- 0 -- 15 566.07
All softwoods 142 669.13 0 -- 0 -- 0 -- 106 334.37All hardwoods 111 1,429.99 0 -- 22 1,812.97 0 -- 89 1,337.09
Total:Douglas-fir 28,535 867.56 26,977 864.60 0 -- 757 736.15 0 --Port-Orford-cedar 8 1,108.66 8 1,108.66 0 -- 0 -- 0 --Hemlock 5,177 506.82 0 -- 0 -- 4,565 495.19 0 --Spruce 1,652 664.56 0 -- 263 1,094.10 1,096 480.53 91 297.33Other softwoods 6,057 688.32 325 971.48 320 1,184.16 5,330 629.85 15 556.07All softwoods 41,430 788.23 27,310 865.95 583 1,143.51 11,747 570.44 106 334.37All hardwoods 5,193 1,741.12 1,534 1,483.18 1,185 1,713.88 1,691 1,389.63 89 1,337.09Red alder 785 1,538.99 0 -- 685 1,550.38 0 -- 0 --
a Blaine.
Source: U.S. Department of Commerce.

56
Table 33c— Volume and average value of log exports by port, species, and destination, Seattle
Customs District, third quarter 2005
(Volume in thousand board feet, Scribner scale; value in dollars per thousand board feet)
Destination
All countries JapanPeople's Republic
of China Korea Canada
Port andspecies Volume
Averagevalue Volume
Averagevalue Volume
Averagevalue Volume
Averagevalue Volume
Averagevalue
Aberdeen-Hoquiam: Douglas-fir 12,324 864.36 12,324 864.36 0 -- 0 -- 0 --
Hemlock 30 612.96 30 612.96 0 -- 0 -- 0 --All softwoods 12,354 863.76 12,354 863.76 0 -- 0 -- 0 --
Seattle:
Douglas-fir 610 1,143.33 0 -- 0 -- 489 1,308.21 0 --
Port-Orford-cedar 15 2,087.56 14 1,643.88 0 -- 0 -- 0 --
Hemlock 956 496.80 0 -- 0 -- 943 490.08 0 --
Spruce 104 398.85 0 -- 0 -- 0 -- 0 --
Other softwoods 1,743 694.87 3 2,445.60 65 1,598.29 1,491 646.10 0 --
All softwoods 3,427 716.30 17 1,800.06 65 1,598.29 2,923 706.57 0 --
All hardwoods 2,981 1,157.58 512 982.97 948 1,597.03 1,196 806.30 0 --
Red alder 661 1,292.29 0 -- 442 1,369.41 0 -- 0 --
Tacoma:
Douglas-fir 13,436 863.50 12,290 874.43 0 -- 1,064 724.40 0 --
Port-Orford-cedar 46 973.82 41 984.58 0 -- 0 -- 0 --
Redcedar 111 507.18 0 -- 111 507.18 0 -- 0 --
Hemlock 2,928 570.46 120 594.98 0 -- 2,627 569.18 0 --
Spruce 482 619.37 0 -- 0 -- 430 415.14 0 --
Other softwoods 4,640 513.27 44 524.08 0 -- 4,534 510.88 0 --
All softwoods 21,644 741.74 12,495 870.88 111 507.18 8,655 550.08 0 --
All hardwoods 469 2,774.84 19 4,821.03 47 3,116.39 135 2,603.50 0 --
Red alder 25 2,663.56 0 -- 19 2,647.73 0 -- 0 --

57
Table 33c—Volume and average value of log exports by port, species, and destination, Seattle Customs
District, third quarter 2005 (continued)
(Volume in thousand board feet, Scribner scale; value in dollars per thousand board feet)
Destination
All countries JapanPeople's Republic
of China Korea Canada
Port andspecies Volume
Averagevalue Volume
Averagevalue Volume
Averagevalue Volume
Averagevalue Volume
Averagevalue
Other ports:a
Douglas-fir 132 1,485.20 0 -- 0 -- 0 -- 43 628.60Redcedar 13 1,080.89 0 -- 0 -- 0 -- 13 1,080.89Other softwoods 15 562.53 0 -- 0 -- 0 -- 15 562.53All softwoods 160 1,366.08 0 -- 0 -- 0 -- 71 700.31All hardwoods 45 2,091.45 0 -- 23 1,726.79 0 -- 22 2,478.00
Total:Douglas-fir 26,502 873.44 24,615 869.39 0 -- 1,553 908.24 43 628.60
Port-Orford-cedar 61 1,237.07 55 1,148.75 0 -- 0 -- 0 --Redcedar 125 569.01 0 -- 111 507.18 0 -- 13 1,080.89Hemlock 3,914 552.79 150 598.55 0 -- 3,570 548.28 0 --Spruce 585 580.37 0 -- 0 -- 430 415.14 0 --Other softwoods 6,397 562.85 47 659.40 65 1,598.29 6,025 544.35 15 562.53All softwoods 37,585 782.19 24,866 867.98 177 909.53 11,578 589.59 71 700.31All hardwoods 3,495 1,386.61 531 1,120.16 1,019 1,670.15 1,331 988.17 22 2,478.00Red alder 685 1,341.33 0 -- 460 1,422.11 0 -- 0 --
a Blaine and Sumas.
Source: U.S. Department of Commerce.

58
Table 33d—Volume and average value of log exports by port, species, and destination, Seattle
Customs District, fourth quarter 2005
(Volume in thousand board feet, Scribner scale; value in dollars per thousand board feet)
Destination
All countries JapanPeople's Republic
of China Korea Canada
Port andspecies Volume
Averagevalue Volume
Averagevalue Volume
Averagevalue Volume
Averagevalue Volume
Averagevalue
Aberdeen-HoquiamDouglas-fir 17,081 893.68 16,647 896.25 0 -- 434 795.15 0 --Hemlock 3,464 569.58 0 -- 0 -- 3,464 569.58 0 --Spruce 172 312.07 0 -- 0 -- 172 312.07 0 --All softwoods 20,717 834.66 16,647 896.25 0 -- 4,070 582.70 0 --
Olympia:
Douglas-fir 1,152 886.86 1,152 886.86 0 -- 0 -- 0 --
Hemlock 42 597.84 42 597.84 0 -- 0 -- 0 --
Other softwoods 14 574.96 14 574.96 0 -- 0 -- 0 --
All softwoods 1,208 873.12 1,208 873.12 0 -- 0 -- 0 --
Seattle:
Douglas-fir 230 741.18 0 -- 0 -- 222 717.22 0 --
Hemlock 834 453.87 0 -- 0 -- 834 453.87 0 --
Spruce 95 1,362.44 0 -- 0 -- 0 -- 0 --
Other softwoods 2,275 726.10 106 2,319.56 6 420.64 2,118 640.66 0 --
All softwoods 3.434 678.68 106 2,319.56 6 420.64 3,174 596.94 0 --
All hardwoods 3,483 1,235.47 817 2,029.09 670 1,156.95 1,898 842.27 0 --
Red alder 304 1,511.45 0 -- 285 1,511.66 0 -- 0 --
Tacoma:
Douglas-fir 22,510 890.55 21,774 898.21 43 542.68 692 671.60 0 --
Redcedar 146 778.28 0 -- 118 579.92 28 1,620.48 0 --
Hemlock 2,181 692.95 0 -- 0 -- 2,181 692.95 0 --
Spruce 612 723.94 0 -- 0 -- 511 425.55 0 --
Other softwoods 5,561 442.20 0 -- 0 -- 5,560 441.60 0 --
All softwoods 31,009 792.44 21,774 898.21 162 569.90 8,972 523.18 0 --
All hardwoods 807 2,393.27 78 3,278.54 157 1,453.71 129 2,099.50 0 --
Red alder 142 1,564.83 0 -- 133 1,549.28 0 -- 0 --

59
Table 33d—Volume and average value of log exports by port, species, and destination, Seattle Customs
District, fourth quarter 2005 (continued)
(Volume in thousand board feet, Scribner scale; value in dollars per thousand board feet)
Destination
All countries JapanPeople's Republic
of China Korea Canada
Port andspecies Volume
Averagevalue Volume
Averagevalue Volume
Averagevalue Volume
Averagevalue Volume
Averagevalue
Other ports:a
Douglas-fir 10 1,945.84 0 -- 0 -- 0 -- 0 --Redcedar 73 407.59 0 -- 0 -- 0 -- 73 407.59All softwoods 83 587.60 0 -- 0 -- 0 -- 73 407.59All hardwoods 370 273.24 0 -- 0 -- 0 -- 370 273.24
Total:Douglas-fir 40,982 891.17 39,573 897.06 43 542.68 1,348 718.85 0 --Redcedar 219 654.34 0 -- 118 579.92 28 1,620.48 73 407.59Hemlock 6,520 596.22 42 597.84 0 -- 6,478 596.21 0 --Spruce 879 712.43 0 -- 0 -- 683 396.91 0 --Other softwoods 7,851 524.72 121 2,112.25 6 420.64 7,678 496.51 0 --All softwoods 56,451 802.44 39,736 900.43 168 564.40 16,215 552.56 73 407.59All hardwoods 4,660 1,359.49 895 2,137.83 826 1,213.18 2,027 922.49 370 273.24Red alder 446 1,528.45 0 -- 418 1,523.65 0 -- 0 --
a Blaine and Sumas.
Source: U.S. Department of Commerce.
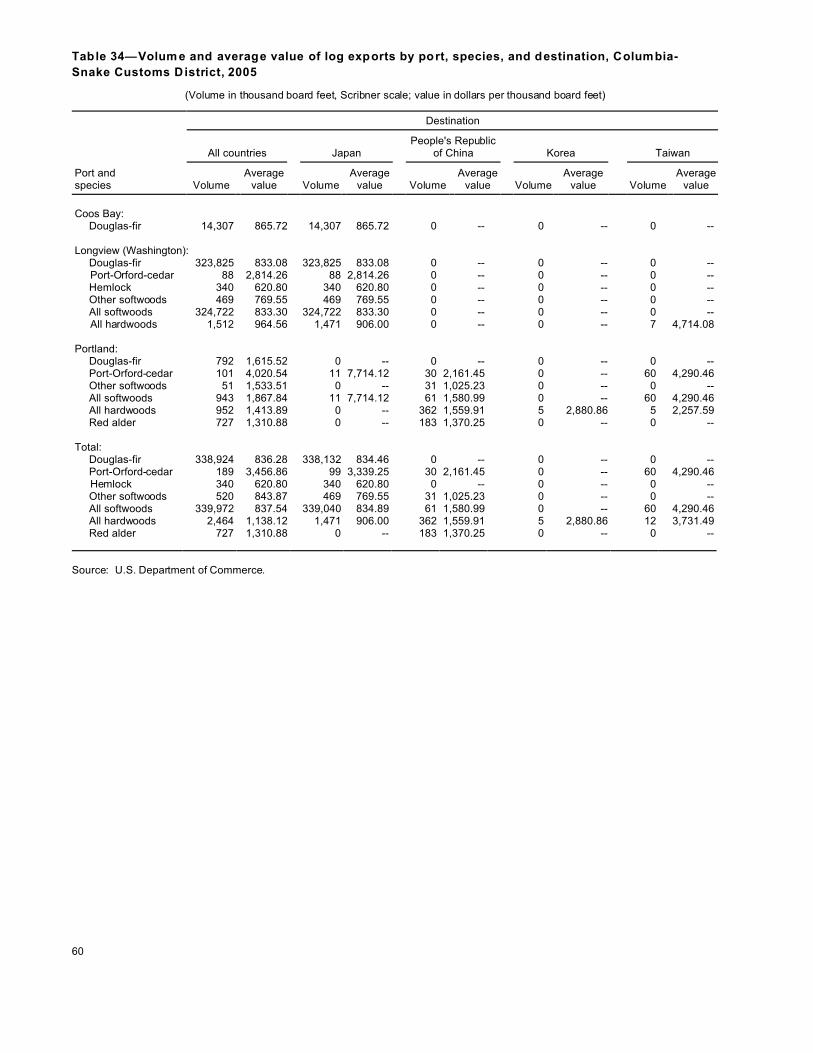
60
Table 34—Volum e and average value of log exports by port, species, and destination, Columbia-
Snake Customs District, 2005
(Volume in thousand board feet, Scribner scale; value in dollars per thousand board feet)
Destination
All countries JapanPeople's Republic
of China Korea Taiwan
Port andspecies Volume
Averagevalue Volume
Averagevalue Volume
Averagevalue Volume
Averagevalue Volume
Averagevalue
Coos Bay:Douglas-fir 14,307 865.72 14,307 865.72 0 -- 0 -- 0 --
Longview (Washington):
Douglas-fir 323,825 833.08 323,825 833.08 0 -- 0 -- 0 -- Port-Orford-cedar 88 2,814.26 88 2,814.26 0 -- 0 -- 0 --
Hemlock 340 620.80 340 620.80 0 -- 0 -- 0 --Other softwoods 469 769.55 469 769.55 0 -- 0 -- 0 --All softwoods 324,722 833.30 324,722 833.30 0 -- 0 -- 0 --
All hardwoods 1,512 964.56 1,471 906.00 0 -- 0 -- 7 4,714.08 Portland:
Douglas-fir 792 1,615.52 0 -- 0 -- 0 -- 0 --Port-Orford-cedar 101 4,020.54 11 7,714.12 30 2,161.45 0 -- 60 4,290.46Other softwoods 51 1,533.51 0 -- 31 1,025.23 0 -- 0 --All softwoods 943 1,867.84 11 7,714.12 61 1,580.99 0 -- 60 4,290.46All hardwoods 952 1,413.89 0 -- 362 1,559.91 5 2,880.86 5 2,257.59Red alder 727 1,310.88 0 -- 183 1,370.25 0 -- 0 --
Total:
Douglas-fir 338,924 836.28 338,132 834.46 0 -- 0 -- 0 --Port-Orford-cedar 189 3,456.86 99 3,339.25 30 2,161.45 0 -- 60 4,290.46
Hemlock 340 620.80 340 620.80 0 -- 0 -- 0 --Other softwoods 520 843.87 469 769.55 31 1,025.23 0 -- 0 --All softwoods 339,972 837.54 339,040 834.89 61 1,580.99 0 -- 60 4,290.46All hardwoods 2,464 1,138.12 1,471 906.00 362 1,559.91 5 2,880.86 12 3,731.49Red alder 727 1,310.88 0 -- 183 1,370.25 0 -- 0 --
Source: U.S. Department of Commerce.

61
Table 35a—Volum e and average value of log exports by port, species, and destination, Columbia-
Snake Customs District, first quarter 2005
(Volume in thousand board feet, Scribner scale; value in dollars per thousand board feet)
Destination
All countries JapanPeople's Republic
of China Korea Taiwan
Port andspecies Volume
Averagevalue Volume
Averagevalue Volume
Averagevalue Volume
Averagevalue Volume
Averagevalue
Coos Bay:Douglas-fir 4,622 862.62 4,622 862.62 0 -- 0 -- 0 --
Longview (Washington):
Douglas-fir 82,274 827.28 82,274 827.28 0 -- 0 -- 0 -- Port-Orford-cedar 88 2,814.26 88 2,814.26 0 -- 0 -- 0 --
Hemlock 106 539.40 106 539.40 0 -- 0 -- 0 --Other softwoods 218 680.53 218 680.53 0 -- 0 -- 0 --All softwoods 82,685 828.65 82,685 828.65 0 -- 0 -- 0 --
Portland:
Douglas-fir 460 758.98 0 -- 0 -- 0 -- 0 --Port-Orford-cedar 21 2,941.83 0 -- 19 2,135.18 0 -- 2 9,798.39All softwoods 481 854.14 0 -- 19 2,135.18 0 -- 2 9,798.39All hardwoods 298 1,453.91 0 -- 74 1,529.46 5 2,880.86 0 --Red alder 221 1,378.56 0 -- 19 1,829.86 0 -- 0 --
Total:
Douglas-fir 87,355 828.79 86,895 829.16 0 -- 0 -- 0 --Port-Orford-cedar 109 2,838.75 88 2,814.26 19 2,135.18 0 -- 2 9,798.39Hemlock 106 539.40 106 539.40 0 -- 0 -- 0 --Other softwoods 218 680.53 218 680.53 0 -- 0 -- 0 --All softwoods 87,788 830.58 87,307 830.45 19 2,135.18 0 -- 2 9,798.39All hardwoods 298 1,453.91 0 -- 74 1,529.46 5 2,880.86 0 --Red alder 221 1,378.56 0 -- 19 1,829.86 0 -- 0 --
Source: U.S. Department of Commerce.

62
Table 35b—Volum e and average value of log exports by port, species, and destination, Columbia-
Snake Customs District, second quarter 2005
(Volume in thousand board feet, Scribner scale; value in dollars per thousand board feet)
Destination
All countries JapanPeople's Republic
of China Korea Taiwan
Port andspecies Volume
Averagevalue Volume
Averagevalue Volume
Averagevalue Volume
Averagevalue Volume
Averagevalue
Coos Bay:Douglas-fir 4,911 857.43 4,911 857.43 0 -- 0 -- 0 --
Longview (Washington):
Douglas-fir 83,094 808.98 83,094 808.98 0 -- 0 -- 0 --Hemlock 134 716.12 134 716.12 0 -- 0 -- 0 --Other softwoods 120 576.79 120 576.79 0 -- 0 -- 0 --
All softwoods 83,348 808.50 83,348 808.50 0 -- 0 -- 0 --All hardwoods 41 3,074.28 0 -- 0 -- 0 -- 7 4,714.08
Portland:Douglas-fir 79 2,588.61 0 -- 0 -- 0 -- 0 --Port-Orford-cedar 29 4,181.54 0 -- 0 -- 0 -- 29 4,181.54Other softwoods 32 1,449.69 0 -- 23 1,031.24 0 -- 0 --All softwoods 140 2,654.97 0 -- 23 1,031.24 0 -- 29 4,181.54All hardwoods 247 1,561.66 0 -- 126 1,581.57 0 -- 0 --Red alder 173 1,522.90 0 -- 62 1,377.90 0 -- 0 --
Total:
Douglas-fir 88,084 813.27 88,005 811.69 0 -- 0 -- 0 --Port-Orford-cedar 29 4,181.54 0 -- 0 -- 0 -- 29 4,181.54Hemlock 134 716.12 134 716.12 0 -- 0 -- 0 --Other softwoods 152 760.49 120 576.79 23 1,031.24 0 -- 0 --All softwoods 88,399 814.13 88,259 811.22 23 1,031.24 0 -- 29 4,181.54All hardwoods 288 1,776.26 0 -- 126 1,581.57 0 -- 7 4,714.08Red alder 173 1,522.90 0 -- 62 1,377.90 0 -- 0 --
Source: U.S. Department of Commerce.

63
Table 35c—Volum e and average value of log exports by port, species, and destination, Columbia-
Snake Customs District, third quarter 2005
(Volume in thousand board feet, Scribner scale; value in dollars per thousand board feet)
Destination
All countries JapanPeople's Republic
of China Korea Taiwan
Port andspecies Volume
Averagevalue Volume
Averagevalue Volume
Averagevalue Volume
Averagevalue Volume
Averagevalue
Coos Bay:Douglas-fir 4,774 877.24 4,774 877.24 0 -- 0 -- 0 --
Longview (Washington):
Douglas-fir 80,246 850.68 80,246 850.68 0 -- 0 -- 0 --Hemlock 99 578.83 99 578.83 0 -- 0 -- 0 --Other softwoods 17 700.09 17 700.09 0 -- 0 -- 0 --All softwoods 80,363 850.32 80,363 850.32 0 -- 0 -- 0 --
Portland:
Douglas-fir 115 3,153.73 0 -- 0 -- 0 -- 0 --Port-Orford-cedar 24 4,484.33 0 -- 0 -- 0 -- 24 4,484.33
Other softwoods 11 2,181.10 0 -- 0 -- 0 -- 0 --All softwoods 150 3,298.79 0 -- 0 -- 0 -- 24 4,484.33All hardwoods 202 1,337.00 0 -- 47 1,975.25 0 -- 5 2,257.59Red alder 143 1,115.43 0 -- 0 -- 0 -- 0 --
Total:
Douglas-fir 85,135 855.18 85,020 852.18 0 -- 0 -- 0 --Port-Orford-cedar 24 4,484.33 0 -- 0 -- 0 -- 24 4,484.33Hemlock 99 578.83 99 578.83 0 -- 0 -- 0 --Other softwoods 28 1,268.80 17 700.09 0 -- 0 -- 0 --All softwoods 85,286 856.12 85,136 851.83 0 -- 0 -- 24 4,484.33All hardwoods 202 1,337.00 0 -- 47 1,975.25 0 -- 5 2,257.59Red alder 143 1,115.43 0 -- 0 -- 0 -- 0 --
Source: U.S. Department of Commerce.

64
Table 35d—Volum e and average value of log exports by port, species, and destination, Columbia-
Snake Customs District, fourth quarter 2005
(Volume in thousand board feet, Scribner scale; value in dollars per thousand board feet)
Destination
All countries JapanPeople's Republic
of China Korea Taiwan
Port andspecies Volume
Averagevalue Volume
Averagevalue Volume
Averagevalue Volume
Averagevalue Volume
Averagevalue
Longview (Washington):
Douglas-fir 78,212 846.71 78,212 846.71 0 -- 0 -- 0 --Other softwoods 114 1,151.74 114 1,151.74 0 -- 0 -- 0 --All softwoods 78,326 847.16 78,326 847.16 0 -- 0 -- 0 --All hardwoods 1,471 906.00 1,471 906.00 0 -- 0 -- 0 --
Portland:Douglas-fir 138 2,633.49 0 -- 0 -- 0 -- 0 --Port-Orford-cedar 27 4,274.61 11 7,714.12 11 2,206.11 0 -- 5 1,704.98Other softwoods 8 1,007.67 0 -- 8 1,007.67 0 -- 0 --All softwoods 173 2,814.44 11 7,714.12 19 1,704.44 0 -- 5 1,704.98All hardwoods 204 1,252.51 0 -- 115 1,385.36 0 -- 0 --Red alder 190 1,186.17 0 -- 102 1,278.67 0 -- 0 --
Total:
Douglas-fir 78,350 849.86 78,212 846.71 0 -- 0 -- 0 --Port-Orford-cedar 27 4,274.61 11 7,714.12 11 2,206.11 0 -- 5 1,704.98Other softwoods 122 1,142.35 114 1,151.74 8 1,007.67 0 -- 0 --All softwoods 78,499 851.49 78,337 848.09 19 1,704.44 0 -- 5 1,704.98All hardwoods 1,675 948.15 1,471 906.00 115 1,385.36 0 -- 0 --Red alder 190 1,186.17 0 -- 102 1,278.67 0 -- 0 --
Source: U.S. Department of Commerce.

65
Table 36—Volume and average value of log exports by port, species, and destination,
San Francisco Customs District, 2005
(Volume in thousand board feet, Scribner scale; value in dollars per thousand board feet)
Destination
All countries JapanPeople's Republic
of China Korea Taiwan
Port andspecies Volume
Averagevalue Volume
Averagevalue Volume
Averagevalue Volume
Averagevalue Volume
Averagevalue
Oakland:Douglas-fir 74 1,262.36 0 -- 0 -- 0 -- 0 --Other softwoods 66 1,215.93 15 296.46 0 -- 0 -- 0 --All softwoods 140 1,240.42 15 296.46 0 -- 0 -- 0 --All hardwoods 1,623 2,784.05 472 2,086.95 154 2,652.85 36 4,407.27 18 1,525.27
Alameda:
All hardwoods 4 5,710.07 0 -- 0 -- 4 5,710.07 0 --
Total:Douglas-fir 74 1,262.36 0 -- 0 -- 0 -- 0 --Other softwoods 66 1,215.93 15 296.46 0 -- 0 -- 0 --All softwoods 140 1,240.42 15 296.46 0 -- 0 -- 0 --All hardwoods 1,628 2,793.45 472 2,086.95 154 2,652.85 40 4,549.66 18 1,525.27
Source: U.S. Department of Commerce.

66
Table 37a— Volume and average value of log exports by port, species, and destination,
San Francisco Customs District, first quarter 2005
(Volume in thousand board feet, Scribner scale; value in dollars per thousand board feet)
Destination
All countries JapanPeople's Republic
of China Korea Taiwan
Port andspecies Volume
Averagevalue Volume
Averagevalue Volume
Averagevalue Volume
Averagevalue Volume
Averagevalue
Oakland: Douglas-fir 45 882.02 0 -- 0 -- 0 -- 0 --
All softwoods 45 882.02 0 -- 0 -- 0 -- 0 -- All hardwoods 447 2,635.87 97 4,283.03 40 2,719.04 16 4,000.97 4 801.09
Alameda: All hardwoods 4 5,710.07 0 -- 0 -- 4 5,710.07 0 --
Total: Douglas-fir 45 882.02 0 -- 0 -- 0 -- 0 -- All softwoods 45 882.02 0 -- 0 -- 0 -- 0 --
All hardwoods 451 2,665.94 97 4,283.03 40 2,719.04 21 4,364.61 4 801.09
Source: U.S. Department of Commerce.
Table 37b—Volume and average value of log exports by port, species, and destination,
San Francisco Customs District, second quarter 2005
(Volume in thousand board feet, Scribner scale; value in dollars per thousand board feet)
Destination
All countries JapanPeople's Republic
of China Korea Taiwan
Port andspecies Volume
Averagevalue Volume
Averagevalue Volume
Averagevalue Volume
Averagevalue Volume
Averagevalue
Oakland:Douglas-fir 6 1,472.59 0 -- 0 -- 0 -- 0 --
Other softwoods 51 1,495.77 0 -- 0 -- 0 -- 0 -- All softwoods 57 1,493.33 0 -- 0 -- 0 -- 0 -- All hardwoods 260 3,061.30 8 6,152.96 35 2,874.90 4 8,764.54 8 1,518.29
Total: Douglas-fir 6 1,472.59 0 -- 0 -- 0 -- 0 -- Other softwoods 51 1,495.77 0 -- 0 -- 0 -- 0 -- All softwoods 57 1,493.33 0 -- 0 -- 0 -- 0 --
All hardwoods 260 3,061.30 8 6,152.96 35 2,874.90 4 8,764.54 8 1,518.29
Source: U.S. Department of Commerce.
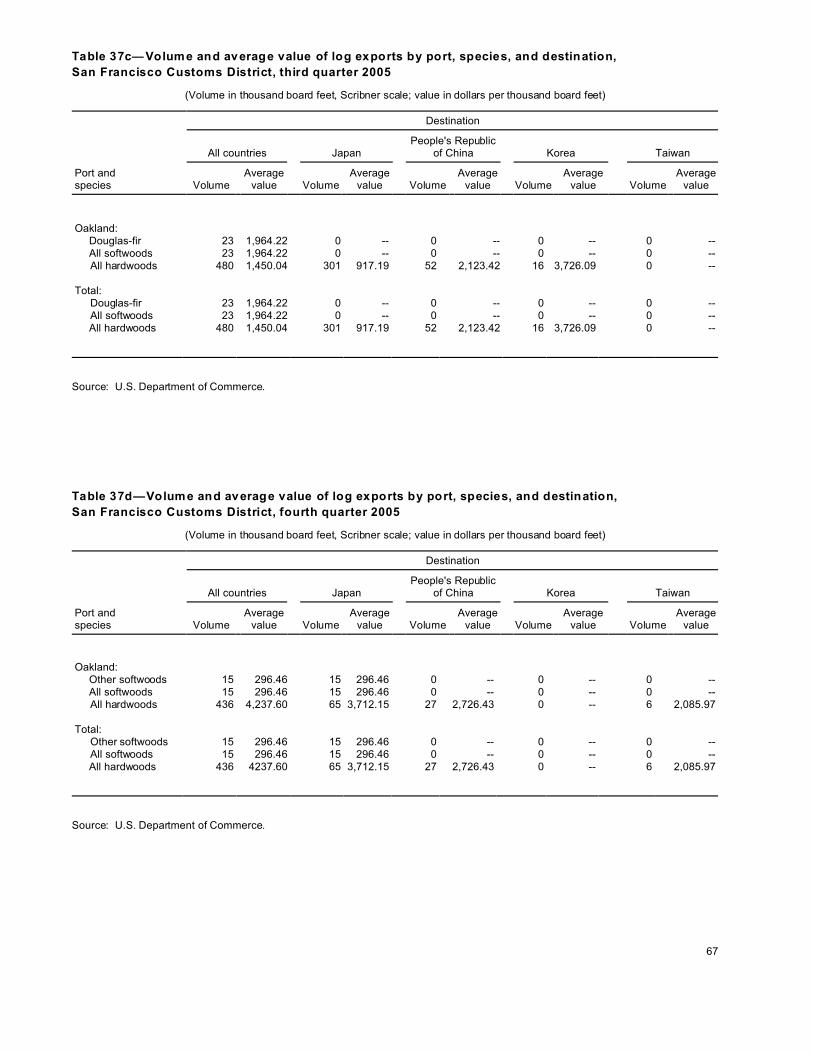
67
Table 37c— Volume and average value of log exports by port, species, and destination,
San Francisco Customs District, third quarter 2005
(Volume in thousand board feet, Scribner scale; value in dollars per thousand board feet)
Destination
All countries JapanPeople's Republic
of China Korea Taiwan
Port andspecies Volume
Averagevalue Volume
Averagevalue Volume
Averagevalue Volume
Averagevalue Volume
Averagevalue
Oakland:Douglas-fir 23 1,964.22 0 -- 0 -- 0 -- 0 --All softwoods 23 1,964.22 0 -- 0 -- 0 -- 0 --
All hardwoods 480 1,450.04 301 917.19 52 2,123.42 16 3,726.09 0 --
Total: Douglas-fir 23 1,964.22 0 -- 0 -- 0 -- 0 -- All softwoods 23 1,964.22 0 -- 0 -- 0 -- 0 --
All hardwoods 480 1,450.04 301 917.19 52 2,123.42 16 3,726.09 0 --
Source: U.S. Department of Commerce.
Table 37d—Volume and average value of log exports by port, species, and destination,
San Francisco Customs District, fourth quarter 2005
(Volume in thousand board feet, Scribner scale; value in dollars per thousand board feet)
Destination
All countries JapanPeople's Republic
of China Korea Taiwan
Port andspecies Volume
Averagevalue Volume
Averagevalue Volume
Averagevalue Volume
Averagevalue Volume
Averagevalue
Oakland:Other softwoods 15 296.46 15 296.46 0 -- 0 -- 0 --All softwoods 15 296.46 15 296.46 0 -- 0 -- 0 --
All hardwoods 436 4,237.60 65 3,712.15 27 2,726.43 0 -- 6 2,085.97
Total: Other softwoods 15 296.46 15 296.46 0 -- 0 -- 0 -- All softwoods 15 296.46 15 296.46 0 -- 0 -- 0 --
All hardwoods 436 4237.60 65 3,712.15 27 2,726.43 0 -- 6 2,085.97
Source: U.S. Department of Commerce.
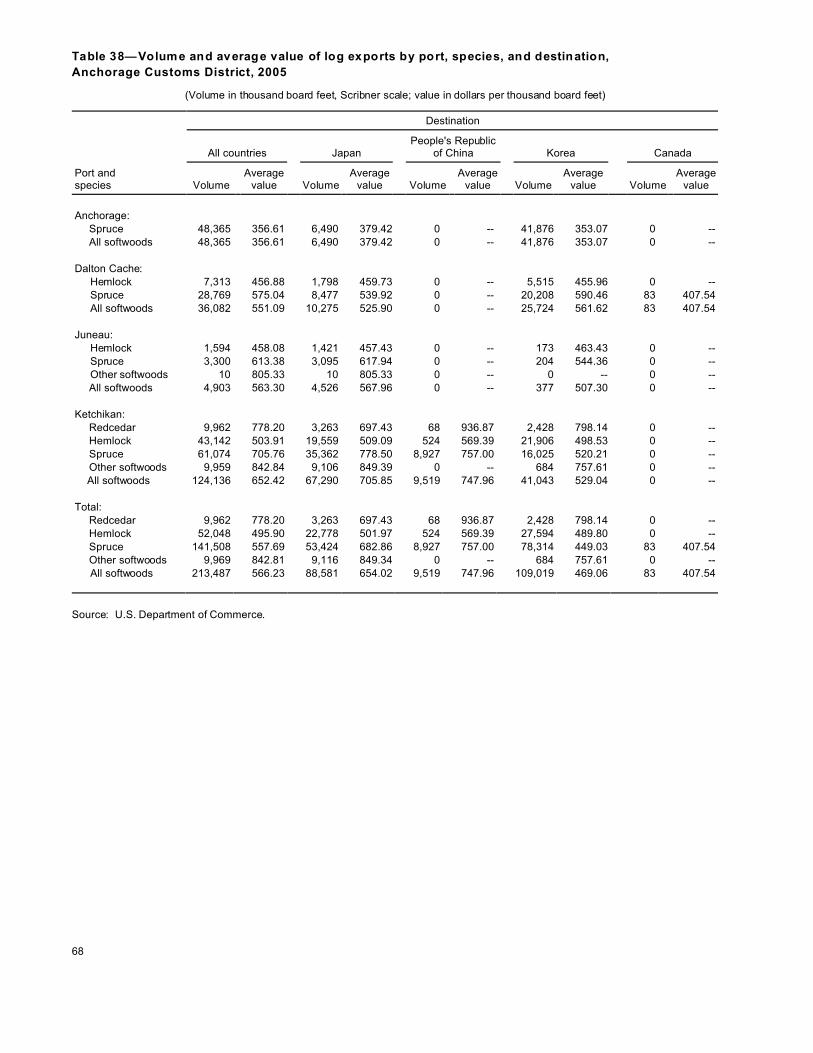
68
Table 38—Volume and average value of log exports by port, species, and destination,
Anchorage Customs District, 2005
(Volume in thousand board feet, Scribner scale; value in dollars per thousand board feet)
Destination
All countries JapanPeople's Republic
of China Korea Canada
Port andspecies Volume
Averagevalue Volume
Averagevalue Volume
Averagevalue Volume
Averagevalue Volume
Averagevalue
Anchorage:Spruce 48,365 356.61 6,490 379.42 0 -- 41,876 353.07 0 --All softwoods 48,365 356.61 6,490 379.42 0 -- 41,876 353.07 0 --
Dalton Cache: Hemlock 7,313 456.88 1,798 459.73 0 -- 5,515 455.96 0 -- Spruce 28,769 575.04 8,477 539.92 0 -- 20,208 590.46 83 407.54 All softwoods 36,082 551.09 10,275 525.90 0 -- 25,724 561.62 83 407.54
Juneau: Hemlock 1,594 458.08 1,421 457.43 0 -- 173 463.43 0 -- Spruce 3,300 613.38 3,095 617.94 0 -- 204 544.36 0 -- Other softwoods 10 805.33 10 805.33 0 -- 0 -- 0 --
All softwoods 4,903 563.30 4,526 567.96 0 -- 377 507.30 0 --
Ketchikan:Redcedar 9,962 778.20 3,263 697.43 68 936.87 2,428 798.14 0 --Hemlock 43,142 503.91 19,559 509.09 524 569.39 21,906 498.53 0 --Spruce 61,074 705.76 35,362 778.50 8,927 757.00 16,025 520.21 0 --Other softwoods 9,959 842.84 9,106 849.39 0 -- 684 757.61 0 --
All softwoods 124,136 652.42 67,290 705.85 9,519 747.96 41,043 529.04 0 --
Total:Redcedar 9,962 778.20 3,263 697.43 68 936.87 2,428 798.14 0 --Hemlock 52,048 495.90 22,778 501.97 524 569.39 27,594 489.80 0 --Spruce 141,508 557.69 53,424 682.86 8,927 757.00 78,314 449.03 83 407.54Other softwoods 9,969 842.81 9,116 849.34 0 -- 684 757.61 0 --
All softwoods 213,487 566.23 88,581 654.02 9,519 747.96 109,019 469.06 83 407.54
Source: U.S. Department of Commerce.

69
Table 39a— Volume and average value of log exports by port, species, and destination,
Anchorage Customs District, first quarter 2005
(Volume in thousand board feet, Scribner scale; value in dollars per thousand board feet)
Destination
All countries JapanPeople's Republic
of China Korea Canada
Port andspecies Volume
Averagevalue Volume
Averagevalue Volume
Averagevalue Volume
Averagevalue Volume
Averagevalue
Anchorage:Spruce 15,205 361.77 3,687 403.90 0 -- 11,518 348.29 0 --
All softwoods 15,205 361.77 3,687 403.90 0 -- 11,518 348.29 0 --
Dalton Cache: Spruce 42 366.86 0 -- 0 -- 0 -- 42 366.86 All softwoods 42 366.86 0 -- 0 -- 0 -- 42 366.86
Juneau:Spruce 838 796.50 838 796.50 0 -- 0 -- 0 --All softwoods 838 796.50 838 796.50 0 -- 0 -- 0 --
Ketchikan: Redcedar 652 710.87 652 710.87 0 -- 0 -- 0 --
Hemlock 2,703 458.24 1,663 434.52 247 577.27 725 470.43 0 --Spruce 8,327 639.82 4,863 677.63 3,288 583.41 175 648.98 0 --Other softwoods 2,096 995.08 2,091 995.59 0 -- 0 -- 0 --All softwoods 13,778 661.61 9,269 708.08 3,535 582.98 900 505.24 0 --
Total: Redcedar 652 710.87 652 710.87 0 -- 0 -- 0 --
Hemlock 2,703 458.24 1,663 434.52 247 577.27 725 470.43 0 --Spruce 24,412 471.55 9,389 580.74 3,288 583.41 11,694 352.80 42 366.86Other softwoods 2,096 995.08 2,091 995.59 0 -- 0 -- 0 --All softwoods 29,864 512.32 13,794 632.15 3,535 582.98 12,418 359.67 42 366.86
Source: U.S. Department of Commerce.

70
Table 39b—Volume and average value of log exports by port, species, and destination,
Anchorage Customs District, second quarter 2005
(Volume in thousand board feet, Scribner scale; value in dollars per thousand board feet)
Destination
All countries JapanPeople's Republic
of China Korea Canada
Port andspecies Volume
Averagevalue Volume
Averagevalue Volume
Averagevalue Volume
Averagevalue Volume
Averagevalue
Anchorage:Spruce 12,369 358.62 0 -- 0 -- 12,369 358.62 0 --All hardwoods 12,369 358.62 0 -- 0 -- 12,369 358.62 0 --
Dalton Cache:Hemlock 1,921 458.73 737 461.14 0 -- 1,183 457.23 0 --Spruce 4,827 634.81 0 -- 0 -- 4,795 636.03 32 451.34All softwoods 6,748 584.69 737 461.14 0 -- 5,979 600.64 32 451.34
Juneau: Hemlock 570 456.16 397 453.00 0 -- 173 463.43 0 -- Spruce 1,808 528.80 1,604 526.82 0 -- 204 544.36 0 -- Other softwoods 10 805.33 10 805.33 0 -- 0 -- 0 -- All softwoods 2,388 512.61 2,011 513.61 0 -- 377 507.30 0 --
Ketchikan:Redcedar 2,756 851.93 948 804.36 0 -- 527 849.12 0 --Hemlock 14,631 523.94 8,631 522.79 0 -- 5,568 526.91 0 --Spruce 19,408 665.32 13,262 747.47 0 -- 5,882 487.93 0 --Other softwoods 3,142 833.21 2,400 855.28 0 -- 684 757.61 0 --
All softwoods 39,937 639.61 25,242 683.03 0 -- 12,661 534.67 0 --
Total:Redcedar 2,756 851.93 948 804.36 0 -- 527 849.12 0 --Hemlock 17,122 514.37 9,766 515.30 0 -- 6,924 513.42 0 --Spruce 38,412 556.30 14,866 723.66 0 -- 23,250 450.18 32 451.34Other softwoods 3,152 833.12 2,410 855.07 0 -- 684 757.61 0 --
All softwoods 61,442 572.08 27,990 665.01 0 -- 31,385 477.53 32 451.34
Source: U.S. Department of Commerce.

71
Table 39c— Volume and average value of log exports by port, species, and destination,
Anchorage Customs District, third quarter 2005
(Volume in thousand board feet, Scribner scale; value in dollars per thousand board feet)
Destination
All countries JapanPeople's Republic
of China Korea Canada
Port andspecies Volume
Averagevalue Volume
Averagevalue Volume
Averagevalue Volume
Averagevalue Volume
Averagevalue
Anchorage:Spruce 8,813 342.13 2,802 347.22 0 -- 6,010 339.75 0 --
All softwoods 8,813 342.13 2,802 347.22 0 -- 6,010 339.75 0 -- Dalton Cache: Hemlock 3,874 456.61 955 459.29 0 -- 2,919 455.74 0 -- Spruce 15,321 582.52 6,468 557.58 0 -- 8,853 600.73 0 -- All softwoods 19,194 557.11 7,423 544.94 0 -- 11,772 564.78 0 --
Juneau: Hemlock 1,024 459.15 1,024 459.15 0 -- 0 -- 0 -- Spruce 653 612.58 653 612.58 0 -- 0 -- 0 -- All softwoods 1,677 518.91 1,677 518.91 0 -- 0 -- 0 --
Ketchikan:Redcedar 2,451 691.95 1,453 594.04 68 936.87 930 826.93 0 --Hemlock 10,522 505.93 2,867 471.80 277 562.36 7,378 517.06 0 --Spruce 12,865 650.50 5,721 646.45 2,956 887.93 4,188 488.45 0 --Other softwoods 1,980 751.08 1,980 751.08 0 -- 0 -- 0 --All softwoods 27,818 606.63 12,021 615.70 3,301 861.63 12,496 530.55 0 --
Total:Redcedar 2,451 691.95 1,453 594.04 68 936.87 930 826.93 0 --Hemlock 15,419 490.43 4,845 466.66 277 562.36 10,297 499.68 0 --Spruce 37,652 550.00 15,645 554.70 2,956 887.93 19,050 493.71 0 --Other softwoods 1,980 751.08 1,980 751.08 0 -- 0 -- 0 --
All softwoods 57,502 547.00 23,923 555.51 3,301 861.63 30,278 505.98 0 --
Source: U.S. Department of Commerce.

72
Table 39d—Volume and average value of log exports by port, species, and destination,
Anchorage Customs District, fourth quarter 2005
(Volume in thousand board feet, Scribner scale; value in dollars per thousand board feet)
Destination
All countries JapanPeople's Republic
of China Korea Canada
Port andspecies Volume
Averagevalue Volume
Averagevalue Volume
Averagevalue Volume
Averagevalue Volume
Averagevalue
Anchorage:Spruce 11,979 358.63 0 -- 0 -- 11,979 358.63 0 --
All softwoods 11,979 358.63 0 -- 0 -- 11,979 358.63 0 --
Dalton Cache: Hemlock 1,519 455.24 106 453.95 0 -- 1,413 455.34 0 -- Spruce 8,579 529.08 2,009 483.06 0 -- 6,560 543.29 9 440.38 All softwoods 10,098 517.97 2,115 481.61 0 -- 7,974 527.70 9 440.38
Ketchikan:Redcedar 4,103 790.89 211 887.39 0 -- 970 742.82 0 --Hemlock 15,285 491.42 6,399 526.69 0 -- 8,235 465.21 0 --Spruce 20,474 805.63 11,515 922.46 2,683 825.49 5,781 572.17 0 --Other softwoods 2,740 803.73 2,635 801.88 0 -- 0 -- 0 --All softwoods 42,603 691.35 20,759 784.81 2,683 825.49 14,985 524.44 0 --
Total: Redcedar 4,103 790.89 211 887.39 0 -- 970 742.82 0 --
Hemlock 16,804 488.15 6,505 525.50 0 -- 9,648 463.77 0 --Spruce 41,032 617.31 13,524 857.19 2,683 825.49 24,320 459.20 9 440.38Other softwoods 2,740 803.73 2,635 801.88 0 -- 0 -- 0 --All softwoods 64,679 602.66 22,874 756.77 2,683 825.49 34,938 468.34 9 440.38
Source: U.S. Department of Commerce.

73
Table 40—Volume and average value of hardwood log exports from Seattle, Columbia-Snake,
Anchorage, and San Francisco Customs Districts, 1994-2005
(Volume in thousand board feet, Scribner scale; value in dollars per thousand board feet)
SeattleCustoms District
Columbia-SnakeCustoms District
AnchorageCustoms District
San FranciscoCustoms District
Year andquarter Volume
Averagevalue Volume
Averagevalue Volume
Averagevalue Volume
Averagevalue
To All Countr ies
1994 28,146 1,551.01 4,398 1,893.59 0 -- 4,031 1,949.831995 27,396 1,661.52 2,923 1,468.01 21 1,409.05 3,151 2,464.611996 25,571 1,525.33 3,485 1,806.60 0 -- 2,293 1,964.931997 26,675 1,613.51 2,071 1,865.35 0 -- 3,461 2,498.451998 13,531 1,559.69 2,755 1,689.58 0 -- 5,823 1,844.061999 30,514 840.25 2,130 1,470.45 40 904.94 3,701 2,054.192000 15,594 1,457.01 17,247 311.74 500 116.61 2,463 2,488.062001 22,143 1,407.34 2,236 1,476.56 0 -- 1,264 2,791.642002 23,125 1,223.79 2,903 1,582.81 0 -- 19,156 131.722003 21,257 1,363.02 3,617 1,455.39 25 647.43 928 2,614.842004:
1st quarter 5,698 1,825.43 385 1,863.62 0 -- 658 1,492.022d quarter 10,884 932.51 715 1,167.01 2 17,938.80 357 2,058.303d quarter 2,594 1,393.05 262 1,263.45 0 -- 114 3,930.844th quarter 4,109 1,321.74 166 2,089.69 0 -- 274 4,808.47
2004 total 23,285 1,271.01 1,527 1,459.38 2 17,938.80 1,403 2,481.90
2005:1st quarter 5,498 1,485.10 317 1,477.93 0 -- 451 2,665.942d quarter 5,308 1,729.05 339 1,675.71 0 -- 260 3,063.903d quarter 3,504 1,386.00 202 1,337.00 0 -- 474 1,449.164th quarter 6,663 1,010.16 1,675 948.15 0 -- 436 4,242.33
2005 total 20,973 1,379.41 2,533 1,142.85 0 -- 1,622 2,798.14
To Japan
1994 15,036 1,632.88 2,114 1,719.96 0 -- 1,452 1,925.881995 14,560 1,828.91 2,103 1,405.14 0 -- 1,425 2,289.121996 14,738 1,738.16 1,343 1,905.80 0 -- 898 2,564.421997 15,677 1,720.14 946 1,859.67 0 -- 1,586 1,654.051998 8,342 1,726.32 2,300 1,674.89 0 -- 647 2,601.621999 11,360 1,530.46 1,552 1,475.78 0 -- 657 2,555.532000 8,221 1,571.70 158 1,156.83 0 -- 234 2,927.002001 7,733 1,568.97 593 1,262.15 0 -- 507 2,165.432002 6,854 1,174.10 1,075 1,302.69 0 -- 443 2,434.982003 6,607 1,384.09 2,046 1,337.21 0 -- 469 2,297.222004:
1st quarter 2,418 1,755.73 20 927.84 0 -- 221 2,060.992d quarter 7,346 623.13 491 937.50 2 17,938.80 48 5,125.903d quarter 328 1,440.85 108 905.93 0 -- 9 6,518.784th quarter 716 1,748.96 4 4,356.27 0 -- 98 5,526.20
2004 total 10,808 975.92 624 955.91 2 17,938.80 375 3,462.49
2005:
1st quarter 2,442 1,361.55 0 -- 0 -- 97 4,283.032d quarter 1,534 1,483.18 0 -- 0 -- 8 6,152.963d quarter 531 1,120.16 0 -- 0 -- 296 905.844th quarter 895 2,137.83 1,471 906.00 0 -- 65 3,712.15
2005 total 5,402 1,501.02 1,471 906.00 0 -- 466 2,093.60
To People’s Republic of China
1994 172 1,358.42 83 1,397.59 0 -- 141 1,769.541995 432 1,983.80 15 2,266.67 0 -- 16 3,187.501996 311 1,979.05 14 1,223.02 0 -- 8 2,080.781997 164 1,697.01 0 -- 0 -- 4 3,187.751998 425 1,229.30 13 2,470.75 0 -- 38 1,460.821999 213 1,782.79 25 2,017.35 0 -- 248 1,415.692000 683 1,829.79 418 761.75 0 -- 468 1,744.802001 5,240 1,358.35 735 1,723.63 0 -- 310 2,198.852002 4,382 1,479.76 703 1,542.18 0 -- 33 2,315.662003 3,230 1,432.28 341 1,445.53 0 -- 173 2,481.192004:
1st quarter 1,032 2,139.83 102 1,703.34 0 -- 59 1,311.692d quarter 834 1,462.81 112 1,774.33 0 -- 49 1,205.533d quarter 580 1,662.74 58 1,415.10 0 -- 46 1,326.714th quarter 376 1,986.31 66 1,603.32 0 -- 33 1,674.88
2004 total 2,822 1,818.79 339 1,657.88 0 -- 188 1,350.66
2005:
1st quarter 741 1,628.65 96 1,434.00 0 -- 40 2,719.042d quarter 1,295 1,668.41 177 1,445.14 0 -- 35 2,874.903d quarter 1,028 1,665.52 47 1,975.25 0 -- 52 2,726.434th quarter 830 1,216.41 115 1,385.36 0 -- 27 2,123.42
2005 total 3,894 1,563.70 435 1,484.53 0 -- 154 2,652.85
Source: U.S. Department of Commerce. The valuation definition used in the export statistics is the value at the seaport or border port of exportation. It is based onthe selling price (or cost if not sold) including inland freight, insurance, and other charges to the port of exportation.Data are compiled from Department of Commerce records at the end of each quarter.

74
Table 41—Volume and average value of alder log exports from the Seattle Customs
District, 1995-2005
(Volume in thousand board feet, Scribner scale; value in dollars per thousand board feet)
Destination
All countries JapanSouthKorea Taiwan
Year and quarter Volume
Averagevalue Volume
Averagevalue Volume
Averagevalue Volume
Averagevalue
1995 1,525 523.28 545 491.74 957 517.24 16 893.431996 921 453.01 397 234.05 467 571.33 33 1,057.081997 994 669.00 190 394.74 721 697.04 82 1,066.131998 164 874.23 11 554.53 69 600.38 83 1,143.201999 206 668.05 30 716.96 158 734.26 0 --2000 1,047 1,285.97 204 1,265.13 264 797.11 0 --2001 3,259 1,469.92 93 1,808.78 54 1,468.15 49 1,328.892002 4,255 1,463.94 102 966.35 4 2,910.53 0 --2003 3,370 1,420.14 0 -- 28 3,745.52 87 1,244.402004:
1st quarter 634 1,600.70 0 -- 0 -- 20 1,004.642d quarter 846 1,508.79 0 -- 0 -- 9 1,007.453d quarter 405 1,585.91 0 -- 0 -- 0 --4th quarter 527 1,622.96 0 -- 0 -- 0 --
2004 total 2,411 1,570.85 0 -- 0 -- 29 1,005.56 2005:
1st quarter 804 1,706.88 0 -- 0 -- 9 4,242.822d quarter 785 1,538.99 0 -- 0 -- 9 1,264.193d quarter 694 1,338.86 0 -- 0 -- 181 1,113.224th quarter 462 1,508.76 0 -- 0 -- 21 912.46
2005 total 2,745 1,532.43 0 -- 0 -- 221 1,235.01
Source: U.S. Department of Commerce.
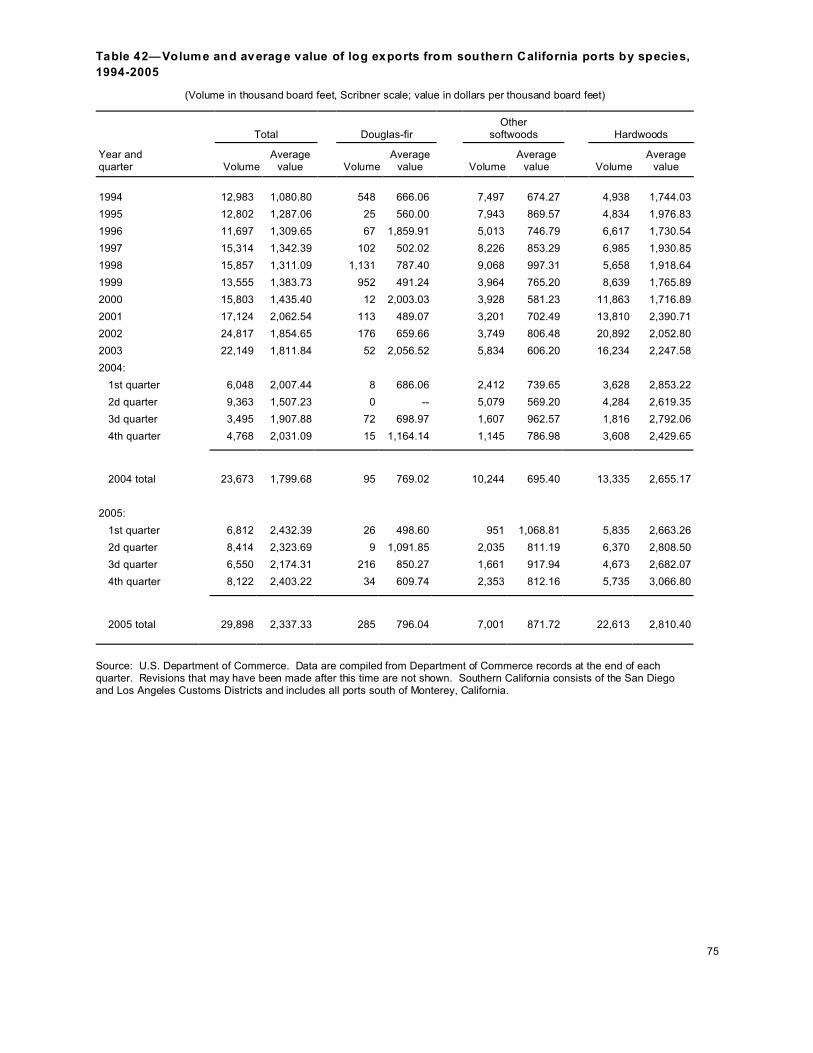
75
Table 42—Volume and average value of log exports from southern California ports by species,
1994-2005
(Volume in thousand board feet, Scribner scale; value in dollars per thousand board feet)
Total Douglas-firOther
softwoods Hardwoods
Year andquarter Volume
Averagevalue Volume
Averagevalue Volume
Averagevalue Volume
Averagevalue
1994 12,983 1,080.80 548 666.06 7,497 674.27 4,938 1,744.03
1995 12,802 1,287.06 25 560.00 7,943 869.57 4,834 1,976.83
1996 11,697 1,309.65 67 1,859.91 5,013 746.79 6,617 1,730.54
1997 15,314 1,342.39 102 502.02 8,226 853.29 6,985 1,930.85
1998 15,857 1,311.09 1,131 787.40 9,068 997.31 5,658 1,918.64
1999 13,555 1,383.73 952 491.24 3,964 765.20 8,639 1,765.89
2000 15,803 1,435.40 12 2,003.03 3,928 581.23 11,863 1,716.89
2001 17,124 2,062.54 113 489.07 3,201 702.49 13,810 2,390.71
2002 24,817 1,854.65 176 659.66 3,749 806.48 20,892 2,052.80
2003 22,149 1,811.84 52 2,056.52 5,834 606.20 16,234 2,247.58
2004:
1st quarter 6,048 2,007.44 8 686.06 2,412 739.65 3,628 2,853.22
2d quarter 9,363 1,507.23 0 -- 5,079 569.20 4,284 2,619.35
3d quarter 3,495 1,907.88 72 698.97 1,607 962.57 1,816 2,792.06
4th quarter 4,768 2,031.09 15 1,164.14 1,145 786.98 3,608 2,429.65
2004 total 23,673 1,799.68 95 769.02 10,244 695.40 13,335 2,655.17
2005:
1st quarter 6,812 2,432.39 26 498.60 951 1,068.81 5,835 2,663.26
2d quarter 8,414 2,323.69 9 1,091.85 2,035 811.19 6,370 2,808.50
3d quarter 6,550 2,174.31 216 850.27 1,661 917.94 4,673 2,682.07
4th quarter 8,122 2,403.22 34 609.74 2,353 812.16 5,735 3,066.80
2005 total 29,898 2,337.33 285 796.04 7,001 871.72 22,613 2,810.40
Source: U.S. Department of Commerce. Data are compiled from Department of Commerce records at the end of each quarter. Revisions that may have been made after this time are not shown. Southern California consists of the San Diego and Los Angeles Customs Districts and includes all ports south of Monterey, California.

76
Table 43—Volume and average value of softwood log exports to Canada from
the Great Falls Customs District, 1994-2005a
(Volume in thousand board feet, Scribner scale; value in dollars per thousand board feet)
All species Douglas-fir Other softwoods
Year andquarter Volume
Averagevalue Volume
Averagevalue Volume
Averagevalue
1994 1,502 327.56 728 376.37 774 281.651995 5,757 402.85 1,410 471.63 4,347 380.541996 2,876 354.99 636 393.37 2,241 344.101997 1,808 396.35 300 435.14 1,508 388.631998 2,030 456.72 642 508.98 1,387 432.531999 1,863 406.72 878 506.59 985 317.702000 1,136 391.51 1,024 400.40 112 310.702001 1,195 327.50 226 433.34 970 302.872002 1,256 302.35 98 496.27 1,159 285.952003 601 374.49 315 392.75 286 354.362004:
1st quarter 32 283.97 0 -- 32 283.972d quarter 283 504.44 210 588.13 73 264.233d quarter 31 220.44 0 -- 31 220.444th quarter 66 404.86 66 404.86 0 --
2004 total andaverage value 413 449.60 276 544.18 137 258.88
2005:1st quarter 0 -- 0 -- 0 --2d quarter 33 536.61 0 -- 33 536.613d quarter 144 667.98 0 -- 144 667.984th quarter 303 325.94 52 296.17 251 331.27
2005 total andaverage value 480 443.05 52 296.17 428 460.36
a Great Falls Customs District includes all ports in Montana and Idaho.
Source: U.S. Department of Commerce. The valuation definition used in the export statistics is the value at the seaport or border port of exportation. It is based on the selling price (or cost if not sold) and includes inland freight, insurance, and other charges to the port of exportation. Data are compiled from Department of Commerce records at the end of each quarter.

77
Table 44—Volume of log exports from British Columbia ports by species and destination,
1995-2005
(In thousand board feet, British Columbia log scale)
Year
Total,
al l species
Doug las-
fir Hem lock Cedar Spruce
Other
softwoods Hardwoods
To All Countries
1995 135,055 331 47,969 4,062 5,872 74,084 2,737
1996 68,810 4,640 21,430 3,910 2,520 35,030 1,280
1997 41,832 11,236 19,868 1,457 88 6,799 1,589
1998 192,450 44,238 123,355 4,790 3,620 11,236 5,210
1999 386,821 74,238 262,715 18,609 16,954 7,042 7,263
2000 513,422 49,073 381,634 46,247 20,155 12,870 3,444
2001 620,287 63,267 470,044 38,764 26,446 15,541 6,225
2002 875,143 56,733 715,850 54,084 26,203 17,770 4,503
2003 903,554 135,938 650,751 51,898 39,161 19,470 6,336
2004 NA NA NA NA NA NA NA
2005 NA NA NA NA NA NA NA
To Japan
1995 29,493 155 24,614 530 3,951 243 0
1996 11,040 1,410 7,750 1,300 400 130 40
1997 10,464 309 8,631 1,192 0 309 22
1998 92,274 861 83,068 4,106 1,060 0 3,179
1999 164,834 1,082 148,830 2,649 12,230 44 0
2000 189,382 2,274 167,837 5,784 12,494 949 44
2001 239,801 5,011 212,053 5,143 14,923 2,561 110
2002 383,135 4,680 355,166 12,318 10,022 861 88
2003 373,091 6,159 328,035 17,174 21,501 22 0
2004 NA NA NA NA NA NA NA
2005 NA NA NA NA NA NA NA
To United States
1995 94,835 22 15,607 1,126 1,656 73,841 2,583
1996 52,650 3,220 10,260 1,280 2,050 34,830 990
1997 22,296 3,267 10,000 265 817 6,424 1,523
1998 93,775 43,355 34,172 486 2,560 11,236 1,965
1999 219,514 72,053 113,135 15,740 4,481 6,954 7,152
2000 314,371 44,834 209,117 39,183 6,534 11,898 2,804
2001 362,914 56,424 247,594 31,347 9,912 12,252 5,386
2002 435,563 48,852 317,373 40,155 11,060 14,834 3,289
2003 411,634 127,572 226,623 30,949 7,483 12,914 6,093
2004 NA NA NA NA NA NA NA
2005 NA NA NA NA NA NA NA
To People’s Republic of China
1995 0 0 0 0 0 0 0
1996 0 0 0 0 0 0 0
1997 66 0 0 0 0 66 0
1998 0 0 0 0 0 0 0
1999 0 0 0 0 0 0 0
2000 66 0 0 0 0 0 66
2001 353 0 44 0 309 0 0
2002 4,305 44 3,664 0 596 0 0
2003 15,850 442 751 265 751 0 66
2004 NA NA NA NA NA NA NA
2005 NA NA NA NA NA NA NA
NA = not available.
Sou rce: Statistics C ana da, Vancouver, B.C ., "Cana dian Expo rts Clea red Through B .C. Cu stom Ports," an d Coun cil of
Forestry Industries of B ritish C olum bia, "B .C. Forest Industry S tatistica l Tab les."

78
Table 45—Average value of log exports from British Columbia ports by species and destination,
1995-2005
(In dollars per thousand board feet, Canadian dollars)
YearTotal,
all speciesDouglas-
fir Hemlock Cedar SpruceOther
softwoods Hardwoods
To All Countries
1995 927.03 NA NA NA NA NA NA1996 1,275.98 NA NA NA NA NA NA1997 1,950.66 NA NA NA NA NA NA1998 899.97 NA NA NA NA NA NA1999 799.85 NA NA NA NA NA NA2000 777.14 NA NA NA NA NA NA2001 692.74 NA NA NA NA NA NA2002 658.75 NA NA NA NA NA NA2003 569.20 NA NA NA NA NA NA
2004 NA NA NA NA NA NA NA
2005 NA NA NA NA NA NA NA
To Japan
1995 1,027.36 NA NA NA NA NA NA1996 1,440.22 NA NA NA NA NA NA1997 1,318.81 NA NA NA NA NA NA1998 792.21 NA NA NA NA NA NA1999 798.38 NA NA NA NA NA NA2000 797.86 NA NA NA NA NA NA2001 706.84 NA NA NA NA NA NA2002 680.70 NA NA NA NA NA NA2003 643.27 NA NA NA NA NA NA
2004 NA NA NA NA NA NA NA
2005 NA NA NA NA NA NA NA
To United States
1995 937.42 NA NA NA NA NA NA1996 1,302.94 NA NA NA NA NA NA1997 2,996.05 NA NA NA NA NA NA1998 1,054.65 NA NA NA NA NA NA1999 799.95 NA NA NA NA NA NA2000 764.70 NA NA NA NA NA NA2001 685.56 NA NA NA NA NA NA2002 656.39 NA NA NA NA NA NA2003 559.23 NA NA NA NA NA NA
2004 NA NA NA NA NA NA NA
2005 NA NA NA NA NA NA NA
To People’s Republic of China
1995 -- -- -- -- -- -- --1996 -- -- -- -- -- -- --1997 1,515.15 -- -- -- -- 1,515.15 --1998 -- -- -- -- -- -- --1999 -- -- -- -- -- -- --2000 -- -- -- -- -- -- --2001 NA -- NA -- NA -- --2002 NA NA NA -- NA -- --2003 NA NA NA NA NA NA NA2004 NA NA NA NA NA NA NA2005 NA NA NA NA NA NA NA
NA = not available. Source: Statistics Canada, Vancouver, B.C., "Canadian Exports Cleared Through B.C. Custom Ports."
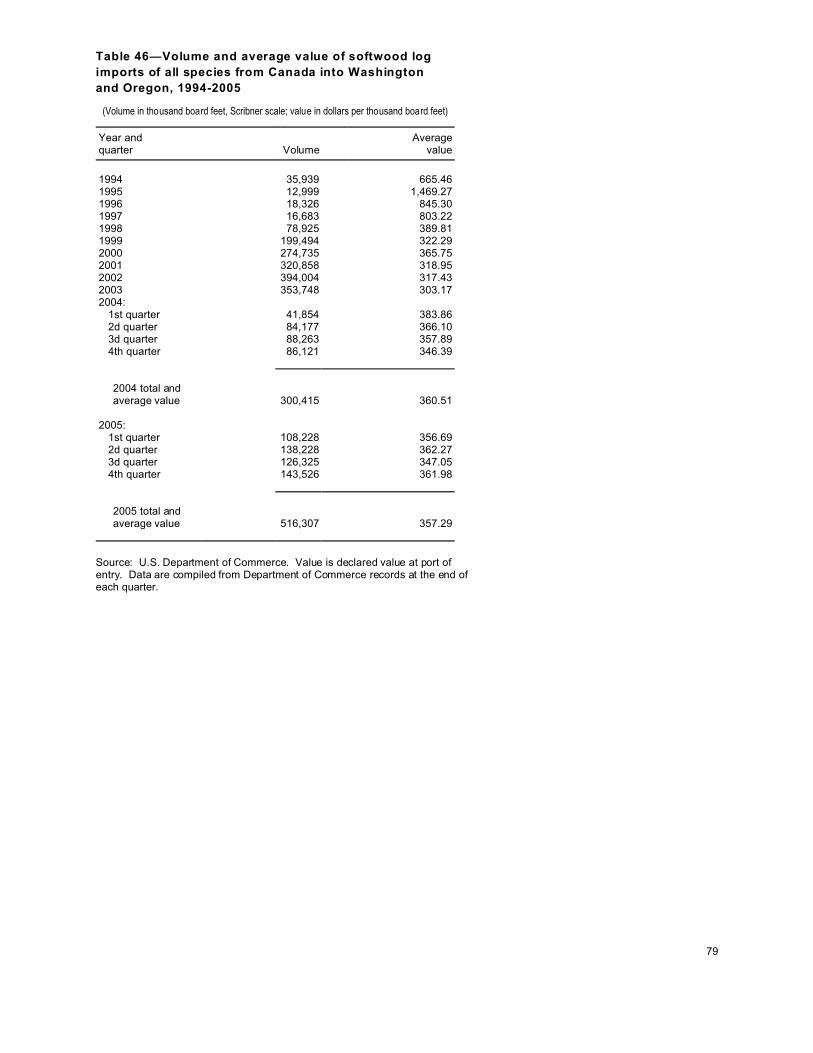
79
Table 46—Volume and average value of softwood log
imports of all species from Canada into Washington
and Oregon, 1994-2005
(Volume in thousand board feet, Scribner scale; value in dollars per thousand board feet)
Year andquarter Volume
Averagevalue
1994 35,939 665.461995 12,999 1,469.271996 18,326 845.301997 16,683 803.221998 78,925 389.811999 199,494 322.292000 274,735 365.752001 320,858 318.952002 394,004 317.432003 353,748 303.172004:
1st quarter 41,854 383.862d quarter 84,177 366.103d quarter 88,263 357.894th quarter 86,121 346.39
2004 total andaverage value 300,415 360.51
2005:
1st quarter 108,228 356.692d quarter 138,228 362.273d quarter 126,325 347.054th quarter 143,526 361.98
2005 total andaverage value 516,307 357.29
Source: U.S. Department of Commerce. Value is declared value at port of entry. Data are compiled from Department of Commerce records at the end of each quarter.

80
Table 47—Volume and average value of pulpwood imports from Canada
into the Seattle Customs District, 1994-2005
Chips Roundwood pulpwood
Year andquarter Volume
Averagevalue Volume
Averagevalue
Short tonsa Dollars Cords Dollars
1994 140,111 38.06 37,649 107.95
1995 370,585 56.74 6,878 199.73
1996 487,095 57.39 3,108 160.56
1997 512,808 63.56 66 142.48
1998 381,260 62.36 8,523 122.21
1999 249,013 59.65 0 --
2000 278,442 55.69 807 120.13
2001 139,436 49.36 1,858 16.13
2002 113,365 54.68 87 73.482003 207,935 51.22 673 45.022004:
1st quarter 8,246 59.92 0 --
2d quarter 25,077 48.04 0 --
3d quarter 6,459 53.70 0 --
4th quarter 24,302 54.57 0 --
2004 total andaverage value 64,084 52.61 0 --
2005:
1st quarter 32,711 47.05 0 --
2d quarter 40,329 38.67 34 67.29
3d quarter 28,908 61.37 0 --
4th quarter 5,049 57.58 3 628.55
2005 total andaverage value 106,997 48.26 37 116.82
a Dry-weight basis.
Source: U.S. Department of Commerce. Data are compiled from Department of Commerce records at the end of each quarter.
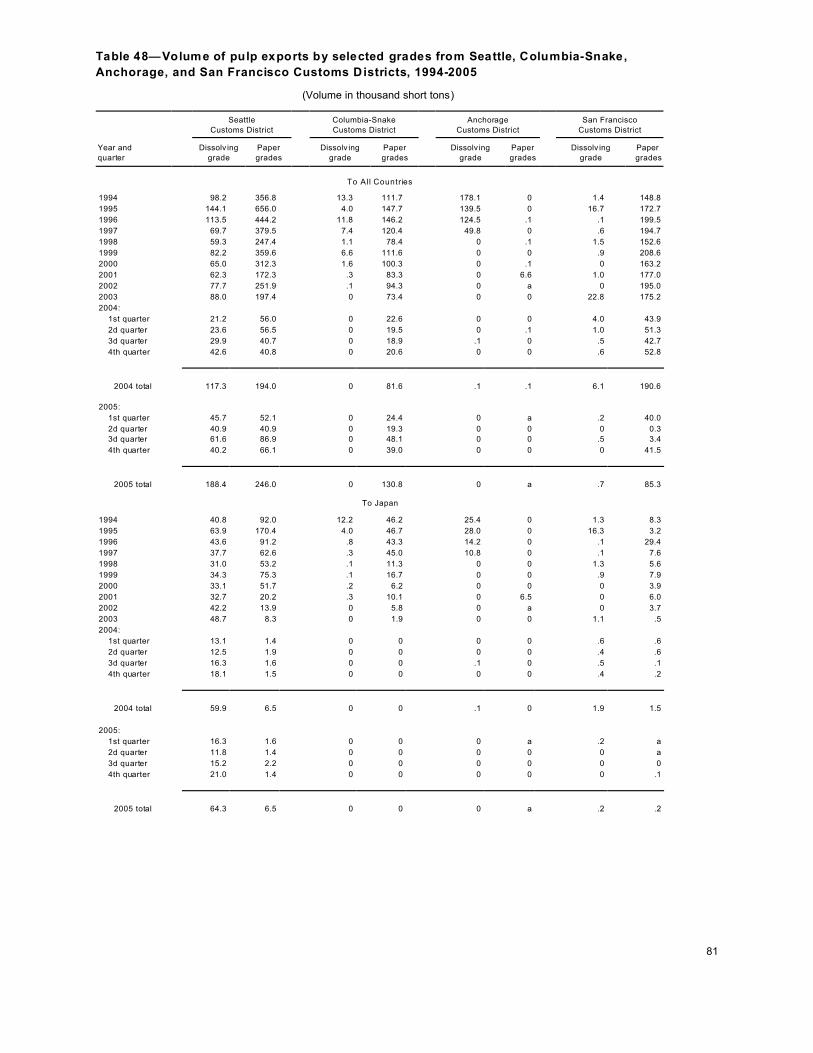
81
Table 48—Volume of pulp exports by selected grades from Seattle, Columbia-Snake,
Anchorage, and San Francisco Customs Districts, 1994-2005
(Volume in thousand short tons)
Seattle
Customs District
Columbia-Snake
Customs District
Anchorage
Customs District
San Francisco
Customs District
Year and
quarter
Dissolv ing
grade
Paper
grades
Dissolv ing
grade
Paper
grades
Dissolv ing
grade
Paper
grades
Dissolv ing
grade
Paper
grades
To All Countr ies
1994 98.2 356.8 13.3 111.7 178.1 0 1.4 148.8
1995 144.1 656.0 4.0 147.7 139.5 0 16.7 172.7
1996 113.5 444.2 11.8 146.2 124.5 .1 .1 199.5
1997 69.7 379.5 7.4 120.4 49.8 0 .6 194.7
1998 59.3 247.4 1.1 78.4 0 .1 1.5 152.6
1999 82.2 359.6 6.6 111.6 0 0 .9 208.6
2000 65.0 312.3 1.6 100.3 0 .1 0 163.2
2001 62.3 172.3 .3 83.3 0 6.6 1.0 177.0
2002 77.7 251.9 .1 94.3 0 a 0 195.0
2003 88.0 197.4 0 73.4 0 0 22.8 175.2
2004:
1st quarter 21.2 56.0 0 22.6 0 0 4.0 43.9
2d quarter 23.6 56.5 0 19.5 0 .1 1.0 51.3
3d quarter 29.9 40.7 0 18.9 .1 0 .5 42.7
4th quarter 42.6 40.8 0 20.6 0 0 .6 52.8
2004 total 117.3 194.0 0 81.6 .1 .1 6.1 190.6
2005:
1st quarter 45.7 52.1 0 24.4 0 a .2 40.0
2d quarter 40.9 40.9 0 19.3 0 0 0 0.3
3d quarter 61.6 86.9 0 48.1 0 0 .5 3.4
4th quarter 40.2 66.1 0 39.0 0 0 0 41.5
2005 total 188.4 246.0 0 130.8 0 a .7 85.3
To Japan
1994 40.8 92.0 12.2 46.2 25.4 0 1.3 8.3
1995 63.9 170.4 4.0 46.7 28.0 0 16.3 3.2
1996 43.6 91.2 .8 43.3 14.2 0 .1 29.4
1997 37.7 62.6 .3 45.0 10.8 0 .1 7.6
1998 31.0 53.2 .1 11.3 0 0 1.3 5.6
1999 34.3 75.3 .1 16.7 0 0 .9 7.9
2000 33.1 51.7 .2 6.2 0 0 0 3.9
2001 32.7 20.2 .3 10.1 0 6.5 0 6.0
2002 42.2 13.9 0 5.8 0 a 0 3.7
2003 48.7 8.3 0 1.9 0 0 1.1 .5
2004:
1st quarter 13.1 1.4 0 0 0 0 .6 .6
2d quarter 12.5 1.9 0 0 0 0 .4 .6
3d quarter 16.3 1.6 0 0 .1 0 .5 .1
4th quarter 18.1 1.5 0 0 0 0 .4 .2
2004 total 59.9 6.5 0 0 .1 0 1.9 1.5
2005:
1st quarter 16.3 1.6 0 0 0 a .2 a
2d quarter 11.8 1.4 0 0 0 0 0 a
3d quarter 15.2 2.2 0 0 0 0 0 0
4th quarter 21.0 1.4 0 0 0 0 0 .1
2005 total 64.3 6.5 0 0 0 a .2 .2

82
Table 48—Volume of pulp exports by selected grades from Seattle, Columbia-Snake,
Anchorage, and San Francisco Customs Districts, 1994-2005 (continued)
(Volume in thousand short tons)
Seattle
Customs District
Columbia-Snake
Customs District
Anchorage
Customs District
San Francisco
Customs District
Year and
quarter
Dissolv ing
grade
Paper
grades
Dissolv ing
grade
Paper
grades
Dissolv ing
grade
Paper
grades
Dissolv ing
grade
Paper
grades
To South Korea
1994 .3 86.3 0 .9 0 0 0 46.4
1995 .5 202.9 0 3.3 0 0 0 40.3
1996 9.5 71.7 0 2.6 0 0 0 54.7
1997 0 67.6 0 7.7 0 0 0 53.9
1998 0 32.0 0 2.6 0 0 0 65.5
1999 0 57.3 0 18.2 0 0 0 98.9
2000 a 60.4 0 15.0 0 0 0 66.0
2001 0 34.5 0 7.3 0 0 0 81.7
2002 .1 47.5 0 10.5 0 a 0 67.4
2003 .2 32.0 0 8.0 0 0 1.6 62.0
2004:
1st quarter 0 8.5 0 1.4 0 0 .1 11.6
2d quarter .5 10.5 0 2.4 0 .1 0 13.2
3d quarter 1.8 7.1 0 1.3 0 0 0 14.4
4th quarter 2.1 6.0 0 1.3 0 0 0 8.7
2004 total 4.5 32.1 0 6.4 0 .1 .1 47.9
2005:
1st quarter 2.5 15.6 0 1.9 0 0 0 3.3
2d quarter 1.9 11.0 0 1.2 0 0 0 0.0
3d quarter 7.5 7.0 0 5.3 0 0 0 0.0
4th quarter 2.5 9.6 0 6.5 0 0 0 0.7
2005 total 14.3 43.2 0 14.8 0 0 0 3.9
To Western Europe
1994 26.2 27.9 .9 31.9 25.1 0 .1 44.4
1995 29.1 9.0 0 66.1 17.8 0 0 65.7
1996 12.3 70.7 .1 57.6 14.6 0 0 .2
1997 11.4 60.3 5.2 63.2 5.0 0 0 .4
1998 24.7 10.7 1.0 53.9 0 0 0 2.5
1999 25.9 12.0 6.4 50.5 0 0 0 1.2
2000 24.8 6.0 1.4 66.5 0 0 0 20.0
2001 26.6 6.9 0 48.4 0 0 0 58.9
2002 26.3 8.0 0 58.8 0 0 0 1.7
2003 29.7 10.2 0 47.3 0 0 0 16.9
2004:
1st quarter 5.4 3.3 0 8.3 0 0 0 0
2d quarter 5.4 0.4 0 5.8 0 0 0 7.5
3d quarter 5.4 0.8 0 9.5 0 0 0 6.5
4th quarter 6.7 0.1 0 11.8 0 0 0 0
2004 total 22.9 4.4 0 35.5 0 0 0 14.0
2005:
1st quarter 11.3 a 0 12.3 0 0 0 0
2d quarter 6.8 a 0 11.9 0 0 0 0
3d quarter 7.0 0.0 0 24.4 0 0 0 0
4th quarter 0 a 0 14.6 0 0 0 0
2005 total 25.1 0.1 0 63.1 0 0 0 0
a Volume less than 0.1 short tons.
Note: Columns may not add to totals because of rounding.
Source: U.S. Department of Commerce.

83
Table 49—Average value of pulp exports by selected grades from Seattle, Colum bia-
Snake, Anchorage, and San Francisco Customs Districts, 1994-2005
(Value in dollars per short tons)
Seattle
Customs District
Columbia-Snake
Customs District
Anchorage
Customs District
San Francisco
Customs District
Year and
quarter
Dissolv ing
grade
Paper
grades
Dissolv ing
grade
Paper
grades
Dissolv ing
grade
Paper
grades
Dissolv ing
grade
Paper
grades
To All Countr ies
1994 687.36 368.04 699.02 459.05 560.60 -- 812.37 511.52
1995 661.79 349.68 758.00 511.25 878.25 -- 362.16 748.76
1996 775.47 316.55 297.67 392.90 658.99 545.45 304.35 394.21
1997 844.99 313.12 463.12 316.38 553.09 -- 387.41 372.60
1998 793.50 329.09 795.71 334.25 -- 359.68 839.89 339.84
1999 680.25 347.81 673.39 367.78 -- -- 991.22 370.34
2000 751.51 407.47 818.55 537.42 -- 675.22 -- 493.27
2001 738.25 381.57 905.55 373.27 -- 102.16 864.86 315.69
2002 728.51 334.67 330.96 374.77 -- 493.00 -- 297.11
2003 733.61 341.88 -- 432.08 -- -- 246.33 256.86
2004:
1st quarter 728.09 364.49 -- 455.26 -- -- 269.05 282.89
2d quarter 712.43 349.52 -- 482.11 -- 91.89 316.54 324.23
3d quarter 651.66 389.43 -- 443.93 271.68 -- 309.80 345.93
4th quarter 581.55 412.55 -- 416.66 -- -- 263.03 269.31
2004 average 652.30 375.47 -- 449.33 271.68 91.89 279.57 304.37
2005:
1st quarter 627.40 399.08 -- 426.12 -- 259.40 264.84 257.87
2d quarter 593.30 376.10 -- 437.77 -- -- -- 413.76
3d quarter 518.99 407.76 -- 337.25 -- -- 326.50 313.18
4th quarter 603.67 378.19 -- 459.19 -- -- -- 310.56
2005 average 579.48 392.72 -- 405.00 -- 259.40 312.14 286.35
To Japan
1994 701.75 413.28 701.24 482.80 557.17 -- 824.24 447.33
1995 588.90 402.95 758.00 510.88 718.39 -- 361.04 636.25
1996 957.53 381.05 722.01 380.34 711.24 -- 455.88 429.97
1997 868.04 352.66 775.77 314.29 568.61 -- 537.18 506.26
1998 869.23 365.27 868.22 330.83 -- -- 883.70 508.56
1999 805.16 366.95 868.22 380.41 -- -- 998.88 421.77
2000 786.42 457.01 868.94 454.66 -- -- -- 489.92
2001 801.62 385.00 905.55 370.38 -- 96.00 -- 334.63
2002 805.88 407.35 -- 435.36 -- 660.45 -- 241.83
2003 802.20 475.12 -- 387.35 -- -- 260.47 298.88
2004:
1st quarter 749.29 649.58 -- -- -- -- 284.02 292.692d quarter 749.17 622.22 -- -- -- -- 320.88 356.87
3d quarter 750.43 761.09 -- -- 271.68 -- 317.33 315.97
4th quarter 705.42 649.12 -- -- -- -- 272.21 241.80
2004 average 736.31 668.03 -- -- 271.68 -- 297.40 315.58
2005:
1st quarter 735.99 815.46 -- -- -- 259.40 264.84 266.93
2d quarter 775.51 720.56 -- -- -- -- -- 720.61
3d quarter 795.20 469.03 -- -- -- -- -- --
4th quarter 776.14 614.74 -- -- -- -- -- 308.38
2005 average 770.35 636.34 -- -- -- 259.40 264.84 329.98
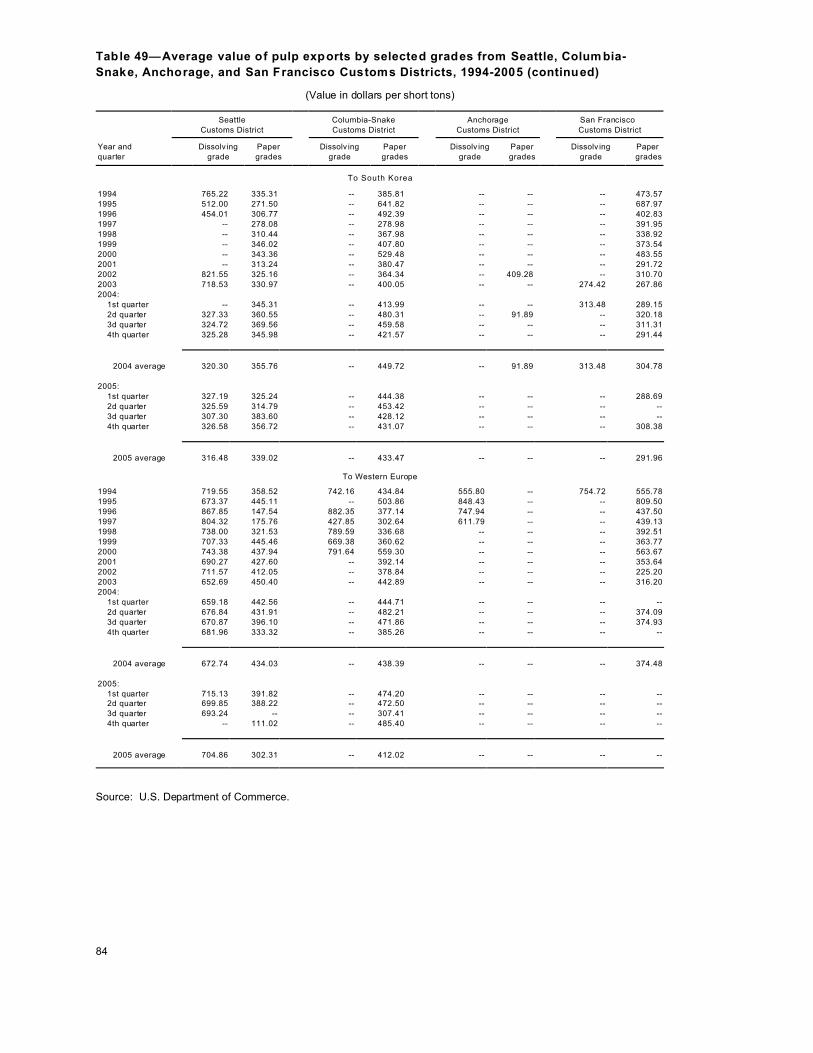
84
Table 49—Average value of pulp exports by selected grades from Seattle, Colum bia-
Snake, Anchorage, and San Francisco Customs Districts, 1994-2005 (continued)
(Value in dollars per short tons)
Seattle
Customs District
Columbia-Snake
Customs District
Anchorage
Customs District
San Francisco
Customs District
Year and
quarter
Dissolv ing
grade
Paper
grades
Dissolv ing
grade
Paper
grades
Dissolv ing
grade
Paper
grades
Dissolv ing
grade
Paper
grades
To South Korea
1994 765.22 335.31 -- 385.81 -- -- -- 473.57
1995 512.00 271.50 -- 641.82 -- -- -- 687.97
1996 454.01 306.77 -- 492.39 -- -- -- 402.83
1997 -- 278.08 -- 278.98 -- -- -- 391.95
1998 -- 310.44 -- 367.98 -- -- -- 338.92
1999 -- 346.02 -- 407.80 -- -- -- 373.54
2000 -- 343.36 -- 529.48 -- -- -- 483.55
2001 -- 313.24 -- 380.47 -- -- -- 291.72
2002 821.55 325.16 -- 364.34 -- 409.28 -- 310.70
2003 718.53 330.97 -- 400.05 -- -- 274.42 267.86
2004:
1st quarter -- 345.31 -- 413.99 -- -- 313.48 289.15
2d quarter 327.33 360.55 -- 480.31 -- 91.89 -- 320.18
3d quarter 324.72 369.56 -- 459.58 -- -- -- 311.31
4th quarter 325.28 345.98 -- 421.57 -- -- -- 291.44
2004 average 320.30 355.76 -- 449.72 -- 91.89 313.48 304.78
2005:
1st quarter 327.19 325.24 -- 444.38 -- -- -- 288.69
2d quarter 325.59 314.79 -- 453.42 -- -- -- --
3d quarter 307.30 383.60 -- 428.12 -- -- -- --
4th quarter 326.58 356.72 -- 431.07 -- -- -- 308.38
2005 average 316.48 339.02 -- 433.47 -- -- -- 291.96
To Western Europe
1994 719.55 358.52 742.16 434.84 555.80 -- 754.72 555.78
1995 673.37 445.11 -- 503.86 848.43 -- -- 809.50
1996 867.85 147.54 882.35 377.14 747.94 -- -- 437.50
1997 804.32 175.76 427.85 302.64 611.79 -- -- 439.13
1998 738.00 321.53 789.59 336.68 -- -- -- 392.51
1999 707.33 445.46 669.38 360.62 -- -- -- 363.77
2000 743.38 437.94 791.64 559.30 -- -- -- 563.67
2001 690.27 427.60 -- 392.14 -- -- -- 353.64
2002 711.57 412.05 -- 378.84 -- -- -- 225.20
2003 652.69 450.40 -- 442.89 -- -- -- 316.20
2004:
1st quarter 659.18 442.56 -- 444.71 -- -- -- --
2d quarter 676.84 431.91 -- 482.21 -- -- -- 374.09
3d quarter 670.87 396.10 -- 471.86 -- -- -- 374.93
4th quarter 681.96 333.32 -- 385.26 -- -- -- --
2004 average 672.74 434.03 -- 438.39 -- -- -- 374.48
2005:
1st quarter 715.13 391.82 -- 474.20 -- -- -- --2d quarter 699.85 388.22 -- 472.50 -- -- -- --
3d quarter 693.24 -- -- 307.41 -- -- -- --
4th quarter -- 111.02 -- 485.40 -- -- -- --
2005 average 704.86 302.31 -- 412.02 -- -- -- --
Source: U.S. Department of Commerce.

85
Table 50—Volume and average value of all chips exported from the Seattle, Columbia-Snake,
San Francisco, and Anchorage Customs Districts, 1995-2005
(In short tons, on a dry-weight basis; value in dollars per short ton)
SeattleCustoms District
Columbia-SnakeCustoms District
San FranciscoCustoms District
AnchorageCustoms District
Year andquarter Volume
Averagevalue Volume
Averagevalue Volume
Averagevalue Volume
Averagevalue
1995 542,694 113.24 1,329,590 130.04 322,454 118.58 146,277 137.381996 589,989 95.97 1,230,966 108.51 314,280 109.65 199,862 83.791997 611,888 72.28 1,247,092 89.54 371,554 97.71 105,653 72.101998 835,594 62.27 1,076,786 96.78 255,546 95.16 145,837 73.801999 753,147 60.51 1,024,223 82.64 285,740 90.57 131,699 41.752000 461,874 78.54 992,062 94.01 237,781 87.11 178,461 41.032001 353,074 86.00 856,164 96.58 166,558 90.59 154,880 61.282002 262,395 71.10 893,184 84.31 109,049 75.50 98,935 68.852003 252,050 82.58 760,965 82.39 63,037 69.10 109,621 49.662004:
1st quarter 73,340 76.21 121,385 87.70 8,867 65.24 26,710 60.312d quarter 121,185 59.16 304,164 66.80 13,455 62.81 8,799 31.483d quarter 87,986 55.86 163,947 71.06 19 560.21 6,454 37.534th quarter 48,249 60.71 154,860 89.61 11,782 78.85 6,884 48.39
2004 total andaverage value 330,760 62.28 744,356 75.89 34,122 69.25 48,848 50.43
2005:
1st quarter 86,318 58.07 254,551 84.63 23,116 73.17 52,020 57.192d quarter 169,845 67.20 189,412 78.79 1,724 105.74 19,525 47.853d quarter 81,561 56.21 265,670 87.19 862 95.81 7,137 29.094th quarter 83,319 58.31 208,841 82.65 767 99.16 35,240 86.26
2005 total andaverage value 421,042 61.44 918,475 83.71 26,470 76.78 113,922 62.82
Source: U.S. Department of Commerce. The valuation definition used in the export statistics is the value at the seaport or border port of exportation. It is based on the selling price (or cost if not sold) and includes inland freight, insurance, and other charges to the port of exportation. Seattle Customs District includes all ports in the State of Washington, except Longview and Vancouver. Columbia-Snake Customs District includes all Oregon ports and Longview and Vancouver, Washington. San Francisco Customs District includes all coastal and inland ports in the State of California from Monterey north. The Anchorage Customs District is the State of Alaska.

86
Table 51—Volume and average value of softw ood chips exported from the Seattle,
Columbia-Snake, San Francisco, and Anchorage Customs Districts, 1995-2005
(In short tons, on a dry-weight basis; value in dollars per short ton)
SeattleCustoms District
Columbia-SnakeCustoms District
San FranciscoCustoms District
AnchorageCustoms District
Year andquarter Volume
Averagevalue Volume
Averagevalue Volume
Averagevalue Volume
Averagevalue
1995 297,603 93.21 969,666 128.72 175,912 109.13 146,277 137.381996 248,359 70.85 991,793 107.03 165,931 109.83 199,862 83.791997 339,109 54.87 1,033,444 85.84 171,848 86.96 104,547 72.251998 464,453 44.17 897,097 94.08 135,644 87.89 126,181 72.911999 444,956 39.96 811,978 77.73 114,002 78.75 131,699 41.752000 241,185 63.28 791,770 78.61 R113,636 R68.37 178,461 41.032001 195,131 70.63 709,213 83.66 101,996 84.66 154,880 61.282002 183,409 65.50 782,520 83.33 66,730 71.54 98,935 68.852003 193,327 67.18 723,012 80.72 62,591 68.71 109,621 49.662004:
1st quarter 56,278 76.19 110,413 88.51 8,867 65.24 2,536 24.522d quarter 85,341 50.74 304,164 66.80 8,448 71.07 8,799 31.483d quarter 70,574 50.00 163,947 71.06 14 405.43 6,454 37.534th quarter 47,761 59.30 154,860 89.61 11,675 70.05 6,884 48.39
2004 total andaverage value 259,954 57.62 733,385 75.84 29,003 69.04 24,674 37.07
2005:
1st quarter 68,217 52.19 254,551 84.63 20,270 74.53 7,918 85.262d quarter 127,636 62.82 189,412 78.79 1,711 91.70 19,525 47.853d quarter 80,792 55.81 265,670 87.19 862 95.81 7,137 29.094th quarter 82,974 57.85 208,841 82.65 767 99.16 20,824 77.35
2005 total andaverage value 359,619 58.08 918,475 83.71 23,611 77.35 55,404 61.87
Source: U.S. Department of Commerce. The valuation definition used in the export statistics is the value at the seaport or border port of exportation. It is based on the selling price (or cost if not sold) and includes inland freight, insurance, and other charges to the port of exportation. Seattle Customs District includes all ports in the State of Washington, except Longview and Vancouver. Columbia-Snake Customs District includes all Oregon ports and Longview and Vancouver, Washington. San Francisco Customs District includes all coastal and inland ports in the State of California from Monterey north. The Anchorage Customs District is the State of Alaska.

87
Table 52—Volume of softwood lumber exports from Seattle and Columbia-Snake Customs Districts
by species and destination, 1994-2005a
(In thousand board feet)
From both customs districts From Seattle Customs District From Columbia-Snake Customs District
Y617ear andquarter Total
Douglas-fir
Westernhemlock
Othersoft-
woods TotalDouglas-
firWesternhemlock
Othersoft-
woods TotalDouglas-
firWesternhemlock
Other soft-
woods
To All Countr ies
1994 948,502 539,667 191,388 217,447 536,150 238,170 146,125 151,853 412,352 301,497 45,263 65,5921995 1,021,509 609,231 187,967 224,310 567,220 267,181 148,744 151,295 454,289 342,050 39,223 73,0151996 1,011,083 655,756 172,776 182,551 567,842 299,178 148,418 120,246 443,241 356,578 24,358 62,3051997 870,870 398,345 77,081 395,444 538,402 201,087 63,220 274,095 332,468 198,258 13,861 121,3491998 468,994 221,978 32,640 214,375 282,042 98,893 25,249 157,900 186,953 123,086 7,392 56,4751999 438,608 225,040 44,748 168,820 237,919 89,449 30,247 118,223 200,689 135,591 14,501 50,5972000 464,164 210,018 33,586 220,560 262,813 71,743 19,803 171,268 201,351 138,275 13,783 49,2922001 312,022 131,461 14,899 165,662 200,544 47,281 9,917 143,346 111,478 84,180 4,982 22,3162002 249,174 89,679 14,723 144,773 180,310 48,951 6,326 125,032 68,865 40,726 8,397 19,4702003 254,866 77,725 16,571 160,571 193,789 44,533 5,790 143,467 61,077 33,192 10,781 17,1032004:
1st qtr. 60,039 20,516 8,145 31,378 40,303 10,492 3,431 26,380 19,736 10,023 4,714 4,9992d qtr. 47,621 16,497 3,139 27,985 35,017 7,751 3,119 24,147 12,604 8,747 19 3,8383d qtr. 43,113 15,124 3,553 24,436 32,669 6,211 3,553 22,905 10,444 8,912 0 1,5324th qtr. 40,189 12,176 2,270 25,743 30,544 6,892 1,669 21,983 9,645 5,284 600 3,761
2004 total 190,962 64,313 17,107 109,542 138,533 31,346 11,772 95,415 52,429 32,966 5,333 14,130 2005:
1st qtr. 42,662 14,093 3,417 25,152 37,132 11,353 2,116 23,663 5,530 2,740 1,301 1,4892d qtr. 37,630 12,151 1,145 24,334 32,395 8,822 552 23,021 5,235 3,329 593 1,3133d qtr. 37,867 11,202 3,821 22,844 29,359 8,890 1,265 19,204 8,508 2,312 2,556 3,6404th qtr. 33,909 9,769 981 23,159 29,589 7,783 981 20,825 4,320 1,986 0 2,334
2005 total 152,068 47,215 9,364 95,489 128,475 36,848 4,914 86,713 23,592 10,367 4,450 8,776
To Japan
1994 656,003 345,747 175,837 134,419 371,150 147,372 131,718 92,060 284,853 198,375 44,119 42,3591995 669,917 355,744 177,523 136,650 367,756 144,142 139,273 84,341 302,161 211,602 38,250 52,3091996 717,669 450,562 159,400 107,707 383,731 185,296 135,647 62,788 333,938 265,266 23,753 44,9191997 564,065 217,985 63,914 282,166 347,236 108,183 52,216 186,837 216,829 109,802 11,698 95,3291998 271,965 120,742 18,990 132,233 160,164 51,343 12,272 96,549 111,801 69,399 6,717 35,6851999 256,882 141,340 18,311 97,231 130,136 54,943 10,378 64,815 126,746 86,397 7,933 32,4162000 255,664 141,656 10,858 103,149 129,322 37,609 7,653 84,059 126,342 104,047 3,205 19,0902001 172,092 85,321 4,855 81,914 92,978 20,087 4,331 68,558 79,114 65,234 524 13,3562002 111,896 51,663 1,256 58,975 73,365 24,613 992 47,758 38,532 27,050 264 11,2182003 107,669 40,710 941 66,019 73,528 15,441 693 57,394 34,142 25,269 248 8,6252004:
1st qtr. 24,110 10,562 845 12,703 13,050 2,930 673 9,447 11,060 7,632 172 3,2562d qtr. 18,792 9,255 150 9,387 10,179 2,216 131 7,832 8,613 7,039 19 1,5553d qtr. 17,814 8,466 88 9,260 10,545 1,517 88 8,940 7,269 6,949 0 3204th qtr. 15,870 5,633 54 10,183 11,632 1,889 54 9,689 4,238 3,744 0 494
2004 total 76,586 33,916 1,137 41,533 45,406 8,552 945 35,908 31,180 25,364 192 5,625 2005:
1st qtr. 15,162 6,317 0 8,845 13,922 5,315 0 8,607 1,240 1,002 0 2382d qtr. 11,386 3,989 15 7,382 10,630 3,372 15 7,243 756 617 0 1393d qtr. 8,137 2,530 24 5,583 7,566 2,216 24 5,326 571 314 0 2574th qtr. 9,458 2,861 0 6,597 9,126 2,653 0 6,473 332 208 0 124
2005 total 44,143 15,697 39 28,407 41,244 13,556 39 27,649 2,899 2,140 0 758
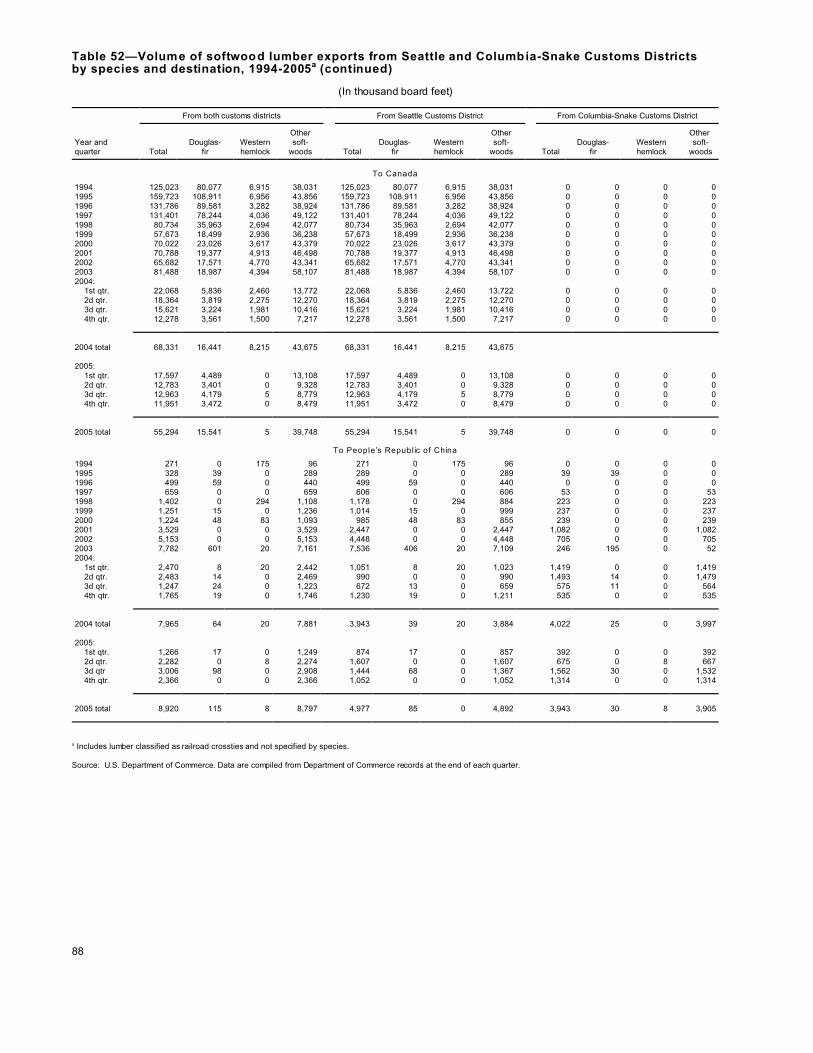
Table 52—Volume of softwood lumber exports from Seattle and Columbia-Snake Customs Districts by species and destination, 1994-2005a (continued)
88
(In thousand board feet)
From both customs districts From Seattle Customs District From Columbia-Snake Customs District
Year andquarter Total
Douglas-fir
Westernhemlock
Othersoft-
woods TotalDouglas-
firWesternhemlock
Othersoft-
woods TotalDouglas-
firWesternhemlock
Other soft-
woods
To Canada
1994 125,023 80,077 6,915 38,031 125,023 80,077 6,915 38,031 0 0 0 01995 159,723 108,911 6,956 43,856 159,723 108,911 6,956 43,856 0 0 0 01996 131,786 89,581 3,282 38,924 131,786 89,581 3,282 38,924 0 0 0 01997 131,401 78,244 4,036 49,122 131,401 78,244 4,036 49,122 0 0 0 01998 80,734 35,963 2,694 42,077 80,734 35,963 2,694 42,077 0 0 0 01999 57,673 18,499 2,936 36,238 57,673 18,499 2,936 36,238 0 0 0 02000 70,022 23,026 3,617 43,379 70,022 23,026 3,617 43,379 0 0 0 02001 70,788 19,377 4,913 46,498 70,788 19,377 4,913 46,498 0 0 0 02002 65,682 17,571 4,770 43,341 65,682 17,571 4,770 43,341 0 0 0 02003 81,488 18,987 4,394 58,107 81,488 18,987 4,394 58,107 0 0 0 02004:
1st qtr. 22,068 5,836 2,460 13,772 22,068 5,836 2,460 13,722 0 0 0 02d qtr. 18,364 3,819 2,275 12,270 18,364 3,819 2,275 12,270 0 0 0 03d qtr. 15,621 3,224 1,981 10,416 15,621 3,224 1,981 10,416 0 0 0 04th qtr. 12,278 3,561 1,500 7,217 12,278 3,561 1,500 7,217 0 0 0 0
2004 total 68,331 16,441 8,215 43,675 68,331 16,441 8,215 43,675 2005:
1st qtr. 17,597 4,489 0 13,108 17,597 4,489 0 13,108 0 0 0 02d qtr. 12,783 3,401 0 9,328 12,783 3,401 0 9,328 0 0 0 03d qtr. 12,963 4,179 5 8,779 12,963 4,179 5 8,779 0 0 0 04th qtr. 11,951 3,472 0 8,479 11,951 3,472 0 8,479 0 0 0 0
2005 total 55,294 15,541 5 39,748 55,294 15,541 5 39,748 0 0 0 0
To People’s Republic of China
1994 271 0 175 96 271 0 175 96 0 0 0 01995 328 39 0 289 289 0 0 289 39 39 0 01996 499 59 0 440 499 59 0 440 0 0 0 01997 659 0 0 659 606 0 0 606 53 0 0 531998 1,402 0 294 1,108 1,178 0 294 884 223 0 0 2231999 1,251 15 0 1,236 1,014 15 0 999 237 0 0 2372000 1,224 48 83 1,093 985 48 83 855 239 0 0 2392001 3,529 0 0 3,529 2,447 0 0 2,447 1,082 0 0 1,0822002 5,153 0 0 5,153 4,448 0 0 4,448 705 0 0 7052003 7,782 601 20 7,161 7,536 406 20 7,109 246 195 0 522004:
1st qtr. 2,470 8 20 2,442 1,051 8 20 1,023 1,419 0 0 1,4192d qtr. 2,483 14 0 2,469 990 0 0 990 1,493 14 0 1,4793d qtr. 1,247 24 0 1,223 672 13 0 659 575 11 0 5644th qtr. 1,765 19 0 1,746 1,230 19 0 1,211 535 0 0 535
2004 total 7,965 64 20 7,881 3,943 39 20 3,884 4,022 25 0 3,997 2005:
1st qtr. 1,266 17 0 1,249 874 17 0 857 392 0 0 3922d qtr. 2,282 0 8 2,274 1,607 0 0 1,607 675 0 8 6673d qtr 3,006 98 0 2,908 1,444 68 0 1,367 1,562 30 0 1,5324th qtr. 2,366 0 0 2,366 1,052 0 0 1,052 1,314 0 0 1,314
2005 total 8,920 115 8 8,797 4,977 85 0 4,892 3,943 30 8 3,905
a Includes lumber classified as railroad crossties and not specified by species. Source: U.S. Department of Commerce. Data are compiled from Department of Commerce records at the end of each quarter.

Figu
re 5
—Lu
mbe
r exp
orts
from
Sea
ttle
and
Col
umbi
a-S
nake
Cus
tom
s D
istri
cts,
199
5-20
05, i
n m
illion
boa
rd fe
et
050100
150
200
250
300
350
400
1995
1996
1997
1998
1999
2000
2001
2002
2003
2004
2005
Sea
ttle
to J
apan
Sea
ttle
to a
ll oth
er c
ount
ries
Col
umbi
a-S
nake
to J
apan
Col
umbi
a-S
nake
to a
ll oth
er c
ount
ries
89

90
Table 53—Value of softwood lumber exports from Seattle and Columbia-Snake Customs Districts
by species and destination, 1994-2005a
(In thousands of dollars)
From both customs districts From Seattle Customs District From Columbia-Snake Customs District
Year andquarter Total
Douglas-fir
Westernhemlock
Othersoft-
woods TotalDouglas-
firWesternhemlock
Othersoft-
woods TotalDouglas-
firWesternhemlock
Other soft-
woods
To All Countr ies
1994 678,426 425,881 123,341 129,205 341,787 167,700 93,394 80,693 336,639 258,181 29,947 48,5121995 714,815 449,115 120,102 145,599 368,109 185,081 95,378 87,650 346,706 264,033 24,724 57,9491996 740,746 517,750 110,839 112,156 390,587 223,901 95,356 71,330 350,159 293,849 15,483 40,8261997 609,619 322,459 52,668 234,493 355,719 153,319 45,092 157,307 253,901 169,140 7,575 77,1861998 309,416 162,681 22,591 124,145 171,973 65,056 18,392 88,526 137,443 97,625 4,199 35,6191999 310,806 173,412 34,987 102,407 158,856 62,266 25,780 70,810 151,951 111,146 9,207 31,5982000 309,006 165,718 21,187 122,102 159,017 49,854 13,862 95,301 149,989 115,864 7,325 26,8012001 206,930 96,299 6,864 103,227 121,059 30,206 4,938 85,915 85,331 66,093 1,926 17,3122002 160,133 61,355 6,183 92,595 111,011 30,781 2,636 77,595 49,121 30,574 3,548 15,0002003 170,218 54,782 6,887 108,549 126,146 27,464 2,896 95,786 44,072 27,318 3,991 12,7632004:
1st qtr. 41,362 16,118 3,159 22,085 26,174 6,914 1,468 17,792 15,188 9,204 1,691 4,2932d qtr. 36,228 13,735 1,548 20,945 25,098 5,494 1,534 18,070 11,130 8,241 14 2,8753d qtr. 34,340 13,707 2,001 18,632 24,444 5,176 2,001 17,267 9,895 8,531 0 1,3644th qtr. 29,940 10,548 1,062 18,330 22,387 5,309 828 16,250 7,553 5,239 234 2,080
2004 total 141,870 54,108 7,770 79,992 98,103 22,892 5,830 69,380 43,766 31,214 1,939 10,612 2005:
1st qtr. 32,414 12,314 1,767 18,333 27,569 9,046 1,293 17,230 4,845 3,268 474 1,1032d qtr. 28,900 10,901 571 17,428 24,114 7,257 358 16,499 4,786 3,644 213 9293d qtr. 28,199 10,222 1,472 16,505 22,317 7,185 613 14,519 5,882 3,037 859 1,9864th qtr. 25,916 8,689 628 16,599 22,344 6,332 628 15,384 3,572 2,357 0 1,215
2005 total 115,429 42,126 4,438 68,865 96,344 29,820 2,892 63,632 19,085 12,307 1,582 5,233
To Japan
1994 469,374 275,508 115,991 77,874 248,362 117,604 86,961 43,796 221,012 157,904 29,030 34,0781995 498,991 296,212 115,673 87,106 260,286 123,597 91,565 45,124 238,705 172,615 24,108 41,9821996 552,934 384,067 105,906 62,959 286,580 160,756 91,024 34,798 266,354 223,311 14,882 28,1611997 404,989 196,006 46,821 162,162 243,333 99,865 40,388 103,080 161,656 96,141 6,433 59,0821998 173,996 87,369 14,422 72,205 96,928 37,982 10,839 48,107 77,068 49,387 3,583 24,0981999 185,884 108,648 16,380 60,850 87,933 40,197 10,148 37,588 97,951 68,452 6,232 23,2672000 193,939 120,244 7,496 66,199 86,171 30,402 4,842 50,926 107,768 89,841 2,654 15,2732001 119,014 66,259 2,547 50,207 57,069 15,173 2,304 39,590 61,945 51,086 243 10,6172002 77,517 38,199 463 38,855 48,314 17,942 240 30,182 29,202 20,256 223 8,7232003 69,980 30,141 450 39,389 43,630 11,337 338 31,955 26,350 18,804 112 7,4342004:
1st qtr. 16,908 8,477 432 7,999 8,147 2,186 334 5,628 8,760 6,291 98 2,3712d qtr. 14,854 7,829 138 6,887 7,335 1,684 124 5,527 7,519 6,145 14 1,3603d qtr. 13,774 6,989 76 6,710 7,493 1,258 76 6,160 6,281 5,731 0 5504th qtr. 12,150 4,755 21 7,374 8,460 1,690 21 6,749 3,690 3,065 0 625
2004 total 57,686 28,049 667 28,970 31,435 6,818 555 24,063 26,250 21,232 112 4,907 2005:
1st qtr. 11,304 5,419 0 5,885 10,235 4,572 0 5,663 1,070 847 0 2232d qtr. 7,848 3,550 26 4,272 7,195 3,011 26 4,158 653 539 0 1143d qtr. 5,755 2,249 31 3,475 5,279 1,953 31 3,295 476 296 0 1804th qtr. 6,332 2,483 0 3,849 6,013 2,276 0 3,737 319 207 0 112
2005 total 31,240 13,701 58 17,481 28,722 11,813 58 16,853 2,518 1,889 0 629

91
Table 53—Value of softwood lumber exports from Seattle and Columbia-Snake Customs Districts
by species and destination, 1994-2005a (continued)
(In thousands of dollars)
From both customs districts From Seattle Customs District From Columbia-Snake Customs District
Year andquarter Total
Douglas-fir
Westernhemlock
Othersoft-
woods TotalDouglas-
firWesternhemlock
Othersoft-
woods TotalDouglas-
firWesternhemlock
Other soft-
woods
To Canada
1994 62,666 41,121 3,702 17,843 62,666 41,121 3,702 17,843 -- -- -- --1995 71,103 48,760 2,916 19,427 71,103 48,760 2,916 19,427 -- -- -- --1996 63,617 43,920 1,407 18,290 63,617 43,920 1,407 18,290 -- -- -- --1997 73,448 41,187 2,713 29,547 73,448 41,187 2,713 29,547 -- -- -- --1998 47,870 16,592 1,628 29,650 47,870 16,592 1,628 29,650 -- -- -- --1999 37,475 10,476 1,778 25,220 37,475 10,476 1,778 25,220 -- -- -- --2000 41,236 12,443 1,964 26,829 41,236 12,443 1,964 26,829 -- -- -- --2001 40,945 9,906 2,415 28,627 40,945 9,906 2,415 28,627 -- -- -- --2002 40,545 8,491 2,250 29,804 40,545 8,491 2,250 29,804 -- -- -- --2003 55,037 10,415 2,157 42,465 55,037 10,415 2,157 42,465 -- -- -- --2004:
1st qtr. 14,268 3,502 971 9,795 14,268 3,502 971 9,795 -- -- -- --2d qtr. 13,274 2,781 922 9,571 13,274 2,781 922 9,571 -- -- -- --3d qtr. 11,427 2,836 760 7,831 11,427 2,836 760 7,831 -- -- -- --4th qtr. 8,519 2,521 655 5,344 8,519 2,521 655 5,344 -- -- -- --
2004 total 47,488 11,639 3,308 32,541 47,488 11,639 3,308 32,541 -- -- -- -- 2005:
1st qtr. 11,837 3,268 -- 8,569 11,837 3,268 -- 8,569 -- -- -- --2d qtr. 9,215 2,560 -- 6,655 9,215 2,560 -- 6,655 -- -- -- --3d qtr. 9,186 2,847 4 6,335 9,186 2,847 4 6,335 -- -- -- --4th qtr. 8,719 2,520 -- 6,199 8,719 2,520 -- 6,199 -- -- -- --
2005 total 38,957 11,196 4 27,758 38,957 11,196 4 27,758 -- -- -- --
To People’s Republic of China
1994 109 -- 71 38 109 -- 71 38 -- -- -- --1995 155 35 -- 120 120 -- -- 120 35 35 -- --1996 313 54 -- 259 313 54 -- 259 -- -- -- --1997 867 -- --- 867 821 -- -- 821 46 -- -- 461998 901 -- 374 528 794 -- 374 420 108 -- -- 1081999 732 5 -- 726 488 5 -- 482 244 -- -- 2442000 1,271 22 39 1,210 996 22 39 935 276 -- -- 2762001 2,513 -- -- 2,513 1,803 -- -- 1,803 710 -- -- 7102002 2,991 -- -- 2,991 2,648 -- -- 2,648 344 -- -- 3442003 5,779 183 4 5,592 5,588 121 4 5,463 191 62 -- 1292004:
1st qtr. 1,362 16 41 1,306 866 16 41 810 496 -- -- 4962d qtr. 2,044 12 -- 2,032 949 -- -- 949 1,094 12 -- 1,0833d qtr. 846 34 -- 812 473 20 -- 453 372 14 -- 3584th qtr. 1,405 4 -- 1,401 1,118 4 -- 1,114 287 -- -- 287
2004 total 5,656 65 41 5,550 3,406 39 41 3,326 2,250 26 -- 2,224 2005:
1st qtr. 910 27 -- 883 744 27 -- 717 167 -- -- 1672d qtr. 1,337 -- 9 1,328 961 -- -- 916 376 -- 9 3673d qtr. 1,691 98 -- 1,593 910 73 -- 837 782 25 -- 7574th qtr. 1,326 -- -- 1,326 648 -- -- 648 678 -- -- 678
2005 total 5,264 125 9 5,130 3,263 100 -- 3,118 2,002 25 9 1,969
Note: Individual columns may not add to totals because of rounding. a Includes lumber classified as railroad crossties and not specified by species. Source: U.S. Department of Commerce. Data are compiled from Department of Commerce records at the end of each quarter.
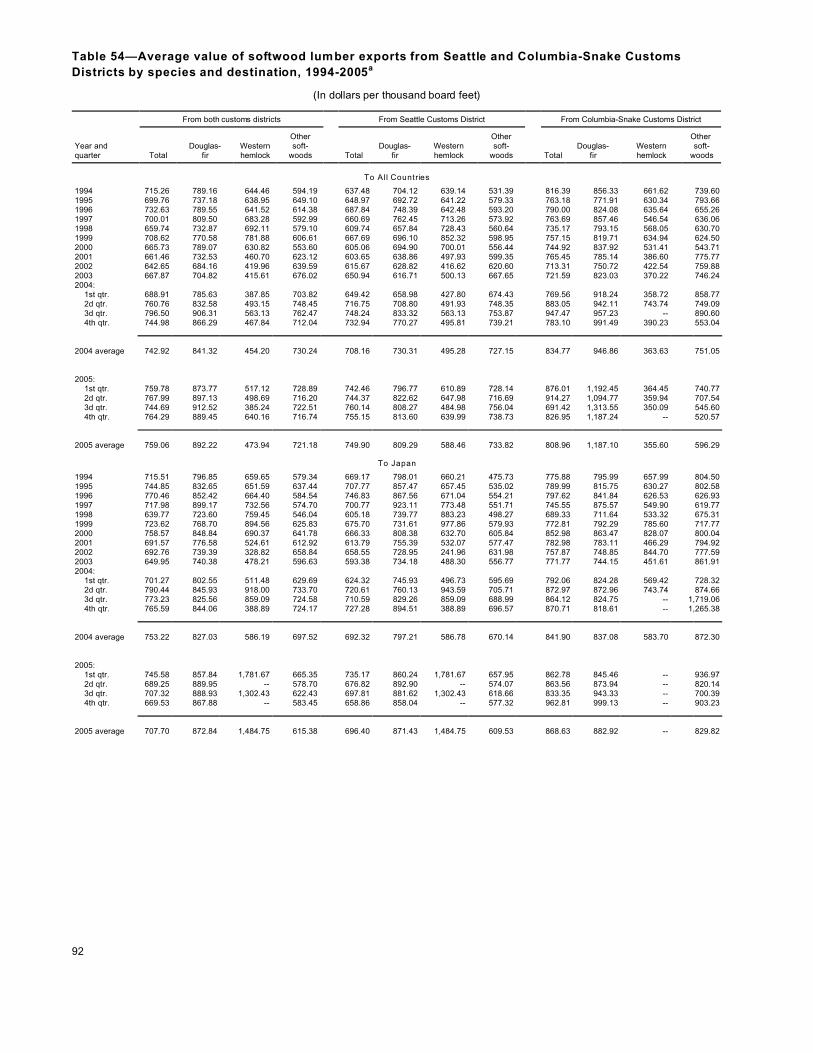
92
Table 54—Average value of softwood lumber exports from Seattle and Columbia-Snake Customs
Districts by species and destination, 1994-2005a
(In dollars per thousand board feet)
From both customs districts From Seattle Customs District From Columbia-Snake Customs District
Year andquarter Total
Douglas-fir
Westernhemlock
Othersoft-
woods TotalDouglas-
firWesternhemlock
Othersoft-
woods TotalDouglas-
firWesternhemlock
Other soft-
woods
To All Countr ies
1994 715.26 789.16 644.46 594.19 637.48 704.12 639.14 531.39 816.39 856.33 661.62 739.601995 699.76 737.18 638.95 649.10 648.97 692.72 641.22 579.33 763.18 771.91 630.34 793.661996 732.63 789.55 641.52 614.38 687.84 748.39 642.48 593.20 790.00 824.08 635.64 655.261997 700.01 809.50 683.28 592.99 660.69 762.45 713.26 573.92 763.69 857.46 546.54 636.061998 659.74 732.87 692.11 579.10 609.74 657.84 728.43 560.64 735.17 793.15 568.05 630.701999 708.62 770.58 781.88 606.61 667.69 696.10 852.32 598.95 757.15 819.71 634.94 624.502000 665.73 789.07 630.82 553.60 605.06 694.90 700.01 556.44 744.92 837.92 531.41 543.712001 661.46 732.53 460.70 623.12 603.65 638.86 497.93 599.35 765.45 785.14 386.60 775.772002 642.65 684.16 419.96 639.59 615.67 628.82 416.62 620.60 713.31 750.72 422.54 759.882003 667.87 704.82 415.61 676.02 650.94 616.71 500.13 667.65 721.59 823.03 370.22 746.242004:
1st qtr. 688.91 785.63 387.85 703.82 649.42 658.98 427.80 674.43 769.56 918.24 358.72 858.772d qtr. 760.76 832.58 493.15 748.45 716.75 708.80 491.93 748.35 883.05 942.11 743.74 749.093d qtr. 796.50 906.31 563.13 762.47 748.24 833.32 563.13 753.87 947.47 957.23 -- 890.604th qtr. 744.98 866.29 467.84 712.04 732.94 770.27 495.81 739.21 783.10 991.49 390.23 553.04
2004 average 742.92 841.32 454.20 730.24 708.16 730.31 495.28 727.15 834.77 946.86 363.63 751.05 2005:
1st qtr. 759.78 873.77 517.12 728.89 742.46 796.77 610.89 728.14 876.01 1,192.45 364.45 740.772d qtr. 767.99 897.13 498.69 716.20 744.37 822.62 647.98 716.69 914.27 1,094.77 359.94 707.543d qtr. 744.69 912.52 385.24 722.51 760.14 808.27 484.98 756.04 691.42 1,313.55 350.09 545.604th qtr. 764.29 889.45 640.16 716.74 755.15 813.60 639.99 738.73 826.95 1,187.24 -- 520.57
2005 average 759.06 892.22 473.94 721.18 749.90 809.29 588.46 733.82 808.96 1,187.10 355.60 596.29
To Japan
1994 715.51 796.85 659.65 579.34 669.17 798.01 660.21 475.73 775.88 795.99 657.99 804.501995 744.85 832.65 651.59 637.44 707.77 857.47 657.45 535.02 789.99 815.75 630.27 802.581996 770.46 852.42 664.40 584.54 746.83 867.56 671.04 554.21 797.62 841.84 626.53 626.931997 717.98 899.17 732.56 574.70 700.77 923.11 773.48 551.71 745.55 875.57 549.90 619.771998 639.77 723.60 759.45 546.04 605.18 739.77 883.23 498.27 689.33 711.64 533.32 675.311999 723.62 768.70 894.56 625.83 675.70 731.61 977.86 579.93 772.81 792.29 785.60 717.772000 758.57 848.84 690.37 641.78 666.33 808.38 632.70 605.84 852.98 863.47 828.07 800.042001 691.57 776.58 524.61 612.92 613.79 755.39 532.07 577.47 782.98 783.11 466.29 794.922002 692.76 739.39 328.82 658.84 658.55 728.95 241.96 631.98 757.87 748.85 844.70 777.592003 649.95 740.38 478.21 596.63 593.38 734.18 488.30 556.77 771.77 744.15 451.61 861.912004:
1st qtr. 701.27 802.55 511.48 629.69 624.32 745.93 496.73 595.69 792.06 824.28 569.42 728.322d qtr. 790.44 845.93 918.00 733.70 720.61 760.13 943.59 705.71 872.97 872.96 743.74 874.663d qtr. 773.23 825.56 859.09 724.58 710.59 829.26 859.09 688.99 864.12 824.75 -- 1,719.064th qtr. 765.59 844.06 388.89 724.17 727.28 894.51 388.89 696.57 870.71 818.61 -- 1,265.38
2004 average 753.22 827.03 586.19 697.52 692.32 797.21 586.78 670.14 841.90 837.08 583.70 872.30 2005:
1st qtr. 745.58 857.84 1,781.67 665.35 735.17 860.24 1,781.67 657.95 862.78 845.46 -- 936.972d qtr. 689.25 889.95 -- 578.70 676.82 892.90 -- 574.07 863.56 873.94 -- 820.143d qtr. 707.32 888.93 1,302.43 622.43 697.81 881.62 1,302.43 618.66 833.35 943.33 -- 700.394th qtr. 669.53 867.88 -- 583.45 658.86 858.04 -- 577.32 962.81 999.13 -- 903.23
2005 average 707.70 872.84 1,484.75 615.38 696.40 871.43 1,484.75 609.53 868.63 882.92 -- 829.82

93
Table 54—Average value of softwood lumber exports from Seattle and Columbia-Snake Customs
Districts by species and destination, 1994-2005a (continued)
(In dollars per thousand board feet)
From both customs districts From Seattle Customs District From Columbia-Snake Customs District
Year andquarter Total
Douglas-fir
Westernhemlock
Othersoft-
woods TotalDouglas-
firWesternhemlock
Othersoft-
woods TotalDouglas-
firWesternhemlock
Other soft-
woods
To Canada
1994 501.24 513.52 535.36 469.17 501.24 513.52 535.36 469.17 -- -- -- --1995 445.16 447.71 419.21 442.97 445.16 447.71 419.21 442.97 -- -- -- --1996 482.73 490.28 428.70 469.89 482.73 490.28 428.70 469.89 -- -- -- --1997 558.96 526.40 672.38 601.50 558.96 526.40 672.38 601.50 -- -- -- --1998 592.93 461.36 604.30 704.65 592.93 461.36 604.30 704.65 -- -- -- --1999 649.78 566.33 605.61 695.97 649.78 566.33 605.61 695.97 -- -- -- --2000 588.90 540.38 542.97 618.49 588.90 540.38 542.97 618.49 -- -- -- --2001 578.43 511.21 491.49 615.66 578.43 511.21 491.49 615.66 -- -- -- --2002 617.29 483.24 471.70 687.66 617.29 483.24 471.70 687.66 -- -- -- --2003 675.40 548.55 490.86 730.81 675.40 548.55 490.86 730.81 -- -- -- --2004:
1st qtr. 646.56 599.98 394.86 711.25 646.56 599.98 394.86 711.25 -- -- -- --2d qtr. 722.80 728.10 405.37 780.01 722.80 728.10 405.37 780.01 -- -- -- --3d qtr. 731.53 879.79 383.65 751.80 731.53 879.79 383.65 751.80 -- -- -- --4th qtr. 693.83 707.81 436.30 740.45 693.83 707.81 436.60 740.45 -- -- -- --
2004 average 694.97 707.93 402.68 745.06 694.97 707.93 402.68 745.06 -- -- -- -- 2005
1sr qtr. 672.69 727.99 -- 653.72 672.69 727.99 -- 653.72 -- -- -- --2d qtr. 720.85 752.90 -- 709.32 720.85 752.90 -- 709.32 -- -- -- --3d qtr. 708.64 681.36 887.79 721.61 708.64 681.36 887.79 721.61 -- -- -- --4th qtr. 729.56 725.80 -- 731.10 729.56 725.80 -- 731.10 -- -- -- --
2005 average 704.54 720.41 887.79 698.35 704.54 720.41 887.79 698.35 -- -- -- --
To People’s Republic of China
1994 402.21 -- 405.71 395.83 402.21 -- 405.71 395.83 -- -- -- --1995 472.56 897.44 -- 415.22 415.22 -- -- 415.22 897.44 897.44 -- --1996 627.25 915.25 -- 588.64 627.25 915.25 -- 588.64 -- -- -- --1997 1,315.63 -- -- 1,315.63 1,355.34 -- -- 1,355.34 858.87 -- -- 858.871998 642.91 -- 1,270.47 476.34 673.46 -- 1,270.47 475.00 481.66 -- -- 481.661999 585.04 358.93 -- 587.78 480.62 358.93 -- 482.62 1,029.71 -- -- 1,029.712000 1,038.72 459.48 472.26 1,106.91 1,010.58 459.48 472.26 1,093.50 1,154.95 -- -- 1,154.952001 712.10 -- -- 712.10 736.85 -- -- 736.85 656.27 -- -- 656.272002 580.44 -- -- 580.44 595.32 -- -- 595.32 487.51 -- -- 487.512003 742.61 304.49 190.00 780.90 741.53 298.74 190.00 768.47 775.36 317.95 -- 2,480.772004:
1st qtr. 551.50 1,968.38 2,037.75 534.74 824.38 1,968.38 2,037.75 791.79 349.40 -- -- 349.402d qtr. 823.00 -- -- 823.00 958.84 -- -- 958.84 732.88 837.50 -- 731.913d qtr. 678.03 1,416.67 -- 663.53 703.95 1,538.46 -- 687.56 647.57 1,272.73 -- 635.464th qtr. 795.86 194.74 -- 802.41 908.63 194.74 -- 919.82 536.69 -- -- 536.69
2004 average 710.09 1,017.19 2,037.75 704.24 863.89 1,011.46 2,037.75 856.41 559.29 1,029.00 -- 556.37 2005:
1st qtr. 718.86 1,614.00 -- 706.97 850.73 1,614.00 -- 836.64 424.79 -- -- 426.022d qtr. 585.69 -- 1,053.62 583.99 597.88 -- -- 570.01 556.86 -- 1,053.62 550.223d qtr. 562.69 1,000.00 -- 547.80 629.83 1,077.86 -- 608.28 500.59 847.64 -- 494.134th qtr. 560.61 -- -- 560.44 616.33 -- -- 615.97 516.12 -- -- 515.98
2005 average 590.20 1,086.96 1,053.62 583.15 655.47 1,176.47 -- 637.37 507.85 847.64 1,053.62 504.23
a Includes lumber classified as railroad crossties and not specified by species. Source: U.S. Department of Commerce. Data are compiled from Department of Commerce records at the end of each quarter.

94
Table 55—Volume and average value of softwood lumber exports from southern
California ports by species and destination, 1994-2005a
(Volume in thousand board feet; value in dollars per thousand board feet)
Total Douglas-fir Other softwoods
Year and quarter Volume
Averagevalue Volume
Averagevalue Volume
Averagevalue
To All Countr ies
1994 144,819 596.57 22,445 459.88 122,374 621.641995 73,253 547.06 5,710 426.44 67,543 557.261996 83,953 428.82 5,128 613.45 78,825 416.811997 104,410 408.21 6,526 562.72 97,884 397.911998 102,512 406.60 10,989 249.40 91,524 425.471999 120,100 380.48 8,269 390.70 111,832 379.722000 134,728 390.62 7,558 517.96 127,169 383.052001 118,952 401.97 8,785 379.91 110,167 403.732002 125,067 397.32 12,108 367.47 112,959 400.512003 117,356 405.45 13,347 318.54 104,008 416.612004:
1st quarter 29,310 409.90 2,591 380.01 26,719 412.792d quarter 22,999 541.97 3,275 474.57 19,724 553.163d quarter 31,594 443.41 5,803 302.19 25,791 475.194th quarter 33,395 451.98 3,542 414.85 29,854 456.39
2004 total andaverage value 117,298 456.80 15,211 378.79 102,087 468.42
2005:
1st quarter 33,082 477.80 3,853 394.31 29,229 488.802d quarter 37,056 560.19 4,808 463.78 32,248 574.563d quarter 38,829 510.58 4,735 463.83 34,094 517.074th quarter 36,675 544.53 4,738 451.85 31,937 558.27
2005 total andaverage value 145,461 524.31 18,133 445.91 127,508 535.45
To Japan
1994 3,398 487.20 736 565.20 2,662 465.641995 2,698 520.76 265 875.47 2,433 482.121996 6,227 483.24 551 1392.39 5,676 395.011997 11,502 508.26 775 1474.77 10,726 438.401998 3,228 621.81 109 953.58 3,118 610.181999 3,423 534.37 81 892.54 3,342 525.742000 2,914 573.04 219 1038.83 2,695 703.942001 1,860 794.75 27 974.15 1,833 792.142002 1,148 860.36 0 -- 1,148 860.362003 1,307 570.02 0 -- 1,307 570.022004:
1st quarter 222 760.98 0 -- 222 760.982d quarter 311 943.47 0 -- 311 943.473d quarter 168 933.44 0 -- 168 933.444th quarter 216 823.79 10 1,365.21 206 796.23
2004 total andaverage value 917 869.18 10 1,365.21 907 863.26
2005:1st quarter 112 1,363.95 24 631.28 88 1,561.672d quarter 141 1,286.95 17 1,051.77 124 1,320.253d quarter 140 1,289.62 12 1,033.09 128 1,316.234th quarter 72 925.49 15 1,217.56 57 856.06
2005 total andaverage value 466 1,250.01 67 934.23 397 1,308.59
a Southern California consists of the San Diego and Los Angeles Customs Districts and includes all ports south of Monterey, California. Source: U.S. Department of Commerce.

95
Table 56—Volume and average value of softwood lumber exports from northern
California ports by species and destination, 1994-2005a
(Volume in thousand board feet; value in dollars per thousand board feet)
Total Douglas-firWesternhemlock
Othersoftwoods
Year andquarter Volume
Averagevalue Volume
Averagevalue Volume
Averagevalue Volume
Averagevalue
To All Countr ies
1994 36,340 819.43 3,019 954.29 14,836 470.48 18,485 1,077.471995 24,191 955.89 1,020 1,118.63 4,993 539.96 18,178 1,061.011996 29,954 712.19 4,732 900.43 2,619 451.38 22,603 702.991997 29,841 880.67 1,470 1,554.24 1,057 583.23 27,314 857.751998 21,524 752.66 372 1,450.88 234 823.50 20,918 739.461999 31,031 630.94 1,536 975.28 208 966.56 29,286 610.492000 34,279 842.77 2,559 818.46 26 365.99 31,694 742.462001 29,428 922.38 449 526.24 76 1,044.06 28,903 927.302002 39,019 683.46 119 583.67 20 1,867.91 38,880 683.162003 60,295 361.57 73 468.23 87 1,353.73 60,135 360.032004 30,789 777.54 530 364.92 199 426.63 30,060 787.142005:
1st quarter 5,133 743.60 140 254.69 0 -- 4,993 757.302d quarter 7,828 715.57 299 915.28 0 -- 7,529 707.583d quarter 6,967 742.59 132 254.74 20 1,166.74 6,815 750.764th quarter 6,751 756.06 63 254.56 0 -- 6,688 760.76
2005 total andaverage value 26,678 738.26 634 566.23 20 1,166.74 26,025 742.09
To Japan
1994 19,260 634.84 320 818.75 14,127 426.77 4,813 1,233.331995 13,782 806.99 547 795.25 4,993 539.96 8,242 969.551996 16,603 750.51 2,739 665.31 2,606 444.44 11,259 842.061997 18,757 783.18 782 1,276.00 1,057 583.23 15,919 857.311998 10,853 650.78 103 1,018.94 84 912.32 10,666 645.171999 9,658 561.23 152 797.87 208 966.56 9,297 548.292000 10,065 624.12 134 811.66 0 -- 9,931 621.592001 5,784 817.74 30 1,107.89 76 1,044.06 5,678 813.242002 1,505 1,126.13 0 -- 20 1,867.91 1,485 1,116.142003 675 1,701.95 16 360.21 86 1,353.73 573 1,790.572004 349 1,835.91 30 1,488.41 20 1,166.74 299 1,915.542005:
1st quarter 39 1,703.87 0 -- 0 -- 39 1,703.872d quarter 31 1,209.10 0 -- 0 -- 31 1,209.103d quarter 101 702.13 0 -- 20 1,166.74 81 590.994th quarter 11 2,553.16 0 -- 0 -- 11 2,553.16
2005 total andaverage value 182 1,113.07 0 -- 20 1,166.74 162 1,105.54
To People’s Republic of China
1994 324 327.16 0 -- 0 -- 324 327.161995 0 -- 0 -- 0 -- 0 --1996 33 746.94 0 -- 0 -- 33 746.941997 31 2,393.05 0 -- 0 -- 31 2,393.051998 153 287.10 0 -- 0 -- 153 287.101999 163 1,302.69 0 -- 0 -- 163 1,302.692000 42 200.43 0 -- 0 -- 42 200.432001 3,886 2,758.53 0 -- 0 -- 3,886 2,758.532002 18,211 686.73 0 -- 0 -- 18,211 686.732003 14,685 752.38 0 -- 0 -- 14,685 752.382004 16,255 850.77 0 -- 0 -- 16,255 850.772005:
1st quarter 2,094 825.52 0 -- 0 -- 2,094 825.522d quarter 5,749 746.06 127 1,809.33 0 -- 5,622 721.973d quarter 2,803 939.93 0 -- 0 -- 2,803 939.934th quarter 2,477 905.37 0 -- 0 -- 2,477 905.37
2005 total andaverage value 13,123 830.22 127 1,809.33 0 -- 12,996 820.66
a Northern California consists of the San Francisco Customs District and includes Monterey, California, and all ports north of Monterey. Source: U.S. Department of Commerce.
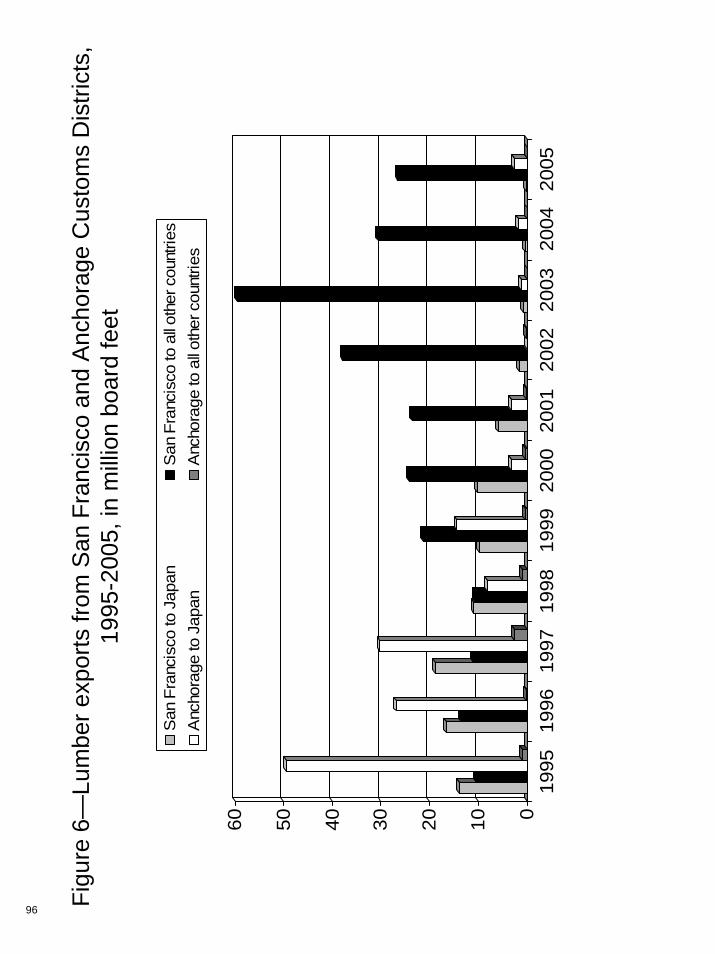
Figu
re 6
—Lu
mbe
r exp
orts
from
San
Fra
ncis
co a
nd A
ncho
rage
Cus
tom
s D
istri
cts,
19
95-2
005,
in m
illio
n bo
ard
feet
0102030405060
1995
1996
1997
1998
1999
2000
2001
2002
2003
2004
2005
San
Fra
ncis
co to
Jap
anS
an F
ranc
isco
to a
ll oth
er c
ount
ries
Anc
hora
ge to
Jap
anA
ncho
rage
to a
ll oth
er c
ount
ries
96

97
Table 57—Volume and average value of softwood lumber exports from Anchorage Customs
District by species and destination, 1994-2005
(Volume in thousand board feet; value in dollars per thousand board feet)
TotalWestern hemlock
Sitka spruce Cedar
Othersoftwoods
Year and quarter Volume
Averagevalue Volume
Averagevalue Volume
Averagevalue Volume
Averagevalue Volume
Averagevalue
To All Countr ies
1994 111,836 561.28 68,839 468.11 42,679 713.84 0 -- 318 254.721995 50,379 775.01 28,367 608.59 20,352 1,010.91 1,407 817.34 253 221.341996 26,854 715.05 14,831 557.28 11,934 914.09 20 688.30 69 204.081997 32,764 599.48 18,524 499.05 13,093 759.35 84 100.11 1,063 420.121998 9,048 460.22 4,447 386.06 3,874 540.98 261 392.86 466 534.461999 14,674 735.78 1,492 371.20 8,624 682.96 0 -- 4,558 955.052000 3,609 901.62 0 -- 3,254 854.45 278 1,235.94 77 1,691.682001 3,292 208.21 0 -- 3,247 200.58 0 -- 44 770.892002 85 49.56 0 -- 0 -- 0 -- 85 49.562003 1,217 1,023.87 0 -- 1,217 1,023.87 0 -- 0 --2004 1,825 1,087.76 0 -- 1,825 1,087.76 0 -- 0 --2005:
1st quarter 304 1,104.40 0 -- 304 1,104.40 0 -- 0 --2d quarter 305 1,150.50 0 -- 305 1,150.50 0 -- 0 --3d quarter 1,592 212.37 0 -- 1,592 212.37 0 -- 0 --4th quarter 468 1,013.20 0 -- 468 1,013.20 0 -- 0 --
2005 total andaverage value 2,669 561.77 0 -- 2,669 561.77 0 -- 0 --
To Japan
1994 107,166 545.84 66,958 473.34 39,952 669.60 0 -- 257 190.661995 49,351 763.63 28,019 607.44 19,672 989.27 1,407 817.34 253 221.341996 26,784 716.24 14,761 558.77 11,934 914.09 20 688.30 69 204.081997 30,238 625.93 17,364 511.95 12,246 793.07 0 -- 627 518.201998 8,105 487.32 3,856 420.46 3,791 550.00 0 -- 458 531.561999 14,370 739.47 1,492 371.20 8,388 687.02 0 -- 4,491 959.612000 3,161 858.77 0 -- 3,161 858.77 0 -- 0 --2001 3,247 200.58 0 -- 3,247 200.58 0 -- 0 --2002 0 -- 0 -- 0 -- 0 -- 0 --2003 1,217 1,023.87 0 -- 1,217 1,023.87 0 -- 0 --2004 1,825 1,087.76 0 -- 1,825 1,087.76 0 -- 0 --2005:
1st quarter 304 1,104.40 0 -- 304 1,104.40 0 -- 0 --2d quarter 305 1,150.50 0 -- 305 1,150.50 0 -- 0 --3d quarter 1,592 212.37 0 -- 1,592 212.37 0 -- 0 --4th quarter 468 1,013.20 0 -- 468 1,013.20 0 -- 0 --
2005 total andaverage value 2,669 561.77 0 -- 2,669 561.77 0 -- 0 --
To South Korea
1994 1,994 1,759.78 0 -- 1,994 1,759.78 0 -- 0 --1995 1,028 1,320.04 348 701.15 680 1,636.76 0 -- 0 --1996 0 -- 0 -- 0 -- 0 -- 0 --1997 380 289.49 0 -- 0 -- 0 -- 380 289.491998 0 -- 0 -- 0 -- 0 -- 0 --1999 223 531.13 0 -- 156 480.13 0 -- 67 649.852000 0 -- 0 -- 0 -- 0 -- 0 --2001 0 -- 0 -- 0 -- 0 -- 0 --2002 0 -- 0 -- 0 -- 0 -- 0 --2003 0 -- 0 -- 0 -- 0 -- 0 --2004 0 -- 0 -- 0 -- 0 -- 0 --2005:
1st quarter 0 -- 0 -- 0 -- 0 -- 0 --2d quarter 0 -- 0 -- 0 -- 0 -- 0 --3d quarter 0 -- 0 -- 0 -- 0 -- 0 --4th quarter 0 -- 0 -- 0 -- 0 -- 0 --
2005 total andaverage value 0 -- 0 -- 0 -- 0 -- 0 --
Source: U.S. Department of Commerce.

98
Table 58—Volume and average value of lumber exports by port, species, and destination, Seattle
Customs District, 2005
(Volume in thousand board feet; value in dollars per thousand board feet)
Destination
All countries JapanPeople's Republic
of China Korea Canada
Port and species Volume
Averagevalue Volume
Averagevalue Volume
Averagevalue Volume
Averagevalue Volume
Averagevalue
Port Angeles: All hardwoods 302 1,336.41 12 1,779.10 259 1,331.84 0 -- 31 1,203.14
Seattle:Douglas-fir 15,085 898.84 8,920 872.61 17 1,614.00 14 1,923.83 10 880.28Other firs 414 986.31 394 985.67 0 -- 0 -- 0 --Cedars 339 1,022.67 50 991.36 65 1,319.90 8 495.60 0 --Hemlock 197 1,195.89 37 1,482.57 0 -- 0 -- 0 --Spruce 10,518 935.70 6,307 849.36 909 642.09 0 -- 0 --Pines 764 588.64 175 937.53 502 494.73 0 -- 0 --Redwood 367 1,671.22 361 1,606.24 0 -- 0 -- 0 --Other softwoods 12,059 997.90 1,843 906.16 157 1,131.65 139 244.05 0 --All softwoods 39,742 943.25 18,086 887.21 1,650 680.60 162 402.33 10 880.28Red alder 41,772 782.31 164 1,268.59 33,738 741.15 89 1,661.08 86 484.03All hardwoods 65,581 899.14 7,807 1,370.05 41,362 767.43 1,127 1,674.91 408 349.63
Tacoma:
Douglas-fir 5,536 855.78 4,591 863.96 68 1,077.86 51 242.79 6 1,694.48Other firs 378 634.32 378 634.32 0 -- 0 -- 0 --Cedars 203 1,037.30 152 984.67 36 1,031.21 3 1,513.94 0 --Hemlock 33 838.69 2 1,522.67 0 -- 5 887.79 0 --Spruce 4,602 770.36 4,352 755.27 84 1,772.10 1 3,225.33 0 --Pines 2,830 540.12 367 293.86 2,462 576.86 0 -- 0 --Redwood 427 1,834.43 407 1,856.11 0 -- 18 1,180.00 0 --Other softwoods 1,808 917.20 1,279 982.00 236 695.98 19 270.11 0 --All softwoods 15,816 804.89 11,528 847.10 2,886 638.79 96 525.76 6 1,694.48Red alder 12,922 696.21 214 1,487.18 10,310 653.29 0 -- 0 --All hardwoods 21,221 926.21 1,669 1,733.45 13,934 740.60 537 2,159.95 0 --

99
Table 58—Volume and average value of lumber exports by port, species, and destination, Seattle Customs District, 2005 (continued)
(Volume in thousand board feet; value in dollars per thousand board feet)
Destination
All countries Japan
People's Republic
of China Korea Canada
Port and
species Volume
Average
value Volume
Average
value Volume
Average
value Volume
Average
value Volume
Average
value
Other ports:a
Douglas-fir 15,900 707.11 19 513.04 0 -- 0 -- 15,257 721.24
Other firs 1,262 1,418.09 149 408.10 0 -- 0 -- 516 453.74
Cedars 17,850 852.08 73 473.10 0 -- 0 -- 17,480 851.43
Hemlock 3,020 477.51 0 -- 0 -- 0 -- 2,903 464.66
Spruce 1,330 648.16 273 866.65 0 -- 0 -- 1,044 554.07
Pines 2,939 760.53 0 -- 0 -- 0 -- 2,939 760.53
Redwood 101 2,306.71 0 -- 0 -- 0 -- 12 1,193.23
Other softwoods 15,173 253.23 10,781 202.11 0 -- 1,425 202.07 2,132 511.72
All softwoods 57,574 640.15 11,296 223.19 0 -- 1,425 202.07 42,283 742.35
Red alder 27,184 1,049.48 0 -- 17 1,927.20 0 -- 15,335 564.78
All hardwoods 50,925 1,061.02 0 -- 31 1,849.04 0 -- 36,773 847.00
Total:
Douglas-fir 36,520 808.84 13,531 869.16 85 1,185.09 65 603.01 15,272 721.69
Other firs 2,053 1,186.98 921 748.04 0 -- 0 -- 516 453.74
Cedars 18,393 857.28 275 850.52 101 1,217.23 11 730.60 17,480 851.43
Hemlock 3,249 524.61 39 1,484.75 0 -- 5 887.79 2,903 464.66
Spruce 16,450 866.20 10,932 812.34 993 737.58 1 3,225.33 1,044 554.07
Pines 6,532 644.96 542 501.54 2,964 562.96 0 -- 2,939 760.53
Redwood 894 1,820.79 768 1,738.76 0 -- 18 1,180.00 12 1,193.23
Other softwoods 29,041 603.80 13,903 367.16 393 869.87 1,583 206.57 2,132 511.72
All softwoods 113,132 769.66 40,911 692.56 4,536 653.99 1,683 239.83 42,298 742.50
Red alder 81,878 857.42 378 1,392.09 44,065 721.06 89 1,661.08 15,421 564.33
All hardwoods 138,028 963.98 9,488 1,434.50 55,586 763.94 1,664 1,831.52 37,212 841.83
a Bellingham, Blaine, Frontier, Laurier, Lynden, Metaline Falls, Neah Bay, Oroville, Sea-Tac Int’l. Airport, and Sumas.
Source: U.S. Department of Commerce.
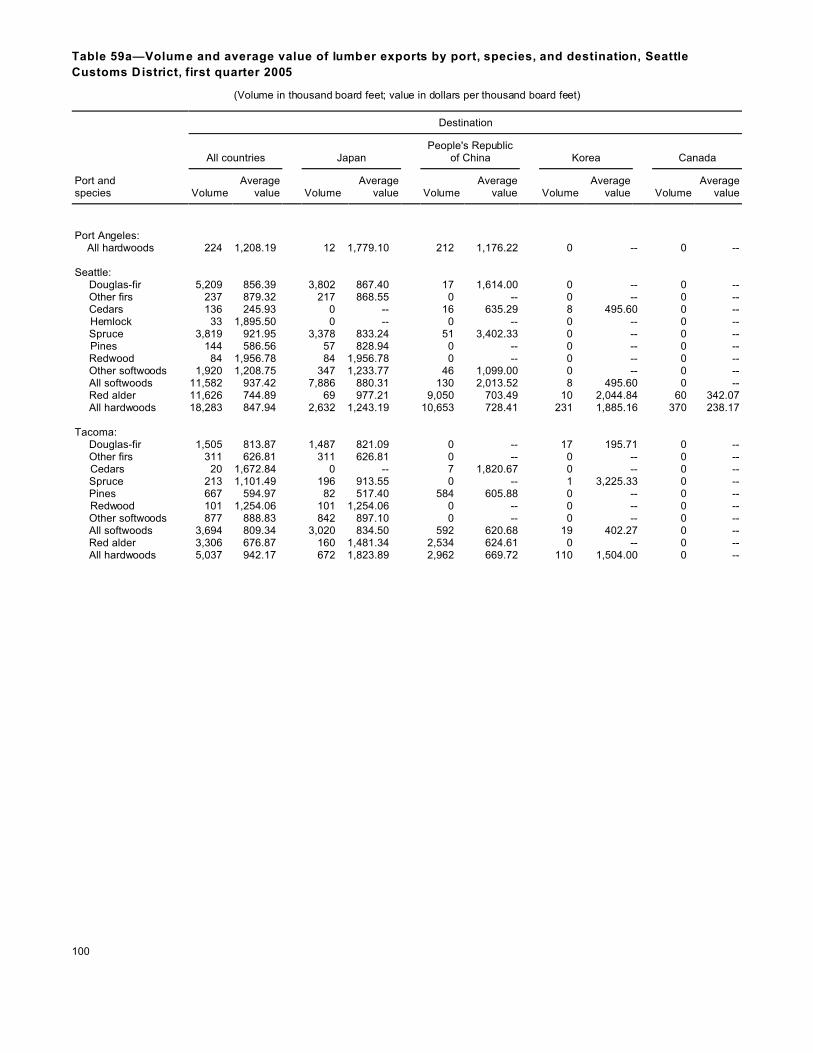
100
Table 59a—Volume and average value of lumber exports by port, species, and destination, Seattle
Customs District, first quarter 2005
(Volume in thousand board feet; value in dollars per thousand board feet)
Destination
All countries JapanPeople's Republic
of China Korea Canada
Port and species Volume
Averagevalue Volume
Averagevalue Volume
Averagevalue Volume
Averagevalue Volume
Averagevalue
Port Angeles: All hardwoods 224 1,208.19 12 1,779.10 212 1,176.22 0 -- 0 --
Seattle:Douglas-fir 5,209 856.39 3,802 867.40 17 1,614.00 0 -- 0 --Other firs 237 879.32 217 868.55 0 -- 0 -- 0 --Cedars 136 245.93 0 -- 16 635.29 8 495.60 0 --
Hemlock 33 1,895.50 0 -- 0 -- 0 -- 0 --Spruce 3,819 921.95 3,378 833.24 51 3,402.33 0 -- 0 --
Pines 144 586.56 57 828.94 0 -- 0 -- 0 --Redwood 84 1,956.78 84 1,956.78 0 -- 0 -- 0 --Other softwoods 1,920 1,208.75 347 1,233.77 46 1,099.00 0 -- 0 --All softwoods 11,582 937.42 7,886 880.31 130 2,013.52 8 495.60 0 --Red alder 11,626 744.89 69 977.21 9,050 703.49 10 2,044.84 60 342.07All hardwoods 18,283 847.94 2,632 1,243.19 10,653 728.41 231 1,885.16 370 238.17
Tacoma:
Douglas-fir 1,505 813.87 1,487 821.09 0 -- 17 195.71 0 --Other firs 311 626.81 311 626.81 0 -- 0 -- 0 --
Cedars 20 1,672.84 0 -- 7 1,820.67 0 -- 0 --Spruce 213 1,101.49 196 913.55 0 -- 1 3,225.33 0 --Pines 667 594.97 82 517.40 584 605.88 0 -- 0 --
Redwood 101 1,254.06 101 1,254.06 0 -- 0 -- 0 --Other softwoods 877 888.83 842 897.10 0 -- 0 -- 0 --All softwoods 3,694 809.34 3,020 834.50 592 620.68 19 402.27 0 --Red alder 3,306 676.87 160 1,481.34 2,534 624.61 0 -- 0 --All hardwoods 5,037 942.17 672 1,823.89 2,962 669.72 110 1,504.00 0 --

101
Table 59a—Volume and average value of lumber exports by port, species, and destination, Seattle
Customs District, first quarter 2005 (continued)
(Volume in thousand board feet; value in dollars per thousand board feet)
Destination
All countries JapanPeople's Republic
of China Korea Canada
Port and species Volume
Averagevalue Volume
Averagevalue Volume
Averagevalue Volume
Averagevalue Volume
Averagevalue
Other ports:a
Douglas-fir 4,562 714.15 0 -- 0 -- 0 -- 4,439 725.70Other firs 508 1,005.30 149 408.10 0 -- 0 -- 200 430.37Cedars 5,405 829.70 0 -- 0 -- 0 -- 5,364 823.41Hemlock 686 509.73 0 -- 0 -- 0 -- 569 450.81Spruce 207 610.94 30 1,163.38 0 -- 0 -- 177 517.10Pines 1,065 687.78 0 -- 0 -- 0 -- 1,065 687.78Redwood 6 6,844.00 0 -- 0 -- 0 -- 0 --Other softwoods 3,368 234.66 2,725 200.62 0 -- 216 200.42 348 529.90All softwoods 15,807 651.33 2,904 221.25 0 -- 216 200.42 12,163 739.10Red alder 7,946 970.26 0 -- 17 1,927.20 0 -- 4,692 488.02All hardwoods 12,857 1,017.11 0 -- 17 1,927.20 0 -- 9,523 791.75
Total:
Douglas-fir 11,275 793.16 5,289 854.38 17 1,614.00 17 195.71 4,439 725.70Other firs 1,057 865.52 678 656.20 0 -- 0 -- 200 430.37Cedars 5,560 818.49 0 -- 23 1,008.46 8 495.60 5,364 823.41Hemlock 719 574.21 0 -- 0 -- 0 -- 569 450.81Spruce 4,239 915.76 3,605 840.37 51 3,402.33 1 3,225.33 177 517.10Pines 1,875 647.03 139 644.68 584 605.88 0 -- 1,065 687.78Redwood 192 1,747.86 186 1,573.33 0 -- 0 -- 0 --Other softwoods 6,165 631.14 3,914 442.16 46 1,099.00 216 200.42 348 529.90All softwoods 31,083 776.75 13,811 731.72 721 871.09 243 226.18 12,163 739.10Red alder 22,878 813.34 229 1,329.45 11,601 688.09 10 2,044.84 4,752 486.18All hardwoods 36,401 922.95 3,316 1,362.79 13,844 724.21 342 1,762.20 9,893 771.05
a Blaine, Frontier, Laurier, Lynden, Metaline Falls, Oroville, and Sumas.
Source: U.S. Department of Commerce.

102
Table 59b—Volume and average value of lumber exports by port, species, and destination, Seattle
Customs District, second quarter 2005
(Volume in thousand board feet; value in dollars per thousand board feet)
Destination
All countries JapanPeople's Republic
of China Korea Canada
Port and species Volume
Averagevalue Volume
Averagevalue Volume
Averagevalue Volume
Averagevalue Volume
Averagevalue
Port Angeles: All hardwoods 37 1,628.78 0 -- 37 1,628.78 0 -- 0 --
Seattle:Douglas-fir 4,058 890.79 2,477 884.50 0 -- 0 -- 0 --
Other firs 111 1,106.13 111 1,106.13 0 -- 0 -- 0 -- Cedars 69 1,676.66 14 697.09 21 1,161.55 0 -- 0 --
Hemlock 67 1,511.71 15 1,781.67 0 -- 0 -- 0 --Spruce 2,926 985.33 1,227 950.64 425 440.22 0 -- 0 --Pines 78 969.51 78 969.51 0 -- 0 -- 0 --Redwood 117 1,479.28 117 1,479.28 0 -- 0 -- 0 --Other softwoods 2,879 899.54 172 845.23 92 1,263.30 0 -- 0 --All softwoods 10,305 938.92 4,211 928.66 538 609.25 0 -- 0 --Red alder 12,134 817.28 78 1,652.31 9,367 775.10 28 1,531.17 26 806.89All hardwoods 20,100 916.76 2,880 1,168.91 11,800 804.77 362 1,634.20 39 1,418.91
Tacoma:
Douglas-fir 926 956.09 876 925.08 0 -- 17 339.13 0 -- Other firs 44 441.03 44 441.03 0 -- 0 -- 0 --
Cedars 14 1,196.30 0 -- 14 1,196.30 0 -- 0 --Spruce 1,722 745.95 1,551 764.34 22 2,042.31 0 -- 0 --Pines 1,189 467.58 226 88.56 963 556.50 0 -- 0 --
Redwood 57 1,204.96 56 1,134.96 0 -- 0 -- 0 --Other softwoods 554 989.83 296 1,129.78 0 -- 19 270.11 0 --All softwoods 4,507 749.89 3,049 798.01 998 597.98 36 302.98 0 --Red alder 3,055 709.25 36 1,235.78 2,370 652.08 0 -- 0 --All hardwoods 5,396 999.16 494 1,711.53 3,303 752.59 261 2,344.62 0 --

103
Table 59b—Volume and average value of lumber exports by port, species, and destination, Seattle
Customs District, second quarter 2005 (continued)
(Volume in thousand board feet; value in dollars per thousand board feet)
Destination
All countries JapanPeople's Republic
of China Korea Canada
Port and species Volume
Averagevalue Volume
Averagevalue Volume
Averagevalue Volume
Averagevalue Volume
Averagevalue
Other ports:a
Douglas-fir 3,789 714.58 19 513.04 0 -- 0 -- 3,381 755.22Other firs 244 1,658.89 0 -- 0 -- 0 -- 116 566.22Cedars 4,767 856.06 0 -- 0 -- 0 -- 4,715 855.56Hemlock 486 529.65 0 -- 0 -- 0 -- 486 529.65Spruce 392 510.95 0 -- 0 -- 0 -- 392 510.95Pines 774 765.09 0 -- 0 -- 0 -- 774 765.09
Redwood 12 1,193.23 0 -- 0 -- 0 -- 12 1,193.23Other softwoods 4,599 273.81 3,198 200.63 0 -- 241 200.58 906 443.06All softwoods 15,063 631.78 3,218 202.52 0 -- 241 200.58 10,781 753.00Red alder 7,196 1,187.29 0 -- 0 -- 0 -- 3,599 648.82All hardwoods 14,653 1,138.64 0 -- 0 -- 0 -- 9,111 883.73
Total:
Douglas-fir 8,773 821.59 3,372 892.90 0 -- 17 339.13 3,381 755.22Other firs 400 1,369.71 156 915.84 0 -- 0 -- 116 566.22Cedars 4,849 868.63 14 697.09 35 1,175.11 0 -- 4,715 855.56Hemlock 552 647.98 15 1,781.67 0 -- 0 -- 486 529.65Spruce 5,041 866.61 2,778 846.62 447 519.18 0 -- 392 510.95Pines 2,041 599.70 304 315.54 963 556.50 0 -- 774 765.09Redwood 186 1,376.68 172 1,368.45 0 -- 0 -- 12 1,193.23Other softwoods 8,033 547.50 3,667 305.99 92 1,263.30 260 205.57 906 443.06All softwoods 29,875 755.55 10,478 667.63 1,536 601.93 277 213.75 10,781 753.00Red alder 22,385 921.48 114 1,520.20 11,737 750.26 28 1,531.17 3,625 649.96All hardwoods 40,186 1,009.38 3,374 1,248.43 15,140 795.40 624 1,931.98 9,150 885.99
a Blaine, Laurier, Lynden, Metaline Falls, Oroville, and Sumas.
Source: U.S. Department of Commerce.
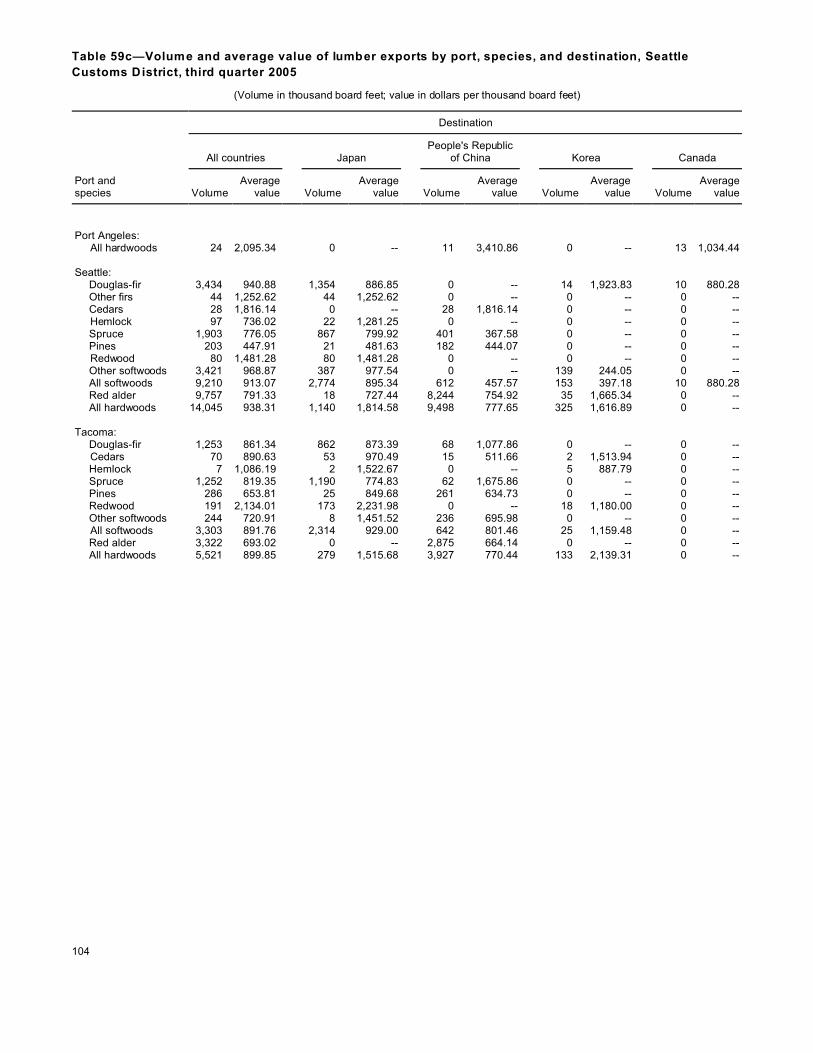
104
Table 59c—Volume and average value of lumber exports by port, species, and destination, Seattle
Customs District, third quarter 2005
(Volume in thousand board feet; value in dollars per thousand board feet)
Destination
All countries JapanPeople's Republic
of China Korea Canada
Port and species Volume
Averagevalue Volume
Averagevalue Volume
Averagevalue Volume
Averagevalue Volume
Averagevalue
Port Angeles: All hardwoods 24 2,095.34 0 -- 11 3,410.86 0 -- 13 1,034.44
Seattle:Douglas-fir 3,434 940.88 1,354 886.85 0 -- 14 1,923.83 10 880.28Other firs 44 1,252.62 44 1,252.62 0 -- 0 -- 0 --Cedars 28 1,816.14 0 -- 28 1,816.14 0 -- 0 --
Hemlock 97 736.02 22 1,281.25 0 -- 0 -- 0 --Spruce 1,903 776.05 867 799.92 401 367.58 0 -- 0 --Pines 203 447.91 21 481.63 182 444.07 0 -- 0 --
Redwood 80 1,481.28 80 1,481.28 0 -- 0 -- 0 --Other softwoods 3,421 968.87 387 977.54 0 -- 139 244.05 0 --All softwoods 9,210 913.07 2,774 895.34 612 457.57 153 397.18 10 880.28Red alder 9,757 791.33 18 727.44 8,244 754.92 35 1,665.34 0 --All hardwoods 14,045 938.31 1,140 1,814.58 9,498 777.65 325 1,616.89 0 --
Tacoma:
Douglas-fir 1,253 861.34 862 873.39 68 1,077.86 0 -- 0 -- Cedars 70 890.63 53 970.49 15 511.66 2 1,513.94 0 --
Hemlock 7 1,086.19 2 1,522.67 0 -- 5 887.79 0 --Spruce 1,252 819.35 1,190 774.83 62 1,675.86 0 -- 0 --Pines 286 653.81 25 849.68 261 634.73 0 -- 0 --Redwood 191 2,134.01 173 2,231.98 0 -- 18 1,180.00 0 --Other softwoods 244 720.91 8 1,451.52 236 695.98 0 -- 0 --
All softwoods 3,303 891.76 2,314 929.00 642 801.46 25 1,159.48 0 --Red alder 3,322 693.02 0 -- 2,875 664.14 0 -- 0 --All hardwoods 5,521 899.85 279 1,515.68 3,927 770.44 133 2,139.31 0 --

105
Table 59c—Volume and average value of lumber exports by port, species, and destination, Seattle
Customs District, third quarter 2005 (continued)
(Volume in thousand board feet; value in dollars per thousand board feet)
Destination
All countries JapanPeople's Republic
of China Korea Canada
Port and species Volume
Averagevalue Volume
Averagevalue Volume
Averagevalue Volume
Averagevalue Volume
Averagevalue
Other ports:a
Douglas-fir 4,144 680.19 0 -- 0 -- 0 -- 4,111 678.76 Other firs 313 1,552.71 0 -- 0 -- 0 -- 150 434.63 Cedars 3,519 886.15 0 -- 0 -- 0 -- 3,439 886.77 Hemlock 1,087 458.68 0 -- 0 -- 0 -- 1,087 458.68 Spruce 453 829.73 217 807.18 0 -- 0 -- 223 689.71 Pines 580 946.23 0 -- 0 -- 0 -- 580 946.23 Redwood 68 2,032.02 0 -- 0 -- 0 -- 0 -- Other softwoods 3,088 247.84 2,240 200.62 0 -- 363 206.68 484 497.13 All softwoods 13,252 660.28 2,458 254.27 0 -- 363 206.68 10,075 729.29 Red alder 6,691 951.52 0 -- 0 -- 0 -- 4,237 580.23 All hardwoods 12,986 1,016.18 0 -- 14 1,748.91 0 -- 10,325 864.94 Total: Douglas-fir 8,831 807.26 2,216 881.62 68 1,077.86 14 1,923.83 4,121 679.24 Other firs 357 1,515.65 44 1,252.62 0 -- 0 -- 150 434.63 Cedars 3,618 893.53 53 970.49 44 1,360.21 3 1,513.94 3,439 886.77 Hemlock 1,190 484.77 24 1,302.43 0 -- 5 887.79 1,087 458.68 Spruce 3,608 797.82 2,274 787.48 463 542.34 0 -- 223 689.71 Pines 1,069 773.27 46 684.23 443 556.35 0 -- 580 946.23 Redwood 339 1,960.09 253 1,995.58 0 -- 18 1,180.00 0 -- Other softwoods 6,753 630.23 2,636 318.61 236 695.98 503 217.05 484 497.13 All softwoods 25,765 780.32 7,545 696.86 1,254 633.64 542 304.63 10,084 729.43 Red alder 19,770 829.02 18 727.44 11,119 731.45 35 1,665.34 4,237 580.23 All hardwoods 32,575 963.67 1,419 1,755.85 13,450 778.60 458 1,769.12 10,338 865.16
a Bellingham, Blaine, Frontier, Lynden, Metaline Falls, Neah Bay, Oroville, and Sumas.
Source: U.S. Department of Commerce.

106
Table 59d—Volume and average value of lumber exports by port, species, and destination, Seattle
Customs District, fourth quarter 2005
(Volume in thousand board feet; value in dollars per thousand board feet)
Destination
All countries JapanPeople's Republic
of China Korea Canada
Port and species Volume
Averagevalue Volume
Averagevalue Volume
Averagevalue Volume
Averagevalue Volume
Averagevalue
Port Angeles:All hardwoods 17 1,330.70 0 -- 0 -- 0 -- 17 1,330.70
Seattle:Douglas-fir 2,384 944.73 1,287 850.14 0 -- 0 -- 0 --Other firs 22 1,000.46 22 1,000.46 0 -- 0 -- 0 --
Cedars 107 1,377.62 37 1,099.60 0 -- 0 -- 0 --Spruce 1,870 1,048.57 835 817.07 32 2,391.47 0 -- 0 --Pines 339 585.70 19 1,625.78 319 523.63 0 -- 0 --Redwood 86 1,828.92 80 1,546.55 0 -- 0 -- 0 --Other softwoods 3,839 992.07 936 766.18 19 563.24 0 -- 0 --All softwoods 8,645 988.39 3,215 842.84 370 686.09 0 -- 0 --Red alder 8,255 772.94 0 -- 7,077 728.32 17 1,632.39 0 --All hardwoods 13,153 901.56 1,155 1,721.91 9,411 754.46 208 1,602.64 0 --
Tacoma:
Douglas-fir 1,853 835.92 1,366 865.49 0 -- 17 194.70 6 1,694.48Other firs 22 1,140.48 22 1,140.48 0 -- 0 -- 0 --Cedars 100 992.14 100 992.14 0 -- 0 -- 0 --Hemlock 26 773.77 0 -- 0 -- 0 -- 0 --Spruce 1,415 706.94 1,415 706.94 0 -- 0 -- 0 --Pines 688 564.95 34 702.75 654 557.81 0 -- 0 --
Redwood 77 2,321.10 77 2,321.10 0 -- 0 -- 0 --Other softwoods 133 1,162.48 133 1,162.48 0 -- 0 -- 0 --All softwoods 4,312 791.73 3,145 846.53 654 557.81 17 194.70 6 1,694.48Red alder 3,239 706.92 17 2,062.12 2,532 670.83 0 -- 0 --All hardwoods 5,267 863.83 224 1,781.50 3,742 754.80 32 2,990.28 0 --

107
Table 59d—Volume and average value of lumber exports by port, species, and destination, Seattle
Customs District, fourth quarter 2005 (continued)
(Volume in thousand board feet; value in dollars per thousand board feet)
Destination
All countries JapanPeople's Republic
of China Korea Canada
Port and species Volume
Averagevalue Volume
Averagevalue Volume
Averagevalue Volume
Averagevalue Volume
Averagevalue
Other ports:a
Douglas-fir 3,405 722.12 0 -- 0 -- 0 -- 3,326 733.26Other firs 197 1,972.60 0 -- 0 -- 0 -- 50 345.27Cedars 4,159 847.78 73 473.10 0 -- 0 -- 3,962 853.75Hemlock 761 442.10 0 -- 0 -- 0 -- 761 442.10Spruce 277 573.09 26 1,021.38 0 -- 0 -- 251 526.90Pines 520 695.73 0 -- 0 -- 0 -- 520 695.73Redwood 14 2,522.70 0 -- 0 -- 0 -- 0 --Other softwoods 4,119 249.47 2,618 206.73 0 -- 604 200.47 394 671.50All softwoods 13,453 616.54 2,717 221.63 0 -- 604 200.47 9,265 748.43Red alder 5,351 1,104.32 0 -- 0 -- 0 -- 2,807 562.07All hardwoods 10,428 1,061.92 0 – 0 -- 0 -- 7,814 847.78
Total:
Douglas-fir 7,642 819.16 2,653 858.04 0 -- 17 194.70 3,331 734.84Other firs 240 1,810.03 43 1,070.47 0 -- 0 -- 50 345.27Cedars 4,366 864.03 209 830.35 0 -- 0 -- 3,962 853.75Hemlock 787 452.99 0 -- 0 -- 0 -- 761 442.10Spruce 3,561 875.91 2,276 750.92 32 2,391.47 0 -- 251 526.90Pines 1,547 613.48 53 1,035.04 974 546.59 0 -- 520 695.73Redwood 177 2,099.65 157 1,927.55 0 -- 0 -- 0 --Other softwoods 8,090 616.80 3,686 383.10 19 563.24 604 200.47 394 671.50All softwoods 26,410 766.86 9,078 658.19 1,024 604.14 621 200.32 9,270 748.99Red alder 16,844 865.51 17 2,062.12 9,608 713.17 17 1,632.39 2,807 562.07All hardwoods 28,865 952.87 1,379 1,731.60 13,153 754.56 241 1,788.31 7,831 848.85
a Blaine, Danville, Frontier, Laurier, Lynden, Metaline Falls, Oroville, and Sumas. Source: U.S. Department of Commerce.

108
Table 60—Volume and average value of lumber exports by port, species, and destination, Columbia-Snake
Customs District, 2005
(Volume in thousand board feet; value in dollars per thousand board feet)
Destination
All countries JapanPeople's Republic
of China Korea Taiwan
Port and species Volume
Averagevalue Volume
Averagevalue Volume
Averagevalue Volume
Averagevalue Volume
Averagevalue
Coos Bay:Douglas-fir 21 740.99 0 -- 0 -- 0 -- 0 --All softwoods 21 740.99 0 -- 0 -- 0 -- 0 --Red alder 136 393.60 0 -- 98 437.70 0 -- 0 --All hardwoods 154 411.42 0 -- 117 454.33 0 -- 0 --
Longview/Vancouver::
Douglas-fir 737 865.95 0 -- 0 -- 0 -- 0 --Other firs 95 781.93 30 475.37 0 -- 0 -- 0 --
Cedars 48 476.14 0 -- 0 -- 0 -- 0 -- Hemlock 4,424 350.03 0 -- 0 -- 0 -- 0 --
Pines 3 1,847.54 0 -- 0 -- 0 -- 0 --Other softwoods 226 624.83 0 -- 0 -- 0 -- 0 --All softwoods 5,534 439.35 30 475.37 0 -- 0 -- 0 --
Red alder 36 1,843.22 0 -- 0 -- 0 -- 0 --All hardwoods 653 873.22 0 -- 291 757.32 0 -- 36 789.15
Portland:
Douglas-fir 9,525 1,211.54 2,070 872.47 30 847.64 0 -- 392 911.41Other firs 139 1,074.04 66 949.48 0 -- 0 -- 0 --Cedars 31 1,168.46 0 -- 0 -- 17 595.24 0 --Hemlock 26 1,309.22 0 -- 0 -- 8 1,053.62 0 --Spruce 60 550.10 0 -- 0 -- 0 -- 0 --Pines 2,824 533.21 267 696.43 2,272 476.65 0 -- 0 --Redwood 75 1,362.24 31 1,020.54 0 -- 0 -- 44 1,605.37Other softwoods 1,447 556.19 344 854.08 936 480.59 0 -- 0 --All softwoods 14,128 1,005.54 2,778 856.79 3,237 481.18 26 745.53 436 981.55Red alder 18,000 865.63 73 1,716.87 15,014 821.45 134 1,277.61 789 783.03All hardwoods 24,428 891.56 133 1,768.08 18,083 833.74 408 1,365.28 917 780.14
Total:
Douglas-fir 10,283 1,185.80 2,070 872.47 30 847.64 0 -- 392 911.41Other firs 235 955.40 95 801.98 0 -- 0 -- 0 --Cedars 80 748.65 0 -- 0 -- 17 595.24 0 --Hemlock 4,450 355.60 0 -- 0 -- 8 1,053.62 0 --Spruce 60 550.10 0 -- 0 -- 0 -- 0 --Pines 2,827 534.58 267 696.43 2,272 476.65 0 -- 0 --Redwood 75 1,362.24 31 1,020.54 0 -- 0 -- 44 1,605.37Other softwoods 1,674 565.47 344 854.08 936 480.59 0 -- 0 --All softwoods 19,683 846.07 2,808 852.76 3,238 481.18 26 745.53 436 981.57Red alder 18,171 864.03 73 1,716.87 15,112 818.95 134 1,277.61 789 783.03All hardwoods 25,234 888.16 133 1,768.08 18,491 830.15 408 1,365.28 953 780.49
Source: U.S. Department of Commerce.
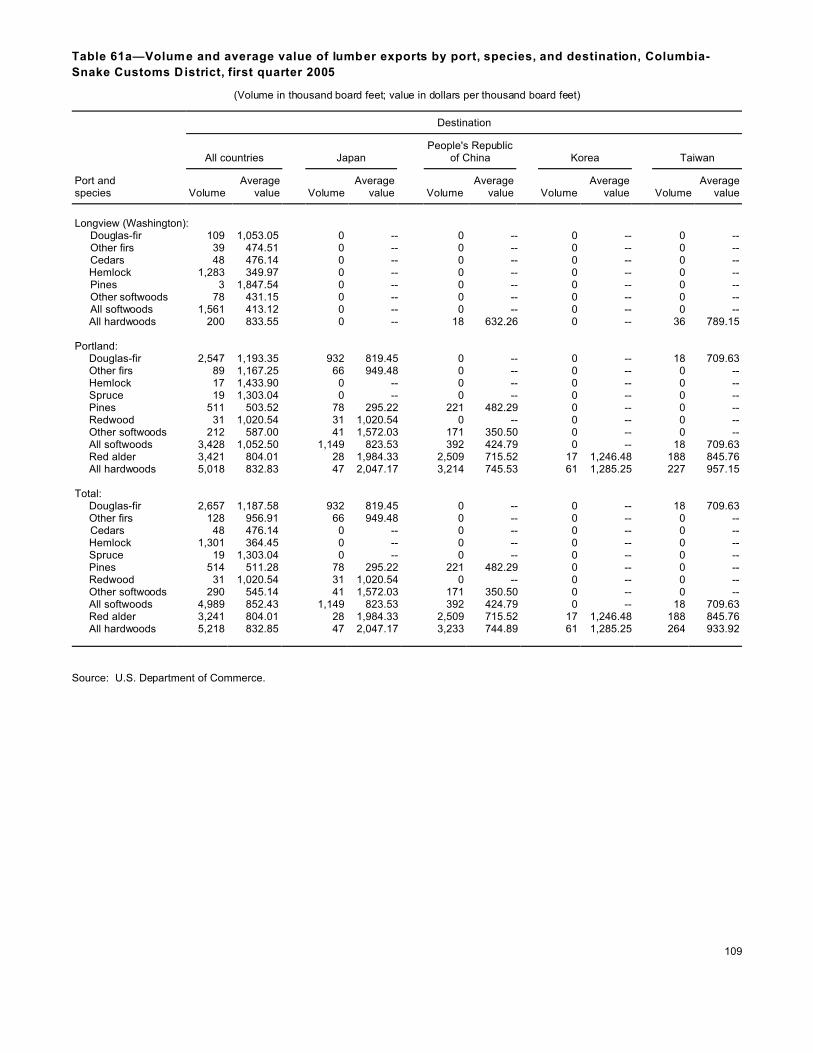
109
Table 61a—Volume and average value of lumber exports by port, species, and destination, Columbia-
Snake Customs District, first quarter 2005
(Volume in thousand board feet; value in dollars per thousand board feet)
Destination
All countries JapanPeople's Republic
of China Korea Taiwan
Port and species Volume
Averagevalue Volume
Averagevalue Volume
Averagevalue Volume
Averagevalue Volume
Averagevalue
Longview (Washington): Douglas-fir 109 1,053.05 0 -- 0 -- 0 -- 0 -- Other firs 39 474.51 0 -- 0 -- 0 -- 0 -- Cedars 48 476.14 0 -- 0 -- 0 -- 0 --
Hemlock 1,283 349.97 0 -- 0 -- 0 -- 0 -- Pines 3 1,847.54 0 -- 0 -- 0 -- 0 -- Other softwoods 78 431.15 0 -- 0 -- 0 -- 0 -- All softwoods 1,561 413.12 0 -- 0 -- 0 -- 0 --
All hardwoods 200 833.55 0 -- 18 632.26 0 -- 36 789.15
Portland:Douglas-fir 2,547 1,193.35 932 819.45 0 -- 0 -- 18 709.63Other firs 89 1,167.25 66 949.48 0 -- 0 -- 0 --Hemlock 17 1,433.90 0 -- 0 -- 0 -- 0 --Spruce 19 1,303.04 0 -- 0 -- 0 -- 0 --Pines 511 503.52 78 295.22 221 482.29 0 -- 0 --Redwood 31 1,020.54 31 1,020.54 0 -- 0 -- 0 --Other softwoods 212 587.00 41 1,572.03 171 350.50 0 -- 0 --All softwoods 3,428 1,052.50 1,149 823.53 392 424.79 0 -- 18 709.63Red alder 3,421 804.01 28 1,984.33 2,509 715.52 17 1,246.48 188 845.76All hardwoods 5,018 832.83 47 2,047.17 3,214 745.53 61 1,285.25 227 957.15
Total:
Douglas-fir 2,657 1,187.58 932 819.45 0 -- 0 -- 18 709.63Other firs 128 956.91 66 949.48 0 -- 0 -- 0 --
Cedars 48 476.14 0 -- 0 -- 0 -- 0 --Hemlock 1,301 364.45 0 -- 0 -- 0 -- 0 --Spruce 19 1,303.04 0 -- 0 -- 0 -- 0 --Pines 514 511.28 78 295.22 221 482.29 0 -- 0 --Redwood 31 1,020.54 31 1,020.54 0 -- 0 -- 0 --Other softwoods 290 545.14 41 1,572.03 171 350.50 0 -- 0 --All softwoods 4,989 852.43 1,149 823.53 392 424.79 0 -- 18 709.63Red alder 3,241 804.01 28 1,984.33 2,509 715.52 17 1,246.48 188 845.76All hardwoods 5,218 832.85 47 2,047.17 3,233 744.89 61 1,285.25 264 933.92
Source: U.S. Department of Commerce.

110
Table 61b—Volume and average value of lumber exports by port, species, and destination, Columbia-
Snake Customs District, second quarter 2005
(Volume in thousand board feet; value in dollars per thousand board feet)
Destination
All countries JapanPeople's Republic
of China Korea Taiwan
Port and species Volume
Averagevalue Volume
Averagevalue Volume
Averagevalue Volume
Averagevalue Volume
Averagevalue
Coos Bay:Douglas-fir 21 740.99 0 -- 0 -- 0 -- 0 --
Longview, WA:Douglas-fir 110 874.09 0 -- 0 -- 0 -- 0 --
Other firs 9 1,517.14 0 -- 0 -- 0 -- 0 -- Hemlock 584 349.88 0 -- 0 -- 0 -- 0 -- Other softwoods 51 565.06 0 -- 0 -- 0 -- 0 -- All softwoods 754 454.73 0 -- 0 -- 0 -- 0 -- Red alder 36 1,843.22 0 -- 0 -- 0 -- 0 -- All hardwoods 253 948.20 0 -- 145 771.49 0 -- 0 --
Portland:Douglas-fir 3,197 1,104.72 617 873.94 0 -- 0 -- 358 930.25Hemlock 8 1,053.62 0 -- 0 -- 8 1,053.62 0 --Pines 240 622.11 119 766.97 121 480.28 0 -- 0 --Redwood 44 1,605.37 0 -- 0 -- 0 -- 44 1,605.37Other softwoods 336 438.42 21 1,106.94 315 394.40 0 -- 0 --All softwoods 3,826 1,021.60 756 863.56 436 418.24 8 1,053.62 402 1,004.31Red alder 6,507 915.42 36 1,522.96 5,359 892.86 52 1,696.40 260 636.03All hardwoods 8,260 931.85 77 1,613.36 6,141 899.57 114 1,481.38 260 636.03
Total:
Douglas-fir 3,329 1,094.77 617 873.94 0 -- 0 -- 358 930.25Other firs 9 1,517.14 0 -- 0 -- 0 -- 0 --Hemlock 593 359.94 0 -- 0 -- 8 1,053.62 0 --Pines 240 622.11 119 766.97 121 480.28 0 -- 0 --Redwood 44 1,605.37 0 -- 0 -- 0 -- 44 1,605.37Other softwoods 387 455.07 21 1,106.94 315 394.40 0 -- 0 --All softwoods 4,601 927.39 756 863.56 436 418.24 8 1,053.62 402 1,004.31Red alder 6,542 920.47 36 1,522.96 5,359 892.86 52 1,696.40 260 636.03All hardwoods 8,513 932.34 77 1,613.36 6,286 896.61 114 1,481.38 260 636.03
Source: U.S. Department of Commerce.
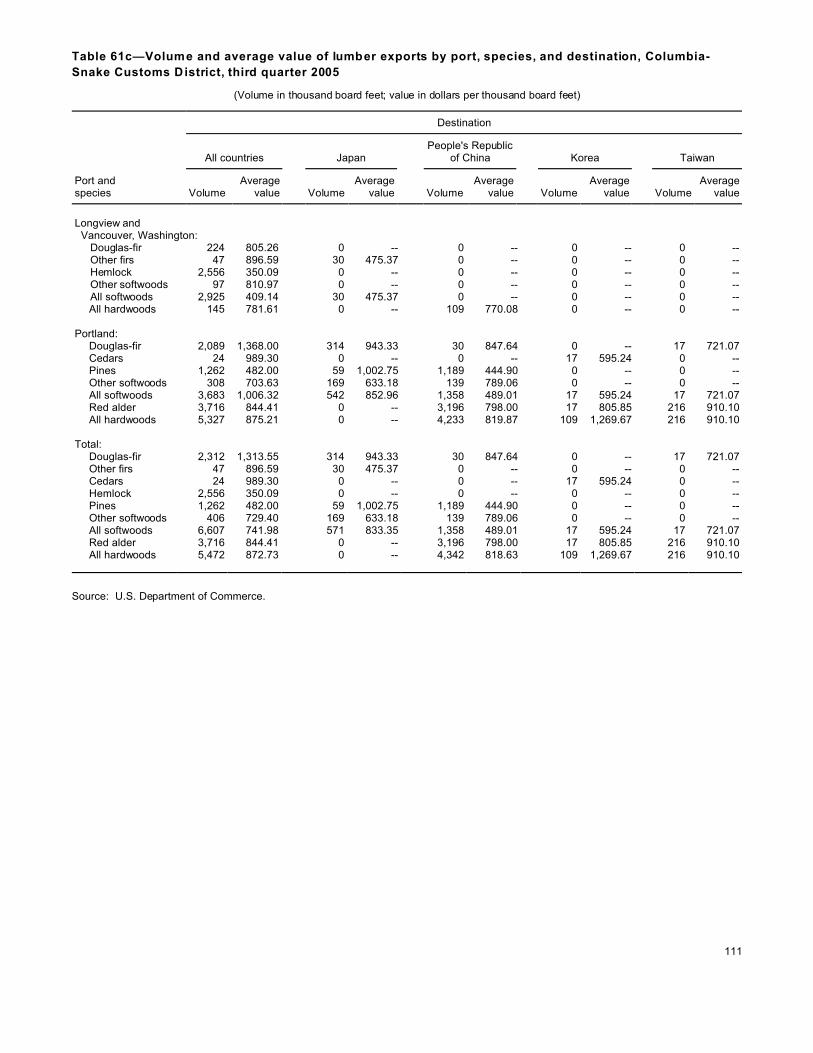
111
Table 61c—Volume and average value of lumber exports by port, species, and destination, Columbia-
Snake Customs District, third quarter 2005
(Volume in thousand board feet; value in dollars per thousand board feet)
Destination
All countries JapanPeople's Republic
of China Korea Taiwan
Port and species Volume
Averagevalue Volume
Averagevalue Volume
Averagevalue Volume
Averagevalue Volume
Averagevalue
Longview and Vancouver, Washington: Douglas-fir 224 805.26 0 -- 0 -- 0 -- 0 -- Other firs 47 896.59 30 475.37 0 -- 0 -- 0 -- Hemlock 2,556 350.09 0 -- 0 -- 0 -- 0 -- Other softwoods 97 810.97 0 -- 0 -- 0 -- 0 -- All softwoods 2,925 409.14 30 475.37 0 -- 0 -- 0 --
All hardwoods 145 781.61 0 -- 109 770.08 0 -- 0 --
Portland:Douglas-fir 2,089 1,368.00 314 943.33 30 847.64 0 -- 17 721.07Cedars 24 989.30 0 -- 0 -- 17 595.24 0 --Pines 1,262 482.00 59 1,002.75 1,189 444.90 0 -- 0 --Other softwoods 308 703.63 169 633.18 139 789.06 0 -- 0 --All softwoods 3,683 1,006.32 542 852.96 1,358 489.01 17 595.24 17 721.07Red alder 3,716 844.41 0 -- 3,196 798.00 17 805.85 216 910.10All hardwoods 5,327 875.21 0 -- 4,233 819.87 109 1,269.67 216 910.10
Total:
Douglas-fir 2,312 1,313.55 314 943.33 30 847.64 0 -- 17 721.07Other firs 47 896.59 30 475.37 0 -- 0 -- 0 --Cedars 24 989.30 0 -- 0 -- 17 595.24 0 --Hemlock 2,556 350.09 0 -- 0 -- 0 -- 0 --Pines 1,262 482.00 59 1,002.75 1,189 444.90 0 -- 0 --Other softwoods 406 729.40 169 633.18 139 789.06 0 -- 0 --All softwoods 6,607 741.98 571 833.35 1,358 489.01 17 595.24 17 721.07Red alder 3,716 844.41 0 -- 3,196 798.00 17 805.85 216 910.10All hardwoods 5,472 872.73 0 -- 4,342 818.63 109 1,269.67 216 910.10
Source: U.S. Department of Commerce.

112
Table 61d—Volume and average value of lumber exports by port, species, and destination, Columbia-
Snake Customs District, fourth quarter 2005
(Volume in thousand board feet; value in dollars per thousand board feet)
Destination
All countries JapanPeople's Republic
of China Korea Taiwan
Port and species Volume
Averagevalue Volume
Averagevalue Volume
Averagevalue Volume
Averagevalue Volume
Averagevalue
Coos Bay:Red alder 136 393.60 0 -- 98 437.70 0 -- 0 --
All hardwoods 154 411.42 0 -- 117 454.33 0 -- 0 --
Longview, WA: Douglas-fir 294 839.53 0 -- 0 -- 0 -- 0 -- All softwoods 294 839.53 0 -- 0 -- 0 -- 0 --
All hardwoods 55 913.70 0 -- 18 693.13 0 -- 0 --
Portland:Douglas-fir 1,692 1,247.70 208 999.13 0 -- 0 -- 0 --Other firs 50 907.36 0 -- 0 -- 0 -- 0 --
Cedars 8 1,725.82 0 -- 0 -- 0 -- 0 -- Spruce 42 212.04 0 -- 0 -- 0 -- 0 --
Pines 811 605.28 11 1,172.26 740 525.37 0 -- 0 --Other softwoods 591 535.11 114 876.87 310 501.34 0 -- 0 --All softwoods 3,192 934.98 332 962.81 1,050 518.28 0 -- 0 --Red alder 4,536 855.63 10 1,657.54 3,949 810.82 47 1,005.53 125 774.84All hardwoods 5,823 899.98 10 1,657.54 4,495 819.95 124 1,382.27 214 636.51
Total:
Douglas-fir 1,986 1,187.25 208 999.13 0 -- 0 -- 0 --Other firs 50 907.36 0 -- 0 -- 0 -- 0 --
Cedars 8 1,725.82 0 -- 0 -- 0 -- 0 --Spruce 42 212.04 0 -- 0 -- 0 -- 0 --
Pines 811 605.28 11 1,172.26 740 525.37 0 -- 0 --Other softwoods 591 535.11 114 876.87 310 501.34 0 -- 0 --All softwoods 3,486 926.93 332 962.81 1,050 518.28 0 -- 0 --Red alder 4,672 842.22 10 1,657.54 4,047 801.76 47 1,005.53 125 774.84All hardwoods 6,032 887.65 10 1,657.54 4,630 810.25 124 1,382.27 214 636.51
Source: U.S. Department of Commerce.
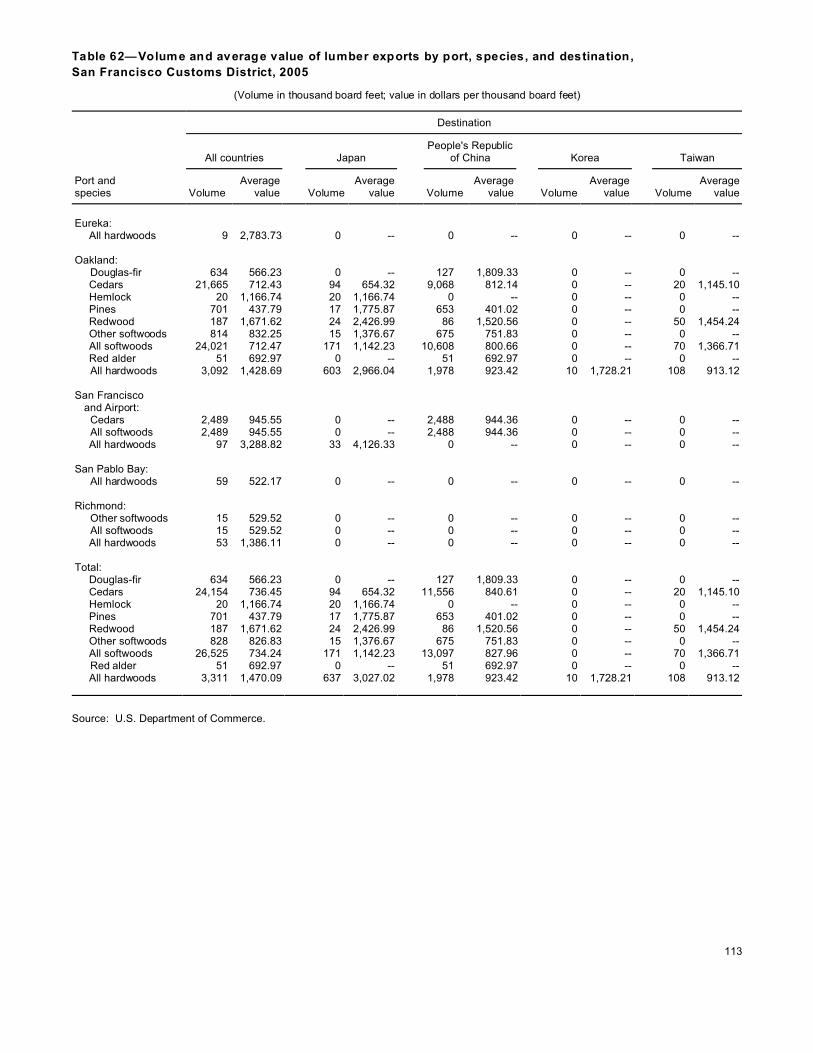
113
Table 62—Volume and average value of lumber exports by port, species, and destination,
San Francisco Customs District, 2005
(Volume in thousand board feet; value in dollars per thousand board feet)
Destination
All countries JapanPeople's Republic
of China Korea Taiwan
Port and species Volume
Averagevalue Volume
Averagevalue Volume
Averagevalue Volume
Averagevalue Volume
Averagevalue
Eureka:All hardwoods 9 2,783.73 0 -- 0 -- 0 -- 0 --
Oakland: Douglas-fir 634 566.23 0 -- 127 1,809.33 0 -- 0 --
Cedars 21,665 712.43 94 654.32 9,068 812.14 0 -- 20 1,145.10Hemlock 20 1,166.74 20 1,166.74 0 -- 0 -- 0 --Pines 701 437.79 17 1,775.87 653 401.02 0 -- 0 --Redwood 187 1,671.62 24 2,426.99 86 1,520.56 0 -- 50 1,454.24Other softwoods 814 832.25 15 1,376.67 675 751.83 0 -- 0 --All softwoods 24,021 712.47 171 1,142.23 10,608 800.66 0 -- 70 1,366.71Red alder 51 692.97 0 -- 51 692.97 0 -- 0 --
All hardwoods 3,092 1,428.69 603 2,966.04 1,978 923.42 10 1,728.21 108 913.12
San Francisco and Airport: Cedars 2,489 945.55 0 -- 2,488 944.36 0 -- 0 -- All softwoods 2,489 945.55 0 -- 2,488 944.36 0 -- 0 --
All hardwoods 97 3,288.82 33 4,126.33 0 -- 0 -- 0 --
San Pablo Bay: All hardwoods 59 522.17 0 -- 0 -- 0 -- 0 --
Richmond: Other softwoods 15 529.52 0 -- 0 -- 0 -- 0 -- All softwoods 15 529.52 0 -- 0 -- 0 -- 0 --
All hardwoods 53 1,386.11 0 -- 0 -- 0 -- 0 --
Total:Douglas-fir 634 566.23 0 -- 127 1,809.33 0 -- 0 --Cedars 24,154 736.45 94 654.32 11,556 840.61 0 -- 20 1,145.10Hemlock 20 1,166.74 20 1,166.74 0 -- 0 -- 0 --Pines 701 437.79 17 1,775.87 653 401.02 0 -- 0 --Redwood 187 1,671.62 24 2,426.99 86 1,520.56 0 -- 50 1,454.24Other softwoods 828 826.83 15 1,376.67 675 751.83 0 -- 0 --All softwoods 26,525 734.24 171 1,142.23 13,097 827.96 0 -- 70 1,366.71
Red alder 51 692.97 0 -- 51 692.97 0 -- 0 --All hardwoods 3,311 1,470.09 637 3,027.02 1,978 923.42 10 1,728.21 108 913.12
Source: U.S. Department of Commerce.

114
Table 63a— Volume and average value of lumber exports by port, species, and destination,
San Francisco Customs District, first quarter 2005
(Volume in thousand board feet; value in dollars per thousand board feet)
Destination
All countries JapanPeople's Republic
of China Korea Taiwan
Port and species Volume
Averagevalue Volume
Averagevalue Volume
Averagevalue Volume
Averagevalue Volume
Averagevalue
Oakland:Douglas-fir 140 254.69 0 -- 0 -- 0 -- 0 --
Cedars 4,344 725.46 12 733.29 1,557 800.42 0 -- 0 -- Pines 151 531.39 0 -- 151 531.39 0 -- 0 -- Redwood 81 1,722.43 11 3,146.67 69 1,487.95 0 -- 0 -- Other softwoods 44 1,130.94 15 1,376.67 0 -- 0 -- 0 -- All softwoods 4,760 726.13 39 1,703.87 1,778 804.40 0 -- 0 -- Red alder 51 692.97 0 -- 51 692.97 0 -- 0 -- All hardwoods 317 2,256.41 109 4,010.91 112 1,221.09 0 -- 25 1,281.91
San Francisco and Airport: Cedars 317 943.97 0 -- 317 943.97 0 -- 0 -- All softwoods 317 943.97 0 -- 317 943.97 0 -- 0 -- All hardwoods 46 2,845.11 13 2,816.77 0 -- 0 -- 0 --
Richmond: Other softwoods 15 529.52 0 -- 0 -- 0 -- 0 -- All softwoods 15 529.52 0 -- 0 -- 0 -- 0 --
Total: Douglas-fir 140 254.69 0 -- 0 -- 0 -- 0 --
Cedars 4,661 740.32 12 733.29 1,873 824.70 0 -- 0 --Pines 151 531.39 0 -- 151 531.39 0 -- 0 --Redwood 81 1,722.43 11 3,146.67 69 1,487.95 0 -- 0 --Other softwoods 59 979.50 15 1,376.67 0 -- 0 -- 0 --All softwoods 5,092 739.12 39 1,703.87 2,094 825.52 0 -- 0 --
Red alder 51 692.97 0 -- 51 692.97 0 -- 0 --All hardwoods 362 2,330.78 122 3,882.82 112 1,221.09 0 -- 25 1,281.91
Source: U.S. Department of Commerce.

115
Table 63b—Volume and average value of lumber exports by port, species, and destination,
San Francisco Customs District, second quarter 2005
(Volume in thousand board feet; value in dollars per thousand board feet)
Destination
All countries JapanPeople's Republic
of China Korea Taiwan
Port and species Volume
Averagevalue Volume
Averagevalue Volume
Averagevalue Volume
Averagevalue Volume
Averagevalue
Oakland:Douglas-fir 299 915.28 0 -- 127 1,809.33 0 -- 0 --Cedars 5,725 669.19 24 733.29 3,949 698.08 0 -- 20 1,145.10Pines 375 422.13 7 2,776.47 368 376.07 0 -- 0 --Redwood 43 1,798.41 0 -- 16 1,661.32 0 -- 0 --Other softwoods 539 803.38 0 -- 480 761.76 0 -- 0 --All softwoods 6,981 683.79 31 1,209.10 4,940 712.00 0 -- 20 1,145.10All hardwoods 457 2,435.50 203 3,082.92 123 1,411.49 0 -- 37 1,222.64
San Francisco: Cedars 795 947.81 0 -- 794 944.10 0 -- 0 -- All softwoods 795 947.81 0 -- 794 944.10 0 -- 0 -- All hardwoods 17 3,481.61 6 4,641.61 0 -- 0 -- 0 --
Richmond:All hardwoods 13 1,132.80 0 -- 0 -- 0 -- 0 --
Total:Douglas-fir 299 915.28 0 -- 127 1,809.33 0 -- 0 --Cedars 6,520 703.16 24 733.29 4,743 739.27 0 -- 20 1,145.10Pines 375 422.13 7 2,776.47 368 376.07 0 -- 0 --Redwood 43 1,798.41 0 -- 16 1,661.32 0 -- 0 --Other softwoods 539 803.38 0 -- 480 761.76 0 -- 0 --All softwoods 7,776 710.78 31 1,209.10 5,734 744.14 0 -- 20 1,145.10All hardwoods 486 2,437.00 208 3,127.27 123 1,411.49 0 -- 37 1,222.64
Source: U.S. Department of Commerce.

116
Table 63c— Volume and average value of lumber exports by port, species, and destination,
San Francisco Customs District, third quarter 2005
(Volume in thousand board feet; value in dollars per thousand board feet)
Destination
All countries JapanPeople's Republic
of China Korea Taiwan
Port and species Volume
Averagevalue Volume
Averagevalue Volume
Averagevalue Volume
Averagevalue Volume
Averagevalue
Oakland:Douglas-fir 132 254.74 0 -- 0 -- 0 -- 0 --
Cedars 5,668 723.68 48 158.73 1,775 1,006.41 0 -- 0 -- Hemlock 20 1,166.74 20 1,166.74 0 -- 0 -- 0 --
Pines 144 374.84 10 1,067.11 133 322.09 0 -- 0 --Redwood 37 1,735.71 13 1,779.28 0 -- 0 -- 24 1,712.78Other softwoods 172 756.68 0 -- 149 680.26 0 -- 0 --All softwoods 6,172 713.94 91 709.17 2,058 938.38 0 -- 24 1,712.78All hardwoods 1,128 1,092.80 73 3,067.09 842 879.53 0 -- 46 458.89
San Francisco and Airport:
Cedars 746 944.20 0 -- 746 944.20 0 -- 0 -- All softwoods 746 944.20 0 -- 746 944.20 0 -- 0 -- All hardwoods 32 2,842.71 12 2,844.22 0 -- 0 -- 0 --
Richmond:All hardwoods 41 1,465.27 0 -- 0 -- 0 -- 0 --
Total:Douglas-fir 132 254.74 0 -- 0 -- 0 -- 0 --
Cedars 6,413 749.32 48 158.73 2,521 988.00 0 -- 0 -- Hemlock 20 1,166.74 20 1,166.74 0 -- 0 -- 0 --
Pines 144 374.84 10 1,067.11 133 322.09 0 -- 0 --Redwood 37 1,735.71 13 1,779.28 0 -- 0 -- 24 1,712.78Other softwoods 172 756.68 0 -- 149 680.26 0 -- 0 --All softwoods 6,918 738.76 91 709.17 2,803 939.93 0 -- 24 1,712.78All hardwoods 1,200 1,152.37 85 3,035.89 842 879.53 0 -- 46 458.89
Source: U.S. Department of Commerce.

117
Table 63d—Volume and average value of lumber exports by port, species, and destination,
San Francisco Customs District, fourth quarter 2005
(Volume in thousand board feet; value in dollars per thousand board feet)
Destination
All countries JapanPeople's Republic
of China Korea Taiwan
Port and species Volume
Averagevalue Volume
Averagevalue Volume
Averagevalue Volume
Averagevalue Volume
Averagevalue
Eureka:All hardwoods 9 2,783.73 0 -- 0 -- 0 -- 0 --
Oakland: Douglas-fir 63 254.56 0 -- 0 -- 0 -- 0 -- Cedars 5,928 733.89 11 2,553.16 1,787 881.41 0 -- 0 -- Pines 31 462.79 0 -- 0 -- 0 -- 0 --
Redwood 26 1,216.54 0 -- 0 -- 0 -- 26 1,216.54Other softwoods 59 1,093.48 0 -- 46 881.00 0 -- 0 --All softwoods 6,107 733.13 11 2,553.16 1,833 881.40 0 -- 26 1,216.54All hardwoods 1,190 1,140.02 219 2,301.64 901 860.94 10 1,728.21 0 --
San Francisco and Airport: Cedars 631 945.08 0 -- 631 945.08 0 -- 0 -- All softwoods 631 945.08 0 -- 631 945.08 0 -- 0 -- All hardwoods 3 15,673.15 3 15,673.15 0 -- 0 -- 0 --
San Pablo Bay: All hardwoods 59 522.17 0 -- 0 -- 0 -- 0 --
Total: Douglas-fir 63 254.56 0 -- 0 -- 0 -- 0 -- Cedars 6,560 754.22 11 2,553.16 2,419 898.03 0 -- 0 -- Pines 31 462.79 0 -- 0 -- 0 -- 0 -- Redwood 26 1,216.54 0 -- 0 -- 0 -- 26 1,216.54 Other softwoods 59 1,093.48 0 -- 46 881.00 0 -- 0 -- All softwoods 6,739 752.98 11 2,553.16 2,464 897.71 0 -- 26 1,216.54 All hardwoods 1,261 1,152.40 221 2,455.34 901 860.94 10 1,728.21 0 --
Source: U.S. Department of Commerce.

118
Table 64—Volume and average value of lumber exports by port, species, and destination,
Anchorage Customs District, 2005
(Volume in thousand board feet; value in dollars per thousand board feet)
Destination
All countries JapanPeople's Republic
of China Korea Canada
Port and species Volume
Averagevalue Volume
Averagevalue Volume
Averagevalue Volume
Averagevalue Volume
Averagevalue
Anchorage: All hardwoods 42 2,460.81 42 2,460.81 0 -- 0 -- 0 0.00
Ketchikan: Spruce 2,669 561.77 2,669 561.77 0 -- 0 -- 0 -- All hardwoods 162 188.74 0 -- 0 -- 0 -- 162 188.74
Skagway: Red alder 18 1,093.52 0 -- 0 -- 0 -- 0 -- All hardwoods 78 395.79 0 -- 0 -- 0 -- 60 189.41
Total: Spruce 2,669 561.77 2,669 561.77 0 -- 0 -- 0 -- All softwoods 2,669 561.77 2,669 561.77 0 -- 0 -- 0 -- Red alder 18 1,093.52 0 -- 0 -- 0 -- 0 -- All hardwoods 281 581.45 42 2,460.81 0 -- 0 -- 222 188.93
Source: U.S. Department of Commerce.

119
Table 65—Volume and average value of lumber exports by port, species, and destination,
Anchorage Customs District, all quarters 2005
(Volume in thousand board feet; value in dollars per thousand board feet)
Destination
All countries JapanPeople's Republic
of China Korea Canada
Port and species Volume
Averagevalue Volume
Averagevalue Volume
Averagevalue Volume
Averagevalue Volume
Averagevalue
1st quarter–
Anchorage: All hardwoods 6 2,304.78 6 2,304.78 0 -- 0 -- 0 --
Ketchikan:
Spruce 304 1,104.40 304 1,104.40 0 -- 0 -- 0 --
Total: Spruce 304 1,104.40 304 1,104.40 0 -- 0 -- 0 -- All hardwoods 6 2,304.78 6 2,304.78 0 -- 0 -- 0 --
2nd quarter–Anchorage: All hardwoods 27 2,100.10 27 2,100.10 0 -- 0 -- 0 --
Ketchikan: Spruce 305 1,150.50 305 1,150.50 0 -- 0 -- 0 -- All hardwoods 162 188.74 0 -- 0 -- 0 -- 162 188.74
Alcan: Red alder 18 1,093.52 0 -- 0 -- 0 -- 0 --
Total: Spruce 305 1,150.50 305 1,150.50 0 -- 0 -- 0 --
All hardwoods 206 514.03 27 2,100.10 0 -- 0 -- 162 18.74Red alder 18 1,093.52 0 -- 0 -- 0 -- 0 --
3rd quarter–
Anchorage:All hardwoods 6 2,265.60 6 2,265.60 0 -- 0 -- 0 --
Ketchikan: Spruce 1,592 212.37 1,592 212.37 0 -- 0 -- 0 --
Wrangell: All hardwoods 60 189.41 0 -- 0 -- 0 -- 60 189.41
Total: Spruce 1,592 212.37 1,592 212.37 0 -- 0 -- 0 -- All hardwoods 66 375.74 6 2,265.60 0 -- 0 -- 60 189.41
4th quarter– Anchorage: All hardwoods 3 7,093.77 3 7,093.77 0 -- 0 -- - 0
Ketchikan:Spruce 468 1,013.20 468 1,013.20 0 -- 0 -- 0 --
Source: U.S. Department of Commerce.

120
Table 66—Volume and average value of softwood lumber exports to Canada from the
Great Falls Customs District, 1994-2005a
(Volume in thousand board feet; value in dollars per thousand board feet)
Total Douglas-firWesternhemlock
Othersoftwoods
Year andquarter Volume
Averagevalue Volume
Averagevalue Volume
Averagevalue Volume
Averagevalue
1994 11,750 635.06 6,138 719.13 339 634.22 5,273 537.271995 13,636 551.63 5,839 653.02 772 624.35 7,025 459.361996 12,804 592.79 4,575 716.13 1,071 565.02 7,158 518.131997 17,370 574.27 7,595 643.85 854 731.12 8,921 500.011998 17,454 657.76 3,112 694.55 7 1,173.45 14,336 649.531999 10,367 702.40 2,635 762.91 14 388.76 7,718 682.322000 9,694 706.96 3,172 741.76 19 605.10 6,522 688.312001 8,303 654.85 2,964 611.50 31 400.73 5,307 680.572002 9,997 634.37 4,045 654.34 41 764.74 5,911 619.862003 7,777 619.59 2,414 693.61 69 554.97 5,293 573.552004:
1st quarter 1,866 620.11 670 721.70 69 551.16 1,127 563.722d quarter 1,933 707.56 841 820.29 0 -- 1,092 621.023d quarter 1,298 780.63 670 860.27 0 -- 628 695.054th quarter 1,600 745.74 671 926.68 0 -- 929 615.62
2004 total 6,697 706.49 2,852 831.54 69 551.16 3,776 614.90
2005:
1st quarter 3,108 752.96 1,895 816.86 0 -- 1,213 652.852d quarter 2,177 884.74 1,300 1,066.52 0 -- 877 615.173d quarter 2,081 744.10 944 911.29 36 520.16 1,101 608.164th quarter 2,157 702.40 1,183 825.66 0 -- 974 552.83
2005 total 9,523 769.70 5,323 896.56 36 520.16 4,164 609.71
a Great Falls Customs District includes all ports in Montana and Idaho.
Source: U.S. Department of Commerce.

121
Table 67—Volume and average value of hardwood lumber exports from Seattle,
Columbia-Snake, Anchorage, and San Francisco Customs Districts, 1994-2005
(Volume in thousand board feet; value in thousands of dollars)
Seattle
Customs District
Columbia-Snake
Customs District
Anchorage
Customs District
San Francisco
Customs District
Year and
quarter Volume
Average
value Volume
Average
value Volume
Average
value Volume
Average
value
To All Countr ies
1994 84,835 1,216.99 32,132 1,371.44 11 1,133.14 14,053 1,299.44
1995 93,216 1,174.13 27,333 1,316.39 0 -- 5,715 1,326.68
1996 106,015 1,212.20 29,067 1,252.99 0 -- 2,049 1,386.24
1997 107,322 1,174.36 31,172 1,269.97 0 -- 2,709 1,257.86
1998 63,018 1,080.08 21,992 1,073.06 27 1,362.09 4,158 1,414.48
1999 90,968 1,082.53 26,635 1,119.37 51 1,201.04 2,791 1,424.17
2000 101,053 1,055.81 21,203 1,019.87 0 -- 3,714 1,383.54
2001 86,789 968.17 26,807 1,040.45 0 -- 2,112 1,524.31
2002 105,556 934.43 26,670 855.97 24 2,665.93 2,444 1,542.09
2003 105,445 954.39 28,547 851.74 181 1,688.60 5,705 1,477.02
2004 116,014 939.45 28,368 822.51 193 717.49 2,000 1,908.81
2005:
1st quarter 34,319 957.89 5,298 828.99 8 8,719.61 363 2,381.84
2d quarter 38,286 1,046.86 8,513 932.34 103 3,053.03 430 2,635.00
3d quarter 31,050 987.64 5,472 872.73 24 21,400.73 1,130 1,181.20
4th quarter 27,887 967.81 5,943 894.33 40 23,433.86 1,272 1,175.68
2005 total 131,542 992.91 25,226 888.75 176 10,493.72 3,195 1,511.17
To Japan
1994 33,259 1,420.67 10,152 1,413.42 0 -- 4,046 1,480.97
1995 38,123 1,456.84 8,953 1,378.98 0 -- 2,239 1,360.88
1996 34,415 1,477.41 9,504 1,387.38 0 -- 938 1,315.57
1997 34,630 1,387.85 8,192 1,416.19 0 -- 1,319 1,399.16
1998 15,051 1,334.98 5,064 1,132.25 0 -- 1,080 1,514.01
1999 16,479 1,334.22 4,355 1,323.06 25 864.12 683 1,423.07
2000 14,578 1,305,57 2,872 1,409.66 0 -- 1,292 1,352.31
2001 15,445 1,204.73 4,401 1,153.21 0 -- 455 1,900.21
2002 15,272 1,056.41 1,239 1,317.87 24 2,665.93 551 2,228.55
2003 9,413 1,347.55 800 1,582.53 132 2,066.84 4,250 1,328.92
2004 10,363 1,338.46 859 1,664.76 193 717.49 390 2,464.65
2005:
1st quarter 3,269 1,372.81 47 2,047.17 8 8,719.61 122 3,882.82
2d quarter 3,355 1,241.74 77 1,613.36 86 3,460.45 208 3,127.27
3d quarter 1,411 1,748.72 0 -- 24 21,400.73 85 3,035.89
4th quarter 1,337 1,725.45 10 1,657.54 40 23,433.86 221 2,455.34
2005 total 9,372 1,432.77 133 1,768.07 158 11,536.27 637 3,027.02
To People’s Republic of China
1994 203 724.14 0 -- 0 -- 92 1,206.52
1995 1,138 790.86 381 687.66 0 -- 0 --
1996 704 1,445.01 55 896.45 0 -- 49 1,204.08
1997 2,640 1,042.77 743 1,677.76 0 -- 90 1,283.48
1998 4,662 700.68 640 702.06 0 -- 41 1,408.03
1999 13,305 702.49 3,339 748.23 0 -- 39 1,496.78
2000 23,623 726.82 5,664 631.98 0 -- 141 1,881.80
2001 23,356 722.30 7,610 717.61 0 -- 131 1,498.34
2002 32,101 684.60 13,143 675.22 0 -- 302 832.87
2003 35,363 692.69 14,417 679.76 0 -- 206 1,142.51
2004 43,472 665.11 16,751 657.80 0 -- 236 1,929.80
2005:
1st quarter 13,768 725.53 3,313 740.85 0 -- 125 1,401.21
2d quarter 15,103 795.47 6,286 896.61 0 -- 61 1,973.72
3d quarter 13,364 782.86 4,342 818.63 0 -- 818 872.36
4th quarter 13,119 754.65 4,630 810.25 0 -- 901 860.94
2005 total 55,354 765.36 18,571 829.06 0 -- 1,905 937.08
Source: U.S. Department of Commerce.

122
Table 68—Volume of lumber exports from British Columbia ports by species and destination,
1995-2005
(In thousand board feet)
YearTotal,
all speciesDouglas-
fir Hem-fir Cedars SpruceOther
softwoods
To All Countries
1995 12,500,939 830,686 1,984,977 1,181,420 105,851 8,398,0051996 12,256,620 801,192 1,863,155 1,141,084 106,854 8,344,3351997 11,516,058 747,305 1,731,186 969,891 93,266 7,974,4101998 10,699,390 848,775 1,461,984 783,467 51,253 7,553,9111999 10,896,046 905,239 1,478,558 753,819 64,930 7,693,5002000 10,920,898 1,025,082 1,323,279 1,011,484 53,631 7,507,4222001 11,216,905 859,790 1,209,516 921,139 64,886 8,161,5742002 11,995,659 846,587 1,049,543 891,409 38,636 9,169,4842003 12,375,244 781,128 1,063,829 785,179 44,229 9,700,8792004 13,755,601 1,044,341 1,218,119 903,130 31,177 10,558,8342005 14,238,972 861,183 1,252,424 887,019 32,310 11,206,036
To Japan
1995 2,420,462 320,540 1,078,768 175,070 97,437 748,6471996 2,616,214 435,525 977,918 198,872 98,232 905,6671997 2,130,206 354,049 832,481 188,103 86,169 669,4041998 1,575,471 343,745 561,473 118,118 47,409 504,7261999 1,795,303 373,161 617,881 101,618 60,023 642,6202000 1,904,164 442,334 615,091 131,272 48,821 666,6472001 1,577,689 291,417 495,500 110,964 60,167 619,6412002 1,515,500 318,703 403,887 100,731 34,177 658,0022003 1,446,886 275,597 363,806 104,697 35,206 667,5802004 1,666,167 340,037 444,470 105,038 23,413 753,2092005 1,360,769 251,079 329,831 90,783 22,803 666,273
To United States a
1995 9,465,010 388,109 702,895 900,668 5,773 7,467,5661996 9,148,980 261,063 704,737 844,579 6,643 7,331,9581997 8,863,227 263,282 742,535 681,492 5,910 7,170,0081998 8,743,274 416,637 782,098 579,870 3,237 6,961,4321999 8,659,092 425,062 717,046 563,981 2,097 6,950,9062000 8,508,678 454,021 548,691 772,799 3,527 6,729,6402001 9,225,342 468,626 575,162 731,885 2,840 7,446,8292002 9,939,938 383,029 483,165 695,993 803 8,376,9482003 10,258,496 355,059 492,107 574,501 2,074 8,834,7552004 11,386,786 568,916 539,938 669,446 3,474 9,605,0122005 12,265,247 492,402 720,961 674,482 3,453 10,373,949
To People’s Republic of China
1995 17,508 1,471 8,543 399 0 7,0961996 18,964 1,433 13,251 158 34 4,0881997 8,267 130 6,936 16 48 1,1371998 8,667 638 5,199 26 76 2,7281999 10,017 365 3,764 136 139 5,6132000 22,376 3,051 9,754 1,622 403 7,5462001 38,187 4,185 20,488 3,680 850 8,9842002 60,032 4,701 31,978 6,275 1,868 15,2102003 85,930 11,820 33,695 13,680 2,539 24,1962004 108,924 7,164 49,475 21,245 1,635 29,4052005 106,596 6,417 54,965 22,471 2,687 20,056
a Figures do not include shipments of railroad crossties. Source: Statistics Canada, Vancouver, B.C., "Canadian Exports Cleared Through B.C. Custom Ports.
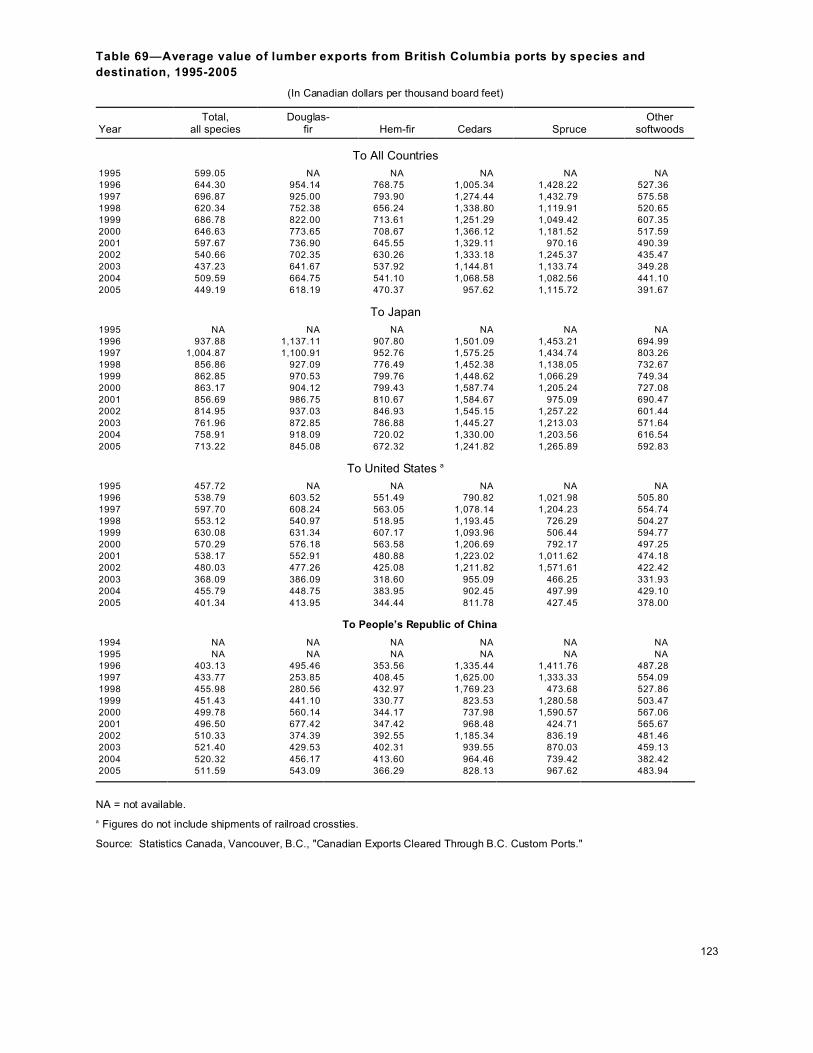
123
Table 69—Average value of lumber exports from British Columbia ports by species and
destination, 1995-2005
(In Canadian dollars per thousand board feet)
YearTotal,
all speciesDouglas-
fir Hem-fir Cedars SpruceOther
softwoods
To All Countries
1995 599.05 NA NA NA NA NA
1996 644.30 954.14 768.75 1,005.34 1,428.22 527.36
1997 696.87 925.00 793.90 1,274.44 1,432.79 575.58
1998 620.34 752.38 656.24 1,338.80 1,119.91 520.65
1999 686.78 822.00 713.61 1,251.29 1,049.42 607.35
2000 646.63 773.65 708.67 1,366.12 1,181.52 517.59
2001 597.67 736.90 645.55 1,329.11 970.16 490.39
2002 540.66 702.35 630.26 1,333.18 1,245.37 435.47
2003 437.23 641.67 537.92 1,144.81 1,133.74 349.28
2004 509.59 664.75 541.10 1,068.58 1,082.56 441.10
2005 449.19 618.19 470.37 957.62 1,115.72 391.67
To Japan
1995 NA NA NA NA NA NA
1996 937.88 1,137.11 907.80 1,501.09 1,453.21 694.99
1997 1,004.87 1,100.91 952.76 1,575.25 1,434.74 803.26
1998 856.86 927.09 776.49 1,452.38 1,138.05 732.67
1999 862.85 970.53 799.76 1,448.62 1,066.29 749.34
2000 863.17 904.12 799.43 1,587.74 1,205.24 727.08
2001 856.69 986.75 810.67 1,584.67 975.09 690.47
2002 814.95 937.03 846.93 1,545.15 1,257.22 601.44
2003 761.96 872.85 786.88 1,445.27 1,213.03 571.64
2004 758.91 918.09 720.02 1,330.00 1,203.56 616.54
2005 713.22 845.08 672.32 1,241.82 1,265.89 592.83
To United States a
1995 457.72 NA NA NA NA NA
1996 538.79 603.52 551.49 790.82 1,021.98 505.80
1997 597.70 608.24 563.05 1,078.14 1,204.23 554.74
1998 553.12 540.97 518.95 1,193.45 726.29 504.27
1999 630.08 631.34 607.17 1,093.96 506.44 594.77
2000 570.29 576.18 563.58 1,206.69 792.17 497.25
2001 538.17 552.91 480.88 1,223.02 1,011.62 474.18
2002 480.03 477.26 425.08 1,211.82 1,571.61 422.42
2003 368.09 386.09 318.60 955.09 466.25 331.93
2004 455.79 448.75 383.95 902.45 497.99 429.10
2005 401.34 413.95 344.44 811.78 427.45 378.00
To People’s Republic of China
1994 NA NA NA NA NA NA
1995 NA NA NA NA NA NA
1996 403.13 495.46 353.56 1,335.44 1,411.76 487.28
1997 433.77 253.85 408.45 1,625.00 1,333.33 554.09
1998 455.98 280.56 432.97 1,769.23 473.68 527.86
1999 451.43 441.10 330.77 823.53 1,280.58 503.47
2000 499.78 560.14 344.17 737.98 1,590.57 567.06
2001 496.50 677.42 347.42 968.48 424.71 565.67
2002 510.33 374.39 392.55 1,185.34 836.19 481.46
2003 521.40 429.53 402.31 939.55 870.03 459.13
2004 520.32 456.17 413.60 964.46 739.42 382.42
2005 511.59 543.09 366.29 828.13 967.62 483.94
NA = not available.
a Figures do not include shipments of railroad crossties.
Source: Statistics Canada, Vancouver, B.C., "Canadian Exports Cleared Through B.C. Custom Ports."

124
Table 70—Volume of all species of softwood lumber imports into the Seattle Customs
District, 1995-2005
(Volume in thousand board feet, Scribner scale)
Countries of origin
Year andquarter
Allcountries Canada Chile Germany
NewZealand Russia Uruguay
1995 3,871,772 3,850,896 19,367 0 839 35 NA1996 3,803,422 3,783,666 18,255 0 230 84 211997 3,392,218 3,366,792 18,282 0 699 163 1,3261998 3,050,317 3,035,612 11,319 0 604 407 1,4991999 3,246,662 3,198,835 17,066 0 2,458 2,725 3,2542000 3,213,148 3,177,351 23,385 0 3,928 3,547 1,3512001 3,745,653 3,730,488 6,736 0 4,589 1,593 7312002 3,594,476 3,583,615 5,551 15 2,809 1,294 2792003 3,930,411 3,919,095 4,657 261 2,122 2,763 8092004:
1st quarter 996,279 993,358 1,082 172 882 263 4932d quarter 1,210,747 1,199,986 3,854 61 6,286 557 3083d quarter 1,261,101 1,241,636 9,428 262 8,460 515 4314th quarter 1,116,951 1,104,547 6,090 61 4,837 536 407
2004 total 4,585,078 4,539,547 20,453 556 20,466 1,870 1,640 2005:
1st quarter 1,186,048 1,175,171 6,965 0 2,604 544 4362d quarter 1,386,620 1,371,967 9,178 28 3,444 944 2503d quarter 1,360,650 1,344,089 9,164 0 5,682 744 3544th quarter 1,261,255 1,246,359 7,375 0 4,498 1,035 312
2005 total 5,194,572 5,137,586 32,682 28 16,228 3,268 1,353
NA = not available.
Source: U.S. Department of Commerce.

125
Table 71—Average value of all species of softwood lumber imports into the Seattle Customs
District, 1995-2005
(Value in dollars per thousand board feet)
Countries of origin
Year andquarter
Allcountries Canada Chile Germany
NewZealand Russia Uruguay
1995 329.76 326.99 816.44 -- 1,156.14 885.71 NA1996 376.33 373.77 852.49 -- 1,352.17 940.48 683.981997 426.33 424.01 813.92 -- 1,001.67 792.03 496.191998 352.24 350.44 738.05 -- 943.97 901.68 430.371999 411.43 412.54 638.18 -- 635.25 591.91 390.582000 395.23 393.90 475.61 -- 836.82 462.26 361.872001 350.52 349.13 524.62 -- 1,069.82 502.85 374.402002 325.48 324.31 679.19 439.77 944.07 479.15 480.552003 267.51 266.66 640.73 784.00 598.26 419.12 460.602004:
1st quarter 312.73 311.78 573.82 574.13 839.43 611.64 433.992d quarter 368.02 364.33 587.71 554.48 884.62 453.40 549.393d quarter 384.70 377.35 881.89 646.03 856.89 398.46 864.834th quarter 335.22 328.54 894.96 898.67 1,030.42 377.36 951.63
2004 average 352.61 347.68 814.09 641.46 905.67 438.72 697.50 2005:
1st quarter 358.82 353.70 788.63 -- 1,331.95 419.72 1,005.242d quarter 346.56 341.03 704.94 1,217.15 1,461.49 461.38 698.743d quarter 311.81 305.49 671.34 -- 1,145.16 443.73 709.034th quarter 318.87 313.40 758.83 -- 954.09 440.35 733.26
2005 average 333.54 327.93 725.51 1,217.15 1,189.30 443.76 808.27
NA = not available.
Source: U.S. Department of Commerce.

126
Table 72—Volume of all species of softwood lumber imports into the Columbia-Snake Customs
District, 1995-2005
(Volume in thousand board feet, Scribner scale)
Countries of origin
Year and quarter
Allcountries Argentina Brazil Canada Chile Malaysia
NewZealand Russia
1995 45,075 NA 13,792 1,953 1,250 0 27,103 171996 43,438 37 9,359 0 659 0 29,970 01997 64,478 198 5,503 366 12,395 0 41,445 01998 89,300 0 3,789 2,469 28,907 0 52,475 01999 130,253 22 15,925 1,662 41,354 28 70,085 02000 112,464 405 7,448 2,180 48,569 120 51,398 532001 125,108 0 3,067 17 46,550 148 73,897 1282002 163,874 418 4,412 0 73,136 6 83,824 6852003 166,063 319 1,891 0 71,951 2 89,750 1,6422004:
1st quarter 31,416 57 272 0 16,655 0 13,998 4162d quarter 31,149 0 366 0 15,307 0 14,519 6193d quarter 30,307 0 334 0 10,182 0 19,042 7144th quarter 31,655 13 375 0 5,036 0 25,799 415
2004 total 124,527 70 1,348 0 47,180 0 73,358 2,164 2005
1st quarter 19,838 0 285 0 896 0 18,440 1742d quarter 26,555 0 198 5,764 654 0 19,167 7723d quarter 16,101 0 833 0 1,051 0 12,726 1,3394th quarter 18,335 0 253 0 1,266 0 14,828 546
2005 total 80,828 0 1,570 5,764 3,867 0 65,160 2,830
NA = not available.
Source: U.S. Department of Commerce.

127
Table 73—Average value of all species of softwood lumber imports into the Columbia-Snake
Customs District, 1995-2005
(Value in dollars per thousand board feet)
Countries of origin
Year and quarter
Allcountries Argentina Brazil Canada Chile Malaysia
NewZealand Russia
1995 882.48 NA 889.65 321.56 1,888.97 -- 868.48 705.881996 742.56 1,024.65 839.52 -- 1,641.08 -- 709.58 --1997 826.50 740.36 906.97 400.71 943.35 -- 789.19 --1998 708.72 -- 796.88 307.35 758.92 -- 691.26 --1999 647.57 763.13 660.15 333.47 725.65 1,258.01 603.02 --2000 565.05 519.36 478.02 128.37 621.84 2,242.09 534.83 353.122001 567.50 -- 491.24 1,506.51 565.30 2,356.76 567.87 482.302002 652.45 593.36 459.91 -- 602.81 2,009.45 705.06 790.002003 586.64 396.80 438.77 -- 543.77 1,790.77 618.08 901.682004:
1st quarter 686.46 203.22 488.42 -- 595.93 -- 785.26 1,182.532d quarter 806.57 -- 509.83 -- 708.16 -- 919.22 966.153d quarter 904.82 -- 573.90 -- 927.75 -- 889.11 1,150.814th quarter 895.94 316.00 691.68 -- 916.21 -- 892.79 1,059.32
2004average 822.90 223.80 572.05 -- 738.14 -- 876.55 1,086.58
2005:
1st quarter 790.05 -- 427.77 -- 805.25 -- 791.20 1,112.502d quarter 646.53 -- 678.55 300.52 755.67 -- 726.15 1,152.933d quarter 758.08 -- 598.91 -- 690.13 -- 724.67 1,252.244th quarter 664.61 -- 572.92 -- 741.21 -- 670.05 1,288.91
2005average
708.08 -- 573.69 300.52 744.61 -- 731.50 1,223.66
NA = not available.
Source: U.S. Department of Commerce.

128
Table 74—Volume and average value of plywood exports from Seattle and Columbia-Snake
Customs Districts by destination, 1994-2005
(Volume in thousand square feet; value in dollars per thousand square feet)
From bothcustoms districts
From SeattleCustoms District
From Columbia-SnakeCustoms District
Softwood3/8-inch
basis
Hardwood3/8-inch
basis
Softwood3/8-inch
basis
Hardwood3/8-inch
basis
Softwood3/8-inch
basis
Hardwood3/8-inch
basis
Year andquarter Volume
Averagevalue Volume
Averagevalue Volume
Averagevalue Volume
Averagevalue Volume
Averagevalue Volume
Averagevalue
To All Countr ies
1994 102,369 278.81 33,481 332.96 32,612 262.88 31,986 330.96 69,757 286.27 1,495 375.921995 107,205 275.89 51,540 314.59 57,437 246.41 49,754 316.05 49,768 309.92 1,786 273.801996 114,058 240.04 50,407 286.43 76,352 221.54 47,189 288.48 37,706 277.49 3,219 256.291997 102,496 251.05 48,400 320.29 62,832 245.33 43,373 320.44 39,663 260.13 5,117 313.391998 43,805 279.43 29,367 358.35 24,661 283.53 28,793 358.18 19,144 274.14 574 367.061999 39,698 301.39 23,570 432.00 27,159 308.25 23,235 431.93 12,539 286.53 335 436.902000 39,587 325.48 25,455 453.49 28,402 337.76 25,324 451.16 11,185 289.20 131 904.712001 31,101 342.72 22,593 435.37 22,881 329.88 22,227 438.43 8,219 378.47 366 249.242002 30,637 298.52 5,282 454.34 24,922 290.87 5,282 454.35 5,715 331.87 0 --2003 29,415 314.22 466 418.34 23,610 312.73 486 418.34 5,806 320.04 0 --2004 36,565 332.34 445 262.14 33,436 322.79 446 262.14 3,129 434.44 0 --2005:
1st quarter 7,983 295.10 592 246.22 7,603 288.79 592 246.22 380 421.43 0 --2d quarter 9,020 336.94 314 332.76 8,114 318.01 314 332.76 906 506.46 0 --3d quarter 10,493 328.84 445 600.00 7,716 338.29 445 600.00 2,777 302.59 0 --4th quarter 7,962 326.26 107 755.62 7,625 317.36 73 831.22 337 527.75 34 584.13
2005 total 35,459 322.73 1,459 410.06 31,059 315.74 1,425 405.99 4,400 372.06 34 584.13
To Japan
1994 7,405 316.68 1,813 387.76 3,210 321.50 1,398 359.80 4,195 312.99 415 481.931995 9,194 295.74 3,077 547.61 3,621 265.95 2,331 631.06 5,573 315.09 746 286.861996 22,484 249.60 1,590 522.64 16,218 251.59 571 968.48 6,266 244.50 1,019 272.821997 14,712 292.81 4,045 426.51 12,608 289.14 1,887 468.16 2,104 314.77 2,159 390.011998 1,905 337.85 1,746 486.39 1,078 318.35 1,356 512.18 827 363.27 390 396.691999 7,462 236.58 489 417.97 5,098 235.76 338 406.42 2,364 238.33 151 443.812000 5,924 419.00 376 510.05 2,751 540.52 258 326.70 3,173 313.57 118 910.922001 4,141 502.65 544 329.94 1,650 473.47 221 436.93 2,492 521.82 323 255.972002 1,407 436.18 44 102.34 501 380.01 44 102.34 906 467.31 0 --2003 1,169 530.39 0 -- 130 848.88 0 -- 1,038 490.86 0 --2004 359 489.97 0 -- 112 570.20 0 -- 247 453.06 0 --2005:
1st quarter 5 4,902.68 490 213.37 5 4,902.68 490 213.37 0 -- 0 --2d quarter 33 713.83 0 -- 2 4,446.24 0 -- 31 437.35 0 --3d quarter 107 661.90 6 477.90 87 721.07 6 477.90 20 408.77 0 --4th quarter 1 3,843.55 0 -- 1 3,843.55 0 -- 0 -- 0 --
2005 total 146 829.73 496 216.38 95 1,046.06 496 216.38 51 425.92 0 --
To W estern Europe
1994 59,905 293.00 185 1,216.22 3,967 410.13 138 1,239.13 55,938 284.69 47 1,148.941995 40,772 319.14 236 394.07 4,618 414.03 203 413.79 36,154 307.02 33 272.731996 33,358 270.16 877 256.56 9,477 256.09 0 -- 23,881 275.74 877 256.561997 28,369 269.88 1,856 310.53 3,751 388.33 596 243.08 24,617 251.83 1,261 342.251998 12,475 293.05 219 245.38 3,299 380.61 171 227.36 9 261.57 49 308.711999 6,477 296.13 15 1,133.62 1,520 466.51 15 1,133.62 4,957 243.91 0 --2000 5,874 270.45 0 -- 1,345 380.99 0 -- 4,529 237.66 0 --2001 1,878 428.06 102 598.77 371 996.30 102 598.77 1,507 288.35 0 --2002 2,898 353.73 102 598.77 524 914.47 102 598.77 2,373 229.96 0 --2003 694 460.21 0 -- 228 911.65 0 -- 466 239.08 0 --2004 694 483.83 0 -- 270 751.09 0 -- 424 236.56 0 --2005:
1st quarter 0 -- 0 -- 0 -- 0 -- 0 -- 0 --2d quarter 95 1,161.26 0 -- 95 1,161.26 0 -- 0 -- 0 --3d quarter 2,132 297.28 288 632.34 0 -- 288 632.34 2,132 297.28 0 --4th quarter 0 -- 73 831.22 0 -- 73 831.22 0 -- 0 --
2005 total 2,227 319.11 362 672.74 95 1,161.26 362 672.74 2,132 297.28 0 --
Source: U.S. Department of Commerce. Columbia-Snake Customs District includes all Oregon ports plus Longview and Vancouver, Washington. Seattle Customs District includes all coastal and inland ports in the State of Washington, except Longview and Vancouver.

129
Table 75—Volume and average value of plywood exports from California, 1994-2005a
(Volume in thousand square feet; value in dollars per thousand square feet)
All C alifo rnia No rthe rn C alifo rnia So uthern Ca liforn ia
All
Plywood
Softwood3/8-inch
basis
Hardwood
surface
m eas ure
Softwood
3/8-inch
basis
Hardwood
surface
m eas ure
Year and
quarter V olu m e
Average
value V olu m e
Average
value V olu m e
Average
value V olu m e
Average
value V olu m e
Average
value
1994 89,402 202.69 1,223 375.31 49 408.16 65,046 178.18 23,084 262.17
1995 49,444 288.57 581 294.32 781 304.74 30,902 277.52 17,180 307.51
1996 82,880 217.46 1,626 249.69 1,041 208.45 53,155 196.18 27,058 257.67
1997 90,535 211.92 888 370.39 201 231.10 64,639 181.88 24,807 284.37
1998 82,031 247.48 1,444 278.24 283 810.35 54,539 197.56 25,765 345.25
1999 110,579 264.22 4,994 253.83 350 286.53 63,980 228.97 41,254 319.94
2000 134,302 296.36 5,716 247.25 181 333.44 92,053 294.20 36,351 309.36
2001 130,286 240.10 920 310.58 107 165.73 97,660 222.76 31,599 291.91
2002 83,963 242.28 331 481.75 0 -- 76,207 234.95 7,425 306.77
2003 89,166 207.36 458 558.18 47 251.57 85,016 202.82 3,645 268.69
2004:
1st quarter 19,815 277.90 128 1,770.81 0 -- 18,745 266.89 942 294.23
2d quarter 17,101 296.96 84 611.34 0 -- 16,033 294.46 984 310.81
3d quarter 17,453 270.84 159 493.43 0 -- 15,243 271.32 2,051 249.98
4th quarter 15,890 267.62 259 253.56 0 -- 13,968 269.76 1,663 251.90
2004 total 70,260 278.45 629 669.62 0 -- 63,989 275.48 5,641 268.55
2005:
1st quarter 15,498 277.56 124 749.65 0 -- 14,575 270.12 799 272.04
2d quarter 15,958 279.36 6 833.49 0 -- 14,573 273.04 1,379 344.02
3d quarter 17,703 277.23 15 3,284.71 130 219.91 15,947 265.09 1,611 374.60
4th quarter 15,342 280.85 16 2,079.50 98 156.66 13,922 268.71 1,306 397.65
2005 total 64,501 278.69 160 1,115.80 228 192.67 59,017 269.15 5,095 356.16
a No rthern Ca lifornia is the San Fra ncisc o C usto m s D istrict and includ es a ll coas tal and inland ports fro m Mon terey no rth.
So uthe rn C alifornia con sists o f the S an D iego and Los Angele s C usto m s D istricts an d inclu des all ports s outh of Mo ntere y.
Source: U.S. Department of Comm erce.

130
Table 76—Volume and average value of veneer exports from Seattle and Columbia-Snake Customs
Districts by destination, 1994-2005
(Vo lum e in tho usa nd s qua re feet; v alue in dolla rs pe r thous and squ are fee t)
From both
customs districts
Fro m Se attle
Customs D istrict
From Columbia-Snake
Customs D istrict
Softwood
surface
m eas ure
Hardwood
surface
m easure
Softwoodsurface
m eas ure
Hardwood
surface
m eas ure
Softwood
surface
m eas ure
Hardwood
surface
m eas ure
Year and
quarter V olu m e
Average
value V olu m e
Average
value V olu m e
Average
value V olu m e
Average
value V olu m e
Average
value V olu m e
Average
value
To All Countries
1994 117,830 147.54 302,401 99.62 80,330 113.53 276,805 99.42 37,500 220.40 25,596 101.70
1995 108,048 153.07 160,438 109.38 77,668 124.71 150,514 107.39 30,380 225.54 9,924 139.56
1996 111,737 151.32 149,396 129.87 83,803 126.69 129,311 132.15 27,934 225.17 20,085 115.21
1997 154,909 89.94 163,193 143.96 151,374 86.67 147,043 145.53 3,536 229.89 16,150 129.67
1998 139,313 70.35 95,541 137.95 136,135 67.34 85,665 138.10 3,178 199.08 9,876 136.65
1999 137,092 86.69 98,520 140.70 135,484 83.23 81,065 141.07 1,608 378.05 17,455 138.99
2000 134,179 99.22 121,051 125.37 131,038 96.35 116,295 126.06 3,141 218.69 4,756 108.42
2001 91,920 123.04 130,900 128.93 82,031 116.83 128,382 127.21 9,878 174.76 2,517 216.52
2002 63,427 163.92 235,368 115.22 59,461 157.42 233,939 114.83 3,965 261.38 1,429 180.10
2003 80,738 158.24 145,927 118.21 78,888 158.68 134,763 119.29 1,850 139.49 11,164 105.22
2004 160,833 95.25 233,097 154.27 160,222 94.96 232,899 154.40 611 170.78 198 135.00
2005:
1st quarter 45,968 76.75 40,657 124.27 44,679 73.15 40,477 124.11 1,289 201.46 180 159.82
2d quarter 36,479 81.75 40,764 128.23 36,136 79.60 40,764 128.23 343 308.25 0 --
3d quarter 37,720 73.84 27,692 131.54 37,720 73.84 27,692 131.54 0 -- 0 --
4th quarter 34,450 80.27 33,979 126.75 33,608 77.38 33,979 126.75 842 195.51 0 --
2005 total 154,617 78.00 143,093 127.39 152,143 75.79 142,913 127.35 2,474 214.25 180 159.82
To Japan
1994 106,489 147.97 113,772 75.71 68,989 108.60 104,030 73.07 37,500 220.40 9,742 103.98
1995 91,833 141.66 59,448 91.31 62,025 101.83 56,664 88.05 29,808 224.54 2,784 157.33
1996 94,020 131.85 13,380 125.19 66,476 93.31 5,733 123.32 27,544 224.84 7,647 126.59
1997 60,271 93.48 22,327 161.07 57,325 86.12 16,600 162.85 2,946 236.73 5,727 155.91
1998 17,736 78.08 13,726 149.14 16,595 67.25 8,891 169.88 1,141 235.77 4,835 111.00
1999 16,448 101.99 29,529 141.42 16,032 97.63 15,766 171.42 415 269.98 13,763 107.06
2000 14,605 87.92 28,435 105.48 12,313 75.79 26,588 104.56 2,293 153.07 1,847 118.77
2001 3,668 110.15 8,759 130.00 1,334 77.51 8,759 130.00 2,333 128.82 0 --
2002 1,187 171.02 11,576 89.43 323 278.69 10,935 88.46 864 130.77 640 106.18
2003 1,398 92.10 13,648 121.03 0 -- 7,771 128.26 1,398 92.10 5,877 111.48
2004 0 -- 20,193 105.97 0 -- 20,193 105.97 0 -- 0 --
2005:
1st quarter 0 -- 9,078 176.66 0 -- 9,078 176.66 0 -- 0 --
2d quarter 9 684.54 11,762 124.39 9 684.54 11,762 124.39 0 -- 0 --
3d quarter 0 -- 1,702 182.90 0 -- 1,702 182.90 0 -- 0 --
4th quarter 0 -- 1,671 130.43 0 -- 1,671 130.43 0 -- 0 --
2005 total 9 684.54 24,214 148.52 9 684.54 24,214 148.52 0 -- 0 --
To Western Europe
1994 30 700.00 4,093 116.78 30 700.00 2,354 116.40 0 -- 1,739 117.31
1995 235 255.32 3,197 151.70 235 255.32 1,250 180.80 0 -- 1,947 133.03
1996 2,088 238.51 3,280 137.80 1,971 236.94 2,635 143.83 117 264.96 645 114.73
1997 1,531 169.97 13,544 131.71 1,162 162.26 12,914 131.38 370 193.61 630 138.62
1998 400 224.50 2,828 111.82 400 224.50 2,828 111.82 0 -- 0 --
1999 304 222.51 5,119 140.19 0 -- 5,119 140.19 304 222.51 0 --
2000 1,725 184.71 477 282.36 1,725 184.71 477 22.36 0 -- 0 --
2001 1,340 215.85 1,125 225.86 1,340 215.85 1,125 225.86 0 -- 0 --
2002 0 -- 564 121.84 0 -- 564 121.81 0 -- 0 --
2003 1,409 250.59 291 111.48 1,409 250.59 0 -- 0 -- 291 111.48
2004 4,691 198.20 0 -- 4,086 203.57 0 -- 605 161.86 0 --
2005:
1st quarter 1,691 219.78 0 -- 402 278.70 0 -- 1,289 201.46 0 --
2d quarter 562 296.92 504 210.82 219 278.70 504 210.82 343 308.25 0 --
3d quarter 0 -- 0 -- 0 -- 0 -- 0 -- 0 --
4th quarter 1,220 210.92 0 -- 449 250.59 0 -- 771 187.88 0 --
2005 total 3,473 229.13 504 210.82 1,070 266.91 504 210.82 2,403 212.35 0 --
Source: U.S. Department of Comm erce. Columbia-Snake Customs District includes all Oregon ports plus Longview and Vancouver, Washington. Seattle Customs
Dis trict includ es a ll coas tal and inland ports in the S tate of W ash ington , exce pt Longv iew a nd V anc ouv er.

Ta
ble
77
—V
olu
me
of
tim
be
r s
old
on
pu
bli
cly
ow
ne
d o
r m
an
ag
ed
la
nd
s,
Mo
nta
na
an
d I
da
ho
, 2
00
0-2
00
5
(In
th
ou
sa
nd
bo
ard
fe
et,
Scri
bn
er
sca
le)
20
04
20
05
Ag
en
cy
20
00
20
01
20
02
20
03
To
tal
4th
qtr
.1
st
qtr
. 2
d q
tr.
3d
qtr
.4
th q
tr.
To
tal
Mo
nta
na
:U
SD
A F
ore
st S
erv
ice
a7
2,5
46
17
6,1
59
13
2,4
34
57
,69
91
26
,45
04
2,2
81
81
,65
12
7,4
15
57
,03
53
2,7
91
19
8,8
92
U.S
. B
ur.
of
La
nd
Ma
na
ge
.b4
63
7,6
44
2,0
78
5,1
03
10
,45
41
,21
0N
AN
AN
AN
AN
AS
tate
of
Mo
nta
na
NA
34
,01
13
6,1
40
39
,78
54
8,3
46
11
,39
61
3,1
45
17
,85
61
5,8
94
7,7
81
54
,67
3
To
tal
NA
21
7,8
14
17
0,6
52
10
2,5
87
18
5,2
50
54
,88
7N
AN
AN
AN
AN
A Id
ah
o:
US
DA
Fo
rest S
erv
ice
a7
3,2
23
17
0,4
77
10
2,1
18
11
8,6
27
83
,48
23
8,4
97
2,3
49
7,5
85
8,6
93
6,1
39
24
,76
5U
.S.
Bu
r. o
f L
an
d M
ana
ge
.b2
,58
86
,24
58
,07
85
,33
11
0,6
92
8,4
96
NA
NA
NA
NA
NA
Sta
te o
f Id
ah
o3
18
,28
23
07
,31
52
93
,82
33
92
,66
33
21
,98
42
9,5
45
22
,69
31
09
,89
31
45
,78
01
36
,33
64
14
,70
2
To
tal
39
4,0
93
48
4,0
37
40
4,0
19
51
6,6
21
41
6,1
58
76
,53
8N
AN
AN
AN
AN
A A
ll p
ub
lic la
nd
s:
US
DA
Fo
rest S
erv
ice
a1
45
,76
93
46
,63
62
34
,55
21
76
,32
62
09
,93
28
0,7
79
84
,00
03
5,0
00
65
,72
83
8,9
30
22
3,6
57
U.S
. B
ur.
of
La
nd
Ma
na
ge
.b3
,05
01
3,8
89
10
,15
61
0,4
34
21
,14
69
,70
6N
AN
AN
AN
AN
AS
tate
of
Mo
nta
na
NA
34
,01
13
6,1
40
39
,78
54
8,3
46
11
,39
61
3,1
45
17
,85
61
5,8
94
7,7
81
54
,67
3S
tate
of
Ida
ho
31
8,2
82
30
7,3
15
29
3,8
23
39
2,6
63
32
1,9
84
29
,54
52
2,6
93
10
9,8
93
14
5,7
80
13
6,3
36
41
4,7
02
T
ota
lN
A7
01
,85
15
74
,67
16
19
,20
86
01
,40
81
31
,42
6N
AN
AN
AN
AN
A
No
te:
Th
e U
.S.
Bu
rea
u o
f In
dia
n A
ffa
irs la
nd
is n
ow
pri
va
tely
ow
ne
d a
nd
no
lon
ge
r m
an
ag
ed
by
the
BIA
. T
ha
t ca
teg
ory
ha
s b
ee
n d
rop
pe
d.
NA
= n
ot
ava
ilab
le.
a C
on
ve
rtib
le p
rod
ucts
on
ly.
b D
oe
s n
ot
inclu
de
cu
ll lo
g s
ale
s.
So
urc
e:
Re
sp
ectiv
e a
ge
ncie
s lis
ted.
131

Ta
ble
78
—A
ve
rag
e s
tum
pa
ge
pri
ce
s o
f ti
mb
er
so
ld o
n p
ub
lic
ly o
wn
ed
or
ma
na
ge
d l
an
ds
, M
on
tan
a a
nd
Id
ah
o,
20
00
-20
05
(In
dol
lars
pe
r th
ou
sa
nd
bo
ard
fe
et)
20
04
20
05
Ag
en
cy
20
00
20
01
20
02
20
03
Ave
rag
e4th
qtr
.1st
qtr
. 2
d q
tr.
3d q
tr.
4th
qtr
.A
ve
rag
e
Mo
nta
na
:U
SD
A F
ore
st
Serv
ice
a1
58
.71
10
1.2
65
6.2
25
8.9
61
24
.78
11
9.2
79
8.1
11
29
.77
95
.62
12
9.6
51
06
.96
U.S
. B
ure
au
of
La
nd
Man
ag
e.b
13
6.2
37
4.9
18
8.9
74
3.8
91
81
.16
22
2.9
6N
AN
AN
AN
AN
AS
tate
of
Mo
nta
na
NA
17
0.0
31
98
.78
17
4.2
32
81
.62
26
9.2
02
55
.62
24
6.3
82
98
.77
29
5.2
92
70
.79
A
ve
rag
eN
A1
11
.07
86
.81
10
2.9
11
68
.90
15
2.6
9N
AN
AN
AN
AN
A Id
ah
o:
US
DA
For
est
Serv
ice
a1
29
.56
10
3.0
07
6.9
71
18
.19
13
0.4
21
58
.53
49
.23
16
0.3
58
1.9
21
00
.91
10
7.5
4U
.S.
Bu
rea
u o
f L
an
d M
ana
ge
.b1
22
.83
76
.79
67
.28
36
.79
21
2.6
82
39
.32
NA
NA
NA
NA
NA
Sta
te o
f Id
ah
o1
50
.82
11
6.9
31
40
.18
78
.52
17
0.2
82
17
.59
22
3.4
22
27
.96
19
7.6
11
10
.83
17
8.5
4
Ave
rag
e1
46
.68
11
1.5
01
22
.75
87
.20
16
3.3
71
90
.30
NA
NA
NA
NA
NA
All
pub
lic lan
ds:
US
DA
For
est
Serv
ice
a1
44
.07
10
2.1
26
2.2
59
8.8
11
27
.02
13
7.9
89
6.7
51
36
.40
93
.81
12
5.1
21
07
.03
U.S
. B
ure
au
of
La
nd
Man
ag
e.b
12
4.8
67
5.7
57
1.7
24
0.2
61
97
.10
23
7.2
8N
AN
AN
AN
AN
AS
tate
of
Mo
nta
na
NA
17
0.0
31
98
.78
17
4.2
32
81
.62
26
9.2
02
55
.62
24
6.3
82
98
.77
29
5.2
92
70
.79
Sta
te o
f Id
ah
o1
50
.82
11
6.9
31
40
.18
78
.52
17
0.2
82
17
.59
22
3.4
22
27
.96
19
7.6
11
10
.83
17
8.5
4
Ave
rag
eN
A1
11
.37
11
2.0
88
9.8
01
65
.07
17
4.5
9N
AN
AN
AN
AN
A
No
te:
Th
e U
.S.
Bu
rea
u o
f In
dia
n A
ffa
irs la
nd
is n
ow
pri
va
tely
ow
ne
d a
nd
no
lon
ge
r m
an
ag
ed
by
the
BIA
. T
ha
t ca
teg
ory
ha
s b
ee
n d
rop
pe
d.
NA
= n
ot
ava
ilab
le.
a P
rice
s r
ece
ived
fo
r in
div
idu
al sa
les m
ay v
ary
sig
nifi
ca
ntly f
rom
th
e a
ve
rag
es s
how
n in
th
is t
ab
le b
ecau
se
of
diffe
ren
ce
s in
sp
ecie
s m
ix,
qu
alit
y,
roa
d c
osts
, lo
gg
ing
an
d p
roce
ssin
gco
sts
, siz
e a
nd
len
gth
of
sa
le, n
um
be
r o
f b
idde
rs,
an
d o
the
r re
late
d p
rice
de
term
ina
nts
. P
rice
s f
or
stu
mp
ag
e o
n N
atio
nal
Fo
rest
lan
ds a
re h
igh
bid
va
lue
. R
oa
d
co
sts
and
an
allo
wa
nce
for
sa
le-a
rea
be
tte
rme
nt a
re in
clu
ded
in
th
e b
id.
b D
oe
s n
ot
inclu
de
cu
ll lo
g p
rice
s.
So
urc
e:
Re
sp
ective
ag
en
cie
s li
ste
d.
132

Ta
ble
79
—V
olu
me
of
sa
wti
mb
er
so
ld o
n N
ati
on
al
Fo
res
ts b
y s
ele
cte
d s
pe
cie
s,
No
rth
ern
Re
gio
n,
19
95
-20
05
(In t
housa
nd b
oard
feet, S
crib
ner
scale
)
West
ern
Ye
ar
an
dD
ou
gla
s-
Po
nd
ero
sa
wh
iteL
od
ge
po
leE
ng
elm
an
West
ern
Tru
eA
ll
qu
art
er
fir
pin
ep
ine
pin
esp
ruce
he
mlo
ck
Cedars
La
rch
firs
sp
ecie
s
19
95
37
,18
52
,66
88
,63
44
5,9
24
22
,33
11
,14
81
,85
81
5,4
86
18
,05
71
64
,69
61
99
67
7,9
00
10
,28
91
0,4
22
87
,68
01
8,5
65
5,1
29
9,9
66
13
,07
06
7,0
62
31
7,2
11
19
97
62
,56
41
2,9
02
8,6
27
68
,77
77
,59
24
,43
56
,98
76
,12
23
5,3
81
23
3,6
90
19
98
56
,27
67
,46
01
,65
94
5,0
70
4,4
82
1,3
66
4,2
27
8,1
58
23
,87
91
72
,57
51
99
95
0,3
83
1,0
60
1,0
61
28
,75
51
,72
72
10
3,9
10
2,3
26
15
,45
21
47
,58
42
00
02
2,5
99
5,7
35
47
13
,86
07
,08
64
32
,07
31
,82
41
5,9
16
99
,54
72
00
18
8,3
66
88
51
,27
74
7,8
07
11
,45
81
,73
74
,71
01
2,6
50
27
,20
92
07
,21
72
00
26
6,8
32
7,0
99
30
32
7,8
30
10
,21
01
03
38
22
,30
89
,07
81
60
,99
42
00
32
0,8
70
10
,74
28
02
11
,16
03
,22
51
62
4,1
27
1,4
87
21
,31
51
09
,66
12
00
4:
1st
qu
arte
r1
,14
11
77
64
,50
02
,66
40
18
,66
91
2,7
32
34
,80
1
2
d q
uart
er
7,3
23
1,1
05
13
1,8
79
30
13
11
71
73
2,8
45
14
,08
7
3
d q
uart
er
27
,33
38
01
38
9,2
73
49
02
54
1,4
14
1,3
10
8,0
57
49
,19
0
4
th q
uart
er
23
,04
86
25
2,5
66
13
,19
31
,80
95
21
,24
13
,39
61
5,4
10
65
,63
6
2
00
4 to
tal
58
,84
51
,98
72
,72
32
8,8
45
5,2
64
30
92
,77
31
3,5
48
39
,04
41
63
,71
4 2
00
5:
1st
qu
arte
r3
3,0
03
01
,05
84
,16
91
9,3
89
23
23
11
,42
65
,25
87
6,5
61
2d
qua
rte
r1
0,7
90
59
27
1,8
10
5,0
72
10
52
2,8
82
63
82
5,5
67
3d
qua
rte
r1
9,0
38
7,6
14
17
,56
86
54
05
10
1,1
58
1,4
49
43
,58
0
4
th q
uart
er
16
,60
31
73
03
,91
26
14
11
51
11
1,7
17
1,7
41
26
,37
3
20
05
tota
l7
9,4
33
7,8
46
1,0
86
17
,45
82
5,7
29
14
86
96
17
,18
39
,08
61
72
,08
2
So
urc
e:
Fo
rest
Ser
vic
e,
U.S
. D
ep
art
me
nt
of
Ag
ricul
ture
. N
ort
hern
Re
gio
n in
clu
de
s M
on
tan
a,
no
rth
ea
ste
rn W
ash
ing
ton
, no
rth
ern
Id
aho
, N
ort
h D
ako
ta,
an
d n
orth
we
ste
rn
So
uth
Da
ko
ta.
133

Ta
ble
80
—A
ve
rag
e s
tum
pa
ge
pri
ce
s f
or
sa
wti
mb
er
so
ld o
n N
ati
on
al
Fo
res
ts b
y s
ele
cte
d s
pe
cie
s,
No
rth
ern
Re
gio
n,
19
95
-20
05
a
(In d
olla
rs p
er
thousa
nd b
oard
feet)
Ye
ar
an
dq
ua
rte
rD
ou
gla
s-
fir
Po
nd
ero
sa
pin
e
West
ern
wh
itep
ine
Lo
dg
ep
ole
pin
eE
ng
elm
an
nsp
ruce
West
ern
he
mlo
ck
Cedars
La
rch
Tru
efir
sA
llsp
ecie
s
19
95
24
4.4
12
65
.39
28
3.3
92
53
.14
31
3.3
72
25
.00
25
1.4
31
95
.44
19
4.0
22
40
.49
19
96
16
6.9
51
72
.15
22
8.9
62
26
.32
11
8.0
81
61
.75
26
2.6
91
96
.82
16
9.5
91
85
.83
19
97
20
7.1
11
88
.76
32
0.3
61
84
.07
29
6.6
01
88
.26
37
0.4
52
16
.28
22
5.7
82
07
.96
19
98
16
8.6
81
15
.50
24
6.9
22
01
.42
25
5.0
21
46
.04
29
0.1
01
15
.48
17
6.3
81
76
.51
19
99
20
3.1
81
73
.90
32
1.7
12
34
.61
19
4.5
92
34
.20
33
7.4
02
46
.43
27
7.4
52
12
.88
20
00
32
1.0
51
45
.85
29
8.1
01
99
.29
35
4.7
22
59
.65
30
9.0
32
50
.07
17
1.0
22
03
.85
20
01
11
7.9
01
76
.30
25
7.9
21
27
.51
13
4.4
21
45
.48
40
6.9
41
15
.21
13
2.0
01
31
.34
20
02
63
.08
34
.96
84
.33
70
.88
88
.81
14
8.8
41
40
.66
72
.14
59
.26
75
.21
20
03
13
4.1
83
6.3
61
85
.01
12
7.2
16
8.6
81
75
.36
28
1.9
01
68
.99
17
2.8
11
37
.31
20
04
:1
st
qu
art
er
16
6.8
32
23
.13
12
5.5
91
57
.50
26
8.0
1--
12
7.3
21
48
.34
14
.70
11
3.8
12
d q
ua
rte
r2
21
.40
86
.22
17
8.7
92
59
.95
37
1.8
64
11
.24
50
8.3
52
50
.78
24
1.5
72
22
.04
3d
qu
art
er
14
6.3
01
33
.95
16
5.5
91
65
.42
16
1.7
31
09
.78
18
0.9
12
29
.35
17
8.5
81
58
.60
4th
qu
art
er
18
7.2
61
69
.79
12
7.4
81
51
.36
93
.33
11
3.1
91
24
.96
10
4.2
71
57
.09
15
9.7
6
20
04
to
tal
17
2.0
91
26
.71
12
9.6
01
63
.91
20
4.0
51
13
.45
16
9.7
81
46
.44
12
1.2
51
55
.00
20
05
:1
st
qu
art
er
13
7.3
2--
81
.11
19
4.9
96
1.8
66
9.2
26
1.3
88
0.6
76
6.0
11
05
.37
2d
qu
art
er
17
4.4
01
24
.58
74
.88
21
0.5
21
74
.05
12
1.2
05
33
.11
12
3.0
91
03
.68
18
2.7
33
d q
ua
rte
r1
21
.28
16
9.6
72
39
.57
15
3.7
91
28
.75
--1
18
.81
83
.46
73
.51
13
6.6
34
th q
ua
rte
r1
85
.93
27
4.8
9--
16
0.5
02
38
.37
30
4.8
42
98
.04
15
6.7
72
03
.50
17
6.7
8
2
00
5 t
ota
l1
48
.67
17
1.6
48
1.0
51
71
.01
89
.89
25
6.2
61
76
.56
95
.58
96
.20
13
5.7
3
a P
rice
s r
ece
ived
fo
r in
div
idu
al sa
les m
ay v
ary
sig
nifi
ca
ntly f
rom
th
e a
ve
rag
es s
how
n in
th
is t
ab
le b
ecau
se
of
diffe
ren
ce
s in
sp
ecie
s m
ix,
qu
alit
y,
roa
d c
osts
, lo
gg
ing
an
d p
roce
ssin
g co
sts
, siz
e a
nd
len
gth
of
sa
le,
nu
mb
er
of
bid
de
rs,
an
d o
the
r re
late
d p
rice
de
term
ina
nts
. P
rice
s f
or
stu
mp
ag
e o
n N
atio
na
l F
ore
st la
nd
are
hig
h b
id v
alu
e.
Ro
ad
co
sts
an
d a
n a
llow
an
ce
fo
r sa
le-a
rea
be
tter
me
nt
are
in
clu
de
d in
th
e b
id.
So
urc
e:
Fo
rest
Ser
vic
e,
U.S
. D
ep
art
me
nt
of
Ag
ricul
ture
. N
ort
hern
Re
gio
n in
clu
de
s M
on
tan
a,
no
rth
ea
ste
rn W
ash
ing
ton
, no
rth
ern
Id
aho
, N
ort
h D
ako
ta,
an
d n
orth
we
ste
rn
So
uth
Da
ko
ta.
134
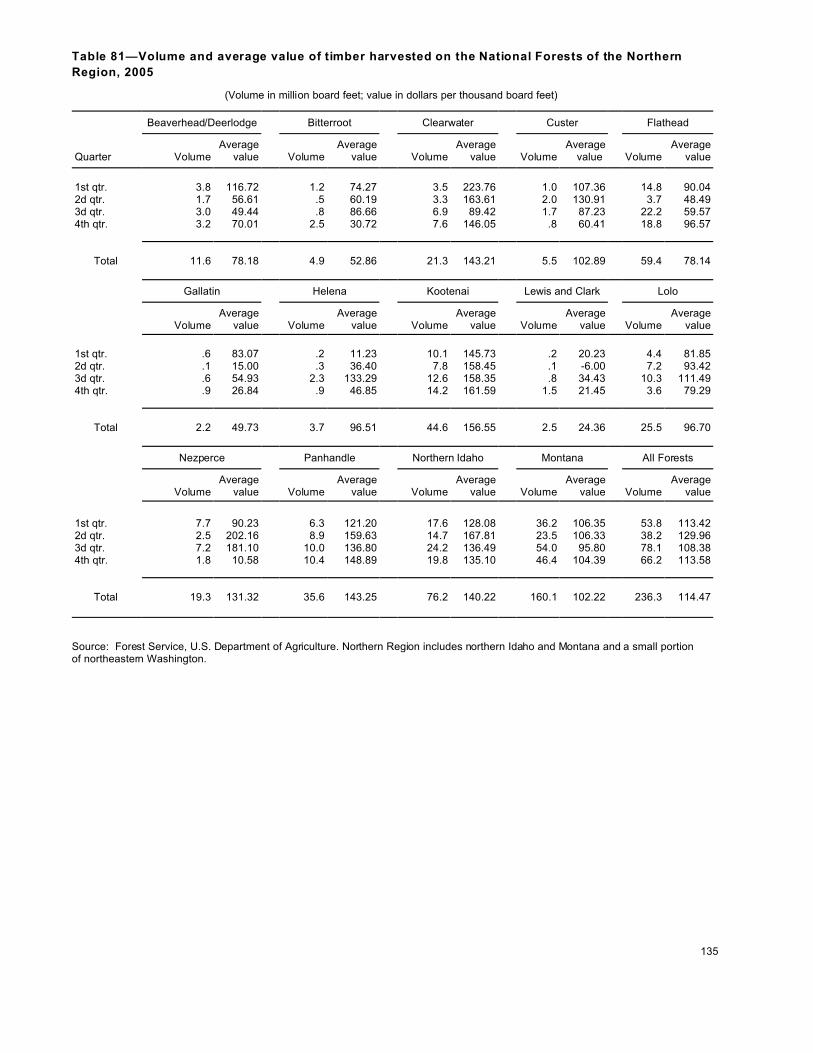
135
Table 81—Volume and average value of timber harvested on the National Forests of the Northern
Region, 2005
(Volume in million board feet; value in dollars per thousand board feet)
Beaverhead/Deerlodge Bitterroot Clearwater Custer Flathead
Quarter VolumeAverage
value VolumeAverage
value VolumeAverage
value VolumeAverage
value VolumeAverage
value
1st qtr. 3.8 116.72 1.2 74.27 3.5 223.76 1.0 107.36 14.8 90.042d qtr. 1.7 56.61 .5 60.19 3.3 163.61 2.0 130.91 3.7 48.493d qtr. 3.0 49.44 .8 86.66 6.9 89.42 1.7 87.23 22.2 59.574th qtr. 3.2 70.01 2.5 30.72 7.6 146.05 .8 60.41 18.8 96.57
Total 11.6 78.18 4.9 52.86 21.3 143.21 5.5 102.89 59.4 78.14
Gallatin Helena Kootenai Lewis and Clark Lolo
VolumeAverage
value VolumeAverage
value VolumeAverage
value VolumeAverage
value VolumeAverage
value
1st qtr. .6 83.07 .2 11.23 10.1 145.73 .2 20.23 4.4 81.852d qtr. .1 15.00 .3 36.40 7.8 158.45 .1 -6.00 7.2 93.423d qtr. .6 54.93 2.3 133.29 12.6 158.35 .8 34.43 10.3 111.494th qtr. .9 26.84 .9 46.85 14.2 161.59 1.5 21.45 3.6 79.29
Total 2.2 49.73 3.7 96.51 44.6 156.55 2.5 24.36 25.5 96.70
Nezperce Panhandle Northern Idaho Montana All Forests
VolumeAverage
value VolumeAverage
value VolumeAverage
value VolumeAverage
value VolumeAverage
value
1st qtr. 7.7 90.23 6.3 121.20 17.6 128.08 36.2 106.35 53.8 113.422d qtr. 2.5 202.16 8.9 159.63 14.7 167.81 23.5 106.33 38.2 129.963d qtr. 7.2 181.10 10.0 136.80 24.2 136.49 54.0 95.80 78.1 108.384th qtr. 1.8 10.58 10.4 148.89 19.8 135.10 46.4 104.39 66.2 113.58
Total 19.3 131.32 35.6 143.25 76.2 140.22 160.1 102.22 236.3 114.47
Source: Forest Service, U.S. Department of Agriculture. Northern Region includes northern Idaho and Montana and a small portion of northeastern Washington.
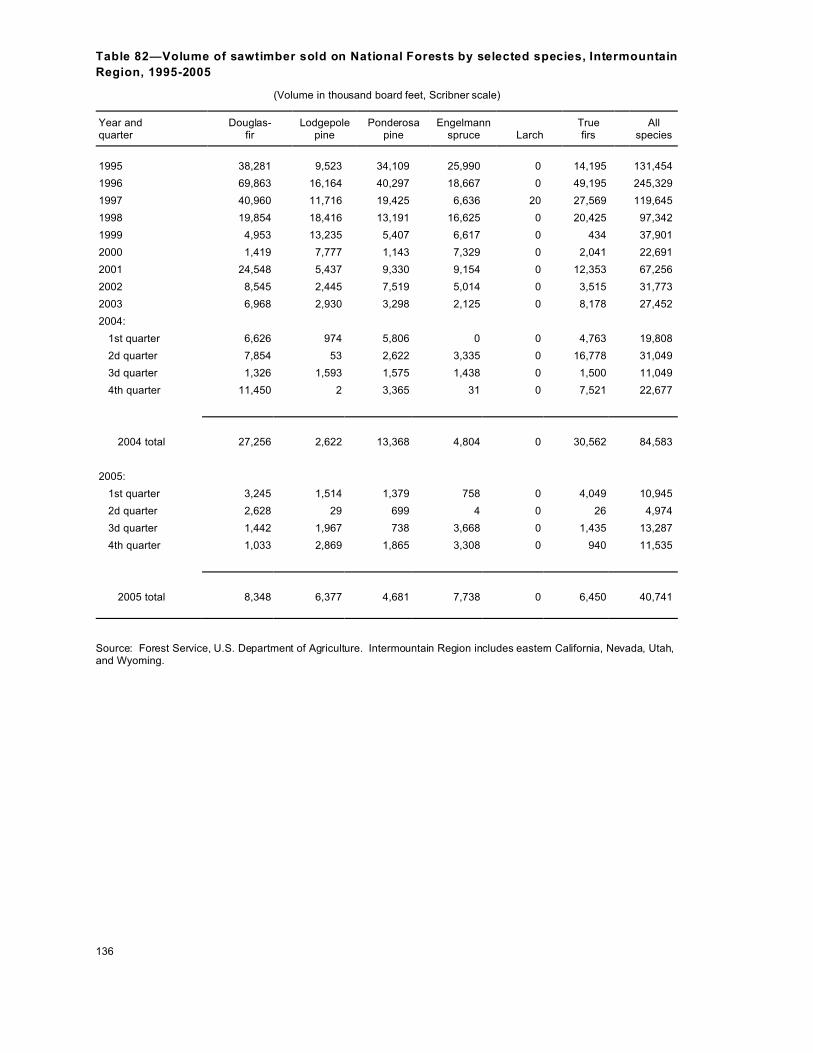
136
Table 82—Volume of sawtimber sold on National Forests by selected species, Intermountain
Region, 1995-2005
(Volume in thousand board feet, Scribner scale)
Year andquarter
Douglas-fir
Lodgepolepine
Ponderosapine
Engelmannspruce Larch
Truefirs
Allspecies
1995 38,281 9,523 34,109 25,990 0 14,195 131,454
1996 69,863 16,164 40,297 18,667 0 49,195 245,329
1997 40,960 11,716 19,425 6,636 20 27,569 119,645
1998 19,854 18,416 13,191 16,625 0 20,425 97,342
1999 4,953 13,235 5,407 6,617 0 434 37,901
2000 1,419 7,777 1,143 7,329 0 2,041 22,691
2001 24,548 5,437 9,330 9,154 0 12,353 67,256
2002 8,545 2,445 7,519 5,014 0 3,515 31,773
2003 6,968 2,930 3,298 2,125 0 8,178 27,452
2004:
1st quarter 6,626 974 5,806 0 0 4,763 19,808
2d quarter 7,854 53 2,622 3,335 0 16,778 31,049
3d quarter 1,326 1,593 1,575 1,438 0 1,500 11,049
4th quarter 11,450 2 3,365 31 0 7,521 22,677
2004 total 27,256 2,622 13,368 4,804 0 30,562 84,583
2005:
1st quarter 3,245 1,514 1,379 758 0 4,049 10,945
2d quarter 2,628 29 699 4 0 26 4,974
3d quarter 1,442 1,967 738 3,668 0 1,435 13,287
4th quarter 1,033 2,869 1,865 3,308 0 940 11,535
2005 total 8,348 6,377 4,681 7,738 0 6,450 40,741
Source: Forest Service, U.S. Department of Agriculture. Intermountain Region includes eastern California, Nevada, Utah, and Wyoming.

137
Table 83—Average stumpage prices for sawtimber sold on National Forests by selected
species, Intermountain Region, 1995-2005
(In dollars per thousand board feet)
Year andquarter
Douglas- fir
Lodgepolepine
Ponderosapine
Engelmannspruce Larch
Truefirs
Allspecies
1995 139.87 195.53 271.61 104.19 -- 306.22 186.97
1996 64.69 134.84 129.40 120.81 -- 64.67 82.23
1997 174.56 150.89 305.58 182.01 325.73 172.52 178.37
1998 148.34 131.23 244.84 207.45 -- 148.47 157.56
1999 173.54 133.19 115.02 191.09 -- 145.65 129.43
2000 188.93 177.34 116.18 284.71 -- 96.06 185.36
2001 84.21 172.86 193.07 173.76 -- 62.05 118.23
2002 130.93 207.27 79.65 203.87 -- 41.96 124.51
2003 63.29 63.97 60.14 192.64 -- 42.98 69.80
2004:
1st quarter 75.34 58.24 87.56 -- -- 45.73 70.88
2d quarter 62.66 143.80 70.59 98.83 -- 76.44 74.12
3d quarter 211.38 177.58 95.70 212.84 -- 79.49 132.88
4th quarter 115.27 140.17 154.00 156.65 -- 107.69 117.66
2004 average 95.08 123.69 101.92 133.32 -- 79.50 92.71
2005:
1st quarter 192.93 152.81 17.87 119.02 -- 69.59 114.57
2d quarter 53.92 112.92 127.62 136.81 -- 79.90 70.18
3d quarter 70.64 105.69 121.46 166.51 -- 102.86 112.99
4th quarter 68.27 102.43 118.38 174.12 -- 74.35 119.21
2005 average 112.62 115.44 90.63 165.10 -- 77.72 109.95
a Prices received for individual sales may vary significantly from the averages shown in this table because of differences in species mix, quality, road costs, logging and processing costs, size and length of sale, number of bidders, and other related price determinants. Prices for stumpage on National Forest lands are high bid value. Road costs and an allowance for sale-area betterment are included in the bid. Source: Forest Service, U.S. Department of Agriculture. Intermountain Region includes eastern California, Nevada, Utah, and Wyoming.

138
Table 84—Volume and average value of timber harvested on the National Forests of the
Intermountain Region, 2005
(Volume in million board feet; value in dollars per thousand board feet)
Ashley Boise Bridger/Teton Caribou/Targhee Dixie
Quarter VolumeAverage
value VolumeAverage
value VolumeAverage
value VolumeAverage
value VolumeAverage
value
1st qtr. .1 11.03 5.6 32.37 .8 17.51 .1 18.94 .4 14.812d qtr. a 81.67 2.9 84.02 .1 61.16 a 275.33 .1 22.683d qtr. 1.7 75.23 7.2 53.26 1.9 34.40 1.4 83.67 2.1 117.524th qtr. 2.1 41.32 10.4 52.98 2.8 32.87 5.2 100.71 5.4 88.61
Total 3.9 55.52 26.1 52.10 5.6 31.38 6.7 95.87 8.0 91.36
Fishlake Humboldt/Toiyabe Manti-Lasal Payette Salmon-Challis
VolumeAverage
value VolumeAverage
value VolumeAverage
value VolumeAverage
value VolumeAverage
value
1st qtr. .2 10.62 .2 22.13 .2 62.28 .8 63.27 .2 29.292d qtr. a 14.94 .2 20.81 .3 23.58 1.2 162.75 .5 28.163d qtr. .5 46.37 .5 20.47 .6 16.38 1.4 73.03 1.4 25.634th qtr. 1.3 105.18 1.3 23.95 1.4 17.57 1.0 16.04 2.1 20.56
Total 2.0 81.27 2.3 22.66 2.6 22.08 4.3 82.54 4.2 23.64
Sawtooth Wasatch Southern Idaho Nevada Utah
VolumeAverage
value VolumeAverage
value VolumeAverage
value VolumeAverage
value VolumeAverage
value
1st qtr. .4 79.45 .3 49.79 7.1 38.22 .1 21.29 1.3 49.712d qtr. .1 68.34 0 -- 4.6 97.46 .1 20.53 .6 19.803d qtr. 2.1 68.86 .6 81.46 13.6 58.06 .3 15.18 6.8 103.144th qtr. 2.8 35.42 1.2 73.54 21.3 57.42 .5 19.67 12.2 72.91
Total 5.4 52.34 2.1 71.88 46.6 58.66 1.0 18.69 20.9 79.73
Wyoming All Forests
VolumeAverage
value VolumeAverage
value
1st qtr. .8 17.51 9.4 37.552d qtr. .1 61.16 5.5 85.23
3d qtr. 1.9 34.51 22.8 68.564th qtr. 3.1 38.59 38.0 59.69
Total 5.9 34.52 75.7 61.47
a Less than 0.1 million board feet. Source: Forest Service, U.S. Department of Agriculture. Intermountain Region includes Idaho, Nevada, Utah, and Wyoming.

Ta
ble
85
—V
olu
me
of
tim
be
r s
old
on
pu
bli
cly
ow
ne
d o
r m
an
ag
ed
la
nd
s i
n C
ali
forn
ia,
20
00
-20
05
(In
th
ou
sa
nd b
oa
rd f
eet
, S
cri
bn
er
sca
le)
20
04
20
05
Ag
en
cy
20
00
20
01
20
02
20
03
To
tal
4th
qtr
.1st
qtr
. 2
d q
tr.
3d q
tr.
4th
qtr
.T
ota
l
US
DA
For
est
Serv
ice
a2
13
,08
62
85
,66
52
44
,33
21
90
,61
43
34
,18
01
24
,49
53
6,0
08
10
6,9
63
18
3,6
87
99
,68
94
26
,34
6
U.S
. B
ure
au
of
La
nd
Man
ag
e.b
4,5
37
1,4
53
60
22
,04
82
06
0N
AN
AN
AN
AN
A
Sta
te o
f C
alif
orn
ia1
8,3
22
0N
AN
AN
AN
AN
AN
AN
AN
AN
A
To
tal
25
4,9
92
28
7,1
18
NA
NA
NA
NA
NA
NA
NA
NA
NA
No
te:
Th
e U
.S. B
ure
au
of
Ind
ian
Aff
air
s lan
d is n
ow
pri
va
tely
ow
ne
d a
nd
no
lo
nge
r m
an
ag
ed
by t
he
BIA
. T
hat
ca
teg
ory
ha
s b
ee
n d
rop
pe
d.
NA
= n
ot
ava
ilab
le.
a C
on
vert
ible
pro
du
cts
on
ly. I
nclu
de
s a
ll o
f th
e P
acifi
c S
ou
thw
est
Re
gio
n a
nd
th
e p
ort
ion
of th
e P
acific
Nor
thw
est
Reg
ion
in C
alif
orn
ia.
b D
oe
s n
ot
inclu
de
cu
ll lo
g s
ale
s o
r vo
lum
e g
ive
n a
wa
y th
roug
h f
ree
-use p
erm
its.
So
urc
e:
Re
sp
ective
ag
en
cie
s li
ste
d.
139

Ta
ble
86
—A
ve
rag
e s
tum
pa
ge
pri
ce
s o
f ti
mb
er
so
ld o
n p
ub
lic
ly o
wn
ed
or
ma
na
ge
d l
an
ds
in
Ca
lifo
rnia
, 2
00
0-2
00
5
(In
dol
lars
pe
r th
ou
sa
nd
bo
ard
fe
et)
20
04
20
05
Ag
en
cy
20
00
20
01
20
02
2
00
3A
ve
rag
e4th
qtr
.1st
qtr
.2d q
tr.
3d q
tr.
4th
qtr
.A
ve
rag
e
US
DA
For
est
Serv
ice
a b
85
.43
53
.37
69
.99
51
.89
52
.77
10
2.8
65
9.1
86
6.5
98
4.4
22
9.6
26
5.0
0
U.S
. B
ure
au
of
La
nd
Man
ag
e.c
16
7.3
21
55
.67
59
.67
22
.80
17
8.2
0--
NA
NA
NA
NA
NA
Sta
te o
f C
alif
orn
ia5
27
.06
--N
AN
AN
AN
AN
AN
AN
AN
AN
A
Ave
rag
e1
42
.47
53
.89
NA
NA
NA
NA
NA
NA
NA
NA
NA
No
te:
Th
e U
.S. B
ure
au
of
Ind
ian
Aff
air
s lan
d is n
ow
pri
va
tely
ow
ne
d a
nd
no
lo
nge
r m
an
ag
ed
by t
he
BIA
. T
hat
ca
teg
ory
ha
s b
ee
n d
rop
pe
d.
NA
= n
ot
ava
ilab
le.
a P
rice
s r
ece
ived
fo
r in
div
idu
al sa
les m
ay v
ary
sig
nifi
ca
ntly f
rom
th
e a
ve
rag
es s
how
n in
th
is t
ab
le b
ecau
se
of
diffe
ren
ce
s in
sp
ecie
s m
ix,
qu
alit
y,
roa
d c
osts
, lo
gg
ing
an
d p
roce
ssin
gco
sts
, siz
e a
nd
len
gth
of
sa
le, n
um
be
r o
f b
idde
rs,
an
d o
the
r re
late
d p
rice
de
term
ina
nts
. P
rice
s f
or
stu
mp
ag
e o
n N
ation
al F
ore
st
lan
ds a
re h
igh
bid
va
lue
. R
oa
d c
osts
an
d a
na
llow
an
ce
for
sa
le-a
rea
be
tte
rme
nt a
re in
clu
ded
in
th
e b
id.
b I
nclu
des a
ll o
f th
e P
acific
So
uth
we
st R
eg
ion
an
d t
he
po
rtio
n o
f th
e P
acifi
c N
ort
hw
est
Re
gio
n in
Ca
lifo
rnia
.
c D
oe
s n
ot
inclu
de
cu
ll lo
g s
ale
s o
r vo
lum
e g
ive
n a
wa
y th
roug
h f
ree
-use p
erm
its.
So
urc
e:
Re
sp
ective
ag
en
cie
s li
ste
d.
140
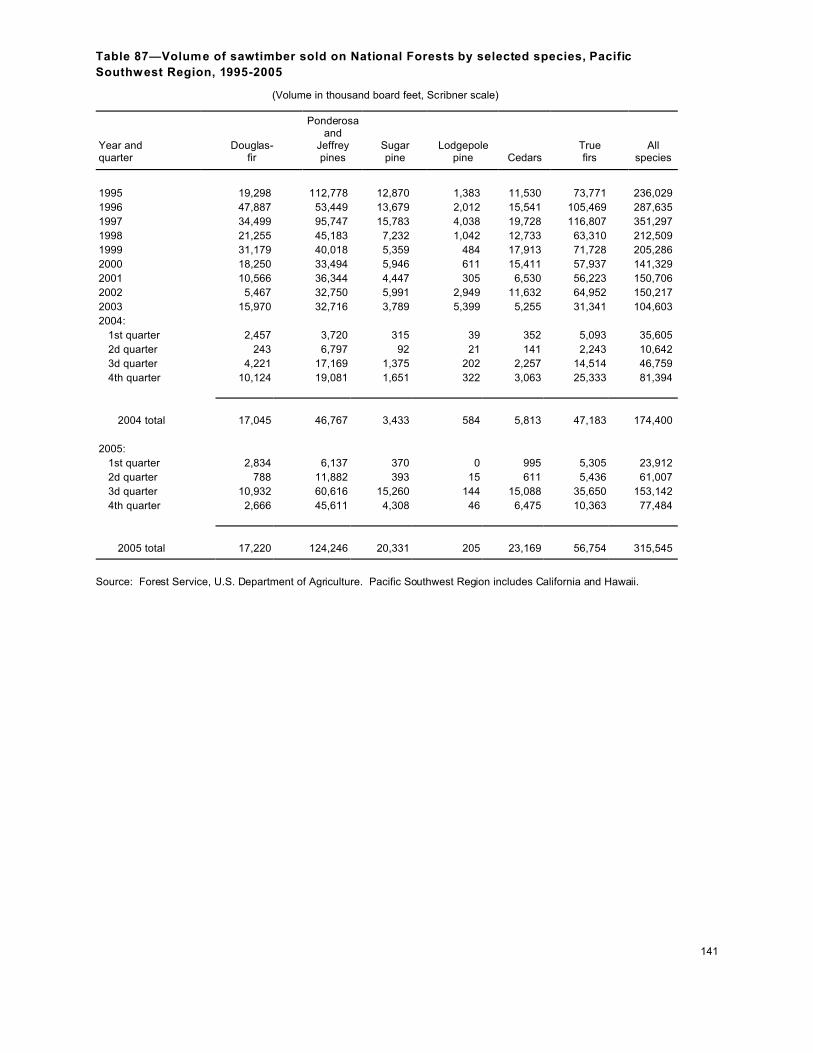
141
Table 87—Volume of sawtimber sold on National Forests by selected species, Pacific
Southwest Region, 1995-2005
(Volume in thousand board feet, Scribner scale)
Year andquarter
Douglas-fir
Ponderosaand
Jeffreypines
Sugarpine
Lodgepolepine Cedars
Truefirs
Allspecies
1995 19,298 112,778 12,870 1,383 11,530 73,771 236,029
1996 47,887 53,449 13,679 2,012 15,541 105,469 287,635
1997 34,499 95,747 15,783 4,038 19,728 116,807 351,297
1998 21,255 45,183 7,232 1,042 12,733 63,310 212,509
1999 31,179 40,018 5,359 484 17,913 71,728 205,286
2000 18,250 33,494 5,946 611 15,411 57,937 141,329
2001 10,566 36,344 4,447 305 6,530 56,223 150,706
2002 5,467 32,750 5,991 2,949 11,632 64,952 150,217
2003 15,970 32,716 3,789 5,399 5,255 31,341 104,603
2004:
1st quarter 2,457 3,720 315 39 352 5,093 35,605
2d quarter 243 6,797 92 21 141 2,243 10,642
3d quarter 4,221 17,169 1,375 202 2,257 14,514 46,759
4th quarter 10,124 19,081 1,651 322 3,063 25,333 81,394
2004 total 17,045 46,767 3,433 584 5,813 47,183 174,400
2005:
1st quarter 2,834 6,137 370 0 995 5,305 23,912
2d quarter 788 11,882 393 15 611 5,436 61,007
3d quarter 10,932 60,616 15,260 144 15,088 35,650 153,142
4th quarter 2,666 45,611 4,308 46 6,475 10,363 77,484
2005 total 17,220 124,246 20,331 205 23,169 56,754 315,545
Source: Forest Service, U.S. Department of Agriculture. Pacific Southwest Region includes California and Hawaii.

142
Table 88—Average stumpage prices for sawtimber sold on National Forests by selected
species, Pacific Southwest Region, 1995-2005
(In dollars per thousand board feet)
Year andquarter
Douglas- fir
Ponderosaand
Jeffreypines
Sugarpine
Lodgepolepine Cedars
Truefirs
Allspecies
1995 350.92 158.36 396.82 105.64 120.08 171.00 186.16
1996 189.36 299.48 318.08 53.61 135.26 182.11 184.12
1997 183.17 237.48 212.37 71.66 114.66 181.90 169.37
1998 172.89 182.66 177.47 47.98 183.87 135.01 134.71
1999 157.97 210.83 224.25 114.12 131.15 138.13 137.39
2000 150.90 155.27 183.04 28.06 97.80 100.87 118.72
2001 129.85 126.54 219.65 50.47 110.68 78.74 87.81
2002 85.83 129.03 131.51 163.43 71.91 65.21 79.68
2003 124.91 86.09 47.77 145.26 39.10 70.87 83.97
2004:
1st quarter 49.59 55.52 41.45 26.61 40.63 51.81 25.31
2d quarter 211.45 11.62 76.90 4.61 10.14 17.09 22.24
3d quarter 79.82 61.48 57.37 26.30 32.98 22.10 50.58
4th quarter 227.97 172.24 192.17 100.98 148.07 152.88 143.31
2004 average 165.33 98.95 121.25 66.68 93.53 95.29 86.97
2005:
1st quarter 150.91 78.69 88.33 -- 231.63 30.38 78.66
2d quarter 155.71 110.08 235.83 28.81 290.59 217.79 113.48
3d quarter 173.02 82.82 108.52 48.16 185.69 73.42 100.14
4th quarter 34.81 26.10 28.20 3.42 42.64 19.07 29.71
2005 average 147.20 64.40 93.59 36.74 150.44 73.30 83.79
a Prices received for individual sales may vary significantly from the averages shown in this table because of differences nspecies mix, quality, road costs, logging and processing costs, size and length of sale, number of bidders, and otherrelated price determinants. Before 1984, prices for stumpage on National Forest lands are statistical high bids. Thestatistical high bid is defined as the bid price minus credits for road costs; it includes an allowance for sale-area betterment(K-V funds). Beginning in 1984, prices for stumpage on National Forest lands are high bid value. Road costs and anallowance for sale-area betterment are included in the bid.
Source: Forest Service, U.S. Department of Agriculture. Pacific Southwest Region includes California and Hawaii.
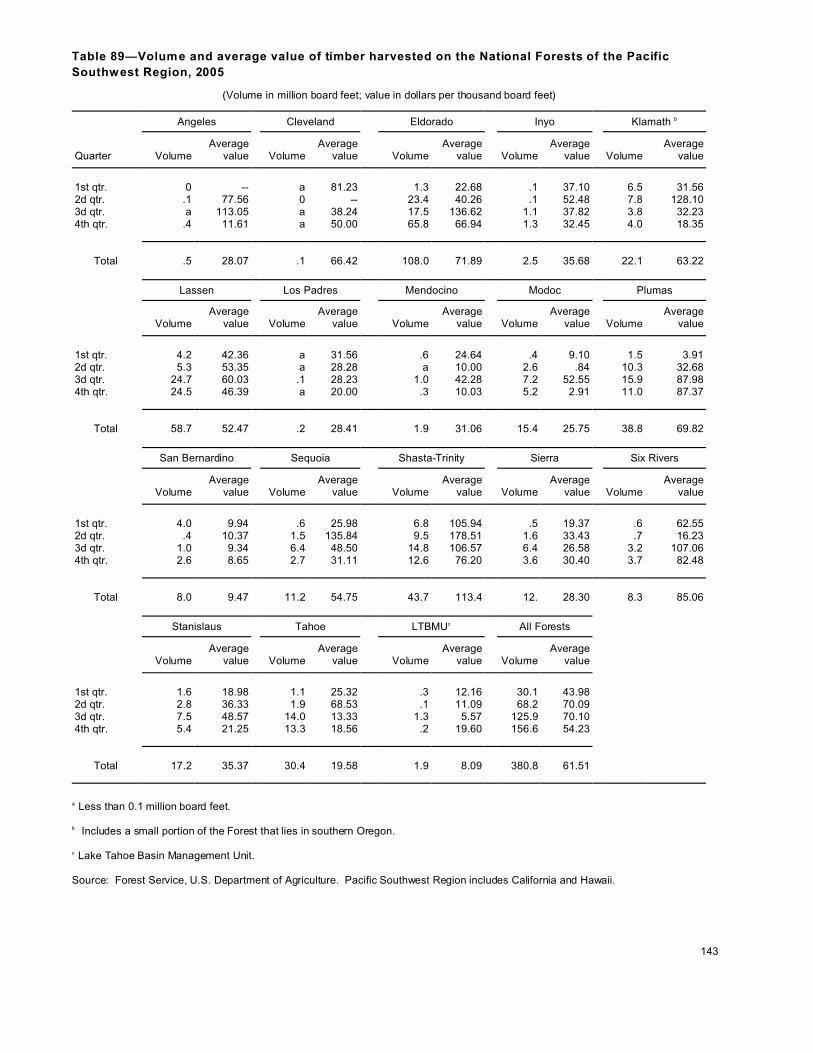
143
Table 89—Volume and average value of timber harvested on the National Forests of the Pacific
Southwest Region, 2005
(Volume in million board feet; value in dollars per thousand board feet)
Angeles Cleveland Eldorado Inyo Klamath b
Quarter VolumeAverage
value VolumeAverage
value VolumeAverage
value VolumeAverage
value VolumeAverage
value
1st qtr. 0 -- a 81.23 1.3 22.68 .1 37.10 6.5 31.562d qtr. .1 77.56 0 -- 23.4 40.26 .1 52.48 7.8 128.103d qtr. a 113.05 a 38.24 17.5 136.62 1.1 37.82 3.8 32.234th qtr. .4 11.61 a 50.00 65.8 66.94 1.3 32.45 4.0 18.35
Total .5 28.07 .1 66.42 108.0 71.89 2.5 35.68 22.1 63.22
Lassen Los Padres Mendocino Modoc Plumas
VolumeAverage
value VolumeAverage
value VolumeAverage
value VolumeAverage
value VolumeAverage
value
1st qtr. 4.2 42.36 a 31.56 .6 24.64 .4 9.10 1.5 3.912d qtr. 5.3 53.35 a 28.28 a 10.00 2.6 .84 10.3 32.683d qtr. 24.7 60.03 .1 28.23 1.0 42.28 7.2 52.55 15.9 87.984th qtr. 24.5 46.39 a 20.00 .3 10.03 5.2 2.91 11.0 87.37
Total 58.7 52.47 .2 28.41 1.9 31.06 15.4 25.75 38.8 69.82
San Bernardino Sequoia Shasta-Trinity Sierra Six Rivers
VolumeAverage
value VolumeAverage
value VolumeAverage
value VolumeAverage
value VolumeAverage
value
1st qtr. 4.0 9.94 .6 25.98 6.8 105.94 .5 19.37 .6 62.552d qtr. .4 10.37 1.5 135.84 9.5 178.51 1.6 33.43 .7 16.233d qtr. 1.0 9.34 6.4 48.50 14.8 106.57 6.4 26.58 3.2 107.064th qtr. 2.6 8.65 2.7 31.11 12.6 76.20 3.6 30.40 3.7 82.48
Total 8.0 9.47 11.2 54.75 43.7 113.4 12. 28.30 8.3 85.06
Stanislaus Tahoe LTBMUc All Forests
VolumeAverage
value VolumeAverage
value VolumeAverage
value VolumeAverage
value
1st qtr. 1.6 18.98 1.1 25.32 .3 12.16 30.1 43.982d qtr. 2.8 36.33 1.9 68.53 .1 11.09 68.2 70.093d qtr. 7.5 48.57 14.0 13.33 1.3 5.57 125.9 70.104th qtr. 5.4 21.25 13.3 18.56 .2 19.60 156.6 54.23
Total 17.2 35.37 30.4 19.58 1.9 8.09 380.8 61.51
a Less than 0.1 million board feet.
b Includes a small portion of the Forest that lies in southern Oregon. c Lake Tahoe Basin Management Unit. Source: Forest Service, U.S. Department of Agriculture. Pacific Southwest Region includes California and Hawaii.

144
Table 90—Monthly stumpage volume and average value of timber sold on National Forest
lands in Washington and Oregon, 2003-2005
(Volume in million board feet; average value in dollars per thousand board feet)
East side West sidePacific Northwest
Region
Year andmonth Volume
Averagevalue Volume
Averagevalue Volume
Averagevalue
2003:January 6 71.58 7 111.33 13 91.88February 2 21.26 9 80.42 11 71.25March 8 78.04 10 77.36 18 77.67April 4 128.22 2 265.75 6 173.23May 8 40.33 27 121.80 35 102.40June 29 64.50 6 212.34 35 87.99July 17 61.69 14 208.97 31 130.26August 6 25.46 23 274.28 29 225.57September 22 53.05 57 134.11 79 111.44October 27 106.95 30 122.93 57 115.23November 18 78.34 11 127.87 29 96.91December 24 66.96 1 267.26 25 71.88
Total 173 70.96 196 150.23 369 113.08 2004:
January 23 78.76 0 -- 23 78.76February 0 -- a 525.71 a 525.71March 0 -- 23 105.17 23 105.17April 67 37.10 5 119.05 72 42.33May 77 55.97 12 120.48 89 64.43June 7 85.50 10 171.96 16 136.97July 11 56.42 94 51.26 105 51.81August 1 109.33 42 31.99 42 32.94September 57 86.06 44 56.97 101 73.30October 66 74.93 6 125.45 72 79.12November 23 147.30 20 82.09 43 117.34December 25 50.54 30 21.45 55 34.45
Total 356 68.44 285 62.38 641 65.75
2005:January 42 42.57 4 177.25 46 53.62February 7 38.70 12 205.71 19 144.52March a 44.40 3 210.84 3 209.25April 1 34.25 2 236.64 3 182.26May 8 107.33 21 139.40 29 130.63June 24 115.92 17 153.46 41 131.38July 29 72.14 0 -- 29 72.14August 85 79.94 20 128.39 105 89.28September 7 139.26 34 178.91 42 172.08October 63 119.00 40 169.53 103 136.77November 7 50.43 8 109.76 16 82.15December a 170.34 16 140.44 16 140.58
Total 273 85.89 179 160.36 452 115.36
a Less than 1 million board feet.
Note: These figures are preliminary.
Source: Forest Service, U.S. Department of Agriculture.

145
Table 91—Volume of timber sold on publicly ow ned or managed lands, Washington and Oregon,
2001-2005
(In thousand board feet, Scribner scale)
2004 2005
Agency 2001 2002 2003 Total 4th qtr. 1st qtr. 2d qtr. 3d qtr. 4th qtr. Total
Western Washington:
USDA Forest Servicea 18,626 16,335 37,007 43,902 9,306 887 8,750 14,392 16,868 40,897
U.S. Bur. Land Mgmt. 0 0 0 0 0 NA NA NA NA NA
State of Washingtonb NA 45,805 374,056 420,515 57,757 NA NA NA NA NA
Total NA 62,140 411,063 464,417 67,063 NA NA NA NA NA
Eastern Washington:
USDA Forest Servicea 54,597 59,018 98,043 41,618 18,358 7,830 19,925 35,735 21,157 84,647
U.S. Bur. Land Mgmt. 1,364 138 0 0 0 NA NA NA NA NA
State of Washingtonb NA b 98,685 79,799 14,316 NA NA NA NA NA
Total NA 59,156 196,727 121,417 32,674 NA NA NA NA NA
Western Oregon:
USDA Forest Servicea 38,283 151,224 182,735 173,204 59,479 51,234 23,764 19,827 50,709 145,534
U.S. Bur. Land Mgmt. 89,147 104,936 215,077 171,442 30,661 NA NA NA NA 174,100
State of Oregon 186,799 221,058 237,277 244,358 43,172 93,199 75,218 74,957 47,425 290,799
Total 314,229 477,218 635,089 589,004 133,312 144,433 98,982 94,784 98,134 610,433
Eastern Oregon:
USDA Forest Servicea 159,323 113,972 101,152 261,315 84,443 27,341 12,339 81,475 59 180,089
U.S. Bur. Land Mgmt. 3,219 107 5,239 2,360 0 NA NA NA NA NA
State of Oregon 4,088 2,692 1,746 8,276 0 0 0 0 11,275 11,275
Total 166,630 116,771 108,137 271,951 84,443 NA NA NA NA NA
All public lands:
USDA Forest Servicea 270,829 340,549 418,937 520,039 171,586 87,293 64,777 151,429 147,668 451,167
U.S. Bur. Land Mgmt. 93,730 105,182 220,315 173,802 30,661 NA NA NA NA NA
State of Washingtonb NA 45,805 472,741 500,314 72,073 NA NA NA NA NA
State of Oregon 190,887 223,750 239,023 252,634 43,172 93,199 75,218 74,957 58,700 302,074
Total NA 715,286 1,351,015 1,446,789 317,492 NA NA NA NA NA
Note: The U.S. Bureau of Indian Affairs land is now privately owned and no longer managed by the BIA. That category has beendropped.
NA = not available.
a Convertible products only.
b Excludes sales under $20,000.
Source: Respective agencies listed.
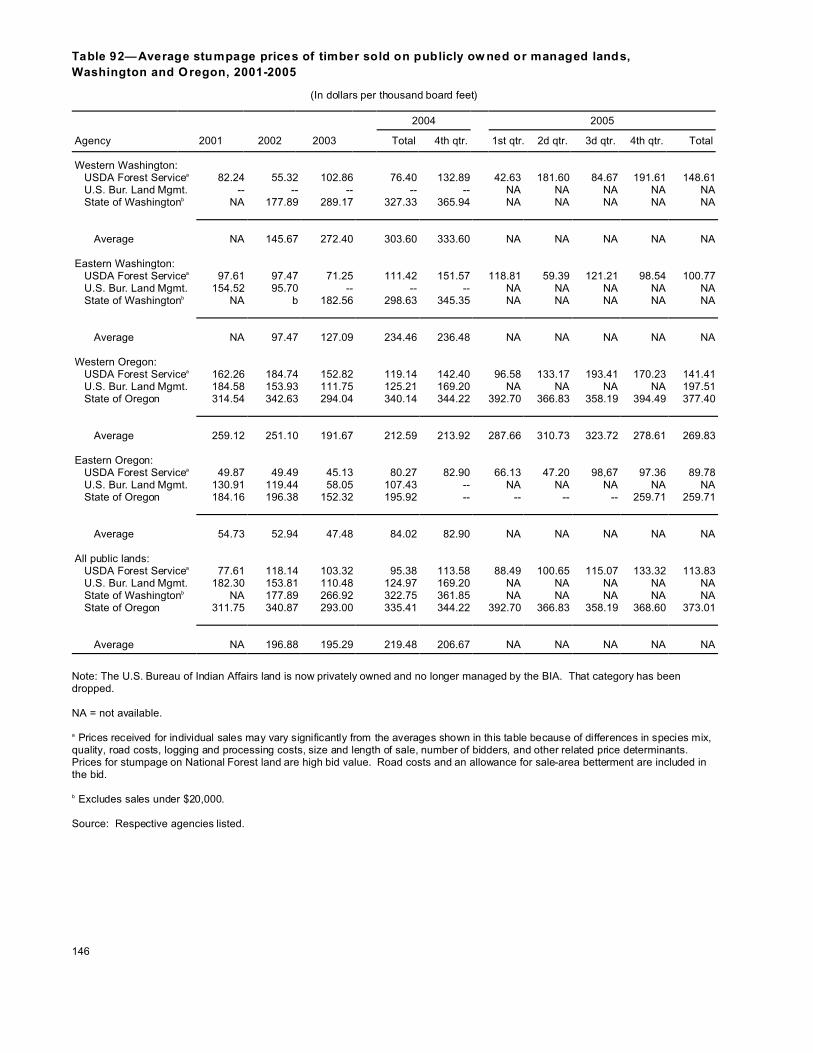
146
Table 92—Average stumpage prices of timber sold on publicly ow ned or managed lands,
Washington and Oregon, 2001-2005
(In dollars per thousand board feet)
2004 2005
Agency 2001 2002 2003 Total 4th qtr. 1st qtr. 2d qtr. 3d qtr. 4th qtr. Total
Western Washington:USDA Forest Servicea 82.24 55.32 102.86 76.40 132.89 42.63 181.60 84.67 191.61 148.61U.S. Bur. Land Mgmt. -- -- -- -- -- NA NA NA NA NAState of Washingtonb NA 177.89 289.17 327.33 365.94 NA NA NA NA NA
Average NA 145.67 272.40 303.60 333.60 NA NA NA NA NA Eastern Washington:
USDA Forest Servicea 97.61 97.47 71.25 111.42 151.57 118.81 59.39 121.21 98.54 100.77U.S. Bur. Land Mgmt. 154.52 95.70 -- -- -- NA NA NA NA NAState of Washingtonb NA b 182.56 298.63 345.35 NA NA NA NA NA
Average NA 97.47 127.09 234.46 236.48 NA NA NA NA NA Western Oregon:
USDA Forest Servicea 162.26 184.74 152.82 119.14 142.40 96.58 133.17 193.41 170.23 141.41U.S. Bur. Land Mgmt. 184.58 153.93 111.75 125.21 169.20 NA NA NA NA 197.51State of Oregon 314.54 342.63 294.04 340.14 344.22 392.70 366.83 358.19 394.49 377.40
Average 259.12 251.10 191.67 212.59 213.92 287.66 310.73 323.72 278.61 269.83 Eastern Oregon:
USDA Forest Servicea 49.87 49.49 45.13 80.27 82.90 66.13 47.20 98,67 97.36 89.78U.S. Bur. Land Mgmt. 130.91 119.44 58.05 107.43 -- NA NA NA NA NAState of Oregon 184.16 196.38 152.32 195.92 -- -- -- -- 259.71 259.71
Average 54.73 52.94 47.48 84.02 82.90 NA NA NA NA NA
All public lands:
USDA Forest Servicea 77.61 118.14 103.32 95.38 113.58 88.49 100.65 115.07 133.32 113.83U.S. Bur. Land Mgmt. 182.30 153.81 110.48 124.97 169.20 NA NA NA NA NAState of Washingtonb NA 177.89 266.92 322.75 361.85 NA NA NA NA NAState of Oregon 311.75 340.87 293.00 335.41 344.22 392.70 366.83 358.19 368.60 373.01
Average NA 196.88 195.29 219.48 206.67 NA NA NA NA NA
Note: The U.S. Bureau of Indian Affairs land is now privately owned and no longer managed by the BIA. That category has beendropped.
NA = not available.
a Prices received for individual sales may vary significantly from the averages shown in this table because of differences in species mix,quality, road costs, logging and processing costs, size and length of sale, number of bidders, and other related price determinants. Prices for stumpage on National Forest land are high bid value. Road costs and an allowance for sale-area betterment are included inthe bid. b Excludes sales under $20,000. Source: Respective agencies listed.

Ta
ble
93
—V
olu
me
of
sa
wti
mb
er
so
ld o
n N
ati
on
al
Fo
res
ts b
y s
ele
cte
d s
pe
cie
s,
Pa
cif
ic N
ort
hw
es
t R
eg
ion
, 1
99
4-2
00
5
(Vo
lum
e in
th
ousa
nd
bo
ard
fe
et,
Scri
bn
er
sca
le)
Do
ug
las-f
ir
Ye
ar
an
dq
ua
rte
rW
est
sid
eE
ast
sid
e
Po
nd
ero
sa
an
d J
eff
rey
pin
es
Su
ga
rp
ine
Wh
ite
pin
e
Lo
dg
ep
ole
pin
e
En
ge
lma
nn
sp
ruce
Sitka
sp
ruce
W
est
ern
he
mlo
ck
Cedars
aL
arc
h
No
ble
fir
an
d S
hasta
red
fir
Oth
er
tru
efir
sA
llsp
ecie
s
19
94
59
,33
33
7,5
60
21
,41
81
,84
73
32
31
,50
11
,81
64
59
,45
43
,12
61
0,2
51
1,3
05
27
,00
92
22
,12
11
99
51
61
,10
77
2,2
91
87
,34
92
,88
59
85
31
,19
41
,56
81
76
29
,35
88
,01
27
,95
31
9,6
06
51
,28
44
99
,87
11
99
66
6,4
47
31
9,0
93
89
,49
01
5,4
43
82
43
4,9
68
1,8
70
27
93
2,2
91
3,3
26
12
,48
41
0,8
83
12
8,4
97
76
9,5
12
19
97
61
,85
21
79
,29
45
5,1
73
2,0
86
2,5
60
17
,88
48
21
,18
62
4,5
53
2,2
43
3,3
74
11
,15
65
0,6
61
45
2,3
32
19
98
31
,88
31
15
,97
89
0,0
82
29
95
35
41
,86
04
79
37
17
,23
52
,20
41
,14
23
,36
98
9,7
77
41
3,4
15
19
99
18
,92
29
2,8
88
58
,38
23
80
89
83
3,2
23
19
67
10
,24
11
,45
02
,37
54
,97
03
6,1
14
27
8,4
39
20
00
23
63
,49
33
4,8
57
15
70
15
,88
07
10
18
21
,28
33
80
37
,89
41
55
,08
42
00
11
2,3
26
55
,61
42
1,6
42
19
03
5,4
18
66
90
7,9
54
1,0
93
67
80
28
,27
61
70
,77
12
00
22
4,6
65
11
0,0
40
28
,26
80
19
23
,31
10
1,0
94
11
,40
81
,13
34
,16
53
,33
93
1,9
42
25
7,7
80
20
03
20
,52
31
91
,22
53
2,0
50
46
22
52
2,8
87
95
85
33
,85
54
,45
11
19
03
7,6
39
35
2,3
37
20
04
:1
st
qu
art
er
3,5
97
25
,92
11
6,5
16
00
1,2
90
00
3,9
76
61
27
26
,38
55
7,9
76
2d
qu
art
er
4,1
76
21
,61
86
0,0
06
00
1,5
67
11
29
48
,90
26
48
38
02
6,8
79
12
4,3
79
3d
qu
art
er
54
37
1,6
92
14
,78
12
,87
02
55
,07
80
07
,79
71
,94
41
49
01
3,9
92
12
7,3
10
4th
qu
art
er
65
38
2,4
96
30
,02
41
,02
70
5,4
59
10
2,5
57
27
30
02
1,0
40
14
7,0
79
2
00
4 t
ota
l8
,96
92
01
,72
71
21
,32
73
,89
72
51
3,3
94
12
29
42
3,2
32
2,8
71
18
82
72
68
,29
64
56
,74
4 2
00
5:
1st
qu
art
er
1,9
82
43
,40
82
1,9
21
00
1,3
81
00
00
00
9,7
36
81
,66
82
d q
ua
rte
r1
,60
12
5,2
65
5,1
80
00
1,7
41
40
01
0,2
48
90
66
40
3,1
36
48
,70
53
d q
ua
rte
r0
69
,30
62
5,4
11
02
43
,32
20
08
,55
52
,96
54
02
3,3
02
13
3,8
58
4th
qu
art
er
07
6,6
50
14
,24
70
07
,47
57
80
01
,52
01
69
00
22
,80
41
23
,75
7
2
00
5 t
ota
l3
,58
22
14
,62
96
6,7
58
02
41
3,9
19
81
90
20
,32
34
,04
06
80
58
,97
83
87
,98
8
a I
nclu
de
s P
ort
-Orf
ord
-ce
da
r, A
lask
a c
ed
ar,
in
ce
ns
e c
ed
ar,
an
d w
este
rn r
ed
ce
da
r.
So
urc
e:
Fo
res
t S
erv
ice
, U
.S.
De
pa
rtm
en
t o
f A
gri
cu
ltu
re.
Pa
cif
ic N
ort
hw
es
t R
eg
ion
in
clu
de
s O
reg
on
an
d W
as
hin
gto
n a
nd
a s
ma
ll p
ort
ion
of
no
rth
ern
Ca
lifo
rnia
.
147

Ta
ble
94
—A
ve
rag
e s
tum
pa
ge
pri
ce
s f
or
sa
wti
mb
er
so
ld o
n N
ati
on
al
Fo
res
ts b
y s
ele
cte
d s
pe
cie
s,
Pa
cif
ic N
ort
hw
es
t R
eg
ion
, 1
99
4-2
00
5a
(In
dol
lars
pe
r th
ou
sa
nd
bo
ard
fe
et)
Do
ug
las-f
ir
Ye
ar
an
dq
ua
rte
rW
est
sid
eE
ast
sid
e
Po
nd
ero
sa
an
d J
eff
rey
pin
es
Su
ga
rp
ine
Wh
ite
pin
eL
od
ge
po
lep
ine
E
ng
elm
an
nsp
ruce
Sitka
sp
ruce
W
est
ern
he
mlo
ck
Cedars
bL
arc
h
No
ble
fir
an
d S
hasta
red
fir
Oth
er
tru
efir
s
All
sp
ecie
s
19
94
65
2.3
63
07
.87
31
8.2
05
88
.27
76
3.6
71
55
.72
21
6.0
03
76
.68
33
4.8
03
63
.51
48
2.1
94
49
.81
25
0.1
33
94
.14
19
95
45
3.3
81
43
.57
25
3.1
94
33
.58
48
8.3
31
36
.01
14
6.2
21
75
.10
29
1.8
48
6.5
62
71
.48
28
5.3
62
17
.78
29
5.3
41
99
63
98
.98
26
7.6
81
65
.67
58
.21
32
8.7
49
6.6
26
0.1
91
07
.67
22
1.2
84
97
.17
21
7.4
92
04
.30
13
9.3
62
31
.78
19
97
29
1.2
62
84
.50
16
4.3
83
94
.16
25
0.6
71
44
.24
10
9.5
61
09
.04
19
1.3
81
,17
4.3
31
56
.28
22
7.5
01
28
.18
24
0.4
61
99
82
01
.64
19
9.6
41
22
.17
47
3.9
72
33
.02
82
.66
56
.07
74
.99
10
1.4
12
68
.01
21
8.6
01
65
.08
84
.17
13
9.3
01
99
93
93
.98
20
2.8
71
39
.91
12
7.3
12
70
.75
94
.92
62
.15
93
.23
77
.69
19
6.4
42
78
.23
27
3.5
81
27
.35
18
0.6
72
00
07
47
.86
12
3.2
01
11
.36
39
7.1
6--
14
4.9
88
4.5
91
39
.46
15
8.3
25
60
.04
65
.16
--9
7.3
81
20
.63
20
01
25
5.3
81
27
.66
83
.98
17
7.1
5--
10
1.6
22
57
.05
--5
6.1
42
83
.17
15
6.1
4–
62
.38
11
6.3
12
00
21
52
.56
18
9.5
28
7.7
5--
10
.00
14
9.5
9--
85
.71
64
.71
32
9.6
51
77
.18
24
.43
62
.63
15
8.7
42
00
32
36
.85
14
6.1
55
4.9
97
5.9
11
25
.86
77
.24
79
.83
23
.85
92
.86
17
0.6
91
20
.00
63
3.4
14
7.5
01
21
.36
20
04
:1
st
qu
art
er
14
4.9
61
13
.19
85
.19
----
91
.14
----
48
.56
1,3
48
.08
56
.72
75
.29
44
.88
94
.69
2d
qu
art
er
58
.09
13
9.5
08
8.6
5--
--1
93
.94
69
.15
17
3.9
13
3.7
13
9.3
21
34
.45
--6
4.1
48
8.3
63
d q
ua
rte
r1
9.2
31
16
.32
12
7.3
81
21
.54
27
4.4
69
1.7
9--
--5
3.8
71
13
.37
74
.75
--1
00
.25
10
5.0
14
th q
ua
rte
r2
58
.48
16
5.1
09
0.9
63
4.6
0--
83
.18
19
.23
--1
01
.86
26
2.9
6--
--8
0.7
51
30
.30
2
00
4 a
ve
rag
e1
05
.15
13
8.3
59
3.4
79
8.6
32
74
.46
10
0.1
86
5.0
01
73
.91
50
.52
11
3.6
18
6.8
37
5.2
97
4.8
51
07
.31
20
05
:1
st
qu
art
er
32
1.4
41
25
.38
60
.09
----
75
.81
----
----
----
13
.48
93
.68
2d
qu
art
er
34
4.6
41
68
.41
49
.81
----
62
.56
24
3.5
8--
52
.71
34
0.4
82
83
.65
--6
3.1
01
28
.59
3d
qu
art
er
--1
62
.13
74
.21
--2
06
.34
17
4.8
1--
--8
1.4
22
27
.55
29
4.0
2--
91
.31
12
9.1
64
th q
ua
rte
r--
17
7.7
11
35
.57
----
84
.32
11
3.3
9--
14
6.3
72
55
.76
----
12
8.1
81
57
.32
2
00
5 a
ve
rag
e3
31
.81
16
1.0
08
0.7
7--
20
6.3
41
02
.35
11
9.6
7--
71
.80
25
4.0
82
84
.29
--9
1.2
21
30
.60
a P
rice
s fo
r in
divid
ua
l sa
les m
ay v
ary
sig
nific
an
tly fro
m th
e a
ve
rag
es s
ho
wn
in th
is ta
ble
be
cau
se
of d
iffe
ren
ce
s in
sp
ecie
s m
ix, q
ua
lity, ro
ad
co
sts
, lo
gg
ing
an
d p
roce
ssin
g c
osts
, siz
e a
ndle
ng
th o
f sa
le, n
um
be
r of b
idd
ers
, an
d o
the
r re
late
d p
rice
de
term
ina
nts. B
efo
re 1
98
4, p
rice
s fo
r stu
mp
age
on
Na
tio
nal F
ore
st l
and
s a
re s
tatistica
l hig
h b
ids. T
he
sta
tistica
l hig
h b
id is
de
fin
eda
s t
he
bid
pri
ce
min
us c
redi
ts fo
r ro
ad
co
sts
; it in
clu
de
s a
n a
llow
anc
e fo
r sa
le-a
rea
be
tte
rme
nt (
K-V
fu
nd
s).
Be
gin
nin
g in
19
84
, p
rice
s f
or
stu
mp
age
on
Na
tio
nal F
ore
st
land
s a
re h
igh
bid
va
lue.
Ro
ad
co
sts
and
an
allo
wa
nce
for
sa
le-a
rea
be
tte
rme
nt a
re in
clu
ded
in
th
e b
id.
b I
nclu
des P
ort
-Orf
ord
-ced
ar,
Ala
ska
ced
ar,
ince
nse c
ed
ar,
an
d w
este
rn r
edce
da
r.
So
urc
e:
Fo
rest
Se
rvic
e,
U.S
. D
ep
art
me
nt
of
Ag
ricu
ltu
re.
Pa
cific
Nor
thw
est
Reg
ion
in
clu
des
Ore
go
n a
nd W
ash
ing
ton
an
d a
sm
all
po
rtio
n o
f n
ort
he
rn C
alif
orn
ia.
148

Figu
re 7
—A
vera
ge s
tum
page
pric
es fo
r saw
timbe
rsol
d on
Nat
iona
l Fo
rest
s, P
acifi
c N
orth
wes
t Reg
ion,
in d
olla
rs p
er th
ousa
nd b
oard
feet
0
100
200
300
400
500
600
700
800
1995
1996
1997
1998
1999
2000
2001
2002
2003
2004
2005
Wes
t-sid
e D
ougl
as-fi
rP
onde
rosa
pin
eW
este
rn h
emlo
ckO
ther
true
firs
149

150
Table 95—Volume and average value of timber harvested on the National Forests of the Pacific
Northwest Region, 2005
(Volume in million board feet; value in dollars per thousand board feet)
Colville Deschutes Fremont Gifford Pinchot Malheur
Quarter VolumeAverage
value VolumeAverage
value VolumeAverage
value VolumeAverage
value VolumeAverage
value
1st qtr. 3.0 77.67 43.6 87.79 .7 18.68 .7 137.00 1.0 33.942d qtr. 1.9 90.62 27.7 84.55 .8 21.42 1.2 109.93 .4 21.773d qtr. 12.5 121.59 13.5 65.38 5.6 52.80 3.2 175.99 5.4 117.714th qtr. 9.6 114.98 25.4 85.97 2.0 47.11 2.6 111.35 7.1 128.04
Total 26.9 112.23 110.1 83.82 9.0 46.29 7.7 140.60 13.9 114.14
Mount Baker-Snoqualmie Mount Hood Ochoco Okanogan Olympic
VolumeAverage
value VolumeAverage
value VolumeAverage
value VolumeAverage
value VolumeAverage
value
1st qtr. .9 134.24 3.2 116.37 1.9 32.57 1.3 151.70 5.4 108.992d qtr. .7 48.87 6.5 139.23 .3 61.00 1.5 58.05 2.2 154.853d qtr. .1 27.57 14.3 139.58 1.1 29.62 1.2 51.62 2.7 109.824th qtr. 0 -- 9.6 101.98 .4 25.33 2.0 62.13 4.7 125.96
Total 1.8 90.12 33.5 126.57 3.8 33.33 6.0 78.14 15.0 121.29
Rogue River a Siskiyou a Siuslaw Umatilla Umpqua
VolumeAverage
value VolumeAverage
value VolumeAverage
value VolumeAverage
value VolumeAverage
value 1st qtr. 1.3 142.93 6.5 76.99 5.6 165.22 3.8 103.56 3.2 149.122d qtr. 2.6 227.82 23.0 41.68 .2 49.74 2.9 90.52 8.3 40.123d qtr. 2.9 65.57 13.2 92.97 6.7 159.58 5.5 63.46 9.8 139.114th qtr. 1.5 200.92 5.5 53.24 6.7 169.43 9.4 77.31 1.4 28.00
Total 8.4 153.08 48.2 61.80 19.2 163.34 21.6 80.22 22.7 97.62
Wallowa-Whitman Wenatchee Willamette WinemaWesternOregon
VolumeAverage
value VolumeAverage
value VolumeAverage
value VolumeAverage
value VolumeAverage
value
1st qtr. 1.2 15.93 6.3 80.43 7.3 190.06 11.1 64.47 27.1 141.942d qtr. .9 63.92 13.2 78.15 9.7 204.75 2.4 82.58 50.3 95.203d qtr. 4.9 33.66 7.8 46.24 24.5 259.75 3.7 18.25 71.3 170.954th qtr. 4.3 13.98 7.6 43.93 22.3 201.71 6.9 123.05 47.1 154.25
Total 11.2 26.78 34.9 63.96 63.8 223.11 24.0 75.96 195.8 143.46
EasternOregon
WesternWashington
EasternWashington
AllForests
VolumeAverage
value VolumeAverage
value VolumeAverage
value VolumeAverage
value
1st qtr. 63.0 79.97 7.1 115.21 10.9 88.71 108.0 98.682d qtr. 35.4 81.98 4.2 123.30 16.5 77.71 106.4 89.193d qtr. 38.6 61.16 6.0 143.51 22.5 89.16 138.4 125.884th qtr. 54.4 86.23 7.3 120.23 20.3 83.97 129.0 112.61
Total 191.4 78.33 24.5 125.02 70.1 84.89 481.8 108.13
a Includes a small portion of the Forest that lies in northern California. Source: Forest Service, U.S. Department of Agriculture. Pacific Northwest Region includes Oregon and Washington and a smallportion of northern California.

151
Table 96—Volume and average stumpage price of selected species sold on the National Forests of the
Pacific Northwest Region, 2005 a b
(Volume in thousand board feet, Scribner scale; value in dollars per thousand board feet)
Douglas-firPonderosa and
Jeffrey pinesWesternhemlock True firsc All speciesWest side East side
National Forest Volume Value Volume Value Volume Value Volume Value Volume Value Volume Value
Western Oregon:Mount Hood--
1st quarter 0 -- 0 -- 0 -- 0 -- 0 -- 1,260 18.072d quarter 3,980 187.82 0 -- 0 -- 753 84.55 0 -- 5,501 147.593d quarter 1,047 99.65 0 -- 0 -- 3 162.46 0 -- 1,050 99.834th quarter 3,247 110.01 857 181.99 0 -- 2,716 127.05 0 -- 8,034 106.96
Total and average 8,274 146.13 857 181.99 0 -- 3,472 117.87 0 -- 15,845 113.52
Rogue River--
1st quarter 1,933 207.15 0 -- 255 292.26 0 -- 317 112.91 2,505 203.892d quarter 0 -- 0 -- 0 -- 0 -- 0 -- 0 --3d quarter 0 -- 0 -- 0 -- 0 -- 0 -- 0 --4th quarter 3,098 256.87 0 -- 0 -- 0 -- 1,272 59.94 4,370 199.55
Total and average 5,031 237.77 0 -- 255 292.26 0 -- 1,589 70.51 6,875 201.13
Siskiyou--
1st quarter 2,179 294.54 0 -- 0 -- 0 -- 0 -- 2,491 257.772d quarter 2,732 23.60 0 -- 551 19.71 0 -- 0 -- 4,248 21.163d quarter 2,425 149.78 0 -- 0 -- 0 -- 199 307.16 2,624 161.724th quarter 7,872 140.47 0 -- 0 -- 0 -- 0 -- 7,872 140.47
Total and average 15,208 143.03 0 -- 551 19.71 0 -- 199 307.16 17,235 131.25
Siuslaw--1st quarter 11,228 223.67 0 -- 0 -- 1,117 25.06 0 -- 12,345 205.702d quarter 8,218 180.08 0 -- 0 -- 3,687 18.63 0 -- 11,905 130.083d quarter 4,786 153.70 0 -- 0 -- 1,227 27.24 0 -- 6,035 127.904th quarter 2,480 168.19 0 -- 0 -- 1,727 21.15 0 -- 4,308 105.68
Total and average 26,712 192.57 0 -- 0 -- 7,758 21.48 0 -- 34,593 153.65
Umpqua--
1st quarter 0 -- 0 -- 0 -- 0 -- 0 -- 0 --2d quarter 133 91.45 0 -- 0 -- 0 -- 0 -- 133 91.453d quarter 3,861 418.02 0 -- 1,691 14.53 3,238 14.53 0 -- 8,876 189.924th quarter 2,635 96.44 0 -- 0 -- 0 -- 2,051 96.56 5,070 89.33
Total and average 6,629 283.64 0 -- 1,691 14.53 3,238 14.53 2,051 96.56 14,079 152.77
Willamette--
1st quarter 36 341.76 0 -- 0 -- 0 -- 0 -- 36 341.762d quarter 7,952 234.03 0 -- 0 -- 971 127.27 0 -- 8,931 222.293d quarter 21,598 211.56 0 -- 0 -- 0 -- 0 -- 21,944 208.314th quarter 18,170 187.51 0 -- 0 -- 95 64.38 0 -- 18,340 167.68
Total and average 47,756 206.25 0 -- 0 -- 1,066 121.67 0 -- 49,251 195.81
All western Oregon:1st quarter 15,376 231.91 0 -- 265 292.26 1,117 25.06 317 112.91 18,637 199.992d quarter 23,015 180.97 0 -- 551 19.71 5,411 47.30 0 -- 30,718 144.803d quarter 33,717 219.07 0 -- 1,691 14.53 4,468 18.12 199 307.16 40,529 186.484th quarter 37,502 168.98 857 181.99 0 -- 4,538 85.44 3,323 82.54 47,994 142.11
Total and average 109,610 195.73 857 181.99 2,497 44.04 15,534 48.45 3,839 96.69 137,878 163.58 Western Washington:
Gifford Pinchot--1st quarter 56 437.67 0 -- 0 -- 0 -- 0 -- 56 437.672d quarter 0 -- 0 -- 0 -- 0 -- 0 -- 0 --3d quarter 0 -- 0 -- 0 -- 0 -- 0 -- 0 --4th quarter 7,912 244.57 0 -- 0 -- 788 89.40 4,236 120.92 12,936 194.63
Total and average 7,968 245.92 0 -- 0 -- 788 89.40 4,236 120.92 12,992 195.67
Mount Baker-Snoqualmie--
1st quarter 0 -- 0 -- 0 -- 0 -- 0 -- 0 --2d quarter 3,468 204.30 0 -- 0 -- 2,909 58.48 0 -- 7,256 149.233d quarter 0 -- 0 -- 0 -- 0 -- 0 -- 0 --4th quarter 0 -- 0 -- 0 -- 0 -- 0 -- 0 --
Total and average 3,468 204.30 0 -- 0 -- 2,909 58.48 0 -- 7,256 149.23
Olympic--1st quarter 0 -- 0 -- 0 -- 0 -- 0 -- 0 --2d quarter 2,168 247.52 0 -- 0 -- 320 162.95 0 -- 2,488 236.643d quarter 4,953 168.43 0 -- 0 -- 8,570 37.65 0 -- 14,150 85.974th quarter 2,976 229.91 0 -- 0 -- 1,064 23.03 0 -- 4,072 174.16
Total and average 10,097 203.53 0 -- 0 -- 9,954 40.12 0 -- 20,710 121.41

152
Table 96--Volume and average stumpage price of selected species sold on the National Forests of the
Pacific Northwest Region, 2005a b (continued)
(Volume in thousand board feet, Scribner scale; value in dollars per thousand board feet)
Douglas-firPonderosa and
Jeffrey pinesWesternhemlock True firsc All speciesWest side East side
National Forest Volume Value Volume Value Volume Value Volume Value Volume Value Volume Value
All western Washington:1st quarter 56 437.67 0 -- 0 -- 0 -- 0 -- 56 437.672d quarter 5,636 220.93 0 -- 0 -- 3,229 68.83 0 -- 9,744 171.553d quarter 4,953 168.43 0 -- 0 -- 8,570 37.65 0 -- 14,150 85.974th quarter 10,888 240.56 0 -- 0 -- 1,852 51.27 4,236 120.92 17,008 189.73
Total and average 21,533 219.34 0 -- 0 -- 13,651 46.87 4,236 120.92 40,958 149.90 All western Oregon andwestern Washington:
1st quarter 15,432 232.66 0 -- 255 292.26 1,117 25.06 317 112.91 18,693 200.712d quarter 28,651 188.83 0 -- 551 19.71 8,640 55.35 0 -- 40,462 151.243d quarter 38,670 212.58 0 -- 1,691 14.53 13,038 30.96 199 307.16 54,679 160.474th quarter 48,390 185.09 857 181.99 0 -- 6,390 75.53 7,559 104.05 65,002 154.57
Total and average 131,143 199.61 857 181.99 2,497 44.04 29,185 47.71 8,075 109.40 178,836 160.44 Eastern Oregon:
Deschutes--1st quarter 0 -- 8,857 121.80 28,160 29.43 0 -- 9,585 3.79 46,602 41.712d quarter 0 -- 3 46.02 42 167.38 0 -- 3 25.04 666 39.493d quarter 0 -- 29,785 114.39 13,543 7.21 0 -- 17,161 17.30 60,729 62.814th quarter 0 -- 0 -- 185 109.10 0 -- 0 -- 8,658 51.39
Total and average 0 -- 38,645 116.09 41,930 22.74 0 -- 26,749 12.46 116,655 53.40
Fremont--1st quarter 0 -- 0 -- 0 -- 0 -- 0 -- 0 --2d quarter 0 -- 0 -- 7,555 15.57 0 -- 1,812 18.34 9,367 16.103d quarter 0 -- 0 -- 6,440 38.96 0 -- 1,572 43.97 9,926 32.454th quarter 351 12.15 0 -- 3,797 70.34 0 -- 353 66.60 5,500 73.10
Total and average 351 12.15 0 -- 17,792 35.73 0 -- 3,737 33.68 24,793 35.29
Malheur--
1st quarter 0 -- 0 -- 0 -- 0 -- 0 -- 0 --2d quarter 0 -- 576 66.23 2,803 43.82 0 -- 0 -- 3,379 47.643d quarter 0 -- 916 114.09 4,706 150.14 0 -- 3,688 32.29 9,586 97.284th quarter 0 -- 1,010 148.09 2,393 119.27 0 -- 0 -- 3,403 127.82
Total and average 0 -- 2,502 116.80 9,902 112.58 0 -- 3,688 32.29 16,368 93.38
Ochoco--
1st quarter 0 -- 0 -- 24 46.25 0 -- 0 -- 25 44.402d quarter 0 -- 0 -- 221 22.50 0 -- 0 -- 248 20.163d quarter 0 -- 748 346.91 649 321.22 0 -- 45 179.23 1,464 325.174th quarter 0 -- 545 57.73 3,004 44.83 0 -- 306 39.03 3,855 46.19
Total and average 0 -- 1,293 225.02 3,898 89.59 0 -- 351 57.00 5,592 118.07
Umatilla--
1st quarter 0 -- 0 -- 0 -- 0 -- 0 -- 0 --2d quarter 0 -- 1,566 206.01 293 63.39 0 -- 2,713 37.36 4,585 96.583d quarter 0 -- 6,165 230.52 239 39.33 0 -- 4,892 79.19 12,256 150.534th quarter 3,185 287.30 0 -- 0 -- 0 -- 7,971 151.51 11,156 190.28
Total and average 3,185 287.30 7,731 225.56 532 52.58 0 -- 15,576 108.91 27,997 157.53
Wallowa-Whitman--1st quarter 0 -- 0 -- 0 -- 0 -- 0 -- 0 --2d quarter 0 -- 415 130.07 458 127.53 0 -- 248 206.52 1,128 146.343d quarter 0 -- 71 133.08 25 71.16 0 -- 113 99.12 275 85.234th quarter 0 -- 1,416 106.09 657 85.45 0 -- 3,341 40.70 5,535 61.59
Total and average 0 -- 1,902 112.33 1,140 102.04 0 -- 3,702 53.59 6,938 76.31
Winema--1st quarter 0 -- 0 -- 2,407 49.32 0 -- 0 -- 2,507 47.502d quarter 0 -- 0 -- 135 231.87 0 -- 0 -- 542 202.783d quarter 0 -- 0 -- 453 144.15 0 -- 0 -- 2,116 100.754th quarter 191 103.05 0 -- 8,713 164.16 0 -- 5,129 120.01 15,675 136.42
Total and average 191 103.05 0 -- 11,708 140.55 0 -- 5,129 120.01 20,840 123.83
All eastern Oregon:
1st quarter 0 -- 8,857 121.80 30,591 31.01 0 -- 9,585 3.79 49,134 42.012d quarter 0 -- 2,560 162.06 11,507 31.35 0 -- 4,776 38.92 19,915 53.273d quarter 0 -- 37,685 138.03 26,055 51.43 0 -- 27,471 32.46 96,352 79.154th quarter 3,727 251.94 2,971 111.50 18,749 117.01 0 -- 17,100 116.65 53,782 112.72
Total and average 3,727 251.94 52,073 134.94 86,902 55.73 0 -- 58,932 52.75 219,183 76.71

153
Table 96--Volume and average stumpage price of selected species sold on the National Forests of the
Pacific Northwest Region, 2005a b (continued)
(Volume in thousand board feet, Scribner scale; value in dollars per thousand board feet)
Douglas-firPonderosa and
Jeffrey pinesWesternhemlock True firsc All speciesWest side East side
National Forest Volume Value Volume Value Volume Value Volume Value Volume Value Volume Value
Eastern Washington:Colville--
1st quarter 0 -- 0 -- 0 -- 0 -- 0 -- 0 --2d quarter 0 -- 1,313 328.34 0 -- 629 0.74 1,709 449.76 8,906 264.993d quarter 0 -- 869 258.66 7 194.72 0 -- 156 185.05 1,380 238.704th quarter 0 -- 9,505 121.54 624 38.86 0 -- 1,630 130.72 12,670 121.68
Total and average 0 -- 11,687 154.97 631 40.59 629 0.74 3,495 289.15 22,956 183.35
Okanogan --1st quarter 0 -- 0 -- 0 -- 0 -- 0 -- 0 --
2d quarter 0 -- 0 -- 0 -- 0 -- 0 -- 14 25.57 3d quarter 0 -- 3,926 104.33 641 101.89 0 -- 0 -- 4,870 100.13 4th quarter 0 -- 2,001 59.46 0 -- 0 -- 0 -- 2,781 74.57
Total and average 0 -- 5,927 89.18 641 101.89 0 -- 0 -- 7,665 90.72
Wenatchee -- 1st quarter 0 -- 0 -- 0 -- 0 -- 0 -- 0 --
2d quarter 0 -- 5,672 47.31 4,281 41.95 0 -- 382 158.83 10,356 49.123d quarter 0 - 11,545 62.08 1,752 76.71 0 - 4,066 100.79 18,259 77.654th quarter 0 -- 688 52.13 0 -- 0 -- 0 -- 850 42.38
Total and average 0 -- 17,905 57.02 6,033 52.04 0 -- 4,448 105.77 29,465 66.60
All eastern Washington:1st quarter 0 -- 0 -- 0 -- 0 -- 0 -- 0 --2d quarter 0 -- 6,985 100.14 4,281 41.95 629 0.74 2,091 396.61 19,276 148.843d quarter 0 -- 16,340 82.69 2,400 83.78 0 -- 4,222 103.90 24,509 90.284th quarter 0 -- 12,194 107.44 624 38.86 0 -- 1,630 130.72 16,301 109.51
Total and average 0 -- 35,519 94.61 7,305 55.43 629 0.74 7,943 186.46 60,086 114.28 All eastern Oregonand eastern Washington:
1st quarter 0 -- 8,857 121.80 30,591 31.01 0 -- 9,585 3.79 49,134 42.012d quarter 0 -- 9,545 116.74 15,788 34.22 629 0.74 6,867 147.84 39,191 100.283d quarter 0 -- 54,025 121.29 28,455 54.16 0 -- 31,693 41.98 120,861 81.414th quarter 3,727 251.94 15,165 108.23 19,373 114.49 0 -- 18,730 117.87 70,083 111.97
Total and average 3,727 251.94 87,592 118.59 94,207 55.71 629 0.74 66,875 68.63 279,269 84.79 Pacific Northwest Region:
1st quarter 15,432 232.66 8,857 121.80 30,846 33.17 1,117 25.06 9,902 7.28 67,827 85.742d quarter 28,651 188.83 9,545 116.74 16,339 33.73 9,269 51.64 6,867 147.84 79,653 126.163d quarter 38,670 212.58 54,025 121.29 30,146 51.94 13,038 30.96 31,892 43.63 175,540 106.044th quarter 52,117 189.87 16,022 112.18 19,373 114.49 6,390 75.53 26,289 113.90 135,085 132.47
Total and average 134,870 201.06 88,449 119.20 96,704 55.41 29,814 46.72 74,950 73.02 458,105 114.33
All of Oregon: 1st quarter 15,376 231.91 8,857 121.80 30,846 33.17 1,117 25.06 9,902 7.28 67,771 85.452d quarter 23,015 180.97 2,560 162.06 12,058 30.82 5,411 47.30 4,776 38.92 50,633 108.803d quarter 33,717 219.07 37,685 138.03 27,746 49.18 4,468 18.12 27,670 34.44 136,881 110.934th quarter 41,229 176.48 3,828 127.28 18,749 117.01 4,538 85.44 20,423 111.10 101,776 126.58
Total and average 113,337 197.58 52,930 135.70 89,399 55.40 15,534 48.45 62,771 55.44 357,061 110.25
All of Washington:
1st quarter 56 437.67 0 -- 0 -- 0 -- 0 -- 56 437.672d quarter 5,636 220.93 6,985 100.14 4,281 41.95 3,858 57.73 2,091 396.61 29,020 156.473d quarter 4,953 168.43 16,340 82.69 2,400 83.78 8,570 37.65 4,222 103.90 38,659 88.704th quarter 10,888 240.56 12,194 107.44 624 38.86 1,852 51.27 5,866 123.64 33,309 150.47
Total and average 21,533 219.34 35,519 94.61 7,305 55.43 14,280 44.84 12,179 163.67 101,044 128.72
a Preliminary. b Prices for individual sales may vary from the averages shown in this table because of differences in species mix, quality, road costs, logging and processing costs, size and length of sale, numberof bidders, and other related price determinants. Prices for stumpage in National Forest lands are high bid value. Road costs and an allowance for sale-area betterment are included in the bid. c Does not include noble fir or Shasta red fir. Source: Forest Service, U.S. Department of Agriculture. Pacific Northwest Region includes Oregon and Washington and a small portion of northern California.

Ta
ble
97
—V
olu
me
of
tim
be
r s
old
on
pu
bli
cly
ow
ne
d o
r m
an
ag
ed
la
nd
s i
n A
las
ka
, 2
00
0-2
00
5
(In
th
ou
sa
nd b
oa
rd f
eet
, S
cri
bn
er
sca
le)
20
04
20
05
Ag
en
cy
20
00
20
01
20
02
20
03
To
tal
4th
qtr
.1st
qtr
.2d q
tr.
3d q
tr.
4th
qtr
.T
ota
l
US
DA
For
est
Serv
ice
a9
2,3
77
52
,83
82
3,6
69
56
,09
48
8,8
58
24
,97
78
,75
52
0,6
74
10
,72
24
1,6
64
81
,81
5
U.S
. B
ure
au
of
La
nd
Man
ag
e.b
20
00
33
60
00
NA
NA
NA
NA
NA
Sta
te o
f A
laska
9,0
03
NA
NA
18
,60
5N
AN
AN
AN
AN
AN
AN
A
To
tal
10
1,5
80
NA
NA
74
,69
9N
AN
AN
AN
AN
AN
AN
A
No
te:
Th
e U
.S. B
ure
au
of
Ind
ian
Aff
air
s lan
d
is n
ow
pri
va
tely
ow
ne
d a
nd
no
lo
nge
r m
an
ag
ed
by t
he
BIA
. T
ha
t ca
teg
ory
ha
s b
ee
n d
rop
pe
d.
NA
= n
ot
ava
ilab
le.
a C
on
vert
ible
pro
du
cts
on
ly.
b D
oe
s n
ot
inclu
de
cu
ll lo
g s
ale
s o
r vo
lum
e g
ive
n a
wa
y th
roug
h f
ree
use
pe
rmits.
So
urc
e:
Re
sp
ective
ag
en
cie
s li
ste
d.
154

Ta
ble
98
—A
ve
rag
e s
tum
pa
ge
pri
ce
s o
f ti
mb
er
so
ld o
n p
ub
lic
ly o
wn
ed
or
ma
na
ge
d l
an
ds
in
Ala
sk
a,
20
00
-20
05
(In
dol
lars
pe
r th
ou
sa
nd
bo
ard
fe
et)
20
04
20
05
Ag
en
cy
20
00
20
01
20
02
20
03
Ave
rag
e4th
qtr
.1st
qtr
.2d q
tr.
3d q
tr.
4th
qtr
.A
ve
rag
e
US
DA
For
est
Serv
ice
a4
0.5
63
4.7
04
1.6
52
3.0
51
0.4
55
.81
16
.57
11
.28
21
.20
14
.27
14
.67
U.S
. B
ure
au
of
La
nd
Man
ag
e.b
10
.00
--3
3.3
3--
----
NA
NA
NA
NA
NA
Sta
te o
f A
laska
NA
NA
NA
NA
NA
NA
NA
NA
NA
NA
14
.95
Ave
rag
eN
AN
AN
AN
AN
AN
AN
AN
AN
AN
AN
A
No
te:
Th
e U
.S.
Bu
rea
u o
f In
dia
n A
ffa
irs
la
nd
is
no
w p
riv
ate
ly o
wn
ed
an
d n
o lo
ng
er
ma
na
ge
d b
y t
he
BIA
. T
ha
t c
ate
go
ry h
as
be
en
dro
pp
ed
.
NA
= n
ot
ava
ilab
le.
a P
rice
s r
ece
ived
fo
r in
div
idu
al sa
les m
ay v
ary
sig
nifi
ca
ntly f
rom
th
e a
ve
rag
es s
how
n in
th
is t
ab
le b
ecau
se
of
diffe
ren
ce
s in
sp
ecie
s m
ix,
qu
alit
y,
roa
d c
osts
, lo
gg
ing
an
d p
roce
ssin
gco
sts
, siz
e a
nd
len
gth
of
sa
le, n
um
be
r o
f b
idde
rs,
an
d o
the
r re
late
d p
rice
de
term
ina
nts
. P
rice
s f
or
stu
mp
ag
e o
n N
atio
nal
Fo
rest
lan
ds a
re h
igh
bid
va
lue
. R
oa
d c
osts
are
no
t in
clu
ded
in t
he b
id.
b D
oe
s n
ot
inclu
de
cu
ll lo
g s
ale
s o
r vo
lum
e g
ive
n a
wa
y th
roug
h f
ree
use
pe
rmits.
So
urc
e:
Re
spe
ctive a
ge
ncie
s lis
ted
. 155
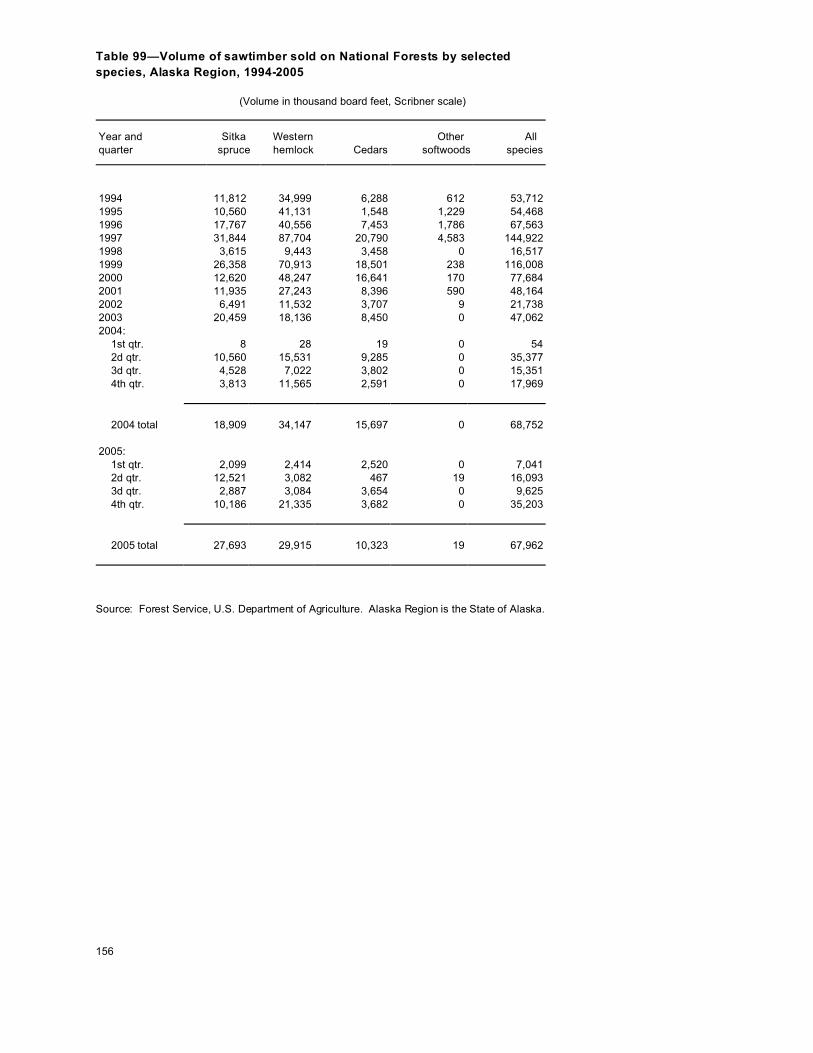
156
Table 99—Volume of sawtimber sold on National Forests by selected
species, Alaska Region, 1994-2005
(Volume in thousand board feet, Scribner scale)
Year and Sitka Western Other All quarter spruce hemlock Cedars softwoods species
1994 11,812 34,999 6,288 612 53,7121995 10,560 41,131 1,548 1,229 54,4681996 17,767 40,556 7,453 1,786 67,5631997 31,844 87,704 20,790 4,583 144,9221998 3,615 9,443 3,458 0 16,5171999 26,358 70,913 18,501 238 116,0082000 12,620 48,247 16,641 170 77,6842001 11,935 27,243 8,396 590 48,1642002 6,491 11,532 3,707 9 21,7382003 20,459 18,136 8,450 0 47,0622004: 1st qtr. 8 28 19 0 54 2d qtr. 10,560 15,531 9,285 0 35,377 3d qtr. 4,528 7,022 3,802 0 15,351 4th qtr. 3,813 11,565 2,591 0 17,969
2004 total 18,909 34,147 15,697 0 68,752 2005: 1st qtr. 2,099 2,414 2,520 0 7,041 2d qtr. 12,521 3,082 467 19 16,093 3d qtr. 2,887 3,084 3,654 0 9,625 4th qtr. 10,186 21,335 3,682 0 35,203
2005 total 27,693 29,915 10,323 19 67,962
Source: Forest Service, U.S. Department of Agriculture. Alaska Region is the State of Alaska.

157
Table 100— Average stumpage prices for saw timber sold on National
Forests by selected species, Alaska Region, 1994-2005a
(In dollars per thousand board feet)
Year andquarter
Sitkaspruce
Westernhemlock Cedars
Othersoftwoods
Allspecies
1994 346.11 20.65 670.37 70.34 168.86
1995 278.05 14.75 945.53 25.63 92.50
1996 551.87 1.27 668.55 43.04 220.78
1997 100.37 15.27 675.55 8.81 128.48
1998 123.88 7.34 195.63 -- 70.54
1999 27.90 4.07 91.68 21.73 23.49
2000 96.85 3.20 139.98 25.31 47.77
2001 49.88 4.52 130.23 1.78 37.64
2002 97.75 1.62 85.30 19.57 44.60
2003 31.01 3.50 68.08 -- 27.06
2004:
1st quarter 43.29 2.80 77.38 -- 33.83
2d quarter 17.23 3.25 34.07 -- 15.51
3d quarter 21.35 2.30 23.87 -- 13.26
4th quarter 12.47 2.10 22.35 -- 7.22
2004 average 17.27 2.66 29.71 -- 12.86
2005:
1st quarter 18.95 2.89 37.43 -- 20.04
2d quarter 15.54 2.97 37.67 5.32 13.76
3d quarter 35.64 2.11 31.71 -- 23.40
4th quarter 35.99 2.38 44.47 -- 16.51
2005 average 25.42 2.45 37.93 5.32 17.20
a Prices received for individual sales may vary significantly from the averages shown in this table because of differences in species mix, quality, road costs, logging and processing costs, size and length of sale, number of bidders, and other related price determinants. Source: Forest Service, U.S. Department of Agriculture. Alaska Region is the State of Alaska.
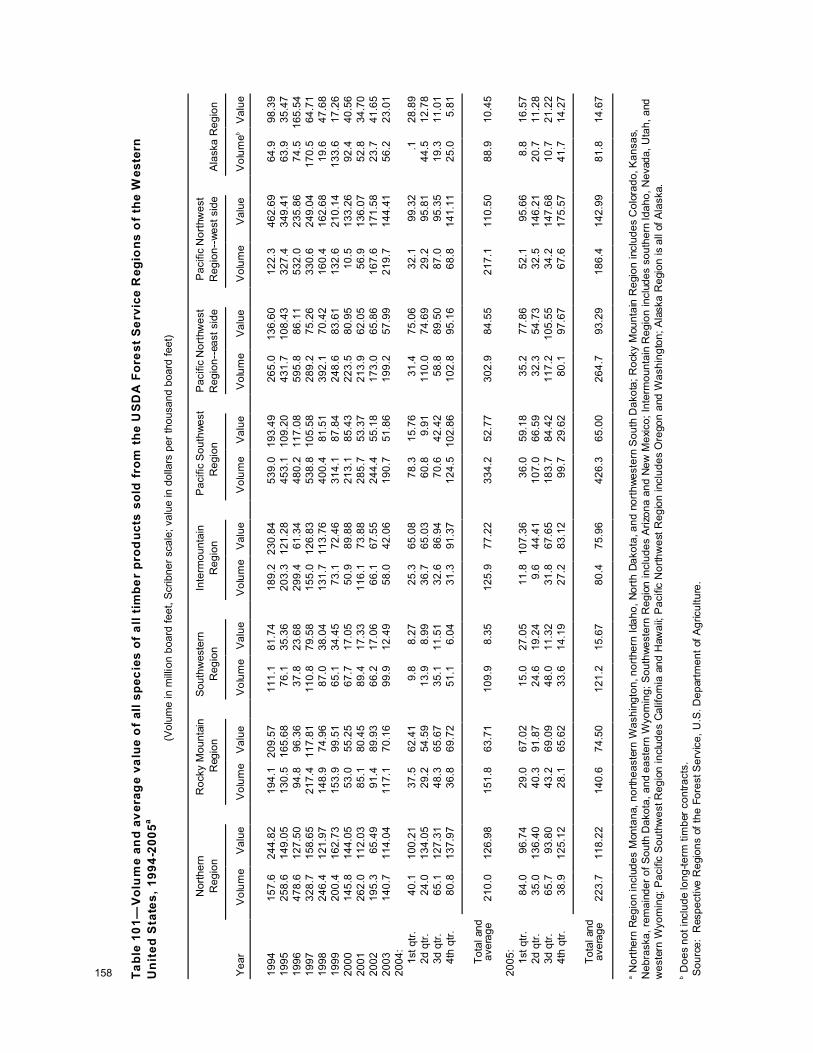
Ta
ble
10
1—
Vo
lum
e a
nd
av
era
ge
va
lue
of
all
sp
ec
ies
of
all
tim
be
r p
rod
uc
ts s
old
fro
m t
he
US
DA
Fo
res
t S
erv
ice
Re
gio
ns
of
the
We
ste
rn
Un
ite
d S
tate
s,
19
94
-20
05
a
(V
olu
me in m
illio
n b
oard
feet, S
crib
ner
scale
; va
lue in d
olla
rs p
er
thousa
nd b
oard
feet)
Nort
hern
Ro
cky M
ou
nta
inS
outh
west
ern
Inte
rmo
un
tain
Pa
cific
So
uth
we
st
Pa
cific
No
rthw
est
Pa
cific
No
rthw
est
Re
gio
n
Reg
ion
Re
gio
nR
eg
ion
Re
gio
n
R
eg
ion
--ea
st
sid
eR
eg
ion
--w
est
sid
e
Ala
ska
Re
gio
n
Ye
ar
Vo
lum
eV
alu
eV
olu
me
Va
lue
Vo
lum
eV
alu
eV
olu
me
Va
lue
Vo
lum
eV
alu
eV
olu
me
Va
lue
Vo
lum
eV
alu
eV
olu
me
bV
alu
e
19
94
15
7.6
24
4.8
21
94
.12
09
.57
11
1.1
81
.74
18
9.2
23
0.8
45
39
.01
93
.49
26
5.0
13
6.6
01
22
.34
62
.69
64
.99
8.3
91
99
52
58
.61
49
.05
13
0.5
16
5.6
87
6.1
35
.36
20
3.3
12
1.2
84
53
.11
09
.20
43
1.7
10
8.4
33
27
.43
49
.41
63
.93
5.4
71
99
64
78
.61
27
.50
94
.89
6.3
63
7.8
23
.68
29
9.4
61
.34
48
0.2
11
7.0
85
95
.88
6.1
15
32
.02
35
.86
74
.51
65
.54
19
97
32
8.7
15
8.6
52
17
.41
17
.81
11
0.8
79
.58
15
5.0
12
6.8
35
38
.81
05
.58
28
9.2
75
.26
33
0.6
24
9.0
41
70
.56
4.7
11
99
82
46
.41
21
.97
14
8.9
74
.96
87
.03
8.0
41
31
.71
13
.76
40
0.4
81
.51
39
2.1
70
.42
16
0.4
16
2.6
81
9.6
47
.68
19
99
20
0.4
16
2.7
31
53
.99
9.5
16
5.1
34
.45
73
.17
2.4
63
14
.18
7.8
42
48
.68
3.6
11
32
.62
10
.14
13
3.6
17
.26
20
00
14
5.8
14
4.0
55
3.0
55
.25
67
.71
7.0
55
0.9
89
.88
21
3.1
85
.43
22
3.5
80
.95
10
.51
33
.26
92
.44
0.5
62
00
12
62
.01
12
.03
85
.18
0.4
58
9.4
17
.33
11
6.1
73
.88
28
5.7
53
.37
21
3.9
62
.05
56
.91
36
.07
52
.83
4.7
02
00
21
95
.36
5.4
99
1.4
89
.93
66
.21
7.0
66
6.1
67
.55
24
4.4
55
.18
17
3.0
65
.86
16
7.6
17
1.5
82
3.7
41
.65
20
03
14
0.7
11
4.0
41
17
.17
0.1
69
9.9
12
.49
58
.04
2.0
61
90
.75
1.8
61
99
.25
7.9
92
19
.71
44
.41
56
.22
3.0
12
00
4:
1st
qtr
.4
0.1
10
0.2
13
7.5
62
.41
9.8
8.2
72
5.3
65
.08
78
.31
5.7
63
1.4
75
.06
32
.19
9.3
2.1
28
.89
2d q
tr.
24
.01
34
.05
29
.25
4.5
91
3.9
8.9
93
6.7
65
.03
60
.89
.91
11
0.0
74
.69
29
.29
5.8
14
4.5
12
.78
3d q
tr.
65
.11
27
.31
48
.36
5.6
73
5.1
11
.51
32
.68
6.9
47
0.6
42
.42
58
.88
9.5
08
7.0
95
.35
19
.31
1.0
1
4th
qtr
.8
0.8
13
7.9
73
6.8
69
.72
51
.16
.04
31
.39
1.3
71
24
.51
02
.86
10
2.8
95
.16
68
.81
41
.11
25
.05
.81
To
tal an
d
a
ve
rag
e2
10
.01
26
.98
15
1.8
63
.71
10
9.9
8.3
51
25
.97
7.2
23
34
.25
2.7
73
02
.98
4.5
52
17
.11
10
.50
88
.91
0.4
5 2
00
5:
1st
qtr
.8
4.0
96
.74
29
.06
7.0
21
5.0
27
.05
11
.81
07
.36
36
.05
9.1
83
5.2
77
.86
52
.19
5.6
68
.81
6.5
7
2d q
tr.
35
.01
36
.40
40
.39
1.8
72
4.6
19
.24
9.6
44
.41
10
7.0
66
.59
32
.35
4.7
33
2.5
14
6.2
12
0.7
11
.28
3d q
tr.
65
.79
3.8
04
3.2
69
.09
48
.01
1.3
23
1.8
67
.65
18
3.7
84
.42
11
7.2
10
5.5
53
4.2
14
7.6
81
0.7
21
.22
4th
qtr
.3
8.9
12
5.1
22
8.1
65
.62
33
.61
4.1
92
7.2
83
.12
99
.72
9.6
28
0.1
97
.67
67
.61
75
.57
41
.71
4.2
7
T
ota
l an
d
a
ve
rag
e2
23
.71
18
.22
14
0.6
74
.50
12
1.2
15
.67
80
.47
5.9
64
26
.36
5.0
02
64
.79
3.2
91
86
.41
42
.99
81
.81
4.6
7
a N
ort
hern
Re
gio
n in
clu
de
s M
onta
na,
no
rth
ea
ste
rn W
ash
ing
ton
, n
ort
he
rn I
dah
o,
No
rth
Da
ko
ta, a
nd
no
rth
we
ste
rn S
ou
th D
ako
ta;
Ro
cky M
ou
nta
in R
egio
n inc
lud
es
Co
lora
do
, K
an
sa
s,N
eb
raska
, re
ma
ind
er
of
So
uth
Da
ko
ta,
an
d e
aste
rn W
yo
min
g;
So
uth
we
ste
rn R
eg
ion
in
clu
de
s A
rizo
na
an
d N
ew
Me
xico
; In
term
ou
nta
in R
eg
ion
in
clu
de
s s
ou
the
rn Id
ah
o,
Ne
vad
a,
Uta
h,
and
we
ste
rn W
yo
min
g;
Pa
cific
So
uth
we
st R
eg
ion
in
clu
de
s C
alif
orn
ia a
nd
Haw
aii;
Pa
cific
No
rth
we
st R
eg
ion
inclu
de
s O
rego
n a
nd
Wa
sh
ing
ton
; A
laska
Re
gio
n is
all
of
Ala
ska.
b D
oe
s n
ot
inclu
de
lon
g-t
erm
tim
ber
co
ntr
acts
. S
ou
rce
: R
esp
ective
Re
gio
ns o
f th
e F
ore
st S
erv
ice
, U
.S. D
ep
art
me
nt
of A
gricu
ltu
re.
158
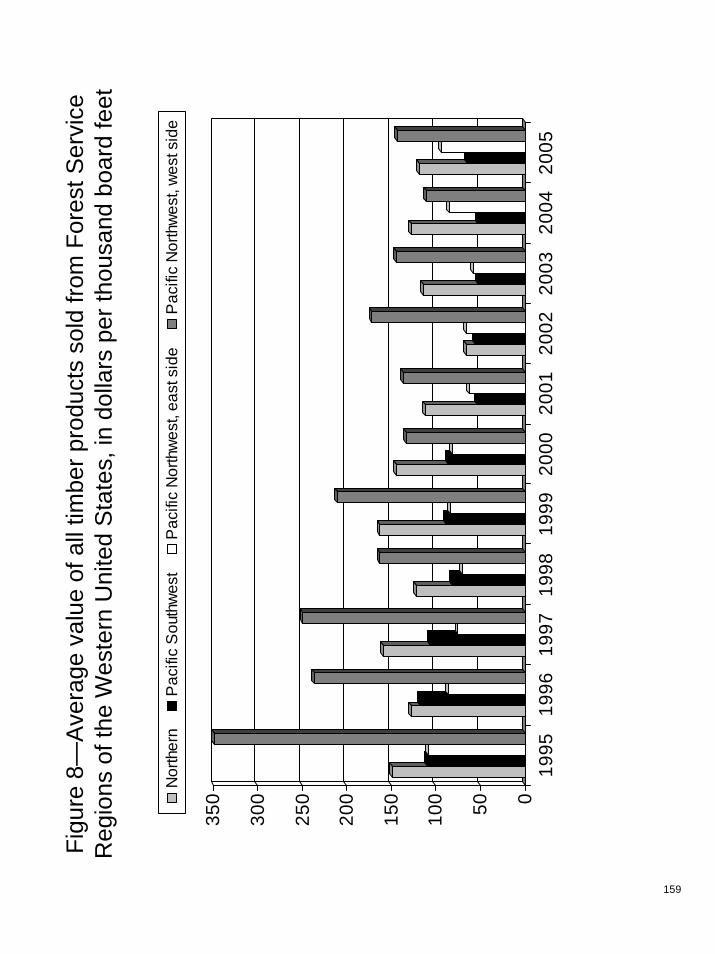
Figu
re 8
—A
vera
ge v
alue
of a
ll tim
ber p
rodu
cts
sold
from
For
est S
ervi
ce
Reg
ions
of t
he W
este
rn U
nite
d S
tate
s, in
dol
lars
per
thou
sand
boa
rd fe
et
050100
150
200
250
300
350
1995
1996
1997
1998
1999
2000
2001
2002
2003
2004
2005
Nor
ther
nP
acifi
c S
outh
wes
tP
acifi
c N
orth
wes
t, ea
st s
ide
Pac
ific
Nor
thw
est,
wes
t sid
e
159

Ta
ble
10
2—
Vo
lum
e a
nd
av
era
ge
va
lue
of
all
sp
ec
ies
of
tim
be
r h
arv
es
ted
fro
m t
he
US
DA
Fo
res
t S
erv
ice
Re
gio
ns
of
the
We
ste
rn U
nit
ed
Sta
tes
, 1
99
4-2
00
5a
(Volu
me in m
illio
n b
oard
feet, S
crib
ner
scale
; va
lue in d
olla
rs p
er
thousa
nd b
oard
feet)
Nort
hern
Re
gio
n
Ro
cky
Mo
un
tain
Re
gio
n
South
west
ern
Re
gio
n
Inte
rmo
un
tain
Re
gio
n
Pa
cific
So
uth
we
st
Re
gio
n
Pa
cific
No
rthw
est
Re
gio
n--
ea
st
sid
e
Pa
cific
No
rthw
est
Re
gio
n--
we
st
sid
eA
laska
Re
gio
n
Ye
ar
Vo
lum
eV
alu
eV
olu
me
Va
lue
Vo
lum
eV
alu
eV
olu
me
Va
lue
Vo
lum
eV
alu
eV
olu
me
Va
lue
Vo
lum
eV
alu
eV
olu
me
Va
lue
19
94
48
5.6
18
5.5
02
47
.81
02
.88
10
9.7
10
4.2
62
51
.51
41
.89
80
7.6
21
5.7
15
22
.52
23
.16
42
6.1
36
7.0
02
51
.94
5.7
61
99
53
25
.61
84
.72
18
4.8
12
0.5
17
8.0
66
.30
21
5.9
12
2.7
25
44
.12
09
.44
48
9.3
18
3.3
73
20
.53
49
.66
19
9.7
66
.34
19
96
34
0.1
18
1.9
21
34
.41
44
.78
45
.75
3.1
22
62
.01
34
.06
45
7.5
13
7.6
84
42
.11
09
.61
29
4.7
37
0.6
39
7.9
10
4.1
41
99
73
52
.11
61
.91
12
9.1
16
9.1
69
7.4
76
.26
20
0.1
15
4.3
55
48
.01
25
.84
47
4.8
12
3.5
83
34
.83
36
.93
12
4.6
16
.41
19
98
33
0.4
15
2.8
61
47
.41
43
.12
96
.13
6.0
41
69
.99
8.0
04
52
.91
06
.64
35
8.5
64
.49
26
7.0
29
2.9
31
21
.54
3.5
01
99
92
65
.41
49
.76
13
9.9
11
8.5
17
5.7
49
.79
13
3.1
96
.64
44
1.4
93
.54
31
6.2
76
.70
21
7.2
23
0.0
41
53
.63
7.6
92
00
02
34
.61
48
.96
12
5.8
10
1.3
86
4.8
37
.80
10
7.0
10
3.5
33
67
.68
7.3
72
30
.36
3.3
01
54
.12
38
.88
11
9.5
39
.35
20
01
17
1.5
12
5.0
01
40
.67
0.7
67
2.8
35
.08
80
.69
2.7
12
97
.24
6.4
52
10
.05
9.1
15
2.0
16
6.4
64
4.4
37
.50
20
02
25
1.2
10
2.1
11
25
.09
9.3
77
2.6
19
.21
84
.47
1.9
72
98
.56
3.2
42
21
.47
2.8
67
7.1
14
5.1
23
2.1
29
.88
20
03
23
3.1
99
.11
11
3.3
80
.66
71
.71
5.0
56
9.8
63
.90
28
4.1
50
.79
22
9.4
58
.89
91
.51
35
.21
48
.23
1.0
12
00
4:
1st
qtr
.4
5.0
15
0.8
82
9.4
12
9.5
51
6.5
14
.71
8.2
79
.72
28
.76
7.0
27
4.7
85
.30
22
.82
01
.02
6.0
9.8
92d q
tr.
41
.91
22
.89
19
.91
33
.69
15
.21
1.8
65
.99
1.8
36
5.5
58
.46
84
.57
5.6
82
1.8
39
8.1
71
2.6
22
.97
3d q
tr.
77
.91
26
.71
43
.61
37
.27
14
.21
2.1
72
7.4
85
.29
10
1.9
49
.46
10
3.1
87
.77
63
.22
00
.20
21
.31
3.0
74th
qtr
.7
3.9
12
5.2
74
8.2
11
0.5
12
9.5
10
.38
25
.35
5.5
56
7.5
38
.04
69
.61
00
.34
67
.31
83
.65
9.4
12
.93
T
ota
l a
nd
ave
rag
e2
38
.71
30
.15
14
1.1
12
6.0
37
5.4
11
.95
66
.87
3.8
22
63
.65
0.6
73
31
.98
6.7
71
75
.02
18
.60
49
.21
5.1
8 2
00
5:
1st
qtr
.5
3.8
11
3.4
23
4.4
13
1.0
11
0.9
12
.66
9.4
37
.55
30
.04
3.9
87
3.9
81
.25
34
.11
36
.42
9.4
17
.22
2d q
tr.
38
.21
29
.96
18
.49
8.1
41
9.7
12
.16
5.5
85
.23
61
.41
05
.67
51
.98
0.6
25
4.5
97
.35
23
.11
0.8
23d q
tr.
78
.11
08
.38
49
.08
0.6
02
7.8
12
.13
22
.86
8.5
61
25
.97
0.1
06
1.0
71
.46
77
.41
68
.81
7.8
5.9
24th
qtr
.6
6.2
11
3.5
84
9.3
88
.05
31
.81
8.6
93
8.0
59
.69
15
6.6
54
.23
74
.78
5.6
25
4.4
14
9.7
06
.32
7.3
0
To
tal a
nd
ave
rag
e2
36
.31
14
.47
15
1.1
96
.67
90
.31
4.5
17
5.7
61
.47
37
4.0
67
.20
26
1.5
80
.09
22
0.3
14
1.4
14
6.6
13
.53
No
te: N
eg
ative
stu
mp
ag
e va
lue
ca
used
by e
me
rgen
cy r
ate
re
dete
rmin
atio
ns.
a N
ort
hern
Re
gio
n in
clu
de
s M
onta
na,
no
rth
ea
ste
rn W
ash
ing
ton
, n
ort
he
rn I
dah
o,
No
rth
Da
ko
ta, a
nd
no
rth
we
ste
rn S
ou
th D
ako
ta;
Ro
cky M
ou
nta
in R
egio
n inc
lud
es
Co
lora
do
, K
an
sa
s,
Ne
bra
ska
, re
ma
ind
er
of
So
uth
Da
ko
ta,
an
d e
aste
rn W
yo
min
g;
So
uth
we
ste
rn r
eg
ion
in
clu
de
s A
rizo
na
an
d N
ew
Me
xico
; In
term
ou
nta
in R
eg
ion
in
clu
de
s s
ou
the
rn Id
ah
o,
Ne
vad
a,
Uta
h,
and
we
ste
rn W
yo
min
g;
Pa
cific
So
uth
we
st
Re
gio
n in
clu
de
s C
alif
orn
ia a
nd
Ha
wai
i; P
acific
No
rth
we
st
Re
gio
n inc
lud
es O
reg
on
an
d W
ash
ing
ton
; A
laska
Re
gio
n is a
ll o
f A
laska
.
So
urc
e:
Re
sp
ective
Re
gio
ns o
f th
e F
ore
st
Se
rvic
e,
U.S
. D
ep
art
me
nt
of
Ag
ricu
ltu
re.
160

161
Table 103—Uncut volume under contract on National Forest lands in Montana, Idaho, California,
Oregon, and Washington, 1995-2005a
(In million board feet, Scribner log rule)
Idaho
Year Californiab Montana Northern Southern Oregon Washington
1995 664.5 292.7 349.1 274.4 810.0 497.1
1996 519.5 323.7 249.2 375.7 503.4 209.7
1997 585.0 386.8 343.7 c282.5 1,176.4 342.5
1998 569.4 c291.6 c284.9 211.5 1,023.5 295.2
1999 467.6 294.7 247.5 162.9 929.4 240.3
2000 359.5 243.3 222.9 165.8 792.5 216.5
2001 278.6 196.5 196.7 187.1 682.9 197.5
2002 336.3 264.1 217.5 165.9 695.5 201.8
2003 305.4 234.9 142.0 106.9 741.6 150.8
2004 254.6 159.3 132.1 140.2 707.9 183.4
2005 353.5 196.1 118.6 162.1 667.0 162.0
a As of June 30 unless otherwise noted. b This figure is sawtimber volume only.
c As of September 30. Source: Forest Service, U.S. Department of Agriculture; and Timber Data Company, Eugene, Oregon.
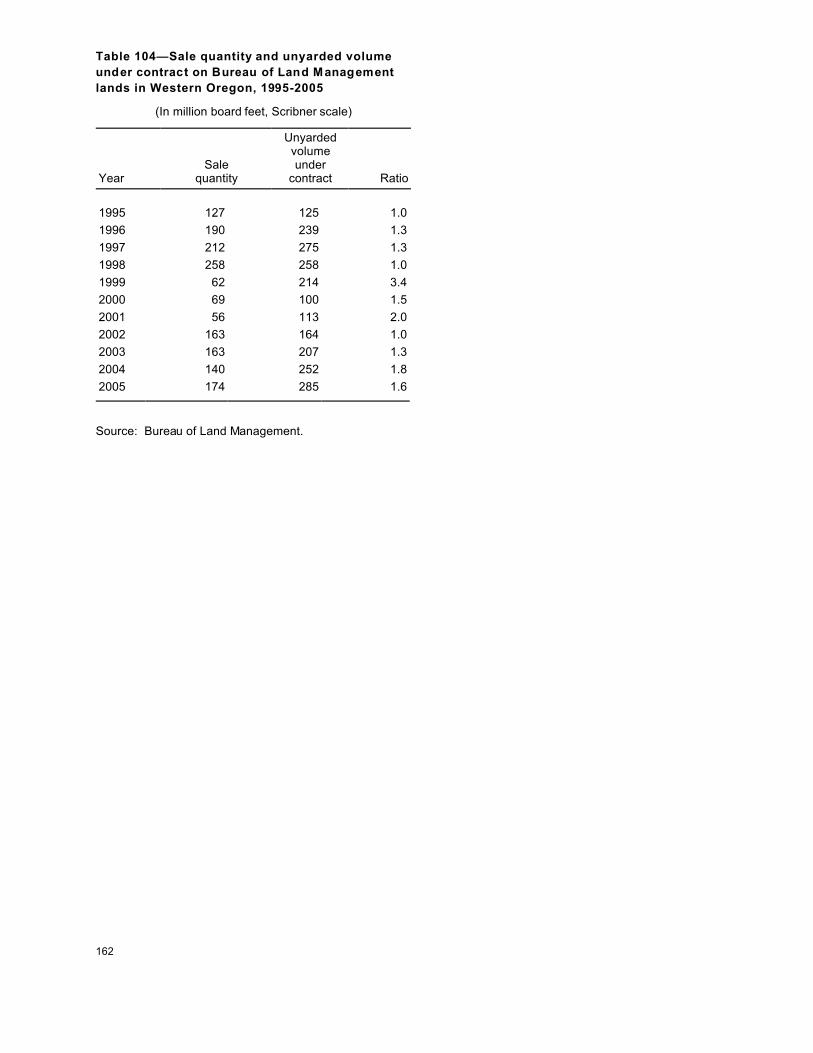
162
Table 104—Sale quantity and unyarded volume
under contract on Bureau of Land Management
lands in Western Oregon, 1995-2005
(In million board feet, Scribner scale)
YearSale
quantity
Unyardedvolumeunder
contract Ratio
1995 127 125 1.0
1996 190 239 1.3
1997 212 275 1.3
1998 258 258 1.0
1999 62 214 3.4
2000 69 100 1.5
2001 56 113 2.0
2002 163 164 1.0
2003 163 207 1.3
2004 140 252 1.8
2005 174 285 1.6
Source: Bureau of Land Management.

163
Table 105—Allowable annual cut and uncut volume under
contract on Oregon State lands, 1995-2005a
(In million board feet, Scribner scale)
YearAllowable
cutUncut volumeunder contract Ratio
1995 177 171 1.0
1996 177 241 1.4
1997 177 267 1.5
1998 182 362 2.0
1999 225 339 1.5
2000 272 326 1.2
2001 226 301 1.3
2002 238 309 1.3
2003 254 268 1.1
2004 259 357 1.4
2005 298 294 1.0
a As of December 31.
Source: State of Oregon, Department of Forestry.
Table 106—Sustainable harvest and uncut volum e under
contract on Washington State lands, 1995-2005a
(In million board feet, Scribner scale)
YearSustainable
harvestUncut volumeunder contract Ratio
1995 b 1,056 NA
1996 b 1,088 NA
1997 655 1,005 1.51998 655 1,034 1.6
1999 560 935 1.7
2000 560 806 1.4
2001 560 737 1.3
2002 560 731 1.3
2003 560 773 1.2
2004 560 680 1.2
2005 NA NA NA
NA = not available. a As of June 30.
b Figure does not reflect environmental constraints; permitted or "sustainable"harvest is unknown.
Source: State of Washington, Department of Natural Resources.

164
Table 107—Small business set-aside sales and total sales on the National Forests, Pacific
Northwest Region, 2000-2005
(Number of sales)
Colville Deschutes Fremont Gifford Pinchot Malheur
QuarterSet-aside
salesTotalsales
Set-asidesales
Totalsales
Set-asidesales
Totalsales
Set-asidesales
Totalsales
Set-asidesales
Totalsales
2000 3 13 0 12 2 11 0 0 0 72001 1 8 0 22 1 4 1 1 0 92002 0 9 0 19 0 3 5 6 0 42003 0 12 0 15 0 6 2 8 0 82004 0 7 0 11 0 11 6 9 0 92005:
1st qtr. 0 0 0 3 0 0 0 1 0 02d qtr. 0 3 0 1 0 2 0 0 0 13d qtr. 0 4 0 4 0 3 0 0 0 34th qtr. 0 3 0 4 0 2 1 5 0 1
2005 total 0 10 0 12 0 7 1 6 0 5
Mount Baker-Snoqualmie Mount Hood Ochoco Okanogan/Wenatchee Olympic
Set-asidesales
Totalsales
Set-asidesales
Totalsales
Set-asidesales
Totalsales
Set-asidesales
Totalsales
Set-asidesales
Totalsales
2000 0 0 0 0 0 2 0 2 0 02001 0 2 0 3 0 6 0 4 0 32002 0 2 1 9 0 1 2 4 0 02003 0 1 5 13 0 2 2 10 1 32004 3 3 1 2 0 5 2 7 3 32005:
1st qtr. 0 0 0 1 0 1 0 0 0 02d qtr. 0 2 2 4 0 1 0 1 1 13d qtr. 0 0 0 2 0 4 0 2 2 34th qtr. 0 0 0 3 0 1 0 1 1 1
2005 total 0 2 2 10 0 7 0 4 4 5
Rogue River Siskiyou Siuslaw Umatilla Umpqua
Set-asidesales
Totalsales
Set-asidesales
Totalsales
Set-asidesales
Totalsales
Set-asidesales
Totalsales
Set-asidesales
Totalsales
2000 0 0 0 8 0 7 0 6 0 12001 0 0 0 3 0 8 0 9 0 12002 0 5 0 12 0 18 0 7 0 62003 0 3 0 15 2 8 0 3 0 42004 0 0 0 14 3 7 2 11 0 112005:
1st qtr. 0 1 0 2 0 1 0 0 0 02d qtr. 0 0 1 3 0 3 0 6 0 13d qtr. 0 0 0 2 0 1 2 11 1 14th qtr. 1 2 0 1 1 2 0 1 0 2 2005 total 1 3 1 8 1 7 2 18 1 4
Wallowa-Whitman Wenatchee Willamette Winema All forests
Set-asidesales
Totalsales
Set-asidesales
Totalsales
Set-asidesales
Totalsales
Set-asidesales
Totalsales
Set-asidesales
Totalsales
2000 5 13 1 9 4 8 1 5 16 1142001 1 8 0 6 4 5 0 1 8 992002 0 6 0 6 4 30 0 7 12 1542003 0 7 a a 10 27 3 7 25 1522004 0 7 a a 0 17 2 4 22 1382005:
1st qtr. 0 0 0 0 0 1 0 1 0 122d qtr. 0 3 0 4 1 5 0 1 5 423d qtr. 0 2 0 3 0 5 0 2 5 524th qtr. 2 4 0 1 0 5 0 2 6 41 2005 total 2 9 0 8 1 16 0 6 16 147
a In 2003 and 2004, the Wenatchee National Forest was combined with the Okanogan National Forest.
Source: Forest Service, U.S. Department of Agriculture. Pacific Northwest Region includes Oregon and Washington and a small portion of northern California.
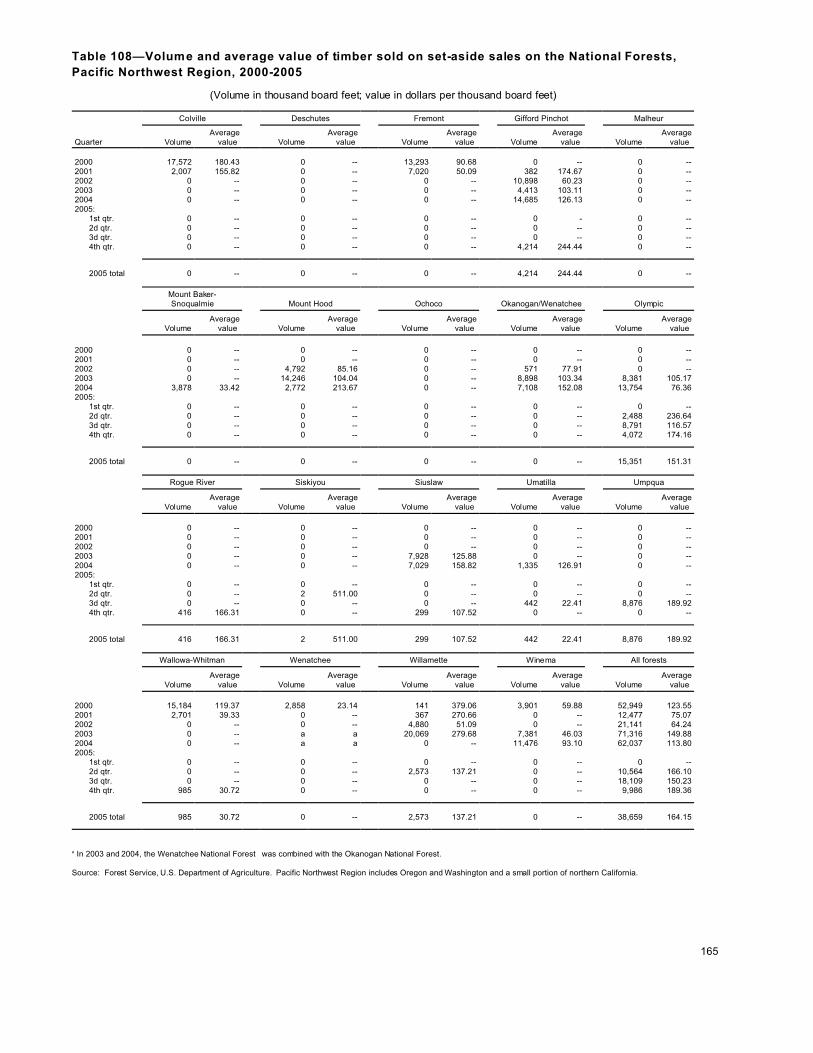
165
Table 108—Volume and average value of timber sold on set-aside sales on the National Forests,
Pacific Northwest Region, 2000-2005
(Volume in thousand board feet; value in dollars per thousand board feet)
Colville Deschutes Fremont Gifford Pinchot Malheur
Quarter VolumeAverage
value VolumeAverage
value VolumeAverage
value VolumeAverage
value VolumeAverage
value
2000 17,572 180.43 0 -- 13,293 90.68 0 -- 0 --2001 2,007 155.82 0 -- 7,020 50.09 382 174.67 0 --2002 0 -- 0 -- 0 -- 10,898 60.23 0 --2003 0 -- 0 -- 0 -- 4,413 103.11 0 --2004 0 -- 0 -- 0 -- 14,685 126.13 0 --2005:
1st qtr. 0 -- 0 -- 0 -- 0 - 0 --2d qtr. 0 -- 0 -- 0 -- 0 -- 0 --3d qtr. 0 -- 0 -- 0 -- 0 -- 0 --4th qtr. 0 -- 0 -- 0 -- 4,214 244.44 0 --
2005 total 0 -- 0 -- 0 -- 4,214 244.44 0 --
Mount Baker-Snoqualmie Mount Hood Ochoco Okanogan/Wenatchee Olympic
VolumeAverage
value VolumeAverage
value VolumeAverage
value VolumeAverage
value VolumeAverage
value
2000 0 -- 0 -- 0 -- 0 -- 0 --2001 0 -- 0 -- 0 -- 0 -- 0 --2002 0 -- 4,792 85.16 0 -- 571 77.91 0 --2003 0 -- 14,246 104.04 0 -- 8,898 103.34 8,381 105.172004 3,878 33.42 2,772 213.67 0 -- 7,108 152.08 13,754 76.362005:
1st qtr. 0 -- 0 -- 0 -- 0 -- 0 --2d qtr. 0 -- 0 -- 0 -- 0 -- 2,488 236.643d qtr. 0 -- 0 -- 0 -- 0 -- 8,791 116.574th qtr. 0 -- 0 -- 0 -- 0 -- 4,072 174.16
2005 total 0 -- 0 -- 0 -- 0 -- 15,351 151.31
Rogue River Siskiyou Siuslaw Umatilla Umpqua
VolumeAverage
value VolumeAverage
value VolumeAverage
value VolumeAverage
value VolumeAverage
value
2000 0 -- 0 -- 0 -- 0 -- 0 --2001 0 -- 0 -- 0 -- 0 -- 0 --2002 0 -- 0 -- 0 -- 0 -- 0 --2003 0 -- 0 -- 7,928 125.88 0 -- 0 --2004 0 -- 0 -- 7,029 158.82 1,335 126.91 0 --2005:
1st qtr. 0 -- 0 -- 0 -- 0 -- 0 --2d qtr. 0 -- 2 511.00 0 -- 0 -- 0 --3d qtr. 0 -- 0 -- 0 -- 442 22.41 8,876 189.924th qtr. 416 166.31 0 -- 299 107.52 0 -- 0 --
2005 total 416 166.31 2 511.00 299 107.52 442 22.41 8,876 189.92
Wallowa-Whitman Wenatchee Willamette Winema All forests
VolumeAverage
value VolumeAverage
value VolumeAverage
value VolumeAverage
value VolumeAverage
value
2000 15,184 119.37 2,858 23.14 141 379.06 3,901 59.88 52,949 123.552001 2,701 39.33 0 -- 367 270.66 0 -- 12,477 75.072002 0 -- 0 -- 4,880 51.09 0 -- 21,141 64.242003 0 -- a a 20,069 279.68 7,381 46.03 71,316 149.882004 0 -- a a 0 -- 11,476 93.10 62,037 113.802005:
1st qtr. 0 -- 0 -- 0 -- 0 -- 0 --2d qtr. 0 -- 0 -- 2,573 137.21 0 -- 10,564 166.103d qtr. 0 -- 0 -- 0 -- 0 -- 18,109 150.234th qtr. 985 30.72 0 -- 0 -- 0 -- 9,986 189.36
2005 total 985 30.72 0 -- 2,573 137.21 0 -- 38,659 164.15
a In 2003 and 2004, the Wenatchee National Forest was combined with the Okanogan National Forest.
Source: Forest Service, U.S. Department of Agriculture. Pacific Northwest Region includes Oregon and Washington and a small portion of northern California.
This Page Left Blank Intentionally

Pacific Northwest Research Station
Web site http://www.fs.fed.us/pnwTelephone (503) 808-2592Publication requests (503) 808-2138FAX (503) 808-2130E-mail [email protected] address Publications Distribution
Pacific Northwest Research StationP.O. Box 3890Portland, OR 97208-3890
The Forest Service of the U.S. Department of Agriculture is dedicated to theprinciple of multiple use management of the Nation’s forest resources for sus-tained yields of wood, water, forage, wildlife, and recreation. Through forestryresearch, cooperation with the States and private forest owners, and manage-ment of the national forests and national grasslands, it strives—as directed byCongress—to provide increasingly greater service to a growing Nation.
The U.S. Department of Agriculture (USDA) prohibits discrimination in all itsprograms and activities on the basis of race, color, national origin, age, disability,and where applicable, sex, marital status, familial status, parental status, religion,sexual orientation, genetic information, political beliefs, reprisal, or because all orpart of an individual’s income is derived from any public assistance program. (Notall prohibited bases apply to all programs.) Persons with disabilities who requirealternative means for communication of program information (Braille, large print,audiotape, etc.) should contact USDA’s TARGET Center at (202) 720-2600 (voiceand TDD).
To file a complaint of discrimination write USDA, Director, Office of Civil Rights,1400 Independence Avenue, S.W. Washington, DC 20250-9410, or call (800) 795-3272 (voice) or (202) 720-6382 (TDD). USDA is an equal opportunity provider andemployer.

U.S. Department of AgriculturePacific Northwest Research Station333 S.W. First AvenueP.O. Box 3890Portland, OR 97208-3890
Official BusinessPenalty for Private Use, $300
PRESORTEDBOUND PRINTED MATTER
U S POSTAGE PAIDUSDA-FS
PERMIT NO G-40
do NOT detach label