united states naval postgraduate school · si 15-0 35 mg 0.2 22 al 0.5 12 1)0.0 ks k 0.1. 6 ca...
TRANSCRIPT

NPS ARCHIVE1961STINNER, R.
LibraryNaval Postgraduate School
Monterey, California
UNITED STATESNAVAL POSTGRADUATE SCHOOL
A FEASIBILITY STTJ]>v OF \ METHOD TO
•VNUY^E THE MOON'S SURFACE USING
NUCLEAB !TIC SCATTERING
X- * X X
Robert J. Stinner
ThesisS726

DUDLEY KNOX LIBRARYNAVAL POSTGRADUATE SCHOOiMONTEREY CA 93943-5101

r iA FEASIBILITY STUDY OF A METHOD TO
ANALYZE THE MOON'S SURFACE USING
NUCLEAR INELASTIC SCATTERING
LT. Robert J. STINNERtf
11 May 1961
Submitted in partial fulfillment of the requirements for the degree of
Master of Science. U. S. Naval Postgraduate School, Monterey, Calif.


Library
U. S. Naval Postgraduate ScliooT
Moutercy, California
UNIVERSITY OF CALIFORNIA
LAWRENCE RADIATION LABORATORY
Lr/ERMORE, CALIFORNIA
A FEASIBILITY STUDY OF A METHOD TO
ANALYZE THE MOON'S SURFACE USING,
NUCLEAR INELASTIC SCATTERING
Robert J. Stinner


A FEASIBILITY STUDY OF A METHOD TO ANALYZE THE MOON'S SURFACE
USING NUCLEAR INELASTIC SCATTERING
ABSTRACT
A selenological study "by the Jet Propulsion Laboratory shows that
the following elements could be found in abundance on the moon: Fe, Si,
Mg, Al, 0, K, Na, Ca, and Ni. An investigation was made to determine if
the gamma rays produced by de-excitation of these nuclei, after the in-
elastically scattering of 1^-Mev neutrons, could be used to determine the
minimum abundance of various elements in a typical geological matrix. A
general statement can be made that less -than 1$ by atom of Fe, Si, Mg, and
Ni, and less than k°jo of the remaining elements could be measured.
Inelastic (n,n') spectra are shown for each pure element and some
excited state transitions not previously reported are suggested.
1 -


A FEASIBILITY STUDY OF A METHOD TO ANALYZE TEE MOON'S SURFACE
USING NUCLEAR INELASTIC SCATTERING
INTRODUCTION
When energetic neutrons are used to "bombard samples of material,
three nuclear processes can occur. These ore (l) Elastic scattering;
(2) Inelastic scattering ; (3) Capture and subsequent decay.
The usual sequence of events in the bombardment process is for the
neutrons to make a number of elastic and inelastic collisions, losing energy
vrith each collision. Each inelastic collision leaves a nucleus in an ex-
cited state. In order for the nucleus to de-excite to the ground state as
quickly as possible, prompt gammas are emitted whose energy is uniquely
related to the mode of de-excitation. When the neutrons reach thermal
energies (~ .025 e.v.) capture takes place. If the capture process results
in an excited state of the nuclide prompt gammas are emitted by a mechanism
similar to that of the inelastic scattering. After a relatively long period,
dependent on the half-life, the nuclide may decay emitting a "beta, gamma
ray, or "both in the process. Tnese gammas are known as activation gammas.
If one uses a pulsed neutron source and defines zero time at the
beginning of each pulse then a time spectrum of the emitted gammas can be
plotted. (See Figure l) . Three main features are readily apparent. Since
the time of arrival of inelastic gammas is only dependent upon the travel
time of the neutrons from the source to the target plus the travel time of
This phenomenon actually results from a reaction process whereby a com-pound nucleus is formed. Competition sets in between different modes ofdecay. Because of the Coulomb barrier, the emission of neutrons is muchmore probable than the emission of charged particles. The re-emittedneutrons can leave the nucleus in an excited state, so that ve obtain.: lastic scattering, (n.b. B1-!
- 2 -


*\ *v •* -Pa ft
CO. CD.
p. d
CO CO10 04 o*
•• K ?-sK•- + ca +X + ca
«+ X
>-l
++ >H
*X— f*
4
>4"
A
f
t t t<."
*
1 i1 .
y, X XH + + + ,
p X X
•
CO
X
CO
CJ
*
•
CO
• >> -P 1 CO -P CO >? rt CJ bO-rl cd •H <u d cj ^ C3 Cj CO
CJ k CO id H "^ o c> CO cj rJ
•s _j H tI
CJ <H> o
39^ H
oCJ £ o
4^>,d o
O -d v a CO d to u g ! •H 4^•rl CJ
It•H q- d CJ CO cj C CO. CJ O cj
63 H d H fcO cq ,QB
•lr-
£ Og
to o q d d CJ >* CO «Hcj o rt d t1 H ^ i d -P
d cq
•h dH o ^d o d d S 1
,Q «<D
•H -P.3
O •H -H ^ -d i do Q CJ £ o •d 9
r! 9as ^
-P o dCO o CQ d
CO cj -5£ CO
21
d co
'd dBb§
cj co CD CQ
bo CO cj o o •H
5 $O -H O «H %* co H >> CO U Ho O P^ a o • H ^ •
-p a co
d P^ O •^
P?4
CO o d CO 3 d 4J O%> o d
5H0) <tH o
CJ 4^> d
a q;* « d CJ
O ti
Pi cj
o du r
c1Pi 4'
o ^ Jh g ra
O -p is d4^
B•H CJCO
•H 310 •H
cj d H £p CO
>,Slvl O •H o •P -d CO to o o d o 'd ^
> i
3 3 H -Hr-l +>
3 CO -p ? 1 O o ^ CJ 'd ^i <D 4^ CO
ftto 3 Pi P4 4- -P CJ P 'd _ P'- i •
'
o a O <L> H C3 •r-l •H CO -{J d -H
23o d G) CJ O (D O O CJ Ph CJ <D o 3 q
<3 s <J .p a a) E4 o s Os CJ Pi W)
to
1oCQ
O•HPCO
d
El
to
ucy-p
ISCJ
CO
o•H-PCO
Cj
A
o
4^>
&OCJ
bs
i
^ -


a from the target to the detector a sharp peak will be noted whose
ace from the origin is equal to the above time sum and whose width is
^rdc-r of the neutron pulse width. After formation of the inelastic
-
luced gamma rays the neutrons continue to lose energy until
slized and are captured. This normally requires 10 - 1000 micro-
Therefore the resulting radiative capture gammas appear as a
ad peak extending over this time range. Finally, there is a low steady
state level which tends to raise the two peaks. This "background" is due
to: 0) natural activity of the experimental environment; (2) Remainder of
the radiative capture counts left over from the previous pulse; (3) Ac-
tivity resulting from the decay of the radionuclides formed in the bombard-
nt process. By gating a pulse height analyzer so that only the counts of
the inelastic peak (plus a few background counts) are analyzed it is possible
to obtain a spectrum whose peaks are indicative of the nuclear levels of the
Isotope being bombarded.
During the past years, considerable work (Da-56, Sc~57, et al) has
been done in determining the cross-section for (n,n f) reactions for various
elements using pulsed neutron sources and time-of-flight techniques. It has
n noted that the various common isotopes differ markedly in their prin-
cipal level structure, but have quite similar excitation cross-sections.
feature led Dr. Carlton Schrader and E. F. Martina (Sc-60) to con-
clude that since one could determine the presence of an unknown level in
m Isotope by (n,n') reactions then conversely one could determine
• presence of an unlmown isotope by interpreting a spectrum of gamma
;.; from levels in an unknown sample. Furthermore, since the reaction
cross-sections were similar, it should be possible to determine the isotopes
their relative abundances in the unknown mix. If the conclusions


were correct remote analysis of materia], vrould be possible. In particular,
a payload could be designed to sample the moon's surface and deduce the
elements present. Based on this line of reasoning, a study was begun of
the feasibility of using inelastic scattering techniques to determine the
composition of the moon's surface. Four questions were to be answered:
1) Can the energy levels of the likely constituents be resolved bysimple methods?
2) Do the isotopic energy levels have relatively similar inelasticcross-sections?
3) What minimum abundances could be determined?a
4) With what precision could these abundances be stated?
THE MOON
The moon, our first satellite, has been a subject of conjecture
since man first raised his eyes to the night sky. Only recently, however,
has conjecture been augmented by scientific analysis and experimentation.
While it is possible to formulate reasonable theories concerning the origin
and physical, composition of the moon using telescopes, spectroscopes, radar
and other observation tools, the advent of the space age now permits physical
testing of the validity of these theories.
The oldest theory of the moon's formation was proposed philo-
sophically by Kant and scientifically by LaPlace. Known as the "accretion
theory", it proposed that a slowly rotating equatorial ring of gas and dust
coalesced into a single satellite whose size approximated the moon's size
as we know it today. This theory closely parallels the accretion theory of
the formation of the solar system. The accreted mass heated up causing
partial, malting with the escape of large quantities of steam and other gases.
Subsurface explosions occurred producing funnel-shaped craters (pre-mare).
Later, la ; rs cove] he s\ ....... Cooling and solidification
- 5-


of the interior then took place. Impacting meteorites formed the post-mare
craters strewing granitic and meteoritic rubble in great ray systems over
othe surface of the moon. The process was completed prior to 10 years ago.
The second theory of formation is a fairly recent one proposed by
George Darwin in the late 19th century* In a study of tides and their ef-
fects, Darwin noted that early in geologic history, the earth's daily rota-
tion of four hours coupled with the sun's gravitational attraction produced
tidal effects every two hours which coincided with the earth's natural
vibratory period of two hours. From this, he postulated that resonances
were set up and a large tidal bulge appeared on the surface. Fission oc-
curred, a moon was formed and the Pacific Ocean basin was left as a testi-
monial to the event.1
Since this could occur only to a plastic sphere (Darwin assumed
a liquid earth), isostatic readjustments would take place both on the earth
and the moon. (Splitting of the Americas from the Bur-African land mass
and formation of the Atlantic Ocean basin was proposed as the earth's ad-
justment.) On the moon, one would expect a rather thick granitic crust
overlying a basaltic core. A cool core would not be likely. Continued
volconism and extensive lava beds would be present.
The latest theory pictures the formation of the moon as an in-
dependent event. At some time during the ages this "meteorite" passed close
to the earth and was captured in a slightly elliptical orbit. If this is
so, then one would expect a typical meteoritic type surface.
The above listing of possible origins of the moon permits one to
make various postulates in regard to the moon's surface. One such analysis
by Jet Propulsion Laboratory (Me-60) is shown in Table III. We expect that
the most abundant elements would be Iron, Silicon, Magnesium, Aluminum,
Oxygen, and Calcium. Potassium, Sodium and Nickel might also be present.
- 6 -


C! •
• M H t qto o d fc O
fe-
'd ft -Hq • | U3 cj o o
O•H5h cl
ci
& £> STGJ G)
^4 1 d•
q
1O P 0) o o•H O -P «H O w •H-p d d P •rl & -O
s 3 «H , o
4>
3orl
•Hto
O
O to O -P• 9 d io q & <y pq }> oH GJ <H d o
B• -O r-l
to crj rd -d • G)
CO d q cj qt4 o H 3q , A
p O
p8|
•HPr^i 3 Ch <L> o d
_o S O pi'H
V, Po Jo cj «h•.hp qP v4 CD d
rj t>o to •rl
s o d -Po H rQ t43 P • ^lH ^ O U
d O -H U)
$ "of |l cH« a ft o
•rl G) •P <" "* O
18u
U3
3
OJ
-P
b&
1 i
71o oj 3 'd CJ CJ o t q sH P J> o
Sto q-?-i P O 'CJ ^3
to I d op • H H O <ri
'; cj <U q -H cj
O 4^ Cj n^'d o d> o 3 H • d Ph CJp g <o q
q A, $ q rqd r-l <h d p
ti CO p 4^ w q
J> d tb Ph
o
|•rl
33
|
• d
P.3
t -
1
G> r-l rd Ph q to
d tJcj ri q d
to o ot
' co P 'd U o a sLi a d o >d o P
^cj d rH
q CO ,£{ rrfM M O 5) >H d Bd p Jh e q 'd o CJ cj - p qd^l 3• p «h O nj p 0) o o A t/0 >HH o O r-t O H Ptp j-i a q -
to q P4 q tA
O •>4 •rl -(J -H o r; p oV !
1p
d GJ S PCJ o q tp ,q
Ph cj cj 4-J •
1 i to -H o <y p Ph a P gj oj «. q -d^d to d r-l
d <h d G> cj
d to to ft «hs _, q o ^
oq h tit a
•-: « tI >D '-i xi •H O P< -HE: fcD P d to cj w q 4^ O <)rl
q o d d q o »• p ^i * to CJ to Pd O q r!
d -d cj d•3 P O vH. q ^! a) o 'd qP pj ,d to H q -)^> ?-( p o •Hd -h t< o c
&Q M CO rd cj q to d
-P ^ (D O •H GJ O BJ o q 3 o oo Td q p o to GJ !> .a Pi m d H O r4 -rl
Jh c> oj d 0) O U "H CJ 4^o q d
v. ° EL b q OH re1
o g4^> ft
oH
r-l O O « a Pg
<M rd GJ -HJ* H to CO £ •
O nj p pi o rdH O p >jH oto o co p <h q
CO to J>> •,-l q GJ rH tO J>»d d -P in
a O 'cj O to d
sr-l
Pidq r^
O <H t4 d f h
S CO <H P( tD
o
1
qo•H4->
G)
?-»
O
3
qo•HtoCO
•H
o
p
- 7


(Abundant Nickel vould "be found only in meteoritio debris.) Furthermore the
relative amounts of the elements vould depend upon the geologic type of
surface so that the ratio of abundance of one element to another vould "be
an indicator of the method of moon formation.
TABLE III. SELENOLOGICALLY IMPORTANT ELEMENTS(after JEL)
Element Concentration (</> by veight
Low . 5ii£
Fe 1.5*
15 .
Si 15-0 35
Mg 0.2 22
Al 0.5 12
1)0.0 kS
K 0.1 . 6
Ca 0.5 - 12,.
Na 0.2 7
Ni 0.002 9
Iron - nickel meteorites will contain 90$ iron.
E?CPERIJ-IEHTAL
A. Ring Procedure
Having decided which elements were of interest, work was begun to
obtain representative spectra so that the principal energy levels could he
determined. A time-of-flight technique first developed at this laboratory
(Bc-59) ^as used. A diagram and photograph of the experimental set-up are
shown in Figures' 2 end 3«
Deuterons, injected into a 350 kev Cockeroft-Walton machine, were
accelerated, swept, end bunched; then deflected onto a thin (0.1 mil) tritium
occluded titanium target. Short bursts (about 3 x 10 seconds) of lk-l. .
. 8 -


utrons were produced by the reaction
D2
+ T3 ->gHe + ^n
1+ 17.3 Mev
at a repetition rate of 5 mc/sec. The neutron flux (about 300 neutrons/pulse)
vas monitored by counting the alpha particles in a gas proportional counter
nounted in a position Yjk vfith respect to the ion beam. Thin rings were
placed so that there was a 70 angle between the incident neutrons and the
detected gamma radiation thereby neutralizing the anistropy of the radiation. •
A copper attenuator was placed in the line-'-of--sight of the target and detector
co that neutron activation of the scintillator would be minimized. The
gamma detector, consisting of a cylindrical ,1-3A" diameter x 2" Nal (Tl)
crystal mounted on an RCA-6810A photomultiplier tube, was placed in a lead
housing whose vails were k" thick. Refrigeration coils encircling the
housing maintained the photomultiplier and crystal at a constant temperature
(l6 C) co that temperature dependent gain variations were eliminated.
The detector-analyzer system was divided into a fast channel circuit
and a slow channel circuit (Fig. k) . The fast signal, taken from the anode
of the photomultiplier, was amplified and used to start the time-to-height
converter. Tne regularly repeating pulse made by the deuterons striking the
target was delayed, amplified and used to stop the time-to-height converter.
The converter produced a voltage which was proportional to the time differ-
ence between the arrival of the start and stop pulses. By setting the dif-
ferential discriminator for specific voltage ranges, gates would be generated
for viewing only those gammas which satisfied a particular time relationship
with respect to the neutron burst. The slow signal, take from the 9th dynode,
was suitably delayed, linearly: amplified and analyzed by the gated 256-channel
pulse height analyzer.
- 9" -


te lover trigger level o
Ices til! kev were not analyzed.
•imination on the dem-
and associated scaler were include slow circuit. A rid
coincidence control was used to d: jtrum c
time spectrum to facilitate settii rential i
third position on the control was used for the run.
Scalers at various points in the circuit wc_ d to ecu. (t,
slow, and gate pulses. The analyzer also had a scaler output indie
dead time within the analyzer, and this, plus the information from the other
scalers was used to compute the dead time of the total system.
A run was made with the rings in place to obtain a "signal plus
background" spectrum and with the. ring removed to obtain a ' round"
spectrum. For each run except Oxygen, 2.5 x 10 " neutrons were produced.
Because of Oxygen's low inelastic cross-section and the desire to reduce
statistical variation of the triple peak 5 >- 10 neutrons were used _.
After the run was completed, the analyzer information was printed out
on paper tape and the scalers and elapsed time were recorded,
tion was transferred to punched IBM. cards. An IBM 650 computer was .aed
to compute the Dead Time Correction; apply it to both the "1
rial plus background" information; subtract the "backgrou.
"si^nal plus background" and print out the correcte - Lai.
1 le "Dead Time Correction" was a multiplicative factor det vd
by the computer solution to the equation:
D.T.C. = .1 + 60/T Wd/60 - 2 x 10"° Nc + 3.5 x 10
where T = Run duration time in minut 1
Nd '= Number of countsanalyzer de Ltor.
- 10 -


He = Total number of counts In the memory core of the pulseheight analyzer.
Ns = Number of start pulses to the time-to-height converter.
Ni = Number of slow pulses appearing at the input to thepulse height analyzer.
The constants were determined empirically by measuring the dead times of the
various electronic components. (A thorough discussion of this analysis is
contained in Appendix II of UCRL 5596 (Be-59)).
The printouts from the IBM 6p0 computer were plotted on rectangular
graph paper. The various spectra are shown in Figs. 7-15 • From these the
most prominent peak of each element was selected and the number of inelastic
gammas contributing to this peak were counted. This count was compared to
the number of counts in the FeQ g, peak and a ''Minimum Abundance Factor" (f)
was defined and computed using the following equation. (See Appendix for
derivation and definition of terms):
Gv N_ (cosch. - cos (i)) (r - r. )
'At M-,
go.o>, \ r^-^H '
(
r2^0l \e
It is assumed that isotopic abundances in a particular element would
be the same on the moon so that this term is neglected. Since Iron was as-
signed the arbitrary value of 1 the solution of the equation gave an indica-
tion of the likelihood of noting the presence of an element as compared to
Iron.
B. Sand Matrix Geometry
If gamma particles are formed deep in a formation, there will be a
certain percentage absorbed in their passage out of the formation to the
detector. The percentage is dependent upon the absorption cross-section
which in turn is dependent upon three principal effects: l) the photoelectric
effect: The incident gamma particle is absorbed. and another particle
- 11 -


ell el.
: oduction:
of the nucleus forming an elec
occurs and two 0.51 •
... be polarizations. The
>air acquiring the re:
both of the 0.51 Mev gammas to be re-
sultant photopeak is being detected so that it appears tha -
goncia ray was reduced by only 0. 51. Mev' or not at all.) 3) Compton effect:
The gamma particle collides with an orbital electron and, depending upon
the angle of the collision, . loses only a portion of its energy. A broad,
continuous spectrum of energies up to the Compton edge results.
Lee these same phenomena also occur in the crystal, it was feared
; the total effect of the energy d _tion would be large enough to
Laracteristic inelastic peaks. Because of this and also to
determine the minimum amount of Iron,, -Sium, and Aluminum that could
be detected it was decided to mock-up a formation whose three di
than several mean free paths of a 1*1 neutron. Any t
itrial abundance table one uses lists Oxygen and Silicc
aon elements by far. With this in mind, 18OO lbs. of a j--cype
.3 used as the carrier for the vary!. Ld -J_.
TABLE IV . Atomic Co .on of Carrier
Element
Oxygen .6
Silicon .7
.miinum 5*7
_ ot£ ssii 1.6
Iron 0.
Icium 0-5
Trace 0.3
- 12 -


placed in a
Iocs/ted h" "below the ncutrc
-.-l/2' above the sc
action-analyzing 1 to t
b. Operating proc
ible exception. For the "signal plu..
jet on the inelastic gamma peak of j crura as was done i
the ring8 . However, since it would not be possible to remove the f
for background measurements, the gate was delayed in time so that those
counts arriving Just after the peak would be analyzed. Since the activa-
tion pectrum is nearly constant the same gate width was used .
t the measured background was very nearly equal to the background cc
to the inelastic gamma peak'.
..or to varying the composition of the sand, runs were made
it energy band widths' (0-3 id 0-8 Mev) to obtain
.jive spectra. The various elements of intei J.)
•e then - - 1 separately in increasing perc ss with runs be:.. ie
ti increase. The recorded data, consisting of "signal pi
:..uid",:
~~ound" and scaler readings was transferred tc . Is
processed as before.
The printouts from the formation e: . plotted on
rectangular h paper as before. However, to illustrate to t-
. : rth of a peak as the elemental perc.
.. curves i articular elem. ..id sup
pointed out earlier, Silicon is a v,
rcDtrial and meteor.. al. Fur 3, since Iron, Aim
I prominent energy pc ./, it was d^_
to v , I.78 Mev peak of Silicon 1 for d .
- 1


and, j. of the e:
enting the beet c:.
continuum was drawn under th
stion.
2) The number of gammas contained in cat. - were count <.
3) .. ratio of the counts in the peak in question to the count
Si, rra ^oak vac formed (C-x/g, „d ). This .
1 . ,o ~ 1. (o
•cissa value on a calibration curve.
4) Since the number of atoms of each element used was known, a ratio
of the number of atoms of the element under question to the numb
of atoms of Silicon was formed. ,.). This ratio was used as the
ordinate of the calibration curve.
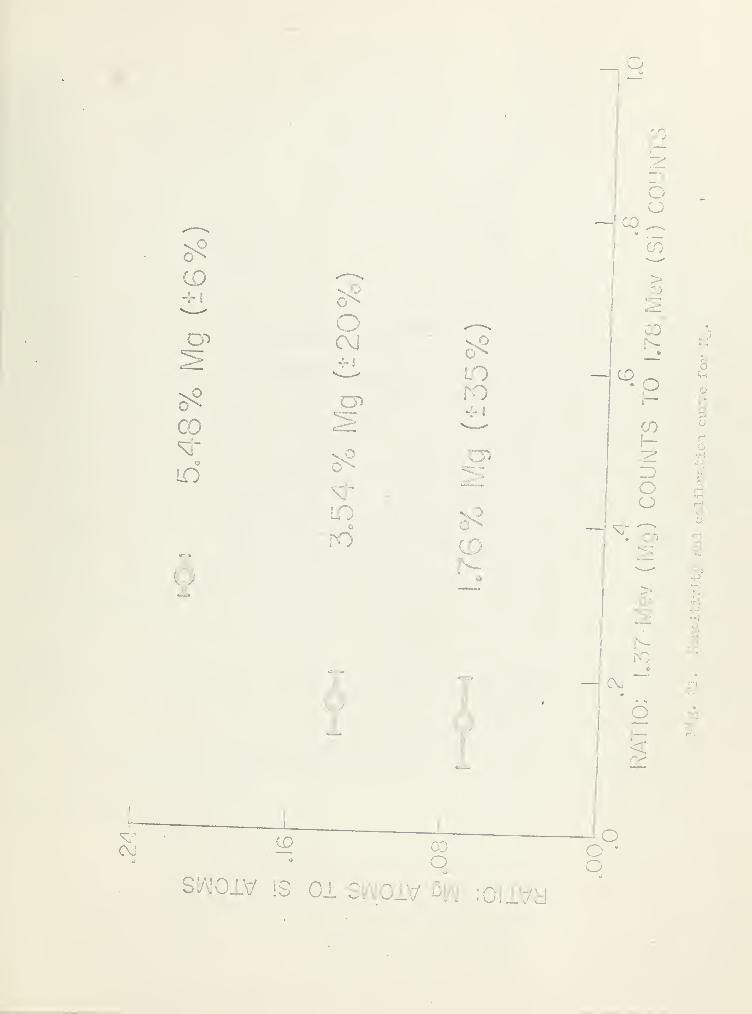
Tiie calibration curves for Fe/ AL, and Mg are shown in Figs. 19,
21 and 23. The percentages in the j es are the uncertain!
mea~ e area of each peak. This uncertainty is due to both the C
continuum subtraction and the unfolding of contributions hy
to the peak in question.
RESULTS
1. Iron (Fig. 7-)
The line at 0.84 Mev represen tsition
56of Fe . Since apparently all cases Les :
this state, the intensity is not
show that a 1$ abundance increase addsu. b 5>0CQ c:
It would not be unreasonable to e
energy level so that one can cone of
Fe -, scted.
- 1


2851^ . The ' contains up.. 30 counts.
62,900 counts of Fc qjl for the.s: r of n n-
; 0.212 co that undance c
29The other peaks shown in Fig. 8, are due to "^
.
3. Magnesium
2k +The first excited level of
r
is at 1.37 Mev (2 ) and produces
the intense peak seen in Fig. 9. In addition peaks are found at 0.83 Mev
and 1.82 Mev and are due to the 5*1 _> 4.2 - " transition and ]
1 transition respectively. The principal peak conn
an "F" value of .3*1-2 so that a 0-31 ndance should he detected.
con.' - formation spectr. .' increase in
1,700 counts to the 1.37 peak (Fig. 20).
In the actual analysis, the 1.37 peal-: is ed by the cc
29ion of the abundant Si 1.23 I Standard- procedure
j spectrum of Si alone ( : -ed from the ri:
using a computer, normalize to the prominent 1.7'-
the entire Si.. ?ocontribution.
. Alu .
27inelastic scattering of 14-1 . utrons fr
1.01-, 1.77-, and 2. 20-Mev gamma rays (Fig. 10) . It
..1 invc ~ors that 1.01- and 2.2
second hird exei
:
! to tl
The 1.77-1-
to ...
- • 1.01-1
lack of symmetry c
- 1!


It
7 -» 1.01 : . • iioition (lluc
. wtdence was found - / "but the
robably masked "by the Compton edge of the 1.01-. .
o 1.01-Mcv photopcak, because of it, would be i
for calibration purposes. However, if a large amount of Silicon is present
29the Si O.9S gamma ray will mask the Al contribution. Therefore, the
2.20-Mcv transition iras used for calibration. There were 8,700 counts a
the "Fn factor was O.OVf indicating a minimum amount detectable of 2
;.
From the formation - jectra a 2tfi> increase in Al added 5kO counts to the
2.20-Mev photopeak, thereby confirm"! 2 calculation.
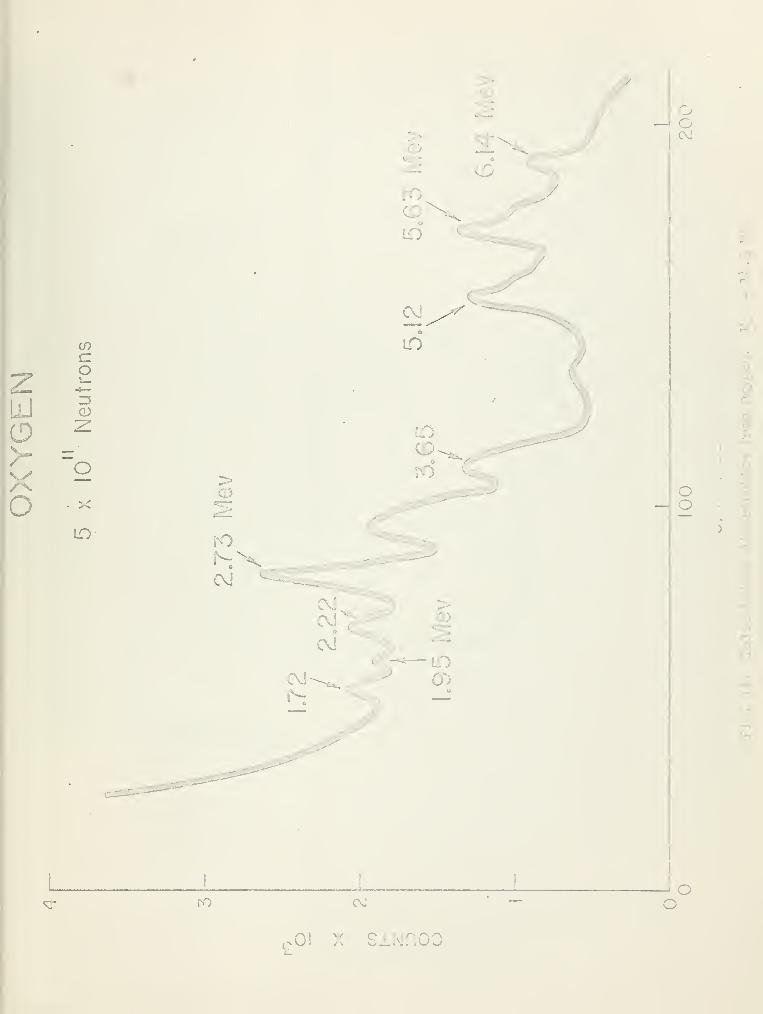
5- :
16Experimental results up to 1959 on the nucleus have b.
.ed by AJzeriberg and Lauritsen (Aj-59)« The doubly ig-
uration of this nucleus predicts a first level of zero spin and e. irity.
Decay is by emission of nuclear pairs. The 6.l4-Mev second excited :
to ground transition with its associated pair (5.12 Mev) and pair plus c.
(5.63 Mev) energy peaks is observed. Four other pe_ -o note.
c,3 follows: •
/
E (Mev) • ition
3. 9.£ -^
2.73 8.87 -> 6.lh
2.22 11.08 -> 8.87
1.95 8.87 -> 6.91
1.72
- 16 -


if ,
y.12, 5.63, o.l'i- Mev)
uccd 17,000 counts In this triplet
3 (5 x 10 ). However, since .
of the ction s; - Increases the "base 1
minimum acceptable and - of coi
creased by an order of magnitude. With this adjusted number of cou -
abundance was 3«7$ and, indeed, is veil belc
a lunar abundance.
;j. Potassium
Very little (n,n 8) experimentation on the stable isotopes K (9
K (6$) has been reported in the literature. A Los Alamos ^roup
-57) noted levels at 2.52-_> 2.81-, 3«05-> snd 3.59-Mev representing t]
39i -2d states of K .
obardment of natural Potassium by l^i-Mev 1 for tk
; produced 2.52-, 2.81-, and 1*. 10-Mev ga . raysj believed tc
;ely dii ransitiom the a 1 to the
39g. 12. insert). A stroi 5 observed at 2.15-
OQ.. to a . .68 -* 2.53-Mev transition. The C
igned to the de-exciting of th oh level of Kjy (3
. 1 vel (2. 82-Mev). There was no : tion c .') sc; by
K (isotopic abundance 6.9I.
The 2.15 Mev photopeak contained 6,000 cc F = 0.10 so
that 1$ of Potass ii . ould be detected. le
its (>1< 3 is usually the c
computer would resolv
- 17 -


fcalcii ;. 13)
• therefore tr
a only occur by nuc:
ation radiation (0.51- , f lc
ls (0.77-, 0.89-, I.l6-Merv) ic out
d by R. B. Day (Da-56) i^t two e
\ 40 ) )i
to (n,p',7) K reactions and the last 1 . Ca first 1 .de-
excitation. A fourth peak, not previously reported as of 1959, appei
1.64-Mev and agrees remarkably veil with the 1.639-Mev fourth excited state
koof K. .
• Ihe O.77 gamma ray peck, containing 13,000 counts -was selected for
the minimum abundance factor calculation. These are slent coun
pect a minimum of 1.2$ Ca would be detected. However, Fe is JLy fou
sent so t3 .e FeQ^ and Ca.
Q„ would merge and a c
solution similar to that outlined for Magnesium would be necessary.
3. Sec.:.
avious (n/n 1
) investigators (Mo-56, and others) of ::o.23
, >nly
•le Sec... .otope, have reported 0.44-, 0.6l-, and 1.64-1
Sra °th. rays were observed (Fig. 14) to which logic
- - be
0.99 3-o3 -* 2.7,
I.29 . 2
the 0.44 p
annihilation peek. . Because of
- 1


• -
Li3 fOUI
3°its principal
]
old take pin
ng the 1.29-Mev peak after unfolding the contribution
LtS.
9. Nickel (Fig. 15)
Natural Ni has two abundant isotopes, Ni^ (67.8^) and Ni (26.:
both of which contribute significantly to the ic spectrum. 1-
1.01-, 1.33-.> and 1.45-iucv inelastic . rays have been observed a
reported by others (Ki-5^ } Da-56 > 51-56) . The i
tentatively assigned as follows.
27
(Mev) lition Iso
O.iA 2.90 -> *.' .v58
0.65 3.^2 -* 2.77 Mev :i58
1.17 2.50 -> 1.33 l^Isv ..i£o
;:o peak was observed at O.83 Mev (Da-po) but this energy \ bly
masked by the 1.01-Mev ganma ray Compton ed< ..
Ihe most sui energy for det
58cit :e transition of NI (1.^-5
1.30 and 1.80 energies of Si, 1 \ count
should be detected (P = O.ll).
1 would only be present if cone -1
-oritic debris were sc at, sc
.ic energies in be
ace for lunar cr;
-19 -


mote i Ig of the li
lues is ble.
. 7-15) she
unique energy when c< d to t
adant elc. - Furthenao_
(as part of the "Minimum Abundance Factor" calculation,
linent peak were equal within an order' of magnitude, and therefor- -
Inelastic crocs sections for the production of these gamma rays are compar-
able.
The minimum, abundances that could be detected varied from 0.1$
o 3*T?° for Oxygen. A summary is shown in Table V. Abundance
precisions have been determined for Fe, . .;nd Al. Since
.ues are dependent on Compton continu-
spectra point of int
calibration curve should be consulted.
I - 1 for the p .irection i by Dr. ton
D. l. :out whose supervision and advice this jould not
n done, and to Dr. Hans Mar] e continuing enthi
a source of inspiration. I am indebted to Messrs. 3 p, Con
.lly and Arthur Williams who as£
especially to Douglas lin who pr 5p0 cc
i on should be made of Mrs . J
~-±y, I would like to ex
to C or Roy V. Cedarlund e
I itly 0]
- 20 -


CD
o
a
P.
d ooOJ on H
OH
P
Ifi
r-l
p.•
I
-p
-3-
CO fc't-OO 8 H LTVH £ -3"
o H H OJ VO CM O O H
o o
,-<
H0^
CO VO CO CO
CvJ CO o OS ro C- O D-Q ON ON on O VOH H
3
O O3 p•H O
Ps Hi
VO CO -3- t— VO ON o OO COITS OJ OJ oj H on ~v LT\
CD —102 ^—i 5!
O c3
aa}
W' «H
£ O O
•
W O <H
r^? O 02
•^ 53
t) O A .
hJ P Pp
o•rl
H•H02
•H01
opo d^
o
-


. Ajaeritx
Is of"
. 9»
>-59) J. Benvenii ';. D. S
ne, 191
(Bl-53) J* M. Blatt, V. F. Weisskopf, Th< cl ^_John Wiley end Sc *w York, 1952, pg> 5Bc
(Da-5o) 3. Day, Phys. Roy, 102, 767.
(Kl-5^) '--• M - Kiehn, C. Goodman, ' Riys. Rev. 95, 989.
(Li-57) D. A. Lind, R. B. Day, R. M. Kloepper, Bull. Am. Phys. Soc. 2
No. 6, 309, H5, 1957.
60) A. E. . ;ar, Jet Propuli bories, priva
[Me-56) I- L. . an, Fliys. Rev. 1031 (1956).
'--57) C. D. Schrader, J. Benveniste, J. E. Zenger, 2- -11 2,
309. 1957.
-60) C. D. Schrader, E. F. Martina, I Lat>02 ^ory,
.University of Calif1 -5916", April i960.
56) R. M. Sinclair, Phys. Rev. 102 , l»6l.
- 2


. not c
, a
a r< tion of the .
ition i. ults or '
ree assumptions are nade:
1) The neutron distribution is i; Le.
2) .pie scattering is no le.
3) The resultant gamma distribution is Isotropic.
Select r, and r~ so that the area of the included band 1 3 the
"1 •~ p
a of the ring cross -section and that the average radius ~^ eo\
the distance from the origin to t .dpoint of the diagonal c
. -section*
Ihus
:
e+2-*i: 1" r V*J a b (1)
2nd "
:
' rl 2 2
1/2
matron
ourceC


S^o =-1
D - a1 CJJ
1
-1 R - b
r. : XfP^:
;ir.ce
7 = <£ + a
tan, 7 = tan (<p -'r cc ') --
<ft + tern a
I - tan </>' tan a(5)
RD
•RL - D
- 7 =i- EVD (L -
ring for D
LD = —J
21 -• I (I + / tan 7)
1/2
R (7)
fractional solid angle (f) intersected ing on the r.
.
.
.2rt
r =hie.
2 =
*i
<fcd<£
., carrying out the int Lon
1
2cos
<f>.- cos c/x
1(9)


.evel whil<
a =
...
N - t- -—7-r where: M of the clt 2 "1
=.Atomic weight
A> = Avogadro ' 6 number
le number of Inelastic gammas of a particular energy tha
is given by eqs. ($))> (10) (ll)«
G = Pf H -§ (cos ^ - cos ^)
j£i!_ X 2 (12 )
2 1 t
whe = ni itrons;
The number of gammas that r at the
..-age solid angle e„ ;or ( d fi,P ) and
. .ter and the distance the de
".so dependent upon ....were small in cc
L - d J2p were considered
2r of gammas, c.
ill
1. Since t 1 type
cts were neglected. • of counts :. .
~ G
- 2!


°2 ^ ->)
(r2
-
= cc
- 25 -


C7>
C
•4—
o(J
CO
1/)
o
oCDCO
C\J
Oo2
.
CLoo
\I
o
<i~.i, i^._
ooCO
O oO —LO H-
OCDCO
LU
O
CD(D CD
rs aCL cr>
i_
O CDrsi
CT>c O—•»—
aCO
cr>
E £o
*— SV1AJ1A1V9 -.
ao
CD.O


ca
a. r>
£<
UJ
O co UJ< Z> COkiO ">_1 X <


Z H
UJ :?H -'
v
DEU
RQFT-
jf• °i o
T *: o < o• Lf) UJ O• rO OQ O
UJ00 CO •
V UJ:
< ) H :
5 <O _J
a.: •
UJ en
CO Ul•:
8>. H •
C )
:-.<_l ! 1
lO Q-
!
KLlI
QUJ
17")
\Ul _J
-:
CO
<3,
z- <ui s
crUJXo
Eoza:U!
r> C3 <r
t20 o>
CO
i—
\ 2:
% h
UI
UJ_JUJ
pd
u
•H
O
•H
o
w
m


_J
CMXo
-J(T< o
UJ —a: 5UJ —U. ";
li.°
_ ooQ 5
<
CO<
^-Xo—; o:£ UJI hi. a:
P UJ*7>
i^oi
>--
en
UJ
<G
o_i
Jn
,
•p
w
•


ASSt
iOUSING
; NG PMCRYSTAL
PERTTENI
--
TRIT
TARGET AL.r


2 <
oUJ COCO UJ
$5in a.
.•
u
cc
m uj oromo
0-CO
UJ1 1
_J :
CO'-
0)
O H (
^ UJ \n z V^--' o ^—UJ <CO 2
a:UJ
oa:UJ1-
2:idoo
Xcc\-<2
o<CO
VO
•n'


ooCO
en•
-4-
H
o
COco=3CD
OX
CM
>0)
CO
o>CD
H
oA
! H<4h
o z: oo •H
— BX £o
-P
-d
-p
•H
Oca
oCO
00 c_> m oo
c-
H
siNnoo


i *
r
c.
COCo
CD
O
CVJ
>
O
aV
OOc\J
_!LU
<
>
HII-
o•H.
,d
CD
ft
C\i OO
Q 0!x SINOOO


2
COeo•»_
"5
CD
2
o
x
CVl
ooOJ
>
C
oo
CO CD CVJ
-
c oi. * s±Nnoo


-
enaov_
CD
oxLO
CO
CD
CM
Oo
_J
o
»oC\J CO v-
.01 * siNnoo
o

ro
OCO
CDco\—•*—
ZJ
LiJ CD
iyz:
:
X ~~o
o . X
in
oo
oSL" o
,01 X 30


COco
3o"7
O
If)
C\J
OoCM
Oo
on
H
W
CO C\JO
o
s oi x sinhoo


o
COcoi_•*—
<D
o
CVJ
>
r-i
II
r
o
3
•H
P
01 X S1NH00


COcO—=3CD
O
X
>0)
ro
oX
CD
Oo
oo
d
CMCD CO
O
. siNnoo


ooC\J
COcoi_
J.--_
3!• 1 CD
!iJ r_:: _
o
z X
to
CM
.-
J
ooo "
I )
£0i x siisinoo


OJ
_J
o
<H
oCD
*—
\
o
goi x sinhoo
o00
oo


— J
CSJ
ooCM
-J
z:
o <6
HI!
co
Vl
P=i
OCO
oCvJ
.01 X S1NH00


LOI
s-
OI
s-
mcd
oC\J
°0 i^- CD LO
LO
o
_J
o
oCD
l
j
oCD
O O(XI
- )0
oo


o
o
Ll
noin
C\J
CD
o
Lf)
CDo
ro
CO
00
.CD
o
CM
COo
s-
LO
o
oo
CD
O
— ::
.
—
Oo
CO
CD O' -
CO
OO
>
o• •
o•
ooo
0)
uo
o
o
•H
H
S1AI01V !S 01 S I :0ilVd


ooC\J
>CD
00Q
o
"
CO
CO ^r co^ LO h• • •
ro —
cm
w rt
-L
oo
oCO
oCO
^J
Q 01 X
oC\J
:o
o

o
O+ i
cn
o
GO
CCM4-1
cn
o
00CD
s*
LOro+ 1
CD
c- .
00o
3Oo
CO
CO
>
CO
CD
<sf"
Oh-
co-
OO
>
00
o
o •
oSIA101V !S 01 SW01V 6|A| :0!lVd
o
o
H0J


v
oo
CJ
oo
COOCD
c
• O
oi sinhoo
o oo


oo
+ 1
CV
in
CD
LOc
:
ov.0
s-
H ^-
—
v^O
< °°
00
oo
00
—. >
o •
CO <O
LO
o
LOo
<D•
00
i^oO
:-
00f-
_Joo" *"
s—*
>o
CMe
CV!
N- CD Sf
SW01V !S 01 D1V iV 'ON :0llVd
Joo •


thesS726
A feasibility study of a method to analy
3 2768 002 02020 8DUDLEY KNOX LIBRARY